WASHINGTON,
FORM 10-K
| FORM 10-K | ||||
OR
| ý | ANNUAL REPORT PURSUANT TO SECTION 13 OR 15(d) OF THE SECURITIES EXCHANGE ACT OF 1934 |
OR
| ¨ | TRANSITION REPORT PURSUANT TO SECTION 13 OR 15(d) OF THE SECURITIES EXCHANGE ACT OF 1934 |
Michael Kors Holdings Limited
(Exact Name of Registrant as Specified in Its Charter)
Michael Kors Holdings Limited (Exact Name of Registrant as Specified in Its Charter) | ||||
| British Virgin Islands | N/A | |
(State or other jurisdiction of incorporation or organization) | (I.R.S. Employer Identification No.) | |
c/o Michael Kors Limited
Unit 1902, 19/F, Tower 6,
The Gateway, Harbour City,
Tsim Sha Tsui, Kowloon, Hong Kong
44 207 632 8600
Title of Each Class | Name of Each Exchange on which Registered | |
| Ordinary Shares, no par value | New York Stock Exchange | |
None
Indicate by check mark if the registrant is a well-known seasoned issuer, as defined in Rule 405 of the Securities Act. x Yes ¨ No
Indicate by check mark if the registrant is not required to file reports pursuant to Section 13 or Section 15(d) of the Act. ¨ Yes x No
Indicate by check mark whether the registrant (1) has filed all reports required to be filed by Section 13 or 15(d) of the Securities Exchange Act of 1934 during the preceding 12 months (or for such shorter period that the registrant was required to file such reports), and (2) has been subject to such filing requirements for the past 90 days. x Yes ¨ No
Indicate by check mark whether the registrant has submitted electronically and posted on its corporate Website, if any, every Interactive Data File required to be submitted and posted pursuant to Rule 405 of Regulation S-T (§232.405 of this chapter) during the preceding 12 months (or for such shorter period that the registrant was required to submit and post such files). x Yes ¨ No
Indicate by check mark if disclosure of delinquent filers pursuant to Item 405 of Regulation S-K (§229.405 of this chapter) is not contained herein, and will not be contained, to the best of registrant’s knowledge, in definitive proxy or information statements incorporated by reference in Part III of this Form 10-K or any amendment to this Form 10-K. x
| Indicate by check mark if the registrant is a well-known seasoned issuer, as defined in Rule 405 of the Securities Act. | ý Yes ¨ No |
| Indicate by check mark if the registrant is not required to file reports pursuant to Section 13 or Section 15(d) of the Act. | ¨ Yes ý No |
| Indicate by check mark whether the registrant (1) has filed all reports required to be filed by Section 13 or 15(d) of the Securities Exchange Act of 1934 during the preceding 12 months (or for such shorter period that the registrant was required to file such reports), and (2) has been subject to such filing requirements for the past 90 days. | ý Yes ¨ No |
| Indicate by check mark whether the registrant has submitted electronically and posted on its corporate Website, if any, every Interactive Data File required to be submitted and posted pursuant to Rule 405 of Regulation S-T (§232.405 of this chapter) during the preceding 12 months (or for such shorter period that the registrant was required to submit and post such files). | ý Yes ¨ No |
| Indicate by check mark if disclosure of delinquent filers pursuant to Item 405 of Regulation S-K (§229.405 of this chapter) is not contained herein, and will not be contained, to the best of registrant’s knowledge, in definitive proxy or information statements incorporated by reference in Part III of this Form 10-K or any amendment to this Form 10-K. | ý |
| Large accelerated filer | ý | Accelerated filer | ¨ | |||
| Non-accelerated filer | ¨ (Do not check if smaller reporting company) | Smaller reporting company | ¨ | |||
Indicate by check mark whether the registrant is a shell company (as defined in Rule 12b-2 of the Exchange Act). ¨ Yes x No
| Indicate by check mark whether the registrant is a shell company (as defined in Rule 12b-2 of the Act). | ¨ Yes ý No |
Page | ||||||
| Item 1 | ||||||
| Item 1A | ||||||
| Item 1B | ||||||
| Item 2 | ||||||
| Item 3 | ||||||
| Item 4 | ||||||
| Item | ||||||
| Item 6 | ||||||
| Item 7 | ||||||
| Item 7A | ||||||
| Item 8 | ||||||
| Item 9 | ||||||
| Item 9A | ||||||
| Item | ||||||
| Item 11 | ||||||
| Item 12 | ||||||
| Item 13 | ||||||
| Item 14 | ||||||
| Item | ||||||
Some of the
You should keep in mind that any forward-looking statement made by us in this annual report speaks onlyCompany’s risk factors, as of the date on which we make it. New risks and uncertaintiesthey may come upbe amended from time to time, which are set forth in the Company’s filings with the Securities and it is impossible for us to predict these events or how they may affect us. We do not undertake anyExchange Commission, including in this Annual Report, particularly under “Item 1A. Risk Factors” and in “Item 7. Management’s Discussion and Analysis of Financial Condition and Results of Operations.” The Company undertakes no obligation to update or revise any forward-looking statements whether as a result of new information, futureto reflect subsequent events or otherwise,circumstances, except as required by law. In light of these risks and uncertainties, you should keep in mind that any event described in a forward-looking statement made in this annual report might not occur.
applicable laws or regulations.
•wholesale sales through approximately 2015. accompanying consolidated financial statements. past ten years, the luxury goods industry has grown and has remained resilient during economic downturns. categories of focus, and grow our sales in other categories with new innovative product offerings. Asia (which were previously reported within our Americas wholesale operations). Retail net sales- North America Retail net sales- Europe Retail net sales- Japan Wholesale net sales- North America Wholesale net sales- Europe Licensing Revenue- North America following six strategic initiatives: leveraging Mr. Kors' global prestige and popularity through a variety of press activities and personal appearances; maintaining our strong advertising position in global fashion publications, growing our online advertising exposure and rapidly growing global luxury lifestyle brand led by a world-class management team and a renowned, award-winning designer. Since launching his namesake brand over 3035 years ago, Michael Kors has featured distinctive designs, materials and craftsmanship with a jet-set aesthetic that combines stylish elegance and a sporty attitude. Mr. Kors’ vision has taken the Company from its beginnings as an American luxury sportswear house to a global accessories, footwear and apparel company with a presence in over 85100 countries.segments—segments — retail, wholesale and licensing—licensing — and we have a strategically controlled global distribution network focused on company-operated retail stores, leading department stores, specialty stores and select licensing partners. In Fiscal 2013,2016, our retail segment accounted for approximately 48.7%50.8% of our total revenue. As of March 30, 2013,April 2, 2016, our retail segment included:231 North American and73•278 international retail stores, including concessions, in Europe and Japan.2013,2016, our wholesale segment accounted for approximately 47.3%45.5% of our total revenue. As of March 30, 2013,April 2, 2016, our wholesale segment included:2,2151,532 department store and 929 specialty store doors in North America;the Americas; and1,0341,222 specialty store and 206 department store and specialty store doors internationally.29.3%25.8% of our total revenue for Fiscal 20132016 and 27.9%26.3% of our total revenue for Fiscal 2012.2015. Our largest wholesale customer, a large, nationally recognized U.S. department store,Macy's, accounted for 14.0%12.7% of our total revenue for Fiscal 20132016 and 13.3%13.7% of our total revenue for Fiscal 2012.2013,2016, our licensing segment accounted for approximately 4.0%3.7% of our total revenue and consisted primarily of royalties earned on licensed products and our geographic licenses.presented in the Notes to the Consolidated Financial Statements.twothree primary collections: theMichael KorsCollection luxury collection andline, theMICHAEL Michael Korsaccessible luxury collection. Theline and theMichael Kors collection Mens line. Michael KorsCollection establishes the aesthetic authority of our entire brand and is carried in many of our retail stores, as well as in the finest luxury department stores in the world, including, among others, Bergdorf Goodman, Saks Fifth Avenue, Neiman Marcus, Holt Renfrew, Harrods, Harvey Nichols and Printemps. In 2004, we saw an opportunity to capitalize on the brand strength of theMichael Kors collection and address the significant demand opportunity in accessible luxury goods, and we introduced theMICHAEL Michael Kors collection,, which has a strong focus on accessories, in addition to offering footwear and apparel. TheMICHAEL Michael Kors collection is carried in all of our lifestyle stores, as well as leading department stores throughout the world, including, among others, Bloomingdale’s, Nordstrom, Macy’s, Harrods, Harvey Nichols, Galeries Lafayette, Lotte, Hyundai, Isetan and Lane Crawford. More recently, we have begun to grow our men's business in recognition of the significant opportunity afforded by our brand's established fashion authority and the expanding men's market. Taken together, our two primary collections target a broad customer base while retaining aour premium luxury image.According to theAltagamma Studies*, total global sales of luxury goods were approximately $226.6 billion in 2010, $251.5 billion in 2011, and are estimated to be approximately $277.7 billion in 2012. Over theIn 2010,While this growth has slowed in the industry showed a significant recovery with 13% growth and surpassedrecent years, the pre-financial crisis peak of $222.7 billion set in 2007. In addition, according to these same studies, demand for the worldwide luxury goods industry, and accessories in particular, is predicted to continue to grow. While the wholesale channel has experienced a slower performance, retail channel continues to grow from approximately $251.5 billiondriven by new store openings and the growth of the e-commerce channel. Accessories remains the leader within personal luxury goods, growing at a faster rate than other luxury categories. The jewelry category also continued to grow in 2011 to between $314.4 billion and $327.5 billion in 2015.the past year, while watch sales have experienced a global decline. We believe that we are well positioned to capitalize on the continued growth of the accessories product category, as it is one of our primary product category focuses.*Comprised of: the Worldwide Luxury Markets Monitor, Spring 2013 update, Luxury Goods Worldwide Market Study, 2012, the Luxury Goods Worldwide Market Monitor, Spring 2012 Update, Luxury Goods Worldwide Market Study, 2011, Luxury Goods Worldwide Market Study Spring 2011 Update, the Luxury Goods Worldwide Market Study, and the Altagamma 2006 Worldwide Markets Monitor (together, the “Altagamma Studies”). These studies were prepared by the Altagamma Foundation in cooperation with Bain & Company and can be obtained free of charge or at a nominal cost by contacting Bain & Company’s media contacts at cheryl.krauss@bain.com or frank.pinto@bain.com. While we believe that each of these studies and publications is reliable, we have not independently verified market and industry data from third-party sources. The Altagamma Studies analyze the global luxury goods market, including the market and financial performance of more than 230 of the world’s leading luxury goods companies and brands. All figures derived from the Altagamma Studies are based on an exchange rate of $1.31 to €1.00.Japan.Asia. Through our licensing segment, which we enter into agreements that license to third parties use of our brand name and trademarks, certain production, and sales and/or distribution rights,rights. We have wholesale arrangements pursuant to which we generate revenue primarilysell products to certain of our licensees, including our licensees in North America.thousands)millions): Fiscal Years Ended March 30,
2013 March 31,
2012 April 2,
2011 $ 938,515 $ 573,394 $ 331,714 101,754 43,316 11,463 22,373 10,230 1,018 913,145 544,686 386,566 118,970 65,474 27,039 86,975 65,154 45,539 $ 2,181,732 $ 1,302,254 $ 803,339 Fiscal Years Ended April 2,
2016 March 28,
2015 March 29,
2014 Retail net sales - The Americas $ 1,779.0 $ 1,656.1 $ 1,318.9 Retail net sales - Europe 509.6 412.1 235.6 Retail net sales - Asia 106.3 66.4 38.5 Wholesale net sales - The Americas 1,628.6 1,662.5 1,335.5 Wholesale net sales - Europe 406.4 401.1 242.0 Wholesale net sales - Asia 108.9 1.5 — Licensing Revenue- The Americas 99.0 100.3 117.4 Licensing Revenue- Europe 74.3 71.5 22.9 Total revenue $ 4,712.1 $ 4,371.5 $ 3,310.8 Rapidly Growing Luxury Lifestyle Brand with Best-in-Class Growth Metrics. We believe that the Michael Kors name has become synonymous with luxurious fashion that is timeless and elegant, expressed through sophisticated accessory and ready-to-wear collections. Each of our collections exemplifies the jet-set lifestyle and features high quality designs, materials and craftsmanship. Some of the most widely recognized global trendsetters—including celebrities such as Kate Hudson, Halle Berry, Angelina Jolie, Heidi Klum, Blake Lively, Penelope Cruz,Jennifer Lopez, Taylor Swift, Michelle Obama, Gwyneth Paltrow, the Duchess of Cambridge, and Catherine Zeta-Jones—Cate Blanchett—walk the red carpet in our collections.Wecollections. We have built a solid foundation for continued long-term global growth and currently enjoy best-in-class growth metrics. Our brand image has been further enhanced by Mr. Kors’ position as a judge on six-time Emmy-nominated reality showProject Runway, during the 2004 season through 2012.Poised to Take Share in the Growing Global Accessories Product Category. According to theAltagamma Studies, from 2005 to 2012*, theThe accessories product category washas been the fastest growing product category in the global luxury goods industry, and in 2012 the accessories product category is estimated to have generated sales of approximately $75.0 billion, representing 27% of total luxury goods sales.industry. In 2004, we saw the opportunity to capitalize on growing accessories demand by leveraging the strength of theMichael Korsluxury collection, and we introduced the accessible luxuryMICHAEL Michael Kors, collection further enhancing our brand awareness within North America.awareness.*sales for the 2012 calendar year are currently an estimate.2013,2016, our retail segment reported net sales of $1,062.6 million and$2.395 billion, which represented a 40.1%12.2% increase from net sales of $2.135 billion in year-over-year comparable store sales from Fiscal 2012.2015. Within our retail segment we have threefour primary retail store formats: collection stores, lifestyle stores, outlet stores and outlet stores.e-commerce sites. Our collection stores are located in some of the world’s most prestigious shopping areas, such as Madison Avenue in New York and Rodeo Drive in California, and are generally 3,200 square feet in size. Our lifestyle stores are located in some of the world’s most frequented metropolitan shopping locations and leading regional shopping centers, and are generally 2,2002,700 square feet in size. We also extend our reach to additional consumer groups through our outlet stores, which are generally 2,8003,600 square feet in size. We also have e-commerce sites in the United States and Canada and plan to launch additional e-commerce sites in Europe and Asia in Fiscal 2017 and 2018. In addition to these threefour retail store formats, we operate concessions in a select number of department stores in North America and internationally. Nordstrom and Macy’s in North America; and Harrods, Harvey Nichols, Selfridges and Galeries Lafayette in Europe. These relationships enable us to access large numbers of our key consumers in a targeted manner. In addition, we are engaged in wholesale growth initiatives that are designed to transform the Michael Kors displays at select department stores into branded “shop-in-shops.” By installingOur "shop-in-shops" have specially trained staff, as well as customized freestanding fixtures, wall casings, and components, decorative items, and flooring, as well as deploying specially trained staff, we believe that our shop-in-shopsand provide department store consumers with a more personalized shopping experience than traditional retail department store configurations. We are also engaged with our wholesale customers on initiatives designed to maximize their e-commerce growth and have entered into new innovative supply chain partnerships with our wholesale customers designed to increase the speed at which our products reach the ultimate consumer. These initiatives, among others, have helped increase total revenue for our wholesale segment by 3.8% from $610.2 million$2.065 billion in Fiscal 20122015 to $1,032.1 million$2.144 billion in Fiscal 2013, representing2016, despite a 69.2% year-over-year increase.challenging wholesale environment.GrowingInnovative Product Offerings from our Licensing Segment. The strength of our global brand has been instrumental in helping us build our licensing business. We collaborate with a select number of product licensees who produce and sell what we believe are products requiring specialized expertise that are enhanced by our brand strength. Our relationship with Fossil Partners, LP. (“Fossil”), for instance, has helped us create a line of watches and jewelry that we believe have become and will continue to be, status items for young fashion-conscious consumers. OtherAs of April 2, 2016, our product licensees include, among others,also included the Aramis and Designer Fragrances division of The Estée Lauder Companies Inc. (“Estée Lauder”) for fragrances and Marchon Eyewear Inc. (“Marchon”)beauty, and Luxottica Group (Luxottica) for eyewear.eyewear, among others. Our relationships with our product licensees have helped us leverage our success across demographics and categories by taking advantage of their unique expertise, resulting in total revenue for licensed products increasing from $65.2$171.8 million in Fiscal 20122015 to $87.0$173.3 million in Fiscal 2013.2016, despite taking direct control of our previously licensed businesses in Latin America and South Korea in Fiscal 2016. During Fiscal 2017, we plan to introduce new fragrance offerings and connected technology, in collaboration with our licensees. In addition, we have entered into agreements with non-manufacturing third-party licensees who we believe have particular expertise in the distribution of fashion accessories, footwear and apparel in specific geographic territories, such as Korea, the Philippines, Singapore, Malaysia, greater China, the Middle East, Turkey, Russia, the CaribbeanEastern Europe, certain parts of Asia and Latin America.Australia.overan average of 25 years of experience in the retail industry, including at a number of public companies, and an average of teneleven years with Michael Kors, our senior management team has strong creative and operational experience and a successful track record. This extensive experience extends beyond our senior management team and deep into our organization.increasecontinue to create shareholder value by increasing our revenue and profits, increasing our comparable store sales and strengthenstrengthening our global brand. OurWe plan to achieve our business strategy includesby focusing on the following:Increase OurTrend Setting Innovative Product Offerings. We will continue to grow our market share and revenue by ensuring that the majority of our product offerings each season are comprised of new products across our lifestyle portfolio, in order to strengthen our position as a fashion leader and continue to generate business growth. We also plan to specifically focus on global diversity in our product offerings.Awareness.Positioning. We intend to continue increasing brand awareness and customer loyalty in North America and internationally in a number of ways, including by:locations;locations around the world; andinternetsocial media presence and continuing to distribute our store catalog featuring our new collections;•holding our semi-annual runway shows that reinforce Mr. Kors’ designer status and high-fashion image, creating excitement around theMichael KorsandMICHAEL Michael Korscollections and generating global multimedia press coverage; andleveraging Mr. Kors’ global prestige and popularity through a variety of press activities and personal appearances.Expand Our Retail Store Base in North America. Continue to expand our retail store base in North America. We believe that there is significant opportunityplan to continue expanding our retail store baseto invest in North Americatechnology and to increase our North American retail store base to approximately 400 locations in the long term. We will look to open new stores predominately in high traffic areas of street and mall locations in high-income demographic areas and will adhere to our already successful retail store formats, which we believe reinforce our brand image and generate strong sales per square foot.
Expand North American Shop-in-Shop Footprint at Select Department Stores. Continue to increase our North American wholesale sales by increasing shop-in-shops. We believe that our proprietary shop-in-shop fixtures effectively communicate our brand image within the department store, enhance the presentationfocus on customer relationship initiatives as part of our merchandise and createomni-channel strategy to provide a moreseamless customer experience across the different channels by:
Increase Global Comparable Store Sales. Continue to increase global comparable store sales with a number of initiatives already under way to increase the size and frequency of purchases by our existing customers and to attract new customers. Such initiatives include, among others, increasing the size of existing stores, creating compelling store environments and offering new products, including logo products, small leather goods, active footwear and fashion jewelry.
Grow International Retail and Wholesale Businesses. Continuewill continue our international expansion in select regions throughoutAsia and Europe and other keyleverage our existing operations in international markets,locations to increase global brand awareness and continuemarket share by:
. We intend to continue making investments in technology focused on optimizing our digital presence, including:
The
| Fiscal Years Ended | ||||||||||||||||||||
| April 2, 2016 | % of Total | March 28, 2015 | % of Total | March 29, 2014 | % of Total | |||||||||||||||
| Accessories | $ | 3,179.7 | 70.1 | % | $ | 2,872.2 | 68.4 | % | $ | 2,060.8 | 65.0 | % | ||||||||
| Apparel | 543.7 | 12.0 | % | 549.4 | 13.1 | % | 482.4 | 15.2 | % | |||||||||||
| Footwear | 491.0 | 10.8 | % | 444.1 | 10.5 | % | 338.0 | 10.7 | % | |||||||||||
| Licensed product | 324.4 | 7.1 | % | 334.0 | 8.0 | % | 289.3 | 9.1 | % | |||||||||||
| Net sales | $ | 4,538.8 | $ | 4,199.7 | $ | 3,170.5 | ||||||||||||||
The
Watches. Fossil has been our exclusive watch licensee since April 2004. Watches are sold in our retail stores, our e-commerce site and by our licensing partnerFossil to wholesale customers in addition to select watch retailers. Generally, our watches retail for between $150 and $500.
Eyewear. Marchon has been our exclusive eyewear licensee since January 2004. Marchon has developed what we believe is a distinctive product assortment of eyewear inspired by our collections. Our eyewear products are focused on status eyewear with sunglasses serving as a key category. Eyewear is sold in our retail stores and by our licensing partnerfrom $195 to wholesale customers in addition to select sunglass retailers and prescription eyewear providers. Generally, our eyewear retails for between $85 and $285.$695.
In varying degrees, depending on
other three quarters.
anticipating and responding to changing consumer demands in a timely manner; establishing and maintaining favorable brand-name recognition; determining and maintaining product quality; maintaining key employees; maintaining and growing market share; developing quality and differentiated products that appeal to consumers; establishing and maintaining acceptable relationships with retail customers; pricing products appropriately; providing appropriate service and support to retailers; optimizing retail and supply chain capabilities; determining size and location of retail and department store selling space; and protecting intellectual property. identify new markets where our products and brand image will be accepted or the performance of our retail stores, including concessions, and shop-in-shops will be considered successful; negotiate acceptable lease terms, including desired tenant improvement allowances, to secure suitable store locations; hire, train and retain personnel and field management; assimilate new personnel and field management into our corporate culture; source sufficient inventory levels; and successfully integrate new retail stores, including concessions, and shop-in-shops into our existing operations and information technology systems. increasing our vulnerability to general adverse economic and industry conditions; limiting our ability to obtain additional financing; requiring a substantial portion of our available cash to pay our rental obligations, thus reducing cash available for other purposes; limiting our flexibility in planning for or reacting to changes in our business or placing us at a disadvantage with respect to some of our competitors. obtain capital; exercise operational and financial control over its business; manage its labor relations; maintain relationships with suppliers; manage its credit and bankruptcy risks; and maintain customer relationships. timely manner or to meet the required quality standards could cause us to miss the delivery date requirements of our customers for those items. The failure to make timely deliveries may cause customers to cancel orders, refuse to accept deliveries or demand reduced prices, any of which could have a material adverse effect on us. In addition, any of the following factors could negatively affect our ability to produce or deliver our products and, as a result, could have a material adverse effect on our business, financial condition and operating results: significant delays or disruptions in delivery of our products due to labor disputes or strikes at political or military conflict involving the United States, which could cause a delay in the transportation of our products and raw materials and increase transportation costs; heightened terrorism security concerns, which could subject imported or exported goods to additional, more frequent or more thorough inspections, leading to delays in deliveries or impoundment of goods for extended periods of time or could result in increased scrutiny by customs officials for counterfeit goods, leading to lost sales, increased costs for our anti-counterfeiting measures and damage to the reputation of our brands; a significant decrease in availability or an increase in the cost of raw materials; disease epidemics and health-related concerns, which could result in closed factories, reduced workforces, scarcity of raw materials and scrutiny or embargoing of goods produced in infected areas; the migration and development of manufacturing contractors, which could affect where our products are or are planned to be produced; imposition of regulations, quotas and safeguards relating to imports and our ability to adjust in a timely manner to changes in trade regulations, which, among other things, could limit our ability to produce products in cost-effective countries that have the labor and expertise needed; increases in the costs of fuel, travel and transportation; imposition of duties, taxes and other charges on imports; significant fluctuation of the value of the United States dollar against foreign currencies; and restrictions on transfers of funds out of countries where our foreign licensees are located. results, and impact the cost and availability of our goods. terminate. our board of directors’ ability to amend the Memorandum and Articles provisions relating to the multiple classes and three-year terms of directors, the manner of election of directors, removal of directors and the appointment of directors upon an increase in the number of directors or vacancy on our board of directors; restrictions on the ability of shareholders to call meetings and bring proposals before meetings; elimination of the ability of shareholders to act by written consent; and the requirement of the affirmative vote of 75% of the shares entitled to vote to amend certain provisions of our Memorandum and Location Use Whittier, CA U.S. Distribution New York, NY Corporate Offices Montreal, Quebec Canadian Corporate Office and Distribution East Rutherford, NJ Corporate Offices Fiscal 2012 Quarter Ended: December 31, 2011 March 31, 2012 Fiscal 2013 Quarter Ended: June 30, 2012 September 29, 2012 December 29, 2012 March 30, 2013 Statement of Operations Data: Net sales Licensing revenue Total revenue Cost of goods sold Gross profit Selling, general and administrative expenses Depreciation and amortization Impairment of long-lived assets Total operating expenses Income from operations Interest expense Foreign currency loss (income) Income before provision for income taxes Provision for income taxes Net income Net income applicable to preference shareholders Net income available for ordinary shareholders Weighted average ordinary shares outstanding(1): Basic Diluted Net income per ordinary share(2): Basic Diluted Operating Data: Comparable retail store sales growth Retail stores at end of period Balance Sheet Data (as of the end of period dated above): Working capital Total assets Revolving line of credit Note payable to parent Shareholders’ equity Number of ordinary shares Number of preference shares Operations see Note 3 to the accompanying consolidated financial statements for additional information). In addition, on January 1, 2016, we assumed direct control over the previously licensed business in South Korea. During the first quarter of Fiscal 2017, we plan to further expand our global presence by acquiring certain of our currently licensed operations in the Greater China region (see Note 21 to the accompanying consolidated financial statements for additional information). While our significant accounting policies are detailed in Note 2 to the accompanying financial statements, our critical accounting policies are discussed below and include revenue recognition, inventories, impairment of long-lived assets, goodwill, share-based compensation, derivatives and income taxes. These estimates are based on such factors as historical trends, actual and forecasted performance, and market conditions, which are reviewed by management on a quarterly basis. Our historical estimates of these costs were not materially different from actual results. See Note 6 to the accompanying consolidated audited financial statements for additional information. requirements. Prepaid expenses and other current assets Accrued expenses and other current liabilities established limits for credit exposure. Income Taxes (Topic 740): Balance Sheet Classification of Deferred Taxes," which eliminated the prior requirement to present deferred tax assets and liabilities as current and noncurrent in a classified balance sheet. ASU 2015-17 will require all deferred tax assets and liabilities to be classified as noncurrent. ASU 2015-17 is effective beginning with our Fiscal 2018, with earlier application permitted. We elected to early adopt ASU 2015-17 during the third quarter of Fiscal 2016 on a retrospective basis. As of March 28, 2015, previously recorded current deferred tax assets and liabilities of $27.7 million and $3.7 million, respectively, were subject to reclassification to noncurrent. Our balance sheet as of March 28, 2015 also reflects a $7.3 million reclassification between total deferred tax assets and deferred tax liabilities due to the fact that jurisdictional netting is not impacted by ASU 2015-17. any amounts that would have been recorded in previous reporting periods if the adjustment was recognized as of the acquisition date. ASU 2015-16 is effective beginning with our fiscal year 2017, with earlier application permitted, and should be applied prospectively. We are currently evaluating the impact of ASU 2015-15 on our consolidated financial statements. Revenue: Net sales: Retail Wholesale Licensing Total revenue Income from operations: Retail Wholesale Licensing Income from operations in the Americas, Europe and Asia. Full price retail stores including concessions: Number of stores Increase during period Percentage increase vs. prior year Total gross square footage Average square footage per store Outlet stores: Number of stores Increase during period Percentage increase vs. prior year Total gross square footage Average square footage per store 2014: Number of full-price wholesale doors Increase during year Percentage increase vs. prior year 2014: On January 1, 2016, our licensing agreement in South Korea expired and we acquired direct control of the related retail and wholesale operations. In addition, we plan to acquire certain of our licensed operations in the Greater China region during the first quarter of Fiscal 2017. Total revenue Gross profit as a percent of total revenue Income from operations Retail net sales - North America Retail net sales - Europe Retail net sales - Japan Increase in comparable store net sales - North America Increase in comparable store net sales - Europe Increase in comparable store net sales - Japan* Wholesale net sales - North America Wholesale net sales - Europe Selling, general and administrative expenses (see below), and as a result our cost of goods sold may not be comparable to that of other entities that have chosen to include some or all of those expenses as a component of their cost of goods sold. 2015 Statements of Operations Data: Net sales Licensing revenue Total revenue Cost of goods sold Gross profit Selling, general and administrative expenses Depreciation and amortization Impairment of long-lived assets Total operating expenses Income from operations Interest expense, net Foreign currency loss (gain) Income before provision for income taxes Provision for income taxes Net income partially offset by lower comparable retail store sales. % of total Revenue Revenue: Net sales: Retail Wholesale Licensing Total revenue 28, 2015 (including 14 stores included as a result of obtaining controlling interest in MK Panama and 36 stores acquired in connection with the MK Korea acquisition) and approximately 14% was attributable to non-comparable sales from our e-commerce sites in the Americas, which included our U.S. e-commerce store sales through the second quarter of Fiscal 2016. Fiscal 2016 included approximately $33.7 million of incremental net retail sales attributable to the inclusion of the 53rd week. 2015. prior year. detailed below. 2015. 2015. that were still in operation. 2015. Income from Operations: Retail Wholesale Licensing Income from operations stores. previously discussed. income related to our anti-counterfeiting efforts. well as higher interest expense on borrowings during Fiscal 2016. 2015 effective tax rate was also favorably impacted by the settlement of certain financial instruments in connection with our international income tax structuring. Attributable to Noncontrolling Interest 2015, which included unfavorable foreign currency effects of $38.1 million. 2014 Statement of Operations Data: Net sales Licensing revenue Total revenue Cost of goods sold Gross profit Selling, general and administrative expenses Depreciation and amortization Impairment of long-lived assets Total operating expenses Income from operations Interest expense, net Foreign currency (gain) loss Income before provision for income taxes Provision for income taxes Net income Revenue: Net sales: Retail Wholesale Licensing Total revenue March 29, 2014 and sales from our e-commerce site. European operations, whose net sales grew by 65.7% from Fiscal 2015 to Fiscal 2014. watches, jewelry and winter outerwear. 2014. revenue. 2014. in Fiscal 2014. 2014. Income from Operations: Retail Wholesale Licensing Income from operations 2014, which was primarily due to lower selling and distribution costs, reflecting our operating expense leverage, partially offset by increased depreciation and amortization expenses as a result of the growth in our wholesale doors. joint venture. applicable reporting units. MKHL 2014. Balance Sheet Data: Cash and cash equivalents Working capital Total assets Revolving line of credit Cash Flows Provided By (Used In): Operating activities Investing activities Financing activities Effect of exchange rate changes Net increase in cash and cash equivalents 2015. infrastructure. restricted share awards. Fiscal year ending Operating leases these contracts. Firm - Ernst & Young LLP. 28, 2015. 29, 2014. 29, 2014. 29, 2014. Amended and Restated Memorandum and Articles of Association of Michael Kors Holdings Limited (included as Exhibit 99.3 to the Company’s Current Report on Form 6-K filed on February 14, 2012, and incorporated herein by reference). 4.1 4.3 10.2 10.3 10.5 10.9 21.1 31.1 31.2 32.1 32.2 101.1 /s/ John D. Idol Chairman, Chief Executive Officer and Director (Principal Executive Officer) /s/ Joseph B. Parsons Chief Financial /s/ M. William Benedetto /s/ Stephen F. Reitman /s/ Ann McLaughlin Korologos /s/ Jean Tomlin /s/ Judy Gibbons opinion. Current assets Cash and cash equivalents Receivables, net Inventories Deferred tax assets Prepaid expenses and other current assets Total current assets Property and equipment, net Intangible assets, net Goodwill Deferred tax assets Other assets Total assets Current liabilities Revolving line of credit Accounts payable Accrued payroll and payroll related expenses Accrued income taxes Accrued expenses and other current liabilities Total current liabilities Deferred rent Deferred tax liabilities Other long-term liabilities Total liabilities Commitments and contingencies Shareholders’ equity Ordinary shares, no par value; 650,000,000 shares authorized, and 201,454,408 shares issued and outstanding at March 30, 2013, and 192,731,390 shares issued and outstanding at March 31, 2012 Additional paid-in capital Accumulated other comprehensive loss Retained earnings Total shareholders’ equity Total liabilities and shareholders’ equity Net sales Licensing revenue Total revenue Cost of goods sold Gross profit Selling, general and administrative expenses Depreciation and amortization Impairment of long-lived assets Total operating expenses Income from operations Interest expense, net Foreign currency loss (gain) Income before provision for income taxes Provision for income taxes Net income Net income applicable to preference shareholders Net income available for ordinary shareholders Weighted average ordinary shares outstanding: Basic Diluted Net income per ordinary share: Basic Diluted Statements of Comprehensive Income: Net income Foreign currency translation adjustments Net realized and unrealized gains on derivatives Comprehensive income Balance at April 3, 2010 Net income Foreign currency translation adjustment Total comprehensive income Balance at April 2, 2011 Net income Foreign currency translation adjustment Total comprehensive income Issuance of shares in exchange for note Elimination of contingent redemption on ordinary shares Issuance of convertible preference shares Issuance of restricted shares Exercise of employee share options Equity compensation expense Tax benefits on exercise of share options Contributed capital-services provided by former parent Conversion of convertible preference shares Balance at March 31, 2012 Net income Foreign currency translation adjustment Net unrealized gain on derivatives (net of taxes of $0.1 million) Total comprehensive income Issuance of restricted shares Exercise of employee share options Equity compensation expense Tax benefits on exercise of share options Contributed capital-services provided by former parent Balance at March 30, 2013 data which is in thousands) Cash flows from operating activities Net income Adjustments to reconcile net income to net cash provided by operating activities: Depreciation and amortization Impairment and write-off of property and equipment Impairment of intangible assets Loss on disposal of fixed assets Unrealized foreign exchange loss (gain) Amortization of deferred financing costs Amortization of deferred rent Deferred income taxes Equity compensation expense Tax benefits on exercise of share options Non-cash charges for services provided by former parent Change in assets and liabilities: Receivables, net Inventories Prepaid expenses and other current assets Other assets Accounts payable Accrued expenses and other current liabilities Other long-term liabilities Net cash provided by operating activities Cash flows from investing activities Capital expenditures Equity method investments Loans receivable-joint venture Purchase of intangible assets Net cash used in investing activities Cash flows from financing activities Repayments of borrowings under revolving credit agreement Borrowings under revolving credit agreement Bank overdraft Proceeds from private placement Exercise of employee share options Tax benefits on exercise of share options Payment of loan to parent Payment of deferred financing costs Net cash provided by (used in) financing activities Effect of exchange rate changes on cash and cash equivalents Net increase in cash and cash equivalents Beginning of period End of period Supplemental disclosures of cash flow information Cash paid for interest Cash paid for income taxes Supplemental disclosure of noncash investing and financing activities Accrued capital expenditures through geographic licenses. eliminated in consolidation. These estimates are based on such factors as historical trends, actual and forecasted performance, and market conditions, which are reviewed by management on a quarterly basis. Retail Return Reserves: Year ended March 30, 2013 Year ended March 31, 2012 Year ended April 2, 2011 Wholesale Total Sales Reserves: Year ended March 30, 2013 Year ended March 31, 2012 Year ended April 2, 2011 Included in the Company’s cash and cash equivalents as of April 2, 2016 and March 28, 2015 are credit card receivables of $14.5 million and $15.8 million, respectively, which generally settle within two to three business days. opening of new retail stores and start up activities, are expensed as incurred. term, including highly probable renewal periods. The Company includes all depreciation and amortization expense as a component of total operating expenses, as the underlying long-lived assets are not directly or indirectly related to bringing the Company’s products to their existing location and condition. Maintenance and repairs are charged to expense in the year incurred. four years. Fiscal 2016. requirements. Prepaid expenses and other current assets Accrued expenses and other current liabilities hedged item, within cash from operating activities. of period. Diluted net income per ordinary share reflects the potential dilution that would occur if share option grants or any other potentially dilutive extent they are dilutive under the treasury stock method. Numerator: Net Income Net income applicable to preference shareholders Net income available for ordinary shareholders Denominator: Basic weighted average ordinary shares Weighted average dilutive share equivalents: Share options and restricted shares/units Convertible preference shares Diluted weighted average ordinary shares Basic net income per ordinary share Diluted net income per ordinary share Trade receivables: Credit risk assumed by factors/insured Credit risk retained by Company Receivables due from licensees Less allowances: March 28, 2015. No other customer accounted for 10% or more of the Company’s total revenues during Fiscal 2016, Fiscal 2015, or Fiscal 2014. capabilities, the availability of production capacity, quality, pricing and delivery. The inability of certain contractors to provide needed services on a timely basis could adversely affect the Company’s operations and financial condition. The Company has relationships with various agents who source the Company’s finished goods with numerous contractors on the Company’s behalf. For the fiscal years ended Furniture and fixtures Equipment Computer equipment and software In-store shops Leasehold improvements Less: accumulated depreciation and amortization Construction-in-progress 2014 impairment charges related to three retail locations, all of which were still in operation. Trademarks Lease Rights Goodwill Fiscal 2014 Fiscal 2015 Fiscal 2016 Fiscal 2017 Fiscal 2018 Thereafter Professional services Advance royalty Inventory purchases Sales tax payable Unrealized loss on foreign exchange contracts Advertising Other expires on October 29, 2020. April 2, 2016 are as follows (in millions): Minimum rentals Contingent rent Total rent expense Fiscal year ending 2014 2015 2016 2017 2018 Thereafter April 2, 2016, including $10.0 million in letters of credit issued under the 2015 Credit Facility. Foreign currency forward contracts- Euro Foreign currency forward contracts- U.S. Dollar Total table (in millions): Outstanding at March 31, 2012 Granted Exercised Canceled/forfeited Outstanding at March 30, 2013 Vested or expected to vest at March 30, 2013 Vested and exercisable at March 30, 2013 April 2, 2016: $19.8 million, which is expected to be recognized over the related weighted-average period of approximately 2.19 years. Expected dividend yield Volatility factor Weighted average risk-free interest rate Expected life of option and Restricted Share Units Performance-based RSUs vest in full on the three-year anniversary of the date of grant, subject to the employee’s continued employment during the vesting period and only if certain pre-established cumulative performance targets are met at the end of the three-year performance period. Expense related to performance-based RSUs is recognized ratably over the three-year performance period, net of forfeitures, based on the probability of attainment of the related performance targets. The potential number of shares that may be earned ranges between 0%, if the minimum level of performance is not attained, and 150%, if the level of performance is at or above the pre-determined maximum achievement level. Unvested at March 31, 2012 Granted Vested Canceled/forfeited Unvested at March 30, 2013 Fiscal 2016: United States Non-U.S. Total income before provision for income taxes Current U.S. Federal U.S. State Non-U.S. Total current Deferred U.S. Federal U.S. State Non-U.S. Total deferred Total provision for income taxes tax rate of 35%. The following table summarizes the significant differences between the Federal tax at 35% statutory rate State and local income taxes, net of federal benefit Differences in tax effects on foreign income Foreign tax credit Liability for uncertain tax positions Effect of changes in valuation allowances on deferred tax assets Other Deferred tax assets Inventories Payroll related accruals Deferred rent Net operating loss carryforwards Stock compensation Deferred revenue Other Valuation allowance Total deferred tax assets Deferred tax liabilities Goodwill and intangibles Depreciation Other Total deferred tax liabilities Net deferred tax (liability) assets 2024. Unrecognized tax benefits beginning balance Additions related to prior period tax positions Additions related to current period tax positions Decreases from prior period positions Unrecognized tax benefits ending balance 30, 2013. Revenue: Net sales: Retail Wholesale Licensing Total revenue Income from operations: Retail Wholesale Licensing Income from operations Depreciation: Retail (1) Wholesale Licensing Total depreciation Net revenues: North America (U.S. and Canada) Europe Other regions Total net revenues Long-lived assets: North America (U.S. and Canada) Europe Other regions Total Long-lived assets: Fiscal 2014. Year Ended March 30, 2013 Total Revenue Gross profit Income from operations Net income Weighted average ordinary shares outstanding: Basic Diluted Year Ended March 31, 2012 Total Revenue Gross profit Income from operations Net income Weighted average ordinary shares outstanding: Basic DilutedWe face risks associated with operating in international markets.We operate on a global basis, with approximately 17.5% of our total revenue coming from operations outside of the U.S during Fiscal 2013. The current political and economic instability and changing macroeconomic conditions in major international markets, including Europe and Japan, have resulted in significant macroeconomic risks including high rates of unemployment, high fuel prices, currency volatility and continued global economic uncertainty driven in part by the European debt crisis, among other factors. These risks, combined with expectations of slower global economic growth as well as a decrease in consumer confidence in Europe, may adversely affect discretionary consumer spending in the international markets in which we operate, which could negatively affect sales of our products in these markets. In addition, if the global macroeconomic environment, including the economic situation in Europe, continues to be weak or worsens, our gross margin rates may be negatively impacted.A material disruption in our information technology systems could have a material adverse effect on our business, financial condition and results of operations.We rely extensively on our information technology (“IT”) systems to track inventory, manage our supply chain, record and process transactions, manage customer communications, summarize results and manage our business. The failure of our IT systems to operate properly or effectively, problems with transitioning to upgraded or replacement systems, or difficulty in integrating new systems, could adversely affect our business. In addition, our IT systems may be subject to damage and/or interruption from power outages, computer, network and telecommunications failures, computer viruses, hackers, security breaches, usage errors by our employees and bad acts by our customers and website visitors. If our IT systems are damaged or cease to function properly, we may have to make a significant investment to fix or replace them, and we may suffer loss of critical data (including our customer data) and interruptions or delays in our operations in the interim. Any significant disruption in our IT systems could harm our reputation and credibility, and could have a material adverse effect on our business, financial condition and operating results.Privacy breaches and other cyber security risks related to our e-commerce business could negatively affect our reputation, credibility and business.We are responsible for storing data relating to our customers and employees and rely on third parties for the operation of parts of our e-commerce website,michaelkors.com, and for the various social media tools and websites we use as part of our marketing strategy. During the last quarter of our fiscal 2014 year, we expect to take over more of the direct operations of our e-commerce website and will be processing and storing customer transaction data on systems that are owned and operated by us, or that are operated by our third-party providers. Consumers, lawmakers and consumer advocates alike are increasingly concerned over the security of personal information transmitted over the Internet, consumer identity theft and privacy. In addition to taking the necessary precautions ourselves, we require that third-party service providers implement reasonable security measures to protect our customers’ identity and privacy. We do not, however, control these third-party service providers and cannot guarantee that no electronic or physical computer break-ins and security breaches will occur in the future. Likewise, our systems and technology are subject to the risk of system failures, viruses, “hackers” and other causes that are out of our control. Any perceived or actual unauthorized disclosure of personally identifiable information regarding our customers or website visitors could harm our reputation and credibility, reduce our e-commerce net sales, impair our ability to attract website visitors and reduce our ability to attract and retain customers, and expose us to significant related liability. Finally, we could incur significant costs in complying with the multitude of state, federal and foreign laws regarding the use and unauthorized disclosure of personal information, to the extent they are applicable. We also may incur significant costs in our implementation of additional security measures to comply with applicable laws and industry standards and to further protect customer data.We may not be able to respond to changing fashion and retail trends in a timely manner, which could have a material adverse effect on our brand, business, financial condition and operating results.The accessories, footwear and apparel industries have historically been subject to rapidly changing fashion trends and consumer preferences. We believe that our success is largely dependent on our brand image and ability to anticipate and respond promptly tochanging consumer demands and fashion trends in the design, styling, production, merchandising and pricing of products. If we do not correctly gauge consumer needs and fashion trends and respond appropriately, consumers may not purchase our products and our brand name and brand image may be impaired. Even if we react appropriately to changes in fashion trends and consumer preferences, consumers may consider our brand image to be outdated or associate our brand with styles that are no longer popular or trend-setting. Any of these outcomes could have a material adverse effect on our brand, business, financial condition and operating results.ToriTory Burch, Prada, Kate Spade, Tommy Hilfiger and Prada.Calvin Klein, as well as through third party distribution channels, such as e-commerce, department stores and specialty stores. Competition is based on a number of factors, including, without limitation, the following:such other factors such as consolidation, and changes in consumer spending patterns and a highly promotional environment, could also result in significant pricing pressure. These factors may cause us to reduce our sales prices to our wholesale customers and retail consumers, which could cause our gross margins to decline if we are unable to appropriately manage inventory levels and/or otherwise offset price reductions with comparable reductions in our operating costs. If our sales prices decline and we fail to sufficiently reduce our product costs or operating expenses, our profitability may decline, which could have a material adverse effect on our business, financial condition and operating results.pre-operatingpre-opening costs and we may encounter initial losses when new retail stores, including concessions, and shop-in-shops commence operations. Certain of our European stores require investments in the form of key money to secure prime locations, which may be paid to landlords or existing lessees. While we expect to open a number of additional retail stores, including concessions, and shop-in-shops in the future, there can be no assurance that we will open the planned number, that we will recover the expenditure costs associated with opening these new retail stores, including concessions, and shop-in-shops or that the operation of these new venues will be successful or profitable. Any such failurechanges from our initial expectations could have a material adverse effect on our business, financial condition and operating results.We face additional risks with respect to our strategy to expand internationally, including our efforts to further expand our operations in European countries and in Japan as well as other Asian countries. In some of these countries we do not yet have significant operating experience, and in most of these countries we face established competitors with significantly more operating experience in those locations. Many of these countries have different operational characteristics, including, but not limited to, employment and labor, transportation, logistics, real estate (including lease terms) and local reporting or legal requirements. Furthermore, consumer demand and behavior, as well as tastes and purchasing trends may differ in these countries and, as a result, sales of our product may not be successful, or the margins on those sales may not be in line with those we currently anticipate. In addition, in many of these countries there is significant competition to attract and retain experienced and talented employees. If our international expansion plans are unsuccessful, it could have a material adverse effect on our business, financial condition and operating results.We have grown rapidly in recent years and we have limited operating experience at our current scale of operations; if we are unable to manage our operations at our current size or are unable to manage any future growth effectively, our brand image and financial performance may suffer.We have expanded our operations rapidly and have limited operating experience at our current size. If our operations continue to grow, we will be required to continue to expand our sales and marketing, product development and distribution functions, to upgrade our management information systems and other processes and to obtain more space for our expanding administrative support and other headquarter personnel. Our continued growth could strain our existing resources, and we could experience operating difficulties, including the availability of desirable locations and the negotiation of acceptable lease terms, difficulties in hiring, training and managing an increasing number of employees, difficulties in obtaining sufficient raw materials and manufacturing capacity to produce our products and delays in production and shipments. These difficulties could result in the erosion of our brand image and could have a material adverse effect on our business, financial condition and operating results.We are dependent on a limited number of distribution facilities. If one or more of our distribution facilities experiences operational difficulties or becomes inoperable, it could have a material adverse effect on our business, financial condition and operating results.We operate a limited number of distribution facilities. Our ability to meet the needs of our wholesale customers and our own retail stores depends on the proper operation of these distribution facilities. If any of these distribution facilities were to shut down or otherwise become inoperable or inaccessible for any reason, we could suffer a substantial loss of inventory and/or disruptions of deliveries to our wholesale customers and retail stores. In addition, we could incur significantly higher costs and longer lead times associated with the distribution of our products during the time it takes to reopen or replace the damaged facility. Any of the foregoing factors could have a material adverse effect on our business, financial condition and operating results.In addition, during Fiscal 2013 we transitioned our California distribution facilities from three separate warehouses totaling approximately 350,000 square feet to an approximately 600,000 square foot distribution center in Whittier, California. We believe this expansion and consolidation allows us to significantly increase our distribution capabilities and efficiency. We began operations in this facility prior to March 31, 2012, and were fully transitioned into this facility at the end of the first quarter of Fiscal 2013. Soon after the transition, we implemented a new warehouse management system that further supports our efforts to operate with increased efficiency and flexibility. There are risks inherent in operating in a new distribution environment and implementing a new warehouse management system, including operational difficulties that may arise with such transitions. We may experience shipping delays should there be any disruptions in our new warehouse management system or the warehouse itself.As we expand our store base, we may be unable to maintain the same comparable store sales or average sales per square foot that we have in the past, which could cause our share price to decline.As we expand our store base, we may not be able to maintain the levels of comparable store sales that we have experienced historically. In addition, we may not be able to maintain our historic average sales per square foot as we move into new markets. If our future comparable store sales or average sales per square foot decline or fail to meet market expectations, the price of our ordinary shares could decline. In addition, the aggregate results of operations of our stores have fluctuated in the past and can be expected to continue to fluctuate in the future. A variety of factors affect both comparable store sales and average sales per square foot, including, among others, fashion trends, competition, current economic conditions, pricing, inflation, the timing of the release of new merchandise and promotional events, changes in our merchandise mix, the success of marketing programs and weather conditions. If we misjudge the market for our products, we may incur excess inventory for some of our products and miss opportunities for other products. These factors may cause our comparable store sales results and average sales per square foot in the future to be materially lower than recent periods and our expectations, which could harm our results of operations and result in a decline in the price of our ordinary shares.leases; anyleases. Any failure to make these lease payments when due could materially adversely affect our business, financial condition and operating results.years with no renewal options.years. Our leases generally require a fixed annual rent and most require the payment of additional rent if store sales exceed a negotiated amount. Certain of our European stores also require initial investments in the form of key money to secure prime locations, which may be paid to landlords or existing lessees. Generally, our leases are “net” leases, which require us to pay all of the costs of insurance, taxes, maintenance and utilities. We generally cannot cancel these leases at our option. Payments under these operating leases account for a significant portion of our operating costs. For example, as of March 30, 2013,April 2, 2016, we were party to operating leases associated with our stores as well as other corporate facilities requiring future minimum lease payments aggregating to $405.9 million$1.079 billion through Fiscal 20182021 and approximately $282.7$746.7 million thereafter through Fiscal 2029.2033. We expect that any new stores we open under operating leases will have terms similar to those contained in leases we have entered previously, which will further increase our operating lease expenses.in the industry in which we compete; andincluding, among others, South Korea, the Philippines, Singapore, Malaysia,such as the Middle East, Russia, Turkey,Eastern Europe, Brazil, certain parts of Asia and Australia. In addition, we have a joint venture that covers the distribution and sale of products and the operation of retail stores in Latin America and the Caribbean. In addition, we have entered into similar licensing agreements with entities that are indirectly owned by certain of our current shareholders, including Mr. Kors, Mr. Idol and Sportswear Holdings Limited, pursuant to which we have granted such entities certain rights to distribute and sell our products in China, Hong Kong, Macau and Taiwan. See Note 16 to our financial statements— “Agreements with Shareholders and Related Party Transactions.”Caribbean (excluding Brazil). In the future, we may enter into additional licensing arrangements. Although we take steps to carefully select our licensing partners, such arrangements may not be successful. Our licensing partners may fail to fulfill their obligations under their license agreements or have interests that differ from or conflict with our own, such as the timing of new store openings, the pricing of our products and the offering of competitive products. In addition, the risks applicable to the business of our licensing partners may be different than the risks applicable to our business, including risks associated with each such partner’s ability to:each of our licensed brands.brand. The misuse of our brandsbrand by a licensing partner could have a material adverse effect on our business, financial condition and operating results.29.3%25.8% of our total revenue for Fiscal 20132016 and 27.9%26.3% of our total revenue for Fiscal 2012.2015. Our largest wholesale customer, a large, nationally recognized U.S. department store,Macy's, accounted for 14.0%12.7% of our total revenue for Fiscal 20132016 and 13.3%13.7% of our total revenue for Fiscal 2012.2015. We do not have written agreements with any of our wholesale customers, and purchases generally occur on an order-by-order basis. A decision by any of our major wholesale customers, whether motivated by marketing strategy, competitive conditions, financial difficulties or otherwise, to decrease significantly the amount of merchandise purchased from us or our licensing partners, or to change their manner of doing business with us or our licensing partners, could substantially reduce our revenue and have a material adverse effect on our profitability. During the past several years, the retail industry has experiencedcountries in Asia Europe and Central and South America.Europe. A manufacturing contractor’s failure to ship products to us in aU.S.the location of the source of our goods and/or at ports of entry;2013,2016, our largest manufacturing contractor, who primarily produces its products in China and who we have worked with for the last nineover ten years, accounted for the production of 31.8%26.7% of our finished products. Our inability to promptly replace manufacturing contractors that terminate their relationships with us or cease to provide high quality products in a timely and cost-efficient manner could have a material adverse effect on our business, financial condition and operating results.2013,2016, our largest third-party agent, whose primary place of business is Hong Kong and who we have worked with for the last nineover 10 years, sourced approximately 14.0%14.9% of our purchases of finished goods. Our inability to promptly replace agents that terminate their relationships with us or cease to provide high quality service in a timely and cost-efficient manner could have a material adverse effect on our business, financial condition and operating results.Restrictive covenants in our credit agreement may restrict our ability to pursue our business strategies.We have a $200.0 million senior unsecured credit facility (the “2013 Credit Facility”) under which Michael Kors (USA), Inc. (“MKUSA”), Michael Kors (Europe) B.V., Michael Kors (Canada) Co. and Michael Kors (Switzerland) GmbH, our indirect wholly owned subsidiaries, are borrowers and we are a parent guarantor. The credit agreement governing the terms of the 2013 Credit Facility restricts, among other things, asset dispositions, mergers and acquisitions, dividends, share repurchases and redemptions, other restricted payments, indebtedness, loans and investments, liens and affiliate transactions. Our credit agreement also contains customary events of default, including a change in control of the Company. In addition, our credit agreement contains financial covenants such as requiring an adjusted leverage ratio of 3.5 to 1.0 (with the ratio being total consolidated indebtedness plus 8.0 times consolidated rent expense to EBITDA plus consolidated rent expense) and a fixed charge coverage ratio of 2.0 to 1.0 (with the ratio being EBITDA plus consolidated rent expense to the sum of fixed charges plus consolidated rent expense). See credit discussion in “Management’s Discussion and Analysis— Liquidity”. These covenants, among other things, limit our ability to fund our future working capital needs and capital expenditures, engage in future acquisitions or development activities, or otherwise realize the value of our assets and opportunities fully because of the need to dedicate a portion of our cash flow from operations to payments on debt.rights.rights in the Americas, Europe, the Middle East, the Far East and elsewhere in the world in both online and offline channels. Our brand enjoys significant worldwide consumer recognition, and the generally higher pricing of our products creates additional incentive for counterfeiters and those seeking to infringe on our products.brand. We work with customs authorities, law enforcement, legal representatives and brand specialists globally in an effort to prevent the sale of counterfeit Michael Kors products, but we cannot guarantee the extent to which our efforts to prevent counterfeiting of our brand and other intellectual property infringement will be successful. Such counterfeiting and other infringement could dilute our brand and harm our business.The actions we take to establishreputation and protect our trademarks and other intellectual property rights may not be adequate to prevent imitation of our products by others or other infringement of our intellectual property rights. business.businesssubsidiaries are subject to taxation in the United States and various foreign jurisdictions, with the applicable tax rates varying by jurisdiction. As a result, our overall effective tax rate is exposedeffected by the proportion of earnings from the various tax jurisdictions. We record tax expense based on our estimates of taxable income and required reserves for uncertain tax positions in multiple tax jurisdictions. At any time, there are multiple tax years that are subject to foreign currency exchangeexaminations by various taxing authorities. The ultimate resolution of these audits and negotiations with taxing authorities may result in a settlement amount that differs from our original estimate. In addition, any proposed or future changes in tax laws and regulations or interpretations could have a material effect on our effective tax rates, financial condition, and results of operations.fluctuations.Ourof 25%. While the Company believes that all of its affiliated entities and the transactions among them have the required economic substance, there is no assurance that this legislation will not have a material effect on its results of operations forand financial condition. international subsidiaries are exposedalso engaged in a number of intercompany transactions. Although we believe that these transactions reflect arm’s length terms and that proper transfer pricing documentation is in place, which should be respected for tax purposes, the transfer prices and conditions may be scrutinized by local tax authorities, which could result in additional tax liabilities. On October 5, 2015, the Organization for Economic Co-operation and Development (OECD), an international association of thirty four countries, including the U.S. and UK, released the final reports from its Base Erosion and Profit Shifting (BEPS) Action Plans. The BEPS recommendations covered a number of issues, including country-by-country reporting, permanent establishment rules, transfer pricing rules and tax treaties. Future tax reform resulting from this development may result in changes to foreign exchangelong-standing tax principles, which could adversely affect our effective tax rate fluctuations asor result in higher cash tax liabilities.financial resultsborrowers and certain material subsidiaries provide unsecured guarantees. The credit agreement governing the terms of the applicable subsidiaries are translated from2015 Credit Facility restricts, among other things, asset dispositions, mergers and acquisitions, dividends, share repurchases and redemptions, other restricted payments, indebtedness, loans and investments, liens and affiliate transactions. The 2015 Credit Facility also contains customary events of default, including, but not limited to, payment defaults, material inaccuracy of representations and warranties, covenant defaults, cross-defaults to certain indebtedness, certain events of bankruptcy or insolvency, certain events under ERISA, material judgments, actual or asserted failure of any guaranty supporting the local currency into U.S. dollars during2015 Credit Facility to be in full force and effect, and changes of control. If such an event of default occurs, the process of financial statement consolidation. Iflenders under the U.S. dollar strengthens against foreign currencies,2015 Credit Facility would be entitled to take various actions, including, but not limited to, terminating the translation of these foreign currency denominated transactions could impact our consolidated results of operations.commitments and accelerating amounts outstanding under the 2015 Credit Facility. In addition, we have intercompany notes amongst certainour credit agreement contains a financial covenant requiring us to maintain a leverage ratio of no greater than 3.5 to 1.0 (with the ratio being total consolidated indebtedness plus 6.0 times the consolidated rent expense for the last four consecutive fiscal quarters, to Consolidated EBITDAR for the last four consecutive fiscal quarters). See credit discussion in “Management’s Discussion and Analysis of Financial Condition and Results of Operations — Liquidity”. The covenants in the 2015 Credit Facility, among other things, may limit our ability to fund our future working capital needs and capital expenditures, engage in future acquisitions or development activities, or otherwise realize the value of our non-U.S. subsidiaries, which may be denominated inassets and opportunities fully because of the need to dedicate a currency other than the local currency of a particular reporting entity. As a result of using a currency other than the functional currency of that subsidiary, results of these operations may be adversely affected during times of significant fluctuation between the functional currency of that subsidiary and the currency in which the note is denominated in.Future salesportion of our ordinary shares, or the perceptioncash flow from operations to payments on debt.the public markets that these sales may occur, may depressour financial reporting, which could harm our business and cause a decline in the price of our ordinary shares.Salesa substantial numberthe Sarbanes-Oxley Act. If our management is unable to certify the effectiveness of our ordinary sharesinternal controls or if our independent registered public accounting firm cannot render an opinion on management’s assessment and on the effectiveness of our internal control over financial reporting, or if material weaknesses in theour internal controls are identified, we could be subject to regulatory scrutiny and a loss of public market, or the perception that such sales may occur,confidence, which could have a materialan adverse effect on our business and cause a decline in the price of our ordinary shares. Pursuant toshareholders agreement our pre-IPO shareholders, including Michael Kors, John D. Idol and Sportswear Holdings Limited (an entity owned by twoaccuracy of our directors, Messrs. Silas K. F. Chouearnings guidance or other forward-looking statements regarding our financial performance.Lawrence S. Stroll),long-range planning process is designed to maximize our long-term growth and profitability, and not to achieve an earnings target in any particular fiscal quarter. We believe that this longer-term focus is in the best interests of the Company and our shareholders. At the same time, however, we recognize that it is helpful to provide investors with guidance as to our forecast of net sales, earnings per share, comparable store sales and other financial metrics or projections. While we generally expect to provide updates to our financial guidance when we report our results each fiscal quarter, we do not have demandany responsibility to update any of our forward-looking statements at such times or otherwise. In addition, any longer-term guidance that we provide is based on goals that we believe, at the time guidance is given, are reasonably attainable for growth and piggyback rightsperformance over a number of years. However, such long-range targets are more difficult to predict than our current quarter and fiscal year expectations. If, or when, we announce actual results that will requirediffer from those that have been predicted by us, outside investment analysts, or others, our share price could be adversely affected. Investors who rely on these predictions when making investment decisions with respect to file registration statements registeringour securities do so at their ordinary shares or to include salesown risk. We take no responsibility for any losses suffered as a result of such ordinary shareschanges in registration statementsour share price.may file for ourselves or other shareholders. In the event such registration rights are exercised and a large number of ordinarywill repurchase all shares are sold in the public market, such sales could reduce the trading price ofavailable under our ordinary shares. In addition, the perception that these sales might occur could cause theshare repurchase program. The market price of our ordinary sharessecurities could be adversely affected if our share repurchase activity differs from investors’ expectations or if our share repurchase program were to decrease significantly. of Association and Articles of Association (together, as amended from time to time, our “Memorandum and Articles of Association”Articles”) contains several provisions that may make it more difficult or expensive for a third party to acquire control of us without the approval of our board of directors. These provisions also may delay, prevent or deter a merger, acquisition, tender offer, proxy contest or other transaction that might otherwise result in our shareholders receiving a premium over the market price for their ordinary shares. These provisions include, among others: of Association to create and issue, from time to time, one or more classes of preference shares and, with respect to each such class, to fix the terms thereof by resolution;Articles of Association. of Association could discourage potential takeover attempts and reduce the price that investors might be willing to pay for our ordinary shares in the future, which could reduce the market price of our ordinary shares. of Association, the BVI Business Companies Act, 2004 (as amended, the “BVI Act”) and the common law of the British Virgin Islands. The rights of shareholders to take legal action against our directors, actions by minority shareholders and the fiduciary responsibilities of our directors under British Virgin Islands law are to a large extent governed by the common law of the British Virgin Islands and by the BVI Act. The common law of the British Virgin Islands is derived in part from comparatively limited judicial precedent in the British Virgin Islands as well as from English common law, which has persuasive, but not binding, authority on a court in the British Virgin Islands. The rights of our shareholders and the fiduciary responsibilities of our directors under British Virgin Islands law are not as clearly established as they would be under statutes or judicial precedents in some jurisdictions in the United States. In particular, the British Virgin Islands has a less developed body of securities laws as compared to the United States, and some states (such as Delaware) have more fully developed and judicially interpreted bodies of corporate law. As a result of the foregoing, holders of our ordinary shares may have more difficulty in protecting their interests through actions against our management, directors or major shareholders than they would as shareholders of a U.S. company.10-10. — “Additional Information-Information — Memorandum and Articles of Association”). The principal protection under statutory law is that shareholders may bring an action to enforce the constituent documents of a British Virgin Islands company and are entitled to have the affairs of the company conducted in accordance with the BVI Act and the memorandum and articles of association of the company. As such, if those who control the company have persistently disregarded the requirements of the BVI Act or the provisions of the company’s memorandum and articles of association, then the courts will likely grant relief. Generally, the areas in which the courts will intervene are the following: (i) an act complained of which is outside the scope of the authorized business or is illegal or not capable of ratification by the majority; (ii) acts that constitute fraud on the minority where the wrongdoers control the company; (iii) acts that infringe on the personal rights of the shareholders, such as the right to vote; and (iv) acts where the company has not complied with provisions requiring approval of a special or extraordinary majority of shareholders, which are more limited than the rights afforded to minority shareholders under the laws of many states in the United States. of Association, we may indemnify and hold our directors harmless against all claims and suits brought against them, subject to limited exceptions. Furthermore, to the extent allowed by law, the rights and obligations among or between us, any of our current or former directors, officers and employees and any current or former shareholder will be governed exclusively by the laws of the British Virgin Islands and subject to the jurisdiction of the British Virgin Islands courts, unless those rights or obligations do not relate to or arise out of their capacities as such. Although there is doubt as to whether United States courts would enforce these provisions in an action brought in the United States under United States securities laws, these provisions could make judgments obtained outside of the British Virgin Islands more difficult to enforce against our assets in the British Virgin Islands or jurisdictions that would apply British Virgin Islands law.Legislation has been introduced that would, if enacted, treat us as a U.S. corporation for U.S. federal income tax purposes.On February 7, 2012, U.S. Senator Carl Levin introduced legislation in the U.S. Senate entitled the “Cut Loopholes Act.” U.S. Senator Levin and U.S. Representative Lloyd Doggett originally introduced similar legislative proposals in 2009 and similar legislation was proposed in 2010 and 2011. If enacted, this legislation would, among other things, cause us to be treated as a U.S. corporation for U.S. tax purposes, as generally any entity whose shares are publicly traded on an established securities market, or whose gross assets are $50 million or more, if the “management and control” of such a corporation is, directly or indirectly, is treated as occurring primarily within the United States. The proposed legislation provides that a corporation will be so treated if substantially all of the executive officers and senior management of the corporation who exercise day-to-day responsibility for making decisions involving strategic, financial and operational policies of the corporation are located primarily within the United States. To date, this legislation has not been approved by either the House of Representatives or the Senate. However, we can provide no assurance that this legislation or similar legislation will not ultimately be adopted. Any such modification to the U.S. federal income tax laws that affects the tax residency of a non-U.S. company managed and controlled in the United States could adversely affect the U.S. federal taxation of some or all of our income and the value of our ordinary shares.Failure to maintain adequate financial and management processes and controls could lead to errors in our financial reporting, which could harm our business and cause a decline in the price of our ordinary shares. As a public company we are required to document and test our internal controls over financial reporting pursuant to Section 404 of the Sarbanes-Oxley Act so that our management can certify the effectiveness of our internal controls on management’s assessment and on the effectiveness of our internal control over financial reporting in our annual reports. If our management is unable to certify the effectiveness of our internal controls or if our independent registered public accounting firm cannot render an opinion on management’s assessment and on the effectiveness of our internal control over financial reporting, or if material weaknesses in our internal controls are identified, we could be subject to regulatory scrutiny and a loss of public confidence, which could harm our business and cause a decline in the price of our ordinary shares.Item 1B.Unresolved Staff CommentsMarch 30, 2013,April 2, 2016, all of which are leased.leased with the exception of our distribution center in Holland, which is owned. The leases expire at various times through Fiscal 2026,2033, subject to renewal options. 1,284,400 613,375Venlo, Holland 1,076,390 262,450 123,358 205,500 100,702 53,476 43,336Secaucus, NJ Distribution 25,403 Secaucus, NJ Distribution 22,760 London, England Corporate Offices 17,221 Paris, France Corporate Offices 16,033 In May 2015, we acquired land in Venlo, Holland and are currently in the process of building our own distribution facility, which will support all of our European operations. The new facility is expected to begin operating in Fiscal 2017. March 30, 2013,April 2, 2016, we also occupied 273668 leased retail stores worldwide (excluding(including concessions). We consider our properties to be in good condition generally and believe that our facilities are adequate for our operations and provide sufficient capacity to meet our anticipated requirements.property.property as of April 2, 2016.Item 5. Market for Registrant’s Common Equity, Related Stockholder Matters and Issuer Purchases of Equity Securities March 30, 2013,April 2, 2016, there were 201,454,408176,441,891 ordinary shares outstanding, and the closing sale price of our ordinary shares was $56.79.$56.97. Also as of that date, we had approximately 94273 ordinary shareholders of record. The table below sets forth the high and low closing sale prices of our ordinary shares for the periods indicated: High Low $ 27.58 $ 23.51 $ 50.69 $ 25.50 $ 49.50 $ 35.50 $ 57.35 $ 37.77 $ 58.62 $ 46.66 $ 65.10 $ 49.00 High Low Fiscal 2015 Quarter Ended: June 28, 2014 $ 98.96 $ 85.71 September 27, 2014 $ 91.79 $ 71.25 December 27, 2014 $ 79.70 $ 68.25 March 28, 2015 $ 76.05 $ 63.31 Fiscal 2016 Quarter Ended: June 27, 2015 $ 66.26 $ 44.91 September 26, 2015 $ 45.37 $ 38.06 December 26, 2015 $ 43.89 $ 38.53 April 2, 2016 $ 58.54 $ 35.57 March 30, 2013,April 1, 2016, the last business day of the our fiscal year. The graph assumes an investment of $100 made at the closing of trading on December 15, 2011, in (i) our ordinary shares, (ii) the shares comprising the RUI, (iii) the shares comprising the GSPC, (iv) the shares comprising the RLX and (iv)(v) the shares comprising the NYA. The peer group consists of the following: Coach, Inc., Guess, Inc., PVH Corp., Limited Brands, Inc., and Ralph Lauren Corporation. All values assume reinvestment of the full amount of all dividends, if any, into additional shares of the same class of equity securities at the frequency with which dividends are paid on such securities during the applicable time period.
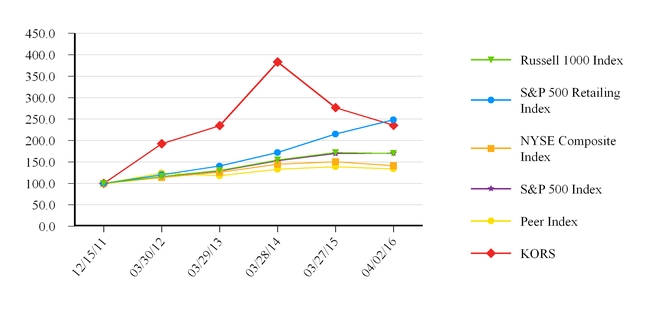
Total Number of Shares Purchased Total Number of Shares (or Units) Purchased as Part of Publicly Announced Plans or Programs December 27 – January 23 — $ — — $ 558,054,655 January 24 – February 20 1,553,900 51.96 1,553,900 477,316,788 February 21 – April 2 2,136,785 55.81 2,136,785 358,054,655 Item 6.Selected Financial Data2013, 20122016, Fiscal 2015 and 2011Fiscal 2014 and the balance sheet data as of the end of Fiscal 20132016 and 2012Fiscal 2015 have been derived from our audited consolidated financial statements included elsewhere in this report. The statements of operations data for Fiscal 20102013 and Fiscal 20092012 and the balance sheet data as of the end of Fiscal 20112014, Fiscal 2013 and Fiscal 20102012 have been derived from our prior audited consolidated financial statements, which are not included in this report. The balance sheet data as of the end of Fiscal 2009 have been derived from our unaudited consolidated financial statements, which are not included in this report. Fiscal Years Ended March 30,
2013 March 31,
2012 April 2,
2011 April 3,
2010 March 28,
2009 (data presented in thousands, except for shares and per share data ) $ 2,094,757 $ 1,237,100 $ 757,800 $ 483,452 $ 377,058 86,975 65,154 45,539 24,647 20,016 2,181,732 1,302,254 803,339 508,099 397,074 875,166 549,158 357,274 241,365 208,283 1,306,566 753,096 446,065 266,734 188,791 621,536 464,568 279,822 191,717 147,490 54,291 37,554 25,543 18,843 14,020 725 3,292 3,834 — 3,043 676,552 505,414 309,199 210,560 164,553 630,014 247,682 136,866 56,174 24,238 1,524 1,495 1,861 2,057 1,600 1,363 (2,629 ) 1,786 (830 ) 391 627,127 248,816 133,219 54,947 22,247 229,525 101,452 60,713 15,699 9,208 397,602 147,364 72,506 39,248 13,039 — 21,227 15,629 8,460 2,811 $ 397,602 $ 126,137 $ 56,877 $ 30,788 $ 10,228 196,615,054 158,258,126 140,554,377 140,554,377 140,554,377 201,540,144 189,299,197 179,177,268 179,177,268 179,177,268 $ 2.02 $ 0.80 $ 0.40 $ 0.22 $ 0.07 $ 1.97 $ 0.78 $ 0.40 $ 0.22 $ 0.07 Fiscal Years Ended March 28,
2015 March 29,
2014 March 30,
2013 March 31,
2012 (data presented in millions, except for shares and per share data) Statement of Operations Data: Net sales $ 4,538.8 $ 4,199.7 $ 3,170.5 $ 2,094.7 $ 1,237.1 Licensing revenue 173.3 171.8 140.3 87.0 65.2 Total revenue 4,712.1 4,371.5 3,310.8 2,181.7 1,302.3 Cost of goods sold 1,914.9 1,723.8 1,294.7 875.1 549.2 Gross profit 2,797.2 2,647.7 2,016.1 1,306.6 753.1 Selling, general and administrative expenses 1,428.0 1,251.5 926.9 621.6 464.6 Depreciation and amortization 183.2 138.4 79.7 54.3 37.5 Impairment of long-lived assets 10.9 0.8 1.3 0.7 3.3 Total operating expenses 1,622.1 1,390.7 1,007.9 676.6 505.4 Income from operations 1,175.1 1,257.0 1,008.2 630.0 247.7 Other income (3.7 ) (1.6 ) — — — Interest expense, net 1.7 0.2 0.4 1.5 1.5 Foreign currency loss (gain) 4.8 2.6 0.1 1.4 (2.6 ) Income before provision for income taxes 1,172.3 1,255.8 1,007.7 627.1 248.8 Provision for income taxes 334.6 374.8 346.2 229.5 101.5 Net income 837.7 881.0 661.5 397.6 147.3 Less: net income applicable to preference shareholders — — — — 21.2 Less: Net loss attributable to noncontrolling interest (1.4 ) — — — — Net income available for ordinary shareholders of MKHL $ 839.1 $ 881.0 $ 661.5 $ 397.6 $ 126.1 Basic 186,293,295 202,680,572 202,582,945 196,615,054 158,258,126 Diluted 189,054,289 205,865,769 205,638,107 201,540,144 189,299,197 Basic $ 4.50 $ 4.35 $ 3.27 $ 2.02 $ 0.80 Diluted $ 4.44 $ 4.28 $ 3.22 $ 1.97 $ 0.78 Fiscal year ended April 2, 2016 contains 53 weeks, whereas all other fiscal years presented are based on 52-week periods. Gives effect to the corporate reorganization completed by the Company and certain of its affiliates in July 2011 (the “Reorganization”) and the 3.8-to-1 split of our ordinary shares (the “Share Split”) that occurred on November 30, 2011. See Note 1 to the financial statements— Business and Basis of Presentation.(2)Basic net income per ordinary share is computed by dividing net income available forto ordinary shareholders of MKHL by basic weighted average ordinary shares outstanding. Diluted net income per ordinary share assumes the conversion of preference shares to ordinary shares and is computed by dividing net income attributable to ordinary shareholders of MKHL by diluted weighted average ordinary shares outstanding. Fiscal Years Ended March 30,
2013 March 31,
2012 April 2,
2011 April 3,
2010 March 28,
2009 (data presented in thousands, except for share and store data ) 40.1 % 39.2 % 48.2 % 19.2 % 6.3 % 304 237 166 106 74 $ 824,941 $ 299,057 $ 117,673 $ 51,263 $ 13,739 $ 1,289,565 $ 674,425 $ 399,495 $ 281,852 $ 218,463 $ — $ 22,674 $ 12,765 $ 43,980 $ 39,440 $ — $ — $ 101,650 $ 103,500 $ 103,500 $ 1,047,246 $ 456,237 $ 125,320 $ 49,011 $ 11,475 201,454,408 192,731,390 140,554,377 140,554,377 140,554,377 — — 10,163,920 10,163,920 10,163,920 Fiscal Years Ended April 2,
2016 March 28,
2015 March 29,
2014 March 30,
2013 March 31,
2012 (data presented in millions, except for share and store data) Operating Data: Comparable retail store sales (decline) growth (4.2 )% 10.3 % 26.2 % 40.1 % 39.2 % Retail stores, including concessions, end of period 668 526 405 304 237 Balance Sheet Data: $ 1,234.3 $ 1,663.4 $ 1,438.3 $ 816.5 $ 287.9 $ 2,566.8 $ 2,684.6 $ 2,211.2 $ 1,280.1 $ 668.2 Revolving line of credit $ — $ — $ — $ — $ 22.7 Long-term debt $ 2.3 $ — $ — $ — $ — Shareholders' equity of MKHL $ 1,995.7 $ 2,241.0 $ 1,806.1 $ 1,047.2 $ 456.2 Number of ordinary shares issued 208,084,175 206,486,699 204,291,345 201,454,408 192,731,390 All prior period deferred tax-related amounts have been reclassified in connection with Company's adoption of ASU 2015-14, "Income Taxes (Topic 740): Balance Sheet Classification of Deferred Taxes" on a retrospective basis. rapidly growing global luxury lifestyle brand led by a world-class management team and a renowned, award-winning designer. Since launching his namesake brand over 3035 years ago, Michael Kors has featured distinctive designs, materials and craftsmanship with a jet-set aesthetic that combines stylish elegance and a sporty attitude. Mr. Kors’ vision has taken the Company from its beginnings as an American luxury sportswear house to a global accessories, footwear and apparel company with a presence in over 85100 countries. As a highly recognized luxury lifestyle brand in North America,the Americas, with accelerating awareness in targeted international markets, we have experienced exceptional sales momentum and intend to continue along this course as we grow our business. We have also expanded our distribution capabilities beyond wholesale into retail which account for a major portion of our total revenue.March 30, 2013,April 2, 2016, our retail segment included 231 North American390 retail stores including concessions, and 73in the Americas (including concessions), 278 international retail stores including concessions, in(including concessions) throughout Europe and Japan.Asia and our e-commerce sites in the United States ("U.S.") and Canada. As of March 30, 2013,April 2, 2016, our wholesale segment included wholesale sales through approximately 2,2151,532 department store doors and 929 specialty store doors in North Americathe Americas and wholesale sales through approximately 1,0341,222 specialty store doors and 206 department store and specialty store doors internationally. Our remaining revenue is generated through our licensing segment, through which we license to third parties certain production, sales and/or distribution rights. During Fiscal 2013,2016, our licensing segment accounted for approximately 4.0%3.7% of our total revenue and consisted primarily of royalties earned on licensed products and our geographic licenses.twothree primary collections: theMichael Kors Collection luxury collection andline, theMICHAEL Michael Korsaccessible luxury collection. Theline and the Michael Kors collection Mens line. The Michael KorsCollection establishes the aesthetic authority of our entire brand and is carried inby many of our retail stores, our e-commerce sites, as well as in the finest luxury department stores in the world. In 2004, we introduced theMICHAEL Michael Kors collection,, which has a strong focus on accessories, in addition to offering footwear and apparel, and addresses the significant demand opportunity in accessible luxury goods. More recently, we have begun to grow our men's business in recognition of the significant opportunity afforded by our brand's established fashion authority and the expanding men's market. Taken together, our twoprimary collections target a broad customer base while retaining aour premium luxury image.TrendsUncertaintiesBroaden Distribution Capabilities Beyond Wholesale into Retail. Over the years, we have successfully broadened our distribution capabilities beyond wholesale into retail, and we believe that this trend will continue as our retail store network grows at a faster rate than wholesale. We believe that retail allows greater control over the shopping environment, merchandise selection and many other aspectsResults of the shopping experience that attracts and retains loyal customers and increases sales.Demand for Our Accessories and Related Merchandise. Our performance is affected by trends in the luxury goods industry, as well as shifts in demographics and changes in lifestyle preferences. Currently, demand for our products is predicted to grow. According to theAltagamma Studies, demand forthe worldwide luxury goods industry is predicted to grow from approximately $251.5 billion in 2011 to between $314.4 billion and $327.5 billion in 2015. The accessories product category represented 27% of total sales for the worldwide luxury goods industry in 2010 and was the fastest growing product category between 2005 and 2011, growing at a compound annual rate of 9.9%. We believe that we are well positioned to capitalize on the continued growth of the accessories product category, as it is one of our primary product category focuses.of America("U.S. GAAP") requires management to make estimates and assumptions that affect the reported amounts of assets and liabilities and disclosure of contingent assets and liabilities at the date of the financial statements, as well as the reported amounts of revenue and expenses during the reporting period. Critical accounting policies are those that are the most important to the portrayal of our financial condition and results of operations and that require our most difficult, subjective and complex judgments as a result of the need to make estimates about the effect of matters that are inherently uncertain. While our significant accounting policies are described in more detail in the notes to our financial statements, our most critical accounting policies, discussed below, pertain to revenue recognition, impairment of long-lived assets, goodwill, share-based compensation and income taxes. In applying such policies, we must use some amounts that aremake certain assumptions based uponon our informed judgments, assessments of probability and best estimates. Estimates, by their nature, are based upon judgmentssubjective and available information. The estimates that we make are based uponon analysis of available information, including current and historical factors current circumstances and the experience and judgment of management. We evaluate our assumptions and estimates on an ongoing basis.andas well as by a provision for estimated future customer returns, which is based on management’s review of historical and current customer returns. The amounts reserved for retail sales returns were $3.1$4.7 million, $1.7$2.5 million and $2.3 million at March 30, 2013, March 31, 2012 and April 2, 2011,2016, March 28, 2015 and March 29, 2014, respectively. To arrive at net sales for wholesale, gross sales are reduced by provisions for estimated future returns based on current expectations, as well as trade discounts, markdowns, allowances, operational chargebacks, as well as forand certain cooperative selling expenses. Total sales reserves for wholesale were $43.0$110.9 million, $30.4$87.5 million and $25.2$65.9 million at March 30, 2013, March 31, 2012, and April 2, 2011,2016, March 28, 2015 and March 29, 2014, respectively.trademarks,tradenames at rates specified in the license agreements. These agreements are also subject to contractual minimum levels. Royalty revenue generated by geography-specific licensing agreements is recognized as it is earned under the licensing agreements based on reported sales byof licensees applicable to specified periods, as outlined in the agreements. These agreements allow for the use of our trademarkstradenames to sell our branded products in certainspecific geographic regions.Allare recorded at cost less accumulated amortizationincluding fixed assets and finite-lived intangible assets, for impairment whenever events or depreciation.changes in circumstances indicate that the carrying amount of any such asset may not be recoverable. For the purposes of impairment testing, thewe group our long-lived assets according to their lowest level of use, such as aggregating and capitalizing all construction costs related to a retail store into leasehold improvements and those related to our wholesale business into shop-in-shops. Our leasehold improvements are typically amortized over the life of the store lease, including highly probable renewals, and our shop-in-shops are amortized over a useful life of three year period. We evaluate all long-lived assets, including fixed assets and intangible assets with finite useful lives, foror four years. Our impairment whenever events or changes in circumstances indicate thattesting is based on our best estimate of the carrying amount of any such asset may not be recoverable.future operating cash flows. If the sum of our estimated undiscounted future cash flows associated with the asset is less than the asset’s carrying value, we recognize an impairment loss,charge, which is measured as the amount by which the carrying value exceeds the fair value of the asset. These estimates of cash flow require significant management judgment and certain assumptions about future volume, sales and expense growth rates, devaluation and inflation. As such, these estimates may differ from actual cash flows.flows and future impairments may result if actual cash flows are lower than our expectations. For Fiscal 2013,2016, Fiscal 20122015, and Fiscal 2011,2014, we recorded charges for impairments on fixed assets, and intangible assetsprimarily related to our retail segment, of $0.7, $3.3$10.9 million, $0.8 million and $3.8$1.3 million, respectively.Onexist, we perform an impairment assessment of goodwill.exist. In the absence of any impairment indicators, goodwill is assessed during the fourth quarter of each fiscal year. These assessments are made with regards to reporting units within our wholesale, retail and licensing segments whichwhere our goodwill is recorded, and are based on our current operating projections. Judgments regarding the existence of impairment indicators are based on market conditions and operational performance of the business. Future events could cause us to conclude thatindicators exist and therefore that goodwill is impaired. Prior toFiscal 2012, we performed our impairment testing for goodwillinitially using the fair value approach, employing both the discounted cash flow method and market multiples method to determine the fair value of our reporting units (“step one”). These methods utilized both our historical results and projected future results. During Fiscal 2012, we adopted a new accounting pronouncement related to goodwill impairment analysis, which allows entities to initially perform a qualitative analysisapproach (“step zero”) of the fair value of its reporting units to determine whether it is necessary to undertake a quantitative (“two step”) goodwill analysis. In the fourth quarter of Fiscal 2013, we used this new guidance in our annual impairment analysis for goodwill, and concludedmore likely than not that the fair value of goodwill is greater than its carrying amounts of all reporting units did not exceed their respective fair values.We will continue to perform this initial qualitative analysis in future years. Shouldvalue. If the results of thisthe qualitative assessment result in either ambiguous or unfavorable conclusion we will perform additional quantitative testing consistent withindicate that it is not more likely than not that the fair value approach mentioned above.of goodwill exceeds its carrying value, a quantitative goodwill analysis would be performed to determine if impairment is required. We may also elect to perform a quantitative analysis of goodwill initially rather than using a qualitative approach. The valuation methods used in the quantitative fair value approach,assessment, discounted cash flow and market multiples methods, require our management to make certain assumptions and estimates regarding certain industry trends and future profitability of our reporting units. If the carrying amount of a reporting unit exceeds its fair value, we would compare the implied fair value of the reporting unit goodwill withto its carrying value. To compute the implied fair value, we would assign the fair value of the reporting unit to all of the assets and liabilities of that unit (including any unrecognized intangible assets) as if the reporting unit had been acquired in a business combination. The excess of the fair value of a reporting unit over the amounts assigned to its assets and liabilities is the implied fair value of goodwill. If the carrying value of the reporting unitunit’s goodwill exceeded the implied fair value of the reporting unitunit’s goodwill, we would record an impairment loss to write down such goodwill to its implied fair value. The valuation of goodwill is affected by, among other things, our business plan for the future and estimated results of future operations.We have assessed our Future events could cause us to conclude the impairment indicators exist and, therefore, that goodwill for impairment in ourmay be impaired.forof Fiscal 2016, we elected to bypass the periods presented.initial qualitative assessment and performed our annual impairment analysis using a quantitative approach, using the discounted cash flow method to estimate fair value. Based on the results of this assessment, we concluded that the fair values of all reporting units significantly exceeded the related carrying amounts and there were no reporting units at risk of impairment. There arewere no impairment charges related to goodwill forin any of the fiscal periods presented.These awards are measured at theThe grant date based on the fair value asof share options is calculated using the Black-Scholes option pricing model, which requires us to use subjective assumptions. The closing market price at the grant date is used to determine the grant date fair value of restricted shares, restricted share units, and performance restricted share units. These values are recognized as expense over the requisite service period, net of estimated forfeitures, based on expected attainment of certainpre-established performance goals for performance grants, or the passage of time for those grants which have only time-based vesting requirements, as well as our completion of an initial public offering. Determining the fair value of share-based awards at the grant date requires considerable judgment, including estimating expected volatility, expected term and risk-free rate.a performance based optionperformance-based options is based on the period to expiration, which is generally 9-10 years. This approach was chosen as it directly correlates to our service period. The expected holding period for time-based vesting options is based on thecalculated using a simplified method, usingwhich uses the vesting term of the options, generally 4 years, and the contractual term of 7 years, resulting in a holding periods ranging fromof 4.5-4.75 years. The simplified method was chosen as a means to determine the Company’s estimated holding period, as prior to December 2011, the Company was privately held and, as such, there was nois insufficient historical option exercise experience due to the Company being privately held.experience. The risk-free rate is derived from the zero-coupon U.S. Treasury Strips yield curve the period of which relates tobased on the grant’s estimated holding period. Determining the grant date fair value of share-based awards requires considerable judgment, including estimating expected volatility, expected term, risk-free rate, and forfeitures. If factors change and we employ different assumptions, the fair value of future awards and resulting share-based compensation expense may differ significantly from what we have estimated in the past.Expense related to equity compensation during Fiscal 2013 and 2012 was approximately $20.9 million and $27.0 million, respectively. There was no expense related to equity compensation for periods prior to Fiscal 2012, as all of our equity grants were not exercisable due to an initial public offering (“IPO”) being one of the vesting requirements. The weighted average grant date fair value of share options granted during Fiscal 2013, Fiscal 2012, and Fiscal 2011 was $20.66, $8.01, and $3.08, respectively.the functionalour purchasing subsidiaries’ local currency relative to the local currency requirement of the supplier on the date of the commitment. As such, we enter into forward currency contracts that generally mature in 1812 months or less, and arewhich is consistent with the related purchase commitments. TheseWe designate certain contracts related to the purchase of inventory that qualify for hedge accounting as cash flow hedges, while others remain undesignated. All of our derivative instruments are recorded at fair value in our consolidated balance sheets as either an asset or liability, and are derivative contracts toat fair value on a gross basis, regardless of their hedge cash flow risks. Certaindesignation. The effective portion of these contracts, are designated as hedges for accounting purposes, while the balance of these contracts are undesignated. Accordingly, the changes in the fair value for contracts designated as cash flow hedges is recorded in equity as a component of accumulated other comprehensive income (loss) until the hedged item effects earnings. When the inventory related to forecasted inventory purchases that are being hedged is sold to a third party, the gains or losses deferred in accumulated other comprehensive income (loss) are recognized within cost of goods sold. We use regression analysis to assess effectiveness of derivative instruments that are designated as hedges, which compares the change in the fair value of the derivative instrument to the change in the related hedged item. Effectiveness is assessed on a quarterly basis and any portion of the designated hedge contracts deemed ineffective is recorded to foreign currency gain (loss). If the hedge is no longer expected to be highly effective in the future, future changes in the fair value are recognized in earnings. For those contracts that are not designated as hedges, for accounting purposes,changes in the fair value are at the balance sheet date and upon maturity (settlement), recorded in our cost of sales or operating expenses,foreign currency gain (loss) in our consolidated statements of operations, as applicableoperations.transactions for which the forward exchangerisk that counterparties to derivative contracts were established. Regarding those contracts which are designated as hedges for accounting purposes, any portion of those contracts deemed ineffective would be chargedwill fail to earnings, in the same manner as those contracts chargedmeet their contractual obligations. In order to earnings above, in the period the ineffectiveness was determined.For Fiscal 2013mitigate counterparty credit risk, the Company recorded a gain of $1.4 million relatingonly enters into contracts with carefully selected financial institutions based upon their credit ratings and certain other financial factors, adhering to these contracts, as a component of operations. For fiscal years ended 2012 and 2011, respectively, amounts representing a gain of $2.6 million and a loss of, $2.5 million were charged to operations. The following table details the fair value of these contracts as of March 30, 2013 and March 31, 2012 (in thousands): March 30,
2013 March 31,
2012 $ 1,367 $ 1,318 $ (71 ) $ (276 ) Recentpronouncementpronouncements discussed below, have concluded that there are no new pronouncements that have a material impact on our results of operations, financial condition or cash flows based on current information.February 2013,May 2014, the Financial Accounting Standards Board (“FASB”("FASB") issued Accounting Standard Updated 2013-02 “ReportingStandards Update ("ASU")No. 2014-09, “Revenue from Contracts with Customers,” which provides new guidance for revenues recognized from contracts with customers, and will replace the existing revenue recognition guidance. ASU No. 2014-09 requires that revenue is recognized at an amount the company is entitled to upon transferring control of Amounts Reclassified Outgoods or services to customers, as opposed to when risks and rewards transfer to a customer. In July 2015, the FASB issued ASU No. 2015-14, "Revenue from Contracts with Customers (Topic 606): Deferral of Accumulated Other Comprehensive Income” (“the Effective Date," which deferred the effective date of ASU 2013-02”). ASU 2013-02 requires an entity to provide information about the amounts reclassified out of accumulated other comprehensive incomeNo. 2014-09 by component. The ASU isone year, making it effective for annual periods andthe interim reporting periods within those periodsthe annual reporting period beginning after December 15, 2012. For2017, or beginning with our fiscal year 2019. This standard may be applied retrospectively to all prior periods presented, or retrospectively with a cumulative adjustment to retained earnings in the twelve months endedyear of adoption. We are currently evaluating the adoption method and the impact that ASU 2014-09 will have on our consolidated financial statements and related disclosures.30, 2013,2016and ASU No. 2016-10, "Revenue from Contracts with Customers (Topic 606): Identifying Performance Obligations and Licensing" issued in April 2016. We will consider this guidance in evaluating the impact of ASU 2014-09.reclassified outrecognized in a business combination by eliminating the requirement to retrospectively account for those adjustments and requiring such adjustments to be recognized in the reporting period in which they are determined. ASU 2015-16 requires disclosures of accumulated other comprehensive income were de minimis. Fiscal Years Ended April 2,
2016 March 28,
2015 March 29,
2014Revenue: Net sales: Retail $ 2,394.9 $ 2,134.6 $ 1,593.0 Wholesale 2,143.9 2,065.1 1,577.5 Licensing 173.3 171.8 140.3 Total revenue $ 4,712.1 $ 4,371.5 $ 3,310.8 Income from operations: Retail $ 501.4 $ 557.2 $ 467.3 Wholesale 584.1 610.9 459.8 Licensing 89.6 88.9 81.1 Income from operations $ 1,175.1 $ 1,257.0 $ 1,008.2 fiscal years then ended (in thousands): Fiscal Years Ended March 30,
2013 March 31,
2012 April 2,
2011 $ 1,062,642 $ 626,940 $ 344,195 1,032,115 610,160 413,605 86,975 65,154 45,539 $ 2,181,732 $ 1,302,254 $ 803,339 $ 315,654 $ 121,851 $ 61,194 269,323 85,000 48,241 45,037 40,831 27,431 $ 630,014 $ 247,682 $ 136,866 RetailFromend consumer through our retail stores and concessions throughout the beginning of Fiscal 2007, when we first undertookAmericas, Europe, Japan and South Korea, as well as through our majore-commerce sites, including our e-commerce platform in the U.S. launched in September 2014 and our e-commerce site in Canada launched in April 2015. We have four primary retail growth initiative, through March 30, 2013, we have leveragedstore formats: collection stores, lifestyle stores, outlet stores and e-commerce. Our collection stores are located in highly prestigious shopping areas, while our successfullifestyle stores are located in well-populated commercial shopping locations and leading regional shopping centers. Our outlet stores, which are generally in outlet centers, extend our reach to additional consumer groups. In addition to these four retail store formats, by openingwe operate concessions in a totalselect number of 294 new stores. During this time period, we have grown our North American retail presence significantly, increasing our North American store count by 221department stores as well as increasing our international store count by 73 stores.2013,2016, Fiscal 20122015, and Fiscal 2011: Fiscal Years Ended March 30,
2013 March 31,
2012 April 2,
2011 201 158 113 43 45 50 27.2 % 39.8 % 79.4 % 410,681 316,649 224,427 2,043 2,004 1,986 103 79 53 24 26 10 30.4 % 49.1 % 23.3 % 291,407 219,407 146,286 2,829 2,777 2,760 April 2,
2016 March 28,
2015 March 29,
2014Full price retail stores including concessions: Number of stores 492 373 279 Increase during period 119 94 78 Percentage increase vs. prior year 31.9 % 33.7 % 38.8 % Total gross square footage 1,140,025 859,352 562,773 Average square footage per store 2,317 2,304 2,017 Outlet stores: Number of stores 176 153 126 Increase during period 23 27 23 Percentage increase vs. prior year 15.0 % 21.4 % 22.3 % Total gross square footage 637,325 517,308 381,567 Average square footage per store 3,621 3,381 3,028 April 2,
2016 March 28,
2015 March 29,
2014Store count by region: The Americas (U.S., Canada and Latin America) 390 343 288 Europe 177 133 80 Asia (Japan and South Korea) 101 50 37 Total 668 526 405 North Americathe Americas and Europe to accommodate consumers who prefer to shop at major department stores. In addition, we sell to specialty stores for those consumers who enjoy the boutique experience afforded by such stores.stores, as well as to travel retail shops in the Americas, Europe and Asia. We also have wholesale arrangements pursuant to which we sell products to certain of our licensees, including our licensees in Asia (which were previously reported within our Americas wholesale operations). We continue to focus our sales efforts and drive sales in existing locations by enhancing presentation, primarily through the creation of more shop-in-shops with our proprietary fixtures that effectively communicate our brand and create a more personalized shopping experience for consumers. We tailor our assortments through wholesale product planning and allocation processes to better match the demands of our department store customers in each local market.growthincrease (decrease) in our network of wholesale doors during Fiscal 2013,2016, Fiscal 20122015 and Fiscal 2011: Fiscal Years Ended March 30,
2013 March 31,
2012 April 2,
2011 3,249 2,677 2,032 572 645 432 21.4 % 31.7 % 27.0 % Fiscal Years Ended April 2,
2016 March 28,
2015 March 29,
2014Number of full-price wholesale doors 3,889 4,038 3,728 (Decrease) increase during period (149 ) 310 479 Percentage (decrease) increase vs. prior year (3.7 )% 8.3 % 14.7 % thousands)millions): Fiscal Years Ended March 30,
2013 March 31,
2012 April 2,
2011 $ 2,181,732 $ 1,302,254 $ 803,339 59.9 % 57.8 % 55.5 % $ 630,014 $ 247,682 $ 136,866 $ 938,515 $ 573,394 $ 331,714 $ 101,754 $ 43,316 $ 11,463 $ 22,373 $ 10,230 $ 1,018 39.6 % 39.8 % 48.7 % 51.3 % 21.8 % 13.7 % 14.7 % 35.1 % n/a $ 913,145 $ 544,686 $ 386,566 $ 118,970 $ 65,474 $ 27,039 *Where n/a is used, stores in that region were not open for the requisite comparable period. Fiscal years ended April 2,
2016 March 28,
2015 March 29,
2014Total revenue $ 4,712.1 $ 4,371.5 $ 3,310.8 Gross profit as a percent of total revenue 59.4 % 60.6 % 60.9 % Income from operations $ 1,175.1 $ 1,257.0 $ 1,008.2 Retail net sales - The Americas $ 1,779.0 $ 1,656.1 $ 1,318.9 Retail net sales - Europe $ 509.6 $ 412.1 $ 235.6 Retail net sales - Asia $ 106.3 $ 66.4 $ 38.5 (Decrease) increase in comparable store net sales (4.2 )% 10.3 % 26.2 % Wholesale net sales - The Americas $ 1,628.6 $ 1,662.5 $ 1,335.5 Wholesale net sales - Europe $ 406.4 $ 401.1 $ 242.0 Wholesale net sales - Asia $ 108.9 $ 1.5 $ — openedoperating for one full year after the end of the first month of its operations. For stores that are closed, sales that were made in the final month of their operations (assuming closure prior to the fiscal month's end), are excluded from the calculation of comparable store sales. Additionally, sales for stores that are either relocated, or expanded by a square footage of 25% or greater, in any given fiscal year, are also excluded from the calculation of comparable store sales at the time of their move or interruption, until such stores have been in their new location, or are operating under their new size/capacity, for at least one full year after the end of the first month of their relocation or expansion. All comparable store sales are presented on a 52-week basis. Beginning with the first quarter of Fiscal 2016, comparable store sales are reported on a global basis, which better represents management’s view of our Company as an expanding global business.toby our licensees as well as contractual royalty rates for the use of our trademarks in certain geographic territories.both fixed and intangible assets to fair value. and, as well as amortization of deferred financing costs, offset by interest earned on highly liquid investments (investments purchased with an original maturity of three months or less, classified as cash equivalents), the amounts of which are not material for all periods presented..gainrepresentslosses includes net gains or losses related to the mark-to-market (fair value) on our forward currency contracts not designated as accounting hedges and unrealized income or loss from the re-measurement of monetary assets and liabilities denominated in currencies other than the functional currencies of our subsidiaries.20132016 with Fiscal 201220132016 and Fiscal 20122015 and expresses the relationship of certain line items to total revenue as a percentage (dollars in thousands)millions): Fiscal Years Ended % of Total % of Total March 30,
2013 March 31,
2012 $ Change % Change Revenue for
Fiscal 2013 Revenue for
Fiscal 2012 $ 2,094,757 $ 1,237,100 $ 857,657 69.3 % 86,975 65,154 21,821 33.5 % 2,181,732 1,302,254 879,478 67.5 % 875,166 549,158 326,008 59.4 % 40.1 % 42.2 % 1,306,566 753,096 553,470 73.5 % 59.9 % 57.8 % 621,536 464,568 156,968 33.8 % 28.5 % 35.7 % 54,291 37,554 16,737 44.6 % 2.5 % 2.9 % 725 3,292 (2,567 ) –78.0 % 0.0 % 0.3 % 676,552 505,414 171,138 33.9 % 31.0 % 38.8 % 630,014 247,682 382,332 154.4 % 28.9 % 19.0 % 1,524 1,495 29 1.9 % 0.1 % 0.1 % 1,363 (2,629 ) 3,992 –151.8 % 0.1 % –0.2 % 627,127 248,816 378,311 152.0 % 28.7 % 19.1 % 229,525 101,452 128,073 126.2 % 10.5 % 7.8 % $ 397,602 $ 147,364 $ 250,238 169.8 % Fiscal Years Ended $ Change % Change April 2,
2016 March 28,
2015 Statements of Operations Data: Net sales $ 4,538.8 $ 4,199.7 $ 339.1 8.1 % Licensing revenue 173.3 171.8 1.5 0.9 % Total revenue 4,712.1 4,371.5 340.6 7.8 % Cost of goods sold 1,914.9 1,723.8 191.1 11.1 % 40.6 % 39.4 % Gross profit 2,797.2 2,647.7 149.5 5.6 % 59.4 % 60.6 % Selling, general and administrative expenses 1,428.0 1,251.5 176.5 14.1 % 30.3 % 28.6 % Depreciation and amortization 183.2 138.4 44.8 32.4 % 3.9 % 3.2 % Impairment of long-lived assets 10.9 0.8 10.1 NM 0.2 % — % Total operating expenses 1,622.1 1,390.7 231.4 16.6 % 34.4 % 31.8 % Income from operations 1,175.1 1,257.0 (81.9 ) (6.5 )% 24.9 % 28.8 % Other income (3.7 ) (1.6 ) (2.1 ) 131.3 % (0.1 )% (0.1 )% Interest expense, net 1.7 0.2 1.5 750.0 % — % — % Foreign currency loss 4.8 2.6 2.2 84.6 % 0.1 % 0.1 % Income before provision for income taxes 1,172.3 1,255.8 (83.5 ) (6.6 )% 24.9 % 28.7 % Provision for income taxes 334.6 374.8 (40.2 ) (10.7 )% 7.1 % 8.6 % Net income 837.7 881.0 (43.3 ) (4.9 )% Less: Net loss attributable to noncontrolling interest (1.4 ) — (1.4 ) NM Net income attributable to MKHL $ 839.1 $ 881.0 $ (41.9 ) (4.8 )% NM Not meaningful. $879.5$340.6 million, or 67.5%7.8%, to $2,181.7 million$4.712 billion for the fiscal year ended April 2, 2016, compared to $4.372 billion for the fiscal year ended March 30, 2013,28, 2015, which included unfavorable foreign currency effects of $168.7 million primarily related to the weakening of the Euro, the Canadian Dollar, and the Japanese Yen against the U.S. Dollar in Fiscal 2016, as compared to $1,302.3Fiscal 2015. On a constant currency basis, our total revenue increased by $509.3 million, foror 11.7%. Fiscal 2016 also included approximately $33.7 million of incremental net retail sales attributable to the fiscal year ended March 31, 2012.inclusion of the 53rd week, as well as $28.9 million of incremental revenue recorded as a result of consolidating MK Panama and acquiring MK Korea during Fiscal 2016. The increase in our revenues was the result ofprimarily due to an increase in our comparable and non-comparable retail store sales and wholesale sales, as well as increases in our licensing revenue.thousands)millions): Fiscal Years Ended % of total
Revenue March 30,
2013 March 31,
2012 $ Change % Change for Fiscal
2013 for Fiscal
2012 $ 1,062,642 $ 626,940 $ 435,702 69.5 % 48.7 % 48.1 % 1,032,115 610,160 421,955 69.2 % 47.3 % 46.9 % 86,975 65,154 21,821 33.5 % 4.0 % 5.0 % $ 2,181,732 $ 1,302,254 $ 879,478 67.5 % Fiscal Years Ended % Change April 2,
2016 March 28,
2015 $ Change As Reported Revenue: Net sales: Retail $ 2,394.9 $ 2,134.6 $ 260.3 12.2 % 17.2 % 50.8 % 48.8 % Wholesale 2,143.9 2,065.1 78.8 3.8 % 6.8 % 45.5 % 47.3 % Licensing 173.3 171.8 1.5 0.9 % 0.9 % 3.7 % 3.9 % Total revenue $ 4,712.1 $ 4,371.5 $ 340.6 7.8 % 11.7 % $435.7$260.3 million, or 69.5%12.2%, to $1,062.6 million$2.395 billion for Fiscal 2013,2016, compared to $626.9 million$2.135 billion for Fiscal 2012.2015, which included unfavorable foreign currency effects of $107.2 million. On a constant currency basis, net sales from our retail stores increased $367.5 million, or 17.2%. We operated 304668 retail stores, including concessions, as of April 2, 2016, compared to 526 retail stores, including concessions, as of March 30, 2013, compared to 237 retail stores, including concessions, as28, 2015.March 31, 2012. During$61.3 million. Our comparable store sales benefited 194 basis points from the inclusion of the U.S. e-commerce sales in comparable store sales beginning with the third quarter of Fiscal 2013,2016. On a constant currency basis, our comparable store sales growth increased $246.6declined $15.8 million, or 40.1%0.9%, primarily driven by lower comparable store sales from Fiscal 2012.our retail business in the Americas, partially offset by increased comparable store sales from our international businesses. The growthdecline in our comparable store sales was primarily due to an increase inreflected lower sales of ourwatches, apparel and jewelry, partially offset by increased sales of accessories line and watches during Fiscal 2013. In addition,2016 compared to Fiscal 2015.were $189.1 million during Fiscal 2013, whichincreased $383.3 million. Approximately 86% of this sales growth was primarily the result of opening 67 newattributable to operating 142 additional stores since March 31, 2012.$422.0$78.8 million, or 69.2%3.8%, to $1,032.1 million$2.144 billion for Fiscal 2013,2016, compared to $610.2 million$2.065 billion for Fiscal 2012.2015, which included unfavorable foreign currency effects of $61.5 million. On a constant currency basis, our wholesale net sales increased $140.3 million, or 6.8%. The increase in our wholesale net sales occurredwas primarily as a result ofattributable to increased sales of our accessories line during Fiscal 2013, as we continue to enhance our presence in department and specialty stores by converting more doors to shop-in-shops, and in continuing our expansion of our European operations. Net wholesale sales from our European operations increased approximately 81.7%accessories and footwear product lines during Fiscal 20132016 as compared to Fiscal 2012, due largely to an increase in full-price doors to 1,034 from 650 in the same period last year.$21.8$1.5 million, or 33.5%0.9%, to $87.0$173.3 million for Fiscal 2013,2016, compared to $65.2$171.8 million for Fiscal 2012.2015. The increase in royalties was primarily dueattributable to royaltieshigher revenues earned on licensing agreements related to the sales of jewelry, eyewear and outerwear, as well as higher revenues from our geographic licensing arrangements in Asia, partially offset by lower licensing revenues related to the sale of watches.$553.5$149.5 million, or 73.5%5.6%, to $1,306.6 million$2.797 billion during Fiscal 2013,2016, compared to $753.1 million$2.648 billion for Fiscal 2012.2015, which included unfavorable foreign currency effects of $113.5 million. Gross profit as a percentage of total revenue increaseddeclined 120 basis points to 59.9%59.4% during Fiscal 2013,2016, compared to 57.8%60.6% during Fiscal 2012. This increase2015. The decline in gross profit margin was attributable to gross profit margin declines of 230 basis points from our retail segment and 80 basis points from our wholesale segment. The decrease in the aggregategross profit margin from our retail segment was primarily due to a decreasean increase in sales allowances and markdowns, as well as experiencing a more favorable product mix,promotional activity during Fiscal 20132016, as compared to Fiscal 2012. This contributed2015. The decrease in gross profit margin from our wholesale segment was primarily due to an increase in gross profit margin in our retail and wholesale segments individually by approximately 220 basis points and 300 basis points, respectively. The increase in gross profit margin in our retail segment was due primarily to sales of higher margin product as well as a decrease in markdowns givenallowances during Fiscal 20132016, as compared to Fiscal 2012. The increase2015. These declines were partially offset by a favorable geographic mix in gross profit marginFiscal 2016, which was driven by a higher proportion of sales outside the U.S. than in our wholesale segment resulted largely from a decrease in discounts and allowances given during Fiscal 2013 as compared to Fiscal 2012.$171.1$231.4 million, or 33.9%16.6%, to $676.6 million$1.622 billion during Fiscal 2013,2016, compared to $505.4 million$1.391 billion for Fiscal 2012.2015. Our operating expenses included a net favorable foreign currency impact of approximately $71.5 million. Total operating expenses decreased to 31.0% as a percentage of total revenue forincreased to 34.4% in Fiscal 2013,2016, compared to 38.8% for31.8% in Fiscal 2012.2015. The components that comprise total operating expenses are explained below:$157.0$176.5 million, or 33.8%14.1%, to $621.5 million$1.428 billion during Fiscal 2013,2016, compared to $464.6 million$1.252 billion for Fiscal 2012. The dollar increase was primarily due to increases in our retail occupancy and salary costs of $101.8 million, increases in promotional costs (which consist of advertising, marketing and various promotional costs) of $20.0 million and increases in corporate employee-related costs of $25.5 million.2015. The increase in our retail occupancyselling, general and payroll costsadministrative expenses was primarily due to the opening of an additional 67following:duringfrom 526 in the prior year and operating our e-commerce sites in the United States for the full year in Fiscal 2013. Advertising costs increased primarily dueto our expansion into new markets during Fiscal 2013, including domestic and international. The2016; our corporate employee-related costs, wasprimarily due primarily to an increase in our corporate staff to accommodatesupport our North Americanglobal growth; international growth. decreasedincreased to 28.5%30.3% during Fiscal 2013,2016, compared to 35.7%28.6% for Fiscal 2012.2015. The decreaseincrease as a percentage of total revenue was primarily due to achieving economies of scalethe increase in our retail store costs during Fiscal 2013,2016, as compared to Fiscal 2012, as our revenue increased at a greater rate relative to our fixed costs.$16.7$44.8 million, or 44.6%32.4%, to $54.3$183.2 million during Fiscal 2013,2016, compared to $37.6$138.4 million for Fiscal 2012. Dollar increases in depreciation and amortization were2015, primarily due to an increase in the build-out of 67our new retail locations during this fiscal year,stores, new shop-in-shop locations, increase in lease rights related to our new European stores, and investments made in our information systems infrastructure to accommodate our growth. Depreciation and amortization decreasedincreased to 2.5%3.9% as a percentage of total revenue during Fiscal 2013,2016, compared to 2.9%3.2% for Fiscal 2012.onof Long-Lived AssetsWeanfixed asset impairment chargecharges of approximately $0.7$10.9 million, on fixed assets$8.6 million of which primarily related to one of ourseven retail locations duringthat are still in operation, $0.4 million related to our wholesale operations and $1.9 million related to a corporate fixed asset that is no longer in service. During Fiscal 2013. We recognized an2015, fixed asset impairment chargecharges of approximately $3.3$0.8 million on fixed assets related to two of our retail locations during Fiscal 2012.increased $382.3decreased $81.9 million, or 154.4%6.5%, to $630.0 million$1.175 billion during Fiscal 2013,2016, compared to $247.7 million$1.257 billion for Fiscal 2012.2015, which included unfavorable foreign currency effects of $42.0 million. Income from operations as a percentage of total revenue increaseddeclined to 28.9% during24.9% in Fiscal 2013,2016, compared to 19.0% for28.8% in Fiscal 2012.thousands)millions): Fiscal Years % of Net
Sales/ % of Net
Sales/ March 30,
2013 March 31,
2012 $ Change % Change Revenue for
Fiscal 2013 Revenue for
Fiscal 2012 $ 315,654 $ 121,851 $ 193,803 159.0 % 29.7 % 19.4 % 269,323 85,000 184,323 216.9 % 26.1 % 13.9 % 45,037 40,831 4,206 10.3 % 51.8 % 62.7 % $ 630,014 $ 247,682 $ 382,332 154.4 % 28.9 % 19.0 % Fiscal Years Ended $ Change % Change % of Net
Sales/
Revenue for
Fiscal 2015 April 2,
2016 March 28,
2015 Income from operations: Retail $ 501.4 $ 557.2 $ (55.8 ) (10.0 )% 20.9 % 26.1 % Wholesale 584.1 610.9 (26.8 ) (4.4 )% 27.2 % 29.6 % Licensing 89.6 88.9 0.7 0.8 % 51.7 % 51.8 % Income from operations $ 1,175.1 $ 1,257.0 $ (81.9 ) (6.5 )% 24.9 % 28.8 % increased $193.8declined $55.8 million, or 159.0%10.0%, to $315.7$501.4 million during Fiscal 2013,2016, compared to $121.9$557.2 million for Fiscal 2012.2015. Income from operations as a percentage of net retail sales for the retail segment increaseddeclined by approximately 10.3%520 basis points to 20.9% during Fiscal 2016. The decrease in retail income from operations as a percentage of net retail sales to 29.7% during Fiscal 2013. The increase as a percentage of net sales was primarily due to an approximately 7.0% decreaseincrease in operating expenses as a percentage of net retail sales of approximately 290 basis points, as well as due to the increasedecrease in gross profit margin, as a percentage of net retail sales,previously discussed above.above, during Fiscal 2016, as compared to Fiscal 2015. The decreaseincrease in operating expenses as a percentage of net retail sales resulted from the increase inwas largely due to increased retail store-related costs and higher depreciation expense primarily attributable to new store openings, as well as fixed asset impairment charges recorded for certain of our net retail sales during Fiscal 2013, which grew at a greater rate relative to expenses and more than offset the additional expenses incurred during the period such as those discussed above in selling, general and administrative expenses.increased $184.3declined $26.8 million, or 216.9%4.4%, to $269.3$584.1 million during Fiscal 2013,2016, compared to $85.0$610.9 million for Fiscal 2012.2015. Income from operations as a percentage of net wholesale sales for the wholesale segment increaseddecreased approximately 12.2% as a percentage of net wholesale sales240 basis points to 26.1%27.2%. This increase was primarily due to an approximately 9.0% decrease in operating expenseswholesale income from operations as a percentage of wholesale net sales as well aswas due to result of the aforementioneda net increase in gross profit margin as a percentage of net wholesale sales during Fiscal 2013 compared to Fiscal 2012. The decrease in operating expenses as a percentage of net wholesale sales resulted from theof approximately 160 basis points during Fiscal 2016 as compared to Fiscal 2015, which was largely attributable to higher depreciation expenses, distribution costs, write-offs related to fixed assets and corporate allocated expenses. The increase in ourwholesale income from operations as a percentage of net wholesale sales during Fiscal 2013, which grew atwas also attributable to a greater rate relative to expenses and more than offset the additional expenses incurred during the period suchlower gross profit margin, as those discussed above in selling, general and administrative expenses.$4.2$0.7 million, or 10.3%0.8%, to $45.0$89.6 million during Fiscal 2013,2016, compared to $40.8$88.9 million for Fiscal 2012.2015. Income from operations as a percentage of licensing revenue for thedeclined approximately 10 basis points to 51.7%. The decline in licensing segment decreased approximately 10.9%income from operations as a percentage of licensing revenue was due to 51.8%. This decrease is primarily the result of an increase in advertising expenseoperating expenses as a percentage of licensing revenues during Fiscal 20132016, as compared to Fiscal 2012,2015. This increase was largely due to increased costs related to protection of our intellectual property and higher depreciation expenses, partially offset by lower advertising costs as we launched several new advertising initiatives, including social mediaa percentage of licensing revenue.other web-based mediums for increasing brand awareness,$1.0 million in income related to our anti-counterfeiting efforts, partially offset by $1.0 million of losses related to our joint venture, which were recorded under the equity method of accounting prior to obtaining controlling interest in MK Panama during the year. The increasesecond quarter of Fiscal 2016. During Fiscal 2015, other income of $1.6 million was primarily comprised of $1.5 million in advertising expenses was offset in part by the aforementioned increase in sales licensing revenue.Interest Expense, netwas approximatelynetboth Fiscal 2013 and2016, as compared to $0.2 million for Fiscal 2012,2015, primarily due to lower interest income earned on our short-term investments (cash equivalents), as average daily balance were not significantly differently year over year. (Gain)losslosses of $1.4$4.8 million and $2.6 million, respectively, during Fiscal 2013, as compared to a2016 and Fiscal 2015. These foreign currency gain of $2.6 million during Fiscal 2012. Thelosses included mark-to-market adjustments related to our forward foreign currency loss during Fiscal 2013, relative tocontracts not designated as accounting hedges, as well as gains and losses on the foreignrevaluation and settlement of certain of our accounts payable in currencies other than the functional currency gain during Fiscal 2012, was primarily due to the strengthening of the U.S. dollar relative toapplicable reporting units, and the Japanese Yen, which impacted the re-measurementremeasurement of Yen-denominated intercompany loans with certain of our subsidiaries. Conversely, during Fiscal 2012 there were larger U.S. dollar denominated intercompany loan balances with certain of our non-U.S. subsidiaries (whose functional currency was the Euro), which were impacted by the U.S. dollar’s strengthening against the Euro during that period.$229.5$334.6 million of income tax expense during Fiscal 2013,2016, compared with $101.5$374.8 million for Fiscal 2012.2015. Our effective tax rate for Fiscal 20132016 was 36.6%28.5%, compared to 40.8%29.8% for Fiscal 2012.2015. The decrease in our effective tax rate resultedwas primarily due to a decreasethe increase in our U.S. blended statetaxable income tax rate, as well as a greater portionin certain of our income being recognized in jurisdictions withnon-U.S. subsidiaries (predominantly European operations) during Fiscal 2016, which are subject to lower statutory income tax rates, as well as state tax benefits recognized during Fiscal 2013 as compared2016. Given that certain of our non-U.S. operations have become consistently profitable, we expect this decrease on our combined consolidated effective rate to continue. The Fiscal 2012.jurisdictions, and certain other nondeductible expenses (such as fees related to a public offering) and income earned in certain non-U.S. entities with significant net operating loss carryforwards.jurisdictions. In addition, factors such as the geographic mix of earnings, enacted tax legislation and the results of various global tax strategies, may also impact our effective tax rate in future periods.increased $250.2declined $41.9 million, or 169.8%4.8%, to $397.6$839.1 million during Fiscal 2013,2016, compared to $147.4$881.0 million for Fiscal 2012.20122015 with Fiscal 201120122015 and Fiscal 20112014 and expresses the relationship of certain line items to total revenue as a percentage (dollars in thousands)millions and all percentages calculated based on unrounded numbers): Fiscal Years Ended % of Total % of Total March 31, April 2, Revenue for Revenue for 2012 2011 $ Change % Change Fiscal 2012 Fiscal 2011 $ 1,237,100 $ 757,800 $ 479,300 63.2 % 65,154 45,539 19,615 43.1 % 1,302,254 803,339 498,915 62.1 % 549,158 357,274 191,884 53.7 % 42.2 % 44.5 % 753,096 446,065 307,031 68.8 % 57.8 % 55.5 % 464,568 279,822 184,746 66.0 % 35.7 % 34.8 % 37,554 25,543 12,011 47.0 % 2.9 % 3.2 % 3,292 3,834 (542 ) 0.3 % 0.5 % 505,414 309,199 196,215 63.5 % 38.8 % 38.5 % 247,682 136,866 110,816 81.0 % 19.0 % 17.0 % 1,495 1,861 (366 ) –19.7 % 0.1 % 0.2 % (2,629 ) 1,786 (4,415 ) –247.2 % –0.2 % 0.2 % 248,816 133,219 115,597 86.8 % 19.1 % 16.6 % 101,452 60,713 40,739 67.1 % 7.8 % 7.6 % $ 147,364 $ 72,506 $ 74,858 103.2 % Fiscal Years Ended $ Change % Change March 28,
2015 March 29,
2014 Statements of Operations Data: Net sales $ 4,199.7 $ 3,170.5 $ 1,029.2 32.5 % Licensing revenue 171.8 140.3 31.5 22.4 % Total revenue 4,371.5 3,310.8 1,060.7 32.0 % Cost of goods sold 1,723.8 1,294.7 429.1 33.1 % 39.4 % 39.1 % Gross profit 2,647.7 2,016.1 631.6 31.3 % 60.6 % 60.9 % Selling, general and administrative expenses 1,251.5 926.9 324.6 35.0 % 28.6 % 28.0 % Depreciation and amortization 138.4 79.7 58.7 73.8 % 3.2 % 2.4 % Impairment of long-lived assets 0.8 1.3 (0.5 ) (38.3 )% — % — % Total operating expenses 1,390.7 1,007.9 382.8 38.0 % 31.8 % 30.4 % Income from operations 1,257.0 1,008.2 248.8 24.7 % 28.8 % 30.5 % Other income (1.6 ) — (1.6 ) NM (0.1 )% — % Interest expense, net 0.2 0.4 (0.2 ) (45.3 )% — % — % Foreign currency loss 2.6 0.1 2.5 NM 0.1 % — % Income before provision for income taxes 1,255.8 1,007.7 248.1 24.6 % 28.7 % 30.4 % Provision for income taxes 374.8 346.2 28.6 8.3 % 8.6 % 10.5 % Net income attributable to MKHL $ 881.0 $ 661.5 $ 219.5 33.2 % NM Not meaningful. $498.9 million,$1.061 billion, or 62.1%32.0%, to $1,302.3 million$4.372 billion for the fiscal year ended March 31, 2012,28, 2015, compared to $803.3 million$3.311 billion for the fiscal year ended April 2, 2011.March 29, 2014, which included unfavorable foreign currency effects of $76.5 million primarily related to the weakening of the Euro and the Canadian Dollar against the U.S. Dollar in Fiscal 2015 as compared to Fiscal 2014. On a constant currency basis, our total revenue increased by $1.137 billion, or 34.3%. The increase in our revenues was the result ofdue to an increase in our comparable and non-comparable retail store sales and wholesale sales, as well as increases in our licensing revenue.thousands)millions): Fiscal Years Ended % of total % of total March 31, April 2, Revenue for Revenue for 2012 2011 $ Change % Change Fiscal 2012 Fiscal 2011 $ 626,940 $ 344,195 $ 282,745 82.1 % 48.1 % 42.8 % 610,160 413,605 196,555 47.5 % 46.9 % 51.5 % 65,154 45,539 19,615 43.1 % 5.0 % 5.7 % $ 1,302,254 $ 803,339 $ 498,915 62.1 % Fiscal Years Ended % Change March 28,
2015 March 29,
2014 $ Change As Reported Revenue: Net sales: Retail $ 2,134.6 $ 1,593.0 $ 541.6 34.0 % 36.7 % 48.8 % 48.1 % Wholesale 2,065.1 1,577.5 487.6 30.9 % 33.0 % 47.3 % 47.7 % Licensing 171.8 140.3 31.5 22.4 % 22.4 % 3.9 % 4.2 % Total revenue $ 4,371.5 $ 3,310.8 $ 1,060.7 32.0 % 34.3 % $282.7$541.6 million, or 82.1%34.0%, to $626.9 million$2.135 billion for Fiscal 2012,2015, compared to $344.2 million$1.593 billion for Fiscal 2011.2014, which included unfavorable foreign currency effects of $43.0 million. On a constant currency basis, net sales from our retail stores increased $584.6 million, or 36.7%. We operated 237526 retail stores, including concessions, as of March 31, 2012,28, 2015, compared to 166405 retail stores, including concessions, as of April 2, 2011. DuringMarch 29, 2014.2012,2015, which included unfavorable foreign currency effects of $22.5 million. On a constant currency basis, our comparable store sales growth increased $132.7$166.4 million, or 39.2%, from Fiscal 2011.11.9%. The growth in our comparable store sales was primarily due to an increase in sales offrom our accessories product line and watches during Fiscal 2012. In addition,2015.were $150.1 million during Fiscal 2012, whichincreased $418.2 million. This sales growth was primarily the result of opening 71 newattributable to operating 121 additional stores since April 2, 2011.$196.6$487.6 million, or 47.5%30.9%, to $610.2 million$2.065 billion for Fiscal 2012,2015, compared to $413.6 million$1.578 billion for Fiscal 2011.2014, which included unfavorable foreign currency effects of $33.5 million. On a constant currency basis, our wholesale net sales increased $521.1 million, or 33.0%. The increase in our wholesale net sales occurredwas primarily as a result ofattributable to increased sales offrom our accessories lineand footwear product lines during Fiscal 2012,2015, as well as our continued efforts to work with our wholesale partnerswe continue to enhance our presence in their department and specialty stores by converting more doors to shop-in-shops, and working with existing retailers in optimizingshop-in-shops. In addition, wholesale net sales increased due to the continuing expansion of our presence in their stores.$19.6$31.5 million, or 43.1%22.4%, to $65.2$171.8 million for Fiscal 2012,2015, compared to $45.5$140.3 million for Fiscal 2011.2014. The increase in royaltieslicensing revenue was primarily due to royalties earned on licensing agreements related to the sales of watches.$307.0$631.6 million, or 68.8%31.3%, to $753.1 million$2.648 billion during Fiscal 2012,2015, compared to $446.1 million$2.016 billion for Fiscal 2011.2014, which included unfavorable foreign currency effects of $51.2 million. Gross profit as a percentage of total revenue increaseddeclined to 57.8%60.6% during Fiscal 2012,2015, compared to 55.5%60.9% during Fiscal 2011. This increase2014. The decline in gross profit margin resulted from a decrease of 66 basis points in the aggregategross profit margin from our retail segment, which represents nearly half of our business. The decrease in gross profit margin from our retail segment was primarily due to the growth in our retail net sales relative to our overall total revenue growth during the period, as our retail net sales generate higher gross profit margins relative to those of wholesale. In addition, gross profit margin increased in our retail and wholesale segments individually by approximately 89 basis points and 184 basis points, respectively. Thean increase in gross profit margin in our retail segment was due primarily tomarkdowns and discounts, partially offset by a decrease in markdownsmore favorable product mix experienced during Fiscal 20122015 as compared to Fiscal 2011. The2014. Wholesale gross margin remained flat, as the favorable impact resulting from the increase in gross profit margin in our wholesale segment resulted largely from an increase in gross profit margin contribution fromon our European wholesale sales which benefited from both the revaluation of foreign currency exchange contracts duringin proportion to total wholesale sales was offset by higher allowances in Fiscal 2012, and from sales of higher margin product during Fiscal 20122015, as compared to Fiscal 2011.$196.2$382.8 million, or 63.5%38.0%, to $505.4 million$1.391 billion during Fiscal 2012,2015, compared to $309.2 million$1.008 billion for Fiscal 2011.2014. Our operating expenses included a net favorable foreign currency impact of approximately $30.3 million. Total operating expenses increased to 38.8% as a percentage of total revenue forincreased to 31.8% in Fiscal 2012,2015, as compared to 38.5% for30.4% in Fiscal 2011.2014. The components that comprise totalchanges in our operating expenses are explainedfurther described below:$184.7$324.6 million, or 66.0%35.0%, to $464.6 million$1.252 billion during Fiscal 2012,2015, compared to $279.8$926.9 million for Fiscal 2011.2014. The dollar increase in selling, general and administrative expenses was primarily due to increasesthe following:ourretail-related costs, including salary and occupancy cost, of $180.1 million, primarily attributable to operating 526 retail occupancy and salary costs of $91.6 million, increasesstores versus 405 retail stores in professional fees of approximately $8.7 million, which include fees related to our private and public offerings, increases in advertising and promotional costs of $9.2 million and increasesthe prior period;$60.6 million. The$70.1 million, primarily due to an increase in our retail occupancycorporate staff to support our North American and payrollinternational growth;was primarily due to the opening(which consist of an additional 71 retail stores during Fiscal 2012. Advertising costs increasedadvertising, marketing and various promotional costs) of $25.9 million, primarily due to our continuing expansion into new markets, during Fiscal 2012, including domestic and international. The increase in our corporate employee-related costs was due primarily to the equity based compensation charge of approximately $27.0 million, as well as a $10.7social media during Fiscal 2015;chargeprimarily comprised of legal and consulting fees incurred in connection with the relocation of our principal executive offices, as well as fees related to our new customer service call center in Fiscal 2015;redemptionaforementioned delays at the U.S. west coast ports; andemployee share options during our private placement in the second fiscal quarter of Fiscal 2012. The equity based compensation charge represented approximately $10.6 million of expenses which would have been recognized in prior fiscal years had an IPO occurred prior to Fiscal 2012. $3.6 million.35.7%28.6% during Fiscal 2012,2015, compared to 34.8%28.0% for Fiscal 2011. The increase2014, primarily due to the aforementioned retail store and overhead costs, as well as corporate operating expenses during Fiscal 2015, as compared to Fiscal 2014. These increases were partially offset by our operating leverage achieved on other operating expenses, including selling and distribution costs as a percentage of total revenue was primarily due to equity compensation expense recognized during Fiscal 2012.$12.0$58.7 million, or 47.0%73.8%, to $37.6$138.4 million during Fiscal 2012,2015, compared to $25.5$79.7 million for Fiscal 2011. Dollar increases in depreciation and amortization were2014, primarily due to an increase in the build-out of 71our new retail locations during this fiscal year as compared to 60 locations for the prior fiscal year,stores, new shop-in-shop locations, increase in lease rights related to our new European stores, and investments made in our information systems infrastructure to accommodate our growth. Depreciation and amortization decreasedincreased to 2.9%3.2% as a percentage of total revenue during Fiscal 2012,2015, compared to 3.2%2.4% for Fiscal 2011.onof Long-Lived AssetsWean impairment chargecharges of approximately $3.3$0.8 million and $1.3 million, respectively, on fixed assets related to two of our retail locations duringin Fiscal 2012. For Fiscal 2011 impairment charges of $3.8 million were comprised of an impairment charge on fixed assets of $2.1 million related to two of our2015 and three retail locations and an impairment charge on definite-lived intangible assets for lease rights of $1.8 million related to one of those locations.$110.8$248.8 million, or 81.0%24.7%, to $247.7 million$1.257 billion during Fiscal 2012,2015, compared to $136.9 million$1.008 billion for Fiscal 2011.2014, which included unfavorable foreign currency effects of $20.9 million. Income from operations as a percentage of total revenue increaseddeclined to 19.0%28.8% during Fiscal 2012,2015, compared to 17.0%30.5% for Fiscal 2011.thousands)millions): % of Net % of Net Fiscal Years Ended Sales/ Sales/ March 31, April 2, Revenue for Revenue for 2012 2011 $ Change % Change Fiscal 2012 Fiscal 2011 $ 121,851 $ 61,194 $ 60,657 99.1 % 19.4 % 17.8 % 85,000 48,241 36,759 76.2 % 13.9 % 11.7 % 40,831 27,431 13,400 48.8 % 62.7 % 60.2 % $ 247,682 $ 136,866 $ 110,816 81.0 % 19.0 % 17.0 % Fiscal Years Ended $ Change % Change % of Net
Sales/
Revenue for
Fiscal 2014 Income from Operations: Retail $ 557.2 $ 467.3 $ 89.9 19.2 % 26.1 % 29.3 % Wholesale 610.9 459.8 151.1 32.9 % 29.6 % 29.1 % Licensing 88.9 81.1 7.8 9.6 % 51.8 % 57.8 % Income from operations $ 1,257.0 $ 1,008.2 $ 248.8 24.7 % 28.8 % 30.5 % $60.7$89.9 million, or 99.1%19.2%, to $121.9$557.2 million during Fiscal 2012,2015, compared to $61.2$467.3 million for Fiscal 2011.2014. Income from operations as a percentage of net retail sales for the retail segment increaseddeclined by approximately 1.6%320 basis points to 26.1% during Fiscal 2015. The decrease in retail income from operations as a percentage of net sales was primarily due to an increase in operating costs as a percentage of net retail sales of approximately 2.6%, as well as due to 19.4%the decrease in gross profit margin, as previously discussed above, during Fiscal 2012.2015 as compared to Fiscal 2014. The increase in operating expenses as a percentage of net retail sales was largely due to an increase in depreciation and amortization expense, primarily related to new stores and lease rights (key money), as well as increased retail store and overhead costs, and distribution expenses.the increase in gross profit margin as a percentage of net retail sales, discussed above, in addition to an approximately 0.6% decrease in operating expenses as a percentage of net retail sales. The decrease in operating expenses as a percentage of net retail sales resulted from the increase in our net retail sales during Fiscal 2012, which grew at a greater rate relative to expenses and more than offset the additional expenses incurred during the period such as those discussed above in selling, general and administrative expenses, as well as the charges related to the impairment of long-lived assets.WholesaleIncome from operations for our wholesale segment increased $36.8 million, or 76.2%, to $85.0 million during Fiscal 2012, compared to $48.2 million for Fiscal 2011. Income from operations as a percentage of net wholesale sales for the wholesale segment increased approximately 2.2% as a percentage of net wholesale sales to 13.9%. This increase was primarily the result of the aforementioned increase in gross profit margin as a percentage of net wholesale sales during Fiscal 20122015 as compared to Fiscal 2011.$13.4$7.8 million, or 48.8%9.6%, to $40.8$88.9 million during Fiscal 2012,2015, compared to $27.4$81.1 million for Fiscal 2011.2014. Income from operations as a percentage of licensing revenue for the licensing segment increaseddecreased approximately 2.5%600 basis points to 51.8%. This decrease as a percentage of licensing revenue was due to 62.7%. This increase is primarily the result of the aforementionedan increase in sales of licensed products, while our operating expenses remained relatively fixedas a percentage of licensing revenues during Fiscal 2012,2015, as compared to Fiscal 2011.Interest Expense, netInterest expense decreased $0.4 million, or 19.7%,2014. This increase was largely due to $1.5increased advertising expenses, as well as certain administrative expenses incurred in connection with the formation of our new licensing operations in Europe during Fiscal 2015.2012, compared2015, and was comprised of $1.5 million in income related to $1.9our anti-counterfeiting efforts and a gain of $0.1 million for Fiscal 2011. The decrease in interest expense was primarily due to the decrease in the average balanceearned on our revolving credit facility during Fiscal 2012 as compared to Fiscal 2011, as well as a decrease in interest rates experienced during the period.(Gain) Lossgainloss of $2.6 million during Fiscal 2012,2015, as compared to a foreign currency loss of $1.8$0.1 million during Fiscal 2011.2014. The gain during Fiscal 20122015 loss was primarily duerelated to the revaluation and settlement of certain of our accounts payable in currencies other than the functional currency of the applicable reporting units, as well as the strengthening of the U.S. dollarDollar relative to the Euro and the Canadian Dollar, which impacted the re-measurement of dollar-denominated intercompany loans with certain of our European subsidiaries, which are denominated in U.S. dollars. We expectsubsidiaries. Such loss was partially offset by net gains of $1.5 million related to mark-to-market of our forward foreign currency contracts not designated as accounting hedges. The $0.1 million loss for Fiscal 2014 was primarily related to the impact resulting from the re-measurementrevaluation and settlement of these loans to diminish in future periods as certain of these intercompany loans were assumed by subsidiaries whoseour accounts payable in currencies other than the functional currency isof the U.S. dollar, and as such are no longer subject to currency re-measurement.$101.5$374.8 million of income tax expense during Fiscal 2012,2015, compared with $60.7$346.2 million for Fiscal 2011.2014. Our effective tax rate for Fiscal 20122015 was 40.8%29.8%, compared to 45.6%34.4% for Fiscal 2011.2014. The decrease in our effective tax rate resultedwas primarily fromdue to the following: decreaseincrease in statutorytaxable income tax rates applicable toin certain of our non-U.S. subsidiaries; and a decrease in our U.S. blended state income tax rate, as well as a greater portion of our income being recognized in jurisdictions withsubsidiaries (predominantly European operations) during Fiscal 2015, which are subject to lower statutory income tax rates duringrates. The Fiscal 2012 as compared to Fiscal 2011. This decrease was offset in part by the impairment charges recognized during Fiscal 2012, which yielded no income tax benefits.Our2015 effective tax rate may fluctuate from timewas also favorably impacted by the settlement of certain financial instruments in connection with our international income tax structuring.time due to the effects of changes in U.S. state and local taxes, tax rates in foreign jurisdictions, and certain other nondeductible expenses (such as fees related to a public offering) and income earned in certain non-U.S. entities with significant net operating loss carryforwards. In addition, factors such as the geographic mix of earnings, enacted tax legislation and the results of various global tax strategies, may also impact our effective tax rate in future periods.Net Income$74.9$219.5 million, or 103.2%33.2%, to $147.4$881.0 million during Fiscal 2012,2015, compared to $72.5$661.5 million for Fiscal 2011.2013 Credit Facilitycredit facility (see below discussion regarding “Senior Unsecured Revolving Credit Facility”) and available cash and cash equivalents. Our primary use of this liquidity is to fund our ongoing cash requirements, including working capital requirements, global retail store construction, expansion and renovation, expansion of our distribution and corporate facilities, construction and renovation of shop-in-shops, investment in information systems infrastructure, share repurchases and expansion of our distribution andother corporate facilities.activities. We believe that the cash generated from our operations, together with borrowings available under our revolving credit facility and available cash and cash equivalents, will be sufficient to meet our working capital needs for the next 12 months, including investments made and expenses incurred in connection with our store growth plans, shop-in shopshop-in-shop growth, investments in corporate and distribution facilities, continued systems development, as well as web based salese-commerce and marketing initiatives.initiatives and acquisition of certain currently licensed operations in Asia. We spent approximately $121.3$369.2 million on capital expenditures during Fiscal 20132016, and expect to spend approximately $230.0$250.0 million on capital expenditures during Fiscal 2014.2017. The majority of these expected expenditures relaterelated to newthe retail store openings planned forwhich occurred during the year, with the remainder being used foron investments made in connection with developing new shop-in-shops, the build-out of our corporate offices and enhancingenhancements to our distribution, e-commerce, and other information systems infrastructure. In addition, we plan to spend approximately $30.0 million during Fiscal 2014, on intangible assets related to our European retail store expansion.thousands)millions): As of March 30, March 31, 2013 2012 $ 472,511 $ 106,354 $ 824,941 $ 299,057 $ 1,289,565 $ 674,425 $ — $ 22,674 Fiscal Years Ended March 30, March 31, April 2, 2013 2012 2011 $ 356,336 $ 115,290 $ 110,308 (139,099 ) (88,187 ) (57,830 ) 150,561 58,639 (37,726 ) (1,641 ) (453 ) 649 $ 366,157 $ 85,289 $ 15,401 As of April 2,
2016 March 28,
2015Balance Sheet Data: Cash and cash equivalents $ 702.0 $ 978.9 $ 1,234.3 $ 1,663.4 Total assets $ 2,566.8 $ 2,684.6 Fiscal Years Ended April 2,
2016 March 28,
2015 March 29,
2014Cash Flows Provided By (Used In): Operating activities $ 1,228.4 $ 857.9 $ 633.0 Investing activities (381.1 ) (388.4 ) (215.5 ) Financing activities (1,128.3 ) (434.7 ) 71.1 Effect of exchange rate changes 4.1 (27.1 ) (4.7 ) Net (decrease) increase in cash and cash equivalents $ (276.9 ) $ 7.7 $ 483.9 $241.0$370.5 million to $356.3 million$1.228 billion during Fiscal 2013,2016, as compared to $115.3$857.9 million for Fiscal 2012.2015. The increase in cash flows from operating activities iswas primarily due to favorable changes in working capital, as well as an increase in our net income after non-cash adjustments. The increase in working capital was largely attributable to: a favorable change in accounts receivable due to higher shipments at the end of Fiscal 2015, as well as improved cash collections; a favorable change in inventories also reflecting higher shipments at the end of Fiscal 2015, partially offset by increased inventory related to new retail stores and wholesale locations (including inventory to support our operations in Panama and South Korea); and increases in accounts payable and accrued expenses and other current liabilities primarily due to the timing of payments, in part due to the inclusion of the 53rd week in Fiscal 2016.offset, in part, byafter non-cash adjustments, as well as a decrease in changes to our accounts receivable and an increase in cash outflowsfavorable change on our inventory primarily attributable to the sell through of our inventory relative to purchases made during Fiscal 20132015. These increases were partially offset by decreases related to changes in our accrued expenses and other current liabilities and accounts payable, as compared to Fiscal 2012. The decrease in the change to our accounts receivable was attributable to our increasing sales during Fiscal 2013, which resulted in higher accounts receivable balances relative to the prior fiscal year. The increase in cash outflows on our inventory occurred primarily to accommodate the increase to our net sales during Fiscal 2013. In addition, as we continue to open more retail stores we expect our expenditures on inventory to increase at a greater rate than the increase in our sales as inventory related to retail sales typically experiences slower inventory turnover than that of wholesale.Cash provided by operating activities increased $5.0 million to $115.3 million during Fiscal 2012, as compared to $110.3 million for Fiscal 2011. The increase in cash flows from operating activities is2014, primarily due to an increase in our nettiming of payments. The decline related to accrued expenses and other current liabilities was also due to the payment of certain non-U.S. current income offset, in part, by a decrease in changes to our accounts receivable and an increase in cash outflows on our inventorytax liabilities during Fiscal 2012 as compared to Fiscal 2011. The decrease in the change to our accounts receivable was largely the result of cash received during Fiscal 2011, which was related to sales billed late in our 2010 fiscal year. The increase in cash outflows on our inventory occurred primarily to accommodate the increase to our net sales during Fiscal 2012. In addition, as we continue to open more retail stores we expect our expenditures on inventory to increase at a greater rate than the increase in our sales as inventory related to retail sales typically experiences slower inventory turnover than that of wholesale.$139.1$381.1 million during Fiscal 2013,2016, compared to net cash used in investing activities of $88.2$388.4 million during Fiscal 2012.2015. The increasefavorable change in cash from investing activities was primarily due to a $17.8 million decline in cash used in investing activitiesconnection with lease rights (key money) for new stores, which was primarily the result ofpartially offset by a $13.0 million increase in capital expenditures, largely attributable to the build-out of our new retail stores which were constructed during the Fiscal 2013,and shop-in-shops, we installed during Fiscal 2013, as well as certaininvestments in new information technology, initiatives undertaken during the year, which related to distribution system enhancements, corporate offices and various other improvements toin our infrastructure. In addition, we purchased approximately $8.5 million of intangible assets related to certain of our stores opened during Fiscal 2013, as well as made an investment in, as well as a loan to, a joint venture, for approximately $3.2 million and $6.0 million, respectively, during Fiscal 2013.increased $30.4 million to $88.2was $388.4 million during Fiscal 2012, as2015, compared to $57.8net cash used in investing activities of $215.5 million during Fiscal 2011.2014. The increase in cash used in investing activities is primarily the result of the build-out of our new retail stores, which were constructed during Fiscal 2012, as well as2015, shop-in-shops we installed during Fiscal 2012,2015, as we grow our business. In addition, we spent approximately $3.7 million in capital expenditureswell as certain technology initiatives undertaken during Fiscal 2015, which related to distribution system enhancements and various other improvements to our new distribution facility in California which we began operations in during fiscal 2012.provided byused in financing activities was $150.6$1.128 billion during Fiscal 2016, compared to net cash used in financing activities of $434.7 million during Fiscal 2013,2015. This decline in cash from financing activities was primarily attributable to increased cash payments of $657.1 million in connection with the repurchase of our ordinary shares, as well a $26.8 million decrease in proceeds from our share option arrangements.$58.6$71.1 million during Fiscal 2012. After excluding the non-cash effects of tax benefits from the exercise of share options, cash provided by operating activities decreased by $20.3 million.2014. This decrease was primarily due to the net repayments on our revolving credit facility of $22.7 million during Fiscal 2013, as compared to net borrowings of $9.9 during Fiscal 2012. This decrease was offset, in part, by an increasedecline in cash received from the exercise of employee share options during Fiscal 2013 as compared to Fiscal 2012.Net cash provided by financing activities was $58.6 million during Fiscal 2012, compared to net cash used in financing activities of $37.7 million during Fiscal 2011. The $96.4 million increase in cash flows from financing activities was primarily dueattributable to increased cash payments of $492.9 million in connection with the net borrowings onrepurchase of our ordinary shares, as well a $13.1 million decrease in proceeds from our share option arrangements.of $9.9 million during Fiscal 2012,("2015 Credit Facility") with, among others, JPMorgan Chase Bank, N.A. ("JPMorgan Chase"), as compared to net repayments of $31.2 million made during Fiscal 2011. In addition, we received net proceeds from the private placement ofadministrative agent, which replaced our convertible preference shares, completed in July 2011, of $9.6 million, as well as $9.7 million from the exercise of employee share options.Revolving Credit FacilitiesSecured Revolving Credit FacilityOn September 15, 2011, we completed an amendment to our securedprior 2013 senior unsecured revolving credit facility (the “2011("2013 Credit Facility”Facility"). The Company and a U.S., which was originally entered into during Fiscal 2007. Pursuant to such amendment,Canadian, Dutch and Swiss subsidiary are the borrowers under the 2015 Credit Facility. The borrowers and certain of our material subsidiaries provide unsecured guarantees of the 2015 Credit Facility. The 2015 Credit Facility providedprovides for up to $100.0 million$1.0 billion in borrowings, which may be denominated in U.S. Dollars and other currencies, including Euros, Canadian Dollars, Pounds Sterling, Japanese Yen and Swiss Francs. The 2015 Credit Facility also provides for the issuance of borrowings, and was originally set to expire on September 15, 2015. The agreement also provided for loans and letters of credit to our European subsidiaries of up to $35.0$75.0 million and swing line loans of up to $50.0 million. All other terms and conditionsWe have the ability to expand its borrowing availability under the 20112015 Credit Facility remained consistent withby up to an additional $500.0 million, subject to the original agreement.agreement of the participating lenders and certain other customary conditions. The 20112015 Credit Facility providedexpires on October 29, 2020.aggregate credit availableloans denominated in U.S. Dollars, an alternative base rate, which is the greater of the prime rate publicly announced from time to time by JPMorgan Chase, the greater of the federal funds effective rate or Federal Reserve Bank of New York overnight bank funding rate plus 50 basis points or the one-month London Interbank Offered Rate adjusted for statutory reserve requirements for Eurocurrency liabilities ("Adjusted LIBOR") plus 100 basis points, in each case, plus an applicable margin based on our leverage ratio; (ii) Adjusted LIBOR for the applicable interest period, plus an applicable margin based on our leverage ratio; (iii) for Canadian borrowings, the Canadian prime rate, which is the greater of the PRIMCAN Index rate or the rate applicable to one-month Canadian Dollar banker's acceptances quoted on Reuters ("CDOR") plus 100 basis points, plus an applicable margin based on our leverage ratio; or (iv) for Canadian borrowings, the average CDOR rate for the applicable interest period, plus an applicable margin based on our leverage ratio.lesseraverage daily unused amount of (i) $100.0 million,the facility. Loans under the 2015 Credit Facility may be prepaid and commitments may be terminated or (ii)reduced by the borrowers without premium or penalty other than customary "breakage" costs with respect to loans bearing interest based upon Adjusted LIBOR or the CDOR rate.specified percentages of eligible receivables and eligible inventory,total indebtedness as defined, plus $30.0 million. The terms of the 2011 Credit Facility required all amounts outstanding under the agreement to be collateralized by substantially all of our assets throughout the durationdate of the agreement. The 2011 Credit Facility contained financial covenants which limited our capital expenditures to $110.0 million for any one fiscal yearmeasurement plus additional amounts as permitted, and a minimum fixed charge coverage ratio of 2.0 to 1.0 (with6.0 times the ratio being EBITDA plus consolidated rent expense for the last four consecutive fiscal quarters, to Consolidated EBITDAR for the sum of fixed chargeslast four consecutive fiscal quarters. Consolidated EBITDAR is defined as consolidated net income plus income tax expense, net interest expense, depreciation and amortization expense, consolidated rent expense), restrictedexpense and limitedother non-cash charges, subject to certain deductions. The 2015 Credit Facility also includes covenants that limit additional indebtedness, guarantees, liens, acquisitions and restricted the incurrence of additional liensother investments and cash dividends. During Fiscal 2013, and prior to its termination,dividends that are customary for financings of this type. As of April 2, 2016, we were in compliance with all of our covenants under the agreement.Borrowings under the 2011 Credit Facility accrued interest at the rate per annum announced from time to time by the agent of 1.25% above the prevailing applicable prime rate, or at a per annum rate equal to 2.25% above the prevailing LIBOR rate. The weighted average interest rate for the revolving credit facility was 2.72% during Fiscal 2013. The Credit Facility required an annual facility fee of $0.1 million, and an annual commitment fee of 0.35% on the unused portion of the available credit under the Credit Facility, which was payable quarterly.Prior to March 30, 2013, the 2011 Credit Facility was terminated (see below) and there were no amounts outstanding or available related to this agreement.largest amount borrowed from the 2011 Credit Facility during Fiscal 2013 was $31.7 million.Senior Unsecured Revolving Credit FacilityOn February 8, 2013, we terminated the provisions of our existing 2011 Credit Facility and entered into a senior unsecured credit facility (“2013 Credit Facility”). Pursuant to the agreement the 2013 Credit Facility provides up to $200.0 million of borrowings, and expires on February 15, 2018. The agreement also provides for loans and letters of credit to our European subsidiaries of up to $100.0 million. The 20132015 Credit Facility contains financial covenantsevents of default customary for financings of this type, including but not limited to, payment defaults, material inaccuracy of representations and warranties, covenant defaults, cross-defaults to certain indebtedness, certain events of bankruptcy or insolvency, certain events under ERISA, material judgments, actual or asserted failure of any guaranty supporting the 2015 Credit Facility to be in full force and effect, and change of control. If such as requiring an adjusted leverage ratioevent of 3.5 to 1.0 (withdefault occurs, the ratio being total consolidated indebtedness plus 8.0 times consolidated rent expense to EBITDA plus consolidated rent expense) and a fixed charge coverage ratio of 2.0 to 1.0 (with the ratio being EBITDA plus consolidated rent expense to the sum of fixed charges plus consolidated rent expense), restricts and limits additional indebtedness, and restricts the incurrence of additional liens and cash dividends. During Fiscal 2013, we were in compliance with all of our covenants covered under this agreement.Borrowingslenders under the 20132015 Credit Facility accrue interest atwould be entitled to take various actions, including terminating the rate per annum announced from time to time by the agent a rate based on the rates applicable for deposits in the London interbank market for U.S. Dollars or the applicable currency in which the loans are made (the “Adjusted LIBOR”) plus an applicable margin. The applicable margin may range from 1.25% to 2.5%,commitments and is based, or dependent upon, a particular threshold related to the adjusted leverage ratio calculated during the period of borrowing. The 2013 Credit Facility requires an annual facility fee of $0.1 million, and an annual commitment fee of 0.25% to 0.35% on the unused portion of the available credit under the facility.As of March 30, 2013, there were noaccelerating amounts outstanding under the 2015 Credit Facility.Facility, andFacility. At April 2, 2016, stand-by letters of credit of $10.0 million were outstanding under the 2015 Credit Facility. At April 2, 2016, the amount available for future borrowings was $188.7$990.0 million. Thereno amounts borrowed under this agreement duringdelivered to us pursuant to these provisions, which did not require any additional cash outlay. The ASR program was accounted for as a treasury stock repurchase, reducing the number of ordinary shares outstanding by 4,718,335 shares.2013. At March 30, 2013, there were documentary letters2016 and Fiscal 2015, we withheld 54,875 shares and 40,787 shares, respectively, at a cost of credit outstanding of approximately $2.0$2.4 million and stand-by letters$3.4 million, respectively, in satisfaction of creditminimum tax withholding obligations relating to the vesting of $9.3 million.March 30, 2013,April 2, 2016, our lease commitments and contractual obligations were as follows (in thousands)millions): Fiscal Fiscal Fiscal Fiscal 2019 and 2014 2015-2016 2017-2018 Thereafter Total $ 86,297 $ 166,839 $ 157,198 $ 282,706 $ 693,040 Fiscal Years Ending Total Operating leases $ 220.7 $ 438.5 $ 420.0 $ 746.7 $ 1,825.9 Inventory Purchase Obligations 549.0 — — — 549.0 Other commitments 45.4 3.8 — — 49.2 Long-term debt — 0.1 1.2 1.0 2.3 Total $ 815.1 $ 442.4 $ 421.2 $ 747.7 $ 2,426.4 $7.1$18.5 million of long-term liabilities related to uncertain tax positions, due to the uncertainty of the time and nature of resolution.March 30, 2013,April 2, 2016, as these items will be paid within one year, and non-current liabilities that have no cash outflows associated with them (e.g., deferred taxes).We do not have any long-term purchase obligations that represent firm commitments at March 30, 2013.have experienced increasedmay experience an increase in cost pressure from our suppliers in the future, which could have an adverse impact on our gross profit results in the future.periods effected.Item 7A.Quantitative and Qualitative Disclosures About Market RiskCurrently weWe enter into foreign currency forward contracts to manage our foreign currency exposure to the fluctuations of certain foreign currencies. The use of these instruments primarily helps to manage our exposure to our foreign purchase commitments and better control our product costs. Other than these purchase commitments, we do not use these foreign exchange contracts for any other purposes. In addition, weWe do not use derivatives for trading or speculative purposes.the functionalour purchasing subsidiaries local currency relative to the local currency requirement of the supplier on the date of the commitment. As such, we enter into forward currency exchange contracts that generally mature in 1812 months or less and are consistent with the related purchase commitments. These contracts are recorded at fair value in our consolidated balance sheets as either an asset or liability, and are derivative contracts to hedge cash flow risks. Certain of these contracts are designated as hedges for hedge accounting purposes, while certain of these contracts, currently a relatively small portion, are not designated as hedges for accounting purposes. Accordingly, the changes in the fair value of the majority of these contracts at the balance sheet date are recorded in our equity as a component of accumulated other comprehensive income, and upon maturity (settlement) are recorded in, or reclassified into, our cost of sales or operating expenses, in our consolidated statement of operations, as applicable to the transactions for which the forward currency exchange contracts were established. RegardingFor those contracts which are designated as hedges for accounting purposes, any portion of those contracts deemed ineffective would be charged to earnings, in the same manner as those contracts charged to earnings above, in the period the ineffectiveness was determined.thoseour forward currency contracts, both designated and not designated as hedges for accounting purposes, to determine the effects of fluctuations in foreign currency exchange rates. For this sensitivity analysis, we assume a hypothetical change in U.S. dollarDollar against foreign exchange rates. Based on all foreign currency exchange contracts outstanding as of March 30, 2013,April 2, 2016, a 10% appreciation or devaluation of the U.S. dollarDollar compared to the level of foreign currency exchange rates for currencies under contract as of March 30, 2013April 2, 2016, would result in a net increase and decrease, respectively, of approximately $1.9$20 million in the fair value of net unrealized foreign currency loss. Conversely, a 10% appreciation of the U.S. dollar would result in an increase approximately of $1.9 million of net unrealized gains.30, 2013,28, 2015, there waswere no balances outstanding balance on our Credit Facility. The balance of our2015 Credit Facility at March 30,or our prior 2013 Credit Facility, which is not indicative of future balances under the 2015 Credit Facility that may be subject to fluctuations in interest rates. Any increases in either the prime rate or LIBORapplicable interest rate(s) would cause an increase to the interest expense on our 2015 Credit Facility relative to any outstanding balance at that date.Item 8.Financial Statements and Supplementary Data15Exhibits15. “Exhibits and Financial Statement ScheduleSchedule” and is incorporated herein by reference.Item 9.Changes in and Disagreements with Accountants on Accounting and Financial DisclosureNone.Item 9A.Controls and Procedures13a-15 (e)13a - 15(e) and 15d—15(d) - 15(e) under the Securities and Exchange Act of 1934 (the “Exchange Act”)) as of March 30, 2013.April 2, 2016. Based on the evaluation, the Chief Executive Officer and Chief Financial Officer concluded that disclosure controls and procedures as of March 30, 2013April 2, 2016 are effective.preparation ofconsolidated financial statements for external purposeshave been prepared in accordance with accounting principles generally accepted accounting principles (“GAAP”in the United States ("U.S. GAAP"). Such internal control over financial reporting includes those policies and procedures that (i) pertain to the maintenance of records that in reasonable detail accurately and fairly reflect the transactions and dispositions of the assets; (ii) provide reasonable assurance (A) that transactions are recorded as necessary to permit preparation of financial statements in accordance with U.S. GAAP and that receipts and expenditures of the Company are being made only in accordance with authorizations of management and directors; and (B) regarding prevention or timely detection of unauthorized acquisition, use or disposition of our assets that could have a material effect on the financial statements.March 30, 2013.April 2, 2016. In making this assessment, it used the criteria set forth inInternal Control—Integrated Frameworkissued by the Committee of Sponsoring Organizations of the Treadway Commission (COSO)., the 2013 Framework. Based on this assessment, management has determined that, as of March 30, 2013,April 2, 2016, our internal control over financial reporting is effective based on those criteria.March 30, 2013,April 2, 2016, as well as the consolidated financial statements, have been audited by PricewaterhouseCoopersErnst & Young LLP, an independent registered public accounting firm, as stated in their report which appears herein. The audit report appears on page44 55 of this report.March 30, 2013,April 2, 2016, that have materially affected, or are reasonably likely to materially affect, our internal control over financial reporting.Item 9B.Other InformationNone.Item 10.Directors, Executive Officers and Corporate Governance2013,2016, which is incorporated herein by reference.Item 11.Executive Compensation2013,2016, which is incorporated herein by reference.Equity Compensation Plan Information (a) (b) (c) Plan category Number of securities to be issued upon exercise of outstanding options, warrants and rights Weighted-average exercise price of outstanding options, warrants and rights Number of securities remaining available for future issuance under equity compensation plans (excluding securities reflected in column (a)) 5,115,065 $ 52.40 9,211,143 2,746,409 $ 5.61 — Total 7,861,474 $ 36.05 9,211,143 Item 12.Security Ownership of Certain Beneficial Owners and Management and Related Stockholder MattersReflects share options, restricted shares and restricted share units issued under the Michael Kors Holdings Limited Omnibus Incentive Plan. Represents the weighted average exercise price of outstanding share awards only. Reflects share options issued under the Amended and Restated Michael Kors (USA), Inc. Stock Option Plan (the “Option Plan”). Prior to our initial public offering, we granted share options to purchase ordinary shares to our executive officers and other eligible employees pursuant to the terms of the Option Plan. All of the share options granted under the Option Plan are ten-year share options and vest in full at the end of the ten-year term if our shareholder net equity has increased by at least 20% per annum during such ten-year period. However, a portion of each share option is eligible to vest on an accelerated basis over the course of five years with 20% vesting each year if the pre-established annual performance goal for the year has been met, in each case, subject to the grantee’s continued employment through the vesting date. The annual performance goals are tied to annual divisional pre-tax profit as determined by the Board. As of April 2, 2016, there were no shares available for future issuance under the 2008 Plan. 2013,2016, which is incorporated herein by reference.Item 13.Certain Relationships, Related Transactions and Director Independence2013,2016, which is incorporated herein by reference.Item 14.Principal Accountant Fees and ServicesInformation with respect to this Item is included in the Company’s Proxy Statement to be filed in June 2013, which is incorporated herein by reference.Item 15.Exhibits and Financial Statement Schedules(a) The following documents are filed as part of this annual report on Form 10-K: 1. The following consolidated financial statements listed below are filed as a separate section of this annual reportAnnual Report on Form 10-K:Firm— PricewaterhouseCoopers LLP .March 30, 2013April 2, 2016 and March 31, 2012.Fiscalfiscal years ended April 2, 2016, March 30, 2013,28, 2015 and March 31, 2012, and April 1, 2011.Fiscalfiscal years ended April 2, 2016, March 30, 2013,28, 2015 and March 31, 2012, and April 1, 2011.Fiscalfiscal years ended April 2, 2016, March 30, 2013,28, 2015 and March 31, 2012, and April 1, 2011.Fiscalfiscal years ended April 2, 2016, March 30, 2013,28, 2015 and March 31, 2012, and April 1, 2011.29, 2014.2. Exhibits: ExhibitNo.Document Description 2.1
No.Restructuring Agreement, dated as of July 7, 2011, by and among Michael Kors Holdings Limited, John Idol, SHL-Kors Limited, Michael Kors, SHL Fashion Limited, Michael Kors (USA), Inc., Michael Kors Far East Holdings Limited, Sportswear Holdings Limited, Littlestone, Northcroft Trading Inc., Vax Trading, Inc., OB Kors LLC, John Muse, Muse Children’s GS Trust, JRM Interim Investors, LP and Muse Family Enterprises (included as Exhibit 2.1 to the Company’s Registration Statement on Form F-1, as amended (File No. 333-178282), filed on December 2, 2011, and incorporated herein by reference).Document Description3.1 3.1Specimen of Ordinary Share Certificate of Michael Kors Holdings Limited (included as Exhibit 4.1 to the Company’s Registration Statement on Form F-1, as amended (File No. 333-178282), filed on December 2, 2011, and incorporated herein by reference). 4.2 4.2Amended and Restated Credit Agreement, dated as of February 8, 2013,October 29, 2015, by and among Michael Kors (USA), Inc., as borrower and guarantor, Michael Kors Holdings Limited, as borrower and guarantor, the foreign subsidiary borrowersForeign Subsidiary Borrowers from time to time party thereto, the lenderscertain other subsidiaries of Michael Kors Holdings Limited from time to time party thereto as Guarantors, the guarantorsLenders party thereto, J.P. MorganJPMorgan Chase Bank, N.A., as Administrative Agent and Co-Syndication Agent, Citibank, N.A., as Co-Syndication Agent, Bank of America, N.A., HSBC Bank USA, National Association, Wells Fargoas Co-Documentation Agent, and U.S. Bank National Association, as Co-Documentation Agent. (included as Exhibit 10.1 to the Company’s Quarterly Report on Form 10-Q for the fiscal quarter ended December 26, 2015 filed on February 3, 2016, and J.P. Morgan Securities L.L.C.incorporated herein by reference).Shareholders Agreement, dated as of July 11, 2011, among Michael Kors Holdings Limited and certain shareholders of Michael Kors Holdings Limited (included as Exhibit 10.2 to the Company’s Registration Statement on Form F-1, as amended (File No. 333-178282), filed on December 2, 2011, and incorporated herein by reference). 4.4Subscription Agreement, dated as of July 7, 2011, among Michael Kors Holdings Limited and certain shareholders of Michael Kors Holdings Limited (included as Exhibit 10.1 to the Company’s Registration Statement on Form F-1, as amended (File No. 333-178282), filed on December 2, 2011, and incorporated herein by reference). 10.1Form of Indemnification Agreement between Michael Kors Holdings Limited and its directors and executive officers (included as Exhibit 10.5 to the Company’s Registration Statement on Form F-1, as amended (File No. 333-178282), filed on December 2, 2011, and incorporated herein by reference). Licensing Agreement, dated as of April 1, 2011, between Michael Kors, L.L.C. and Michael Kors (HK) Limited (included as Exhibit 10.6 to the Company’s Registration Statement on Form F-1, as amended (File No. 333-178282), filed on December 2, 2011, and incorporated herein by reference). (Certain portions of this exhibit were omitted pursuant to a confidential treatment request. Omitted information was filed separately with the Securities and Exchange Commission.) Licensing Agreement, dated as of April 1, 2011, between Michael Kors, L.L.C. and Michael Kors Trading Shanghai Limited (included as Exhibit 10.7 to the Company’s Registration Statement on Form F-1, as amended (File No. 333-178282), filed on December 2, 2011, and incorporated herein by reference). (Certain portions of this exhibit were omitted pursuant to a confidential treatment request. Omitted information was filed separately with the Securities and Exchange Commission). 10.4Document Description 10.4 Amended and Restated Michael Kors (USA), Inc. Stock Option Plan (included as Exhibit 10.4 to the Company’s Registration Statement on Form F-1, as amended (File No. 333-178282), filed on December 2, 2011, and incorporated herein by reference). Amended No. 1 to the Amended and Restated Michael Kors (USA), Inc. Share Option Plan. (included as Exhibit 4.9 to the Company’s Annual Report on Form 20-F for the fiscal year ended March 31, 2012, filed on June 12, 2012, and incorporated herein by reference). 10.6 10.6Exhibit 10.8Appendix A to the Company’s RegistrationDefinitive Proxy Statement on Form F-1, as amendedSchedule 14A (File No. 333-178282)001-35368), filed on December 2, 2011,June 16, 2015, and incorporated herein by reference).10.7 10.7Second Amended and Restated Employment Agreement, dated as of May 23, 2013,20, 2015, by and among Michael Kors (USA), Inc., Michael Kors Holdings Limited and Michael Kors.Kors (included as Exhibit 10.7 to the Company's Annual Report on Form 10-K for the fiscal year ended March 28, 2015, filed on May 27, 2015, and incorporated herein by reference).10.8 10.8Second Amended and Restated Employment Agreement, dated as of May 23, 2013,20, 2015, by and among Michael Kors (USA), Inc., Michael Kors Holdings Limited and John D. Idol.Idol (included as Exhibit 10.8 to the Company's Annual Report on Form 10-K for the fiscal year ended March 28, 2015, filed on May 27, 2015, and incorporated herein by reference).Amended and Restated Employment Agreement, dated as of May 23, 2013, by and among Michael Kors (USA), Inc., Michael Kors Holdings Limited and Joseph B. Parsons.Parsons (included as Exhibit 10.9 to the Company’s Annual Report on Form 10-K for the fiscal year ended March 30, 2013 filed on May 29, 2013, and incorporated herein by reference).10.10 Michael Kors Holdings Limited Executive Bonus Program (included as Exhibit 10.1 to the Company’s Quarterly Report on Form 10-Q for the fiscal quarter ended June 29, 2013 filed on August 6, 2013, and incorporated herein by reference). 10.10Amended and Restated Employment Agreement, dated as of May 23, 2013,12, 2014, by and amongbetween Michael Kors (USA), Inc., Michael Kors Holdings Limited and Lee S. Sporn.Cathy Marie Robison (included as Exhibit 10.14 to the Company’s Annual Report on Form 10-K for the fiscal year ended March 29, 2014 filed on May 28, 2014, and incorporated herein by reference).10.12 10.11Offer Letter,Employment Agreement, dated as of August 21, 2012,July 14, 2014, by and between Pascale Meyran and Michael Kors (USA), Inc. (included as Exhibit 10.14 to the Company's Annual Report on Form 10-K for the fiscal year ended March 28, 2015, filed on May 27, 2015, and incorporated herein by reference).10.13 Form of Employee Non-Qualified Option Award Agreement (included as Exhibit 10.15 to the Company's Annual Report on Form 10-K for the fiscal year ended March 28, 2015, filed on May 27, 2015, and incorporated herein by reference). 10.14 Form of Employee Restricted Share Unit Award Agreement (included as Exhibit 10.16 to the Company's Annual Report on Form 10-K for the fiscal year ended March 28, 2015, filed on May 27, 2015, and incorporated herein by reference). 10.15 Form of Performance-Based Restricted Share Unit Award Agreement (included as Exhibit 10.17 to the Company's Annual Report on Form 10-K for the fiscal year ended March 28, 2015, filed on May 27, 2015, and incorporated herein by reference). 10.16 Form of Independent Director Restricted Share Unit Award Agreement (included as Exhibit 10.18 to the Company's Annual Report on Form 10-K for the fiscal year ended March 28, 2015, filed on May 27, 2015, and incorporated herein by reference). 10.17 Aircraft Time Sharing Agreement, dated November 24, 2014, by and between Michael Kors (USA), Inc. and Britton Russell.John Idol (included as Exhibit 10.19 to the Company's Annual Report on Form 10-K for the fiscal year ended March 28, 2015, filed on May 27, 2015, and incorporated herein by reference).10.18 Aircraft Time Sharing Agreement, dated December 12, 2014, by and between Michael Kors (USA), Inc. and Michael Kors (included as Exhibit 10.20 to the Company's Annual Report on Form 10-K for the fiscal year ended March 28, 2015, filed on May 27, 2015, and incorporated herein by reference). 10.12Form of Performance-Based Restricted Share Unit Award Agreement.List of subsidiaries of Michael Kors Holdings Limited. 23.123.2 Consent of PricewaterhouseCoopersErnst & Young LLP.Certification of Chief Executive Officer pursuant to Section 302 of Sarbanes Oxley Act of 2002. Certification of Chief Financial Officer pursuant to Section 302 of Sarbanes Oxley Act of 2002. Certification of Chief Executive Officer pursuant to 18 U.S.C. Section 1350, as adopted pursuant to Section 906 of the Sarbanes-Oxley Act of 2002. Certification of Chief Financial Officer pursuant to 18 U.S.C. Section 1350, as adopted pursuant to Section 906 of the Sarbanes-Oxley Act of 2002. Interactive Data Files. May 29, 2013June 1, 2016MICHAEL KORS HOLDINGS LIMITED By: Name:Name: John D. Idol Title:Title: Chairman & Chief Executive Officer By:/s/ Michael Kors Honorary Chairman, Chief Creative Officer and DirectorMay 29, 2013Michael KorsBy: By: /s/ Michael Kors Honorary Chairman, Chief Creative Officer and Director June 1, 2016 Michael Kors By: /s/ John D. Idol May 29, 2013June 1, 2016 John D. Idol By: Joseph B. ParsonsOfficer.Officer, Chief Operating Officer and Treasurer (Principal Financial and Accounting Officer)June 1, 2016 May 29, 2013Joseph B. Parsons By: /s/ Silas K.F. Chou DirectorMay 29, 2013Silas K.F. ChouBy:/s/ Lawrence S. Stroll DirectorMay 29, 2013Lawrence S. StrollBy:Director DirectorMay 29, 2013June 1, 2016 M. William Benedetto By: Director DirectorMay 29, 2013June 1, 2016 Stephen F. Reitman By: Director DirectorMay 29, 2013June 1, 2016 Ann McLaughlin Korologos By: Director DirectorMay 29, 2013June 1, 2016 Jean Tomlin By: Director DirectorMay 29, 2013June 1, 2016 Judy Gibbons By: /s/ Jane Thompson Director June 1, 2016 Jane Thompson In our opinion,of shareholders’shareholders' equity and of cash flows present fairly, in all material respects, the financial position of Michael Kors Holdings Limited and its subsidiaries at March 30, 2013 and March 31, 2012, and the results of their operations and their cash flows for each of the three years in the period ended March 30, 2013 in conformity with accounting principles generally accepted inApril 2, 2016. These financial statements are the United States of America. Also in our opinion, the Company maintained, in all material respects, effective internal control over financial reporting as of March 30, 2013, based on criteria established inInternal Control - Integrated Framework issued by the Committee of Sponsoring Organizationsresponsibility of the Treadway Commission (COSO). The Company’s management is responsible for these financial statements, for maintaining effective internal control over financial reporting and for its assessment of the effectiveness of internal control over financial reporting, included in Management’s Report on Internal Control over Financial Reporting appearing under Item 9A.Company's management. Our responsibility is to express opinionsan opinion on these financial statements and on the Company’s internal control over financial reporting based on our audits (which was an integrated audit in the year ended March 30, 2013). audits.auditsaudit to obtain reasonable assurance about whether the financial statements are free of material misstatementmisstatement. An audit includes examining, on a test basis, evidence supporting the amounts and disclosures in the financial statements. An audit also includes assessing the accounting principles used and significant estimates made by management, as well as evaluating the overall financial statement presentation. We believe that our audits provide a reasonable basis for our opinion.audits of the financial statements included examining, on a test basis, evidence supporting the amounts and disclosures in the financial statements, assessing the accounting principles used and significant estimates made by management, and evaluating the overall financial statement presentation. Our audit of internal control over financial reporting included obtaining an understanding of internal control over financial reporting, assessing the risk that a material weakness exists, and testing and evaluating the design and operating effectiveness of internal control based on the assessed risk. Our audits also includedrisk, and performing such other procedures as we considered necessary in the circumstances. We believe that our audits provideaudit provides a reasonable basis for our opinions.(i)(1) pertain to the maintenance of records that, in reasonable detail, accurately and fairly reflect the transactions and dispositions of the assets of the company; (ii)(2) provide reasonable assurance that transactions are recorded as necessary to permit preparation of financial statements in accordance with generally accepted accounting principles, and that receipts and expenditures of the company are being made only in accordance with authorizations of management and directors of the company; and (iii)(3) provide reasonable assurance regarding prevention or timely detection of unauthorized acquisition, use, or disposition of the company’s assets that could have a material effect on the financial statements./s/ PricewaterhouseCoopers LLPNew York, New YorkMay 29, 2013thousands,millions, except share data) March 30,
2013 March 31,
2012 Assets $ 472,511 $ 106,354 206,454 127,226 266,894 187,413 8,480 11,145 34,850 31,925 989,189 464,063 242,113 170,755 20,980 14,146 14,005 14,005 4,389 3,952 18,889 7,504 $ 1,289,565 $ 674,425 Liabilities and Shareholders’ Equity $ — $ 22,674 82,977 67,326 38,642 33,710 9,074 8,199 33,555 33,097 164,248 165,006 56,986 43,292 13,163 6,300 7,922 3,590 242,319 218,188 — — 424,454 228,321 (3,461 ) (735 ) 626,253 228,651 1,047,246 456,237 $ 1,289,565 $ 674,425 April 2,
2016 March 28,
2015Assets Current assets Cash and cash equivalents $ 702.0 $ 978.9 Receivables, net 307.9 363.4 Inventories 546.8 519.9 Prepaid expenses and other current assets 113.1 127.5 Total current assets 1,669.8 1,989.7 Property and equipment, net 758.2 562.9 Intangible assets, net 67.4 61.5 Goodwill 23.2 14.0 Deferred tax assets 24.5 23.0 Other assets 23.7 33.5 Total assets $ 2,566.8 $ 2,684.6 Liabilities and Shareholders’ Equity Current liabilities Accounts payable $ 131.4 $ 114.1 Accrued payroll and payroll related expenses 59.7 62.9 Accrued income taxes 51.6 25.5 Accrued expenses and other current liabilities 192.8 123.8 Total current liabilities 435.5 326.3 Deferred rent 106.4 88.3 Deferred tax liabilities 3.5 7.0 Long-term debt 2.3 — Other long-term liabilities 19.6 22.0 Total liabilities 567.3 443.6 Commitments and contingencies Shareholders’ equity Ordinary shares, no par value; 650,000,000 shares authorized; 208,084,175 shares issued and 176,441,891 outstanding at April 2, 2016; 206,486,699 shares issued and 199,656,833 outstanding at March 28, 2015 — — Treasury shares, at cost (31,642,284 shares at April 2, 2016 and 6,829,866 shares at March 28, 2015) (1,650.1 ) (497.7 ) Additional paid-in capital 718.9 636.7 Accumulated other comprehensive loss (80.9 ) (66.8 ) Retained earnings 3,007.8 2,168.8 Total shareholders' equity of MKHL 1,995.7 2,241.0 Noncontrolling interest 3.8 — Total equity 1,999.5 2,241.0 Total liabilities and shareholders’ equity $ 2,566.8 $ 2,684.6 thousands,millions, except share and per share data) Fiscal Years Ended March 30,
2013 March 31,
2012 April 2,
2011 $ 2,094,757 $ 1,237,100 $ 757,800 86,975 65,154 45,539 2,181,732 1,302,254 803,339 875,166 549,158 357,274 1,306,566 753,096 446,065 621,536 464,568 279,822 54,291 37,554 25,543 725 3,292 3,834 676,552 505,414 309,199 630,014 247,682 136,866 1,524 1,495 1,861 1,363 (2,629 ) 1,786 627,127 248,816 133,219 229,525 101,452 60,713 397,602 147,364 72,506 — 21,227 15,629 $ 397,602 $ 126,137 $ 56,877 196,615,054 158,258,126 140,554,377 201,540,144 189,299,197 179,177,268 $ 2.02 $ 0.80 $ 0.40 $ 1.97 $ 0.78 $ 0.40 $ 397,602 $ 147,364 $ 72,506 (4,006 ) (4,768 ) 3,803 1,280 — — $ 394,876 $ 142,596 $ 76,309 Fiscal Years Ended April 2,
2016 March 28,
2015 March 29,
2014Net sales $ 4,538.8 $ 4,199.7 $ 3,170.5 Licensing revenue 173.3 171.8 140.3 Total revenue 4,712.1 4,371.5 3,310.8 Cost of goods sold 1,914.9 1,723.8 1,294.7 Gross profit 2,797.2 2,647.7 2,016.1 Selling, general and administrative expenses 1,428.0 1,251.5 926.9 Depreciation and amortization 183.2 138.4 79.7 Impairment of long-lived assets 10.9 0.8 1.3 Total operating expenses 1,622.1 1,390.7 1,007.9 Income from operations 1,175.1 1,257.0 1,008.2 Other income, net (3.7 ) (1.6 ) — Interest expense, net 1.7 0.2 0.4 Foreign currency loss 4.8 2.6 0.1 Income before provision for income taxes 1,172.3 1,255.8 1,007.7 Provision for income taxes 334.6 374.8 346.2 Net income 837.7 881.0 661.5 Less: Net loss attributable to noncontrolling interest (1.4 ) — — Net income attributable to MKHL $ 839.1 $ 881.0 $ 661.5 Weighted average ordinary shares outstanding: Basic 186,293,295 202,680,572 202,582,945 Diluted 189,054,289 205,865,769 205,638,107 Net income per ordinary share attributable to MKHL: Basic $ 4.50 $ 4.35 $ 3.27 Diluted $ 4.44 $ 4.28 $ 3.22 Statements of Comprehensive Income: Net income $ 837.7 $ 881.0 $ 661.5 Foreign currency translation adjustments 18.5 (91.3 ) — Net (losses) gains on derivatives (32.5 ) 30.9 (2.9 ) Comprehensive income 823.7 820.6 658.6 Less: Net loss attributable to noncontrolling interest (1.4 ) — — Less: Other comprehensive income attributable to noncontrolling interest 0.1 — — Comprehensive income attributable to MKHL $ 825.0 $ 820.6 $ 658.6 thousandsmillions, except share data) Accumulated Convertible
Preference Shares Ordinary Shares Additional
Paid-in
Capital Other
Comprehensive
Gain/(loss) Retained
Earnings Total Shares Amounts Shares Amounts 10,163,920 $ — 140,554,377 $ — $ 40,000 $ 230 $ 8,781 $ 49,011 — — — — — — 72,506 72,506 — — — — — 3,803 — 3,803 — — — — — — — 76,309 10,163,920 — 140,554,377 — 40,000 4,033 81,287 125,320 — — — — — — 147,364 147,364 — — — — — (4,768 ) — (4,768 ) — — — — — — — 142,596 475,796 — 6,579,656 — 101,650 — — 101,650 — — — — 6,706 — — 6,706 217,137 — — — 9,550 — — 9,550 — — 820,074 — — — — — — — 3,521,258 — 9,672 — — 9,672 — — — — 27,020 — — 27,020 — — — — 32,281 — — 32,281 — — — — 1,442 — — 1,442 (10,856,853 ) — 41,256,025 — — — — — — $ — 192,731,390 $ — $ 228,321 $ (735 ) $ 228,651 $ 456,237 — — — — 397,602 397,602 (4,006 ) (4,006 ) — — — 1,280 — 1,280 — — — — — 394,876 18,541 — — — — — 8,704,477 — 30,435 — — 30,435 — — 20,932 — — 20,932 — — 144,508 — — 144,508 — — — — 258 — — 258 — $ — 201,454,408 $ — $ 424,454 $ (3,461 ) $ 626,253 $ 1,047,246 Ordinary Shares Additional
Paid-in
Capital Treasury Shares Accumulated
Other
Comprehensive
Loss Retained
Earnings Total Equity of MKHL Non-controlling Interest Total Equity Shares Amounts Shares Amounts Balance at March 30, 2013 201,454 $ — $ 424.4 — $ — $ (3.5 ) $ 626.3 $ 1,047.2 $ — $ 1,047.2 Net income — — — — — 661.5 661.5 — 661.5 Other comprehensive loss — — — — — (2.9 ) — (2.9 ) — (2.9 ) Total comprehensive income — — — — — — — 658.6 — 658.6 Issuance of restricted shares 251 — — — — — — — — — Exercise of employee share options 2,586 — 19.0 — — — — 19.0 — 19.0 Equity compensation expense — — 29.1 — — — — 29.1 — 29.1 Tax benefits on exercise of share options — — 54.7 — — — — 54.7 — 54.7 Purchase of treasury shares — — — (30 ) (2.4 ) — — (2.4 ) — (2.4 ) Balance at March 29, 2014 204,291 $ — $ 527.2 (30 ) $ (2.4 ) $ (6.4 ) $ 1,287.8 $ 1,806.2 $ — $ 1,806.2 Net income — — — — — — 881.0 881.0 — 881.0 Other comprehensive loss — — — — — (60.4 ) — (60.4 ) — (60.4 ) Total comprehensive income — — — — — — — 820.6 — 820.6 Issuance of restricted shares 413 — — — — — — — — — Exercise of employee share options 1,783 — 15.3 — — — — 15.3 — 15.3 Equity compensation expense — — 48.9 — — — — 48.9 — 48.9 Tax benefits on exercise of share options — — 45.3 — — — — 45.3 — 45.3 Purchase of treasury shares — — — (6,800 ) (495.3 ) — — (495.3 ) — (495.3 ) Balance at March 28, 2015 206,487 $ — $ 636.7 (6,830 ) $ (497.7 ) $ (66.8 ) $ 2,168.8 $ 2,241.0 $ — $ 2,241.0 Net income — — — — — — 839.1 839.1 (1.4 ) 837.7 Other comprehensive loss — — — — — (14.1 ) — (14.1 ) 0.1 (14.0 ) Total comprehensive income (loss) — — — — — — — 825.0 (1.3 ) 823.7 Fair value of noncontrolling interest in MK Panama — — — — — — — — 5.1 5.1 Forfeitures of restricted awards, net (35 ) — — — — — — — — — Exercise of employee share options 1,632 — 12.7 — — — — 12.7 — 12.7 Equity compensation expense — — 48.4 — — — — 48.4 — 48.4 Tax benefits on exercise of share options — — 21.1 — — — — 21.1 — 21.1 Purchase of treasury shares — — — (24,812 ) (1,152.4 ) — — (1,152.4 ) — (1,152.4 ) Other — — — — — — (0.1 ) (0.1 ) — (0.1 ) Balance at April 2, 2016 208,084 $ — $ 718.9 (31,642 ) $ (1,650.1 ) $ (80.9 ) $ 3,007.8 $ 1,995.7 $ 3.8 $ 1,999.5 thousands)millions) Fiscal Years Ended March 30,
2013 March 31,
2012 April 2,
2011 $ 397,602 $ 147,364 $ 72,506 54,291 37,554 25,543 725 3,292 2,052 — — 1,782 229 — — 1,363 (2,629 ) 1,786 703 498 225 3,245 4,214 3,020 3,222 (7,729 ) 12,443 20,932 27,020 — (144,508 ) (32,281 ) — 258 1,442 — (80,581 ) (48,399 ) (14,071 ) (81,108 ) (71,151 ) (50,465 ) (3,866 ) (12,647 ) (8,990 ) 6 (2,284 ) (664 ) 16,299 14,888 18,043 152,630 46,419 37,405 14,894 9,719 9,693 356,336 115,290 110,308 (121,321 ) (88,187 ) (57,348 ) (3,232 ) — — (6,000 ) — — (8,546 ) — (482 ) (139,099 ) (88,187 ) (57,830 ) (38,954 ) (100,855 ) (225,820 ) 16,280 110,764 194,605 — — (4,380 ) — 9,550 — 30,435 9,672 — 144,508 32,281 — — — (1,850 ) (1,708 ) (2,773 ) (281 ) 150,561 58,639 (37,726 ) (1,641 ) (453 ) 649 366,157 85,289 15,401 106,354 21,065 5,664 $ 472,511 $ 106,354 $ 21,065 $ 484 $ 1,266 $ 1,202 $ 70,500 $ 84,389 $ 27,252 $ 12,289 $ 6,869 $ 3,538 Fiscal Years Ended April 2,
2016 March 28,
2015 March 29,
2014Cash flows from operating activities Net income $ 837.7 $ 881.0 $ 661.5 Adjustments to reconcile net income to net cash provided by operating activities: Depreciation and amortization 183.2 138.4 79.7 Equity compensation expense 48.4 48.9 29.1 Deferred income taxes (1.9 ) 6.2 (29.9 ) Non-cash litigation related costs 1.9 5.7 2.0 Amortization of deferred rent 2.6 5.1 6.3 Loss on disposal of fixed assets 2.8 1.9 3.8 Impairment and write-off of property and equipment 10.9 0.8 1.3 Amortization of deferred financing costs 0.9 0.7 0.7 Tax benefits on exercise of share options (21.1 ) (45.3 ) (54.7 ) Foreign currency (gains) losses 4.8 (1.5 ) 0.1 Gain on acquisition of MK Korea (3.7 ) — — Loss (income) earned on joint venture 1.0 (0.1 ) (0.4 ) Change in assets and liabilities: Receivables, net 52.5 (83.3 ) (104.4 ) Inventories (16.3 ) (112.4 ) (158.2 ) Prepaid expenses and other current assets (5.3 ) (20.1 ) (5.2 ) Other assets (0.4 ) (6.3 ) (4.3 ) Accounts payable 14.2 (8.6 ) 53.7 Accrued expenses and other current liabilities 104.5 36.3 126.5 Other long-term liabilities 11.7 10.5 25.4 Net cash provided by operating activities 1,228.4 857.9 633.0 Cash flows from investing activities Capital expenditures (369.2 ) (356.2 ) (184.7 ) Purchase of intangible assets (11.4 ) (29.2 ) (28.8 ) Investment in joint venture (1.0 ) (3.0 ) — Equity method investments — — (2.0 ) Cash received, net of cash paid for acquired businesses 0.5 — — Net cash used in investing activities (381.1 ) (388.4 ) (215.5 ) Cash flows from financing activities Repurchase of treasury shares (1,152.4 ) (495.3 ) (2.4 ) Tax benefits on exercise of share options 21.1 45.3 54.7 Exercise of employee share options 12.7 15.3 19.0 Repayments of borrowings under revolving credit agreement (199.8 ) — (21.1 ) Borrowings under revolving credit agreement 192.6 — 21.1 Payment of deferred financing costs (2.4 ) — (0.2 ) Other financing activities (0.1 ) — — Net cash (used in) provided by financing activities (1,128.3 ) (434.7 ) 71.1 Effect of exchange rate changes on cash and cash equivalents 4.1 (27.1 ) (4.7 ) Net (decrease) increase in cash and cash equivalents (276.9 ) 7.7 483.9 Beginning of period 978.9 971.2 487.3 End of period $ 702.0 $ 978.9 $ 971.2 Supplemental disclosures of cash flow information Cash paid for interest $ 1.5 $ 0.7 $ 0.7 Cash paid for income taxes $ 273.0 $ 373.3 $ 280.7 Supplemental disclosure of noncash investing and financing activities Accrued capital expenditures $ 33.6 $ 32.9 $ 16.3 “KORS MICHAEL KORS” and various other related trademarks and logos. The Company’s business consists of retail, wholesale and licensing segments. Retail operations consist of collection stores and lifestyle stores, including concessions and outlet stores, located primarily in the UnitedAmericas (United States, Canada and Latin America), Europe and Japan.Asia, as well as e-commerce. Wholesale revenues are principally derived from major department and specialty stores located throughout the United States, CanadaAmericas, Europe and Europe.Asia. The Company licenses its trademarks on products such as fragrances, cosmetics,beauty, eyewear, leather goods, jewelry, watches, coats, footwear, men’s suits, swimwear, furs and ties.For all periods presented, all ordinary share and per share amounts in these consolidated financial statements and the notes hereto have been adjusted retroactively to reflect the effects of a 3.8-to-1 share split, which was completed on November 30, 2011,ties, as well as the effects of the July 2011 reorganization discussed in Note 2 below, as if such reorganization and share split had occurred at the beginning of the periods presented.arehave been prepared in accordance with accounting principles generally accepted in the United States (“U.S. GAAP”) and include the accounts of the Company and its wholly-owned subsidiaries. All significant intercompany accountsbalances and transactions have been eliminated.30, 2013,28, 2015 and March 31, 2012 and April 2, 201129, 2014 (“Fiscal 2013,” “Fiscal 2012”2015” and “Fiscal 2011,”2014”, respectively) consistconsisted of 52 weeks. Reorganization and Initial Public OfferingPrior to July 2011, the Company was owned 85% by SHL-Kors Limited, a BVI corporation, and 15% by Mr. Kors. SHL-Kors Limited was owned 100% by SHL Fashion Limited.In July 2011, the Company underwent a corporate reorganization whereby the Company completed a merger with its former parent, SHL-Kors Limited, which merged with and into the Company, with the Company as the surviving corporation (the “First Merger”). Subsequent to the completion of the First Merger, SHL Fashion Limited, the former parent company of SHL-Kors Limited, merged with and into the Company (the “Second Merger”), with the Company as the surviving corporation. Upon completion of the Second Merger, the previous shareholders of SHL Fashion Limited (which include Sportswear Holdings Limited and the Company’s chief executive officer, John Idol), and Mr. Kors became direct shareholders in the Company. Immediately prior to the Second Merger, the Company issued 475,796 preference shares and 6,579,656 ordinary shares to SHL Fashion Limited in consideration for the extinguishment of the Company’s $101.7 million note payable to SHL Fashion Limited. This exchange was based on the fair value of the Company at the time of exchange. In the Second Merger, Mr. Kors and the shareholders of SHL Fashion Limited received 147,134,033 newly issued ordinary shares and 10,639,716 newly issued convertible preference shares of the Company in proportion to their ownership interests held prior to the Second Merger. The Company considered this transaction to be the acquisition of the non-controlling interest in the Company held by Mr. Kors, and, accordingly, the Company accounted for this transaction as an equity transaction.Following the reorganization, in a private placement in July 2011, a group of investors purchased (i) all 10,639,716 convertible preference shares issued in the reorganization from the previous SHL Fashion Limited shareholders and Mr. Kors for $490 million, and (ii) 217,137 newly issued convertible preference shares from the Company for $10.0 million, of which $9.5 million in proceeds, net of placement fees of $0.5 million, were received by the Company. As a result of the aforementioned transactions, the capital structure of the Company increased from 4,351 issued and outstanding ordinary shares to 147,134,033 issued and outstanding ordinary shares (650,000,000 authorized) and 10,856,853 authorized, issued and outstanding convertible preference shares.In addition to the above, immediately prior to the reorganization, the redemption feature related to the contingently redeemable ordinary shares was eliminated, thereby, resulting in the reclassification of $6.7 million from temporary equity, which was classified as “contingently redeemable ordinary shares” in the Company’s consolidated balance sheets, to permanent equity as additional paid-in capital (see Note 16).On December 20, 2011, the Company completed an initial public offering (“IPO”), which resulted in the sale of 54,280,000 shares at a price of $20 per share, all of which were sold by selling shareholders. The Company did not receive any of the proceeds related to the sale of these shares. On December 20, 2011, in connection with the consummation of the IPO, 10,856,853 convertible preference shares were converted into 41,256,025 ordinary shares at a ratio of 3.8-to-1 resulting in no preference shares issued and outstanding at March 31, 2012.During March 2012, the Company completed a secondary offering of 25,000,000 ordinary shares at a price of $47.00 per share. Subsequent to this offering and in connection with it, the underwriters exercised their additional share purchase option during April 2012, where an additional 3,750,000 shares were offered at $47.00 per share. Similar to the IPO the Company did not receive any of the proceeds related to the sale of these shares and incurred approximately $0.7 million in fees related to the secondary offering which were charged to selling, general and administrative expenses during the fourth quarter of Fiscal 2012. As a result of the secondary offering, Sportswear Holdings Limited ownership decreased to 25.0% of the Company’s ordinary shares whereby the Company ceased to be a “controlled company” under New York Stock Exchange listing rules.During September 2012, the Company completed a secondary offering of 23,000,000 ordinary shares at a price of $53.00 per share. Subsequent to this offering, and in connection with it, the underwriters exercised their additional share purchase option during October 2012, where an additional 3,450,000 shares were offered at $53.00 per share. Similar to the prior public offerings the Company did not receive any of the proceeds related to the sale of these shares and incurred approximately $0.9 million in fees related to the secondary offering, which were charged to selling, general and administrative expenses.During February 2013, the Company completed a secondary offering of 25,000,000 ordinary shares at a price of $61.50 per share. Similar to the prior public offerings the Company did not receive any of the proceeds related to the sale of these shares and incurred approximately $0.8 million in fees related to the secondary offering, which were charged to selling, general and administrative expenses.3. Summary of Significant Accounting Policiesaccounting principles generally accepted in the United StatesU.S. GAAP requires management to use judgment and make estimates that affect the reported amounts of assets and liabilities and disclosure of contingent assets and liabilities at the date of the financial statements and the reported amounts of revenues and expenses during the reporting period. The level of uncertainty in estimates and assumptions increases with the length of time until the underlying transactions are completed. The most significant assumptions and estimates involved in preparing the financial statements include allowances for customer deductions, sales returns, sales discounts and doubtful accounts, estimates of inventory recovery, the valuation of share-based compensation, valuation of deferred taxes and the estimated useful lives used for amortization and depreciation of intangible assets and property and equipment. Actual results could differ from those estimates.isare transferred to theand operational chargebacks, as well as forand certain cooperative selling expenses.March 30, 2013, March 31, 2012, and April 2, 20112016, March 28, 2015, and March 29, 2014 (in thousands)millions): Balance
Beginning
of Year Amounts
Charged to
Revenue Write-offs
Against
Reserves Balance
at
Year End $ 1,659 $ 35,448 $ (33,961 ) $ 3,146 $ 2,313 $ 23,580 $ (24,234 ) $ 1,659 $ 1,413 $ 14,323 $ (13,423 ) $ 2,313 Balance
Beginning
of Year Amounts
Charged to
Revenue Write-offs
Against
Reserves Balance
at
Year End $ 30,381 $ 135,450 $ (122,822 ) $ 43,009 $ 25,180 $ 114,577 $ (109,376 ) $ 30,381 $ 20,215 $ 84,697 $ (79,732 ) $ 25,180 Retail Return Reserves: Fiscal year ended April 2, 2016 $ 2.5 $ 71.7 $ (69.5 ) $ 4.7 Fiscal year ended March 28, 2015 2.3 57.0 (56.8 ) 2.5 Fiscal year ended March 29, 2014 3.2 45.6 (46.5 ) 2.3 Wholesale Total Sales Reserves: Fiscal year ended April 2, 2016 $ 87.5 $ 348.4 $ (325.0 ) $ 110.9 Fiscal year ended March 28, 2015 65.9 281.0 (259.4 ) 87.5 Fiscal year ended March 29, 2014 43.0 203.5 (180.6 ) 65.9 geographic specificgeography-specific licensing agreements is recognized as it is earned under the licensing agreements based on reported sales of licensees applicable to specified periods, as outlined in the agreements. These agreements allow for the use of the Company’s tradenames to sell its branded products in specific geographic regions.charged to expenseexpensed when incurred and are reflected in general and administrative expenses. For the years ended March 30, 2013, March 31, 2012,Advertising and April 2, 2011, advertisingmarketing expense was $41.9$103.9 million, $31.4$103.6 million and $27.4$65.7 million in Fiscal 2016, Fiscal 2015 and Fiscal 2014, respectively.2013,2016, Fiscal 2012,2015 and Fiscal 2011,2014, were $5.1$7.4 million, $4.3$8.0 million and $3.9$7.3 million, respectively.amounting to $29.1were $98.6 million, $19.7$92.6 million and $12.4$78.6 million for Fiscal 2013,2016, Fiscal 2012,2015 and Fiscal 2011,2014, respectively, and are included in selling, general and administrative expenses in the consolidated statements of operations.first-in-first-out (FIFO)weighted-average cost method. Costs include amounts paid to independent manufacturers, plus duties and freight to bring the goods to the Company’s warehouses, which are located in the United States, Holland, Canada, Japan, Hong Kong and Hong Kong.South Korea. The Company adjustscontinuously evaluates the composition of its inventory to reflect situations in whichand makes adjustments when the cost of inventory is not expected to be fully recovered. These adjustmentsrecoverable. The net realizable value of the Company’s inventory is estimated based on historical experience, current and forecasted demand, and market conditions. In addition, reserves for inventory loss are estimated based on historical experience and physical inventory counts. The Company’s inventory reserves are estimates, which could vary significantly from actual results if future economic conditions, customer demand or competition differ from expectations. ForOur historical estimates of these adjustments have not differed materially from actual results.periods presented, there were no significant adjustments related to unsalable inventory.providedrecorded on a straight-line basis over the expected remaining useful lives of the related assets. Equipment, furniture and fixtures, andare depreciated over five to seven years, computer hardware and software are depreciated over three to five years and in-store shops are amortized over three to four years. Leasehold improvements are amortized using the straight-line method over the shorter of the estimated remaining useful lives of the related assets or the remaining lease term.years.Maintenance and repairs are charged to expense in the year incurred. Cost and related accumulated depreciation for property and equipment are removed from the accounts upon their sale or disposition and the resulting gain or loss is reflected in the results of operations.Internal-use SoftwareIntangibleand lease rights and customer relationships and are stated at cost less accumulated amortization. Trademarks are amortized over twenty years, customer relationships are amortized over five years to ten years, and lease rights are amortized over the termterms of the related lease agreements, including highly probable renewal periods, on a straight-line basis. with finite useful lives, for impairment whenever events or changes in circumstances indicate that the carrying amount of any such asset may not be recoverable. The Company’s impairment testing is based on its best estimate of its future operating cash flows. If the sum of estimated undiscounted future cash flows associated with the asset is less than the asset’s carrying value, an impairment charge is recognized, which is measured as the amount by which the carrying value exceeds the fair value of the asset. These estimates of cash flow require significant management judgment and certain assumptions about future volume, sales and expense growth rates, devaluation and inflation. As such, these estimates may differ from actual cash flows. and Other Intangible AssetsOn the Company evaluates goodwill for impairment during the Company’s fourth quarter of its fiscal year or whenever impairment indicators exist. In the absence of any impairment indicators, goodwill is assessed during the fourth quarter of each fiscal year. Judgments regarding the existence of impairment indicators are based on market conditions and operational performance of the business. Future events could cause theto conclude that impairment indicators exist, and, therefore, that goodwill may be impaired. To the extent that the fair value associated with the goodwill is less thanassess its carrying amount, the Company writes down the carrying amount of the goodwill to its fair value.Prior to Fiscal 2012 the Company assessed goodwill for impairment by calculating the fair value of the Company’s reporting units to which goodwill has been allocatedinitially using the discounted cash flow method along with the market multiples method. During Fiscal 2012, the Company adopted a new accounting pronouncement related to goodwill impairment analysis, which allows entities to initially perform a qualitative analysisapproach (“step zero”) of the fair value of its reporting units to determine whether it is necessary to undertake a quantitative (“two step”) goodwill analysis. In the fourth quarter of Fiscal 2013, the Company continued to follow this guidance with respect to its annual impairment analysis for goodwill, and concludedmore likely than not that the fair value of goodwill is greater than its carrying amounts of all reporting units were significantly exceeded by their respective fair values, and thus performing any further analysis (e.g. two step) was unnecessary.The Company will continue to perform the aforementioned qualitative analysis (step zero) in future fiscal years as its first step in goodwill impairment assessment. Shouldvalue. If the results of thisthe qualitative assessment result in either an ambiguous or unfavorable conclusion the Company will perform additional quantitative testing consistent withindicate that it is not more likely than not that the fair value approach mentioned above.of goodwill exceeds its carrying value, a quantitative goodwill analysis would be performed to determine if impairment is required. The Company may also elect to perform a quantitative analysis of goodwill initially rather than using a qualitative approach. The valuation methods used in the quantitative fair value approach,assessment, discounted cash flow and market multiples method, require the Company’s management to make certain assumptions and estimates regarding certain industry trends and future profitability of the Company’s reporting units. If the carrying amount of a reporting unit exceeds its fair value, the Company would compare the implied fair value of the reporting unit goodwill withto its carrying value. To compute the implied fair value, the Company would assign the fair value of the reporting unit to all of the assets and liabilities of that unit (including any unrecognized intangible assets) as if the reporting unit had been acquired in a business combination. The excess of the fair value of a reporting unit over the amounts assigned to its assets and liabilities is the implied fair value of goodwill. If the carrying value of the reporting unit goodwill exceeded the implied fair value of the reporting unit goodwill, the Company would record an impairment loss to write down such goodwill to its implied fair value. The valuation of goodwill is affected by, among other things, the Company’s business plan for the future and estimated results of future operations.Joint Venture InvestmentsThe Company accounts for investments in joint ventures as equity investments and records them in other assets in the Company’s consolidated balance sheets. During February 2013, Future events could cause the Company made a non-recourse loanto conclude that impairment indicators exist, and, therefore, that goodwill may be impaired.Company’s sole joint venture, for approximately $6.0 million, which accrues at a 5%Company's annual rate. The purposeimpairment analysis performed during the fourth quarter of this loan was to provide working capital for the joint venture’s operations. The loan is repayable at the time of the expiration of the joint venture agreement, along with accrued interest payable at the expiration date. The loan, along with accrued interest, is recorded in other assets in the Company’s consolidated balance sheets.Awards are measured at theThe grant date based on the fair value asof share options is calculated using the Black-Scholes option pricing model, for share options, or themodel. The closing market price at the grant date.date is used to determine the grant date fair value of restricted shares, restricted shares units (RSUs) and performance RSUs. These fair values are recognized as expense over the requisite service period, net of estimated forfeitures, based on expected attainment of certainpre-established performance goals for performance grants, or the passage of time for those grants which have only time-based vesting requirements, which included the Company’s completion of an initial public offering (“IPO”). Determining the fair value of share-based awards at the grant date requires considerable judgment, including estimating expected volatility, expected term and risk-free rate.past 4.5-9.5 years, which is the Company’s range of estimated expected holding periods. The expected holding period for performance-based options which vest based on performance requirements areis based on the period to expiration, which is generally 9-10 years, which directly correlates to the Company’s service period requirement for such options. Generally, theThe expected holding period for time-based vesting options (no performance requirements) areis calculated using the simplified method, which uses the vesting term of the options, generally 4 years, and the contractual term of 7 years, resulting in a holding period of 4.5-4.75 years. The simplified method was chosen as a means to determine the Company���sCompany’s estimated holding period, as prior to December 2011, the Company was privately held and, as such, there is insufficient historical option exercise experience. The risk-free interest rate is derived from the zero-coupon U.S. Treasury Strips yield curve the period of which relates tobased on the grant’s estimated holding period. Determining the grant date fair value of share-based awards requires considerable judgment, including estimating expected volatility, expected term and risk-free rate. If factors change and the Company employs different assumptions, the fair value of future awards and the resulting share-based compensation expense may differ significantly from what the Company has estimated in the past.dollarDollar (“USD”) for MKHL and its United States based subsidiaries. Assets and liabilities have beenare translated using period-end exchange rates, andwhile revenues and expenses have beenare translated using average exchange rates over the reporting period. The resulting translation adjustments resulting from translation have beenare recorded separately in shareholders’ equity as a component of accumulated other comprehensive loss.income (loss). Foreign currency transaction income and losses resulting from the re-measuring of transactions denominated in a currency other than the functional currency of a particular entity are included in foreign currency loss on the Company’s consolidated statements of operations. of its transactions. The Company in its normal course of business enters into transactions with foreign suppliers and seeks to minimize risks related to these transactions. The Company employs these forward currency contracts to hedge the Company’s cash flows, as they relate to foreign currency transactions, of which certaintransactions. Certain of these contracts are designated as hedges for accounting purposes, while others are undesignated hedges for hedge accounting purposes. Theseremain undesignated. All of the Company’s derivative instruments are recorded in the Company’s consolidated balance sheets at fair value on a gross basis, regardless of if they are designated or undesignated as hedges.Prior to the Company’s third fiscal 2013 quarter ended December 29, 2012, thetheir hedge designation.did not designate these instruments as hedges for hedge accounting purposes. During the third Fiscal 2013 quarter, the Company elected to designate contracts entered into during and subsequent to that quarter as hedges for hedge accounting purposes, fordesignates certain contracts related to the purchase of inventory. Accordingly,inventory that qualify for hedge accounting as cash flow hedges. Formal hedge documentation is prepared for all derivative instruments designated as hedges, including description of the hedged item and the hedging instrument, the risk being hedged, and the manner in which hedge effectiveness will be assessed prospectively and retrospectively. The effective portion of changes in the fair value for contracts entered into subsequent to the fiscal quarter ended September 29, 2012, aredesignated as cash flow hedges is recorded in equity as a component of accumulated other comprehensive loss, andincome (loss) until the hedged item effects earnings. When the inventory related to forecasted inventory purchases that are being hedged is sold to a third party, the gains or losses deferred in accumulated other comprehensive income (loss) are recognized within cost of sales forgoods sold. The Company uses regression analysis to assess effectiveness of derivative instruments that are designated as hedges, which compares the change in the fair value of the derivative instrument to the change in the related hedged item. Effectiveness is assessed on a quarterly basis and any portion of thosethe designated hedge contracts deemed ineffective. The Company will continueineffective is recorded to recordforeign currency gain (loss). If the hedge is no longer expected to be highly effective in the future, future changes in the fair value of hedge designated contractsare recognized in this manner until their maturity, where the unrealized gain or loss will be recognized into earnings in that period.earnings. For those contracts entered into prior to the third fiscal 2013 quarter, as well as those that willare not be designated as hedges, in future periods, changes in the fair value as of each balance sheet date and upon maturity, are recorded to foreign currency gain (loss) in cost of sales or operating expenses, within the Company’s consolidated statements of operations, as applicableoperations. The Company classifies cash flows relating to its derivative instruments consistently with the transactions for whichclassification of the forward exchange contracts were intended to hedge. During Fiscal 2013, a net realized gain of $1.4 million was recorded as a component of cost of sales, and related to the change in fair value of those contracts entered into prior to adoption hedge accounting in the third fiscal 2013 quarter, as well asthose contacts entered into subsequent to the adoption of hedge accounting which were not designated as hedges. Also included, in the net realized gain was the ineffective portion of those contracts designated as hedges during the year. In addition, the net unrealized gain related to those contracts designated as hedges during Fiscal 2013 of $1.3 million, was charged to equity as a component of accumulated other comprehensive loss. The company expects that substantially all this amount will be reclassified into earnings during the next twelve months, based upon the timing of inventory purchases and turns. These amounts are subject to fluctuations in the applicable currency exchange rates.The following table details the fair value of these contracts as of March 30, 2013, and March 31, 2012 (in thousands): March 30,
2013 March 31,
2012 $ 1,367 $ 1,318 $ (71 ) $ (276 ) attemptsorder to mitigate counterparty credit risk, the Company only enters into contracts with carefully selected financial institutions based upon their credit ratings and certain other financial factors, adhering to established limits for credit exposure. The aforementioned forward contracts generally have a term of no more than 1812 months. The period of these contracts is directly related to the foreign transaction they are intended to hedge. The notional amount of these contracts outstanding at March 30, 2013 was approximately $78.2 million., on a straight-line basis over the lease term. Accordingly,The difference between straight-line rent expense charged to operations differs fromand rent paid resulting in the Company recordingis recorded as deferred rent, which is classified as awithin short-term and long-term liabilityliabilities in the Company’s consolidated balance sheets. The recognition of rent expense for a given operating lease commences on the earlier of the lease commencement date or the date of possession of the property. The Company accounts for landlord allowances and incentives as a component of deferred rent, which is amortized over the lease term as a reduction of rent expense. The Company records rent expense as a component of selling, general and administrative expenses.March 30, 2013,April 2, 2016, deferred financing costs were $3.4$3.9 million, net of accumulated amortization of $2.0 million, and as$0.4 million. As of March 31, 2012,28, 2015 deferred financing costs were $2.4$2.1 million, net of accumulated amortization of $1.3$3.6 million. Deferred financing costs are included in other assets on the consolidated balance sheets.Perper ShareCompany reported earnings per share in conformity with the two-class method for calculating and presenting earnings per share for fiscal years prior to Fiscal 2013, due to the existence of both ordinary and convertible preference securities in those periods. Under the two-class method,Company’s basic net income per ordinary share is computedcalculated by dividing the net income available to ordinary shareholders by the weighted-average number of ordinary shares outstanding during the period. Net income available to shareholders is determined by allocating undistributed earnings between holders of ordinary and convertible preference shares, based on the participation rights of the preference shares. Diluted net income per share is computed by dividing the net income available to both ordinary and preference shareholders by the weighted-average number of dilutive shares outstanding during the period.The Company’s basic net income per share excludes the dilutive effect of share options and unvested restricted shares. It is based upon the weighted average number of ordinary shares outstanding during the period divided into net income.equity instruments, including restricted shares and units (“RSUs”), were exercised or converted into ordinary shares. These equity instrumentspotentially dilutive securities are included as potential dilutive securitiesin diluted shares to the extent they are dilutive under the treasury stock method for the applicable periods.For Performance-based RSUs are included in diluted shares if the purposes of basic and diluted net income per share,related performance conditions are considered satisfied as a result of the reorganization and exchange during July 2011, weighted average shares outstanding for purposes of presenting net income per share on a comparative basis were retroactively restated for all periods presented to reflect the exchange of ordinary shares for the newly issued ordinary and convertible preference shares as described in Note 2, as if such reorganization and exchange had occurred at the beginningend of the periods presented. In addition, as a result ofreporting period and to the 3.8-to-1 share split, which was completed on November 30, 2011, weighted average shares outstanding were retroactively restated for all periods presented.thousandsmillions, except share and per share data): Fiscal Years Ended March 30,
2013 March 31,
2012 April 2,
2011 $ 397,602 $ 147,364 $ 72,506 — 21,227 15,629 $ 397,602 $ 126,137 $ 56,877 196,615,054 158,258,126 140,554,377 4,925,090 2,628,650 — — 28,412,421 38,622,891 201,540,144 189,299,197 179,177,268 $ 2.02 $ 0.80 $ 0.40 $ 1.97 $ 0.78 $ 0.40 Fiscal Years Ended April 2,
2016 March 28,
2015 March 29,
2014Numerator: Net income attributable to MKHL $ 839.1 $ 881.0 $ 661.5 Denominator: Basic weighted average shares 186,293,295 202,680,572 202,582,945 Weighted average dilutive share equivalents: Share options and restricted shares/units, and performance restricted share units 2,760,994 3,185,197 3,055,162 Diluted weighted average shares 189,054,289 205,865,769 205,638,107 Basic net income per share $ 4.50 $ 4.35 $ 3.27 Diluted net income per share $ 4.44 $ 4.28 $ 3.22 7,3412,255,271 shares, 699,321 shares and 44,256 shares, for the fiscal year endedyears ending April 2, 2016, March 30, 2013,28, 2015 and March 29, 2014, respectively, have been excluded from the above calculation due to their anti-dilutive effect. Share equivalents for 343,787 forfiscal year endedFASB issued ASU No. 2015-17, "Income Taxes (Topic 740): Balance Sheet Classification of Deferred Taxes," which eliminated the prior requirement to present deferred tax assets and liabilities as current and noncurrent in a classified balance sheet. ASU 2015-17 will require all deferred tax assets and liabilities to be classified as noncurrent. ASU 2015-17 is effective beginning with the Company's Fiscal 2018, with earlier application permitted. The Company elected to early adopt ASU 2015-17 during the third quarter of Fiscal 2016 on a retrospective basis. As of March 31, 2012, have been excluded from the above calculation28, 2015, previously recorded current deferred tax assets and liabilities of $27.7 million and $3.7 million, respectively, were subject to reclassification to noncurrent. The Company's balance sheet as of March 28, 2015 also reflects a $7.3 million reclassification between total deferred tax assets and deferred tax liabilities due to their anti-dilutive effect. Share options for the fiscal year ended April 2, 2011 have been excluded from the calculation of diluted earnings per share as they werefact that jurisdictional netting is not exercisable during those periods, as the Company had not completed an IPO.Recentimpacted by ASU 2015-17.—flows, basedflows.information.requirement to value inventory at the lower of cost or market. Net realizable value is defined as the estimated selling price in the ordinary course of business, less reasonably predictable costs of completion, disposal and transportation. ASU 2015-11 is effective beginning with the Company's fiscal year 2018 and should be applied prospectively, with earlier application permitted. The Company does not expect that ASU No. 2015-11 will have a material impact on its financial statements. January 1, 2016 Inventory $ 3.0 Fixed assets 2.1 Customer relationship intangible assets 2.2 Fair value of assets acquired 7.3 Less: consideration paid 3.6 Gain on acquisition of MK Korea $ 3.7 June 28, 2015 Current assets $ 25.9 Fixed assets 6.4 Customer relationship intangible assets 2.0 Goodwill 9.2 Debt obligations (9.5 ) Other liabilities (2.3 ) Total fair value of net assets of MK Panama 31.7 Fair value of preexisting interest in MK Panama 8.1 Non-controlling interest 5.1 Fair value of consideration provided $ 18.5 thousands)millions): March 30,
2013 March 31,
2012 $ 199,677 $ 125,219 45,588 28,021 7,344 6,026 252,609 159,266 (46,155 ) (32,040 ) $ 206,454 $ 127,226 The Company has historically assigned a substantial portion of its trade receivables to factors in the United States and Europe whereby the factors assumed credit risk with respect to such receivables assigned. Under the factor agreements, factors bear the risk of loss from the financial inability of the customer to pay the trade receivable when due, up to such amounts as accepted by the factor; but not the risk of non-payment of such trade receivable for any other reason. Beginning in July 2012, the Company assumed responsibility for a large portion of previously factored accounts receivable balances the majority of which were insured at December 29, 2012. The Company provides an allowance for such non-payment risk at the time of sale, which is recorded as an offset to revenue. April 2,
2016 March 28,
2015Trade receivables: Credit risk assumed by insured/factors $ 353.7 $ 374.1 Credit risk retained by Company 61.8 67.5 Receivables due from licensees 9.5 11.8 425.0 453.4 Less allowances: (117.1 ) (90.0 ) $ 307.9 $ 363.4 retailwholesale customers' sales performance, seasonal negotiations with customers, historical deduction trends and an evaluation of current market conditions. Operational chargebacks are based on deductions taken by customers, net of expected recoveries. Such provisions, and related recoveries, are reflected in net sales.underby insurance, and assessments of collectability based on an evaluation of historic and anticipated trends, the financial conditions of the Company’s customers and the impact of general economic conditions. The past due status of a receivable is based on its contractual terms. Amounts deemed uncollectible are written off against the allowance when it is probable the amounts will not be recovered. AllowancesAllowance for doubtful accounts were $1.1was $0.7 million as of April 2, 2016 and $0.4 million, at the end of Fiscal 2013 and Fiscal 2012, respectively.With respect to certain of its receivables, theThe Company also mitigates its credit risk through the assignment of receivables to a factor, as well asby obtaining insurance coverage for a substantial portion of non-factoredits receivables (as demonstrated in the above table in “Credit risk assumed by insured/factors”). For the fiscal years ended March 30, 2013, March 31, 2012, and April 2, 2011,2016, March 28, 2015 and March 29, 2014, net sales related to oneour largest wholesale customer, within the Company’s wholesale segment,Macy's, accounted for approximately 14%12.7%, 13%,13.7% and 14%14.4%, respectively, of total revenue. The accounts receivable related to this customer were fullyeither factored or substantially insured for all three fiscal years.March 30, 2013, March 31, 2012 and April 2, 2011,2016, March 28, 2015 and March 29, 2014, one agent sourced approximately 14.0%14.9%, 17.0%,11.7% and 19.5%12.6%, respectively, and one contractor accounted for approximately 31.8%26.7%, 31.0%,29.1% and 30.5%30.4%, respectively, of the Company’s finished goods purchases.thousands)millions): March 30,
2013 March 31,
2012 $ 76,336 $ 58,009 13,276 10,871 29,429 20,280 78,809 48,058 168,306 137,771 366,156 274,989 (165,340 ) (117,487 ) 200,816 157,502 41,297 13,253 $ 242,113 $ 170,755 April 2,
2016 March 28,
2015Leasehold improvements $ 414.6 $ 294.2 In-store shops 242.9 189.3 Furniture and fixtures 212.7 160.2 Computer equipment and software 167.9 104.4 Equipment 79.1 73.6 Land 15.1 — 1,132.3 821.7 Less: accumulated depreciation and amortization (490.9 ) (337.8 ) 641.4 483.9 Construction-in-progress 116.8 79.0 $ 758.2 $ 562.9 March 30, 2013, March 31, 2012, and April 2, 2011,2016, March 28, 2015, and March 29, 2014, was $52.7$172.2 million, $36.0$131.4 million, and $23.6$76.6 million, respectively. During Fiscal 2013, Fiscal 2012the fiscal years ended April 2, 2016, March 28, 2015, and Fiscal 2011,March 29, 2014, the Company recorded fixed asset impairment charges of $0.7$10.9 million, $3.3$0.8 million and $2.1$1.3 million, respectively,respectively. Approximately $8.6 million of the Company's Fiscal 2016 impairment charges primarily related to certainseven retail locations still in operation. The impairmentsoperation, $0.4 million related to one storeits wholesale operations and $1.9 million related to a corporate fixed asset that is no longer in service. Fiscal 2013, and2015 impairment charges related to two stores in both Fiscal 2012retail locations and Fiscal 2011.disclosesdetails the carrying values of the Company's intangible assets and goodwillthat are subject to amortization (in thousands)millions): March 30, 2013 March 31, 2012 Gross
Carrying
Amount Accumulated
Amortization Net Gross
Carrying
Amount Accumulated
Amortization Net $ 23,000 $ 11,693 $ 11,307 $ 23,000 $ 10,545 $ 12,455 12,433 2,760 9,673 3,838 2,147 1,691 14,005 — 14,005 14,005 — 14,005 $ 49,438 $ 14,453 $ 34,985 $ 40,843 $ 12,692 $ 28,151 April 2, 2016 March 28, 2015 Net Net Trademarks $ 23.0 $ 15.1 $ 7.9 $ 23.0 $ 14.0 $ 9.0 Lease Rights 73.3 17.8 55.5 61.1 8.6 52.5 Customer Relationships 4.2 0.2 4.0 — — — $ 100.5 $ 33.1 $ 67.4 $ 84.1 $ 22.6 $ 61.5 lease.lease, including highly probable renewal periods. Amortization expense was $1.5$11.0 million, $1.5$7.0 million and $1.9$3.1 million, respectively, for each of the fiscal years ended March 30, 2013, March 31, 2012, and April 2, 2011.Goodwill2016, March 28, 2015 and March 29, 2014.Fiscal 2017 $ 8.7 Fiscal 2018 8.7 Fiscal 2019 8.6 Fiscal 2020 8.6 Fiscal 2021 8.4 Thereafter 24.4 $ 67.4 Retail Wholesale Licensing Total Balance at March 28, 2015 $ — $ 12.1 $ 1.9 $ 14.0 Acquisition of controlling interest in MK Panama (Note 3) 8.0 1.2 — 9.2 Balance at April 2, 2016 $ 8.0 $ 13.3 $ 1.9 $ 23.2 amortizedsubject to amortization but is evaluated annually for impairment annually in the last quarter orof each fiscal year, or whenever impairment indicators exist. The Company evaluated goodwill during the fourth fiscal quarter of Fiscal 2013,2016, and determined that there was no impairment.impairment (See Note 11 for additional information). As of March 30, 2013,April 2, 2016, cumulative impairment related to goodwill totaled $5.4 million. There were no charges related to the impairment of goodwill in any of the periods presented.Estimated amortization expense for eachnext five years is as followsfollowing (in thousands)millions): $ 2,187 2,240 2,234 2,234 2,187 9,898 $ 20,980 As a result of impairment charges recognized in Fiscal 2011 related to certain retail stores, as described in Note 6, the Company recognized impairment charges of $1.8 million for lease rights related to those stores. There were no impairments to lease rights related to the stores which were impaired during Fiscal 2013 and Fiscal 2012.8. Accrued Expenses and Other Current Liabilities April 2,
2016 March 28,
2015Prepaid taxes $ 57.8 $ 60.8 Prepaid rent 27.3 16.8 Leasehold incentive receivable 8.9 12.3 Unrealized gains on forward foreign exchange contracts 0.1 25.0 Other 19.0 12.6 $ 113.1 $ 127.5 thousands)millions): March 30,
2013 March 31,
2012 $ 4,041 $ 2,545 1,094 9,881 5,040 3,750 7,635 4,636 334 276 3,013 2,038 12,398 9,971 $ 33,555 $ 33,097 April 2,
2016 March 28,
2015Accrued capital expenditures $ 33.6 $ 32.9 Advance royalties 30.2 5.1 Other taxes payable 38.2 20.2 Accrued rent 30.5 27.1 Gift cards and retail store credits 13.1 8.2 Professional services 7.0 7.3 Unrealized loss on forward foreign exchange contracts 5.5 0.6 Accrued advertising 5.2 5.7 Accrued litigation 1.8 6.2 Other 27.7 10.5 $ 192.8 $ 123.8 Credit FacilitiesSecuredDebt ObligationsThehad aentered into an amended and restated senior unsecured revolving credit facility ("2015 Credit Facility") with, a maturity date of September 15, 2015,among others, JPMorgan Chase Bank, N.A. ("JPMorgan Chase"), as administrative agent, which it terminated during Februaryreplaced its prior 2013 (the “2011senior unsecured revolving credit facility ("2013 Credit Facility”Facility"). The 2011Company and a U.S., Canadian, Dutch and Swiss subsidiary are the borrowers under the 2015 Credit Facility. The borrowers and certain material subsidiaries of the Company provide unsecured guarantees of the 2015 Credit Facility. The 2015 Credit Facility was originally entered into during Fiscal 2007provides for up to $1.0 billion in borrowings, which may be denominated in U.S. Dollars and was amended on September 15, 2011. Pursuant to such amendment, theother currencies, including Euros, Canadian Dollars, Pounds Sterling, Japanese Yen and Swiss Francs. The 2015 Credit Facility provided up to $100.0 millionalso provides for the issuance of borrowings, and was originally set to expire on September 15, 2015. The agreement also provided for loans and letters of credit to our European subsidiaries of up to $35.0$75.0 million and swing line loans of up to $50.0 million. All other terms and conditionsThe Company has the ability to expand its borrowing availability under the 20112015 Credit Facility remained consistent withby up to an additional $500.0 million, subject to the original agreement.agreement of the participating lenders and certain other customary conditions. The 20112015 Credit Facility provided for aggregate credit available equal to the lesser of (i) $100.0 million, or (ii) the sum of specified percentages of eligible receivables and eligible inventory, as defined, plus $30.0 million. The terms of the 2011 Credit Facility required all amounts outstanding under the agreement to be collateralized by substantially all of our assets throughout the duration of the agreement. The 2011 Credit Facility contained financial covenants which limited our capital expenditures to $110.0 million for any one fiscal year plus additional amounts as permitted, and a minimum fixed charge coverage ratio of 2.0 to 1.0 (with the ratio being EBITDA plus consolidated rent expense to the sum of fixed charges plus consolidated rent expense), restricted and limited additional indebtedness, and restricted the incurrence of additional liens and cash dividends. During Fiscal 2013, and prior to its termination, the Company was in compliance with all of the covenants covered under the agreement.20112015 Credit Facility accruedbear interest, at the Company's option, at (i) for loans denominated in U.S. Dollars, an alternative base rate, per annumwhich is the greater of the prime rate publicly announced from time to time by JPMorgan Chase, the agentgreater of 1.25% above the prevailingfederal funds effective rate or Federal Reserve Bank of New York overnight bank funding rate plus 50 basis points or the one-month London Interbank Offered Rate adjusted for statutory reserve requirements for Eurocurrency liabilities ("Adjusted LIBOR") plus 100 basis points, in each case, plus an applicable margin based on the Company's leverage ratio; (ii) Adjusted LIBOR for the applicable interest period, plus an applicable margin based on the Company's leverage ratio; (iii) for Canadian borrowings, the Canadian prime rate, which is the greater of the PRIMCAN Index rate or at a per annumthe rate equalapplicable to 2.25% aboveone-month Canadian Dollar banker's acceptances quoted on Reuters ("CDOR") plus 100 basis points, plus an applicable margin based on the prevailing LIBOR rate. The weightedCompany's leverage ratio; or (iv) for Canadian borrowings, the average interestCDOR rate for the revolving credit facility was 2.72% during Fiscal 2013. applicable interest period, plus an applicable margin based on the Company's leverage ratio. required an annual facility fee of $0.1 million, and an annual commitment fee of 0.35% on the unused portion of the available credit under the Credit Facility, which was payable quarterly.At March 30, 2013 there were no amounts outstanding or available related to this agreement. The largest amount borrowed from the 2011 Credit Facility during Fiscal 2013 was $31.7 million.Senior Unsecured Revolving Credit FacilityOn February 8, 2013, the Company terminated the provisions of its existing 2011 Credit Facility and entered into a senior unsecured credit facility (“2013 Credit Facility”). Pursuant to the agreement the 2013 Credit Facility provides up to $200.0 million of borrowings, and expires on February 15, 2018. The agreement also provides for loansan annual administration fee and lettersa commitment fee equal to 0.10% to 0.175% per annum, based on the Company's leverage ratio, applied to the average daily unused amount of credit to our European subsidiaries of up to $100.0 million. The 2013the facility. Loans under the 2015 Credit Facility contains financial covenants such as requiring an adjustedmay be prepaid and commitments may be terminated or reduced by the borrowers without premium or penalty other than customary "breakage" costs with respect to loans bearing interest based upon Adjusted LIBOR or the CDOR rate.1.0 (with1. Such leverage ratio is calculated as the ratio beingof the sum of total consolidated indebtedness as of the date of the measurement plus 8.06.0 times the consolidated rent expense for the last four consecutive fiscal quarters, to EBITDAConsolidated EBITDAR for the last four consecutive fiscal quarters. Consolidated EBITDAR is defined as consolidated net income plus consolidated rent expense)income tax expense, net interest expense, depreciation and a fixed charge coverage ratio of 2.0 to 1.0 (with the ratio being EBITDA plusamortization expense, consolidated rent expense and other non-cash charges, subject to the sum of fixed charges plus consolidated rent expense), restricts and limitscertain deductions. The 2015 Credit Facility also includes covenants that limit additional indebtedness, guarantees, liens, acquisitions and restricts the incurrence of additional liensother investments and cash dividends.dividends that are customary for financings of this type. As of March 30, 2013,April 2, 2016, the Company was in compliance with all covenants related to this agreement.Borrowings20132015 Credit Facility accrue interest atwould be entitled to take various actions, including terminating the rate per annum announced from time to time by the agent a rate based on the rates applicable for deposits in the London interbank market for U.S. Dollars or the applicable currency in which the loans are made (the “Adjusted LIBOR”) plus an applicable margin. The applicable margin may range from 1.25% to 2.5%,commitments and is based, or dependent upon, a particular threshold related to the adjusted leverage ratio calculated during the period of borrowing. The 2013 Credit Facility requires an annual facility fee of $0.1 million, and an annual commitment fee of 0.25% to 0.35% on the unused portion of the available credit under the facility.As of March 30, 2013, there were noaccelerating amounts outstanding under the 2015 Credit Facility.Facility, andFacility. At April 2, 2016, stand-by letters of credit of $10.0 million were outstanding under the 2015 Credit Facility. At April 2, 2016, the amount available for future borrowings was $188.7$990.0 million. There were no amounts borrowed during2013, which were related to this agreement. At March 30, 2013, there were documentary letters2016, the Company obtained controlling interest in MK Panama and began consolidating its financial results into its operations (see Note 3 for additional information). MK Panama's debt obligations included on the Company's consolidated balance sheet as of credit outstanding of approximately $2.0 million, and stand-by letters of credit of $9.3 million. April 2,
20164.75% loan, due April 6, 2020 from Banco General de Panama $ 1.2 5.0% loan (see Note 19) 1.0 Other 0.1 Total long-term debt $ 2.3 April 2026.August 2033. In addition to minimum rental payments, the leases require payment of increases in real estate taxes and other expenses incidental to the use of the property.for the fiscal years then ended consistconsists of the following (in thousands)millions): March 30,
2013 March 31,
2012 April 2,
2011 $ 74,708 $ 61,364 $ 43,875 29,871 11,209 3,049 $ 104,579 $ 72,573 $ 46,924 Fiscal Years Ended April 2,
2016 March 28,
2015 March 29,
2014Minimum rentals $ 193.5 $ 151.0 $ 107.1 Contingent rent 64.4 65.8 56.3 Total rent expense $ 257.9 $ 216.8 $ 163.4 thousands)millions): $ 82,869 84,534 81,384 79,802 77,263 282,706 $ 688,558 Fiscal years ending: 2017 $ 220.7 2018 223.4 2019 215.1 2020 213.1 2021 206.9 Thereafter 746.7 $ 1,825.9 $8.9$10.6 million at March 30, 2013.Thehashad an employment agreement with one of its officers that providesprovided for continuous employment through the date of the officer’s death or permanent disability at a current salary of $2.5$1.0 million. In addition to salary, the agreement providesprovided for an annual bonus and other employee related benefits.athe three-level valuation hierarchy for disclosure of fair value measurements. The determination of the applicable level within the hierarchy of a particular asset or liability depends on the inputs used in the valuation as of the measurement date, notably the extent to which the inputs are market-based (observable) or internally derived (unobservable). Observable inputs are inputs that market participants would use in pricing the asset or liability developed based on market data obtained from independent sources. Unobservable inputs are inputs based on a company’s own assumptions about market participant assumptions developed based on the best information available in the circumstances. The hierarchy is broken down into three levels based on the reliability of inputs as follows:The Company has historically entered into forward exchange contracts to hedge the foreign currency exposure for certain inventory purchases from its manufacturers in EuropeAsia, as well as commitments for certain services. The forward contracts that are used in the program mature in eighteen months or less, consistent with the related planned purchases or services. The Company attempts to hedge the majority of its total anticipated European and Asian purchase and service contracts. Realized gainsand losses applicable to derivatives used for inventory purchases are recognized in cost of sales, and those applicable to other services are recognized in selling, general and administrative expenses (see Note 3- Summary of Significant Accounting Policies,Derivative Financial Instruments,for further detail regarding hedge accounting treatment as it relates to gains and losses). At March 30, 2013,28, 2015, the fair valuevalues of the Company’s foreign currency forward contracts, the Company’s only derivatives,derivative instruments, were valueddetermined using broker quotations, which includewere calculations derived from observable market information.information: the applicable currency rates at the balance sheet date and those forward rates particular to the contract at inception. The Company makes no adjustments to these broker obtained quotes or prices, but does assessassesses the credit risk of the counterparty andvaluevalues of the forward contracts are included in prepaid expenses and other current assets, and in accrued expenses and other current liabilities in the consolidated balance sheets, depending on whether they represent assets or (liabilities) to the Company.Company, as detailed in Note 12. All contracts are measured and recorded at fair value on a recurring basis and are categorized in Level 2 of the fair value hierarchy, as shown in the following table: Total Fair value at March 30, 2013, using: (In thousands) Quoted prices in
active markets for
identical assets
(Level 1) Significant other
observable inputs
(Level 2) Significant
unobservable inputs
(Level 3) $ 1,367 $ — $ 1,367 $ — (71 ) — (71 ) — $ 1,296 $ — $ 1,296 $ — Fair value at April 2, 2016, using: Fair value at March 28, 2015, using: Foreign currency forward contracts: Euro $ — $ (5.5 ) $ — $ — $ 23.6 $ — Canadian Dollar — — — — 1.4 — U.S. Dollar — 0.1 — — (0.6 ) — Total $ — $ (5.4 ) $ — $ — $ 24.4 $ — the Credit Facilityrevolving credit agreements, if outstanding, are recorded at facecarrying value, aswhich resembles fair value due to the short-term nature of such borrowings.Credit Facility is synonymousCompany’s derivative contracts, which are recorded on a gross basis in the consolidated balance sheets as of April 2, 2016 and March 28, 2015 (in millions): Fair Values Notional Amounts April 2,
2016 March 28,
2015 April 2,
2016 March 28,
2015 April 2,
2016 March 28,
2015Designated forward currency exchange contracts $ 174.1 $ 226.1 $ 0.1 $ 23.6 $ 5.1 $ 0.5 Undesignated forward currency exchange contracts 30.0 25.8 — 1.4 0.4 0.1 Total $ 204.1 $ 251.9 $ 0.1 $ 25.0 $ 5.5 $ 0.6 Recorded within prepaid expenses and other current assets in the Company’s audited consolidated balance sheets. Recorded within accrued expenses and other current liabilities in the Company’s audited consolidated balance sheets. Fiscal Year Ended April 2, 2016 Fiscal Year Ended March 28, 2015 Fiscal Year Ended March 29, 2014 Pre-Tax
Loss
Recognized
in OCI Pre-tax Loss
Reclassified from
Accumulated OCI
into EarningsDesignated hedges $ (25.2 ) $ 10.9 $ 36.6 $ 2.1 $ (3.8 ) $ (0.5 ) recorded valueordinary shares from the ASR Counterparty, which represents 100% of the shares expected to be purchased pursuant to the ASR program, based on anit is a short-term debt facility duetreasury stock repurchase, reducing the number of ordinary shares outstanding by 4,718,335 shares. The forward contract was accounted for as an equity instrument.its revolving nature.12.cover” repurchase program, which allows the Company to withhold ordinary shares from certain executive officers to satisfy minimum tax withholding obligations relating to the vesting of their restricted share awards. During Fiscal 2016 and Fiscal 2015, the Company withheld 54,875 shares and 40,787 shares, respectively, at a cost of $2.4 million and $3.4 million, respectively, in satisfaction of minimum tax withholding obligations relating to the vesting of restricted share awards. Balance at March 30, 2013 $ (4.8 ) $ 1.3 $ (3.5 ) Other comprehensive loss before reclassifications — (3.4 ) (3.4 ) Less: amounts reclassified from AOCI to earnings — (0.5 ) (0.5 ) Other comprehensive loss net of tax — (2.9 ) (2.9 ) Balance at March 29, 2014 (4.8 ) (1.6 ) (6.4 ) Other comprehensive (loss) income before reclassifications (91.3 ) 32.8 (58.5 ) Less: amounts reclassified from AOCI to earnings — 1.9 1.9 Other comprehensive (loss) income net of tax (91.3 ) 30.9 (60.4 ) Balance at March 28, 2015 (96.1 ) 29.3 (66.8 ) Other comprehensive income (loss) before reclassifications 18.5 (22.6 ) (4.1 ) Less: amounts reclassified from AOCI to earnings — 9.9 9.9 Other comprehensive income (loss) net of tax 18.5 (32.5 ) (14.0 ) Balance at April 2, 2016 $ (77.6 ) $ (3.2 ) $ (80.8 ) Less: other comprehensive income attributable to noncontrolling interest $ 0.1 $ — $ 0.1 Other comprehensive loss attributable to MKHL $ (77.7 ) $ (3.2 ) $ (80.9 ) Accumulated other comprehensive income related to net gains (losses) on derivative financial instruments is net of a tax benefit of $0.3 million as of April 2, 2016 and a tax provision of $3.3 million as of March 28, 2015. Other comprehensive income (loss) before reclassifications related to derivative instruments for Fiscal 2016 and Fiscal 2015 is net of a tax benefit of $2.6 million and a tax provision of $3.7 million, respectively. The tax effect related to all other amounts was not material. Reclassified amounts relate to the Company’s forward foreign currency exchange contracts for inventory purchases and are recorded within cost of goods sold in the Company’s consolidated statements of operations. The amount reclassified from other comprehensive income for Fiscal 2016 is net of a tax provision of $1.0 million. The tax effects related to prior period amounts were not material. the grantinggrants of share options only and was authorized to issue up to 23,980,823 ordinary shares. As of March 30, 2013,April 2, 2016, there arewere no shares available for the granting ofto grant equity awards under the 2008 Plan. The 2012 Plan allows for the grantinggrants of share options, restricted shares and restricted share units, and other equity awards, and authorizes a total issuance of up to 15,246,000 ordinary shares. At March 30, 2013,April 2, 2016, there were 12,903,1979,211,143 ordinary shares available for the grantingfuture grants of equity awards under the 2012 Plan. Option grants issued from the 2008 Plan generally expire ten years from the date of the grant, and those issued under the 2012 Plan generally expire seven years from the date of the grant.Performance basedPerformance-based share options may vest based upon the attainment of one of two performance measures. One performance measure is an individual performance target, which is based upon certain performance targets unique to the individual grantee, and the other measure is a company-wide performance target, which is based on a cumulative minimum growth requirement in consolidated net equity. The individual performance target vests 20% of the total option grant each year the target is satisfied. The individual has ten years in which to achieve five5 individual performance vesting tranches. The company-wide performance target must be achieved over the ten-year term. Performance is measured at the end of the term, and any unvested options under the grant vest if the target is achieved. The Company-wide performance target is established at the time of the grant. The target metrics underlying individual performance vesting requirements are established for each recipient each year up until such time as the grant is fully vested. Options subject to time basedtime-based vesting requirements become vested in four equal increments on each of the first, second, third and fourth anniversaries of the date on which such options were awarded.2013,2016, and information about options outstanding at March 30, 2013: Number of
Options Weighted
Average
Exercise
price Weighted
Average
Remaining
Contractual
Life (years) Aggregate
Intrinsic
Value
(in thousands) 19,542,400 $ 6.59 55,248 $ 50.15 (8,704,477 ) $ 3.50 (511,829 ) $ 10.77 10,381,342 $ 9.21 7.13 $ 493,945 9,716,968 $ 9.21 7.11 $ 461,486 2,057,884 $ 7.91 6.14 $ 100,587 Outstanding at March 28, 2015 7,187,003 $ 23.14 Granted 515,430 $ 47.07 Exercised (1,632,461 ) $ 7.72 Canceled/forfeited (249,559 ) $ 52.18 Outstanding at April 2, 2016 5,820,413 $ 28.34 4.36 $ 193.0 Vested or expected to vest at April 2, 2016 5,781,360 $ 28.34 4.36 Vested and exercisable at April 2, 2016 4,081,064 $ 17.72 3.95 $ 167.5 20132016 and Fiscal 2015 was $415.1 million.$70.3 million and $131.6 million, respectively. The cash received from options exercised during Fiscal 2013,2016 and Fiscal 2015 was $30.4 million. The total intrinsic value$12.7 million and $15.3 million, respectively. As of April 2, 2016, the remaining unrecognized share-based compensation expense for nonvested share options exercised during Fiscal 2012 was $109.5 million. The cash received from options exercised during Fiscal 2012, was $9.7 million.2013,2016, Fiscal 2012,2015 and Fiscal 2011,2014, was $20.66, $8.01,$14.35, $27.96 and $3.08,$24.95, respectively. The following table represents assumptions used to estimate the fair value of options: Fiscal Year Ended March 30,
2013 March 31,
2012 April 2,
2011 0.0 % 0.0 % 0.0 % 48.5 % 46.5 % 46.7 % 0.6 % 1.8 % 3.2 % 4.75 years 7.8 years 10 years Fiscal Years Ended April 2,
2016 March 28,
2015 March 29,
2014Expected dividend yield 0.0 % 0.0 % 0.0 % Volatility factor 31.1 % 33.2 % 46.0 % Weighted average risk-free interest rate 1.6 % 1.5 % 1.0 % Expected life of option 4.75 years 4.75 years 4.75 years aton the date of the grant. Expense for restricted share grantsawards is calculated based on the intrinsic valueclosing market price of the Company’s shares on the date of grant which is the difference between the cost to the recipient and the fair market value of the underlying share (grants are generally issued at no cost to the recipient). Expense is recognized ratably over the vesting period, which is generally three to four years from the date of the grant. Similar to share options, restrictedgrant, net of expected forfeitures. four equal increments on each of the first, second, third and fourthfour anniversaries of the date on which suchof grant. In addition, the Company grants were awarded. Restrictedtwo types of restricted share unitsunit (“RSU”) awards: time-based RSUs and performance-based RSUs. Time-based RSUs generally vest in full either on the first anniversary of the date of the grant, or in equal increments on each of the four anniversaries of the date of grant.shares and restricted share units foractivity under the 2012 Plan as of March 30, 2013 and changes during the fiscal year then ended: Number of Unvested
Restricted Shares/Units Weighted
Average Grant
Date Fair Value 836,874 $ 22.53 35,470 $ 49.66 (221,147 ) $ 22.31 (5,966 ) $ 25.26 645,231 $ 23.98 Restricted Shares Unvested at March 28, 2015 770,592 $ 68.77 Granted — $ — Vested (326,988 ) $ 50.59 Canceled/forfeited (53,375 ) $ 80.55 Unvested at April 2, 2016 390,229 $ 82.38 shares/unitsshares vested was $14.4 million, $22.8 million and $17.6 million during Fiscal 2013 was $11.3 million. There were no restricted shares/units that vested prior to2016, Fiscal 2013.Compensation expense attributable to share-based compensation for Fiscal 20132015 and Fiscal 2012 was approximately $20.9 and $27.0 million,2014, respectively. There was no compensation expense recognized prior to Fiscal 2012, as the Company had not completed an IPO which was one of the vesting requirements for all equity grants. Had the completion of an IPO occurred as of the beginning of the periods presented, compensation expense of $5.3 million would have been recognized for Fiscal 2011. As of March 30, 2013,April 2, 2016, the remaining unrecognized share-based compensation expense for non-vested restricted share options and restricted shares to be expensed in future periods is $42.6grants was $22.3 million, and the related weighted-average period over which it is expected to be recognized over the related weighted-average period of approximately 1.99 years. Service-based Performance-based Unvested at March 28, 2015 35,940 $ 66.26 317,201 $ 76.69 Granted 1,104,983 $ 46.76 287,476 $ 47.10 Vested (18,537 ) $ 59.69 — $ — Canceled/forfeited (51,328 ) $ 47.87 (24,903 ) $ 80.72 Unvested at April 2, 2016 1,071,058 $ 47.13 579,774 $ 61.84 4.6 years. There were 2,057,884expected to be recognized over the related weighted-average periods of approximately 3.13 years and 8,323,458 vested1.58 years, respectively.non-vested outstanding options, respectively, at March 30, 2013. There were 617,468 unvested restricted grants and 27,763 restricted share units at March 30, 2013. Fiscal 2014 (in millions): Fiscal Years Ended April 2,
2016 March 28,
2015 March 29,
2014Share-based compensation expense $ 48.4 $ 48.9 $ 29.1 Tax benefits related to share-based compensation expense $ 15.7 $ 17.5 $ 11.5 since the inception of share option granting.to date. The estimated value of future forfeitures for equity grants as of March 30, 2013April 2, 2016 is approximately $2.0$2.8 million.13. Fiscal Years Ended April 2,
2016 March 28,
2015 March 29,
2014U.S. $ 737.5 $ 814.3 $ 792.9 Non-U.S. 434.8 441.5 214.8 Total income before provision for income taxes $ 1,172.3 $ 1,255.8 $ 1,007.7 Fiscal Years Ended April 2,
2016 March 28,
2015 March 29,
2014Current U.S. Federal $ 268.0 $ 277.0 $ 295.2 U.S. State 14.3 49.7 50.3 Non-U.S. 54.2 41.9 30.6 Total current 336.5 368.6 376.1 Deferred U.S. Federal 0.3 5.0 (24.8 ) U.S. State 1.0 0.3 (3.6 ) Non-U.S. (3.2 ) 0.9 (1.5 ) Total deferred (1.9 ) 6.2 (29.9 ) Total provision for income taxes $ 334.6 $ 374.8 $ 346.2 generally not subject to taxation. MKHL’s subsidiaries are subject to taxation ina tax resident of the United StatesU.K. However, since the proportion of the U.S. revenues, assets, operating income, and variousthe associated tax provisions is significantly higher than any other foreign jurisdictions which are aggregated insingle tax jurisdiction within the “Non-U.S,” information captioned below.Income (loss) beforeworldwide group, the reconciliation of the differences between the provision for income taxes consistedand the statutory rate is presented on the basis of the following (in thousands): Fiscal Years Ended March 30,
2013 March 31,
2012 April 2,
2011 $ 538,607 $ 227,514 $ 134,197 88,520 21,302 (978 ) $ 627,127 $ 248,816 $ 133,219 The provision forU.S. statutory federal income taxes was as follows (in thousands): Fiscal Years Ended March 30,
2013 March 31,
2012 April 2,
2011 $ 179,014 $ 79,690 $ 30,494 32,249 20,916 11,527 15,040 8,575 6,249 226,303 109,181 48,270 1,246 (4,128 ) 9,950 2,088 (3,595 ) 2,057 (112 ) (6 ) 436 3,222 (7,729 ) 12,443 $ 229,525 $ 101,452 $ 60,713 United States FederalU.S. federal statutory tax rate and the Company’s effective tax rate for financial statement purposes: Fiscal Years Ended March 30,
2013 March 31,
2012 April 2,
2011 35.0 % 35.0 % 35.0 % 3.6 % 4.8 % 7.1 % –3.1 % –1.3 % 1.9 % –0.2 % –0.6 % –1.1 % 0.5 % 0.2 % 0.3 % 0.3 % 1.8 % 2.5 % 0.5 % 0.9 % –0.1 % 36.6 % 40.8 % 45.6 % Fiscal Years Ended April 2,
2016 March 28,
2015 March 29,
2014Federal tax at 35% statutory rate 35.0 % 35.0 % 35.0 % State and local income taxes, net of federal benefit 1.2 % 2.4 % 2.3 % Differences in tax effects on foreign income (7.9 )% (8.2 )% (3.9 )% Foreign tax credit (0.2 )% (0.4 )% (0.2 )% Liability for uncertain tax positions — % 0.2 % 0.8 % Effect of changes in valuation allowances on deferred tax assets (0.2 )% (0.1 )% (0.2 )% Other 0.6 % 0.9 % 0.6 % Effective tax rate 28.5 % 29.8 % 34.4 % thousands)millions): March 30,
2013 March 31,
2012 $ 8,469 $ 5,185 1,188 1,123 16,209 11,677 8,508 8,142 8,909 7,777 — 3,993 2,331 1,464 45,614 39,361 (8,746 ) (8,233 ) 36,868 31,128 (14,780 ) (1,222 ) (20,927 ) (20,801 ) (1,455 ) (308 ) (37,162 ) (22,331 ) $ (294 ) $ 8,797 Fiscal Years Ended April 2,
2016 March 28,
2015Deferred tax assets Inventories $ 10.5 $ 11.2 Payroll related accruals 2.2 0.4 Deferred rent 37.1 30.4 Net operating loss carryforwards 3.4 5.9 Stock compensation 30.0 23.8 Sales allowances 13.4 10.1 Other 12.1 11.1 108.7 92.9 Valuation allowance (3.4 ) (5.7 ) Total deferred tax assets 105.3 87.2 Deferred tax liabilities Goodwill and intangibles (32.9 ) (32.7 ) Depreciation (48.0 ) (34.6 ) Other (3.4 ) (3.9 ) Total deferred tax liabilities (84.3 ) (71.2 ) Net deferred tax assets $ 21.0 $ 16.0 were increased by approximately $1.6$3.3 million, $0.2 million and $0.9 million in Fiscal 2013, $4.4 million in2016, Fiscal 2012,2015, and $3.3 million in Fiscal 2011.2014, respectively. As a result of the attainment and expectation of achieving profitable operations in certain countries comprising the Company’s European operations and certain state jurisdictions in the United States,U.S., for which deferred tax valuation allowances had been previously established, the Company released valuation allowances amounting to approximately $1.1$5.6 million, $2.6 million, and $1.6 million in Fiscal 2013, $0.2 million in2016, Fiscal 2012,2015, and $0.9 million in Fiscal 2011.The2014, respectively.hashad non-U.S. net operating loss carryforwards of approximately $51.7$11.5 million that will begin to expire in 2016.30, 2013,28, 2015, the Company has accrued a liability of approximately $7.1 millionliabilities related to its uncertain tax positions, which includesincluding accrued interest, of approximately $18.5 million and $21.2 million, respectively, which isare included in other long-term liabilities in the Company’s audited consolidated balance sheets.approximately $6.6approximately$16.8 million, at$19.9 million and $18.1 million as of April 2, 2016, March 30, 2013,28, 2015, and approximately $1.8 million at March 31, 2012.29, 2014, respectively. A reconciliation of the beginning and ending amounts of unrecognized tax benefits, excluding accrued interest, for Fiscal 20132016, Fiscal 2015, and Fiscal 2012,2014, are presented below (in thousands)millions): March 30,
2013 March 31,
2012 $ 1,758 $ 939 3,318 246 2,482 573 (930 ) — $ 6,628 $ 1,758 Fiscal Years Ended April 2,
2016 March 28,
2015 March 29,
2014Unrecognized tax benefits beginning balance $ 19.9 $ 18.1 $ 6.6 Additions related to prior period tax positions — 0.4 2.5 Additions related to current period tax positions 5.8 5.2 9.3 Decreases from prior period positions (5.7 ) (3.8 ) (0.3 ) Decreases related to audit settlements (3.2 ) — — Unrecognized tax benefits ending balance $ 16.8 $ 19.9 $ 18.1 20132016, Fiscal 2015, and Fiscal 20122014 was approximately $0.3$1.7 million, $1.3 million and $0.1$0.9 million, respectively.and/orand assessments and the expiration of applicable statutes of limitations. The Company anticipates that the balance of gross unrecognized tax benefits, excluding interest and penalties, will be reduced by approximately $1.8 million during the next twelve months. However, the outcomes and timing of such events are highly uncertain and changes in the occurrence, expected outcomes, and timing of such events could cause the Company’s current estimate to change materially in the future.United States,U.S., for federal, state, and local purposes, and in certain foreign jurisdictions. With few exceptions, the Company is no longer subject to examinations by the relevant tax authorities for years prior to its fiscal year ended March 28, 2009.total amount ofCompany’s policy with respect to its undistributed earnings of United States and other non-U.S. subsidiaries as of March 30, 2013 was approximately $671.1 million. It is the Company’s intention to permanently reinvest undistributed earnings of its United StatesU.S. and non-U.S. subsidiaries is to consider those earnings to be either indefinitely reinvested or able to be repatriated tax-neutral. Undistributed earnings of subsidiaries considered to be either indefinitely reinvested or able to be repatriated tax-neutral amounted to $2.638 billion at April 2, 2016. Determination of the amount of unrecognized deferred U.S. and therebynon-U.S. income tax liability on those earnings which are indefinitely postpone their remittance. Accordingly, no provision has been made for withholding taxes or income taxes which may become payable if undistributed earnings are paid as dividends.14.reinvested is not practicable.Company. For the years ended March 30, 2013, March 31, 2012,Company, which vary by country. During Fiscal 2016, Fiscal 2015, and April 2, 2011,Fiscal 2014, the Company recognized expenseexpenses of approximately $2.2 million. $1.6$10.1 million, $5.8 million, and $1.3$3.5 million, respectively, related to these retirement plans.15.executive managementthe Company's chief operating decision maker in deciding how to allocate resources, as well as in assessing performance. The primary key performance indicators are net sales or revenue (in the case of Licensing) and operating income for each segment. The Company’s reportable segments represent channels of distribution that offer similar merchandise, customer experience and sales/marketing strategies. Sales ofThe Company’s Retail segment includes sales through the Company’s products through Company owned stores, for the Retail segment includeincluding “Collection,” “Lifestyle” including “concessions,” and outlet stores located throughout North America,the Americas (U.S., Canada and Latin America), Europe, and Japan.Asia, as well as the Company’s e-commerce sales. Products sold through the Retail segment include women’s apparel, accessories (which include handbags and small leather goods such as wallets), men's apparel, footwear and licensed products, such as watches, jewelry, fragrances and beauty, and eyewear. The Wholesale segment includes sales primarily to major department stores and specialty shops throughout North Americathe Americas, Europe and Europe.Asia. Products sold through the Wholesale segment include accessories (which include handbags and small leather goods such as wallets), footwear and women’s and men’s apparel. We also have wholesale arrangements pursuant to which we sell products to certain of our licensees, including our licensees in Asia (which were previously reported within our Americas wholesale operations). The Licensing segment includes royalties earned on licensed products and use of the Company’s trademarks, and rights granted to third parties for the right to sell the Company’s products in certain geographicalgeographic regions (e.g.such as the Middle East) and countries suchEast, Eastern Europe, throughout all of Asia (excluding Japan), as Korea, the Philippines, Singapore, Malaysia, Russia and Turkey.well as Australia. All intercompany revenues are eliminated in consolidation and are not reviewed when evaluating segment performance. Corporate overhead expenses are allocated to the segments based upon specific usage or other allocation methods.$12.1$13.3 million, $8.0 million and $1.9 million of its recorded $23.2 million goodwill as of April 2, 2016 to its Wholesale, Retail and Licensing segments, respectively. See Note 3 for goodwill recorded upon the Company's acquisition of controlling interest in MK Panama during the second quarter of Fiscal 2016. As of March 28, 2015, the Company's goodwill balance of $14.0 million was allocated $12.1 million and $1.9 million to its Wholesale and Licensing segments, respectively. The Company does not have identifiable assets separated by segment.thousands)millions): Fiscal Years Ended March 30,
2013 March 31,
2012 April 2,
2011 $ 1,062,642 $ 626,940 $ 344,195 1,032,115 610,160 413,605 86,975 65,154 45,539 $ 2,181,732 $ 1,302,254 $ 803,339 $ 315,654 $ 121,851 $ 61,194 269,323 85,000 48,241 45,037 40,831 27,431 $ 630,014 $ 247,682 $ 136,866 Fiscal Years Ended April 2,
2016 March 28,
2015 March 29,
2014Revenue: Net sales: Retail $ 2,394.9 $ 2,134.6 $ 1,593.0 Wholesale 2,143.9 2,065.1 1,577.5 Licensing 173.3 171.8 140.3 Total revenue $ 4,712.1 $ 4,371.5 $ 3,310.8 Income from operations: Retail $ 501.4 $ 557.2 $ 467.3 Wholesale 584.1 610.9 459.8 Licensing 89.6 88.9 81.1 Income from operations $ 1,175.1 $ 1,257.0 $ 1,008.2 thousands)millions): Fiscal Years Ended March 30,
2013 March 31,
2012 April 2,
2011 $ 35,388 $ 25,293 $ 16,526 18,531 12,012 8,894 372 249 123 $ 54,291 $ 37,554 $ 25,543 Fiscal Years Ended April 2,
2016 March 28,
2015 March 29,
2014 Retail $ 114.5 $ 84.5 $ 46.7 Wholesale 67.3 53.0 32.4 Licensing 1.4 0.9 0.6 Total depreciation and amortization $ 183.2 $ 138.4 $ 79.7 Excluded infrom the above table are fixed asset impairment charges related to the Company's retail segment for $0.7operations of $8.6 million, $3.3$0.8 million and $3.8$1.3 million, during Fiscal 2016, Fiscal 2015 and Fiscal 2014, respectively. During Fiscal 2016, the fiscal years ended March 30, 2013, March 31, 2012,Company also recorded fixed asset impairment charges of $0.4 million relating to its wholesale operations and April 2, 2011, respectively.$1.9 million relating to a corporate fixed asset.(as recognized based(based on country of origin), and long-lived assets by geographic location of the consolidated Company are as follows (in thousands)millions): Fiscal Years Ended March 30,
2013 March 31,
2012 April 2,
2011 $ 1,938,635 $ 1,183,234 $ 763,819 220,724 108,790 38,502 22,373 10,230 1,018 $ 2,181,732 $ 1,302,254 $ 803,339 As of March 30,
2013 March 31,
2012 $ 209,973 $ 151,516 46,154 27,857 6,966 5,528 $ 263,093 $ 184,901 16. Fiscal Years Ended April 2,
2016 March 28,
2015 March 29,
2014Revenue: $ 3,506.6 $ 3,418.9 $ 2,771.8 Europe 990.3 884.7 500.5 Asia 215.2 67.9 38.5 Total revenue $ 4,712.1 $ 4,371.5 $ 3,310.8 As of April 2,
2016 March 28,
2015Long-lived assets: $ 507.7 $ 443.8 Europe 284.2 169.2 Asia 33.7 11.4 Total Long-lived assets: $ 825.6 $ 624.4 Net revenues earned in the U.S. during Fiscal 2016, Fiscal 2015, and Fiscal 2014 were $3.304 billion, $3.228 billion and $2.600 billion, respectively. Long-lived assets located in the U.S. as of April 2, 2016 and March 28, 2015 were $472.2 million and $418.8 million, respectively. Fiscal Years Ended April 2,
2016 March 28,
2015 March 29,
2014 Accessories $ 3,179.7 70.1% $ 2,872.2 68.4 % $ 2,060.8 65.0 % Apparel 543.7 12.0% 549.4 13.1 % 482.4 15.2 % Footwear 491.0 10.8% 444.1 10.5 % 338.0 10.7 % Licensed product 324.4 7.1% 334.0 8.0 % 289.3 9.1 % Net sales $ 4,538.8 $ 4,199.7 $ 3,170.5 During July 2011, the note payable to the Company’s former parent, for $101.7 million, was exchanged for 475,796 preference shares and 6,579,662 ordinary shares, after taking into effect the impact of the share exchange that resulted from the reorganization discussed in Note 2. Accordingly, there are no outstanding balances related to the note, subsequent to the aforementioned transaction.From time to time, Sportswear Holdings Limited or its affiliates have provided a plane for purposes of business travel to the directors and senior management of the Company at no charge to the Company. During Fiscal 2013, approximately $0.3 million, representing the estimated costs of these services, which are based on allocated or incremental cost, was charged to selling, general and administrative expenses as an offset to contributed capital (additional paid-in capital). The Company or its chief executive officer may arrange a plane owned by Sportswear Holdings Limited or its affiliates to be used for the Company’s directors and senior management for purposes of business travel on terms and conditions not less favorable to the Company than it would receive in an arm’s-length transaction with a third party. To the extent the Company’s chief executive officer enters into such an arrangement for business travel, the Company will reimburse him for the actual market price paid for the use of such plane. These reimbursed expenses will be charged to the Company’s operations but will not result in an increase to additional paid-in capital.currentformer shareholders, including Sportswear Holdings Limited, jointly own Michael Kors Far East Holdings Limited, a BVI company. During Fiscal 2012,On April 1, 2011, the Company entered into certain licensing agreements with certain subsidiaries of Michael Kors Far East Holdings Limited, including Michael Kors (HK) Limited, (the “Licensees”), which provide the Licensees with certain exclusive rights for use of the Company’s trademarks within China, Hong Kong, Macau and Taiwan, and to import, sell, advertise and promote certain of the Company’s products in these regions, as well as to own and operate stores which bear the Company’s tradenames. The agreements between the Company and subsidiaries of Michael Kors Far East Holdings Limitedthe Licensees expire on March 31, 2041, and may be terminated by the Company at certain intervals if certain minimum salesales benchmarks are not met. As of March 30, 2013,During Fiscal 2016, Fiscal 2015 and Fiscal 2014, there were noapproximately $7.6 million, $4.7 million and $1.6 million, respectively, of royalties earned under these agreements. Under these agreements noThese royalties will be earned until the start ofwere driven by Licensee adjusted net sales (of the Company’s fiscalgoods) to their customers of approximately $169.8 million, $103.7 million and $36.5 million in Fiscal 2016, Fiscal 2015 and Fiscal 2014, year. The Company also providesrespectively, as defined in the Licensees with certain services, including, but not limited to, supply chain and logistics support, and management information system support at the request of the Licensees, for whichlicensing agreement. In addition, the Company charges a service fee based on allocated internal costs employed in delivering the services, and includes a contractually agreed upon markup. During Fiscal 2013, amounts chargedsells certain inventory items to the Licensees through its wholesale segment at terms consistent with those of similar licensees in the region. During Fiscal 2016, Fiscal 2015 and Fiscal 2014, amounts recognized as net sales in the Company’s consolidated statements of operations related to these sales, were approximately $62.8 million, $35.3 million and $12.9 million, respectively. As of April 2, 2016 and March 28, 2015, the Company’s total accounts receivable from this related party were $16.1 million and $6.5 million, respectively. See Note 21 for information relating to the Company's acquisition of Michael Kors (HK) Limited on May 31, 2016.totaled $0.3 million, which is recorded in other selling, generalduring each of Fiscal 2015 and administrative expenses. routinely purchases certain inventory from a manufacturer owned by one of its directors.former directors (who resigned on September 10, 2014). Amounts purchased from this manufacturer during Fiscal 2013, Fiscal 20122015 and Fiscal 2011,2014, were approximately $5.7 million, $2.7$9.1 million and $2.6$8.1 million, respectively.17.20132016 and 2012Fiscal 2015 quarterly results (dollars in thousands)millions): Fiscal Quarter Ended June September December March $ 414,865 $ 532,935 $ 636,778 $ 597,154 $ 251,000 $ 315,900 $ 383,451 $ 356,215 $ 111,943 $ 157,928 $ 204,839 $ 155,304 $ 68,645 $ 97,828 $ 130,028 $ 101,101 192,790,454 194,323,935 199,291,480 200,080,126 199,391,127 200,192,291 202,817,811 203,785,123 $ 243,126 $ 305,532 $ 373,606 $ 379,990 $ 136,969 $ 175,100 $ 221,905 $ 219,122 $ 44,976 $ 59,278 $ 64,587 $ 78,841 $ 24,115 $ 40,606 $ 39,031 $ 43,612 140,554,377 146,555,601 154,738,356 191,184,171 179,177,268 187,580,161 193,583,954 196,855,404 69 Fiscal Quarter Ended June 27,
2015 September 26,
2015 December 26,
2015 April 2,
2016(1) Fiscal 2016 Total revenue $ 986.0 $ 1,130.0 $ 1,397.4 $ 1,198.7 Gross profit $ 603.6 $ 664.4 $ 832.0 $ 697.2 Income from operations $ 248.6 $ 273.1 $ 409.3 $ 244.1 Net income $ 174.4 $ 192.8 $ 294.2 $ 176.3 Net income attributable to MKHL $ 174.4 $ 193.1 $ 294.6 $ 177.0 (2) Weighted average ordinary shares outstanding: Basic 196,977,021 188,857,398 182,176,452 177,814,521 Diluted 200,054,494 191,524,156 184,851,616 180,439,102 Fiscal Quarter Ended June 28,
2014 September 27,
2014 December 27,
2014 March 28,
2015 Fiscal 2015 Total revenue $ 919.2 $ 1,056.6 $ 1,314.7 $ 1,081.0 Gross profit $ 571.6 $ 645.1 $ 800.1 $ 630.9 Income from operations $ 276.8 $ 305.5 $ 418.5 $ 256.2 Net income $ 187.7 $ 207.0 $ 303.7 $ 182.6 Net income attributable to MKHL $ 187.7 $ 207.0 $ 303.7 $ 182.6 Weighted average ordinary shares outstanding: Basic 203,749,572 204,464,952 202,668,541 199,828,293 Diluted 207,176,243 207,432,250 205,647,816 203,195,838 The fiscal quarter ended April 2, 2016 contains 14 weeks, whereas all other fiscal quarters presented contain 13 weeks.