Robert Half Legal offers a full suite of legal staffing and consulting services to help organizations manage constantly changing workloads and access expertise across in-demand legal practice areas. Protiviti has gained unique perspectives on the challenges faced by its clients. Protiviti uses these perspectives not only to solve regulatory, risk and compliance problems, but also to help clients become more effective and productive. Protiviti provides solutions to its clients in areas such as business performance improvement, internal audit and financial advisory, IT consulting, restructuring and litigation, risk and compliance, and transaction services. the Company conducts public relations activities designed to enhance public recognition of the Company and its services. This includes outreach to journalists, bloggers and social media influencers, and the distribution of thought leadership via print, video, corporate-maintained social media sites and other online properties. groups in their local communities. 2013 4th Quarter 3rd Quarter 2nd Quarter 1st Quarter 2012 4th Quarter 3rd Quarter 2nd Quarter 1st Quarter 2014. October 1, 2013 to October 31, 2013 November 1, 2013 to November 30, 2013 December 1, 2013 to December 31, 2013 Total October 1, 2013 to December 31, 2013 Income Statement Data: Net service revenues Direct costs of services, consisting of payroll, payroll taxes, insurance costs and reimbursable expenses Gross margin Selling, general and administrative expenses Amortization of intangible assets Interest income, net Income before income taxes Provision for income taxes Net income Net income available to common stockholders Net Income Per Share: Basic Diluted Shares: Basic Diluted Cash Dividends Declared Per Share Balance Sheet Data: Total assets Notes payable and other indebtedness, less current portion Stockholders’ equity extrapolating past results, management believes that it is reasonably likely that future results will be consistent with historical trends and experience. However, if the financial condition of the Company’s customers were to deteriorate, resulting in an impairment of their ability to make payments, or if unexpected events or significant future changes in trends were to occur, additional allowances may be required. operating performance. The discount rate for all reporting units was determined by management based on estimates of risk free interest rates, beta and market risk premiums. The discount rate used was compared to the rate published in various third party research reports, which indicated that the rate was within a range of reasonableness. The primary assumptions related to future operating performance include revenue growth rates and profitability levels. In addition, the impairment assessment requires that management make certain judgments in allocating shared assets and liabilities to the balance sheets of the reporting units. Solely for purposes of establishing inputs for the fair value calculations described above related to its annual goodwill impairment testing, the Company made the following assumptions. The Company assumed that year-to-date trends through the date of the last assessment would continue for all reporting units through units. the ability of the Company's field and corporate leadership teams to grow the business. United States of America ("GAAP") and the rules of the SEC. To help readers understand the Company’s financial performance, the Company supplements its GAAP financial results with revenue growth rates derived from non-GAAP revenue amounts. Variations in the Company’s financial results include the impact of changes in foreign currency exchange rates and billing days. The Company provides “same billing days and constant currency” revenue growth calculations to remove the impact of these items. These calculations show the year-over-year revenue growth rates for the Company’s 2014. U.S., Temporary and consultant staffing As Reported Billing Days Impact Currency Impact Same Billing Days and Constant Currency Permanent placement staffing As Reported Billing Days Impact Currency Impact Same Billing Days and Constant Currency 2014. This year-over-year improvement in gross margin percentage of 0.6% was primarily attributable to higher pay/bill spreads and lower fringe costs driven by lower state unemployment insurance expenses in 2015 compared to 2014. 2015, up from demand. admin compensation and fixed overhead. 2014. 2013. For the Company’s international operations, 2014 revenues increased 6.3%, and on a same-day, constant-currency basis increased 8.5%, compared to 2013. Temporary and consultant staffing As Reported Billing Days Impact Currency Impact Same Billing Days and Constant Currency Permanent placement staffing As Reported Billing Days Impact Currency Impact Same Billing Days and Constant Currency 2013. This year-over-year improvement in gross margin percentage of 0.4% was primarily attributable to lower fringe costs driven by lower state unemployment insurance expenses in 2014 compared to 2013. client demand. 2014 . 2013. benefits and a decrease in federal 15, 2016. Contractual Obligations Long-term debt obligations Operating lease obligations Purchase obligations Other liabilities Total liabilities. Although currency fluctuations impact the Company’s reported results and shareholders’ equity, such fluctuations generally do not affect cash flow or result in actual economic gains or losses. The Company generally has few cross-border transfers of funds, except for transfers to the U.S. for payment of intercompany loans, working capital loans made between the U.S. and the Company’s foreign subsidiaries, and dividends from the Company’s foreign subsidiaries. Cash and cash equivalents Accounts receivable, less allowances of $27,261 and $24,852 Current deferred income taxes Other current assets Total current assets Goodwill Other intangible assets, net Property and equipment, net Other assets Total assets Accounts payable and accrued expenses Accrued payroll costs and retirement obligations Current portion of notes payable and other indebtedness Total current liabilities Notes payable and other indebtedness, less current portion Other liabilities Total liabilities Commitments and Contingencies (Note I) Preferred stock, $.001 par value authorized 5,000,000 shares; issued and outstanding zero shares Common stock, $.001 par value authorized 260,000,000 shares; issued and outstanding 137,466,421 and 139,438,603 shares Capital surplus Accumulated other comprehensive income Retained earnings Total stockholders’ equity Total liabilities and stockholders’ equity Net service revenues Direct costs of services, consisting of payroll, payroll taxes, insurance costs and reimbursable expenses Gross margin Selling, general and administrative expenses Amortization of intangible assets Interest income, net Income before income taxes Provision for income taxes Net income Net income available to common stockholders—diluted Net income per share (Note L): Basic Diluted Shares: Basic Diluted Cash dividends declared per share COMPREHENSIVE INCOME: Net income Foreign currency translation adjustments, net of tax Total comprehensive income COMMON STOCK—SHARES: Balance at beginning of period Net issuances of restricted stock Repurchases of common stock Exercises of stock options Balance at end of period COMMON STOCK—PAR VALUE: Balance at beginning of period Net issuances of restricted stock Repurchases of common stock Exercises of stock options Balance at end of period CAPITAL SURPLUS: Balance at beginning of period Net issuances of restricted stock at par value Repurchases of common stock—excess over par value Cash dividends ($.64 per share, $.60 per share and $.56 per share) Stock-based compensation expense Exercises of stock options—excess over par value Tax impact of equity incentive plans Balance at end of period ACCUMULATED OTHER COMPREHENSIVE INCOME: Balance at beginning of period Foreign currency translation adjustments, net of tax Balance at end of period RETAINED EARNINGS: Balance at beginning of period Net income Repurchases of common stock—excess over par value Cash dividends ($.64 per share and $.60 per share) Balance at end of period CASH FLOWS FROM OPERATING ACTIVITIES: Net income Adjustments to reconcile net income to net cash provided by operating activities: Amortization of intangible assets Depreciation expense Stock-based compensation expense—restricted stock and stock units Excess tax benefits from stock-based compensation Deferred income taxes Provision for doubtful accounts receivable Changes in assets and liabilities, net of effects of acquisitions: Increase in accounts receivable Increase in accounts payable, accrued expenses, accrued payroll costs and retirement obligations (Decrease) increase in income taxes payable Change in other assets, net of change in other liabilities Net cash flows provided by operating activities CASH FLOWS FROM INVESTING ACTIVITIES: Payment for acquisitions, net of cash acquired Capital expenditures Increase in trusts for employee benefits and retirement plans Net cash flows used in investing activities CASH FLOWS FROM FINANCING ACTIVITIES: Repurchases of common stock Cash dividends paid Decrease in notes payable and other indebtedness Excess tax benefits from stock-based compensation Proceeds from exercises of stock options Net cash flows used in financing activities Effect of exchange rate changes on cash and cash equivalents Net (decrease) increase in cash and cash equivalents Cash and cash equivalents at beginning of period Cash and cash equivalents at end of period SUPPLEMENTAL DISCLOSURES OF CASH FLOW INFORMATION: Cash paid during the year for: Interest Income taxes, net of refunds Non-cash items: Stock repurchases awaiting settlement estimating the effect of permanent placement candidates who do not remain with its clients through the 90-day guarantee period. Allowances are established to estimate these losses. Fees to clients are generally calculated as a percentage of the new employee’s annual compensation. No fees for permanent placement services are charged to employment candidates. Advertising Costs of these assets is dependent on future taxable income, its ability to use foreign tax credit carryforwards and carrybacks, final U.S. and foreign tax settlements, and the effectiveness of its tax planning strategies in the various relevant jurisdictions. Computer hardware Computer software Furniture and equipment Leasehold improvements Internal-use software development costs Deposits in trusts for employee benefits and retirement plans Other Balance as of December 31, 2011 Acquisitions Foreign currency translation adjustments Balance as of December 31, 2012 Acquisitions Foreign currency translation adjustments Balance as of December 31, 2013 Computer hardware Computer software Furniture and equipment Leasehold improvements Other Property and equipment, cost Accumulated depreciation Property and equipment, net Benefit Costs Payroll and benefits Employee retirement obligations Workers’ compensation Payroll taxes Deferred compensation plan and other benefits related to the Company’s Chief Executive Officer 2014 2015 2016 2017 2018 Thereafter 2013. Current: Federal State Foreign Deferred: Federal and state Foreign Domestic Foreign Federal U.S. income tax rate State income taxes, net of federal tax benefit Non-deductible expenses Non-U.S. income taxed at different rates, net of foreign tax credits Federal tax credits Tax impact of uncertain tax positions Valuation allowance release, net Other, net Effective tax rate (continued) Amortization of franchise rights Amortization of other intangibles Accrued expenses, deducted for tax when paid Capitalized costs for books, deducted for tax Depreciation Federal impact of unrecognized tax benefits Foreign tax credit carryforwards Other, net Current deferred income tax assets, net Long-term deferred income tax liabilities, net Deferred Income Tax Assets Provision for bad debts Employee retirement and other benefit obligations Workers’ compensation Deferred compensation Credits and net operating loss carryforwards Other Total deferred income tax assets Deferred Income Tax Liabilities Amortization of intangible assets Property and equipment basis differences Other Total deferred income tax liabilities Valuation allowance Total deferred income tax assets, net enterprise zone tax credits, respectively. (continued) 2014. Balance at beginning of period Gross increases—tax positions in prior years Gross decreases—tax positions in prior years Gross increases—tax positions in current year Settlements Lapse of statute of limitations Balance at end of period 2014 2015 2016 2017 2018 Thereafter Contingencies (continued) Common stock repurchased (in shares) Common stock repurchased Employee stock plan repurchased (in shares) Employee stock plan repurchased Cash dividends declared per share The Company has not granted any options to purchase common stock since 2006. previous equity awards to which it can be offset. The Company calculates the amount of eligible excess tax benefits that are available to offset future tax shortfalls in accordance with the long-form method described in the FASB authoritative guidance. Restricted stock and stock units Restricted stock and stock units Outstanding, December 31, 2010 Granted Exercised Restrictions lapsed Forfeited Outstanding, December 31, 2011 Granted Exercised Restrictions lapsed Forfeited Outstanding, December 31, 2012 Granted Exercised Restrictions lapsed Forfeited Outstanding, December 31, 2013 Total pre-tax intrinsic value of stock options exercised Total fair value of shares vested Range of $32.36. Basic net income per share: Net income Income allocated to participating securities Net income available to common stockholders Basic weighted average shares Basic net income per share Diluted net income per share: Net income Income allocated to participating securities Net income available to common stockholders Basic weighted average shares Dilutive effect of potential common shares Diluted weighted average shares Diluted net income per share Total number of anti-dilutive potential common shares amount of compensation cost for future service that the Company has not yet recognized, and the amount of tax benefits that would be recorded in capital surplus, if the options were exercised and the stock units and performance-based restricted stock had vested. Net service revenues Temporary and consultant staffing Permanent placement staffing Risk consulting and internal audit services Operating income Temporary and consultant staffing Permanent placement staffing Risk consulting and internal audit services Amortization of intangible assets Interest income, net Income before income taxes Accounts receivable Temporary and consultant staffing Permanent placement staffing Risk consulting and internal audit services Goodwill Temporary and consultant staffing Permanent placement staffing Risk consulting and internal audit services Net service revenues Domestic Foreign Assets, long-lived Domestic Foreign (a) There were no customers that accounted for more than 10% of the Company's total net revenue in any year presented. 2013 Net service revenues Gross margin Income before income taxes Net income Net income available to common stockholders - diluted Basic net income per share Diluted net income per share 2012 Net service revenues Gross margin Income before income taxes Net income Net income available to common stockholders - diluted Basic net income per share Diluted net income per share Quarterly dividend per share Declaration date Record date Payment date 17, 2016 Plan Category Equity compensation plans approved by security holders Equity compensation plans not approved by security holders(a) Total 2014. 2013. 2013. 2013. 2013. Exhibit Annual Performance Bonus Plan, as amended and restated, incorporated by reference to Exhibit 99.1 to Registrant’s Current Report on Form 8-K dated May 23, 2013. Stock Incentive Plan—Form of Restricted Share Agreement for Executive Officers effective April 15, 2013, incorporated by reference to Exhibit 10.1 to Registrant’s Quarterly Report onForm 10-Q for the fiscal quarter ended March 31, 2013. Part II, Item 8 of this Form 10-K formatted in XBRL. Date: February Date: February Date: February Date: February Date: February Date: February Date: February Year Ended December 31, 2011 Allowance for doubtful accounts receivable Deferred tax valuation allowance Year Ended December 31, 2012 Allowance for doubtful accounts receivable Deferred tax valuation allowance Year Ended December 31, 2013 Allowance for doubtful accounts receivable Deferred tax valuation allowanceadvertising,interactive media, design, and marketing and web design fields.Protiviti, which began operations in 2002, is a global business consulting and internal audit firm.Protiviti, which primarily employs professionals specializing in risk, advisory and transactional services, is a wholly-ownedwholly owned subsidiary of the Company.work loadsworkloads for accounting, taxfinance, and financebookkeeping personnel caused by such predictable events as vacations, taking inventories, tax work,month-end activities and special projects, and such unpredictable events as illness and emergencies. Businesses view the use of temporary employees as a means of controlling personnel costs and converting such costs from fixed to variable. The cost and inconvenience to clients of hiring and firing regular employees are eliminated by the use ofAccountempstemporaries. The temporary workers are employees ofAccountempsand are paid byAccountemps. The customer pays a fixed rate only for hours worked.word processorsexecutive and administrative assistants to office managers.receptionists and customer service representatives. OfficeTeamoperates in much the same fashion as theAccountempsdivision.1The Company’sRobert Half Finance & Accounting division specializes in the placement of full-time accounting, financial, tax and bankingaccounting operations personnel. Fees for successfulworkloadcaseload periods) are similar to the demands of the clients of theAccountempsdivision.and senior financial analysts, internal auditors, and business systems analysts for such tasks as financial systems conversions, expansion into new markets, business process reengineering, business systems performance improvement, and post-merger financial consolidation.servesspecializes in identifying for its clients creative professionals in the areas of interactive media, design, marketing, advertising marketing and web designpublic relations. The division places freelance and places project consultants in a variety of positions such as creative directors, graphics designers, web content developers, web designers, media buyers, brand managers, and public relations specialists.Protiviti is a global business consulting and internal audit firm composed of experts specializing in risk, advisory and transactional services. The firmthat helps clientscompanies solve problems in finance, and transactions,technology, operations, technology, litigation, governance, risk and compliance.internal audit. Through its risk management and internal audit heritage, websites,digital, search engine marketing, social media, websites, job banksboards, and trade shows. Direct marketing throughe-mail regular mail and telephone solicitation also constitutes a significant portion of the Company’s total advertising. National advertising conducted by the Company consists primarily of radio, outdoor/billboard,streaming audio, digital display, search engine marketing, social media amplification, and advertisements in national digital and print advertisements in national newspapers, magazines,news publications, websites, social media sites, and trade journals.publications. Additionally, the Company has expanded its use of job boards and aggregators in all aspects of sales and recruitment. Joint marketing arrangements have been entered into with major software manufacturers and typically provide for development of proprietary skills tests, cooperative advertising, joint mailingse-mail campaigns, and similar promotional activities. The Company also actively seeks endorsements and affiliations with professional organizations in the business management, technology, office administration, and professional secretarial fields. In addition,2Local employeesRobert Half staffing and recruiting professionals are encouraged to be active in civic organizations and industry trade groups.2013,2015, the Company conducted its staffing services operations through 345332 offices in 42 states, the District of Columbia and 1817 foreign countries. Office managers are responsible for most activities of their offices, including sales, local advertising and marketing and recruitment.2013,2015, Protiviti had 5956 offices in 23 states and 11 foreign countries.313,00016,100 full-time employees, including approximately 2,7003,300 engaged directly inProtiviti operations. In addition, the Company placed approximately 197,000220,000 temporary employees on assignments with clients during 2013.2015. Employees placed by the Company on assignment with clients are the Company’s employees for all purposes while they are working on assignments. The Company pays the related costs of employment, such as workers’ compensation insurance, state and federal unemployment taxes, social security and certain fringe benefits. The Company provides access to voluntary health insurance coverage to interested temporary employees.crisisdownturn may continue to harm the Company’s business and financial condition. The world economy may continueMany of the Company’s markets, particularly in Europe, are currently experiencing a prolonged economic downturn characterized by high unemployment, limited availability of credit and decreased consumer and business spending. Given the nature of the Company’s business, financial results could be significantly harmed should such a prolongedthis downturn occur.continue for an extended period of time or intensify. In the past, the Company’s business has suffered during periods of high unemployment as demand for staffing services tends to significantly decrease during such periods. ThisThe impact of this downturn on the Company’s business could be further dramatized given the unprecedentedsevere impact it has had and may continue to have on the global labor markets.4Company’sCompany’s business. The demand for the Company’s services, in particular its staffing services, is highly dependent upon the state of the economy and upon the staffing needs of the Company’s clients. Any variation in the economic condition or unemployment levels of the U.S. or of any of the foreign countries in which the Company does business, or in the economic condition of any region of any of the foregoing, or in any specific industry may severely reduce the demand for the Company’s services and thereby significantly decrease the Company’s revenues and profits.results.results. As a provider of temporary and permanent staffing solutions as well as consultant services, the Company’s reputation is dependent upon the performance of the employees it places with its clients and the services rendered by its consultants. The Company depends on its reputation and name recognition to secure engagements and to hire qualified employees and consultants. If the Company’s clients become dissatisfied with the performance of those employees or consultants or if any of those employees or consultants engage in or are believed to have engaged in conduct that is harmful to the Company’s clients, the Company’s ability to maintain or expand its client base may be harmed.alleging various wage and hour related claims that could cause the Company to incur substantial liabilities. The Company and certain subsidiaries are defendants in several actual or asserted class and representative action lawsuits brought by or on behalf of the Company’s current and former employees alleging violations of federal and state law with respect to certain wage and hour related matters.matters, as well as claims challenging the Company’s compliance with the Fair Credit Reporting Act. The various claims made in one or more of such lawsuits include, among other things, the misclassification of certain employees as exempt employees under applicable law, failure to comply with wage statement requirements, failure to compensate certain employees for time spent performing activities related to the interviewing process, and other related wage and hour violations. Such suits seek, as applicable, unspecified amounts for unpaid overtime compensation, penalties, and other damages, as well as attorneys’ fees. It is not possible to predict the outcome of these lawsuits. However, these lawsuits may consume substantial amounts of the Company’s financial and managerial resources and might result in adverse publicity, regardless of the ultimate outcome of the lawsuits. In addition, the Company and its subsidiaries may become subject to similar lawsuits in the same or other jurisdictions. An unfavorable outcome with respect to5operatesoperates in a highly competitive businessand may be unable to retain clients or market share. The staffing services business is highly competitive and, because it is a service business, the barriers to entry are quite low. There are many competitors, some of which have greater resources than the Company, and new competitors are entering the market all the time. In addition, long-term contracts form a negligible portion of the Company’s revenue. Therefore, there can be no assurance that the Company will be able to retain clients or market share in the future. Nor can there be any assurance that the Company will, in light of competitive pressures, be able to remain profitable or, if profitable, maintain its current profit margins.Company.InCompany. In addition, the Company’s temporary services business entails employing individuals on a temporary basis and placing such individuals in clients’ workplaces. Increased government regulation of the workplace or of the employer-employee relationship, or judicial or administrative proceedings related to such regulation, could materially adversely affect the Company. In addition, to the extent that government regulation imposes increased costs upon the Company, such as unemployment insurance taxes, there can be no assurance that such costs will not adversely impact the Company’s profit margins. Further, lawsuits or other proceedings related to the Company’s compliance with government regulations or licensing requirements could materially adversely affect the Company. For example, the Company is currently named as a defendant in litigation challenging its compliance with the Fair Credit Reporting Act. It is not possible to predict the outcome of such litigation; however, such litigation or any future lawsuits or proceedings related to the Company’s compliance with government regulation or licensing requirements could consume substantial amounts of the Company’s financial and managerial resources and might result in adverse publicity, regardless of the ultimate outcome of any such lawsuits or other proceedings. An unfavorable outcome with respect to such litigation or any future lawsuits or proceedings could, individually or in the aggregate, cause the Company to incur substantial liabilities that may have a material adverse effect upon the Company’s business, financial condition or results of operations.(collectively, the “Health Care Reform Laws”(the “PPACA”) werewas signed into law in the United States. The Health Care Reform Laws include a large number of health-related provisions, includingPPACA imposed new mandates on individuals and employers, requiring most individuals to have health insurance and, establishing new regulations on health plans. Although the Health Care Reform Laws do not mandate that employers offer health insurance, beginning in 2015, assessing penalties will be assessed on large employers whothat do not offer health insurance that meets certain coverage, value, or affordability or benefit requirements.standards. Beginning 2015, the Company has redesigned its employee benefits to offer health insurance coverage to its temporary candidates in a way that it believes meets the requirements of the PPACA’s employer mandate. Providing such additional health insurance benefits and an increase in the number of employees who elect to participate in the Company’s employees, or the payment of penalties if such coverage is not provided, willhealth plans may significantly increase the Company’s expense. Ifhealth care-related costs as compared to historical periods. While the Company is unableattempting to raiserecover these costs from its customers, there can be no assurance that it will be successfully able to do so, and any difficulties it encounters in recovering such costs will cause its financial results to suffer.ratesregulations governing the PPACA’s employer mandate are new and subject to interpretation, it charges itsis possible that despite the Company’s efforts, the Company may incur liability in the form of penalties, fines, or damages if:to cover this expense,seek indemnification for health care claims by candidates working on client assignments.increases in expensepenalties, fines, or damages could harmhave a material adverse effect on the Company’s financial and operating results.systems.systems, some of which are managed by third-party vendors. The Company’s primary computer systems and operations are vulnerable to damage or interruption from power outages, computer and telecommunications failures, computer viruses, security breaches, catastrophic events and errors in usage by the Company’s employees.employees and those of the Company’s vendors. In particular, the Company’s employees or vendors may have access or exposure to personally identifiable or otherwise confidential information and customer data and systems, the misuse of which could result in legal liability. Cyber-attacks, including attacks motivated by grievances against the business services industry in general or against the Company in particular, may disable or damage its systems. It is possible that the Company’s security controls or those of its third-party vendors over personal and other data and other practices it follows may not prevent the improper access to or disclosure of personally identifiable or otherwise confidential information. Such disclosure or damage to the Company’s systems could harm its reputation and subject it to government sanctions and liability under its contracts and laws that protect personal data and confidential information, resulting in increased costs or loss of revenue. The potential risk of security breaches and cyber-attacks may increase as the Company introduces new service offerings.ThisSimilarly there are a number of proposals currently being considered by the U.S. Congress to further delay or, in some cases, remove the requirements of Sarbanes-Oxley for a number of public companies. These or other similar delays or modifications of the Sarbanes Oxley requirements could decrease demand for Protiviti’sProtiviti’s services.clients.clients or be able to maintain the technology, personnel and other requirements to successfully compete.72013,2015, placement activities were conducted through 345332 offices located in the United States, Canada, the United Kingdom, Belgium, Brazil, France, the Netherlands, Germany, Italy, Luxembourg, Switzerland, Japan, China, Singapore, Australia, New Zealand, Austria, the United Arab Emirates, and Chile. As of December 31, 2013,2015, Protiviti had 5956 offices in the United States, Canada, Australia, China, France, Germany, Italy, the Netherlands, Japan, Singapore, India and the United Kingdom. All of the offices are leased.business, financial condition or results of operations, financial position or cash flows, litigation is subject to certain inherent uncertainties.8Item 5.Market for Registrant’s Common Equity, Related Stockholder Matters and Issuer Purchases of Equity Securities2014,2016, there were 1,6721,303 holders of record of the Common Stock. Sales Prices High Low $ 42.33 $ 37.16 $ 39.23 $ 30.64 $ 37.75 $ 31.08 $ 37.59 $ 32.22 Sales Prices High Low $ 31.84 $ 25.10 $ 29.41 $ 25.70 $ 32.32 $ 26.00 $ 31.00 $ 26.92 Sales Prices 2015 High Low 4th Quarter $ 54.01 $ 44.95 3rd Quarter $ 58.00 $ 49.18 2nd Quarter $ 60.54 $ 54.58 1st Quarter $ 63.27 $ 55.60 Sales Prices 2014 High Low 4th Quarter $ 59.45 $ 45.30 3rd Quarter $ 53.08 $ 46.98 2nd Quarter $ 48.13 $ 39.57 1st Quarter $ 43.06 $ 38.62 $.16$.20 per share were declared and paid in each quarter of 2013.2015. Cash dividends of $.15$.18 per share were declared and paid in each quarter of 2012. Total
Number of
Shares
Purchased Average
Price Paid
per Share Total
Number of
Shares
Purchased
as Part of
Publicly
Announced
Plans Maximum
Number of
Shares that May
Yet Be
Purchased
Under Publicly
Announced
Plans (b) — — — 8,617,378 — — — 8,617,378 1,083,897 (a) $ 39.74 525,816 8,091,562 1,083,897 525,816 October 1, 2015 to October 31, 2015 — — — 11,823,541 November 1, 2015 to November 30, 2015 100,000 $ 50.90 100,000 11,723,541 December 1, 2015 to December 31, 2015 1,590,345 (a) $ 47.22 1,310,947 10,412,594 Total October 1, 2015 to December 31, 2015 1,690,345 1,410,947 (a) Includes 558,081279,398 shares repurchased in connection with employee stock plans, whereby Company shares were tendered by employees for the payment of applicable withholding taxes and/or exercise price.(b) Commencing in October 1997, the Company’s Board of Directors has, at various times, authorized the repurchase, from time to time, of the Company’s common stock on the open market or in privately negotiated transactions depending on market conditions. Since plan inception, a total of 98,000,000108,000,000 shares have been authorized for repurchase of which 89,908,43897,587,406 shares have been repurchased as of December 31, 2013.2015.92013,2015, the cumulative total return of the Company’s Common Stock, an index of certain publicly traded employment services companies, and the S&P 500. The graph assumes the investment of $100 at the beginning of the period depicted in the chart and reinvestment of all dividends. The information presented in the graph was obtained by the Company from outside sources it considers to be reliable but has not been independently verified by the Company.Previously, the peer group for this graph included SFN Group Inc. During the five-year period, SFN Group was acquired by Randstad Holdings N.V. in an all cash transaction. The Company and all of the other members of the peer group are based in the U.S. and traded on either the New York Stock Exchange (“NYSE”) or NASDAQ. Randstad is based in Europe and is not traded on either the NYSE or NASDAQ. Accordingly, the Company believes it is appropriate to adjust its peer group to not include Randstad and to add two other companies that provide professional staffing services (Kforce Inc. and Resources Connection Inc.) that are based in the U.S. and traded on either the NYSE or NASDAQ. The accompanying chart shows the performance of both the new peer group and the old peer group (with SFN Group being included for the period prior to its acquisition and Randstad being included for the period subsequent to its acquisition of SFN Group).
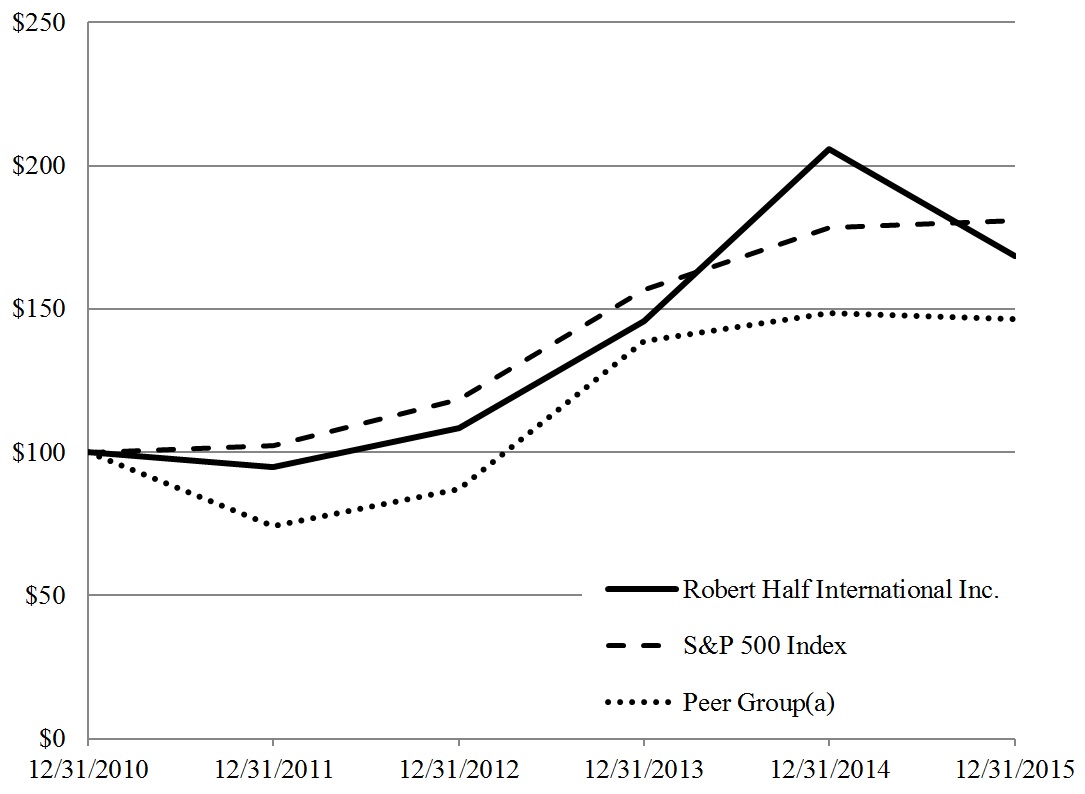
(a) This index represents the cumulative total return of the Company and the following corporations providing temporary or permanent employment services: CDI Corp.; Kelly Services, Inc.; Kforce Inc.; ManpowerGroup; and Resources Connection Inc. (b)This index represents the cumulative total return of the Company and the following corporations providing temporary or permanent employment services: CDI Corp.; Kelly Services, Inc.; ManpowerGroup; and SFN Group Inc./Randstad Holdings NV. Effective September 2, 2011, SFN Group Inc. was acquired by Netherlands-based Randstad Holdings NV. Accordingly, this index reflects the performance of SFN Group prior to such acquisition and the performance of Randstad Holdings thereafter.10Item 6.Selected Financial Data Years Ended December 31, 2013 2012 2011 2010 2009 (in thousands) $ 4,245,895 $ 4,111,213 $ 3,776,976 $ 3,175,093 $ 3,036,547 2,522,803 2,462,153 2,287,374 1,981,060 1,932,868 1,723,092 1,649,060 1,489,602 1,194,033 1,103,679 1,324,815 1,305,614 1,240,184 1,079,033 1,036,899 1,700 398 153 411 1,460 (1,002 ) (1,197 ) (951 ) (579 ) (1,443 ) 397,579 344,245 250,216 115,168 66,763 145,384 134,303 100,294 49,099 29,500 $ 252,195 $ 209,942 $ 149,922 $ 66,069 $ 37,263 $ 252,192 $ 208,867 $ 147,772 $ 63,729 $ 35,067 Years Ended December 31, 2013 2012 2011 2010 2009 (in thousands, except per share amounts) $ 1.85 $ 1.51 $ 1.05 $ .45 $ .24 $ 1.83 $ 1.50 $ 1.04 $ .44 $ .24 136,153 138,201 140,479 142,833 145,912 137,589 139,409 141,790 144,028 146,611 $ .64 $ .60 $ .56 $ .52 $ .48 December 31, 2013 2012 2011 2010 2009 (in thousands) $ 1,490,271 $ 1,381,271 $ 1,311,836 $ 1,273,984 $ 1,283,535 $ 1,300 $ 1,428 $ 1,545 $ 1,656 $ 1,779 $ 919,643 $ 842,011 $ 800,505 $ 834,371 $ 899,810 11 Years Ended December 31, 2015 2014 2013 2012 2011 (in thousands) Income Statement Data: Net service revenues $ 5,094,933 $ 4,695,014 $ 4,245,895 $ 4,111,213 $ 3,776,976 2,980,462 2,772,098 2,522,803 2,462,153 2,287,374 Gross margin 2,114,471 1,922,916 1,723,092 1,649,060 1,489,602 Selling, general and administrative expenses 1,533,799 1,425,734 1,324,815 1,305,614 1,240,184 Amortization of intangible assets 192 557 1,700 398 153 Interest income, net (550 ) (724 ) (1,002 ) (1,197 ) (951 ) Income before income taxes 581,030 497,349 397,579 344,245 250,216 Provision for income taxes 223,234 191,421 145,384 134,303 100,294 Net income $ 357,796 $ 305,928 $ 252,195 $ 209,942 $ 149,922 Net income available to common stockholders—diluted $ 357,796 $ 305,928 $ 252,192 $ 208,867 $ 147,772 Years Ended December 31, 2015 2014 2013 2012 2011 (in thousands, except per share amounts) Net Income Per Share: Basic $ 2.72 $ 2.28 $ 1.85 $ 1.51 $ 1.05 Diluted $ 2.69 $ 2.26 $ 1.83 $ 1.50 $ 1.04 Shares: Basic 131,749 134,358 136,153 138,201 140,479 Diluted 132,930 135,541 137,589 139,409 141,790 Cash Dividends Declared Per Share $ .80 $ .72 $ .64 $ .60 $ .56 December 31, 2015 2014 2013 2012 2011 (in thousands) Balance Sheet Data: Total assets $ 1,702,960 $ 1,647,267 $ 1,490,271 $ 1,381,271 $ 1,311,836 $ 1,007 $ 1,159 $ 1,300 $ 1,428 $ 1,545 Stockholders’ equity $ 1,003,781 $ 979,858 $ 919,643 $ 842,011 $ 800,505 Item 7.Management’s Discussion and Analysis of Financial Condition and Results of Operations4.6%4.4% as of December 31, 20132015 and 2012,2014, respectively. As of December 31, 2013,2015, a five-percentage point deviation in the Company’s accounts receivable allowances balance would have resulted in an increase or decrease in the allowance of $1.4$1.8 million. Although future results cannot always be predicted by12$37.0$26.3 million and $39.3$29.6 million were recorded as of December 31, 20132015 and 2012,2014, respectively. The valuation allowances recorded related primarily to net operating losses in certain foreign operations. If such losses are ultimately utilized to offset future operating income, the Company will recognize a tax benefit up to the full amount of the related valuation reserve.2013,2015, and determined that no adjustment to the carrying value of goodwill was required. There were no events or changes in circumstances duringsince the six months ended December 31, 2013annual goodwill impairment assessment that caused the Company to perform an interim impairment assessment.2013,2015, of $127.4$126.1 million, $26.6$26.3 million, $0.0 million, $7.2$7.0 million, $0.0 million and $39.6$49.2 million, respectively, totaling $200.8$208.6 million. There were no changes to the Company’s reporting units or to the allocations of goodwill by reporting unit for the year ended December 31, 2013.2015.132013,2015, using unique assumptions for each reporting unit. In addition, the Company applied profitability assumptions consistent with each reporting unit’s historical trends at various revenue levels and, for years 20152017 and beyond, used a 5% growth factor to calculate the terminal value at the end of ten years for each unit.factor. This rate is comparable to the Company’s most recent ten-year annual compound revenue growth rate. The future cash flows used to calculate fair value go out a total of 10 years with a terminal value calculation at the end of the 10 year period. In its most recent calculation, the Company used a 10.5%10.0% discount rate, which is slightly higherlower than the 10.0%10.2% discount rate used for the Company’s test during the second quarter of 2012.2014. This increasedecrease in discount rate is primarily attributable primarily to an increaseslight decreases in the risk free rate partially offset by a decrease in theand equity market risk premium.70%74% would be required before any reporting unit would have a carrying value in excess of its fair value.$10.9 millionrepresenting 0.11%, 0.16% and $7.9 million, representing 0.22%, 0.36% and 0.30% of applicable U.S. revenue for the years ended December 31, 2015, 2014 and 2013, 2012 and 2011, respectively.2013,2015, a five-percentage point deviation in the Company’s estimated loss development rates would have resulted in an increase or decrease in the reserve of $0.2 million.142013,2015, the Company utilized an historical volatility of 32.23%23.70%, a 0% dividend yield and a risk-free interest rate of 0.36%0.84%. The historical volatility was based on the most recent 2.61-year2.76-year period for the Company and the components of the peer group. The stock price projection for the Company and the components of the peer group assumes a 0% dividend yield. This is mathematically equivalent to reinvesting dividends in the issuing entity over the performance period. The risk-free interest rate is equal to the yield, as of the measurement date, of the zero-coupon U.S. Treasury bill that is commensurate with the remaining performance measurement period.The Company determines the fair value of options to purchase common stock using the Black-Scholes valuation model. The Company recognizes expense over the service period for options that are expected to vest and records adjustments to compensation expense at the end of the service period if actual forfeitures differ from original estimates. The Company has not granted any options to purchase common stock since 2006. There was no compensation expense related to stock options for the years ended December 31, 2013, 2012 and 2011.2013, 20122015, 2014 and 2011,2013, compensation expense related to restricted stock and stock units was $38.9$41.3 million, $41.5$40.8 million and $50.9$38.9 million, respectively, of which $9.9$11.1 million, $11.4$11.7 million and $13.3$9.9 million was related to grants made in 2015, 2014 and 2013, 2012 and 2011, respectively. ABased on the Company’s results for the year ended December 31, 2015, a one-percentage point deviation in the estimated forfeiture rates would have resulted in a $0.4 million $0.4 million and $0.5 million increase or decrease in compensation expense related to restricted stock and stock units for each year ended December 31, 2013, 2012 and 2011, respectively.improvingimproved global economic conditions during 2013.2015. Because of the inherent difficulty in predicting economic trends and the absence of material long-term contracts in any of ourthe Company's business units, future demand for the Company’s services cannot be forecastedforecast with certainty. We expect totalbelieve the Company resultsis well positioned to continuebenefit in the current United States macroeconomic environment. We are making investments in people and infrastructure to be impacted by general macroeconomic conditionssupport business expansion, and are confident in 2014.345332 offices in 42 states, the District of Columbia and 1817 foreign countries, while Protiviti has 5956 offices in 23 states and 11 foreign countries.Because fluctuations in foreign currency exchange rates have an impact on the Company’sprovides selected growth percentages below on a constant-currency basis. Constant-currency percentages are calculated using as-reported amounts which have been retranslated using foreign currency exchange rates fromprepared in conformity with accounting principles generally accepted in the prior year’s comparable period.15Non-GAAP Financial Measurestemporary and consultant staffing and permanent placement staffingreportable segments on both a reported basis and also on a same day, constant-currency basis for global, U.S. and international operations. The Company has provided this data because management believes it better reflects the Company’s actual revenue growth rates and aids in evaluating revenue trends over time. The Company expresses year-over-year revenue changes as calculated percentages using the same number of billing days and constant currency exchange rates. staffing lines of business. In order to remove the fluctuations caused by comparable periods having different billing days, the Company calculates same billing day revenue growth rates by dividing each comparative period’s reported revenues by the calculated number of billing days for that period, to arrive at a per billing day amount. Same billing day growth rates are then calculated based upon the per billing day amounts. The term “same billing days and constant currency” means that the impact of different billing days has been removed from the constant currency calculation.20132015 and 20122014$4.25$5.09 billion for the year ended December 31, 2013,2015, increasing by 3.3%8.5% compared to $4.11$4.70 billion for the year ended December 31, 2012.2014. Revenues from foreign operations represented 24%19% and 26%23% of total revenues for the years ended December 31, 20132015 and 2012,2014, respectively. The Company analyzes its revenues for three reportable segments: temporary and consultant staffing, permanent placement staffing and risk consulting and internal audit services. In 2013,2015, revenues for all three of the Company’s reportable segments were up compared to 2012.2014. Results were strongest domestically with growth rates outside the United States impacted by weaker economiesdemand also improving in several other countries, most notably within Europe. Risk consulting and internal audit services continued to post strong growth rates. Contributing factors for each reportable segment are discussed below in further detail.$3.37$3.93 billion for the year ended December 31, 2013,2015, increasing by 1.4%6.9% compared to revenues of $3.32$3.68 billion for the year ended December 31, 2012.2014. Key drivers of temporary and consultant staffing services revenues include average hourly bill rates and the number of hours worked by the Company’s temporary employees on client engagements. On a same-day, constant-currency basis, temporary and consultant staffing services revenues increased 1.6%10.3% for 20132015, compared to 2012.2014, due primarily to an increase in temporary hours worked by the Company's20132015 revenues increased 4.1%, or 4.3%11.5% on an as reported basis and 11.4% on a same-day basis, compared to 2012.2014. For the Company’s international operations, 20132015 revenues decreased 6.7%8.9% on an as reported basis and increased 6.4% on a same-day, constant-currency basis, decreased 6.5%, compared to 2012.$348$421 million for the year ended December 31, 2013,2015, increasing by 4.0%6.8% compared to revenues of $334$395 million for the year ended December 31, 2012.2014. Key drivers of permanent placement staffing revenues consist of the number of candidate placements and average fees earned per placement. On a same-day, constant-currency basis, permanent placement revenues increased 5.1%11.7% for 20132015 compared to 2012.2014. In the1620132015 revenues increased 12.5%, or 12.7%15.5% on an as reported basis and 15.4% on a same-day basis, compared to 2012.2014. For the Company’s international operations, 20132015 revenues decreased 7.5%,9.3% on an as reported basis, and on a same-day, constant-currency basis decreased 5.3%increased 4.9%, compared to 2012.2014, driven primarily by an increase in number of placements. Historically, demand for permanent placement services is even more sensitive to economic and labor market conditions than demand for temporary and consulting staffing services and this is expected to continue.2013,2015, is presented in the following table: Global United States International 1.4 % 4.1 % -6.7 % 0.2 % 0.2 % 0.2 % 0.0 % — 0.0 % 1.6 % 4.3 % -6.5 % 4.0 % 12.5 % -7.5 % 0.2 % 0.2 % 0.2 % 0.9 % — 2.0 % 5.1 % 12.7 % -5.3 % Risk consulting and internal audit services revenues were $528 million for the year ended December 31, 2013, increasing by 16.7% compared to revenues of $453 million for the year ended December 31, 2012. Contributing to the increase was higher demand in the U.S. In the U.S., 2013 revenues increased 20.5% compared to 2012. For the Company’s international operations, 2013 revenues increased 4.2% compared to 2012. Global United States International Temporary and consultant staffing As Reported 6.9 % 11.5 % -8.9 % Billing Days Impact 0.0 % -0.1 % -0.1 % Currency Impact 3.4 % — 15.4 % Same Billing Days and Constant Currency 10.3 % 11.4 % 6.4 % Permanent placement staffing As Reported 6.8 % 15.5 % -9.3 % Billing Days Impact -0.1 % -0.1 % 0.0 % Currency Impact 5.0 % — 14.2 % Same Billing Days and Constant Currency 11.7 % 15.4 % 4.9 % Risk consulting and internal audit services As Reported 19.0 % 22.3 % 4.0 % Billing Days Impact 0.1 % 0.2 % 0.2 % Currency Impact 2.7 % — 14.5 % Same Billing Days and Constant Currency 21.8 % 22.5 % 18.7 % $1.72$2.11 billion for the year ended December 31, 2013,2015, up 4.5%10.0% from $1.65$1.92 billion for the year ended December 31, 2012.2014. For 20132015 compared to 2012,2014, gross margin dollars for all three of the Company’s reportable segments increased. Gross margin dollars as a percentage of revenues increased for both the Company’s temporary and consultant staffing services segment and the risk consulting and internal audit services segment on a year-over-year basis. Contributing factors for each reportable segment are discussed below in further detail.insurancebenefit costs for temporary employees, and reimbursable expenses. The$1.22$1.46 billion for the year ended December 31, 2013,2015, up 1.9%8.8% from $1.20$1.35 billion for the year ended December 31, 2012.2014. As a percentage of revenues, gross margin dollars for temporary and consultant staffing services were 36.2%37.2% in 2013,2015, up from 36.0%36.6% in 2012.$348$421 million for the year ended December 31, 2013,2015, up 4.1%6.7% from $334$394 million for the year ended December 31, 2012.2014. Because reimbursable expenses for permanent placement staffing services are de minimis, the increase in gross margin dollars is substantially explained by the increase in revenues previously discussed.insurancebenefit costs and reimbursable expenses. The primary drivers of$155$230 million for the year ended December 31, 2013,2015, up 32%25.6% from $117$183 million for the year ended December 31, 2012.2014. As a percentage of revenues, gross margin dollars for risk consulting and internal audit services were 29.3%31.0% in 2013,1725.9%29.4% in 2012.2014. The increaseimprovement in 2013 gross margin percentage2015 compared to 2014 was primarily the result of higher staff utilization rates. Utilization is the relationshipdue to a better alignment of the time spent onmix of professional staff relative to client engagements to the total time available for the Company’s risk consulting and internal audit services staff.$1.32$1.53 billion for the year ended December 31, 2013,2015, up 1.5%7.6% from $1.31$1.43 billion for the year ended December 31, 2012.2014. As a percentage of revenues, the Company’s selling, general and administrative expenses were 31.2%30.1% for 2013,2015, down from 31.8%30.4% for 2012. For 2013 compared to 2012,2014. In 2015, selling, general and administrative expenses decreasedincreased for all three of the Company’s temporaryreportable segments compared to 2014. As percentage of revenue, selling, general and consultant segment and increasedadministrative expenses for the Company’s permanent placement staffing services and risk consulting and internal audit services segments. Selling,divisions decreased in 2015 compared to 2014, however for the temporary and consulting staffing division, selling, general and administrative expenses increased as a percentage of revenues decreased for the Company’s temporary and consultant and risk consulting and internal audit services segments and increased for the Company’s permanent placement staffing services segment in 2013 compared to 2012.revenue. Contributing factors for each reportable segment are discussed below in further detail.$920$1.06 billion for the year ended December 31, 2015, up 7.8% from $987 million for the year ended December 31, 2013, down 0.2% from $921 million for the year ended December 31, 2012.2014. As a percentage of revenues, selling, general and administrative expenses for temporary and consultant staffing services were 27.3%27.1% in 2013, down2015, up from 27.7%26.8% in 2012.2014. For 20132015 compared to 2012,2014, the decreaseincrease in selling, general and administrative expenses as a percentage of revenue is primarily due to an increase in field compensation expense and variable overhead, partially offset by a $19 million, or 0.6% of revenues, chargedecrease in 2012 related to a litigation settlement disclosed in the Company’s July 5, 2012, Form 8-K.$293$336 million for the year ended December 31, 2013,2015, up 5.4%6.2% from $278$316 million for the year ended December 31, 2012.2014. As a percentage of revenues, selling, general and administrative expenses for permanent placement staffing services were 84.3%79.7% in 2013, up2015, down from 83.3%80.1% in 2012.2014. For 20132015 compared to 2012, increases2014, decreases in field compensationfixed overhead and variable overhead, partially offset by decreasesan increase in advertising expenses and fixed overhead,field compensation drove the overall increasedecrease as a percentage of revenues.$112$134 million for the year ended December 31, 2013,2015, up 5.3%9.3% from $106$123 million for the year ended December 31, 2012.2014. As a percentage of revenues, selling, general and administrative expenses for risk consulting and internal audit services were 21.2%18.1% in 2013,2015, down from 23.5%19.7% in 2012.2014. For 20132015 compared to 2012,2014, improved leverage inof general and administrative expenses, as a result of higher revenue, drove the overall decrease as a percentage of revenues.$398$581 million, or 9.4%11.4% of revenues, for the year ended December 31, 2013,2015, up 16.0%16.8% from $343$497 million, or 8.4%10.6% of revenues, for the year ended December 31, 2012.2014. For the Company’s temporary and consultant staffing services division, operating income was $301$400 million, or 8.9%10.2% of applicable revenues, up 8.8%11.5% from $277$359 million, or 8.3%9.8% of applicable revenues, in 2012.2014. For the Company’s permanent placement$54$85 million, or 15.6%20.2% of applicable revenues, down 2.4%up 8.5% from operating income of $55$78 million, or 16.7%19.9% of applicable revenues, in 2012.2014. For the Company’s risk consulting and internal audit services division, operating income was $43$96 million, or 8.1%12.9% of applicable revenues, up 292.7%58.9% from operating income of $11$60 million, or 2.4%9.7% of applicable revenues, in 2012.36.6%relatively consistent at 38.4% and 39.0%38.5% for the years ended December 31, 20132015 and 2012,2014, respectively. The 2013 decrease is primarily due to foreign restructuring, improving foreign results, and increased federal tax credits.1820122014 and 20112013$4.11$4.70 billion for the year ended December 31, 2012,2014, increasing by 9%10.6% compared to $3.78$4.25 billion for the year ended December 31, 2011.2013. Revenues from foreign operations represented 26%23% and 30%24% of total revenues for the yearyears ended December 31, 20122014 and 2011,2013, respectively. The Company analyzes its revenues for three reportable segments: temporary and consultant staffing, permanent placement staffing and risk consulting and internal audit2012,2014, revenues for all three of the Company’s reportable segments were up compared to 2011.2013. Results were strongest domestically with growth rates outsidebroad-based revenue expansion across the United States impacted by weaker economies in several countries, most notably within Europe.Company’s staffing and consulting operations. Contributing factors for each reportable segment are discussed below in further detail.$3.32$3.68 billion for the year ended December 31, 2012,2014, increasing by 9.0%9.1% compared to revenues of $3.05$3.37 billion for the year ended December 31, 2011.2013. Key drivers of temporary and consultant staffing services revenues include average hourly bill rates and hours worked by the Company's temporary employees on client engagements. On a same-day, constant-currency basis, temporary and consultant staffing services revenues increased 10.0%9.5% for 20122014 compared to 2011.2013, due primarily to an increase in temporary hours worked by the Company's temporary employees and inclusive of a 3.2% increase in average bill rates. In the U.S., 20122014 revenues increased 13.7%, or 13.5%10.6% on both an as reported and a same-day basis, compared to 2011.2013. For the Company’s international operations, 20122014 revenues decreased 3.0%increased 4.2% and on a same-day, constant-currency basis increased 1.3%5.9%, compared to 2011.$334$395 million for the year ended December 31, 2012,2014, increasing by 10.6% 13.5%$302$348 million for the year ended December 31, 2011.2013. Key drivers of permanent placement staffing revenues consist of number of candidate placements and average fees earned per placement. On a same-day, constant- currencyconstant-currency basis, permanent placement revenues increased 12.6%14.3% for 20122014 compared to 2011.2013. In the U.S., 20122014 revenues increased 20.5%, or 20.2%17.8% on aboth an as reported and same-day basis, compared to 2011. For the Company’s international operations, 2012 revenues decreased 0.6%, and on a same-day, constant-currency basis increased 4.1%, compared to 2011.2013, driven primarily by an increase in number of placements. Historically, demand for permanent placement services is even more sensitive to economic and labor market conditions than demand for temporary and consulting staffing services and this is expected to continue.2012,2014, is presented in the following table: Global United States International 9.0 % 13.7 % -3.0 % -0.3 % -0.2 % -0.2 % 1.3 % — 4.5 % 10.0 % 13.5 % 1.3 % 10.6 % 20.5 % -0.6 % -0.3 % -0.3 % -0.2 % 2.3 % — 4.9 % 12.6 % 20.2 % 4.1 % Risk consulting and internal audit services revenues were $453 million for the year ended December 31, 2012, increasing by 6.8% compared to revenues of $424 million for the year ended December 31, 2011. Contributing to the increase was higher demand in the U.S. In the U.S., 2012 revenues increased 11% compared to 2011. For the Company’s international operations, 2012 revenues decreased 5% compared to 2011. Global United States International Temporary and consultant staffing As Reported 9.1 % 10.6 % 4.2 % Billing Days Impact 0.0 % 0.0 % 0.0 % Currency Impact 0.4 % — 1.7 % Same Billing Days and Constant Currency 9.5 % 10.6 % 5.9 % Permanent placement staffing As Reported 13.5 % 17.8 % 6.3 % Billing Days Impact 0.0 % 0.0 % 0.0 % Currency Impact 0.8 % — 2.2 % Same Billing Days and Constant Currency 14.3 % 17.8 % 8.5 % Risk consulting and internal audit services As Reported 18.1 % 21.9 % 3.8 % Billing Days Impact -0.8 % -0.9 % -0.8 % Currency Impact 0.2 % — 1.1 % Same Billing Days and Constant Currency 17.5 % 21.0 % 4.1 % $1.65$1.92 billion for the year ended December 31, 2012,2014, up 11%$1.49$1.72 billion for the year ended December 31, 2011.2013. For 20122014 compared to 2011,2013, gross margin dollars for all three19decreased for the Company’s risk consulting and internal audit services segment on a year-over-year basis. Contributing factors for each reportable segment are discussed below in further detail.insurancebenefit costs for temporary employees, and reimbursable expenses.expenses.The key drivers of gross margin are: i) pay/bill spreads, which represent the differential between wages paid to temporary employees and amounts billed to clients; ii) fringe costs, which are primarily composed of payroll taxes and benefit costs for$1.20$1.35 billion for the year ended December 31, 2012,2014 , up 12%10.2% from $1.07$1.22 billion for the year ended December 31, 2011.2013. As a percentage of revenues, gross margin dollars for temporary and consultant staffing services were 36.0% for 2012,36.6% in 2014, up from 35.2%36.2% in 2011.$334$394 million for the year ended December 31, 2012,2014, up 11%13.5% from $302$348 million for the year ended December 31, 2011.2013. Because reimbursable expenses for permanent placement staffing services are de minimis, the increase in gross margin dollars is substantially explained by the increase ininsurancebenefit costs and reimbursable expenses. The primary drivers of$117$183 million for the year ended December 31, 2012,2014, up 3%18.5% from $114$155 million for the year ended December 31, 2011.2013. As a percentage of revenues, gross margin dollars for risk consulting and internal audit services were 25.9%29.4% in 2012, down2014, up from 26.8%29.3% in 2011. Lower2013. The increase in 2014 gross margin percentagesCompany’s international operations contributedmix of professional staff relative to the decrease in 2012 gross margin percentage.$1.31$1.43 billion for the year ended December 31, 2012,2014, up 5%7.6% from $1.24$1.32 billion for the year2011.2013. As a percentage of revenues, the Company’s selling, general and administrative expenses were 31.8%2012,2014, down from 32.8%31.2% for 2011. For 2012 compared to 2011,2013. In 2014, selling, general and administrative expenses increased for all three of thetemporary and consultant and permanent placement staffing servicesreportable segments and decreased for the Company’s risk consulting and internal audit services segment. Selling,compared to 2013. As percentage of revenue, selling, general and administrative expenses as a percentage of revenues decreased for20122014 compared to 2011.2013. Contributing factors for each reportable $9212012,2014, up 6%7.3% from $865$920 million for the year ended December 31, 2011.2013. As a27.7% 26.8%2012,2014, down from 28.3%27.3% in 2011.2013. For 20122014 compared to 2011,2013, the decrease in selling, general and administrative expenses asthean improvement in leverage resulting from higher operating leverage obtained by higher revenues, partially offset by a $19 million, or 0.6% of revenues, charge related to a litigation settlement disclosedrevenue in the Company’s July 5, 2012, Form 8-K.$278$316 million for the year ended December 31, 2012,2014, up 4%7.8% from $267$293 million for the year ended December 31, 2011.2013. As a percentage of revenues, selling, general and administrative expenses for permanent placement staffing services were 83.3%80.1% in 2012,2014, down from 88.2%84.3% in 2011.2013. For 20122014 compared to 2011, improved leverage2013, decreases in generalfield compensation, administrative compensation and administrative expenses, as a result of higher revenue,fixed overhead drove the overall decrease as a percentage of revenues. $1062012, down 2%2014, up 9.8% from $109$112 million for the year ended December 31, 2011.2013. As a23.5% 19.7%2012,2014, down from 25.6%21.2% in 2011.2013. For 20122014 compared to202011, 2013, improved leverage in general and administrative expenses, as$343$497 million, or 8.4%10.6% of revenues, for the year ended2012, up 38% from $249 million, or 6.6% of revenues, for the year ended December 31, 2011.2013. For the$277$359 million, or 8.3%9.8% of applicable32%19.0% from $209$301 million, or 6.9%8.9% of applicable revenues, in 2011.2013. For the Company’s permanent placement$55$78 million, or 16.7%19.9% of applicable revenues, up 58%44.0% from operating income of $35$54 million, or 11.7%15.6% of applicable revenues, in 2011.2013. For the Company’s risk consulting and internal audit services division,$11$60 million, or 2.4%9.7% of applicable revenues, up 119%41.2% from operating income of $5$43 million, or 1.2%8.1% of2011.39%38.5% and 40%36.6% for the years ended December 31, 20122011,2013, respectively. The 2012 decrease2014 increase is primarily due to the resolution of certainfewer available foreign tax matters.2013, 20122015, 2014 and 2011,2013, is primarily the net effect of funds generated by operations and the funds used for capital expenditures, repurchases of common stock and payment of dividends.$276$225 million, $288$287 million and $279$276 million at December 31, 2015, 2014 and 2013, 2012respectively. Operating activities provided $438 million during the year ended December 31, 2015, offset by $118 million and 2011,$369 million of net cash used in investing activities and financing activities, respectively. Operating activities provided $341 million during the year ended December 31, 2014, offset by $89 million and $230 million of net cash used in investing activities and financing activities, respectively. Operating activities provided $309 million during the year ended December 31, 2013, offset by $98 million and $220 million of net cash used in investing activities and financing activities, respectively.provided $289 million duringfor the year ended December 31, 2012, partially2015, was $438 million. This was composed of net income of $358 million adjusted upward for non-cash items of $89 million, offset by $73 million and $210 million of net cash used in investingchanges in working capital of $9 million. Net cash provided by operating activities and financing activities, respectively. Operating activities provided $256 million duringfor the year ended December 31, 2011,2014, was composed of net income of $306 million adjusted for non-cash items of $90 million, offset by $63 million and $226 million of net cash used in investing activities and financing activities, respectively.Operating activities—changes in working capital of $55 million. Net cash provided by operating activities for the year ended December 31, 2013, was composed of net income of $252 million adjusted for non-cash items of $74 million, and offset by net cash used inprovided by changes in working capital of $17 million. Net cash provided by operating2012,2015, was $118 million. This was composed of net incomecapital expenditures of $210$75 million, adjusteddeposits to trusts for non-cash itemsemployee deferred compensation plans of $74$28 million, and payment for an acquisition, net of cash acquired, of $15 million. Cash used in changes in working capital of $5 million. Net cash provided by operatinginvesting activities for the year ended December 31, 2011,2014, was $89 million. This was primarily composed of net incomecapital expenditures of $150 million adjusted for non-cash items of $122$63 million and net cash used in changes in working capitaldeposits to trusts for employee deferred compensation plans of $16$26 million.Investing activities—Cash used in investing activities for the year ended December 31, 2013, was $98 million. This was primarily composed of capital expenditures of $54 million and deposits to trusts for employee benefits and retirementdeferred compensation plans of $44 million.investingfinancing activities for the year ended December 31, 2012,2015, was $73$369 million. This was primarily composedincluded repurchases of capital expenditures$271 million in common stock and $108 million in cash dividends to stockholders, offset by the proceeds of $50$2 million deposits to trusts for employeefrom exercises of stock options and the excess tax benefits and retirement plansfrom stock-based compensation of $9 million and payment of acquisitions, net of cash acquired of $14 million. Cash used in investingfinancing activities for the year ended December 31, 2011,2014, was $63$230 million. This was primarily composedincluded repurchases of capital expenditures$154 million in common stock and $97 million in cash dividends to stockholders, offset by the proceeds of $57$14 million from exercises of stock options and deposits to trusts for employeethe excess tax benefits and retirement plansfrom stock-based compensation of $7 million.Financing activities—Cash used in financing activities for the year ended December 31, 2013, was $220 million. This included repurchases of $168 million in common stock, $89 million in cash dividends to stockholders and $4 million of payments of notes payable and other indebtedness, offset by the proceeds of $33 million from exercises of stock options and the excess tax benefits from stock-based compensation of $8 million. Cash used in financing activities for the year ended December 31, 2012, was $210 million. This included repurchases of $177 million in common stock and $84 million in cash dividends to stockholders, offset21by proceeds of $43 million from exercises of stock options and the excess tax benefits from stock-based compensation of $8 million. Cash used in financing activities for the year ended December 31, 2011, was $226 million. This included repurchases of $168 million in common stock and $80 million in cash dividends to stockholders, offset by proceeds of $18 million from exercises of stock options and the excess tax benefits from stock-based compensation of $4 million.2013,2015, the Company is authorized to repurchase, from time to time, up to 8.110.4 million additional shares of the Company’s common stock on the open market or in privately negotiated transactions, depending on market conditions. During the years ended December 31, 2013, 20122015, 2014 and 2011,2013, the Company repurchased approximately 4.3 million shares, 3.3 million shares 4.7 million shares and 5.33.3 million shares of common stock on the open market for a total cost of $118$228 million, $133$162 million and $142$118 million, respectively. Additional stock repurchases were made in connection with employee stock plans, whereby Company shares were tendered by employees for the payment of exercise price and applicable statutory withholding taxes. During the years ended December 31, 2013, 20122015, 2014 and 2011,2013, such repurchases totaled approximately 1.20.5 million shares, 1.70.5 million shares and 1.01.2 million shares at a cost of $44$25 million, $50$22 million and $29$44 million, respectively. Repurchases of shares have been funded with cash generated from operations.2013,2015, included $276$225 million in cash and cash equivalents. The Company expects that internally generated cash will be sufficient to support the working capital needs of the Company, the Company’s fixed payments, dividends, and other obligations on both a short-short-term and long-term basis.2014,2016, the Company announced a quarterly dividend of $0.18$.22 per share to be paid to all shareholders of record on February 25, 2014.2016. The dividend will be paid on March 14, 2014.20132015 (in thousands): Payments due by period 2014 2015 and 2016 2017 and 2018 Thereafter Total $ 252 $ 505 $ 505 $ 757 $ 2,019 88,434 132,398 74,613 86,276 381,721 28,392 26,702 6,155 — 61,249 2,116 1,621 872 14,430 19,039 $ 119,194 $ 161,226 $ 82,145 $ 101,463 $ 464,028 Payments due by period Contractual Obligations 2016 Thereafter Total Long-term debt obligations $ 252 $ 505 $ 505 $ 252 $ 1,514 Operating lease obligations 88,177 131,364 80,431 81,437 381,409 Purchase obligations 42,044 28,772 2,840 — 73,656 Other liabilities 1,062 1,853 669 6,493 10,077 Total $ 131,535 $ 162,494 $ 84,445 $ 88,182 $ 466,656 20142016 and thereafter under non-cancelable leases in effect at December 31, 2013.2015. Purchase obligations consist of purchase commitments primarily related to telecom service agreements, software licenses and subscriptions, and computer hardware and software maintenance agreements. Other liabilities consist of asset retirement and deferred compensation obligations.The above table does not reflect $6.1 million of gross unrecognized tax benefits which the Company has accrued for uncertain tax positions in accordance with FASB authoritative guidance. As of December 31, 2013, the Company classified $2.2 million of its unrecognized tax benefits ascurrent liability, as these amounts are expected to be resolved in the next twelve months. The remaining $3.9 million of unrecognized tax benefits have been classified as a non-current liability, as a reasonably reliable estimateportion of the period of future payments, if any, could not be determined.22Item 7A. Quantitativeand Qualitative Disclosures About Market RiskTheCompany’s net revenues are derived from its operations outside the U.S. and are denominated ininvestments in its foreign subsidiaries,assets and the intercompany transactions with its foreign subsidiaries.2013,2015, approximately 24%19% of the Company’s revenues were generated outside of the United States. These operations transact business in their functional currency, which is the same as their local currency. As a result, fluctuations in the value of foreign currencies against the U.S. dollar, particularly the Canadian dollar, British pound, Euro, and Australian dollar have an impact on the Company’s reported results. RevenuesUnder GAAP, revenues and expenses denominated in foreign currencies are translated into U.S. dollars at the monthly average exchange rates prevailing during the period. Consequently, as the value of the U.S. dollar changes relative to the currencies of the Company’s non-U.S. markets, the Company’s reported results vary.23Item8. Financial Statements and Supplementary Data December 31, 2013 2012 ASSETS $ 275,764 $ 287,635 551,905 512,852 112,881 102,993 231,978 161,205 1,172,528 1,064,685 200,833 201,339 556 2,256 112,644 107,680 3,710 5,311 $ 1,490,271 $ 1,381,271 LIABILITIES $ 139,683 $ 139,879 396,042 361,641 128 117 535,853 501,637 1,300 1,428 33,475 36,195 570,628 539,260 STOCKHOLDERS’ EQUITY — — 137 139 868,120 798,093 38,071 43,779 13,315 — 919,643 842,011 $ 1,490,271 $ 1,381,271 December 31, 2015 2014 ASSETS Cash and cash equivalents $ 224,577 $ 287,119 Accounts receivable, less allowances of $35,087 and $30,544 704,640 657,676 Current deferred income taxes 145,684 133,151 Other current assets 268,780 245,337 Total current assets 1,343,681 1,323,283 Goodwill 208,579 199,488 Other intangible assets, net 4,508 — Property and equipment, net 142,906 121,754 Other assets 3,286 2,742 Total assets $ 1,702,960 $ 1,647,267 LIABILITIES Accounts payable and accrued expenses $ 148,108 $ 175,107 Accrued payroll and benefit costs 504,782 448,115 Income taxes payable 2,506 — Current portion of notes payable and other indebtedness 153 140 Total current liabilities 655,549 623,362 Notes payable and other indebtedness, less current portion 1,007 1,159 Other liabilities 42,623 42,888 Total liabilities 699,179 667,409 Commitments and Contingencies (Note I) STOCKHOLDERS’ EQUITY — — 131 135 Capital surplus 979,477 928,157 Accumulated other comprehensive (loss) income (10,294 ) 14,730 Retained earnings 34,467 36,836 Total stockholders’ equity 1,003,781 979,858 Total liabilities and stockholders’ equity $ 1,702,960 $ 1,647,267 24 Years Ended December 31, 2013 2012 2011 $ 4,245,895 $ 4,111,213 $ 3,776,976 2,522,803 2,462,153 2,287,374 1,723,092 1,649,060 1,489,602 1,324,815 1,305,614 1,240,184 1,700 398 153 (1,002 ) (1,197 ) (951 ) 397,579 344,245 250,216 145,384 134,303 100,294 $ 252,195 $ 209,942 $ 149,922 $ 252,192 $ 208,867 $ 147,772 $ 1.85 $ 1.51 $ 1.05 $ 1.83 $ 1.50 $ 1.04 136,153 138,201 140,479 137,589 139,409 141,790 $ 0.64 $ .60 $ .56 Years Ended December 31, 2015 2014 2013 Net service revenues $ 5,094,933 $ 4,695,014 $ 4,245,895 2,980,462 2,772,098 2,522,803 Gross margin 2,114,471 1,922,916 1,723,092 Selling, general and administrative expenses 1,533,799 1,425,734 1,324,815 Amortization of intangible assets 192 557 1,700 Interest income, net (550 ) (724 ) (1,002 ) Income before income taxes 581,030 497,349 397,579 Provision for income taxes 223,234 191,421 145,384 Net income $ 357,796 $ 305,928 $ 252,195 Net income available to common stockholders—diluted $ 357,796 $ 305,928 $ 252,192 Net income per share (Note L): Basic $ 2.72 $ 2.28 $ 1.85 Diluted $ 2.69 $ 2.26 $ 1.83 Shares: Basic 131,749 134,358 136,153 Diluted 132,930 135,541 137,589 Cash dividends declared per share $ .80 $ .72 $ .64 25 Years Ended December 31, 2013 2012 2011 $ 252,195 $ 209,942 $ 149,922 (5,708 ) 2,892 (6,233 ) $ 246,487 $ 212,834 $ 143,689 Years Ended December 31, 2015 2014 2013 COMPREHENSIVE INCOME: Net income $ 357,796 $ 305,928 $ 252,195 Foreign currency translation adjustments, net of tax (25,024 ) (23,341 ) (5,708 ) Total comprehensive income $ 332,772 $ 282,587 $ 246,487 26 Years Ended December 31, 2013 2012 2011 139,439 142,086 146,183 1,091 1,443 1,425 (4,461 ) (6,350 ) (6,328 ) 1,397 2,260 806 137,466 139,439 142,086 $ 139 $ 142 $ 146 1 1 1 (4 ) (6 ) (6 ) 1 2 1 $ 137 $ 139 $ 142 $ 798,093 $ 759,476 $ 787,105 (1 ) (1 ) (1 ) — (7,715 ) (20,641 ) (12,256 ) (49,971 ) (81,024 ) 38,867 41,464 50,906 33,285 42,936 18,308 10,132 11,904 4,823 $ 868,120 $ 798,093 $ 759,476 $ 43,779 $ 40,887 $ 47,120 (5,708 ) 2,892 (6,233 ) $ 38,071 $ 43,779 $ 40,887 $ — $ — $ — 252,195 209,942 149,922 (162,029 ) (175,015 ) (149,922 ) (76,851 ) (34,927 ) — $ 13,315 $ — $ — Years Ended December 31, 2015 2014 2013 COMMON STOCK—SHARES: Balance at beginning of period 135,134 137,466 139,439 Net issuances of restricted stock 785 938 1,091 Repurchases of common stock (4,817 ) (3,798 ) (4,461 ) Exercises of stock options 54 528 1,397 Balance at end of period 131,156 135,134 137,466 COMMON STOCK—PAR VALUE: Balance at beginning of period $ 135 $ 137 $ 139 Net issuances of restricted stock 1 1 1 Repurchases of common stock (5 ) (4 ) (4 ) Exercises of stock options — 1 1 Balance at end of period $ 131 $ 135 $ 137 CAPITAL SURPLUS: Balance at beginning of period $ 928,157 $ 868,120 $ 798,093 Net issuances of restricted stock at par value (1 ) (1 ) (1 ) Cash dividends ($.64 per share) — — (12,256 ) Stock-based compensation expense 41,292 40,821 38,867 Exercises of stock options—excess over par value 1,529 14,323 33,285 Tax impact of equity incentive plans 8,500 4,894 10,132 Balance at end of period $ 979,477 $ 928,157 $ 868,120 ACCUMULATED OTHER COMPREHENSIVE (LOSS) INCOME: Balance at beginning of period $ 14,730 $ 38,071 $ 43,779 Foreign currency translation adjustments, net of tax (25,024 ) (23,341 ) (5,708 ) Balance at end of period $ (10,294 ) $ 14,730 $ 38,071 RETAINED EARNINGS: Balance at beginning of period $ 36,836 $ 13,315 $ — Net income 357,796 305,928 252,195 Repurchases of common stock—excess over par value (252,916 ) (183,969 ) (162,029 ) Cash dividends ($.80 per share, $.72 per share and $.64 per share) (107,249 ) (98,438 ) (76,851 ) Balance at end of period $ 34,467 $ 36,836 $ 13,315 27 Years Ended December 31, 2013 2012 2011 $ 252,195 $ 209,942 $ 149,922 1,700 398 153 47,072 48,326 51,262 38,867 41,464 50,906 (8,103 ) (8,475 ) (4,211 ) (13,259 ) (14,993 ) 17,156 7,467 7,133 6,673 (47,699 ) (21,354 ) (81,314 ) 38,356 16,672 64,932 (11,927 ) 15,160 6,368 4,548 (5,096 ) (5,531 ) 309,217 289,177 256,316 — (14,393 ) — (53,725 ) (50,056 ) (56,535 ) (44,052 ) (8,577 ) (6,867 ) (97,777 ) (73,026 ) (63,402 ) (167,975 ) (176,794 ) (168,103 ) (89,187 ) (84,129 ) (80,303 ) (4,496 ) (107 ) (91 ) 8,103 8,475 4,211 33,285 42,939 18,309 (220,270 ) (209,616 ) (225,977 ) (3,041 ) 1,764 (2,738 ) (11,871 ) 8,299 (35,801 ) 287,635 279,336 315,137 $ 275,764 $ 287,635 $ 279,336 $ 315 $ 405 $ 536 $ 168,407 $ 136,023 $ 76,422 $ — $ 5,942 $ 2,466 Years Ended December 31, 2015 2014 2013 CASH FLOWS FROM OPERATING ACTIVITIES: Net income $ 357,796 $ 305,928 $ 252,195 Adjustments to reconcile net income to net cash provided by operating activities: Amortization of intangible assets 192 557 1,700 Depreciation expense 53,273 49,124 47,072 41,292 40,821 38,867 Excess tax benefits from stock-based compensation (8,762 ) (7,174 ) (8,103 ) Deferred income taxes (8,579 ) (3,643 ) (13,259 ) Provision for doubtful accounts 12,005 9,825 7,467 Changes in assets and liabilities, net of effects of acquisitions: Increase in accounts receivable (75,745 ) (134,917 ) (47,699 ) 60,232 71,740 38,356 Increase (decrease) in income taxes payable 19,948 16,359 (11,927 ) Change in other assets, net of change in other liabilities (13,416 ) (7,922 ) 4,548 Net cash flows provided by operating activities 438,236 340,698 309,217 CASH FLOWS FROM INVESTING ACTIVITIES: Payments for acquisitions, net of cash acquired (14,668 ) — — Capital expenditures (75,057 ) (62,830 ) (53,725 ) Payments to trusts for employee deferred compensation plans (28,225 ) (25,811 ) (44,052 ) Net cash flows used in investing activities (117,950 ) (88,641 ) (97,777 ) CASH FLOWS FROM FINANCING ACTIVITIES: Repurchases of common stock (271,138 ) (153,821 ) (167,975 ) Cash dividends paid (107,561 ) (97,604 ) (89,187 ) Decrease in notes payable and other indebtedness (140 ) (128 ) (4,496 ) Excess tax benefits from stock-based compensation 8,762 7,174 8,103 Proceeds from exercises of stock options 1,529 14,324 33,285 Net cash flows used in financing activities (368,548 ) (230,055 ) (220,270 ) Effect of exchange rate changes on cash and cash equivalents (14,280 ) (10,647 ) (3,041 ) Net (decrease) increase in cash and cash equivalents (62,542 ) 11,355 (11,871 ) Cash and cash equivalents at beginning of period 287,119 275,764 287,635 Cash and cash equivalents at end of period $ 224,577 $ 287,119 $ 275,764 SUPPLEMENTAL DISCLOSURES OF CASH FLOW INFORMATION: Cash paid during the year for: Interest $ 285 $ 330 $ 315 Income taxes, net of refunds $ 212,668 $ 178,375 $ 168,407 Non-cash items: Stock repurchases awaiting settlement $ 11,935 $ 30,152 $ — 28personnel.professionals. Robert Half Technology provides informationproject and full-time technology professionals.Robert Half Legal provides temporary, project, and full-time staffing of attorneyslawyers, paralegals and specializedlegal support personnel within law firms and corporate legal departments.personnel. The Creative Group provides project staffinginteractive, design, marketing, advertising and public relations professionals. Protiviti is a global consulting firm that helps companies solve problems in the advertising, marketing, and web design fields.Protiviti provides business consultingfinance, technology, operations, governance, risk and internal audit, services, and is a wholly-ownedwholly owned subsidiary of the Company. Revenues are predominantly derived from specialized staffing services. The Company operates in North America, South America, Europe, Asia and Australia. The Company is a Delaware corporation.wholly-owned.wholly owned. All intercompany balances have been eliminated.2013,2015, such estimates included allowances for uncollectible accounts receivable, workers’ compensation losses and income and other taxes. Management estimates are also utilized in the Company’s goodwill impairment assessment and in the valuation of stock grants subject to market conditions.29NOTES TO CONSOLIDATED FINANCIAL STATEMENTS (Continued)Note A—Summary of Significant Accounting Policies (Continued)insurancebenefit costs for the Company’s temporary employees, as well as reimbursable expenses. Direct costs of permanent placement staffinginsurancebenefit costs, as well as reimbursable expenses.2013, 20122015, 2014 and 2011,2013, are reflected in the following table (in thousands): Years Ended December 31, 2013 2012 2011 $ 38,845 $ 42,256 $ 42,728 Years Ended December 31, 2015 2014 2013 Advertising Costs $ 44,015 $ 42,335 $ 38,845 2013,2015, and determined that no adjustment to the carrying value of goodwill was required. There were no events or changes in circumstances during the six months ended December 31, 20132015 that caused the Company to perform an interim impairment assessment.30NOTES TO CONSOLIDATED FINANCIAL STATEMENTS (Continued)Note A—Summary of Significant Accounting Policies (Continued)$37.0$26.3 million and $39.3$29.6 million were recorded as of December 31, 20132015 and 2012,2014, respectively. The valuation allowances recorded related primarily to net operating losses in certain foreign operations. If such losses are ultimately utilized to offset future operating income, the Company will recognize a tax benefit up to the full amount of the valuation reserve.state- operatedstate-operated insurance funds, and an estimate for the Company’s liability for Incurred But Not Reported (“IBNR”) claims and for the ongoing development of existing claims.31NOTES TO CONSOLIDATED FINANCIAL STATEMENTS (Continued)Note A—Summary of Significant Accounting Policies (Continued)The Company determines the fair value of options to purchase common stock using the Black-Scholes valuation model. The Company recognizes expense over the service period for options that are expected to vest and records adjustments to compensation expense at the end of the service period if actual forfeitures differ from original estimates. The Company has not granted any options to purchase common stock since 2006.2 to 3 years 2 to 5 years 5 years 2013, 20122015, 2014 and 2011,2013, are reflected in the following table (in thousands): Years Ended December 31, 2013 2012 2011 $ 13,027 $ 19,083 $ 18,133 Years Ended December 31, 2015 2014 2013 Internal-use software development costs $ 31,964 $ 24,367 $ 13,027 Balance Sheet Disclosures. In December 2011,April 2014, the Financial Accounting Standards Board (“FASB”("FASB") issued authoritative guidance in regards to the presentationcriteria for reporting discontinued operations while enhancing disclosures in this area. Under the new guidance, only disposals representing a strategic shift in operations should be presented as discontinued operations. In addition, the new guidance requires expanded disclosures about discontinued operations that will provide financial statement users with more information about the assets, liabilities, income, and expenses of netting assets and liabilities related to financial and derivative instruments as a single amountdiscontinued operations. The amendments in the statement of financial position to address the difference between GAAP and international financial reporting standards (“IFRS”). This authoritative guidance is to be applied for annual reporting periods beginning on or after January 1, 2013, and interim periods within those annual periods.were effective in the first quarter of 2015. The adoption of this guidance as of March 31, 2013, did not have ana material impact on the Company’sCompany's Financial Statements.Comprehensive Income.Revenue from Contracts with Customers. In March 2013,May 2014, the FASB issued authoritative guidance that provides companies with a single model for use in regardsaccounting for revenue arising from contracts with customers and supersedes current revenue recognition guidance, including industry-specific revenue guidance. The new guidance requires a company to comprehensive incomerecognize revenue to depict the transfer of goods or services to a customer at an amount that reflects the consideration it expects to receive in exchange for those goods or services. It also requires additional disclosure about the nature, amount, timing and reporting amounts reclassified outuncertainty of accumulatedrevenue and cash flows arising from customer contracts, including significant judgments and changes in judgments and assets recognized from costs incurred to obtain or fulfill a contract. In August 2015, the FASB issued a decision to delay the effective date by one year. The new guidance is effective for annual and interim periods beginning after December 15, 2017. Public entities are not permitted to adopt the standard earlier than the original effective date (that is, no earlier than 2017 for calendar year-end entities). The guidance permits companies to either apply the requirements retrospectively to all prior periods presented, or apply the requirements in the year of adoption, through a cumulative adjustment. The Company is in the process of evaluating the impact of adoption of this guidance on its Financial Statements. comprehensive incomesoftware licenses. If a cloud computing arrangement does not include a software license, the customer should account for the arrangement as a service contract. The guidance will not change GAAP for a customer’s accounting for service contracts. This guidance is effective for annual and interim periods beginning after December 15, 2015. The Company does not expect the adoption of this guidance to improvehave a material impact to its Financial Statements. transparencyFASB issued authoritative guidance that eliminates the requirement to restate prior period financial statements for measurement period adjustments following a business combination. The new guidance requires that an acquirer record in the same period’s financial statements the effects of reporting these reclassifications. Other comprehensive income which included gains and losses that are initially excluded from net income for an accountingthe cumulative impact of adjustments including the impact on prior periods. The prior period would need toimpact of the adjustments should be presented eitherseparately on the face of the income statement where net income is presented or disclosed in the notes. ThisThe new guidance is effective for annual and interim periods beginning after December 15, 2015 for public business entities. The amendments should be applied prospectively to adjustments to provisional amounts that occur after the effective date with earlier application permitted for financial statements that have not been issued. The Company does not expect the adoption of this guidance to have a material impact on its Financial Statements.to be appliedeffective for annual reporting periods beginning after December 15, 2012.2016. Early adoption is permitted for all entities as of the beginning of an interim or annual reporting period. The guidance may be applied either prospectively, for all deferred tax assets and liabilities, or retrospectively (i.e., by reclassifying the comparative balance sheet). If applied prospectively, entities are required to include a statement that prior periods were not retrospectively adjusted. If applied retrospectively, entities are also required to include quantitative information about the effects of the change on prior periods. The Company is in the process of evaluating the impact of adoption of this guidance as of March 31, 2013, did not have an impact on the Company’s Financial Statements.Income Taxes. In September 2013, the FASB issued authoritative guidance in regards to the presentation of unrecognized tax benefits when a net operating loss carryforward, a similar tax loss, or a tax credit carryforward exists. The amendment states that an unrecognized tax benefit or a portion of the unrecognized tax benefit should be presented in the financial statements as a reduction to a deferred tax asset for a net operating loss carryforward, a similar tax loss, or a tax credit carryforward. This authoritative guidance is to be applied for fiscal years, and interim periods within those years, beginning after December 15, 2013. The Company does not expect that the adoption of this guidance will have a material impact on its Financial Statements.32 December 31, 2013 2012 $ 149,391 $ 97,535 82,587 63,670 $ 231,978 $ 161,205 Deposits in trusts for employee benefits increased for the year ended December 31, 2013 due to changes in the Company’s broad-based Deferred Salary Savings Plan (the “Plan”) whereby previously unfunded employee accrual accounts were funded so that employees could direct the investments in their accounts. The Company’s executive officers do not participate in the Plan. December 31, 2015 2014 Deposits in trusts for employee deferred compensation plans $ 198,256 $ 172,237 Other 70,524 73,100 $ 268,780 $ 245,337 2011,2013, through December 31, 20132015 (in thousands): Goodwill $ 189,423 11,454 462 $ 201,339 13 (519 ) $ 200,833 Goodwill Temporary and consultant staffing Permanent placement staffing Risk consulting and internal audit services Total Balance as of December 31, 2013 $ 134,692 $ 26,574 $ 39,567 $ 200,833 Acquisitions — — — — Foreign currency translation adjustments (728 ) (124 ) (493 ) (1,345 ) Balance as of December 31, 2014 $ 133,964 $ 26,450 $ 39,074 $ 199,488 Acquisitions — — 10,988 10,988 Foreign currency translation adjustments (791 ) (199 ) (907 ) (1,897 ) Balance as of December 31, 2015 $ 133,173 $ 26,251 $ 49,155 $ 208,579 December 2012November 2015 the Company, through its wholly-ownedwholly owned subsidiary Protiviti, acquired SusQtech, Inc.,certain assets of Decision First Technologies, a provider of Microsoft SharePoint implementation, design and integration services.company specializing in business intelligence solutions. As part of the asset acquisition, the Company recorded goodwill of $10$11 million within its risk consulting and internal audit services segment. December 31, 2013 2012 $ 148,541 $ 132,331 288,532 269,917 111,426 114,623 118,868 122,060 11,488 12,884 678,855 651,815 (566,211 ) (544,135 ) $ 112,644 $ 107,680 33 December 31, 2015 2014 Computer hardware $ 162,346 $ 159,309 Computer software 339,634 312,968 Furniture and equipment 96,536 105,262 Leasehold improvements 118,491 113,782 Other 9,560 9,045 Property and equipment, cost 726,567 700,366 Accumulated depreciation (583,661 ) (578,612 ) Property and equipment, net $ 142,906 $ 121,754 Costs and Retirement Obligationscosts and retirement obligationsbenefit costs consisted of the following (in thousands): December 31, 2013 2012 $ 238,252 $ 196,569 96,461 92,233 26,671 28,595 34,658 44,244 $ 396,042 $ 361,641 December 31, 2015 2014 Payroll and benefits $ 240,793 $ 213,962 Employee deferred compensation plans 212,220 181,709 Workers’ compensation 25,834 26,127 Payroll taxes 25,935 26,317 Accrued payroll and benefit costs $ 504,782 $ 448,115 retirement obligationsdeferred compensation plans is the following (in thousands): December 31, 2013 2012 $ 75,745 $ 74,155 December 31, 2015 2014 $ 81,874 $ 79,060 $1.4$1.2 million at December 31, 2013,2015, and $1.5$1.3 million at December 31, 2012.2014. At December 31, 2013, $1.42015, $1.2 million of the notes were collateralized by a standby letter of credit. The following table shows the schedule of maturities for notes payable and other indebtedness at December 31, 20132015 (in thousands): $ 128 140 153 167 183 657 $ 1,428 2016 $ 153 2017 167 2018 183 2019 200 2020 218 Thereafter 239 $ 1,160 2013,2015, the notes carried fixed rates and the weighted average interest rate for the above was 9.0% for each of the years ended December 31, 2013, 20122015, 2014 and 2011.$18.6$13.5 million in debt support standby letters of credit as of December 31, 20132015 and $19.7$16.6 million as of December 31, 2012.2014. Of the debt support standby letters of credit outstanding, $17.1$12.3 million as of December 31, 20132015 and $18.1$15.3 million as of December 31, 2012,2014, satisfies workers’ compensation insurer’s collateral requirements. There is a service fee of 1.125% on the used portion of the facility. The facility is subject to certain financial covenants and expires on August 31, 2014.2016. The Company intends to renew this facility prior to its August 31, 20142016 expiration.342013, 20122015, 2014 and 2011,2013, consisted of the following (in thousands): Years Ended December 31, 2013 2012 2011 $ 114,687 $ 99,354 $ 48,068 27,358 24,339 11,969 16,598 25,603 23,101 (7,759 ) (15,188 ) 15,117 (5,500 ) 195 2,039 $ 145,384 $ 134,303 $ 100,294 Years Ended December 31, 2015 2014 2013 Current: Federal $ 181,640 $ 146,633 $ 114,687 State 36,281 33,054 27,358 Foreign 13,892 15,377 16,598 Deferred: Federal and state (8,398 ) (4,626 ) (7,759 ) Foreign (181 ) 983 (5,500 ) $ 223,234 $ 191,421 $ 145,384 2013, 20122015, 2014 and 2011,2013, consisted of the following (in thousands): Years Ended December 31, 2013 2012 2011 $ 357,382 $ 286,537 $ 202,210 40,197 57,708 48,006 $ 397,579 $ 344,245 $ 250,216 Years Ended December 31, 2015 2014 2013 Domestic $ 520,263 $ 449,834 $ 357,382 Foreign 60,767 47,515 40,197 $ 581,030 $ 497,349 $ 397,579 Years Ended December 31, 2013 2012 2011 35.0 % 35.0 % 35.0 % 4.3 4.0 3.4 0.7 0.8 1.3 (1.0 ) 0.7 2.2 (1.3 ) (0.3 ) (1.2 ) 0.1 (1.2 ) (0.4 ) (1.0 ) — — (0.2 ) — (0.2 ) 36.6 % 39.0 % 40.1 % 35 Years Ended December 31, 2015 2014 2013 Federal U.S. income tax rate 35.0 % 35.0 % 35.0 % State income taxes, net of federal tax benefit 4.2 4.2 4.3 Non-deductible expenses 0.5 0.6 0.7 0.1 (0.2 ) (1.0 ) Federal tax credits (0.6 ) (0.6 ) (1.3 ) Tax impact of uncertain tax positions (0.2 ) (0.1 ) 0.1 Valuation allowance release, net (0.5 ) (0.3 ) (1.0 ) Other, net (0.1 ) (0.1 ) (0.2 ) Effective tax rate 38.4 % 38.5 % 36.6 % (Continued) Years Ended December 31, 2013 2012 2011 $ 514 $ 514 $ 514 621 1,180 1,142 (11,190 ) (13,494 ) (2,076 ) 3,019 7,395 7,448 (2,597 ) (7,813 ) (1,709 ) (274 ) 478 331 (3,449 ) — 5,719 97 (3,253 ) 5,787 $ (13,259 ) $ (14,993 ) $ 17,156 Years Ended December 31, 2015 2014 2013 Amortization of franchise rights $ 514 $ 514 $ 514 Amortization of other intangibles 1,590 1,241 621 Accrued expenses, deducted for tax when paid (17,664 ) (14,221 ) (11,190 ) Capitalized costs for books, deducted for tax 5,315 8,809 3,019 Depreciation (5,932 ) (4,147 ) (2,597 ) Federal impact of unrecognized tax benefits 1,058 44 (274 ) Foreign tax credit carryforwards 3,636 (186 ) (3,449 ) Other, net 2,904 4,303 97 $ (8,579 ) $ (3,643 ) $ (13,259 ) December 31, 2013 2012 $ 112,881 $ 102,993 (10,601 ) (14,244 ) $ 102,280 $ 88,749 December��31, 2015 2014 Current deferred income tax assets, net $ 145,684 $ 133,151 Long-term deferred income tax liabilities, net (29,139 ) (26,807 ) $ 116,545 $ 106,344 20132015 and 2012,2014, were as follows (in thousands): December 31, 2013 2012 $ 8,012 $ 7,585 72,227 62,637 9,538 10,007 12,067 10,895 49,556 48,609 25,953 23,781 177,353 163,514 (23,305 ) (22,169 ) (8,098 ) (8,029 ) (6,626 ) (5,257 ) (38,029 ) (35,455 ) (37,044 ) (39,310 ) $ 102,280 $ 88,749 December 31, 2015 2014 Deferred Income Tax Assets Provision for bad debts $ 11,092 $ 9,210 Deferred compensation and other benefit obligations 96,948 83,065 Workers’ compensation 8,206 9,138 Stock-based compensation 15,814 14,572 Credits and net operating loss carryforwards 35,499 39,309 Other 23,885 25,316 Total deferred income tax assets 191,444 180,610 Deferred Income Tax Liabilities Amortization of intangible assets (26,960 ) (25,060 ) Property and equipment basis differences (11,890 ) (12,384 ) Other (9,720 ) (7,261 ) Total deferred income tax liabilities (48,570 ) (44,705 ) Valuation allowance (26,329 ) (29,561 ) Total deferred income tax assets, net $ 116,545 $ 106,344 $37.3$27.9 million that expire in 20142016 and later; foreignand California enterprise zone tax credits of $3.4$4.3 million that expire in 2023;2023. Valuation allowances of $24.5 million and $1.8 million have been established for net operating losses carryforwards in foreign countries and California36(Continued)enterprise zone tax credits of $6.3 million that expire in 2023. New legislation passed by the State of California in 2013 limits the carryforward period on the enterprise zone credits to 10 years; therefore, the company expects that it will utilize $3.2 million of these credits prior to expiration.$2.8$5.7 million and $2.2$3.7 million of undistributed earnings of its non-U.S. subsidiaries as of December 31, 20132015 and 2012,2014, respectively, since the Company intends to reinvest these earnings indefinitely. The U.S. tax impact upon repatriation, net of foreign tax credits, would be zero for the years ended December 31, 20132015 and 2012.20112013 to December 31, 20132015 (in thousands): December 31, 2013 2012 2011 $ 7,097 $ 11,669 $ 12,505 559 352 564 (369 ) (273 ) (1,061 ) 38 42 40 — (252 ) (111 ) (1,215 ) (4,441 ) (268 ) $ 6,110 $ 7,097 $ 11,669 December 31, 2015 2014 2013 Balance at beginning of period $ 4,573 $ 6,110 $ 7,097 Gross increases—tax positions in prior years — 1 559 Gross decreases—tax positions in prior years (1,807 ) (333 ) (369 ) Gross increases—tax positions in current year 120 35 38 Settlements (520 ) — — Lapse of statute of limitations (1,552 ) (1,240 ) (1,215 ) Balance at end of period $ 814 $ 4,573 $ 6,110 $1.0 millionfor 2015, 2014 and $2.7 million for 2013, 2012 and 2011, respectively.2013,2015, is $2.8$0.2 million, including a $2.3 million reduction recorded in income tax expense during the year. The total amount of interest and penalties accrued as of December 31, 2014 is $2.5 million, including a $0.3 million reduction recorded in income tax expense during the year. The total amount of interest and penalties accrued as of December 31, 2012,2013, was $3.1$2.8 million, including a $2.3$0.3 million reduction recorded in income tax expense during the year. The total amount of interest and penalties accrued as of December 31, 2011, was $5.3 million, including a $0.3 million increase recorded in income tax expense during the year.$2.2$0.3 million of the unrecognized gross tax benefit has been classified as a current liability as of December 31, 2013.2015. This amount primarily represents unrecognized tax benefits composed of items related to assessed state income tax audits and negotiations.Germany.the United Kingdom. For U.S. federal income tax, the Company remains subject to examination for 20102012 and subsequent years. For major U.S. states, with few exceptions, the Company remains subject to examination for 20092011 and subsequent years. Generally, for the foreign countries, the Company remains subject to examination for 20062008 and subsequent years.37NOTES TO CONSOLIDATED FINANCIAL STATEMENTS (Continued)$92.7$85.9 million, $96.8$89.9 million and $100.6$92.7 million for the years ended December 31, 2013, 20122015, 2014 and 2011,2013, respectively. The approximate minimum rental commitments for 20142016 and thereafter under non-cancelable leases in effect at December 31, 20132015 were as follows (in thousands): $ 88,434 76,248 56,150 43,984 30,629 86,276 $ 381,721 Additionally, as of December 31, 2013, the Company had future purchase commitments of approximately $55 million over the next three years primarily related to telecom service agreements, software licensessubscriptions, and computer hardware and software maintenance agreements.2016 $ 88,177 2017 74,939 2018 56,425 2019 42,763 2020 37,668 Thereafter 81,437 $ 381,409 2013,2015, the Company is authorized to repurchase, from time to time, up to 8.110.4 million additional shares of the Company’s common stock on the open market or in privately negotiated transactions, depending on market conditions. The number and the cost of common stock shares repurchased during the years ended December 31, 2013, 20122015, 2014 and 2011,2013, are reflected in the following table (in thousands): Years Ended December 31, 2013 2012 2011 3,305 4,689 5,308 $ 117,864 $ 132,691 $ 141,552 38NOTES TO CONSOLIDATED FINANCIAL STATEMENTS (Continued) Years Ended December 31, 2015 2014 2013 Common stock repurchased (in shares) 4,343 3,336 3,305 Common stock repurchased $ 228,166 $ 161,587 $ 117,864 2013, 20122015, 2014 and 2011,2013, are reflected in the following table (in thousands): Years Ended December 31, 2013 2012 2011 1,157 1,661 1,020 $ 44,169 $ 50,045 $ 29,017 Years Ended December 31, 2015 2014 2013 Employee stock plan repurchased (in shares) 474 462 1,157 Employee stock plan repurchased $ 24,755 $ 22,386 $ 44,169 2013, 20122015, 2014 and 2011,2013, are reflected in the following table: Years Ended December 31, 2013 2012 2011 $ .64 $ .60 $ .56 Years Ended December 31, 2015 2014 2013 Cash dividends declared per share $ .80 $ .72 $ .64 As a result, the Company had $13.3 million in retained earnings as of December 31, 2013 and no retained earnings as of December 31, 2012 and 2011. Compensation expense for restricted stock and stock units is generally recognized on either a 3 year cliff basis or 4 year straight line basis, based on the stock’s fair market value on the grant date. For restricted stock grants issued with performance conditions, compensation expense is recognized over each vesting tranche.39NOTES TO CONSOLIDATED FINANCIAL STATEMENTS (Continued)Note K—Stock Plans (Continued)The Company determines the fair value of options to purchase common stock using the Black-Scholes valuation model. The Company recognizes expense over the service period for options that are expected to vest and records adjustments to compensation expense at the end of the service period if actual forfeitures differ from original estimates. The Company has not granted any options to purchase common stock since 2006.2013,2015, the Company granted performance shares to its executives in the form of restricted stock. The shares granted contain (1) a performance condition based on target net income per share, and (2) a market condition based on Total Shareholder Return (“TSR”). The TSR market condition measures the Company’s performance against a peer group. Shares will be delivered at the end of the three year vesting and TSR performance period based on the Company’s actual performance compared to the peer group. Actual shares earned will range from fifty percent (50%) to one hundred fifty percent (150%) of the target award after any adjustment made for the performance condition. The fair value of this award was determined using a Monte Carlo simulation with the following assumptions: an historical volatility of 32.23%23.70%, 0% dividend yield and a risk-free interest rate of 0.36%0.84%. The historical volatility was based on the most recent 2.61-year2.76-year period for the Company and the components of the peer group. The stock price projection for the Company and the components of the peer group assumes a 0% dividend yield. This is mathematically equivalent to reinvesting dividends in the issuing entity over the performance period. The risk-free interest rate is equal to the yield, as of the measurement date, of the zero-coupon U.S. Treasury bill that is commensurate with the remaining performance measurement period. Years Ended December 31, 2013 2012 2011 $ 38,867 $ 41,464 $ 50,906 Years Ended December 31, 2015 2014 2013 Restricted stock and stock units $ 41,292 $ 40,821 $ 38,867 December 31, 2013 2012 2011 $ 53,646 $ 51,877 $ 54,419 The unrecognized compensation cost is expected to be recognized over the next four years.40NOTES TO CONSOLIDATED FINANCIAL STATEMENTS (Continued)Note K—Stock Plans (Continued) December 31, 2015 2014 2013 Restricted stock and stock units $ 60,627 $ 54,968 $ 53,646 20102012 through December 31, 2013,2015, and the weighted average exercise prices (in thousands, except per share amounts): Restricted Stock Plans
without Market-Condition Restricted Stock Plans
with Market-Condition Stock Option Plans Number of
Shares/
Units Weighted
Average
Grant Date
Fair Value Number of
Shares/
Units Weighted
Average
Grant Date
Fair Value Number of
Shares/
Units Weighted
Average Exercise
Price Per Share 3,996 $ 23.44 — — 5,316 $ 22.04 879 $ 31.18 523 $ 33.42 — — — — — — (806 ) $ 22.73 (2,389 ) $ 25.27 — — — — (94 ) $ 23.09 — — (60 ) $ 26.05 2,392 $ 24.47 523 $ 33.42 4,450 $ 21.85 937 $ 27.71 517 $ 29.53 — — — — — — (2,260 ) $ 19.00 (1,550 ) $ 22.20 (240 ) $ 33.42 — — (42 ) $ 24.26 (42 ) $ 33.42 (99 ) $ 24.74 1,737 $ 28.25 758 $ 30.77 2,091 $ 24.80 688 $ 35.34 400 $ 43.04 — — — — — — (1,397 ) $ 23.82 (1,087 ) $ 28.53 (259 ) $ 29.53 — — (21 ) $ 31.29 — — (62 ) $ 20.48 1,317 $ 31.68 899 $ 36.58 632 $ 27.41 Stock Option Plans Outstanding, December 31, 2012 1,737 $28.25 758 $30.77 2,091 $24.80 Granted 688 $35.34 400 $42.04 — — Exercised — — — — (1,397 ) $23.82 Restrictions lapsed (1,087 ) $28.53 (259 ) $29.53 — — Forfeited (21 ) $31.29 — — (62 ) $20.48 Outstanding, December 31, 2013 1,317 $31.68 899 $36.58 632 $27.41 Granted 585 $41.60 335 $50.09 — — Exercised — — — — (528 ) $27.12 Restrictions lapsed (712 ) $31.96 — — — — Forfeited (25 ) $32.82 — — (27 ) $27.83 Outstanding, December 31, 2014 1,165 $36.47 1,234 $40.24 77 $29.22 Granted 502 $58.14 257 $71.86 — — Exercised — — — — (54 ) $28.18 Restrictions lapsed (599 ) $36.30 (499 ) $31.41 — — Forfeited (16 ) $37.63 — — (11 ) $30.94 Outstanding, December 31, 2015 1,052 $46.88 992 $52.89 12 $32.36 2013, 20122015, 2014 and 2011,2013, are reflected in the following table (in thousands): Years Ended December 31, 2013 2012 2011 $ 17,092 $ 23,678 $ 6,429 $ 53,931 $ 55,186 $ 67,076 Years Ended December 31, 2015 2014 2013 Total pre-tax intrinsic value of stock options exercised $ 1,709 $ 9,150 $ 17,092 Total fair value of shares vested $ 56,570 $ 38,566 $ 53,931 20132015 (in thousands, except number of years and per share amounts): Options Outstanding and Exercisable
Exercise Prices Number
Outstanding
and Exercisable as of
December 31,
2013 Weighted
Average
Remaining
Contractual
Life Weighted
Average
Exercise
Price Aggregate
Intrinsic
Value $23.49 to $26.12 163 1.09 $ 25.82 $ 2,639 $26.13 to $26.13 11 0.30 $ 26.13 173 $26.56 to $26.56 239 0.82 $ 26.56 3,688 $27.36 to $33.89 219 1.06 $ 29.58 2,717 632 0.97 $ 27.41 $ 9,217 41NOTES TO CONSOLIDATED FINANCIAL STATEMENTS (Continued)Note K—Stock Plans (Continued) Options Outstanding and Exercisable Range of
Exercise Prices Number
Outstanding
and Exercisable as of
December 31,
2015 Weighted
Average
Remaining
Contractual
Life Weighted
Average
Exercise
Price Aggregate
Intrinsic
Value$32.36 to $32.36 12 0.57 $32.36 $ 179 $41.99$47.14 as of December 31, 2013,2015, which would have been received by the option holders had they exercised their in-the-money options as of that date.2013,2015, the total number of available shares to grant under the plans (consisting of either restricted stock, stock units, stock appreciation rights or options to purchase common stock) was approximately 2.35.8 million. All of the 0.6 million12 thousand options outstanding at December 31, 2013,2015, were exercisable with a weighted average exercise price of $27.41.20132015 is reflected in the following table (in thousands, except per share amounts): Years Ended December 31, 2013 2012 2011 $ 252,195 $ 209,942 $ 149,922 3 1,081 2,159 $ 252,192 $ 208,861 $ 147,763 136,153 138,201 140,479 $ 1.85 $ 1.51 $ 1.05 $ 252,195 $ 209,942 $ 149,922 3 1,075 2,150 $ 252,192 $ 208,867 $ 147,772 136,153 138,201 140,479 1,436 1,208 1,311 137,589 139,409 141,790 $ 1.83 $ 1.50 $ 1.04 Years Ended December 31, 2015 2014 2013 Basic net income per share: Net income $ 357,796 $ 305,928 $ 252,195 Income allocated to participating securities — — 3 $ 357,796 $ 305,928 $ 252,192 Basic weighted average shares 131,749 134,358 136,153 Basic net income per share $ 2.72 $ 2.28 $ 1.85 Diluted net income per share: Net income $ 357,796 $ 305,928 $ 252,195 Income allocated to participating securities — — 3 $ 357,796 $ 305,928 $ 252,192 Basic weighted average shares 131,749 134,358 136,153 Dilutive effect of potential common shares 1,181 1,183 1,436 Diluted weighted average shares 132,930 135,541 137,589 Diluted net income per share $ 2.69 $ 2.26 $ 1.83 The weighted average diluted common shares outstanding for the years ended December 31, 2013, 2012 and 2011, excludes the effect of the following (in thousands): Years Ended
December 31, 2013 2012 2011 — 227 475 42NOTES TO CONSOLIDATED FINANCIAL STATEMENTS (Continued)Note L—Net Income Per Share (Continued)or loss from operations before net interest income, intangible amortization expense, and income taxes. Years Ended December 31, 2013 2012 2011 $ 3,369,840 $ 3,324,286 $ 3,050,999 347,715 334,198 302,155 528,340 452,729 423,822 $ 4,245,895 $ 4,111,213 $ 3,776,976 $ 301,185 $ 276,826 $ 209,101 54,390 55,745 35,340 42,702 10,875 4,977 398,277 343,446 249,418 1,700 398 153 (1,002 ) (1,197 ) (951 ) $ 397,579 $ 344,245 $ 250,216 43NOTES TO CONSOLIDATED FINANCIAL STATEMENTS (Continued)Note M—Business Segments (Continued) Years Ended December 31, 2015 2014 2013 Net service revenues Temporary and consultant staffing $ 3,930,843 $ 3,676,281 $ 3,369,840 Permanent placement staffing 421,411 394,515 347,715 742,679 624,218 528,340 $ 5,094,933 $ 4,695,014 $ 4,245,895 Operating income Temporary and consultant staffing $ 399,808 $ 358,533 $ 301,185 Permanent placement staffing 85,019 78,333 54,390 95,845 60,316 42,702 580,672 497,182 398,277 Amortization of intangible assets 192 557 1,700 Interest income, net (550 ) (724 ) (1,002 ) Income before income taxes $ 581,030 $ 497,349 $ 397,579 December 31, 2013 2012 2011 $ 349,364 $ 336,468 $ 342,122 100,550 88,436 75,333 129,252 112,800 98,499 $ 579,166 $ 537,704 $ 515,954 December 31, 2013 2012 2011 $ 134,692 $ 134,756 $ 134,507 26,574 26,586 26,545 39,567 39,997 28,371 $ 200,833 $ 201,339 $ 189,423 December 31, 2015 2014 2013 Accounts receivable Temporary and consultant staffing $ 425,179 $ 403,615 $ 349,364 Permanent placement staffing 121,670 115,563 100,550 Risk consulting and internal audit services 192,878 169,042 129,252 $ 739,727 $ 688,220 $ 579,166 December 31, 2015 2014 2013 Goodwill Temporary and consultant staffing $ 133,173 $ 133,964 $ 134,692 Permanent placement staffing 26,251 26,450 26,574 Risk consulting and internal audit services 49,155 39,074 39,567 $ 208,579 $ 199,488 $ 200,833 Years Ended December 31, 2013 2012 2011 $ 3,219,820 $ 3,022,274 $ 2,655,443 1,026,075 1,088,939 1,121,533 $ 4,245,895 $ 4,111,213 $ 3,776,976 December 31, 2013 2012 2011 $ 92,252 $ 86,239 $ 87,146 20,392 21,441 20,826 $ 112,644 $ 107,680 $ 107,972 44 Years Ended December 31, 2015 2014 2013 Net service revenues (a) Domestic $ 4,105,013 $ 3,623,812 $ 3,219,820 Foreign (b) 989,920 1,071,202 1,026,075 $ 5,094,933 $ 4,695,014 $ 4,245,895 December 31, 2015 2014 2013 Assets, long-lived Domestic $ 117,176 $ 101,181 $ 92,252 Foreign 25,730 20,573 20,392 $ 142,906 $ 121,754 $ 112,644 NOTES TO CONSOLIDATED FINANCIAL STATEMENTS (Continued)20132015 and 20122014 (in thousands, except per share amounts): Quarter 1 2 3 4 $ 1,023,684 $ 1,063,228 $ 1,075,119 $ 1,083,864 $ 410,290 $ 432,108 $ 437,478 $ 443,216 $ 89,376 $ 100,596 $ 103,713 $ 103,894 $ 55,863 $ 63,089 $ 66,358 $ 66,885 $ 55,861 $ 63,088 $ 66,358 $ 66,885 $ .41 $ .46 $ .49 $ .49 $ .40 $ .46 $ .48 $ .49 Quarter 1 2 3 4 $ 1,015,444 $ 1,028,383 $ 1,033,173 $ 1,034,213 $ 402,083 $ 415,303 $ 415,249 $ 416,425 $ 80,264 $ 72,272 (a) $ 94,467 $ 97,242 $ 48,334 $ 45,329 (a) $ 57,660 $ 58,619 $ 48,070 $ 45,101 $ 57,383 $ 58,322 $ .34 $ .33 $ .42 $ .43 $ .34 $ .32 (a) $ .41 $ .42 (a)The decrease in second quarter 2012 income before income taxes, net income, and net income per share was primarily due to a charge related to a litigation settlement disclosed in the Company’s July 5, 2012, Form 8-K. The settlement resulted in a non-recurring $19.0 million pre-tax charge to selling, general and administrative expenses and reduced second quarter net income and net income per share by $11.4 million and $0.08 per share, respectively. Quarter 2015 1 2 3 4 Net service revenues $ 1,205,563 $ 1,272,058 $ 1,312,718 $ 1,304,594 Gross margin $ 494,087 $ 530,502 $ 549,801 $ 540,081 Income before income taxes $ 128,174 $ 149,235 $ 159,306 $ 144,315 Net income $ 77,922 $ 89,706 $ 96,725 $ 93,443 Basic net income per share $ .59 $ .68 $ .74 $ .71 Diluted net income per share $ .58 $ .67 $ .73 $ .71 Quarter 2014 1 2 3 4 Net service revenues $ 1,084,342 $ 1,164,914 $ 1,224,308 $ 1,221,450 Gross margin $ 438,495 $ 478,444 $ 505,220 $ 500,757 Income before income taxes $ 102,014 $ 123,653 $ 138,361 $ 133,321 Net income $ 61,551 $ 75,140 $ 85,184 $ 84,053 Basic net income per share $ .45 $ .56 $ .64 $ .63 Diluted net income per share $ .45 $ .55 $ .63 $ .62 20142016 the Company announced the following: $ 0.18 February 11, 2014 February 25, 2014 March 14, 2014 45Quarterly dividend per share $.22 Declaration date February 11, 2016 Record date February 25, 2016 Payment date March 15, 2016 20132015 and 2012,2014, and the results of their operations and their cash flows for each of the three years in the period ended December 31, 20132015 in conformity with accounting principles generally accepted in the United States of America. In addition, in our opinion, the financial statement schedule listed in the index appearing under Item 15(a)(2) presents fairly, in all material respects, the information set forth therein when read in conjunction with the related consolidated financial statements. Also in our opinion, the Company maintained, in all material respects, effective internal control over financial reporting as of December 31, 2013,2015, based on criteria established in Internal Control—Control - Integrated Framework (1992) (2013) issued by the Committee of Sponsoring Organizations of the Treadway Commission (COSO). The Company’sCompany's management is responsible for these financial statements and financial statement schedule, for maintaining effective internal control over financial reporting and for its assessment of the effectiveness of internal control over financial reporting, included in Management’sManagement's Report on Internal Control over Financial Reporting appearing in Item 9A. Our responsibility is to express opinions on these financial statements, on the financial statement schedule, and on the Company’sCompany's internal control over financial reporting based on our integrated audits. We conducted our audits in accordance with the standards of the Public Company Accounting Oversight Board (United States). Those standards require that we plan and perform the audits to obtain reasonable assurance about whether the financial statements are free of material misstatement and whether effective internal control over financial reporting was maintained in all material respects. Our audits of the financial statements included examining, on a test basis, evidence supporting the amounts and disclosures in the financial statements, assessing the accounting principles used and significant estimates made by management, and evaluating the overall financial statement presentation. Our audit of internal control over financial reporting included obtaining an understanding of internal control over financial reporting, assessing the risk that a material weakness exists, and testing and evaluating the design and operating effectiveness of internal control based on the assessed risk. Our audits also included performing such other procedures as we considered necessary in the circumstances. We believe that our audits provide a reasonable basis for our opinions.14, 2014462013,2015, using criteria established inInternal Control-Integrated Framework (1992) (2013) issued by the Committee of Sponsoring Organizations of the Treadway Commission (COSO) and concluded that the Company maintained effective internal control over financial reporting as of December 31, 2013.2015.2013,2015, has been audited by PricewaterhouseCoopers LLP, an independent registered public accounting firm, as stated in their report which is included herein.472014.2016.Item 12.Security Ownership of Certain Beneficial Owners and Management and Related Stockholder Matters. Number of securities
to be issued upon
exercise of
outstanding options,
warrants and rights
A Weighted average
exercise price of
outstanding options,
warrants and rights
B Number of securities
remaining available for
future issuance under
equity compensation plans
(excluding securities
reflected in column A)
C 387,725 $ 27.30 2,291,989 244,319 $ 27.57 0 632,044 $ 27.41 2,291,989 (a)These plans, by their terms, expressly prohibited any grants to directors or executive officers. All such plans were terminated in May 2005, and no future grants may be made under such plans. The information in the table reflects shares issuable upon the exercise of options granted before such plans were terminated.Plan Category Equity compensation plans approved by security holders 12,107 $32.36 5,762,138 Equity compensation plans not approved by security holders — — — Total 12,107 $32.36 5,762,138 2013.2014. Such plan authorizes the issuance of stock options, restricted stock, stock units and stock appreciation rights to directors, executive officers and employees.Description of Equity Plans Not Approved by StockholdersAll of the following plans were terminated in May 2005. No future grants may be made under any of these plans.StockPlus Plan. The StockPlus Plan authorized the grant of stock options to employees other than directors and executive officers. No option could have a term of more than ten years.Stock Option Plan for Field Employees. The Stock Option Plan for Field Employees authorized the grant of stock options to employees or consultants other than directors and executive officers. No option could have a term of more than ten years.48(a)(a) 1. Financial Statements 20132015 and 2012.2013, 2012,2015, 2014, and 2011.2013, 2012,2015, 2014, and 2011.2013, 2012,2015, 2014, and 2011.2013, 2012,2015, 2014, and 2011.20132015 and 20122014 are set forth in Note N—Quarterly Financial Data (Unaudited) included in Item 8 of this report. 3.1 Restated Certificate of Incorporation, incorporated by reference to Exhibit 3.1 to Registrant’s Quarterly Report on Form 10-Q for the fiscal quarter ended March 31, 2009. 3.2 By-Laws, incorporated by reference to Exhibit 3.2 to Registrant’s Annual Report on Form 10-K for the fiscal year ended December 31, 2003. 4.1 Restated Certificate of Incorporation of Registrant (filed as Exhibit 3.1). *10.1 Form of Power of Attorney and Indemnification Agreement, incorporated by reference to Exhibit 10.1 to the Registrant’s Quarterly Report on Form 10-Q for the fiscal quarter ended September 30, 2002. *10.2 Employment Agreement between the Registrant and Harold M. Messmer, Jr., incorporated by reference to (i) Exhibit 10.(c) to the Registrant’s Annual Report on Form 10-K for the fiscal year ended December 31, 1985, (ii) Exhibit 10.2(b) to Registrant’s Registration Statement on Form S-1 (No. 33-15171), (iii) Exhibit 10.2(c) to the Registrant’s Annual Report on Form 10-K for the fiscal year ended December 31, 1987, (iv) Exhibit 10.2(d) to the Registrant’s Annual Report on Form 10-K for the fiscal year ended December 31, 1988, (v) Exhibit 28.1 to the Registrant’s Quarterly Report on Form 10-Q for the fiscal quarter ended March 31, 1990, (vi) Exhibit 10.8 to the Registrant’s Annual Report on Form 10-K for the fiscal year ended December 31, 1991, (vii) Exhibit 10.1 to the Registrant’s Quarterly Report on Form 10-Q for the fiscal quarter ended June 30, 1993, (viii) Exhibit 10.7 to the Registrant’s Annual Report on Form 10-K for the fiscal year ended December 31, 1993, (ix) Exhibit 10.1 to the Registrant’s Quarterly Report on Form 10-Q for the fiscal quarter ended March 31, 1995, (x) Exhibit 10.7 to the Registrant’s Annual Report on Form 10-K for the fiscal year ended December 31, 1995, (xi) Exhibit 10.2 to the Registrant’s Annual Report on Form 10-K for the 49ExhibitNo.Exhibitfiscal year ended December 31, 1996, (xii) Exhibit 10.2 to the Registrant’s Annual Report on Form 10-K for the fiscal year ended December 31, 1997, (xiii) Exhibit 10.2 to the Registrant’s Annual Report on Form 10-K for the fiscal year ended December 31, 1998, (xiv) Exhibit 10.2 to the Registrant’s Annual Report on Form 10-K for the fiscal year ended December 31, 1999, (xv) Exhibit 10.1 to the Registrant’s Quarterly Report on Form 10-Q for the fiscal quarter ended March 31, 2004, (xvi) Exhibit 10.5 to the Registrant’s Quarterly Report on Form 10-Q for the fiscal quarter ended June 30, 2008, and (xvii) Exhibit 10.2 to the Registrant’s Annual Report on Form 10-K for the fiscal year ended December 31, 2010. *10.3 Amended and Restated Retirement Agreement between Registrant and Harold M. Messmer Jr., incorporated by reference to Exhibit 99.2 to the Registrant’s Current Report on Form 8-K dated December 7, 2006. *10.4 Outside Directors’ Option Plan, as amended, incorporated by reference to Exhibit 10.1 to the Registrant’s Quarterly Report on Form 10-Q for the fiscal quarter ended June 30, 2004.*10.5 Equity Incentive Plan, as amended, incorporated by reference to Exhibit 10.1 to the Registrant’s Quarterly Report on Form 10-Q for the fiscal quarter ended September 30, 2000.*10.6 Amended and Restated Deferred Compensation Plan, incorporated by reference to Exhibit 10.4 to the Registrant’s Quarterly Report on Form 10-Q for the fiscal quarter ended June 30, 2008. * 10.710.5 Amended and Restated Severance Agreement dated as of February 9, 2011, between Registrant and Paul F. Gentzkow, incorporated by reference to Exhibit 10.8 to Registrant’s Annual Report on Form 10-K for the fiscal year ended December 31, 2010. * 10.810.6 Agreement dated as of July 31, 1995, between Registrant and Paul F. Gentzkow, incorporated by reference to Exhibit 10.6 to Registrant’s Quarterly Report on Form 10-Q for the fiscal quarter ended September 30, 2000. * 10.910.7 Form of Amended and Restated Severance Agreement, incorporated by reference to Exhibit 10.10 to Registrant’s Annual Report on Form 10-K for the fiscal year ended December 31, 2010. * 10.1010.8 Form of Indemnification Agreement for Directors of the Registrant, incorporated by reference to (i) Exhibit 10.27 to the Registrant’s Annual Report on Form 10-K for the fiscal year ended December 31, 1989 and (ii) Exhibit 10.19 to the Registrant’s Annual Report on Form 10-K for the fiscal year ended December 31, 1993. Exhibit * 10.1110.9 Form of Indemnification Agreement for Executive Officers of Registrant, incorporated by reference to Exhibit 10.4 to the Registrant’s Quarterly Report on Form 10-Q for the fiscal quarter ended September 30, 2000. * 10.1210.10 Senior Executive Retirement Plan, incorporated by reference to Exhibit 10.13 to Registrant’s Annual Report on Form 10-K for the fiscal year ended December 31, 2010. * 10.1310.11 Collateral Assignment of Split Dollar Insurance Agreement, incorporated by reference to (i) Exhibit 10.3 to the Registrant’s Quarterly Report on Form 10-Q for the fiscal quarter ended September 30, 2000, and (ii) Exhibit 10.18 to the Registrant’s Annual Report on Form 10-K for the fiscal year ended December 31, 2003. * 10.1410.12 Form of Part-Time Employment Agreement, as amended and restated, incorporated by reference to Exhibit 10.1 to the Registrant’s Quarterly Report on Form 10-Q for the fiscal quarter ended March 31, 2009.September 30, 2014.* 10.1510.13 StockPlus Plan, incorporated by reference to Exhibit 10.20 to Registrant’s Annual Report on Form 10-K for the fiscal year ended December 31, 2002.*10.1650ExhibitNo. Exhibit* 10.17Stock Option Plan for Field Employees, incorporated by reference to Exhibit 10.22 to the Registrant’s Annual Report on Form 10-K for the fiscal year ended December 31, 2002.*10.18Equity Incentive Plan—Form of Restricted Stock Agreement, incorporated by reference to Exhibit 99.2 to the Registrant’s Current Report on Form 8-K dated October 21, 2004.*10.19Equity Incentive Plan—Form of Stock Option Agreement, incorporated by reference to Exhibit 99.3 to the Registrant’s Current Report on Form 8-K dated October 21, 2004.*10.20Outside Directors’ Option Plan—Form of Stock Option Agreement, incorporated by reference to Exhibit 99.4 to the Registrant’s Current Report on Form 8-K dated October 21, 2004.*10.2110.14 Summary of Outside Director Cash Remuneration, incorporated by reference to Exhibit 10.2 to the Registrant’s Quarterly Report on Form 10-Q for the fiscal quarter ended March 31, 2010. * 10.2210.15 Stock Incentive Plan, as amended and restated, incorporated by reference to Exhibit 99.210.2 to the Registrant’s CurrentQuarterly Report on Form 8-K dated May 23, 2013.10-Q for the fiscal quarter ended September 30, 2014.* 10.2310.16 * 10.2410.17 Stock Incentive Plan—Form of Restricted Share Agreement for Executive Officers effective through April 14, 2013, incorporated by reference to Exhibit 99.3 to Registrant’s Current Report onForm 8-K dated May 3, 2005. * 10.2510.18 Amendment to Restricted Share Agreement dated as of May 9, 2012, between Registrant and Harold M. Messmer, Jr., incorporated by reference to Exhibit 10.1 to Registrant’s Quarterly Report on Form10-Q for the fiscal quarter ended June 30, 2012. * 10.2610.19 Form of Amendment to Restricted Share Agreement dated as of May 9, 2012, incorporated by reference to Exhibit 10.2 to Registrant’s Quarterly Report on Form 10-Q for the fiscal quarter ended June 30, 2012. * 10.2710.20 Form of Amendment to Restricted Share Agreement dated as of November 8, 2012, incorporated by reference to Exhibit 10.27 to Registrant’s Annual Report onForm 10-K for the fiscal year ended December 31, 2012. * 10.2810.21 Stock Incentive Plan—Form of Stock Option Agreement for Executive Officers, incorporated by reference to Exhibit 99.4 to Registrant’s Current Report on Form 8-K dated May 3, 2005. * 10.2910.22 Stock Incentive Plan—Form of Restricted Share Agreement for Outside Directors, incorporated by reference to Exhibit 10.1 to Registrant’s Quarterly Report on Form 10-Q for the fiscal quarter ended March 31, 2006. * 10.3010.23 Stock Incentive Plan—Form of Stock Option Agreement for Outside Directors, incorporated by reference to Exhibit 99.6 to Registrant’s Current Report on Form 8-K dated May 3, 2005. 21.1 Subsidiaries of the Registrant. 23.1 Independent Registered Public Accounting Firm’s Consent. 31.1 Rule 13a-14(a) Certification of Chief Executive Officer. Exhibit 31.2 Rule 13a-14(a) Certification of Chief Financial Officer. 32.1 Rule 1350 Certification of Chief Executive Officer. 32.2 Rule 1350 Certification of Chief Financial Officer. 101.1 51Date: February 14, 2014 Date: February 17, 2016 By: 14, 201417, 2016 By: 14, 201417, 2016 By: Andrew S. Berwick, Jr., Director 14, 201417, 2016 By: Barbara J. Novogradac, Director 14, 201417, 2016 By: Robert J. Pace, Director 14, 201417, 2016 By: Frederick A. Richman, Director 14, 201417, 2016 By: 14, 201417, 2016 By: 52 Balance at
Beginning of
Period Charged to
Expenses Deductions Translation
Adjustments Balance at
End of Period $ 21,569 6,673 (4,370 ) (1,245 ) $ 22,627 $ 30,983 7,745 (2,308 ) (86 ) $ 36,334 $ 22,627 7,133 (3,845 ) (1,063 ) $ 24,852 $ 36,334 6,558 (2,774 ) (808 ) $ 39,310 $ 24,852 7,467 (4,313 ) (745 ) $ 27,261 $ 39,310 7,053 (8,135 ) (1,184 ) $ 37,044 Deductions Year Ended December 31, 2013 Allowance for doubtful accounts receivable $24,852 7,467 (4,313) (745) $27,261 Deferred tax valuation allowance $39,310 7,053 (8,135) (1,184) $37,044 Year Ended December 31, 2014 Allowance for doubtful accounts receivable $27,261 9,825 (3,670) (2,872) $30,544 Deferred tax valuation allowance $37,044 1,742 (6,056) (3,169) $29,561 Year Ended December 31, 2015 Allowance for doubtful accounts receivable $30,544 12,005 (5,353) (2,109) $35,087 Deferred tax valuation allowance $29,561 6,283 (8,068) (1,447) $26,329