SECURITIES AND EXCHANGE COMMISSION
WASHINGTON, D.C. 20549
FORM 10-K
|
| |
| x | ANNUAL REPORT PURSUANT TO SECTION 13 OR 15(d) OF THE SECURITIES AND EXCHANGE ACT OF 1934 |
For the Fiscal Year Ended December 31, 20132016
|
| |
| ¨ | TRANSITION REPORT PURSUANT TO SECTION 13 OR 15(d) OF THE SECURITIES EXCHANGE ACT OF 1934 |
(Exact name of registrant as specified in its charter)
|
| |
| DELAWARE | | 75-2303920 |
(State or other jurisdiction of incorporation or organization) | | identification no.) |
| |
5101 Tennyson Parkway | Plano, Texas | 75024 |
Plano, Texas | | (Zip code) |
| (Address of principal executive offices) | | (Zip code) |
Registrant’s telephone number, including area code: (972) 713-3700
Securities registered pursuant to Section 12(b) of the Act:
|
| |
Title of each class | | Name of each exchange on which registered |
| COMMON STOCK, $0.01 PAR VALUE | | NEW YORK STOCK EXCHANGE |
Securities registered pursuant to Section 12(g) of the Act:
NONE
NONE
Indicate by check mark if the registrant is a well-known seasoned issuer, as defined in Rule 405 of the Securities Act. YES ¨ NO x Indicate by check mark if the registrant is not required to file reports pursuant to Section 13 or 15(d) of the Act. YES ¨ NO x Indicate by check mark whether the registrant (1) has filed all reports required to be filed by Section 13 or 15(d) of the Securities Exchange Act of 1934 during the preceding 12 months (or for such shorter period that the registrant was required to file such reports), and (2) has been subject to such filing requirements for the past 90 days. YES x NO ¨ Indicate by check mark if disclosure of delinquent filer pursuant to Item 405 of Regulation S-K is not contained herein, and will not be contained, to the best of the registrant’s knowledge, in definitive proxy or information statements incorporated by reference in Part III of the Form 10-K or any amendment to the Form 10-K. YES ¨ NO x Indicate by check mark whether the registrant has submitted electronically and posted on its corporate Web site, if any, every Interactive Data file required to be submitted and posted pursuant to Rule 405 of Regulation S-T during the preceding 12 months (or for such shorter period that the registrant was required to submit and post such files). YES x NO ¨ Indicate by check mark whether the registrant is a large accelerated filer, an accelerated filer, or a non-accelerated filer. See definition of “accelerated filer and large accelerated filer” in Rule 12b-2 of the Exchange Act. (Check one):
|
| | | | | |
| Large accelerated filer | | x | | Accelerated filer | | ¨ |
| | | | | |
| Non-accelerated filer | | ¨ (Do not check if a smaller reporting company) | | Smaller reporting companyReporting Company | | ¨ |
Indicate by check mark whether the registrant is a shell company (as defined in Rule 12b-2 of the Act.) YES ¨ NO x The aggregate market value of the voting stock held by non-affiliates of the registrant was
$2,077,427,000$5,505,843,000 based on the reported last sale price of common stock on June 30,
2013,2016, which is the last business day of the registrant’s most recently completed second fiscal quarter.
The number of shares of common stock of the registrant outstanding on February 13, 201421, 2017 was 32,925,000.36,828,000
DOCUMENTS INCORPORATED BY REFERENCE
Certain information required by Part III of this annual report is incorporated by reference from the registrant’s definitive proxy statement for its annual meeting of stockholders to be held on May
14, 2014.10, 2017.
Tyler Technologies, Inc. (“Tyler”) is a major provider of integrated information management solutions and services for the public sector, with a focus on local governments. We partner with clients to make local government more accessible to the public, more responsive to the needs of citizens and more efficient in its operations. We have a broad line of software solutions and services to address the information technology (“IT”) needs of major areas of operations for cities, counties, schools and other local government entities. Most of our
customersclients have our software installed in-house. For
customersclients who prefer not to physically acquire the software and hardware, most of our software applications can be delivered as software as a service (“SaaS”), which utilize the Tyler private cloud. We provide professional IT services to our
customers,clients, including software and hardware installation, data conversion, training and, at times, product modifications. In addition, we are the nation’s largest provider of outsourced property appraisal services for taxing jurisdictions. We also provide continuing
customerclient support services to ensure product performance and reliability, which provides us with long-term
customerclient relationships and a significant base of recurring maintenance revenue. In
2010addition, we
began providingprovide electronic document filing solutions (“e-filing”), which simplify the filing and management of court
related documents.
Tyler was founded in 1966. Prior to 1998, we operated as a diversified industrial conglomerate, with operations in various industrial, retail and distribution businesses, all of which have been divested. In 1997, we embarked on a multi-phase growth plan focused on serving the specialized information management needs of local governments nationwide.
In 1998 and 1999, weWe entered the local government IT market through a series of strategic
acquisitions.acquisitions in 1998 and 1999.
The state and local government market is one of the largest and most decentralized IT markets in the country, consisting of all 50 states, approximately 3,000 counties, 36,000 cities and towns and 13,900 school districts. This market is also comprised of approximately 37,000 special districts and other agencies, each with specialized delegated responsibilities and unique information management requirements.
Traditionally, local government bodies and agencies performed state-mandated duties, including property assessment, record keeping, road maintenance, law enforcement, administration of election and judicial functions, and the provision of welfare assistance. Today, a host of emerging and urgent issues are confronting local governments, each of which demands a service response. These areas include criminal justice and corrections, administration and finance, public safety, health and human services,
planning, regulatory and
public works.maintenance and records and document management. Transfers of responsibility from the federal and state governments to county and municipal governments and agencies in these and other areas also place additional service and financial requirements on these local government units. In addition, constituents of local governments are increasingly demanding improved service and better access to information from public entities. As a result, local governments recognize the increasing value of information management systems and services to, among other things, improve revenue collection, provide increased access to information, and streamline delivery of services to their constituents. Local government bodies are now recognizing that “e-government” is an additional responsibility for community development. From integrated tax systems to integrated civil and criminal justice information systems, many counties and cities have benefited significantly from the implementation of jurisdiction-wide systems that allow different agencies or government offices to share data and provide a more comprehensive approach to information management. Many city and county governmental agencies also have unique individual information management requirements, which must be tailored to the specific functions of each particular office.
Many local governments also have difficulties attracting and retaining the staff necessary to support their IT functions. As a result, they seek to establish long-term relationships with reliable providers of high quality IT products and services such as Tyler.
Although local governments generally face budgetary constraints in their operations, their primary revenue sources are usually property taxes, and to a lesser extent, utility billings and other fees, which historically tend to be relatively stable. In addition, the acquisition of new technology typically enables local governments to operate more efficiently, and often provides a measurable return on investment that justifies the purchase of software and related services.
Gartner,
Inc., a leading information technology research and advisory company, estimates that state and local government application and vertical specific software spending will grow from
$10.1$12.7 billion in
20142017 to
$11.5$15.5 billion in
2017.2020. The professional services and support segments of the market
where our business is primarily focused, isare expected to expand from
$34.7$31.1 billion in
20142017 to
$37.3$35.1 billion in
2017.2020. Application and vertical specific software sales in the primary and secondary education segments of the market is expected to expand from
$1.7$2.3 billion in
20142017 to
$2.2$2.9 billion in
20172020 while professional services and support are expected to grow from
$2.3$2.1 billion in
20142017 to
$2.6$2.4 billion in
2017.2020.
We provide a comprehensive and flexible suite of products and services that addresses the information technology needs of cities, counties, schools and other local government entities. We derive our revenues from five primary
sources:sourcessalesSales of software licenses and royalties;royalties
subscription-based arrangements;Subscription-based arrangements
software services;Software services
maintenanceMaintenance and support; andsupport
appraisal services.Appraisal services
We design, develop,
market and
marketsupport a broad range of software solutions to serve mission-critical “back-office” functions of local governments. Many of our software applications include Internet-accessible solutions that allow for real-time public access to a variety of information or that allow the public to transact business with local governments via the Internet. Our software solutions and services are generally grouped in
threesix major areas:
Financial Management and Education;Education
Courts and Justice; andJustice
Public Safety
Property Appraisal and Tax
Planning, Regulatory and Other.Maintenance
Land and Vital Records Management
Each of our core software systems consists of several fully integrated applications. For
customersclients who acquire
the software for use in-house, we generally license our systems under standard perpetual license agreements that provide the
customerclient with a fully paid, nonexclusive, nontransferable right to use the software. In some of the product areas, such as financial management and education and property appraisal and tax, we offer multiple solutions designed to meet the needs of different sized governments.
We also offer SaaS arrangements, which utilize the Tyler private cloud, for
customersclients who do not wish to maintain, update and operate these systems or to make up-front capital expenditures to implement these advanced technologies. For these
customers, we deliver our software using the SaaS model —clients, the software and client data are hosted at our data centers or at third-party locations, and
customersclients typically sign multi-year contracts for these subscription-based services.
Historically, we have had a greater proportion of our annual revenues in the second half of our fiscal year due to governmental budget and spending cycles and the timing of system implementations for
customersclients desiring to “go live” at the beginning of the calendar year.
A description of our suites of products and services follows:
Financial Management and Education
Our financial management and education solutions are enterprise resource planning systems for local governments, which integrate information across all facets of a client organization. Our financial management solutions include modular fund accounting systems that can be tailored to meet the needs of virtually any government agency or not-for-profit entity. Our financial management systems include modules for general ledger, budget preparation, fixed assets, requisitions, purchase orders, bid management, accounts payable, contract management, accounts receivable, investment management, inventory control, project and grant accounting, work orders, job costing, GASB
34 reporting, payroll and human resources. All of our financial management systems are intended to conform to government auditing and financial reporting requirements and generally accepted accounting principles.
We sell utility billing systems that support the billing and collection of metered and non-metered services, along with multiple billing cycles. Our Web-enabled utility billing solutions allow
customersclients to access information online such as average consumption and transaction history. In addition, our systems can accept secured Internet payments via credit cards and checks.
We also offer specialized products that automate numerous city functions, including municipal courts, parking tickets, equipment and project costing, animal licenses, business licenses, permits and inspections, code enforcement, citizen complaint tracking, ambulance billing, fleet maintenance, and cemetery records management.
In addition to providing financial management systems to K-12 schools, we sell student information systems for K-12 schools, which manage such activities as scheduling, grades and attendance. We also offer student transportation solutions to manage school bus routing optimization, fleet management, field trips and other related functions.
Tyler’s financial management and education solutions include Web components that enhance local governments’ service capabilities by facilitating online access to information for both employees and citizens and enabling online transactions.
We offer a complete, fully integrated suite of judicial solutions designed to handle complex, multi-jurisdictional county or statewide implementations as well as single county systems. Our solutions help eliminate duplicate data entry, promote more effective business procedures and improve efficiency across the entire justice process.
Our unified court case management system is designed to automate the tracking and management of information involved in all case types, including criminal, traffic, civil, family, probate and juvenile courts. It also tracks the status of cases, processes fines and fees and generates the specialized judgment and sentencing documents, notices and forms required in the court process. Documents received by the court can be scanned into the electronic case file and easily retrieved for viewing. Documents generated by the court can be electronically signed and automatically attached to the electronic case file. Additional modules automate the management of court calendars, coordinate
judge’sjudges' schedules and generate court dockets. Our targeted courtroom technologies allow courts to rapidly review calendars, cases and view documents in the courtroom. Courts may also take advantage of our related jury management system.
Our law enforcement systems automate police and sheriff functions from dispatch and records management through booking and jail management. Searching, reporting and tracking features are integrated, allowing reliable, up-to-date access to current arrest and incarceration data, including digital mug shots. Our systems also provide warrant checks for visitors or book-ins, inmate classification and risk assessment, commissary, property and medical processing, and automation of statistics and state and federal reporting. Our computer-aided dispatch/emergency 911 system tracks calls and the availability of emergency response vehicles, interfaces with local and state searches, and assists dispatchers with processing emergency situations. The law enforcement and jail management systems are fully integrated with prosecution and other court products that manage the entire judicial process.
Our court and law enforcement systems allow the public to access, via the Internet, a variety of information, including non-confidential criminal and civil court records, jail booking and release information, bond and bondsmen information, and court calendars and dockets. In addition, our systems allow cities and counties to accept payments for traffic and parking tickets over the Internet, with a seamless and automatic interface to back-office justice and financial systems.
Our prosecutor system enables state attorney offices to track and manage criminal cases, including detailed victim information and private case notes. Investigative reports and charging instrument documents can be generated and stored for later viewing. Prosecutors can schedule and record the outcome of grand jury hearings. When integrated with the court system, prosecutors can view the electronic case file and related documents, as well as manage witness lists and subpoenas needed for court hearings.
Our supervision system allows pre-trial and probation offices to manage offender caseloads. Supervision officers can track contact schedules, risk/needs assessments and reassessments, detailed drug test results, employment histories, compliance with conditions and payments of fees and restitution. Documents and forms, like pre-sentence investigations or revocation orders, can be generated and stored for easy viewing. When integrated with the jail and court systems, supervision officers
can haveobtain easy access and quick notification of offenders that have court hearings scheduled, are arrested locally, and have new warrants issued.
We also offer a court case management solution that automates and tracks all aspects of municipal courts and offices. It is a fully integrated, graphical application that provides effective case management, document processing and cash/bond management. This system complies with all state reporting and conviction reports and includes electronic reporting and also integrates with certain of our financial management solutions and public safety solutions.
Public Safety
Our public safety software is a fully unified and comprehensive solution for municipalities includes more than thirty essential law enforcement, criminal investigation,fire and administration recordEMS, including 911 / computer aided dispatch (“CAD”), records management, modules.mobile computing, corrections management, Web-based information sharing and decision support. The public safety solution managesmodules are fully integrated, utilizing a common database and providing full functionality between modules, reducing data entry. The software provides fast, efficient dispatching, and quick access to records, reports and actionable information from an agency’s database.
Our 911 / CAD solutions provide real-time, critical response dispatch functions in either single- or multi-jurisdictional environments. When integrated with our records management software, a vital link exists between dispatch and the most comprehensive records database available. Within seconds, the dispatch operator and the officer in the field can access critical information, such as arrestsprior incidents and field interviews, traffic reportsoutstanding warrants, increasing officer knowledge and citations,safety. The solutions offer strong geographic information systems integration to help dispatchers quickly locate and incidentsend the best response during an emergency. Tyler’s 911 / CAD solutions dramatically improve performance, response time and offense reports. It also supports multimedia files, photo lineups, multi-agency securityunit safety.
Our records management solutions for law enforcement and incidentfire track statistical, operational, investigative and management data for inquiry and reporting. The systems create an efficient case processing workflow and streamlines mandatory reportinghelp solve crimes with an accessible database that maintains central files on people, places, property, vehicles and criminal activity. Tyler’s public safety records management solutions enable easy access to information and simplify reporting.
Our mobile computing solutions for law enforcement and fire provide instant access to local, state,
regional and federal
offices.databases via mobile devices. Officers and firefighters can experience the benefits of obtaining critical, real-time information in the field, while saving time by preparing reports directly in their vehicles.
Our jail management systems document and manage information that meets the requirements of a modern jail facility. This includes the booking and housing of persons in custody, supervising defendants on a pre-trial release, maintaining offenders sentenced to local incarceration and billing other agencies for housing inmates. Searching, reporting and tracking features are integrated, allowing reliable, up-to-date access to current arrest and incarceration data, including digital mug shots. Our systems also provide warrant checks for visitors or book-ins, inmate classification and risk assessment, commissary, property and medical processing, automation of statistics, and state and federal reporting.
Our civil processing solutions manage civil process needs from document receipt through service, payment process and final closeout. We also have a mobile electronic citation solution through which law enforcement officers can easily enter citation information in a mobile device, which is automatically uploaded into the court or public safety records management systems, rather than hand-writing citations that must be re-entered into the systems.
We significantly expanded our presence in the public safety market with our acquisition of New World Systems Corporation in November 2015.
Property Appraisal and Tax
and OtherWe provide systems and software that automate the appraisal and assessment of real and personal property, including record keeping, mass appraisal, inquiry and protest tracking, appraisal and tax roll generation, tax statement processing, and electronic state-level reporting. These systems are image and video-enabled to facilitate the storage of and access to the many property-related documents and for the online storage of digital photographs of properties for use in defending values in protest situations. Other related tax applications are available for agencies that bill and collect taxes, including cities, counties, school tax offices, and special taxing and collection agencies. These systems support billing, collections, lock box operations, mortgage company electronic payments, and various reporting requirements.
Planning, Regulatory and Maintenance
Our planning, regulatory and maintenance software solutions are designed for public sector agencies such as community development, planning, building, code enforcement, tax and revenues, public works, transportation, land control, environmental, fire safety, storm water management, regulatory controls and engineering. These solutions help public sector agencies better manage their day-to-day business functions while streamlining and automating the many aspects of their land management, permitting and planning systems. Our mobile solutions extend automation to the field and Web access brings online services to citizens 24 hours a day, 365 days a year.
Land and Vital Records Management
We also offer a number of specialized software applications designed to help
countylocal governments enhance and automate
courthouse operations.operations involving records and document management. These systems record, scan and index information for the many documents maintained
at the courthouse,by local governments, such as deeds, mortgages, liens, UCC financing statements and vital records (birth, death and marriage certificates). These applications include fully integrated imaging systems with batch and scan processing capabilities and fully integrated receipting and cashiering systems, as well as Web-enabled public access.
Our content management solutions allow state and local governments and school districts to capture, deliver, manage and archive electronic information. These solutions streamline the flow of digital information throughout the organization to increase efficiency by transforming paper forms and documents into electronic images that drive key business processes.
Subscription-Based Services
Subscription-based revenue is primarily derived from our SaaS arrangements, which utilize the Tyler private cloud, as well as our transaction based offerings such as e-filing solutions.
We are able to provide the majority of our software products through our SaaS model. The
customersclients who choose this model typically do not wish to maintain, update and operate these systems or make up-front capital expenditures to implement these advanced technologies. The contract terms for these arrangements range from one to 10 years, but are typically contracted for
a periodinitial periods of
threefive to
sixseven years. The majority of our SaaS or hosting arrangements include additional professional services as well as maintenance and support services. In certain arrangements, the
customerclient may also acquire a license to the software.
As part of our subscription-based services, we provide e-filing solutions that simplify the filing and management of court related documents for courts and law offices. Revenues for e-filing are included in subscription-based revenues and are derived from transaction fees and in some cases fixed fee arrangements.
We provide a variety of professional IT services to
customersclients who utilize our software products. Virtually all of our
customersclients contract with us for installation, training, and data conversion services in connection with their purchase of Tyler’s software solutions. The complete implementation process for a typical system includes planning, design, data conversion, set-up and testing. At the culmination of the implementation process,
an installationa data implementation team travels to the
customer’sclient’s facility to ensure the smooth
transfer of data togo-live with the new system.
InstallationData implementation fees are charged separately to
customersclients on either a fixed-fee or hourly charge basis, depending on the contract.
Both in connection with the installation of new systems and on an ongoing basis, we provide extensive training services and programs related to our products and services. Training can be provided in our training centers, onsite at
customers’clients’ locations, or at meetings and conferences and can be customized to meet
customers’clients’ requirements. The vast majority of our
customersclients contract with us for training services, both to improve their employees’ proficiency and productivity and to fully utilize the functionality of our systems. Training services are generally billed on an hourly or daily basis, along with travel and other expenses.
Following the implementation of our software systems, we provide ongoing software support services to assist our
customersclients in operating the systems and to periodically update the software. Support is provided
to clients over the phone
to customersor via the Web through help desks staffed by our
customerclient support representatives. For more complicated issues, our staff, with the
customers’client’s permission, can log on to
customers’clients’ systems remotely. We maintain our
customers’clients’ software largely through releases that contain improvements and incremental additions of features and functionality, along with updates necessary because of legislative or regulatory changes.
Virtually all of our software
customersclients contract with us for maintenance and support, which provides us with a significant source of recurring revenue. We generally provide maintenance and support
for our on-premises clients under annual,
or in some cases, multi-year contracts, with a typical fee based on a percentage of the software product’s license fee. These fees can
generally be increased
annuallyon renewal and may also increase as new license fees increase. Maintenance and support fees are generally paid
annually in
advance for the entire maintenance contract period.advance. Most maintenance contracts automatically renew unless the
customerclient or Tyler gives notice of termination prior to expiration. Similar support is provided to our SaaS
customers,clients and is included in their subscription fees, which are classified as subscription-based revenues.
We are the nation’s largest provider of property appraisal outsourcing services for local government taxing authorities. These services
include:includetheThe physical inspection of commercial and residential properties;properties
dataData collection and processing;processing
sophisticatedSophisticated computer analyses for property valuation;valuation
preparationPreparation of tax rolls;rolls
communityCommunity education regarding the assessment process; andprocess
arbitrationArbitration between taxpayers and the assessing jurisdiction.jurisdiction
Local government taxing authorities normally reappraise properties from time to time to update values for tax assessment purposes and to maintain equity in the taxing process. In some jurisdictions,
law mandates reassessment
cycles are mandated by law;cycles; in others, they are discretionary. While some taxing jurisdictions perform reappraisals in-house, many local governments outsource this function because of its cyclical nature and because of the specialized knowledge and expertise requirements associated with it. Our appraisal services business unit has been in this business since 1938.
In some instances, we also sell property tax and/or appraisal software products in connection with appraisal outsourcing projects, while other
customersclients may only engage us to provide appraisal services. Appraisal outsourcing services are somewhat seasonal in nature to the extent that winter weather conditions reduce the productivity of data collection activities in connection with those projects.
Our objective is to grow our revenue and earnings
internally,organically, supplemented by focused strategic acquisitions. The key components of our business strategy are to:
| • | | Provide high quality, value–added products and services to our clients. We compete on the basis of, among other things, delivering to customers our deep domain expertise in local government operations through the highest value products and services in the market. We believe we have achieved a reputation as a premium product and service provider to the local government market. |
| • | | Continue to expand our product and service offerings. While we already have what we believe to be the broadest line of software products for local governments, we continually upgrade our core software applications and expand our complementary product and service offerings to respond to technological advancements and the changing needs of our clients. In 2010, we began providing e-filing for courts and law offices, which simplify the filing and management of court related documents. In late 2012, we signed a contract with the Texas Office of Court Administration to manage e-filing of court documents. In early 2013 the state of Texas issued an order mandating e-filing in civil cases beginning in January 2014. We expect this contract to provide a long-term recurring revenue stream of $17 million to $19 million annually when e-filing
|
| becomes mandatory beginning in 2014. We believe revenues from e-filing solutions will grow over time as more local and state governments begin mandating electronic document filings. We also offer solutions that allow the public to access data and conduct transactions with local governments, such as paying traffic tickets, property taxes and utility bills via the Internet. We believe that the addition of such features enhances the market appeal of our core products. Since 2001, we have also offered software products as SaaS solutions which we believe will, over time, have increasing appeal to local governments and will comprise a larger percentage of our new business mix. In addition, we have also broadened our offerings of consulting and business process reengineering services.
|
| • | | Expand our customer base. We seek to establish long-term relationships with new customers primarily through our sales and marketing efforts. While we currently have customers in all 50 states, Canada, the Caribbean, and the United Kingdom, not all of our solutions have achieved nationwide geographic penetration. We intend to continue to expand into new geographic markets by adding sales staff and targeting marketing efforts by solutions in those areas. We also intend to continue to expand our customer base to include more large governments. While our traditional market focus has primarily been on small and mid-sized governments, our increased size and market presence, together with the technological advances and improved scalability of certain of our solutions, are allowing us to achieve increasing success in selling to larger customers. |
| • | | Expand our existing customer relationships. Our existing customer base offers significant opportunities for additional sales of solutions and services that we currently offer, but that existing customers do not fully utilize. Add-on sales to existing customers typically involve lower sales and marketing expenses than sales to new customers. |
| • | | Grow recurring revenues. We have a large recurring revenue base from maintenance and support and subscription-based services, which generated revenues of $253.6 million, or 61% of total revenues, in 2013. We have historically experienced very low customer turnover (approximately 2% annually) and recurring revenues continue to grow as the installed customer base increases. In addition, subscription-based revenues have been our fastest growing revenue category over the past five years, increasing from $17.2 million in 2009 to $61.9 million in 2013. |
| • | | Maximize economies of scale and take advantage of financial leverage in our business. We seek to build and maintain a large client base to create economies of scale, enabling us to provide value-added products and services to our customers while expanding our operating margins. Because we sell primarily “off-the-shelf” software, increased sales of the same solutions result in incrementally higher gross margins. In addition, we believe that we have a marketing and administrative infrastructure in place that we can leverage to accommodate significant long-term growth without proportionately increasing selling, general and administrative expenses. |
| • | | Attract and retain highly qualified employees. We believe that the depth and quality of our operating management and staff is one of our significant strengths, and that the ability to retain such employees is crucial to our continued growth and success. We believe that our stable management team, financial strength and growth opportunities, as well as our leadership position in the local government market, enhance our attractiveness as an employer for highly skilled employees. |
| • | | Pursue selected strategic acquisitions. While we expect to primarily grow internally, from time to time we selectively pursue strategic acquisitions that provide us with one or more of the following: |
| q | new products and services to complement our existing offerings; |
| q | entry into new markets related to local governments; and |
| q | new customers and/or geographic expansion. |
| • | | Establish strategic alliances. In January 2007 we announced a strategic alliance with Microsoft Corporation to jointly develop core public sector functionality for Microsoft Dynamics AX to address the unique accounting needs of public sector organizations worldwide. As part of this alliance we are enhancing Microsoft Dynamics AX with public sector-specific functionality. The arrangement has broadened the functionality of Microsoft Dynamics AX, providing both Tyler and Microsoft with a public sector accounting platform to support their existing and prospective clients well into the future. Microsoft Dynamics AX with public sector functionality was released to the market in August 2011 and is being sold in the United States and internationally through Microsoft’s distribution channels. Tyler is also an authorized Microsoft reseller for the Microsoft Dynamics solutions developed under this arrangement, and we are selling the solutions directly into the government market. Tyler receives license and maintenance royalties on direct and indirect public-sector sales worldwide of the solutions co-developed under this multi-year term relationship. |
•Provide high quality, value–added products and services to our clients. We compete on the basis of, among other things, delivering to clients our deep domain expertise in local government operations through the highest value products and services in the market. We believe we have achieved a reputation as a premium product and service provider to the local government market.
•Continue to expand our product and service offerings. While we already have what we believe to be the broadest line of software products for local governments, we continually upgrade our core software applications and expand our complementary product and service offerings to respond to technological advancements and the changing needs of our clients. In 2010, we began providing e-filing for courts and law offices, which simplifies the filing and management of court related documents. We believe revenue from e-filing solutions will continue to grow over time as more local and state governments mandate electronic document filings. We also offer solutions that allow the public to access data and conduct transactions with local governments, such as paying traffic tickets, property taxes and utility bills via the Internet. We believe that the addition of such features enhances the market appeal of our core products. We have also broadened our offerings of consulting and business process reengineering services. In November 2015, we significantly expanded our presence in the public safety software market through the acquisition of New World Systems Corporation.
•Expand our client base. We seek to establish long-term relationships with new clients primarily through our sales and marketing efforts. While we currently have clients in all 50 states, Canada, the Caribbean, the United Kingdom, and other international locations, not all of our solutions have achieved nationwide geographic penetration. We intend to continue to expand into new geographic markets by adding sales staff and targeting marketing efforts by solutions in those areas. We also intend to continue to expand our customer base to include more large governments. While our traditional market focus has primarily been on small and mid-sized governments, our increased size and market presence, together with the technological advances and improved scalability of certain of our solutions, are allowing us to achieve increasing success in selling to larger clients. We also expect to expand our presence in international markets by leveraging our leadership position in the United States through the disciplined pursuit of selected opportunities in other countries.
•Expand our existing client relationships. Our existing customer base offers significant opportunities for additional sales of solutions and services that we currently offer, but that existing clients do not fully utilize. Add-on sales to existing clients typically involve lower sales and marketing expenses than sales to new clients.
•Grow recurring revenues. We have a large recurring revenue base from maintenance and support and subscription-based services, which generated revenues of $465.7 million, or 62% of total revenues, in 2016. We have historically experienced very low customer turnover (approximately 2% annually) and recurring revenues continue to grow as the installed customer base increases. Subscription-based revenues have been our fastest growing revenue category over the past five years, increasing from $44.6 million in 2012 to $142.7 million in 2016.
•Maximize economies of scale and take advantage of financial leverage in our business. We seek to build and maintain a larger client base to create economies of scale, enabling us to provide value-added products and services to our clients while expanding our operating margins. Because we sell primarily “off-the-shelf” software, increased sales of the same solutions result in incrementally higher gross margins. In addition, we believe that we have a marketing and administrative infrastructure in place that can be leveraged to accommodate significant long-term growth without proportionately increasing selling, general and administrative expenses.
•Attract and retain highly qualified employees. We believe that the depth and quality of our operations management and staff is one of our significant strengths, and that the ability to retain such employees is crucial to our continued growth and success. We believe that our stable management team, financial strength and growth opportunities, as well as our leadership position in the local government market, enhance our attractiveness as an employer for highly skilled employees.
•Pursue selected strategic acquisitions. While we expect to primarily grow internally, from time to time we selectively pursue strategic acquisitions that provide us with one or more of the following
New products and services to complement our existing offerings
Entry into new markets related to local governments
New clients and/or geographic expansion
•Establish strategic alliances. In January 2007, we announced a strategic alliance with Microsoft Corporation to jointly develop core public sector functionality for Microsoft Dynamics AX to address the unique accounting needs of public sector organizations worldwide. As part of this alliance, we are enhancing Microsoft Dynamics AX with public sector-specific functionality. The arrangement has broadened the functionality of Microsoft Dynamics AX, providing both Tyler and Microsoft with a public sector accounting platform to support their existing and prospective clients well into the future. Microsoft Dynamics AX with public sector functionality was released to the market in August 2011 and is being sold in the United States and internationally through Microsoft’s distribution channels. Tyler is also an authorized Microsoft reseller for the Microsoft Dynamics solutions developed under this arrangement, and we are selling the solutions directly into the government market. Tyler receives license and maintenance royalties on direct and indirect public-sector sales worldwide.
Our contractual research and development commitment to develop public sector functionality for Microsoft Dynamics AX was amended in March 2016 and significantly reduced our development commitment through March 2018. However, we will continue to provide sustained engineering and technical support for the public sector functionality within Dynamics AX.
SALES, MARKETING, AND
CUSTOMERSCLIENTS
We market our products and services through direct sales and marketing personnel located throughout the United States. Other in-house sales staff focus on add-on sales, professional services and support.
Sales of new systems are typically generated from referrals from other government offices or departments within a county or municipality, referrals from other local governments, relationships established between sales representatives and county or local officials, contacts at trade shows, direct mailings, and direct contact from prospects already familiar with us. We are active in numerous national, state, county, and local government associations, and participate in annual meetings, trade shows, and educational events.
Customers
Clients consist primarily of county and municipal agencies, school districts and other local government offices. In counties,
customersclients include the auditor, treasurer, tax assessor/collector, county clerk, district clerk, county and district court judges, probation officers, sheriff, and county appraiser. At municipal government sites,
customersclients include directors from various departments, including administration, finance, utilities, public works, code enforcement, personnel, purchasing, taxation, municipal court, and police. Contracts for software products and services are generally implemented over periods of three months to one year,
although some complex implementations may span multiple years, with annually renewing maintenance and support update agreements thereafter. Although either the
customerclient or we can terminate these agreements, historically almost all support and maintenance agreements are automatically renewed annually.
During 2016, approximately 43% of our revenue was attributable to ongoing support and maintenance agreements. Contracts for appraisal outsourcing services are generally one to three years in duration.
During 2013, approximately 46% of our revenue was attributable to ongoing support and maintenance agreements.
We compete with numerous local, regional, and national firms that provide or offer some or many of the same solutions and services that we provide. Many of these competitors are smaller companies that may be able to offer less expensive solutions than ours. Many of these firms operate within a specific geographic area and/or in a narrow product or service niche. We also compete with national firms, some of which have greater financial and technical resources than we do, including Oracle Corporation, Infor,
Lawson, SAP AG,
Affiliated Computer Services, Inc. (a unit of Xerox Corporation), SunGard Data Systems, Inc.FIS (SunGard), Thomson Reuters Corporation,
New World Systems, American Cadastre, LLC (AmCad) and Constellation Software, Inc. In addition, we sometimes compete with consulting and systems integration firms, which develop custom systems, primarily for larger governments. We also occasionally compete with central internal information service departments of local governments, which
requirerequires us to persuade the end-user department to discontinue service by its own personnel and outsource the service to us.
We compete on a variety of factors, including price, service, name recognition, reputation, technological capabilities, and the ability to modify existing products and services to accommodate the individual requirements of the
customer.client. Our ability to offer an integrated system of applications for several offices or departments is often a competitive advantage. Local governmental units often are required to seek competitive proposals through a request for proposal process and some prospective clients use consultants to assist them with the proposal and vendor selection process.
Substantially all of the computers, peripherals, printers, scanners, operating system software, office automation software, and other equipment necessary for the implementation and provision of our software systems and services are presently available from several third-party sources. Hardware is purchased on original equipment manufacturer or distributor terms at discounts from retail. We have not experienced any significant supply problems.
At December 31,
2013,2016, our estimated revenue backlog was approximately
$551.7$953.3 million, compared to
$380.6$844.5 million at December 31,
2012.2015. The backlog represents signed contracts under which the revenue has not been recognized as of year-end. Approximately
$311.0$580.2 million, or
56%61%, of the backlog is expected to be recognized during
2014.2017.
INTELLECTUAL PROPERTY, PROPRIETARY RIGHTS, AND LICENSES
We regard certain features of our internal operations, software, and documentation as confidential and proprietary and rely on a combination of contractual restrictions, trade secret laws and other measures to protect our proprietary intellectual property. We generally do not rely on patents. We believe that, due to the rapid rate of technological change in the computer software industry, trade secrets and copyright protection are less significant than factors such as knowledge, ability and experience of our employees, frequent product enhancements, and timeliness and quality of support services. We typically license our software products under non-exclusive license agreements, which are generally non-transferable and have a perpetual term.
At December 31,
2013,2016, we had
2,5733,831 employees.
Appraisal outsourcing projects are cyclical in nature and can be widely dispersed geographically. We often hire temporary employees to assist in these projects whose term of employment generally ends with the project’s completion. None of our employees are represented by a labor union or are subject to collective bargaining agreements. We consider our relations with our employees to be positive.
INTERNET WEBSITE AND AVAILABILITY OF PUBLIC FILINGS
We file annual, quarterly, current and other reports, proxy statements and other information with the Securities and Exchange Commission, or SEC, pursuant to the Securities Exchange Act. You may read and copy any materials we file with the SEC at the SEC’s Public Reference Room by calling the SEC at
1-800-SEC-0330.1-800-732-0330. The SEC maintains an Internet site that contains reports, proxy and other information statements, and other information regarding issuers, including us, that file electronically with the SEC. The address of this site is http://www.sec.gov.
We also maintain
an Internet sitea website at www.tylertech.com. We make available free of charge through this site our Annual Report on Form 10-K, Quarterly Reports on Form 10-Q, Forms 4 and 5, Current Reports on Form 8-K, and amendments to those reports filed or furnished pursuant to Section 13(a) or 15(d) of the Exchange Act as soon as reasonably practicable after we electronically file such material with, or furnish it to, the SEC. In addition, copies of our annual report will be made available, free of charge upon written request.
Our “Code of Business Conduct and Ethics” is also available on our website. We intend to satisfy the disclosure requirements regarding amendments to, or waivers from, a provision of our Code of Business Conduct and Ethics by posting such information on our website.
An investment in our common stock involves a high degree of risk. Investors evaluating our company should carefully consider the factors described below and all other information contained in this Annual Report. Any of the following factors could materially harm our business, operating results, and financial condition. Additional factors and uncertainties not currently known to us or that we currently consider immaterial could also harm our business, operating results, and financial condition. This section should be read in conjunction with the Financial Statements and related Notes and Management’s Discussion and Analysis of Financial Condition and Results of Operations included in this Annual Report. We may make forward-looking statements from time to time, both written and oral. We undertake no obligation to revise or publicly release the results of any revisions to these forward-looking statements. Our actual results may differ materially from those projected in any such forward-looking statements due to a number of factors, including those set forth below and elsewhere in this Annual Report.
Risks Associated with Our Software Products
Cyber-attacks and security vulnerabilities can disrupt our business and harm our competitive position.
Threats to IT security can take a variety of forms. Individuals and groups of hackers, and sophisticated organizations including state-sponsored organizations, may take steps that pose threats to our clients and our IT. They may develop and deploy malicious software to attack our products and services and gain access to our networks and data centers, or act in a coordinated manner to launch distributed denial of service or other coordinated attacks. Cyber threats are constantly evolving, thereby increasing the difficulty of detecting and successfully defending against them. Cyber threats can have cascading impacts that unfold with increasing speed across our internal networks and systems and those of our partners and clients. Breaches of our network or data security could disrupt the security of our internal systems and business applications, impair our ability to provide services to our clients and protect the privacy of their data, result in product development delays, compromise confidential or technical business information harming our competitive position, result in theft or misuse of our intellectual property or other assets, require us to allocate more resources to improve technologies, or otherwise adversely affect our business. Our business policies and internal security controls may not keep pace with these evolving threats.
We may not be able to fully protect client information from security breaches.
As we continue to grow the number and scale of our cloud-based offerings, we store and process increasingly large amounts of personally identifiable and other confidential information of our clients. The continued occurrence of high-profile data breaches provides evidence of an external environment increasingly hostile to information security. Despite our efforts to improve security controls, it is possible our security controls over personal data, our training of employees on data security, and other practices we follow may not prevent the improper disclosure of client data that we store and manage. Improper disclosure could harm our reputation, lead to legal exposure to clients, or subject us to liability under laws that protect personal data, resulting in increased costs or loss of revenue.
Hosting services for some of our products are dependent upon the uninterrupted operation of data centers.
A material portion of our business is provided through software hosting services. These hosting services depend on the uninterrupted operation of data centers and the ability to protect computer equipment and information stored in these data centers against damage that may be caused by natural disaster, fire, power loss, telecommunications or Internet failure, acts of terrorism, unauthorized intrusion, computer viruses, and other similar damaging events. If any of our data centers were to become inoperable for an extended period, we might be unable to fulfill our contractual commitments. Although we take what we believe to be reasonable precautions against such occurrences, we can give no assurance that damaging events such as these will not result in a prolonged interruption of our services, which could result in client dissatisfaction, loss of revenue, and damage to our business.
We run the risk of errors or defects with new products or enhancements to existing products.
Our software products are complex and may contain errors or defects, especially when first introduced or when new versions or enhancements are released. Although we have not experienced material adverse effects from any such defects or errors to date, we cannot assure you that material defects and errors will not be found in the future. Any such defects could result in a loss of revenues or delay market acceptance. Our license agreements typically contain provisions designed to limit our exposure to potential liability. However, it is possible we may not always successfully negotiate such provisions in our client contracts or the limitation of liability provisions may not be effective due to existing or future federal, state, or local laws, ordinances, or judicial decisions. Although we maintain errors and omissions and general liability insurance, and we try to structure contracts to limit liability, we cannot assure you that a successful claim could not be made or would not have a material adverse effect on our future operating results.
We must timely respond to technological changes to be competitive.
The market for our products is characterized by technological change, evolving industry standards in software technology, changes in client requirements, and frequent new product introductions and enhancements. The introduction of products embodying new technologies and the emergence of new industry standards can render existing products obsolete and unmarketable. As a result, our future success will depend, in part, upon our ability to enhance existing products and develop and introduce new products that keep pace with technological developments, satisfy increasingly sophisticated client requirements, and achieve market acceptance. We cannot assure you that we will successfully identify new product opportunities and develop and bring new products to market in a timely and cost-effective manner. The products, capabilities, or technologies developed by others could also render our products or technologies obsolete or noncompetitive. Our business may be adversely affected if we are unable to develop or acquire new software products or develop enhancements to existing products on a timely and cost-effective basis, or if such new products or enhancements do not achieve market acceptance.
We may be unable to protect our proprietary rights.
Many of our product and service offerings incorporate proprietary information, trade secrets, know-how, and other intellectual property rights. We rely on a combination of contracts, copyrights, and trade secret laws to establish and protect our proprietary rights in our technology. We cannot be certain that we have taken all appropriate steps to deter misappropriation of our intellectual property. There has also been significant litigation recently involving intellectual property rights. We are not currently involved in any material intellectual property litigation; however, we may be a party to such litigation in the future to protect our proprietary information, trade secrets, know-how, and other intellectual property rights. We cannot assure you that third-parties will not assert infringement or misappropriation claims against us with respect to current or future products. Any claims or litigation, with or without merit, could be time-consuming, costly, and a diversion to management. Any such claims and litigation could also cause product shipment delays or require us to enter into royalty or licensing arrangements. Such royalty or licensing arrangements, if required, may not be available on terms acceptable to us, if at all. Therefore, litigation to defend and enforce our intellectual property rights could have a material adverse effect on our business, regardless of the final outcome of such litigation.
Clients may elect to terminate our maintenance contracts and manage operations internally.
It is possible that our clients may elect to not renew maintenance contracts for our software, trying instead to maintain and operate the software themselves using their perpetual license rights (excluding software applications that we provide on a hosted or cloud basis). This could adversely affect our revenues and profits. Additionally, they may inadvertently allow our intellectual property or other information to fall into the hands of third-parties, including our competitors, which could adversely affect our business.
Material portions of our business require the Internet infrastructure to be further developed or adequately maintained.
Part of our future success depends on the use of the Internet as a means to access public information and perform transactions electronically, including, for example, electronic filing of court documents. This in part requires the further development and maintenance of the Internet infrastructure. Among other things, this further development and maintenance will require a reliable network backbone with the necessary speed, data capacity, security, and timely development of complementary products for providing reliable Internet access and services. If this infrastructure fails to be further developed or be adequately maintained, our business would be harmed because users may not be able to access our government portals.
Risks Associated with Selling Products and Services into the Public Sector Marketplace
Selling products and services into the public sector poses unique challenges.
We derive substantially all of our revenues from sales of software and services to state, county, and city governments, other municipal agencies, and other public entities. We expect that sales to public sector clients will continue to account for substantially all of our revenues in the future. We face many risks and challenges associated with contracting with governmental entities, including
Resource limitations caused by budgetary constraints, which may provide for a termination of executed contracts due to a lack of future funding
Long and complex sales cycles
Contract payments at times being subject to achieving implementation milestones, and we may have differences with clients as to whether milestones have been achieved
Political resistance to the concept of contracting with third-parties to provide IT solutions
Legislative changes affecting a local government’s authority to contract with third-parties
Varying bid procedures and internal processes for bid acceptance
Various other political factors, including changes in governmental administrations and personnel
Each of these risks is outside our control. If we fail to adequately adapt to these risks and uncertainties, our financial performance could be adversely affected.
A prolonged economic slowdown could harm our operations.
A prolonged economic slowdown or recession could reduce demand for our software products and services. Local and state governments may face financial pressures that could in turn affect our growth rate and profitability in
2014 and beyond.the future. There is no assurance that local and state spending levels will be unaffected by declining or stagnant general economic conditions, and if budget shortfalls occur, they may negatively impact local and state
information technologyIT spending and could
have a material adverse effect uponadversely affect our
business, operating results, and financial condition.Selling products and services into the public sector poses unique challenges.
We derive substantially all of our revenues from sales of software and services to state, county and city governments, other municipal agencies, and other public entities. We expect that sales to public sector customers will continue to account for substantially all of our revenues in the future. We face many risks and challenges associated with contracting with governmental entities, including:
business.limitations on governmental resources placed by budgetary constraints, which in some circumstances, may provide for a termination of executed contracts because of a lack of future funding;
the sales cycle of governmental agencies may be complex and lengthy;
payments under some public sector contracts are subject to achieving implementation milestones, and we have had, and may in the future have, differences with customers as to whether milestones have been achieved;
political resistance to the concept of government agencies contracting with third parties to provide information technology solutions;
changes in legislation authorizing government’s contracting with third parties;
the internal review process by governmental agencies for bid acceptance;
changes to the bidding procedures by governmental agencies;
changes in governmental administrations and personnel; and
the general effect of economic downturns and other changes on local governments’ ability to spend public funds on outsourcing arrangements.
Each of these risks is outside our control. If we fail to adequately adapt to these risks and uncertainties, our financial performance could be adversely affected.
A decline in the demand for information technology spendingIT may result in a decrease in our revenues or lower our growth rate.
A decline in the demand for
information technologyIT among our current and prospective
customersclients may result in decreased revenues or a lower growth rate
for us because our sales depend, in part, on our
customers’clients’ level of funding for new or additional
information technologyIT systems and services. Moreover, demand for our solutions may be reduced by a decline in overall demand for computer software and services.
Accordingly, weWe cannot assure you that we will be able to increase or maintain our revenues.
The open bidding process
for governmental contracts creates uncertainty in predicting future contract awards.
Many governmental agencies purchase products and services through an open bidding process. Generally, a governmental entity will publish an established list of requirements requesting potential vendors to propose solutions for the established requirements. To respond successfully to these requests for proposals, we must accurately estimate our cost structure for servicing a proposed contract, the time required to establish operations for the proposed client, and the likely terms of any other
third partythird-party proposals submitted. We cannot guarantee that we will win any bids in the future through the request for proposal process, or that any winning bids will ultimately result in contracts on favorable terms. Our failure to secure contracts through the open bidding process, or to secure such contracts on favorable terms, may adversely affect our
business, financial condition,revenue and
results of operations.gross margins.
We face significant competition from other vendors and potential new entrants into our markets.
We believe we are a leading provider of integrated solutions for the public sector. However, we face competition from a variety of software vendors that offer products and services similar to those offered by us, as well as from companies offering to develop custom software. We compete
based on
the basis of a number of factors,
including:includingtheThe attractiveness of theour “evergreen” business strategy
The breadth, depth, and services we offer;
the breadth of products and services we offer;
features and functionalityquality of our software;
price;
quality of productsproduct and service;service offerings
technological innovation;
ourThe ability to modify existing products and servicesour offerings to accommodate the particular clients’ needs of our customers;
name recognition; andTechnological innovation
ourName recognition
Price
Our financial strength and stability.stability
We believe the market is highly fragmented with a large number of competitors that vary in size,
primary computer platforms,product platform, and
overall product scope. Our competitors include consulting firms, publicly held companies that focus on selected segments of the public sector market, and a significant number of smaller, privately held companies. Certain competitors have greater technical, marketing, and financial resources than we do. We cannot assure you that such competitors will not develop products or offer services that are superior to our products or services or that achieve greater market acceptance.
We also compete with internal, centralized
information serviceIT departments of governmental entities, which
requirerequires us to persuade the end-user to stop the internal service and outsource to us. In addition, our
customers mayclients and prospective clients could elect
in the future to provide information management services internally through new or existing departments, which could reduce the market for our services.
We could face additional competition as other established and emerging companies enter the public sector software application market and new products and technologies are introduced. Increased competition could result in pricing pressure, fewer
customerclient orders, reduced gross margins, and loss of market share.
In addition, currentCurrent and potential competitors may make strategic acquisitions or establish cooperative relationships among themselves or with third-parties, thereby increasing the ability of their products to address the needs of our prospective
customers.clients. It is possible that new competitors or alliances
among current and new competitors may emerge and rapidly gain significant market share.
Further, competitive pressures could require us to reduce the price of our software licenses and related services. We cannot assure you that we will be able to compete successfully against current and future competitors, and the failure to do so would have a material adverse effect upon our
business, operating results, and financial condition.Fixed- pricebusiness.
Fixed-price contracts may affect our profits.
Some of our
present contracts are on a fixed-priced basis, which can lead to various risks,
including:includingtheThe failure to accurately estimate the resources and time required for an engagement;engagement
theThe failure to effectively manage governmental agencies’ and other customers’our clients’ expectations regarding the scope of services to be delivered for an estimated price; anda fixed fee
theThe failure to timely and satisfactorily complete fixed-price engagements within budget to the customers’ satisfaction.
If we do not adequately assess these and other risks, we may be subject to cost overruns and penalties, which may harm our
business, financial
condition, or results of operations.performance.
Changes in the insurance markets may affect our
ability to win some contract awards and may lead to increased expenses.business.
Some of our
customers,clients, primarily those for our property appraisal services, require that we secure performance bonds before they will select us as their vendor. In addition, we have in the past been required to provide letters of credit as security for the issuance of a performance bond.
Our current credit facility contains a $25.0 million sublimit for letters of credit. We cannot guarantee that we will be able to secure such performance bonds in the future on terms that are favorable to us, if at all. Our inability to obtain performance bonds on favorable terms or at all could impact our future ability to win some contract awards, particularly large property appraisal services contracts, which could
have a material adverse effect on our business, financial condition, and results of operations.Volatility innegatively impact revenues. In addition, the stockgeneral insurance markets increasing shareholder litigation, the adoption of expansive legislation that redefines corporate controls (in particular, legislation adoptedmay experience volatility, which may lead to prevent future corporate and accounting scandals), as well as other factors have at times led to volatility in premiums for directors’ and officers’ liability insurance. Volatility of the insurance market may result in future increases in our general and administrative expenses which may adversely affect futureand negatively impact our operating results.
Risks Associated with Our Periodic Results and Stock Price
As with other software vendors, we
Software revenue recognition rules may
be requiredrequire us to delay revenue recognition into future
periods, which could adversely impact our operating results.periods.
We have in the past had to, and
may in the future
may havebe required to, defer revenue recognition for
software license fees due to several factors, including
whether:licenseLicense agreements include applications that are under development or other undelivered elements;elements
we must deliverClient contracts require the delivery of services that are considered essential to the functionality of the software, including significant modifications, customization, or complex interfaces, whichthat could delay product delivery or acceptance;acceptance
theThe transaction involves customer acceptance criteria;criteria with a right to refund
theThe transaction involves contingent payment terms or fees;fees
weWe are required to accept a fixed-fee services contract; orcontract
weWe are required to provide extended payment terms.terms
Because of
thethese factors
listed above and other specific requirements
for software revenue recognition under generally accepted accounting principles in the United States,
for software revenue recognition, we must have very precise terms in our
license agreements in ordercontracts to recognize revenue
when we initially deliverupon the delivery and
installinstallation of our software or
performperformance of services. Negotiation of mutually acceptable terms and conditions
canmay extend the sales
cycle, and sometimes we docycle. We are not
obtainalways able to negotiate terms and conditions that permit revenue recognition at the time of delivery or even
as work on theupon project
is completed.We may experience fluctuationscompletion.
Fluctuations in quarterly revenue
that could adversely impact our
stock priceoperating results and
our operating results.Our actual revenues in a quarter could fall below expectations, which could lead to a decline in our stock price.
Our revenues and operating results are difficult to predict and may fluctuate substantially from quarter to
quarter. Revenues from license fees in any quarter
depend substantially upon our contracting activity and our ability to recognize revenues in that quarter in accordance with our revenue recognition policies. Our quarterly revenue may fluctuate and may be difficult to forecast for a variety of reasons, including the
following:followinga significant number of our prospective customers’Prospective clients’ contracting decisions regarding whether to enter into license agreements with us may beare often made withinin the last few weeks of each quarter;a quarter
theThe size of license transactions can vary significantly;significantly
customersClients may unexpectedly postpone or cancel procurement processes due to changes in their strategic priorities, project objectives, budget, or personnel;personnel
customerClient purchasing processes vary significantly and a customer’sclient’s internal approval, expenditure authorization, and contract negotiation processes can be difficult and time consuming to complete, even after selection of a vendor;vendor
theThe number, timing, and significance of software product enhancements and new software product announcements by us and our competitors may affect purchase decisions;decisions
weWe may have to defer revenues under our revenue recognition policies; andpolicies
customersClients may choose ourelect subscription-based arrangements, which result in lower software license revenues in the initial year as compared to traditional, perpetualon-premise software license arrangements, but generate higher overall subscription-based revenues over the term of the contract.contract
Fluctuation in our quarterly revenues may adversely affect our operating results.
In each fiscal quarter, our expense levels, operating costs, and hiring plans are based to some extent on projections of future revenues and are relatively fixed. If our actual revenues fall below expectations, we could experience a reduction in operating results.
Also, if actual revenues or earnings for any given quarter fall below expectations, it may lead to a decline in our stock price.
Increases in service revenue as a percentage of total revenues could decrease overall
margins and adversely affect our operating results.margins.
We realize lower margins on software and appraisal service revenues than on license revenue. The majority of our contracts include both software licenses and
professionalsoftware services. Therefore, an increase in the percentage of software service and appraisal service revenue compared to license revenue could have a detrimental impact on our overall gross margins and could adversely affect operating results.
Our stock price may be volatile.
The market price of our common stock may be
volatile and may be significantly affected by many different factors. Some examplesvolatile. Examples of factors that
can have a significantmay significantly impact
on our stock price
include:includeactualActual or anticipated fluctuations in our operating results;results
announcementsAnnouncements of technological innovations, new products, or new contracts by us or our competitors;competitors
developmentsDevelopments with respect to patents, copyrights, or other proprietary rights;rights
conditionsConditions and trends in the software and other technology industries;industries
adoptionAdoption of new accounting standards affecting the software industry;industry
changesChanges in financial estimates by securities analysts; andanalysts
generalGeneral market conditions and other factors.factors
In addition, the stock market has from time to time experienced significant price and volume fluctuations that have particularly affected the market prices
for the common stock of technology
companies. These broad market fluctuationscompany stocks and may
in the future adversely affect the market price of our
common stock.
In the past,Sometimes, securities class action litigation is filed following periods of volatility in the market price of a particular company’s
securities, securities class action litigation has often been brought against that company.securities. We cannot assure you that similar litigation will not occur in the future with respect to us. Such litigation could result in substantial costs and a diversion of management’s attention and resources, which could have a material adverse effect upon our
business, operating results, and financial
condition.performance.
From time to time, in press releases and otherwise, we may publish forecasts or other forward-looking statements regarding our results, including estimated revenues or
net earnings. Any forecast of our future performance reflects various assumptions. These assumptions are subject to significant uncertainties, and as a matter of course, any number of them may prove to be incorrect. Further, the achievement of any forecast depends on numerous risks and other factors (including those described in this discussion), many of which are beyond our control. As a result, we cannot be certain that our performance will be consistent with any management forecasts or that the variation from such forecasts will not be material and adverse. Current and potential stockholders are cautioned not to base their entire analysis of our business and prospects upon isolated predictions, but instead are encouraged to utilize our entire publicly available mix of historical and forward-looking information, as well as other available information regarding us, our products and services, and the software industry when evaluating our prospective results of operations.
Risks Associated with Our Software Products
Our products are complex and we run the risk of errors or defects with new product introductions or enhancements.
Software products as complex as those developed by us may contain errors or defects, especially when first introduced or when new versions or enhancements are released. Although we have not experienced material adverse effects resulting from any such defects or errors to date, we cannot assure you that material defects and errors will not be found after commencement of product shipments. Any such defects could result in loss of revenues or delay market acceptance.
Our license agreements with our customers typically contain provisions designed to limit our exposure to potential liability claims. It is possible, however, that we may not always be able to negotiate such provisions in our contracts with customers or that the limitation of liability provisions contained in our license agreements may not be effective as a result of existing or future federal, state or local laws, ordinances, or judicial decisions. Although we maintain errors and omissions and general liability insurance, and we try to structure our contracts to include limitations on liability, we cannot assure you that a successful claim could not be made or would not have a material adverse effect on our business, financial condition, and results of operations.
We must respond to rapid technological changes to be competitive.
The market for our products is characterized by rapid technological change, evolving industry standards in computer hardware and software technology, changes in customer requirements, and frequent new product introductions and enhancements. The introduction of products embodying new technologies and the emergence of new industry standards can render existing products obsolete and unmarketable. As a result, our future success will depend, in part, upon our ability to continue to enhance existing products and develop and introduce in a timely manner or acquire new products that keep pace with technological developments, satisfy increasingly sophisticated customer requirements, and achieve market acceptance. We cannot assure you that we will successfully identify new product opportunities and develop and bring new products to market in a timely and cost-effective manner. Further, we cannot assure you that the products, capabilities, or technologies developed by others will not render our products or technologies obsolete or noncompetitive. If we are unable to develop or acquire on a timely and cost-effective basis new software products or enhancements to existing products, or if such new products or enhancements do not achieve market acceptance, our business, operating results, and financial condition may be materially adversely affected.
We may be unable to protect our proprietary rights.
Many of our product and service offerings incorporate proprietary information, trade secrets, know-how, and other intellectual property rights. We rely on a combination of contracts, copyrights, and trade secret laws to establish and protect our proprietary rights in our technology. We cannot be certain that we have taken all appropriate steps to deter misappropriation of our intellectual property. In addition, there has been significant litigation in the United States in recent years involving intellectual property rights. We are not currently involved in any material intellectual property litigation. We may, however, be a party to intellectual property litigation in the future to protect our proprietary information, trade secrets, know-how, and other intellectual property rights. Further, we cannot assure you that third parties will not assert infringement or misappropriation claims against us in the future with respect to current or future products. Any claims or litigation, with or without merit, could be time-consuming and result in costly litigation and diversion of management’s attention. Further, any claims and litigation could cause product shipment delays or require us to enter into royalty or licensing arrangements. Such royalty or licensing arrangements, if required, may not be available on terms acceptable to us, if at all. Thus, litigation to defend and enforce our intellectual property rights could have a material adverse effect on our business, financial condition, and results of operations, regardless of the final outcome of such litigation.
We generally grant our customers fully paid perpetual licenses to use our software applications and customers may elect to terminate our maintenance contracts and manage operations internally.
It is possible that governments and their successors and affiliates may elect to not renew maintenance contracts for our software, trying instead to maintain and operate the software themselves using their right of use license rights to the software programs and other applications we have developed for them in their operations (excluding software applications that we provide on a software-as-a-service basis). This could adversely affect our revenues and profits. Additionally, they may inadvertently allow our intellectual property or other information to fall into the hands of third parties, including our competitors.
We cannot fully protect client information from security breaches.
As a provider of hosted services, we receive, maintain, process, and transmit confidential information on behalf of our clients and other authorized users. There is no guarantee that the systems and procedures that we maintain to protect against unauthorized access to such information are adequate to protect against loss, destruction, computer break-ins, theft, or other improper activity that could jeopardize the security of such information for which we are responsible. Any such lapse in security could expose us to litigation, loss of customers, harm our business reputation, and otherwise cause a material adverse effect on our business and financial results.
Hosting services for some of our products are dependent upon the uninterrupted operation of data centers.
A material portion of our business is provided through hosting services of some of our software products. These hosting services depend on the uninterrupted operation of data centers and the ability to protect computer equipment and information stored in these data centers against damage that may be caused by natural disaster, fire, power loss, telecommunications or Internet failure, unauthorized intrusion, computer viruses, and other similar damaging events. If any of our data centers were to become inoperable for an extended period, we might be unable to provide our customers with contracted services. Although we take what we believe to be reasonable precautions against such occurrences, we can give no assurance that damaging events such as these will not result in a prolonged interruption of our services, which could result in customer dissatisfaction, loss of revenue, and damage to our business.
Material portions of our business require the Internet infrastructure to be further developed or adequately maintained.
The Internet has experienced, and is expected to continue to experience, significant growth in the number of users and amount of traffic. If the Web continues to experience increased numbers of users, frequency of use, or increased bandwidth requirements, the Internet infrastructure may not be able to support these increased demands or perform reliably. The Internet has experienced a variety of outages and other delays as a result of damage to portions of its infrastructure, and could face such outages and delays in the future. These outages and delays could reduce the level of Internet usage and traffic on our government portals. Such outages and delays would also hinder our customers’ ability to complete online transactions. In addition, the Internet could lose its viability due to delays in the development or adoption of new standards and protocols to handle increased levels of activity or due to increased governmental regulation. If the Internet infrastructure is not adequately further developed or maintained, use of our government portals and our citizen-to-government and business-to-government services may be reduced.
Part of our future success depends on the use of the Internet as a means to access public information and perform transactions electronically, including for example, electronic filing of court documents. This in part requires the further development and maintenance of the Internet infrastructure. If this infrastructure fails to be further developed or be adequately maintained, our business would be harmed because users may not be able to access our government portals. Among other things, this further development and maintenance will require a reliable network backbone with the necessary speed, data capacity, security, and timely development of complementary products for providing reliable Internet access and services.
Risks Associated with Our Growth Strategy and Other General Corporate Risks
We may experience difficulties in executing our acquisition strategy.
A
significantmaterial portion of our
historical growth has resulted from strategic
acquisitions in new product and geographic markets.acquisitions. Although our focus is on internal growth, we will continue to identify and pursue strategic acquisitions
and alliances with suitable candidates.
These transactions involve significant challenges and risks, including the transaction does not advance our business strategy, we get no satisfactory return on our investment, we have difficulty integrating business systems and technology, we have difficulty retaining or integrating new employees, the transactions distract management from our other businesses, we acquire unforeseen liabilities, and other unanticipated events. Our future success will depend, in part, on our ability to successfully integrate future acquisitions
and other strategic alliances into our operations.
AcquisitionsIt may
involve a number of special risks, including diversion of management’s attention, failuretake longer than expected to
retain key acquired personnel, unanticipated events or circumstances, legal liabilities, and amortization of certain acquired intangible assets. Some or allrealize the full benefits of these
risks could have a material adverse effect on our business, financial condition, and results of operations.transactions, such as increased revenue, enhanced efficiencies, or increased market share, or the benefits may be ultimately smaller than we expected. Although we conduct due diligence reviews of potential acquisition candidates, we may not identify all material liabilities or risks related to acquisition candidates. There can be no assurance that any such strategic acquisitions
or alliances will be accomplished on favorable terms or will result in profitable operations.
Our failure to properly manage growth could adversely affect our business.
We have expanded our operations
significantly since 1998, when we entered the business of providing software solutions and services to the public sector. We intend to continue expansion in the foreseeable future to pursue existing and potential market opportunities. This growth places a significant demand on management and operational resources. In order to manage growth effectively, we must implement
and improve our operational systems, procedures, and controls on a timely basis. We must also identify, hire, train, and manage key managerial and technical personnel. If we fail to implement these systems, or employ and retain such qualified personnel, our business financial condition, and results of operations may be materially adversely affected.
We may be unable to hire, integrate, and retain qualified personnel.
Our continued success will depend upon the availability and performance of our key management, sales, marketing,
customerclient support, and product development personnel. The loss of key management or technical personnel could adversely affect us. We believe that our continued success will depend in large part upon our ability to attract, integrate, and retain such personnel. We have at times experienced and continue to experience difficulty in recruiting qualified personnel. Competition for qualified software development, sales, and other personnel is intense, and we cannot assure you that we will be successful in attracting and retaining such personnel.
Compliance with changing regulation of corporate governance
and public disclosure may result in additional expenses.
Changing laws, regulations, and standards relating to corporate governance and public disclosure
including the Sarbanes-Oxley Act of 2002, new Securities and Exchange Commission regulations and New York Stock Exchange rules, are creatingcan create uncertainty for
companies such as ours.public companies. The costs required to comply with such evolving laws are difficult to predict. To maintain high standards of corporate governance and public disclosure, we intend to invest all reasonably necessary resources to comply with evolving standards. This investment may result in an unforeseen increase in general and administrative expenses and a diversion of management’s time and attention from revenue-generating activities, which may harm our
business, financial condition, or results of operations.Historically, we have not paidoperating results.
We don’t foresee paying dividends on our common stock.
We have not declared or paid a cash dividend since we entered the business of providing software solutions and services to the public sector in 1998.
Additionally, our bank credit agreement contains restrictions on the payment of cash dividends. We intend to retain earnings for use in the operation and expansion of our business. We do not anticipate paying any cash dividends on our common stock in the foreseeable future.
Provisions in our certificate of incorporation, bylaws, and Delaware law could deter takeover attempts.
Our board of directors may issue up to 1,000,000 shares of preferred stock and may determine the price, rights, preferences, privileges, and restrictions, including voting and conversion rights, of these
shares of preferred
stock.shares. These determinations may be made without any further vote or action by our stockholders. The rights of the holders of our common stock will be subject to, and may be adversely affected by, the rights of the holders of any preferred stock that may be issued in the future. The issuance of preferred stock may make it more difficult for a
third partythird-party to acquire a majority of our outstanding voting stock. In addition, some provisions of our Certificate of Incorporation, Bylaws, and
of the Delaware General Corporation Law could also delay, prevent, or make more difficult a merger, tender offer, or proxy contest involving us.
ITEM 1B. | UNRESOLVED STAFF COMMENTS. |
ITEM 1B. UNRESOLVED STAFF COMMENTS.
We occupy approximately
625,000890,000 square feet of office space, of which
360,000approximately 609,000 square feet is in office facilities we own. We own or lease offices for our major operations in Arizona, Colorado, Georgia, Iowa, Maine,
Michigan, Montana, New York, Ohio, Texas and Washington.
| |
| ITEM 3. | LEGAL PROCEEDINGS. |
Other than routine litigation incidental to our business, there are no material legal proceedings pending to which we are party or to which any of our properties are subject.
| |
| ITEM 4. | SUBMISSION OF MATTERS TO A VOTE OF SECURITY HOLDERS. |
| |
| ITEM 5. | MARKET FOR REGISTRANT’S COMMON EQUITY, RELATED STOCKHOLDER MATTERS AND ISSUER PURCHASES OF EQUITY SECURITIES. |
Our common stock is traded on the New York Stock Exchange under the symbol “TYL.” At December 31,
2013,2016, we had approximately
1,7761,492 stockholders of record.
A numberMost of our stockholders hold their shares in street name; therefore, there are substantially more than
1,7761,492 beneficial owners of our common stock.
The following table shows, for the calendar periods indicated, the high and low sales price per share of our common stock as reported on the New York Stock Exchange.
| | | | | | | | | | |
2012: | | First Quarter | | $ | 39.43 | | | $ | 29.67 | |
| | Second Quarter | | | 41.61 | | | | 36.00 | |
| | Third Quarter | | | 44.41 | | | | 36.99 | |
| | Fourth Quarter | | | 49.60 | | | | 41.95 | |
2013: | | First Quarter | | $ | 61.60 | | | $ | 48.86 | |
| | Second Quarter | | | 70.49 | | | | 57.00 | |
| | Third Quarter | | | 88.68 | | | | 68.60 | |
| | Fourth Quarter | | | 105.74 | | | | 83.25 | |
2014: | | First Quarter (through February 13, 2014) | | $ | 107.99 | | | $ | 87.22 | |
|
| | | | | | | | |
| | | High | | Low |
| 2015: | First Quarter | $ | 125.84 |
| | $ | 103.18 |
|
| | Second Quarter | 133.54 |
| | 118.05 |
|
| | Third Quarter | 152.91 |
| | 127.25 |
|
| | Fourth Quarter | 184.01 |
| | 150.00 |
|
| | | | | |
| 2016 | First Quarter | $ | 172.50 |
| | $ | 118.16 |
|
| | Second Quarter | 168.19 |
| | 126.70 |
|
| | Third Quarter | 175.77 |
| | 159.24 |
|
| | Fourth Quarter | 172.24 |
| | 139.61 |
|
| | | | | |
| 2017: | First Quarter (through February 21, 2017) | $ | 166.86 |
| | $ | 142.75 |
|
We did not pay any cash dividends in
20132016 or
2012.2015. Our bank credit agreement contains restrictions on the payment of cash dividends. We intend to retain earnings for use in the operation and expansion of our business, and, therefore, we do not anticipate declaring a cash dividend in the foreseeable future.
The following table summarizes certain information related to our stock option plan and our
Employee Stock Purchase Plan (“ESPP”).employee stock purchase plan. There are no warrants or rights related to our equity compensation plans as of December 31,
2013. | | | | | | | | | | | | |
Plan Category | | Number of securities to be
issued upon exercise of
outstanding options,
warrants and rights as of
December 31, 2013 | | | Weighted average
exercise price of
outstanding
options, warrants
and rights | | | Number of securities remaining
available for future issuance
under equity compensation
plans (excluding securities
reflected in initial column as of
December 31, 2013) | |
Equity compensation plans approved by security shareholders: | | | | | | | | | | | | |
Stock options | | | 5,719,374 | | | $ | 34.66 | | | | 1,139,755 | |
ESPP | | | 9,783 | | | | 86.81 | | | | 994,514 | |
Equity compensation plans not approved by security shareholders | | | — | | | | — | | | | — | |
| | | | | | | | | | | | |
| | | 5,729,157 | | | $ | 34.75 | | | | 2,134,269 | |
| | | | | | | | | | | | |
2016.
|
| | | | | | | | | |
| | Number of securities to be issued upon exercise of outstanding options, warrants and rights as of December 31, 2016 | | Weighted average exercise price of outstanding options, warrants and rights | | Number of securities remaining available for future issuance under equity compensation plans (excluding securities reflected in initial column as of December 31, 2016) |
| Plan Category | | | | | |
Equity compensation plans approved by security shareholders: | | | | | |
| Stock option plan | 5,155,437 |
| | $ | 83.64 |
| | 2,902,978 |
|
| Employee stock purchase plan | 13,592 |
| | 121.35 |
| | 846,727 |
|
Equity compensation plans not approved by security shareholders | — |
| | — |
| | — |
|
| | 5,169,029 |
| | $ | 83.74 |
| | 3,749,705 |
|
As of December 31, 2013,2016, we had authorization to repurchase up to 1.72.0 million additional shares of Tyler common stock. There was noDuring 2016, we purchased approximately 882,000 shares of our common stock for an aggregate purchase price of $112.7 million. A summary of the repurchase activity during the twelve months ended December 31, 2013. 2016 is as follows:
|
| | | | | | | | | | | | | |
| Period | | Total number of shares repurchased | | Additional number of shares authorized that may be repurchased | | Average price paid per share | | Maximum number of shares that may be repurchased under current authorization |
| Three months ended March 31 | | 757,000 |
| | | | $ | 124.75 |
| | 643,000 |
|
| Additional authorization by the board of directors | | — |
| | 1,500,000 |
| | — |
| | 2,143,000 |
|
| Three months ended June 30 | | — |
| | — |
| | — |
| | 2,143,000 |
|
| Three months ended September 30 | | — |
| | — |
| | — |
| | 2,143,000 |
|
| October 1 through October 31 | | — |
| | — |
| | — |
| | 2,143,000 |
|
| November 1 through November 30 | | 37,000 |
| | — |
| | 149.53 |
| | 2,106,000 |
|
| December 1 through December 31 | | 88,000 |
| | — |
| | 144.57 |
| | 2,018,000 |
|
| | | 882,000 |
| | 1,500,000 |
| | $ | 127.75 |
| | |
The repurchase program, which was approved by our board of directors, was announced in October 2002 and was amended
in Aprilat various times from 2003
July 2003, October 2004, October 2005, May 2007, May 2008, October 2008, May 2009, July 2010, October 2010 and September 2011.through 2016. There is no expiration date specified for the authorization, and we intend to repurchase stock under the plan from time to time.
Subsequent to December 31, 2016 and through February 21, 2017, we purchased approximately 42,000 shares of our common stock for an aggregate cash purchase price of $6.2 million.
The following Performance Graph and related information shall not be deemed “soliciting material” or to be “filed” with the Securities and Exchange Commission, nor shall such information be incorporated by reference into any future filing under the Securities Act of 1933 or Securities Exchange Act of 1934, each as amended, except to the extent that we specifically incorporate it by reference into such filing.
The following table compares total
Shareholdershareholder returns for Tyler over the last five years to the Standard and Poor’s 500 Stock Index and the Standard and Poor’s 600 Information Technology Index assuming a $100 investment made on December 31,
2008.2011. Each of the three measures of cumulative total return assumes reinvestment of dividends. The stock performance shown on the graph below is not necessarily indicative of future price performance.
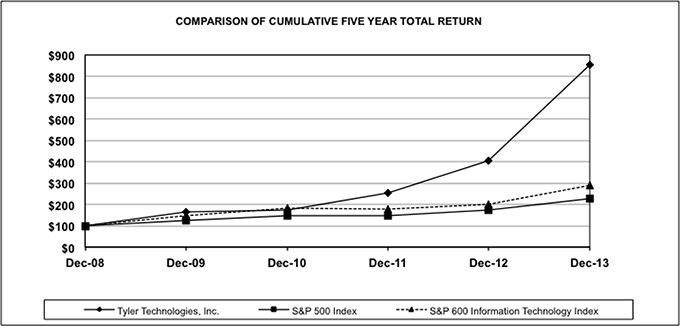
| | | | | | | | | | | | | | | | | | | | | | | | |
Company / Index | | 12/31/08 | | | 12/31/09 | | | 12/31/10 | | | 12/31/11 | | | 12/30/12 | | | 12/30/13 | |
Tyler Technologies, Inc. | | | 100 | | | | 166.19 | | | | 173.29 | | | | 251.34 | | | | 404.34 | | | | 852.50 | |
S&P 500 Index | | | 100 | | | | 126.46 | | | | 145.51 | | | | 148.59 | | | | 172.37 | | | | 228.19 | |
S&P 600 Information Technology Index | | | 100 | | | | 148.16 | | | | 184.60 | | | | 177.17 | | | | 198.48 | | | | 287.61 | |
|
| | | | | | | | | | | | | | | | | |
| Company / Index | 12/31/11 |
| | 12/31/12 |
| | 12/31/13 |
| | 12/31/14 |
| | 12/31/15 |
| | 12/31/16 |
|
| Tyler Technologies, Inc. | 100 |
| | 160.88 |
| | 339.19 |
| | 363.47 |
| | 578.94 |
| | 474.16 |
|
| S&P 500 Stock Index | 100 |
| | 116.00 |
| | 153.57 |
| | 174.60 |
| | 177.01 |
| | 198.18 |
|
| S&P 600 Information Technology Index | 100 |
| | 112.02 |
| | 162.33 |
| | 183.91 |
| | 192.46 |
| | 257.61 |
|
ITEM 6. SELECTED FINANCIAL DATA.
(In thousands, except per share data)
| | | | | | | | | | | | | | | | | | | | |
| | | FOR THE YEARS ENDED DECEMBER 31, | |
| | | 2013 | | | 2012 | | | 2011 | | | 2010 | | | 2009 | |
STATEMENT OF OPERATIONS DATA: | | | | | | | | | | | | | | | | | | | | |
Revenues | | $ | 416,643 | | | $ | 363,304 | | | $ | 309,391 | | | $ | 288,628 | | | $ | 290,286 | |
Costs and expenses: | | | | | | | | | | | | | | | | | | | | |
Cost of revenues | | | 223,440 | | | | 195,602 | | | | 167,479 | | | | 160,311 | | | | 161,523 | |
Selling, general and administrative expenses | | | 98,289 | | | | 86,706 | | | | 75,650 | | | | 69,480 | | | | 70,115 | |
Research and development expense | | | 23,269 | | | | 20,140 | | | | 16,414 | | | | 13,971 | | | | 11,159 | |
Amortization of customer and trade name intangibles | | | 4,517 | | | | 4,279 | | | | 3,331 | | | | 3,225 | | | | 2,705 | |
| | | | | | | | | | | | | | | | | | | | |
Operating income | | | 67,128 | | | | 56,577 | | | | 46,517 | | | | 41,641 | | | | 44,784 | |
Other expense, net | | | (1,309 | ) | | | (2,709 | ) | | | (2,404 | ) | | | (1,742 | ) | | | (146 | ) |
| | | | | | | | | | | | | | | | | | | | |
Income from operations before income taxes | | | 65,819 | | | | 53,868 | | | | 44,113 | | | | 39,899 | | | | 44,638 | |
Income tax provision | | | 26,718 | | | | 20,874 | | | | 16,556 | | | | 14,845 | | | | 17,628 | |
| | | | | | | | | | | | | | | | | | | | |
Net income | | $ | 39,101 | | | $ | 32,994 | | | $ | 27,557 | | | $ | 25,054 | | | $ | 27,010 | |
| | | | | | | | | | | | | | | | | | | | |
Net income per diluted share | | $ | 1.13 | | | $ | 1.00 | | | $ | 0.83 | | | $ | 0.71 | | | $ | 0.74 | |
| | | | | | | | | | | | | | | | | | | | |
Weighted average diluted shares | | | 34,590 | | | | 32,916 | | | | 33,154 | | | | 35,528 | | | | 36,624 | |
STATEMENT OF CASH FLOWS DATA: | | | | | | | | | | | | | | | | | | | | |
Cash flows provided by operating activities | | $ | 66,090 | | | $ | 58,668 | | | $ | 56,435 | | | $ | 35,350 | | | $ | 42,941 | |
Cash flows used by investing activities | | | (25,658 | ) | | | (34,736 | ) | | | (28,809 | ) | | | (8,694 | ) | | | (13,658 | ) |
Cash flows provided (used) by financing activities | | | 32,038 | | | | (18,852 | ) | | | (28,414 | ) | | | (34,238 | ) | | | (21,349 | ) |
BALANCE SHEET DATA: | | | | | | | | | | | | | | | | | | | | |
Total assets | | $ | 444,488 | | | $ | 338,666 | | | $ | 295,391 | | | $ | 264,032 | | | $ | 270,670 | |
Revolving line of credit | | | — | | | | 18,000 | | | | 60,700 | | | | 26,500 | | | | — | |
Shareholders’ equity | | | 246,319 | | | | 145,299 | | | | 78,110 | | | | 106,972 | | | | 134,358 | |
|
| | | | | | | | | | | | | | | | | | | |
| | FOR THE YEARS ENDED DECEMBER 31, |
| | 2016 | | 2015 (b) | | 2014 | | 2013 | | 2012 |
| STATEMENT OF OPERATIONS DATA: | | | | | | | | | |
| Revenues | $ | 756,043 |
| | $ | 591,022 |
| | $ | 493,101 |
| | $ | 416,643 |
| | $ | 363,304 |
|
| Cost and expenses: | | | | | | | | | |
| Cost of revenues | 400,692 |
| | 313,835 |
| | 259,730 |
| | 223,440 |
| | 195,602 |
|
| Selling, general and administrative expenses | 167,161 |
| | 133,317 |
| | 108,260 |
| | 98,289 |
| | 86,706 |
|
| Research and development expense | 43,154 |
| | 29,922 |
| | 25,743 |
| | 23,269 |
| | 20,140 |
|
| Amortization of customer and trade name intangibles | 13,731 |
| | 5,905 |
| | 4,546 |
| | 4,517 |
| | 4,279 |
|
| Operating income | 131,305 |
| | 108,043 |
| | 94,822 |
| | 67,128 |
| | 56,577 |
|
| Other (expenses) income, net | (1,998 | ) | | 381 |
| | (355 | ) | | (1,309 | ) | | (2,709 | ) |
| Income before income taxes | 129,307 |
| | 108,424 |
| | 94,467 |
| | 65,819 |
| | 53,868 |
|
| Income tax provision (a) | 19,450 |
| | 43,555 |
| | 35,527 |
| | 26,718 |
| | 20,874 |
|
| Net income | 109,857 |
| | 64,869 |
| | 58,940 |
| | 39,101 |
| | 32,994 |
|
| Net earnings per diluted share | $ | 2.82 |
| | $ | 1.77 |
| | $ | 1.66 |
| | $ | 1.13 |
| | $ | 1.00 |
|
| Weighted average diluted shares (a) | 38,961 |
| | 36,552 |
| | 35,401 |
| | 34,590 |
| | 32,916 |
|
| STATEMENT OF CASH FLOWS DATA: | | | | | | | | | |
| Cash flows provided by operating activities (a) | $ | 191,859 |
| | $ | 134,327 |
| | $ | 142,839 |
| | $ | 94,297 |
| | $ | 67,432 |
|
| Cash flows used by investing activities | (50,720 | ) | | (398,459 | ) | | (11,555 | ) | | (25,658 | ) | | (34,736 | ) |
| Cash flows (used) provided by financing activities (a) | (138,075 | ) | | 91,052 |
| | (3,993 | ) | | 3,831 |
| | (27,616 | ) |
| BALANCE SHEET DATA: | | | | | | | | | |
| Total assets | $ | 1,357,945 |
| | $ | 1,356,570 |
| | $ | 569,812 |
| | $ | 444,488 |
| | $ | 338,666 |
|
| Revolving line of credit | 10,000 |
| | 66,000 |
| | — |
| | — |
| | 18,000 |
|
| Shareholders' equity | 915,525 |
| | 858,857 |
| | 336,973 |
| | 246,319 |
| | 145,299 |
|
(a) During 2016, we adopted Accounting Standards Update ("ASU") No. 2016-09 "Improvements to Employee Share-Based Payment Accounting" requiring the recognition of excess tax benefits or tax deficiencies as a component of income tax expense; these benefits or deficiencies were historically recognized in equity. As the standard requires a prospective method of adoption, our net income in 2016 includes a $29.6 million income tax benefit due to the adoption that did not occur in the comparable periods presented above. In addition, the ASU updates the method of calculating diluted shares resulting in the inclusion of 519,000 additional shares in our diluted earnings per share calculation that is not comparable to the other periods presented. Refer to Note 1 "Summary of Significant Accounting Policies" for further discussion of this new accounting standard.
The adoption of ASU No. 2016-09 also requires excess tax benefits, previously presented as financing activities, to be classified as operating activities. As retrospective adoption for this component of the standard is allowable, we have adjusted all periods presented above to reflect this change in classification.
(b) On November 16, 2015, we completed the acquisition of New World Systems Corporation ("NWS"). Operating results for the twelve months ended December 31, 2015, include $5.9 million for financial advisory, legal, accounting, due diligence, valuation and other expenses necessary to complete the NWS acquisition as well as $3.5 million amortization expense related to NWS acquisition intangibles.
| |
| ITEM 7. | MANAGEMENT’S DISCUSSION AND ANALYSIS OF FINANCIAL CONDITION AND RESULTS OF OPERATIONS. |
ITEM 7. MANAGEMENT’S DISCUSSION AND ANALYSIS OF FINANCIAL CONDITION AND RESULTS OF OPERATIONS.FORWARD-LOOKING STATEMENTS
This document contains “forward-looking statements” within the meaning of Section 27A of the Securities Act of 1933 and Section 21E of the Securities Exchange Act of 1934 that are not historical in nature and typically address future or anticipated events, trends, expectations or beliefs with respect to our financial condition, results of operations or business. Forward-looking statements often contain words such as “believes,” “expects,” “anticipates,” “foresees,” “forecasts,” “estimates,” “plans,” “intends,” “continues,” “may,” “will,” “should,” “projects,” “might,” “could” or other similar words or phrases. Similarly, statements that describe our business strategy, outlook, objectives, plans, intentions or goals also are forward-looking statements. We believe there is a reasonable basis for our forward-looking statements, but they are inherently subject to risks and uncertainties and actual results could differ materially from the expectations and beliefs reflected in the forward-looking statements. We presently consider the following to be among the important factors that could cause actual results to differ materially from our expectations and beliefs: (1) changes in the budgets or regulatory environments of our
customers,clients, primarily local and state governments, that could negatively impact information technology spending; (2) our ability to protect client information from security breaches and provide uninterrupted operations of data centers; (3)
our ability to achieve growth or operational synergies through the integration of acquired businesses, while avoiding unanticipated costs and disruptions to existing operations; (4) material portions of our business require the Internet infrastructure to be
further developed or adequately maintained;
(4)(5) our ability to achieve our financial forecasts due to various factors, including project delays by our
customers,clients, reductions in transaction size, fewer transactions, delays in delivery of new products or releases or a decline in our renewal rates for service agreements;
(5)(6) general economic, political and market
conditions, including the global economic and financial crisis, and the generaltightening of access to debt or equity capital; (6)conditions; (7) technological and market risks associated with the development of new products or services or of new versions of existing or acquired products or services; (7) our ability to successfully complete acquisitions and achieve growth or operational synergies through the integration of acquired businesses, while avoiding unanticipated costs and disruptions to existing operations; (8) competition in the industry in which we conduct business and the impact of competition on pricing, customerclient retention and pressure for new products or services; (9) the ability to attract and retain qualified personnel and dealing with the loss or retirement of key members of management or other key personnel; and (10) costs of compliance and any failure to comply with government and stock exchange regulations. A detailed discussion of these factors and other risks that affect our business are described in Item 1A, “Risk Factors.” We expressly disclaim any obligation to publicly update or revise our forward-looking statements.
We provide integrated information management solutions and services for the public sector, with a focus on local governments. We develop and market a broad line of software products and services to address the
information technology (“IT”)IT needs of cities, counties, schools and other local government entities. In addition, we provide professional IT services to our
customers,clients, including software and hardware installation, data conversion, training and for certain
customers,clients, product modifications, along with continuing maintenance and support for
customersclients using our systems. We also provide subscription-based services such as software as a service (“SaaS”), which utilizes the Tyler private cloud, and electronic document filing solutions (“e-filing”)
. In 2010 we began providing e-filing for courts and law offices,, which simplify the filing and management of court related documents. Revenues for e-filing are derived from transaction fees and in some cases fixed fee arrangements. We also provide property appraisal outsourcing services for taxing jurisdictions.
Our products generally automate
threesix major functional areas: (1) financial management and education, (2) courts and justice,
and (3)
public safety (4) property appraisal and tax,
(5) planning, regulatory and
wemaintenance, and (6) land and vital records management. We report our results in two segments. The Enterprise Software
Solutions (“
ESS”ES”) segment provides municipal and county governments and schools with software systems and services to meet their information technology and automation needs for mission-critical “back-office” functions such
asas: financial
management andmanagement; courts and justice
processes.processes; public safety; planning, regulatory and maintenance; and land and vital records management. The Appraisal and Tax
Software Solutions and Services (“
ATSS”A&T”) segment provides systems and software that automate the appraisal and assessment of real and personal property as well as property appraisal outsourcing services for local governments and taxing authorities. Property appraisal outsourcing services include: the physical inspection of commercial and residential properties; data collection and processing; computer analysis for property valuation; preparation of tax rolls; community education; and arbitration between taxpayers and the assessing jurisdiction.
Total organic revenues increased 12% in 2016 compared to 2015.
On November 16, 2015, we acquired all of the capital stock of New World Systems Corporation (“NWS”), which provides public safety and financial solutions for local governments. The purchase price, net of cash acquired of $22.5 million, was $337.5 million in cash, of which $4.0 million was accrued at December 31, 2015, and 2.1 million shares of Tyler common stock valued at $362.8 million.
On May 29, 2015, we acquired all of the capital stock of Brazos Technology Corporation (“Brazos”), which provides mobile hand held solutions primarily to law enforcement agencies for field accident reporting and electronically issuing citations. The purchase price, net of cash acquired and including debt assumed, was $6.1 million in cash and 12,500 shares of Tyler common stock valued at $1.5 million.
The operating results of NWS and Brazos are included with the operating results of the Enterprise Software segment since their respective dates of acquisition.
We monitor and analyze several key performance indicators in order to manage our business and evaluate our financial and operating performance. These indicators include the following:
Revenues – We derive our revenues from five primary sources: sale of software licenses and royalties; subscription-based arrangements; software services; maintenancemaintenance; and appraisal services. Subscriptions and maintenance are considered recurring revenue sources and comprised approximately 61%62% of our revenue in 2013.2016. The number of new SaaS customersclients and the number of existing customersclients who convert from our traditional software arrangements to our SaaS model are a significant driver to our business, together with new software license sales and maintenance rate increases. In addition, we also monitor our customer base and churn as we historically have experienced very low customer turnover. During 2013,2016, based on our customernumber of customers, turnover was approximately 2%.
Cost of Revenues and Gross Margins – Our primary cost component is personnel expenses in connection with providing software implementation, subscription-based services, maintenance and support, and appraisal services to our customers.clients. We can improve gross margins by controlling headcount and related costs and by expanding our revenue base, especially from those products and services that produce incremental revenue with minimal incremental cost, such as software licenses and royalties, subscription-based services, and maintenance and support. Our appraisal projects are cyclical in nature, and we often employ appraisal personnel on a short-term basis to coincide with the life of a project. As of December 31, 2013,2016, our total employee count increased to 2,5733,831 from 2,3883,586 at December 31, 2012.2015.
Selling, General and Administrative (“SG&A”) Expenses – The primary components of SG&A expenses are administrative and sales personnel salaries and commissions, share-based compensation expense, marketing expense, rent and professional fees. Sales commissions typically fluctuate with revenues and share-based compensation expense generally increases when the market price of our stock increases. Other administrative expenses tend to grow at a slower rate than revenues. In 2015, SG&A expenses include approximately $5.9 million for financial advisory, legal, accounting, due diligence, valuation and other various services necessary to complete the NWS acquisition.
Liquidity and Cash Flows – The primary driver of our cash flows is net income. Uses of cash include acquisitions, capital investments in property and equipment and discretionary purchases of treasury stock. During 2013, we invested $26.9 million in property and equipment. Our investment in property and equipment included $20.3 million in connection with the construction of an office building in Plano, Texas. Our working capital needs are fairly stable throughout the year with the significant components of cash outflows being payment of personnel expenses offset by cash inflows representing collection of accounts receivable and cash receipts from customersclients in advance of revenue being earned. In recent years, we have also received significant amounts of cash from employees exercising stock options and contributing to our Employee Stock Purchase Plan.
Balance Sheet – Cash, accounts receivable and days sales outstanding and deferred revenue balances are important indicators of our business.
Outlook
New Accounting Pronouncements Adopted in 2016
Improvements to Employee Share-Based Payment Accounting. In March 2016, the Financial Accounting Standards Board (“FASB”) issued Accounting Standards Update ("ASU") No. 2016-09, "Compensation-Stock Compensation (Topic 718): Improvements to Employee Share-Based Payment Accounting" which simplifies several aspects of the accounting for employee share-based payment transactions, including the accounting for income taxes, forfeitures, and statutory tax withholding requirements, as well as classification in the statement of cash flows. This standard is effective for our interim and annual reporting periods beginning December 15, 2016, and early adoption is permitted. We elected to early adopt this standard in fourth quarter of 2016. The impact of the early adoption was as follows:
The standard eliminates additional paid in capital ("APIC") pools and requires excess tax benefits and tax deficiencies to be recorded in the income statement as a discrete item when the awards vest or are settled. The adoption of this guidance on a prospective basis resulted in the recognition of excess tax benefits in our provision for income taxes.
The standard requires excess tax benefits to be recognized regardless of whether the benefit reduces taxes payable. The adoption of this guidance is applied on a modified retrospective basis; however, it did not have an impact on our retained earnings as of January 1, 2016, as we had previously recognized all our excess tax benefits.
As permitted, we have elected to continue to estimate forfeitures expected to occur to determine the amount of stock-based compensation cost to be recognized in each period. As such, the guidance relating to forfeitures did not have an impact on our retained earnings as of January 1, 2016.
The new guidance changes the calculation of common stock equivalents for earnings per share purposes.
As permitted, we elected to apply the statement of cash flows guidance that cash flows related to excess tax benefits be presented as an operating activity retrospectively.
Adoption of the new standard resulted in the recognition of excess tax benefits in our provision for income taxes rather than APIC of $29.6 million for the period ended December 31, 2016. As of December 31, 2016, the change in the calculation of common stock equivalents added approximately 519,000 weighted average shares for the diluted earnings per share calculations. The impact to our previously reported quarterly results for fiscal year 2016 is as follows:
|
| | | | | | | | | | | | | | | | | | | | | | | |
| | Three Months Ended | | Three Months Ended | | Three Months Ended |
| | March 31, 2016 | | June 30, 2016 | | September 30, 2016 |
| (In thousands, except per share amounts) | As Reported | | As Adjusted | | As Reported | | As Adjusted | | As Reported | | As Adjusted |
| | | | | | | | | | | | |
| Income statements: | | | | | | | | | | | |
| Income tax provision | $ | 10,495 |
| | $ | 9,350 |
| | $ | 11,323 |
| | $ | 5,188 |
| | $ | 14,155 |
| | $ | 989 |
|
| Net income | $ | 17,079 |
| | $ | 18,224 |
| | $ | 18,872 |
| | $ | 25,007 |
| | $ | 22,264 |
| | $ | 35,430 |
|
| Basic earnings per common share | $ | 0.47 |
| | $ | 0.50 |
| | $ | 0.52 |
| | $ | 0.69 |
| | $ | 0.61 |
| | $ | 0.97 |
|
| Diluted earnings per common share | $ | 0.44 |
| | $ | 0.47 |
| | $ | 0.49 |
| | $ | 0.65 |
| | $ | 0.58 |
| | $ | 0.91 |
|
| Diluted weighted average common shares outstanding | 38,557 |
| | 39,071 |
| | 38,196 |
| | 38,738 |
| | 38,506 |
| | 39,062 |
|
| | | | | | | | | | | | |
| Statement of cash flows: | | | | | | | | | | | |
| Net cash provided by operating activities | $ | 40,270 |
| | $ | 41,321 |
| | $ | 13,877 |
| | $ | 19,520 |
| | $ | 67,091 |
| | $ | 79,213 |
|
| Net cash (used) provided by financing activities | $ | (15,860 | ) | | $ | (16,911 | ) | | $ | 5,668 |
| | $ | 25 |
| | $ | (77,973 | ) | | $ | (90,095 | ) |
Presentation of Financial Statements - Going Concern. In August 2014, the FASB issued ASU No. 2014-15, Presentation of Financial Statements - Going Concern (Subtopic 205-40): Disclosure of Uncertainties about an Entity’s Ability to Continue as a Going Concern. The guidance requires an entity to evaluate whether there are conditions or events, in the aggregate, that raise substantial doubt about the entity’s ability to continue as a going concern within one year after the date that the financial statements are issued (or within one year after the financial statements are available to be issued when applicable) and to provide related footnote disclosures in certain circumstances. The guidance is effective for the annual period ending after December 15, 2016, and for annual and interim periods thereafter. We adopted this standard in the fourth quarter of 2016 and its adoption did not have an impact on our consolidated financial statements.
Recent Accounting Guidance not yet Adopted
Revenue from Contracts with Customers. On May 28, 2014, FASB issued ASU No. 2014-09, “Revenue from Contracts with Customers.” This ASU is the result of a convergence project between the FASB and the International Accounting Standards Board. The core principle behind ASU No. 2014-09 is that an entity should recognize revenue to depict the transfer of promised goods and services to customers in an amount that reflects the consideration to which the entity expects to be entitled in exchange for delivering those goods and services. This model involves a five-step process that includes identifying the contract with the customer, identifying the performance obligations in the contract, determining the transaction price, allocating the transaction price to the performance obligations in the contract and recognizing revenue when (or as) the entity satisfies the performance obligations. The ASU allows two methods of adoption: a full retrospective approach where three years of financial information are presented in accordance with the new standard, and a modified retrospective approach where the ASU is applied to the most current period presented in the financial statements. We currently anticipate adopting the standard using the full retrospective method to restate each prior reporting period presented. Our ability to adopt using the full retrospective method is dependent on system readiness, including software procured from third-party providers, and the completion of our analysis of information necessary to restate prior period financial statements.
The new standard requires application no later than annual reporting periods beginning after December 15, 2017, including interim reporting periods therein; however, public entities are permitted to elect to early adopt the new standard. We are assessing the financial impact of adopting the new standard and the methods of adoption; however, we are currently unable to provide a reasonable estimate regarding the financial impact. We will adopt the new standard in fiscal year 2018.
We anticipate this standard will have a material impact on our consolidated financial statements. While we are continuing to assess all potential impacts of the standard, we currently believe the most significant impact relates to our accounting for software license fees, installation fees, and incremental cost of obtaining a contract. Specifically, under the new standard we expect software license fees under perpetual agreements will no longer be subject to 100% discount allocations from other elements in the contract. Discounts in arrangements will be allocated across all deliverables increasing license revenues and decreasing revenues allocated to other performance obligations. In addition, in most cases, net license fees (total license fees less any allocated discounts) will be recognized at the point in time that control of the software license transfers to the customer versus our current policy of recognizing revenue only to the extent billable per the contractual terms. Time-based license fees currently recognized over the license term will no longer be recognized over the period of the license and will instead be recognized at the point in time that control of the software license transfers to the customer. Installation fees will no longer be considered distinct performance obligations and therefore will be recognized over the term of the arrangement or life of the performance obligation. We expect revenue related to our SaaS offerings and professional services to remain substantially unchanged. Due to the trendcomplexity of gradual improvementscertain contracts, the actual revenue recognition treatment required under the standard will be dependent on contract-specific terms and may vary in some instances from recognition at the time of billing. Application of the new standard requires that incremental costs directly related to obtaining a contract (typically sales commissions plus any associated fringe benefits) must be recognized as an asset and expensed over the expected life of the arrangement, unless that life is less than one year. Currently, we defer sales commissions and recognize expense over the relevant initial contractual term. With the adoption the new standard, we expect amortization periods to extend past the initial term.
Leases. On February 25, 2016, the FASB issued its new lease accounting guidance in ASU No. 2016-02, “Leases (Topic 842).” Under the new guidance, lessees will be required to recognize the following for all leases (with the exception of short-term leases) at the commencement date:
A lease liability, which is a lessee‘s obligation to make lease payments arising from a lease, measured on a discounted basis; and
A right-of-use asset, which is an asset that represents the lessee’s right to use, or control the use of, a specified asset for the lease term.
Lessees (for capital and operating leases) and lessors (for sales-type, direct financing, and operating leases) must apply a modified retrospective transition approach for leases existing at, or entered into after, the beginning of the earliest comparative period presented in the marketplacefinancial statements. The modified retrospective approach would not require any transition accounting for leases that expired before the earliest comparative period presented. Lessees and lessors may not apply a full retrospective transition approach.
The ASU is effective for fiscal years beginning after December 15, 2018, including interim periods therein. Early application is permitted for all business entities upon issuance. We are assessing the financial impact of adopting the new standard; however, we are currently unable to provide a reasonable estimate regarding the financial impact. We expect to adopt the new standard in fiscal year 2019.
Outlook
Activity in the local government software market continues to be robust, and our backlog at December 31, 2016 reached $953.3 million, a 13% increase from last year. We expect to continue
to achieve solid growth in
2014. We have maderevenue and earnings. With our strong financial position and cash flow, we plan to continue to make significant investments in
product development to better position us to continue to expand our
business that we believe will enhance ourcompetitive position in the public sector software market
leadership and improve long-term revenue and margin growth.over the long term.
CRITICAL ACCOUNTING POLICIES AND ESTIMATES
Our discussion and analysis of financial condition and results of operations is based upon our financial statements, which have been prepared in accordance with accounting principles generally accepted in the United States (“GAAP”). The preparation of these financial statements requires us to make estimates and judgments that affect the reported amounts of assets and liabilities at the date of the financial statements, the reported amounts of revenues, cost of revenues and expenses during the reporting period, and related disclosure of contingencies. The Notes to the Financial Statements included as part of this Annual Report describe our significant accounting policies used in the preparation of the financial statements. Significant items subject to such estimates and assumptions include the application of the percentage-of-completion and proportional performance methods of revenue recognition, the carrying amount and estimated useful lives of intangible assets, determination of share-based compensation expense and valuation allowance for receivables. We base our estimates on historical experience and on various other assumptions that we believe to be reasonable under the circumstances, the results of which form the basis for making judgments about the carrying values of assets and liabilities that are not readily apparent from other sources. Actual results may differ from these estimates under different assumptions or conditions.
We believe the following critical accounting policies require significant judgments and estimates used in the preparation of our financial statements.
Revenue Recognition. We recognize revenues in accordance with the provisions of Accounting Standards Codification (“ASC”) 605, Revenue Recognition and ASC 985-605, Software Revenue Recognition. Our revenues are derived from sales of software licenses and royalties, subscription-based services, appraisal services, maintenance and support, and services that typically range frominstallation, training and basic consulting to software modification and customization to meet specific customer needs. For multiple element software arrangements, which do not entail the performance of services that are considered essential to the functionality of the software, we generally record revenue when the delivered products or performed services result in a legally enforceable and non-refundable claim. We maintain allowances for doubtful accounts and sales adjustments, which are provided at the time the revenue is recognized. Because most of our customers are governmental entities, we rarely incur a loss resulting from the inability of a customer to make required payments. In a limited number of cases, we encounter a customer who is dissatisfied with some aspect of the software product or our service, and we may offer a “concession” to such customer. In those limited situations where we grant a concession, we rarely reduce the contract arrangement fee, but alternatively may perform additional services, such as additional training or creating additional custom reports. These amounts have historically been nominal. In connection with our customer contracts and the adequacy of related allowances and measures of progress towards contract completion, our project managers are charged with the responsibility to continually review the status of each customer on a specific contract basis. Also, we review, on at least a quarterly basis, significant past due accounts receivable and the adequacy of related reserves. Events or changes in circumstances that indicate that the carrying amount for the allowances for doubtful accounts and sales adjustments may require revision, include, but are not limited to, deterioration of a customer’s financial condition, failure to manage our customer’s expectations regarding the scope of the services to be delivered, and defects or errors in new versions or enhancements of our software products.
We use contract accounting, primarily the percentage-of-completion method, as discussed in ASC 605-35, Construction – Type and Certain Production – Type Contracts, for those software arrangements that involve significant production, modification or customization of the software, or where our software services are otherwise considered essential to the functionality of the software. We measure progress-to-completion primarily using labor hours incurred, or value added. In addition, we recognize revenue using the proportional performance method
of revenue recognition for our property appraisal projects, some of which can range up to five years. These methods rely on estimates of total expected contract revenue, billings and collections and expected contract costs, as well as measures of progress toward completion. We believe reasonably dependable estimates of revenue and costs and progress applicable to various stages of a contract can be made. At times, we perform additional and/or non-contractual services for little to no incremental fee to satisfy customer expectations. If changes occur in delivery, productivity or other factors used in developing our estimates of expected costs or revenues, we revise our cost and revenue estimates, and any revisions are charged to income in the period in which the facts that give rise to that revision first become known. In connection with these and certain other contracts, we may perform the work prior to when the services are billable and/or payable pursuant to the contract. The termination clauses in most of our contracts provide for the payment for the value of products delivered and services performed in the event of an early termination.
For SaaS arrangements, we evaluate whether the customer has the contractual right to take possession of our software at any time during the hosting period without significant penalty and whether the customer can feasibly maintain the software on the customer’s hardware or enter into another arrangement with a
third partythird-party to host the software. If we determine that the customer has the contractual right to take possession of our software at any time during the hosting period without significant penalty and can feasibly maintain the software on the customer’s hardware or enter into another arrangement with a
third partythird-party to host the software, we recognize the license, professional services and hosting services revenues pursuant to ASC 985-605, Software Revenue Recognition. For SaaS arrangements that do not meet the criteria for recognition under ASC 985-605, we account for the elements under ASC 605-25, Multiple Element Arrangements using all applicable facts and circumstances, including whether (i) the element has stand-alone value, (ii) there is a general right of return and (iii) the revenue is contingent on delivery of other elements. We allocate the contract value to each element of the arrangement that qualifies for treatment as a separate element based on vendor-specific objective evidence of fair value (“VSOE”), and if VSOE is not available,
third partythird-party evidence, and if
third partythird-party evidence is unavailable, estimated selling price. For professional services associated with SaaS arrangements that we determine do not have stand-alone value to the customer or are contingent on delivery of other elements, we recognize the services revenue ratably over the remaining contractual period once hosting has gone live and we may begin billing for the hosting services. We record amounts that have been invoiced in accounts receivable and in deferred revenue or revenues, depending on whether the revenue recognition criteria have been met.
In connection with certain of our contracts, we have recorded retentions receivable or unbilled receivables consisting of costs and estimated profit in excess of billings as of the balance sheet date. Many of the contracts which give rise to unbilled receivables at a given balance sheet date are subject to billings in the subsequent accounting period. We review unbilled receivables and related contract provisions to ensure we are justified in recognizing revenue prior to billing the customer and that we have objective evidence which allows us to recognize such revenue. In addition, we have a sizable amount of deferred revenue, which represents billings in excess of revenue earned. The majority of this liability consists of maintenance billings for which payments are made in advance and the revenue is ratably earned over the maintenance period, generally one year. We also have deferred revenue for those contracts in which we receive a deposit and the conditions in which to record revenue for the service or product
hashave not been met. On a periodic basis, we review by customer the detail components of our deferred revenue to ensure our accounting remains appropriate.
Intangible Assets and Goodwill. Our business acquisitions typically result in the creation of goodwill and other intangible asset balances, and these balances affect the amount and timing of future period amortization expense, as well as expense we could possibly incur as a result of an impairment charge. The cost of acquired companies is allocated to identifiable tangible and intangible assets based on estimated fair value, with the excess allocated to goodwill. Accordingly, we have a significant balance of acquisition date intangible assets, including software, customer related intangibles, trade name, leases and goodwill. These intangible assets (other than goodwill) are amortized over their estimated useful lives. We currently have no intangible assets with indefinite lives other than goodwill. When testing goodwill for impairment quantitatively, we first compare the fair value of each reporting unit with its carrying amount. If the carrying amount of a reporting unit exceeds its fair value, a second step is performed to measure the amount of potential impairment. In the second step, we compare the implied fair value of reporting unit goodwill with the carrying amount of the reporting unit’s goodwill. If the carrying amount of reporting unit goodwill exceeds the implied fair value of that goodwill, an impairment loss is recognized. The fair values calculated in our impairment tests are determined using discounted cash flow models involving several assumptions. The assumptions that are used are based upon what we believe a hypothetical marketplace participant would use in estimating fair value. We base our fair value estimates on assumptions we believe to be reasonable but that are unpredictable and inherently uncertain. We evaluate the reasonableness of the fair value calculations of our reporting units by comparing the total of the fair value of all of our reporting units to our total market capitalization.
Our annual goodwill impairment analysis, which we performed quantitatively during the second quarter of
2013,2016, did not result in an impairment charge. During
2013,2016, we did not identify any triggering events
whichthat would require an update to our annual impairment review.
All intangible assets (other than goodwill) are reviewed for impairment whenever events or changes in circumstances indicate that the carrying amount of an asset may not be recoverable. Recoverability of other intangible assets is measured by comparison of the carrying amount to estimated undiscounted future cash flows. The assessment of recoverability or of the estimated useful life for amortization purposes will be affected if the timing or the amount of estimated future operating cash flows is not achieved. Such indicators may include, among others: a significant decline in expected future cash flows; a sustained, significant decline in stock price and market capitalization; a significant adverse change in legal factors or in the business climate; unanticipated competition; and reductions in growth rates. In addition, products, capabilities, or technologies developed by others may render our software products obsolete or non-competitive. Any adverse change in these factors could have a significant impact on the recoverability of goodwill or other intangible assets.
Share-Based Compensation.We have a stock option plan that provides for the grant of stock options to key employees, directors and non-employee consultants. We estimate the fair value of share-based awards on the date of grant using the Black-Scholes option
valuation model. Share-based compensation expense includes the estimated effects of forfeitures, which will be adjusted over the requisite service period to the extent actual forfeitures differ, or are expected to differ from such estimates. Changes in estimated forfeitures are recognized in the period of change and will also impact the amount of expense to be recognized in future periods. Forfeiture rate assumptions are derived from historical data. Our policy to estimate the impact of the forfeitures remains in accordance with the newly adopted accounting standard ASU No. 2016-09.
We estimate stock price volatility at the date of grant based on the historical volatility of our common stock. Estimated option life is determined using the weighted-average period the stock options are expected to be outstanding based primarily on the options’ vesting terms, remaining contractual life and the employees’ expected exercise based on historical patterns. Determining the appropriate fair-value model and calculating the fair value of share-based awards at the grant date requires considerable judgment, including estimating stock price volatility, expected option life and forfeiture rates.
ANALYSIS OF RESULTS OF OPERATIONS AND OTHER
The following discussion compares the historical results of operations on a basis consistent with GAAP for the years ended December 31,
2013, 20122016, 2015 and
2011. | | | | | | | | | | | | |
| | | Percentage of Total Revenue
Years ended December 31, | |
| | | 2013 | | | 2012 | | | 2011 | |
Revenue: | | | | | | | | | | | | |
Software licenses and royalties | | | 9.8 | % | | | 9.3 | % | | | 10.5 | % |
Subscriptions | | | 14.8 | | | | 12.3 | | | | 10.1 | |
Software services | | | 22.4 | | | | 23.0 | | | | 22.5 | |
Maintenance | | | 46.0 | | | | 47.3 | | | | 47.4 | |
Appraisal services | | | 5.0 | | | | 6.2 | | | | 7.5 | |
Hardware and other | | | 2.0 | | | | 1.9 | | | | 2.0 | |
| | | | | | | | | | | | |
Total revenue | | | 100.0 | | | | 100.0 | | | | 100.0 | |
Operating Expenses: | | | | | | | | | | | | |
Cost of software licenses, royalties and acquired software | | | 1.1 | | | | 1.1 | | | | 1.3 | |
Cost of software services, maintenance and subscriptions | | | 47.9 | | | | 47.2 | | | | 46.5 | |
Cost of appraisal services | | | 3.3 | | | | 4.1 | | | | 4.7 | |
Cost of hardware and other | | | 1.3 | | | | 1.4 | | | | 1.6 | |
Selling, general and administrative expenses | | | 23.6 | | | | 23.9 | | | | 24.5 | |
Research and development expense | | | 5.6 | | | | 5.5 | | | | 5.3 | |
Amortization of customer base and trade name intangibles | | | 1.1 | | | | 1.2 | | | | 1.1 | |
| | | | | | | | | | | | |
Operating income | | | 16.1 | | | | 15.6 | | | | 15.0 | |
Other expense | | | 0.3 | | | | 0.8 | | | | 0.7 | |
| | | | | | | | | | | | |
Income before income taxes | | | 15.8 | | | | 14.8 | | | | 14.3 | |
Income tax provision | | | 6.4 | | | | 5.7 | | | | 5.4 | |
| | | | | | | | | | | | |
Net income | | | 9.4 | % | | | 9.1 | % | | | 8.9 | % |
| | | | | | | | | | | | |
20132014.
|
| | | | | | | | |
| | Percentage of Total Revenues Years Ended December 31, |
| | 2016 | | 2015 | | 2014 |
| Revenues: | | | | | |
| Software licenses and royalties | 9.8 | % | | 10.0 | % | | 10.0 | % |
| Subscriptions | 18.9 |
| | 18.9 |
| | 17.8 |
|
| Software services | 23.1 |
| | 23.7 |
| | 23.1 |
|
| Maintenance | 42.7 |
| | 41.6 |
| | 43.1 |
|
| Appraisal services | 3.5 |
| | 4.2 |
| | 4.4 |
|
| Hardware and other | 2.0 |
| | 1.6 |
| | 1.6 |
|
| Total revenues | 100.0 |
| | 100.0 |
| | 100.0 |
|
| Operating Expenses: | |
| | |
| | |
Cost of software licenses, royalties and acquired software | 3.3 |
| | 1.0 |
| | 0.8 |
|
Cost of software services, maintenance and subscriptions | 46.2 |
| | 48.2 |
| | 47.9 |
|
| Cost of appraisal services | 2.2 |
| | 2.7 |
| | 2.9 |
|
| Cost of hardware and other | 1.3 |
| | 1.1 |
| | 1.1 |
|
| Selling, general and administrative expenses | 22.1 |
| | 22.6 |
| | 22.0 |
|
| Research and development expense | 5.7 |
| | 5.1 |
| | 5.2 |
|
Amortization of customer and trade name intangibles | 1.8 |
| | 1.0 |
| | 0.9 |
|
| Operating income | 17.4 |
| | 18.3 |
| | 19.2 |
|
| Other (expense) income, net | (0.3 | ) | | 0.1 |
| | (0.1 | ) |
| Income before income taxes | 17.1 |
| | 18.4 |
| | 19.1 |
|
| Income tax provision | 2.6 |
| | 7.4 |
| | 7.2 |
|
| Net income | 14.5 | % | | 11.0 | % | | 11.9 | % |
2016 Compared to
20122015
On November 16, 2015, we acquired NWS, which provides public safety and financial solutions for local governments. In May 2015, we acquired a company which provides mobile hand-held solutions primarily to law enforcement agencies for field accident reporting and electronically issuing citations. The results of their operations are included in our ES segment from their respective dates of acquisition. For comparative purposes, we have provided explanations for changes in operations to exclude results of operations for these acquisitions noting the exclusion.
Software licenses and royalties.
The following table sets forth a comparison of our software licenses and royalties
revenuesrevenue for the years ended December 31:
| | | | | | | | | | | | | | | | |
| | | | | | | | | Change | |
($ in thousands) | | 2013 | | | 2012 | | | $ | | | % | |
ESS | | $ | 38,774 | | | $ | 32,060 | | | $ | 6,714 | | | | 21 | % |
ATSS | | | 2,067 | | | | 1,868 | | | | 199 | | | | 11 | |
| | | | | | | | | | | | | | | | |
Total software licenses and royalties revenue | | $ | 40,841 | | | $ | 33,928 | | | $ | 6,913 | | | | 20 | % |
| | | | | | | | | | | | | | | | |
Since March 2012, we have acquired two companies which provide financial and human capital management software solutions to
|
| | | | | | | | | | | | | | | |
| | | | | Change |
| ($ in thousands) | | 2016 | | 2015 | | $ | | % |
| ES | | $ | 68,844 |
| | $ | 54,376 |
| | $ | 14,468 |
| | 27 | % |
| A&T | | 5,462 |
| | 4,632 |
| | 830 |
| | 18 |
|
| Total software licenses and royalties revenue | | $ | 74,306 |
| | $ | 59,008 |
| | $ | 15,298 |
| | 26 | % |
Excluding the K-12 education market and one company that provides enterprise permitting, land management, licensing and regulatory software solutions to governmental agencies. The results of these acquisitions, are included in our ESS segment from the dates of their acquisitions. Excluding the impact of acquisitions, total software licenses and royaltieslicense revenue increased 12% compared to 2012. Approximately half of the growth was due to an increase of $2.3 million in royalties on sales of Microsoft Dynamics AX by other Microsoft partners3% compared to the prior year. We record royalty revenue whenThe majority of this growth was due to a more active marketplace as the fees are fixed or determinable, which is known when we receive noticeresult of the amounts earned pursuant to our royalty arrangements which are generally 30 to 60 days after each quarterly reporting period. Royalty revenue is dependent upon sales volume from Microsoft partners,improvement in local government economic conditions, as well as the timing of maintenance renewals, and can vary substantially from periodour increasingly strong competitive position, which we attribute in part to period. Excluding the impact of acquisitions, software licenses grew 5% mainly due to increased investmentsour investment in product development overin recent years. This increase was offset somewhat by lower sales to our existing customer base for courts and justice related add-on solutions that assist and support the past few years. However,transition to a paperless environment. By the end of 2015, the majority of our courts and justice clients had implemented these add-on solutions.
Although the mix of new contracts between subscription-based and perpetual license arrangements may vary from quarter to quarter and year to year, we expect our longer-term software license growth
was reduced somewhat because ofrate to be negatively impacted by a growing number of customers choosing our subscription-based options, rather than purchasing the software under a traditional perpetual software license arrangement. Subscription-based arrangements result in
nolower software license
revenuesrevenue in the initial year as compared to
traditional perpetual software license arrangements but generate higher overall
subscription-based services revenue over the term of the contract.
We had 100Our new
customers thatclient mix in 2016 was approximately 68% selecting perpetual software license arrangements and approximately 32% selecting subscription-based arrangements compared to a client mix in 2015 of approximately 76% selecting perpetual software license arrangements and approximately 24% selecting subscription-based arrangements. 250 new clients entered into subscription-based
software arrangements in
20132016 compared to
76134 new
customersclients in
2012.2015.
The following table sets forth a comparison of our
subscription revenuessubscriptions revenue for the years ended December 31:
| | | | | | | | | | | | | | | | |
| | | | | | | | | Change | |
($ in thousands) | | 2013 | | | 2012 | | | $ | | | % | |
ESS | | $ | 59,070 | | | $ | 43,319 | | | $ | 15,751 | | | | 36 | % |
ATSS | | | 2,794 | | | | 1,299 | | | | 1,495 | | | | 115 | |
| | | | | | | | | | | | | | | | |
Total subscriptions revenue | | $ | 61,864 | | | $ | 44,618 | | | $ | 17,246 | | | | 39 | % |
| | | | | | | | | | | | | | | | |
|
| | | | | | | | | | | | | | | |
| | | | | Change |
| ($ in thousands) | | 2016 | | 2015 | | $ | | % |
| ES | | $ | 135,516 |
| | $ | 107,090 |
| | $ | 28,426 |
| | 27 | % |
| A&T | | 7,188 |
| | 4,843 |
| | 2,345 |
| | 48 |
|
| Total subscriptions revenue | | $ | 142,704 |
| | $ | 111,933 |
| | $ | 30,771 |
| | 27 | % |
Subscription-based services revenue primarily consists of
revenuesrevenue derived from our SaaS arrangements, which utilize the Tyler private cloud. As part of our subscription-based services, we also provide
e-filingelectronic document filing solutions (“e-filing”) that simplify the filing and management of court related documents for courts and law offices.
Revenues for e-filing areE-filing revenue is derived from transaction fees
or in some casesand fixed fee arrangements.
The contract term for SaaS arrangements range from one to 10 years but are typically for a period of three to six years.Excluding the impact of acquisitions, subscription-based services revenue increased 37%24% compared to 2012.2015. E-filing services contributed approximately $4.9 million of the subscriptions revenue increase in 2016. Most of the e-filing revenue increase related to several statewide contracts, several of which implemented mandatory electronic filing during 2015 and throughout 2016. New SaaS customersclients as well as existing customersclients who converted to our SaaS model provided the majorityremainder of the subscription-basedsubscriptions revenue increase. In 2013,2016, we
added
100250 new
customersSaaS clients and
6353 existing
customersclients elected to convert to our SaaS model.
E-filing services also contributed approximately $5.0 million of the subscription revenue increase. E-filing revenue included $3.8 million relatedThe average contract sizes in 2016 were 1% and 9% higher than 2015 for new clients and clients converting to
a new contract with the Texas Office of Court Administration for our
Odyssey File and Serve e-filing system for Texas courts (“e-File Texas.gov”), which was implemented in September 2013. This contract is a fixed fee arrangement and we expect it will provide a long-term recurring revenue stream of $17 million to $19 million annually when e-filing becomes mandatory in Texas in 2014. The remaining e-filing revenue increase is mainly the result of existing clients expanding mandatory e-filing for court documents.SaaS model, respectively.
Software
services.services.
The following table sets forth a comparison of our software services
revenuesrevenue for the years ended December 31:
| | | | | | | | | | | | | | | | |
| | | | | | | | | Change | |
($ in thousands) | | 2013 | | | 2012 | | | $ | | | % | |
ESS | | $ | 85,459 | | | $ | 76,103 | | | $ | 9,356 | | | | 12 | % |
ATSS | | | 7,808 | | | | 7,305 | | | | 503 | | | | 7 | |
| | | | | | | | | | | | | | | | |
Total software services revenue | | $ | 93,267 | | | $ | 83,408 | | | $ | 9,859 | | | | 12 | % |
| | | | | | | | | | | | | | | | |
|
| | | | | | | | | | | | | | | |
| | | | | Change |
| ($ in thousands) | | 2016 | | 2015 | | $ | | % |
| ES | | $ | 158,478 |
| | $ | 129,068 |
| | $ | 29,410 |
| | 23 | % |
| A&T | | 16,326 |
| | 10,784 |
| | 5,542 |
| | 51 |
|
| Total software services revenue | | $ | 174,804 |
| | $ | 139,852 |
| | $ | 34,952 |
| | 25 | % |
Software services
revenuesrevenue primarily
consistconsists of professional services billed in connection with
the installation ofimplementing our software,
conversion of customerconverting client data, training
customerclient personnel,
custom development activities and consulting. New
customersclients who purchase our proprietary software licenses generally also contract with us to provide for the related software services. Existing
customersclients also periodically purchase additional training, consulting and minor programming services. Excluding the
impactresults of acquisitions, software services
increased 7%revenue grew 11% compared to
2012. The increasethe prior year period. This growth is partly due to
growth in software license activityadditions to our implementation and
duesupport staff, which increased our capacity to
deliver backlog, and a contract
arrangementsmix that included more
programmingcustom development and other services.
Maintenance.
Maintenance.
The following table sets forth a comparison of our maintenance
revenuesrevenue for the years ended December 31:
| | | | | | | | | | | | | | | | |
| | | | | | | | | Change | |
($ in thousands) | | 2013 | | | 2012 | | | $ | | | % | |
ESS | | $ | 175,180 | | | $ | 155,290 | | | $ | 19,890 | | | | 13 | % |
ATSS | | | 16,540 | | | | 16,561 | | | | (21 | ) | | | — | |
| | | | | | | | | | | | | | | | |
Total maintenance revenue | | $ | 191,720 | | | $ | 171,851 | | | $ | 19,869 | | | | 12 | % |
| | | | | | | | | | | | | | | | |
|
| | | | | | | | | | | | | | | |
| | | | | Change |
| ($ in thousands) | | 2016 | | 2015 | | $ | | % |
| ES | | $ | 304,380 |
| | $ | 227,586 |
| | $ | 76,794 |
| | 34 | % |
| A&T | | 18,589 |
| | 17,951 |
| | 638 |
| | 4 |
|
| Total maintenance revenue | | $ | 322,969 |
| | $ | 245,537 |
| | $ | 77,432 |
| | 32 | % |
We provide maintenance and support services for our software products and certain
third partythird-party software. Excluding the
impactresults of acquisitions, maintenance revenue grew 9%
from 2012. This increase wascompared to the prior year. Maintenance and support revenue increased mainly due to growth in our installed customer base from new software license sales
andas well as annual maintenance rate increases.
Appraisal
services.services.
The following table sets forth a comparison of our appraisal services
revenuesrevenue for the years ended December 31:
| | | | | | | | | | | | | | | | |
| | | | | | | | | Change | |
($ in thousands) | | 2013 | | | 2012 | | | $ | | | % | |
ESS | | $ | — | | | $ | — | | | $ | — | | | | — | % |
ATSS | | | 20,825 | | | | 22,543 | | | | (1,718 | ) | | | (8 | ) |
| | | | | | | | | | | | | | | | |
Total appraisal services revenue | | $ | 20,825 | | | $ | 22,543 | | | $ | (1,718 | ) | | | (8 | )% |
| | | | | | | | | | | | | | | | |
Appraisal services revenue declined 8% in 2013 compared to 2012.
|
| | | | | | | | | | | | | | | |
| | | | | Change |
| ($ in thousands) | | 2016 | | 2015 | | $ | | % |
| ES | | $ | — |
| | $ | — |
| | $ | — |
| | — | % |
| A&T | | 26,287 |
| | 25,065 |
| | 1,222 |
| | 5 |
|
| Total appraisal services revenue | | $ | 26,287 |
| | $ | 25,065 |
| | $ | 1,222 |
| | 5 | % |
The appraisal services business is somewhat cyclical and driven in part by statutory revaluation cycles in various states.
The decline is mainlyIn 2016, appraisal services revenue increased 5% compared to prior year primarily due to the
completionFranklin County, Ohio, revaluation project, which began late in
mid-2012the fourth quarter of
a large contract in Pennsylvania. We expect appraisal revenues for 2014 will increase slightly compared to 2013.2015.
Cost of Revenues and Gross Margins
The following table sets forth a comparison of the key components of our cost of revenues for the years ended December 31:
| | | | | | | | | | | | | | | | |
| | | | | | | | | Change | |
($ in thousands) | | 2013 | | | 2012 | | | $ | | | % | |
Software licenses and royalties | | $ | 2,377 | | | $ | 1,983 | | | $ | 394 | | | | 20 | % |
Acquired software | | | 2,078 | | | | 1,888 | | | | 190 | | | | 10 | |
Software services, maintenance and subscriptions | | | 199,617 | | | | 171,584 | | | | 28,033 | | | | 16 | |
Appraisal services | | | 13,809 | | | | 14,889 | | | | (1,080 | ) | | | (7 | ) |
Hardware and other | | | 5,559 | | | | 5,258 | | | | 301 | | | | 6 | |
| | | | | | | | | | | | | | | | |
Total cost of revenues | | $ | 223,440 | | | $ | 195,602 | | | $ | 27,838 | | | | 14 | % |
| | | | | | | | | | | | | | | | |
|
| | | | | | | | | | | | | | | |
| | | | | Change |
| ($ in thousands) | | 2016 | | 2015 | | $ | | % |
| Software licenses and royalties | | $ | 2,964 |
| | $ | 1,632 |
| | $ | 1,332 |
| | 82 | % |
| Acquired software | | 22,235 |
| | 4,440 |
| | 17,795 |
| | N/M |
|
| Software services, maintenance and subscriptions | | 348,939 |
| | 285,340 |
| | 63,599 |
| | 22 |
|
| Appraisal services | | 16,411 |
| | 15,922 |
| | 489 |
| | 3 |
|
| Hardware and other | | 10,143 |
| | 6,501 |
| | 3,642 |
| | 56 |
|
| Total cost of revenues | | $ | 400,692 |
| | $ | 313,835 |
| | $ | 86,857 |
| | 28 | % |
The following table sets forth a comparison of gross margin percentage by revenue type for the years ended December 31:
| | | | | | | | | | | | |
Gross margin percentage | | 2013 | | | 2012 | | | Change | |
Software licenses, royalties and acquired software | | | 89.1 | % | | | 88.6 | % | | | 0.5 | % |
Software services, maintenance and subscriptions | | | 42.4 | | | | 42.8 | | | | (0.4 | ) |
Appraisal services | | | 33.7 | | | | 34.0 | | | | (0.3 | ) |
Hardware and other | | | 31.6 | | | | 24.4 | | | | 7.2 | |
Overall gross margin | | | 46.4 | % | | | 46.2 | % | | | 0.2 | % |
|
| | | | | | | | | |
| Gross margin percentage | | 2016 | | 2015 | | Change |
| Software licenses, royalties and acquired software | | 66.1 | % | | 89.7 | % | | (23.6 | )% |
| Software services, maintenance and subscriptions | | 45.5 |
| | 42.6 |
| | 2.9 |
|
| Appraisal services | | 37.6 |
| | 36.5 |
| | 1.1 |
|
| Hardware and other | | 32.3 |
| | 32.5 |
| | (0.2 | ) |
| Overall gross margin | | 47.0 | % | | 46.9 | % | | 0.1 | % |
Software licenses, royalties and acquired software. Costs of software licenses, royalties and acquired software are primarily comprised of third party software costs and amortization expense for acquired software acquired through acquisitions.and third-party software costs. We do not have any direct costs associated with royalties. In 2013,2016, our software licenses, royalties and acquired software gross margin percentage increaseddeclined compared to 2012 mainlythe prior year due to much higher revenuesamortization expense for acquired software resulting from royalties. The margin also benefited from a product mix that included slightly more proprietaryour acquisition of NWS. Excluding the results of NWS, our software revenues, which have a higherlicense, royalties and acquired software gross margin than third party software.was 93.9% in 2016 compared to 93.6% in 2015.
Software services, maintenance and subscription-based servicessubscriptions. Cost of software services, maintenance and subscription-based servicessubscriptions primarily consists of personnel costs related to installation of our software, conversion of customerclient data, training customerclient personnel and support activities and various other services such as custom client development and on-going operation of SaaS arrangements and e-filing. Maintenancee-filing arrangements. In 2016, the software services, maintenance and subscriptions gross margin increased 2.9% compared to the prior year. Our implementation and support staff has grown by 169 employees since December 31, 2015. To support sales growth, we began making significant investments in our implementation and support staff in early 2015. Since December 31, 2014, excluding acquisitions, we have added 369 implementation and support employees. These additions contributed to the revenue growth in 2016. In addition, the NWS revenue mix includes a lower proportion of software services compared to Tyler’s historical revenue mix, which also benefited the gross margin. Costs related to maintenance and various other services such as SaaS costsand e-filing typically grow at a slower rate than related revenuesrevenue due to leverage in the utilization of our support and maintenance staff and economies of scale. However, we accelerated hiring in 2013 to ensure that we were well-positioned to deliver our current backlog and anticipated new business. In late 2012, we signed a contract with the Texas Office of Court Administration for e-FileTexas.gov to manage e-filing of court documents. In early 2013 the state of Texas issued an order mandating e-filing in civil cases beginning in January 2014. Mandatory e-filing will be phased in over a two and a half year period, beginning with the largest counties in January 2014. We will be paid on a fixed fee basis but had very limited revenues in 2013 from e-FileTexas.gov. However, during 2013, we incurred expenses of approximately $3.3 million in connection with implementing the system in courts across the state. Excluding the limited revenues and cost incurred in connection with implementing e-FileTexas.gov in 2013, our software services, maintenanceMaintenance and subscription servicesprice increases also resulted in slightly higher gross margin would have been approximately 42.8%. Our implementation and support staff has increased by 202 employees since 2012. Most of these additions occurred mid-to late 2013.margins.
Appraisal services. Appraisal services revenues arerevenue comprised approximately 5%3.5% of total revenues.revenue. The appraisal services gross margin declined slightlyincreased 1.1% compared to 2012.2015. A high proportion of the costs of appraisal services revenue are variable, as we often hire temporary employees to assist in appraisal projects, whose term of employment generally ends with the projects’ completion. Our
2016 blended gross margin
remained consistent compared to 2015. Our overall gross margin was positively impacted by improved utilization of our support and maintenance staff; however, this benefit was offset by amortization expense for
2013 increased 0.2% from 2012. The increase was due to higher royalty revenue and also benefited from a product mix that included slightly higher proprietaryacquired software
revenues than third party software. Costs incurred related to
our implementation of e-FileTexas.gov with minimal related revenues as well as increased hiring of implementation and support staff in order to expand our capacity to implement our contract backlog offset some of the
positive impact of higher royalty and proprietary software revenue.NWS acquisition.
Selling, General and Administrative Expenses
Selling, general and administrative (“SG&A”) expenses consist primarily of salaries, employee benefits, travel, share-based compensation expense, commissions and related overhead costs for administrative and sales and marketing employees, as well as, professional fees, trade show activities, advertising costs and other marketing related costs. The following table sets forth a comparison of our SG&A expenses for the following years ended December 31:
| | | | | | | | | | | | | | | | |
| | | | | | | | | Change | |
($ in thousands) | | 2013 | | | 2012 | | | $ | | | % | |
Selling, general and administrative expenses | | $ | 98,289 | | | $ | 86,706 | | | $ | 11,583 | | | | 13 | % |
|
| | | | | | | | | | | | | | | |
| | | | | Change |
| ($ in thousands) | | 2016 | | 2015 | | $ | | % |
| Selling, general and administrative expenses | | $ | 167,161 |
| | $ | 133,317 |
| | $ | 33,844 |
| | 25 | % |
SG&A as a percentage of
revenuesrevenue was
23.6%22.1% in
20132016 compared to
23.9%22.6% in
2012.2015. In 2015, our SG&A expense included approximately $5.9 million for financial advisory, legal, accounting, due diligence, valuation and other various expenses necessary to complete the NWS acquisition. Excluding
NWS transaction costs
and SG&A from acquisitions,
almost half of the SG&A expense
increase isincreased approximately 12% mainly due to
compensation costs related to increased
staff levels, higher stock compensation expense
resulting from the substantial increaseand increased commission expense as a result of higher sales. We have added 22 employees mainly to our sales and finance teams since December 31, 2015. In addition, our 2016 stock compensation expense rose $6.4 million, mainly due to increases in our stock price over the last
twelve months and higher payroll taxes associated with increased stock option exercise activity. Commission expense has also increased compared to the prior year periods due to higher sales.few years.
Research and Development Expense
Research and development expense consists primarily of salaries, employee benefits and related overhead costs associated with product development. The following table sets forth a comparison of our research and development expense for the years ended December 31:
| | | | | | | | | | | | | | | | |
| | | | | | | | | Change | |
($ in thousands) | | 2013 | | | 2012 | | | $ | | | % | |
Research and development expense | | $ | 23,269 | | | $ | 20,140 | | | $ | 3,129 | | | | 16 | % |
|
| | | | | | | | | | | | | | | |
| | | | | Change |
| ($ in thousands) | | 2016 | | 2015 | | $ | | % |
| Research and development expense | | $ | 43,154 |
| | $ | 29,922 |
| | $ | 13,232 |
| | 44 | % |
Research and development expense
consistconsists mainly of costs associated with development of new products and
new software platformstechnologies from which we do not currently generate
revenue. These include the next version of Microsoft Dynamics AX project,revenue, as well as
other new productcosts related to the ongoing development
efforts. In 2007, we entered into a Software Developmentefforts for Microsoft Dynamics AX. Our contractual research and
License Agreement, which provides for a strategic alliance with Microsoft Corporation (“Microsoft”)development commitment to
jointly develop
core public sector functionality for Microsoft Dynamics AX
was amended in March 2016, which significantly reduced our development commitment through March 2018. However, we will continue to
address the accounting needs of public sector organizations worldwide. This agreementprovide sustained engineering and
subsequent amendments granted Microsoft intellectual property rights in the software code provided and developed by Tyler into Microsoft Dynamics AX products to be marketed and sold outside oftechnical support for the public sector
in exchangefunctionality within Dynamics AX. License and maintenance royalties for
reimbursement payments to partially offset the researchall applicable domestic and
development costs and royalties on direct and indirect public-sectorinternational sales
worldwide of the solutions co-developed under this arrangement. In addition, Tyler has agreed to commit certain resources to the development of the next version of Dynamics AX
andto public sector entities will
receive software and maintenance royalties on direct and indirect public-sector sales worldwidecontinue under the terms of the
solutions co-developed under this arrangement.Ourcontract.
Excluding the results of acquisitions, research and development expense increased
$3.1 million1.5% in
20132016 compared to
2012. In 2013 we did not have anythe prior year period, mainly due to research and development
expense offsets earned underefforts related to new Tyler product development initiatives. As a result of the
termsMicrosoft Dynamics AX amendment, we also redeployed certain development resources to enhance functionality on several existing solutions and these costs were recorded in cost of
our agreement with Microsoft compared to $1.0 million in researchsales – software services, maintenance and
development expense offsets in 2012.subscriptions.
Amortization of Customer and Trade Name Intangibles
Acquisition intangibles are comprised of the excess of the purchase price over the fair value of net tangible assets acquired that is allocated to acquired software,
leases and customer and trade name intangibles. The remaining excess purchase price is allocated to goodwill that is not subject to amortization. Amortization expense related to acquired software is included with cost of revenues, while amortization expense of customer and trade name intangibles is recorded as operating expense. The estimated useful lives of both customer and trade name intangibles
arerange from five to 25 years. The following table sets forth a comparison of amortization of customer and trade name intangibles for the years ended December 31:
| | | | | | | | | | | | | | | | |
| | | | | | | | | Change | |
($ in thousands) | | 2013 | | | 2012 | | | $ | | | % | |
Amortization of customer and trade name intangibles | | $ | 4,517 | | | $ | 4,279 | | | $ | 238 | | | | 6 | % |
|
| | | | | | | | | | | | | | | |
| | | | | Change |
| ($ in thousands) | | 2016 | | 2015 | | $ | | % |
| Amortization of customer and trade name intangibles | | $ | 13,731 |
| | $ | 5,905 |
| | $ | 7,826 |
| | 133 | % |
Amortization of customer and trade name intangibles increased substantially from the comparable prior year periods due to the acquisition of NWS in November 2015.
Estimated annual amortization expense relating to customer and trade name acquisition intangibles, excluding acquired software for which the amortization expense is recorded as cost of revenues, for the next five years
and thereafter is as follows (in thousands):
| | | | |
2014 | | $ | 4,515 | |
2015 | | | 4,515 | |
2016 | | | 4,515 | |
2017 | | | 4,515 | |
2018 | | | 4,366 | |
|
| | | |
| 2017 | $ | 13,808 |
|
| 2018 | 13,658 |
|
| 2019 | 12,395 |
|
| 2020 | 11,241 |
|
| 2021 | 11,121 |
|
Amortization expense relating to acquired leases will be recorded as a reduction to hardware and other revenue and is expected to be $442,000 in 2017, $426,000 in 2018, $373,000 in 2019, $314,000 in 2020, $312,000 in 2021 and $1.3 million thereafter.
The following table sets forth a comparison of other
expense,(expense) income, net for the years ended December 31:
| | | | | | | | | | | | | | | | |
| | | | | | | | | Change | |
($ in thousands) | | 2013 | | | 2012 | | | $ | | | % | |
Other expense, net | | $ | 1,309 | | | $ | 2,709 | | | $ | (1,400 | ) | | | (52 | )% |
|
| | | | | | | | | | | | | | |
| | | | | Change |
| ($ in thousands) | | 2016 | | 2015 | | $ | | % |
| Other (expense) income, net | | $ | (1,998 | ) | | $ | 381 |
| | $ | (2,379 | ) | | N/M |
Other
expense(expense) income is
primarily comprised of interest expense
and non-usage and other fees associated with our revolving
line of credit
agreement. Interest expense was lower in 2013 than 2012 becauseagreement as well as interest income from invested cash. In 2015, we
maintainedhad significantly higher
invested cash balances and no outstanding debt
levels in 2012 associated primarily with several acquisitionsuntil we completed
from October 2011 throughthe NWS acquisition on November
2012.16, 2015.
The following table sets forth a comparison of our income tax provision for the years ended December 31:
| | | | | | | | | | | | | | | | |
| | | | | | | | | Change | |
($ in thousands) | | 2013 | | | 2012 | | | $ | | | % | |
Income tax provision | | $ | 26,718 | | | $ | 20,874 | | | $ | 5,844 | | | | 28 | % |
Effective income tax rate | | | 40.6 | % | | | 38.8 | % | | | | | | | | |
|
| | | | | | | | | | | | | | | |
| | | | | Change |
| ($ in thousands) | | 2016 | | 2015 | | $ | | % |
| Income tax provision | | $ | 19,450 |
| | $ | 43,555 |
| | $ | (24,105 | ) | | (55 | )% |
| | | | | | | | | |
| Effective income tax rate | | 15.0 | % | | 40.2 | % | | | | |
The decrease in the income tax provision during 2016 was primarily driven by the adoption of ASU No. 2016-09, which requires the excess tax benefits from stock option exercises to be recognized as a reduction of the income tax provision, whereas they previously were accounted for as an increase to shareholders’ equity. The adoption of ASU No. 2016-09 resulted in a $29.6 million decrease in our full year 2016 provision for income taxes. (see Note 1 - "Summary of Significant Accounting Policies" in the accompanying consolidated financial statements).
Excluding the impact of the adoption of ASU No. 2016-09, our income tax provision and effective tax rate in 2016 would have been $49.0 million and 37.9%, respectively.
The effective income tax rates
were differentin both 2016 and 2015 also differed from the statutory United States federal income tax rate of 35% due to state income taxes,
the domestic production activities deduction, non-deductible share-based compensation expense,
the qualified manufacturing activities deduction, disqualifying incentive stock option dispositions, and non-deductible
mealsbusiness expenses. We realized a lower domestic production activities deduction as a result of taxable income limitations and
entertainment costs.non-deductible transaction costs related to the NWS acquisition negatively impacted our 2015 effective tax rate. In the past few years a relatively high amount of excess tax benefits related to stock option exercises have resulted in a reduction in our qualified manufacturing activities deduction. The qualified manufacturing activities deduction can be limited to a certain level of taxable income on the tax return. Therefore, any significant items that reduce taxable income, such as excess tax benefits on stock options, can reduce the amount of the qualified manufacturing activities deduction. We experienced significant stock option exercise activity in
20132016 and 2015 that generated
$28.2 million excess tax benefits. Excess tax benefits reduce tax payments but do not significantly reduce the effective tax rate and can result in limitations on other deductions. In 2013, limitations resulting from excess tax benefits
eliminated the qualified manufacturing activities deduction, which negatively impacted our effective tax rate.2012of $29.6 million and $45.3 million, respectively.
2015 Compared to
20112014
Software licenses and royalties.
The following table sets forth a comparison of our software licenses and royalties
revenuesrevenue for the years ended December 31:
| | | | | | | | | | | | | | | | |
| | | | | | | | | Change | |
($ in thousands) | | 2012 | | | 2011 | | | $ | | | % | |
ESS | | $ | 32,060 | | | $ | 30,194 | | | $ | 1,866 | | | | 6 | % |
ATSS | | | 1,868 | | | | 2,400 | | | | (532 | ) | | | (22 | ) |
| | | | | | | | | | | | | | | | |
Total software licenses and royalties revenue | | $ | 33,928 | | | $ | 32,594 | | | $ | 1,334 | | | | 4 | % |
| | | | | | | | | | | | | | | | |
|
| | | | | | | | | | | | | | | |
| | | | | Change |
| ($ in thousands) | | 2015 | | 2014 | | $ | | % |
| ES | | $ | 54,376 |
| | $ | 46,047 |
| | $ | 8,329 |
| | 18 | % |
| A&T | | 4,632 |
| | 3,018 |
| | 1,614 |
| | 53 |
|
| Total software licenses and royalties revenue | | $ | 59,008 |
| | $ | 49,065 |
| | $ | 9,943 |
| | 20 | % |
Excluding the impactresults of acquisitions, total software licenses and royaltieslicense revenue declined by 3%increased 15% compared to 2011. Mostthe prior year. The majority of the declinethis growth was due to fewera more active marketplace as the result of improvement in local government economic conditions, as well as our increasingly strong competitive position, which we attribute in part to our investment in product development in recent years. In addition, add-on sales to our existing customer base. In addition, software license growthbase for courts and justice related solutions that assist and support the transition to a paperless environment increased approximately $1.3 million.
Our new client mix in 2015 was
reduced somewhat because of a growing number of customers choosing our subscription-based options, rather than purchasing the software under a traditional perpetual software license arrangement. Subscription-based arrangements result in no software license revenues in the initial year as compared to traditionalapproximately 76% selecting perpetual software license arrangements
but generate higher overalland approximately 24% selecting subscription-based
services revenue over the termarrangements compared to a client mix in 2014 of
the contract. We had 76approximately 74% selecting perpetual software license arrangements and approximately 26% selecting subscription-based arrangements. 134 new
customers thatclients entered into subscription-based
software arrangements in
20122015 compared to
47138 new
customersclients in
2011.2014.
The following table sets forth a comparison of our
subscription revenuessubscriptions revenue for the years ended December 31:
| | | | | | | | | | | | | | | | |
| | | | | | | | | Change | |
($ in thousands) | | 2012 | | | 2011 | | | $ | | | % | |
ESS | | $ | 43,319 | | | $ | 30,400 | | | $ | 12,919 | | | | 42 | % |
ATSS | | | 1,299 | | | | 760 | | | | 539 | | | | 71 | |
| | | | | | | | | | | | | | | | |
Total subscriptions revenue | | $ | 44,618 | | | $ | 31,160 | | | $ | 13,458 | | | | 43 | % |
| | | | | | | | | | | | | | | | |
Excluding the impact of acquisitions, subscription-based
|
| | | | | | | | | | | | | | | |
| | | | | Change |
| ($ in thousands) | | 2015 | | 2014 | | $ | | % |
| ES | | $ | 107,090 |
| | $ | 84,322 |
| | $ | 22,768 |
| | 27 | % |
| A&T | | 4,843 |
| | 3,526 |
| | 1,317 |
| | 37 |
|
| Total subscriptions revenue | | $ | 111,933 |
| | $ | 87,848 |
| | $ | 24,085 |
| | 27 | % |
Subscription-based services revenue increased
40%27% compared to
2011.2014. E-filing services contributed approximately $7.7 million of the subscriptions revenue increase in 2015. Most of the e-filing revenue increase related to several statewide contracts, several of which implemented mandatory electronic filing near the end of 2014 and throughout 2015. New SaaS
customersclients as well as existing
customersclients who converted to our SaaS model provided the
majorityremainder of the
subscription-basedsubscriptions revenue increase. In
2012,2015, we added
76134 new
customersSaaS clients and
6866 existing
customersclients elected to convert to our SaaS model.
E-filing services also contributed approximately $2.3 million of the subscription revenue increase as a result ofThe average contract sizes in 2015 were 38% and 22% higher than 2014 for new clients
implementing e-filing and
several existing clients
adopting or expanding mandatory e-filing for court documents in the last half of 2011 and 2012.converting to our SaaS model, respectively.
Software
services.services.
The following table sets forth a comparison of our software services
revenuesrevenue for the years ended December 31:
| | | | | | | | | | | | | | | | |
| | | | | | | | | Change | |
($ in thousands) | | 2012 | | | 2011 | | | $ | | | % | |
ESS | | $ | 76,103 | | | $ | 60,840 | | | $ | 15,263 | | | | 25 | % |
ATSS | | | 7,305 | | | | 8,777 | | | | (1,472 | ) | | | (17 | ) |
| | | | | | | | | | | | | | | | |
Total software services revenue | | $ | 83,408 | | | $ | 69,617 | | | $ | 13,791 | | | | 20 | % |
| | | | | | | | | | | | | | | | |
|
| | | | | | | | | | | | | | | |
| | | | | Change |
| ($ in thousands) | | 2015 | | 2014 | | $ | | % |
| ES | | $ | 129,068 |
| | $ | 104,146 |
| | $ | 24,922 |
| | 24 | % |
| A&T | | 10,784 |
| | 9,675 |
| | 1,109 |
| | 11 |
|
| Total software services revenue | | $ | 139,852 |
| | $ | 113,821 |
| | $ | 26,031 |
| | 23 | % |
Excluding the
impactresults of acquisitions, software services
increased 14%revenue grew 20% compared to
2011. The increasethe prior year period. This growth is
mainly due
partly to
contractmuch higher revenue from proprietary software arrangements,
that included more programming services as well as
several state-wide arrangements that in additionadditions to
services, include more third party vendor servicesour implementation and support staff, which increased our capacity to
build certain software interfaces.Maintenance.
deliver backlog.
Maintenance.
The following table sets forth a comparison of our maintenance
revenuesrevenue for the years ended December 31:
| | | | | | | | | | | | | | | | |
| | | | | | | | | Change | |
($ in thousands) | | 2012 | | | 2011 | | | $ | | | % | |
ESS | | $ | 155,290 | | | $ | 130,999 | | | $ | 24,291 | | | | 19 | % |
ATSS | | | 16,561 | | | | 15,499 | | | | 1,062 | | | | 7 | |
| | | | | | | | | | | | | | | | |
Total maintenance revenue | | $ | 171,851 | | | $ | 146,498 | | | $ | 25,353 | | | | 17 | % |
| | | | | | | | | | | | | | | | |
|
| | | | | | | | | | | | | | | |
| | | | | Change |
| ($ in thousands) | | 2015 | | 2014 | | $ | | % |
| ES | | $ | 227,586 |
| | $ | 195,881 |
| | $ | 31,705 |
| | 16 | % |
| A&T | | 17,951 |
| | 16,815 |
| | 1,136 |
| | 7 |
|
| Total maintenance revenue | | $ | 245,537 |
| | $ | 212,696 |
| | $ | 32,841 |
| | 15 | % |
Excluding the
impactresults of acquisitions, maintenance revenue grew
9% from 2011. This increase was12% compared to the prior year. Maintenance and support revenue increased mainly due to growth in our installed customer base
andfrom new software license sales as well as annual maintenance rate
increases on most of our product lines.increases.
Appraisal
services.services.
The following table sets forth a comparison of our appraisal services
revenuesrevenue for the years ended December 31:
| | | | | | | | | | | | | | | | |
| | | | | | | | | Change | |
($ in thousands) | | 2012 | | | 2011 | | | $ | | | % | |
ESS | | $ | — | | | $ | — | | | $ | — | | | | — | % |
ATSS | | | 22,543 | | | | 23,228 | | | | (685 | ) | | | (3 | ) |
| | | | | �� | | | | | | | | | | | |
Total appraisal services revenue | | $ | 22,543 | | | $ | 23,228 | | | $ | (685 | ) | | | (3 | )% |
| | | | | | | | | | | | | | | | |
|
| | | | | | | | | | | | | | | |
| | | | | Change |
| ($ in thousands) | | 2015 | | 2014 | | $ | | % |
| ES | | $ | — |
| | $ | — |
| | $ | — |
| | — | % |
| A&T | | 25,065 |
| | 21,802 |
| | 3,263 |
| | 15 |
|
| Total appraisal services revenue | | $ | 25,065 |
| | $ | 21,802 |
| | $ | 3,263 |
| | 15 | % |
Appraisal services revenue
declined 3%benefited from the addition of several new revaluation contracts, including the City of Detroit, and the current appraisal cycle in
2012 comparedIndiana, both of which began in 2014. In late 2015, Franklin County, Ohio began a full reappraisal cycle, which also contributed to
2011. The appraisal services
business is somewhat cyclical and driven in part by statutory revaluation cycles in various states. The decline is mainly due to the completion in mid-2012, of a large contract in Pennsylvania offset slightly by the start-up of smaller projects, including several in Ohio.revenue.
Cost of Revenues and Gross Margins
The following table sets forth a comparison of the key components of our cost of revenues for the years ended December 31:
| | | | | | | | | | | | | | | | |
| | | | | | | | | Change | |
($ in thousands) | | 2012 | | | 2011 | | | $ | | | % | |
Software licenses and royalties | | $ | 1,983 | | | $ | 3,034 | | | $ | (1,051 | ) | | | (35 | )% |
Acquired software | | | 1,888 | | | | 1,125 | | | | 763 | | | | 68 | |
Software services, maintenance and subscriptions | | | 171,584 | | | | 143,776 | | | | 27,808 | | | | 19 | |
Appraisal services | | | 14,889 | | | | 14,550 | | | | 339 | | | | 2 | |
Hardware and other | | | 5,258 | | | | 4,994 | | | | 264 | | | | 5 | |
| | | | | | | | | | | | | | | | |
Total cost of revenues | | $ | 195,602 | | | $ | 167,479 | | | $ | 28,123 | | | | 17 | % |
| | | | | | | | | | | | | | | | |
|
| | | | | | | | | | | | | | | |
| | | | | Change |
| ($ in thousands) | | 2015 | | 2014 | | $ | | % |
| Software licenses and royalties | | $ | 1,632 |
| | $ | 1,900 |
| | $ | (268 | ) | | (14 | )% |
| Acquired software | | 4,440 |
| | 1,858 |
| | 2,582 |
| | 139 |
|
| Software services, maintenance and subscriptions | | 285,340 |
| | 236,363 |
| | 48,977 |
| | 21 |
|
| Appraisal services | | 15,922 |
| | 14,284 |
| | 1,638 |
| | 11 |
|
| Hardware and other | | 6,501 |
| | 5,325 |
| | 1,176 |
| | 22 |
|
| Total cost of revenues | | $ | 313,835 |
| | $ | 259,730 |
| | $ | 54,105 |
| | 21 | % |
The following table sets forth a comparison of gross margin percentage by revenue type for the years ended December 31:
| | | | | | | | | | | | |
Gross margin percentage | | 2012 | | | 2011 | | | Change | |
Software licenses, royalties and acquired software | | | 88.6 | % | | | 87.2 | % | | | 1.4 | % |
Software services, maintenance and subscriptions | | | 42.8 | | | | 41.9 | | | | 0.9 | |
Appraisal services | | | 34.0 | | | | 37.4 | | | | (3.4 | ) |
Hardware and other | | | 24.4 | | | | 20.7 | | | | 3.7 | |
Overall gross margin | | | 46.2 | % | | | 45.9 | % | | | 0.3 | % |
|
| | | | | | | | | |
| Gross margin percentage | | 2015 | | 2014 | | Change |
| Software licenses, royalties and acquired software | | 89.7 | % | | 92.3 | % | | (2.6 | )% |
| Software services, maintenance and subscriptions | | 42.6 |
| | 43.0 |
| | (0.4 | ) |
| Appraisal services | | 36.5 |
| | 34.5 |
| | 2.0 |
|
| Hardware and other | | 32.5 |
| | 32.3 |
| | 0.2 |
|
| Overall gross margin | | 46.9 | % | | 47.3 | % | | (0.4 | )% |
Software licenses, royalties and acquired software. In 2012,2015, our software licenses, royalties and acquired software gross margin percentage declined compared to the prior year due to much higher amortization expense for acquired software resulting from our acquisition of NWS. Excluding the results of NWS, our software license, royalties and acquired software gross margin percentagewas 93.6% which increased compared to 20111.3% from the prior year period mainly due to higher royalties and because our product mix included less third partyrevenues from proprietary software which offset higher amortization expense associated with acquisitions.arrangements.
Software services, maintenance and subscription-based servicessubscriptions. In 2012,2015, the software services, maintenance and subscriptions gross margin increasedpercentage declined compared to the prior year partly because we improved our utilization of our support and maintenance staff andmainly due to annual rate increases on certain services.onboarding costs associated with accelerated hiring to ensure that we are well-positioned to deliver our current backlog and anticipated new business. Excluding 147285 employees added with acquisitions, our implementation and support staff has increasedgrown by 103200 employees since 2011. MostDecember 31, 2014. In addition, in 2015, we incurred $1.4 million more in contract labor cost than 2014 in an effort to maintain flexibility to accommodate fluctuations in demand for professional services. The gross margin decline was somewhat offset because costs related to maintenance and various other services such as SaaS and e-filing typically grow at a slower rate than related revenue due to leverage in the utilization of these additions occurred mid-to late 2012.our support and maintenance staff and economies of scale. Price increases also resulted in slightly higher rates on certain services.
Appraisal services. Appraisal services revenues arerevenue comprised approximately 6%4% of total revenues.revenue. The appraisal services gross margin declinedincreased 2% compared to 2011.2014. A high proportion of the costs of appraisal services revenue are variable, as we often hire temporary employees to assist in appraisal projects, whose term of employment generally ends with the projects’ completion. The appraisal services gross margin in 2011 was also favorably impacted by operational efficiencies associated with a large revaluation contract whichthat began in mid-2010 and was substantially complete by mid-2011.late 2014.
Our
2015 blended gross margin
for 2012 increased 0.3% from 2011 mainly duedeclined 0.4% compared to
leverage in the utilization of our support, maintenance and subscription-based services staff and economies of scale and slightly higher rates on certain services.2014. The gross margin
also benefited from lower third partywas negatively impacted by increased acquired software
costsamortization expense associated with the NWS acquisition and
higher royalties.expenses associated with increased hiring of implementation and development staff in order to expand our capacity to implement our contract backlog.
Selling, General and Administrative Expenses
The following table sets forth a comparison of our SG&A expenses for the following years ended December 31:
| | | | | | | | | | | | | | | | |
| | | | | | | | | Change | |
($ in thousands) | | 2012 | | | 2011 | | | $ | | | % | |
Selling, general and administrative expenses | | $ | 86,706 | | | $ | 75,650 | | | $ | 11,056 | | | | 15 | % |
Excluding the impact of acquisitions, SG&A increased approximately 11% compared to 2011.
|
| | | | | | | | | | | | | | | |
| | | | | Change |
| ($ in thousands) | | 2015 | | 2014 | | $ | | % |
| Selling, general and administrative expenses | | $ | 133,317 |
| | $ | 108,260 |
| | $ | 25,057 |
| | 23 | % |
SG&A as a percentage of revenuesrevenue was 23.9%22.6% in 20122015 compared to 24.5%22.0% in 2011.2014. In 2015, our SG&A expenses increasedinclude approximately $5.9 million for financial advisory, legal, accounting, due diligence, valuation and other various services necessary to complete the NWS acquisition. In addition, our 2015 operating results include $4.0 million of SG&A expenses for NWS from the date of acquisition. The remaining SG&A expense increase is mainly due to higher commission expense in connection withcompensation cost related to increased sales; increased headcount in sales and related expenses to support geographic expansion; and increased incentive compensation costs due to improved results andstaff levels, higher stock compensation expense becauseand increased commission expense as a result of higher sales. Excluding 140 employees added with acquisitions, we have added 16 employees mainly to our companysales and finance teams since December 31, 2014. In addition, our 2015 stock compensation expense rose $4.2 million, mainly due to increases in our stock price has increased substantially over the last few years.
Research and Development Expense
The following table sets forth a comparison of our research and development expense for the years ended December 31:
| | | | | | | | | | | | | | | | |
| | | | | | | | | Change | |
($ in thousands) | | 2012 | | | 2011 | | | $ | | | % | |
Research and development expense | | $ | 20,140 | | | $ | 16,414 | | | $ | 3,726 | | | | 23 | % |
Our research
|
| | | | | | | | | | | | | | | |
| | | | | Change |
| ($ in thousands) | | 2015 | | 2014 | | $ | | % |
| Research and development expense | | $ | 29,922 |
| | $ | 25,743 |
| | $ | 4,179 |
| | 16 | % |
Research and development expense
increased $3.7in 2015 includes approximately $1.5 million
in 2012related to NWS. The remaining increase compared to
2011. The increase is mainly2014 was primarily due to
lower reimbursements from Microsoft in 2012. In 2012, we had $1.0 million in researchincreased staffing to maintain and
development expense offsets compared to $3.5 million in 2011, which were the amounts earned under the terms ofenhance our
agreement with Microsoft. Under our amended agreement with Microsoft, the project included offsets to researchcompetitive position and
development expense, varying in amount from quarter to quarter from 2009 through 2012 for a total of approximately $6.2 million. As of September 30, 2012, we received the final $1.0 million under the agreement.annual wage adjustments.
Amortization of Customer and Trade Name Intangibles
The following table sets forth a comparison of amortization of customer and trade name intangibles for the years ended December 31:
| | | | | | | | | | | | | | | | |
| | | | | | | | | Change | |
($ in thousands) | | 2012 | | | 2011 | | | $ | | | % | |
Amortization of customer and trade name intangibles | | $ | 4,279 | | | $ | 3,331 | | | $ | 948 | | | | 28 | % |
|
| | | | | | | | | | | | | | | |
| | | | | Change |
| ($ in thousands) | | 2015 | | 2014 | | $ | | % |
| Amortization of customer and trade name intangibles | | $ | 5,905 |
| | $ | 4,546 |
| | $ | 1,359 |
| | 30 | % |
In
2012,2015, we completed
fourtwo acquisitions that increased amortizable customer and trade name intangibles by approximately
$11.1$127.8 million. This amount is being amortized over a weighted average period of
11.815 years.
We also added approximately $3.7 million to acquisition related intangibles to reflect the fair value of acquired leases, which will be amortized over the weighted average life of 9 years.
The following table sets forth a comparison of other
expense,income (expense), net for the years ended December 31:
| | | | | | | | | | | | | | | | |
| | | | | | | | | Change | |
($ in thousands) | | 2012 | | | 2011 | | | $ | | | % | |
Other expense, net | | $ | 2,709 | | | $ | 2,404 | | | $ | 305 | | | | 13 | % |
Interest expense was higher
|
| | | | | | | | | | | | | | |
| | | | | Change |
| ($ in thousands) | | 2015 | | 2014 | | $ | | % |
| Other income (expense), net | | $ | 381 |
| | $ | (355 | ) | | $ | 736 |
| | N/M |
Expenses in
2012 than 2011 due to higher debt levels2014 were comprised primarily of non-usage and other fees associated with
several acquisitionsa revolving debt agreement that terminated in August 2014, offset slightly by interest income from invested cash. In 2015, we had significantly higher invested cash balances than 2014 until we completed
since October 2011 and stock repurchases in the
last half of 2011. The effective interest rate in 2012 was 3.4% compared to 3.3% in 2011.NWS acquisition on November 16, 2015.
The following table sets forth a comparison of our income tax provision for the years ended December 31:
| | | | | | | | | | | | | | | | |
| | | | | | | | | Change | |
($ in thousands) | | 2012 | | | 2011 | | | $ | | | % | |
Income tax provision | | $ | 20,874 | | | $ | 16,556 | | | $ | 4,318 | | | | 26 | % |
Effective income tax rate | | | 38.8 | % | | | 37.5 | % | | | | | | | | |
|
| | | | | | | | | | | | | | | |
| | | | | Change |
| ($ in thousands) | | 2015 | | 2014 | | $ | | % |
| Income tax provision | | $ | 43,555 |
| | $ | 35,527 |
| | $ | 8,028 |
| | 23 | % |
| | | | | | | | | |
| Effective income tax rate | | 40.2 | % | | 37.6 | % | | | | |
The effective income tax rates
for both years were different from the statutory United States federal income tax rate of 35%
principally due to state income taxes, non-deductible share-based compensation expense, the qualified manufacturing activities deduction, disqualifying incentive stock option dispositions,
and non-deductible meals and entertainment
costs and non-deductible transaction costs.
The effective income tax rate in 2011 was also reduced by a research and development tax credit. TheA lower qualified manufacturing activities deduction
declined in 2012 contributingand non-deductible transaction costs related to
a higherthe NWS acquisition negatively impacted our 2015 effective tax rate.
In the past few years a relatively high amount of excess tax benefits related to stock option exercises have resulted in a reduction in our qualified manufacturing activities deduction as a result of taxable income limitations. We experienced significant stock option exercise activity in 2015 and 2014 that generated excess tax benefits of $45.3 million and $19.4 million, respectively.
FINANCIAL CONDITION AND LIQUIDITY
As of December 31,
2013,2016, we had cash and cash equivalents of
$78.9 million and investments available-for-sale of $1.3$36.2 million compared to
cash and cash equivalents of $6.4 million and investments available-for-sale of $2.0$33.1 million at December 31,
2012.2015. We also had $33.5 million invested in investment grade corporate and municipal bonds as of December 31, 2016. These investments mature between 2016 through mid-2018 and we intend to hold these investments until maturity. Cash and cash equivalents consist of cash on deposit with several domestic banks and money market funds. As of December 31,
2013,2016, we had
no$10.0 million in outstanding borrowings and
antwo outstanding
letterletters of credit totaling
$2.0 million. Some of our customers require a letter of credit$2.2 million in connection with
a client contract and the expansion of our
contracts. The notional amount of performance guarantees outstanding secured by letterYarmouth facility. Both letters of credit
as of December 31, 2013 was estimated to be approximately $29.0 million.guarantee our performance under each contract. We do not believe
this letterthe letters of credit will be required to be drawn upon.
Both letters of credit expire in 2017. We believe
thatour revolving line of credit, cash from operating activities, cash on hand and access to the credit markets
providesprovide us with sufficient flexibility to meet our long-term financial needs.
The following table sets forth a summary of cash flows for the years ended December 31:
| | | | | | | | | | | | |
($ in thousands) | | 2013 | | | 2012 | | | 2011 | |
Cash flows provided (used) by: | | | | | | | | | | | | |
Operating activities | | $ | 66,090 | | | $ | 58,668 | | | $ | 56,435 | |
Investing activities | | | (25,658 | ) | | | (34,736 | ) | | | (28,809 | ) |
Financing activities | | | 32,038 | | | | (18,852 | ) | | | (28,414 | ) |
| | | | | | | | | | | | |
Net increase (decrease) in cash and cash equivalents | | $ | 72,470 | | | $ | 5,080 | | | $ | (788 | ) |
| | | | | | | | | | | | |
|
| | | | | | | | | | | | |
| ($ in thousands) | | 2016 | | 2015 | | 2014 |
| Cash flows provided (used) by: | | | | | | |
| Operating activities | | $ | 191,859 |
| | $ | 134,327 |
| | $ | 142,839 |
|
| Investing activities | | (50,720 | ) | | (398,459 | ) | | (11,555 | ) |
| Financing activities | | (138,075 | ) | | 91,052 |
| | (3,993 | ) |
| Net increase (decrease) in cash and cash equivalents | | $ | 3,064 |
| | $ | (173,080 | ) | | $ | 127,291 |
|
Net cash provided by operating activities continues to be our primary source of funds to finance operating needs and capital expenditures. Other potential capital resources include cash on hand, public and private issuances of debt or equity securities, and bank borrowings. It is possible that our ability to access the capital and credit markets in the future may be limited by economic conditions or other factors. We currently believe that cash provided by operating activities, cash on hand and access to theavailable credit markets are
sufficient to fund our working capital requirements, capital expenditures, income tax obligations, and share repurchases for at least the next twelve months.
In
2013,2016, operating activities provided
net cash of
$66.1 million,$191.9 million. Operating activities that provided cash were primarily
generated fromcomprised of net income of
$39.1$109.9 million, non-cash depreciation and amortization charges of
$13.8$50.3 million and non-cash share-based compensation expense of
$11.7$29.7 million.
Cash from operations also benefited from timingOther sources of
payments on wages and bonuses. In addition,operating cash were higher deferred revenue balances
were higher than 2012 due to
an increase in annual software maintenance billings as a result of growth in our installed
software maintenance customer base and growth in subscription-based
arrangements. Thesearrangements and timing of payments for wages and commissions. Somewhat offsetting these increases
in liabilities were
offset somewhat by higher accounts receivable balances from annual
software maintenance
billings, progress billings associated with large contracts and
prepaid commissions on large contracts.subscription billings.
In general, changes in the balance of deferred revenue are cyclical and primarily driven by the timing of our maintenance renewal billings. Our renewal dates occur throughout the year but our
heaviestlargest renewal cycles occur in the second and fourth quarters.
At December 31, 2013, our days
Days sales outstanding
(“DSOs”)in accounts receivable were
87 days compared to DSOs of 9593 days at December 31,
2012. DSOs are2016, compared to 100 days at December 31, 2015. Our maintenance billing cycle typically peaks at its highest level in June and second highest level in December of each year and is followed by collections in the subsequent quarter. DSO is calculated based on
quarter-end accounts receivable (excluding long-term receivables, but including unbilled receivables) divided by the quotient of annualized quarterly revenues divided by 360 days.
Accounts receivable at December 31, 2012 included several large billings for retentions associated with appraisal contracts. Investing activities used cash of
$25.7$50.7 million in
20132016 compared to
$34.7$398.5 million in
2012. Investing activities in 2013 include2015. We invested $20.3 million
in investment grade corporate and municipal bonds with maturity dates ranging from 2016 through mid-2018. Approximately $37.7 million was invested in property and equipment. We purchased an office building in Falmouth, Maine, that was previously leased from an entity owned by an executive’s father and brother, for approximately $9.7 million and paid
$8.0 million for construction to expand a building in Yarmouth, Maine. We plan to spend approximately $18.7 million in 2017 in connection with the
constructioncompletion of
anthis office
buildingexpansion. The remaining additions were for computer equipment, furniture and fixtures in
Plano, Texas comparedsupport of internal growth, particularly with respect to
$2.3growth in our cloud-based offerings. We also made a small acquisition for approximately $7.4 million
and paid $2.0 million related to the working capital holdback in
2012. In 2012, we completedconnection with the
acquisitions of Akanda Innovations, Inc., UniFund, L.L.C., Computer Software Associates, Inc. and EnerGov Solutions, L.L.C. The combined cash purchase prices paid in 2012, net of cash acquired was approximately $25.7 million. In May 2012, we purchased land and a building in Moraine, Ohio to support our appraisal and tax operations for a purchase price of $2.6 million, which was comprised of $1.7 million in cash and land and a building valued at $900,000.NWS acquisition. These expenditures were funded from cash generated from operations,
cash on hand and
borrowings under our revolving credit line.bank borrowings.
In
2011,2015, we completed the acquisition of
Windsor. TheNWS for the purchase price of $337.5 million in cash, of which $4.0 million was accrued at December 31, 2015, and 2.1 million shares of Tyler common stock valued at $362.8 million. Also we completed the acquisition of Brazos Technology Corporation for the purchase price, net of cash acquired
and including debt assumed, of $6.1 million in cash and 12,500 shares of Tyler common stock valued at $1.5 million. On January 30, 2015, we made a $15.0 million investment in convertible preferred stock representing a 20% interest in Record Holdings Pty Limited. We also invested $30.9 million in investment grade corporate and municipal bonds. The remaining use of cash was
approximately $16.4 million. In March 2011, we paid $6.6 million for
approximately 27 acrescapital expenditures related to computer equipment, furniture and fixtures in support of
land and a buildinginternal growth, particularly with respect to growth in
Plano, Texas.our cloud-based offerings.
Financing activities in 2013 providedused cash of $32.0$138.1 million in 2016 compared to cash usedprovided by financing activities of $18.9$91.1 million in 2012.2015. Financing activities in 20132016 were comprised of $18.0$56.0 million in net payments on our revolving line of credit offset somewhat by collections of $21.8$29.8 million from stock option exercises and employee stock purchase plan activityactivity. We also purchased approximately 882,000 shares of our common stock for an aggregate purchase price of $112.7 million, of which $860,000 was accrued at December 31, 2016.
Financing activities in 2015 were comprised of net borrowings of $66.0 million and $28.2collections of $27.8 million excess tax benefit from stock option exercises and employee stock purchase plan activity. We purchased approximately 5,400 shares of share-based arrangements.our common stock for an aggregate purchase price of $645,000 in 2015 and paid $2.1 million in debt issuance costs. Cash used inby financing activities in 2012 was mainly2014 were comprised of $42.7purchases of 294,000 shares of our common stock for an aggregate purchase price of $22.8 million in payments on our revolving line of credit offset substantially by collections of $15.1$18.8 million from stock option exercises and contributions from the employee stock purchase plan and $8.8 million excess tax benefit from exercisesplan.
On May 11, 2016, our board of
share-based arrangements.In 2011, cash used in financing activities was primarily compriseddirectors authorized the repurchase of purchases of treasury shares, net of proceeds from stock option exercises, borrowings and payments on our revolving credit line and contributions from our employee stock purchase plan. During 2011, we purchased 3.0an additional 1.5 million shares of ourTyler common stock for an aggregate purchase price of $71.8 million.
stock. The share repurchase program, which was approved by our board of directors, was announced in October 2002, and was amended in Aprilat various times from 2003 July 2003, October 2004, October 2005, May 2007, May 2008, October 2008, May 2009, July 2010, October 2010 and September 2011.through 2016. As of December 31, 2013,2016, we had remaining authorization to repurchase up to 1.72.0 million additional shares of our common stock. Our share repurchase program allows us to repurchase shares at our discretion and marketdiscretion. Market conditions influence the timing of the buybacks and the number of shares repurchased, as well as the volume of employee stock option exercises. These shareShare repurchases are generally funded using our existing cash balances and borrowings under our revolving credit agreementfacility and may occur through open market purchases and transactions structured through investment banking institutions, privately negotiated transactions and/or other mechanisms. There is no expiration date specified for the authorization and we intend to repurchase stock under the plan from time to time.
In 2013,
Subsequent to December 31, 2016 and through February 21, 2017, we issued 1.4 million shares of common stock and received $18.3 million in aggregate proceeds upon exercise of stock options. In 2012 we issued 1.2 million shares of common stock and received $12.4 million in aggregate proceeds upon exercise of stock options. In 2011 we received $3.6 million from the exercise of options to purchasepurchased approximately 582,00042,000 shares of our common stock under our employee stock option plan. In 2013, 2012 and 2011for an aggregate cash purchase price of $6.2 million.
On November 16, 2015, we
received $3.5 million, $2.6 million and $2.0 million, respectively, from contributions to the Tyler Technologies, Inc. Employee Stock Purchase Plan.We haveentered into a $150.0$300.0 million Credit Agreement (the “Credit Facility”) with the various lenders party thereto and a related pledge and security agreement with a group of seven financial institutions, withWells Fargo Bank, of America, N.A.,National Association, as Administrative Agent. The Credit Facility provides for a revolving credit line
of $150.0 million (which may be increased up to $200.0$300.0 million, subject to our obtaining commitments for such increase), withincluding a $25.0$10.0 million sublimit for letters of credit. The Credit Facility matures on August 11, 2014.November 16, 2020. Borrowings under the Credit Facility may be used for general corporate purposes, including working capital requirements, acquisitions and share repurchases.Borrowings under the Credit Facility bear interest at a rate of either (1) the Bank of America’sWells Fargo Bank’s prime rate (subject to certain higher rate determinations) plus a margin of 1.50%0.25% to 2.75%1.00% or (2) the 30, 60, 90 or 180-day180 day LIBOR rate plus a margin of 2.50%1.25% to 3.75%, with the margin determined by2.00%. As of December 31, 2016, our consolidated leverage ratio.interest rate was 1.96%. The Credit Facility is secured by substantially all of our assets, excluding real property.assets. The Credit Facility requires us to maintain certain financial ratios and other financial conditions and prohibits us from making certain investments, advances, cash dividends or loans, and limits incurrence of additional indebtedness and liens. As of December 31, 2013,2016, we were in compliance with those covenants.
covenants
. As of December 31, 2013,2016, we had no$10.0 million in outstanding borrowings and unused available borrowing capacity of $148.0$287.8 million under the Credit Facility. In addition, as of December 31, 2013, our bank had issued an outstanding letter of credit totaling $2.0 million. This letter of credit reduces our available borrowing capacity and expires in 2014.Facility
. We paid income taxes, net of refunds received, of
$9.3$30.2 million in
2013, $13.12016, $27.3 million in
20122015, and
$13.4$10.2 million in
2011. We2014. In 2016, we experienced significant stock option exercise activity
in 2013 that generated
$28.2 million excess tax benefits. Excessnet tax benefits
reduceof $29.6 million and reduced tax payments
but do not significantly reduce the effective tax rateaccordingly. In 2015 and
can result in limitations on other deductions. The majority of this excess tax benefit was generated in the last half of 2013 and as a result we anticipate a tax refund in 2014,
for approximately $9.7 million. In 2012 and 2011, excess tax benefits were
$8.8$45.3 million and
$3.6$19.4 million, respectively.
Excluding acquisitions, we anticipate that
20142017 capital spending will be between
$12.0$52.0 million and
$13.0 million.$54.0 million, including approximately $24.0 million related to real estate. We expect the majority of
thisthe other capital spending will consist of computer equipment and software for infrastructure replacements and expansion. We currently do not expect to capitalize significant amounts related to software development in
2014,2017, but the actual amount and timing of those costs, and whether they are capitalized or expensed may result in additional capitalized software development. Capital spending is expected to be funded from existing cash balances,
and cash flows from
operations.operations and borrowings under our revolving line of credit.
From time to time we engage in discussions with potential acquisition candidates. In order to pursue such opportunities, which could require significant commitments of capital, we may be required to incur debt or to issue additional potentially dilutive securities in the future. No assurance can be given as to our future acquisition opportunities and how such opportunities will be financed.
We lease office facilities, as well as transportation, computer and other equipment used in our operations under non-cancelable operating lease agreements expiring at various dates through
2021.2023. Most leases contain renewal options and some contain purchase options.
Summarized in the table below are our obligations to make future payments under our
long-term revolving credit agreementCredit Facility and lease obligations at December 31,
20132016 (in thousands):
| | | | | | | | | | | | | | | | | | | | | | | | | | | | |
| | | 2014 | | | 2015 | | | 2016 | | | 2017 | | | 2018 | | | Thereafter | | | Total | |
Lease obligations | | $ | 5,680 | | | $ | 4,677 | | | $ | 4,415 | | | $ | 3,880 | | | $ | 1,731 | | | $ | 2,339 | | | $ | 22,722 | |
|
| | | | | | | | | | | | | | | | | | | | | | | | | | | |
| | 2017 | | 2018 | | 2019 | | 2020 | | 2021 | | Thereafter | | Total |
| Revolving line of credit | $ | — |
| | $ | — |
| | $ | — |
| | $ | 10,000 |
| | $ | — |
| | $ | — |
| | $ | 10,000 |
|
| Lease obligations | 5,177 |
| | 4,221 |
| | 3,556 |
| | 3,273 |
| | 2,059 |
| | 601 |
| | 18,887 |
|
| Total future payment obligations | $ | 5,177 |
| | $ | 4,221 |
| | $ | 3,556 |
| | $ | 13,273 |
| | $ | 2,059 |
| | $ | 601 |
| | $ | 28,887 |
|
As of December 31,
2013,2016, we do not have any off-balance sheet arrangements, guarantees to
third partiesthird-parties or material purchase commitments, except for the operating lease commitments listed above.
At December 31,
2013,2016, our capitalization consisted of
no$10.0 million of outstanding borrowings and
$246.3$915.5 million of shareholders’ equity.
| |
| ITEM 7A. | QUANTITATIVE AND QUALITATIVE DISCLOSURES ABOUT MARKET RISK. |
Market risk represents the risk of loss that may affect us due to adverse changes in financial market prices and interest rates.
As of December 31, 20132016, we had no$10.0 million in outstanding borrowings under the Credit Facility. BorrowingsLoans under the Credit Facility bear interest, at Tyler’s option, at a per annum rate of either (1) the Wells Fargo Bank of America’s prime rate (subject to certain higher rate determinations) plus a margin of 1.50%0.25% to 2.75%1.00% or (2) the 30, 60, 90 or 180-day LIBOR rate plus a margin of 2.50%1.25% to 3.75%, with the margin determined2.00%.
In 2016, our effective average interest rate for borrowings was 1.79%. As of December 31, 2016 our interest rate was 1.96%. The Credit Facility is secured by
substantially all of our
consolidated leverage ratio.assets.
Assuming borrowings of $10.0 million, a hypothetical 10% increase in our interest rate at December 31, 2016 for a one-year period would result in approximately $19,600 of additional interest rate expense.
| |
| ITEM 8. | FINANCIAL STATEMENTS AND SUPPLEMENTARY DATA. |
The reports of our independent registered public accounting firm and our financial statements, related notes, and supplementary data are included as part of this Annual Report beginning on page F-1.
| |
| ITEM 9. | CHANGES IN AND DISAGREEMENTS WITH ACCOUNTANTS ON ACCOUNTING AND FINANCIAL DISCLOSURE. |
| |
| ITEM 9A. | CONTROLS AND PROCEDURES. |
Evaluation of Disclosure Controls and Procedures— We maintain disclosure controls and procedures (as defined in Rule 13a-15(e) of the Securities Exchange Act) designed to provide reasonable assurance that the information required to be disclosed by us in the reports we file or submit under the Exchange Act is recorded, processed, summarized and reported within the time periods specified in the SEC’s rules and forms. These include controls and procedures designed to ensure that this information is accumulated and communicated to our management, including our chief executive officer and chief financial officer, as appropriate to allow timely decisions regarding required disclosures. Management, with the participation of the chief executive officer and chief financial officer, evaluated the effectiveness of our disclosure controls and procedures as of December 31, 2013.2016. Based on this evaluation, the chief executive officer and chief financial officer have concluded that ourdisclosure controls and procedures were effective as of December 31, 2013.2016.
Management’s Report on Internal Control Over Financial Reporting— Tyler’s management is responsible for establishing and maintaining effective internal control over financial reporting as defined in Securities Exchange Act Rule 13a-15(f). Tyler’s internal control over financial reporting is designed to provide reasonable assurance to Tyler’s management and board of directors regarding the preparation and fair presentation of published financial statements. Because of its inherent limitations, internal control over financial reporting may not prevent or detect misstatements. Therefore, even those systems determined to be effective can provide only reasonable assurance with respect to financial statement preparation and presentation.
Management assessed the effectiveness of Tyler’s internal control over financial reporting as of December 31,
2013.2016. In making this assessment, management used the criteria set forth by the Committee of Sponsoring Organizations of the Treadway Commission
(COSO) inInternal Control – Integrated Framework (1992(2013 framework) (the COSO criteria). Based on our assessment, we concluded that, as of December 31,
2013,2016, Tyler’s internal control over financial reporting was effective based on those criteria.
Tyler’s internal control over financial reporting as of December 31, 20132016 has been audited by Ernst & Young LLP, the independent registered public accounting firm who also audited Tyler’s financial statements. Ernst & Young’s attestation report on Tyler’s internal control over financial reporting appears on page F-1 hereof.
F-1 hereof.Changes in Internal Control Over Financial Reporting— During the quarter ended December 31, 2013,2016, there were no changes in our internal control over financial reporting, as defined in Securities Exchange Act Rule 13a-15(f), that materially affected, or are reasonably likely to materially affect, our internal control over financial reporting.
| |
| ITEM 9B. | OTHER INFORMATION. |
See the information under the following captions in Tyler’s definitive Proxy Statement, which is incorporated herein by reference. Only those sections of the Proxy Statement that specifically address the items set forth herein are incorporated by reference. Such incorporation by reference does not include the Compensation Discussion and Analysis, the Compensation Committee Report or the Audit Committee Report, which are included in the Proxy Statement.
|
| | |
| | | Headings in Proxy Statement |
| | |
ITEM 10. DIRECTORS, EXECUTIVE OFFICERS, AND CORPORATE GOVERNANCE. | | “Tyler Management” and “Corporate Governance Principles and Board Matters” |
| | |
|
| | |
ITEM 11. EXECUTIVE COMPENSATION. | | “Executive Compensation” |
|
| | |
ITEM 12. SECURITY OWNERSHIP OF CERTAIN BENEFICIAL OWNERS AND MANAGEMENT AND RELATED STOCKHOLDER MATTERS. | | “Security Ownership of Certain Beneficial Owners and Management” |
|
| | |
ITEM 13. CERTAIN RELATIONSHIPS AND RELATED TRANSACTIONS, AND DIRECTOR INDEPENDENCE. | | “
"Executive Compensation “Compensation" and “Certain Relationships and Related Transactions” |
|
| | |
ITEM 14. PRINCIPAL ACCOUNTING FEES AND SERVICES. | | |
| The information required under this item may be found under the section captioned “Proposals For Consideration – Proposal Two – Ratification of Our Independent Auditors for Fiscal Year 2017” in our Proxy Statement and is incorporated herein by reference. |
The information required under this item may be found under the section captioned “Proposals For Consideration – Proposal Two – Ratification of Our Independent Auditors for Fiscal Year 2014” in our Proxy Statement and is incorporated herein by reference.
ITEM 15. | EXHIBITS, FINANCIAL STATEMENT SCHEDULES. |
ITEM 15. EXHIBITS, FINANCIAL STATEMENT SCHEDULES.
The following documents are filed as part of this Annual Report:
|
| | | | | | | |
(a) | | (1)(1 | ) | | The financial statements are filed as part of this Annual Report. | | | | |
| | | |
| | | | | | | Page | |
| | | | | | |
| | | F-1 | |
| | | |
| | | | | | |
| | | F-3 | |
| | | |
| | | | | | |
| | | F-4 | |
| | | |
| | | | | | |
| | | F-5 | |
| | | |
| | | | | | |
| | | F-6 | |
| | | |
| | | | | | |
| | | F-7(2 | |
| | | |
| | (2)) | | Financial statement schedules: | | | | |
| | | |
| | | | There are no financial statement schedules filed as part of this Annual Report, since the required information is included in the financial statements, including the notes thereto, or the circumstances requiring inclusion of such schedules are not present. | | | | |
| | | |
| | (3)(3 | ) | | Exhibits | | | | |
| | | |
| | | | Certain of the exhibits to this Annual Report are hereby incorporated by reference, as specified: | | | |
| | |
Exhibit
Number | | Description |
| |
| 3.1 | | Restated Certificate of Incorporation of Tyler Three, as amended through May 14, 1990, and Certificate of Designation of Series A Junior Participating Preferred Stock (filed as Exhibit 3.1 to our Form 10-Q for the quarter ended June 30, 1990, and incorporated by reference herein). |
| |
| 3.2 | | Certificate of Amendment to the Restated Certificate of Incorporation (filed as Exhibit 3.1 to our Form 8-K, dated February 19, 1998, and incorporated by reference herein). |
| |
| 3.3 | | Amended and Restated By-Laws of Tyler Corporation, dated November 4, 1997October 20, 2015 (filed as Exhibit 3.3 to our Form 10-K10-Q for the yearquarter ended December 31, 1997,September 30, 2015, and incorporated by reference herein). |
| | |
Exhibit
Number
| | Description
|
| |
| 3.4 | | Certificate of Amendment dated May 19, 1999 to the Restated Certificate of Incorporation (filed as Exhibit 3.4 to our Form 10-K for the year ended December 31, 2000, and incorporated by reference herein). |
| |
| 4.1 | | Specimen of Common Stock Certificate (filed as Exhibit 4.1 to our registration statement no. 33-33505 and incorporated by reference herein). |
| |
| 4.2 | | Credit Agreement dated August 11, 2010,November 16, 2015, among Tyler Technologies, Inc. and Wells Fargo Bank, of America, N. A. as Administrative Agent and other lenders party hereto (filed as Exhibit 4.110.1 to our Form 8-K dated August 12, 2010,November 16, 2015, and incorporated by reference herein). |
| |
10.14.3 | | FormAgreement and Plan of Indemnification Agreement for directorsMerger, dated as of September 30, 2015, by and officersamong Tyler Technologies, Inc., Brinston Acquisition, LLC, New World Systems Corporation, and Larry D. Leinweber, as the Principal Shareholder identified therein and the Shareholders’ Representative identified therein. (filed as Exhibit 10.12.1 to our Form 10-K for the year ended December 31, 20028-K, dated October 1, 2015, and incorporated by reference herein). |
| |
| 10.2 | | Tyler Technologies, Inc. 2010 Stock Option Plan effective as of May 13, 2010 (filed as Exhibit 4.1 to our registration statementno. 333-168499 and incorporated by reference herein). |
| |
| 10.3 | | Employment and Non-Competition Agreement between Tyler Technologies, Inc. and John S. Marr Jr. dated February 5, 2013 (filed as Exhibit 10.3 to our Form 10-K for the year ended December 31, 2012 and incorporated by reference herein). |
|
| | |
Exhibit Number | | Description |
| 10.4 | | Employment and Non-Competition Agreement between Tyler Technologies, Inc. and Dustin R. Womble dated February 5, 2013 (filed as Exhibit 10.4 to our Form 10-K for the year ended December 31, 2012 and incorporated by reference herein). |
| |
| 10.5 | | Employment and Non-Competition Agreement between Tyler Technologies, Inc. and Brian K. Miller dated February 5, 2013 (filed as Exhibit 10.5 to our Form 10-K for the year ended December 31, 2012 and incorporated by reference herein). |
| |
| 10.6 | | Employment and Non-Competition Agreement between Tyler Technologies, Inc. and H. Lynn Moore dated February 5, 2013 (filed as Exhibit 10.6 to our Form 10-K for the year ended December 31, 2012 and incorporated by reference herein). |
| | |
Exhibit
Number
10.7 | | Description
|
| |
10.7 | | Employee Stock Purchase Plan (filed as Exhibit 10.1 to our registration statement 333-182318 dated June 25, 2012 and incorporated by reference herein). |
| |
*23 *23 | | Consent of Independent Registered Public Accounting FirmFirm. |
| |
*31.1 | | Rule 13a-14(a) Certification by Principal Executive Officer. |
| |
*31.2 | | Rule 13a-14(a) Certification by Principal Financial Officer. |
| |
*32 | | Section 1350 Certification of Principal Executive Officer and Principal Financial Officer. |
*101 | | Instance Document |
*101 | | Schema Document |
*101 | | Calculation Linkbase Document |
*101 | | Labels Linkbase Document |
*101 | | Definition Linkbase Document |
*101 | | Presentation Linkbase Document |
| | |
|
| |
*101 | | Instance Document |
| |
*101 | | Schema Document |
| |
*101 | | Calculation Linkbase Document |
| |
*101 | | Labels Linkbase Document |
| |
*101 | | Definition Linkbase Document |
| |
*101 | | Presentation Linkbase Document— Filed herewith. |
* — Filed herewith.
A copy of each exhibit may be obtained at a price of 15 cents per page, with a $10.00 minimum order, by writing Investor Relations, 5101 Tennyson Parkway, Plano, Texas, 75024.
Pursuant to the requirements of Section 13 or 15(d) of the Securities Exchange Act of 1934, the registrant has duly caused this report to be signed on its behalf by the undersigned, thereunto duly authorized.
|
| | | | |
| | TYLER TECHNOLOGIES, INC. |
| | |
Date: February 19, 201422, 2017 | | By: | | /s/ John S. Marr |
| | | | John S. Marr |
| | | | Chief Executive Officer and PresidentChairman of the Board |
| | | | (principal executive officer) |
Pursuant to the requirements of the Securities Exchange Act of 1934,
this report has been signed below by the following persons on behalf of the registrant and in the capacities and on the dates
indicated.indicated have signed this report below. |
| | | | |
Date: February 19, 201422, 2017 | | By: | | /s/ John S. Marr |
| | | | John S. Marr |
| | | | Chief Executive Officer and President Director
Chairman of the Board |
| | | | Director |
| | | | (principal executive officer) |
| | |
Date: February 19, 201422, 2017 | | By: | | /s/ John M. Yeaman
|
| | | | John M. Yeaman |
| | | | Chairman of the Board |
| | |
Date: February 19, 2014 | | By: | | /s/ Brian K. Miller |
| | | | Brian K. Miller |
| | | | Executive Vice President and Chief Financial Officer |
| | | | (principal financial officer) |
| | |
Date: February 19, 201422, 2017 | | By: | | /s/ W. Michael Smith |
| | | | W. Michael Smith |
| | | | Vice President and Chief Accounting Officer |
| | | | (principal accounting officer) |
| Date: February 22, 2017 | | By: | | /s/ Donald R. Brattain |
| | | | Donald R. Brattain |
| | | | Director |
| Date: February 22, 2017 | | By: | | /s/ Glenn A. Carter |
| | | | Glenn A. Carter |
| | | | Director |
| Date: February 22, 2017 | | By: | | /s/ Brenda A. Cline |
| | | | Brenda A. Cline |
| | | | Director |
|
| | | | |
Date: February 19, 201422, 2017 | | By: | | /s/ Donald R. Brattain
|
| | | | Donald R. Brattain |
| | | | Director |
| | |
Date: February 19, 2014 | | By: | | /s/ J. Luther King |
| | | | J. Luther King |
| | | | Director |
| | |
Date: February 19, 201422, 2017 | | By: | | /s/ G. Stuart Reeves Larry D. Leinweber |
| | | | G. Stuart ReevesLarry D. Leinweber |
| | | | Director |
| | |
Date: February 19, 201422, 2017 | | By: | | /s/ Michael D. Richards Daniel M. Pope |
| | | | Michael D. RichardsDaniel M. Pope |
| | | | Director |
| | |
Date: February 19, 201422, 2017 | | By: | | /s/ Dustin R. Womble R.Womble |
| | | | Dustin R. Womble |
| | | | Director |
| Date: February 22, 2017 | | By: | | /s/ John M. Yeaman |
| | | | John M. Yeaman |
| | | | Director |
REPORT OF INDEPENDENT REGISTERED PUBLIC ACCOUNTING FIRM
The Board of Directors and Shareholders
We have audited Tyler Technologies, Inc.’s internal control over financial reporting as of December 31,
2013,2016, based on criteria established in Internal Control — Integrated Framework issued by the Committee of Sponsoring Organizations of the Treadway Commission
(1992(2013 framework) (the COSO
Criteria)criteria). Tyler Technologies, Inc.’s management is responsible for maintaining effective internal control over financial reporting, and for its assessment of the effectiveness of internal control over financial reporting included in the accompanying “Management’s Report on Internal Control Over Financial Reporting.” Our responsibility is to express an opinion on the company’s internal control over financial reporting based on our audit.
We conducted our audit in accordance with the standards of the Public Company Accounting Oversight Board (United States). Those standards require that we plan and perform the audit to obtain reasonable assurance about whether effective internal control over financial reporting was maintained in all material respects. Our audit included obtaining an understanding of internal control over financial reporting, assessing the risk that a material weakness exists, testing and evaluating the design and operating effectiveness of internal control based on the assessed risk, and performing such other procedures as we considered necessary in the circumstances. We believe that our audit provides a reasonable basis for our opinion.
A company’s internal control over financial reporting is a process designed to provide reasonable assurance regarding the reliability of financial reporting and the preparation of financial statements for external purposes in accordance with generally accepted accounting principles. A company’s internal control over financial reporting includes those policies and procedures that (1) pertain to the maintenance of records that, in reasonable detail, accurately and fairly reflect the transactions and dispositions of the assets of the company; (2) provide reasonable assurance that transactions are recorded as necessary to permit preparation of financial statements in accordance with generally accepted accounting principles, and that receipts and expenditures of the company are being made only in accordance with authorizations of management and directors of the company; and (3) provide reasonable assurance regarding prevention or timely detection of unauthorized acquisition, use, or disposition of the company’s assets that could have a material effect on the financial statements.
Because of its inherent limitations, internal control over financial reporting may not prevent or detect misstatements. Also, projections of any evaluation of effectiveness to future periods are subject to the risk that controls may become inadequate because of changes in conditions, or that the degree of compliance with the policies or procedures may deteriorate.
In our opinion, Tyler Technologies, Inc. maintained, in all material respects, effective internal control over financial reporting as of December 31,
2013,2016, based on the COSO criteria.
We also have audited, in accordance with the standards of the Public Company Accounting Oversight Board (United States), the consolidated balance sheets of Tyler Technologies, Inc. as of December 31,
20132016 and
2012,2015, and the related consolidated statements of comprehensive income, shareholders’ equity, and cash flows for each of the three years in the period ended December 31,
20132016 and our report dated February
19, 201422, 2017 expressed an unqualified opinion thereon.
February 19, 201422, 2017
REPORT OF INDEPENDENT REGISTERED PUBLIC ACCOUNTING FIRM
The Board of Directors and Shareholders
We have audited the accompanying consolidated balance sheets of Tyler Technologies, Inc. as of December 31,
20132016 and
2012,2015, and the related consolidated statements of comprehensive income, shareholders’ equity, and cash flows for each of the three years in the period ended December 31,
2013.2016. These financial statements are the responsibility of the
Company’sCompany's management. Our responsibility is to express an opinion on these financial statements based on our audits.
We conducted our audits in accordance with the standards of the Public Company Accounting Oversight Board (United States). Those standards require that we plan and perform the audit to obtain reasonable assurance about whether the financial statements are free of material misstatement. An audit includes examining, on a test basis, evidence supporting the amounts and disclosures in the financial statements. An audit also includes assessing the accounting principles used and significant estimates made by management, as well as evaluating the overall financial statement presentation. We believe that our audits provide a reasonable basis for our opinion.
In our opinion, the financial statements referred to above present fairly, in all material respects, the financial position of Tyler Technologies, Inc. at December 31,
20132016 and
2012,2015, and the
consolidated results of its operations and its cash flows for each of the three years in the period ended December 31,
2013,2016, in conformity with U.S. generally accepted accounting principles.
As discussed in Note 1 to the consolidated financial statements, the Company has adopted ASU 2016-09 Compensation-Stock Compensation (Topic 718): Improvements to Employee Share-Based Payment Accounting.
We also have audited, in accordance with the standards of the Public Company Accounting Oversight Board (United States), Tyler Technologies, Inc.’s internal control over financial reporting as of December 31,
2013,2016, based on criteria established in Internal Control—Integrated Framework issued by the Committee of Sponsoring Organizations of the Treadway Commission
(1992(2013 framework) and our report dated February
19, 201422, 2017 expressed an unqualified opinion thereon.
February 19, 201422, 2017
Consolidated Statements of Comprehensive Income
For the years ended December 31
(In thousands, except per share amounts)
| | | | | | | | | | | | |
| | | 2013 | | | 2012 | | | 2011 | |
Revenues: | | | | | | | | | | | | |
Software licenses and royalties | | $ | 40,841 | | | $ | 33,928 | | | $ | 32,594 | |
Subscriptions | | | 61,864 | | | | 44,618 | | | | 31,160 | |
Software services | | | 93,267 | | | | 83,408 | | | | 69,617 | |
Maintenance | | | 191,720 | | | | 171,851 | | | | 146,498 | |
Appraisal services | | | 20,825 | | | | 22,543 | | | | 23,228 | |
Hardware and other | | | 8,126 | | | | 6,956 | | | | 6,294 | |
| | | | | | | | | | | | |
Total revenues | | | 416,643 | | | | 363,304 | | | | 309,391 | |
Cost of revenues: | | | | | | | | | | | | |
Software licenses and royalties | | | 2,377 | | | | 1,983 | | | | 3,034 | |
Acquired software | | | 2,078 | | | | 1,888 | | | | 1,125 | |
Software services, maintenance and subscriptions | | | 199,617 | | | | 171,584 | | | | 143,776 | |
Appraisal services | | | 13,809 | | | | 14,889 | | | | 14,550 | |
Hardware and other | | | 5,559 | | | | 5,258 | | | | 4,994 | |
| | | | | | | | | | | | |
Total cost of revenues | | | 223,440 | | | | 195,602 | | | | 167,479 | |
| | | | | | | | | | | | |
Gross profit | | | 193,203 | | | | 167,702 | | | | 141,912 | |
Selling, general and administrative expenses | | | 98,289 | | | | 86,706 | | | | 75,650 | |
Research and development expense | | | 23,269 | | | | 20,140 | | | | 16,414 | |
Amortization of customer and trade name intangibles | | | 4,517 | | | | 4,279 | | | | 3,331 | |
| | | | | | | | | | | | |
Operating income | | | 67,128 | | | | 56,577 | | | | 46,517 | |
Other expense, net | | | 1,309 | | | | 2,709 | | | | 2,404 | |
| | | | | | | | | | | | |
Income before income taxes | | | 65,819 | | | | 53,868 | | | | 44,113 | |
Income tax provision | | | 26,718 | | | | 20,874 | | | | 16,556 | |
| | | | | | | | | | | | |
Net income | | $ | 39,101 | | | $ | 32,994 | | | $ | 27,557 | |
| | | | | | | | | | | | |
Earnings per common share: | | | | | | | | | | | | |
Basic | | $ | 1.23 | | | $ | 1.09 | | | $ | 0.88 | |
| | | | | | | | | | | | |
Diluted | | $ | 1.13 | | | $ | 1.00 | | | $ | 0.83 | |
| | | | | | | | | | | | |
Unrealized gains (losses) on investment securities available-for-sale | | $ | 341 | | | $ | 134 | | | $ | (123 | ) |
Income tax expense (benefit) related to components of other comprehensive income (loss) | | | 119 | | | | 47 | | | | (43 | ) |
| | | | | | | | | | | | |
Other comprehensive income (loss), net of tax | | $ | 222 | | | $ | 87 | | | $ | (80 | ) |
| | | | | | | | | | | | |
Comprehensive income | | $ | 39,323 | | | $ | 33,081 | | | $ | 27,477 | |
| | | | | | | | | | | | |
|
| | | | | | | | | | | |
| | 2016 | | 2015 | | 2014 |
| Revenues: | | | | | |
| Software licenses and royalties | $ | 74,306 |
| | $ | 59,008 |
| | $ | 49,065 |
|
| Subscriptions | 142,704 |
| | 111,933 |
| | 87,848 |
|
| Software services | 174,804 |
| | 139,852 |
| | 113,821 |
|
| Maintenance | 322,969 |
| | 245,537 |
| | 212,696 |
|
| Appraisal services | 26,287 |
| | 25,065 |
| | 21,802 |
|
| Hardware and other | 14,973 |
| | 9,627 |
| | 7,869 |
|
| Total revenues | 756,043 |
| | 591,022 |
| | 493,101 |
|
| | | | | | |
| Cost of revenues: | | | | | |
| Software licenses and royalties | 2,964 |
| | 1,632 |
| | 1,900 |
|
| Acquired software | 22,235 |
| | 4,440 |
| | 1,858 |
|
| Software services, maintenance and subscriptions | 348,939 |
| | 285,340 |
| | 236,363 |
|
| Appraisal services | 16,411 |
| | 15,922 |
| | 14,284 |
|
| Hardware and other | 10,143 |
| | 6,501 |
| | 5,325 |
|
| Total cost of revenues | 400,692 |
| | 313,835 |
| | 259,730 |
|
| | | | | | |
| Gross profit | 355,351 |
| | 277,187 |
| | 233,371 |
|
| | | | | | |
| Selling, general and administrative expenses | 167,161 |
| | 133,317 |
| | 108,260 |
|
| Research and development expense | 43,154 |
| | 29,922 |
| | 25,743 |
|
| Amortization of customer and trade name intangibles | 13,731 |
| | 5,905 |
| | 4,546 |
|
| | | | | | |
| Operating income | 131,305 |
| | 108,043 |
| | 94,822 |
|
| | | | | | |
| Other (expense) income, net | (1,998 | ) | | 381 |
| | (355 | ) |
| Income before income taxes | 129,307 |
| | 108,424 |
| | 94,467 |
|
| Income tax provision | 19,450 |
| | 43,555 |
| | 35,527 |
|
| Net income | $ | 109,857 |
| | $ | 64,869 |
| | $ | 58,940 |
|
| | | | | | |
| Earnings per common share: | | | | | |
| Basic | $ | 3.01 |
| | $ | 1.90 |
| | $ | 1.79 |
|
| Diluted | $ | 2.82 |
| | $ | 1.77 |
| | $ | 1.66 |
|
| | | | | | |
Consolidated Balance Sheets
(In thousands, except par value and share amounts)
| | | | | | | | |
| | | December 31,
2013 | | | December 31,
2012 | |
ASSETS | | | | | | | | |
Current assets: | | | | | | | | |
Cash and cash equivalents | | $ | 78,876 | | | $ | 6,406 | |
Accounts receivable (less allowance for losses of $1,113 in 2013 and $1,621 in 2012) | | | 106,570 | | | | 99,212 | |
Prepaid expenses | | | 13,522 | | | | 9,000 | |
Income tax receivable | | | 9,721 | | | | 406 | |
Other current assets | | | 787 | | | | 1,074 | |
Deferred income taxes | | | 7,759 | | | | 5,955 | |
| | | | | | | | |
Total current assets | | | 217,235 | | | | 122,053 | |
Accounts receivable, long-term portion | | | 588 | | | | 1,187 | |
Property and equipment, net | | | 64,844 | | | | 45,381 | |
Non-current investments available-for-sale | | | 1,288 | | | | 2,037 | |
Other assets: | | | | | | | | |
Goodwill | | | 121,011 | | | | 121,011 | |
Other intangibles, net | | | 38,986 | | | | 45,800 | |
Sundry | | | 536 | | | | 1,197 | |
| | | | | | | | |
| | $ | 444,488 | | | $ | 338,666 | |
| | | | | | | | |
LIABILITIES AND SHAREHOLDERS’ EQUITY | | | | | | | | |
Current liabilities: | | | | | | | | |
Accounts payable | | $ | 2,533 | | | $ | 3,167 | |
Accrued liabilities | | | 32,839 | | | | 26,018 | |
Deferred revenue | | | 156,738 | | | | 140,550 | |
| | | | | | | | |
Total current liabilities | | | 192,110 | | | | 169,735 | |
Revolving line of credit | | | — | | | | 18,000 | |
Deferred income taxes | | | 6,059 | | | | 5,632 | |
Commitments and contingencies | | | | | | | | |
Shareholders’ equity: | | | | | | | | |
Preferred stock, $10.00 par value; 1,000,000 shares authorized, none issued | | | — | | | | — | |
Common stock, $0.01 par value; 100,000,000 shares authorized; 48,147,969 shares issued in 2013 and 2012 | | | 481 | | | | 481 | |
Additional paid-in capital | | | 182,176 | | | | 154,018 | |
Accumulated other comprehensive loss, net of tax | | | (46 | ) | | | (268 | ) |
Retained earnings | | | 202,210 | | | | 163,109 | |
Treasury stock, at cost; 15,309,940 and 16,816,903 shares in 2013 and 2012, respectively | | | (138,502 | ) | | | (172,041 | ) |
| | | | | | | | |
Total shareholders’ equity | | | 246,319 | | | | 145,299 | |
| | | | | | | | |
| | $ | 444,488 | | | $ | 338,666 | |
| | | | | | | | |
|
| | | | | | | |
| | December 31, 2016 | | December 31, 2015 |
| ASSETS | | | |
| Current assets: | | | |
| Cash and cash equivalents | $ | 36,151 |
| | $ | 33,087 |
|
| Accounts receivable (less allowance for losses of $3,396 in 2016 and $1,640 in 2015) | 200,334 |
| | 176,360 |
|
| Short-term investments | 20,273 |
| | 13,423 |
|
| Prepaid expenses | 21,039 |
| | 22,334 |
|
| Income tax receivable | 2,895 |
| | 21,080 |
|
| Other current assets | 2,268 |
| | 1,931 |
|
| Total current assets | 282,960 |
| | 268,215 |
|
| | | | |
| Accounts receivable, long-term | 2,480 |
| | 2,777 |
|
| Property and equipment, net | 124,268 |
| | 101,112 |
|
| Other assets: | | | |
| Goodwill | 650,237 |
| | 653,666 |
|
| Other intangibles, net | 267,259 |
| | 295,378 |
|
| Cost method investment | 15,000 |
| | 15,000 |
|
| Non-current investments and other assets | 15,741 |
| | 20,422 |
|
| | $ | 1,357,945 |
| | $ | 1,356,570 |
|
| | | | |
| LIABILITIES AND SHAREHOLDERS' EQUITY | | | |
| Current liabilities: | | | |
| Accounts payable | $ | 7,295 |
| | $ | 6,789 |
|
| Accrued liabilities | 55,989 |
| | 49,156 |
|
| Deferred revenue | 298,217 |
| | 281,627 |
|
| Total current liabilities | 361,501 |
| | 337,572 |
|
| | | | |
| Revolving line of credit | 10,000 |
| | 66,000 |
|
| Deferred revenue, long-term | 2,140 |
| | 3,115 |
|
| Deferred income taxes | 68,779 |
| | 91,026 |
|
| | | | |
| Commitments and contingencies |
| |
|
| | | | |
| Shareholders' equity: |
| |
|
| Preferred stock, $10.00 par value; 1,000,000 shares authorized; none issued | — |
| | — |
|
Common stock, $0.01 par value; 100,000,000 shares authorized; 48,147,969 shares issued in 2016 and 2015 | 481 |
| | 481 |
|
| Additional paid-in capital | 556,663 |
| | 607,755 |
|
| Accumulated other comprehensive loss, net of tax | (46 | ) | | (46 | ) |
| Retained earnings | 435,876 |
| | 326,019 |
|
| Treasury stock, at cost; 11,381,733 and 11,373,666 shares in 2016 and 2015, respectively | (77,449 | ) | | (75,352 | ) |
| Total shareholders' equity | 915,525 |
| | 858,857 |
|
| | $ | 1,357,945 |
| | $ | 1,356,570 |
|
Consolidated Statements of Shareholders’ Equity
For the years ended December 31, 2013, 20122016, 2015 and 20112014
(In thousands | | | | | | | | | | | | | | | | | | | | | | | | | | | | | | | | |
| | | | | | | | | | | | Accumulated | | | | | | | | | | | | | |
| | | | | | | | | Additional | | | Other | | | | | | | | | | | | Total | |
| | | Common Stock | | | Paid-in | | | Comprehensive | | | Retained | | | Treasury Stock | | | Shareholders’ | |
| | | Shares | | | Amount | | | Capital | | | Income (Loss) | | | Earnings | | | Shares | | | Amount | | | Equity | |
Balance at December 31, 2010 | | | 48,148 | | | $ | 481 | | | $ | 153,576 | | | $ | (275 | ) | | $ | 102,558 | | | | (15,854 | ) | | $ | (149,368 | ) | | $ | 106,972 | |
Net Income | | | — | | | | — | | | | — | | | | — | | | | 27,557 | | | | — | | | | — | | | | 27,557 | |
Unrealized loss on investment securities, net of tax | | | — | | | | — | | | | — | | | | (80 | ) | | | — | | | | — | | | | — | | | | (80 | ) |
Issuance of shares pursuant to stock compensation plan | | | — | | | | — | | | | (10,352 | ) | | | — | | | | — | | | | 582 | | | | 13,905 | | | | 3,553 | |
Stock compensation | | | — | | | | — | | | | 6,253 | | | | — | | | | — | | | | — | | | | — | | | | 6,253 | |
Treasury stock purchases | | | — | | | | — | | | | — | | | | — | | | | — | | | | (3,004 | ) | | | (71,802 | ) | | | (71,802 | ) |
Issuance of shares pursuant to Employee Stock Purchase Plan | | | — | | | | — | | | | (230 | ) | | | — | | | | — | | | | 100 | | | | 2,275 | | | | 2,045 | |
Federal income tax benefit related to exercise of stock options | | | — | | | | — | | | | 3,612 | | | | — | | | | — | | | | — | | | | — | | | | 3,612 | |
| | | | | | | | | | | | | | | | | | | | | | | | | | | | | | | | |
Balance at December 31, 2011 | | | 48,148 | | | | 481 | | | | 152,859 | | | | (355 | ) | | | 130,115 | | | | (18,176 | ) | | | (204,990 | ) | | | 78,110 | |
Net Income | | | — | | | | — | | | | — | | | | — | | | | 32,994 | | | | — | | | | — | | | | 32,994 | |
Unrealized gain on investment securities, net of tax | | | — | | | | — | | | | — | | | | 87 | | | | — | | | | — | | | | — | | | | 87 | |
Issuance of shares pursuant to stock compensation plan | | | — | | | | — | | | | (17,018 | ) | | | — | | | | — | | | | 1,218 | | | | 29,461 | | | | 12,443 | |
Stock compensation | | | — | | | | — | | | | 7,411 | | | | — | | | | — | | | | — | | | | — | | | | 7,411 | |
Issuance of shares pursuant to Employee Stock Purchase Plan | | | — | | | | — | | | | 639 | | | | — | | | | — | | | | 81 | | | | 2,002 | | | | 2,641 | |
Federal income tax benefit related to exercise of stock options | | | — | | | | — | | | | 8,798 | | | | — | | | | — | | | | — | | | | — | | | | 8,798 | |
Issuance of shares for acquisition | | | — | | | | — | | | | 1,329 | | | | — | | | | — | | | | 60 | | | | 1,486 | | | | 2,815 | |
| | | | | | | | | | | | | | | | | | | | | | | | | | | | | | | | |
Balance at December 31, 2012 | | | 48,148 | | | | 481 | | | | 154,018 | | | | (268 | ) | | | 163,109 | | | | (16,817 | ) | | | (172,041 | ) | | | 145,299 | |
Net Income | | | — | | | | — | | | | — | | | | — | | | | 39,101 | | | | — | | | | — | | | | 39,101 | |
Unrealized gain on investment securities, net of tax | | | — | | | | — | | | | — | | | | 222 | | | | — | | | | — | | | | — | | | | 222 | |
Issuance of shares pursuant to stock compensation plan | | | — | | | | — | | | | (13,742 | ) | | | — | | | | — | | | | 1,443 | | | | 32,031 | | | | 18,289 | |
Stock compensation | | | — | | | | — | | | | 11,653 | | | | — | | | | — | | | | — | | | | — | | | | 11,653 | |
Issuance of shares pursuant to Employee Stock Purchase Plan | | | — | | | | — | | | | 2,034 | | | | — | | | | — | | | | 64 | | | | 1,508 | | | | 3,542 | |
Federal income tax benefit related to exercise of stock options | | | — | | | | — | | | | 28,213 | | | | — | | | | — | | | | — | | | | — | | | | 28,213 | |
| | | | | | | | | | | | | | | | | | | | | | | | | | | | | | | | |
Balance at December 31, 2013 | | | 48,148 | | | $ | 481 | | | $ | 182,176 | | | $ | (46 | ) | | $ | 202,210 | | | | (15,310 | ) | | $ | (138,502 | ) | | $ | 246,319 | |
| | | | | | | | | | | | | | | | | | | | | | | | | | | | | | | | |
thousands)
|
| | | | | | | | | | | | | | | | | | | | | | | | | | | | | |
| | Common Stock | | Additional Paid-in Capital | | Accumulated Other Comprehensive Income (Loss) | | Retained Earnings | | Treasury Stock | | Total Shareholders' Equity |
| | Shares | | Amount | | | | | Shares | | Amount | |
| Balance at December 31, 2013 | 48,148 |
| | $ | 481 |
| | $ | 182,176 |
| | $ | (46 | ) | | $ | 202,210 |
| | (15,310 | ) | | $ | (138,502 | ) | | $ | 246,319 |
|
| Net income | — |
| | — |
| | — |
| | — |
| | 58,940 |
| | — |
| | — |
| | 58,940 |
|
| Issuance of shares pursuant to stock compensation plan | — |
| | — |
| | (17,449 | ) | | — |
| | — |
| | 855 |
| | 32,129 |
| | 14,680 |
|
| Stock compensation | — |
| | — |
| | 14,819 |
| | — |
| | — |
| | — |
| | — |
| | 14,819 |
|
| Issuance of shares pursuant to employee stock purchase plan | — |
| | — |
| | 2,235 |
| | — |
| | — |
| | 53 |
| | 1,909 |
| | 4,144 |
|
| Federal income tax benefit related to exercise of stock options | — |
| | — |
| | 19,415 |
| | — |
| | — |
| | — |
| | — |
| | 19,415 |
|
| Treasury stock purchases | — |
| | — |
| | — |
| | — |
| | — |
| | (294 | ) | | (22,817 | ) | | (22,817 | ) |
| Issuance of shares for acquisition | — |
| | — |
| | 193 |
| | — |
| | — |
| | 17 |
| | 1,280 |
| | 1,473 |
|
| Balance at December 31, 2014 | 48,148 |
| | 481 |
| | 201,389 |
| | (46 | ) | | 261,150 |
| | (14,679 | ) | | (126,001 | ) | | 336,973 |
|
| Net income | — |
| | — |
| | — |
| | — |
| | 64,869 |
| | — |
| | — |
| | 64,869 |
|
| Issuance of shares pursuant to stock compensation plan | — |
| | — |
| | 4,332 |
| | — |
| | — |
| | 1,118 |
| | 18,828 |
| | 23,160 |
|
| Stock compensation | — |
| | — |
| | 20,182 |
| | — |
| | — |
| | — |
| | — |
| | 20,182 |
|
| Issuance of shares pursuant to employee stock purchase plan | — |
| | — |
| | 3,879 |
| | — |
| | — |
| | 43 |
| | 792 |
| | 4,671 |
|
| Federal income tax benefit related to exercise of stock options | — |
| | — |
| | 45,314 |
| | — |
| | — |
| | — |
| | — |
| | 45,314 |
|
| Treasury stock purchases | — |
| | — |
| | — |
| | — |
| | — |
| | (5 | ) | | (645 | ) | | (645 | ) |
| Issuance of shares for acquisition | — |
| | — |
| | 332,659 |
| | — |
| | — |
| | 2,149 |
| | 31,674 |
| | 364,333 |
|
| Balance at December 31, 2015 | 48,148 |
| | 481 |
| | 607,755 |
| | (46 | ) | | 326,019 |
| | (11,374 | ) | | (75,352 | ) | | 858,857 |
|
| Net income | — |
| | — |
| | — |
| | — |
| | 109,857 |
| | — |
| | — |
| | 109,857 |
|
| Issuance of shares pursuant to stock compensation plan | — |
| | — |
| | (82,273 | ) | | — |
| | — |
| | 827 |
| | 105,800 |
| | 23,527 |
|
| Stock compensation | — |
| | — |
| | 29,747 |
| | — |
| | — |
| | — |
| | — |
| | 29,747 |
|
| Issuance of shares pursuant to employee stock purchase plan | — |
| | — |
| | 1,434 |
| | — |
| | — |
| | 47 |
| | 4,802 |
| | 6,236 |
|
| Treasury stock purchases | — |
| | — |
| | — |
| | — |
| | — |
| | (882 | ) | | (112,699 | ) | | (112,699 | ) |
| Balance at December 31, 2016 | 48,148 |
| | $ | 481 |
| | $ | 556,663 |
| | $ | (46 | ) | | $ | 435,876 |
| | (11,382 | ) | | $ | (77,449 | ) | | $ | 915,525 |
|
Consolidated Statements of Cash Flows
For the years ended December 31
(In thousands)
| | | | | | | | | | | | |
| | | 2013 | | | 2012 | | | 2011 | |
Cash flows from operating activities: | | | | | | | | | | | | |
Net income | | $ | 39,101 | | | $ | 32,994 | | | $ | 27,557 | |
Adjustments to reconcile net income to net cash provided by operations: | | | | | | | | | | | | |
Depreciation and amortization | | | 13,786 | | | | 12,711 | | | | 10,676 | |
Share-based compensation expense | | | 11,653 | | | | 7,411 | | | | 6,253 | |
Provision for losses - accounts receivable | | | 729 | | | | 961 | | | | 805 | |
Excess tax benefit from exercises of share-based arrangements | | | (28,207 | ) | | | (8,764 | ) | | | (3,590 | ) |
Deferred income tax benefit | | | (1,497 | ) | | | (215 | ) | | | (2,916 | ) |
Changes in operating assets and liabilities, exclusive of effects of acquired companies: | | | | | | | | | | | | |
Accounts receivable | | | (7,488 | ) | | | (6,825 | ) | | | (8,544 | ) |
Income tax receivable | | | 18,898 | | | | 7,791 | | | | 6,084 | |
Prepaid expenses and other current assets | | | (4,154 | ) | | | 110 | | | | (214 | ) |
Accounts payable | | | (574 | ) | | | (369 | ) | | | 575 | |
Accrued liabilities | | | 7,655 | | | | (530 | ) | | | 4,887 | |
Deferred revenue | | | 16,188 | | | | 13,393 | | | | 14,862 | |
| | | | | | | | | | | | |
Net cash provided by operating activities | | | 66,090 | | | | 58,668 | | | | 56,435 | |
| | | | | | | | | | | | |
Cash flows from investing activities: | | | | | | | | | | | | |
Proceeds from sale of investments | | | 1,090 | | | | 75 | | | | 50 | |
Cost of acquisitions, net of cash acquired | | | (181 | ) | | | (25,680 | ) | | | (17,298 | ) |
Additions to property and equipment | | | (26,858 | ) | | | (9,102 | ) | | | (12,278 | ) |
Decrease (increase) in other | | | 291 | | | | (29 | ) | | | 717 | |
| | | | | | | | | | | | |
Net cash used by investing activities | | | (25,658 | ) | | | (34,736 | ) | | | (28,809 | ) |
| | | | | | | | | | | | |
Cash flows from financing activities: | | | | | | | | | | | | |
(Decrease) increase in net borrowings on revolving line of credit | | | (18,000 | ) | | | (42,700 | ) | | | 34,200 | |
Purchase of treasury shares | | | — | | | | — | | | | (71,802 | ) |
Contributions from employee stock purchase plan | | | 3,542 | | | | 2,641 | | | | 2,045 | |
Proceeds from exercise of stock options | | | 18,289 | | | | 12,443 | | | | 3,553 | |
Excess tax benefit from exercises of share-based arrangements | | | 28,207 | | | | 8,764 | | | | 3,590 | |
| | | | | | | | | | | | |
Net cash provided (used) by financing activities | | | 32,038 | | | | (18,852 | ) | | | (28,414 | ) |
| | | | | | | | | | | | |
Net increase (decrease) in cash and cash equivalents | | | 72,470 | | | | 5,080 | | | | (788 | ) |
Cash and cash equivalents at beginning of period | | | 6,406 | | | | 1,326 | | | | 2,114 | |
| | | | | | | | | | | | |
Cash and cash equivalents at end of period | | $ | 78,876 | | | $ | 6,406 | | | $ | 1,326 | |
| | | | | | | | | | | | |
|
| | | | | | | | | | | |
| | 2016 | | 2015 | | 2014 |
| Cash flows from operating activities: | | | | | |
| Net income | $ | 109,857 |
| | $ | 64,869 |
| | $ | 58,940 |
|
| Adjustments to reconcile net income to cash provided by operations: | | | | | |
| Depreciation and amortization | 50,301 |
| | 19,574 |
| | 14,605 |
|
| Share-based compensation expense | 29,747 |
| | 20,182 |
| | 14,819 |
|
| Provision for losses - accounts receivable | 4,484 |
| | 1,756 |
| | 1,897 |
|
| Deferred income tax benefit | (28,939 | ) | | (7,956 | ) | | (3,804 | ) |
Changes in operating assets and liabilities, exclusive of effects of acquired companies: | | | | | |
| Accounts receivable | (30,227 | ) | | (28,172 | ) | | (8,912 | ) |
| Income tax receivable | 18,185 |
| | 24,255 |
| | 29,117 |
|
| Prepaid expenses and other current assets | 2,229 |
| | (3,054 | ) | | (3,696 | ) |
| Accounts payable | 387 |
| | 652 |
| | 1,586 |
|
| Accrued liabilities | 10,717 |
| | 490 |
| | 6,326 |
|
| Deferred revenue | 25,118 |
| | 41,731 |
| | 31,961 |
|
| Net cash provided by operating activities | 191,859 |
| | 134,327 |
| | 142,839 |
|
| | | | | | |
| Cash flows from investing activities: | | | | | |
| Cost of acquisitions, net of cash acquired | (9,394 | ) | | (339,961 | ) | | (3,242 | ) |
| Purchase of cost method investment | — |
| | (15,000 | ) | | — |
|
| Purchase of marketable security investments | (20,316 | ) | | (31,907 | ) | | — |
|
| Proceeds from marketable security investments | 16,837 |
| | 900 |
| | 808 |
|
| Additions to property and equipment | (37,726 | ) | | (12,501 | ) | | (9,343 | ) |
| (Increase) decrease in other | (121 | ) | | 10 |
| | 222 |
|
| Net cash used by investing activities | (50,720 | ) | | (398,459 | ) | | (11,555 | ) |
| | | | | | |
| Cash flows from financing activities: | | | | | |
| (Decrease) increase in net borrowings on revolving line of credit | (56,000 | ) | | 66,000 |
| | — |
|
| Purchase of treasury shares | (111,838 | ) | | (645 | ) | | (22,817 | ) |
| Contributions from employee stock purchase plan | 6,236 |
| | 4,671 |
| | 4,144 |
|
| Proceeds from exercise of stock options | 23,527 |
| | 23,160 |
| | 14,680 |
|
| Debt issuance costs | — |
| | (2,134 | ) | | — |
|
| Net cash (used) provided by financing activities | (138,075 | ) | | 91,052 |
| | (3,993 | ) |
| | | | | | |
| Net increase (decrease) in cash and cash equivalents | 3,064 |
| | (173,080 | ) | | 127,291 |
|
| Cash and cash equivalents at beginning of period | 33,087 |
| | 206,167 |
| | 78,876 |
|
| Cash and cash equivalents at end of period | $ | 36,151 |
| | $ | 33,087 |
| | $ | 206,167 |
|
Notes to Consolidated Financial Statements
(Tables in thousands, except per share data)
(1)SUMMARY OF SIGNIFICANT ACCOUNTING POLICIES We provide integrated software systems and related services for the public sector, with a focus on local governments. We develop and market a broad line of software solutions and services to address the information technology (“IT”) needs of cities, counties, schools and other local government entities. In addition, we provide professional IT services, including software and hardware installation, data conversion, training, and for certain customers, product modifications, along with continuing maintenance and support for customers using our systems. We also provide subscription-based services such as software as a service (“SaaS”) arrangements, which utilize the Tyler private cloud, and electronic document filing solutions (“e-filing”). In addition, we
also provide property appraisal outsourcing services for taxing jurisdictions.
PRINCIPLES OF CONSOLIDATION
The consolidated financial statements include our parent company and a subsidiary, which is wholly-owned. All significant intercompany balances and transactions have been eliminated in consolidation.
Comprehensive income (loss) is defined as the change in equity of a business enterprise during a period from transactions, and other events and circumstances from non-owner sources and includes all components of net income (loss) and other comprehensive income (loss). We had no items of other comprehensive income (loss) during the years ended December 31, 2016, 2015 and 2014.
CASH AND CASH EQUIVALENTS
Cash
in excess of that necessary for operating requirements is invested in short-term, highly liquid, income-producing investments. Investments with original maturities of three months or less are classified as cash and cash equivalents,
which primarily consist of cash on deposit with
a bank.several banks and money market funds. Cash and cash equivalents are stated at cost, which approximates market value.
INVESTMENTS
Investments consist of auction rate municipal securities. These investments are classified as available-for-sale securities and are stated at fair value in accordance with Accounting Standards Codification (“ASC”) 820, Fair Value Measurements and Disclosures. Unrealized holding gains and losses, net of the related tax effect, if any, are not reflected in earnings but are reported as a separate component of accumulated other comprehensive income until realized. The cost basis of securities sold is the specific cost of the auction rate municipal security. We account for the transactions as “proceeds from sales of investments” for the security relinquished, and a “purchases of investments” for the security purchased, in the accompanying Consolidated Statements of Cash Flows.
We earn revenue from software licenses, royalties,
subscriptions,subscription-based services, software services, post-contract customer support (“PCS” or “maintenance”), hardware, and appraisal services.
For the majority of our software arrangements, we provide services that range from installation, training, and basic consulting to software modification and customization to meet specific customer needs. If the arrangement does not require significant production, modification or customization or where the software services are not considered essential to the functionality of the software, revenue is recognized when all of the following conditions are
met: | i. | persuasive evidence of an arrangement exists; |
| ii. | delivery has occurred; |
| iii. | our fee is fixed or determinable; and |
| iv. | collectability is probable. |
met
persuasive evidence of an arrangement exists
delivery has occurred
our fee is fixed or determinable
collectability is probable
For multiple element arrangements, each element of the arrangement is analyzed and we allocate a portion of the total arrangement fee to the elements based on the relative fair value of the element using vendor-specific objective evidence of fair value (“VSOE”), regardless of any separate prices stated within the contract for each element. Fair value is considered the price a customer would be required to pay if the element was sold separately based on our historical experience of stand-alone sales of these elements to
thirdparties.third-parties. For PCS, we use renewal rates for continued support arrangements to determine fair value. For software services, we use the fair value we charge our customers when those services are sold separately. We monitor our transactions to determine that we maintain and periodically revise VSOE to reflect fair value. In software arrangements in which we have the fair value of all undelivered elements but not of a delivered element, we apply the “residual method,” in compliance with ASCAccounting Standards Codification (“ASC”) 985-605, Software Revenue Recognition. Under the residual method, if the fair value of all undelivered elements is determinable, the fair value of the undelivered elements is deferred and the remaining portion of the arrangement fee is allocated to the delivered element(s) and is recognized as revenue assuming the other revenue recognition criteria are met. In software arrangements in which we do not have VSOE for all undelivered elements, revenue is deferred until fair value is determined or all elements for which we do not have VSOE have been delivered. Alternatively, if sufficient VSOE does not exist and the only undelivered element is
services that do not involve significant modification or customization of the software, the entire fee is recognized over the period during which the services are expected to be performed.
Software Licenses and Royalties
We recognize the revenue allocable to software licenses and specified upgrades upon delivery of the software product or upgrade to the customer, unless the fee is not fixed or determinable or collectability is not probable. If the fee is not fixed or determinable, software license revenue is generally recognized as payments become due from the customer. If collectability is not considered probable, revenue is recognized when the fee is collected. Arrangements that include software services, such as training or installation, are evaluated to determine whether those services are essential to the product’s functionality.
A majority of our software arrangements involve “off-the-shelf” software. We consider software to be off-the-shelf software if it can be added to an arrangement with minor changes in the underlying code and it can be used by the customer for the customer’s purpose upon installation. For off-the-shelf software arrangements, we recognize the software license fee as revenue after delivery has occurred, customer acceptance is reasonably assured, that portion of the fee represents a non-refundable enforceable claim and is probable of collection, and the remaining services such as training are not considered essential to the product’s functionality.
For arrangements that involve significant production, modification or customization of the software, or where software services are otherwise considered essential, we recognize revenue using contract accounting and apply the provisions of the Construction
– Typetype and Production
– Typetype Contracts as discussed in ASC
605-35, Multiple Elements Arrangements.605-35. We generally use the percentage-of-completion method to recognize revenue from these arrangements. We measure progress-to-completion primarily using labor hours incurred, or value added. The percentage-of-completion method generally results in the recognition of reasonably consistent profit margins over the life of a contract because we have the ability to produce reasonably dependable estimates of contract billings and contract costs. We use the level of profit margin that is most likely to occur on a contract. If the most likely profit margin cannot be precisely determined, the lowest probable level of profit
margin in the range of estimates is used until the results can be estimated more precisely. These arrangements are often implemented over an extended time period and occasionally require us to revise total cost estimates. Amounts recognized in revenue are calculated using the progress-to-completion measurement after giving effect to any changes in our cost estimates. Changes to total estimated contract costs, if any, are recorded in the period they are determined. Estimated losses on uncompleted contracts are recorded in the period in which we first determine that a loss is apparent. For arrangements that include new product releases for which it is difficult to estimate final profitability except to assume that no loss will ultimately be incurred, we recognize revenue under the completed contract method. Under the completed contract method, revenue is recognized only when a contract is completed or substantially complete. Historically these amounts have been immaterial.
We recognize royalty revenue when earned under the terms of our third party royalty arrangements, provided the fees are considered fixed or determinable and realization of payment is probable. Currently, our third party royalties are variable in nature and such amounts are not considered fixed or determinable until we receive notice of amounts earned. Typically, we receive notice of royalty revenues earned on a quarterly basis in the immediate quarter following the royalty reporting period. Some of our software arrangements include services considered essential for the customer to use the software for the customer’s purposes. For these software arrangements, both the software license revenue and the services revenue are recognized as the services are performed using the percentage-of-completion contract accounting method. When software services are not considered essential, the fee allocable to the service element is recognized as revenue as we perform the services.
Computer Hardware Equipment
Revenue allocable to computer hardware equipment is recognized when we deliver the equipment and collection is probable.
Post contract
Post-Contract Customer Support
Our customers generally enter into PCS agreements when they purchase our software licenses. PCS includes telephone support, bug fixes, and rights to upgrades on a when-and-if available basis. Our PCS agreements are typically renewable annually. Revenue allocated to PCS is recognized on a straight-line basis over the period the PCS is provided. All significant costs and expenses associated with PCS are expensed as incurred.
Subscription-Based Services:
Subscription-based services consist of revenues derived from SaaS arrangements, which utilize the Tyler private cloud, and electronic filing transactions.
For SaaS arrangements, we evaluate whether the customer has the contractual right to take possession of our software at any time during the hosting period without significant penalty and whether the customer can feasibly maintain the software on the customer’s hardware or enter into another arrangement with a
third partythird-party to host the software. In cases where the customer has the contractual right to take possession of our software at any time during the hosting period without significant penalty and the customer can feasibly maintain the software on the customer’s hardware or enter into another arrangement with a
third partythird-party to host the software, we recognize the license, professional services and hosting services revenues pursuant to ASC 985-605, Software Revenue Recognition.
For SaaS arrangements that do not meet the criteria for recognition under ASC 985-605, we account for the elements under ASC 605-25, Multiple Element Arrangements, using all applicable facts and circumstances, including whether (i) the element has stand-alone value, (ii) there is a general right of return and (iii) the revenue is contingent on delivery of other elements. We allocate contract value to each element of the arrangement that qualifies for treatment as a separate element based on VSOE, and if VSOE is not available,
third partythird-party evidence, and if
third partythird-party evidence is unavailable, estimated selling price. We recognize hosting services ratably over the term of the arrangement, which range from one to 10 years but are typically for a period of
threefive to
sixseven years. For professional services associated with SaaS arrangements that we determine do not have stand-alone value to the customer or are contingent on delivery of other elements, we recognize the services revenue ratably over the remaining contractual period once we have provided the customer access to the software and we may begin billing for hosting services. We record amounts that have been invoiced in accounts receivable and in deferred revenue or revenues, depending on whether the revenue recognition criteria have been met.
Electronic filing transaction fees primarily pertain to documents filed with the courts by attorneys and other
third partiesthird-parties via our e-filing services and retrieval of filed documents via our access services. The elements for these arrangements are accounted for under ASC 605-25. For each document filed with a court, the filer generally pays a transaction fee and a court filing fee to us and we remit a portion of the transaction fee and the filing fee to the court. We record as revenue the transaction fee, while the portion of the transaction fee remitted to the courts is recorded as cost of sales as we are acting as a principal in the arrangement. Court filing fees collected on behalf of the courts and remitted to the courts are recorded on a net basis and thus do not affect the statement of comprehensive income. In some cases, we are paid on a fixed fee basis and recognize the revenue ratably over the contractual period.
Costs of performing services under subscription-based arrangements are expensed as incurred, except for certain direct and incremental contract origination and set-up costs associated with SaaS arrangements. Such direct and incremental costs are capitalized and amortized ratably over the related SaaS hosting term.
For our property appraisal projects, we recognize revenue using the proportional performance method of revenue recognition since many of these projects are implemented over one to three year periods and consist of various unique activities. Under this method of revenue recognition, we identify each activity for the appraisal project, with a typical project generally calling for bonding, office set up, training, routing of map information, data entry, data collection, data verification, informal hearings, appeals and project management. Each activity or act is specifically identified and assigned an estimated cost. Costs which are considered to be associated with indirect activities, such as bonding costs and office set up, are expensed as incurred. These costs are typically billed as incurred and are recognized as revenue equal to cost. Direct contract fulfillment activities and related supervisory costs such as data collection, data entry and verification are expensed as incurred. The direct costs for these activities are determined and the total contract value is then allocated to each activity based on a consistent profit margin. Each activity is assigned a consistent unit of measure to determine progress towards completion and revenue is recognized for each activity based upon the percentage complete as applied to the estimated revenue for that activity. Progress for the fulfillment activities is typically based on labor hours or an output measure such as the number of parcel counts completed for that activity. Estimated losses on uncompleted contracts are recorded in the period in which we first determine that a loss is apparent.
Allocation of Revenue in Statements of Comprehensive Income
In our statements of comprehensive income, we allocate revenue to software licenses, software services, maintenance and hardware and other based on the VSOE of fair value for elements in each revenue arrangement and the application of the residual method for arrangements in which we have established VSOE of fair value for all undelivered elements. In arrangements where we are not able to establish VSOE of fair value for all undelivered elements, revenue is first allocated to any undelivered elements for which VSOE of fair value has been established. We then allocate revenue to any undelivered elements for which VSOE of fair value has not been established based upon management’s best estimate of fair value of those undelivered elements and apply a residual method to
determine the license fee. Management’s best estimate of fair value of undelivered elements for which VSOE of fair value has not been established is based upon the VSOE of similar offerings and other objective criteria.
The majority of deferred revenue consists of unearned
support and maintenance revenue that has been billed based on contractual terms in the underlying arrangement with the remaining balance consisting of payments received in advance of revenue being earned under software licensing, subscription-based services, software and appraisal services and hardware installation. Unbilled revenue is not billable at the balance sheet date but is recoverable over the remaining life of the contract through billings made in accordance with contractual agreements. The termination clauses in our contracts generally provide for the payment for the value of products delivered and services performed in the event of an early termination.
Prepaid expenses and other current assets include direct and incremental costs such as commissions associated with arrangements for which revenue recognition has been deferred. Such costs are expensed at the time the related revenue is recognized.
The preparation of our financial statements in conformity with accounting principles generally accepted in the United States (“GAAP”) requires us to make estimates and assumptions that affect the reported amounts of assets and liabilities and disclosure of contingent assets and liabilities at the date of the financial statements and the reported amounts of revenues and expenses during the reporting period. Significant items subject to such estimates and assumptions include the application of the percentage-of-completion and proportional performance methods of revenue recognition, the carrying amount and estimated useful lives of intangible assets, determination of share-based compensation expense and valuation allowance for receivables. Actual results could differ from estimates.
PROPERTY AND EQUIPMENT, NET
Property, equipment and purchased software are recorded at original cost and increased by the cost of any significant improvements after purchase. We expense maintenance and repairs when incurred. Depreciation and amortization is calculated using the straight-line method over the shorter of the asset’s estimated useful life or the term of the lease in the case of leasehold improvements. For income tax purposes, we use accelerated depreciation methods as allowed by tax laws.
RESEARCH AND DEVELOPMENT COSTS
We expensed research and development costs of
$23.3$43.2 million during
2013, $20.12016, $29.9 million during
20122015, and
$16.4$25.7 million during
2011. We reduced our research and development expense by approximately $1.0 million in 2012 and, $3.5 million in 2011, which was the amount earned under the terms of our strategic alliance with a development partner.2014.
Income taxes are accounted for under the asset and liability method. Deferred taxes arise because of different treatment between financial statement accounting and tax accounting, known as “temporary differences.” We record the tax effect of these temporary differences as “deferred tax assets” (generally items that can be used as a tax deduction or credit in the future periods) and “deferred tax liabilities” (generally items that we received a tax deduction for, which have not yet been recorded in the income statement). The deferred tax assets and liabilities are measured using enacted tax rules and laws that are expected to be in effect when the temporary differences are expected to be recovered or settled. A valuation allowance would be established to reduce deferred tax assets if it is more likely than not that a deferred tax asset will not be
realized."realized."
We have a stock option plan that provides for the grant of stock options to key employees, directors and non-employee consultants. Stock options generally vest after three to six years of continuous service from the date of grant and have a contractual term of
ten10 years. We account for share-based compensation utilizing the fair value recognition pursuant to ASC 718, Stock Compensation. See Note
109 – “Share-Based Compensation” for further information.
During fourth quarter of 2016, we adopted Accounting Standards Update ("ASU") No. 2016-09 "Compensation-Stock Compensation (Topic 718): Improvements to Employee Share-Based Payment Accounting," See "New Accounting Pronouncements" below for further information.
GOODWILL AND OTHER INTANGIBLE ASSETS
Goodwill represents the excess of the purchase price over the fair value of net assets acquired, including identifiable intangible assets, in connection with our business combinations. Upon acquisition, goodwill is assigned to the reporting unit that is expected to benefit from the synergies of the business combination, which is the reporting unit to which the related acquired technology is assigned. A reporting unit is the operating segment, or a business unit one level below that operating segment, for which discrete financial information is prepared and regularly reviewed by executive management. We assess goodwill for impairment annually as of April, or more frequently whenever events or changes in circumstances indicate its carrying value may not be recoverable.
When testing goodwill for impairment quantitatively, we first compare the fair value of each reporting unit with its carrying amount. If the carrying amount of a reporting unit exceeds its fair value, a second step is performed to measure the amount of potential impairment. In the second step, we compare the implied fair value of reporting unit goodwill with the carrying amount of the reporting unit’s goodwill. If the carrying amount of reporting unit goodwill exceeds the implied fair value of that goodwill, an impairment loss is recognized. The fair values calculated in our impairment tests are determined using discounted cash flow models involving several assumptions. The assumptions that are used are based upon what we believe a hypothetical marketplace participant would use in estimating fair value. We evaluate the reasonableness of the fair value calculations of our reporting units by comparing the total of the fair value of all of our reporting units to our total market capitalization.
Our annual goodwill impairment analysis, which we performed quantitatively during the second quarter of
2013,2016, did not result in an impairment charge.
We make judgments about the recoverability of purchased intangible assets other than goodwill whenever events or changes in circumstances indicate that an impairment may exist. Customer base
constitutesand acquired software each comprise approximately
80%half of our purchased intangible assets other than goodwill. We review our customer turnover each year for indications of impairment. Our customer turnover has historically been very low.
There have been no significant impairments of intangible assets in any of the periods presented. If indications of impairment are determined to exist, we measure the recoverability of assets by a comparison of the carrying amount of the asset to the estimated undiscounted future cash flows expected to be generated by the asset. If the carrying amount of the assets exceeds their estimated future cash flows, an impairment charge is recognized for the amount by which the carrying amount of the assets exceeds the fair value of the assets.
There have been no significant impairments of intangible assets in any of the periods presented.IMPAIRMENT OF LONG-LIVED ASSETS
We periodically evaluate whether current facts or circumstances indicate that the carrying value of our property and equipment or other long-lived assets to be held and used may not be recoverable. If such circumstances are determined to exist, we measure the recoverability of assets to be held and used by a comparison of the carrying amount of the asset or appropriate grouping of assets and the estimated undiscounted future cash flows expected to be generated by the assets. If the carrying amount of the assets exceeds their estimated future cash flows, an impairment charge is recognized for the amount by which the carrying amount of the assets exceeds the fair value of the assets. Assets to be disposed of would be separately presented in the balance sheet and reported at the lower of the carrying amount or fair value less costs to sell, and are no longer depreciated. The assets and liabilities of a disposed group classified as held for sale would be presented separately in the appropriate asset and liability sections of the balance sheet. There have been no significant impairments of long-lived assets in any of the periods presented.
COSTS OF COMPUTER SOFTWARE
We capitalize software development costs upon the establishment of technological feasibility and prior to the availability of the product for general release to customers. Software development costs primarily consist of personnel costs and rent for related office space. We begin to amortize capitalized costs when a product is available for general release to customers. Amortization expense is determined on a product-by-product basis at a rate not less than straight-line basis over the product’s remaining estimated economic
life, but not to exceed five years.life. We have not capitalized any internal software development costs in any of the periods presented.
FAIR VALUE OF FINANCIAL INSTRUMENTS
Cash and cash equivalents, accounts receivables, accounts payables, short-term obligations and certain other assets at cost approximate fair value because of the short maturity of these instruments.
Our investments available-for-sale are recorded atThe fair
value of our revolving line of credit approximates book value as of December 31,
2013 based upon the level of judgment associated with the inputs used to measure their fair value.2016, because our interest rates reset approximately every 30 days or less. See Note
36 –
“Fair Value“Revolving Line of
Financial Instruments”Credit” for further
information.discussion.
As of December 31, 2016, we have $33.5 million in investment grade corporate and municipal bonds with maturity dates ranging from 2016 through mid-2018. We intend to hold these bonds to maturity and have classified them as such. We believe cost approximates fair value because of the relatively short duration of these investments. The fair values of these securities are considered Level II as they are based on inputs from quoted prices in markets that are not active or from other observable market data. These investments are included in short-term investments and non-current investments and other assets.
As of December 31, 2016, we have $15.0 million invested in convertible preferred stock representing a 20% interest in Record Holdings Pty Limited, a privately held Australian company specializing in digitizing the spoken word in court and legal proceedings. The fair value of this investment is based on valuations using Level III, unobservable inputs that are supported by little or no market value activity and that are significant to the fair value of the investment.
CONCENTRATIONS OF CREDIT RISK AND UNBILLED RECEIVABLES
Financial instruments that potentially subject us to significant concentrations of credit risk consist principally of cash and cash equivalents,
investments available-for-sale and accounts receivable from trade
customers.customers, and investments in marketable securities. Our cash and cash equivalents primarily consists of operating account balances
and money market funds, which are maintained at
oneseveral major
domestic financial
institutioninstitutions and the balances often exceed insured amounts. As of December 31,
20132016, we had cash and cash equivalents of
$78.9$36.2 million. We perform periodic evaluations of the credit standing of
thisthese financial
institution.institutions.
Concentrations of credit risk with respect to receivables are limited due to the size and geographical diversity of our customer base. Historically, our credit losses have not been significant. As a result, we do not believe we have any significant concentrations of credit risk as of December 31,
2013.2016.
We maintain allowances for doubtful accounts and sales adjustments, which are provided at the time the revenue is recognized. Since most of our customers are domestic governmental entities, we rarely incur a loss resulting from the inability of a customer to make required payments. Events or changes in circumstances that indicate that the carrying amount for the allowances for doubtful accounts and sales adjustments may require revision, include, but are not limited to, deterioration of a customer’s financial condition, failure to manage our customer’s expectations regarding the scope of the services to be delivered, and defects or errors in new versions or enhancements of our software products.
The following table summarizes the changes in the allowances for doubtful accounts and sales adjustments:
| | | | | | | | | | | | |
| | | Years ended December 31, | |
| | | 2013 | | | 2012 | | | 2011 | |
Balance at beginning of year | | $ | 1,621 | | | $ | 990 | | | $ | 1,603 | |
Provisions for losses—accounts receivable | | | 729 | | | | 961 | | | | 805 | |
Collection of accounts previously reserved | | | — | | | | — | | | | (142 | ) |
Deductions for accounts charged off or credits issued | | | (1,237 | ) | | | (330 | ) | | | (1,276 | ) |
| | | | | | | | | | | | |
Balance at end of year | | $ | 1,113 | | | $ | 1,621 | | | $ | 990 | |
| | | | | | | | | | | | |
|
| | | | | | | | | | | |
| | Years Ended December 31, |
| | 2016 | | 2015 | | 2014 |
| Balance at beginning of year | $ | 1,640 |
| | $ | 1,725 |
| | $ | 1,113 |
|
| Provisions for losses - accounts receivable | 4,484 |
| | 1,756 |
| | 1,897 |
|
| Collection of accounts previously written off | — |
| | 153 |
| | — |
|
| Deductions for accounts charged off or credits issued | (2,728 | ) | | (1,994 | ) | | (1,285 | ) |
| Balance at end of year | $ | 3,396 |
| | $ | 1,640 |
| | $ | 1,725 |
|
The termination clauses in most of our contracts provide for the payment for the value of products delivered or services performed in the event of early termination. Our property appraisal outsourcing service contracts can range up to three years and, in a few cases, as long as five years, in duration. In connection with these contracts, as well as certain software service contracts, we may perform work prior to when the software and services are billable and/or payable pursuant to the contract. We have historically recorded such unbilled receivables (costs and estimated profit in excess of billings) in connection with (1) property appraisal services contracts accounted for using proportional performance accounting in which the revenue is earned based upon activities performed in one accounting period but the billing normally occurs subsequently and may span another accounting period; (2) software services contracts accounted for using the percentage-of-completion method of revenue recognition using labor hours as a measure of progress towards completion in which the services are performed in one accounting period but the billing for the software element of the arrangement may be based upon the specific phase of the implementation; (3) software revenue for which we have objective evidence that the customer-specified objective criteria has been met but the billing has not yet been submitted to the customer; (4) some of our contracts provide for an amount to be withheld from a progress billing (generally
a 10%between 5% and 20% retention) until final and satisfactory project completion is achieved; and (5) in a limited number of cases, we may grant extended payment terms, generally to existing customers with whom we have a long-term relationship and favorable collection history.
In connection with this activity, we
We have recorded unbilled receivables of
$10.8$33.6 million and
$11.8$29.7 million at December 31,
20132016 and
2012,2015, respectively.
We also have recordedIncluded in unbilled receivables are retention receivables of
$2.6$5.0 million and
$1.3$4.7 million at December 31,
20132016 and
2012,2015, respectively, and these retentions become payable upon the completion of the contract or completion of our
field workfieldwork and formal hearings. Unbilled receivables and retention receivables expected to be collected in excess of one year have been included with accounts receivable, long-term portion in the accompanying consolidated balance sheets.
Most of our software license agreements indemnify our customers in the event that the software sold infringes upon the intellectual property rights of a
third party.third-party. These agreements typically provide that in such event we will either modify or replace the software so that it becomes non-infringing or procure for the customer the right to use the software. We have recorded no liability associated with these indemnifications, as we are not aware of any pending or threatened infringement actions that are possible losses. We believe the estimated fair value of these intellectual property indemnification clauses is minimal.
We have also agreed to indemnify our officers and board members if they are named or threatened to be named as a party to any proceeding by reason of the fact that they acted in such capacity. We maintain directors’ and officers’
liability insurance coverage to protect against any such losses. We have recorded no liability associated with these indemnifications. Because of our insurance coverage, we believe the estimated fair value of these indemnification agreements is minimal.
Certain amounts for previous years have been reclassified to conform to the current year presentation.
(2) ACQUISITIONS
2012
NEW ACCOUNTING PRONOUNCEMENTS
New Accounting Pronouncements Adopted in 2016
Improvements to Employee Share-Based Payment Accounting. In March 2016, the Financial Accounting Standards Board ("FASB") issued ASU No. 2016-09, "Compensation-Stock Compensation (Topic 718): Improvements to Employee Share-Based Payment Accounting" which simplifies several aspects of the accounting for employee share-based payment transactions, including the accounting for income taxes, forfeitures, and statutory tax withholding requirements, as well as classification in the statement of cash flows. This standard is effective for our interim and annual reporting periods beginning December 15, 2016, and early adoption is permitted. We elected to early adopt this standard in fourth quarter of 2016. The impact of the early adoption was as follows:
The standard eliminates additional paid in capital ("APIC") pools and requires excess tax benefits and tax deficiencies to be recorded in the income statement as a discrete item when the awards vest or are settled. The adoption of this guidance on a prospective basis resulted in the recognition of excess tax benefits in our provision for income taxes.
The standard requires excess tax benefits to be recognized regardless of whether the benefit reduces taxes payable. The adoption of this guidance is applied on a modified retrospective basis; however, it did not have an impact on our retained earnings as of January 1, 2016, as we had previously recognized all our excess tax benefits.
As permitted, we have elected to continue to estimate forfeitures expected to occur to determine the amount of stock-based compensation cost to be recognized in each period. As such, the guidance relating to forfeitures did not have an impact on our retained earnings as of January 1, 2016.
The new guidance changes the calculation of common stock equivalents for earnings per share purposes.
As permitted, we elected to apply the statement of cash flows guidance that cash flows related to excess tax benefits be presented as an operating activity retrospectively.
Adoption of the new standard resulted in the recognition of excess tax benefits in our provision for income taxes rather than APIC of $29.6 million for the period ended December 31, 2016. As of December 31, 2016, the change in the calculation of common stock equivalents added approximately 519,000 weighted average shares for the diluted earnings per share calculations. The impact to our previously reported quarterly results for fiscal year 2016 is as follows:
|
| | | | | | | | | | | | | | | | | | | | | | | |
| | Three Months Ended | | Three Months Ended | | Three Months Ended |
| | March 31, 2016 | | June 30, 2016 | | September 30, 2016 |
| (In thousands, except per share amounts) | As Reported | | As Adjusted | | As Reported | | As Adjusted | | As Reported | | As Adjusted |
| | | | | | | | | | | | |
| Income statements: | | | | | | | | | | | |
| Income tax provision | $ | 10,495 |
| | $ | 9,350 |
| | $ | 11,323 |
| | $ | 5,188 |
| | $ | 14,155 |
| | $ | 989 |
|
| Net income | $ | 17,079 |
| | $ | 18,224 |
| | $ | 18,872 |
| | $ | 25,007 |
| | $ | 22,264 |
| | $ | 35,430 |
|
| Basic earnings per common share | $ | 0.47 |
| | $ | 0.50 |
| | $ | 0.52 |
| | $ | 0.69 |
| | $ | 0.61 |
| | $ | 0.97 |
|
| Diluted earnings per common share | $ | 0.44 |
| | $ | 0.47 |
| | $ | 0.49 |
| | $ | 0.65 |
| | $ | 0.58 |
| | $ | 0.91 |
|
| Diluted weighted average common shares outstanding | 38,557 |
| | 39,071 |
| | 38,196 |
| | 38,738 |
| | 38,506 |
| | 39,062 |
|
| | | | | | | | | | | | |
| Statement of cash flows: | | | | | | | | | | | |
| Net cash provided by operating activities | $ | 40,270 |
| | $ | 41,321 |
| | $ | 13,877 |
| | $ | 19,520 |
| | $ | 67,091 |
| | $ | 79,213 |
|
| Net cash (used) provided by financing activities | $ | (15,860 | ) | | $ | (16,911 | ) | | $ | 5,668 |
| | $ | 25 |
| | $ | (77,973 | ) | | $ | (90,095 | ) |
Presentation of Financial Statements - Going Concern. In August 2014, the FASB issued ASU No. 2014-15, "Presentation of Financial Statements - Going Concern (Subtopic 205-40): Disclosure of Uncertainties about an Entity’s Ability to Continue as a Going Concern." The guidance requires an entity to evaluate whether there are conditions or events, in the aggregate, that raise substantial doubt about the entity’s ability to continue as a going concern within one year after the date that the financial statements are issued (or within one year after the financial statements are available to be issued when applicable) and to provide related footnote disclosures in certain circumstances. The guidance is effective for the annual period ending after December 15, 2016, and for annual and interim periods thereafter. We adopted this standard in the fourth quarter of 2016 and its adoption did not have an impact on our consolidated financial statements.
Recent Accounting Guidance not yet Adopted
Revenue from Contracts with Customers. On May 28, 2014, the FASB issued ASU No. 2014-09, “Revenue from Contracts with Customers.” This ASU is the result of a convergence project between the FASB and the International Accounting Standards Board. The core principle behind ASU No. 2014-09 is that an entity should recognize revenue to depict the transfer of promised goods and services to customers in an amount that reflects the consideration to which the entity expects to be entitled in exchange for delivering those goods and services. This model involves a five-step process that includes identifying the contract with the customer, identifying the performance obligations in the contract, determining the transaction price, allocating the transaction price to the performance obligations in the contract and recognizing revenue when (or as) the entity satisfies the performance obligations. The ASU allows two methods of adoption: a full retrospective approach where three years of financial information are presented in accordance with the new standard, and a modified retrospective approach where the ASU is applied to the most current period presented in the financial statements. We currently anticipate adopting the standard using the full retrospective method to restate each prior reporting period presented. Our ability to adopt using the full retrospective method is dependent on system readiness, including software procured from third-party providers, and the completion of our analysis of information necessary to restate prior period financial statements.
The new standard requires application no later than annual reporting periods beginning after December 15, 2017, including interim reporting periods therein; however, public entities are permitted to elect to early adopt the new standard. We are assessing the financial impact of adopting the new standard and the methods of adoption; however, we are currently unable to provide a reasonable estimate regarding the financial impact. We will adopt the new standard in fiscal year 2018.
We anticipate this standard will have a material impact on our consolidated financial statements. While we are continuing to assess all potential impacts of the standard, we currently believe the most significant impact relates to our accounting for software license fees,
installation fees, and incremental cost of obtaining a contract. Specifically, under the new standard we expect software license fees under perpetual agreements will no longer be subject to 100% discount allocations from other elements in the contract. Discounts in arrangements will be allocated across all deliverables increasing license revenues and decreasing revenues allocated to other performance obligations. In addition, in most cases, net license fees (total license fees less any allocated discounts) will be recognized at the point in time that control of the software license transfers to the customer versus our current policy of recognizing revenue only to the extent billable per the contractual terms. Time-based license fees currently recognized over the license term will no longer be recognized over the period of the license and will instead be recognized at the point in time that control of the software license transfers to the customer. Installation fees will no longer be considered distinct performance obligations and therefore will be recognized over the term of the arrangement or life of the performance obligation. We expect revenue related to our SaaS offerings and professional services to remain substantially unchanged. Due to the complexity of certain contracts, the actual revenue recognition treatment required under the standard will be dependent on contract-specific terms and may vary in some instances from recognition at the time of billing. Application of the new standard requires that incremental costs directly related to obtaining a contract (typically sales commissions plus any associated fringe benefits) must be recognized as an asset and expensed over the expected life of the arrangement, unless that life is less than one year. Currently, we defer sales commissions and recognize expense over the relevant initial contractual term. With the adoption the new standard, we expect amortization periods to extend past the initial term.
Leases. On February 25, 2016, the FASB issued its new lease accounting guidance in ASU No. 2016-02, “Leases (Topic 842).” Under the new guidance, lessees will be required to recognize the following for all leases (with the exception of short-term leases) at the commencement date:
A lease liability, which is a lessee‘s obligation to make lease payments arising from a lease, measured on a discounted basis; and
A right-of-use asset, which is an asset that represents the lessee’s right to use, or control the use of, a specified asset for the lease term.
Lessees (for capital and operating leases) and lessors (for sales-type, direct financing, and operating leases) must apply a modified retrospective transition approach for leases existing at, or entered into after, the beginning of the earliest comparative period presented in the financial statements. The modified retrospective approach would not require any transition accounting for leases that expired before the earliest comparative period presented. Lessees and lessors may not apply a full retrospective transition approach.
The ASU is effective for fiscal years beginning after December 15, 2018, including interim periods therein. Early application is permitted for all business entities upon issuance. We are assessing the financial impact of adopting the new standard; however, we are currently unable to provide a reasonable estimate regarding the financial impact. We expect to adopt the new standard in fiscal year 2019.
(2)ACQUISITIONS
2016
During 2016, we acquired a business for approximately $7.4 million in cash paid. This acquisition is immaterial to our consolidated financial statements. The operating results of this small acquisition are included with the operating results of the Enterprise Software segment since its date of acquisition. The purchase price allocation for this acquisition is reflected in the accompanying consolidated balance sheet as of December 31, 2016 and is preliminary.
2015
On November 2012,16, 2015, we acquired all the capital stock of New World Systems Corporation (“NWS”), which provides public safety and financial solutions for local governments. The purchase price, net of cash acquired of $22.5 million, comprised of $337.5 million in cash, of which $4.0 million was accrued at December 31, 2015, and 2.1 million shares of Tyler common stock valued at $362.8 million, which was based on the closing price on November 16, 2015. We also incurred fees of approximately $5.9 million for financial advisory, legal, accounting, due diligence, valuation and other various services necessary to complete the acquisition. These fees were expensed in 2015 and are included in selling, general and administrative expenses.
In 2016, we paid $2.0 million related to the working capital holdback of $4.0 million and reduced the accrued liability. Our final valuation of the fair market value of NWS’ assets and liabilities resulted in adjustments to the preliminary opening balance sheet. These adjustments related to a reduction in deferred revenue and related deferred income taxes and additional reserves for accounts receivable and contingencies resulting in a net decrease to goodwill of approximately $7.4 million.
On May 29, 2015, we acquired all of the capital stock of EnerGov Solutions, L.L.C.Brazos Technology Corporation (“EnerGov”Brazos”) that develops, which provides mobile hand held solutions primarily to law enforcement agencies for field accident reporting and sells enterprise permitting, land management, licensing and regulatory software solutions to governmental agencies.electronically issuing citations. The purchase price, net of cash acquired of $15,000$312,000 and including debt assumed of $733,000, was $10.5$6.1 million in cash and 60,00012,500 shares of Tyler common stock valued at $2.8 million, based on$1.5 million.
The operating results of NWS and Brazos are included with the
stock price on the acquisition date. As of December 31, 2012 the purchase price allocation was not yet complete. In March 2013, we finalized the purchase price allocation, which resulted in additional goodwill of $1.1 million and a corresponding reduction in tangible assets. The balance sheet at December 31, 2012 has been retrospectively revised to include this adjustment.In April 2012, we acquired alloperating results of the capital stockEnterprise Software segment since their dates of Computer Software Associates, Inc. (“CSA”) for a cash purchase price of
$9.4 million, net of cash acquired of $437,000. CSA is a reseller of Tyler’s Infinite Visions school enterprise solution, and sells proprietary CSA tax and recording solutions to county governments, primarily in the Northwest.
In March 2012, we acquired all the capital stock of UniFund, L.L.C. (“UniFund”) for a cash purchase price of $4.6 million, net of cash acquired of $780,000. UniFund provides enterprise resource planning solutions to schools and local governments, primarily in the Northeast. UniFund is also a reseller of Tyler’s Infinite Visions school enterprise solution.
In January 2012, we acquired substantially allacquisition. The fair value of the assets of Akanda Innovation, Inc., (“Akanda”) a provider of web-based solutions to the public sector, whichand liabilities acquired are integrated, with our property tax software, for a total purchase price of $2.9 million. The purchase price included certain liabilities we assumed of approximately $800,000, resulting in net cash paid to the sellers of $2.1 million, of which $900,000 was paid prior to December 31, 2011.
2011
In October 2011, we acquired all of the capital stock of Windsor Management Group, L.L.C. for a cash purchase price of $16.4 million, net of cash acquired of $7.4 million. Windsor provides Infinite Visions suite of school enterprise solutions for the K-12 education market, primarily in the Southwest.
(3) FAIR VALUE OF FINANCIAL INSTRUMENTS
Assets recorded at fair value in the balance sheet as of December 31, 2013 are categorized based upon the level of judgment associated with theon valuations using Level III, unobservable inputs used to measure their fair value as defined by ASC 820, Fair Value Measurements and Disclosures. We have investments available-for-sale (consisting of auction rate securities) that are considered to be Level 3 assets for whichsupported by little or no market data existactivity and that are requiredsignificant to be measured at fair value on a recurring basis. Thethe fair value of our investments available-for-sale as of December 31, 2013 and December 31, 2012 was $1.3 million and $2.0 million, respectively. As of December 31, 2013 the par value of our investments available-for-sale was $1.4 million and the related temporary impairment was $72,000, based on our estimate of the related fair value using a discounted trinomial model.
In association with this estimate of fair value, we have recorded an after-tax temporary unrealized gain on our investments available-for-sale of $222,000, net of related tax effects of $119,000 in 2013, which is included in accumulated other comprehensive loss on our balance sheet. The unrealized gain includes the impact of adjusting previously recorded unrealized losses of approximately $138,000 net of related tax effects of $74,000 as of December 31, 2013 for one security, which was partially redeemed at par during 2013.
The following table reflects the activity for assets measured at fair value using Level 3 inputs for the years ended December 31:
| | | | |
Balance as of December 31, 2010 | | $ | 2,126 | |
Transfers into level 3 | | | — | |
Transfers out of level 3 | | | (25 | ) |
Purchases, sales issuances and settlements | | | (25 | ) |
Unrealized losses included in accumulated loss | | | (123 | ) |
| | | | |
Balance as of December 31, 2011 | | | 1,953 | |
Transfers into level 3 | | | — | |
Transfers out of level 3 | | | — | |
Purchases, sales issuances and settlements | | | (50 | ) |
Unrealized gains included in accumulated loss | | | 134 | |
| | | | |
Balance as of December 31, 2012 | | | 2,037 | |
Transfers into level 3 | | | — | |
Transfers out of level 3 | | | — | |
Purchases, sales issuances and settlements | | | (1,090 | ) |
Unrealized gains included in accumulated loss | | | 341 | |
| | | | |
Balance as of December 31, 2013 | | $ | 1,288 | |
| | | | |
(4) or liabilities.
(3)PROPERTY AND EQUIPMENT, NET Property and equipment, net consists of the following at December 31:
| | | | | | | | | | | | |
| | | Useful
Lives
(years) | | | 2013 | | | 2012 | |
Land | | | — | | | $ | 7,800 | | | $ | 7,800 | |
Building and leasehold improvements | | | 5-39 | | | | 50,523 | | | | 33,299 | |
Computer equipment and purchased software | | | 3-5 | | | | 27,071 | | | | 24,036 | |
Furniture and fixtures | | | 5 | | | | 10,834 | | | | 8,108 | |
Transportation equipment | | | 5 | | | | 241 | | | | 274 | |
| | | | | | | | | | | | |
| | | | | | | 96,469 | | | | 73,517 | |
Accumulated depreciation and amortization | | | | | | | (31,625 | ) | | | (28,136 | ) |
| | | | | | | | | | | | |
Property and equipment, net | | | | | | $ | 64,844 | | | $ | 45,381 | |
| | | | | | | | | | | | |
|
| | | | | | | | | | |
| | Useful Lives (years) | | 2016 | | 2015 |
| Land | — |
| | $ | 9,958 |
| | $ | 8,146 |
|
| Building and leasehold improvements | 5-39 |
| | 94,924 |
| | 77,020 |
|
| Computer equipment and purchased software | 3-5 |
| | 55,627 |
| | 42,245 |
|
| Furniture and fixtures | 5 |
| | 19,897 |
| | 16,661 |
|
| Transportation equipment | 5 |
| | 447 |
| | 252 |
|
| | | | 180,853 |
| | 144,324 |
|
| Accumulated depreciation and amortization | | | (56,585 | ) | | (43,212 | ) |
| Property and equipment, net | | | $ | 124,268 |
| | $ | 101,112 |
|
Depreciation expense was
$6.4$13.4 million during
2013, $5.62016, $9.1 million during
20122015, and
$5.3$7.9 million during
2011.2014.
In 2016, we purchased an office building in Falmouth, Maine, that was previously leased from an entity owned by an executive’s father and brother, for approximately $9.7 million, and paid $8.0 million for construction to expand a building in Yarmouth, Maine.
We own office buildings in
Bangor, Falmouth and Yarmouth,
Maine,Maine; Lubbock and Plano,
Texas,Texas; Troy, Michigan; and Moraine, Ohio. We lease some space in these buildings to third-party tenants. These leases expire between
20142017 and
20172025 and are expected to provide rental income of approximately
$834,000$1.6 million during
2014, $685,0002017, $1.9 million during
2015, $319,0002018, $1.9 million during
20162019, $1.7 million during 2020, $1.4 million during 2021, and
$46,000 during 2017.$5.2 million thereafter. Rental income
associated with third partyfrom third-party tenants was
$704,000 in 2013, $586,000 in 2012 and $1.2$1.7 million in
2011,2016, $913,000 in 2015, and
was included as a reduction of selling, general and administrative expenses.(5) $945,000 in 2014.
(4)GOODWILL AND OTHER INTANGIBLE ASSETS Other intangible assets and related accumulated amortization consists of the following at December 31:
| | | | | | | | |
| | | 2013 | | | 2012 | |
Gross carrying amount of acquisition intangibles: | | | | | | | | |
Customer related intangibles | | $ | 60,547 | | | $ | 60,547 | |
Software acquired | | | 32,003 | | | | 32,003 | |
Trade name | | | 3,109 | | | | 3,272 | |
Lease acquired | | | 1,387 | | | | 1,387 | |
| | | | | | | | |
| | | 97,046 | | | | 97,209 | |
Accumulated amortization | | | (58,060 | ) | | | (51,489 | ) |
| | | | | | | | |
Acquisition intangibles, net | | $ | 38,986 | | | $ | 45,720 | |
| | | | | | | | |
Post acquisition software development costs | | $ | 36,701 | | | $ | 36,701 | |
Accumulated amortization | | | (36,701 | ) | | | (36,621 | ) |
| | | | | | | | |
Post acquisition software costs, net | | $ | — | | | $ | 80 | |
| | | | | | | | |
Total other intangibles | | $ | 38,986 | | | $ | 45,800 | |
| | | | | | | | |
|
| | | | | | | |
| | 2016 | | 2015 |
| Gross carrying amount of acquisition intangibles: | | | |
| Customer related intangibles | $ | 186,231 |
| | $ | 181,671 |
|
| Acquired software | 176,096 |
| | 172,666 |
|
| Trade name | 11,065 |
| | 10,765 |
|
| Leases acquired | 3,694 |
| | 3,694 |
|
| | 377,086 |
| | 368,796 |
|
| Accumulated amortization | (109,827 | ) | | (73,418 | ) |
| Total intangibles, net | $ | 267,259 |
| | $ | 295,378 |
|
Total amortization expense for
acquisition related intangibles
and post acquisition software development costs, was
$6.8$36.4 million in
2013, $6.52016, $10.3 million in 2015, and $6.4 million during
2012, and $4.9 million during 2011.2014.
The allocation of acquisition intangible assets is summarized in the following table:
| | | | | | | | | | | | | | | | | | | | | | | | |
| | | December 31, 2013 | | | December 31, 2012 | |
| | | Gross
Carrying
Amount | | | Weighted
Average
Amortization
Period | | | Accumulated
Amortization | | | Gross
Carrying
Amount | | | Weighted
Average
Amortization
Period | | | Accumulated
Amortization | |
Non-amortizable intangibles: | | | | | | | | | | | | | | | | | | | | | | | | |
Goodwill | | $ | 121,011 | | | | — | | | $ | — | | | $ | 121,011 | | | | — | | | $ | — | |
Amortizable intangibles: | | | | | | | | | | | | | | | | | | | | | | | | |
Customer related intangibles | | | 60,547 | | | | 15 years | | | | 28,864 | | | | 60,547 | | | | 15 years | | | | 24,554 | |
Software acquired | | | 32,003 | | | | 5 years | | | | 26,584 | | | | 32,003 | | | | 5 years | | | | 24,505 | |
Trade name | | | 3,109 | | | | 15 years | | | | 1,225 | | | | 3,272 | | | | 15 years | | | | 1,182 | |
Lease acquired | | | 1,387 | | | | 5 years | | | | 1,387 | | | | 1,387 | | | | 5 years | | | | 1,248 | |
|
| | | | | | | | | | | | | | | | | | | | | |
| | December 31, 2016 | | December 31, 2015 |
| | Gross Carrying Amount | | Weighted Average Amortization Period | | Accumulated Amortization | | Gross Carrying Amount | | Weighted Average Amortization Period | | Accumulated Amortization |
| Non-amortizable intangibles: | | | | | | | | | | | |
| Goodwill | $ | 650,237 |
| | — |
| | $ | — |
| | $ | 653,666 |
| | — |
| | $ | — |
|
| Amortizable intangibles: | | | | | | | | | | | |
| Customer related intangibles | 186,231 |
| | 15 years |
| | 51,491 |
| | 181,671 |
| | 15 years |
| | 38,754 |
|
| Acquired software | 176,096 |
| | 7 years |
| | 55,115 |
| | 172,666 |
| | 7 years |
| | 32,880 |
|
| Trade name | 11,065 |
| | 12 years |
| | 2,740 |
| | 10,765 |
| | 12 years |
| | 1,747 |
|
| Leases acquired | 3,694 |
| | 9 years |
| | 481 |
| | 3,694 |
| | 9 years |
| | 37 |
|
The changes in the carrying amount of goodwill for the two years ended December 31,
20132016 are as follows:
| | | | | | | | | | | | |
| | | Enterprise
Software
Solutions | | | Appraisal and
Tax Software
Solutions and
Services | | | Total | |
Balance as of December 31, 2011 | | $ | 100,504 | | | $ | 5,590 | | | $ | 106,094 | |
Goodwill acquired during 2012 related to the purchase of Akanda | | | — | | | | 967 | | | | 967 | |
Goodwill acquired during 2012 related to the purchase of UniFund | | | 1,055 | | | | — | | | | 1,055 | |
Goodwill acquired during 2012 related to the purchase of CSA | | | 4,634 | | | | — | | | | 4,634 | |
Goodwill acquired during 2012 related to the purchase of EnerGov | | | 8,261 | | | | — | | | | 8,261 | |
| | | | | | | | | | | | |
Balance as of December 31, 2012 and December 31, 2013 | | $ | 114,454 | | | $ | 6,557 | | | $ | 121,011 | |
| | | | | | | | | | | | |
|
| | | | | | | | | | | |
| | Enterprise Software | | Appraisal and Tax | | Total |
| Balance as of 12/31/2014 | $ | 117,585 |
| | $ | 6,557 |
| | $ | 124,142 |
|
| Goodwill acquired during 2015 related to the purchase of NWS | 527,618 |
| | — |
| | 527,618 |
|
| Goodwill acquired during 2015 related to the purchase of Brazos | 1,906 |
| | — |
| | 1,906 |
|
| Balance as of 12/31/2015 | 647,109 |
| | 6,557 |
| | 653,666 |
|
| Goodwill acquired during 2016 related to a small acquisition | 3,943 |
| | — |
| | 3,943 |
|
| Purchase price adjustments related to NWS acquisition | (7,372 | ) | | — |
| | (7,372 | ) |
| Balance as of 12/31/2016 | $ | 643,680 |
| | $ | 6,557 |
| | $ | 650,237 |
|
Estimated annual amortization expense relating to acquired leases will be recorded as a reduction to hardware and other revenue and is expected to be $442,000 in 2017, $426,000 in 2018, $373,000 in 2019, $314,000 in 2020, $312,000 in 2021 and $1.3 million thereafter.Estimated annual amortization expense relating to acquisition intangibles, including acquired software, for which the amortization expense is recorded as cost of revenues, for the next five years is as follows: | | | | |
Years ending December 31, | | | |
2014 | | $ | 6,308 | |
2015 | | | 6,128 | |
2016 | | | 6,039 | |
2017 | | | 5,042 | |
2018 | | | 4,366 | |
(6)
|
| | | |
| 2017 | $ | 35,120 |
|
| 2018 | 34,443 |
|
| 2019 | 33,107 |
|
| 2020 | 31,660 |
|
| 2021 | 31,302 |
|
Accrued liabilities consist of the following at December 31:
| | | | | | | | |
| | | 2013 | | | 2012 | |
Accrued wages, bonuses and commissions | | $ | 25,471 | | | $ | 17,875 | |
Other accrued liabilities | | | 7,368 | | | | 8,143 | |
| | | | | | | | |
| | $ | 32,839 | | | $ | 26,018 | |
| | | | | | | | |
(7)
|
| | | | | | | |
| | 2016 | | 2015 |
| Accrued wages, bonuses and commissions | $ | 38,996 |
| | $ | 32,006 |
|
| Other accrued liabilities | 16,993 |
| | 17,150 |
|
| | $ | 55,989 |
| | $ | 49,156 |
|
(6)REVOLVING LINE OF CREDIT On
August 11, 2010,November 16, 2015, we entered into a
new $150.0$300.0 million Credit Agreement (the “Credit Facility”)
with the various lenders party thereto and
a related pledge and security agreement with a group of seven financial institutions, withWells Fargo Bank,
of America, N.A.,National Association, as Administrative Agent. The Credit Facility provides for a revolving credit line of
$150.0 million (which may be increased up to
$200.0$300.0 million,
subject to our obtaining commitments for such increase), withincluding a
$25.0$10.0 million sublimit for letters of credit. The Credit Facility matures on
August 11, 2014.November 16, 2020. Borrowings under the Credit Facility may be used for general corporate purposes, including working capital requirements, acquisitions and share repurchases.
Borrowings under the Credit Facility bear interest at a rate of either (1) the Bank of America’sWells Fargo Bank’s prime rate (subject to certain higher rate determinations) plus a margin of 1.50%0.25% to 2.75%1.00% or (2) the 30, 60, 90 or 180-day180 day LIBOR rate plus a margin of 2.50%1.25% to 3.75%, with the margin determined by2.00%. As of December 31, 2016, our consolidated leverage ratio.interest rate was 1.96%. The Credit Facility is secured by substantially all of our assets, excluding real property.assets. The Credit Facility requires us to maintain certain financial ratios and other financial conditions and prohibits us from making certain investments, advances, cash dividends or loans, and limits incurrence of additional indebtedness and liens. As of December 31, 2013,2016, we were in compliance with those covenants.covenants
. As of December 31, 2013,2016, we had no$10.0 million in outstanding borrowings and unused available borrowing capacity of $148.0$287.8 million under the Credit Facility.Facility. In addition, as of December 31, 2013,2016, we had antwo outstanding letterletters of credit totaling $2.0 million. Some$2.2 million in favor of our customers require a letterclient contract and the expansion of an office building in Yarmouth, Maine. Both letters of credit guaranteeingguarantee our performance under each contract and both expire in connection with our contracts. The notional amount of performanceguarantees outstanding as of December 31, 2013 was estimated to be approximately $29.0 million. This letter of credit is issued under our revolving line of credit and reduces our available borrowing capacity. We do not believe this letter of credit will be required to be drawn upon. The letter of credit expires in 2014.
2017.
We paid interest of
$899,000 in 2013 and $2.0$1.9 million in
2012.(8) 2016 and $223,000 in 2015.
The income tax provision (benefit) on income from operations consists of the following:
| | | | | | | | | | | | |
| | | Years ended December 31, | |
| | | 2013 | | | 2012 | | | 2011 | |
Current: | | | | | | | | | | | | |
Federal | | $ | 25,625 | | | $ | 19,113 | | | $ | 17,239 | |
State | | | 2,590 | | | | 1,976 | | | | 2,233 | |
| | | | | | | | | | | | |
| | | 28,215 | | | | 21,089 | | | | 19,472 | |
Deferred | | | (1,497 | ) | | | (215 | ) | | | (2,916 | ) |
| | | | | | | | | | | | |
| | $ | 26,718 | | | $ | 20,874 | | | $ | 16,556 | |
| | | | | | | | | | | | |
|
| | | | | | | | | | | |
| | Years Ended December 31, |
| | 2016 | | 2015 | | 2014 |
| Current: | | | | | |
| Federal | $ | 41,366 |
| | $ | 44,841 |
| | $ | 34,504 |
|
| State | 7,023 |
| | 6,670 |
| | 4,827 |
|
| | 48,389 |
| | 51,511 |
| | 39,331 |
|
| Deferred | (28,939 | ) | | (7,956 | ) | | (3,804 | ) |
| | $ | 19,450 |
| | $ | 43,555 |
| | $ | 35,527 |
|
Reconciliation of the U.S. statutory income tax rate to our effective income tax expense rate for operations follows:
| | | | | | | | | | | | |
| | | Years ended December 31, | |
| | | 2013 | | | 2012 | | | 2011 | |
Federal income tax expense at statutory rate | | $ | 23,037 | | | $ | 18,854 | | | $ | 15,440 | |
State income tax, net of federal income tax benefit | | | 2,371 | | | | 1,365 | | | | 1,238 | |
Non-deductible business expenses | | | 1,110 | | | | 1,087 | | | | 918 | |
Qualified manufacturing activities | | | — | | | | (717 | ) | | | (840 | ) |
Research and development credit | | | — | | | | — | | | | (177 | ) |
Other, net | | | 200 | | | | 285 | | | | (23 | ) |
| | | | | | | | | | | | |
| | $ | 26,718 | | | $ | 20,874 | | | $ | 16,556 | |
| | | | | | | | | | | | |
|
| | | | | | | | | | | |
| | Years Ended December 31, |
| | 2016 | | 2015 | | 2014 |
| Federal income tax expense at statutory rate | $ | 45,257 |
| | $ | 37,949 |
| | $ | 33,064 |
|
| State income tax, net of federal income tax benefit | 4,807 |
| | 3,715 |
| | 2,867 |
|
| Domestic production activities deduction | (3,947 | ) | | (466 | ) | | (1,720 | ) |
| Excess tax benefits related to stock option exercises | (29,582 | ) | | — |
| | — |
|
| Non-deductible business expenses | 2,979 |
| | 2,414 |
| | 1,485 |
|
| Other, net | (64 | ) | | (57 | ) | | (169 | ) |
| | $ | 19,450 |
| | $ | 43,555 |
| | $ | 35,527 |
|
Due to the adoption of ASU No. 2016-09, federal and state excess tax benefits from stock option exercises for the year ended December 31, 2016 are reflected as a reduction of the provision for income taxes, whereas they were previously accounted for as an increase to shareholders’ equity. See Note 1 "Summary of Significant Accounting Policies" for additional information related to this adoption.
The tax effects of the major items recorded as deferred tax assets and liabilities as of December 31 are:
| | | | | | | | |
| | | 2013 | | | 2012 | |
Deferred income tax assets: | | | | | | | | |
Operating expenses not currently deductible | | $ | 7,360 | | | $ | 5,372 | |
Stock option and other employee benefit plans | | | 7,089 | | | | 6,097 | |
Capital loss and credit carryforward | | | 185 | | | | 275 | |
Property and equipment | | | 149 | | | | 570 | |
| | | | | | | | |
Total deferred income tax assets | | | 14,783 | | | | 12,314 | |
Deferred income tax liabilities: | | | | | | | | |
Intangible assets | | | (12,910 | ) | | | (11,838 | ) |
Other | | | (173 | ) | | | (153 | ) |
| | | | | | | | |
Total deferred income tax liabilities | | | (13,083 | ) | | | (11,991 | ) |
| | | | | | | | |
Net deferred income tax asset | | $ | 1,700 | | | $ | 323 | |
| | | | | | | | |
At December 31, 2013, we had approximately $650,000 of net operating loss carryforwards for Federal income tax reporting purposes available to offset future taxable income. The $650,000 was attributable to excess tax benefits related to share-based arrangements for which authoritative guidance prohibits the recognition of a deferred tax asset. The $650,000 tax benefit will be accounted for as an increase to shareholders’ equity and a reduction in income tax payable when realized. This carryforward expires in 2034. We recognized approximately $28.2 million excess tax benefits related to share-based arrangements in 2013 as a credit to shareholders’ equity and a reduction in income taxes payable.
|
| | | | | | | |
| | 2016 | | 2015 |
| Deferred income tax assets: | | | |
| Operating expenses not currently deductible | $ | 18,721 |
| | $ | 9,953 |
|
| Stock option and other employee benefit plans | 19,665 |
| | 13,504 |
|
| Capital loss and credit carryforward | — |
| | 179 |
|
| Total deferred income tax assets | 38,386 |
| | 23,636 |
|
| Deferred income tax liabilities: | | | |
| Intangible assets | (103,754 | ) | | (111,653 | ) |
| Property and equipment | (3,207 | ) | | (2,781 | ) |
| Other | (204 | ) | | (228 | ) |
| Total deferred income tax liabilities | (107,165 | ) | | (114,662 | ) |
| Net deferred income tax liabilities | $ | (68,779 | ) | | $ | (91,026 | ) |
Although realization is not assured, we believe it is more likely than not that all the deferred tax assets
at December 31, 2013 and 2012 will be realized. Accordingly, we believe no valuation allowance is required for the deferred tax assets. However, the amount of the deferred tax asset considered realizable could be adjusted in the future if estimates of reversing taxable temporary differences are revised.
No reserves for uncertain income There were no unrecognized tax positions have been recorded pursuant to ASC 740-10, Income Taxes.
benefits during any of the reported periods.
The Internal Revenue Service (“IRS”) is examining our U.S. income tax return for the year
2010.2012. As of February 21, 2017, no significant adjustments have been proposed by any taxing jurisdiction. We are unable to make a reasonable estimate as to when cash settlements,
related to the examination, if any, will occur.
We are subject to U.S. federal tax as well as income tax of multiple state and local jurisdictions. We are no longer subject to United States federal income tax
examinations for years before 2009. We are no longer subject toor state and local income tax examinations
by tax authorities for
the years before
2008.2011.
We paid income taxes, net of refunds received, of
$9.3$30.2 million in
2013, $13.12016, $27.3 million in
2012,2015, and
$13.4$10.2 million in
2011.(9) 2014.
The following table details activity in our common stock:
| | | | | | | | | | | | | | | | | | | | | | | | |
| | | Years ended December 31, | |
| | | 2013 | | | 2012 | | | 2011 | |
| | | Shares | | | Amount | | | Shares | | | Amount | | | Shares | | | Amount | |
Stock option exercises | | | 1,443 | | | $ | 18,289 | | | | 1,218 | | | $ | 12,443 | | | | 582 | | | $ | 3,553 | |
Purchases of common stock | | | — | | | | — | | | | — | | | | — | | | | (3,004 | ) | | | (71,802 | ) |
Employee stock plan purchases | | | 64 | | | | 3,542 | | | | 81 | | | | 2,641 | | | | 100 | | | | 2,045 | |
Shares issued for acquisition | | | — | | | | — | | | | 60 | | | | 2,815 | | | | — | | | | — | |
|
| | | | | | | | | | | | | | | | | | | | |
| | Years Ended December 31, |
| | 2016 | | 2015 | | 2014 |
| | Shares | | Amount | | Shares | | Amount | | Shares | | Amount |
| Stock option exercises | 827 |
| | $ | 23,527 |
| | 1,118 |
| | $ | 23,160 |
| | 855 |
| | $ | 14,680 |
|
| Purchases of common stock | (882 | ) | | (112,699 | ) | | (5 | ) | | (645 | ) | | (294 | ) | | (22,817 | ) |
| Employee stock plan purchases | 47 |
| | 6,236 |
| | 43 |
| | 4,671 |
| | 53 |
| | 4,144 |
|
| Shares issued for acquisitions | — |
| | — |
| | 2,149 |
| | 364,333 |
| | 17 |
| | 1,473 |
|
Subsequent to December 31, 2016 and through February 21, 2017, we repurchased 42,000 shares for an aggregate purchase price of $6.2 million. As of February
19, 201421, 2017, we had authorization from our board of directors to repurchase up to
1.72.0 million additional shares of our common stock.
(10)
(9)SHARE-BASED COMPENSATION
Share-Based Compensation Plan We have a stock option plan that provides for the grant of stock options to key employees, directors and non-employee consultants. Stock options generally vest after three to six years of continuous service from the date of grant and have a contractual term of
ten10 years. Once options become exercisable, the employee can purchase shares of our common stock at the market price on the date we granted the option. We account for share-based compensation utilizing the fair value recognition pursuant to ASC 718, Stock Compensation.
During fourth quarter of 2016, we adopted ASU No. 2016-09 "Improvements to Employee Share-Based Payment Accounting," See Note 1 - "Summary of Significant Accounting Policies" for further information.
As of December 31,
2013,2016, there were
1.12.9 million shares available for future grants under the plan from the
16.020.0 million shares previously approved by the
stockholders.shareholders.
Determining Fair Value of Stock Compensation
Valuation and Amortization Method. We estimate the fair value of share-based awards granted using the Black-Scholes option valuation model. We amortize the fair value of all awards on a straight-line basis over the requisite service periods, which are generally the vesting periods.
Expected Life. The expected life of awards granted represents the period of time that they are expected to be outstanding. The expected life represents the weighted-average period the stock options are expected to be outstanding based primarily on the options’ vesting terms, remaining contractual life and the employees’ expected exercise based on historical patterns.
Expected Volatility. Using the Black-Scholes option valuation model, we estimate the volatility of our common stock at the date of grant based on the historical volatility of our common stock.
Risk-Free Interest Rate. We base the risk-free interest rate used in the Black-Scholes option valuation model on the implied yield currently available on U.S. Treasury zero-coupon issues with an equivalent remaining term equal to the expected life of the award.
Expected Dividend Yield. We have not paid any cash dividends on our common stock in
the lastmore than ten years and we do not anticipate paying any cash dividends in the foreseeable future. Consequently, we use an expected dividend yield of zero in the Black-Scholes option valuation model.
Expected Forfeitures. We use historical data to estimate pre-vesting option forfeitures. We record share-based compensation only for those awards that are expected to vest.
The following weighted average assumptions were used for options granted:
| | | | | | | | | | | | |
| | | Years ended December 31, | |
| | | 2013 | | | 2012 | | | 2011 | |
Expected life (in years) | | | 6.4 | | | | 6.7 | | | | 6.7 | |
Expected volatility | | | 32.4 | % | | | 32.6 | % | | | 33.1 | % |
Risk-free interest rate | | | 1.4 | % | | | 1.0 | % | | | 1.7 | % |
Expected forfeiture rate | | | 3 | % | | | 3 | % | | | 3 | % |
|
| | | | | | | | |
| | Years Ended December 31, |
| | 2016 | | 2015 | | 2014 |
| Expected life (in years) | 6.0 |
| | 6.0 |
| | 6.0 |
|
| Expected volatility | 29.3 | % | | 28.3 | % | | 30.9 | % |
| Risk-free interest rate | 1.8 | % | | 1.7 | % | | 1.8 | % |
| Expected forfeiture rate | — | % | | 1.7 | % | | 3.0 | % |
The following table summarizes share-based compensation expense related to share-based awards which is recorded in the statements of comprehensive income:
| | | | | | | | | | | | |
| | | Years ended December 31, | |
| | | 2013 | | | 2012 | | | 2011 | |
Cost of software services, maintenance and subscriptions | | $ | 1,509 | | | $ | 1,084 | | | $ | 871 | |
Selling, general and administrative expense | | | 10,144 | | | | 6,327 | | | | 5,382 | |
| | | | | | | | | | | | |
Total share-based compensation expense | | | 11,653 | | | | 7,411 | | | | 6,253 | |
Tax benefit | | | (3,363 | ) | | | (2,040 | ) | | | (1,545 | ) |
| | | | | | | | | | | | |
Net decrease in net income | | $ | 8,290 | | | $ | 5,371 | | | $ | 4,708 | |
| | | | | | | | | | | | |
|
| | | | | | | | | | | |
| | Years Ended December 31, |
| | 2016 | | 2015 | | 2014 |
| Cost of software services, maintenance and subscriptions | $ | 6,548 |
| | $ | 3,380 |
| | $ | 2,177 |
|
| Selling, general and administrative expenses | 23,199 |
| | 16,802 |
| | 12,642 |
|
| Total share-based compensation expenses | 29,747 |
| | 20,182 |
|
| 14,819 |
|
| Tax benefit | (30,059 | ) | | (5,986 | ) | | (4,237 | ) |
| Net (decrease) increase in net income | $ | (312 | ) | | $ | 14,196 |
|
| $ | 10,582 |
|
Adoption of ASU 2016-09 resulted in the recognition of excess tax benefits in our provision for income taxes rather than paid-in capital of $29.6 million for period ended December 31, 2016.
Options granted, exercised, forfeited and expired are summarized as follows:
| | | | | | | | | | | | | | | | |
| | | Number of
Shares | | | Weighted
Average
Exercise Price | | | Weighted Average
Remaining Contractual
Life (Years) | | | Aggregate
Intrinsic
Value | |
Outstanding at December 31, 2010 | | | 5,836 | | | $ | 12.74 | | | | | | | | | |
Granted | | | 831 | | | | 26.83 | | | | | | | | | |
Exercised | | | (582 | ) | | | 6.10 | | | | | | | | | |
Forfeited | | | (26 | ) | | | 15.78 | | | | | | | | | |
| | | | | | | | | | | | | | | | |
Outstanding at December 31, 2011 | | | 6,059 | | | | 15.31 | | | | | | | | | |
Granted | | | 930 | | | | 43.53 | | | | | | | | | |
Exercised | | | (1,218 | ) | | | 10.22 | | | | | | | | | |
Forfeited | | | (60 | ) | | | 28.07 | | | | | | | | | |
| | | | | | | | | | | | | | | | |
Outstanding at December 31, 2012 | | | 5,711 | | | | 20.86 | | | | | | | | | |
Granted | | | 1,453 | | | | 67.08 | | | | | | | | | |
Exercised | | | (1,443 | ) | | | 12.68 | | | | | | | | | |
Forfeited | | | (1 | ) | | | 68.17 | | | | | | | | | |
| | | | | | | | | | | | | | | | |
Outstanding at December 31, 2013 | | | 5,720 | | | | 34.66 | | | | 7 | | | $ | 385,868 | |
Exercisable at December 31, 2013 | | | 1,971 | | | $ | 15.41 | | | | 5 | | | $ | 170,956 | |
|
| | | | | | | | | | | | |
| | Number of Shares | �� | Weighted Average Exercise Price | | Weighted Average Remaining Contractual Life (Years) | | Aggregate Intrinsic Value |
| Outstanding at December 31, 2013 | 5,720 |
| | $ | 34.66 |
| | | | |
|
| Granted | 675 |
| | 94.15 |
| | | | |
|
| Exercised | (855 | ) | | 17.17 |
| | | | |
|
| Forfeited | (3 | ) | | 37.44 |
| | | | |
|
| Outstanding at December 31, 2014 | 5,537 |
| | 44.61 |
| | | | |
|
| Granted | 747 |
| | 145.71 |
| | | | |
|
| Exercised | (1,118 | ) | | 20.71 |
| | | | |
|
| Forfeited | (2 | ) | | 19.61 |
| | | | |
|
| Outstanding at December 31, 2015 | 5,164 |
| | 64.43 |
| | | | |
| Granted | 846 |
| | 147.25 |
| | | | |
| Exercised | (827 | ) | | 28.43 |
| | | | |
|
| Forfeited | (27 | ) | | 95.33 |
| | | | |
|
| Outstanding at December 31, 2016 | 5,156 |
| | 83.64 |
| | 7 | | $ | 320,924 |
|
| Exercisable at December 31, 2016 | 2,311 |
| | 58.07 |
| | 6 | | $ | 198,460 |
|
We had
unvested options to purchase 3.5 million shares with a weighted average grant date exercise price of $44.55 as of December 31, 2013 and unvested options to purchase 2.8 million shares with a weighted average grant date exercise price of
$27.20$104.91 as of December 31,
2012.2016 and unvested options to purchase 3.1 million shares with a weighted average grant date exercise price of $78.86 as of December 31, 2015. As of December 31,
2013,2016, we had
$48.3$80.1 million of total unrecognized compensation cost related to unvested options, net of expected forfeitures, which is expected to be amortized over a weighted average amortization period of
four3.2 years.
Other information pertaining to option activity was as follows during the twelve months ended December 31:
| | | | | | | | | | | | |
| | | 2013 | | | 2012 | | | 2011 | |
Weighted average grant-date fair value of stock options granted | | $ | 23.27 | | | $ | 15.24 | | | $ | 9.91 | |
Total intrinsic value of stock options exercised | | | 99,393 | | | | 40,589 | | | | 12,289 | |
|
| | | | | | | | | | | |
| | 2016 | | 2015 | | 2014 |
| Weighted average grant-date fair value of stock options granted | $ | 46.89 |
| | $ | 45.17 |
| | $ | 31.32 |
|
| Total intrinsic value of stock options exercised | 103,703 |
| | 149,542 |
| | 69,768 |
|
Employee Stock Purchase Plan
Under our Employee Stock Purchase Plan (“ESPP”) participants may contribute up to 15% of their annual compensation to purchase common shares of Tyler. The purchase price of the shares is equal to 85% of the closing price of Tyler shares on the last day of each quarterly offering period. As of December 31, 2013,2016, there were 1.0 million847,000 shares available for future grants under the ESPP from the 2.0 million shares previously approved by the stockholders.(11)
Basic earnings and diluted earnings per share data were computed as follows:
| | | | | | | | | | | | |
| | | Years Ended December 31, | |
| | | 2013 | | | 2012 | | | 2011 | |
Numerator for basic and diluted earnings per share: | | | | | | | | | | | | |
Net income | | $ | 39,101 | | | $ | 32,994 | | | $ | 27,557 | |
| | | | | | | | | | | | |
Denominator: | | | | | | | | | | | | |
Weighted-average basic common shares outstanding | | | 31,891 | | | | 30,327 | | | | 31,267 | |
Assumed conversion of dilutive securities: | | | | | | | | | | | | |
Stock options | | | 2,699 | | | | 2,589 | | | | 1,887 | |
| | | | | | | | | | | | |
Denominator for diluted earnings per share—Adjusted weighted-average shares | | | 34,590 | | | | 32,916 | | | | 33,154 | |
| | | | | | | | | | | | |
Earnings per common share: | | | | | | | | | | | | |
Basic | | $ | 1.23 | | | $ | 1.09 | | | $ | 0.88 | |
| | | | | | | | | | | | |
Diluted | | $ | 1.13 | | | $ | 1.00 | | | $ | 0.83 | |
| | | | | | | | | | | | |
|
| | | | | | | | | | | |
| | Years Ended December 31, |
| | 2016 | | 2015 | | 2014 |
| Numerator for basic and diluted earnings per share: | | | | | |
| Net income | $ | 109,857 |
| | $ | 64,869 |
| | $ | 58,940 |
|
| Denominator: | |
| | |
| | |
|
| Weighted-average basic common shares outstanding | 36,448 |
| | 34,137 |
| | 33,011 |
|
| Assumed conversion of dilutive securities: | | | | | |
| Stock options | 2,513 |
| | 2,415 |
| | 2,390 |
|
Denominator for diluted earnings per share - Adjusted weighted-average shares | 38,961 |
| | 36,552 |
| | 35,401 |
|
| Earnings per common share: | |
| | |
| | |
|
| Basic | $ | 3.01 |
| | $ | 1.90 |
| | $ | 1.79 |
|
| Diluted | $ | 2.82 |
| | $ | 1.77 |
| | $ | 1.66 |
|
Stock options representing the right to purchase common stock of 62,000786,000 shares in 2013, 463,0002016, 417,000 shares in 2012,2015, and 714,000481,000 shares in 20112014 were not included in the computation of diluted earnings per share because their inclusion would have had an anti-dilutive effect.(12) During fourth quarter of 2016, we adopted ASU No. 2016-09 requiring the recognition of excess tax benefits as a component of income tax expense; these benefits were historically recognized in equity. As the standard required a prospective method of adoption, our 2016 net income includes a $29.6 million income tax benefit due to the adoption that did not occur in the comparable periods presented above. In addition, the standard updates the method of calculating diluted shares resulting in the inclusion of 519,000 additional shares in our diluted EPS calculation that is not comparable to the other periods presented. Refer to Note 1 "Summary of Significant Accounting Policies" for further discussion of this new accounting standard.
We lease office facilities for use in our operations, as well as transportation, computer and other equipment.
We also have an office facility lease agreement with an entity owned by an executive’s father and brother. The executive does not have an interest in the entity that leases the property to us and the lease arrangement existed at the time we acquired the business unit that occupies this property. Most of our leases are non-cancelable operating lease agreements and they expire at various dates through
2021.2023. In addition to rent, the leases generally require us to pay taxes, maintenance, insurance and certain other operating expenses.
Rent expense was approximately
$7.5$6.7 million in
2013,2016, $7.2 million in
2012,2015, and
$5.9$6.7 million in
2011,2014, which included rent expense associated with related party lease agreements of
$330,000 in 2016, $1.8 million in 2015, and $1.7 million in
2013, $1.7 million in 2012, and $1.8 million in 2011.2014.
Future minimum lease payments under all non-cancelable leases at December 31,
20132016 are as follows:
| | | | |
Years ending December 31, | | | |
2014 | | $ | 5,680 | |
2015 | | | 4,677 | |
2016 | | | 4,415 | |
2017 | | | 3,880 | |
2018 | | | 1,731 | |
Thereafter | | | 2,339 | |
| | | | |
| | $ | 22,722 | |
| | | | |
Included in future minimum lease payments are non-cancelable payments due to related parties of $1.7 million in 2014, $1.7 million in 2015, $1.7 million in 2016 and $1.7 million in 2017.
(13)
|
| | | |
| Years Ending December 31, | |
| 2017 | $ | 5,177 |
|
| 2018 | 4,221 |
|
| 2019 | 3,556 |
|
| 2020 | 3,273 |
|
| 2021 | 2,059 |
|
| Thereafter | 601 |
|
| Total | $ | 18,887 |
|
(12)EMPLOYEE BENEFIT PLANS We provide a defined contribution plan for the majority of our employees meeting minimum service requirements. The employees can contribute up to 30% of their current compensation to the plan subject to certain statutory limitations. We contribute up to a maximum of 3% of an employee’s compensation to the plan. We made contributions to the plan and charged operating results $3.8$6.9 million during 2013, $3.32016, $5.3 million during 2012,2015, and $2.9$4.3 million during 2011.(14) 2014.
(13)COMMITMENTS AND CONTINGENCIES Other than routine litigation incidental to our business, there are no material legal proceedings pending to which we are party or to which any of our properties are subject.(15)
(14)SEGMENT AND RELATED INFORMATION We are a major provider of integrated information management solutions and services for the public sector, with a focus on local and state governments.
We provide our software systems and services and appraisal services through four business units, which focus on the following products:
financial management, education and educationplanning, regulatory and maintenance software solutions;
financial management, and municipal courts, and land and vital records management software solutions;
courts and justice and public safety software solutions; and
appraisal and tax software solutions and property appraisal services.
In accordance with ASC 280-10, Segment Reporting, the financial management,
education and
educationplanning, regulatory and maintenance software solutions
unit,unit; financial management,
and municipal courts and land and vital records
management software solutions
unitunit; and the courts and justice
and public safety software solutions unit meet the criteria for aggregation and are presented in one reportable segment, Enterprise Software
Solutions (“
ESS”ES”). The
ESSES segment provides municipal and county governments and schools with software systems and services to meet their information technology and automation needs for mission-critical “back-office” functions such as financial management and courts and justice
and public safety processes. The Appraisal and Tax
Software Solutions and Services (“
ATSS”A&T”) segment provides systems and software that automate the appraisal and assessment of real and personal property as well as property appraisal outsourcing services for local governments and taxing authorities. Property appraisal outsourcing services include: the physical inspection of commercial and residential properties; data collection and processing; computer analysis for property valuation; preparation of tax rolls; community education; and arbitration between taxpayers and the assessing jurisdiction.
We evaluate performance based on several factors, of which the primary financial measure is business segment operating income. We define segment operating income for our business units as income before noncash amortization of intangible assets associated with their acquisition, interest expense and income taxes. Segment operating income includes intercompany transactions. The majority of intercompany transactions relate to contracts involving more than one unit and are valued based on the contractual arrangement. Segment operating income for corporate primarily consists of compensation costs for the executive management team and certain accounting and administrative staff and share-based compensation expense for the entire company. Corporate segment operating income also includes revenues and expenses related to a company-wide user conference. The accounting policies of the reportable segments are the same as those described in Note 1, “Summary of Significant Accounting Policies.”
Segment assets include net accounts receivable, prepaid expenses and other current assets and net property and equipment. Corporate assets consist of cash and investments, prepaid insurance, intangibles associated with acquisitions, deferred income taxes and net property and equipment mainly related to unallocated information and technology assets.
ESS
ES segment capital expenditures in
2013, 2012 and 20112016 included
$19.6$17.7 million
$3.0 million and $6.6 million, respectively for the
construction of a new building and purchaseexpansion of an existing building and
land in connection with plans to consolidate workforces and support long-term growth. ATSS segment capital expenditures in 2012 included $2.6 million for the purchase of a building and
land to support long-term growth.land.
As of andthe year ended December 31, 2013 | | | | | | | | | | | | | | | | |
| | | Enterprise
Software
Solutions | | | Appraisal and Tax
Software Solutions
and Services | | | Corporate | | | Totals | |
Revenues | | | | | | | | | | | | | | | | |
Software licenses and royalties | | $ | 38,774 | | | $ | 2,067 | | | $ | — | | | $ | 40,841 | |
Subscriptions | | | 59,070 | | | | 2,794 | | | | — | | | | 61,864 | |
Software services | | | 85,459 | | | | 7,808 | | | | — | | | | 93,267 | |
Maintenance | | | 175,180 | | | | 16,540 | | | | — | | | | 191,720 | |
Appraisal services | | | — | | | | 20,825 | | | | — | | | | 20,825 | |
Hardware and other | | | 6,342 | | | | — | | | | 1,784 | | | | 8,126 | |
Intercompany | | | 2,899 | | | | — | | | | (2,899 | ) | | | — | |
| | | | | | | | | | | | | | | | |
Total revenues | | $ | 367,724 | | | $ | 50,034 | | | $ | (1,115 | ) | | $ | 416,643 | |
Depreciation and amortization expense | | | 10,569 | | | | 1,028 | | | | 2,189 | | | | 13,786 | |
Segment operating income | | | 85,045 | | | | 9,428 | | | | (20,750 | ) | | | 73,723 | |
Capital expenditures | | | 22,457 | | | | 250 | | | | 3,438 | | | | 26,145 | |
Segment assets | | $ | 161,923 | | | $ | 16,244 | | | $ | 266,321 | | | $ | 444,488 | |
2016
|
| | | | | | | | | | | | | | | |
| | Enterprise Software | | Appraisal and Tax | | Corporate | | Totals |
| Revenues | | | | | | | |
| Software licenses and royalties | $ | 68,844 |
| | $ | 5,462 |
| | $ | — |
| | $ | 74,306 |
|
| Subscriptions | 135,516 |
| | 7,188 |
| | — |
| | 142,704 |
|
| Software services | 158,478 |
| | 16,326 |
| | — |
| | 174,804 |
|
| Maintenance | 304,380 |
| | 18,589 |
| | — |
| | 322,969 |
|
| Appraisal services | — |
| | 26,287 |
| | — |
| | 26,287 |
|
| Hardware and other | 11,942 |
| | 16 |
| | 3,015 |
| | 14,973 |
|
| Intercompany | 6,742 |
| | — |
| | (6,742 | ) | | — |
|
| Total revenues | $ | 685,902 |
| | $ | 73,868 |
|
| $ | (3,727 | ) |
| $ | 756,043 |
|
| Depreciation and amortization expense | 43,962 |
| | 984 |
| | 5,355 |
| | 50,301 |
|
| Segment operating income | 190,817 |
| | 18,286 |
| | (41,832 | ) | | 167,271 |
|
| Capital expenditures | 23,843 |
| | 1,432 |
| | 11,448 |
| | 36,723 |
|
| Segment assets | $ | 295,260 |
| | $ | 31,769 |
| | $ | 1,030,916 |
| | $ | 1,357,945 |
|
As of andthe year ended December 31, 2012 | | | | | | | | | | | | | | | | |
| | | Enterprise
Software
Solutions | | | Appraisal and Tax
Software Solutions
and Services | | | Corporate | | | Totals | |
Revenues | | | | | | | | | | | | | | | | |
Software licenses and royalties | | $ | 32,060 | | | $ | 1,868 | | | $ | — | | | $ | 33,928 | |
Subscriptions | | | 43,319 | | | | 1,299 | | | | — | | | | 44,618 | |
Software services | | | 76,103 | | | | 7,305 | | | | — | | | | 83,408 | |
Maintenance | | | 155,290 | | | | 16,561 | | | | — | | | | 171,851 | |
Appraisal services | | | — | | | | 22,543 | | | | — | | | | 22,543 | |
Hardware and other | | | 5,297 | | | | — | | | | 1,659 | | | | 6,956 | |
Intercompany | | | 2,249 | | | | — | | | | (2,249 | ) | | | — | |
| | | | | | | | | | | | | | | | |
Total revenues | | $ | 314,318 | | | $ | 49,576 | | | $ | (590 | ) | | $ | 363,304 | |
Depreciation and amortization expense | | | 9,929 | | | | 958 | | | | 1,824 | | | | 12,711 | |
Segment operating income | | | 71,135 | | | | 8,498 | | | | (16,889 | ) | | | 62,744 | |
Capital expenditures | | | 5,469 | | | | 3,382 | | | | 1,865 | | | | 10,716 | |
Segment assets | | $ | 134,160 | | | $ | 18,464 | | | $ | 186,042 | | | $ | 338,666 | |
2015
|
| | | | | | | | | | | | | | | |
| | Enterprise Software | | Appraisal and Tax | | Corporate | | Totals |
| Revenues | | | | | | | |
| Software licenses and royalties | $ | 54,376 |
| | $ | 4,632 |
| | $ | — |
| | $ | 59,008 |
|
| Subscriptions | 107,090 |
| | 4,843 |
| | — |
| | 111,933 |
|
| Software services | 129,068 |
| | 10,784 |
| | — |
| | 139,852 |
|
| Maintenance | 227,586 |
| | 17,951 |
| | — |
| | 245,537 |
|
| Appraisal services | — |
| | 25,065 |
| | — |
| | 25,065 |
|
| Hardware and other | 6,935 |
| | 12 |
| | 2,680 |
| | 9,627 |
|
| Intercompany | 4,025 |
| | — |
| | (4,025 | ) | | — |
|
| Total revenues | $ | 529,080 |
| | $ | 63,287 |
|
| $ | (1,345 | ) |
| $ | 591,022 |
|
| Depreciation and amortization expense | 15,413 |
| | 867 |
| | 3,294 |
| | 19,574 |
|
| Segment operating income | 141,401 |
| | 15,477 |
| | (38,490 | ) | | 118,388 |
|
| Capital expenditures | 6,112 |
| | 646 |
| | 6,746 |
| | 13,504 |
|
| Segment assets | $ | 265,877 |
| | $ | 22,283 |
| | $ | 1,068,410 |
| | $ | 1,356,570 |
|
As of andthe year ended December 31, 2011 | | | | | | | | | | | | | | | | |
| | | Enterprise
Software
Solutions | | | Appraisal and Tax
Software Solutions
and Services | | | Corporate | | | Totals | |
Revenues | | | | | | | | | | | | | | | | |
Software licenses and royalties | | $ | 30,194 | | | $ | 2,400 | | | $ | — | | | $ | 32,594 | |
Subscriptions | | | 30,400 | | | | 760 | | | | — | | | | 31,160 | |
Software services | | | 60,840 | | | | 8,777 | | | | — | | | | 69,617 | |
Maintenance | | | 130,999 | | | | 15,499 | | | | — | | | | 146,498 | |
Appraisal services | | | — | | | | 23,228 | | | | — | | | | 23,228 | |
Hardware and other | | | 5,199 | | | | — | | | | 1,095 | | | | 6,294 | |
Intercompany | | | 2,103 | | | | — | | | | (2,103 | ) | | | — | |
| | | | | | | | | | | | | | | | |
Total revenues | | $ | 259,735 | | | $ | 50,664 | | | $ | (1,008 | ) | | $ | 309,391 | |
Depreciation and amortization expense | | | 8,516 | | | | 650 | | | | 1,510 | | | | 10,676 | |
Segment operating income | | | 56,856 | | | | 9,786 | | | | (15,669 | ) | | | 50,973 | |
Capital expenditures | | | 11,143 | | | | 137 | | | | 998 | | | | 12,278 | |
Segment assets | | $ | 119,595 | | | $ | 20,535 | | | $ | 155,261 | | | $ | 295,391 | |
| | | | | | | | | | | | |
Reconciliation of reportable segment operating income to the Company’s consolidated totals: | | 2013 | | | 2012 | | | 2011 | |
Total segment operating income | | $ | 73,723 | | | $ | 62,744 | | | $ | 50,973 | |
Amortization of acquired software | | | (2,078 | ) | | | (1,888 | ) | | | (1,125 | ) |
Amortization of customer and trade name intangibles | | | (4,517 | ) | | | (4,279 | ) | | | (3,331 | ) |
Other expense, net | | | (1,309 | ) | | | (2,709 | ) | | | (2,404 | ) |
| | | | | | | | | | | | |
Income before income taxes | | $ | 65,819 | | | $ | 53,868 | | | $ | 44,113 | |
| | | | | | | | | | | | |
(16) 2014
|
| | | | | | | | | | | | | | | |
| | Enterprise Software | | Appraisal and Tax | | Corporate | | Totals |
| Revenues | | | | | | | |
| Software licenses and royalties | $ | 46,047 |
| | $ | 3,018 |
| | $ | — |
| | $ | 49,065 |
|
| Subscriptions | 84,322 |
| | 3,526 |
| | — |
| | 87,848 |
|
| Software services | 104,146 |
| | 9,675 |
| | — |
| | 113,821 |
|
| Maintenance | 195,881 |
| | 16,815 |
| | — |
| | 212,696 |
|
| Appraisal services | — |
| | 21,802 |
| | — |
| | 21,802 |
|
| Hardware and other | 5,398 |
| | 11 |
| | 2,460 |
| | 7,869 |
|
| Intercompany | 2,812 |
| | — |
| | (2,812 | ) | | — |
|
| Total revenues | $ | 438,606 |
| | $ | 54,847 |
|
| $ | (352 | ) |
| $ | 493,101 |
|
| Depreciation and amortization expense | 11,140 |
| | 866 |
| | 2,599 |
| | 14,605 |
|
| Segment operating income | 114,993 |
| | 11,603 |
| | (25,370 | ) | | 101,226 |
|
| Capital expenditures | 3,644 |
| | 359 |
| | 5,446 |
| | 9,449 |
|
| Segment assets | $ | 170,369 |
| | $ | 16,463 |
| | $ | 382,980 |
| | $ | 569,812 |
|
|
| | | | | | | | | | | | |
| Reconciliation of reportable segment operating | | Years Ended December 31, |
| income to the Company's consolidated totals: | | 2016 | | 2015 | | 2014 |
| Total segment operating income | | $ | 167,271 |
| | $ | 118,388 |
| | $ | 101,226 |
|
| Amortization of acquired software | | (22,235 | ) | | (4,440 | ) | | (1,858 | ) |
| Amortization of customer and trade name intangibles | | (13,731 | ) | | (5,905 | ) | | (4,546 | ) |
| Other (expense) income, net | | (1,998 | ) | | 381 |
| | (355 | ) |
| Income before income taxes | | $ | 129,307 |
| | $ | 108,424 |
|
| $ | 94,467 |
|
(15)QUARTERLY FINANCIAL INFORMATION (unaudited) The following table contains selected financial information from unaudited statements of income for each quarter of 20132016 and 2012. | | | | | | | | | | | | | | | | | | | | | | | | | | | | | | | | |
| | | Quarters Ended | |
| | | 2013 | | | 2012 | |
| | | Dec. 31 | | | Sept. 30 | | | June 30 | | | Mar. 31 | | | Dec. 31 | | | Sept. 30 | | | June 30 | | | Mar. 31 | |
Revenues | | $ | 110,735 | | | $ | 107,021 | | | $ | 103,088 | | | $ | 95,799 | | | $ | 95,368 | | | $ | 93,845 | | | $ | 91,368 | | | $ | 82,723 | |
Gross profit | | | 52,767 | | | | 49,549 | | | | 47,042 | | | | 43,845 | | | | 44,640 | | | | 44,944 | | | | 40,699 | | | | 37,419 | |
Income before income taxes | | | 19,062 | | | | 17,572 | | | | 15,053 | | | | 14,132 | | | | 15,035 | | | | 17,810 | | | | 11,682 | | | | 9,341 | |
Net income | | | 10,512 | | | | 11,049 | | | | 9,047 | | | | 8,493 | | | | 9,376 | | | | 10,832 | | | | 7,105 | | | | 5,681 | |
Earnings per diluted share | | | 0.30 | | | | 0.32 | | | | 0.26 | | | | 0.25 | | | | 0.28 | | | | 0.33 | | | | 0.22 | | | | 0.17 | |
Shares used in computing diluted earnings per share | | | 35,348 | | | | 34,764 | | | | 34,290 | | | | 33,948 | | | | 33,421 | | | | 32,986 | | | | 32,769 | | | | 32,530 | |
F-24
2015. |
| | | | | | | | | | | | | | | | | | | | | | | | | | | | | | | |
| | Quarters Ended |
| | 2016 | | 2015 |
| | Dec. 31 | | Sept. 30 | | June 30 | | Mar. 31 | | Dec. 31(b) | | Sept. 30 | | June 30 | | Mar. 31 |
| Revenues | $ | 193,281 |
| | $ | 194,497 |
| | $ | 188,972 |
| | $ | 179,293 |
| | $ | 158,916 |
| | $ | 150,845 |
| | $ | 146,295 |
| | $ | 134,966 |
|
| Gross profit | 92,817 |
| | 93,480 |
| | 86,936 |
| | 82,118 |
| | 73,222 |
| | 71,833 |
| | 68,253 |
| | 63,879 |
|
| Income before income taxes (a) | 35,119 |
| | 36,419 |
| | 30,195 |
| | 27,574 |
| | 19,540 |
| | 31,744 |
| | 29,781 |
| | 27,359 |
|
| Net income (a) | 31,196 |
| | 35,430 |
| | 25,007 |
| | 18,224 |
| | 8,618 |
| | 20,142 |
| | 18,836 |
| | 17,273 |
|
| Earnings per diluted share | $ | 0.80 |
| | $ | 0.91 |
| | $ | 0.65 |
| | $ | 0.47 |
| | $ | 0.23 |
| | $ | 0.55 |
| | $ | 0.52 |
| | $ | 0.48 |
|
Shares used in computing diluted earnings per share (a) | 38,975 |
| | 39,062 |
| | 38,738 |
| | 39,071 |
| | 37,864 |
| | 36,349 |
| | 36,097 |
| | 35,895 |
|
| |
| (a) | During fourth quarter 2016, we adopted ASU No. 2016-09 requiring the recognition of excess tax benefits as a component of income tax expense; these benefits were historically recognized in equity. As the standard required a prospective method of adoption, our fourth quarter 2016 net income includes a $9.2 million income tax benefit due to the adoption that did not occur in the comparable prior year periods presented above. The three months ended March 31, June 30, and September 30, 2016, respectively, have been adjusted for the newly adopted standard. Refer to Note 1 "Summary of Significant Accounting Policies" for further discussion of this new accounting standard. |
| |
| (b) | Operating results for the three months ended December 31, 2015, include $5.9 million for financial advisory, legal, accounting, due diligence, valuation and other expenses necessary to complete the NWS acquisition as well as $3.5 million amortization expense related to NWS acquisition intangibles. |