SECURITIES AND EXCHANGE COMMISSION
Washington, D.C. 20549FORM 10-K
(Mark One)
x |
| |
| ý | ANNUAL REPORT PURSUANT TO SECTION 13 OR 15(d) OF THE SECURITIES EXCHANGE ACT OF 1934 |
For the fiscal year ended December 31, 20132016
|
| |
| ¨ | TRANSITION REPORT PURSUANT TO SECTION 13 OR 15(d) OF THE SECURITIES EXCHANGE ACT OF 1934 |
For the transition period fromto Commission File Number: 000-20278
ENCORE WIRE CORPORATION
(Exact name of registrant as specified in its charter)
|
|
|
ENCORE WIRE CORPORATION (Exact name of registrant as specified in its charter) |
|
|
| | |
| Delaware | | 75-2274963 |
(State or other jurisdiction of
incorporation or organization) | | (I.R.S. Employer
Identification No.) |
| | |
McKinney, Texas | | 75069 |
(Address of principal executive offices) | | (Zip Code) |
Registrant’s telephone number, including area code: (972) 562-9473
Securities registered pursuant to Section 12(b) of the Act:
|
| | |
Title of each class | | Name of each exchange on which registered |
| Common Stock, par value $.01 per share | | The NASDAQ Global Select Market |
Securities registered pursuant to Section 12(g) of the Act: None Indicate by check mark if the registrant is a well-known seasoned issuer, as defined in Rule 405 of the Securities Act. ¨ Yes xý No Indicate by check mark if the registrant is not required to file reports pursuant to Section 13 or Section 15(d) of the Act. ¨ Yes xý No
Note – Checking the box above will not relieve any registrant required to file reports pursuant to Section 13 or 15(d) of the Exchange Act from their obligations under those Sections. Indicate by check mark whether the registrant (1) has filed all reports required to be filed by Section 13 or 15(d) of the Securities Exchange Act of 1934 during the preceding 12 months (or for such shorter period that the registrant was required to file such reports), and (2) has been subject to such filing requirements for the past 90 days. xý Yes ¨ No Indicate by check mark whether the registrant has submitted electronically and posted on its corporate Website, if any, every Interactive Data File required to be submitted and posted pursuant to Rule 405 of Regulation S-T (§232.405) of this chapter) during the preceding 12 months (or for such shorter period that the registrant was required to submit and post such files). xý Yes ¨ No Indicate by check mark if disclosure of delinquent filers pursuant to Item 405 of Regulation S-K (§229.405 of this chapter) is not contained herein, and will not be contained, to the best of registrant’s knowledge, in definitive proxy or information statements incorporated by reference in Part III of this Form 10-K or any amendment to this Form 10-K. ¨ Indicate by check mark whether the registrant is a large accelerated filer, an accelerated filer, a non-accelerated filer or a smaller reporting company. See the definitions of “large accelerated filer,” “accelerated filer” and “smaller reporting company” in Rule 12b-2 of the Exchange Act.
| |
| | | | |
| Large accelerated filer | | ¨ | ý | Accelerated filer | | x¨ |
| | | | |
| Non-accelerated filer | | ¨ (Do not check if a smaller reporting company) | | Smaller Reporting Company | | ¨ |
Indicate by check mark whether the registrant is a shell company (as defined in Rule 12b-2 of the Act). ¨ Yes xý No The aggregate market value of the Common Stock held by non-affiliates of the registrant computed by reference to the price at which the Common Stock was last sold as of the last business day of the registrant’s most recently completed second fiscal quarter was
$555,222,440$744,961,655 (Note: The aggregate market value of Common Stock held by the Company’s directors, executive officers, immediate family members of such directors and executive officers, 10% or greater stockholders and other stockholders deemed to be affiliates was excluded from the computation of the foregoing amount. The characterization of such persons as “affiliates” should not be construed as an admission that any such person is an affiliate of the Registrant for any other purpose).
Number of shares of Common Stock outstanding as of February 27, 2014: 20,712,40223, 2017: 20,736,248
DOCUMENTS INCORPORATED BY REFERENCE
Listed below are documents, parts of which are incorporated herein by reference, and the part of this report into which the document is incorporated:
| |
| (1) | Proxy statement for the 20142017 annual meeting of stockholders – Part III |
ENCORE WIRE CORPORATION
FORM 10-K
FOR THE YEAR ENDED DECEMBER 31, 2016
PART I
Encore Wire Corporation is a Delaware corporation, incorporated in 1989, with its principal executive office and manufacturing plants located at 1329 Millwood Road, McKinney, Texas 75069. The Company’s telephone number is (972) 562-9473. As used in this annual report, unless otherwise required by the context, the terms
“we,” “our,” “Company,” “Encore” and “Encore Wire” refer to Encore Wire Corporation and its consolidated entities.
Encore is a low-cost manufacturer of electrical building wire and cable. The Company is a significant supplier of building wire for interior electrical wiring in commercial and industrial buildings, homes, apartments, and manufactured housing.
The principal customers for Encore’s wire are wholesale electrical distributors, who sell building wire and a variety of other products to electrical contractors. The Company sells its products primarily through independent manufacturers’ representatives located throughout the United States and, to a lesser extent, through its own direct in-house marketing efforts.
Strategy
Encore’s strategy is to further expand its share of the building wire market primarily by emphasizing a high level of customer service and the addition of new products that complement its current product line, while maintaining and enhancing
its’its low-cost production
capabilities to help the Company prosper. The Company maintains product inventory levels sufficient to meet anticipated customer demand and believes that the speed and completeness with which it fills customer orders are key competitive advantages critical to marketing its products.capabilities. Encore’s low-cost production capability features an efficient plant design incorporating highly automated manufacturing equipment, an integrated production process and a
highly motivatedhighly-motivated work force.
Strategy
Encore’s strategy for expanding its share of the building wire markets emphasizes
Customer Service: Encore is highly focused on responding to customer
service and product innovations coupled with low-cost production.Customer Service. Responsiveness to customers is a primary focus of Encore,needs, with an emphasis on building and maintaining strong customer relationships. Encore seeks to establish customer loyalty by achieving a high order fill rate and rapidly handling customer orders, shipments, inquiries and returns. The Company maintains product inventories sufficient to meet anticipated customer demand and believes that the speed and completeness with which it fills orders are key competitive advantages critical to marketing its products.
Product Innovation.Innovation: Encore has been a leader in bringing new ideas to a commodity product. Encore pioneered the widespread use of color feeder sizes of commercial wire and colors in the residential non-metallic cable. The colors have improved on the jobon-the-job safety and reduced installation times for contractors. Encore Wire’s new patented SmartColor ID® system for metal-clad and armor cladarmor-clad cables allows for quick and accurate identification of gauge, number of conductors, wire and jacket type. Additionally, Encore currently has two patentednineteen patents and seventeentwenty-nine patent-pending innovations that range from process improvements to packaging solutions.
Low-Cost
Production.Production: Encore’s low-cost production capability features an efficient plant design and an incentivized work force.
Efficient Plant
Design.Design: Encore’s highly automated wire manufacturing equipment is integrated in an efficient design that reduces material handling, labor and in-process inventory.
Incentivized Work
Force.Force: The Company has a stock option plan
and a stock appreciation rights plan that
enhancesenhance the motivation of its salaried manufacturing supervisors. The Company also has a comprehensive safety program that emphasizes employee participation. The Company provides a 401(k) retirement savings plan to all
employees with at least one year of service.employees.
Encore offers an electrical building wire product line that consists primarily of NM-B cable, UF-B cable, THHN/THWN-2 and other types of wire products, including
metal cladmetal-clad and armored cable. All of these products are manufactured with copper or aluminum as the conductor.
The Company also purchases small quantities of other types of wire to re-sell to customers that buy products that the Company manufactures. The principal bases for differentiation among stock-keeping units (“SKUs”) are product type, conductor type, diameter, insulation, color and packaging.
Bare Copper: Bare copper conductors are used in overhead electrical transmission and distribution systems for grounding and bonding of electrical systems, and where high conductivity and flexibility are required for equipment and circuit grounding.
NM-B
Cable.Cable: Non-metallic sheathed cable is used primarily as interior wiring in homes, apartments and manufactured housing. NM-B cable is composed of either two or three insulated copper wire conductors, with an
un-insulateduninsulated ground wire, all sheathed in a polyvinyl chloride (“PVC”) jacket.
UF-B
Cable.Cable: Underground feeder cable is used to conduct power underground to outside lighting and other applications remote from
buildings.buildings or structures. UF-B cable is composed of two or three
PVCpolyvinyl chloride (PVC) insulated copper wire conductors, with an
un-insulateduninsulated ground wire, all jacketed in PVC.
SE Style
Cable.Cable (Style U): Service Entrance cable is primarily utilized as an
aboveground external service
dropentrance cable from the meter enclosure to the
meter base to theservice distribution equipment.
SESE-U style cable is composed of copper or aluminum multiple conductors, insulated with
PVCpolyvinyl chloride (PVC) or a single layer of cross-linked polyethylene (XLPE) insulation, all jacketed in
PVC.polyvinyl chloride (PVC).
SE Style Cable (Style R): Service Entrance cable is primarily utilized as an aboveground service entrance cable from the service disconnecting means to other remotely located electrical distribution equipment. SE-R style cable is composed of copper or aluminum multiple conductors, insulated with polyvinyl chloride (PVC) or a single layer of cross-linked polyethylene (XLPE) insulation, all jacketed in polyvinyl chloride (PVC).
THHN/THWN-2
Cable.Cable: THHN/THWN-2 cable is used primarily as
branch circuit, feeder
circuit and
branch wiring inservice entrance conductors within commercial and industrial
buildings.buildings and structures. It is composed of a copper or aluminum single conductor, either stranded or solid, and insulated with PVC, which is further coated with nylon. Users typically pull THHN/THWN-2 cable through cable tray or protective conduit
pipepipe.
XHHW-2: XHHW-2
Cable.XHHW-2 wirecable is
intended for general purpose applications utilized in conduit or other recognized raceways forused primarily as branch circuit, feeder and service
feeders,entrance conductors within commercial and
branch-circuit wiring.industrial buildings and structures. It is composed of a copper or aluminum single conductor, either stranded or solid, and with a single layer of cross-linked polyethylene (XLPE) insulation.
USE-2 Cable.
USE-2 or RHH or
RHW-2: USE-2, RHH or RHW-2
wire cable is intended for general purpose applications
utilized in
conduit or installed indirect burial, underground applications
as USE-2 or
as RHH or RHW-2 for either aboveground or underground applications in
recognizedlisted raceways for
branch circuit, feeder and service
feeders, and branch-circuit wiring.entrance conductors. It is composed of a copper or aluminum single conductor, either stranded or solid, and with a single layer of cross-linked polyethylene (XLPE) insulation suitable for wet locations.
Metal Clad
Tray Cable (Power and/or Control): Tray Cable is primarily used as branch circuit or feeders for power, lighting, control, and Armored Cable.Metal cladsignal circuits for direct installations in raceways, outdoor locations where supported by a messenger wire, in cable trays and armoreddirect burial in underground installations where evaluated for the specific condition of use. It is composed of copper or aluminum multiple conductors, insulated with polyvinyl chloride (PVC) or cross-linked polyethylene (XLPE) with either insulated or bare equipment grounding conductor, all jacketed in rugged polyvinyl chloride (PVC).
Metal-Clad Cable: Metal-clad cable is used primarily as branch circuit, feeder, and service conductors, primarily in multi-family dwellings, commercial and industrial buildings. It is composed of multiple conductors, either stranded or solid, and insulated with polyvinyl chloride (PVC), which are further coated with nylon or with a single layer of cross-linked polyethylene (XLPE) insulation and then fully encased in a flexible aluminum or steel “armored” protective sheathing.
Armored Cable: Armored cable is used primarily as branch circuit and
branch wiring,feeders, primarily in commercial and industrial buildings. It is composed of multiple conductors, either stranded or solid, and insulated with
PVC,polyvinyl chloride (PVC), which are further coated with nylon and then fully encased in a flexible aluminum or steel “armored” protective
sheath that eliminates the need to pull the wire through pipe or conduit.sheathing.
Photovoltaic Cable.Single-Conductor Cable: Photovoltaic (PV) style conductors and/or cables are designedprimarily intended for use as photovoltaic (PV) direct-current output circuit and source circuits between the PV arrays and combiner boxes. It is composed of a copper or aluminum single conductor, either stranded or solid, and with a single layer of cross-linked polyethylene (XLPE) insulation.
URD or UDC Cable: Underground Residential Distribution Cable (URD) or Underground Distribution Cable (UDC) is primarily for underground secondary distribution, as service entrance conductors underground, and as service laterals. It may be directly buried in earth or installed in an electrical duct system in both wet and dry locations. It is composed of a copper or aluminum single conductor, either stranded or solid, and with a single layer of cross-linked polyethylene (XLPE) insulation.
Mobile Home Feeder Cable: Mobile Home Feeder Cable is primarily for underground feeders to
meet the different needsmobile homes as defined in Article 550 of the
emerging Solar Industry by providing connections between PV panels, collector boxesNational Electrical Code®. It may be directly buried in earth or in a listed raceway system in both wet and
inverters;dry locations. It is composed of a copper or aluminum single conductor, either stranded or solid, and
where also allowed by the National Electric Code (NEC).Bare Copper.Bare copperwith a single layer of cross-linked polyethylene (XLPE) insulation.
Overhead Service Drop: Overhead Service Drop conductors are
used inprimarily for overhead
secondary distribution, as service entrance conductors overhead, and as service drop conductors from utility transformers to premise wiring systems. It is composed of electrical
transmissiongrade 1350 series aluminum alloy conductors, typically stranded, and
distribution systems for grounding electrical systems, and where high-conductivity and flexibility are required for equipment and circuit grounding.with a single layer of cross-linked polyethylene (XLPE) insulation.
The efficiency of Encore’s highly automated manufacturing facility is a key element of its low-cost production capability. Encore’s residential wire manufacturing lines have been integrated so that the handling of product is substantially reduced throughout the production process.
The manufacturing process for the Company’s various products involves multiple steps, including: casting, drawing, stranding, compounding, insulating,
cabling, jacketing and armoring.
Casting.
Casting: Rod is produced by melting sheets of copper cathode and copper scrap, casting the molten copper into a bar and rolling the hot copper bar into a 5/16 inch copper rod to be drawn into copper wire.
Drawing.
Drawing: Drawing is the process of reducing 5/16 inch copper rod through converging dies until the specified wire diameter is attained. The wire is then heated with electrical current to soften or “anneal” the wire to make it easier to handle.
Stranding.
Stranding: Stranding is the process of twisting together from seven to sixty-one individual
bare wire strands to form a single cable. The purpose of stranding is to improve the flexibility of wire while maintaining its electrical current carrying capacity.
PVC
Compounding.Compounding: PVC compounding is the process of mixing the various raw materials that are required to produce the PVC necessary to meet
U/L specifications
of Underwriters Laboratories, Inc. (“UL”) for the insulation and jacket requirements for the wire that is manufactured.
Insulating.
Insulating: Insulating is the process of extruding PVC over the solid or stranded wire.
Jacketing.
Cabling: Cabling is the process of twisting together two or more insulated conductors to form a cable.
Jacketing: Jacketing is the process of extruding PVC over two or more insulated conductor wires, with or without an
un-insulateduninsulated ground wire, to form a finished product. The Company’s jacketing lines are integrated with packaging lines that cut the wire and coil it onto reels or package it in boxes or shrink-wrap. Jacketing also comprises extruding a nylon covering over some
PVC insulatedPVC-insulated products, such as THHN/THWN-2.
Metal Cladding
Metal-Cladding and
Armoring.Metal claddingArmoring: Metal-cladding and armoring is the process of covering two or more insulated conductor wires, with or without an
un-insulateduninsulated ground wire, with a spiral interlocking cover of aluminum or steel to form a finished product.
Encore manufactures and tests all of its products in accordance with the
standards of Underwriters Laboratories
Inc. (“U/L”),(UL) standards, a nationally recognized testing and standards agency. Encore’s machine operators and quality control inspectors conduct routine product
tests.inspections. The Company tests finished products for electrical continuity to ensure compliance with its own quality standards and those of
U/L.UL. Encore’s manufacturing lines are equipped with laser micrometers to measure wire diameter and insulation thickness while the lines are in operation. During each shift, operators perform and record routine physical measurements of products, all of which are separately verified and approved by quality control inspectors. Although suppliers pre-test PVC and nylon compounds, the Company tests products for aging, cracking and brittleness of insulation and jacketing. Additionally, UL representatives routinely visit and test products from each area of manufacturing.
Encore sells its wire
principally to wholesale electrical distributors throughout the United
States and, to a lesser extent, to retail home improvement centers.States. Most distributors supply products to electrical contractors. Encore’s customer base is numerous and diversified. Encore has
two customers, each of whom slightly exceed 10% of the Company's total sales. Encore has no customer, the loss of which would have a material adverse effect on the Company.
Encore believes that the speed and completeness with which it fills customers’ orders is crucial to its ability to expand the market share for its products. The Company also believes that,
in order to reduce costs,for a variety of reasons, many customers
do notstrive to maintain
substantiallean inventories. Because of this trend, the Company seeks to maintain sufficient inventories to satisfy customers’ prompt delivery requirements.
Marketing and Distribution
Encore markets its products throughout the United States primarily through independent manufacturers’ representatives and, to a lesser extent, through its own direct marketing efforts.
Encore maintains the majority of its finished product inventory at its plant in McKinney, Texas. In order to provide flexibility in handling customer requests for immediate delivery, of the Company’s products, additional product inventories are maintained at warehouses owned and operated by independent manufacturers’ representatives located throughout the United States. As of December 31, 2013, additional product inventories are maintained at the warehouses of independent manufacturers’ representatives located in Chattanooga, Tennessee;TN; Norcross, Georgia;GA; Cincinnati, Ohio;OH; Canton, Michigan; Edison, New Jersey;MI; Fairless Hills, PA; Louisville, Kentucky;KY; Greensboro, North Carolina;NC; Pittsburgh, Pennsylvania;PA; Santa Fe Springs, California;CA; Hayward, California;CA; Portland, OR, and
Lakeland,
Florida.FL. Some of these manufacturers’ representatives, as well as the Company’s other manufacturers’ representatives, maintain offices without warehouses in numerous locations throughout the United States.
Finished goods are typically delivered to warehouses and customers by trucks operated by common carriers. The decision regarding the carrier to be used is based primarily on availability and cost.
The Company invoices its customers directly for products purchased and, if an order has been obtained through a manufacturer’s representative, pays the representative a commission based on pre-established rates. The Company determines customer credit limits. The Company recorded
nominalno bad debt charges in
2013, 2012,2016, 2015, and
2011.2014. The manufacturers’ representatives have no discretion to determine prices charged for the Company’s products, and all sales are subject to
approval by the Company.Company approval. Encore sells all of its products with a one-year replacement warranty. Warranty expenses have historically been nominal.
Encore believes that its hourly employees are highly motivated and that their motivation contributes significantly to the plant’s efficient operation.
The Company attributes the motivation of these employees largely to the fact that Encore offers competitive hourly compensation that is directly tied to productivity and quality standards. The Company believes that competitive hourly compensation coupled with sound management practices focuses its employees on maintaining high production standards and product quality.
As of December 31,
2013,2016, Encore had
1,1081,253 employees,
9431,060 of whom were paid hourly wages and were primarily engaged in the operation and maintenance of the Company’s manufacturing and warehouse
facility.facilities. The
rest of the Company’s
remaining employees were executive, supervisory, administrative, sales and clerical personnel. The Company considers its relations with its employees to be good. The Company has no collective bargaining agreements with any of its employees.
The principal raw materials used by Encore in manufacturing its products are copper cathode, copper scrap, PVC thermoplastic compounds, XLPE compounds, aluminum, steel, paper and nylon, all of which are readily available from a number of suppliers. Copper is the principal raw material used by the Company in manufacturing its products, constituting
nearly 85.6%77.8% of the dollar value of all raw materials used by the Company during
2013.2016. Copper requirements are purchased primarily from miners and commodity brokers at prices determined each month primarily based on the average daily COMEX closing prices for copper for that month, plus a negotiated premium. The Company also purchases raw materials necessary to manufacture various PVC thermoplastic compounds. These raw materials include PVC resin, clay and plasticizer.
The Company produces copper rod from purchased copper
cathodescathode and copper scrap in its own rod fabrication facility. The Company reprocesses copper scrap generated by its operations
andas well as copper scrap purchased from others. In
2013,2016, the Company’s copper rod fabrication facility manufactured the majority of the Company’s copper rod requirements. The Company purchases aluminum rod
from various suppliers for aluminum wire production.
The Company also compounds its own wire jacket and insulation compounds. The process involves the mixture of PVC raw material components to produce the PVC used to insulate the Company’s wire and cable products. The raw materials include PVC resin, clay and plasticizer. During the last year, the Company’s plastic compounding facility produced virtually all of the Company’s PVC requirements.
The electrical wire and cable industry is highly competitive. The Company competes with several companies who manufacture and sell wire and cable products beyond the building wire segment in which the Company competes. The Company’s primary competitors include Southwire Company, Cerro Wire LLC,
United Copper Industries, General Cable Corporation and AFC Cable Systems, Inc.
The principal elements of competition in the electrical wire and cable industry are, in the
Company's opinion,
of the Company, order fill rate, quality, pricing, and, in some instances, breadth of product line. The Company believes that it is competitive with respect to all of these factors.
Competition in the electrical wire and cable industry, although intense, has been primarily from U.S. manufacturers, including foreign-owned facilities located in the United States. The Company has encountered little significant competition from imports of building wire. The Company believes this is primarily because direct labor costs generally account for a relatively small percentage of the cost of goods sold for these products and freight costs are relatively high to bring wire to the United States from overseas.
Compliance with Environmental Regulations
The Company is subject to federal, state and local environmental protection laws and regulations governing the Company’s operations and the use, handling, disposal and remediation of hazardous substances currently or formerly used by the Company. Management believes the Company is in compliance with all such rules including permitting and reporting requirements. Historically, compliance with such laws and regulations has not had a material impact on the capital expenditures, earnings and competitive position of the Company.
Research and Development Activities
The Company classifies research and development activities as a component of production overhead.
ResearchCosts attributable to Company-sponsored research and development
costsactivities were approximately
$1.5$2.0 million,
$1.6$1.8 million and
$1.0$1.7 million for the years ended December 31,
2013, 20122016, 2015 and
2011,2014, respectively.
Research and development costs attributable to customer-sponsored research activities performed by the Company were insignificant.Intellectual Property Matters
From time to time, the Company files patent applications with the United States Patent and Trademark Office. The Company currently owns several patents and pending patent applications. The Company also owns several registered trademarks and pending trademark applications with the U.S. Patent and Trademark Office. The current registrations for the marks will expire on various dates between
20152017 and 2023, but each registration can be renewed indefinitely as long as the respective mark continues to be used in commerce and the requisite proof of continued use or renewal application, as applicable, is filed. These trademarks provide source identification for the goods manufactured and sold by the Company and allow the Company to achieve brand recognition within the industry.
Internet Address/SEC Filings
The Company’s Internet address is http://www.encorewire.com. Under the
“Investors Info”“Investors” section of our website, the Company provides a link to our electronic Securities and Exchange Commission (“SEC”) filings, including our annual report on Form 10-K, our quarterly reports on Form 10-Q, our current reports on Form 8-K, director and officer beneficial ownership reports filed pursuant to Section 16 of the Securities Exchange Act of 1934, as amended, and any amendments to these reports. All such reports are available free of charge and are available as soon as reasonably practicable after the Company files such material with, or furnishes it to, the SEC.
The public may read and copy any materials the Company files with the SEC at the SEC’s Public Reference Room at 100 F Street, NE, Washington, DC 20549. The public may obtain information on the operation of the Public Reference Room by calling the SEC at 1-800-SEC-0330. The SEC maintains an Internet site that contains reports, proxy and information statements, and other information regarding issuers that file electronically with the SEC at http://www.sec.gov.
The following are risk factors that could affect the Company’s business, financial results and results of operations. These risk factors should be considered in connection with evaluating the forward-looking statements contained in this Annual Report on Form 10-K because these factors could cause the actual results and conditions to differ materially from those projected in forward-looking statements. Before purchasing the Company’s stock, an investor should know that making such an investment involves some risks, including the risks described below. If any of the risks mentioned below or other unknown risks actually occur, the Company’s business, financial condition or results of operations could be negatively affected. In that case, the trading price of its stock could fluctuate significantly.
Product Pricing and Volatility of Copper Market
Price competition for copper electrical wire and cable is intense, and the Company sells its productproducts in accordance with prevailing market prices. Wire prices can, and frequently do, change on a daily basis. This competitive pricing market for wire does not always mirror changes in copper prices, making margins highly volatile. Copper, a commodity product, is the principal raw material used in the Company’s manufacturing operations. Copper accounted for approximately 77.6%65.2%, 79.0%72.1% and 86.1%74.7% of the costs of goods sold by the Company during 2013, 20122016, 2015 and 2011,2014, respectively, and the Company expects that copper will continue to account for a significant portion of these costs in the future. The price of copper fluctuates depending on general economic conditions and in relation to supply and demand and other factors, and it causes monthly variations in the cost of copper purchased by the Company. The SEC has recently issued an order amending a rule to allowallows shares of a physically backed copper exchange traded fundfunds (“ETF”ETFs”) to be listed and publicly traded. Such fundfunds and other copper ETFs like it hold copper cathode as collateral against their shares. The acquisition of copper cathode by Copper ETFs may materially decrease or interrupt the availability of copper for immediate delivery in the United States, which could materially increase the Company’s cost of copper. In addition to rising copper prices and potential supply shortages, we believe that ETFs and similar copper-backed derivative products could lead to increased copper price volatility. The
Company cannot predict future copper prices or the effect of fluctuations in the costs of copper on the Company’s future operating results. Consequently, fluctuations in copper prices caused by market forces can significantly affect the Company’s financial results. With the volatility of both raw material prices and wire prices in the Company’s end market, hedging raw materials can be risky. Historically, the Company has not engaged in hedging strategies for raw material purchases.
Operating Results May Fluctuate
Encore’s
quarterly results of operations may fluctuate as a result of a number of factors, including fluctuation in the demand for and shipments of the Company’s products. Therefore,
quarter-to-quarter comparisons of results of operations have been and will be impacted by the volume of such orders and shipments. In addition,
itsthe Company's operating results could be adversely affected by the following factors, among others, such as variations in the mix of product sales, price changes in response to competitive factors, increases in raw material costs and other significant costs, the loss of key manufacturer’s representatives who sell the Company’s product line, increases in utility costs (particularly electricity and natural gas) and various types of insurance coverage and interruptions in plant operations resulting from the interruption of raw material supplies and other factors.
Reliance on Senior Management
Encore’s future operating results depend, in part, upon the continued service of its senior management, Mr. Daniel L. Jones, the
Chairman, President and Chief Executive Officer, and Mr. Frank J. Bilban, the Company’s Vice President and Chief Financial Officer (neither of whom are bound by an employment agreement). The Company’s future success will depend upon its continuing ability to attract and retain highly qualified managerial and technical personnel. Competition for such personnel is intense, and there can be no assurance that the Company will retain its key managerial and technical employees or that it will be successful in attracting, assimilating or retaining other highly qualified personnel in the future.
Industry Conditions and Cyclicality
The residential, commercial and industrial construction industry, which is the end user of the Company’s products, is cyclical and is affected by a number of factors, including the general condition of the economy, market demand and changes in interest
rates, among other factors.rates. Industry sales of electrical wire and cable products tend to parallel general construction activity, which includes remodeling.
Housing constructionConstruction activity in the United States
declined significantlysuffered through a severe recession in
20062008 through 2012. Construction began to pick up in strongly in 2013 and continued
its downward trenddoing well through
2010, improving somewhat in 2011 through 2013. Nationally, commercial2016. While volumes were not at "boom" levels nationally, there were regional pockets of strength, such as Texas, while other regions of the country had lower levels of activity. According to various industry and national economic forecasts, the future is unclear for the next few years. Data on remodeling is not as readily available. However, remodeling activity historically trends up when new construction
had been strong through 2007, but slowed significantly in 2008, and continued downward through 2012, improving slightly in 2013. The ongoing sluggish economy in the United States and the overhang of excess housing and commercial and industrial buildings may have a negative impact on the construction industry for some time to come.slows down.
Deterioration in the financial condition of the Company’s customers due to
current industry and economic conditions may result in reduced sales, an inability to collect receivables and payment delays or losses due to a customer’s bankruptcy or insolvency. Although the Company’s bad debt experience has been
relatively low
even in recent years, the Company’s inability to collect receivables may increase the amounts the Company must expense against its bad debt reserve, decreasing the Company’s profitability.
TheA downturn in the residential, commercial or industrial construction industries and general economic conditions as a whole may
continue to have a material adverse effect on the Company.
Environmental Liabilities
The Company is subject to federal, state and local environmental protection laws and regulations governing the Company’s operations and the use, handling, disposal and remediation of hazardous substances currently or formerly used by the Company. A risk of environmental liability is inherent in the Company’s current manufacturing activities in the event of a release or discharge of a hazardous substance generated by the Company. Under certain environmental laws, the Company could be held jointly and severally responsible for the remediation of any hazardous substance contamination at the Company’s facilities and at third party waste disposal sites and could also be held liable for any consequences arising out of human exposure to such substances or other environmental damage. There can be no assurance that the costs of complying with environmental, health and safety laws and requirements in the Company’s current operations or the liabilities arising from past releases of, or exposure to, hazardous substances, will not result in future expenditures by the Company that could materially and adversely affect the Company’s financial results, cash flow or financial condition.
The electrical wire and cable industry is highly competitive. The Company competes with several manufacturers of wire and cable products that have substantially greater resources than the Company. Some of these competitors are owned and operated by large, diversified companies. The principal elements of competition in the wire and cable industry are, in the opinion of the Company, pricing, product availability and quality and, in some instances, breadth of product line. The Company believes that it is competitive with respect to all of these factors. While the number of firms producing wire and cable has declined in the past, there can be no assurance that new competitors will not emerge or that existing producers will not employ or improve upon the Company’s manufacturing and marketing strategy.
Patent and Intellectual Property Disputes
Disagreements about patents and intellectual property rights occur in the wire and cable industry. The unfavorable resolution of a patent or intellectual property dispute could preclude the Company from manufacturing and selling certain products or could require the Company to pay a royalty on the sale of certain products. Patent and intellectual property disputes could also result in substantial legal fees and other costs.
Common Stock Price May Fluctuate
Future announcements concerning Encore or its competitors or customers, quarterly variations in operating results, announcements of technological innovations, the introduction of new products or changes in product pricing policies by the Company or its competitors, developments regarding proprietary rights, changes in earnings estimates by analysts or reports regarding the Company or its industry in the financial press or investment advisory publications, among other factors, could cause the market price of the
Common Stockcommon stock to fluctuate substantially. These fluctuations, as well as general economic, political and market conditions, such as recessions, world events, military conflicts or market or market-sector declines, may materially and adversely affect the market price of the
Common Stock.common stock.
Beneficial Ownership of the Company’s Common Stock by a Small Number of Stockholders
A small number of significant stockholders beneficially own greater than
40%44% of the
Company’s outstanding common
stock of the Company.stock. Depending on stockholder turnout for a stockholder vote, these stockholders, acting together, could be able to control the election of directors and certain matters requiring majority approval by the Company’s stockholders. The interests of this group of stockholders may not always coincide with the Company’s interests or the interests of other stockholders.
In the future, these stockholders could sell large amounts of common stock over relatively short periods of time.
In February 2012, the Company entered into a Registration Rights Agreement with Capital Southwest Corporation and Capital Southwest Venture Corporation (together, the “Capital Southwest”), pursuant to which the Company agreed to register the offer and sale of an aggregate of 4,086,750 shares of the Company’s common stock held by Capital Southwest on a registration statement on Form S-3 (the “Registration”). On May 14, 2012, the Company repurchased 2,774,250 shares of common stock owned by Capital Southwest Venture Corporation at an aggregate purchase price of $66,638,000, based on a price of $24.02 per share. The Company cannot predict if, when or in what amounts
Capital Southwest willstockholders may sell any of
the other shares covered by the Registration. However, the Registration enables Capital Southwest to sell all of such shares in the public market without any volume limitation, subject to certain trading restrictions.their shares. Sales of substantial amounts of the Company’s common stock in the public market by existing stockholders or the perception that these sales could occur, may adversely affect the market price of our common stock by creating a public perception of difficulties or problems with the Company’s business.
Future Sales of Common Stock Could Affect the Price of the Common Stock
No prediction can be made as to the effect, if any, that future sales of shares or the availability of shares for sale will have on the market price of the Common Stockcommon stock prevailing from time to time. Sales of substantial amounts of Common Stock,common stock, or the perception that such sales might occur, could adversely affect prevailing market prices of the Common Stock.common stock.
Cybersecurity Breaches and other Disruptions to our Information Technology Systems
The efficient operation of our business is dependent on our information technology systems to process, transmit and store sensitive electronic data, including employee, distributor and customer records, and to manage and support our business operations and manufacturing processes. The secure maintenance of this information is critical to our operations. Despite our security measures, our information technology system may be vulnerable to attacks by hackers or breaches due to errors or malfeasance by employees and others who have access to our system, or other disruptions during the process of upgrading or replacing computer software or hardware, power outages, computer viruses, telecommunication or utility failures or natural disasters. Any such event could compromise our information technology system, expose our customers, distributors and employees to risks of misuse of confidential information, impair our ability to effectively and timely operate our business and manufacturing processes, and cause other disruptions, which could result in legal claims or proceedings, disrupt our operations and the services we provide to customers, damage our reputation, and cause a loss of confidence in our products and services, any of which could adversely affect our results of operations and competitive position.
Regulations Related to Conflict-free Minerals May Force Us to Incur Additional Expenses.
In August 2012, the SEC adopted disclosure requirements related to certain minerals sourced from the Democratic Republic of Congo or adjoining countries, as required by Section 1502 of the Dodd-Frank Wall Street Reform and Consumer Protection Act (the “Dodd-Frank Act”). The SEC rules implementing Section 1502 of the Dodd-Frank Act require us to perform due diligence, and report whether “conflict minerals,” which are defined as tin, tantalum, tungsten and gold, necessary to the functionality of a product we purchase originated from the Democratic Republic of Congo or an adjoining country. Since 2014, we have been required to file with the SEC on an annual basis a specialized disclosure report on Form SD regarding such matters. As our supply chain is complex, we may incur significant costs to determine the source and custody of conflict minerals that are used in the manufacture of our products in order to comply with these regulatory requirements in the future. We may also face reputation challenges if we are unable to verify the origins for all conflict minerals used in our products, or if we are unable to conclude that our products are “conflict free.” Over time, conflict minerals reporting requirements may affect the sourcing, price and availability of our products, and may affect the availability and price of conflict minerals that are certified as conflict free. Accordingly, we may incur significant costs as a consequence of regulations related to conflict-free minerals, which may adversely affect our business, financial condition or results of operations.
Item 1B. Unresolved Staff Comments.
None
Encore maintains its corporate office and manufacturing plants in McKinney, Texas, approximately 35 miles north of Dallas. The Company’s facilities are located on a combined site of approximately 425430 acres and consist of buildings containing approximately 1.62.1 million square feet of floor space. The plant and equipment are owned by the Company and are not mortgaged to secure any of the Company’s existing indebtedness. Encore believes that its plant and equipment are suited to its present needs, comply with applicable federal, state and local laws and regulations, and are properly maintained and adequately insured.
Item 3. Legal Proceedings.
A description of the Company’s legal proceedings is contained in Note 9 to the Company’s consolidated financial statements included in Item 8 to this report and incorporated herein by reference.
Item 4. Mine Safety
DisclosuresDisclosures.
EXECUTIVE OFFICERS OF THE COMPANY
Information regarding Encore’s executive officers including their respective ages as of February
28, 2014,24, 2017, is set forth below:
|
| | | |
Name | Age | | Age
| | Position with Company |
| Daniel L. Jones | | 5053 | | President, Chief Executive Officer, and MemberChairman of the Board of Directors, President and Chief Executive Officer |
| | | |
| Frank J. Bilban | | 5760 | | Vice President – Finance, Treasurer, Secretary, and Chief Financial Officer |
Mr. Jones has held the office of President and Chief Executive Officer of the Company since February 2006. He performed the duties of the Chief Executive Officer in an interim capacity from May 2005 to February 2006. From May 1998 until February
2006,2005, Mr. Jones was President and Chief Operating Officer of the Company. He previously held the positions of Chief Operating Officer from October 1997 until May 1998, Executive Vice President from May 1997 to October 1997, Vice President-Sales and Marketing from 1992 to May 1997, after serving as Director of Sales since joining the Company in November 1989. He has also served as a member of the Board of Directors since May
1994.1992, and was named Chairman of the Board in 2014.
Mr. Bilban has served as Vice President-Finance, Treasurer, Secretary and Chief Financial Officer of Encore since June 2000. From 1998 until joining the Company in June 2000, Mr. Bilban was Executive Vice President and Chief Financial Officer of Alpha Holdings, Inc., a plastics manufacturing conglomerate. From 1996 until 1998, Mr. Bilban was Vice President and Chief Financial Officer of Wedge Dia-Log Inc., an oil field services company.
All executive officers are elected annually by the Board of Directors to serve until the next annual meeting of the Board or until their respective successors are chosen and qualified.
PART II
Item 5. Market for Registrant’s Common Equity, Related Stockholder Matters and Issuer Purchases of Equity Securities.
The Company’s
Common Stockcommon stock is traded and quoted on the NASDAQ Stock Market’s Global Select Market under the symbol “WIRE.” The following table sets forth the high and low intraday sales prices per share for the
Common Stockcommon stock as reported by NASDAQ for the periods indicated.
| | | | | | | | |
| | | High | | | Low | |
2013 | | | | | | | | |
First Quarter | | $ | 35.41 | | | $ | 30.69 | |
Second Quarter | | | 35.90 | | | | 31.46 | |
Third Quarter | | | 42.48 | | | | 34.07 | |
Fourth Quarter | | | 54.84 | | | | 37.95 | |
2012 | | | | | | | | |
First Quarter | | $ | 30.74 | | | $ | 25.16 | |
Second Quarter | | | 30.19 | | | | 23.58 | |
Third Quarter | | | 30.49 | | | | 25.37 | |
Fourth Quarter | | | 32.64 | | | | 29.27 | |
|
| | | | | | | |
| | High | | Low |
| 2016 | | | |
| First Quarter | $ | 40.13 |
| | $ | 32.96 |
|
| Second Quarter | 41.46 |
| | 35.40 |
|
| Third Quarter | 43.78 |
| | 34.03 |
|
| Fourth Quarter | 46.40 |
| | 33.70 |
|
| | | | |
| 2015 | | | |
| First Quarter | $ | 38.10 |
| | $ | 29.36 |
|
| Second Quarter | 48.50 |
| | 37.05 |
|
| Third Quarter | 46.32 |
| | 30.23 |
|
| Fourth Quarter | 44.95 |
| | 31.89 |
|
As of February
27, 2014,23, 2017, there were
4133 holders of record
holders of the Company’s
Common Stock.common stock.
The Company paid its first cash dividend in January 2007 and has continued paying quarterly dividends of two cents per share through
2013.2016. Aside from periodic dividends, management intends to retain the majority of future earnings for the operation and expansion of the Company’s business.
Issuer Purchases of Equity Securities
On November 10, 2006, the Board of Directors approved a stock repurchase program authorizing the Company to repurchase up to
1,000,000an authorized number of shares of its common stock
through December 31, 2007 on the open market or through privately negotiated transactions at prices determined by the President of the
Company.Company during the term of the program. The Company’s Board of
Directors has subsequently authorized several increases and annual extensions of this stock repurchase program. Asprogram, and, as of December 31, 2013, the2016, 1,132,946 shares remained authorized for repurchase authorization had 1,225,750 shares remaining authorized through March 31, 2015.2018. The Company did not repurchase any shares of its stock in 2013. On May 14, 2012, the2016 and 2014. The Company repurchased 2,774,25092,804 shares of commonits stock owned by Capital Southwest Venture Corporation at an aggregate purchase pricein the third quarter of $66,638,000, based on2015, its only purchases in 2015. The Company also has a price of $24.02 per share. Appropriate consentsbroker agreement to the repurchase were also obtained from lenders under the Company’s Financing Agreement. The repurchase represented approximately 11.8% of the Company’s outstanding shares as of the purchase date and was the only repurchasestock in 2012. Other than the Company’s repurchase of 2,774,250 shares of common stock owned by Capital Southwest Venture Corporation on May 14, 2012, all shares purchased under the program were purchased on the open market by the Company’s brokerat certain trigger points pursuant to a Rule 10b5-1 plan announced on November 28, 2007.
Equity Compensation Plan Information The following table provides information about the Company’s equity compensation plans as of December 31,
2013. | | | | | | | | | | | | |
| | | Number of securities to be issued upon exercise of outstanding options, warrants and rights | | | Weighted-average exercise price of outstanding options, warrants and rights | | | Number of securities remaining available for future issuance under equity compensation plans (excluding securities reflected in column (a)) | |
PLAN CATEGORY | | (a) | | | (b) | | | (c) | |
Equity compensation plans approved by security holders | | | 345,150 | | | $ | 25.03 | | | | 343,500 | |
Equity compensation plans not approved by security holders | | | 0 | | | | 0 | | | | 0 | |
| | | | | | | | | | | | |
TOTAL | | | 345,150 | | | $ | 25.03 | | | | 343,500 | |
| | | | | | | | | | | | |
2016.
|
| | | | | | | | | |
| | Number of securities to be issued upon exercise of outstanding options, warrants and rights | | Weighted-average exercise price of outstanding options, warrants and rights | | Number of securities remaining available for future issuance under equity compensation plans (excluding securities reflected in column (a)) |
| PLAN CATEGORY | (a) | | (b) | | (c) |
| Equity compensation plans approved by security holders | 351,400 |
| | $ | 31.28 |
| | 172,300 |
|
The following graph is not “soliciting material,” is not deemed filed with the SEC, and is not to be incorporated by reference into any of the Company’s filings under the Securities Act of 1933 or the Securities Exchange Act of 1934, as amended, respectively.
The graph below sets forth the cumulative total stockholder return, which assumes reinvestment of dividends, of a $100 investment in the Company’s
Common Stock,common stock, the Russell 2000 Index, and the Company’s self-determined peer group for the
yearfive years ended December 31,
2013, and the Russell 2000 Index.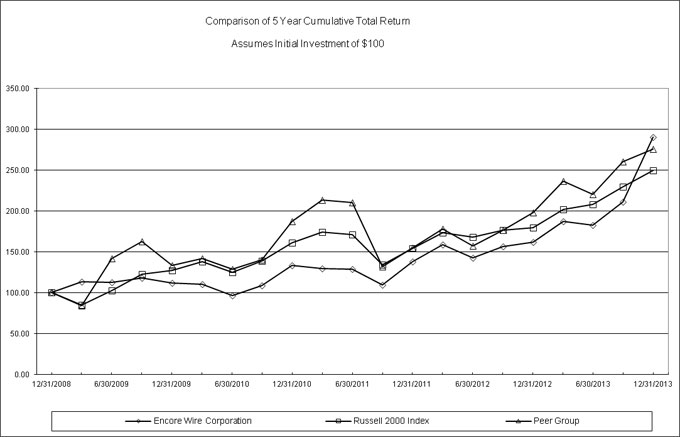
| | | | | | | | | | | | | | | | | | | | | | | | | | | | | | |
Symbol | | Total Return For: | | 12/31/2008 | | | 3/31/2009 | | | 6/30/2009 | | | 9/30/2009 | | | 12/31/2009 | | | 3/31/2010 | | | 6/30/2010 | |
¿ | | Encore Wire Corporation | | | 100.00 | | | | 113.03 | | | | 112.71 | | | | 118.16 | | | | 111.44 | | | | 110.22 | | | | 96.50 | |
n | | Russell 2000 Index | | | 100.00 | | | | 85.03 | | | | 102.62 | | | | 122.39 | | | | 127.09 | | | | 138.30 | | | | 124.57 | |
p | | Peer Group | | | 100.00 | | | | 84.18 | | | | 141.97 | | | | 162.79 | | | | 133.47 | | | | 141.72 | | | | 128.45 | |
| | | | | | | | |
Symbol | | Total Return For: | | 9/30/2010 | | | 12/31/2010 | | | 3/31/2011 | | | 6/30/2011 | | | 9/30/2011 | | | 12/31/2011 | | | 3/31/2012 | |
¿ | | Encore Wire Corporation | | | 108.91 | | | | 133.18 | | | | 129.46 | | | | 128.93 | | | | 109.55 | | | | 138.00 | | | | 158.53 | |
n | | Russell 2000 Index | | | 138.63 | | | | 161.17 | | | | 173.97 | | | | 171.17 | | | | 133.75 | | | | 154.44 | | | | 173.65 | |
p | | Peer Group | | | 140.60 | | | | 187.15 | | | | 213.15 | | | | 210.06 | | | | 131.74 | | | | 154.56 | | | | 177.60 | |
| | | | | | | | |
Symbol | | Total Return For: | | 6/30/2012 | | | 9/30/2012 | | | 12/31/2012 | | | 3/31/2013 | | | 6/30/2013 | | | 9/30/2013 | | | 12/31/2013 | |
¿ | | Encore Wire Corporation | | | 142.89 | | | | 156.24 | | | | 161.95 | | | | 187.24 | | | | 182.43 | | | | 211.12 | | | | 290.27 | |
n | | Russell 2000 Index | | | 167.62 | | | | 176.43 | | | | 179.75 | | | | 202.02 | | | | 208.25 | | | | 229.50 | | | | 249.53 | |
p | | Peer Group | | | 157.45 | | | | 176.10 | | | | 198.10 | | | | 236.37 | | | | 220.03 | | | | 260.14 | | | | 275.33 | |
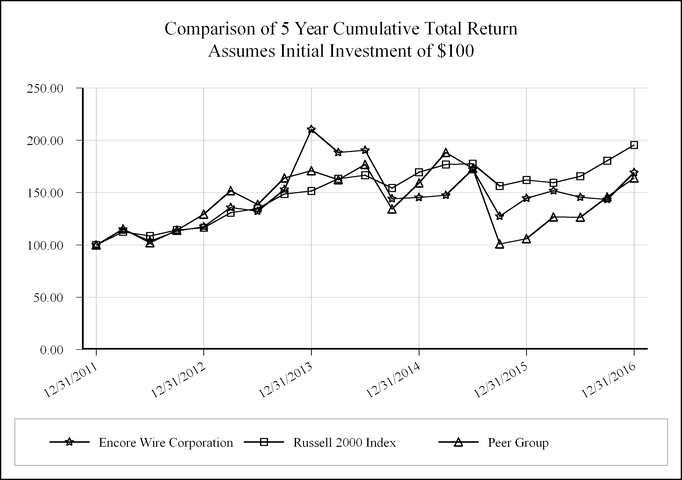
2016
|
| | | | | | | | | | | | | | |
| | | | | As of December 31, |
| Symbol | | Total Return For: | | 2011 | | 2012 | | 2013 | | 2014 | | 2015 | | 2016 |
| « | | Encore Wire Corporation | | 100.00 | | 117.36 | | 210.42 | | 145.20 | | 144.50 | | 169.25 |
| n | | Russell 2000 Index | | 100.00 | | 116.35 | | 151.52 | | 169.42 | | 161.95 | | 195.45 |
| ▲ | | Peer Group | | 100.00 | | 129.34 | | 170.78 | | 159.20 | | 105.77 | | 164.04 |
| |
| (1) | Data presented in the performance graph is complete through December 31, 2013.2016. |
| |
| (2) | The Peer Group is self-determined and consists of the following companies: General Cable Corporation Belden Inc. and Coleman Cable,Belden, Inc. |
| |
| (3) | The peer group index uses only such peer group’s performance and excludes the performance of the Company. The peer group index uses beginning of period market capitalization weighting. |
| |
| (4) | Each data line represents quarterly index levels derived from compounded daily returns that include all dividends. |
| |
| (5) | The index level for all data lines was set to $100.00 on December 31, 2008.2011. |
Item 6. Selected Consolidated Financial Data.
The following financial data should be read in conjunction with Item 7, “Management’s Discussion and Analysis of Financial Condition and Results of Operations” and Item 8, “Financial Statements and Supplementary Data.” The table below presents, as of and for the dates indicated, selected historical financial information for the Company.
| | | | | | | | | | | | | | | | | | | | |
| | | Year Ended December 31, | |
| | | 2013 | | | 2012 | | | 2011 | | | 2010 | | | 2009 | |
| | | (In thousands, except per share amounts) | |
Statement of Income Data: | | | | | | | | | | | | |
Net sales | | $ | 1,158,252 | | | $ | 1,072,348 | | | $ | 1,180,474 | | | $ | 910,222 | | | $ | 649,613 | |
Cost of goods sold | | | 1,023,180 | | | | 982,021 | | | | 1,039,619 | | | | 827,813 | | | | 599,498 | |
| | | | | | | | | | | | | | | | | | | | |
Gross profit | | | 135,072 | | | | 90,327 | | | | 140,855 | | | | 82,409 | | | | 50,115 | |
Selling, general and administrative expenses | | | 64,453 | | | | 60,981 | | | | 64,577 | | | | 57,073 | | | | 43,767 | |
| | | | | | | | | | | | | | | | | | | | |
Operating income | | | 70,619 | | | | 29,346 | | | | 76,278 | | | | 25,336 | | | | 6,348 | |
Interest and other (income) expense | | | (329 | ) | | | (343 | ) | | | (239 | ) | | | 2,395 | | | | (1,633 | ) |
Interest expense | | | 265 | | | | 313 | | | | 322 | | | | 522 | | | | 3,181 | |
| | | | | | | | | | | | | | | | | | | | |
Income before income taxes | | | 70,683 | | | | 29,376 | | | | 76,195 | | | | 22,419 | | | | 4,800 | |
Provision for income taxes | | | 23,773 | | | | 9,565 | | | | 26,064 | | | | 7,129 | | | | 1,164 | |
| | | | | | | | | | | | | | | | | | | | |
Net income | | $ | 46,910 | | | $ | 19,811 | | | $ | 50,131 | | | $ | 15,290 | | | $ | 3,636 | |
| | | | | | | | | | | | | | | | | | | | |
Net income per common and common equivalent shares – basic | | $ | 2.27 | | | $ | 0.91 | | | $ | 2.15 | | | $ | 0.66 | | | $ | 0.16 | |
| | | | | | | | | | | | | | | | | | | | |
Weighted average common and common equivalent shares – basic | | | 20,676 | | | | 21,680 | | | | 23,300 | | | | 23,184 | | | | 23,011 | |
Net income per common and common equivalent shares – diluted | | $ | 2.26 | | | $ | 0.91 | | | $ | 2.14 | | | $ | 0.66 | | | $ | 0.16 | |
| | | | | | | | | | | | | | | | | | | | |
Weighted average common and common equivalent shares – diluted | | | 20,764 | | | | 21,732 | | | | 23,410 | | | | 23,342 | | | | 23,298 | |
| | | | | | | | | | | | | | | | | | | | |
| | | As of December 31, | |
| | | 2013 | | | 2012 | | | 2011 | | | 2010 | | | 2009 | |
| | | (In thousands, except per share amounts) | |
Balance Sheet Data: | | | | | | | | | | | | |
Working capital | | $ | 282,148 | | | $ | 261,493 | | | $ | 334,484 | | | $ | 283,944 | | | $ | 276,882 | |
Total assets | | | 525,826 | | | | 472,467 | | | | 516,146 | | | | 477,276 | | | | 534,558 | |
Long-term debt, net of current portion | | | — | | | | — | | | | — | | | | — | | | | — | |
Stockholders’ equity | | | 456,581 | | | | 410,164 | | | | 457,743 | | | | 407,377 | | | | 392,984 | |
Annual dividends paid | | | 1,654 | | | | 1,763 | | | | 1,863 | | | | 1,854 | | | | 1,840 | |
Annual dividends paid per common share | | $ | 0.08 | | | $ | 0.08 | | | $ | 0.08 | | | $ | 0.08 | | | $ | 0.08 | |
|
| | | | | | | | | | | | | | | | | | | |
| | Year Ended December 31, |
| | 2016 | | 2015 | | 2014 | | 2013 | | 2012 |
| | (in thousands, except per share data) |
| Statement of Income Data: | | | | | |
| Net sales | $ | 940,790 |
| | $ | 1,017,622 |
| | $ | 1,166,979 |
| | $ | 1,158,252 |
| | $ | 1,072,348 |
|
| Cost of goods sold | 820,673 |
| | 880,900 |
| | 1,042,002 |
| | 1,023,180 |
| | 982,021 |
|
| Gross profit | 120,117 |
| | 136,722 |
| | 124,977 |
| | 135,072 |
| | 90,327 |
|
| Selling, general and administrative expenses | 69,351 |
| | 64,493 |
| | 68,876 |
| | 64,453 |
| | 60,981 |
|
| Operating income | 50,766 |
| | 72,229 |
| | 56,101 |
| | 70,619 |
| | 29,346 |
|
| Net interest and other income | (48 | ) | | (155 | ) | | (56 | ) | | (64 | ) | | (30 | ) |
| Income before income taxes | 50,814 |
| | 72,384 |
| | 56,157 |
| | 70,683 |
| | 29,376 |
|
| Provision for income taxes | 16,975 |
| | 24,779 |
| | 19,034 |
| | 23,773 |
| | 9,565 |
|
| Net income | $ | 33,839 |
| | $ | 47,605 |
| | $ | 37,123 |
| | $ | 46,910 |
| | $ | 19,811 |
|
| Earnings per common and common equivalent shares – basic | $ | 1.63 |
| | $ | 2.30 |
| | $ | 1.79 |
| | $ | 2.27 |
| | $ | 0.91 |
|
| Weighted average common and common equivalent shares – basic | 20,704 |
| | 20,713 |
| | 20,714 |
| | 20,676 |
| | 21,680 |
|
| Earnings per common and common equivalent shares – diluted | $ | 1.63 |
| | $ | 2.29 |
| | $ | 1.78 |
| | $ | 2.26 |
| | $ | 0.91 |
|
| Weighted average common and common equivalent shares – diluted | 20,773 |
| | 20,787 |
| | 20,821 |
| | 20,764 |
| | 21,732 |
|
| Annual dividends paid per common share | $ | 0.08 |
| | $ | 0.08 |
| | $ | 0.08 |
| | $ | 0.08 |
| | $ | 0.08 |
|
|
| | | | | | | | | | | | | | | | | | | |
| | As of December 31, |
| | 2016 | | 2015 | | 2014 | | 2013 | | 2012 |
| | (in thousands) |
| Balance Sheet Data: | | | | | |
Working capital (1) | $ | 325,500 |
| | $ | 315,913 |
| | $ | 284,671 |
| | $ | 277,392 |
| | $ | 255,703 |
|
| Total assets | 657,964 |
| | 628,116 |
| | 572,751 |
| | 525,826 |
| | 472,467 |
|
| Long-term debt, net of current portion | — |
| | — |
| | — |
| | — |
| | — |
|
| Stockholders’ equity | 573,109 |
| | 538,639 |
| | 493,187 |
| | 456,581 |
| | 410,164 |
|
(1) Amounts are reflective of the retrospective adoption of accounting guidance for the presentation of deferred income taxes.
Item 7. Management’s Discussion and Analysis of Financial Condition and Results of Operations.
The following management’s discussion and analysis is intended to provide a better understanding of key factors, drivers and risks regarding the Company and the building wire industry.
Encore Wire sells a commodity product in a highly competitive market. Management strongly believes that the historical strength of the Company’s growth and earnings is attributable to the following main factors:
Industryindustry leading order-fillorder fill rates and responsive customer service.service
Productproduct innovations and product line expansions based on listening to and understanding customer needs.needs and market trends
Lowlow cost manufacturing operations, resulting from a state-of-the-art manufacturing complex.complex
Lowlow distribution and freight costs due in large part to the “one campus” business model.model
Aa focused management team leading an incentivized work force.force
Lowlow general and administrative overhead costs.costs, and
Aa team of experienced independent manufacturers’ representatives with strong customer relationships across the United States.
These factors, and others, have allowed Encore Wire to grow from a startup in 1989 to what management believes is one of the largest
copper electric building wire companies in the United States of America. Encore has built a loyal following of customers throughout the United States. These customers have developed a brand preference for Encore Wire in a commodity product line due to the reasons noted above, among others. The Company prides itself on striving to grow sales by expanding its product offerings where profit margins are acceptable. Senior management monitors gross margins daily, frequently extending down to the individual order level. Management strongly believes that this “hands-on” focused approach to the building wire business has
producedbeen an important factor in the Company's success,
thus far and will lead to continued success.
The construction and remodeling industries drive demand for building wire.
Housing constructionConstruction activity in the United States
declined significantly in 2006 and continued its downward trendsuffered through
2010, improving slightly in 2011 and 2012 and then improving somewhat more in 2013. Nationally, commercial construction had been strong through 2007, but slowed significantlya severe recession in 2008
and continued downward through
2012, before improving somewhat in 2013. The Company’s unit sales volume, as measured in pounds of copper wire sold, declined 15.6% in 2009 versus 2008 and declined another 3.8% in 2010 versus 2009. In 2011, the Company’s unit sales volume increased 6.2% compared to 2010. In 2012, copper unit sales declined 1.3% versus 2011. Total unit sales including pounds of aluminum wire sold increased 2.3% in 2012 versus 2011, as the Company continued to expand its building wire product line as discussed throughout this report.2012. Total unit sales, including pounds of aluminum wire sold, increased 14.9% in 2013 versus 2012. In 2013, copper unit sales increased 9.5% versus 2012, while aluminum unit sales increased 116.8% versus 2012. 2013 was the first full year of sales and production from the Company’s new aluminum wire plant. The Company believes that the expansion into building wire product offerings with aluminum conductors helped the increase in copper unit sales in 2013, as customers prefer to
do “one stop
shopping”shop” and order from full line producers.
The Company believesIn 2015, unit sales were down 1.5% in copper wire and 0.5% in aluminum wire versus 2014. It should be noted, however, that
2015 had a slow start, due in part to rough winter and spring weather. Unit sales volumes were down 9.4% for copper and 2.7% for aluminum through the
overall declinefirst five months of
2015 versus the first five months of 2014. However, unit
sales volumes
sold since 2006 is primarilythe result of the slowdown in construction throughout the United States. The Company also believes that the reduced percentage declinewere up 4.4% for copper and 1.0% for aluminum in the Company’slast seven months of 2015 versus the same period in 2014. In 2016, unit sales volumewere up 2.4% in 2010copper wire and the increase7.6% in 2011 was caused, in large part, by the exit of a former competitor from the industry in the first quarter of 2010. aluminum wire versus 2015.
According to various industry and national economic forecasts, the future is unclear for the next few years.
The “credit crisis” and the resulting tightening of credit could continue to negatively impact the availability of capital to fund construction projects for some time to come. Data on remodeling is not as readily available; however, remodeling activity historically trends up when new construction slows down.
The Company’s operating results are driven by several key factors, including the volume of product produced and shipped, the cost of copper and other raw materials, the competitive pricing environment in the wire industry and the resulting influence on gross margins and the efficiency with which the Company’s plants operate during the period, among others. Price competition for electrical wire and cable is intense, and the Company sells its products in accordance with prevailing market prices. Copper, a commodity product, is the principal raw material used by the Company in manufacturing its products. Copper accounted for approximately 77.6%65.2%, 79.0%72.1%, and 86.1%74.7% of the Company’s cost of goods sold during fiscal 2013, 20122016, 2015 and 2011,2014, respectively. The price of copper fluctuates, depending on general economic conditions and in relation to supply and demand and other factors, which causes monthly variations in the cost of copper purchased by the Company. Additionally, the SEC has recently issued an order amending a rule to allowallows shares of a physically backed copper exchange traded fundfunds (“ETF”ETFs”) to be listed and publicly traded. Such fundfunds and other copper ETFs like it hold copper cathode as collateral against their shares. The acquisition of copper cathode by Copper ETFs may materially decrease or interrupt the availability of copper for immediate delivery in the United States, which could materially increase the Company’s
cost of copper. In addition to rising copper prices and potential supply shortages, we believe that ETFs and similar copper-backed derivative products could lead to increased price volatility for copper. The Company cannot predict copper prices in the future or the effect of fluctuations in the cost of copper on the Company’s future operating results. Wire prices can, and frequently do change on a daily basis. This competitive pricing market for wire does not always mirror changes in copper prices, making margins highly volatile. With the Company’s expansion into aluminum conductors in some of its building wire products, aluminum
willmay slowly grow its percentage share of the raw materials cost for the Company. The Company built a plant to expand the production of aluminum building wire
as previously announced.beginning in late 2011. The
building was completed in mid-2012, while the installation of all the machinery and equipment was ongoing as of December 31, 2012. Production ramped up considerably in the first quarter of 2013, and the plant was fully operational by
mid-year.mid-year 2013. In 2012, aluminum wire sales constituted 3.6% of net sales, growing to
6.9%10.3% of net sales in
2013.2016. The growth of aluminum sales to over $103.4 million in 2014 provided the impetus for the Company to construct a 250,000 square foot expansion to the aluminum plant to allow for the continued growth of this business. The construction of the building expansion was substantially completed in the fourth quarter of 2014. Machinery and equipment was installed during 2015. Historically, the cost of aluminum has been much
lower and less
volatile than
copper and also less volatile.copper. With the volatility of both raw material prices and wire prices in the Company’s end market, hedging raw materials can be risky. Historically, the Company has not engaged in hedging strategies for raw material purchases. The tables below highlight the range of closing prices of copper on the Comex exchange for the periods shown.
COMEX COPPER CLOSING PRICE
2013 | | | | | | | | | | | | | | | | | | | | |
| | |
| | | October
2013 | | | November
2013 | | | December
2013 | | | Quarter Ended
Dec. 31, 2013 | | | Year-to-Date
Dec. 31, 2013 | |
High | | $ | 3.33 | | | $ | 3.29 | | | $ | 3.47 | | | $ | 3.47 | | | $ | 3.78 | |
Low | | | 3.22 | | | | 3.15 | | | | 3.20 | | | | 3.15 | | | | 3.03 | |
Average | | | 3.28 | | | | 3.22 | | | | 3.34 | | | | 3.28 | | | | 3.34 | |
2016
|
| | | | | | | | | | | | | | | | | | | |
| | October
2016 |
| | November
2016 |
| | December
2016 |
| | Quarter Ended
Dec. 31, 2016 |
| | Year Ended
Dec. 31, 2016 |
|
| High | $ | 2.20 |
| | $ | 2.67 |
| | $ | 2.69 |
| | $ | 2.69 |
| | $ | 2.69 |
|
| Low | 2.08 |
| | 2.22 |
| | 2.47 |
| | 2.08 |
| | 1.94 |
|
| Average | 2.14 |
| | 2.47 |
| | 2.57 |
| | 2.39 |
| | 2.20 |
|
COMEX COPPER CLOSING PRICE
2012 | | | | | | | | | | | | | | | | | | | | |
| | | October
2012 | | | November
2012 | | | December
2012 | | | Quarter Ended
Dec. 31, 2012 | | | Year-to-Date
Dec. 31, 2012 | |
High | | $ | 3.81 | | | $ | 3.63 | | | $ | 3.70 | | | $ | 3.81 | | | $ | 3.97 | |
Low | | | 3.50 | | | | 3.44 | | | | 3.53 | | | | 3.44 | | | | 3.28 | |
Average | | | 3.68 | | | | 3.50 | | | | 3.62 | | | | 3.60 | | | | 3.61 | |
2015
|
| | | | | | | | | | | | | | | | | | | |
| | October
2015 |
| | November
2015 |
| | December
2015 |
| | Quarter Ended
Dec. 31, 2015 |
| | Year Ended
Dec. 31, 2015 |
|
| High | $ | 2.43 |
| | $ | 2.33 |
| | $ | 2.14 |
| | $ | 2.43 |
| | $ | 2.95 |
|
| Low | 2.31 |
| | 2.02 |
| | 2.03 |
| | 2.02 |
| | 2.02 |
|
| Average | 2.37 |
| | 2.16 |
| | 2.08 |
| | 2.20 |
| | 2.51 |
|
COMEX COPPER CLOSING PRICE
2011 | | | | | | | | | | | | | | | | | | | | |
| | | October
2011 | | | November
2011 | | | December
2011 | | | Quarter Ended
Dec. 31, 2011 | | | Year-to-Date
Dec. 31, 2011 | |
High | | $ | 3.70 | | | $ | 3.58 | | | $ | 3.60 | | | $ | 3.70 | | | $ | 4.62 | |
Low | | | 3.05 | | | | 3.27 | | | | 3.26 | | | | 3.05 | | | | 3.05 | |
Average | | | 3.34 | | | | 3.44 | | | | 3.43 | | | | 3.41 | | | | 4.00 | |
2014
|
| | | | | | | | | | | | | | | | | | | |
| | October
2014 |
| | November
2014 |
| | December
2014 |
| | Quarter Ended
Dec. 31, 2014 |
| | Year Ended
Dec. 31, 2014 |
|
| High | $ | 3.11 |
| | $ | 3.08 |
| | $ | 2.95 |
| | $ | 3.11 |
| | $ | 3.43 |
|
| Low | 2.98 |
| | 2.86 |
| | 2.84 |
| | 2.84 |
| | 2.84 |
|
| Average | 3.04 |
| | 3.02 |
| | 2.90 |
| | 2.98 |
| | 3.12 |
|
The following table presents certain items of income and expense as a percentage of net sales for the periods indicated.
| | | | | | | | | | | | |
| | | Year Ended December 31, | |
| | | 2013 | | | 2012 | | | 2011 | |
Net sales | | | 100.0 | % | | | 100.0 | % | | | 100.0 | % |
Cost of goods sold: | | | | | | | | | | | | |
Copper | | | 68.6 | | | | 72.3 | | | | 75.8 | |
Other raw materials | | | 11.5 | | | | 9.6 | | | | 7.3 | |
Depreciation | | | 1.1 | | | | 1.2 | | | | 1.0 | |
Labor and overhead | | | 8.1 | | | | 7.5 | | | | 5.9 | |
LIFO adjustment | | | (1.0 | ) | | | 1.0 | | | | (2.0 | ) |
Lower cost or market adjustment | | | 0.0 | | | | 0.0 | | | | 0.0 | |
| | | | | | | | | | | | |
| | | 88.3 | | | | 91.6 | | | | 88.0 | |
| | | | | | | | | | | | |
Gross profit | | | 11.7 | | | | 8.4 | | | | 12.0 | |
Selling, general and administrative expenses | | | 5.6 | | | | 5.7 | | | | 5.5 | |
| | | | | | | | | | | | |
Operating income | | | 6.1 | | | | 2.7 | | | | 6.5 | |
Interest and other (income) expense | | | 0.0 | | | | 0.0 | | | | 0.0 | |
| | | | | | | | | | | | |
Income before income taxes | | | 6.1 | | | | 2.7 | | | | 6.5 | |
Provision for income taxes | | | 2.0 | | | | 0.9 | | | | 2.3 | |
| | | | | | | | | | | | |
Net income | | | 4.1 | % | | | 1.8 | % | | | 4.2 | % |
| | | | | | | | | | | | |
|
| | | | | | | | |
| | Year Ended December 31, |
| | 2016 |
| | 2015 |
| | 2014 |
|
| Net sales | 100.0 | % | | 100.0 | % | | 100.0 | % |
| Cost of goods sold: | | | | | |
| Copper | 56.9 | % | | 62.4 | % | | 66.7 | % |
| Other raw materials | 15.0 | % | | 14.9 | % | | 13.2 | % |
| Depreciation | 1.5 | % | | 1.4 | % | | 1.2 | % |
| Labor and overhead | 12.6 | % | | 11.0 | % | | 9.0 | % |
| LIFO adjustment | 1.2 | % | | (3.1 | )% | | (0.8 | )% |
| | 87.2 | % | | 86.6 | % | | 89.3 | % |
| | | | | | |
| Gross profit | 12.8 | % | | 13.4 | % | | 10.7 | % |
| Selling, general and administrative expenses | 7.4 | % | | 6.3 | % | | 5.9 | % |
| Operating income | 5.4 | % | | 7.1 | % | | 4.8 | % |
| Interest and other (income) expense | — | % | | — | % | | — | % |
| | | | | | |
| Income before income taxes | 5.4 | % | | 7.1 | % | | 4.8 | % |
| Provision for income taxes | 1.8 | % | | 2.4 | % | | 1.6 | % |
| | | | | | |
| Net income | 3.6 | % | | 4.7 | % | | 3.2 | % |
The following discussion and analysis relates to factors that have affected the operating results of the Company for the years ended December 31,
2013, 20122016, 2015 and
2011.2014. Reference should also be made to the Consolidated Financial Statements and the related notes included under “Item 8. Financial Statements and Supplementary Data” of this Annual Report.
Net sales were $1.158$940.8 million in 2016 compared to $1.018 billion in 2013 compared to $1.0722015 and $1.167 billion in 2012 and $1.180 billion in 2011.2014. The 8.0% increase7.6% decrease in net sales dollars in 20132016 versus 20122015 is primarily the result of a 4.4% increase7.9% decrease in copper wire sales and a 3.9% decrease in aluminum wire sales. Sales dollars were driven lower primarily by decreases in average selling prices of 10.1% and 10.7% of copper and aluminum wire, respectively, offset somewhat by a 9.5%2.4% increase in copper wire pounds shipped and a 105.0% increase in aluminum wire sales driven by a 116.8%7.6% increase in aluminum wire pounds shipped, offset somewhat by decreases in averageshipped. Average selling prices of 4.7% and 5.5% of copper and aluminumfor wire respectively. Aluminum wire constituted 6.9% of total net sales in 2013. Thesold were driven lower by the fact that the average price of a pound of copper purchased decreased 7.5%13.2% in 20132016 versus 2012,2015, while aluminum purchase prices decreased 1.9%9.2% during the same time period. Aluminum wire constituted 10.3% of total net sales in 2016, compared to 9.9% of total net sales in 2015.
In the fourth quarter of 2016, net sales dollars decreased 4.6% versus the fourth quarter of 2015. The decrease in net sales was due to a 4.6% decrease in copper net sales and a 4.6% decrease in aluminum net sales, driven by a decrease in unit sales volume of copper of 8.7% and an increase in unit sales volume of aluminum of 2.0%, offset by an average selling price increase of 4.4% in copper wire and an average selling price decrease of 6.5% in aluminum wire in the fourth quarter of 2016 versus the fourth quarter of 2015. Aluminum net sales comprised 10.2% of net sales in the fourth quarter of 2016, compared to 10.2% in the fourth quarter of 2015.
On a sequential quarter comparison, net sales dollars in the fourth quarter of 2016 increased 0.9% versus the third quarter of 2016, due primarily to an 8.2% increase in average copper wire selling prices, offset somewhat by a 6.4% decrease in copper wire unit sales. Average selling prices were driven higher by a 7.1% increase in the cost of copper purchased. Margins in the fourth quarter of 2016 were up versus those of the third quarter of 2016, producing $11.4 million of net income in the fourth quarter of 2016 versus $6.0 million in the third quarter of 2016.
Comparing the full year of 2016 to 2015, the decrease in gross profit margin percentage was primarily the result of a decrease in the spread between the average price paid for a pound of raw copper and the average sales price for a pound of copper in 2016 versus 2015, due primarily to competitive industry pricing. Fluctuations in sales prices are primarily a result of changing copper raw material prices and product price competition. The margin declines were due primarily to the competitive pricing environment in the industry. There were two notable competitive factors at work in the market in 2016. First, our largest competitor announced the purchase of a smaller competitor during the third quarter. While these industry consolidations generally lead to better industry
margin discipline in the long term, they can lead to erratic pricing in the short term. Historically, the acquired companies appear to “window dress” themselves by pumping up sales figures pre-sale with low prices while dropping unit cost figures with high production volumes and then dumping excess inventory in the market post-sale. In addition, we believe a different, financially stressed competitor was acting erratically in the aluminum wire market. We believe both of these factors impacted our spreads negatively in 2016. The copper spread decreased 4.1% in 2016 versus 2015. The spread contracted as a result of the 10.1% decline in the average sales price per copper pound sold while the per pound cost of raw copper decreased 13.2%. In nominal dollars, the sales price declined more than the cost of copper. Aluminum wire followed that trend, with the spread decreasing 11.5% in the same year-to-date comparison. Fluctuations in sales prices are primarily a result of changing copper and other raw material prices and product price competition.
The 12.8% decrease in net sales in 2015 versus 2014 is the result of a 13.8% decrease in copper wire sales and a 2.8% decrease in aluminum wire sales. Sales dollars were driven lower primarily by decreases in average selling prices of 12.5% and 2.3% of copper and aluminum wire, respectively, and also slightly by a 1.5% decrease in copper wire pounds shipped and a 0.5% decrease in aluminum wire pounds shipped. Average selling prices for wire sold were driven lower by the fact that the average price of a pound of copper purchased decreased 19.3% in 2015 versus 2014, while aluminum purchase prices decreased 12.3% during the same time period. In the fourth quarter of
2013,2015, net sales
increased 13.8%decreased 12.1% versus the fourth quarter of
2012.2014. The
increasedecrease in net sales was due
largely to the
10.4% increase13.1% decrease in copper net sales and a
76.9% increase2.4% decrease in aluminum net sales, driven by
anthe decrease in purchase prices of copper of 25.3% and aluminum
of 27.2%. These lower prices were offset somewhat by unit
sales volume
increaseincreases of
88.5%5.1% in copper wire and 5.0% in aluminum wire in the fourth quarter of
20132015 versus the fourth quarter of
2012.2014. Aluminum net sales comprised
8.0%10.2% of net sales in the fourth quarter of
2013. Copper unit volume was up 18.4%2015, compared to 9.2% in the fourth quarter of
2013 compared to the fourth quarter of 2012 while the average selling price per copper pound sold was down 6.8% between the same periods.2014. On a sequential quarter comparison, net sales in the fourth quarter of
20132015 decreased
5.3%4.5% versus the third quarter of
2013,2015, due primarily to a
6.7%7.5% decrease
in average copper wire selling prices, offset somewhat by a 3.4% increase in copper wire unit
sales offset somewhatsales. Average selling prices were driven lower by a
0.6% increase7.6% decrease in
average selling prices.the cost of copper purchased. Margins in the fourth quarter of
20132015 were down
slightly versus those of the third quarter of
2013,2015, producing
$11.2$11.0 million of net income in the fourth quarter
of 2015 versus
$13.8$14.5 million in the third
quarter.quarter of 2015.
Comparing the full
yearsyear of
20132015 to
2012,2014, the average sales price of wire that contained a pound of copper decreased less than the average price of a pound of copper purchased during the period. Therefore, margins
expandedincreased as the spread between the price of wire sold and the cost of raw copper purchased increased by
3.7%5.2%, due primarily to
somewhat improved industry pricing discipline.
Aluminum wire margins also increased from 2014 to 2015, with the spread between the price of wire sold and the cost of raw aluminum purchased increasing by 4.0%. Fluctuations in sales prices are primarily a result of changing copper and other raw material prices and product price competition.
Margins were stronger in all four quarters of 2013 versus 2012.The 9.2% decrease in net sales in 2012 versus 2011 was primarily the result of a 10.4% decrease in the average price of product sold and a 1.3% decrease in the volume of copper pounds of product sold. The average price of copper purchased in 2012 decreased 10.7% versus the 2011 average price. In the fourth quarter of 2012, net sales increased 3.9% versus the fourth quarter of 2011. The small increase in net sales was due largely to the growth in aluminum net sales in the fourth quarter of 2012, which were up 196.1% versus the fourth quarter of 2011, driven by a unit volume increase of 229.9% in the fourth quarter of 2012 versus the fourth quarter of 2011. Aluminum sales, however, comprised only 5.1% of net sales in the quarter. Copper unit volume was up 2.2% in the fourth quarter of 2012 compared to the fourth quarter of 2011 while the average selling price per copper pound sold was down 1.8% between the same periods, resulting in nearly flat fourth quarter results for copper sales. On a sequential quarter comparison, net sales in the fourth quarter of 2012 decreased 4.2%, due primarily to a 9.4% decrease in copper wire unit sales offset somewhat by 3.6% increase in average prices. Margins in the fourth quarter of 2012 were consistent with those of the third quarter of 2012, producing similar results.
In 2012, the average sales price of wire that contained a pound of copper decreased more than the average price of copper purchased during the period. Therefore, margins contracted as the spread between the price of wire sold and the cost of raw copper purchased in 2012 decreased by 9.4%, as compared to 2011, due primarily to somewhat weaker industry pricing discipline. Fluctuations in sales prices are primarily a result of changing copper raw material prices and product price competition. Margins were weaker in all four quarters of 2012 versus 2011, bottoming in the second quarter of 2012.
Cost of goods sold was $1.023$820.7 million in 2016, compared to $880.9 million in 2015 and $1.042 billion in 2013, compared to $982.0 million in 2012 and $1.040 billion in 2011.2014. The copper costs included in cost of goods sold were $794.4$535.4 million in 20132016 compared to $775.4$635.2 million in 20122015 and $895.2$778.1 million in 2011.2014. Copper costs as a percentage of net sales decreased to 68.6%56.9% in 20132016 compared to 72.3%62.4% in 20122015 and 75.8%66.7% in 2011.2014. The decrease from 2015 to 2016 of copper costs as a percentage of net sales was due to copper costs decreasing morewhile other components of cost of sales increased. As noted above, copper costs are the largest component of costs and therefore the most significant driver of sales prices of copper wire. Accordingly, the decrease in copper prices in 2016 and 2015 caused most of the other costs to grow in terms of their percentage of net sales dollars. The cost of other raw materials as a percentage of net sales rose from 13.2% in 2014 and 14.9% in 2015 to 15.0% in 2016. The consistent increase over the period is primarily due to the Company's increasing production of aluminum wire. Although aluminum is much cheaper than or opposedcopper, the increased aluminum production drove the other materials category up as a percentage of net sales because aluminum is higher in cost than most of the other items in this category. Material cost percentages in 2016 were increased by a 1.2% LIFO debit (expense), and decreased in 2015 by a 3.1% LIFO credit (income), and decreased in 2014 by a 0.8% LIFO credit (income). Adding the LIFO adjustment to the cost of copper and other costs.materials, the total materials cost in 2016 was 73.1% of net sales versus 74.2% in 2015 and 79.1% in 2014.
The decrease from 2014 to 2015 of copper costs as a percentage of net sales was due to copper costs decreasing while other components of cost of sales increased. As noted above, copper costs are the largest component of costs and therefore the most significant driver of sales prices of wire. Accordingly, the decrease in copper prices in
20132015 and
20122014 caused most of the other costs to grow in terms of their percentage of net sales dollars. The cost of other raw materials
rose from 7.3%as a percentage of net sales
rose from 13.2% in
20112014 to
9.6%14.9% in
2012 and 11.5% in 20132015. The consistent increase over the period is primarily due to the
fact the Company increasedCompany's increasing production of aluminum
wire in the second half of 2012 and throughout 2013. Whilewire. Although aluminum is much cheaper than copper,
the increased aluminum production drove the other materials category up as a percentage of net sales because aluminum is higher in cost than
the majoritymost of the
rest of the productsother items in
the other materials category, which in turn contributed to the rise in the other materials category percentage. Other lower cost materials such as plastic also rose marginally in price in 2012.this category. Material cost percentages in
2013 were2015 decreased
bydue to a
1.0%3.1% LIFO credit (income) and in
2012 were increased by2014 decreased due to a
1.0% LIFO debit (expense). In 2011, material costs were decreased by a 2.0%0.8% LIFO credit (income). Adding
the LIFO
adjustment to the cost of copper and other materials, the total materials cost
including LIFO in
20132015 was
79.1%74.2% of net sales versus
82.9%79.1% in
2012 and 81.2% in 2011.The increase in copper prices and the corresponding increase in net sales dollars in 2011 caused most of the other costs to shrink in terms of their percentage of net sales dollars. The cost of other raw materials, however, rose from 6.6% of net sales in 2010 to 7.3% in 2011. On a cents per pound basis, the cost of other raw materials increased by 35.7% in 2011 versus 2010, consistent with the cost of copper and other commodities and in small part due to the fact the Company began producing aluminum wire in 2011. Although the quantity of aluminum building wire sold in 2011 was insignificant compared to copper volumes, the Company did slowly increase its sales of aluminum wire during the year. The Company produced aluminum wire in its existing plants in 2011. In December of 2011, the Company announced that it was building a new 202,000 square-foot manufacturing plant on its McKinney, Texas campus, in which the Company would expand its aluminum wire and cable production.
2014.
Depreciation, labor and overhead costs as a percentage of net sales were
9.2%14.1% in
20132016 compared to
8.7%12.3% in
20122015 and
6.9%10.2% in
2011.2014. The percentage increase of depreciation, labor and overhead costs in
20132016 and
20122015 versus
20112014 was due primarily to the decrease in copper driven sales dollars
trending the opposite direction of the small percentage increasesproviding a smaller denominator for these costs to be divided into. This upward trend in
depreciation, labor and overhead costs. This disparitypercentages is
also somewhat due to the fact that depreciation, labor and overhead costs have fixed or semi-fixed components and do not vary directly with sales dollars or unit volumes.
Inventories consist of the following at December 31 (in thousands): | | | | | | | | | | | | |
| | | 2013 | | | 2012 | | | 2011 | |
Raw materials | | $ | 28,293 | | | $ | 26,013 | | | $ | 18,482 | |
Work-in-process | | | 21,881 | | | | 22,309 | | | | 22,955 | |
Finished goods | | | 82,997 | | | | 88,750 | | | | 84,819 | |
| | | | | | | | | | | | |
Total | | | 133,171 | | | | 137,072 | | | | 126,256 | |
Adjust to LIFO cost | | | (62,391 | ) | | | (73,416 | ) | | | (62,765 | ) |
Lower of cost or market adjustment | | | — | | | | — | | | | — | |
| | | | | | | | | | | | |
Inventory, net | | $ | 70,780 | | | $ | 63,656 | | | $ | 63,491 | |
| | | | | | | | | | | | |
|
| | | | | | | | | | | |
| | 2016 | | 2015 | | 2014 |
| Raw materials | $ | 23,144 |
| | $ | 26,245 |
| | $ | 28,283 |
|
| Work-in-process | 20,889 |
| | 20,155 |
| | 19,169 |
|
| Finished goods | 81,764 |
| | 70,348 |
| | 84,020 |
|
| Total | 125,797 |
| | 116,748 |
| | 131,472 |
|
| Adjust to LIFO cost | (32,523 | ) | | (21,494 | ) | | (53,221 | ) |
| Inventory | $ | 93,274 |
| | $ | 95,254 |
| | $ | 78,251 |
|
In 2013, 2016,copper traded in a narrow range similar to 2012,lower than 2015, while still exhibiting some volatility as shown in the COMEX copper tableclosing price tables above. CopperFollowing the global collapse of many commodities that began in 2015, copper prices continued to drop in 20132016, but then rallied in the fourth quarter and finished lowerhigher than at the end of 2012. In addition the2015. The quantity of total copper inventory on hand declined slightlyincreased nominally in 2013.2016, compared to 2015. The other materials category, which includes a large number of raw materials, had quantity changes that included increases primarilyand decreases in aluminum.various other materials. These factors resulted in the 20132016 year-end inventory value of all inventories using the LIFO method being $62.4$32.5 million less than the FIFO value, and the 20132016 year end LIFO reserve balance being $11.0 million higher than at the end of 2015. This resulted in a LIFO adjustment increasing cost of sales by $11.0 million in 2016.
In 2015,copper traded in a range significantly lower than 2014, while exhibiting some volatility as shown in the copper table above. Following the global collapse of many commodities, copper prices in 2015 finished much lower than at the end of 2012. This resulted in a LIFO adjustment decreasing cost of sales by $11.0 million.In 2012, copper traded in a more consistent range than in 2011, but still exhibited some volatility. Copper prices in 2012 finished higher than at the end of 2011. In addition2014. However, the quantity of total copper inventory on hand rose slightlyincreased somewhat in 2012.2015, compared to 2014. The other materials category, which includes a large number of raw materials, had quantity changes that included increases primarilyand decreases in aluminum.various other materials. These factors resulted in the 20122015 year-end inventory value of all inventories using the LIFO method being $73.4$21.5 million less than the FIFO value, and the 20122015 year end LIFO reserve balance being $10.7$31.7 million higherlower than at the end of 2011.2014. This resulted in a LIFO adjustment increasingdecreasing cost of sales by $10.7 million. In the fourth quarter of 2011, as part of the Company’s aforementioned expansion into aluminum wire products and$31.7 million in anticipation of the start of production at the Company’s new aluminum wire plant in 2012, the Company began a new aluminum wire inventory pool which is accounted for separately from the Company’s copper wire inventory pool. The Company established this new aluminum wire pool in accordance with U.S. GAAP, which requires that new inventory items not previously present in significant quantities and having qualities significantly different from those items previously inventoried, as is the case with the physical, chemical, and cost differences between copper and aluminum metals, be accounted for separately. 2015.
Based on the current copper and other raw material prices, there is no LCM adjustment
necessary.necessary in the periods presented above. Future reductions in the price of copper and other raw materials could require the Company to record an LCM adjustment against the related inventory balance, which would result in a negative impact on net income.
In 2011, copper traded in a relatively consistent range, at or near historical highs for most of the first three quarters and then made a fairly steep decline in the fourth quarter. This was offset slightly by a small increase in the amount of inventory on hand. These factors resulted in the 2011 year-end inventory value of all inventories using the LIFO method being $62.8 million less than the FIFO value, and the 2011 year end LIFO reserve balance being $24.0 million lower than at the end of 2010. This resulted in a LIFO adjustment decreasing cost of sales by $24.0 million.
Gross profit was
$135.1$120.1 million, or
11.7%12.8% of net sales, in
20132016 compared to
$90.3$136.7 million, or
8.4%13.4% of net sales, in
20122015 and
$140.9$125.0 million, or
11.9%10.7% of net sales, in
2011.2014. The changes in gross profit were due to the factors discussed above.
Selling expenses, which
includeare made up of freight and sales commissions, were
$48.3$47.7 million in
2013, $44.42016, $47.2 million in
20122015 and
$47.8$52.5 million in
2011.2014. As a percentage of net sales, selling expenses
remained steady at 4.2%increased to 5.1% in
20132016 versus
4.1%4.6% in
20122015 and
4.1%4.5% in
2011.2014. General and administrative expenses, as a percentage of net sales,
remained steady at 1.4%increased to 2.3% in
2013, 1.5%2016 versus 1.7% in
20122015 and 1.4% in
2011.2014. Percentages to sales of these costs rose slightly as the metal driven sales dollars declined. Accounts receivable write-offs were
$29,000 in 2016 and zero in
20132015 and
2012, and $0.5 million in 2011.2014. The Company did not increase the bad debt reserve in
2013, 20122016, 2015 and
2011 to provide for potential bad debt expenses.2014.
Interest expenses were
$0.2 million in 2016, $0.3 million in
2013, $0.3 million in 20122015 and $0.3 million in
2011. The Company capitalized zero interest expense relating to the construction of assets in 2013, 2012 and 2011.2014.
The Company’s effective tax rate was
33.6%33.4% in
2013, 32.6% in 2012 and2016, 34.2% in
2011, commensurate with2015 and 33.9% in 2014. The differences between the
Company’sprovisions for income taxes and the income taxes computed using the federal income tax
liabilities. The American Jobs Creation Actstatutory rate are due to changes in the effects of
2004 provides a deduction from incomepermanent differences between transactions reported for
qualifiedfinancial reporting and tax purposes, primarily the domestic production
activities. Accordingly, the impact of any deduction is being reported in the period for which the deduction will be claimed on the Company’s tax return.activity deduction. The domestic production activity deduction reduced the
20132016 effective tax rate approximately
2.5%.3.4%, compared to 1.2% and 3.0% in 2015 and 2014, respectively.
As a result of the foregoing factors, the Company’s net income was
$46.9$33.8 million in
2013, $19.82016, $47.6 million in
20122015 and
$50.1$37.1 million in
2011.2014.
Off-Balance Sheet Arrangements
The Company does not currently have any off-balance sheet arrangements that have or are reasonably likely to have a current or future effect on the Company’s financial condition, revenues or expenses, results of operations, liquidity, capital expenditures or capital resources that are material to investors.
Liquidity and Capital Resources
The following table summarizes the Company’s cash flow activities (in thousands):
| | | | | | | | | | | | |
| | | Year Ended December 31, | |
| | | 2013 | | | 2012 | | | 2011 | |
Net cash provided by operating activities | | $ | 47,218 | | | $ | 30,060 | | | $ | 26,169 | |
Net cash used in investing activities | | | (43,466 | ) | | | (40,284 | ) | | | (16,946 | ) |
Net cash used in financing activities | | | (857 | ) | | | (68,191 | ) | | | (177 | ) |
| | | | | | | | | | | | |
Net increase (decrease) in cash and cash equivalents | | $ | 2,895 | | | $ | (78,415 | ) | | $ | 9,046 | |
| | | | | | | | | | | | |
|
| | | | | | | | | | | |
| | Year Ended December 31, |
| | 2016 | | 2015 | | 2014 |
| Net cash provided by operating activities | $ | 58,560 |
| | $ | 70,768 |
| | $ | 63,122 |
|
| Net cash used in investing activities | (41,582 | ) | | (43,469 | ) | | (44,231 | ) |
| Net cash used in financing activities | (377 | ) | | (2,811 | ) | | (1,005 | ) |
| Net increase in cash and cash equivalents | $ | 16,601 |
| | $ | 24,488 |
| | $ | 17,886 |
|
| Annual dividends paid | $ | 1,656 |
| | $ | 1,657 |
| | $ | 1,657 |
|
The Company maintains a substantial inventory of finished products to satisfy customers’ prompt delivery requirements. As is customary in the industry, the Company provides payment terms to most of its customers that exceed terms that it receives from its suppliers. In general, the Company’s standard payment terms result in the collection of a significant majority of net sales within approximately 75 days of the date of the invoice. Therefore, the Company’s liquidity needs have generally consisted of working capital necessary to finance receivables and inventory. Capital expenditures have historically been necessary to expand and update the production capacity of the Company’s manufacturing operations. The Company has historically satisfied its liquidity and capital expenditure needs with cash generated from operations, borrowings under its various debt arrangements and sales of its common stock.
At December 31,
20132016 and
December 31, 2012,2015, the Company had no debt outstanding.
The Company is party to a Credit Agreement
(as amended, the “Credit Agreement”) with two banks, Bank of America, N.A., as administrative agent and letter of credit issuer, and Wells Fargo Bank, National Association as syndication
agent (the “Credit Agreement”).agent. The Credit Agreement extends through October 1,
2017,2021, and provides for maximum borrowings of
$150.0 million. In the
lesserthird quarter of
$150.0 million or2016, the Company signed a Third Amendment to the Credit Agreement, which, along with other minor changes, eliminated the restriction of maximum borrowings based on the amount of eligible accounts receivable plus the amount of eligible finished goods and raw materials, less any reserves established by the banks. Additionally, at our request and subject to certain conditions, the commitments under the Credit Agreement may be increased by a maximum of up to $100.0 million as long as existing or new lenders agree to provide such additional commitments.
The calculated maximum borrowing amount available at December 31, 2013, as computed under the Credit Agreement, was $149.5 million. Borrowings under the line of credit bear interest, at the Company’s option, at either (1) LIBOR plus a margin that varies from 0.875% to 1.75% depending upon the Leverage Ratio (as defined in the Credit Agreement), or (2) the base rate (which is the highest of the federal funds rate plus 0.5%, the prime rate, or LIBOR plus 1.0%) plus 0% to 0.25% (depending upon the Leverage Ratio). A commitment fee ranging from 0.15% to 0.30% (depending upon the Leverage Ratio) is payable on the unused line of credit. At December 31,
2013,2016, there were no borrowings outstanding
under the Credit Agreement, and letters of credit outstanding in the amount of $1.0 million left $149.0 million of credit available under the Credit Agreement. Obligations under the Credit Agreement are the only contractual borrowing obligations or commercial borrowing commitments of the Company.
Obligations under the Credit Agreement are unsecured and contain customary covenants and events of default. The Company was in compliance with the covenants as of December 31,
2013.2016.
The Company paid interest totaling
$265,000, $313,000$0.2 million, $0.3 million and
$322,000$0.3 million in
2013, 20122016, 2015 and
2011, respectively. The Company did not capitalize any interest in 2013, 2012 and 2011.2014, respectively, none of which was capitalized.
On November 10, 2006, the Board of Directors approved a stock repurchase program authorizing the Company to repurchase up to
1,000,000an authorized number of shares of its common stock
through December 31, 2007 on the open market or through privately negotiated transactions at prices determined by the President of the
Company.Company during the term of the program. The Company’s Board of Directors has
subsequently authorized
several increases and annual extensions of this stock repurchase
program. Asprogram, and, as of December 31,
2013, the2016, 1,132,946 shares remained authorized for repurchase
authorization had 1,225,750 shares remaining authorized through March 31,
2015.2018. The Company did not repurchase any shares of its stock in
2013. On May 14, 2012, the2016. The Company repurchased
2,774,25092,804 shares of
commonits stock
owned by Capital Southwest Venture Corporation at an aggregatepurchase pricein the third quarter of $66,638,000, based on2015, its only purchases that year. The Company also has a price of $24.02 per share. Appropriate consentsbroker agreement to the repurchase were also obtained from lenders under the Company’s Financing Agreement. The repurchase represented approximately 11.8% of the Company’s outstanding shares as of the purchase date and was the only repurchasestock in 2012. Other than the Company’s repurchase of 2,774,250 shares of common stock owned by Capital Southwest Venture Corporation on May 14, 2012, all shares purchased under the program were purchased on the open market by the Company’s brokerat certain trigger points pursuant to a Rule 10b5-1 plan announced on November 28, 2007.
Net cash provided by operations was
$47.2$58.6 million in
20132016 compared to
$30.1$70.8 million in
20122015 and
$26.2$63.1 million in
2011.2014. The
increasedecrease in cash provided by operations of
$17.1$12.2 million in
20132016 versus
20122015 was due to several factors. The Company had
increaseddecreased net income of
$46.9$33.8 million in
20132016 versus
$19.8$47.6 million of net income in
2012. Inventory increased2015. Accounts receivable decreased slightly in
2013,2016, resulting in cash provided of $1.2 million versus cash provided of $20.8 million in 2015, resulting in a
$7.1 million use of cash, while inventory was relatively unchanged in 2012 compared to 2011, resulting in a decrease of cash provided of $7.0 million in 2013 versus 2012. Accounts receivable increased in 2013, resulting in a use of cash of $17.8 million versus a decrease of $1.4 million in 2012, resulting in a negative swingreduction in operating cash flow of
$19.2 million in 2013 versus 2012.$19.6 million. Accounts receivable generally fluctuate in proportion to dollar sales and, to a lesser extent, are affected by the timing of when sales occur during a given quarter. Additionally, accounts receivable can fluctuate based upon the payment timing patterns of certain large customers, although increases in accounts receivable at the end of quarterly reporting periods for this reason have not historically raised collectability issues. Changes in current and deferred taxes
resulted in $1.3 million of cash used in 2016 versus cash provided
$5.2of $16.3 million in
2015, a negative swing of $17.6 million in 2016 versus 2015. Changes in inventory resulted in cash
provided of $2.0 million in
20132016 versus cash used of
$5.4$17.0 million in
2012,2015, a
$19.0 million increase in cash used. Changes in trade accounts payable and accrued liabilities resulted in cash used of $8.6 million in 2016 versus cash provided of $5.9 million in 2015, a negative swing of $2.7 million, which was offset by the $2.4 million positive swing
of $10.6 million in
2013the other assets and liabilities in 2016 versus
2012.2015. These changes in cash flow were the primary drivers of the
$17.2$12.2 million
increasedecrease in net cash flow provided by operations in
20132016 versus
2012.2015.
The
small increase in
net cash provided by operations of
$3.9$7.7 million in
20122015 versus
20112014 was due to several factors. The Company had
reducedincreased net income of
$19.8$47.6 million in
20122015 versus
$50.1$37.1 million of net income in
2011. Inventory increased in 2011, resulting in a $21.4 million use of cash, while inventory barely changed in 2012, resulting in a decrease of cash used of $21.2 million in 2012 versus 2011.2014. Accounts receivable decreased in
2012,2015, resulting in
a sourcecash provided of
cash of $1.4$20.8 million versus
an increasecash provided of
$9.0$8.8 million in
2011,2014, resulting in a positive swing in
operating cash flow of
$10.4$12.0 million in
20122015 versus
2011.2014. Accounts receivable generally fluctuate in proportion to dollar sales and to a lesser extent are affected by the timing of when sales occur during a given quarter. Additionally, accounts receivable can fluctuate based upon the payment timing patterns of certain large customers, although increases in accounts receivable at the end of quarterly reporting periods for this reason have not historically raised collectability issues.
AccountsChanges in current and deferred taxes resulted in $11.0 million cash provided in 2015 versus cash used of $0.9 million in 2014, a positive swing of $11.9 million in 2015 versus 2014. Changes in inventory resulted in cash used of $17.0 million in 2015 versus cash used of $7.5 million in 2014, a $9.5 million increase in cash used. Changes in trade accounts payable and accrued liabilities resulted in
a $19.7 million increase in cash
provided in 2012 versus 2011 due primarily to the increase in accounts payable, stemming from the timingused of
inventory receipts at quarter end. Changes in current and deferred taxes used $5.4$5.9 million in
cash in 20122015 versus cash provided of
$9.2$9.3 million in
2011.2014, a negative swing of $15.2 million in 2015 versus 2014. These changes in cash flow were the primary drivers of the
$3.9$7.7 million increase in
net cash flow
fromprovided by operations in
20122015 versus
2011.2014.
Net cash used in investing activities
increased towas $41.6 million in 2016 versus $43.5 million in
2013 versus $40.32015 and $44.2 million in
2012 and $16.9 million in 2011.2014. In
2013,2016, capital expenditures were used primarily
tofor the expansion of an existing wire plant and the purchase
201 acresand installation of
land adjacent tomachinery and equipment throughout the
Company’s existing campusCompany. In 2015, capital expenditures were used primarily for the purchase and installation of machinery and equipment in
McKinney, Texas for $25.7 million.the aluminum wire plant expansion project. In
2012,2014, capital expenditures were used primarily for the construction of the new aluminum wire plant
expansion project and the purchase and installation of machinery and equipment in that plant.
In 2011, capital expenditures were used for various machinery and equipment, and completing the construction and equipping of the new research & development building.The net cash used in financing activities of
$0.9$0.4 million in
20132016 consisted primarily of
dividend payments of $1.7 million
in dividend payments offset by
$0.6$1.4 million proceeds from issuance of Company stock related to employees exercising stock options. The
net cash used in financing activities of
$68.2$2.8 million in
20122015 consisted primarily of
$66.6$2.9 million used to repurchase
2,774,25092,804 shares of
itsthe Company's common stock
from Capital Southwest Venture Corporation in
May of 2012the third quarter, along with
dividend payments of $1.8 million. The cash used in financing activities of $0.2 million in 2011 consisted primarily of $1.9$1.7 million in dividend payments offset by
$1.8$1.7 million proceeds from issuance of Company stock related to employees exercising stock options.
The net cash used of $1.0 million in 2014 consisted primarily of $1.7 million in dividend payments offset by $0.5 million proceeds from issuance of Company stock related to employees exercising stock options.
During
2014,2017, the Company expects its capital expenditures will consist primarily of machinery and equipment for its manufacturing operations. The Company also expects its future working capital requirements may fluctuate as a result of changes in unit sales volumes and the price of copper and other raw materials. The Company believes that its cash balance, cash flow from operations and the financing available from its revolving credit facility will satisfy working capital and capital expenditure requirements for the next twelve months.
As shown below, the Company had the following contractual obligations as of December 31,
2013. | | | | | | | | | | | | | | | | | | | | |
| | | Payments Due By Period ($ in Thousands) | |
Contractual Obligations | | Total | | | Less Than
1 Year | | | 1-3
Years | | | 3-5
Years | | | More Than
5 Years | |
Long-Term Debt Obligations | | $ | — | | | $ | — | | | $ | — | | | $ | — | | | $ | — | |
Capital Lease Obligations | | | — | | | | — | | | | — | | | | — | | | | — | |
Operating Lease Obligations | | | — | | | | — | | | | — | | | | — | | | | — | |
Purchase Obligations | | | 74,486 | | | | 74,486 | | | | — | | | | — | | | | — | |
| | | | | | | | | | | | | | | | | | | | |
Total | | $ | 74,486 | | | $ | 74,486 | | | $ | — | | | $ | — | | | $ | — | |
| | | | | | | | | | | | | | | | | | | | |
|
| | | | | | | | | | | | | | | | |
| | Payments Due By Period ($ in Thousands) |
| Contractual Obligations | Total | | Less Than
1 Year | | 1-3 Years | | 3-5 Years | | More Than
5 Years |
| Purchase Obligations | $ | 68,528 |
| | $ | 68,528 |
| | — |
| | — |
| | — |
|
| |
| Note: | Amounts listed as purchase obligations consist of open purchase orders for major raw material purchases and $6.6$5.5 million of capital equipment and construction purchase orders open as of December 31, 2013.2016. |
Critical Accounting Policies and Estimates
Management’s discussion and analysis of its financial condition and results of operations are based upon the Company’s consolidated financial statements, which have been prepared in accordance with accounting principles generally accepted in the U.S. The preparation of these financial statements requires management to make estimates and assumptions that affect the amounts reported in the financial statements and accompanying notes. Actual results could differ from those estimates. See Note 1 to the Consolidated Financial Statements. Management believes the following critical accounting policies affect its more significant estimates and assumptions used in the preparation of its consolidated financial statements.
Inventories are stated at the lower of cost, using the last-in, first out (LIFO) method, or market. The Company maintains two inventory pools for LIFO purposes. As permitted by U.S. generally accepted accounting principles, the Company maintains its inventory costs and cost of goods sold on a first-in, first-out (FIFO) basis and makes a monthly adjustment to adjust total inventory and cost of goods sold from FIFO to LIFO. The Company applies the lower of cost or market (LCM) test by comparing the LIFO cost of its raw materials, work-in-process and finished goods inventories to estimated market values, which are based primarily upon the most recent quoted market price of copper, aluminum and finished wire prices as of the end of each reporting period. The Company performs a lower of cost or market calculation quarterly. As of December 31,
2013,2016, no LCM adjustment was required. However, decreases in copper and other material prices could necessitate establishing an LCM reserve in future periods. Additionally, future reductions in the quantity of inventory on hand could cause copper or other raw materials that are carried in inventory at costs different from the cost of copper and other raw materials in the period in which the reduction occurs to be included in costs of goods sold for that period at the different price.
Revenue from the sale of the Company’s products is recognized when goods are shipped to the customer, title and risk of loss are transferred, pricing is fixed or determinable and collection is reasonably assured. A provision for payment discounts and customer rebates is estimated based upon historical experience and other relevant factors and is recorded within the same period that the revenue is recognized.
The Company has provided an allowance for losses on customer receivables based upon estimates of those customers’ inability to make required payments. Such allowance is established and adjusted based upon the makeup of the current receivable portfolio, past bad debt experience and current market conditions. If the financial condition of our customers was to deteriorate and impair their ability to make payments to the Company, additional allowances for losses might be required in future periods.
Recent Accounting Pronouncements
The Financial Accounting Standards Board (the “FASB”) Accounting Standards Codification (“ASC”) is the sole source of authoritative U.S. GAAP other than Securities and Exchange Commission ("SEC") issued rules and regulations that apply only to SEC registrants. The FASB issues an Accounting Standard Update (“ASU”) to communicate changes to the codification. The Company considers the applicability and impact of all ASUs. The followings are those ASUs that are relevant to the Company.
In November 2015, the FASB issued ASU No. 2015-17, “Income Taxes (Topic 740) - Balance Sheet Classification of Deferred Taxes.” ASU No. 2015-17 eliminates the requirement to classify deferred tax assets and liabilities as current or long-term based on how the related assets or liabilities are classified. All deferred taxes are now required to be classified as long-term including any associated valuation allowances. This guidance is effective for public companies for fiscal years beginning after December 15, 2016 with early adoption permitted on either a prospective or retrospective basis. The Company has chosen early adoption of this ASU and has applied it retrospectively. Refer to Note 5 of the Company’s consolidated financial statements included in Item 8 of this report for details on the impact of the adoption of this ASU.
In May 2014, the FASB issued ASU No. 2014-09, “Revenue from Contracts with Customers (Topic 606),” which supersedes the revenue recognition requirements in ASC Topic 605, “Revenue Recognition,” and most industry-specific guidance. This ASU is
based on the principle that revenue is recognized to depict the transfer of goods or services to customers in an amount that reflects the consideration to which the entity expects to be entitled in exchange for those goods or services. The ASU also requires additional disclosure about the nature, amount, timing and uncertainty of revenue and cash flows arising from customer contracts, including significant judgments and changes in judgments, and assets recognized from costs incurred to obtain or fulfill a contract. We are currently evaluating the provisions of this ASU and assessing the impact, if any, it may have on our financial position and results of operations. As part of our assessment work to-date, our team has taken training of the new ASU's revenue recognition model and begun sales terms review and documentation. The standard is effective for annual and interim periods beginning January 1, 2018. We currently expect to apply the modified retrospective method of adoption at that time.
Information Regarding Forward-Looking Statements
This report contains various forward-looking statements and information that are based on management’s belief as well as assumptions made by and information currently available to management. Although the Company believes that the expectations reflected in such forward-looking statements are reasonable, it can give no assurance that such expectations will prove to have been correct. Such statements are subject to certain risks, uncertainties and assumptions. Should one or more of these risks or uncertainties materialize, or should underlying assumptions prove incorrect, actual results may vary materially from those expected.
Among the key factors that may have a direct bearing on the Company’s operating results and stock price are:
Fluctuationsfluctuations in the global and national economy.economy
Fluctuationsfluctuations in the level of activity in the construction industry, including remodeling.remodeling
Demanddemand for the Company’s products.products
Thethe impact of price competition on the Company’s margins.margins
Fluctuationsfluctuations in the price of copper and other key raw materials.materials
Thethe loss of key manufacturers’ representatives who sell the Company’s product line.line
Fluctuationsfluctuations in utility costs, especially electricity and natural gas.gas
Fluctuationsfluctuations in insurance costs and coverage of various types.types
Weatherweather related disasters at the Company’s and/or key vendor’s operating facilities.facilities
Stockstock price fluctuations due to “stock market expectations” and other external variables.variables
Unforeseenunforeseen future legal issues and/or government regulatory changes.changes
Patentpatent and intellectual property disputes.disputes, and
Fluctuationsfluctuations in the Company’s financial position or national banking issues that impede the Company’s ability to obtain reasonable and adequate financing.
This list highlights some of the major factors that could affect the Company’s operations or stock price, but cannot enumerate all the potential issues that management faces on a daily basis, many of which are totally out of management’s control. For further discussion of the factors described herein and their potential effects on the Company, see “Item 1. Business,” “Item 1A. Risk Factors,” “Item 7. Management’s Discussion and Analysis of Financial Condition and Results of Operations” and “Item 7A. Quantitative and Qualitative Disclosures About Market Risk.”
Item 7A. Quantitative and Qualitative Disclosures about Market Risk.
The Company does not engage in metal futures trading or hedging activities and does not enter into derivative financial instrument transactions for trading or other speculative purposes. However, the Company is generally exposed to commodity price and interest rate risks.
The Company purchases copper cathode primarily from miners and commodity brokers at prices determined each month based on the average daily COMEX closing prices for copper for that month, plus a negotiated premium. As a result, fluctuations in copper prices caused by market forces can significantly affect the Company’s financial results. Interest rate risk is attributable to the Company’s long-term debt. As of December 31, 2013,2016, the Company was a party to the Credit Agreement. Amounts outstanding
under the Credit Agreement, as amended, are payable on October 1,
2017,2021, with interest payments due quarterly. At December 31,
2013,2016, the balance outstanding under the Credit Agreement was zero.
There is inherent rollover risk for borrowings under the Credit Agreement as such borrowings mature and are renewed at current market rates. The extent of this risk is not quantifiable or predictable because of the variability of future interest rates and the Company’s future financing requirements. Assuming that the Company had $100.0 million of outstanding debt, an average 1% interest rate increase in
20142016 would increase the Company’s interest expense by $1.0 million.
For further information, see “Item 7. Management’s Discussion and Analysis of Financial Condition and Results of Operations,” and “Item 1A. Risk Factors.”
Item 8. Financial Statements and Supplementary Data.
The consolidated financial statements of the Company and the notes thereto appear on the following pages.
Report of Independent Registered Public Accounting Firm
Board of Directors and Stockholders
We have audited the accompanying consolidated balance sheets of Encore Wire Corporation (the Company) as of December 31,
20132016 and
2012,2015, and the related consolidated statements of income, stockholders’ equity and cash flows for each of the three years in the period ended December 31,
2013.2016. These financial statements are the responsibility of the Company’s management. Our responsibility is to express an opinion on these financial statements based on our audits.
We conducted our audits in accordance with the standards of the Public Company Accounting Oversight Board (United States). Those standards require that we plan and perform the audit to obtain reasonable assurance about whether the financial statements are free of material misstatement. An audit includes examining, on a test basis, evidence supporting the amounts and disclosures in the financial statements. An audit also includes assessing the accounting principles used and significant estimates made by management, as well as evaluating the overall financial statement presentation. We believe that our audits provide a reasonable basis for our opinion.
In our opinion, the financial statements referred to above present fairly, in all material respects, the consolidated financial position of Encore Wire Corporation at December 31,
20132016 and
2012,2015, and the consolidated results of its operations and its cash flows for each of the three years in the period ended December 31,
2013,2016, in conformity with U.S. generally accepted accounting principles.
We
also have
also audited, in accordance with the standards of the Public Company Accounting Oversight Board (United States), Encore Wire Corporation’s internal control over financial reporting as of December 31,
2013,2016, based on criteria established in
Internal Control-Integrated Framework issued by the Committee of Sponsoring Organizations of the Treadway Commission
(1992(2013 Framework) and our report dated February
28, 201424, 2017 expressed an unqualified opinion thereon.
February 28, 201424, 2017
Consolidated Balance Sheets
| | | | | | | | |
| | | December 31 | |
In Thousands of Dollars, Except Share Data | | 2013 | | | 2012 | |
Assets | | | | | | | | |
Current assets: | | | | | | | | |
Cash and cash equivalents | | $ | 36,778 | | | $ | 33,883 | |
Accounts receivable, net of allowance of $2,065 and $2,064 | | | 215,739 | | | | 197,980 | |
Inventories | | | 70,780 | | | | 63,656 | |
Income taxes receivable | | | — | | | | — | |
Deferred income taxes | | | 4,756 | | | | 5,790 | |
Prepaid expenses and other | | | 2,013 | | | | 5,541 | |
| | | | | | | | |
Total current assets | | | 330,066 | | | | 306,850 | |
Property, plant and equipment – at cost: | | | | |
Land and land improvements | | | 47,324 | | | | 18,466 | |
Construction-in-progress | | | 12,222 | | | | 25,434 | |
Buildings and improvements | | | 90,930 | | | | 90,790 | |
Machinery and equipment | | | 224,502 | | | | 196,838 | |
Furniture and fixtures | | | 8,564 | | | | 8,426 | |
| | | | | | | | |
Total property, plant and equipment | | | 383,542 | | | | 339,954 | |
Accumulated depreciation | | | (189,288 | ) | | | (175,030 | ) |
| | | | | | | | |
Property, plant and equipment – net | | | 194,254 | | | | 164,924 | |
Other assets | | | 1,506 | | | | 693 | |
| | | | | | | | |
Total assets | | $ | 525,826 | | | $ | 472,467 | |
| | | | | | | | |
Liabilities and Stockholders’ Equity | | | | |
Current liabilities: | | | | |
Trade accounts payable | | $ | 23,465 | | | $ | 20,112 | |
Accrued liabilities | | | 23,006 | | | | 23,438 | |
Income taxes payable | | | 1,447 | | | | 1,807 | |
Deferred income taxes | | | — | | | | — | |
| | | | | | | | |
Total current liabilities | | | 47,918 | | | | 45,357 | |
Noncurrent deferred income taxes | | | 21,327 | | | | 16,946 | |
Commitments and contingencies | | | | |
Stockholders’ equity: | | | | |
Preferred stock, $.01 par value: | | | | | | | | |
Authorized shares – 2,000,000; none issued | | | — | | | | — | |
Common stock, $.01 par value: | | | | |
Authorized shares – 40,000,000; | | | | |
Issued shares – 26,631,653 and 26,597,753 | | | 266 | | | | 266 | |
Additional paid-in capital | | | 49,459 | | | | 48,298 | |
Treasury stock, at cost – 5,934,651 and 5,934,651 shares | | | (88,134 | ) | | | (88,134 | ) |
Retained earnings | | | 494,990 | | | | 449,734 | |
| | | | | | | | |
Total stockholders’ equity | | | 456,581 | | | | 410,164 | |
| | | | | | | | |
Total liabilities and stockholders’ equity | | $ | 525,826 | | | $ | 472,467 | |
| | | | | | | | |
As of December 31, 2016 and 2015
(In thousands, except share data)
|
| | | | | | | |
| | 2016 | | 2015 |
| Assets | | | |
| Current assets: | | | |
| Cash and cash equivalents | $ | 95,753 |
| | $ | 79,152 |
|
| Accounts receivable, net of allowance of $2,036 and $2,065 | 184,876 |
| | 186,065 |
|
| Inventories | 93,274 |
| | 95,254 |
|
| Income taxes receivable | — |
| | 7,344 |
|
| Prepaid expenses and other | 2,479 |
| | 2,340 |
|
| Total current assets | 376,382 |
| | 370,155 |
|
| | | | |
| Property, plant and equipment – at cost: | | | |
| Land and land improvements | 50,934 |
| | 50,580 |
|
| Construction-in-progress | 35,825 |
| | 33,942 |
|
| Buildings and improvements | 121,432 |
| | 102,432 |
|
| Machinery and equipment | 289,493 |
| | 274,755 |
|
| Furniture and fixtures | 9,204 |
| | 9,012 |
|
| Total property, plant and equipment | 506,888 |
| | 470,721 |
|
| | | | |
| Accumulated depreciation | (225,499 | ) | | (215,953 | ) |
| Property, plant and equipment – net | 281,389 |
| | 254,768 |
|
| | | | |
| Other assets | 193 |
| | 3,193 |
|
| Total assets | $ | 657,964 |
| | $ | 628,116 |
|
| | | | |
| Liabilities and Stockholders’ Equity | | | |
| Current liabilities: | | | |
| Trade accounts payable | $ | 18,577 |
| | $ | 28,743 |
|
| Accrued liabilities | 27,986 |
| | 25,499 |
|
| Income taxes payable | 4,319 |
| | — |
|
| Total current liabilities | 50,882 |
| | 54,242 |
|
| | | | |
| Deferred income taxes | 33,973 |
| | 35,235 |
|
| | | | |
| Commitments and contingencies |
| |
|
| | | | |
| Stockholders’ equity: | | | |
| Preferred stock, $.01 par value: | | | |
| Authorized shares – 2,000,000; none issued | — |
| | — |
|
| Common stock, $.01 par value: | | | |
| Authorized shares – 40,000,000; | | | |
| Issued shares – 26,762,703 and 26,715,216 | 268 |
| | 267 |
|
| Additional paid-in capital | 55,311 |
| | 53,024 |
|
| Treasury stock, at cost – 6,027,455 and 6,027,455 shares | (91,056 | ) | | (91,056 | ) |
| Retained earnings | 608,586 |
| | 576,404 |
|
| Total stockholders’ equity | 573,109 |
| | 538,639 |
|
| Total liabilities and stockholders’ equity | $ | 657,964 |
| | $ | 628,116 |
|
Consolidated Statements of Income
| | | | | | | | | | | | |
| | | Year ended December 31 | |
In Thousands, Except Per Share Data | | 2013 | | | 2012 | | | 2011 | |
Net sales | | $ | 1,158,252 | | | $ | 1,072,348 | | | $ | 1,180,474 | |
Cost of goods sold | | | 1,023,180 | | | | 982,021 | | | | 1,039,619 | |
| | | | | | | | | | | | |
Gross profit | | | 135,072 | | | | 90,327 | | | | 140,855 | |
Selling, general and administrative expenses | | | 64,453 | | | | 60,981 | | | | 64,577 | |
| | | | | | | | | | | | |
Operating income | | | 70,619 | | | | 29,346 | | | | 76,278 | |
Other (income) expense: | | | | | | | | | | | | |
Interest and other income | | | (329 | ) | | | (343 | ) | | | (239 | ) |
Interest expense | | | 265 | | | | 313 | | | | 322 | |
| | | | | | | | | | | | |
Income before income taxes | | | 70,683 | | | | 29,376 | | | | 76,195 | |
Provision for income taxes | | | 23,773 | | | | 9,565 | | | | 26,064 | |
| | | | | | | | | | | | |
Net income | | $ | 46,910 | | | $ | 19,811 | | | $ | 50,131 | |
| | | | | | | | | | | | |
Net income per common and common equivalent share – basic | | $ | 2.27 | | | $ | 0.91 | | | $ | 2.15 | |
| | | | | | | | | | | | |
Weighted average common and common equivalent shares outstanding – basic | | | 20,676 | | | | 21,680 | | | | 23,300 | |
Net income per common and common equivalent share – diluted | | $ | 2.26 | | | $ | 0.91 | | | $ | 2.14 | |
| | | | | | | | | | | | |
Weighted average common and common equivalent shares outstanding – diluted | | | 20,764 | | | | 21,732 | | | | 23,410 | |
Cash dividends declared per share | | $ | 0.08 | | | $ | 0.08 | | | $ | 0.08 | |
| | | | | | | | | | | | |
For the Years Ended December 31, 2016, 2015, and 2014
(In thousands, except per share data)
|
| | | | | | | | | | | |
| | 2016 | | 2015 | | 2014 |
| Net sales | $ | 940,790 |
| | $ | 1,017,622 |
| | $ | 1,166,979 |
|
| Cost of goods sold | 820,673 |
| | 880,900 |
| | 1,042,002 |
|
| Gross profit | 120,117 |
| | 136,722 |
| | 124,977 |
|
| | | | | | |
| Selling, general and administrative expenses | 69,351 |
| | 64,493 |
| | 68,876 |
|
| Operating income | 50,766 |
| | 72,229 |
| | 56,101 |
|
| | | | | | |
| Net interest and other income | (48 | ) | | (155 | ) | | (56 | ) |
| Income before income taxes | 50,814 |
| | 72,384 |
| | 56,157 |
|
| | | | | | |
| Provision for income taxes | 16,975 |
| | 24,779 |
| | 19,034 |
|
| Net income | $ | 33,839 |
| | $ | 47,605 |
| | $ | 37,123 |
|
Earnings per common and common equivalent share – basic | $ | 1.63 |
| | $ | 2.30 |
| | $ | 1.79 |
|
Weighted average common and common equivalent shares outstanding – basic | 20,704 |
| | 20,713 |
| | 20,714 |
|
Earnings per common and common equivalent share – diluted | $ | 1.63 |
| | $ | 2.29 |
| | $ | 1.78 |
|
Weighted average common and common equivalent shares outstanding – diluted | 20,773 |
| | 20,787 |
| | 20,821 |
|
| Cash dividends declared per share | $ | 0.08 |
| | $ | 0.08 |
| | $ | 0.08 |
|
Consolidated Statements of
Stockholders’Stockholders' Equity
| | | | | | | | | | | | | | | | | | | | | | | | |
| | | Common Stock | | | Additional
Paid-In
Capital | | | Treasury
Stock | | | Retained
Earnings | | | | |
In Thousands, Except Per Share Data | | Shares | | | Amount | | | | | | Total | |
Balance at December 31, 2010 | | | 26,367 | | | | 264 | | | | 45,040 | | | | (21,294 | ) | | | 383,367 | | | | 407,377 | |
Net income | | | — | | | | — | | | | — | | | | — | | | | 50,131 | | | | 50,131 | |
Proceeds from exercise of stock options | | | 220 | | | | 2 | | | | 1,786 | | | | — | | | | — | | | | 1,788 | |
Tax benefit on exercise of stock options | | | — | | | | — | | | | 100 | | | | — | | | | — | | | | 100 | |
Stock-based compensation | | | — | | | | — | | | | 416 | | | | — | | | | — | | | | 416 | |
Dividend declared—$0.08 per share | | | — | | | | — | | | | — | | | | — | | | | (1,867 | ) | | | (1,867 | ) |
Purchase of treasury stock | | | — | | | | — | | | | — | | | | (202 | ) | | | — | | | | (202 | ) |
| | | | | | | | | | | | | | | | | | | | | | | | |
Balance at December 31, 2011 | | | 26,587 | | | | 266 | | | | 47,342 | | | | (21,496 | ) | | | 431,631 | | | | 457,743 | |
Net income | | | — | | | | — | | | | — | | | | — | | | | 19,811 | | | | 19,811 | |
Proceeds from exercise of stock options | | | 11 | | | | — | | | | 198 | | | | — | | | | — | | | | 198 | |
Tax benefit on exercise of stock options | | | — | | | | — | | | | 12 | | | | — | | | | — | | | | 12 | |
Stock-based compensation | | | — | | | | — | | | | 746 | | | | — | | | | — | | | | 746 | |
Dividend declared—$0.08 per share | | | — | | | | — | | | | — | | | | — | | | | (1,708 | ) | | | (1,708 | ) |
Purchase of treasury stock | | | — | | | | — | | | | — | | | | (66,638 | ) | | | — | | | | (66,638 | ) |
| | | | | | | | | | | | | | | | | | | | | | | | |
Balance at December 31, 2012 | | | 26,598 | | | | 266 | | | | 48,298 | | | | (88,134 | ) | | | 449,734 | | | | 410,164 | |
Net income | | | — | | | | — | | | | — | | | | — | | | | 46,910 | | | | 46,910 | |
Proceeds from exercise of stock options | | | 34 | | | | — | | | | 622 | | | | — | | | | — | | | | 622 | |
Tax benefit on exercise of stock options | | | — | | | | — | | | | 175 | | | | — | | | | — | | | | 175 | |
Stock-based compensation | | | — | | | | — | | | | 364 | | | | — | | | | — | | | | 364 | |
Dividend declared—$0.08 per share | | | — | | | | — | | | | — | | | | — | | | | (1,654 | ) | | | (1,654 | ) |
Purchase of treasury stock | | | — | | | | — | | | | — | | | | — | | | | — | | | | — | |
| | | | | | | | | | | | | | | | | | | | | | | | |
Balance at December 31, 2013 | | | 26,632 | | | $ | 266 | | | $ | 49,459 | | | $ | (88,134 | ) | | $ | 494,990 | | | $ | 456,581 | |
| | | | | | | | | | | | | | | | | | | | | | | | |
(In thousands, except per share data)
|
| | | | | | | | | | | | | | | | | | | | | | |
| | Common Stock | | Additional Paid-In Capital | | Treasury Stock | | Retained Earnings | | |
| | Shares | | Amount | | Total |
| Balance at January 1, 2014 | 26,632 |
| | $ | 266 |
| | $ | 49,459 |
| | $ | (88,134 | ) | | $ | 494,990 |
| | $ | 456,581 |
|
| Net income | — |
| | — |
| | — |
| | — |
| | 37,123 |
| | 37,123 |
|
| Exercise of stock options | 25 |
| | 1 |
| | 528 |
| | — |
| | — |
| | 529 |
|
| Tax benefit on exercise of stock options | — |
| | — |
| | 123 |
| | — |
| | — |
| | 123 |
|
| Stock-based compensation | — |
| | — |
| | 488 |
| | — |
| | — |
| | 488 |
|
| Dividend declared—$0.08 per share | — |
| | — |
| | — |
| | — |
| | (1,657 | ) | | (1,657 | ) |
| Balance at December 31, 2014 | 26,657 |
| | 267 |
| | 50,598 |
| | (88,134 | ) | | 530,456 |
| | 493,187 |
|
| Net income | — |
| | — |
| | — |
| | — |
| | 47,605 |
| | 47,605 |
|
| Exercise of stock options | 58 |
| | — |
| | 1,728 |
| | — |
| | — |
| | 1,728 |
|
| Tax benefit on exercise of stock options | — |
| | — |
| | 40 |
| | — |
| | — |
| | 40 |
|
| Stock-based compensation | — |
| | — |
| | 658 |
| | — |
| | — |
| | 658 |
|
| Dividend declared—$0.08 per share | — |
| | — |
| | — |
| | — |
| | (1,657 | ) | | (1,657 | ) |
| Purchase of treasury stock | — |
| | — |
| | — |
| | (2,922 | ) | | — |
| | (2,922 | ) |
| Balance at December 31, 2015 | 26,715 |
| | 267 |
| | 53,024 |
| | (91,056 | ) | | 576,404 |
| | 538,639 |
|
| Net income | — |
| | — |
| | — |
| | — |
| | 33,839 |
| | 33,839 |
|
| Exercise of stock options | 48 |
| | 1 |
| | 1,436 |
| | — |
| | — |
| | 1,437 |
|
| Tax benefit on exercise of stock options | — |
| | — |
| | 60 |
| | — |
| | — |
| | 60 |
|
| Stock-based compensation | — |
| | — |
| | 791 |
| | — |
| | — |
| | 791 |
|
| Dividend declared—$0.08 per share | — |
| | — |
| | — |
| | — |
| | (1,657 | ) | | (1,657 | ) |
| Balance at December 31, 2016 | 26,763 |
| | $ | 268 |
| | $ | 55,311 |
| | $ | (91,056 | ) | | $ | 608,586 |
| | $ | 573,109 |
|
See accompanying
notesnotes.
Consolidated Statements of Cash Flows
| | | | | | | | | | | | |
| | | Year ended December 31 | |
In Thousands of Dollars | | 2013 | | | 2012 | | | 2011 | |
Operating Activities | | | | |
Net income | | $ | 46,910 | | | $ | 19,811 | | | $ | 50,131 | |
Adjustments to reconcile net income to net cash provided by (used in) operating activities: | | | | |
Depreciation and amortization | | | 14,788 | | | | 14,280 | | | | 13,728 | |
Deferred income taxes | | | 5,415 | | | | (6,085 | ) | | | 9,980 | |
Excess tax benefits of options exercised | | | (175 | ) | | | (12 | ) | | | (100 | ) |
Stock-based compensation | | | 364 | | | | 746 | | | | 416 | |
Provision for bad debts | | | — | | | | — | | | | — | |
Other | | | (604 | ) | | | (91 | ) | | | (596 | ) |
Changes in operating assets and liabilities: | | | | |
Accounts receivable | | | (17,760 | ) | | | 1,424 | | | | (9,002 | ) |
Inventories | | | (7,124 | ) | | | (165 | ) | | | (21,387 | ) |
Trade accounts payable and accrued liabilities | | | 2,921 | | | | 3,617 | | | | (16,104 | ) |
Other assets and liabilities | | | 2,668 | | | | (4,110 | ) | | | (106 | ) |
Current income taxes receivable / payable | | | (185 | ) | | | 645 | | | | (791 | ) |
| | | | | | | | | | | | |
Net cash provided by (used in) operating activities | | | 47,218 | | | | 30,060 | | | | 26,169 | |
Investing Activities | | | | |
Purchases of property, plant and equipment | | | (44,505 | ) | | | (40,301 | ) | | | (25,007 | ) |
Proceeds from sale of assets | | | 1,039 | | | | 17 | | | | 8,061 | |
| | | | | | | | | | | | |
Net cash provided by (used in) investing activities | | | (43,466 | ) | | | (40,284 | ) | | | (16,946 | ) |
Financing Activities | | | | |
Purchase of treasury stock | | | — | | | | (66,638 | ) | | | (202 | ) |
Proceeds from issuance of common stock, net | | | 622 | | | | 198 | | | | 1,788 | |
Dividends paid | | | (1,654 | ) | | | (1,763 | ) | | | (1,863 | ) |
Excess tax benefits of options exercised | | | 175 | | | | 12 | | | | 100 | |
| | | | | | | | | | | | |
Net cash provided by (used in) financing activities | | | (857 | ) | | | (68,191 | ) | | | (177 | ) |
| | | | | | | | | | | | |
Net increase (decrease) in cash and cash equivalents | | | 2,895 | | | | (78,415 | ) | | | 9,046 | |
Cash and cash equivalents at beginning of year | | | 33,883 | | | | 112,298 | | | | 103,252 | |
| | | | | | | | | | | | |
Cash and cash equivalents at end of year | | $ | 36,778 | | | $ | 33,883 | | | $ | 112,298 | |
| | | | | | | | | | | | |
For the Years Ended December 31, 2016, 2015, and 2014
(In thousands)
|
| | | | | | | | | | | |
| | 2016 | | 2015 | | 2014 |
| Operating Activities | | | | | |
| Net income | $ | 33,839 |
| | $ | 47,605 |
| | $ | 37,123 |
|
Adjustments to reconcile net income to net cash provided by operating activities: | | | | | |
| Depreciation and amortization | 16,811 |
| | 16,063 |
| | 15,453 |
|
| Deferred income taxes | (1,262 | ) | | 16,315 |
| | 2,349 |
|
| Excess tax benefits of options exercised | (60 | ) | | (40 | ) | | (123 | ) |
| Stock-based compensation | 1,596 |
| | 802 |
| | 703 |
|
| Other | 1,294 |
| | (190 | ) | | (116 | ) |
| Changes in operating assets and liabilities: | | | | | |
| Accounts receivable | 1,210 |
| | 20,843 |
| | 8,831 |
|
| Inventories | 1,980 |
| | (17,003 | ) | | (7,471 | ) |
| Trade accounts payable and accrued liabilities | (8,583 | ) | | (5,859 | ) | | 9,309 |
|
| Other assets and liabilities | 12 |
| | (2,415 | ) | | 339 |
|
| Current income taxes receivable / payable | 11,723 |
| | (5,353 | ) | | (3,275 | ) |
| Net cash provided by operating activities | 58,560 |
| | 70,768 |
| | 63,122 |
|
| | | | | | |
| Investing Activities | | | | | |
| Purchases of property, plant and equipment | (45,374 | ) | | (43,711 | ) | | (44,274 | ) |
| Proceeds from sale of assets | 3,792 |
| | 242 |
| | 75 |
|
| Other | — |
| | — |
| | (32 | ) |
| Net cash used in investing activities | (41,582 | ) | | (43,469 | ) | | (44,231 | ) |
| | | | | | |
| Financing Activities | | | | | |
| Deferred financing fees | (197 | ) | | — |
| | — |
|
| Purchase of treasury stock | — |
| | (2,922 | ) | | — |
|
| Proceeds from issuance of common stock, net | 1,416 |
| | 1,728 |
| | 529 |
|
| Dividends paid | (1,656 | ) | | (1,657 | ) | | (1,657 | ) |
| Excess tax benefits of options exercised | 60 |
| | 40 |
| | 123 |
|
| Net cash used in financing activities | (377 | ) | | (2,811 | ) | | (1,005 | ) |
| | | | | | |
| Net increase in cash and cash equivalents | 16,601 |
| | 24,488 |
| | 17,886 |
|
| Cash and cash equivalents at beginning of year | 79,152 |
| | 54,664 |
| | 36,778 |
|
| Cash and cash equivalents at end of year | $ | 95,753 |
| | $ | 79,152 |
| | $ | 54,664 |
|
Notes to Consolidated Financial Statements
1. Significant Accounting Policies
The Company conducts its business in one segment – the manufacture of electric building wire, principally NM-B cable, for use primarily as interior wiring in homes, apartments, and manufactured housing, and THHN/THWN-2 cable and
metal cladmetal-clad and armored cable for use primarily as wiring in commercial and industrial buildings. The Company sells its products primarily through
3129 manufacturers’ representatives located throughout the United States and, to a lesser extent, through its own direct marketing efforts. The principal customers for Encore’s building wire are wholesale electrical distributors.
Copper, a commodity product, is the principal raw material used in the Company’s manufacturing operations. Copper accounted for
77.6%65.2%%,
79.0%72.1% and
86.1%74.7% of the cost of goods sold during
2013, 2012,2016, 2015, and
2011,2014, respectively. The price of copper fluctuates, depending on general economic conditions and in relation to supply and demand and other factors, and has caused monthly variations in the cost of copper purchased by the Company. The Company cannot predict future copper prices or the effect of fluctuations in the cost of copper on the Company’s future operating results. As the Company continues to expand its product offerings with aluminum wire, the cost of aluminum will impact the raw materials discussion
contained in this paragraph and throughout this report. During
2013,2016, aluminum rod used to draw into aluminum wire constituted
3.3%4.6% of cost of goods
sold.sold.
Principles of Consolidation
The consolidated financial statements include the accounts of the Company and its wholly owned subsidiary. Intercompany accounts and transactions have been eliminated upon consolidation.
The preparation of financial statements in conformity with U.S. generally accepted accounting principles requires management to make estimates and assumptions that affect the amounts reported in the financial statements and accompanying notes. Actual results could differ from those estimates.
Revenue from the sale of the Company’s products is recognized when goods are shipped to the customer, title and risk of loss are transferred, pricing is fixed or determinable and collection is reasonably assured. A provision for payment discounts and customer rebates is estimated based upon historical experience and other relevant factors and is recorded within the same period that the revenue is recognized.
The Company classifies shipping and handling costs as a component of selling, general and administrative expenses. Shipping and handling costs were approximately
$21.7$24.1 million,
$20.1$22.7 million and
$18.4$24.9 million for the years ended December 31,
2013, 20122016, 2015 and
2011,2014, respectively.
Fair Value of Financial Instruments
Certain items are required to be measured at fair value on a recurring
basis.basis, primarily cash equivalents held in banks. Fair value is defined as the price that would be received to sell an asset or paid to transfer a liability (an exit price) in the principal or most advantageous market for the asset or liability in an orderly transaction between market participants on the measurement date. A three-level hierarchy is followed for disclosure to show the extent and level of judgment used to estimate fair value measurements:
Level 1 – Inputs used to measure fair value are unadjusted quoted prices that are available in active markets for the identical assets or liabilities as of the reporting date.
Level 2 – Inputs used to measure fair value, other than quoted prices included in Level 1, are either directly or indirectly observable as of the reporting date through correlation with market data, including quoted prices for similar assets and liabilities in active markets and quoted prices in markets that are not active. Level 2 also includes assets and liabilities that are valued using models or other pricing methodologies that do not require significant judgment since the input assumptions used in the models, such as interest rates and volatility factors, are corroborated by readily observable data from actively quoted markets for substantially the full term of the financial instrument.
Level 3 – Inputs used to measure fair value are unobservable inputs that are supported by little or no market activity and reflect the use of significant management judgment. These values are generally determined using pricing models for which the assumptions utilize management’s estimates of market participant assumptions.
At December 31,
20132016 and
2012,2015, the
Company had no financial instruments that were required to be measured at fair value on a recurring basis.At December 31, 2013 and 2012, the Company’s faircarrying value of cash and cash equivalents of $36.8 million and $33.9 million respectively, approximated carrying value due to the short maturity of these financial instruments.
is based on Level 1 measurements.
Concentrations of Credit Risk and Accounts Receivable
Financial instruments that potentially subject the Company to a concentration of credit risk consist principally of cash and cash equivalents and accounts receivable. The Company places its cash and cash equivalents with high credit quality financial institutions.
Accounts receivable represent amounts due from customers, (primarilyprimarily wholesale electrical distributors, manufactured housing suppliers and retail home improvement centers) related to the sale of the Company’s products. Such receivables are uncollateralized and are generally due from a diverse group of customers located throughout the United States. Encore has two customers, each of whom slightly exceed 10% of the Company's total sales.
The Company establishes an allowance for losses based upon the makeup of the current portfolio, past bad debt experience and current market conditions.
| | | | | | | | | | | | |
Allowance for Losses Progression (In Thousands of Dollars) | | 2013 | | | 2012 | | | 2011 | |
Beginning balance January 1 | | $ | 2,064 | | | $ | 2,102 | | | $ | 2,582 | |
(Write offs) of bad debts, net of collections of previous write offs | | | 1 | | | | (38 | ) | | | (480 | ) |
Bad debt provision | | | — | | | | — | | | | — | |
| | | | | | | | | | | | |
Ending balance at December 31 | | $ | 2,065 | | | $ | 2,064 | | | $ | 2,102 | |
| | | | | | | | | | | | |
|
| | | | | | | | | | | |
| Allowance for Losses Progression (In Thousands) | 2016 | | 2015 | | 2014 |
| Beginning balance January 1 | $ | 2,065 |
| | $ | 2,065 |
| | $ | 2,065 |
|
| (Write offs) of bad debts, net of collections of previous write offs | (29 | ) | | — |
| | — |
|
| Ending balance at December 31 | $ | 2,036 |
| | $ | 2,065 |
| | $ | 2,065 |
|
Cash and Cash Equivalents
The Company considers all highly liquid debt instruments purchased with a maturity of three months or less to be cash equivalents. At December 31,
20132016 and
2012,2015, the Company’s cash equivalents consisted of investments in money market accounts with the Company’s banks.
Inventories are stated at the lower of cost, using the last-in, first-out (LIFO) method, or market. The Company evaluates the market value of its raw materials, work-in-process and finished goods inventory primarily based upon current raw material and finished goods prices at the end of each period.
Property, Plant, and Equipment
Depreciation of property, plant and equipment for financial reporting is provided on the straight-line method over the estimated useful lives of the respective assets as follows: buildings and improvements, 15 to 39 years; machinery and equipment, 3 to
1520 years; and furniture and fixtures, 3 to 15 years. Accelerated cost recovery methods are used for tax purposes. Repairs and maintenance costs are expensed as incurred.
The Company follows the fair value based method in accounting for equity-based compensation. Under the fair value based method, compensation cost is measured at the grant date based on the fair value of the award and is recognized on a straight-line basis over the related service period. Excess tax benefits on stock-based compensation are recognized as an increase to additional paid-in capital and as a part of cash flows from financing activities.
ASC 718 requires the estimation of forfeitures when recognizing compensation expense and adjustment of the estimated forfeiture rate over the requisite service period should actual forfeitures differ from such estimates. Changes in estimated forfeitures are recognized through a cumulative catch-up adjustment, which is recognized in the period of change and impacts the amount of un-recognized compensation expense to be recorded in future periods.
Earnings per common and common equivalent share is computed using the weighted average number of shares of common stock and common stock equivalents outstanding during each period. The dilutive effects of stock options, which are common stock equivalents, are calculated using the treasury stock method.
Income taxes are provided for based on the liability method, resulting in deferred income tax assets and liabilities arising due to temporary differences. Temporary differences are differences between the tax basis of assets and liabilities and their reported amounts in the financial statements that will result in taxable or deductible amounts in future years.
The effect on deferred income tax assets and liabilities of a change in tax rates is recognized in income in the period the change in rate is enacted.
Comprehensive income is defined as the change in equity of a business enterprise during a period from transactions and other events and circumstances from non-owner sources. There were no differences between comprehensive income and reported income in the periods presented.
Recent Accounting Standards Update (ASU) 2011-5, Comprehensive Income,Pronouncements
In May 2014, the FASB issued ASU No. 2014-09, “Revenue from Contracts with Customers (Topic 606),” which supersedes the revenue recognition requirements in ASC Topic 605, “Revenue Recognition,” and most industry-specific guidance. This ASU is based on the principle that revenue is recognized to depict the transfer of goods or services to customers in an amount that reflects the consideration to which the entity expects to be entitled in exchange for those goods or services. The ASU also requires additional disclosure about the nature, amount, timing and uncertainty of revenue and cash flows arising from customer contracts, including significant judgments and changes in judgments, and assets recognized from costs incurred to obtain or fulfill a contract. We are currently evaluating the provisions of this ASU and assessing the impact, if any, it may have on our financial position and results of operations. As part of our assessment work to-date, our team has taken training of the new ASU's revenue recognition model and begun sales terms review and documentation. The standard is effective for
fiscal yearsannual and interim periods
within those fiscal years beginning
after December 15, 2011, with earlyJanuary 1, 2018. We currently expect to apply the modified retrospective method of adoption
permitted and retrospective application required. Under ASU 2011-5, for companiesat that
report items of other comprehensive income, there is a requirement to present comprehensive income along with net income in either a single continuous statement or two separate but consecutive statements. The Company has early adopted the provisions of ASU 2011-5 in fiscal 2011. However, as there were no differences between comprehensive income and reported income, the adoption did not have an effect on the Company’s financial statements as of December 31, 2013 and 2012, or for the three fiscal years ended December 31, 2013.time.
Inventories consist of the following as of December 31:
| | | | | | | | |
In Thousands of Dollars | | 2013 | | | 2012 | |
Raw materials | | $ | 28,293 | | | $ | 26,013 | |
Work-in-process | | | 21,881 | | | | 22,309 | |
Finished goods | | | 82,997 | | | | 88,750 | |
| | | | | | | | |
Total | | | 133,171 | | | | 137,072 | |
Adjust to LIFO cost | | | (62,391 | ) | | | (73,416 | ) |
Lower of cost or market adjustment | | | — | | | | — | |
| | | | | | | | |
Inventory, net | | $ | 70,780 | | | $ | 63,656 | |
| | | | | | | | |
|
| | | | | | | |
| In Thousands | 2016 | | 2015 |
| Raw materials | $ | 23,144 |
| | $ | 26,245 |
|
| Work-in-process | 20,889 |
| | 20,155 |
|
| Finished goods | 81,764 |
| | 70,348 |
|
| Total | 125,797 |
| | 116,748 |
|
| Adjust to LIFO cost | (32,523 | ) | | (21,494 | ) |
| Inventory | $ | 93,274 |
| | $ | 95,254 |
|
During
20132016, the Company liquidated portions of the inventory layers established in 2015 in both the copper and
2012aluminum wire pools. In both pools, the liquidation had an insignificant effect on the net income of the Company. During 2015 and 2014, the Company did not liquidate any LIFO inventory layers established in prior years.
Accrued liabilities consist of the following as of December 31:
| | | | | | | | |
In Thousands of Dollars | | 2013 | | | 2012 | |
Sales volume discounts payable | | $ | 15,898 | | | $ | 13,940 | |
Property taxes payable | | | 3,226 | | | | 2,937 | |
Commissions payable | | | 2,027 | | | | 1,768 | |
Accrued salaries | | | 1,314 | | | | 4,235 | |
Other accrued liabilities | | | 541 | | | | 558 | |
| | | | | | | | |
Total accrued liabilities | | $ | 23,006 | | | $ | 23,438 | |
| | | | | | | | |
|
| | | | | | | |
| In Thousands | 2016 | | 2015 |
| Sales volume discounts payable | $ | 13,590 |
| | $ | 13,193 |
|
| Property taxes payable | 3,932 |
| | 3,444 |
|
| Commissions payable | 2,157 |
| | 1,939 |
|
| Accrued salaries | 6,198 |
| | 5,801 |
|
| Other accrued liabilities | 2,109 |
| | 1,122 |
|
| Total accrued liabilities | $ | 27,986 |
| | $ | 25,499 |
|
At December 31,
20132016 and
December 31, 2012,2015, the Company had no debt outstanding.
The Company is party to a Credit Agreement
(as amended, the “Credit Agreement”) with two banks, Bank of America, N.A., as administrative agent and letter of credit issuer, and Wells Fargo Bank, National Association as syndication
agent (the “Credit Agreement”).agent. The Credit Agreement extends through October 1,
2017,2021, and provides for maximum borrowings of
$150.0 million. In the
lesserthird quarter of
$150.0million or2016, the Company signed a Third Amendment to the Credit Agreement, which, along with other minor changes, eliminated the restriction of maximum borrowings based on the amount of eligible accounts receivable plus the amount of eligible finished goods and raw materials, less any reserves established by the banks. Additionally, at our request and subject to certain conditions, the commitments under the Credit Agreement may be increased by a maximum of up to $100.0 million as long as existing or new lenders agree to provide such additional commitments. The calculated maximum borrowing amount available at December 31, 2013, as computed under the Credit Agreement, was $149.5 million. Borrowings under the line of credit bear interest, at the Company’s option, at either (1) LIBOR plus a margin that varies from 0.875% to 1.75% depending upon the Leverage Ratio (as defined in the Credit Agreement), or (2) the base rate (which is the highest of the federal funds rate plus 0.5%, the prime rate, or LIBOR plus 1.0%) plus 0% to 0.25% (depending upon the Leverage Ratio). A commitment fee ranging from 0.15% to 0.30% (depending upon the Leverage Ratio) is payable on the unused line of credit. At December 31, 2013,2016, there were no borrowings outstanding under the Credit Agreement, and letters of credit outstanding in the amount of $1.0 million left $149.0 million of credit available under the Credit Agreement. Obligations under the Credit Agreement are the only contractual borrowing obligations or commercial borrowing commitments of the Company.
Obligations under the Credit Agreement are unsecured and contain customary covenants and events of default. The Company was in compliance with the covenants as of December 31,
2013.2016.
The Company paid interest totaling
$265,000, $313,000$0.2 million, $0.3 million and
$322,000$0.3 million in
2013, 20122016, 2015 and
2011, respectively. The Company did not capitalize any interest in 2013, 2012 and 2011.2014, respectively, none of which was capitalized.
The provisions for income tax expense are summarized as follows for the years ended December 31:
| | | | | | | | | | | | |
In Thousands of Dollars | | 2013 | | | 2012 | | | 2011 | |
Current: | | | | | | | | | | | | |
Federal | | $ | 17,011 | | | $ | 14,609 | | | $ | 15,098 | |
State | | | 1,347 | | | | 1,041 | | | | 986 | |
Deferred | | | 5,415 | | | | (6,085 | ) | | | 9,980 | |
| | | | | | | | | | | | |
Total Income Tax Expense | | $ | 23,773 | | | $ | 9,565 | | | $ | 26,064 | |
| | | | | | | | | | | | |
|
| | | | | | | | | | | |
| In Thousands | 2016 | | 2015 | | 2014 |
| Current: | | | | | |
| Federal | $ | 17,139 |
| | $ | 7,918 |
| | $ | 15,742 |
|
| State | 1,098 |
| | 546 |
| | 943 |
|
| Deferred: | | | | | |
| Federal | (905 | ) | | 16,486 |
| | 2,222 |
|
| State | (357 | ) | | (171 | ) | | 127 |
|
| Total Income Tax Expense | $ | 16,975 |
| | $ | 24,779 |
| | $ | 19,034 |
|
The differences between the provision for income taxes and income taxes computed using the federal income tax rate are as follows for the years ended December 31:
| | | | | | | | | | | | |
In Thousands of Dollars | | 2013 | | | 2012 | | | 2011 | |
Amount computed using the statutory rate | | $ | 24,739 | | | $ | 10,282 | | | $ | 26,668 | |
State income taxes, net of federal tax benefit | | | 1,063 | | | | 463 | | | | 990 | |
Qualified domestic production activity deduction | | | (1,797 | ) | | | (1,522 | ) | | | (1,511 | ) |
Other items | | | (232 | ) | | | 342 | | | | (83 | ) |
| | | | | | | | | | | | |
Total Income Tax Expense | | $ | 23,773 | | | $ | 9,565 | | | $ | 26,064 | |
| | | | | | | | | | | | |
|
| | | | | | | | | | | |
| In Thousands | 2016 | | 2015 | | 2014 |
| Amount computed using the statutory rate | $ | 17,769 |
| | $ | 25,334 |
| | $ | 19,655 |
|
| State income taxes, net of federal tax benefit | 482 |
| | 244 |
| | 691 |
|
| Qualified domestic production activity deduction | (1,712 | ) | | (859 | ) | | (1,698 | ) |
| Other items | 436 |
| | 60 |
| | 386 |
|
| Total Income Tax Expense | $ | 16,975 |
| | $ | 24,779 |
| | $ | 19,034 |
|
In October 2004, the American Jobs Creation Act of 2004 (“the Act”) was passed, which provides a deduction for income from qualified domestic production activities. This deduction lowered the Company’s effective tax rate by approximately
2.5%3.4%,
5.1%1.2%, and
2.0%3.0% for
2013, 20122016, 2015 and
2011,2014, respectively.
The tax effect of each type of temporary difference giving rise to the net deferred tax liability at December 31,
20132016 and
20122015 is as follows:
| | | | | | | | | | | | | | | | |
| | | Deferred Tax Asset (Liability) | |
| | | 2013 | | | 2012 | |
In Thousands of Dollars | | Current | | | Non-current | | | Current | | | Non-current | |
Depreciation | | $ | — | | | $ | (21,327 | ) | | $ | — | | | $ | (16,945 | ) |
Inventory | | | 3,104 | | | | — | | | | 4,313 | | | | — | |
Allowance for doubtful accounts | | | 749 | | | | — | | | | 748 | | | | — | |
Uniform capitalization rules | | | 309 | | | | — | | | | 350 | | | | — | |
Other | | | 594 | | | | — | | | | 378 | | | | — | |
| | | | | | | | | | | | | | | | |
Deferred income tax asset (liability) | | $ | 4,756 | | | $ | (21,327 | ) | | $ | 5,789 | | | $ | (16,945 | ) |
| | | | | | | | | | | | | | | | |
|
| | | | | | | |
| In Thousands | 2016 | | 2015 |
| Depreciation | $ | (30,845 | ) | | $ | (26,892 | ) |
| Inventory | (5,807 | ) | | (10,101 | ) |
| Allowance for doubtful accounts | 738 |
| | 749 |
|
| Uniform capitalization rules | 932 |
| | 145 |
|
| Other | 1,009 |
| | 864 |
|
| Deferred income tax liability | $ | (33,973 | ) | | $ | (35,235 | ) |
The Company made income tax payments of
$18.5$6.7 million in
2013, $15.02016, $14.0 million in
20122015 and
$16.9$20.0 million in
2011.2014.
The Company’s federal income tax returns for the years subsequent to December 31,
20092012 remain subject to examination. The Company’s income tax returns in major state income tax jurisdictions remain subject to examination for various periods subsequent to December 31,
2008.2011. The Company has no reserves for uncertain tax positions as of December 31,
2013.2016 and 2015. Interest and penalties resulting from audits by tax authorities have been immaterial and are included in the provision for income taxes in the consolidated statements of income.
The American Taxpayer Relief Act
In November 2015, the FASB issued ASU No. 2015-17, “Income Taxes (Topic 740) - Balance Sheet Classification of 2012 was enactedDeferred Taxes.” ASU No. 2015-17 eliminates the requirement to classify deferred tax assets and liabilities as current or long-term based on January 2, 2013. Included withinhow the related assets or liabilities are classified. All deferred taxes are now required to be classified as long-term, including any associated valuation allowances. This guidance is effective for public companies for fiscal years beginning after December 15, 2016 with early adoption permitted on either a prospective or retrospective basis. We adopted this legislation was an extension of the research and development credit which had previously expiredASU retrospectively on December 31, 2011. This legislation retroactively reinstated2016, and extended the credit from the previous expiration date throughhave reclassified deferred income taxes current liabilities of $8.5 million as of December 31, 2013. The2015 to deferred income tax impacttaxes non-current liabilities.
6. Stock-Based Compensation
Total stock-based compensation expense by type of
award was as follows for the
2013 research and development credit was a benefit of $32,000. As the legislation was not enacted until 2013, the income tax impact of the retroactive reinstatement and extension related to 2012 was not recognized until the first quarter of 2013. If the tax impact of the research and development credit had been recognized in 2012, it would have represented a $77,000 tax benefit.In addition, the American Taxpayer Relief Act of 2012 renewed the alternative fuels tax credit. The income tax impact of the 2013 alternative fuels tax credit was a benefit of $150,000. The income tax impact of the retroactive reinstatement and extension related to 2012 was not recognized until the first quarter of 2013. If the tax impact of the alternative fuels tax credit had been recognized in 2012, it would have represented a $127,000 tax benefit.
6. years ended December 31:
|
| | | | | | | | | | | |
| In Thousands | 2016 | | 2015 | | 2014 |
| Stock options | $ | 791 |
| | $ | 658 |
| | $ | 488 |
|
| Stock appreciation rights (“SARs”) | 805 |
| | 144 |
| | 215 |
|
| Total stock-based compensation expense | $ | 1,596 |
| | $ | 802 |
| | $ | 703 |
|
| | | | | | |
| Tax benefit on exercise of stock options | $ | 60 |
| | $ | 40 |
| | $ | 123 |
|
In 2010, the Board of Directors adopted a new stock option plan called the Encore Wire 2010 Stock Option Plan (the “2010 Stock Option Plan”) which was approved by the Company’s stockholders at the 2010 Annual Meeting of Stockholders. Similar to the “1999 Stock Option
Plan”,Plan,” which expired on June 28, 2009, the 2010 Stock Option Plan permits the grant of stock options to directors, officers and employees of the Company. The Company granted stock option awards in
20122016, 2015 and 2014 with exercise prices equal to the fair market value of its stock on the date of grant of the options. These options vest ratably over a period of five years from the time the options were granted.
No options were granted in 2013 or 2011. The maximum term of any option granted under the 1999 or 2010 Stock Option Plan is ten years.
New shares are issued upon the exercise of options. As of December 31,
2013, 345,5002016, 172,300 options were available to be granted in the future under the 2010 Stock Option Plan.
During 2013, 2012 and 2011, the Company recorded $364,000, $746,000 and $416,000, respectively, of stock based compensation included in selling, general and administrative expenses. The income tax benefit realized in excess of book deductions associated with stock based compensation totaled $175,000, $12,000 and $100,000 for the years ended December 31, 2013, 2012 and 2011, respectively.
The following presents a summary of stock option activity for the year ended December 31,
2013: | | | | | | | | | | | | | | | | |
| | | Number
of
Shares | | | Weighted
Average
Exercise
Price | | | Weighted
Average
Remaining
Contractual
Term | | | Aggregate
Intrinsic Value
(In Thousands) | |
Outstanding at January 1, 2013 | | | 345,150 | | | $ | 25.03 | | | | | | | | | |
Granted | | | 0 | | | | 0.00 | | | | | | | | | |
Exercised | | | (33,900 | ) | | | 18.37 | | | | | | | | | |
Forfeited/Cancelled | | | (2,000 | ) | | | 28.74 | | | | | | | | | |
| | | | | | | | | | | | | | | | |
Outstanding at December 31, 2013 | | | 309,250 | | | $ | 25.73 | | | | 5.76 | | | $ | 8,804 | |
| | | | | | | | | | | | | | | | |
Vested and exercisable at December 31, 2013 | | | 189,950 | | | $ | 24.26 | | | | 4.37 | | | $ | 5,686 | |
| | | | | | | | | | | | | | | | |
2016:
|
| | | | | | | | | | | | |
| | Number
of
Shares | | Weighted
Average
Exercise
Price | | Weighted
Average
Remaining
Contractual
Term | | Aggregate
Intrinsic Value
(In Thousands) |
| Outstanding at January 1, 2016 | 320,887 |
| | $ | 30.25 |
| | | | |
| Granted | 80,000 |
| | 34.79 |
| | | | |
| Exercised | (47,487 | ) | | 29.34 |
| | | | |
| Forfeited/Canceled | (2,000 | ) | | 21.12 |
| | | | |
| Outstanding at December 31, 2016 | 351,400 |
| | $ | 31.28 |
| | 5.9 years | | $ | 4,647 |
|
| Vested and exercisable at December 31, 2016 | 179,599 |
| | $ | 26.64 |
| | 3.9 years | | $ | 3,164 |
|
The fair value of stock options granted during the years ended December 31,
2013, 2012,2016, 2015, and
2011,2014, was estimated on the date of grant using a Black-Scholes
optionsoption pricing model and the following weighted average assumptions:
| | | | | | | | | | | | |
| | | Year Ended December 31, | |
| | | 2013 | | | 2012 | | | 2011 | |
Risk-free interest rate | | | n/a | | | | 0.78 | % | | | n/a | |
Expected dividend yield | | | n/a | | | | 0.28 | % | | | n/a | |
Expected volatility | | | n/a | | | | 44.9 | % | | | n/a | |
Expected lives | | | n/a | | | | 5.0 years | | | | n/a | |
|
| | | | | | | | |
| | Year Ended December 31, |
| | 2016 | | 2015 | | 2014 |
| Risk-free interest rate | 1.46 | % | | 1.22 | % | | 1.57 | % |
| Expected dividend yield | 0.23 | % | | 0.25 | % | | 0.15 | % |
| Expected volatility | 32.9 | % | | 31.9 | % | | 32.9 | % |
| Expected lives | 5.0 years |
| | 5.0 years |
| | 5.0 years |
|
We base expected volatilities on historical volatilities of our common stock. The expected life represents the weighted average period of time that options granted are expected to be outstanding giving consideration to vesting periods and management’s consideration of historical exercise patterns. The
risk freerisk-free rate is based on the U.S. Treasury yield curve in effect at the time of grant for periods corresponding to the expected life of the option. The expected dividend yield is based on the annualized dividend payment paid on common shares.
ASC 718 requires the estimation of forfeitures when recognizing compensation expense and adjustment of the estimated forfeiture rate over the requisite service period should actual forfeitures differ from such estimates. Changes in estimated forfeitures are recognized through a cumulative catch-up adjustment, which is recognized in the period of change and impacts the amount of un-recognized compensation expense to be recorded in future periods.
During the years ended December 31,
2013, 2012,2016, 2015, and
2011,2014, the weighted average grant date fair value of options granted was
n/a, $11.11$10.64, $9.25 and
n/a,$16.03, respectively, and the total intrinsic value of options exercised was
$0.8$0.5 million,
$0.1$0.7 million and
$3.1$0.7 million, respectively. As of December 31,
2013,2016, total unrecognized compensation cost related to non-vested stock options of
$0.9$1.0 million was expected to be recognized over a weighted average period of
2.903.2 years.
Stock Appreciation Rights:
In 2014, the Board of Directors adopted a new stock appreciation rights plan called the Encore Wire 2014 Stock Appreciation Rights Plan (the “2014 SARs Plan”). The 2014 SARs Plan permits the grant of stock appreciation rights ("SARs") that may only be settled in cash to non-executive officers and employees of the Company. The Company granted SARs for the first time in 2014 for a nominal amount. Additional SARs were granted in 2016. SARs granted to employees vest ratably over a period of five years from the time the SARs were granted. The maximum term of any SARs granted under the 2014 SARs Plan is ten years. These awards are classified as liability awards. The liability balance was $1.2 million and $0.4 million at December 31, 2016 and 2015, respectively. Compensation cost for these awards is determined using a fair value method and remeasured at each reporting date until the date of settlement. Stock-based compensation expense recognized is based on SARs ultimately expected to vest, and therefore it has been reduced for estimated forfeitures. As of December 31, 2016, a total of 226,500 SARs were outstanding under the 2014 SARs Plan.
The following presents a summary of SARs activity for the year ended December 31, 2016:
|
| | | | | | | | | | | | |
| | Cash-settled SARs | | Weighted
Average
Exercise
Price | | Weighted
Average
Remaining
Contractual
Term | | Aggregate
Intrinsic Value
(In Thousands) |
| Outstanding at January 1, 2016 | 133,000 |
| | $ | 41.59 |
| | | | |
| Granted | 142,000 |
| | 34.79 |
| | | | |
| Exercised | (1,000 | ) | | 41.59 |
| | | | |
| Forfeited/Canceled | (47,500 | ) | | 38.51 |
| | | | |
| Outstanding at December 31, 2016 | 226,500 |
| | $ | 37.97 |
| | 8.4 years | | $ | 1,218 |
|
| Vested and exercisable at December 31, 2016 | 42,400 |
| | $ | 41.59 |
| | 7.6 years | | $ | 75 |
|
The fair value of SARs granted during the years ended December 31, 2016, 2015, and 2014, was estimated on the date of grant using a Black-Scholes option pricing model and the following weighted average assumptions:
|
| | | | | | | | |
| | Year Ended December 31, |
| | 2016 | | 2015 | | 2014 |
| Risk-free interest rate | 1.53 | % | | 1.39 | % | | 1.60 | % |
| Expected dividend yield | 0.18 | % | | 0.22 | % | | 0.21 | % |
| Expected volatility | 33.25 | % | | 30.30 | % | | 32.10 | % |
| Expected lives | 3.4 years |
| | 3.2 years |
| | 4.6 years |
|
We base expected volatilities on historical volatilities of our common stock. The expected life represents the weighted average period of time that options granted are expected to be outstanding giving consideration to vesting periods and management’s consideration of historical exercise patterns. The risk-free rate is based on the U.S. Treasury yield curve in effect at the time of grant for periods corresponding to the expected life of the option. The expected dividend yield is based on the annualized dividend payment paid on common shares.
During the years ended December 31, 2016, 2015, and 2014, the weighted average grant date fair value of SARs granted was $13.36, $7.33 and $9.38, respectively, and the total intrinsic value of SARs exercised was negligible in 2016. No SARs were exercised in 2015 and 2014. As of December 31, 2016, total unrecognized compensation cost related to non-vested SARs of $1.9 million was expected to be recognized over a weighted average period of 3.4 years.
The following table sets forth
certain components of the computation of basic and diluted earnings per share for the year ended December 31:
| | | | | | | | | | | | |
In Thousands | | 2013 | | | 2012 | | | 2011 | |
Numerator: | | | | | | | | | | | | |
Net income | | $ | 46,910 | | | $ | 19,811 | | | $ | 50,131 | |
| | | | | | | | | | | | |
Denominator: | | | | | | | | | | | | |
Denominator for basic earnings per share – weighted average shares | | | 20,676 | | | | 21,680 | | | | 23,300 | |
Effect of dilutive securities: | | | | | | | | | | | | |
Employee stock options | | | 88 | | | | 52 | | | | 110 | |
| | | | | | | | | | | | |
Denominator for diluted earnings per share –weighted average shares | | | 20,764 | | | | 21,732 | | | | 23,410 | |
| | | | | | | | | | | | |
|
| | | | | | | | | | | |
| In Thousands | 2016 | | 2015 | | 2014 |
| Numerator: | | | | | |
| Net income | $ | 33,839 |
| | $ | 47,605 |
| | $ | 37,123 |
|
| | | | | | |
| Denominator: | | | | | |
| Denominator for basic earnings per share – weighted average shares | 20,704 |
| | 20,713 |
| | 20,714 |
|
| | | | | | |
| Effect of dilutive securities: | | | | | |
| Employee stock options | 69 |
| | 74 |
| | 107 |
|
| | | | | | |
| Denominator for diluted earnings per share – weighted average shares | 20,773 |
| | 20,787 |
| | 20,821 |
|
Stock options to purchase common stock at exercise prices in excess of the average actual stock price for the period that were anti-dilutive and that were excluded from the determination of diluted earnings per share are as follows:
| | | | | | | | | | | | |
In Thousands, Except Per Share Data | | 2013 | | | 2012 | | | 2011 | |
Weighted average anti-dilutive stock options | | | 191 | | | | 179 | | | | 80 | |
Weighted average exercise price per share | | $ | 31.16 | | | $ | 31.37 | | | $ | 31.28 | |
|
| | | | | | | | | | | |
| In Thousands, Except Per Share Data | 2016 | | 2015 | | 2014 |
| Weighted average anti-dilutive stock options | 143 |
| | 96 |
| | 54 |
|
| | | | | | |
| Weighted average exercise price per share | $ | 40.39 |
| | $ | 43.43 |
| | $ | 49.90 |
|
On November 10, 2006, the Board of Directors approved a stock repurchase program authorizing the Company to repurchase up to
1,000,000an authorized number of shares of its common stock
through December 31, 2007 on the open market or through privately negotiated transactions at prices determined by the President of the
Company.Company during the term of the program. The Company’s Board of
Directors has subsequently authorized several increases and annual extensions of this stock repurchase program. Asprogram, and, as of December 31, 2013, the2016, 1,132,946 shares remained authorized for repurchase authorization had 1,225,750 shares remaining authorized through March 31, 2015.2018. The Company did not repurchase any shares of its stock in 2013. On May 14, 2012, the2016 and 2014. The Company repurchased 2,774,25092,804 shares of commonits stock owned by Capital Southwest Venture Corporation at an aggregate purchase pricein the third quarter of $66,638,000, based on2015, its only purchases in 2015. The Company also has a price of $24.02 per share. Appropriate consentsbroker agreement to the repurchase were also obtained from lenders under the Company’s Financing Agreement. The repurchase represented approximately 11.8% of the Company’s outstanding shares as of the purchase date and was the only repurchasestock in 2012. Other than the Company’s repurchase of 2,774,250 shares of common stock owned by Capital Southwest Venture Corporation on May 14, 2012, all shares purchased under the program were purchased on the open market by the Company’s brokerat certain trigger points pursuant to a Rule 10b5-1 plan announced on November 28, 2007.
9. Contingencies
On July 7, 2009, Southwire Company, a Delaware corporation (“Southwire”), filed a complaint for patent infringement against the Company and Cerro Wire, Inc. (“Cerro”) in the United States District Court for the Eastern District of Texas. In the complaint, Southwire alleged that the Company infringed one or more claims of United States Patent No. 7,557,301 (the “‘301 patent”), entitled “Method of Manufacturing Electrical Cable Having Reduced Required Force for Installation,” by making and selling electrical cables, including the Company’s Super Slick cables. The case has been transferred to the Northern District of Georgia and the parties have agreed to stay it pending reexamination of the ‘301 patent by the United States Patent and Trademark Office (the “USPTO”). On June 23, 2011, the USPTO issued an office action in the reexamination finally rejecting all the claims of the ‘301 patent. Southwire responded to these final rejections on August 8, 2011 by submitting substantially amended claims. The examiner determined that the amended claims captured patentable subject matter and on September 21, 2011 issued a notice that a reexamination certificate would be issued evidencing the patentability of the amended claims. The reexamination certificate was issued on the ‘301 patent on December 27, 2011. Subsequent to the issuance of the ‘301 reexamination certificate, a new inter partes reexamination proceeding was instituted by Cerro Wire against the reexamined ‘301 patent. At this time all of the claims of the reexamined ‘301 patent have been rejected by the USPTO. This decision is not final.
On July 2, 2010, the Company filed a complaint against Southwire in the Northern District of Georgia. The complaint alleged that Southwire was using a deceptively misdescriptive trademark on its SimPull products, and that Southwire had made false statements about the Company’s Slick Wire products. Southwire’s United States Patent No. 7,749,024 (“the ‘024 patent”) issued on July 6, 2010. The morning the patent issued, the Company amended its complaint to seek a declaratory judgment that the Company’s Slick Wire products do not infringe the ‘024 patent. Later that same day, Southwire filed a separate complaint against the Company and Cerro Wire in the Eastern District of Texas alleging infringement of the ‘024 patent. The Company’s complaint against Southwire was stayed by agreement on April 11, 2011. The case will remain stayed until the USPTO issues a certificate of reexamination of the ‘024 patent. The complaint filed by Southwire in the Eastern District of Texas has been voluntarily dismissed and Southwire will have the option to pursue its claims against the Company in the Northern District of Georgia, once the reexamination is completed. On October 8, 2010, the Company filed a request with the USPTO for an inter partes reexamination of the ‘024 patent. On November 9, 2010, the USPTO ordered the reexamination of the ‘024 patent. In ordering reexamination of Southwire’s ‘024 patent, the USPTO determined that the Company’s submission of prior art raised a substantial new question of patentability of the claims of the ‘024 patent. On December 3, 2010, the USPTO issued a non-final office action rejecting all of the claims of the ‘024 Patent. Southwire filed a response to the non-final office action on February 3, 2011, which included legal arguments and supporting technical declarations. The Company filed its comments to the Southwire response on March 3, 2011, including points and authorities, legal arguments, and supporting technical declarations. On July 9, 2012, the Examiner issued an Action Closing Prosecution (“ACP”) finally rejecting patent claims 4-7 and 9-12 in the reexamination of the ‘024 patent. On August 15, 2012, Southwire filed a response to the ACP, which included extensive proposed claim amendments and arguments supporting the patentability of the proposed amended claims. The Company filed its comments to the Southwire response to the ACP on September 13, 2012, including points and authorities, legal arguments, and a supporting technical declaration. The Examiner refused entry of Southwire’s proposed amendments and maintained the rejection of all the claims under reexamination in a Right of Appeal Notice mailed September 28, 2012. On October 17, 2012 Southwire filed two petitions requesting that the reexamination be reopened or, in the alternative, that the proposed amendments presented in its September 13, 2012 response to ACP be entered into the record. These petitions were denied by the USPTO in a decision mailed April 5, 2013. Southwire filed a Notice of Appeal on October 29, 2012 and its Appellant’s Brief on December 31, 2012, followed by the Company filing its Respondent’s Brief on January 25, 2013. The Examiner’s Brief was mailed on July 16, 2013. Southwire filed its Rebuttal Brief on August 16, 2013, and the case now stands in front of the Patent Trial and Appeal Board awaiting a decision.
The ‘024 patent was also subject to parallel Inter Partes Reexamination Control No. 95/000,594, instituted by Cerro on November 11, 2010 (“the ‘594 reexamination”). The ‘024 patent exam proceeded with the ‘594 reexamination and ultimately all the claims were finally rejected by the Examiner in an ACP mailed August 10, 2012. In response to a
right of appeal notice mailed by the Examiner on October 25, 2012, Southwire filed a notice of appeal on November 26, 2012 and filed an appeal brief on January 28, 2013. Southwire’s appeal brief exceeded the page limitations allowed for patent owner’s appeal briefs during reexaminations, and therefore the USPTO mailed a notice of defective appeal brief on February 20, 2013. Although Southwire was given at least one month to file a corrected appeal brief, Southwire filed a petition with the Patent Trial and Appeal Board (“PTAB”) on March 5, 2013, requesting a waiver of the page limit on appeal brief length. On June 24, 2013, the PTAB denied the petition to waive the appeal brief page limit and, since the time limit to file a corrected appeal brief had expired, also dismissed Southwire’s appeal. On July 12, 2013, the Examiner mailed a Notice of Intent to Issue Inter Partes Reexamination Certificate, cancelling all claims of the ‘024 patent. On August 6, 2013, Southwire petitioned for revival of the ‘024 Patent and re-opening of the ‘594 Reexamination on the grounds that its failure to timely file an Appellant’s Brief was unintentional. This petition was accompanied by a corrected Appellant’s Brief. Southwire’s petition to revive the ‘024 Patent was granted on October 24, 2013 and the ‘594 Reexamination was re-opened at the appeals stage. With the re-opening of the ‘594 Reexamination, Cerro filed their Respondent’s Brief on November 25, 2013, which was followed by the Examiner’s Answer to Southwire’s Appellant’s Brief on December 4, 2013. On January 6, 2014, both Southwire and Cerro submitted Rebuttal Briefs in response to the Examiner’s Answer. Once any remaining briefs are filed by the parties, the appeal will be submitted to the PTAB for a decision. Southwire’s complaints sought unspecified damages and injunctive relief. At this time, all pending litigation between Encore and Southwire has been dismissed or stayed by agreement of the parties.
The parties convened on March 21, 2012 and August 27, 2012 for settlement conferences regarding the ‘301 patent lawsuit. Such settlement conferences did not result in any negotiation, agreement, decision or other development that the Company believed is material to such lawsuit. Settlement discussions continue between the parties. The potentially applicable factual and legal issues related to the above claims asserted against the Company have not been resolved. The Company disputes all of Southwire’s claims and alleged damages and intends to vigorously defend the lawsuits and vigorously pursue its own claims against Southwire if and when the litigation resumes.
The Company is from time to time involved in litigation, certain other claims and arbitration matters arising in the ordinary course of its business. The Company accrues for a liability when it is both probable that a liability has been incurred and the amount of the loss can be reasonably estimated. Significant judgment is required in both the determination of the probability of a loss and the determination as to whether a loss is reasonably estimable. Any such accruals are reviewed at least quarterly and adjusted to reflect the effects of negotiations, settlements, rulings, advice of legal counsel and technical experts and other information and events pertaining to a particular matter. To the extent there is a reasonable possibility (within the meaning of ASC 450) that probable losses could exceed amounts already accrued, if any, and the additional loss or range of loss is able to be estimated, management discloses the additional loss or range of loss.
For matters where the Company has evaluated that a loss is not probable, but is reasonably possible, the Company will disclose an estimate of the possible loss or range of loss or make a statement that such an estimate cannot be made. In some instances, for reasonably possible losses, the Company cannot estimate the possible loss or range of loss. The nature and progression of litigation can make it difficult to predict the impact a particular lawsuit will have on the Company. There are many reasons that the Company cannot make these assessments, including, among others, one or more of the following: the early stages of a proceeding; damages sought that are unspecified, unsupportable, unexplained or uncertain; discovery is incomplete; the complexity of the facts that are in dispute; the difficulty of assessing novel claims; the parties not having engaged in any meaningful settlement discussions; the possibility that other parties may share in any ultimate liability; and/or the often slow pace of litigation.
On July 7, 2009, Southwire Company, a Delaware corporation (“Southwire”), filed a complaint for patent infringement against the Company and Cerro Wire, Inc. (“Cerro”) in the United States District Court for the Eastern District of Texas. In the complaint, Southwire alleged that the Company infringed one or more claims of United States Patent No. 7,557,301 (the “301 Patent”), entitled “Method of Manufacturing Electrical Cable Having Reduced Required Force for Installation,” by making and selling electrical cables, including the Company’s Super Slick cables. The case has been transferred to the Northern District of Georgia and the parties have agreed to stay it pending reexamination of the 301 Patent by the United States Patent and Trademark Office. One reexamination proceeding - a reexamination request by Cerro - remains pending. In that reexamination, the examiner rejected all the claims, and the Patent Trial and Appeal Board affirmed the examiner's rejection. Southwire appealed the decision to the Federal Circuit, and that appeal is ongoing.
The potentially applicable factual and legal issues related to the above claims asserted against the Company have not been resolved. The Company disputes all of Southwire’s claims and alleged damages and intends to vigorously defend the lawsuits and vigorously pursue its own claims against Southwire if and when the litigation resumes.
At this time, given the status of the proceedings, the complexities of the facts in dispute and the multiple claims involved, the Company has not concluded that a probable loss exists with respect to the Southwire litigation. Accordingly, no accrual has been made. Additionally, given the aforementioned uncertainties,
while it is reasonably possible we may incur a loss, the Company is unable to estimate any possible loss or range of losses for disclosure purposes.
10. Encore Wire Corporation 401(k) Profit Sharing Plan
The Company sponsors a tax qualified 401(k) profit sharing plan known as the Encore Wire Corporation 401(k) Profit Sharing Plan (the “401(k) Plan”) that is intended to provide participating employees an opportunity to save money for retirement.
Effective January 1, 2015, employees are immediately eligible to participate in the 401(k) Plan and to receive matching contributions after attaining age 18. Employees
who do not take action to either enroll or decline to enroll in the 401(k) Plan within a 30 day notification period, are
automatically enrolled in the Plan with a pre-tax contribution rate equal to 5% of their eligible compensation (as defined in the 401(k) Plan). Prior to January 1, 2015, the 401(k) Plan did not provide for automatic enrollment, and employees were eligible to participate in the 401(k) Plan and to receive matching contributions after attaining age 21 and completing one year of service (as defined in the 401(k) Plan).
Eligible employees may elect to contribute between 1% and 50% of eligible compensation to the 401(k) Plan on a pre-tax basis, up to IRS limits. These employee contributions are called elective deferral contributions. The Company matches a portion of the elective deferral contributions made to the 401(k) Plan by eligible employees. The 401(k) Plan provides for a safe-harbor matching contribution equal to 100% of the first 3% of an employee’s eligible compensation contributed to the 401(k) Plan and 50% of the next 2% of eligible compensation contributed by such employee to the 401(k) Plan for the year. Employer safe harbor matching contributions
made to the 401(k) Plan for eligible participants are 100%
vested when paid.vested.
The Company’s matching contributions were
$0.9$1.9 million,
$0.7$1.5 million and
$0.6$0.9 million in years
2013, 20122016, 2015 and
2011,2014, respectively.
At the discretion of its Board of Directors, the Company may, but is not required to, make profit-sharing contributions to the 401(k) Plan on behalf of its employees. The Company made no profit-sharing contributions for
2013, 20122016, 2015 or
2011.2014. Effective January 1, 2015, any profit-sharing contributions that are made to the 401(k) Plan will be 100% vested.
Participants are permitted to choose how contributions made to the 401(k) Plan by or for them are invested. If a participant does not make an investment election, the contributions will be invested in the moderate risk tolerance based balanced portfolio which serves as the 401(k) Plan's qualified default investment alternative.
11. Related Party Transactions
The Company purchases certain finished goods inventory components from a company that is partially owned by a family member of an individual serving on its Board of Directors. The Company purchases these products from this company, which totaled approximately $12.0 million, $8.1 million and $6.9 million in 2013, 2012 and 2011, respectively, at prices that we believe are no less favorable than prices available from non-affiliated parties. Additionally, for
For a minor portion of its freight requirements, the Company uses a freight carrier that is owned by a family member of one of the Company’s executive officers. During fiscal years 2013, 20122016, 2015 and 2011,2014, amounts paid to the affiliated freight carrier were not significant.
The Company purchased certain finished goods inventory components from a company that was partially owned by a family member of an individual serving on the Board of Directors. The Company purchased these products from this company, which totaled approximately $10.3 million, $13.4 million and $13.1 million in 2016, 2015 and 2014, respectively. This supplier was sold during 2016 to a totally unrelated company. Therefore, this related party relationship ended in mid-2016.
The Company obtains quotes and purchases these items from other vendors at prices that confirm that the Company is obtaining prices that are no less favorable than prices available from non-affiliated parties.
Each of theseThese transactions
waswere approved by the Audit Committee pursuant to Encore Wire Corporation’s Related Party Transactions Policy.
In February 2012, the Company entered into a Registration Rights Agreement with Capital Southwest Corporation and Capital Southwest Venture Corporation (together, “Capital Southwest”), pursuant to which the Company agreed to register the offer and sale of 4,086,750 shares of common stock of the Company held by Capital Southwest on a registration statement on Form S-3 (the “Registration Statement”). In exchange for registration of the offer and sale of such shares, Capital Southwest agreed to reimburse the Company for all costs, fees and expenses incurred by the Company in connection with such registration, unless the Registration Statement did not become effective solely due to the actions or omissions of the Company and without fault of Capital Southwest. The disinterested members of the board of directors of the Company approved the Company entering into the Registration Rights Agreement.
On May 14, 2012, the Company repurchased 2,774,250 shares of common stock owned by Capital Southwest Venture Corporation at an aggregate purchase price of $66,638,000, based on a price of $24.02 per share. A special committee of the board of directors comprised of disinterested members of the board approved the Company repurchasing such shares.
Neither the Company’s registration of the shares owned by Capital Southwest pursuant to the Registration Statement nor the Company’s repurchase of shares owned by Capital Southwest Venture Corporation necessarily means that Capital Southwest will offer or sell the remaining shares covered by the Registration Statement. The Company cannot predict if, when or in what amounts Capital Southwest may sell any of the remaining shares covered by the Registration Statement.
12. Quarterly Financial Information (Unaudited)
The following is a summary of the unaudited quarterly financial information for the two years ended December 31,
20132016 and
20122015 (in thousands, except per share
amounts)data):
| | | | | | | | | | | | | | | | |
| | | Three Months Ended | |
2013 | | March 31 | | | June 30 | | | September 30 | | | December 31 | |
Net sales | | $ | 265,351 | | | $ | 289,460 | | | $ | 309,927 | | | $ | 293,514 | |
Gross profit | | | 24,301 | | | | 40,151 | | | | 37,904 | | | | 32,716 | |
Net income (loss) | | | 6,395 | | | | 15,502 | | | | 13,802 | | | | 11,212 | |
Net income (loss) per common share – basic | | | 0.31 | | | | 0.75 | | | | 0.67 | | | | 0.54 | |
Net income (loss) per common share – diluted | | | 0.31 | | | | 0.75 | | | | 0.66 | | | | 0.54 | |
| | | | | | | | | | | | | | | | |
| | | Three Months Ended | |
2012 | | March 31 | | | June 30 | | | September 30 | | | December 31 | |
Net sales | | $ | 280,466 | | | $ | 264,730 | | | $ | 269,152 | | | $ | 258,000 | |
Gross profit | | | 24,461 | | | | 19,391 | | | | 24,136 | | | | 22,339 | |
Net income (loss) | | | 6,694 | | | | 2,370 | | | | 5,527 | | | | 5,220 | |
Net income (loss) per common share – basic | | | 0.29 | | | | 0.11 | | | | 0.27 | | | | 0.25 | |
Net income (loss) per common share – diluted | | | 0.29 | | | | 0.11 | | | | 0.27 | | | | 0.25 | |
|
| | | | | | | | | | | | | | | |
| | Three Months Ended |
| 2016 | March 31 | | June 30 | | September 30 | | December 31 |
| Net sales | $ | 225,544 |
| | $ | 238,831 |
| | $ | 237,168 |
| | $ | 239,247 |
|
| Gross profit | 30,143 |
| | 28,631 |
| | 27,818 |
| | 33,525 |
|
| Net income | 8,599 |
| | 7,839 |
| | 5,999 |
| | 11,402 |
|
| Earnings per common share – basic | 0.42 |
| | 0.38 |
| | 0.29 |
| | 0.55 |
|
| Earnings per common share – diluted | 0.41 |
| | 0.38 |
| | 0.29 |
| | 0.55 |
|
|
| | | | | | | | | | | | | | | |
| | Three Months Ended |
| 2015 | March 31 | | June 30 | | September 30 | | December 31 |
| Net sales | $ | 250,262 |
| | $ | 253,747 |
| | $ | 262,756 |
| | $ | 250,857 |
|
| Gross profit | 32,430 |
| | 32,905 |
| | 38,335 |
| | 33,052 |
|
| Net income | 10,789 |
| | 11,353 |
| | 14,511 |
| | 10,952 |
|
| Earnings per common share – basic | 0.52 |
| | 0.55 |
| | 0.70 |
| | 0.53 |
|
| Earnings per common share – diluted | 0.52 |
| | 0.54 |
| | 0.70 |
| | 0.53 |
|
Item 9. Changes in and Disagreements With Accountants on Accounting and Financial Disclosure.
Item 9A. Controls and
Procedures.Procedures.
Disclosure Controls and Procedures
The Company maintains controls and procedures designed to ensure that information required to be disclosed by it in the reports it files with or submits to the Securities and Exchange Commission (the “SEC”) is recorded, processed, summarized and reported, within the time periods specified in the SEC’s rules and forms and to ensure that information required to be disclosed by the Company in such reports is accumulated and communicated to the Company’s management, including the Chief Executive and Chief Financial Officers, as appropriate to allow timely decisions regarding required disclosure. Based on an evaluation of the Company’s disclosure controls and procedures (as such term is defined in Rules 13a-15(e) and 15d-15(e) under the Securities Exchange Act of 1934, as amended) as of the end of the period covered by this report conducted by the Company’s management, with the participation of the Chief Executive and Chief Financial Officers, the Chief Executive and Chief Financial Officers concluded that the Company’s disclosure controls and procedures were effective to ensure that information required to be disclosed by the Company in the reports it files with or submits to the SEC is recorded, processed, summarized and reported, within the time periods specified in the SEC’s rules and forms and to ensure that information required to be disclosed by the Company in such reports is accumulated and communicated to the Company’s management, including the Chief Executive and Chief Financial Officers, as appropriate to allow timely decisions regarding required disclosure.
Management’s Report on Internal Control over Financial Reporting
Management of the Company is responsible for establishing and maintaining adequate internal control over financial reporting (as defined in Rule 13a-15(f) under the Securities Exchange Act of 1934, as amended) for the Company.
Because of its inherent limitations, internal control over financial reporting may not prevent or detect misstatements. Projections of any evaluation of effectiveness to future periods are subject to the risk that controls may become inadequate because of changes in conditions, or that the degree of compliance with the policies or procedures may deteriorate. All internal control systems, no matter how well designed, have inherent limitations. Therefore, even those systems determined to be effective can provide only reasonable assurance with respect to financial statement preparation and presentation.
Management assessed the effectiveness of the Company’s internal control over financial reporting as of December 31,
2013.2016. In making this assessment, management used the criteria set forth by the Committee of Sponsoring Organizations of the Treadway Commission (COSO) in
Internal Control —Integrated Framework(1992 (2013 Framework). Based on our assessment, we concluded that, as of December 31,
2013,2016, the Company’s internal control over financial reporting is effective based on those criteria.
Ernst & Young LLP, the independent registered public accounting firm that audited the Company’s consolidated financial statements, has also audited the Company’s internal control over financial reporting as of December 31,
2013.2016. Ernst & Young LLP’s attestation report on the Company’s internal control over financial reporting appears directly below.
There have been no changes in the Company’s internal control over financial reporting or in other factors that have materially affected, or are reasonably likely to materially affect, the Company’s internal control over financial reporting during the Company’s last fiscal quarter.
Report of Independent Registered Public Accounting Firm
Board of Directors and Stockholders
We have audited Encore Wire Corporation’s
(the Company) internal control over financial reporting as of December 31,
2013,2016, based on criteria established in Internal Control—Integrated Framework issued by the Committee of Sponsoring Organizations of the Treadway Commission
(1992(2013 Framework) (the COSO criteria).
The Company’sEncore Wire Corporation’s management is responsible for maintaining effective internal control over financial reporting, and for its assessment of the effectiveness of internal control over financial reporting included in the accompanying Management’s Report on Internal Control over Financial Reporting. Our responsibility is to express an opinion on the
Company’scompany’s internal control over financial reporting based on our audit.
We conducted our audit in accordance with the standards of the Public Company Accounting Oversight Board (United States). Those standards require that we plan and perform the audit to obtain reasonable assurance about whether effective internal control over financial reporting was maintained in all material respects. Our audit included obtaining an understanding of internal control over financial reporting, assessing the risk that a material weakness exists, testing and evaluating the design and operating effectiveness of internal control based on the assessed risk, and performing such other procedures as we considered necessary in the circumstances. We believe that our audit provides a reasonable basis for our opinion.
A company’s internal control over financial reporting is a process designed to provide reasonable assurance regarding the reliability of financial reporting and the preparation of financial statements for external purposes in accordance with generally accepted accounting principles. A company’s internal control over financial reporting includes those policies and procedures that (1) pertain to the maintenance of records that, in reasonable detail, accurately and fairly reflect the transactions and dispositions of the assets of the company; (2) provide reasonable assurance that transactions are recorded as necessary to permit preparation of financial statements in accordance with generally accepted accounting principles, and that receipts and expenditures of the company are being made only in accordance with authorizations of management and directors of the company; and (3) provide reasonable assurance regarding prevention or timely detection of unauthorized acquisition, use, or disposition of the company’s assets that could have a material effect on the financial statements.
Because of its inherent limitations, internal control over financial reporting may not prevent or detect misstatements. Also, projections of any evaluation of effectiveness to future periods are subject to the risk that controls may become inadequate because of changes in conditions, or that the degree of compliance with the policies or procedures may deteriorate.
In our opinion, Encore Wire Corporation maintained, in all material respects, effective internal control over financial reporting as of December 31,
2013,2016, based on the COSO criteria.
We also have audited, in accordance with the standards of the Public Company Accounting Oversight Board (United States), the consolidated balance sheets of Encore Wire Corporation as of December 31,
20132016 and
20122015 and the related consolidated statements of income, stockholders’ equity and cash flows for each of the three years in the period ended December 31,
20132016 and our report dated February
28, 201424, 2017 expressed an unqualified opinion thereon.
February 28, 201424, 2017
PART III
Item 10. Directors, Executive Officers, and Corporate Governance.
The sections entitled “Election of Directors”, “Corporate Governance and Other Board Matters” and “Section 16(a) Beneficial Ownership Reporting Compliance” appearing in the Company’s proxy statement for the annual meeting of stockholders to be held on May
6, 20149, 2017 setting forth certain information with respect to the directors of the Company, Section 16(a) reporting obligations of directors and officers, the Company’s audit committee, the Company’s audit committee financial expert and the procedures by which security holders may recommend nominees to the Board of Directors are incorporated herein by reference. Certain information with respect to persons who are or may be deemed to be executive officers of the Company is set forth under the caption “Executive Officers of the Company” in Part I of this report.
In connection with Company’s long-standing commitment to conduct its business in compliance with applicable laws and regulations and in accordance with its ethical principles, the Board of Directors has adopted a Code of Business Conduct and Ethics applicable to all employees, officers, directors, and advisors of the Company. The Code of Business Conduct and Ethics of the Company is available under the “Investor Info”“Investors” section of the Company’s website at http://www.encorewire.com, and is incorporated herein by reference. The Company intends to post amendments to or waivers of its Code of Business Conduct and Ethics (to the extent applicable to any officer or director of the Company) at such location on its website.
Item 11. Executive Compensation.
The section entitled “Executive Compensation” appearing in the Company’s proxy statement for the annual meeting of stockholders to be held on May 6, 2014,9, 2017, sets forth certain information with respect to the compensation of management of the Company and compensation committee interlocks and insider participation and is incorporated herein by reference.
Item 12. Security Ownership of Certain Beneficial Owners and Management and Related Stockholder Matters.
The section entitled “Security Ownership of Certain Beneficial Owners, Directors and Executive Officers” appearing in the Company’s proxy statement for the annual meeting of stockholders to be held on May 6, 20149, 2017 sets forth certain information with respect to the ownership of the Company’s common stock, and is incorporated herein by reference. Certain information with respect to the Company’s equity compensation plans that is required to be set forth in this Item 12 is set forth under the caption “Equity Compensation Plan Information” contained in “Item 5. Market for Registrant’s Common Equity, Related Stockholder Matters and Issuer Purchases of Equity Securities” of this Form 10-K and is incorporated herein by reference.
Item 13. Certain Relationships and Related Transactions, and Director Independence.
The sections entitled “Executive Compensation — Certain Relationships and Related Transactions” and “Corporate Governance and Other Board Matters — Board Independence” appearing in the Company’s proxy statement for the annual meeting of stockholders to be held on May 6, 20149, 2017 set forth certain information with respect to certain relationships and related transactions, and director independence, and are incorporated herein by reference.
Item 14. Principal Accounting Fees and Services.
The Section entitled “Proposal Three — Ratification of Appointment of Independent Registered Public Accounting Firm” appearing in the Company’s proxy statement for the annual meeting of stockholders to be held on May
6, 2014,9, 2017, sets forth certain information with respect to certain fees paid to accountants, and is incorporated herein by reference.
PART IV
Item 15. Exhibits, Financial Statement Schedules.
The following documents are filed as a part of this report:
| |
| (1) | Consolidated Financial Statements included in Item 8 of this Annual Report on Form 10-K; and |
| |
| (2) | Financial statement schedules have been omitted because they are not applicable or the information required therein is included in the financial statements or notes thereto in Item 8 of this Annual Report on Form 10-K. |
| |
| (3) | The exhibits required by Item 601 of Regulation S-K, as set forth in the Index to Exhibits accompanying this Annual Report on Form 10-K. |
Item 16. Form 10-K Summary.
None.
Pursuant to the requirements of Section 13 or 15(d) of the Securities Exchange Act of 1934, the registrant has duly caused this report to be signed on its behalf by the undersigned, thereunto duly authorized.
| | |
| | | |
Date: February 28, 2014 | | | 24, 2017 | ENCORE WIRE CORPORATION |
| | | |
| | | |
| | By: | | /s/ Daniel L. Jones |
| | | | | | Chairman, President and Chief Executive Officer |
Pursuant to the requirements of the Securities Exchange Act of 1934, this report has been signed below by the following persons on behalf of the registrant and in the capacities and on the dates indicated.
|
| | | | |
Signature
| | Title
| | Date
|
| Signature | | Title | | Date |
| | | | |
| /s/ DANIEL L. JONES | | Chairman, President and Chief Executive Officer (Principal Executive Officer) | | February 28, 201424, 2017 |
| Daniel L. Jones | | Officer and Director
(Principal Executive Officer) | |
| | | | |
| | |
/s/ FRANK J. BILBAN | | Vice President-Finance, Treasurer, Secretary and Chief Financial Officer (Principal Financial and Accounting Officer) | | February 28, 201424, 2017 |
| Frank J. Bilban | | Treasurer, Secretary and
Chief Financial Officer (Principal Financial and
Accounting Officer) | |
| | | | |
| | |
/s/ DONALD E. COURTNEY | | Director | | February 28, 201424, 2017 |
| Donald E. Courtney | | | | |
| | | | |
/s/ GREGORY J. FISHER | | Director | | February 28, 201424, 2017 |
| Gregory J. Fisher | | | | |
| | | | |
/s/ WILLIAM R. THOMAS, III | | Director | | February 28, 201424, 2017 |
| William R. Thomas, III | | | | |
| | | | |
/s/ SCOTT D. WEAVER | | Director | | February 28, 201424, 2017 |
| Scott D. Weaver | | | | |
| | | | |
/s/ JOHN H. WILSON | | Lead Independent Director | | February 28, 201424, 2017 |
| John H. Wilson | | | | |
|
| | |
Exhibit Number | | Description |
| | |
| 3.1 | | Certificate of Incorporation of Encore Wire Corporation and all amendments thereto (filed as Exhibit 3.1 to the Company’s Quarterly Report on Form 10-Q for the quarter ended March 31, 2009 and incorporated herein by reference). |
| | |
| 3.2 | | Third Amended and Restated Bylaws of Encore Wire Corporation, as amended through February 27, 2012 (filed as Exhibit 3.2 to the Company’s Annual Report on Form 10-K for the year ended December 31, 2011 and incorporated herein by reference). |
| | |
| 4.1 | | Form of certificate for Common Stock (filed as Exhibit 1 to the Company’s registration statement on Form 8-A, filed with the SEC on June 4, 1992 and incorporated herein by reference). |
| |
4.2 | | Registration Rights Agreement dated February 29, 2012 among Encore Wire Corporation, Capital Southwest Corporation and Capital Southwest Venture Corporation (filed as Exhibit 4.2 to the Company’s Annual Report on Form 10-K for the year ended December 31, 2011 and incorporated herein by reference). |
| |
| 10.1* | | 1999 Stock Option Plan, as amended and restated, effective as of February 20, 2006 (filed as Exhibit 4.1 to the Company’s Registration Statement on Form S-8 (No. 333-138165) and incorporated herein by reference). |
| | |
| 10.2* | | 2010 Stock Option Plan (filed as Annex A to the Company’s Proxy Statement filed with the SEC on March 26, 2010 and incorporated herein by reference). |
| | |
| 10.3* | | Form of Indemnification Agreement (filed as Exhibit 10.11 to the Company’s Quarterly Report on Form 10-Q for the quarter ended March 31, 2009 and incorporated herein by reference). |
| | |
| 10.4* | | Form of Stock Option Agreement under the 1999 Stock Option Plan (filed as Exhibit 10.12 to the Company’s Quarterly Report on Form 10-Q for the quarter ended June 30, 2009 and incorporated herein by reference). |
| | |
| 10.5* | | Form of Incentive Stock Option Agreement under the 2010 Stock Option Plan (filed as Exhibit 10.15 to the Company’s Annual Report on Form 10-K for the year ended December 31, 2010 and incorporated herein by reference). |
| | |
| 10.6* | | Form of Non-Qualified Stock Option Agreement under the 2010 Stock Option Plan (filed as Exhibit 10.16 to the Company’s Annual Report on Form 10-K for the year ended December 31, 2010 and incorporated here by reference). |
| | |
| 10.7 | | Registration Rights Agreement dated February 29, 2012 among Encore Wire Corporation, Capital Southwest Corporation and Capital Southwest Venture Corporation (filed as Exhibit 4.2 to the Company’s Annual Report on Form 10-K filed with the SEC on March 2, 2012 and incorporated herein by reference). |
| |
10.8 | | Share Repurchase Agreement dated May 14, 2012 by and among the Company, Capital Southwest Corporation and Capital Southwest Venture Corporation (filed as Exhibit 10.1 to the Company’s Current Report on Form 8-K filed with the SEC on May 18, 2012 and incorporated herein by reference). |
| |
10.9 | | Credit Agreement dated September 27, 2012 by and among the Company, Bank of America, N.A., as administrative agent and letter of credit issuer, Wells Fargo Bank, National Association, as syndication agent and the other lender parties thereto (filed as Exhibit 10.1 to the Company’s Quarterly Report on Form 10-Q filed with the SEC on November 2, 2012 and incorporated herein by reference). |
| |
10.10 | | Commercial Contract |
| 10.8 | | First Amendment to Credit Agreement, dated as of Sale dated June 18,December 31, 2013, by and among the Company, VTCR, LP, MADMT, LPBank of America, N.A., as lender and Prairie Flight, LPadministrative agent and Wells Fargo Bank, National Association, as lender (filed as Exhibit 10.1 to the Company’sCompany's Quarterly Report on Form 10-Q filed with the SEC on August 2, 2013May 5, 2014 and incorporated herein by reference). |
| | |
| 10.9 | | Second Amendment to Credit Agreement, dated as of December 31, 2014, by and among the Company, Bank of America, N.A., as lender and administrative agent and Wells Fargo Bank, National Association, as lender (filed as Exhibit 10.10 to the Company’s Annual Report on Form 10-K for the year ended December 31, 2014 and incorporated herein by reference). |
| | |
|
| | |
| 10.10 | | Third Amendment to Credit Agreement, dated as of September 29, 2016, by and among Encore Wire Corporation, as borrower, Bank of America, N.A., as administrative agent and letter of credit issuer, Wells Fargo Bank, National Association, as syndication agent, the financial institutions a party thereto as lenders and EWC Aviation Corporation, as guarantor (filed as Exhibit 10.1 to the Company’s Current Report on Form 8-K filed with the SEC on October 5, 2016 and incorporated herein by reference). |
| | |
| 10.11* | | Encore Wire Corporation 2014 Stock Appreciation Rights Plan |
| | |
| 21.1 | | Subsidiaries |
| | |
| 23.1 | | Consent of Ernst & Young LLP |
| | |
| |
| 31.1 | | Certification by Daniel L. Jones, Chairman, President and Chief Executive Officer of the Company, dated February 28, 201424, 2017 and submitted pursuant to Rule 13a-14(a)/15d-14(a) and pursuant to Section 302 of the Sarbanes-Oxley Act of 2002. |
| | |
| 31.2 | | Certification by Frank J. Bilban, Vice President — Finance, Treasurer, Secretary and Chief Financial Officer of the Company, dated February 28, 201424, 2017 and submitted pursuant to Rule 13a-14(a)/15d-14(a) and pursuant to Section 302 of the Sarbanes-Oxley Act of 2002. |
| | |
| 32.1 | | Certification by Daniel L. Jones, Chairman, President and Chief Executive Officer of the Company, dated February 28, 201424, 2017 as required by 18 U.S.C. Section 1350, as adopted pursuant to Section 906 of the Sarbanes-Oxley Act of 2002. |
| | |
| 32.2 | | Certification by Frank J. Bilban, Vice President — Finance, Treasurer, Secretary and Chief Financial Officer, dated February 28, 201424, 2017 as required by 18 U.S.C. Section 1350, as adopted pursuant to Section 906 of the Sarbanes-Oxley Act of 2002. |
| | |
| 101.INS | | XBRL Instance Document |
| | |
| 101.SCH | | XBRL Taxonomy Extension Schema Document |
| | |
| 101.CAL | | XBRL Taxonomy Extension Calculation Linkbase Document |
| | |
| 101.DEF | | XBRL Taxonomy Extension Definition Document |
| | |
| 101.LAB | | XBRL Taxonomy Extension Label Linkbase Document |
| | |
| 101.PRE | | XBRL Taxonomy Extension Presentation Linkbase Document |
| |
| * | Management contract or compensatory plan |