inability to retain and increase the Company’s subscriber base;
inability to execute properly on new products and services, or failure of subscribers to accept these products and services;
competition;
inability to attract and retain sales and senior management personnel;
inability to access adequate capital to fund operations and investments in our business;
difficulties in protecting the security, confidentiality, integrity and reliability of the Company’s data;
changes in accounting policies or practices;
legal and regulatory issues;
the results of pending, threatening or future litigation; and
the risk factors listed under “Item 1A. Risk Factors” of this annual report on Form 10-K.
You are cautioned not to place undue reliance on any forward-looking statements, which speak only as of the date of this annual report on Form 10-K. Except as required by law, the Company undertakes no obligation to publicly update or release any revisions to these forward-looking statements to reflect any events or circumstances after the date of this annual report on Form 10-K or to reflect the occurrence of unanticipated events.
The following is a discussion of the risk factors that Reis’s management believes are material to Reis at this time. These risks and uncertainties are not the only ones facing Reis and there may be additional matters that Reis is unaware of or that Reis currently considers immaterial. Any or all of these could adversely affect Reis’s business, results of operations, profitability, financial condition and cash flows.
Risks Related to the Reis Services Business and the Information Services Industry Generally
A failure to attract and retain subscribers could harm our business.
We must acquire new subscribers and expand our business with our current subscribers in order to grow our business.Our ability to grow our business will be adversely impacted to the extent that current subscribers reduce or discontinue the use of our products and web sites,websites, includingReis SE, MobiussandReisReports, or if we are unable to locate and have prospects subscribe toReis SE, Mobiussand ReisReports. This may occur due to budgetary constraints, which was particularly true during the height of the economic downturn in 2008 and 2009, or if our product offering is less competitive with those of other companies in our industry. Prior to 2008, our overall trailing twelve month renewal rates were above 94% for many years. In the latter part of 2008 and in 2009, we
experienced an overall decrease in the total number of our subscribers and a reduction in our trailing twelve month renewal rates. The overall trailing twelve month renewal rate fell to a low of 83% at September 30, 2009. The
Our overall renewal rates were 87% and 91% for the trailing twelve month renewal rate atmonths ended December 31, 2014 and 2013, respectively (for institutional subscribers, the renewal rates were 89% and 93% for the trailing twelve months ended December 31, 2014 and 2013, respectively). The decline in the renewal rates reflects our decision to be more aggressive with our renewal pricing policies, particularly in instances where customer usage levels are significantly greater than what was 91%. initially estimated as annual usage for that customer. We believe that aligning client report consumption with appropriate annual fees, while remaining respectful of subscriber need for Reis information, is more important in the long-term, than a modest decline in the current renewal rate. While management believes, based upon past experience, that many non-renewing customers ultimately renew with Reis as their information and analytic needs may not be fully addressed by competitive offerings, there is no certainty that non-renewing customers will ultimately renew with Reis.
There can be no assurance that we will be successful in continuing to identify and sell to additional subscribers, expand business from our existing subscribers, regain non-renewing customers, or either maintain our existing renewal rates or increase our renewal rates to pre-recession levels.rates.
Our revenues are concentrated among certain key subscribers.
We had 994 and 844have approximately 1,000 enterprise subscribers toReis SE at December 31, 2013 and 2012, respectively.2014. The largest individual subscriber accounted for 3.4%2.9% and 4.2%3.4% of our revenue for the years ended December 31, 20132014 and 2012,2013, respectively. If we were to experience a reduction or loss of business from a number of our largest subscribers, it could have a material adverse effect on our revenues and, depending on the significance of the loss, our profitability, financial condition and cash flows. In addition, although we generally impose contractual restrictions limiting our immediate exposure to revenue reductions due to mergers and consolidations among our subscribers and potential subscribers and our pricing model is based on actual and projected usage, we may be impacted by
consolidation among our subscribers and potential subscribers, as a result of their reduced usage on a combined basis or greater bargaining power.
We may be unable to compete successfully with our current or future competitors.
The market for information, analytics and decision support services in general is highly competitive and rapidly changing. We compete with (1) local companies that offer commercial real estate research with respect to their specific geographic areas and (2) national companies that offer national commercial real estate research. Specifically, certain of our products compete with those of CoStar (including both its Property and Portfolio Research and LoopNet businesses), Real Capital Analytics, Xceligent, and CBRE Econometric Realty Advisors.Advisors and Moody’s. Some of our competitors, either alone or with affiliated entities, may have greater name recognition, larger subscriber bases or greater financial, technical or marketing resources than we have. In addition, some competitors may be able to undertake more effective marketing campaigns, adopt more aggressive pricing policies, make more attractive offers to potential employees and business partners or respond more quickly to new or emerging technologies or changes in subscriber requirements. Competition could negatively impact our revenues, profitability, financial condition and cash flows.
We may not be able to maintain Reis Services’s historical rates of growth in revenues or EBITDA. In addition, multi-year contracts may negatively impact our growth rates.
Historically, Reis Services has experienced revenue and EBITDA growth (EBITDA is(we define EBITDA as earnings (defined as income(income (loss) from continuing operations), before interest, taxes, depreciation and amortization). Reis Services’s annualAnnual revenue grew by 14.9% from 2011 to 2012, and by 11.2% from 2012 to 2013.2013 and by 19.0% from 2013 to 2014. On a pro forma basis, revenue grew by 12.8% from 2011 to 2012 and by 13.2% from 2012 to 2013 after consideration of certain pro forma items in 2012, as more fully described in Item 7. The fourth quarter and annual 20132014 revenue was the highest quarterly and annual revenue in the Company’s history. It also marks the 15th19th consecutive quarterly increase in revenue over the prior year’s corresponding quarter. There can be no assurance that our revenues will continue to grow at or in excess of the pace of our recent performance, pace, on a consecutive quarter and annual basis, on a year over yearyear-over-year basis, or at all in the future.
Reis Services’s annual EBITDA grew by 17.8% from 2011 to 2012, and by 12.1% from 2012 to 2013.2013 and by 17.8% from 2013 to 2014. On a pro forma basis, Reis Services EBITDA grew by 12.5% from 2011 to 2012 and by 17.3% from 2012 to 2013, after consideration of certain pro forma items in 2012, as more fully described in Item 7. The fourth quarter of 2014 marks the 17th consecutive quarterly increase in Reis Services EBITDA over the prior year’s quarter. Expenses will increase in the future, including expenses for content maintenance, sales, marketing and product development, with the expectation that these expense increases will drive future revenue growth; however, such additional expenses could result in reduced margins or profitability, or negatively impact liquidity in the near term, and if not successful, may negatively impact margins, profitability and liquidity in the long term. There can be no assurance that ourfuture EBITDA or Adjusted EBITDA for the Reis Services segment, or on a consolidated basis will continue to grow at or in excess of
the pace of our recent performance, pace, on a consecutive quarter and annual basis, on a year over yearyear-over-year basis, or at all in the future.all. There can be no assurance that we will be able to maintain or expand our EBITDA or EBITDA margins for the Reis Services segment, or on a consolidated basis, in the future. EBITDA is aand Adjusted EBITDA are non-GAAP financial measuremeasures within the meaning of the rules and regulations of the Securities and Exchange Commission.SEC. See Item 7 for a reconciliationreconciliations of EBITDA and Adjusted EBITDA to the most comparable GAAP measure, income from continuing operations.operations, for both the Reis Services segment and on a consolidated basis.
Over the past three years, Reis has made a concerted effort to negotiate and enter into multi-year contracts with terms of two or three years, and in some cases, four years. Securing customers into contracts greater than 12 months allows for a stable revenue base and increased revenue visibility (as measured by our level of reported Aggregate Revenue Under Contract (see Item 7 for more information on this performance metric)) and increased cash flow visibility, positively impacts our renewal rates and allows for a better allocation of account management and other personnel resources. However, multi-year subscriptions mute our revenue growth rates after the first year of the subscription. We recognize revenue ratably over the related contractual period. Therefore any increases in the price of the subscription after the first year of a multi-year contract are considered in the total amount being straight-lined over the contract term. On any given multi-year contract, the biggest revenue growth will be reflected in the 12 month period following a negotiated renewal, with no further revenue growth generated from that contract after the first year. Although our cash collection increases year-over-year, multi-year contracts have a flattening effect on our overall revenue growth rate. This would also similarly impact our EBITDA growth rates. As of December 31, 2014, we have subscriptions with approximately 240 institutions signed to a multi-year deal.
If our growth rates decline, or if revenue and/or EBITDA decline, investors’ perceptions of our business may be adversely affected and the market price of our common stock could decline.
We must continue to obtain information from multiple sources.
The quality of our databases supporting our products depends substantially on information provided by a large number of sources, including commercial real estate brokers, agents and property owners, as well as from public sources, such as tax assessors, deed recorders, planning and zoning boards, corporate web sites,websites, the business and trade press, and selected third party vendors of business information. If we are unable to collect information from a significant number of these sources, or if the cost of collecting information becomes too expensive, our products could be negatively affected, potentially resulting in an increase in subscriber cancellations and a failure to acquire new subscribers.
Our revenues, expenses and operating results could be affected by general economic conditions or by changes in commercial real estate markets, which are cyclical.
Our business and the commercial real estate industry are sensitive to trends in the general economy and trends in local, regional and national commercial real estate markets, which are unpredictable. Therefore, our operating results, to the extent they reflect changes in the broader commercial real estate industry, may be subject to significant fluctuations. A number of factors could have an effect on our revenues, expenses, profitability or cash flows, such as:
periods of economic slowdown or recession in the U.S. or locally;
mergers, acquisitions, failures or government takeovers of our subscribers and potential subscribers;
governmental intervention in economic policy;
inflation or deflation;
flows of capital into or out of real estate investment in the U.S. or various regions of the U.S.;
changes to the manner in which transactions are financed;
changes in the risk profile of real estate assets and collateral for financings;
changes or consolidation in the real estate industry;
changes in levels of rent, absorption, leasing activity or appreciation of asset values;
changing interest rates;
changes in the cost and availability of capital;
lower consumer confidence;
wage and salary levels;
war, terrorist attacks or natural disasters; or
the public perception that any of these conditions may occur.
If our subscribers choose not to useReis SE, Mobiuss orReisReports because of any of these factors, and we are not successful in attracting new subscribers, our revenues, expenses, EBITDA, margins, profitability, cash flows and/or stock price could be negatively affected.
Our success depends on our ability to introduce new or upgraded services or products.
To continue to attract new subscribers and renew our existing subscribers, we may need to introduce new products or services. The need for new products and services may be in response to or in anticipation of changing or developing customer needs or preferences as well as to remain competitive with other providers of market information. We may choose to develop new products and services independently or to license or otherwise integrate content and data from or with third parties. The introduction of new products and services could impose costs on our business and require the use of resources, and there is no guarantee that we will continue to be able to access new content and technologies on commercially reasonable terms or at all. If subscribers or potential subscribers do not recognize the value of our new services or enhancements to existing services, our operating results could be negatively affected. We may incur significant costs and experience difficulties in developing and delivering these new or upgraded services or products.
Efforts to enhance and improve the ease of use, responsiveness, functionality and features of our existing and newly developed products and services have inherent risks, and we may not be able to manage these product developments and enhancements successfully or in a cost effective manner. If we are unable to continue to develop new or upgraded services or products, then subscribers may choose not to use our products and services. Our growth and results of operations would be negatively impacted if we were unable to successfully market and sell any new services or upgrades.
OurMobiuss product is dependent upon the activities of another organization over which we do not exercise control.Mobiuss has been developed with, and is being co-marketed with Opera Solutions, an unrelated third party. Opera Solutions is a leader in “Big Data” science, predictive analytics and technological innovations. TheMobiuss product is a combination of Reis’s commercial real estate market information and forecasts with Opera Solutions’s risk analytics and web-based technologies.technologies provided by the unrelated third party. If Opera Solutionsthis third party fails to devote the time, capital and resources to the continuing development and support of theMobiussproduct, and if Reis cannot either replace Opera Solutionsthem with another party or perform the functions for itself, sales ofMobiussto new subscribers or the renewal of
subscriptions to existingMobiuss subscribers could be negatively impacted resulting in a reduction in revenue, and negatively impacting our EBITDA, margins, profitability and cash flows.
Our ReisReports and Mobiuss offerings may not be successful or may not result in increased revenues, which may negatively impact our business, results of operations and financial position.
WeDuring 2015, we expect to continue to expand our sales and marketing efforts in connection with ourReisReportsandMobiuss product offerings during 2014 which could result in increased expenses. If our costs for these efforts exceed our expectations, our profitability and financial position could be adversely affected. In addition, if we incur additional costs to expand these products and we are not successful in marketing or selling these expanded services, this could have an adverse effect on our financial position by increasing our expenses without increasing our revenues, impacting margins, profitability and cash flows.
If we fail to protect confidential information against security breaches, or if subscribers are reluctant to use our products because of privacy concerns, we might experience a loss in profitability.
Pursuant to the terms and conditions of use on our web sites,websites, as part of our subscriber registration process, we collect and use personally identifiable information. Industry-wide incidents or incidents with respect to our web sites,websites, including theft, alteration, deletion or misappropriation of information, security breaches, malevolent activities by computer hackers, viruses (or anything else that may contaminate or cause destruction to our systems), or changes in industry standards, regulations or laws could deter people from using the Internet or our web siteswebsites to conduct transactions that involve the transmission of confidential information, which could harm our business. Under the laws of certain jurisdictions, if there is a breach of our computer systems and we know or suspect that unencrypted personal subscriber data has been stolen, we may be required to inform any subscribers whose data was stolen and we may be subjected to liability, which could harm our reputation and business.
Certain state laws require businesses that maintain personal information in electronic databases to implement reasonable measures to keep that information secure. Various states have enacted different and sometimes contradictory requirements for protecting personal information collected and maintained electronically. We may face adverse publicity if we are not able to comply with laws requiring us to take adequate measures to assure the confidentiality of the personally identifiable information that our subscribers have given to us. This could result in a loss of customers and revenue. Even if we are in full compliance with all relevant laws and regulations, we still may face liability or disruption to our business if we do not comply in every instance or if the security of the customer data that we collect is compromised, regardless of whether our practices comply or not.
Our business could be harmed if we are unable to maintain the integrity and reliability of our data and forecasts.
Our success depends on our subscribers’ confidence in the comprehensiveness, accuracy, and reliability of the data and forecasts we provide. We believe that we take adequate precautions to safeguard the completeness and accuracy of our data and that the information is generally current, comprehensive and accurate. Nevertheless, we depend to a large degree on information provided to us on a voluntary basis by third parties, including commercial real estate brokers, agents and property owners. OurMobiuss product involves the delivery of portfolio analytics derived from the combined expertise of Reis and Opera Solutions, aan unrelated third party; we are not in control of Opera Solutions’sthe unrelated third party’s technology, intellectual property or economic or financial models in connection with the delivery of its portion of theMobiuss product. Further, data is susceptible to electronic malfeasance including theft, alteration, deletion, viruses and malevolent activities by computer hackers. In addition, our reports and conference calls for the benefit of our subscribers may contain forecasts with respect to real estate trends. Although our contracts contain language limiting our liability if any of our data or forecasts are inaccurate or are later not borne out by actual results, for any of the above reasons, demand for our services could diminish and we may be exposed to lawsuits claiming damages resulting from inaccurate data and forecasts.
We may be unable to enforce or defend our ownership or use of intellectual property.
Our business depends in large measure on the intellectual property utilized in our methodologies, software and database.databases. We rely on a combination of trademark, trade secret, database protection and copyright laws, registered domain names, non-disclosure, non-competition and other contractual provisions with employees, vendors and consultants, work-for-hire provisions, restrictive license agreements with subscribers and technical security measures to protect our proprietary intellectual property rights. However, we do not hold Federal registrations covering all of our trademarks and copyrightable materials. We also do not own any patents or patent applications. In addition, current law may not adequately protect our databases and data, and legal standards relating to the validity, enforceability and scope of protection of proprietary rights in online businesses are uncertain and evolving. Our business could be significantly harmed if we do not continue to protect our intellectual property.
In addition, notwithstanding our efforts to protect our intellectual property, third parties may misappropriate our data through web sitewebsite scraping, robots or other means and aggregate this data on their web siteswebsites with data from other companies. In addition, copycat web siteswebsites may misappropriate data on our web sitewebsite and attempt to imitate the functionality of our web site.website. We may not be able to detect all such web siteswebsites in a timely manner and, even if we could, technological and legal measures may be insufficient to stop their operations. Available remedies may not be adequate to protect us against the misappropriation of our data, and any measures that we may take could require us to expend significant financial resources.
We also could be significantly harmed if claims are made against us alleging infringement of the intellectual property rights of others. Any intellectual property claims, regardless of merit, could be expensive to litigate or settle, and could require the expenditure of substantial amounts of time and/or money.
If our web siteswebsites or other services experience system failures or malicious attacks, our subscribers may be dissatisfied and our operations could be impaired.
Our business depends upon the satisfactory performance, reliability and availability of our web sites.websites. Problems with the web siteswebsites could result in reduced demand for our services. Furthermore, the software underlying our services is complex and may contain undetected errors. Despite testing, we cannot be certain that errors will not be found in our software. Any errors could result in adverse publicity, impaired use of our services, loss of revenues, cost increases or legal claims by subscribers.
Additionally, our services substantially depend on systems provided by third party vendors and service providers, over whom we have little or no control. Interruptions in service could result from the failure of data providers, telecommunications providers, or other third parties, including due to break-ins, unauthorized access, computer viruses, vandalism, fire, floods, severe weather, earthquakes, power loss, telecommunications failures, terrorism, acts of war, and other similarly damaging events. We depend on these third party providers of Internet communication services to provide continuous and uninterrupted service. We also depend on Internet service providers that provide access to our services. Any disruption in the Internet access provided by third party providers or any failure of third party providers to handle higher volumes of user traffic could harm our business.
Our internal network infrastructure could be disrupted or penetrated, which could materially impact both our ability to provide services and subscribers’ confidence in our services.
Our operations depend upon our ability to maintain and protect our computer systems. While we believe that our systems, most of which are redundant and independent systems in separate locations, are adequate to support our operations, our systems may be vulnerable to damage from break-ins, unauthorized access, computer viruses, vandalism, fire, floods, severe weather, earthquakes, power loss, telecommunications failures, terrorism, acts of war, and other similarly damaging events. Although we maintain insurance against fires, floods, and general business interruptions, the amount and types of coverage may not be adequate in any particular case. Furthermore, any damage or disruption could materially impair or block our ability to provide services, which could significantly impact our business.
Experienced computer programmers, or hackers, may attempt to penetrate our network security from time to time. Although we have not experienced any security breaches to date and we maintain a firewall, a hacker who penetrates network security could misappropriate proprietary information or cause interruptions in our services. We might be required to further expend significant capital and resources to protect against, or to alleviate, problems caused by hackers. We also may not have a timely remedy against a hacker who is able to penetrate our network security. In addition to purposeful security breaches, the inadvertent transmission of computer viruses or anything else manifesting contaminating or destructive properties could expose us to litigation or to a material risk of loss. Any of these incidents could materially impact our ability to provide services as well as materially impact the confidence of our subscribers in our services, either of which could significantly and adversely impact our business.
We may be subject to regulation of advertising and subscriber solicitation or other newly-adopted laws and regulations.
As part of our subscriber registration process, our subscribers agree to receive emails and other communications from us. In addition, we use email and other online marketing techniques to reach potential subscribers, particularly for ourReis SEandReisReports products. We may be subject to restrictions on our ability to communicate through email and phone calls, even with existing subscribers. The U.S. and other jurisdictions have proposed or adopted laws that restrict or prohibit unsolicited email or spam. These laws may impose significant monetary penalties for violations. In addition, laws or regulations that could harm our business could be adopted, or reinterpreted so as to affect our activities, by Federal and state governments, regulatory agencies or foreign governments or agencies. This could include, for example, laws regulating the source, content or form of information provided on our web sites,websites, the information or services we provide, or our transmissions over the Internet. Violations or new interpretations of these laws or regulations may result in penalties, damage our reputation, increase our costs or make our services less attractive.
Litigation or governmental investigations in which we become involved may significantly increase our expenses and adversely affect our stock price.
From time to time, we are a party to various lawsuits. Any lawsuits, threatened lawsuits or governmental investigations in which we are involved could cost us a significant amount of time and money to defend, could distract management’s attention away from operating our business, could result in negative publicity and could adversely affect our stock price. In addition, if any claims are determined against us or if a settlement requires us to pay a large monetary amount or take other action that materially restricts our operations, our profitability could be significantly reduced and our financial position could be adversely affected. Our insurance may not be sufficient to cover any losses we incur in connection with litigation claims.
Reis develops and maintains three highly curated, proprietary databases of U.S. commercial real estate. On an ongoing basis Reis surveys and receives data from building owners, leasing agents and managers, as well as from multiple data sources. None-the-less,Nonetheless, we may be subject to legal liability for collecting, displaying or distributing information. We may also be subject to claims based on the content that is accessible from our website through links to other websites or information on our website supplied by third parties. We could also be subject to claims that the collection or provision of certain information breached laws and regulations relating to privacy and data protection. Even if these claims do not result in liability to us, we could incur significant costs in investigating and defending against any claims.
Our revenue, expenses, operating results, margins, financial condition and cash flows are subject to fluctuations.
Our revenues, expenses, operating results, margins, financial condition and cash flows have fluctuated in the past and are likely to continue to do so in the future. These fluctuations could negatively affect our results of operations during that period and future periods. Our revenues, expenses, operating results, margins, financial condition and cash flows may fluctuate from quarter to quarterquarter-to-quarter due to factors including, among others, those described below:
our ability to obtain new subscribers, and retain existing subscribers and regain non-renewing subscribers;
the number and dollar amount of contracts that are multi-year;
changes in our marketing or other corporate strategies;
changes in our pricing strategies;
our introduction of new products and services or changes to existing products and services;
the amount and timing of our operating expenses and capital expenditures;
changes in the volume, timing or price of custom data deliverables;
costs related to acquisitions of businesses or technologies;
competition;
changes or consolidation in the real estate industry;
changes in subscriber budgets;
interest rate fluctuations;
inflation;
changes in accounting policies or practices; and
other factors outside of our control.
An impairment in the carrying value of goodwill or other intangible assets could negatively impact our consolidated results of operations.
Reis has $54,825,000 of goodwill at December 31, 2014, which is not an amortizable asset and is tested for impairment at least annually, or after a triggering event has occurred, requiring such a calculation. In addition, the carrying amount of amortizable intangible assets at December 31, 2014 aggregated $14,681,000. There were no indications of impairment in any of the Company’s intangible assets or goodwill at December 31, 2014. If, in the future, a determination is made that the carrying amount of the Company’s goodwill or amortizable intangible assets is less than the fair value of the respective asset, the Company would record an impairment charge in accordance with the applicable accounting literature. Any future impairment charge could negatively impact the Company’s results of operations, net worth, or the market price of our common stock.
Our business depends on retaining and attracting capable management and operating personnel.
The implementation and development of Reis’s business plan require the skills and knowledge of our senior executives, as well as our sales, technology and operational personnel. Reis may not be able to offset the impact of the loss of the services of these individuals or other key officers or employees because our business requires skilled management, as well as technical, product and technology, and
sales and marketing personnel, who are in high demand and are often subject to competing offers. Competition for qualified employees is intense in the information industry, and the loss of a substantial number of qualified employees, or an inability to attract, retain and motivate additional highly skilled employees, could have a material adverse impact on Reis.
Although Reis uses various incentive programs to retain and attract key personnel, these measures may not be sufficient to either attract or retain, as applicable, the personnel required to ensure our success. In addition, grants and issuances pursuant to our equity incentive plans may result in dilution to Reis stockholders.
The loss of one or more of our senior executives, or our sales, technology or operational personnel, could have a material adverse impact on the continuing operations of Reis and could adversely affect the market price of Reis’sour common stock.
We may be subject to tax audits or other procedures concerning our tax collection policies.
We do not collect sales or other similar taxes in states other than New York. However, one or more states (other than New York) may seek to impose sales tax collection obligations on out-of-state companies, such as Reis, which engage in online commerce. A successful assertion that we should collect sales, use or other taxes on the sale of our products or services into these states could subject us to liability for current or past taxes due, and could increase the effective price of our products and services, which could harm our business.
If we are not able to successfully identify or integrate future acquisitions, our business operations and financial condition could be adversely affected, and future acquisitions may divert management’s attention and consume significant resources.
We may in the future attempt to further expand our markets and services in part through acquisitions of complementary businesses, services, databases and technologies. Mergers and acquisitions are inherently risky, and we cannot assure you that future acquisitions, if any, will be successful. The successful execution of any future acquisition strategy will depend on our ability to identify, negotiate, complete and integrate such acquisitions. Acquisitions involve numerous risks and uncertainties, including the potential unavailability of financial resources necessary to consummate acquisitions, the potential inability to identify all of the risks and liabilities inherent in a target company, the diversion of management’s attention from the operations of our business and strain on our existing personnel. In addition, any acquired businesses would generally be subject to the other risks described under this “Risks Related to the Reis Services Business and the Information Services Industry Generally” section.
Failure to manage and successfully integrate acquired businesses could harm our business. Integration of acquired entities can involve significant difficulties, such as strain on our personnel, systems and operational and managerial controls and procedures, the need to modify systems or add management resources, possible adverse short-term effects on cash flows or operating results, diversion of management’s attention from the operations of our business and failure to obtain and retain key personnel of an acquired business. In addition, if we finance acquisitions by incurring additional debt, our financial condition or liquidity could be adversely impacted. If we finance or otherwise complete acquisitions by issuing equity or convertible debt securities, existing stockholders’ ownership may be diluted.
Risks Related to Our Discontinued Operations (Residential Development Activities)
We may be exposed to risks associated with our prior development, construction and sale of residential units, and our prior ownership of real property generally.
Reis and certain of its subsidiaries were exposed to significant losses and other expenses associated with construction defect litigation at its Colorado condominium project during 2012. Reis may be exposed in the future to other claims associated with its discontinued residential development activities, including its involvement in the development, construction and sale of single family homes or lots, or claims related to environmental remediation, dissatisfaction by homeowners and homeowners’ associations with the construction of homes and amenities by us and/or our developer partners, or other matters, which could result in litigation costs, remediation costs, warranty expenses or settlement costs which could be material to Reis’s reported discontinued operations, financial condition and cash flows. See Note 10 to the Company’s consolidated financial statements for information relating to the Company’s Gold Peak condominium project in Colorado.Colorado (“Gold Peak”).
We may be unable to recover any cash from insurance companies or other potentially responsible parties.
We continue to evaluate the cost and benefits of pursuing cash recovery efforts from insurance providers, subcontractors, other professionals, our partners or other potentially responsible parties related to the Gold Peak project. During 2012, Reis and certain of its subsidiaries settled with, and used $17,000,000 of cash on the balance sheet to pay the Gold Peak homeowners association. No portion
of the $17,000,000 was provided by any of the other defendants, potentially responsible parties or insurance companies. Our recovery efforts may include litigation, mediation, settlement or trials. Recovery efforts through December 31, 20132014 resulted in cash collections ofaggregating $819,000, including $26,000, $80,000 and $712,500$713,000 in 2014, 2013 and 2012, respectively. During 2014,2015, we may incur additional legal and expert costs and allocate resources to our recovery efforts, which may not result in any cash recoveries. As described in Note 10 to the Company’s consolidated financial statements, a trial in the comprehensive insurance action is scheduled for July 2015, and the trial in the subcontractor case is scheduled for October 2015. The amount of incurred costs related to these actions, without any cash recoveries, could negatively affect our discontinued operating results, financial condition and cash flow.
Risks Related to Ownership of Our Common Stock, Our Capital Structure and Reis Generally
Our common stock is thinly traded; there may continue to be little or no liquidity for shares of our common stock; and our Board of Directors may take actions with which you disagree, which affect the trading price of our common stock.
Historically, our common stock has been thinly traded, and ana highly active trading market for our common stock may not develop. In the absence of ana highly active public trading market, investors trying to sell their shares may find it difficult to find buyers for their shares at prices quoted in the market or at all.
Our Board of Directors, or Board, may authorize transactions with respect to our common stock. These transactions may include a reverse stock split or odd-lot or other share repurchase programs, or the declaration of a one-time or recurring dividend. Between December 2008 and August 2011, the Board authorized the repurchase of up to an aggregate amount of $5,000,000 of our common stock, of which approximately $551,000 remained available for repurchase as of December 31, 2013.stock. Cumulatively, the Company hasutilized $4,449,000 through December 31, 2011, and repurchased approximately 8.1% of the common shares outstanding at the time of the Board’s initial authorization in December 2008. All future decisions regarding any such authorizations to repurchase stock will be at the discretion of our Board, will require authorization from the Board, and will be evaluated from time to time in light of the Company’s liquidity and anticipated cash needs, the price per share of our common stock, the number of shares of our common stock outstanding, applicable NASDAQ rules, debt covenant compliance requirements, applicable law and other factors deemed relevant. Amounts may be authorized by the Board whereby future purchases could be commenced or suspended at any time, or from time to time without notice. If we effect any such repurchases in the future, the liquidity of our common stock could be adversely affected due to the reduced number of shares that would be outstanding. In addition, a share repurchase program requires the payment of cash by Reis to stockholders, which could adversely impact our liquidity. If we effect a reverse stock split, there can be no assurance that the market price per share of our common stock after the reverse stock split will rise or remain constant in proportion to the reduction in the number of shares of our common stock outstanding before the reverse stock split.
We commenced a quarterly dividend program in the second quarter of 2014 when we declared and paid an initial quarterly cash dividend of $0.11 per common share in June 2014. In the third and fourth quarters of 2014, we declared and paid a quarterly cash dividend of $0.11 per common share in each of September 2014 and December 2014, respectively. Aggregate dividends paid by the Company during 2014 approximated $3,698,000. On February 2, 2015, we announced that we have increased the dividend payable on March 18, 2015 to $0.14 per common share. Although we anticipate paying a quarterly dividend hereafter, future dividends are subject to approval by the Board. If the Board were to declare a special dividend, or increase the regular quarterly dividend pay rate to an amount greater than $0.14 per share, the cash used infor such a special dividend or dividend increase could adversely impact our liquidity;liquidity. Conversely, if we were to reduce, or stop paying a quarterly dividend, it could result in addition, the resultinga change in the investment profile of the CompanyReis and could cause certain stockholders with an investment criteria of investing in stocks that pay a dividend to purchase and/or sell our stock, potentially adversely affecting the market for and the market price of our common stock.
Certain of our executive officers and directors own a significant percentage of our stock, have significant control of our management and affairs, and may favor transactions or policies with which you disagree.
The named executive officers and directors of Reis in the aggregate beneficially owned approximately 24.9%24.2% of Reis’s outstanding common stock as of December 31, 2013.2014. Of this total, Lloyd Lynford and Jonathan Garfield, each of whom is a founder, an executive officer and a director of the Company, beneficially owned 12.9%12.4% and 9.0%8.8%, respectively.respectively, at December 31, 2014. A significant concentration of share ownership may adversely affect the trading price of a company’s common stock because investors may perceive disadvantages in owning stock in companies where management holds a significant percentage of the voting power. A concentration of ownership may have the effect of delaying or preventing a change of control, including a merger, consolidation or
other business combination involving Reis, or discouraging a potential acquirer from making a tender offer or otherwise attempting to obtain control, even if such a change of control might be seen as beneficial to other Reis stockholders.
Executive officers, directors and employees may sell shares of Reis stock.
Certain of our executive officers, directors and employees may establish selling plans in accordance with the rules and regulations of the SEC. These selling plans may be utilized to provide such employees with a degree of financial diversification, as well as to assist in satisfying certain tax or other financial obligations. In the fourth quarter of 2014, both Lloyd Lynford and Jonathan Garfield established selling plans under Rule 10b5-1 which are designed to comply with selling limitations under Rule 144. The market may disfavor the adoption of Rule 10b5-1 trading plans by one or more of our officers or directors, perceiving that such a plan represents a decline in management’s confidence about our prospects or that the parameters for and trading under a Rule 10b5-1 sales plan could cause downward pressure on our stock price. In addition, as part of the terms of the Merger in May 2007, both Messrs. Lynford and Garfield have certain rights, subject to some conditions, to require us to file registration statements covering their shares or to include their shares in registration statements that we may file for ourselves or other stockholders. Selling of shares by employees, especially executives, could adversely affect the demand for our stock, could negatively impact the liquidity of our stock and could result in a decrease in the market price of our stock.
Our governing documents and Maryland law contain anti-takeover provisions that may discourage acquisition bids or merger proposals, which may adversely affect the market price of our common stock.
Reis’s articles of amendment and restatement and bylaws contain provisions designed to discourage attempts to acquire control of Reis by merger, tender offer, proxy contest, or removal of incumbent management without the approval of our Board. These provisions may make it more difficult or expensive for a third party to acquire control of Reis even if a change of control might be seen as beneficial by other Reis stockholders. This could discourage potential takeover attempts and could adversely affect the market price of Reis’s common stock. Reis’s governing documents:
provide for a classified board of directors, which could discourage potential acquisition proposals and could delay or prevent a change of control;
authorize the issuance of blank check stock that could be issued by Reis’s Board to thwart a takeover attempt;
contain advance notice requirements for nominations of candidates for election to our Board or for proposing matters that can be acted upon by stockholders at stockholder meetings.
In addition, under Maryland law, certain “business combinations” (including certain issuances of equity securities) between a Maryland corporation and any person who beneficially owns 10% or more of the voting power of the corporation’s shares or an affiliate thereof are prohibited for five years after the most recent date on which the interested stockholder becomes an interested stockholder, unless waived by the then existing board. Our Board may approve certain transactions or exempt certain interested stockholders at any time prior to a party becoming an interested stockholder. At December 31, 20132014 and through the date of this annual report on Form 10-K, the Board has not approved any exemptions from the Maryland statute.
Increases in interest rates could increase our interest expense.
In October 2012, Reis Services, as borrower, and the Company, as guarantor, entered into a loan and security agreement with Capital One, National Association, as lender, for a $10,000,000 revolving credit facility, which we refer to as the Revolver. The Revolver has a three year term expiring on October 16, 2015, and any borrowings bear interest at a rate of LIBOR + 2.00% per annum (for LIBOR loans) or the greater of 1.00% or the bank’s prime rate minus 0.50% per annum (for base rate loans) and is subject to an unused facility fee of 0.25% per annum.
As of December 31, 2013,2014, we had no debt outstanding; however, we may borrow amounts under the Revolver in the future. There have been instances in the past when we purchased interest rate caps on our outstanding debt to limit our exposure to significant interest rate increases. In deciding whether to purchase interest rate caps or other hedging instruments, we may weigh the value of protection against significant increases in interest rates against the cost of such instruments. The Company does not have any interest rate caps or other hedging instruments at December 31, 2013.2014. Therefore, if interest rates increase, our interest costs on any outstanding
borrowings would also increase, which may have a material adverse effect on our results of operations, financial condition and cash flows.
The Company may seek to extend, modify or replace the Revolver.
The Revolver is scheduled to expire on October 16, 2015. We may consider, based upon market conditions and business needs, refinancing or otherwise amending or replacing the Revolver with a new facility. There can be no assurance that we will be able to do so, or be able to do so on terms that are acceptable to us.
Our Revolver contains, and a modified or replacement facility will likely contain, covenants that restrict our operations, which may negatively affect our ability to operate our business and limit our ability to take advantage of potential business opportunities. Declines in our operational performance could cause financial covenants to be violated on our outstanding debt.
Provisions in the Revolver or a modified or replacement facility may impose restrictions on the Company’s ability to, among other things:
incur additional debt;
amend its organizational documents;
pay dividends and make distributions;
redeem or repurchase outstanding equity;
make certain investments or enter into transactions to acquire assets or businesses;
create certain liens;
enter into transactions with stockholders and affiliates;
undergo a change of control; and
make certain fundamental changes, including engaging in a merger or consolidation.
The Revolver also contains other customary covenants, including covenants which require the Company to meet specified financial ratios and financial tests. If the Company were not able to comply with these covenants in the future, the failure to do so may result in the declaration of an event of default. Furthermore, certain events, such as the voluntary or involuntary filing by Reis under any bankruptcy, insolvency or similar law (which is not stayed or dismissed within certain time periods), will cause an event of default. In addition, an event of default, if not cured or waived, may result in the acceleration of the maturity of indebtedness outstanding under the Revolver, which would require the Company to pay all amounts outstanding. If an event of default occurs, the Company may not
be able to cure it within any applicable cure period, if at all. If the maturity of this indebtedness is accelerated, Reis Services or Reis may not have the ability to borrow or obtain sufficient funds to replace the accelerated indebtedness on terms acceptable to us, or at all. Furthermore, the Revolver is secured by Reis Services’s assets and, therefore, these assets would not be available to secure additional credit.
The Company may decide to sell shares of stock which could be dilutive to existing shareholders of Reis stock.
In order to continue to grow revenue, management may need to increase its spending to hire additional employees to build databases and improve our website functionality, or may identify the need to invest in additional or new technology or pursue an acquisition of tangible or intangible assets or a business. We may need additional cash, beyond what is generated by the business or available under the Revolver, to be able to fund certain objectives, and may decide to raise capital by selling additional shares of common stock or issuing other forms of equity in Reis. If we issue equity or convertible debt securities, existing stockholders’ ownership may be diluted. In addition, the price for which our shares trade may be reduced.
Our ability to use our net tax operating loss carryforwards will be subject to limitation and the generation of taxable income in the future.
The Company has aggregatesignificant Federal, state and local net operating loss, or NOL, carryforwards aggregating approximately $66,006,000 at December 31, 2013.2014. The aggregate Federal NOLs were approximately $61,165,000 at December 31, 2014. These NOLs include NOLs generated subsequent to the Merger, losses from Privatethe Reis Services business prior to the Merger losses obtained from the Company’s 1998 merger with Value Property Trust (VLP) and the Company’s operating losses prior to the Merger. Approximately $25,158,000$20,317,000 of these Federal NOLs are subject to an annual limitation of $2,779,000 per year, whereas the remaining balance of approximately $40,848,000 is not subject to such a limitation. All of these losses may be utilized against consolidated Federal taxable income in the future. The actual ability to utilize the tax benefit of any existing NOLs will be dependent upon the Company’s ability to generate taxable income in the future, if at all. Under applicable tax regulations, these NOLs may not be usable inA March 2014 New York for stateState law and city purposesanticipated conforming changes to the New York City law in years that these2015 will limit the amount of existing NOLs arewhich could be used for Federal purposes. This lack of symmetry between taxing authorities regardingeach year in those jurisdictions; however, although the timing and usability of NOLs could result in paying taxes on incomelosses in New York State and New York City are limited, we expect to fully utilize all of our NOLs in 2014 and possibly 2015.the future.
Federal, state and local tax audits may result in the payment of additional taxes, penalties and interest.
Our tax returns are subject to audit by Federal, state and local tax authorities. Currently, Reis’s Federal tax returns are open (subject to audit) for 2010, 2011 and 2012.2013. The 2012 Federal tax return is currently under audit. Reis’s and a subsidiary’s New York State tax returns are under audit for the years 2004 to 2006 and are open, as a result of signed waiver, for the years 2007 to 2012.2013. Reis’s and a subsidiary’s New York City tax returns are also open for the years 2004 to 20122013 as well. The tax returns of another Reis subsidiary are open in Colorado for 20092010 to 2012.2013. All other tax years are closed. However, prior year tax returns giving rise to an NOL may be reviewable in connection with the audit of a later tax year when such loss is utilized. The ultimate resolution of the current audits and open tax years for New York State and New York City, as well as open tax years for Federal purposes, could result in the payment of additional tax, penalties and interest, which could negatively affect our profitability and cash flows.
Item 1B. Unresolved Staff Comments.
None.
As ofAt December 31, 2013,2014, the Company leasesleased approximately 38,000 square feet of space in New York, New York under two leases, both of which expire in September 2016 and approximately 10,000 square feet of space in White Plains, New York, under one lease, which expires in September 2019.
As disclosed in Note 10 to the Company’s consolidated financial statements, the Company is engaged in certain legal matters, and the disclosure set forth in Note 10 is incorporated herein by reference.
Item 4. Mine Safety Disclosures.
Not applicable.
PART II
Item 5. Market for Registrant’s Common Equity, Related Stockholder Matters and Issuer Purchases of Equity Securities.
Market Information
The Company’s common shares trade on the NASDAQ Global Market under the symbol “REIS.” As of December 31, 2013,2014, there were approximately 450237 holders of record of our common stock. This number does not reflect beneficial holdersSince certain of our common stock through accounts maintained at participants inshares are held by brokers and other institutions on behalf of shareholders, the Depository Trust Company.foregoing number is not representative of the number of beneficial owners.
The high and low sales prices per share for our common stock for each quarter in the years ended December 31, 20132014 and 20122013 are as follows:
| 2013 | 2012 | 2014 | 2013 | |||||||||||||||||||||||||||||
Quarter | High | Low | High | Low | High | Low | High | Low | ||||||||||||||||||||||||
First | $ | 16.49 | $ | 12.01 | $ | 12.49 | $ | 8.55 | $ | 19.80 | $ | 16.64 | $ | 16.49 | $ | 12.01 | ||||||||||||||||
Second | $ | 19.08 | $ | 14.43 | $ | 9.75 | $ | 7.74 | $ | 21.23 | $ | 16.36 | $ | 19.08 | $ | 14.43 | ||||||||||||||||
Third | $ | 18.93 | $ | 15.66 | $ | 11.94 | $ | 8.58 | $ | 23.95 | $ | 20.95 | $ | 18.93 | $ | 15.66 | ||||||||||||||||
Fourth | $ | 19.75 | $ | 15.95 | $ | 13.49 | $ | 10.08 | $ | 28.82 | $ | 21.37 | $ | 19.75 | $ | 15.95 | ||||||||||||||||
Common Stock Price Performance Graph
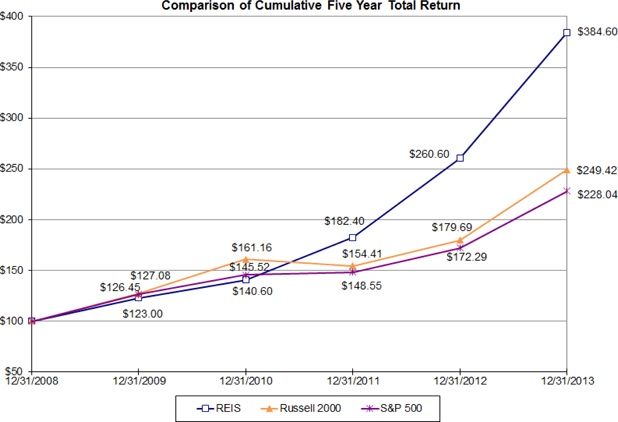
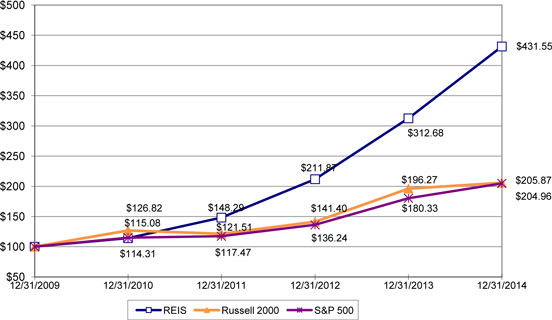
The following graph compares the cumulative total stockholder return on Reis’s common stock, which is represented below by “REIS,” for the period commencing December 31, 20082009 through December 31, 2013,2014, with the cumulative total return on the Russell 2000 Index, which we refer to as the Russell 2000, and the S&P 500 Index, which we refer to as the S&P 500, for the same period. Reis has chosen the Russell 2000 based on the market capitalization of the issuers contained in that index. Reis has not identified a peer group, due to the limited number of issuers in businesses similar to ours. Total return values were calculated based on cumulative total return assuming (1) the investment of $100 in the Russell 2000, the S&P 500 and Reis common stock on December 31, 2008,2009, and (2) reinvestment of dividends. The total return for Reis common stock from December 31, 20082009 to December 31, 20132014 was a gain of approximately 284.6%331.5% versus a gain of approximately 149.4%105.9% for the Russell 2000 and a gain of approximately 128.0%105.0% for the S&P 500.
Comparison of Cumulative Five Year Total Return
Dividends
The Company commenced a quarterly dividend program in the second quarter of 2014 when it declared and paid an initial quarterly cash dividend of $0.11 per common share in June 2014. In the third and fourth quarters of 2014, the Company declared and paid a quarterly cash dividend of $0.11 per common share in each of September 2014 and December 2014. Aggregate dividends paid by the Company during 2014 approximated $3,698,000. On February 2, 2015, the Company announced that it has increased the dividend payable on March 18, 2015 to $0.14 per common share. Although the Company anticipates paying a quarterly dividend hereafter, future dividends are subject to approval by the Board. The Company did not declare or distribute any dividends during the years ended December 31, 2013 orand 2012.
Reis does not currently pay a dividend. All decisions regarding the declaration and payment of dividends will be at the discretion of the Board and will be evaluated from time to time by the Board in light of the Company’s financial condition, earnings, cash flows, growth prospects, tax situation, restrictions under the Revolver, applicable law and other factors that the Board deems relevant.
Recent Sales of Unregistered Securities
The Company has not sold any unregistered securities within the past three years.
Issuer Purchases of Equity Securities
Between December 2008During the fourth quarter and August 2011, the Board authorized the repurchase of up to an aggregate amount of $5,000,000 of the Company’s common stock, of which approximately $551,000 remained available for repurchases as ofyear ended December 31, 2013. Although2014, the Company has remaining availability under a prior authorization, such authorization was at a time when the Company’s stock price and cash position was significantly different than where they were at December 31, 2013; and, therefore, management would probably seek a new authorizationdid not repurchase any shares of common stock.
Authorization from the Board if the Company were to considerwill be required for any stock repurchases in the future.
The stock repurchases are permitted from time to time in the open market or through privately negotiated transactions. Depending on market conditions, financial developments and other factors, additional amounts may be authorized by the Board whereby future purchases could be commenced or suspended at any time, or from time to time, without prior notice. The Company may make purchases pursuant to a trading plan under Securities Exchange Act Rule 10b5-1, permitting open market purchases of common stock during blackout periods consistent with the Company’s “Policies for Transactions in Reis Stock and Insider Trading and Tipping.” During the fourth quarter and year ended December 31, 2013, the Company did not repurchase any shares of common stock.
From the inception of the share repurchase programs in December 2008, the Company purchased an aggregate of 888,136 shares of common stock at an average price of $5.01 per share, for an aggregate of approximately $4,449,000. Cumulatively, the Company has repurchased approximately 8.1% of the common shares outstanding at the time of the Board’s initial authorization in December 2008.
Other Security Information
For additional information concerning the Company’s capitalization, see Note 8 to the Company’s consolidated financial statements.
Calculation of Aggregate Market Value of Non-Affiliate Shares
For purposes of calculating the aggregate market value of shares of common stock of the Company held by non-affiliates, as shown on the cover page of this annual report on Form 10-K, it has been assumed that all of the outstanding shares at June 30, 20132014 were held by non-affiliates except for shares held by directors and officers of the Company. However, this should not be deemed to constitute an admission that all of such directors and officers are, in fact, affiliates of the Company, or that there are not other persons who may be deemed to be affiliates of the Company. For further information concerning shareholdings of officers, directors and principal stockholders, see “Item 12. Security Ownership of Certain Beneficial Owners and Management and Related Stockholder Matters.”
Item 6. Selected Financial Data.
The following table presents selected financial data for the Company and should be read in conjunction with “Item 7. Management’s Discussion and Analysis of Financial Condition and Results of Operations,” and the consolidated financial statements included herein starting at page F-1. For the periods presented, this information conforms with the current financial statement presentation which segregates the assets and liabilities, as well as the operating results of the Company’s Residential Development Activities segment, and other related costs, as a discontinued operation.operations segment.
| (amounts in thousands, except per share data) | ||||||||||||||||||||
| For the Years Ended December 31, | ||||||||||||||||||||
Consolidated Statements of Operations: | 2013 | 2012 | 2011 | 2010 | 2009 | |||||||||||||||
Subscription revenue | $ | 34,721 | $ | 31,229 | $ | 27,180 | $ | 24,198 | $ | 23,892 | ||||||||||
Income from continuing operations (A) | $ | 17,933 | $ | 8,013 | $ | 4,861 | $ | 465 | $ | 1,028 | ||||||||||
Net income (loss) (A)(B)(C) | $ | 17,597 | $ | (4,284 | ) | $ | 1,886 | $ | 668 | $ | 1,004 | |||||||||
Per share amounts – basic: | ||||||||||||||||||||
Income from continuing operations | $ | 1.65 | $ | 0.75 | $ | 0.46 | $ | 0.04 | $ | 0.10 | ||||||||||
Net income (loss) | $ | 1.62 | $ | (0.40 | ) | $ | 0.18 | $ | 0.06 | $ | 0.09 | |||||||||
Per share amounts – diluted: | ||||||||||||||||||||
Income from continuing operations | $ | 1.57 | $ | 0.73 | $ | 0.45 | $ | 0.04 | $ | 0.09 | ||||||||||
Net income (loss) | $ | 1.54 | $ | (0.39 | ) | $ | 0.17 | $ | 0.06 | $ | 0.09 | |||||||||
Cash dividends per share | $ | — | $ | — | $ | — | $ | — | $ | — | ||||||||||
| December 31, | ||||||||||||||||||||
Consolidated Balance Sheets: | 2013 | 2012 | 2011 | 2010 | 2009 | |||||||||||||||
Cash (D) | $ | 10,560 | $ | 4,961 | $ | 22,153 | $ | 20,164 | $ | 22,735 | ||||||||||
Total assets | $ | 117,867 | $ | 98,034 | $ | 111,218 | $ | 106,688 | $ | 112,204 | ||||||||||
Total debt from continuing operations (E) | $ | — | $ | — | $ | 5,691 | $ | 11,250 | $ | 19,463 | ||||||||||
Deferred revenue | $ | 20,284 | $ | 18,230 | $ | 15,707 | $ | 15,446 | $ | 12,193 | ||||||||||
Total stockholders’ equity | $ | 92,871 | $ | 74,557 | $ | 77,510 | $ | 74,292 | $ | 73,321 | ||||||||||
| (amounts in thousands, except per share data) | ||||||||||||||||||||||||||||||||||||||||
| For the Years Ended December 31, | ||||||||||||||||||||||||||||||||||||||||
Consolidated Statements of Operations: | 2014 | 2013 | 2012 | 2011 | 2010 | |||||||||||||||||||||||||||||||||||
Subscription revenue | $ | 41,335 | $ | 34,721 | $ | 31,229 | $ | 27,180 | $ | 24,198 | ||||||||||||||||||||||||||||||
Income from continuing operations (A) | $ | 4,616 | $ | 17,933 | $ | 8,013 | $ | 4,861 | $ | 465 | ||||||||||||||||||||||||||||||
Net income (loss) (A)(B)(C) | $ | 4,047 | $ | 17,597 | $ | (4,284) | $ | 1,886 | $ | 668 | ||||||||||||||||||||||||||||||
Per share amounts – basic: | ||||||||||||||||||||||||||||||||||||||||
Income from continuing operations | $ | 0.42 | $ | 1.65 | $ | 0.75 | $ | 0.46 | $ | 0.04 | ||||||||||||||||||||||||||||||
Net income (loss) | $ | 0.37 | $ | 1.62 | $ | (0.40) | $ | 0.18 | $ | 0.06 | ||||||||||||||||||||||||||||||
Per share amounts – diluted: | ||||||||||||||||||||||||||||||||||||||||
Income from continuing operations | $ | 0.39 | $ | 1.57 | $ | 0.73 | $ | 0.45 | $ | 0.04 | ||||||||||||||||||||||||||||||
Net income (loss) | $ | 0.34 | $ | 1.54 | $ | (0.39) | $ | 0.17 | $ | 0.06 | ||||||||||||||||||||||||||||||
Cash dividends per share | $ | 0.33 | $ | — | $ | — | $ | — | $ | — | ||||||||||||||||||||||||||||||
| December 31, | ||||||||||||||||||||||||||||||||||||||||
Consolidated Balance Sheets: | 2014 | 2013 | 2012 | 2011 | 2010 | |||||||||||||||||||||||||||||||||||
Cash (D) | $ | 17,745 | $ | 10,560 | $ | 4,961 | $ | 22,153 | $ | 20,164 | ||||||||||||||||||||||||||||||
Total assets | $ | 123,888 | $ | 117,867 | $ | 98,034 | $ | 111,218 | $ | 106,688 | ||||||||||||||||||||||||||||||
Total debt from continuing operations (E) | $ | — | $ | — | $ | — | $ | 5,691 | $ | 11,250 | ||||||||||||||||||||||||||||||
Deferred revenue | $ | 22,885 | $ | 20,284 | $ | 18,230 | $ | 15,707 | $ | 15,446 | ||||||||||||||||||||||||||||||
Total stockholders’ equity | $ | 96,113 | $ | 92,871 | $ | 74,557 | $ | 77,510 | $ | 74,292 | ||||||||||||||||||||||||||||||
| December 31, | December 31, | |||||||||||||||||||||||||||||||||||||||
Consolidated Statements of Cash Flows: | 2013 | 2012 | 2011 | 2010 | 2009 | 2014 | 2013 | 2012 | 2011 | 2010 | ||||||||||||||||||||||||||||||
Net cash provided by (used in): | ||||||||||||||||||||||||||||||||||||||||
Operating activities (D) | $ | 11,442 | $ | (6,555 | ) | $ | 11,961 | $ | 9,665 | $ | 11,638 | $ | 14,789 | $ | 11,442 | $ | (6,555) | $ | 11,961 | $ | 9,665 | |||||||||||||||||||
Investing activities | $ | (4,499 | ) | $ | (4,037 | ) | $ | (3,623 | ) | $ | (2,647 | ) | $ | (1,438 | ) | $ | (4,203) | $ | (4,499) | $ | (4,037) | $ | (3,623) | $ | (2,647) | |||||||||||||||
Financing activities | $ | (1,344 | ) | $ | (6,600 | ) | $ | (6,349 | ) | $ | (9,589 | ) | $ | (11,617 | ) | $ | (3,401) | $ | (1,344) | $ | (6,600) | $ | (6,349) | $ | (9,589) | |||||||||||||||
| ||||||||||||||||||||||||||||||||||||||||
| (A) | The 2013, 2012 and 2011 amounts reflect a net tax benefit of $13,670, $5,427 and $4,075, respectively, in both income from continuing operations and net income (loss), primarily from the reversal of valuation allowances recorded against certain of the Company’s net operating loss carryforwards. |
| (B) | The 2012 net (loss) and related per share amounts reflect a net litigation charge of $11,547, which was recorded in income (loss) from discontinued operations in 2012. See “Item 3. Legal |
| (C) | The 2011 net income and related per share amounts reflect a net litigation charge of $4,460, which was recorded in income (loss) from discontinued operations at December 31, 2011. See “Item 3. Legal Proceedings.” |
| (D) | The Company’s cash balance at December 31, 2012 and cash |
| (E) | Reductions in total debt from continuing operations reflects repayments made in each period. |
Item 7. Management’s Discussion and Analysis of Financial Condition and Results of Operations.Operations.
The following discussion should be read in conjunction with the consolidated financial statements and notes thereto appearing elsewhere in this annual report on Form 10-K.
Management Summary
The Company’s 2014 financial performance reflects management’s long-standing commitment to innovation and providing commercial real estate investors with industry leading market information and analytical tools. The continuing adoption of our products, both by new customers and within our existing customer base, is reflected in the 19.0% annual revenue growth rate recorded from 2013 to 2014. EBITDA of the Reis Services business grew 17.8% over that same period, resulting in an EBITDA margin for the Reis Services business of 40.8%. Defined terms and reconciliations to the most comparable GAAP financial measures in this Management Summary are presented elsewhere in this Item 7.
Our cash balance has grown by $7.2 million in 2014. This growth occurred while we invested approximately $3.8 million in our website and databases, and commenced a dividend program that returned approximately $3.7 million to shareholders in the last three quarters of the year. We expect to continue to generate significant cash in 2015. We will continue to prioritize growth through the introduction of new geographic markets and property types. On February 1, 2015, we launched coverage of 53 seniors housing markets, bringing our total coverage of this sector to 110 metropolitan areas. In May 2015, we will publish market reports and comparable property data on 100 student housing markets, Reis’s eighth property type. Development work is underway to launch two new property types in 2016: medical office buildings and affordable housing. We have demonstrated that we can invest prudently, grow revenues, EBITDA and our cash balance, while simultaneously rewarding our shareholders. On February 2, 2015 we announced an increase to our quarterly dividend from $0.11 per share to $0.14 per share.
Based upon several factors, including historical and anticipated report consumption, our account managers determine whether Reis and a subscriber are best served by an annual or multi-year commitment. Over the past three years, in order to increase the predictability of fees from our subscribers and Reis’s own revenue and cash flow, we have made a concerted effort to encourage multi-year contracts when appropriate, with terms of two or three years, and in some cases, four years. The average life of multi-year contracts signed in each of the last three years is approximately 2.2 years. There are significant benefits to adopting and expanding our program, on a selective basis, of lengthening the duration of client contracts, including locking in recurring revenue for longer periods, thereby increasing the predictability of our renewal rates and future revenues. From an operational perspective, multi-year contracts free up account management resources to focus on subscribers requiring a higher level of attention and upselling opportunities across our account base. Finally, multi-year deals also insulate us from competitive pressures and increase the likeliness that Reis data and analytics will become embedded in the work flow of our clients.
In accordance with GAAP, our revenue recognition policy is to record revenue ratably over the life of a subscriber contract. Therefore any increases in the price of the subscription after the first year of a multi-year contract are considered in the total amount being straight-lined over the contract term. If pricing steps are built in on and after the first anniversary of a multi-year contract, there will be increasing cash flow from the contract, but no growth in revenue during the subsequent years under that contract. At December 31, 2014, there are approximately 240 institutions signed to multi-year contracts, including many of our largest subscribers. The reported levels of deferred revenue and Aggregate Revenue Under Contract of $22,885,000 and $45,402,000, respectively, suggest strong financial performance during 2015. However, the effect of having such a significant segment of our subscriber base under multi-year agreements will result in annual revenue growth in 2015 that is more in line with the reported annual growth rates we generally experienced from 2010 through 2013. Moreover, the anticipated renewal of multi-year contracts signed in 2013 and 2014 is expected to result in incremental growth in the latter part of 2015 and in 2016.
Operationally, we will continue to invest in technology and build databases. Our employee headcount in the sales and operational groups will increase in 2015 and we will accelerate our marketing initiatives that were set in place in the latter part of 2014. These are sound investments that will further differentiate Reis in the world of U.S. commercial real estate market information providers. These continuing investments may cause temporary declines in our EBITDA margins in 2015, but we believe that any declines will be short term as we expect that these investments will result in additional revenue opportunities for Reis.
Please read the remainder of this Item 7 for additional detail about our critical business metrics, reconciliations of income from continuing operations to EBITDA and Adjusted EBITDA and reconciliations of deferred revenue to Aggregate Revenue Under Contract, results of operations, our liquidity and capital resources, changes in cash flows and selected significant accounting policies.
Critical Business Metrics of the Reis Services BusinessSegment
Management considers certain metrics in evaluating the performance of the Reis Services business.segment. These metrics are revenue, revenue growth, EBITDA (which is earnings (defined as income (loss) from continuing operations) before interest, taxes, depreciation and amortization), EBITDA growth, EBITDA margin, Adjusted EBITDA (which is earnings before interest, taxes, depreciation, amortization and stock based compensation) and Adjusted EBITDA margin. Other important metrics that management considers include the cash flow generation of the Reis Services business as well as the visibility into future performance as supported by our deferred revenue and other related metrics discussed in this Item 7.
Following is a presentation of revenue, EBITDA and EBITDA margin for the Reis Services businesssegment and revenue, EBITDA, Adjusted EBITDA and the related margins on a consolidated basis (excluding discontinued operations) (see below for a reconciliation of income from continuing operations to EBITDA and Adjusted EBITDA for both the Reis Services segment and on a consolidated basis for each of the periods presented here).
| (amounts in thousands, excluding percentages) | For the Three Months Ended | (amounts in thousands, excluding percentages) | ||||||||||||||||||||||||||||||
| December 31, | Percentage | For the Three Months Ended | ||||||||||||||||||||||||||||||
| 2013 | 2012 | Increase | Increase | December 31, | Percentage | |||||||||||||||||||||||||||
| 2014 | 2013 | Increase | Increase | |||||||||||||||||||||||||||||
Reis Services segment: | ||||||||||||||||||||||||||||||||
Revenue | $ | 9,209 | $ | 8,581 | $ | 628 | 7.3 | % | $ | 10,726 | $ | 9,209 | $ | 1,517 | 16.5% | |||||||||||||||||
EBITDA | $ | 3,788 | $ | 3,543 | $ | 245 | 6.9 | % | $ | 4,410 | $ | 3,788 | $ | 622 | 16.4% | |||||||||||||||||
EBITDA margin | 41.1 | % | 41.3 | % | 41.1% | 41.1% | ||||||||||||||||||||||||||
| For the Three Months Ended | ||||||||||||||||||||||||||||||||
| December 31, 2013 | September 30, 2013 | Increase | Percentage Increase | |||||||||||||||||||||||||||||
Consolidated, excluding discontinued operations: | ||||||||||||||||||||||||||||||||
Revenue | $ | 9,209 | $ | 8,780 | $ | 429 | 4.9 | % | $ | 10,726 | $ | 9,209 | $ | 1,517 | 16.5% | |||||||||||||||||
EBITDA | $ | 3,788 | $ | 3,679 | $ | 109 | 3.0 | % | $ | 3,631 | $ | 2,832 | $ | 799 | 28.2% | |||||||||||||||||
EBITDA margin | 41.1 | % | 41.9 | % | 33.9% | 30.8% | ||||||||||||||||||||||||||
Adjusted EBITDA | $ | 3,889 | $ | 3,211 | $ | 678 | 21.1% | |||||||||||||||||||||||||
Adjusted EBITDA margin | 36.3% | 34.9% | ||||||||||||||||||||||||||||||
| For the Years Ended | For the Three Months Ended | |||||||||||||||||||||||||||||||
| December 31, | Percentage | December 31, 2014 | September 30, 2014 | Increase | Percentage Increase | |||||||||||||||||||||||||||
| 2013 | 2012 | Increase | Increase | |||||||||||||||||||||||||||||
Reis Services segment: | ||||||||||||||||||||||||||||||||
Revenue | $ | 34,721 | $ | 31,229 | $ | 3,492 | 11.2 | % | $ | 10,726 | $ | 10,469 | $ | 257 | 2.5% | |||||||||||||||||
EBITDA | $ | 14,307 | $ | 12,762 | $ | 1,545 | 12.1 | % | $ | 4,410 | $ | 4,285 | $ | 125 | 2.9% | |||||||||||||||||
EBITDA margin | 41.2 | % | 40.9 | % | 41.1% | 40.9% | ||||||||||||||||||||||||||
Consolidated, excluding discontinued operations: | ||||||||||||||||||||||||||||||||
Revenue | $ | 10,726 | $ | 10,469 | $ | 257 | 2.5% | |||||||||||||||||||||||||
EBITDA | $ | 3,631 | $ | 3,236 | $ | 395 | 12.2% | |||||||||||||||||||||||||
EBITDA margin | 33.9% | 30.9% | ||||||||||||||||||||||||||||||
Adjusted EBITDA | $ | 3,889 | $ | 3,673 | $ | 216 | 5.9% | |||||||||||||||||||||||||
Adjusted EBITDA margin | 36.3% | 35.1% | ||||||||||||||||||||||||||||||
| For the Years Ended | Increase | Percentage Increase | For the Years Ended | |||||||||||||||||||||||||||||
| December 31, | December 31, | Percentage | ||||||||||||||||||||||||||||||
| 2012 | 2011 | 2014 | 2013 | Increase | Increase | |||||||||||||||||||||||||||
Reis Services segment: | ||||||||||||||||||||||||||||||||
Revenue | $ | 31,229 | $ | 27,180 | $ | 4,049 | 14.9 | % | $ | 41,335 | $ | 34,721 | $ | 6,614 | 19.0% | |||||||||||||||||
EBITDA | $ | 12,762 | $ | 10,837 | $ | 1,925 | 17.8 | % | $ | 16,852 | $ | 14,307 | $ | 2,545 | 17.8% | |||||||||||||||||
EBITDA margin | 40.9 | % | 39.9 | % | 40.8% | 41.2% | ||||||||||||||||||||||||||
Consolidated, excluding discontinued operations: | ||||||||||||||||||||||||||||||||
Revenue | $ | 41,335 | $ | 34,721 | $ | 6,614 | 19.0% | |||||||||||||||||||||||||
EBITDA | $ | 12,760 | $ | 9,396 | $ | 3,364 | 35.8% | |||||||||||||||||||||||||
EBITDA margin | 30.9% | 27.1% | ||||||||||||||||||||||||||||||
Adjusted EBITDA | $ | 14,325 | $ | 11,337 | $ | 2,988 | 26.4% | |||||||||||||||||||||||||
Adjusted EBITDA margin | 34.7% | 32.7% | ||||||||||||||||||||||||||||||
Reis Services segment: Revenue EBITDA EBITDA margin Consolidated, excluding discontinued operations: Revenue EBITDA EBITDA margin Adjusted EBITDA Adjusted EBITDA margin(amounts in thousands, excluding percentages) For the Years Ended December 31, Percentage 2013 2012 Increase Increase $ 34,721 $ 31,229 $ 3,492 11.2% $ 14,307 $ 12,762 $ 1,545 12.1% 41.2% 40.9% $ 34,721 $ 31,229 $ 3,492 11.2% $ 9,396 $ 7,673 $ 1,723 22.5% 27.1% 24.6% $ 11,337 $ 9,968 $ 1,369 13.7% 32.7% 31.9%
2014 Revenue Performance
All of the Company’s revenue is generated by the Reis Services’s segment. Reis Services’s revenue increased by approximately $628,000,$1,517,000, or 7.3%16.5%, from the fourth quarter of 20122013 to the fourth quarter of 20132014 and $3,492,000,$6,614,000, or 11.2%19.0%, for the year ended December 31, 20132014 over the comparable 20122013 annual period. The revenue increase over the corresponding prior quarterly period is the 1519th consecutive quarterly increase in revenue over the prior year’s quarter. In addition, revenue increased by approximately $429,000,$257,000, or 4.9%2.5%, from the third quarter of 20132014 to the fourth quarter of 2013.2014. In general, these revenue increases in 2014 reflect: (1) additional newReis SE business; (2) revenue growth fromReisReports Mobiuss; and (3) revenue growth fromMobiussReisReports in the 2013 periods. .
The Company’s revenue growth reflects not just a single strong revenue quarter, but also the momentum created by sustained contract growth during 20122013 and throughout 2013. In2014. The Company continues to post record bookings performance with respect to the dollar value of contracts. Fiscal 2013, the Company had its best booking year and the fourth quarter was the best booking quarter in Reis’s history. The Company’s overall renewal rate remained at 91% for the trailing twelve
months ended December 31, 2013 and 2012 (for institutional subscribers, the renewal rates were 93% both at December 31, 2013 and 2012, respectively). TotalReis SE subscribers increased to 994 at December 31, 2013 from 844 subscribers at December 31, 2012.
As we disclosed in prior filings including the Company’s 2012 Annual Report filed on Form 10-K and its quarterly reports filed during 2013, revenue in the fourth quarter and annual 2012 periods included incremental revenue from one specific custom project of $427,000 and $569,000, respectively. Excluding this custom project from our 2012 reported revenue would result, on a pro forma basis, in revenue growth of 12.9% inas well as the fourth quarter of 2013, over 2012represented unprecedented contract signings, surpassed again by 2014’s annual and 13.2% forfourth quarter results. The Company was able to achieve the 2013 annual periodrevenue growth rates reported above while its renewal rates have been modestly trending lower over the 2012 annual period (in contrast with our reported growth rates of 7.3% and 11.2%, respectively). Pro forma revenue growth was 16.8% in the fourth quarter of 2012 over 2011 and 12.8% for the 2012 annual period over the 2011 annual period (in contrast with our reported amounts of growth of 23.0% and 14.9%, respectively).
Reis Services’s revenue increased by approximately $1,602,000, or 23.0%, from the fourth quarter of 2011 to the fourth quarter of 2012 and $4,049,000, or 14.9%, for the year ended December 31, 2012 over the comparable 2011 annual period. These revenue increases reflect: (1) incremental new business in 2012 which is demonstrated in the growth ofReis SE subscribers from 726 at December 31, 2011 to 844 subscribers at December 31, 2012; (2) revenue growth from our data redistribution initiatives; (3) revenue growth fromReisReports; (4) custom project revenue in 2012 in excess of 2011 amounts; and (5) the cumulative impact of the increased volume of contract signings in 2011 and throughout 2012.past few quarters. The Company’s overall renewal raterates were 87% and 91% for the trailing twelve months ended December 31, 2012 was 91%, as compared to 93% for the corresponding period in 20112014 and 2013, respectively (for institutional subscribers, the renewal rates were 89% and 93% and 95% atfor the trailing twelve months ended December 31, 20122014 and 2011,2013, respectively). The decline in the renewal rates reflects the Company’s decision to be more aggressive on renewal pricing, particularly in instances where customer usage levels are significantly greater than what was initially estimated as annual usage for that customer. The Company believes that aligning client report consumption with appropriate annual fees, while remaining respectful of subscriber need for Reis information, is more important in the long-term, than a modest decline in the current renewal rate. Also, based upon past experience, management believes that many non-renewing customers ultimately renew with Reis as their information and analytic needs may not be fully addressed by competitive offerings.
Reis’s revenue model is based primarily on annual subscriptions that are paid in accordance with contractual billing terms. Reis recognizes revenue from its contracts on a ratable basis; for example, one-twelfth of the value of a one-year contract is recognized monthly. Therefore, increases in the dollar value of new contracts are spread evenly over the life of a contract, thereby moderating an immediate impact on revenue. Historically, the largest percentage of our contracts are executed in the fourth quarter of each year.year and 2014 was not an exception to that trend.
2013 Revenue Performance
Reis Services’s revenue increased by approximately $3,492,000 or 11.2% for the year ended December 31, 2013 over the comparable 2012 annual period. In general, these revenue increases reflected: (1) additional newReis SEbusiness; (2) revenue growth fromReis Reports; and (3) revenue fromMobiuss in the 2013 period. The Company’s overall renewal rate was 91% for the trailing twelve months ended December 31, 2013 and 2012 (for institutional subscribers, the renewal rate was 93% for the years ended December 31, 2013 and 2012).
As we disclosed in prior filings including the Company’s 2013 Annual Report filed on Form 10-K and its quarterly reports filed during 2013, revenue for the 2012 annual period included incremental revenue from one specific custom project of $569,000. Excluding this custom project from our 2012 reported revenue would have resulted, on a pro forma basis, in revenue growth of 13.2% for the 2013 annual period over the 2012 annual period (in contrast with our reported growth rate of 11.2%).
Deferred Revenue and Aggregate Revenue Under Contract
Two additional metrics management utilizes are deferred revenue and Aggregate Revenue Under Contract. Analyzing these amounts can provide additional insight into Reis Services’s future financial performance. Deferred revenue, which is a GAAP basis accounting concept and is reported by the Company on the consolidated balance sheet, represents revenue from annual or longer term contracts for which we have billed and/or received payments from our subscribers related to services we will be providing over the remaining contract period. It does not include future revenue under non-cancellable contracts for which we do not yet have the contractual right to bill; this aggregate number we refer to as Aggregate Revenue Under Contract. Deferred revenue will be recognized as revenue ratably over the remaining life of a contract. The following table reconciles deferred revenue to Aggregate Revenue Under Contract at December 31, 20132014 and 2012,2013, respectively.
| December 31, | December 31, | |||||||||||||||
| 2013 | 2012 | 2014 | 2013 | |||||||||||||
Deferred revenue (GAAP basis) | $ | 20,284,000 | $ | 18,230,000 | $ | 22,885,000 | $ | 20,284,000 | ||||||||
Amounts under non-cancellable contracts for which the Company does not yet have the contractual right to bill at the period end (A) | 20,046,000 | 18,179,000 | 22,517,000 | 20,046,000 | ||||||||||||
|
|
|
| |||||||||||||
Aggregate Revenue Under Contract | $ | 40,330,000 | $ | 36,409,000 | $ | 45,402,000 | $ | 40,330,000 | ||||||||
|
|
|
| |||||||||||||
| ||||||||||||||||
| (A) | Amounts are billable subsequent to December 31 of each year and represent (i) non-cancellable contracts for subscribers with multi-year subscriptions where the future years are not yet billable, or (ii) subscribers with non-cancellable annual subscriptions with interim billing terms. |
Included in Aggregate Revenue Under Contract at December 31, 20132014 was approximately $27,338,000$30,516,000 related to amounts under contract for the forward twelve month period through December 31, 2014.2015. The remainder reflects amounts under contract beyond December 31, 2014.2015. The forward twelve month Aggregate Revenue Under Contract amount is approximately 79%74% of revenue on a trailing twelve month basis at December 31, 2013.2014. For comparison purposes, at December 31, 20122013 and 2011,2012, the forward twelve month Aggregate Revenue Under Contract was $23,947,000$27,338,000 and $20,064,000,$23,947,000, respectively, and as a percentage of that year’s revenue was approximately 77%79% and 74%77%, respectively.
Both deferred revenue and Aggregate Revenue Under Contract are influenced by: (1) the timing and dollar value of contracts signed and billed; (2) the quantity and timing of contracts that are multi-year; and (3) the impact of recording revenue ratably over the life of a multi-year contract, which moderates the effect of price increases after the first year. Coupled withThe then record new business and contract signings in 2013, exceeded by the Company continued to signhistoric level of new business contracted in 2014 and the increased number of multi-year contracts.
2014 Reis Services EBITDA Performance
Reis Services’s EBITDA for the three months ended December 31, 20132014 was $3,788,000,$4,410,000, an increase of $245,000,$622,000, or 6.9%16.4%, over the fourth quarter 2012 amount2013 amount. The Reis Services EBITDA increase over the corresponding prior quarterly period is the 17th consecutive quarterly increase in Reis Services EBITDA over the prior year’s quarter. For the year ended December 31, 2014, Reis Services EBITDA was $16,852,000, an increase of $2,545,000, or 17.8%, over the comparable 2013 period. On a consecutive quarter basis, Reis Services EBITDA increased $125,000, or 2.9%, from the third quarter of 2014 to the fourth quarter of 2014. These increases were primarily derived from the increases in revenue, as described above. Operating expenses also continued to grow, the net effect of which resulted in the Reis Services EBITDA margins of 41.1% and 40.8% for the three months and year ended December 31, 2014, respectively, consistent with the reported Reis Services EBITDA margins of 41.1% and 41.2% in the 2013 comparable periods.
Investment in our business remains a priority. This includes the development of new products and functionality, introducing new, or expanding existing databases, adding resources to grow our customer base and generate more revenue. Separately, as Reis’s business continues to grow, we are devoting additional resources to expand our sales pipeline through marketing efforts and sales force expansion. The expectation for spending in 2015 may result in margins for future quarters being at or below the approximate 41% Reis Services EBITDA margin we reported for the year ended December 31, 2014.
2013 Reis Services EBITDA Performance
Reis Services’s EBITDA increased $1,545,000, or 12.1%, in the year ended December 31, 2013 over the comparable 2012 annual period. On a consecutive quarter basis, EBITDA increased $109,000, or 3.0%, from the third quarter of 2013 to the fourth quarter of 2013. These increases wereThis increase was primarily derived from the corresponding increasesincrease in 2013 revenue, as described above. Operating expenses also continued to grow, but at a slower pace than revenue growth, the net effect of which resulted in the Reis Services EBITDA margins of 41.1%being maintained at 41.2% and 41.2%40.9% for
the three months and yearyears ended December 31, 2013 consistent with the 41.3% and 40.9% reported amounts in the 2012, comparable periods.
EBITDA for the three months ended December 31, 2012 was $3,543,000, an increase of $795,000, or 28.9%, over the fourth quarter 2011 amount and increased $1,925,000, or 17.8%, in the year ended December 31, 2012 over the comparable 2011 annual period.respectively. Reis Services EBITDA in the fourth quarter and annual 2012 periodsperiod was similarly impacted from the aforementioned incremental custom work. Excluding only that incremental custom revenue from our reported 2012 Reis Services EBITDA would result, on a pro forma basis, in Reis Services EBITDA growth of 21.6% in the fourth quarter of 2013 over 2012 and 17.3% for the 2013 annual period over the 2012 annual period (in contrast with our reported growth ratesrate of 6.9% and 12.1%, respectively)). The pro forma EBITDA growth was 13.4% in the fourth quarter of 2012 over 2011 and 12.5% for the 2012 annual period over the 2011 annual period (in contrast with our reported amounts of growth of 28.9% and 17.8%, respectively).
Reinvestment in our business remains a priority, including developing new products and functionality, expanding our databases or adding resources to grow our customer base. Accordingly, we continue to hire in many departments, including in sales (both new business and account management) as well as in operations, including our data collection departments. With a growing head count, the Company leased additional space in the third quarter of 2013. The impact of this additional expense began in the fourth quarter of 2013. Separately, as Reis’s business continues to grow, we expect to devote additional resources to expand our sales pipeline through marketing efforts and sales force expansion. This additional spending may reduce our margins in 2014 below the 41.2% Reis Services EBITDA margin we reported for the 2013 annual period.
Reconciliations of Income from Continuing Operations to EBITDA and Adjusted EBITDA
We define EBITDA isas earnings (defined as income(income (loss) from continuing operations) before interest, taxes, depreciation and amortization. We define Adjusted EBITDA isas earnings before interest, taxes, depreciation, amortization and stock based compensation. Although EBITDA and Adjusted EBITDA are not measures of performance calculated in accordance with GAAP, senior management uses EBITDA and Adjusted EBITDA to measure operational and management performance. Management believes that EBITDA and Adjusted EBITDA are appropriate metrics that may be used by investors as supplemental financial measures to be considered in addition to the reported GAAP basis financial information towhich may assist investors in evaluating and understanding: (1) the performance of the Reis Services segment, the primary business of the Company and (2) the Company’s continuing consolidated results, from year to year or period to period, as applicable. Further, these measures provide the reader with the ability to understand our operational performance while isolating non-cash charges, such as depreciation and amortization expenses, as well as other non-operating items, such as interest income, interest expense and income taxes and, in the case of Adjusted EBITDA, isolates non-cash charges for stock based compensation. Management also believes that disclosing EBITDA and Adjusted EBITDA will provide better comparability to other companies in the information services sector. However, because EBITDA and Adjusted EBITDA are not calculated in accordance with GAAP, they may not necessarily be comparable to similarly titled measures employed by other companies. EBITDA and Adjusted EBITDA are presented both for the Reis Services businesssegment and on a consolidated basis. We believe that these metrics, for Reis Services, provide the reader with valuable information for evaluating the financial performance of the core Reis Services business, excluding public company costs, and to makefor making assessments about the intrinsic value of that stand-alone business to a potential acquirer. Management primarily monitors and measures its performance, and is compensated, based on the results of the Reis Services business.segment. EBITDA and Adjusted EBITDA, on a consolidated basis, allow the reader to make assessments about the current trading value of the Company’s common stock, including expenses related to operating as a public company. However, investors should not consider these measures in isolation or as substitutes for net income (loss), income from continuing operations, operating income, or any other measure for determining operating performance that is calculated in accordance with GAAP. In addition, because EBITDA and Adjusted EBITDA are not calculated in accordance with GAAP, they may not necessarily be comparable to similarly titled measures employed by other companies. Reconciliations of EBITDA and Adjusted EBITDA to the most comparable GAAP financial measure, income from continuing operations, follow for each identified period on a segment basis (including the Reis Services segment), as well as on a consolidated basis:
Reconciliation of Income from Continuing Operations to EBITDA and Adjusted EBITDA for the Three Months Ended December 31, 2013 Income from continuing operations Income tax (benefit) Income (loss) before income taxes and discontinued operations Add back: Depreciation and amortization expense Interest expense (income), net EBITDA Add back: Stock based compensation expense, net Adjusted EBITDA Adjusted EBITDA margin – Reis Services and consolidated (B) Reconciliation of Income from Continuing Operations to EBITDA and Adjusted EBITDA for the Year Ended December 31, 2013 Income from continuing operations Income tax (benefit) Income (loss) before income taxes and discontinued operations Add back: Depreciation and amortization expense Interest expense (income), net EBITDA Add back: Stock based compensation expense, net Adjusted EBITDA Adjusted EBITDA margin – Reis Services and consolidated (B) Reconciliation of Income from Continuing Operations to EBITDA and Adjusted EBITDA for the Three Months Ended December 31, 2012 Income from continuing operations Income tax (benefit) Income (loss) before income taxes and discontinued operations Add back: Depreciation and amortization expense Interest expense (income), net EBITDA Add back: Stock based compensation expense, net Adjusted EBITDA Adjusted EBITDA margin – Reis Services and consolidated (B) See footnotes on next page.(amounts in thousands) By Segment Consolidated Reis Services Other (A) $ 16,304 (14,751 ) $ 2,511 $ (958 ) 1,553 1,251 2 1,253 26 — 26 3,788 (956 ) 2,832 — 379 379 $ 3,788 $ (577 ) $ 3,211 41.1 % 34.9 % By Segment Consolidated Reis Services Other (A) $ 17,933 (13,670 ) $ 9,183 $ (4,920 ) 4,263 5,021 9 5,030 103 — 103 14,307 (4,911 ) 9,396 — 1,941 1,941 $ 14,307 $ (2,970 ) $ 11,337 41.2 % 32.7 % By Segment Consolidated Reis Services Other (A) $ 6,519 (5,427 ) $ 2,337 $ (1,245 ) 1,092 1,182 2 1,184 24 — 24 3,543 (1,243 ) 2,300 — 505 505 $ 3,543 $ (738 ) $ 2,805 41.3 % 32.7 %
(amounts in thousands) Reconciliation of Income from Continuing Operations to EBITDA and Adjusted EBITDA for the Year Ended December 31, 2012 By Segment Income from continuing operations Income tax (benefit) Income (loss) before income taxes and discontinued operations Add back: Depreciation and amortization expense Interest expense (income), net EBITDA Add back: Stock based compensation expense, net Adjusted EBITDA Adjusted EBITDA margin – Reis Services and consolidated (B) Reconciliation of Income from Continuing Operations to EBITDA and Adjusted EBITDA for the Year Ended December 31, 2011 Income from continuing operations Income tax (benefit) Income (loss) before income taxes and discontinued operations Add back: Depreciation and amortization expense Interest expense (income), net EBITDA Add back: Stock based compensation expense, net Adjusted EBITDA Adjusted EBITDA margin – Reis Services and consolidated (B) Reconciliation of Income from Continuing Operations to EBITDA and Adjusted EBITDA for the Three Months Ended September 30, 2013 Income from continuing operations Income tax expense Income (loss) before income taxes and discontinued operations Add back: Depreciation and amortization expense Interest expense (income), net EBITDA Add back: Stock based compensation expense, net Adjusted EBITDA Adjusted EBITDA margin – Reis Services and consolidated (B) Reis Services Other (A) Consolidated $ 8,013 (5,427 ) $ 7,683 $ (5,097 ) 2,586 4,974 9 4,983 105 (1 ) 104 12,762 (5,089 ) 7,673 — 2,295 2,295 $ 12,762 $ (2,794 ) $ 9,968 40.9 % 31.9 % By Segment Consolidated Reis Services Other (A) $ 4,861 (4,075 ) $ 5,500 $ (4,714 ) 786 5,135 4 5,139 202 (5 ) 197 10,837 (4,715 ) 6,122 — 2,204 2,204 $ 10,837 $ (2,511 ) $ 8,326 39.9 % 30.6 % By Segment Reis Services Other (A) Consolidated $ 705 469 $ 2,381 $ (1,207 ) 1,174 1,273 2 1,275 25 — 25 3,679 (1,205 ) 2,474 — 329 329 $ 3,679 $ (876 ) $ 2,803 41.9 % 31.9 %
| (amounts in thousands) | ||||||||||||
Reconciliation of Income from Continuing Operations to EBITDA and Adjusted EBITDA for the Three Months Ended December 31, 2014 | By Segment | |||||||||||
| Reis Services | Other (A) | Consolidated | ||||||||||
Income from continuing operations | $ | 1,524 | ||||||||||
Income tax expense | 768 | |||||||||||
|
| |||||||||||
Income (loss) before income taxes and discontinued operations | $ | 3,073 | $ | (781) | 2,292 | |||||||
Add back: | ||||||||||||
Depreciation and amortization expense | 1,315 | 2 | 1,317 | |||||||||
Interest expense (income), net | 22 | — | 22 | |||||||||
|
|
|
|
|
| |||||||
EBITDA | 4,410 | (779) | 3,631 | |||||||||
Add back: | ||||||||||||
Stock based compensation expense, net | — | 258 | 258 | |||||||||
|
|
|
|
|
| |||||||
Adjusted EBITDA | $ | 4,410 | $ | (521) | $ | 3,889 | ||||||
|
|
|
|
|
| |||||||
Adjusted EBITDA margin – Reis Services and consolidated (B) | 41.1% | 36.3% | ||||||||||
|
|
|
| |||||||||
Reconciliation of Income from Continuing Operations to EBITDA and Adjusted EBITDA for the Year Ended December 31, 2014 | By Segment | |||||||||||
| Reis Services | Other (A) | Consolidated | ||||||||||
Income from continuing operations | $ | 4,616 | ||||||||||
Income tax expense | 2,842 | |||||||||||
|
| |||||||||||
Income (loss) before income taxes and discontinued operations | $ | 11,559 | $ | (4,101) | 7,458 | |||||||
Add back: | ||||||||||||
Depreciation and amortization expense | 5,202 | 9 | 5,211 | |||||||||
Interest expense (income), net | 91 | — | 91 | |||||||||
|
|
|
|
|
| |||||||
EBITDA | 16,852 | (4,092) | 12,760 | |||||||||
Add back: | ||||||||||||
Stock based compensation expense, net | — | 1,565 | 1,565 | |||||||||
|
|
|
|
|
| |||||||
Adjusted EBITDA | $ | 16,852 | $ | (2,527) | $ | 14,325 | ||||||
|
|
|
|
|
| |||||||
Adjusted EBITDA margin – Reis Services and consolidated (B) | 40.8% | 34.7% | ||||||||||
|
|
|
| |||||||||
| ||||||||||||
See footnotes on next page. | ||||||||||||
Reconciliation of Income from Continuing Operations to EBITDA and Adjusted EBITDA for the Three Months Ended December 31, 2013 Income from continuing operations Income tax (benefit) Income (loss) before income taxes and discontinued operations Add back: Depreciation and amortization expense Interest expense (income), net EBITDA Add back: Stock based compensation expense, net Adjusted EBITDA Adjusted EBITDA margin – Reis Services and consolidated (B) Reconciliation of Income from Continuing Operations to EBITDA and Adjusted EBITDA for the Year Ended December 31, 2013 Income from continuing operations Income tax (benefit) Income (loss) before income taxes and discontinued operations Add back: Depreciation and amortization expense Interest expense (income), net EBITDA Add back: Stock based compensation expense, net Adjusted EBITDA Adjusted EBITDA margin – Reis Services and consolidated (B) Reconciliation of Income from Continuing Operations to EBITDA and Adjusted EBITDA for the Year Ended December 31, 2012 Income from continuing operations Income tax (benefit) Income (loss) before income taxes and discontinued operations Add back: Depreciation and amortization expense Interest expense (income), net EBITDA Add back: Stock based compensation expense, net Adjusted EBITDA Adjusted EBITDA margin – Reis Services and consolidated (B) Reconciliation of Income from Continuing Operations to EBITDA and Adjusted EBITDA for the Three Months Ended September 30, 2014 Income from continuing operations Income tax expense Income (loss) before income taxes and discontinued operations Add back: Depreciation and amortization expense Interest expense (income), net EBITDA Add back: Stock based compensation expense, net Adjusted EBITDA Adjusted EBITDA margin – Reis Services and consolidated (B) (amounts in thousands) By Segment Reis Services Other (A) Consolidated $ 16,304 (14,751) $ 2,511 $ (958) 1,553 1,251 2 1,253 26 — 26 3,788 (956) 2,832 — 379 379 $ 3,788 $ (577) $ 3,211 41.1% 34.9% By Segment Reis Services Other (A) Consolidated $ 17,933 (13,670) $ 9,183 $ (4,920) 4,263 5,021 9 5,030 103 — 103 14,307 (4,911) 9,396 — 1,941 1,941 $ 14,307 $ (2,970) $ 11,337 41.2% 32.7% By Segment Reis Services Other (A) Consolidated $ 8,013 (5,427) $ 7,683 $ (5,097) 2,586 4,974 9 4,983 105 (1) 104 12,762 (5,089) 7,673 — 2,295 2,295 $ 12,762 $ (2,794) $ 9,968 40.9% 31.9% By Segment Reis Services Other (A) Consolidated $ 1,130 743 $ 2,924 $ (1,051) 1,873 1,339 2 1,341 22 — 22 4,285 (1,049) 3,236 — 437 437 $ 4,285 $ (612) $ 3,673 40.9% 35.1%
| (A) | Includes interest and other income, depreciation expense and general and administrative expenses (including public company related costs) that are not associated with the Reis Services segment. Since the reconciliations start with income from continuing operations, the effects of the discontinued operations (Residential Development Activities) are excluded from these reconciliations for all periods presented. |
| (B) | Reflects an Adjusted EBITDA margin on the Reis Services segment and on a consolidated basis, both of which exclude the impact of discontinued operations. |
Results of Operations
Comparison of the Results of Operations for the Year Ended December 31, 2014 and 2013
Subscription revenues and related cost of sales were approximately $41,335,000 and $8,037,000 respectively, for the year ended December 31, 2014, which resulted in a gross profit for the Reis Services segment of approximately $33,298,000. Amortization expense included in cost of sales (for the database intangible asset) was approximately $1,780,000 during this period. Subscription revenues and related cost of sales were approximately $34,721,000 and $6,974,000, respectively, for the year ended December 31, 2013, resulting in a gross profit for the Reis Services segment of approximately $27,747,000. Amortization expense included in cost of sales was approximately $1,547,000 during this period. See “— Critical Business Metrics of the Reis Services Segment” for a discussion of the variances and trends in revenue and EBITDA of the Reis Services segment. The increase in cost of sales of $1,063,000 resulted from greater employment related costs, specifically from hiring during 2013 and 2014, coupled with compensation increases and higher benefit costs than in the 2013 period of $830,000, and a $233,000 increase in amortization expense for database costs as a result of the addition of a new property type in 2014 (seniors housing).
Sales and marketing expenses were approximately $10,235,000 and $8,350,000 for the years ended December 31, 2014 and 2013, respectively, and solely represented costs of the Reis Services segment. Amortization expense included in sales and marketing expenses (for the customer relationships intangible asset) was approximately $962,000 and $973,000 during the years ended December 31, 2014 and 2013, respectively. The increase in sales and marketing expenses between the two periods of approximately $1,885,000 resulted from greater employment related costs from hiring during 2013 and 2014 and increased commissions expense, coupled with compensation increases and higher benefit costs than in the 2013 period.
Product development expenses were approximately $3,473,000 and $3,122,000 for the years ended December 31, 2014 and 2013, respectively, and solely represented costs of the Reis Services segment. Amortization expense included in product development expenses (for the website intangible asset) was approximately $1,784,000 and $1,875,000 during the years ended December 31, 2014 and 2013, respectively. Product development costs increased $351,000, primarily due to increased employment related costs from hiring during 2013, coupled with compensation increases and higher benefit costs than in the 2013 period of $442,000, offset by a net $91,000 decrease in amortization expense for website costs due to the completion of amortization in the first half of 2013 related to significant prior year product releases (including the 2010 introduction of ReisReports and monthly publication of data).
General and administrative expenses of approximately $12,040,000 for the year ended December 31, 2014 included current period expenses of approximately $9,789,000, depreciation and amortization expense of approximately $686,000 for lease value and furniture, fixtures and equipment, and approximately $1,565,000 of net non-cash compensation expense. The net non-cash compensation expense was comprised of equity awards for employees and directors of approximately $1,702,000, offset by a compensation benefit of approximately $137,000 related to the liability for option cancellations due to the final settlement in 2014 of the remaining 17,724 options accounted for in this manner. General and administrative expenses of approximately $11,909,000 for the year ended December 31, 2013 included current period expenses of approximately $9,333,000, depreciation and amortization expense of approximately $635,000 for lease value and furniture, fixtures and equipment, and approximately $1,941,000 of net non-cash compensation expense. The net non-cash compensation expense was comprised of equity awards for employees and directors of approximately $1,859,000 and by an approximate $82,000 increase in the liability for option cancellations due to an increase in the market price of the Company’s common stock from $13.03 per share at December 31, 2012 to $19.23 per share at December 31, 2013. Excluding the non-cash expenses, the net increase in general and administrative expenses of $456,000 was primarily a result of increased employment related costs, additional rent expense and increased professional fees, partially offset by a reduction in public company segment related costs from 2013 to 2014.
Interest expense of $113,000 during the years ended December 31, 2014 and 2013 was comprised of unused facility fees and deferred financing cost amortization on the Revolver, which the Company obtained in October 2012 and as more fully described in “— Debt” in this Item 7. There was no outstanding balance on the Revolver during 2014 or 2013.
The aggregate income tax expense applicable to continuing operations was $2,842,000 during the year ended December 31, 2014, which reflected current state and local tax expense of $302,000, current Federal alternative minimum tax (“AMT”) of $110,000 and a deferred Federal provision of $2,434,000, offset by a deferred state and local tax benefit of $4,000. During the year ended December 31, 2013, the net income tax benefit from continuing operations of $13,670,000 included the aggregate deferred Federal, Federal AMT, state and local income tax benefit of $15,217,000 as a result of the release of the remaining valuation allowance against the Company’s deferred tax assets, offset by a current state and local tax provision of $164,000, current Federal AMT of $53,000, and deferred Federal, Federal AMT, state and local tax expenses aggregating $1,330,000.
The loss from discontinued operations was $(569,000) for the year ended December 31, 2014 and primarily reflected legal and professional fees of $977,000 in connection with our recovery efforts (related to the 2012 Gold Peak settlement of $17,000,000), offset by $26,000 of recoveries during the period and an income tax benefit of $382,000. The loss from discontinued operations was $(336,000) for the year ended December 31, 2013 and primarily reflected $646,000 of legal and professional fees in connection with our recovery efforts related to the Gold Peak settlement, offset by $80,000 of recoveries during the period and an income tax benefit of $230,000.
Comparison of the Results of Operations for the Years Ended December 31, 2013 and 2012
Subscription revenues and related cost of sales were approximately $34,721,000 and $6,974,000, respectively, for the year ended December 31, 2013, which resulted in a gross profit for the Reis Services segment of approximately $27,747,000. Amortization expense included in cost of sales (for the database intangible asset) was approximately $1,547,000 during this period. Subscription revenues and related cost of sales were approximately $31,229,000 and $6,617,000, respectively, for the year ended December 31, 2012, which resulted in a gross profit for the Reis Services segment of approximately $24,612,000. Amortization expense included in cost of sales was approximately $1,907,000 during this period. See “— Critical Business Metrics of the Reis Services Business”Segment” in this Item 7 for a discussion of the variances and trends in revenue and EBITDA of the Reis Services segment. The increase in cost of sales of $357,000 resulted from greater employment related costs, specifically from hiring during 2012 and 2013, coupled with compensation increases and higher benefit costs than in the 2012 period, offset by a reduction in amortization expense of $360,000 from the Merger related purchase price allocations for the database intangible asset becoming fully amortized in the second quarter of 2012.
Sales and marketing expenses were approximately $8,350,000 and $7,643,000 for the years ended December 31, 2013 and 2012, respectively, and solely represent costs of the Reis Services segment. Amortization expense included in sales and marketing expenses (for the customer relationships intangible asset) was approximately $973,000 and $982,000 during the years ended December 31, 2013 and 2012, respectively. The increase in sales and marketing expenses between the two periods of approximately $707,000 resulted from greater employment related costs from hiring during 2012 and 2013, coupled with compensation increases and higher benefit costs than in the 2012 period.
Product development expenses were approximately $3,122,000 and $2,485,000 for the years ended December 31, 2013 and 2012, respectively, and solely represent costs of the Reis Services segment. Amortization expense included in product development expenses (for the web sitewebsite intangible asset) was approximately $1,875,000 and $1,436,000 during the years ended December 31, 2013 and 2012, respectively. Product development costs increased $637,000 due to a $439,000 increase in amortization expense for web sitewebsite costs capitalized and amortization expense which commenced in the period for significant product introductions and improvements during 2012 and in May 2013, with the remainder from increased employment related costs from hiring during 2012 and 2013, coupled with compensation increases and higher benefit costs than in the 2012 period.
General and administrative expenses of approximately $11,909,000 for the year ended December 31, 2013 included current period expenses of approximately $9,333,000, depreciation and amortization expense of approximately $635,000 for lease value and furniture, fixtures and equipment, and approximately $1,941,000 of net non-cash compensation expense. The net non-cash compensation expense was comprised of equity awards for employees and directors of approximately $1,859,000 and by an approximate $82,000 increase in the liability for option cancellations due to an increase in the market price of the Company’s common stock from $13.03 per share at December 31, 2012 to $19.23 per share at December 31, 2013. General and administrative expenses of approximately $11,793,000 for the year ended December 31, 2012 included current period expenses of approximately $8,840,000, depreciation and amortization expense of approximately $658,000 for lease value and furniture, fixtures and equipment, and approximately $2,295,000 of net non-cash compensation expense. The net non-cash compensation expense was comprised of equity awards for employees and directors of approximately $2,181,000 and by an approximate $114,000 increase in the liability for option cancellations due to an increase in the market price of the Company’s common stock from $9.12 per share at December 31, 2011 to $13.03 per share at December 31, 2012. Excluding the non-cash expenses, the increase in general and administrative expenses of $493,000 was primarily a result of increased public company segment related professional fees, additional rent expense in the 2013 period, employment related costs from hiring during the later part of 2012, coupled with compensation increases and higher benefit costs than in the 2012 period.
Interest expense of $113,000 for the year ended December 31, 2013 was comprised of unused facility fees and deferred financing cost amortization on the Company’s Revolver, which the Company obtained in October 2012 and as more fully described in “— Debt” in this Item 7. There was no outstanding balance on the Revolver during the year ended December 31, 2013 or during the period October 16, 2012 to December 31, 2012. Interest expense of $155,000 for the year ended December 31, 2012 was comprised of interest and deferred financing cost amortization of $128,000 on the Bank Loan and $27,000 of unused facility fees and deferred financing cost amortization on the Revolver. In the second quarter of 2012, the Bank Loan was repaid and that obligation was cancelled.
During the year ended December 31, 2013, the net income tax benefit from continuing operations of $13,670,000 included the aggregate deferred Federal, Federal AMT, state and local income tax benefit of $15,217,000 as a result of the release of the remaining valuation allowance against the Company’s deferred tax assets, offset by a current state and local tax provision of $164,000, current Federal AMT of $53,000, deferred Federal, Federal AMT, state and local tax expenses aggregating $1,238,000 and a provision related
to the excess tax benefit from stock based compensation of $92,000.$1,330,000. During the year ended December 31, 2012, the net income tax benefit from continuing operations of $5,427,000 included the aggregate deferred Federal, state and local income tax benefit of $5,614,000 as a result of the partial release of the valuation allowance against certain deferred tax assets, offset by current state and local tax expense of $187,000 arising from the changes in that year of the Company’s treatment of NOLs reflected on certain state and local tax returns. In the fourth quarters of 2013 and 2012, the Company reduced the valuation allowance recorded against a portion of its NOL carryforwards. The decisions to reduce the valuation allowance in each period waswere made after management determined, based on an assessment of continuing operations, profitability and forecasts of future taxable income, that these deferred tax assets would be realized.
The loss from discontinued operations was $(336,000) for the year ended December 31, 2013 and primarily reflectsreflected $646,000 of legal and professional fees in connection with our recovery efforts related to the Gold Peak settlement, offset by $80,000 of recoveries during that period and an income tax benefit of $230,000. The loss from discontinued operations of $(12,297,000) for the year ended December 31, 2012 primarily was comprised of a net charge of $12,260,000 related to the June 2012 settlement of the Gold Peak litigation for $17,000,000, plus other professional fees and expenses of $750,000, offset by $712,500$713,000 of recoveries in December 2012.
Comparison of the Results of Operations for the Year Ended December 31, 2012 and 2011
Subscription revenues and related cost of sales were approximately $31,229,000 and $6,617,000, respectively, for the year ended December 31, 2012, which resulted in a gross profit for the Reis Services segment of approximately $24,612,000. Amortization expense included in cost of sales (for the database intangible asset) was approximately $1,907,000 during this period. Subscription revenues and related cost of sales were approximately $27,180,000 and $6,305,000, respectively, for the year ended December 31, 2011, which resulted in a gross profit for the Reis Services segment of approximately $20,875,000. Amortization expense included in cost of sales was approximately $2,410,000 during this period. See “— Critical Business Metrics of the Reis Services Business” in this Item 7 for a discussion of the variances and trends in revenue and EBITDA of the Reis Services segment. The increase in cost of sales of $312,000 was primarily a result of employment related costs from hiring during 2011 and throughout 2012, coupled with wage and benefit increases over the 2011 period aggregating $815,000, offset by a net decrease in amortization expense of $503,000 from the Merger related purchase price allocations for the database intangible asset becoming fully amortized in the second quarter of 2012.
Sales and marketing expenses were approximately $7,643,000 and $6,704,000 for the year ended December 31, 2012 and 2011, respectively, and solely represent costs of the Reis Services segment. Amortization expense included in sales and marketing expenses (for the customer relationships intangible asset) was approximately $982,000 and $992,000 during the year ended December 31, 2012 and 2011, respectively. The increase in sales and marketing expenses between the two periods of approximately $939,000 reflected increased commissions and employment related costs from hiring during 2011 and throughout 2012, coupled with wage and benefit increases over the 2011 period.
Product development expenses were approximately $2,485,000 and $2,093,000 for the year ended December 31, 2012 and 2011, respectively, and solely represent costs of the Reis Services segment. Amortization expense included in product development expenses (for the web site intangible asset) was approximately $1,436,000 and $1,084,000 during the year ended December 31, 2012 and 2011, respectively. Product development costs increased $392,000, primarily due to increased amortization expense for web site costs capitalized and amortization expense which commenced in the period for significant product introductions and improvements in 2011 and 2012, as well as increased employment related costs over the 2011 period.
General and administrative expenses of approximately $11,793,000 for the year ended December 31, 2012 included current period expenses of approximately $8,840,000, depreciation and amortization expense of approximately $658,000 for lease value and furniture, fixtures and equipment, and approximately $2,295,000 of net non-cash compensation expense. The net non-cash compensation expense was comprised of equity awards for employees and directors of approximately $2,181,000 and by an approximate $114,000 increase in the liability for option cancellations due to an increase in the market price of the Company’s common stock from $9.12 per share at December 31, 2011 to $13.03 per share at December 31, 2012. General and administrative expenses of approximately $11,095,000 for the year ended December 31, 2011 included current period expenses of approximately $8,237,000, depreciation and amortization expense of approximately $654,000 for lease value and furniture, fixtures and equipment, and approximately $2,204,000 of net non-cash compensation expense. The net non-cash compensation expense was comprised of equity awards for employees and directors of approximately $2,083,000 and by an approximate $121,000 increase in the liability for option cancellations due to an increase in the market price of the Company’s common stock from $7.03 per share at December 31, 2010 to $9.12 per share at December 31, 2011. Excluding the non-cash expenses, the increase in general and administrative expenses
of $603,000 was primarily a result of increased rent related costs for additional office space, increased professional fees, compensation increases and higher benefit costs than in the 2011 period.
Interest expense of $155,000 for the year ended December 31, 2012 was comprised of interest and deferred financing cost amortization of $128,000 and $27,000 on the Bank Loan and Revolver, respectively. Interest expense of $274,000 for the year ended December 31, 2011 included interest and deferred financing cost amortization on the Bank Loan of $272,000 and interest from other debt of $2,000. In the second quarter of 2012, the Bank Loan was repaid and that obligation was cancelled. In October 2012, the Company obtained a $10,000,000 Revolver, as more fully described in “— Debt” elsewhere in this Item 7.
During the year ended December 31, 2012, the net income tax benefit from continuing operations of $5,427,000 included the aggregate deferred Federal, state and local income tax benefit of $5,614,000 as a result of the partial release of the valuation allowance against certain deferred tax assets, offset by current state and local tax expense of $187,000 arising from the changes in that year of the Company’s treatment of NOLs reflected on certain state and local tax returns. The income tax benefit from continuing operations during the year ended December 31, 2011 of $4,075,000 reflected an aggregate deferred Federal, state and local income tax benefit as a result of the partial release of the Company’s valuation allowance against certain deferred tax assets. In the fourth quarters of 2013 and 2012, the Company reduced the valuation allowance recorded against a portion of its NOL carryforwards. The decision to reduce the valuation allowance in each period was made after management determined, based on an assessment of continuing operations, profitability and forecasts of future taxable income, that these deferred tax assets would be realized.
The loss from discontinued operations of $(12,297,000) for the year ended December 31, 2012 primarily was comprised of a net charge of $12,260,000 related to the June 2012 settlement of the Gold Peak litigation for $17,000,000, plus other professional fees and expenses of $750,000, offset by $712,500 of recoveries in December 2012. The 2011 loss from discontinued operations of $(2,975,000) reflected a charge of $4,460,000 recorded at December 31, 2011 in connection with the construction defect litigation at our Gold Peak development project, offset by a gain on the sale of the East Lyme project in a bulk transaction in April 2011 of $1,242,000 and net other income of $243,000, primarily from the release of unused warranty accruals on home sales at the East Lyme project.
Income Taxes
Deferred income taxes reflect the net tax effects of temporary differences between the carrying amount of assets and liabilities for financial reporting purposes and the amounts used for income tax purposes. The net deferred tax asset was approximately $23,789,000$22,437,000 and $9,622,000$23,789,000 at December 31, 20132014 and 2012,2013, respectively, of which $2,472,000$3,798,000 and $1,065,000$2,472,000 is reflected as a net current asset in prepaid and other assets and $21,317,000$18,639,000 and $8,557,000$21,317,000 is reflected separately as a net non-current asset in the accompanying consolidated balance sheets, respectively. The significant portion of the deferred tax items primarily relate to: (1)relates to deferred tax assets including NOL carryforwards; (2)carryforwards, Federal AMT credit carryforwards; (3)carryforwards and stock based compensation; and (4) liability reserves, all as they relate to deferred tax assets; and (5)compensation, with the remainder of the deferred tax liabilityitems relating to liabilities resulting from the intangible assets recorded at the time of the Merger.
The Company has aggregate Federal NOL carryforwards aggregating approximately $61,165,000 at December 31, 2014, as well as significant state and local NOL carryforwards aggregating approximately $66,006,000 at December 31, 2013.carryforwards. These NOLs include NOLs generated subsequent to the Merger, losses from Privatethe Reis Services business prior to the Merger losses obtained from the Company’s 1998 merger with Value Property Trust (“VLP”) and the Company’s operating losses prior to the Merger. Approximately $25,158,000$20,317,000 of these Federal NOLs are subject to an annual limitation, whereas the remaining balance of approximately $40,848,000 is not subject to such a limitation. There is an annual limitation on the use of NOLs after an ownership change, pursuant to Section 382 of the Internal Revenue Code. As a result of the Merger, the Company experienced such an ownership change which resulted in a new annual limitation of $2,779,000. However, becauseBecause of the accumulation of annual limitations, it is expected that the use of NOLs will not be limited by expiration. A 2014 New York State law and the anticipated conforming changes to the New York City law limits the amount of existing NOLs which could be used each year in those jurisdictions; however, all such losses are expected to be fully utilized in the future. A substantial NOL was realized during the year ended December 31, 2012 as a result of the Gold Peak litigation settlement, as discussed in Note 10 to the Company’s consolidated financial statements.
A further requirement of the tax rules is that after a corporation experiences an ownership change, it must satisfy the continuity of business enterprise, or COBE, requirement (which generally requires that a corporation continue its historic business or use a significant portion of its historic business assets in its business for the two year period beginning on the date of the ownership change) to be able to utilize NOLs generated prior to such ownership change. The Company believes that the COBE requirement was met through the required two year period subsequent to the ownership change. In February 2012, the Internal Revenue Service (“IRS”) completed an audit of the Company’s 2009 Federal income tax return. The 2009 tax year included the end of the two year period subsequent to the Merger. The IRS issued a no change letter related to the Company’s 2009 tax return, thereby accepting the Company’s position that the two year COBE requirement was met.
The Company does not have any near-term expirations of NOLs; the next NOL expiration for the Company is in 20172018 for approximately $3,391,000$252,000 of Federal NOLs. Included in the Federal and state NOLs at December 31, 20132014 is approximately $1,723,000 attributable to excess tax deductions from the issuance of common shares as non-cash compensation. The tax benefits attributable to those NOLs will be credited directly to additional paid in capital when utilized to offset taxes payable.
A valuation allowance is required to reduce deferred tax assets if, based on the weight of the evidence, it is more likely than not that some portion or all of the deferred tax assets will not be realized. As a result of management’s current evaluation of the Company’s future operations, it has been determined that no valuation allowance was necessary at either December 31, 2014 or 2013. Management
determined that a valuation allowance of approximately $15,217,000 was necessary at December 31, 2012. The allowance at December 31, 2012 related primarily to NOL carryforwards and AMT credits. The decrease in the allowance in 2012 was primarily attributable to the $5,614,000 increase in deferred tax assets expected to be realized in the years subsequent to December 31, 2012, offset in part by the litigation settlement payments made in 2012, net of recoveries, which resulted in an increase to the 2012 NOL. The decrease in the allowance in 2011 was primarily attributable to the release of valuation allowance against deferred assets expected to be utilized in the three years subsequent to December 31, 2011, of $4,075,000, a reduction in the effective tax rate utilized by the Company (approximately $1,850,000), and utilizing the tax loss on the sale of the Company’s East Lyme project for which an allowance was provided for, related to the net liability in 2010, offset by the allowance provided for the net litigation liability at December 31, 2011.
As part of its assessment to reduce the valuation allowance and reflect deferred tax assets on the consolidated balance sheet in each of the three years ended December 31, 2013 2012 and 2011,2012, management considered many factors, including: the completion of sales of assets in its Residential Development Activitiesdiscontinued operations segment in 2011; the trend of pre-tax income from both continuing operations and income before taxes, on a consolidated basis (without consideration of discontinued operations reporting); and the predictability of future pre-tax income. The Company considered the predictability of future pre-tax income for the next three years as part of its 2011 assessment, and for the next five years in its 2012 and 2013 assessments. Based upon these factors, and consideration of uncertainties that could affect the ultimate usability of the deferred tax assets, management concluded to record an aggregate deferred tax asset of $23,789,000 and $9,622,000 at December 31, 2013 and 2012, respectively, with no valuation allowance at December 31, 2013. For the 2012 assessment, management was unable to conclude that all of its deferred tax assets would be realized, and therefore maintained a valuation allowance of approximately $15,217,000 at December 31, 2012. The Company performed a similar assessment in 2014 and concluded that a valuation allowance was not required at December 31, 2014. In order to be able to realize the deferred tax assets in the future, the Company considered its historic trend in revenue and EBITDA growth rates, the expected level of future amortization and depreciation expense and the expectation that there should be minimal financial impact from the discontinued operations. If revenue and EBITDA growth is not achieved to the extent expected, or at all, if EBITDA margins materially decline, or if material losses occur as a result of our discontinued operations, the ability to fully utilize these assets in future years could be negatively affected. There is no expectation of future taxable income being derived from a source other than ordinary and recurring operations of the Company’s business to be able to utilize deferred tax assets. For the 2012 assessment, management was unable to conclude that all of its deferred tax assets would be realized, and therefore maintained a valuation allowance of approximately $15,217,000 at December 31, 2012.
The Company’s reserve for unrecognized tax benefits, including estimated interest, was $62,000$105,000 and $345,000$62,000 at December 31, 20132014 and 2012,2013, respectively. The unrecognized tax benefits as well as related interest was included in general and administrative expenses. The Company recorded an additional provision, including interest, of $43,000 and $51,000 in 2014 and $200,000 in 2013, and 2012, respectively.
For additional information related to income taxes, see Note 7 to the Company’s consolidated financial statements.
Debt
The Company had no debt outstanding at December 31, 2014 and 2013.
Revolver
In October 2012, Reis Services, as borrower, and the Company, as guarantor, entered into a loan and security agreement with Capital One, National Association, as lender, for a $10,000,000 revolving credit facility, (the “Revolver”).which we refer to as the Revolver. The Revolver has a three year term expiringwhich is set to expire on October 16, 2015, and any borrowings bear interest at a rate of LIBOR + 2.00% per annum (for LIBOR loans) or the greater of 1.00% or the bank’s prime rate minus 0.50% per annum (for base rate loans) and is subject to an unused facility fee of 0.25% per annum. The Company paid a commitment fee of $50,000 in connection with the closing. The Revolver is secured by a security interest in substantially all of the tangible and intangible assets of Reis Services and a pledge by the Company of its membership interests in Reis Services. The Revolver also contains customary affirmative and negative covenants, including minimum financial covenants, as defined in the agreement; all of the covenants were met at December 31, 2014 and 2013. No borrowings were made on the Revolver during 2012the years ended December 31, 2014 , 2013 or 2013.2012.
During 2015, the Company may consider, based on market conditions and business needs, refinancing or otherwise amending or replacing the Revolver, though there can be no assurance that the Company will do so, or be able to do so on terms acceptable to the Company.
Bank Loan
During 2012, the Company repaid the remaining outstanding balance of $5,691,000 in connection with borrowings under a credit agreement, dated October 11, 2006, with the Bank of Montreal, Chicago Branch, as administrative agent, and BMO Capital Markets, as lead arranger. Loan proceeds were used to finance $25,000,000 of the cash portion of the Merger consideration. The final scheduled maturity date of all amounts borrowed pursuant to the credit agreement was September 30, 2012. The interest rate during 2012 was LIBOR + 1.50%.
Liquidity and Capital Resources
The core Reis Services business has traditionally generated significant cash annually,annually; and we expect it to continue to do so. CashOur consolidated cash and cash equivalents balance aggregated approximately $10,560,000$17,745,000 at December 31, 2013,2014, an increase of $5,599,000 from$7,185,000 over the December 31, 20122013 balance of approximately $4,961,000.$10,560,000. The Company was able to increase its cash position in 2014 by 68% while meeting all of its operational costs and obligations, making investments in its websites and databases and paying an aggregate dividend of approximately $3,698,000 in 2014.
Our cash balance decreased significantly during the year ended December 31, 2012 from the $17,000,000 settlement of the Gold Peak litigation and the repayment of approximately $5,691,000 of outstanding debt. Cash generation of the Reis Services business in 2013 and 2014 has been solely responsible for the replenishment of our cash balance. In addition to the cash generation of the Reis Services business, in October 2012, the Company obtained the three year $10,000,000 Revolver to provide working capital flexibility.flexibility; no borrowings have been made on the Revolver since it was obtained. Separately, the Company is seeking recovery under all available insurance policies, and is pursuing appropriate additional actions against other potentially responsible parties related to Gold Peak. To date, these efforts have resulted in the recovery of $80,000 and $712,500 in 2013 and 2012, respectively.approximately $819,000 of cash through December 31, 2014. There can be no assurance that the Company will recover any additional amounts in the short or long-term from these efforts.
At December 31, 2013,2014, the Company’s short-term liquidity requirements include: current operating and capitalizable costs, including accounts payable and other accrued expenses; near-term product development and enhancement of the web sitewebsite and databases;databases either through building with Company resources or through acquisitions; operating leases; growth in operating expenses from a further increase in the number of Reis employees and additional resources being devoted to our sales and marketing efforts; insurance deductibles and legal costs related to discontinued operations; other costs, including public company expenses not included in the Reis Services segment; the resolution of open tax years with state and local tax authorities; payment of employee taxes on vested equity awards, for which the employee uses shares to settle his/her minimum withholding tax obligations with the Company; and the potential settlementuse of certain outstanding stock options in cash (the liability for which was approximately $268,000 at December 31, 2013 based upon the closing stock pricepayment of the Company at December 31, 2013 of $19.23 per share).quarterly dividends. The Company expects to meet these short-term liquidity requirements generally through the use of available cash and cash generated from subscription revenue of Reis Services and, if necessary, with borrowings under the Revolver.Revolver or a replacement facility, and/or proceeds from the sale of Reis stock. During 2015, the Company may consider, based on market conditions and business needs, refinancing or otherwise amending or replacing the Revolver, though there can be no assurance we will do so, or be able to do so on terms acceptable to us. There could be additional cash inflows from insurance recoveries, or from other potentially responsible parties, related to the Gold Peak litigation; however, there can be no assurance that the Company will recover any additional amounts in the short or long-term. The Company has NOLs that it expects to be able to use beyond the next fewover many years against future Federal, state and local taxable income, if any. Tax payments related to 20142015 are expected to be for alternate state and local taxes on income and Federal AMT, but generally not for Federal, income taxes.state or local taxes on income. In 2015 and thereafter, as a result of the new tax law enacted in New York State in March 2014, the use of certain NOLs for New York State purposes will be subject to an annual limitation and, therefore, any taxes in excess of the limitation will need to be paid in those periods.
The Company’s long-term liquidity requirements, beyond 2014,2015, may include: future operating and capitalizable costs, including accounts payable and other accrued expenses; long-term product development and enhancements of the web siteswebsites and databases;databases, either through building with Company resources or through acquisitions; operating leases and other capital expenditures; growth in operating expenses from a further increase in the number of Reis employees and additional resources being devoted to our sales and marketing efforts; other costs, including public company expenses not included in the Reis Services segment; the resolution of open tax years with state and local tax authorities; and the possible payment of employee taxes on vested equity awards, for which the employee uses shares to settle his/her minimum withholding tax obligations with the Company.Company; and the use of cash for the payment of quarterly dividends. The Company expects to meet these long-term liquidity requirements generally through the use of available cash and cash generated from subscription revenue of Reis Services and, if necessary, with borrowings under a replacement revolving credit facility, and/or proceeds from the Revolver.sale of Reis stock. There could be additional cash inflows from insurance recoveries, or from other potentially responsible parties, both related to the Gold Peak litigation; however, there can be no assurance that the Company will recover any additional amounts in the short or long-term. The Company has NOLs that it expects to be able to use beyond the next few years against future Federal, state and local taxable income, if any. Tax payments related to 20142015 and possibly 2015 are expected to be for state and local taxes on income and Federal AMT, but not for Federal income taxes. Subsequent to 2015, tax paymentsbeyond are expected to be for alternative state and local taxes and Federal AMT, but generally not for Federal, state or local taxes on income. In 2015 and thereafter, as a result of the new tax law enacted in New York State in March 2014, the use of certain NOLs for New York State purposes will be subject to an annual limitation and, therefore, any taxes in excess of the limitation will need to be paid in those periods.
The Company may determine to use its cash to: (1) acquire or invest in other databases or information companies that have logical adjacencies or complementary products or services; (2) repurchase shares of Reis common stock; or (3) pay a special dividend, to stockholders in the form of a special or aincrease its recurring quarterly dividend. There can be no assurance that the Company will use its cash for any of these purposes during 20142015 or thereafter.
Material Contractual Obligations
The following table summarizes material contractual obligations as of December 31, 2013:2014:
| (amounts in thousands) | Payments Due | Payments Due | ||||||||||||||||||||||||||||||||||||||
| For the Years Ended December 31, |
|
| For the Years Ending December 31, | |||||||||||||||||||||||||||||||||||||
Contractual Obligations | 2014 | 2015 and 2016 | 2017 and 2018 | Thereafter | Aggregate | 2015 | 2016 and 2017 | 2018 and 2019 | Thereafter | Aggregate | ||||||||||||||||||||||||||||||
Principal and interest payments for the Revolver | $ | 25 | $ | 20 | $ | — | $ | — | $ | 45 | $ | 19 | $ | — | $ | — | $ | — | $ | 19 | ||||||||||||||||||||
Future contractual minimum operating lease payments | 1,812 | 3,391 | 433 | 166 | 5,802 | 1,896 | 1,709 | 386 | — | 3,991 | ||||||||||||||||||||||||||||||
|
|
|
|
|
|
|
|
|
| |||||||||||||||||||||||||||||||
Total contractual obligations | $ | 1,837 | $ | 3,411 | $ | 433 | $ | 166 | $ | 5,847 | $ | 1,915 | $ | 1,709 | $ | 386 | $ | — | $ | 4,010 | ||||||||||||||||||||
|
|
|
|
|
|
|
|
|
| |||||||||||||||||||||||||||||||
| (A) | Includes unused facility fees for 2015. |
| (B) | For additional information related to the Company’s operating leases, see Item 2. Properties. |
Off-Balance Sheet Arrangements
The Company does not have any off-balance sheet liabilities or obligations which are required to be disclosed by the SEC’s rules and regulations.
Discontinued Operations Impact on Liquidity
Cash flows from discontinued operations during the years ended December 31, 2014, 2013 2012 and 20112012 were included in the consolidated statements of cash flows in the operating activities section in accordance with the applicable accounting literature. Cash flows used in discontinued operations during 20132014 was a net outflow of approximately $673,000,$989,000, including $753,000$1,015,000 of cash used for legal and professional fees incurred as part of our cash recovery efforts from insurance companies and other potentially responsible parties, offset by $26,000 of recoveries. Cash flows used in discontinued operations during 2013 was a net outflow of approximately $673,000, including $753,000 of cash used for legal and professional fees, offset by $80,000 of recoveries. Cash flows during 2012 primarily were comprised of the $17,000,000 of settlement payments, plus legal costs paid, offset by $712,500$713,000 of recoveries. In 2011, cash flows from discontinued operations were related to the bulk sale lots, net of the operating costs and related expenses through the date of sale. Future cash flows from discontinued operations will be solely comprised of expenditures incurred as part of our cash recovery efforts from insurance companies and other potentially responsible parties and, to the extent that we are successful in these efforts, cash inflows from any future recoveries; however, there can be no assurance that the Company will recover any amounts in the short or long-term.
For additional information pertaining to our discontinued operations, see Note 3 and Note 10 to the Company’s consolidated financial statements and Note 10 for additional information pertaining to the Gold Peak litigation.
Other Items Impacting Liquidity
Issuer Purchases of Equity SecuritiesDividends
BetweenThe Company commenced a quarterly dividend program in the second quarter of 2014 when it declared and paid an initial quarterly cash dividend of $0.11 per common share in June 2014. In the third and fourth quarters of 2014, the Company declared and paid a quarterly cash dividend of $0.11 per common share in each of September 2014 and December 2008 and August 2011,2014. Aggregate dividends paid by the Board authorizedCompany during 2014 approximated $3,698,000. On February 2, 2015, the repurchase of upCompany announced that it has increased the dividend payable on March 18, 2015 to an aggregate amount of $5,000,000 of the Company’s$0.14 per common stock, of which approximately $551,000 remained available for repurchases as of December 31, 2013.share. Although the Company has remaining availability underanticipates paying a prior authorization, such authorization was at a time when the Company’s stock price and cash position was significantly different than where they were at December 31, 2013; and therefore, management would probably seek a new authorization from the Board if the Company werequarterly dividend hereafter, future dividends are subject to consider stock repurchases in the future.
The stock repurchases are permitted from time to time in the open market or through privately negotiated transactions. Depending on market conditions, financial developments and other factors, additional amounts may be authorizedapproval by the Board whereby future purchases could be commenced or suspended at any time, or from time to time, without prior notice.Board. The Company may make purchases pursuant to a trading plan under Securities Exchange Act Rule 10b5-1, permitting open market purchases of common stockdid not declare or distribute any dividends during blackout periods consistent with the Company’s “Policies for Transactions in Reis Stock and Insider Trading and Tipping.” During the fourth quarter and yearyears ended December 31, 2013 the Company did not repurchase any shares of common stock.
From the inception of the share repurchase programs in December 2008, the Company purchased an aggregate of 888,136 shares of common stock at an average price of $5.01 per share, for an aggregate of approximately $4,449,000. Cumulatively, the Company has repurchased approximately 8.1% of the common shares outstanding at the time of the Board’s initial authorization in December 2008.and 2012.
Stock Plans and Options Accounted for as Liability Awards
The Company has adopted certain incentive plans for the purpose of attracting and retaining the Company’s directors, officers and employees by having the ability to issue options, restricted stock units (or RSUs)“RSUs”), or stock awards. Awards granted under the Company’s incentive plans expire ten years from the date of grant and vest over periods ranging generally from three to five years for employees.
Certain outstanding options allowhad allowed the option holder to receive from the Company, in cancellation of the holder’s option, a cash payment with respect to each cancelled option equal to the amount, if any, by which the fair market value of the share of stock underlying the option exceeds the exercise price of such option. The Company accountsaccounted for these options as liability awards. ThisThe liability iswas adjusted at the end of each reporting period to reflect: (1) the net cash payments to option holders made during each period; (2) the impact of the exercise and expiration of options; and (3) the changes in the market price of the Company’s common
stock. Changes in the settlement value of option awards treated under the liability method arewere reflected as incomean increase to, or a reduction of, expense in the consolidated statements of operations.
At December 31, 2014, there were no options outstanding for which a liability was required as the remaining liability award options were either exercised or settled with a net cash payment. At December 31, 2013, the liability for option cancellations was approximately $268,000 based upon the difference in the closing stock price of the Company’s common stock at December 31, 2013 of $19.23 per share and the individual exercise prices of the outstanding 17,724 “in-the-money” options that were accounted for as a liability award at that date. AtThe Company recorded a compensation benefit of approximately $137,000 for the year ended December 31, 2012, the liability for option cancellations was approximately $297,000 based upon the difference in the closing stock price of the Company at December 31, 2012 of $13.03 per share2014 and the individual exercise prices of the outstanding 35,448 “in-the-money” options that were accounted for as a liability award at that date. The Company recorded compensation expense of approximately $82,000 $114,000 and $121,000$114,000 for the years ended December 31, 2013 2012 and 2011,2012, respectively, in general and administrative expenses in the consolidated statements of operations related to the respective changes in the amount of the liability for option cancellations.
In each of the years ended December 31, 2014, 2013 2012 and 2011,2012, a total of 8,862 options were settled with net cash payments aggregating approximately $132,000, $110,000 $58,000, and $38,000,$58,000, respectively.
The liability for option cancellations could materially change from periodFor additional information related to period based upon: (1) an option holder either (a) exercising the options in a traditional manner, or (b) electing the net cash settlement alternative;stock plans and (2) changes in the market price ofother incentives, see Note 9 to the Company’s common stock. At each period end, an increase in the Company’s common stock price would result in an increase in compensation expense, whereas a decline in the stock price would reduce compensation expense. In 2014, the remaining 17,724 options accounted for as liability awards are scheduled to expire.consolidated financial statements.
Changes in Cash Flows
Cash flows for the years ended December 31, 2014, 2013 2012 and 20112012 are summarized as follows:
| For the Years Ended December 31, | For the Years Ended December 31, | |||||||||||||||||||||||
| 2013 | 2012 | 2011 | 2014 | 2013 | 2012 | |||||||||||||||||||
Net cash provided by (used in) operating activities | $ | 11,441,800 | $ | (6,554,862 | ) | $ | 11,960,940 | $ | 14,788,857 | $ | 11,441,800 | $ | (6,554,862) | |||||||||||
Net cash (used in) investing activities | (4,498,923 | ) | (4,036,929 | ) | (3,623,162 | ) | ||||||||||||||||||
Cash (used in) investing activities | (4,203,063) | (4,498,923) | (4,036,929) | |||||||||||||||||||||
Net cash (used in) financing activities | (1,343,828 | ) | (6,600,161 | ) | (6,348,763 | ) | (3,400,616) | (1,343,828) | (6,600,161) | |||||||||||||||
|
|
|
|
|
| |||||||||||||||||||
Net increase (decrease) in cash and cash equivalents | $ | 5,599,049 | $ | (17,191,952 | ) | $ | 1,989,015 | $ | 7,185,178 | $ | 5,599,049 | $ | (17,191,952) | |||||||||||
|
|
|
|
|
| |||||||||||||||||||
Comparison of Cash Flows for the Years Ended December 31, 2014 and 2013
Net cash provided by operating activities increased $3,347,000 from $11,442,000 provided in the 2013 period to $14,789,000 provided in the 2014 period. This increase was the result of an increase in operating cash flow of $2,974,000 from the Reis Services segment due to growth in revenue and Reis Services EBITDA.
Cash used in investing activities decreased $296,000 from $4,499,000 used in the 2013 period to $4,203,000 used in the 2014 period. This change resulted from a $67,000 decrease in furniture, fixtures and equipment purchases as the 2013 period included spending in connection with additional office space leased in 2013, coupled with a $229,000 decrease of cash used in the 2014 period as compared to the 2013 period for website and database development costs for continuing product development and enhancement initiatives.
Net cash used in financing activities was $3,401,000 and $1,344,000 in the 2014 and 2013 periods, respectively. In the 2014 period, this amount includes approximately $3,698,000 for dividends declared and paid in the second, third and fourth quarters of 2014 and $132,000 for option cancellation payments, offset by proceeds received from employees for option exercises in 2014 aggregating $429,000. In the 2013 period, cash used in financing activities was for option cancellation payments of $110,000 and restricted stock unit settlements of $1,280,000, offset by proceeds received from option exercises in 2013 of $46,000.
Comparison of Cash Flows for the Years Ended December 31, 2013 and 2012
Cash flowsNet cash provided by operating activities increased $17,997,000 from $6,555,000 used in the 2012 period to $11,442,000 provided in the 2013 period. This increase was primarily the result of the one-time use of cash in 2012 for the Gold Peak settlement payments aggregating $17,000,000. In addition, the improvement also included increased operating cash flow from the Reis Services segment of $2,533,000 from $13,109,000 provided in the 2012 period to $15,642,000 provided in the 2013 period due to growth in revenue and EBITDA and the timing of accounts receivable collections. Cash flows from discontinued operations in future periods will include any additional legal costs in connection with recovery efforts against potentially responsible third parties and/or co-defendants in the lawsuit. Although the Company recovered $80,000 and $712,500$713,000 in 2013 and 2012, respectively, there is no assurance that the Company will be successful in any additional recovery efforts.
Cash flows used in investing activities increased $462,000 from $4,037,000 used in the 2012 period to $4,499,000 used in the 2013 period. This change resulted from an increase of cash used in the 2013 period as compared to the 2012 period for web sitewebsite and database development costs for continuing product development and enhancement initiatives, as well as cash used for furniture, fixture and equipment purchases in 2013 for the additional office space we have leased to house our growing employee base.
Cash flowsNet cash used in financing activities decreased $5,256,000 from $6,600,000 used in the 2012 period to $1,344,000 used in the 2013 period. During the 2012 period, the Company’s remaining debt of $5,691,000 was completely repaid; whereas in the 2013 period no debt was incurred and no payments were made. Payments for restricted stock unit settlements were approximately $1,390,000 and $909,000 in the 2013 and 2012 periods, respectively; the increase of $481,000 is due to the higher average price of our common stock in 2013 than in 2012. Proceeds received from option exercises in 2013 were $46,000, with no such proceeds from exercises in the 2012 period.
Comparison of Cash Flows for the Years Ended December 31, 2012 and 2011
Cash flows used in operating activities changed $18,516,000 from $11,961,000 provided in the 2011 period to $6,555,000 used in the 2012 period. The operating cash flow decrease was primarily the result of: (1) payments aggregating $17,000,000 in 2012 to settle the
Gold Peak litigation; (2) cash proceeds received in 2011 from the sale of the East Lyme property and the related escrow releases; (3) the February 2011 collection of approximately $455,000 in satisfaction of a mortgage note and accrued interest thereon from the prior sale of property in Claverack, New York; and (4) increased spending on professional fees in the 2012 period, all primarily related to discontinued operations. These decreases were partially offset by an increase in cash flow from the Reis Services segment of $1,379,000 from $11,730,000 provided in the 2011 period to $13,109,000 provided in the 2012 period. The property sale, the satisfaction of the mortgage note and the Gold Peak settlement payment all were cash flows related to the Company’s discontinued operations.
Cash flows used in investing activities increased $414,000 from $3,623,000 used in the 2011 period to $4,037,000 used in the 2012 period. This change primarily resulted from: (1) a $440,000 increase of cash used in the 2012 period as compared to the 2011 period for web site and database development costs for continuing product development and enhancement initiatives, including the additional property type, self storage, and the launch of the next generation of our flagship product, offset by (2) a $26,000 decrease in spending on furniture, fixtures and equipment, as during the 2011 period the Company added additional office space.
Cash flows used in financing activities increased $251,000 from $6,349,000 used in the 2011 period to $6,600,000 used in the 2012 period. During the 2012 period, $5,691,000 was repaid on the Bank Loan whereas $5,531,000 was repaid in the 2011 period. Other debt repayments in the 2011 period were $28,000, with no such payments in the 2012 period. Payments for restricted stock unit settlements were approximately $909,000 and $389,000 in the 2012 and 2011 periods, respectively. In the 2011 period, the Company repurchased 50,060 shares of outstanding common stock for approximately $449,000, with no stock repurchases in the 2012 period. Proceeds from option exercises in 2011 were $48,000, with no such proceeds from exercise in the 2012 period.
Selected Significant Accounting Policies
Management has identified the following accounting policies which it believes are significant in understanding the Company’s activities, financial position and operating results.
Principles of Consolidation
The accompanying consolidated financial statements include the accounts of the Company and its majority-owned and controlled subsidiaries. Investments in entities where the Company does not have a controlling interest are accounted for under the equity method of accounting. These investments were initially recorded at cost and were subsequently adjusted for the Company’s proportionate share of the investment’s income (loss) and additional contributions or distributions. All intercompany accounts and transactions among the Company and its subsidiaries have been eliminated in consolidation.
Discontinued Operations
TheIn April 2011, the Company determined as a resultthat all operational and litigation related activities associated with the prior ownership and development of the April 2011 sale of property in East Lyme, Connecticut, that the Residential Development Activities segment,residential real estate, including certain general and administrative costs that supported that segment’s operations, should be presented as a discontinued operation. As a result of this determination and the fact that the historicthese operations and cash flows can be clearly distinguished, the operating results of the Residential Development Activitiesdiscontinued segment and related general and administrative costs are aggregated for separate presentation apart from continuing operating results of the Company in the consolidated financial statements for all periods presented.
Intangible Assets, Amortization and Impairment
Web SiteWebsite Development Costs
The Company expenses all internet web sitewebsite costs incurred during the preliminary project stage. Thereafter, all direct external and internal development and implementation costs are capitalized and amortized using the straight-line method over their remaining estimated useful lives, not exceeding three years. The value ascribed to the web sitewebsite intangible asset acquired at the time of the Merger was amortized on a straight-line basis over three years, and during 2010, this ascribed value was fully amortized. Amortization of all capitalized web sitewebsite development costs is charged to product development expense.
Database Costs
The Company capitalizes costs for the development of its database in connection with the identification and addition of new real estate properties and sale transactions which provide a future economic benefit. Amortization is calculated on a straight-line basis over a three or five year period. Costs of updating and maintaining information on existing properties in the database are expensed as
incurred. The value ascribed to the database intangible asset acquired at the time of the Merger was amortized on a straight-line basis over three or five years. The ascribed value having a three and five year amortizable life was fully amortized in 2010 and 2012, respectively. Amortization of all capitalized database costs is charged to cost of sales.
Customer Relationships
The value ascribed to customer relationships acquired at the time of the Merger is amortized over 15 years on an accelerated basis and is charged to sales and marketing expense.
Lease Value
The value ascribed to the below market terms of the office lease existing at the time of the Merger is amortized over the remaining term of the acquired office lease which was approximately nine years. Amortization is charged to general and administrative expenses.
Goodwill and Intangible Asset Impairment
Goodwill and a major portion of the other intangible assets were recorded at the time of the Merger. As a result of the tax treatment of the Merger, goodwill and the acquired intangible assets are not deductible for income tax purposes.
Goodwill is not amortized and is tested for impairment at least annually, or after a triggering event has occurred, requiring such a calculation. A qualitative assessment can be utilized to determine if a more detailed two step calculation is required. If the qualitative assessment results in a determination that it is not more likely than not that the fair value of a reporting unit is less than its carrying amount, including goodwill, then no further evaluation would be necessary. If, after performing the qualitative assessment, the Company determined that it is more likely than not that the fair value of a reporting unit is less than its carrying amount, including goodwill, then the first step of the two step test would be necessary. The first step is a comparison of the estimated fair value of the reporting unit to which the goodwill has been assigned with the reporting unit’s carrying value. The fair values used in this evaluation would be estimates based upon market projections for the reporting unit. These market projections would utilize a number of estimates and assumptions, such as earnings before interest, taxes, depreciation and amortization (EBITDA)EBITDA multiples, market comparisons, and quoted market prices. If the fair value of the reporting unit were to exceed its carrying value, goodwill would not be deemed to be impaired. If the fair value of the reporting unit is less than its carrying value, a second step would be required to calculate the implied fair value of goodwill by deducting the fair value of all tangible and intangible net assets of the reporting unit from the fair value of the reporting unit. The Company early adopted the qualitative assessment guidance for goodwill in 2011, which did not impact the consolidated financial statements, other than disclosure, and utilized the qualitative assessment for its 20122014, 2013 and 20132012 evaluations. There was no goodwill impairment identified in 2014, 2013 2012 or 2011.2012.
Intangible assets, with determinable useful lives, are amortized over their respective estimated useful lives using a method of amortization that reflects the pattern in which the economic benefits of the intangible assets are consumed or otherwise used up.used. In addition, the carrying amount of amortizable intangible assets are reviewed when indicators of impairment are present. If estimated future undiscounted net cash flows are less than the carrying amount of the asset, the asset would be considered impaired. An impairment charge would be determined by comparing the estimated fair value of the intangible asset to its carrying value, with any shortfall from fair value recognized as an expense in the current period. There was no intangible asset impairment identified in 2014, 2013 2012 or 2011.2012.
Revenue Recognition and Related Items
The Company’s subscription revenue is derived principally from subscriptions to its web-based services for itsReis SE product and is recognized as revenue ratably over the related contractual period, which is typically one year but can be as long as 48 months. Revenue fromMobiuss in 2014 and 2013 represents the Company’s 50% share of the value of the subscription and is recognized as revenue ratably over the related contractual period consistent with the treatment for theReis SEproduct. Revenues from ad-hoc and custom reports or projects are recognized as completed and delivered to the customers, provided that no significant Company obligations remain. Revenues fromReisReportsare recognized monthly as billed for monthly subscribers, or recognized as revenue ratably over the related contractual period for subscriptions in excess of one month. Revenue fromMobiuss represents the Company’s 50% share of the value of the subscription and is recognized as revenue ratably over the related contractual period. Deferred revenue represents the portion of a subscription billed or collected in advance under the terms of the respective contract, which will be recognized in future periods. If a customer does not meet the payment obligations of a contract, any related accounts receivable and deferred revenue are written off at that time and the net amount, after considering any recovery of accounts receivable, is charged to cost of sales.
Cost of sales of subscription revenue principally consists of salaries and related expenses for the Company’s researchers who collect and analyze the commercial real estate data that is the basis for the Company’s information services. Additionally, cost of sales includes the amortization of the database technology intangible asset.
Interest revenue is recorded on an accrual basis.
Income Taxes
Deferred income tax assets and liabilities are determined based upon differences between the financial reporting basis and the tax basis of assets and liabilities, and are measured using the enacted tax rates and laws that are estimated to be in effect when the differences are expected to reverse. Valuation allowances with respect to deferred income tax assets are recorded when deemed appropriate and adjusted based upon periodic evaluations. In 2013 and 2012, the Company determinedmade determinations that areduced the valuation allowance was no longer requiredin each of those periods (as discussed elsewhere in this Item 7), which hashad a significant positive impact on
income from continuing operations and net income for the yearyears ended December 31, 2013 and 2012. There was no valuation allowance with respect to deferred income taxes at December 31, 2014 and 2013.
The Company evaluates its tax positions in accordance with applicable current accounting literature. Recognition of uncertain tax positions (step one) occurs when an enterprise concludes that a tax position, based solely on its technical merits, is more likely than not to be sustained upon examination. Measurement (step two) determines the amount of benefit that more likely than not will be realized upon settlement. Derecognition of a tax position that was previously recognized would occur when a company subsequently determines that a tax position no longer meets the more likely than not threshold of being sustained or there is a satisfactory resolution of the tax position.
See Note 7 for more information regarding income taxes.
Item 7A. Quantitative and Qualitative Disclosures aboutAbout Market Risk.
The Company’s primary market risk exposure has been to changes in interest rates. This risk may be managed by limiting the Company’s financing exposures, to the extent possible, by purchasing interest rate caps when deemed appropriate.
At December 31, 20132014 and 2012,2013, the Company’s only potential exposure to interest rates was on variable rate based debt. This exposure has historically been minimized through the use of interest rate caps. Throughout 20132014 and 2012,2013, the Company did not have any interest rate caps. No debt was outstanding at December 31, 20132014 and 2012.2013. For more information about the Company’s debt, see Note 6 to the Company’s consolidated financial statements.
Reis holds cash and cash equivalents at various regional and national banking institutions. Management monitors the institutions that hold our cash and cash equivalents. Management’s emphasis is primarily on safety of principal. Management, in its discretion, has diversified Reis’s cash and cash equivalents among banking institutions to potentially minimize exposure to any one of these entities. To date, we have experienced no loss or lack of access to our invested cash or cash equivalents; however, we can provide no assurances that access to invested cash and cash equivalents will not be impacted by adverse conditions in the financial markets.
Cash balances held at banking institutions with which we do business generally exceed the Federal Deposit Insurance Corporation insurance limits. While management monitors the cash balances in these bank accounts, such cash balances could be impacted if the underlying banks fail or could be subject to other adverse conditions in the financial markets.
Item 8. Financial Statements and Supplementary Data.
The response to this Item 8 is included as a separate section of this annual report on Form 10-K starting at page F-1 and is incorporated by reference herein.
Item 9. Changes in and Disagreements With Accountants on Accounting and Financial Disclosure.
None.
Item 9A. Controls and Procedures.
Evaluation of Disclosure Controls and Procedures
As of December 31, 2013,2014, the Company carried out an evaluation, under the supervision and with the participation of our management, including our Chief Executive Officer and Chief Financial Officer, of the effectiveness of our disclosure controls and procedures (as defined in Rule 13a-15(e) or Rule 15d-15(e) under the Securities Exchange Act of 1934, as amended (the “Exchange Act”)). Based on this evaluation, our Chief Executive Officer and Chief Financial Officer have concluded that our disclosure controls and procedures as of December 31, 20132014 were designed at a reasonable assurance level and were effective to ensure that information required to be disclosed by the Company in the reports that the Company files or submits under the Exchange Act is recorded, processed, summarized and reported within the time periods specified in the SEC rules and forms, and to ensure that such information is accumulated and communicated to the Company’s management, including the Chief Executive Officer and Chief Financial Officer, as appropriate, to allow timely decisions regarding required disclosure.
Changes in Internal Control Over Financial Reporting
We regularly review our system of internal control over financial reporting and make changes to our processes and systems to improve controls and increase efficiency, while ensuring that we maintain an effective internal control environment. There were no changes in our internal control over financial reporting that have materially affected, or are reasonably likely to materially affect, our internal control over financial reporting during the fourth quarter of 2013.2014.
Management’s Report on Internal Control Over Financial Reporting
Management of the Company is responsible for establishing and maintaining adequate internal control over financial reporting and for the assessment of the effectiveness of internal control over financial reporting. Internal control over financial reporting is defined in Rules 13a-15(f) and 15d-15(f) under the Exchange Act as a process designed by, or under the supervision of, the Company’s principal executive and principal financial officers and effected by the Company’s Board of Directors, management and other personnel to provide reasonable assurance regarding the reliability of financial reporting and the preparation of financial statements for external purposes in accordance with U.S. generally accepted accounting principles. The Company’s internal control system was designed to provide reasonable assurance to our management and Board of Directors regarding the preparation and fair presentation of published financial statements.
All internal control systems, no matter how well designed, have inherent limitations. Therefore, even those systems determined to be effective can provide only reasonable assurance with respect to financial statement preparation and presentation.
The Company’s management assessed the effectiveness of the Company’s internal control over financial reporting as of December 31, 2013.2014. In making this assessment, management used the criteria set forth by the Committee of Sponsoring Organizations of the Treadway Commission in “Internal Control - Integrated Framework” (1992(2013 Framework). Based upon this assessment, management concluded that, as of December 31, 2013,2014, our internal control over financial reporting is effective in accordance with those criteria.
The effectiveness of our internal control over financial reporting as of December 31, 20132014 has been audited by Ernst & Young LLP, an independent registered public accounting firm, as stated in their report which is included on page F-3 herein.
None.
PART III
Item 10. Directors, Executive Officers and Corporate Governance.
The executive officers and directors of the Company, their ages and their positions are as follows:
Name | Age | Positions and Offices Held | ||
| M. Christian Mitchell | Chairman of the Board and Director** | |||
Lloyd Lynford | Chief Executive Officer, President and Director*** | |||
Jonathan Garfield | Executive Vice President and Director* | |||
Mark | Vice President, Chief Financial Officer | |||
William Sander | Chief Operating Officer and President, Reis Services | |||
Thomas J. Clarke Jr. | ||||
| Director** | |||
| 51 | Director* |
* Term expires during 2015. | ||||
** | Term expires during 2016. | ||||
*** Term expires during 2017. | |||||
To the extent responsive to the requirements of this item, information contained in the Company’s definitive proxy statement for the 20142015 annual meeting of stockholders is incorporated herein by reference.
Item 11. Executive Compensation.
To the extent responsive to the requirements of this item, information contained in the Company’s definitive proxy statement for the 20142015 annual meeting of stockholders is incorporated herein by reference.
Item 12. Security Ownership of Certain Beneficial Owners and Management and Related Stockholder Matters.
To the extent responsive to the requirements of this item, information contained in the Company’s definitive proxy statement for the 20142015 annual meeting of stockholders is incorporated herein by reference.
Item 13. Certain Relationships and Related Transactions, and Director Independence.
To the extent responsive to the requirements of this item, information contained in the Company’s definitive proxy statement for the 20142015 annual meeting of stockholders is incorporated herein by reference.
Item 14. Principal Accountant Fees and Services.
To the extent responsive to the requirements of this item, information contained in the Company’s definitive proxy statement for the 20142015 annual meeting of stockholders is incorporated herein by reference.
PART IV
Item 15. Exhibits and Financial Statement Schedules.
(a) (1) Financial Statements
Consolidated Balance Sheets at December 31, 2014 and 2013 Consolidated Statements of Operations for the Years Ended December 31, 2014, 2013 and 2012 Consolidated Statements of Changes in Stockholders’ Equity for the Years Ended December 31, 2014, 2013 and 2012 Consolidated Statements of Cash Flows for the Years Ended December 31, 2014, 2013 and 2012 |
|
|
|
Notes to Consolidated Financial Statements |
(a) (2) Financial Statement Schedules
All schedules have been omitted because the required information for such schedules is not present, is not present in amounts sufficient to require submission of the schedule or because the required information is included in the consolidated financial statements.
(a) (3) Exhibits
Exhibit No. | Description | |
| 3.1 | Articles of Amendment and Restatement filed on May 30, 1997 (incorporated by reference to Exhibit 3.1 to the Company’s Registration Statement on Form S-11 (File No. 333-32445) filed on July 30, 1997). | |
| 3.2 | Articles Supplementary (incorporated by reference to Exhibit 3.1 to the Company’s Current Report onForm 8-K (File No. 1-12917) filed on December 21, 2006). | |
| 3.3 | Articles of Amendment (incorporated by reference to Exhibit 3.1 to the Company’s Current Report onForm 8-K (File No. 1-12917) filed on June 4, 2007). | |
| 3.4 | Articles Supplementary (incorporated by reference to Exhibit 3.2 to the Company’s Current Report onForm 8-K (File No. 1-12917) filed on June 30, 2008). | |
| 3.5 | Amended and Restated Bylaws (incorporated by reference to Exhibit 3.1 to the Company’s Current Report on Form 8-K (File No. 1-12917) filed on June 30, 2008). | |
| 4.1 | The rights of the Company’s equity security holders are defined in Articles V and VI of Exhibit 3.1 above. | |
| 4.2 | Specimen certificate for common stock (incorporated by reference to Exhibit 4.1 to the Company’s Registration Statement on Form 8-A (File No. 1-12917) filed on November 29, 2007). | |
| 4.3 | Registration Rights Agreement dated as of May 30, 2007 among Wellsford, Lloyd Lynford and Jonathan Garfield (incorporated by reference to Exhibit 3 to the Schedule 13D (File No. 005-51221) filed by Jonathan Garfield with respect to the Company on June 8, 2007). | |
| 10.1 | Loan and Security Agreement, dated as of October 16, 2012, by and among Reis Services, LLC, as Borrower, Reis, Inc., as Guarantor, and Capital One, National Association, as Lender (incorporated by reference to Exhibit 10.1 to the Company’s Current Report on Form 8-K (File No. 1-12917) filed on October 18, 2012). | |
| 10.2 | Trademark Collateral Security Agreement, dated as of October 16, 2012, by and between Reis Services, LLC, as Borrower, and Capital One, National Association, as Lender (incorporated by reference to Exhibit 10.2 to the Company’s Current Report on Form 8-K (File No. 1-12917) filed on October 18, 2012). | |
| 10.3 | Pledge Agreement, dated as of October 16, 2012, between Capital One, National Association, as Pledgee, and Reis, Inc., as Pledgor (incorporated by reference to Exhibit 10.3 to the Company’s Current Report onForm 8-K (File No. 1-12917) filed on October 18, 2012). | |
| 10.4 | Trademark Assignment of Security, dated as of October 16, 2012, between Reis Services, LLC, as Borrower, and Capital One, National Association, as Lender (incorporated by reference to Exhibit 10.4 to the Company’s Quarterly Report on Form 10-Q for the quarter ended September 30, 2012 (File No. 1-12917), filed on November 8, 2012). | |
| 10.5 | Amended and Restated Wellsford Real Properties, Inc. 1998 Management Incentive Plan (incorporated by reference to Exhibit 10.2 to the Company’s Annual Report on Form 10-K for the year ended December 31, 2006 (File No. 1-12917)).* | |
| 10.6 | Amendment to Amended and Restated Wellsford Real Properties, Inc. 1998 Management Incentive Plan
| |
| 10.7 | Reis, Inc. 2008 Omnibus Incentive Plan (incorporated by reference to Annex A to the Company’s proxy statement filed on April 25, 2008).* | |
| 10.8 | Amended and Restated Reis, Inc. 2011 Omnibus Incentive Compensation Plan (incorporated by reference to Annex A to the Company’s proxy statement (File No. 1-12917) filed on April 28, 2011).* |
| 10.9 | Reis, Inc. 2013 Annual Incentive Compensation Plan (incorporated by reference to Annex A to the Company’s proxy statement on Schedule 14A (File No. 1-12917) filed on April 24, 2013).* |
| 10.10 | Employment Agreement effective July 1, 2013, among Reis, Inc., Reis Services, LLC and Lloyd Lynford (incorporated by reference to Exhibit 10.1 to the Company’s Current Report on Form 8-K (File No. 1-12917) filed on June 17, 2013).* | |
| 10.11 | Indemnification Agreement effective July 1, 2013, among Reis, Inc., Reis Services, LLC and Lloyd Lynford (incorporated by reference to Exhibit 10.2 to the Company’s Current Report on Form 8-K (File No. 1-12917) filed on June 17, 2013).* | |
| 10.12 | Employment Agreement effective July 1, 2013, among Reis, Inc., Reis Services, LLC and Jonathan Garfield (incorporated by reference to Exhibit 10.3 to the Company’s Current Report on Form 8-K (File No. 1-12917) filed on June 17, 2013).* | |
| 10.13 | Indemnification Agreement effective July 1, 2013, among Reis, Inc., Reis Services, LLC and Jonathan Garfield (incorporated by reference to Exhibit 10.4 to the Company’s Current Report on Form 8-K (File No. 1-12917) filed on June 17, 2013). * | |
| 10.14 | Employment Agreement effective July 1, 2013, between Reis Services, LLC and William Sander (with Reis, Inc. a party thereto for limited purposes) (incorporated by reference to Exhibit 10.5 to the Company’s Current Report on Form 8-K (File No. 1-12917) filed on June 17, 2013).* | |
| 10.15 | Employment Agreement effective July 1, 2013, among Reis, Inc., Reis Services, LLC and Mark P. Cantaluppi (incorporated by reference to Exhibit 10.6 to the Company’s Current Report on Form 8-K (File No. 1-12917) filed on June 17, 2013).* | |
| 10.16 | Form of Employee Restricted Stock Unit Agreement Under Amended and Restated Reis, Inc. 2011 Omnibus Incentive Plan (incorporated by reference to Exhibit 10.2 to the Company’s Form 10-Q for the quarter ended June 30, 2011 (File No. 1-12917), filed on August 4, | |
| 10.17 | Form of Director Restricted Stock Unit Agreement Under Amended and Restated Reis, Inc. 2011 Omnibus Incentive Plan (incorporated by reference to Exhibit 10.11 to the Company’s Annual Report on Form 10-K for the year ended December 31, 2011 (File No. 1-12917)).* | |
| 14.1 | Reis, Inc. Code of Business Conduct and Ethics for Directors, Senior Financial Officers, Other Officers and All Other Employees (incorporated by reference to Exhibit 14.1 to the Company’s Annual Report on Form 10-K for the year ended December 31, 2007 (File No. 1-12917)). | |
| 21.1 | Subsidiaries of the Registrant. | |
| 23.1 | Consent of Ernst & Young LLP. | |
| 31.1 | Chief Executive Officer Certification pursuant to Section 302 of the Sarbanes-Oxley Act of 2002. | |
| 31.2 | Chief Financial Officer Certification pursuant to Section 302 of the Sarbanes-Oxley Act of 2002. | |
| 32.1 | Chief Executive Officer and Chief Financial Officer Certifications pursuant to Section 906 of the Sarbanes-Oxley Act of 2002. | |
| 101 | Interactive Data Files, formatted in extensible Business Reporting Language (XBRL). |
| * | This document is either a management contract or compensatory plan. | |
| (b) | Those exhibits listed in Item 15(a)(3) above and not indicated as “incorporated by reference” are filed as exhibits to thisForm 10-K. |
| (c) | Not applicable. |
Pursuant to the requirements of Section 13 or 15(d) of the Securities Exchange Act of 1934, the Registrant has duly caused this report to be signed on its behalf by the undersigned, thereunto duly authorized.
| REIS, INC. | ||
| By: | /s/ Mark P. Cantaluppi | |
Mark P. Cantaluppi | ||
| Vice President, Chief Financial Officer | ||
Dated: March 6, 20145, 2015
Pursuant to the requirements of the Securities Exchange Act of 1934, this report has been signed below by the following persons on behalf of the Registrant and in the capacities and on the dates indicated.
Name | Title | Date | ||
/s/ Lloyd Lynford
| Chief Executive Officer, President and Director | March 5, 2015 | ||
| Lloyd Lynford | (Principal Executive Officer) | |||
/s/ Mark P. Cantaluppi
| Vice President, Chief Financial Officer | March 5, 2015 | ||
| Mark P. Cantaluppi | (Principal Financial and Accounting Officer) | |||
/s/ M. Christian Mitchell
| Chairman of the Board and Director | March | ||
| M. Christian Mitchell | ||||
/s/ Thomas J. Clarke Jr.
| Director | March | ||
| Thomas J. Clarke Jr. | ||||
/s/ Jonathan Garfield
| Director | March | ||
| Jonathan Garfield | ||||
/s/ Byron C. Vielehr
| Director | March | ||
| Byron C. Vielehr | ||||
REIS, INC. AND SUBSIDIARIES
INDEX TO CONSOLIDATED FINANCIAL STATEMENTS
FINANCIAL STATEMENT SCHEDULES
All schedules have been omitted because the required information for such schedules is not present, is not present in amounts sufficient to require submission of the schedule or because the required information is included in the consolidated financial statements.
REPORT OF INDEPENDENT REGISTERED PUBLIC ACCOUNTING FIRM
The Board of Directors and Stockholders of Reis, Inc. and Subsidiaries
We have audited the accompanying consolidated balance sheets of Reis, Inc. and Subsidiaries (the “Company”) as of December 31, 20132014 and 2012,2013, and the related consolidated statements of operations, changes in stockholders’ equity, and cash flows for the three years in the period ended December 31, 2013.2014. These financial statements are the responsibility of the Company’s management. Our responsibility is to express an opinion on these financial statements based on our audits.
We conducted our audits in accordance with the standards of the Public Company Accounting Oversight Board (United States). Those standards require that we plan and perform the audit to obtain reasonable assurance about whether the financial statements are free of material misstatement. An audit includes examining, on a test basis, evidence supporting the amounts and disclosures in the financial statements. An audit also includes assessing the accounting principles used and significant estimates made by management, as well as evaluating the overall financial statement presentation. We believe that our audits provide a reasonable basis for our opinion.
In our opinion, the financial statements referred to above present fairly, in all material respects, the consolidated financial position of the Company at December 31, 20132014 and 2012,2013, and the consolidated results of its operations and its cash flows for the three years in the period ended December 31, 2013,2014, in conformity with U.S. generally accepted accounting principles.
We also have audited, in accordance with the standards of the Public Company Accounting Oversight Board (United States), the Company’s internal control over financial reporting as of December 31, 2013,2014, based on criteria established in Internal Control —IntegratedControl—Integrated Framework issued by the Committee of Sponsoring Organizations of the Treadway Commission (1992(2013 Framework) and our report dated March 6, 20145, 2015 expressed an unqualified opinion thereon.
/s/ Ernst & Young LLP
Chicago, Illinois
March 6, 20145, 2015
REPORT OF INDEPENDENT REGISTERED PUBLIC ACCOUNTING FIRM
The Board of Directors and Stockholders of Reis, Inc. and Subsidiaries
We have audited Reis, Inc. and Subsidiaries’ (the “Company”) internal control over financial reporting as of December 31, 2013,2014, based on criteria established in Internal Control—Integrated Framework issued by the Committee of Sponsoring Organizations of the Treadway Commission (1992(2013 Framework) (the COSO criteria). The Company’s management is responsible for maintaining effective internal control over financial reporting, and for its assessment of the effectiveness of internal control over financial reporting included in the accompanying Management’s Assessment of Internal Control over Financial Reporting. Our responsibility is to express an opinion on the Company’s internal control over financial reporting based on our audit.
We conducted our audit in accordance with the standards of the Public Company Accounting Oversight Board (United States). Those standards require that we plan and perform the audit to obtain reasonable assurance about whether effective internal control over financial reporting was maintained in all material respects. Our audit included obtaining an understanding of internal control over financial reporting, assessing the risk that a material weakness exists, testing and evaluating the design and operating effectiveness of internal control based on the assessed risk, and performing such other procedures as we considered necessary in the circumstances. We believe that our audit provides a reasonable basis for our opinion.
A company’s internal control over financial reporting is a process designed to provide reasonable assurance regarding the reliability of financial reporting and the preparation of financial statements for external purposes in accordance with generally accepted accounting principles. A company’s internal control over financial reporting includes those policies and procedures that (1) pertain to the maintenance of records that, in reasonable detail, accurately and fairly reflect the transactions and dispositions of the assets of the company; (2) provide reasonable assurance that transactions are recorded as necessary to permit preparation of financial statements in accordance with generally accepted accounting principles, and that receipts and expenditures of the company are being made only in accordance with authorizations of management and directors of the company; and (3) provide reasonable assurance regarding prevention or timely detection of unauthorized acquisition, use or disposition of the company’s assets that could have a material effect on the financial statements.
Because of its inherent limitations, internal control over financial reporting may not prevent or detect misstatements. Also, projections of any evaluation of effectiveness to future periods are subject to the risk that controls may become inadequate because of changes in conditions, or that the degree of compliance with the policies or procedures may deteriorate.
In our opinion, the Company maintained, in all material respects, effective internal control over financial reporting as of December 31, 2013,2014, based on the COSO criteria.
We also have audited, in accordance with the standards of the Public Company Accounting Oversight Board (United States), the consolidated balance sheets of the Company as of December 31, 20132014 and 20122013 and the related consolidated statements of operations, changes in stockholders’ equity, and cash flows for each of the three years in the period ended December 31, 2013,2014, and our report dated March 6, 20145, 2015 expressed an unqualified opinion thereon.
/s/ Ernst & Young LLP
Chicago, Illinois
March 6, 20145, 2015
| December 31, | December 31, | |||||||||||||||
| 2013 | 2012 | 2014 | 2013 | |||||||||||||
ASSETS | ||||||||||||||||
Current assets: | ||||||||||||||||
Cash and cash equivalents | $ | 10,559,899 | $ | 4,960,850 | $ | 17,745,077 | $ | 10,559,899 | ||||||||
Restricted cash and investments | 216,702 | 216,125 | 212,625 | 216,702 | ||||||||||||
Accounts receivable, net | 11,386,584 | 10,694,201 | 12,627,063 | 11,386,584 | ||||||||||||
Prepaid and other assets | 2,787,909 | 1,438,829 | 4,164,320 | 2,787,909 | ||||||||||||
Assets attributable to discontinued operations | 8,500 | — | 3,500 | 8,500 | ||||||||||||
|
|
|
| |||||||||||||
Total current assets | 24,959,594 | 17,310,005 | 34,752,585 | 24,959,594 | ||||||||||||
Furniture, fixtures and equipment, net of accumulated depreciation of $1,905,933 and $1,828,199, respectively | 853,377 | 738,490 | ||||||||||||||
Intangible assets, net of accumulated amortization of $28,764,189 and $24,067,250, respectively | 15,687,117 | 16,332,596 | ||||||||||||||
Deferred tax asset, net | 21,316,520 | 8,557,420 | ||||||||||||||
Furniture, fixtures and equipment, net of accumulated depreciation of $2,158,647 and $1,905,933, respectively | 850,866 | 853,377 | ||||||||||||||
Intangible assets, net of accumulated amortization of $33,589,746 and $28,764,189, respectively | 14,681,410 | 15,687,117 | ||||||||||||||
Deferred tax asset, non-current portion, net | 18,638,737 | 21,316,520 | ||||||||||||||
Goodwill | 54,824,648 | 54,824,648 | 54,824,648 | 54,824,648 | ||||||||||||
Other assets | 225,528 | 271,257 | 139,797 | 225,528 | ||||||||||||
|
|
|
| |||||||||||||
Total assets | $ | 117,866,784 | $ | 98,034,416 | $ | 123,888,043 | $ | 117,866,784 | ||||||||
|
| |||||||||||||||
|
| |||||||||||||||
LIABILITIES AND STOCKHOLDERS’ EQUITY | ||||||||||||||||
Current liabilities: | ||||||||||||||||
Current portion of debt | $ | — | $ | — | $ | — | $ | — | ||||||||
Accrued expenses and other liabilities | 3,578,227 | 3,902,206 | 4,170,687 | 3,578,227 | ||||||||||||
Liability for option cancellations | 268,341 | 296,523 | — | 268,341 | ||||||||||||
Deferred revenue | 20,284,178 | 18,230,332 | 22,885,287 | 20,284,178 | ||||||||||||
Liabilities attributable to discontinued operations | 342,138 | 460,251 | 299,025 | 342,138 | ||||||||||||
|
|
|
| |||||||||||||
Total current liabilities | 24,472,884 | 22,889,312 | 27,354,999 | 24,472,884 | ||||||||||||
Other long-term liabilities | 522,941 | 588,484 | 419,638 | 522,941 | ||||||||||||
|
|
|
| |||||||||||||
Total liabilities | 24,995,825 | 23,477,796 | 27,774,637 | 24,995,825 | ||||||||||||
|
|
|
| |||||||||||||
Commitments and contingencies | ||||||||||||||||
Stockholders’ equity: | ||||||||||||||||
Common stock, $0.02 par value per share, 101,000,000 shares authorized, 10,916,441 and 10,782,643 shares issued and outstanding, respectively | 218,328 | 215,652 | ||||||||||||||
Common stock, $0.02 par value per share, 101,000,000 shares authorized, 11,156,571 and 10,916,441 shares issued and outstanding, respectively | 223,131 | 218,328 | ||||||||||||||
Additional paid in capital | 102,717,693 | 102,002,972 | 105,605,803 | 102,717,693 | ||||||||||||
Retained earnings (deficit) | (10,065,062 | ) | (27,662,004 | ) | (9,715,528) | (10,065,062) | ||||||||||
|
|
|
| |||||||||||||
Total stockholders’ equity | 92,870,959 | 74,556,620 | 96,113,406 | 92,870,959 | ||||||||||||
|
|
|
| |||||||||||||
Total liabilities and stockholders’ equity | $ | 117,866,784 | $ | 98,034,416 | $ | 123,888,043 | $ | 117,866,784 | ||||||||
|
|
|
| |||||||||||||
See Notes to Consolidated Financial Statements
CONSOLIDATED STATEMENTS OF OPERATIONS
| For the Years Ended December 31, | ||||||||||||||||||||||||
| For the Years Ended December 31, | 2014 | 2013 | 2012 | |||||||||||||||||||||
| 2013 | 2012 | 2011 | ||||||||||||||||||||||
Subscription revenue | $ | 34,721,088 | $ | 31,228,644 | $ | 27,180,479 | $ | 41,335,155 | $ | 34,721,088 | $ | 31,228,644 | ||||||||||||
Cost of sales of subscription revenue | 6,973,772 | 6,616,931 | 6,304,597 | 8,037,019 | 6,973,772 | 6,616,931 | ||||||||||||||||||
|
|
|
|
|
| |||||||||||||||||||
Gross profit | 27,747,316 | 24,611,713 | 20,875,882 | 33,298,136 | 27,747,316 | 24,611,713 | ||||||||||||||||||
|
|
|
|
|
| |||||||||||||||||||
Operating expenses: | ||||||||||||||||||||||||
Sales and marketing | 8,349,544 | 7,643,303 | 6,704,106 | 10,235,349 | 8,349,544 | 7,643,303 | ||||||||||||||||||
Product development | 3,121,729 | 2,485,168 | 2,093,303 | 3,472,875 | 3,121,729 | 2,485,168 | ||||||||||||||||||
General and administrative expenses | 11,909,462 | 11,793,441 | 11,095,425 | 12,040,343 | 11,909,462 | 11,793,441 | ||||||||||||||||||
|
|
|
|
|
| |||||||||||||||||||
Total operating expenses | 23,380,735 | 21,921,912 | 19,892,834 | 25,748,567 | 23,380,735 | 21,921,912 | ||||||||||||||||||
|
|
|
|
|
| |||||||||||||||||||
Other income (expenses): | ||||||||||||||||||||||||
Interest and other income | 9,981 | 51,972 | 77,515 | 22,016 | 9,981 | 51,972 | ||||||||||||||||||
Interest expense | (113,200 | ) | (155,443 | ) | (274,178 | ) | (113,200) | (113,200) | (155,443) | |||||||||||||||
|
|
|
|
|
| |||||||||||||||||||
Total other income (expenses) | (103,219 | ) | (103,471 | ) | (196,663 | ) | (91,184) | (103,219) | (103,471) | |||||||||||||||
|
|
|
|
|
| |||||||||||||||||||
Income before income taxes and discontinued operations | 4,263,362 | 2,586,330 | 786,385 | 7,458,385 | 4,263,362 | 2,586,330 | ||||||||||||||||||
Income tax (benefit) | (13,670,069 | ) | (5,427,000 | ) | (4,075,000 | ) | ||||||||||||||||||
Income tax expense (benefit) | 2,842,000 | (13,670,069) | (5,427,000) | |||||||||||||||||||||
|
|
|
|
|
| |||||||||||||||||||
Income from continuing operations | 17,933,431 | 8,013,330 | 4,861,385 | 4,616,385 | 17,933,431 | 8,013,330 | ||||||||||||||||||
(Loss) from discontinued operations, net of income tax benefit of $(230,000), $— and $—, respectively | (336,489 | ) | (12,296,912 | ) | (2,974,958 | ) | ||||||||||||||||||
(Loss) from discontinued operations, net of income tax benefit of $(382,000), $(230,000) and $—, respectively | (569,263) | (336,489) | (12,296,912) | |||||||||||||||||||||
|
|
|
|
|
| |||||||||||||||||||
Net income (loss) | $ | 17,596,942 | $ | (4,283,582 | ) | $ | 1,886,427 | $ | 4,047,122 | $ | 17,596,942 | $ | (4,283,582) | |||||||||||
|
|
| ||||||||||||||||||||||
|
|
| ||||||||||||||||||||||
Per share amounts – basic: | ||||||||||||||||||||||||
Income from continuing operations | $ | 1.65 | $ | 0.75 | $ | 0.46 | $ | 0.42 | $ | 1.65 | $ | 0.75 | ||||||||||||
|
|
|
|
|
| |||||||||||||||||||
Net income (loss) | $ | 1.62 | $ | (0.40 | ) | $ | 0.18 | $ | 0.37 | $ | 1.62 | $ | (0.40) | |||||||||||
|
|
|
|
|
| |||||||||||||||||||
Per share amounts – diluted: | ||||||||||||||||||||||||
Income from continuing operations | $ | 1.57 | $ | 0.73 | $ | 0.45 | $ | 0.39 | $ | 1.57 | $ | 0.73 | ||||||||||||
|
|
|
|
|
| |||||||||||||||||||
Net income (loss) | $ | 1.54 | $ | (0.39 | ) | $ | 0.17 | $ | 0.34 | $ | 1.54 | $ | (0.39) | |||||||||||
|
|
| ||||||||||||||||||||||
|
|
| ||||||||||||||||||||||
Weighted average number of common shares outstanding: | ||||||||||||||||||||||||
Basic | 10,884,533 | 10,685,333 | 10,569,805 | 11,086,690 | 10,884,533 | 10,685,333 | ||||||||||||||||||
|
|
|
|
|
| |||||||||||||||||||
Diluted | 11,396,559 | 11,034,082 | 10,876,876 | 11,593,079 | 11,396,559 | 11,034,082 | ||||||||||||||||||
|
|
|
|
|
| |||||||||||||||||||
Dividends declared per common share | $ | 0.33 | $ | — | $ | — | ||||||||||||||||||
|
|
| ||||||||||||||||||||||
See Notes to Consolidated Financial Statements
CONSOLIDATED STATEMENTS OF CHANGES IN STOCKHOLDERS’ EQUITY
FOR THE YEARS ENDED DECEMBER 31, 2014, 2013 2012 AND 20112012
| Retained | Total | Retained Earnings (Deficit) | Total Stockholders’ Equity | |||||||||||||||||||||||||||||||||||||
| Common Shares | Paid in | Earnings | Stockholders’ | Common Shares | Paid in Capital | |||||||||||||||||||||||||||||||||||
| Shares | Amount | Capital | (Deficit) | Equity | Shares | Amount | ||||||||||||||||||||||||||||||||||
Balance, January 1, 2011 | 10,472,010 | $ | 209,440 | $ | 99,347,837 | $ | (25,264,849 | ) | $ | 74,292,428 | ||||||||||||||||||||||||||||||
Balance, January 1, 2012 | 10,570,891 | $ | 211,417 | $ | 100,677,336 | $ | (23,378,422) | $ | 77,510,331 | |||||||||||||||||||||||||||||||
Shares issued for vested employees restricted stock units | 133,809 | 2,676 | (2,676 | ) | — | — | 133,518 | 2,671 | (2,671) | — | — | |||||||||||||||||||||||||||||
Shares issued for settlement of vested director restricted stock units | 6,270 | 125 | (125 | ) | — | — | 72,410 | 1,448 | (1,448) | — | — | |||||||||||||||||||||||||||||
Option exercises | 8,862 | 177 | 47,943 | — | 48,120 | |||||||||||||||||||||||||||||||||||
Stock based compensation, net | — | — | 1,731,877 | — | 1,731,877 | |||||||||||||||||||||||||||||||||||
Stock repurchases | (50,060 | ) | (1,001 | ) | (447,520 | ) | — | (448,521 | ) | |||||||||||||||||||||||||||||||
Net income | — | — | — | 1,886,427 | 1,886,427 | |||||||||||||||||||||||||||||||||||
|
|
|
|
| ||||||||||||||||||||||||||||||||||||
Balance, December 31, 2011 | 10,570,891 | 211,417 | 100,677,336 | (23,378,422 | ) | 77,510,331 | ||||||||||||||||||||||||||||||||||
Shares issued for vested employees restricted stock units | 133,518 | 2,671 | (2,671 | ) | — | — | ||||||||||||||||||||||||||||||||||
Shares issued for settlement of vested director restricted stock units | 72,410 | 1,448 | (1,448 | ) | — | — | ||||||||||||||||||||||||||||||||||
Option exercises | 5,824 | 116 | (116 | ) | — | — | ||||||||||||||||||||||||||||||||||
Shares issued for option exercises | 5,824 | 116 | (116) | — | — | |||||||||||||||||||||||||||||||||||
Stock based compensation, net | — | — | 1,329,871 | — | 1,329,871 | — | — | 1,329,871 | — | 1,329,871 | ||||||||||||||||||||||||||||||
Net (loss) | — | — | — | (4,283,582 | ) | (4,283,582 | ) | — | — | — | (4,283,582) | (4,283,582) | ||||||||||||||||||||||||||||
|
|
|
|
|
|
|
|
|
| |||||||||||||||||||||||||||||||
Balance, December 31, 2012 | 10,782,643 | 215,652 | 102,002,972 | (27,662,004 | ) | 74,556,620 | 10,782,643 | 215,652 | 102,002,972 | (27,662,004) | 74,556,620 | |||||||||||||||||||||||||||||
Shares issued for vested employee restricted stock units | 124,936 | 2,499 | (2,499 | ) | — | — | 124,936 | 2,499 | (2,499) | — | — | |||||||||||||||||||||||||||||
Option exercises | 8,862 | 177 | 46,260 | — | 46,437 | |||||||||||||||||||||||||||||||||||
Shares issued for option exercises | 8,862 | 177 | 46,260 | — | 46,437 | |||||||||||||||||||||||||||||||||||
Stock based compensation, net | — | — | 670,960 | — | 670,960 | — | — | 670,960 | — | 670,960 | ||||||||||||||||||||||||||||||
Net income | — | — | — | 17,596,942 | 17,596,942 | — | — | — | 17,596,942 | 17,596,942 | ||||||||||||||||||||||||||||||
|
|
|
|
|
|
|
|
|
| |||||||||||||||||||||||||||||||
Balance, December 31, 2013 | 10,916,441 | $ | 218,328 | $ | 102,717,693 | $ | (10,065,062 | ) | $ | 92,870,959 | 10,916,441 | 218,328 | 102,717,693 | (10,065,062) | 92,870,959 | |||||||||||||||||||||||||
|
|
|
|
| ||||||||||||||||||||||||||||||||||||
Shares issued for vested employees restricted stock units | 144,660 | 2,894 | (2,894) | — | — | |||||||||||||||||||||||||||||||||||
Shares issued for settlement of vested director restricted stock units | 40,564 | 811 | (811) | — | — | |||||||||||||||||||||||||||||||||||
Shares issued for option exercises | 54,906 | 1,098 | 427,652 | — | 428,750 | |||||||||||||||||||||||||||||||||||
Stock based compensation, net | — | — | 2,464,163 | — | 2,464,163 | |||||||||||||||||||||||||||||||||||
Dividends | — | — | — | (3,697,588) | (3,697,588) | |||||||||||||||||||||||||||||||||||
Net income | — | — | — | 4,047,122 | 4,047,122 | |||||||||||||||||||||||||||||||||||
|
|
|
|
| ||||||||||||||||||||||||||||||||||||
Balance, December 31, 2014 | 11,156,571 | $ | 223,131 | $ | 105,605,803 | $ | (9,715,528) | $ | 96,113,406 | |||||||||||||||||||||||||||||||
|
|
|
|
| ||||||||||||||||||||||||||||||||||||
See Notes to Consolidated Financial Statements
CONSOLIDATED STATEMENTS OF CASH FLOWS
| For the Years Ended December 31, | For the Years Ended December 31, | |||||||||||||||||||||||
| 2013 | 2012 | 2011 | 2014 | 2013 | 2012 | |||||||||||||||||||
CASH FLOWS FROM OPERATING ACTIVITIES: | ||||||||||||||||||||||||
Net income (loss) | $ | 17,596,942 | $ | (4,283,582 | ) | $ | 1,886,427 | $ | 4,047,122 | $ | 17,596,942 | $ | (4,283,582) | |||||||||||
Adjustments to reconcile to net cash provided by (used in) operating activities: | ||||||||||||||||||||||||
Deferred tax (benefit), net | (13,900,069 | ) | (5,427,000 | ) | (4,075,000 | ) | ||||||||||||||||||
Deferred tax provision (benefit) | 2,113,783 | (13,900,069) | (5,427,000) | |||||||||||||||||||||
Depreciation | 332,576 | 354,953 | 351,595 | 382,829 | 332,576 | 354,953 | ||||||||||||||||||
Amortization of intangible assets | 4,696,939 | 4,629,394 | 4,788,174 | 4,828,452 | 4,696,939 | 4,629,394 | ||||||||||||||||||
Stock based compensation charges | 1,859,336 | 2,181,135 | 2,083,497 | 1,702,163 | 1,859,336 | 2,181,135 | ||||||||||||||||||
Changes in assets and liabilities: | ||||||||||||||||||||||||
Restricted cash and investments | (577 | ) | (720 | ) | 790,078 | 4,077 | (577) | (720) | ||||||||||||||||
Accounts receivable, net | (692,383 | ) | (2,096,737 | ) | 364,159 | (1,240,479) | (692,383) | (2,096,737) | ||||||||||||||||
Prepaid and other assets | 95,149 | 2,755,777 | (2,500,801 | ) | 40,320 | 95,149 | 2,755,777 | |||||||||||||||||
Real estate assets | — | — | 1,297,245 | |||||||||||||||||||||
Accrued expenses and other liabilities | (681,666 | ) | (7,305,528 | ) | 6,594,351 | 446,044 | (681,666) | (7,305,528) | ||||||||||||||||
Liability for option cancellations | 81,707 | 113,965 | 120,612 | (136,563) | 81,707 | 113,965 | ||||||||||||||||||
Deferred revenue | 2,053,846 | 2,523,481 | 260,603 | 2,601,109 | 2,053,846 | 2,523,481 | ||||||||||||||||||
|
|
|
|
|
| |||||||||||||||||||
Net cash provided by (used in) operating activities | 11,441,800 | (6,554,862 | ) | 11,960,940 | 14,788,857 | 11,441,800 | (6,554,862) | |||||||||||||||||
|
|
|
|
|
| |||||||||||||||||||
CASH FLOWS FROM INVESTING ACTIVITIES: | ||||||||||||||||||||||||
Web site and database development costs | (4,051,460 | ) | (3,806,795 | ) | (3,366,763 | ) | ||||||||||||||||||
Website and database development costs | (3,822,745) | (4,051,460) | (3,806,795) | |||||||||||||||||||||
Furniture, fixtures and equipment additions | (447,463 | ) | (230,134 | ) | (256,399 | ) | (380,318) | (447,463) | (230,134) | |||||||||||||||
|
|
|
|
|
| |||||||||||||||||||
Net cash (used in) investing activities | (4,498,923 | ) | (4,036,929 | ) | (3,623,162 | ) | ||||||||||||||||||
Cash (used in) investing activities | (4,203,063) | (4,498,923) | (4,036,929) | |||||||||||||||||||||
|
|
| ||||||||||||||||||||||
|
|
| ||||||||||||||||||||||
CASH FLOWS FROM FINANCING ACTIVITIES: | ||||||||||||||||||||||||
Repayment of debt | — | (5,690,940 | ) | (5,531,050 | ) | — | — | (5,690,940) | ||||||||||||||||
Repayments on capitalized equipment leases | — | — | (27,851 | ) | ||||||||||||||||||||
Dividends | (3,697,588) | — | — | |||||||||||||||||||||
Payments for option cancellations and restricted stock units | (1,390,265 | ) | (909,221 | ) | (389,461 | ) | (131,778) | (1,390,265) | (909,221) | |||||||||||||||
Proceeds from option exercises | 46,437 | — | 48,120 | 428,750 | 46,437 | — | ||||||||||||||||||
Stock repurchases | — | — | (448,521 | ) | ||||||||||||||||||||
|
|
|
|
|
| |||||||||||||||||||
Net cash (used in) financing activities | (1,343,828 | ) | (6,600,161 | ) | (6,348,763 | ) | (3,400,616) | (1,343,828) | (6,600,161) | |||||||||||||||
|
|
|
|
|
| |||||||||||||||||||
Net increase (decrease) in cash and cash equivalents | 5,599,049 | (17,191,952 | ) | 1,989,015 | 7,185,178 | 5,599,049 | (17,191,952) | |||||||||||||||||
Cash and cash equivalents, beginning of year | 4,960,850 | 22,152,802 | 20,163,787 | 10,559,899 | 4,960,850 | 22,152,802 | ||||||||||||||||||
|
|
|
|
|
| |||||||||||||||||||
Cash and cash equivalents, end of year | $ | 10,559,899 | $ | 4,960,850 | $ | 22,152,802 | $ | 17,745,077 | $ | 10,559,899 | $ | 4,960,850 | ||||||||||||
|
|
|
|
|
| |||||||||||||||||||
SUPPLEMENTAL INFORMATION: | ||||||||||||||||||||||||
Cash paid during the year for interest | $ | 24,236 | $ | 42,008 | $ | 191,425 | $ | 25,347 | $ | 24,236 | $ | 42,008 | ||||||||||||
|
|
|
|
|
| |||||||||||||||||||
Cash paid during the year for income taxes, net of refunds | $ | 723,228 | $ | 77,856 | $ | 48,559 | $ | 229,982 | $ | 723,228 | $ | 77,856 | ||||||||||||
|
|
|
|
|
| |||||||||||||||||||
SUPPLEMENTAL SCHEDULE OF NON-CASH INVESTING AND FINANCING ACTIVITIES: | ||||||||||||||||||||||||
Disposal of fully depreciated furniture, fixtures and equipment | $ | 130,115 | $ | 254,842 | $ | 82,776 | ||||||||||||||||||
|
|
| ||||||||||||||||||||||
Disposal of fully depreciated website costs | $ | 2,895 | ||||||||||||||||||||||
| ||||||||||||||||||||||||
Shares issued for vested employee restricted stock units | $ | 2,499 | $ | 2,671 | $ | 2,676 | $ | 2,894 | $ | 2,499 | $ | 2,671 | ||||||||||||
|
|
|
|
|
| |||||||||||||||||||
Shares issued for settlement of vested director restricted stock units | $ | 1,448 | $ | 125 | $ | 811 | $ | 1,448 | ||||||||||||||||
|
|
|
| |||||||||||||||||||||
Exercise of stock options through the receipt of tendered shares | $ | 39,524 | $ | 36,246 | $ | 39,524 | ||||||||||||||||||
|
|
| ||||||||||||||||||||||
Disposal of fully amortized intangible assets | $ | 241,724 | ||||||||||||||||||||||
| ||||||||||||||||||||||||
Disposal of fully depreciated furniture, fixtures and equipment | $ | 254,842 | $ | 82,776 | $ | 51,731 | ||||||||||||||||||
|
|
| ||||||||||||||||||||||
Release of accrued remediation liability obligation upon sale of real estate | $ | 1,000,000 | ||||||||||||||||||||||
| ||||||||||||||||||||||||
See Notes to Consolidated Financial Statements
REIS, INC. AND SUBSIDIARIES
NOTES TO CONSOLIDATED FINANCIAL STATEMENTS
| 1. | Organization and Business |
Reis, Inc. is a Maryland corporation. Reis, Inc. and its consolidated subsidiaries (“Reis” or the “Company”) provides commercial real estate market information and analytical tools to real estate professionals, through its Reis Services subsidiary. For disclosure and financial reporting purposes, this business is referred to as the Reis Services segment.
Reis Services
Reis Services, including its predecessors, was founded in 1980. Reis maintains a proprietary database containing detailed information on commercial properties in metropolitan markets and neighborhoods throughout the U.S. The database contains information on apartment, office, retail, warehouse/distribution, flex/research & development, and self storage and seniors housing properties, and is used by real estate investors, lenders and other professionals to make informed buying, selling and financing decisions. In addition, Reis data is used by debt and equity investors to assess, quantify and manage the risks of default and loss associated with individual mortgages, properties, portfolios and real estate backed securities. Reis currently provides its information services to many of the nation’s leading lending institutions, equity investors, brokers and appraisers.
The Company’s product portfolio features:Reis SE, its flagship delivery platform aimed at larger and mid-sized enterprises;ReisReports, aimed at prosumers and smaller enterprises; andMobiuss Portfolio CRE,or Mobiuss,launched in early 2013 and aimed primarily at risk managers and credit administrators at banks and non-bank lending institutions. It is through these products that Reis,providesReisprovides online access to a proprietary database of commercial real estate information and analytical tools designed to facilitate debt and equity transactions as well as ongoing asset and portfolio evaluations. Depending on the product or level of entitlement, users have access to market trends and forecasts at metropolitan and neighborhood levels throughout the U.S. and/or detailed building-specific information such as rents, vacancy rates, lease terms, property sales, new construction listings and property valuation estimates. Reis’s products are designed to meet the demand for timely and accurate information to support the decision-makingdecision making of property owners, developers, builders, banks and non-bank lenders, equity investors and service providers. These real estate professionals require access to timely information on both the performance and pricing of assets, including detailed data on market transactions, supply, absorption, rents and sale prices. This information is critical to all aspects of valuing assets and financing their acquisition, development and construction.
Discontinued Operations – Residential Development Activities
ReisPrior to May 2007, the name of the Company was Wellsford Real Properties, Inc. (“Wellsford”). Wellsford, which was originally formed on January 8, 1997, as Wellsford Real Properties, Inc. (“Wellsford”). Wellsford acquired the Reis Services business by merger in May 2007 (the “Merger”). Wellsford’s primary operating activities immediately prior to the Merger, and conducted through its subsidiaries, were the development, construction and sale of three residential projects and its approximate 23% ownership interest in the Reis Services business. The Company completed the sale of the remaining residential units and homes at its Colorado project in September 2009, sold its Claverack, New York projectprojects or divested of the remaining residential projects in bulk in February 2010, sold its remaining project in East Lyme, Connecticut in bulk insales by April 2011, and2011. In 2012, the Company settled construction defect litigation at the aforementionedits Colorado project in 2012.project.
See Note 3 and Note 10 for additional information regarding the Company’s segments.segments and the aforementioned litigation.
| 2. | Summary of Significant Accounting Policies |
Basis of Presentation
Principles of Consolidation
The accompanying consolidated financial statements include the accounts of the Company and its majority-owned and controlled subsidiaries. Investments in entities where the Company does not have a controlling interest are accounted for under the equity method of accounting. These investments were initially recorded at cost and were subsequently adjusted for the Company’s proportionate share of the investment’s income (loss) and additional contributions or distributions. All inter-company accounts and transactions among the Company and its subsidiaries have been eliminated in consolidation.
REIS, INC. AND SUBSIDIARIES
NOTES TO CONSOLIDATED FINANCIAL STATEMENTS
(Continued)
Summary of Significant Accounting Policies (continued)
Codification and the Hierarchy of Generally Accepted Accounting Principles
Effective July 1, 2009, the Company adopted the provisions of the Financial Accounting Standards Board (“FASB”) guidance related to the Accounting Standards Codification and the Hierarchy of Generally Accepted Accounting Principles (“GAAP”). This guidance identifies the sources of accepted accounting principles and the framework for selecting the principles used in the preparation of financial statements of nongovernmental entities that are presented in conformity with GAAP in the United States (the GAAP hierarchy). The Codification superseded all then-existing non-SEC accounting and reporting standards upon the effective date. The adoption of this standard changed how the Company references various elements of GAAP when preparing its financial statement disclosures, but has had no impact on the Company’s consolidated financial statements.
Discontinued Operations
TheIn April 2011, the Company determined as a resultthat all operational and litigation related activities associated with the prior ownership and development of the April 2011 sale of property in East Lyme, Connecticut, that the Residential Development Activities segment,residential real estate, including certain general and administrative costs that supported that segment’s operations, should be presented as a discontinued operation. As a result of this determination and the fact that the historicthese operations and cash flows can be clearly distinguished, the operating results of the Residential Development Activitiesdiscontinued segment and related general and administrative costs are aggregated for separate presentation apart from continuing operating results of the Company in the consolidated financial statements for all periods presented.
Variable Interests
The Company evaluates its investments and subsidiaries to determine if an entity is a voting interest entity or a variable interest entity (“VIE”). The Company performs this analysis on an ongoing basis, or as circumstances change. The Company does not have any VIEs in the years ended December 31, 2014, 2013 2012 and 2011.2012.
Cash and Cash Equivalents
The Company considers all demand and money market accounts and short term investments in government funds with a maturity of three months or less at the date of purchase to be cash and cash equivalents.
Accounts Receivable and Allowance for Doubtful Accounts
Accounts receivables are recorded at invoiced amounts and do not bear interest. The allowance for doubtful accounts reflects the Company’s assessment of collectability of outstanding receivables after consideration of the age of a receivable, customer payment history and other current events or economic factors that could affect a customer’s ability to make payments.
Furniture, Fixtures and Equipment
The Company capitalizes costs for the purchase of furniture, fixtures and equipment that have an expected useful life beyond one year. Depreciation expense is calculated on a straight-line basis over the determined useful life of the asset, generally three to ten years. Depreciation expense was approximately $383,000, $333,000 $355,000 and $352,000$355,000 for the years ended December 31, 2014, 2013 2012 and 2011,2012, respectively.
Intangible Assets, Amortization and Impairment
Web SiteWebsite Development Costs
The Company expenses all internet web sitewebsite costs incurred during the preliminary project stage. Thereafter, all direct external and internal development and implementation costs are capitalized and amortized using the straight-line method over their remaining estimated useful lives, not exceeding three years. The value ascribed to the web sitewebsite intangible asset acquired at the time of the Merger was amortized on a straight-line basis over three years, and during 2010, this ascribed value was fully amortized. Amortization of all capitalized web sitewebsite development costs is charged to product development expense.
REIS, INC. AND SUBSIDIARIES
NOTES TO CONSOLIDATED FINANCIAL STATEMENTS
(Continued)
Summary of Significant Accounting Policies (continued)
Database Costs
The Company capitalizes costs for the development of its database in connection with the identification and addition of new real estate properties and sale transactions which provide a future economic benefit. Amortization is calculated on a straight-line basis over a three or five year period. Costs of updating and maintaining information on existing properties in the database are expensed as incurred. The value ascribed to the database intangible asset acquired at the time of the Merger was amortized on a straight-line basis over three or five years. The ascribed value having a three and five year amortizable life was fully amortized in 2010 and 2012, respectively. Amortization of all capitalized database costs is charged to cost of sales.
Customer Relationships
The value ascribed to customer relationships acquired at the time of the Merger is amortized over 15 years on an accelerated basis and is charged to sales and marketing expense.
Lease Value
The value ascribed to the below market terms of the office lease existing at the time of the Merger is amortized over the remaining term of the acquired office lease which was approximately nine years. Amortization is charged to general and administrative expenses.
Goodwill and Intangible Asset Impairment
Goodwill and a major portion of the other intangible assets were recorded at the time of the Merger. As a result of the tax treatment of the Merger, goodwill and the acquired intangible assets are not deductible for income tax purposes.
Goodwill is not amortized and is tested for impairment at least annually, or after a triggering event has occurred, requiring such a calculation. A qualitative assessment can be utilized to determine if a more detailed two step calculation is required. If the qualitative assessment results in a determination that it is not more likely than not that the fair value of a reporting unit is less than its carrying amount, including goodwill, then no further evaluation would be necessary. If, after performing the qualitative assessment, the Company determined that it is more likely than not that the fair value of a reporting unit is less than its carrying amount, including goodwill, then the first step of the two step test would be necessary. The first step is a comparison of the estimated fair value of the reporting unit to which the goodwill has been assigned with the reporting unit’s carrying value. The fair values used in this evaluation would be estimates based upon market projections for the reporting unit. These market projections would utilize a number of estimates and assumptions, such as earnings before interest, taxes, depreciation and amortization (EBITDA) multiples, market comparisons, and quoted market prices. If the fair value of the reporting unit were to exceed its carrying value, goodwill would not be deemed to be impaired. If the fair value of the reporting unit is less than its carrying value, a second step would be required to calculate the implied fair value of goodwill by deducting the fair value of all tangible and intangible net assets of the reporting unit from the fair value of the reporting unit. The Company early adopted the qualitative assessment guidance for goodwill in 2011, which did not impact the consolidated financial statements, other than disclosure, and utilized the qualitative assessment for its 20122014, 2013 and 20132012 evaluations. There was no goodwill impairment identified in 2014, 2013 2012 or 2011.2012.
Intangible assets, with determinable useful lives, are amortized over their respective estimated useful lives using a method of amortization that reflects the pattern in which the economic benefits of the intangible assets are consumed or otherwise used up.used. In addition, the carrying amount of amortizable intangible assets are reviewed when indicators of impairment are present. If estimated future undiscounted net cash flows are less than the carrying amount of the asset, the asset would be considered impaired. An impairment charge would be determined by comparing the estimated fair value of the intangible asset to its carrying value, with any shortfall from fair value recognized as an expense in the current period. There was no intangible asset impairment identified in 2014, 2013 2012 or 2011.2012.
REIS, INC. AND SUBSIDIARIES
NOTES TO CONSOLIDATED FINANCIAL STATEMENTS
(Continued)
Summary of Significant Accounting Policies (continued)
Real Estate and Impairment
Costs directly related to the acquisition, development and improvement of real estate were capitalized, including interest and other costs incurred during the construction period. Ordinary repairs, maintenance and project operating costs were expensed as incurred. The Company historically reviewed its real estate assets for impairment: (1) whenever events or changes in circumstances indicated that the carrying amount of an asset may not be recoverable for assets held for use; and (2) when a determination was made to sell an asset or investment. If estimated cash flows on an undiscounted basis were insufficient to recover the carrying amount of an asset, an impairment loss equal to the excess of the carrying amount over estimated fair value would be recognized. No impairment charges were recorded during 2011 related to the Company’s real estate assets. The Company did not have any real estate assets during 2012 and 2013.
Deferred Financing Costs
Deferred financing costs consist of costs incurred to obtain financing or financing commitments. Such costs are amortized by the Company over the expected term of the respective agreements.
Fair Value Measurements
The current accounting literature provides for a three-level valuation hierarchy for disclosure of fair value measurements. The valuation hierarchy is based upon the transparency of inputs to the valuation of an asset or liability as of the measurement date. A financial instrument’s categorization within the valuation hierarchy is based upon the lowest level of input that is significant to the fair value measurement. The three levels are defined as follows:
Level 1 - inputs to the valuation methodology are quoted prices (unadjusted) for identical assets or liabilities in active markets;
Level 2 - inputs to the valuation methodology include quoted prices for similar assets and liabilities in active markets, and inputs that are observable for the asset or liability, either directly or indirectly, for substantially the full term of the financial instrument; and
Level 3 - inputs to the valuation methodology are unobservable and significant to the fair value measurement.
During the years ended December 31, 2014, 2013, 2012, and 2011,2012, the Company had no assets or liabilities valued using the valuation hierarchy.
Revenue Recognition and Related Items
The Company’s subscription revenue is derived principally from subscriptions to its web-based services for itsReis SE product and is recognized as revenue ratably over the related contractual period, which is typically one year but can be as long as 48 months. Revenue fromMobiuss in 2014 and 2013 represents the Company’s 50% share of the value of the subscription and is recognized as revenue ratably over the related contractual period consistent with the treatment for theReis SEproduct. Revenues from ad-hoc and custom reports or projects are recognized as completed and delivered to the customers, provided that no significant Company obligations remain. Revenues fromReisReports are recognized monthly as billed for monthly subscribers, or recognized as revenue ratably over the related contractual period for subscriptions in excess of one month. Revenue fromMobiuss represents the Company’s 50% share of the value of the subscription and is recognized as revenue ratably over the related contractual period. Deferred revenue represents the portion of a subscription billed or collected in advance under the terms of the respective contract, which will be recognized in future periods. If a customer does not meet the payment obligations of a contract, any related accounts receivable and deferred revenue are written off at that time and the net amount, after considering any recovery of accounts receivable, is charged to cost of sales.
Cost of sales of subscription revenue principally consists of salaries and related expenses for the Company’s researchers who collect and analyze the commercial real estate data that is the basis for the Company’s information services. Additionally, cost of sales includes the amortization of the database technology intangible asset.
Revenue from the sale of real estate in 2011, which solely consisted of a bulk sale of lots in a single family home development, was recognized at closing in accordance with applicable accounting guidelines.
Interest revenue is recorded on an accrual basis.
REIS, INC. AND SUBSIDIARIES
NOTES TO CONSOLIDATED FINANCIAL STATEMENTS
(Continued)
Summary of Significant Accounting Policies (continued)
Share Based Compensation
Equity Awards
The fair market value as of the grant date of awards of stock, restricted stock units or certain stock options is recognized as compensation expense by the Company over the respective vesting periods.
Liability Awards
The Company accruesaccrued a liability for cash payments that could be made to option holders for the amount of the market value of the Company’s common stock in excess of the exercise prices of outstanding options accounted for as a liability award. This liability iswas adjusted at the end of each reporting period to reflect: (1) the net cash payments to option holders made during each period; (2) the impact of the exercise and expiration of options; and (3) the changes in the market price of the Company’s common stock.
REIS, INC. AND SUBSIDIARIES
NOTES TO CONSOLIDATED FINANCIAL STATEMENTS
(Continued)
Summary of Significant Accounting Policies (continued)
Changes in the settlement value of option awards treated under the liability method arewere reflected as incomean increase to, or a reduction of, expense in the consolidated statements of operations. At December 31, 2014, there were no options outstanding for which a liability was required as the remaining liability award options were either exercised or settled with a net cash payment. At December 31, 2013, of the 627,724 outstanding options, 17,724 options arewere accounted for as a liability award as these awards provideallowed for settlement in cash or in stock at the election of the option holder. At December 31, 2012, of the 645,448 outstanding options, 35,448 options were accounted for as a liability award. The liability for option cancellations was approximately $268,000 and $297,000 at December 31, 2013 and 2012, respectively.
The2013; there was no liability for option cancellations could materially change from period to period based upon: (1) an option holder either (a) exercising the options in a traditional manner or (b) electing the net cash settlement alternative; and (2) changes in the market price of the Company’s common stock. At each period end, an increase in the Company’s common stock price would result in an increase in compensation expense, whereas a decline in the stock price would reduce compensation expense.at December 31, 2014.
See Note 9 for activity with respect to stock options and restricted stock units.
Income Taxes
Deferred income tax assets and liabilities are determined based upon differences between the financial reporting basis and the tax basis of assets and liabilities, and are measured using the enacted tax rates and laws that are estimated to be in effect when the differences are expected to reverse. Valuation allowances with respect to deferred income tax assets are recorded when deemed appropriate and adjusted based upon periodic evaluations.
The Company evaluates its tax positions in accordance with applicable current accounting literature. Recognition of uncertain tax positions (step one) occurs when an enterprise concludes that a tax position, based solely on its technical merits, is more likely than not to be sustained upon examination. Measurement (step two) determines the amount of benefit that more likely than not will be realized upon settlement. Derecognition of a tax position that was previously recognized would occur when a company subsequently determines that a tax position no longer meets the more likely than not threshold of being sustained or there is a satisfactory resolution of the tax position.
See Note 7 for more information regarding income taxes.
REIS, INC. AND SUBSIDIARIES
NOTES TO CONSOLIDATED FINANCIAL STATEMENTS
(Continued)
Summary of Significant Accounting Policies (continued)
Per Share Data
Basic earnings per common share is computed based upon the weighted average number of common shares outstanding during the period. Diluted earnings per common share is based upon the increased number of common shares that would be outstanding assuming the exercise of dilutive common share options and the consideration of restricted stock awards. The following table details the computation of earnings per common share, basic and diluted:
| For the Years Ended December 31, | For the Years Ended December 31, | |||||||||||||||||||||||
| 2013 | 2012 | 2011 | 2014 | 2013 | 2012 | |||||||||||||||||||
Numerator for basic per share calculation: | ||||||||||||||||||||||||
Income from continuing operations for basic calculation | $ | 17,933,431 | $ | 8,013,330 | $ | 4,861,385 | $ | 4,616,385 | $ | 17,933,431 | $ | 8,013,330 | ||||||||||||
(Loss) from discontinued operations, net of income tax expense | (336,489 | ) | (12,296,912 | ) | (2,974,958 | ) | ||||||||||||||||||
(Loss) from discontinued operations, net of income tax (benefit) | (569,263) | (336,489) | (12,296,912) | |||||||||||||||||||||
|
|
|
|
|
| |||||||||||||||||||
Net income (loss) for basic calculation | $ | 17,596,942 | $ | (4,283,582 | ) | $ | 1,886,427 | $ | 4,047,122 | $ | 17,596,942 | $ | (4,283,582) | |||||||||||
|
|
|
|
| �� |
| ||||||||||||||||||
Numerator for diluted per share calculation: | ||||||||||||||||||||||||
Income from continuing operations | $ | 17,933,431 | $ | 8,013,330 | $ | 4,861,385 | $ | 4,616,385 | $ | 17,933,431 | $ | 8,013,330 | ||||||||||||
Adjustments to income from continuing operations for the income statement impact of dilutive securities | — | — | — | |||||||||||||||||||||
Adjustments to income from continuing operations for the statement of operations impact of dilutive securities | (136,563) | — | — | |||||||||||||||||||||
|
|
|
|
|
| |||||||||||||||||||
Income from continuing operations for dilution calculation | 17,933,431 | 8,013,330 | 4,861,385 | 4,479,822 | 17,933,431 | 8,013,330 | ||||||||||||||||||
(Loss) from discontinued operations, net of income tax expense | (336,489 | ) | (12,296,912 | ) | (2,974,958 | ) | ||||||||||||||||||
(Loss) from discontinued operations, net of income tax (benefit) | (569,263) | (336,489) | (12,296,912) | |||||||||||||||||||||
|
|
|
|
|
| |||||||||||||||||||
Net income (loss) for dilution calculation | $ | 17,596,942 | $ | (4,283,582 | ) | $ | 1,886,427 | $ | 3,910,559 | $ | 17,596,942 | $ | (4,283,582) | |||||||||||
|
|
| ||||||||||||||||||||||
|
|
| ||||||||||||||||||||||
Denominator: | ||||||||||||||||||||||||
Weighted average common shares – basic | 10,884,533 | 10,685,333 | 10,569,805 | 11,086,690 | 10,884,533 | 10,685,333 | ||||||||||||||||||
Effect of dilutive securities: | ||||||||||||||||||||||||
RSUs | 242,396 | 305,033 | 301,956 | 169,813 | 242,396 | 305,033 | ||||||||||||||||||
Stock options | 269,630 | 43,716 | 5,115 | 336,576 | 269,630 | 43,716 | ||||||||||||||||||
|
|
|
|
|
| |||||||||||||||||||
Weighted average common shares – diluted | 11,396,559 | 11,034,082 | 10,876,876 | 11,593,079 | 11,396,559 | 11,034,082 | ||||||||||||||||||
|
|
|
|
|
| |||||||||||||||||||
Per common share amounts – basic: | ||||||||||||||||||||||||
Income from continuing operations | $ | 1.65 | $ | 0.75 | $ | 0.46 | $ | 0.42 | $ | 1.65 | $ | 0.75 | ||||||||||||
(Loss) from discontinued operations | (0.03 | ) | (1.15 | ) | (0.28 | ) | (0.05) | (0.03) | (1.15) | |||||||||||||||
|
|
|
|
|
| |||||||||||||||||||
Net income (loss) | $ | 1.62 | $ | (0.40 | ) | $ | 0.18 | $ | 0.37 | $ | 1.62 | $ | (0.40) | |||||||||||
|
|
| ||||||||||||||||||||||
|
|
| ||||||||||||||||||||||
Per common share amounts – diluted: | ||||||||||||||||||||||||
Income from continuing operations | $ | 1.57 | $ | 0.73 | $ | 0.45 | $ | 0.39 | $ | 1.57 | $ | 0.73 | ||||||||||||
(Loss) from discontinued operations | (0.03 | ) | (1.12 | ) | (0.28 | ) | (0.05) | (0.03) | (1.12) | |||||||||||||||
|
|
|
|
|
| |||||||||||||||||||
Net income (loss) | $ | 1.54 | $ | (0.39 | ) | $ | 0.17 | $ | 0.34 | $ | 1.54 | $ | (0.39) | |||||||||||
|
|
|
|
|
| |||||||||||||||||||
Potentially dilutive securities include all stock based awards. For the year ended December 31, 2014, certain equity awards were antidilutive. For the year ended December 31, 2013, the option awards accounted for under the liability method were antidilutive. For the yearsyear ended December 31, 2012, and 2011, certain equity awards in addition toand the option awards accounted for under the liability method were antidilutive.
Estimates
The preparation of financial statements in conformity with GAAP requires management to make estimates and assumptions that affect the reported amounts of assets and liabilities and disclosure of contingent assets and liabilities at the date of the financial statements and the reported amounts of revenues and expenses during the reporting period. Actual results could differ from those estimates.
REIS, INC. AND SUBSIDIARIES
NOTES TO CONSOLIDATED FINANCIAL STATEMENTS
(Continued)
Summary of Significant Accounting Policies (continued)
From time to time, the Company has been, is or may in the future be a defendant in various legal actions arising in the normal course of business. The Company records a provision for a liability when it is both probable that a liability has been incurred and the amount of loss can be reasonably estimated. The outcome of any litigation is uncertain; it is possible that a judgment in any legal actions to which the Company is a party, or which are proposed or threatened, will have a material adverse effect on the consolidated financial statements. See Note 10.
REIS, INC. AND SUBSIDIARIES
NOTES TO CONSOLIDATED FINANCIAL STATEMENTS
(Continued)
Summary of Significant Accounting Policies (continued)
New Accounting Pronouncements
In July 2013, the FASB issued ASUAccounting Standards Update (“ASU”) 2013-11,Presentation of an Unrecognized Tax Benefit When a Net Operating Loss Carryforward, a Similar Tax Loss, or a Tax Credit Carryforward Exists (“(“ASU 2013-11”).ASU 2013-11 changes the presentation of an unrecognized tax benefit when a net operating loss carryforward, a similar tax loss, or a tax credit carryforward exists. These changes require an entity to present an unrecognized tax benefit as a liability in the financial statements if (i) a net operating loss carryforward, a similar tax loss, or a tax credit carryforward is not available at the reporting date under the tax law of the applicable jurisdiction to settle any additional income taxes that would result from the disallowance of a tax position, or (ii) the tax law of the applicable jurisdiction does not require the entity to use, and the entity does not intend to use, the deferred tax asset to settle any additional income taxes that would result from the disallowance of a tax position. Otherwise, an unrecognized tax benefit is required to be presented in the financial statements as a reduction to a deferred tax asset for a net operating loss carryforward, a similar tax loss, or a tax credit carryforward. Previously, there was diversity in practiceThe Company adopted the provisions of this update as no explicit guidance existed.of January 1, 2014 and incorporated the provisions of this update into its consolidated financial statements upon adoption. The guidance inadoption of this update did not have a material impact on the Company’s financial condition or results of operations.
In April 2014, the FASB issued ASU 2013-112014-08,Reporting Discontinued Operations and Disclosures of Disposals of Components of an Entity (“ASU 2014-08”). ASU 2014-08 changes the definition of a discontinued operation to include only those disposals of components of an entity that represent a strategic shift that has (or will have) a major effect on an entity’s operations and financial results. ASU 2014-08 is effective for public companiesprospectively for fiscal years, and interim periods within those years beginning after December 15, 2013. Management has determined2014 and is available for early adoption as of January 1, 2014. The Company adopted the provisions of ASU 2014-08 as of January 1, 2014 and incorporated the provisions of this update into its consolidated financial statements upon adoption. The adoption of ASU 2014-08 did not have a material impact on the Company’s financial condition or results of operations.
In May 2014, the FASB issued ASU 2014-09,Revenue from Contracts with Customers(“ASU 2014-09”). ASU 2014-09 affects any entity that either enters into contracts with customers to transfer goods or services or enters into contracts for the transfer of nonfinancial assets. Under ASU 2014-09, an entity will recognize revenue when it transfers promised goods or services to customers in an amount that reflects what it expects in exchange for the goods or services. ASU 2014-09 is effective for annual periods beginning after December 15, 2016. The Company is currently evaluating the impact the adoption of ASU 2014-09 will have on the Company’s consolidated financial statements and disclosures.
In August 2014, the FASB issued ASU 2014-15, Disclosure of Uncertainties about an Entity’s Ability to Continue as a Going Concern(“ASU 2014-15”). ASU 2014-15 defines management’s responsibility to evaluate whether there is substantial doubt about an organization’s ability to continue as a going concern and to provide related footnote disclosures. ASU 2014-15 is effective for annual periods ending after December 15, 2016 and interim periods within annual periods beginning after December 15, 2016. The Company expects that the adoption of these changesASU 2014-15 will not have a significantmaterial impact on the Company’s consolidated financial statements.statements and disclosures.
| 3. | Segment Information |
The Company is organized into two separately managed segments:segments as follows: the Reis Services segment, and the discontinued Residential Development Activities segment.operations segment and other. The following tables present condensed balance sheet and operating data for these segments:
REIS, INC. AND SUBSIDIARIES
(amounts in thousands)
| ||||||||||||||||
Condensed Balance Sheet Data December 31, 2013 | Reis Services | Discontinued Operations (A) | Other (B) | Consolidated | ||||||||||||
Assets | ||||||||||||||||
Current assets: | ||||||||||||||||
Cash and cash equivalents | $ | 10,347 | $ | — | $ | 213 | $ | 10,560 | ||||||||
Restricted cash and investments | 217 | — | — | 217 | ||||||||||||
Accounts receivable, net | 11,386 | — | — | 11,386 | ||||||||||||
Prepaid and other assets | 187 | — | 2,601 | 2,788 | ||||||||||||
Assets attributable to discontinued operations | — | — | 9 | 9 | ||||||||||||
|
|
|
|
|
|
|
| |||||||||
Total current assets | 22,137 | — | 2,823 | 24,960 | ||||||||||||
Furniture, fixtures and equipment, net | 829 | — | 24 | 853 | ||||||||||||
Intangible assets, net | 15,687 | — | — | 15,687 | ||||||||||||
Deferred tax asset, net | 285 | �� | — | 21,032 | 21,317 | |||||||||||
Goodwill | 57,203 | — | (2,378 | ) | 54,825 | |||||||||||
Other assets | 225 | — | — | 225 | ||||||||||||
|
|
|
|
|
|
|
| |||||||||
Total assets | $ | 96,366 | $ | — | $ | 21,501 | $ | 117,867 | ||||||||
|
|
|
|
|
|
|
| |||||||||
Liabilities and stockholders’ equity | ||||||||||||||||
Current liabilities: | ||||||||||||||||
Current portion of debt | $ | — | $ | — | $ | — | $ | — | ||||||||
Accrued expenses and other liabilities | 2,623 | — | 956 | 3,579 | ||||||||||||
Liability for option cancellations | — | — | 268 | 268 | ||||||||||||
Deferred revenue | 20,284 | — | — | 20,284 | ||||||||||||
Liabilities attributable to discontinued operations | — | 271 | 71 | 342 | ||||||||||||
|
|
|
|
|
|
|
| |||||||||
Total current liabilities | 22,907 | 271 | 1,295 | 24,473 | ||||||||||||
Other long-term liabilities | 523 | — | — | 523 | ||||||||||||
Deferred tax liability, net | 18,957 | — | (18,957 | ) | — | |||||||||||
|
|
|
|
|
|
|
| |||||||||
Total liabilities | 42,387 | 271 | (17,662 | ) | 24,996 | |||||||||||
Total stockholders’ equity | 53,979 | (271 | ) | 39,163 | 92,871 | |||||||||||
|
|
|
|
|
|
|
| |||||||||
Total liabilities and stockholders’ equity | $ | 96,366 | $ | — | $ | 21,501 | $ | 117,867 | ||||||||
|
|
|
|
|
|
|
| |||||||||
NOTES TO CONSOLIDATED FINANCIAL STATEMENTS
(Continued)
Segment Information (continued)
| (amounts in thousands) | ||||||||||||||||
Condensed Balance Sheet Data December 31, 2014 | Reis Services | Discontinued Operations (A) | Other (B) | Consolidated | ||||||||||||
Assets | ||||||||||||||||
Current assets: | ||||||||||||||||
Cash and cash equivalents | $ | 17,562 | $ | — | $ | 183 | $ | 17,745 | ||||||||
Restricted cash and investments | 213 | — | — | 213 | ||||||||||||
Accounts receivable, net | 12,627 | — | — | 12,627 | ||||||||||||
Prepaid and other assets | 213 | — | 3,950 | 4,163 | ||||||||||||
Assets attributable to discontinued operations | — | — | 4 | 4 | ||||||||||||
|
|
|
|
|
|
|
| |||||||||
Total current assets | 30,615 | — | 4,137 | 34,752 | ||||||||||||
Furniture, fixtures and equipment, net | 836 | — | 15 | 851 | ||||||||||||
Intangible assets, net | 14,681 | — | — | 14,681 | ||||||||||||
Deferred tax asset, non-current portion, net | 285 | — | 18,354 | 18,639 | ||||||||||||
Goodwill | 57,203 | — | (2,378) | 54,825 | ||||||||||||
Other assets | 140 | — | — | 140 | ||||||||||||
|
|
|
|
|
|
|
| |||||||||
Total assets | $ | 103,760 | $ | — | $ | 20,128 | $ | 123,888 | ||||||||
|
|
|
|
|
|
|
| |||||||||
Liabilities and stockholders’ equity | ||||||||||||||||
Current liabilities: | ||||||||||||||||
Current portion of debt | $ | — | $ | — | $ | — | $ | — | ||||||||
Accrued expenses and other liabilities | 3,157 | — | 1,014 | 4,171 | ||||||||||||
Deferred revenue | 22,885 | — | — | 22,885 | ||||||||||||
Liabilities attributable to discontinued operations | — | 271 | 28 | 299 | ||||||||||||
|
|
|
|
|
|
|
| |||||||||
Total current liabilities | 26,042 | 271 | 1,042 | 27,355 | ||||||||||||
Other long-term liabilities | 420 | — | — | 420 | ||||||||||||
Deferred tax liability, net | 23,108 | — | (23,108) | — | ||||||||||||
|
|
|
|
|
|
|
| |||||||||
Total liabilities | 49,570 | 271 | (22,066) | 27,775 | ||||||||||||
Total stockholders’ equity | 54,190 | (271) | 42,194 | 96,113 | ||||||||||||
|
|
|
|
|
|
|
| |||||||||
Total liabilities and stockholders’ equity | $ | 103,760 | $ | — | $ | 20,128 | $ | 123,888 | ||||||||
|
|
|
|
|
|
|
| |||||||||
Condensed Balance Sheet Data December 31, 2013 | Reis Services | Discontinued Operations (A) | Other (B) | Consolidated | ||||||||||||
Assets | ||||||||||||||||
Current assets: | ||||||||||||||||
Cash and cash equivalents | $ | 10,347 | $ | — | $ | 213 | $ | 10,560 | ||||||||
Restricted cash and investments | 217 | — | — | 217 | ||||||||||||
Accounts receivable, net | 11,386 | — | — | 11,386 | ||||||||||||
Prepaid and other assets | 187 | — | 2,601 | 2,788 | ||||||||||||
Assets attributable to discontinued operations | — | — | 9 | 9 | ||||||||||||
|
|
|
|
|
|
|
| |||||||||
Total current assets | 22,137 | — | 2,823 | 24,960 | ||||||||||||
Furniture, fixtures and equipment, net | 829 | — | 24 | 853 | ||||||||||||
Intangible assets, net | 15,687 | — | — | 15,687 | ||||||||||||
Deferred tax asset, non-current portion, net | 285 | — | 21,032 | 21,317 | ||||||||||||
Goodwill | 57,203 | — | (2,378) | 54,825 | ||||||||||||
Other assets | 225 | — | — | 225 | ||||||||||||
|
|
|
|
|
|
|
| |||||||||
Total assets | $ | 96,366 | $ | — | $ | 21,501 | $ | 117,867 | ||||||||
|
|
|
|
|
|
|
| |||||||||
Liabilities and stockholders’ equity | ||||||||||||||||
Current liabilities: | ||||||||||||||||
Current portion of debt | $ | — | $ | — | $ | — | $ | — | ||||||||
Accrued expenses and other liabilities | 2,623 | — | 956 | 3,579 | ||||||||||||
Liability for option cancellations | — | — | 268 | 268 | ||||||||||||
Deferred revenue | 20,284 | — | — | 20,284 | ||||||||||||
Liabilities attributable to discontinued operations | — | 271 | 71 | 342 | ||||||||||||
|
|
|
|
|
|
|
| |||||||||
Total current liabilities | 22,907 | 271 | 1,295 | 24,473 | ||||||||||||
Other long-term liabilities | 523 | — | — | 523 | ||||||||||||
Deferred tax liability, net | 18,957 | — | (18,957) | — | ||||||||||||
|
|
|
|
|
|
|
| |||||||||
Total liabilities | 42,387 | 271 | (17,662) | 24,996 | ||||||||||||
Total stockholders’ equity | 53,979 | (271) | 39,163 | 92,871 | ||||||||||||
|
|
|
|
|
|
|
| |||||||||
Total liabilities and stockholders’ equity | $ | 96,366 | $ | — | $ | 21,501 | $ | 117,867 | ||||||||
|
|
|
|
|
|
|
| |||||||||
| (A) | Includes the assets and liabilities of the Company’s discontinued |
| (B) | Includes cash, other assets and liabilities not specifically attributable to or allocable to a specific operating segment. |
REIS, INC. AND SUBSIDIARIES
NOTES TO CONSOLIDATED FINANCIAL STATEMENTS
(Continued)
Segment Information (continued)
(amounts in thousands)
| ||||||||||||||||
Condensed Balance Sheet Data December 31, 2012 | Reis Services | Discontinued Operations (A) | Other (B) | Consolidated | ||||||||||||
Assets | ||||||||||||||||
Current assets: | ||||||||||||||||
Cash and cash equivalents | $ | 4,212 | $ | — | $ | 749 | $ | 4,961 | ||||||||
Restricted cash and investments | 216 | — | — | 216 | ||||||||||||
Accounts receivable, net | 10,694 | — | — | 10,694 | ||||||||||||
Prepaid and other assets | 219 | — | 1,220 | 1,439 | ||||||||||||
|
|
|
|
|
|
|
| |||||||||
Total current assets | 15,341 | — | 1,969 | 17,310 | ||||||||||||
Furniture, fixtures and equipment, net | 705 | — | 33 | 738 | ||||||||||||
Intangible assets, net | 16,333 | — | — | 16,333 | ||||||||||||
Deferred tax asset, net | — | — | 8,557 | 8,557 | ||||||||||||
Goodwill | 57,203 | — | (2,378 | ) | 54,825 | |||||||||||
Other assets | 271 | — | — | 271 | ||||||||||||
|
|
|
|
|
|
|
| |||||||||
Total assets | $ | 89,853 | $ | — | $ | 8,181 | $ | 98,034 | ||||||||
|
|
|
|
|
|
|
| |||||||||
Liabilities and stockholders’ equity | ||||||||||||||||
Current liabilities: | ||||||||||||||||
Current portion of debt | $ | — | $ | — | $ | — | $ | — | ||||||||
Accrued expenses and other liabilities | 2,556 | — | 1,346 | 3,902 | ||||||||||||
Liability for option cancellations | — | — | 297 | 297 | ||||||||||||
Deferred revenue | 18,230 | — | — | 18,230 | ||||||||||||
Liabilities attributable to discontinued operations | — | 271 | 189 | 460 | ||||||||||||
|
|
|
|
|
|
|
| |||||||||
Total current liabilities | 20,786 | 271 | 1,832 | 22,889 | ||||||||||||
Other long-term liabilities | 588 | — | — | 588 | ||||||||||||
Deferred tax liability, net | 15,786 | — | (15,786 | ) | — | |||||||||||
|
|
|
|
|
|
|
| |||||||||
Total liabilities | 37,160 | 271 | (13,954 | ) | 23,477 | |||||||||||
Total stockholders’ equity | 52,693 | (271 | ) | 22,135 | 74,557 | |||||||||||
|
|
|
|
|
|
|
| |||||||||
Total liabilities and stockholders’ equity | $ | 89,853 | $ | — | $ | 8,181 | $ | 98,034 | ||||||||
|
|
|
|
|
|
|
| |||||||||
| (amounts in thousands) | ||||||||||||||||
Condensed Operating Data for the Year Ended December 31, 2014 | Reis Services | Discontinued Operations (A) | Other (B) | Consolidated | ||||||||||||
Subscription revenue | $ | 41,335 | $ | — | $ | — | $ | 41,335 | ||||||||
Cost of sales of subscription revenue | 8,037 | — | — | 8,037 | ||||||||||||
|
|
|
|
|
|
|
| |||||||||
Gross profit | 33,298 | — | — | 33,298 | ||||||||||||
|
|
|
|
|
|
|
| |||||||||
Operating expenses: | ||||||||||||||||
Sales and marketing | 10,235 | — | — | 10,235 | ||||||||||||
Product development | 3,473 | — | — | 3,473 | ||||||||||||
General and administrative expenses | 7,940 | — | 4,101 | 12,041 | ||||||||||||
|
|
|
|
|
|
|
| |||||||||
Total operating expenses | 21,648 | — | 4,101 | 25,749 | ||||||||||||
Other income (expenses): | ||||||||||||||||
Interest and other income | 22 | — | — | 22 | ||||||||||||
Interest expense | (113) | — | — | (113) | ||||||||||||
|
|
|
|
|
|
|
| |||||||||
Total other income (expenses) | (91) | — | — | (91) | ||||||||||||
|
| �� |
|
|
|
|
|
| ||||||||
Income (loss) before income taxes and discontinued operations | $ | 11,559 | $ | — | $ | (4,101) | $ | 7,458 | ||||||||
|
|
|
|
|
|
|
| |||||||||
(Loss) from discontinued operations, before income taxes | $ | — | $ | (31) | $ | (920) | $ | (951) | ||||||||
|
|
|
|
|
|
|
| |||||||||
Condensed Operating Data for the Year Ended December 31, 2013 | Reis Services | Discontinued Operations (A) | Other (B) | Consolidated | ||||||||||||
Subscription revenue | $ | 34,721 | $ | — | $ | — | $ | 34,721 | ||||||||
Cost of sales of subscription revenue | 6,974 | — | — | 6,974 | ||||||||||||
|
|
|
|
|
|
|
| |||||||||
Gross profit | 27,747 | — | — | 27,747 | ||||||||||||
|
|
|
|
|
|
|
| |||||||||
Operating expenses: | ||||||||||||||||
Sales and marketing | 8,350 | — | — | 8,350 | ||||||||||||
Product development | 3,122 | — | — | 3,122 | ||||||||||||
General and administrative expenses | 6,989 | — | 4,920 | 11,909 | ||||||||||||
|
|
|
|
|
|
|
| |||||||||
Total operating expenses | 18,461 | — | 4,920 | 23,381 | ||||||||||||
Other income (expenses): | ||||||||||||||||
Interest and other income | 10 | — | — | 10 | ||||||||||||
Interest expense | (113) | — | — | (113) | ||||||||||||
|
|
|
|
|
|
|
| |||||||||
Total other income (expenses) | (103) | — | — | (103) | ||||||||||||
|
|
|
|
|
|
|
| |||||||||
Income (loss) before income taxes and discontinued operations | $ | 9,183 | $ | — | $ | (4,920) | $ | 4,263 | ||||||||
|
|
|
|
|
|
|
| |||||||||
(Loss) from discontinued operations, before income taxes | $ | — | $ | (9) | $ | (557) | $ | (566) | ||||||||
|
|
|
|
|
|
|
| |||||||||
| (A) |
Condensed Operating Data for the Year Ended December 31, 2013 | Reis Services | Discontinued Operations (A) | Other (B) | Consolidated | ||||||||||||
Subscription revenue | $ | 34,721 | $ | — | $ | — | $ | 34,721 | ||||||||
Cost of sales of subscription revenue | 6,974 | — | — | 6,974 | ||||||||||||
|
|
|
|
|
|
|
| |||||||||
Gross profit | 27,747 | — | — | 27,747 | ||||||||||||
|
|
|
|
|
|
|
| |||||||||
Operating expenses: | ||||||||||||||||
Sales and marketing | 8,350 | — | — | 8,350 | ||||||||||||
Product development | 3,122 | — | — | 3,122 | ||||||||||||
General and administrative expenses | 6,989 | — | 4,920 | 11,909 | ||||||||||||
|
|
|
|
|
|
|
| |||||||||
Total operating expenses | 18,461 | — | 4,920 | 23,381 | ||||||||||||
Other income (expenses): | ||||||||||||||||
Interest and other income | 10 | — | — | 10 | ||||||||||||
Interest expense | (113 | ) | — | — | (113 | ) | ||||||||||
|
|
|
|
|
|
|
| |||||||||
Total other income (expenses) | (103 | ) | — | — | (103 | ) | ||||||||||
|
|
|
|
|
|
|
| |||||||||
Income (loss) before income taxes and discontinued operations | $ | 9,183 | $ | — | $ | (4,920 | ) | $ | 4,263 | |||||||
|
|
|
|
|
|
|
| |||||||||
(Loss) from discontinued operations, before income taxes | $ | — | $ | (9 | ) | $ | (557 | ) | $ | (566 | ) | |||||
|
|
|
|
|
|
|
| |||||||||
| Includes the results of the Company’s discontinued |
| (B) | Includes interest and other income, depreciation expense and general and administrative expenses that have not been allocated to the operating segments. |
REIS, INC. AND SUBSIDIARIES
NOTES TO CONSOLIDATED FINANCIAL STATEMENTS
(Continued)
Segment Information (continued)
(amounts in thousands)
| ||||||||||||||||||||||||||||||||
Condensed Operating Data for the Year Ended December 31, 2012 | Reis Services | Discontinued Operations (A) | Other (B) | Consolidated | Reis Services | Discontinued Operations (A) | Other (B) | Consolidated | ||||||||||||||||||||||||
Subscription revenue | $ | 31,229 | $ | — | $ | — | $ | 31,229 | $ | 31,229 | $ | — | $ | — | $ | 31,229 | ||||||||||||||||
Cost of sales of subscription revenue | 6,617 | — | — | 6,617 | 6,617 | — | — | 6,617 | ||||||||||||||||||||||||
|
|
|
|
|
|
|
| |||||||||||||||||||||||||
Gross profit | 24,612 | — | — | 24,612 | 24,612 | — | — | 24,612 | ||||||||||||||||||||||||
|
|
|
|
|
|
|
| |||||||||||||||||||||||||
Operating expenses: | ||||||||||||||||||||||||||||||||
Sales and marketing | 7,643 | — | — | 7,643 | 7,643 | — | — | 7,643 | ||||||||||||||||||||||||
Product development | 2,485 | — | — | 2,485 | 2,485 | — | — | 2,485 | ||||||||||||||||||||||||
General and administrative expenses | 6,696 | — | 5,098 | 11,794 | 6,696 | — | 5,098 | 11,794 | ||||||||||||||||||||||||
|
|
|
|
|
|
|
| |||||||||||||||||||||||||
Total operating expenses | 16,824 | — | 5,098 | 21,922 | 16,824 | — | 5,098 | 21,922 | ||||||||||||||||||||||||
Other income (expenses): | ||||||||||||||||||||||||||||||||
Interest and other income | 50 | — | 1 | 51 | 50 | — | 1 | 51 | ||||||||||||||||||||||||
Interest expense | (155 | ) | — | — | (155 | ) | (155) | — | — | (155) | ||||||||||||||||||||||
|
|
|
|
|
|
|
| |||||||||||||||||||||||||
Total other income (expenses) | (105 | ) | — | 1 | (104 | ) | (105) | — | 1 | (104) | ||||||||||||||||||||||
|
|
|
|
|
|
|
| |||||||||||||||||||||||||
Income (loss) before income taxes and discontinued operations | $ | 7,683 | $ | — | $ | (5,097 | ) | $ | 2,586 | $ | 7,683 | $ | — | $ | (5,097) | $ | 2,586 | |||||||||||||||
|
|
|
|
|
|
|
| |||||||||||||||||||||||||
(Loss) from discontinued operations, before income taxes | $ | — | $ | (393 | ) | $ | (11,904 | ) | $ | (12,297 | ) | |||||||||||||||||||||
|
|
|
| |||||||||||||||||||||||||||||
Condensed Operating Data for the Year Ended December 31, 2011 | Reis Services | Discontinued Operations (A) | Other (B) | Consolidated | ||||||||||||||||||||||||||||
Subscription revenue | $ | 27,180 | $ | — | $ | — | $ | 27,180 | ||||||||||||||||||||||||
Cost of sales of subscription revenue | 6,305 | — | — | 6,305 | ||||||||||||||||||||||||||||
|
|
|
| |||||||||||||||||||||||||||||
Gross profit | 20,875 | — | — | 20,875 | ||||||||||||||||||||||||||||
|
|
|
| |||||||||||||||||||||||||||||
Operating expenses: | ||||||||||||||||||||||||||||||||
Sales and marketing | 6,704 | — | — | 6,704 | ||||||||||||||||||||||||||||
Product development | 2,093 | — | — | 2,093 | ||||||||||||||||||||||||||||
General and administrative expenses | 6,376 | — | 4,719 | 11,095 | ||||||||||||||||||||||||||||
|
|
|
| |||||||||||||||||||||||||||||
Total operating expenses | 15,173 | — | 4,719 | 19,892 | ||||||||||||||||||||||||||||
Other income (expenses): | ||||||||||||||||||||||||||||||||
Interest and other income | 72 | — | 5 | 77 | ||||||||||||||||||||||||||||
Interest expense | (274 | ) | — | — | (274 | ) | ||||||||||||||||||||||||||
|
|
|
| |||||||||||||||||||||||||||||
Total other income (expenses) | (202 | ) | — | 5 | (197 | ) | ||||||||||||||||||||||||||
|
|
|
| |||||||||||||||||||||||||||||
Income (loss) before income taxes and discontinued operations | $ | 5,500 | $ | — | $ | (4,714 | ) | $ | 786 | |||||||||||||||||||||||
|
|
|
| |||||||||||||||||||||||||||||
(Loss) from discontinued operations, before income taxes | $ | — | $ | (2,975 | ) | $ | — | $ | (2,975 | ) | $ | — | $ | (393) | $ | (11,904) | $ | (12,297) | ||||||||||||||
|
|
|
|
|
|
|
| |||||||||||||||||||||||||
| (A) | Includes the results of the Company’s discontinued |
| (B) | Includes interest and other income, depreciation expense and general and administrative expenses that have not been allocated to the operating segments. |
REIS, INC. AND SUBSIDIARIES
NOTES TO CONSOLIDATED FINANCIAL STATEMENTS
(Continued)
Segment Information (continued)
Reis Services
See Note 1 for a description of Reis Services’s business and products at December 31, 2013.2014.
The Company’s largest individual subscriber accounted for 3.4%2.9%, 4.2%3.4% and 4.9%4.2% of Reis Services’s revenue for the years ended December 31, 2014, 2013 2012 and 2011,2012, respectively.
The following table presents the accounts receivable balances of Reis Services at December 31, 20132014 and 2012:2013:
| December 31, | ||||||||||||||||
| December 31, | 2014 | 2013 | ||||||||||||||
| 2013 | 2012 | |||||||||||||||
Accounts receivable | $ | 11,465,000 | $ | 10,763,000 | $ | 12,679,000 | $ | 11,465,000 | ||||||||
Allowance for doubtful accounts | (79,000 | ) | (69,000 | ) | (52,000) | (79,000) | ||||||||||
|
|
|
| |||||||||||||
Accounts receivable, net | $ | 11,386,000 | $ | 10,694,000 | $ | 12,627,000 | $ | 11,386,000 | ||||||||
|
|
|
| |||||||||||||
Thirty-one subscribers accounted for an aggregate of approximately 65.0% of Reis Services’s accounts receivable at December 31, 2014, including four subscribers in excess of 4.0% and the largest representing 9.4%. Through February 27, 2015, the Company received payments of approximately $9,773,000 or 77.1% against the December 31, 2014 accounts receivable balance. Twenty-five subscribers accounted for an aggregate of approximately 59.1% of Reis Services’s accounts receivable at December 31, 2013, including four subscribers in excess of 4.0% withand the largest representing 10.4%. Through February 27, 2014, the Company received payments of approximately $9,079,000 or 79.2% against the December 31, 2013 accounts receivable balance. Twenty-four subscribers accounted for an aggregate of approximately 58.2% of Reis Services’s accounts receivable at December 31, 2012, including two subscribers in excess of 5.0% with the largest representing 11.1%.
At December 31, 20132014 and 2012,2013, the largest individual subscriber accounted for 5.9%5.2% and 6.6%5.9%, respectively, of deferred revenue.
Discontinued Operations – Residential Development Activities
Income (loss) from discontinued operations is comprised of the following:
| For the Years Ended December 31, | ||||||||||||
| 2013 | 2012 | 2011 | ||||||||||
Revenue from sales of real estate | $ | — | $ | — | $ | 1,800,000 | ||||||
Cost of sales of real estate | — | — | (288,000 | ) | ||||||||
Litigation charge, net of recoveries (see Note 10) | 80,000 | (11,547,000 | ) | (4,460,000 | ) | |||||||
Other income (expense), net | (646,000 | ) | (750,000 | ) | (27,000 | ) | ||||||
|
|
|
|
|
| |||||||
(Loss) from discontinued operations before income tax | (566,000 | ) | (12,297,000 | ) | (2,975,000 | ) | ||||||
Income tax benefit from discontinued operations | (230,000 | ) | — | — | ||||||||
|
|
|
|
|
| |||||||
(Loss) from discontinued operations, net of income tax benefit | $ | (336,000 | ) | $ | (12,297,000 | ) | $ | (2,975,000 | ) | |||
|
|
|
|
|
| |||||||
East Lyme
Prior to its sale in April 2011, the Company’s last remaining residential development was The Orchards, a single family home development in East Lyme, Connecticut, zoned for 161 single family homes on 224 acres (“East Lyme”).
The East Lyme project was sold in a bulk transaction for a gross sales price of $1,800,000 for the remaining 119 lots in inventory, plus the release of approximately $792,000 of project-related deposits and escrows held as restricted cash. Net cash received at closing, after selling expenses and closing adjustments, and including the cash received upon release of the deposits and escrows, aggregated approximately $2,600,000. Certain of the lots at East Lyme required remediation of pesticides which were used on the property when it was an apple orchard. As a result of the April 2011 bulk sale, the Company was indemnified from any financial obligation related to the environmental remediation. The Company recorded a gain on this transaction in the second quarter of 2011 of approximately $1,242,000, which is included in income (loss) from discontinued operations.
REIS, INC. AND SUBSIDIARIES
NOTES TO CONSOLIDATED FINANCIAL STATEMENTS
(Continued)
Segment Information (continued)
A bank initially provided a $3,000,000 letterDiscontinued Operations – Residential Development Activities
Income (loss) from discontinued operations is comprised of credit to a municipality in connection with the construction of public roads at the East Lyme project. In connection with the April 2011 sale of East Lyme, the Company was released from the letter of credit by the municipality and the cash collateral at that time of $400,000 was fully released.following:
Claverack
In February 2011, the Company received cash of approximately $455,000 in full satisfaction of a mortgage note and accrued interest thereon related to the February 2010 bulk sale of 235 acres in Claverack, New York.
Gold Peak
| For the Years Ended December 31, | ||||||||||||
| 2014 | 2013 | 2012 | ||||||||||
Litigation recoveries | $ | 26,000 | $ | 80,000 | $ | 713,000 | ||||||
Litigation charge, net | — | — | (12,260,000) | |||||||||
Other (expenses), net | (977,000) | (646,000) | (750,000) | |||||||||
|
|
|
|
|
| |||||||
(Loss) from discontinued operations before income tax | (951,000) | (566,000) | (12,297,000) | |||||||||
Income tax (benefit) from discontinued operations | (382,000) | (230,000) | — | |||||||||
|
|
|
|
|
| |||||||
(Loss) from discontinued operations, net of income tax (benefit) | $ | (569,000) | $ | (336,000) | $ | (12,297,000) | ||||||
|
|
|
|
|
| |||||||
In September 2009, the Company sold the final unit at Gold Peak, the final phase of Palomino Park, a five phase multifamily residential development in Highlands Ranch, Colorado. Gold Peak was a 259 unit condominium project on the remaining 29 acre land parcel at Palomino Park. On March 13, 2012, in connection with litigation regarding construction defects at the Gold Peak project, a jury rendered its verdict whereby Reis, one of its subsidiaries (Gold Peak at Palomino Park LLC, the developer of the project (“GP LLC”)), and the construction manager/general contractor for the project (Tri-Star Construction West, LLC (“Tri-Star”)) were found jointly and severally liable for an aggregate of $18,200,000, plus other costs of approximately $756,000. The Company recorded a charge of $14,216,000 during the first quarter of 2012. On June 20, 2012, following denial of all of the defendants’ post-trial motions, Reis and its subsidiaries reached a settlement with the plaintiff, the Gold Peak homeowners association, providing for a total payment of $17,000,000. Of this amount, $5,000,000 was paid on August 3, 2012 and the remaining $12,000,000 was paid on October 15, 2012, in accordance with the settlement terms. As a result of the settlement, in the second quarter of 2012 the Company reversed $1,956,000 of the previously recorded charge. In December 2012, the Company recovered $712,500, which offset a portion of the previously recorded charge, resulting in the net litigation charge for the year ended December 31, 2012 of approximately $11,547,000. $12,260,000.
During the yearyears ended December 31, 2014, 2013 and 2012, the Company recovered $80,000.had litigation recoveries of $26,000, $80,000 and $713,000, respectively, from insurance carriers and other responsible parties. Other expenses primarily reflect legal and other professional costs incurred related to the Gold Peak litigation. For additional information pertaining to the Gold Peak litigation, see Note 10.
| 4. | Restricted Cash and Investments |
Restricted cash and investments represents a security deposit for the 530 Fifth Avenue corporate office space. The Company provided the lessor a bank-issued letter of credit, which is fully collateralized by a certificate of deposit issued by that bank. The restricted cash balance was approximately $217,000$213,000 and $216,000$217,000 at December 31, 20132014 and 2012,2013, respectively.
| 5. | Intangible Assets |
The amount of identified intangible assets, including the respective amounts of accumulated amortization, are as follows:
| December 31, | ||||||||
| 2013 | 2012 | |||||||
Database | $ | 17,149,000 | $ | 15,175,000 | ||||
Accumulated amortization | (13,238,000 | ) | (11,691,000 | ) | ||||
|
|
|
| |||||
Database, net | 3,911,000 | 3,484,000 | ||||||
|
|
|
| |||||
Customer relationships | 14,100,000 | 14,100,000 | ||||||
Accumulated amortization | (6,417,000 | ) | (5,444,000 | ) | ||||
|
|
|
| |||||
Customer relationships, net | 7,683,000 | �� | 8,656,000 | |||||
|
|
|
| |||||
Web site | 10,402,000 | 8,325,000 | ||||||
Accumulated amortization | (7,095,000 | ) | (5,220,000 | ) | ||||
|
|
|
| |||||
Web site, net | 3,307,000 | 3,105,000 | ||||||
|
|
|
| |||||
Acquired below market lease | 2,800,000 | 2,800,000 | ||||||
Accumulated amortization | (2,014,000 | ) | (1,712,000 | ) | ||||
|
|
|
| |||||
Acquired below market lease, net | 786,000 | 1,088,000 | ||||||
|
|
|
| |||||
Intangibles, net | $ | 15,687,000 | $ | 16,333,000 | ||||
|
|
|
| |||||
The Company capitalized approximately $1,974,000 and $1,952,000 to the database intangible asset and $2,077,000 and $1,855,000 to the web site intangible asset during the years ended December 31, 2013 and 2012, respectively.
| December 31, | ||||||||
| 2014 | 2013 | |||||||
Database | $ | 19,435,000 | $ | 17,149,000 | ||||
Accumulated amortization | (15,018,000) | (13,238,000) | ||||||
|
|
|
| |||||
Database, net | 4,417,000 | 3,911,000 | ||||||
|
|
|
| |||||
Customer relationships | 14,100,000 | 14,100,000 | ||||||
Accumulated amortization | (7,379,000) | (6,417,000) | ||||||
|
|
|
| |||||
Customer relationships, net | 6,721,000 | 7,683,000 | ||||||
|
|
|
| |||||
Website | 11,936,000 | 10,402,000 | ||||||
Accumulated amortization | (8,876,000) | (7,095,000) | ||||||
|
|
|
| |||||
Website, net | 3,060,000 | 3,307,000 | ||||||
|
|
|
| |||||
Acquired below market lease | 2,800,000 | 2,800,000 | ||||||
Accumulated amortization | (2,317,000) | (2,014,000) | ||||||
|
|
|
| |||||
Acquired below market lease, net | 483,000 | 786,000 | ||||||
|
|
|
| |||||
Intangibles, net | $ | 14,681,000 | $ | 15,687,000 | ||||
|
|
|
| |||||
REIS, INC. AND SUBSIDIARIES
NOTES TO CONSOLIDATED FINANCIAL STATEMENTS
(Continued)
Intangible Assets (continued)
The Company capitalized approximately $2,286,000 and $1,974,000 to the database intangible asset and $1,537,000 and $2,077,000 to the website intangible asset during the years ended December 31, 2014 and 2013, respectively.
Amortization expense for intangible assets aggregated approximately $4,697,000$4,829,000 for the year ended December 31, 2013,2014, of which approximately $1,547,000$1,780,000 related to the database, which is charged to cost of sales, approximately $973,000$962,000 related to customer relationships, which is charged to sales and marketing expense, approximately $1,875,000$1,784,000 related to web sitewebsite development, which is charged to product development expense, and approximately $302,000$303,000 related to the value ascribed to the below market terms of the office lease, which is charged to general and administrative expense, all in the Reis Services segment. Amortization expense for intangible assets aggregated approximately $4,697,000 for the year ended December 31, 2013, of which approximately $1,547,000 related to the database, approximately $973,000 related to customer relationships, approximately $1,875,000 related to website development, and approximately $302,000 related to the value ascribed to the below market terms of the office lease. Amortization expense for intangible assets aggregated approximately $4,629,000 for the year ended December 31, 2012, of which approximately $1,907,000 related to the database, approximately $982,000 related to customer relationships, approximately $1,436,000 related to web sitewebsite development, and approximately $304,000 related to the value ascribed to the below market terms of the office lease, all in the Reis Services segment. Amortization expense for intangible assets aggregated approximately $4,788,000 for the year ended December 31, 2011, of which approximately $2,410,000 related to the database, approximately $992,000 related to customer relationships, approximately $1,084,000 related to web site development, and approximately $302,000 related to the value ascribed to the below market terms of the office lease.
The Company’s future amortization expense related to the net intangible asset balance at December 31, 20132014 follows:
For the Year Ended December 31, | Amount | Amount | ||||||
2014 | $ | 4,443,000 | ||||||
2015 | 3,548,000 | $ | 4,552,000 | |||||
2016 | 2,308,000 | 3,424,000 | ||||||
2017 | 1,317,000 | 2,131,000 | ||||||
2018 | 1,045,000 | 1,367,000 | ||||||
2019 | 1,058,000 | |||||||
Thereafter | 3,026,000 | 2,149,000 | ||||||
|
| |||||||
Total | $ | 15,687,000 | $ | 14,681,000 | ||||
|
| |||||||
| 6. | Debt |
The Company has no debt outstanding at December 31, 20132014 and 2012.2013.
In October 2012, Reis Services, as borrower, and the Company, as guarantor, entered into a loan and security agreement with Capital One, National Association, as lender, for a $10,000,000 revolving credit facility (the “Revolver”). The Revolver has a three year term expiringwhich is set to expire on October 16, 2015, and any borrowings bear interest at a rate of LIBOR + 2.00% per annum (for LIBOR loans) or the greater of 1.00% or the bank’s prime rate minus 0.50% per annum (for base rate loans) and is subject to an unused facility fee of 0.25% per annum. The Company paid a commitment fee of $50,000 in connection with the closing. The Revolver is secured by a security interest in substantially all of the tangible and intangible assets of Reis Services and a pledge by the Company of its membership interests in Reis Services. The Revolver also contains customary affirmative and negative covenants, including minimum financial covenants, as defined in the agreement; all of the covenants were met at December 31, 2014 and 2013. No borrowings were made on the Revolver during 2012the years ended December 31, 2014, 2013 or 2013.2012.
During 2012, the Company repaid the remaining outstanding balance of $5,691,000 in connection with borrowings under a credit agreement, dated October 11, 2006, with the Bank of Montreal, Chicago Branch, as administrative agent, and BMO Capital Markets, as lead arranger. Loan proceeds were used to finance $25,000,000 of the cash portion of the Merger consideration. The final scheduled maturity date of all amounts borrowed pursuant to the credit agreement was September 30, 2012. The interest rate during 2012 was LIBOR + 1.50%.
REIS, INC. AND SUBSIDIARIES
NOTES TO CONSOLIDATED FINANCIAL STATEMENTS
(Continued)
| 7. | Income Taxes |
The components of income tax expense (benefit) are as follows:
| For the Years Ended December 31, | ||||||||||||
| 2013 | 2012 | 2011 | ||||||||||
Current Federal alternative minimum (“AMT”) expense | $ | 42,000 | $ | — | $ | — | ||||||
Current state and local tax expense (A) | 132,000 | 187,000 | — | |||||||||
Deferred Federal tax expense (benefit) (B) | (12,775,000 | ) | (5,279,000 | ) | (3,606,000 | ) | ||||||
Deferred state and local tax expense (benefit) (C) | (1,299,000 | ) | (335,000 | ) | (469,000 | ) | ||||||
|
|
|
|
|
| |||||||
Consolidated income tax expense (benefit), including taxes attributable to discontinued operations (D) | (13,900,000 | ) | (5,427,000 | ) | (4,075,000 | ) | ||||||
Less income tax expense (benefit) attributable to discontinued operations | (230,000 | ) | — | — | ||||||||
|
|
|
|
|
| |||||||
Income tax (benefit) (E) | $ | (13,670,000 | ) | $ | (5,427,000 | ) | $ | (4,075,000 | ) | |||
|
|
|
|
|
| |||||||
| For the Years Ended December 31, | ||||||||||||
| 2014 | 2013 | 2012 | ||||||||||
Current Federal alternative minimum tax (“AMT”) expense | $ | 92,000 | $ | 42,000 | $ | — | ||||||
Current state and local tax expense | 254,000 | 132,000 | 187,000 | |||||||||
Deferred Federal tax expense (benefit) (A) | 2,118,000 | (12,775,000) | (5,279,000) | |||||||||
Deferred state and local tax expense (benefit) | (4,000) | (1,299,000) | (335,000) | |||||||||
|
|
|
|
|
| |||||||
Consolidated income tax expense (benefit), including taxes | 2,460,000 | (13,900,000) | (5,427,000) | |||||||||
Less income tax expense (benefit) attributable to discontinued | (382,000) | (230,000) | — | |||||||||
|
|
|
|
|
| |||||||
Income tax expense (benefit) (C) | $ | 2,842,000 | $ | (13,670,000) | $ | (5,427,000) | ||||||
|
|
|
|
|
| |||||||
| ||||||||||||
| (A) | Includes an AMT (benefit) of $(92,000) and |
| (B) | Includes |
| (C) |
Reflects the tax |
The reconciliation of income tax computed at the U.S. Federal statutory rate to income tax expense (benefit) on continuing operations is as follows:
| For the Years Ended December 31, | For the Years Ended December 31, | |||||||||||||||||||||||||||||||||||||||||||||||
| 2013 | 2012 | 2011 | 2014 | 2013 | 2012 | |||||||||||||||||||||||||||||||||||||||||||
| Amount | Percent | Amount | Percent | Amount | Percent | Amount | Percent | Amount | Percent | Amount | Percent | |||||||||||||||||||||||||||||||||||||
Tax (benefit) expense at U.S. statutory rate | $ | 1,492,000 | 35.00 | % | $ | (3,399,000 | ) | (35.00 | %) | $ | (766,000 | ) | (35.00 | %) | ||||||||||||||||||||||||||||||||||
Tax expense (benefit) at U.S. statutory rate | $ | 2,610,000 | 35.00% | $ | 1,492,000 | 35.00% | $ | (3,399,000) | (35.00%) | |||||||||||||||||||||||||||||||||||||||
State and local tax expense (benefit), net of Federal impact | 86,000 | 2.01 | % | (96,000 | ) | (0.99 | %) | (61,000 | ) | (2.80 | %) | 194,000 | 2.60% | 86,000 | 2.01% | (96,000) | (0.99%) | |||||||||||||||||||||||||||||||
Impact of state and local tax rate change net of Federal impact | 110,000 | 2.58 | % | 6,000 | 0.06 | % | 67,000 | 3.08 | % | 27,000 | 0.36% | 110,000 | 2.58% | 6,000 | 0.06% | |||||||||||||||||||||||||||||||||
Cost (benefit) attributable to valuation allowance, net | (150,000 | ) | (3.52 | %) | 3,671,000 | 37.80 | % | 754,000 | 34.44 | % | — | — | (150,000) | (3.52%) | 3,671,000 | 37.80% | ||||||||||||||||||||||||||||||||
Non-deductible items | 9,000 | 0.21 | % | 5,000 | 0.05 | % | 6,000 | 0.28 | % | 11,000 | 0.15% | 9,000 | 0.21% | 5,000 | 0.05% | |||||||||||||||||||||||||||||||||
Benefit attributable to reduction in allowance against certain deferred tax assets | (15,217,000 | ) | (356.94 | %) | (5,614,000 | ) | (57.81 | %) | (4,075,000 | ) | (186.19 | %) | — | — | (15,217,000) | (356.94%) | (5,614,000) | (57.81%) | ||||||||||||||||||||||||||||||
|
|
|
|
|
|
|
|
|
|
|
| |||||||||||||||||||||||||||||||||||||
Income tax expense (benefit) | $ | 2,842,000 | 38.11% | $ | (13,670,000) | (320.66%) | $ | (5,427,000) | (55.89%) | |||||||||||||||||||||||||||||||||||||||
| $ | (13,670,000 | ) | (320.66 | %) | $ | (5,427,000 | ) | (55.89 | %) | $ | (4,075,000 | ) | (186.19 | %) |
|
|
|
|
|
| ||||||||||||||||||||||||||||
|
|
|
|
|
| |||||||||||||||||||||||||||||||||||||||||||
During 2013 2012 and 2011,2012, the Company recorded an aggregate deferred Federal, state and local income tax benefit of $15,217,000 $5,614,000 and $4,075,000,$5,614,000, respectively, from the release of the valuation allowance against certain deferred tax assets. In the fourth quarters of 2013 2012 and 2011,2012, the Company reversed the valuation allowance recorded against a portion of its net operating loss (“NOL”)NOL carryforwards in 2011 and 2012, and the remaining balance of the valuation allowance against NOL and AMT credit carryforwards in 2013. The decision to reduce the valuation allowance in each period was made after management determined, based on an assessment of continuing operations, profitability and forecasts of future taxable income, that these deferred tax assets would be realized in the future.
Separately, during the fourth quarter of 2013, the Company also reevaluated the availability of state operating loss carryforwards and modified the future effective state and local tax rate. As a result, the future tax benefit was reduced by approximately $346,000 during the year ended December 31, 2013. In
During March 2014, New York State enacted a law to (1) reduce corporate tax rates, effective in future years and (2) change the fourth quartermethod of 2011,determining the availability and use of NOLs existing at December 31, 2014. As a consequence, the Company revisedevaluated all elements affecting the balance of its annual effectivenet deferred tax rate. The change resulted from a reviewassets, including the availability of the Company’s operations since the MergerNew York State and the adoption by New York City of a 100% revenue apportionment factor which is being implemented over a number of years through 2017. As a result ofNOL carryforwards and the reductionchanges in the effectiveNew York State law and are reflected in the 2014 income tax rate, the deferred tax benefit was reduced by approximately $339,000 for the year ended December 31, 2011.expense.
REIS, INC. AND SUBSIDIARIES
NOTES TO CONSOLIDATED FINANCIAL STATEMENTS
(Continued)
Income Taxes (continued)
In January 2015, New York City proposed that it would change its tax laws to conform with the New York State changes. The Company will assess the impact of changes for New York City when a law is enacted.
Due to the amount of its NOL and credit carryforwards, the Company does not anticipate paying Federal income taxes for the foreseeable future.a number of years. The Company expects, in the near-term,future, that it will be subject to cash payments for Federal AMT and for a portion of its state and local income taxes as the changed New York State tax rules and Federal AMT.anticipated New York City rules limit the amount of existing NOLs which could be used each year.
Deferred income taxes reflect the net tax effects of temporary differences between the carrying amount of assets and liabilities for financial reporting purposes and the amounts used for income tax purposes. The net deferred tax asset was approximately $23,789,000$22,437,000 and $9,622,000$23,789,000 at December 31, 20132014 and 2012,2013, respectively, of which $2,472,000$3,798,000 and $1,065,000$2,472,000 is reflected as a net current asset in prepaid and other assets and $21,317,000$18,639,000 and $8,557,000$21,317,000 is reflected separately as a net non-current asset in the accompanying consolidated balance sheets, respectively. The significant portion of the deferred tax items primarily relates to: (1)to deferred tax assets including NOL carryforwards; (2)carryforwards, Federal AMT credit carryforwards; (3)carryforwards and stock based compensation; and (4) liability reserves, all as they relate to deferred tax assets; and (5)compensation, with the remainder of the deferred tax liabilityitems relating to liabilities resulting from the intangible assets recorded at the time of the Merger.
Significant components of the Company’s deferred tax assets and liabilities are as follows:
| December 31, | December 31, | |||||||||||||||
| 2013 | 2012 | 2014 | 2013 | |||||||||||||
Deferred Tax Assets | ||||||||||||||||
Net operating loss carryforwards | $ | 23,771,675 | $ | 24,807,803 | $ | 22,113,983 | $ | 23,771,675 | ||||||||
Asset basis differences — tax amount greater than book value | 263,944 | 276,365 | 259,922 | 263,944 | ||||||||||||
Liability reserves | 212,376 | 658,713 | 212,142 | 212,376 | ||||||||||||
Reserve for option cancellations | 99,689 | 111,878 | — | 99,689 | ||||||||||||
Stock compensation plans | 1,598,969 | 1,514,453 | 1,520,041 | 1,598,969 | ||||||||||||
AMT credit carryforwards | 1,181,423 | 1,139,392 | 1,273,792 | 1,181,423 | ||||||||||||
Other | 31,167 | 25,871 | 21,585 | 31,167 | ||||||||||||
|
|
|
| |||||||||||||
| 27,159,243 | 28,534,475 | 25,401,465 | 27,159,243 | |||||||||||||
Valuation allowance | — | (15,217,496 | ) | — | — | |||||||||||
|
|
|
| |||||||||||||
Total deferred tax assets | 27,159,243 | 13,316,979 | 25,401,465 | 27,159,243 | ||||||||||||
|
|
|
| |||||||||||||
Deferred Tax Liabilities | ||||||||||||||||
Acquired asset differences — book value greater than tax | (3,145,741 | ) | (3,676,472 | ) | (2,669,655) | (3,145,741) | ||||||||||
Asset basis differences — carrying amount value greater than tax | (224,982 | ) | (18,087 | ) | (295,073) | (224,982) | ||||||||||
|
|
|
| |||||||||||||
Total deferred tax liabilities | (3,370,723 | ) | (3,694,559 | ) | (2,964,728) | (3,370,723) | ||||||||||
|
|
|
| |||||||||||||
Net deferred tax asset (liability) | $ | 23,788,520 | $ | 9,622,420 | $ | 22,436,737 | $ | 23,788,520 | ||||||||
|
|
|
| |||||||||||||
The Company has aggregate Federal NOL carryforwards aggregating approximately $61,165,000 at December 31, 2014, as well as significant state and local NOL carryforwards aggregating approximately $66,006,000 at December 31, 2013.carryforwards. These NOLs include NOLs generated subsequent to the Merger, losses from Privatethe Reis Services business prior to the Merger losses obtained from the Company’s 1998 merger with Value Property Trust (“VLP”) and the Company’s operating losses prior to the Merger. Approximately $25,158,000$20,317,000 of these Federal NOLs are subject to an annual limitation, whereas the remaining balance of approximately $40,848,000 is not subject to such a limitation. There is an annual limitation on the use of NOLs after an ownership change, pursuant to Section 382 of the Internal Revenue Code. As a result of the Merger, the Company experienced such an ownership change which resulted in a new annual limitation of $2,779,000. However, becauseBecause of the accumulation of annual limitations, it is expected that the use of NOLs will not be limited by expiration. The 2014 New York State law discussed above and the anticipated conforming changes to the New York City law limits the amount of existing NOLs which could be used each year in those jurisdictions; however, all such losses are expected to be fully utilized in the future. A substantial NOL was realized during the year ended December 31, 2012 as a result of the Gold Peak litigation settlement, discussed in Note 10.
A further requirement of the tax rules is that after a corporation experiences an ownership change, it must satisfy the continuity of business enterprise, or COBE, requirement (which generally requires that a corporation continue its historic business or use a
REIS, INC. AND SUBSIDIARIES
NOTES TO CONSOLIDATED FINANCIAL STATEMENTS
(Continued)
Income Taxes (continued)
significant portion of its historic business assets in its business for the two year period beginning on the date of the ownership change) to be able to utilize NOLs generated prior to such ownership change. The Company believes that the COBE requirement was met through the required two year period subsequent to the ownership change. In February 2012, the Internal Revenue Service (“IRS”) completed an audit of the Company’s 2009 Federal income tax return. The 2009 tax year included the end of the two year period subsequent to the Merger. The IRS issued a no change letter related to the Company’s 2009 tax return, thereby accepting the Company’s position that the two year COBE requirement was met.
REIS, INC. AND SUBSIDIARIES
NOTES TO CONSOLIDATED FINANCIAL STATEMENTS
(Continued)
Income Taxes (continued)
The Company does not have any near-term expirations of NOLs; the next NOL expiration for the Company is in 20172018 for approximately $3,391,000$252,000 of Federal NOLs. Included in the Federal and state NOLs at December 31, 20132014 is approximately $1,723,000 attributable to excess tax deductions from the issuance of common shares as non-cash compensation.compensation in prior years. The tax benefits attributable to those NOLs will be credited directly to additional paid in capital when utilized to offset taxes payable.
A valuation allowance is required to reduce deferred tax assets if, based on the weight of the evidence, it is more likely than not that some portion or all of the deferred tax assets will not be realized. As a result of management’s current evaluation of the Company’s future operations, it has been determined that no valuation allowance was necessary at either December 31, 2014 or 2013. Management determined that a valuation allowance of approximately $15,217,000 was necessary at December 31, 2012. The allowance at December 31, 2012 related primarily to NOL carryforwards and AMT credits. The decrease in the allowance in 2012 was primarily attributable to the $5,614,000 increase in deferred tax assets expected to be realized in the years subsequent to December 31, 2012, offset in part by the litigation settlement payments made in 2012, net of recoveries, which resulted in an increase to the 2012 NOL. The decrease in the allowance in 2011 was primarily attributable to the release of valuation allowance against deferred assets expected to be utilized in the three years subsequent to December 31, 2011 of $4,075,000, a reduction in the effective tax rate utilized by the Company (approximately $1,850,000), and utilizing the tax loss on the sale of the Company’s East Lyme project for which an allowance was provided for, related to the net liability in 2010, offset by the allowance provided for the net litigation liability at December 31, 2011.
The Company and its subsidiaries have been audited by the Federal tax authorities for 2009 and the 2012 Federal tax return is currently under audit. The Federal tax returns are open for 2010, 2011 and 2012; all2013. All prior Federal periods are closed, except to the extent that NOLs were generated in a given year. The acquired VLP net operating loss carryforward is openTax returns for 1997 and 1998 are open for the NOLs generated during those years. Privateyears from an acquired business at that time. The Reis Services business prior to the Merger, was audited by the IRS for tax years ending October 31, 2005 and 2006. In addition, tax returns are open from 2000 to 2002 and 2007, to the extent that NOLs were generated during these periods by Private Reis.the Reis Services business prior to the Merger.
Tax returns for the Company and a subsidiary are under audit by the State of New York for the years 2004 to 2006 and are open for the years 2007 to 2012.2013. As a result of the New York State audit, New York City returns are open for the years 2004 to 20122013 as well. The tax years for another subsidiary, operating in Colorado are open from 20092010 to 2012.
The Company’s reserve for unrecognized tax benefits, including estimated interest, was $62,000$105,000 and $345,000$62,000 at December 31, 20132014 and 2012,2013, respectively. The unrecognized tax benefits as well as related interest was included in general and administrative expenses. The Company recorded an additional provision, including interest, of $43,000 and $51,000 in 2014 and $200,000 in 2013, and 2012, respectively. A reconciliation of the unrecognized tax benefits for the years ended December 31, 2014, 2013 2012 and 20112012 follows:
| For the Years Ended December 31, | For the Years Ended December 31, | |||||||||||||||||||||||
| 2013 | 2012 | 2011 | 2014 | 2013 | 2012 | |||||||||||||||||||
Balance at beginning of period | $ | 345,000 | $ | 145,000 | $ | 145,000 | $ | 62,000 | $ | 345,000 | $ | 145,000 | ||||||||||||
Additional provisions and interest related to prior years | 51,000 | 200,000 | 7,700 | 43,000 | 51,000 | 200,000 | ||||||||||||||||||
Resolution of matters during the period | (334,000 | ) | — | (7,700 | ) | — | (334,000) | — | ||||||||||||||||
|
|
|
|
|
| |||||||||||||||||||
Balance at end of period | $ | 62,000 | $ | 345,000 | $ | 145,000 | $ | 105,000 | $ | 62,000 | $ | 345,000 | ||||||||||||
|
|
|
|
|
| |||||||||||||||||||
The Company expects that a substantial portion of the 20132014 balance could be resolved in 2014.2015.
| 8. | Stockholders’ Equity |
Between December 2008 and August 2011,During the Company’s Board of Directors (the “Board”) authorized the repurchase of up to an aggregate amount of $5,000,000 of the Company’s common stock, of which approximately $551,000 remained available for repurchases as ofyears ended December 31, 2013. Although2014, 2013 and 2012, the Company has remaining availability underdid not repurchase any shares of common stock.
The Company commenced a prior authorization, such authorization was at a timequarterly dividend program in the second quarter of 2014 when it declared and paid an initial quarterly cash dividend of $0.11 per common share in June 2014. In the Company’s stock pricethird and cash position was significantly different than where they were at December 31, 2013; and therefore, management would probably seek a new authorization from the Board iffourth quarters of 2014, the Company were to consider stock repurchasesdeclared and paid a quarterly cash dividend of $0.11 per common share in the future.each of September 2014 and December 2014. Aggregate
REIS, INC. AND SUBSIDIARIES
NOTES TO CONSOLIDATED FINANCIAL STATEMENTS
(Continued)
Stockholders’ Equity (continued)
The stock repurchases are permitted from time to time in the open market or through privately negotiated transactions. Depending on market conditions, financial developments and other factors, additional amounts may be authorizeddividends paid by the Board whereby future purchases could be commenced or suspended at any time, or from time to time, without prior notice. The Company may make purchases pursuant to a trading plan under Securities Exchange Act Rule 10b5-1, permitting open market purchases of common stock during blackout periods consistent with the Company’s “Policies for Transactions in Reis Stock and Insider Trading and Tipping.”
During the years ended December 31, 2013 and 2012,2014 approximated $3,698,000. On February 2, 2015, the Company did not repurchase any shares ofannounced that it has increased the dividend payable on March 18, 2015 to $0.14 per common stock. During the year ended December 31, 2011,share. Although the Company repurchased 50,060 shares of common stock at an average price of $8.96 per share.
anticipates paying a quarterly dividend hereafter, future dividends are subject to approval by the Board. The Company did not declare or distribute any dividends during the years ended December 31, 2013 2012 or 2011.and 2012.
| 9. | Stock Plans and Other Incentives |
The Company has adopted certain incentive plans for the purpose of attracting and retaining the Company’s directors, officers and employees by having the ability to issue options, restricted stock units (“RSUs”), or stock awards. Awards granted under the Company’s incentive plans expire ten years from the date of grant and vest over periods ranging generally from three to five years for employees.
Option Awards
The following table presents option activity and other plan data for the years ended December 31, 2014, 2013 2012 and 2011:2012:
| For the Years Ended December 31, | For the Years Ended December 31, | |||||||||||||||||||||||||||||||||||||||||||||||
| 2013 | 2012 | 2011 | 2014 | 2013 | 2012 | |||||||||||||||||||||||||||||||||||||||||||
| Options | Weighted- Average Exercise Price | Options | Weighted- Average Exercise Price | Options | Weighted- Average Exercise Price | Options | Weighted- Average Exercise Price | Options | Weighted- Average Exercise Price | Options | Weighted- Average Exercise Price | |||||||||||||||||||||||||||||||||||||
Outstanding at beginning of period | 645,448 | $ | 8.94 | 663,172 | $ | 8.82 | 680,896 | $ | 8.73 | 627,724 | $ | 9.05 | 645,448 | $ | 8.94 | 663,172 | $ | 8.82 | ||||||||||||||||||||||||||||||
Granted | — | $ | — | — | $ | — | — | $ | — | 20,000 | $ | 18.52 | — | $ | — | — | $ | — | ||||||||||||||||||||||||||||||
Exercised | (8,862 | ) | $ | (5.24 | ) | (8,862 | ) | $ | (4.46 | ) | (8,862 | ) | $ | (5.43 | ) | (56,362) | $ | (8.25) | (8,862) | $ | (5.24) | (8,862) | $ | (4.46) | ||||||||||||||||||||||||
Cancelled through cash settlement | (8,862 | ) | $ | (5.24 | ) | (8,862 | ) | $ | (4.46 | ) | (8,862 | ) | $ | (5.43 | ) | (8,862) | $ | (4.09) | (8,862) | $ | (5.24) | (8,862) | $ | (4.46) | ||||||||||||||||||||||||
Forfeited/cancelled/expired | — | $ | — | — | $ | — | — | $ | — | — | $ | — | — | $ | — | — | $ | — | ||||||||||||||||||||||||||||||
|
|
|
|
|
| |||||||||||||||||||||||||||||||||||||||||||
Outstanding at end of period | 627,724 | $ | 9.05 | 645,448 | $ | 8.94 | 663,172 | $ | 8.82 | 582,500 | $ | 9.52 | 627,724 | $ | 9.05 | 645,448 | $ | 8.94 | ||||||||||||||||||||||||||||||
|
|
|
|
|
|
|
|
|
|
|
| |||||||||||||||||||||||||||||||||||||
Options exercisable at end of period | 627,724 | $ | 9.05 | 420,448 | $ | 9.43 | 361,172 | $ | 9.10 | 562,500 | $ | 9.21 | 627,724 | $ | 9.05 | 420,448 | $ | 9.43 | ||||||||||||||||||||||||||||||
|
|
|
|
|
|
|
|
|
|
|
| |||||||||||||||||||||||||||||||||||||
Options exercisable which can be settled in cash | 17,724 | $ | 4.09 | 35,448 | $ | 4.67 | 53,172 | $ | 4.60 | — | $ | — | 17,724 | $ | 4.09 | 35,448 | $ | 4.67 | ||||||||||||||||||||||||||||||
|
|
|
|
|
|
|
|
|
|
|
| |||||||||||||||||||||||||||||||||||||
Weighted average fair value of options granted per year (per option) | $ | — | $ | — | $ | — | $ | 7.64 | $ | — | $ | — | ||||||||||||||||||||||||||||||||||||
|
|
|
|
|
| |||||||||||||||||||||||||||||||||||||||||||
Weighted average remaining contractual life at end of period | 4.5 years | 5.3 years | 6.2 years | 3.9 years | 4.5 years | 5.3 years | ||||||||||||||||||||||||||||||||||||||||||
Certain outstanding options allowhad allowed the option holder to receive from the Company, in cancellation of the holder’s option, a cash payment with respect to each cancelled option equal to the amount, if any, by which the fair market value of the share of stock underlying the option exceeds the exercise price of such option. The Company accountsaccounted for these options as liability awards. ThisThe liability iswas adjusted at the end of each reporting period to reflect: (1) the net cash payments to option holders made during each period; (2) the impact of the exercise and expiration of options; and (3) the changes in the market price of the Company’s common stock. Changes in the settlement value of option awards treated under the liability method arewere reflected as incomean increase to, or a reduction of, expense in the consolidated statements of operations.
At December 31, 2014, there were no options outstanding for which a liability was required as the remaining liability award options were either exercised or settled with a net cash payment. At December 31, 2013, the liability for option cancellations was approximately $268,000 based upon the difference in the closing stock price of the Company’s common stock at December 31, 2013 of $19.23 per share and the individual exercise prices of the outstanding 17,724 “in-the-money” options that were accounted for as a liability award at that date. AtThe Company recorded a compensation benefit of approximately $137,000 for the year ended December 31, 2012, the liability for option cancellations was approximately $297,000 based upon the difference in the closing stock price of the Company at December 31, 2012 of $13.03 per share2014 and the individual exercise prices of the outstanding 35,448 “in-the-money” options
REIS, INC. AND SUBSIDIARIES
NOTES TO CONSOLIDATED FINANCIAL STATEMENTS
(Continued)
Stock Plans and Other Incentives (continued)
that were accounted for as a liability award at that date. The Company recorded compensation expense of approximately $82,000 $114,000 and $121,000$114,000 for the years ended December 31, 2013 2012 and 2011,2012, respectively, in general and administrative expenses in the consolidated statements of operations related to the respective changes in the amount of the liability for option cancellations.
In each of the years ended December 31, 2014, 2013 2012 and 2011,2012, a total of 8,862 options were settled with net cash payments aggregating approximately $132,000, $110,000 and $58,000, respectively.
REIS, INC. AND SUBSIDIARIES
NOTES TO CONSOLIDATED FINANCIAL STATEMENTS
(Continued)
Stock Plans and $38,000, respectively.Other Incentives (continued)
In May 2014, the Company granted 20,000 options to one employee. These options, which are accounted for as an equity award, vest 20% per year over a five-year period and have an exercise price of $18.52 per option, based upon the closing price of the Company’s common stock on the date of grant. For expense purposes, the Company estimated the fair value of each option granted on the date of grant using the Black-Scholes option-pricing model at $7.64 per option. The following table includes the assumptions that were made and the estimated fair value for option grants in 2014 (no option awards were granted during 2013 or 2012):
| 2014 Grant | ||||
Stock price on grant date | $ | 18.52 | ||
Exercise price | $ | 18.52 | ||
Dividend yield | 2.38% | |||
Risk-free interest rate | 2.20% | |||
Expected life | 8.0 years | |||
Estimated volatility | 47.8% | |||
Fair value of options granted (per option) | $ | 7.64 | ||
The following table presents additional option details at December 31, 20132014 and 2012:2013:
| Options Outstanding and Exercisable at December 31, 2013 | Options Outstanding and Exercisable at December 31, 2012 | |||||||||||||||||||||||||||||||
Range of Exercise Prices | Outstanding | Remaining Contractual Life (Years) | Weighted Average Exercise Price | Intrinsic Value (A) | Outstanding | Remaining Contractual Life (Years) | Weighted Average Exercise Price | Intrinsic Value (A) | ||||||||||||||||||||||||
$4.09 (B) | 17,724 | 0.72 | $ | 4.09 | $ | 268,341 | 17,724 | 1.72 | $ | 4.09 | $ | 158,453 | ||||||||||||||||||||
$5.24 (B) | — | — | — | — | 17,724 | 1.00 | 5.24 | 138,070 | ||||||||||||||||||||||||
$7.50 | 70,000 | 3.62 | 7.50 | 821,100 | 70,000 | 4.62 | 7.50 | 387,100 | ||||||||||||||||||||||||
$8.03 | 225,000 | 6.58 | 8.03 | 2,521,125 | 225,000 | 7.50 | 8.03 | 1,126,125 | ||||||||||||||||||||||||
$10.40 | 315,000 | 3.41 | 10.40 | 2,781,450 | 315,000 | 4.41 | 10.40 | 828,450 | ||||||||||||||||||||||||
|
|
|
|
|
|
|
| |||||||||||||||||||||||||
| 627,724 | 4.49 | 9.05 | $ | 6,392,016 | 645,448 | 5.34 | 8.94 | $ | 2,638,198 | |||||||||||||||||||||||
|
|
|
|
|
|
|
| |||||||||||||||||||||||||
| Options Outstanding and Exercisable at December 31, 2014 | Options Outstanding and Exercisable at December 31, 2013 | |||||||||||||||||||||||||||||||
Range of Exercise Prices | Outstanding | Remaining Contractual Life (Years) | Weighted Average Exercise Price | Intrinsic Value (A) | Outstanding | Remaining Contractual Life (Years) | Weighted Average Exercise Price | Intrinsic Value (A) | ||||||||||||||||||||||||
$ 4.09(B) | — | — | $ | — | $ | — | 17,724 | 0.7 | $ | 4.09 | $ | 268,341 | ||||||||||||||||||||
$ 7.50 | 47,500 | 2.6 | 7.50 | 886,825 | 70,000 | 3.6 | 7.50 | 821,100 | ||||||||||||||||||||||||
$ 8.03 | 225,000 | 5.6 | 8.03 | 4,082,625 | 225,000 | 6.6 | 8.03 | 2,521,125 | ||||||||||||||||||||||||
$ 10.40 | 290,000 | 2.4 | 10.40 | 4,573,300 | 315,000 | 3.4 | 10.40 | 2,781,450 | ||||||||||||||||||||||||
$ 18.52 | 20,000 | 9.4 | 18.52 | 153,000 | — | — | — | — | ||||||||||||||||||||||||
|
|
|
|
|
|
|
| |||||||||||||||||||||||||
| 582,500 | 3.9 | 9.52 | $ | 9,695,750 | 627,724 | 4.5 | 9.05 | $ | 6,392,016 | |||||||||||||||||||||||
|
|
|
|
|
|
|
| |||||||||||||||||||||||||
| ||||||||||||||||||||||||||||||||
| (A) | The intrinsic value is the amount by which the fair value of the Company’s stock price exceeds the exercise price of an option at December 31, |
| (B) | These options are the remaining options accounted for as liability |
The Company estimates the fair value of each option grantedDividends are not paid or accrued on the date of grant using the Black-Scholes option-pricing model; however there were no option awards granted during the years ended December 31, 2013, 2012 or 2011.unexercised options.
RSU Awards
The following table presents the changes in RSUs outstanding for the years ended December 31, 2014, 2013 2012 and 2011:2012:
| For the Years Ended December 31, | For the Years Ended December 31, | |||||||||||||||||||||||
| 2013 | 2012 | 2011 | 2014 | 2013 | 2012 | |||||||||||||||||||
Outstanding at beginning of period | 469,848 | 590,662 | 523,479 | 365,686 | 469,848 | 590,662 | ||||||||||||||||||
Granted | 103,176 | 169,481 | 251,281 | 105,132 | 103,176 | 169,481 | ||||||||||||||||||
Common stock delivered (A) (B) (C) | (205,075 | ) | (290,295 | ) | (184,098 | ) | (185,224) | (205,075) | (290,295) | |||||||||||||||
Forfeited | (2,263 | ) | — | — | (7,621) | (2,263) | — | |||||||||||||||||
|
|
|
|
|
| |||||||||||||||||||
Outstanding at end of period | 365,686 | 469,848 | 590,662 | 277,973 | 365,686 | 469,848 | ||||||||||||||||||
|
|
|
|
|
| |||||||||||||||||||
Intrinsic value (D) | $ | 7,032,000 | $ | 6,122,000 | $ | 5,386,800 | $ | 7,275,000 | $ | 7,032,000 | $ | 6,122,000 | ||||||||||||
|
|
|
|
|
| |||||||||||||||||||
| ||||||||||||||||||||||||
| (A) | In the 2014 period, all of the vested RSUs were issued as shares. |
| (B) | The 2013 period includes 80,139 shares which were used to settle minimum employee withholding tax obligations for 16 employees of approximately $1,280,000 in 2013. A net of 124,936 shares of common stock were delivered in 2013. |
The 2012 period includes 84,367 shares which were used to settle minimum employee withholding tax obligations for 16 employees of approximately $851,000 in 2012. A net of 133,518 shares of common stock were delivered in 2012. |
| (D) | For purposes of this calculation, the Company’s closing stock prices were $26.17, $19.23 |
REIS, INC. AND SUBSIDIARIES
NOTES TO CONSOLIDATED FINANCIAL STATEMENTS
(Continued)
Stock Plans and Other Incentives (continued)
In February 2014, an aggregate of 91,431 RSUs were granted to employees, which RSUs vest one-third a year over three years and had a grant date fair value of $18.13 per RSU. In December 2014, an aggregate of 6,900 RSUs were granted, which RSUs vest upon the third anniversary of the grant date and had a grant date fair value of $21.71 per RSU. In February 2013, an aggregate of 91,356 RSUs were granted to employees, which RSUs vest one-third a year over three years and had a grant date fair value of $16.20 per RSU (which was determined based on the closing stock price of the Company’s common stock on the applicable date of grant).RSU. In February 2012, an aggregate of 143,783 RSUs were granted to employees, which RSUs vest one-third a year over three years and had a grant date fair value of $10.05 per RSU (whichRSU. In each case, the grant date fair value was determined based on the closing stock price of the Company’s common stock on the applicable date of grant). In March 2011, an aggregate of 214,135 RSUs were granted to employees, which RSUs vest one-third a year over three years and had a weighted average grant date fair value of $7.41 per RSU (which was determined based on the closing stock price of the Company’s common stock on the applicable date of grant).grant. The awards granted to employees in 2014, 2013 2012 and 20112012 are treated as equity awards and the grant date fair value is charged to compensation expense at the corporate level on a straight-line basis over the vesting periods. Dividends are not paid or accrued on unvested employee RSUs.
During the years ended December 31, 2014, 2013 2012 and 2011,2012, an aggregate of 6,801 RSUs, 11,820 RSUs 25,698 RSUs and 37,14625,698 RSUs, respectively, were granted to non-employee directors (with an average grant date fair value of $20.28, $15.56 $9.54 and $8.25$9.54 per RSU, respectively) related to the equity component of their compensation. In each case, the grant date fair value was determined as of the last trading day of the quarter for which the RSUs were being received as compensation. The RSUs are immediately vested, but are not deliverable to the non-employee directors until six months after termination of their service as a director. Dividends are paid on RSUs granted to non-employee directors. The Company issued 72,41040,564 and 6,27072,410 shares in December2014 and 2012, and 2011, respectively, to satisfy the settlement of RSUs related to directors that retired from the Board during those years.six months prior.
Option and RSU Expense Information
The Company recorded non-cash compensation expense of approximately $1,702,000, $1,859,000 $2,181,000 and $2,083,000,$2,181,000, respectively, including approximately $138,000, $173,000 $222,000 and $295,000$222,000 related to non-employee director equity compensation, for the years ended December 31, 2014, 2013 2012 and 2011,2012, respectively, related to all stock options and RSUs accounted for as equity awards, as a component of general and administrative expenses in the statements of operations.
At December 31, 2013,2014, the total compensation cost related to outstanding, non-vested equity awards of options and RSUs that is expected to be recognized as compensation cost in the future aggregates approximately $1,637,000.$2,000,000. It does not include any awards granted subsequent to December 31, 2013.2014.
For the Year Ended December 31, | Options | RSUs | Total | Options | RSUs | Total | ||||||||||||||||||
2014 | $ | — | $ | 1,037,000 | $ | 1,037,000 | ||||||||||||||||||
2015 | — | 520,000 | 520,000 | $ | 31,000 | $ | 1,107,000 | $ | 1,138,000 | |||||||||||||||
2016 | — | 80,000 | 80,000 | 31,000 | 666,000 | 697,000 | ||||||||||||||||||
2017 | 31,000 | 92,000 | 123,000 | |||||||||||||||||||||
2018 | 31,000 | — | 31,000 | |||||||||||||||||||||
2019 | 11,000 | — | 11,000 | |||||||||||||||||||||
|
|
|
|
|
| |||||||||||||||||||
| $ | — | $ | 1,637,000 | $ | 1,637,000 | $ | 135,000 | $ | 1,865,000 | $ | 2,000,000 | |||||||||||||
|
|
|
|
|
| |||||||||||||||||||
| 10. | Commitments and Contingencies |
Litigation
From time to time, the Company has been, is or may in the future be a defendant in various legal actions arising in the normal course of business. The Company records a provision for a liability when it is both probable that a liability has been incurred and the amount of loss can be reasonably estimated.
Reis has purchased insurance with respect to construction defect and completed operations at its past real estate development projects. Reis has, from time to time, been exposed to various claims associated with the development, construction and sale of condominium units, single family homes or lots. Claims related to dissatisfaction by homeowners and homeowners associations with the construction of condominiums, homes and amenities by us and/or our developer partners in any condominium or subdivision development, or other matters, may result in litigation costs, remediation costs, warranty expenses or settlement costs which could be material to the Company’s reportable discontinued operating income (loss), or its consolidated financial position or cash flows. It would not have any effect on the Company’s income from continuing operations.
REIS, INC. AND SUBSIDIARIES
NOTES TO CONSOLIDATED FINANCIAL STATEMENTS
(Continued)
Commitments and Contingencies (continued)
Reis, Inc. and two of its subsidiaries (GP LLC and Wellsford Park Highlands Corp. (“WPHC”)) were the subject of a suit brought by the homeowners association at the Company’s former 259-unit Gold Peak condominium project outside of Denver, Colorado.
This suit was filed in District Court in Douglas County, Colorado on October 19, 2010, seeking monetary damages (not quantified at the time) relating to design and construction defects at the Gold Peak project. Tri-Star, the construction manager/general contractor for the project (not affiliated with Reis) and two former senior officers of Reis, Inc. (Jeffrey H. Lynford, who was also previously a director of the Company, and David M. Strong) were also named as defendants in the suit. In October 2011, experts for the plaintiff delivered a report alleging a cost to repair of approximately $19,000,000. Trial commenced on February 21, 2012 and a jury rendered its verdict on March 13, 2012 finding Reis, GP LLC and Tri-Star jointly and severally liable for an aggregate of $18,200,000, plus other costs of approximately $756,000.
As of December 31, 2011, based on the best available information at that time, the Company recorded a charge of approximately $4,460,000 in discontinued operations, representing the low end of the Company’s expected range of net exposure. This amount reflected an aggregate minimum liability of approximately $7,740,000, less the then minimum expected insurance recovery of $3,000,000 and other previously reserved amounts. At March 31, 2012, as a result of the verdict, the Company recorded an additional charge of $14,216,000 in discontinued operations in the first quarter of 2012, to bring the Company’s liability up to the $18,200,000 judgment, plus other costs of approximately $756,000. As of March 31, 2012, the Company, in accordance with the applicable accounting literature, could no longer conclude that $3,000,000 of insurance was probable of being recovered. These charges were reflected in discontinued operations and negatively impacted consolidated net income (loss), but did not impact income from continuing operations.
On June 20, 2012, following denial of all of the defendants’ post-trial motions, Reis, GP LLC and WPHC reached a settlement with the plaintiff, the Gold Peak homeowners association, providing for a total payment of $17,000,000. Of this amount, $5,000,000 was paid on August 3, 2012 and the remaining $12,000,000 was paid on October 15, 2012, in accordance with the settlement terms. In reaching the decision to settle, Reis’s management and Board considered, among other factors: (1) the amount of the settlement versus the potential for an ultimately greater judgment after appeal, including additional costs and post-judgment interest; (2) the benefits of the clarity of settling the case at this time versus continuing uncertainty; and (3) the strong cash flow generation of Reis Services’s core business. As a result of the settlement, in the second quarter of 2012 the Company reversed $1,956,000 of the previously recorded charge. In December 2012, the Company recovered $712,500, which offset a portion of the previously recorded charge, resulting in the net litigation charge for the year ended December 31, 2012 of approximately $11,547,000.$12,260,000. During the yearyears ended December 31, 2014, 2013 and 2012, the Company recovered $80,000.had litigation recoveries of $26,000, $80,000 and $713,000, respectively, from insurance companies and other responsible parties.
In connection with the development of Gold Peak, the Company purchased a commercial general liability “WRAP” insurance policy from a predecessor of ACE Westchester (“ACE”) covering the Company (including its subsidiaries) and its former officers, Tri-Star and Tri-Star’s subcontractors. The Company upon advice of counsel and based on a reading of the policy, has takentook the position that a total of $9,000,000 (and possibly $12,000,000) of coverage iswas available for this claim. ACE has takentook the position that only $3,000,000 of coverage (including defense costs) was provided. The Company has filed suit against ACE in District Court in Douglas County, Colorado on January 18, 2012, alleging failure to cover this claim, bad faith and other related causes of action. In particular, the Gold Peak litigation could have been settled for $12,000,000 or less prior to the trial. On November 20, 2014, the Colorado District Court determined that the WRAP policy provided $3,000,000 of coverage (including defense costs). The Company takesis currently evaluating its appeal rights regarding such ruling. The Company continues to take the position that ACE is liable for all damages stemming from thisits failure to engage and settle.
Additionally, the Company hasmade claims against multipleother additional insurance companies under policies maintained by the Company, including Reis’s directors’ and officers’ insurance policy, and against Reis’s former insurance broker. On November 20, 2014, the Colorado District Court determined that the directors’ and officers’ insurance policy had no obligation to the Company for the asserted claims. A motion for summary judgment by the insurance broker was denied at that time by the Colorado District Court. Trial in this comprehensive insurance action, including ACE and the insurance broker, is scheduled for June 2014. July 2015.
The Company has also brought separate claims against Tri-Star, the subcontractors, the architect and a third party inspector engaged at Gold Peak, relating to those parties’ actions on the project. A trial for these actions would not occur untilis scheduled for October 2015.
Reis continues to consider its options with respect to contribution or other actions against potentially responsibleother third parties and/or co-defendants in the lawsuit, and will pursue all reasonable efforts to mitigate the effects of thisthe 2012 settlement. There is no assurance that the Company will be successful in these additionalany of its recovery efforts.
The Company is not a party to any other litigation that could reasonably be foreseen to be material to the Company.
REIS, INC. AND SUBSIDIARIES
NOTES TO CONSOLIDATED FINANCIAL STATEMENTS
(Continued)
Commitments and Contingencies (continued)
The Company is not a party to any other litigation that could reasonably be foreseen to be material to the Company.
Other Operating Commitments
The Company is a tenant under three operating leases, two of which are for office space in Midtown Manhattan, New York and expire in September 2016, and a third for office space in White Plains, New York, which expires in September 2019. Rent expense was approximately $2,082,000, $1,893,000 $1,793,000 and $1,738,000$1,793,000 for the years ended December 31, 2014, 2013 2012 and 2011,2012, respectively, which includes base rent plus other charges including, but not limited to, real estate taxes and maintenance costs in excess of base year amounts. In connection with one lease, the Company provided a letter of credit through a bank, to the lessor. The letter of credit requirement is approximately $212,000 which is collateralized by a certificate of deposit issued by that bank. The certificate of deposit is included in restricted cash and investments in the consolidated balance sheets at December 31, 2014 and 2013 and 2012.(see Note 4).
Future minimum lease payments under operating leases at December 31, 20132014 are as follows:
For the Year Ended December 31, | Amount | Amount | ||||||
2014 | $ | 1,812,000 | ||||||
2015 | 1,896,000 | $ | 1,896,000 | |||||
2016 | 1,495,000 | 1,495,000 | ||||||
2017 | 214,000 | 214,000 | ||||||
2018 | 219,000 | 219,000 | ||||||
Thereafter | 166,000 | |||||||
2019 | 166,000 | |||||||
|
| |||||||
Total | $ | 5,802,000 | $ | 3,990,000 | ||||
|
| |||||||
The Company has a defined contribution savings plans pursuant to Section 401 of the Internal Revenue Code. The Company matches contributions up to 2% of employees’ salaries, as then defined, for 2014, 2013 2012 and 20112012 (calculated as 50% of the employee’s contribution, capped at 4% of the employee’s salary). The Company made contributions to this plan of approximately $231,000, $203,000 $159,000 and $148,000$159,000 for the years ended December 31, 2014, 2013 2012 and 2011,2012, respectively.
| 11. | Fair Value of Financial Instruments |
At December 31, 20132014 and 2012,2013, the Company’s financial instruments included receivables, payables, accrued expenses, other liabilities and debt. The fair values of these financial instruments, excluding debt, were not materially different from their recorded values at December 31, 20132014 and 2012.2013. The Company had no debt balance outstanding at December 31, 20132014 or 2012.2013. See Note 6 for moreadditional information about the Company’s debt.
REIS, INC. AND SUBSIDIARIES
NOTES TO CONSOLIDATED FINANCIAL STATEMENTS
(Continued)
| 12. | Summarized Consolidated Quarterly Information (Unaudited) |
Summarized consolidated and condensed quarterly financial information is as follows:
(amounts in thousands, except per share amounts)
| (amounts in thousands, except per share amounts)
| (amounts in thousands, except per share amounts) | ||||||||||||||||||||||||||||||
| 2013 | 2014 | |||||||||||||||||||||||||||||||
| For the Three Months Ended March 31 | For the Three Months Ended June 30 | For the Three Months Ended September 30 | For the Three Months Ended December 31 | For the Three Months Ended March 31 | For the Three Months Ended June 30 | For the Three Months Ended September 30 | For the Three Months Ended December 31 | |||||||||||||||||||||||||
Subscription revenue | $ | 8,234 | $ | 8,498 | $ | 8,780 | $ | 9,209 | $ | 9,946 | $ | 10,194 | $ | 10,469 | $ | 10,726 | ||||||||||||||||
|
|
|
|
|
|
|
| |||||||||||||||||||||||||
Income from continuing operations (A) | $ | 402 | $ | 522 | $ | 705 | $ | 16,304 | ||||||||||||||||||||||||
|
|
|
| |||||||||||||||||||||||||||||
Net income (A) | $ | 250 | $ | 484 | $ | 649 | $ | 16,214 | ||||||||||||||||||||||||
|
|
|
| |||||||||||||||||||||||||||||
Per share amounts – basic (B): | ||||||||||||||||||||||||||||||||
Income from continuing operations | $ | 0.04 | $ | 0.05 | $ | 0.06 | $ | 1.49 | $ | 1,047 | $ | 915 | $ | 1,130 | $ | 1,524 | ||||||||||||||||
|
|
|
|
|
|
|
| |||||||||||||||||||||||||
Net income | $ | 0.02 | $ | 0.04 | $ | 0.06 | $ | 1.49 | $ | 669 | $ | 822 | $ | 1,080 | $ | 1,476 | ||||||||||||||||
|
|
|
|
|
|
|
| |||||||||||||||||||||||||
Per share amounts – diluted (B): | ||||||||||||||||||||||||||||||||
Per share amounts – basic (A): | ||||||||||||||||||||||||||||||||
Income from continuing operations | $ | 0.04 | $ | 0.05 | $ | 0.05 | $ | 1.42 | $ | 0.10 | $ | 0.08 | $ | 0.10 | $ | 0.14 | ||||||||||||||||
|
|
|
|
|
|
|
| |||||||||||||||||||||||||
Net income | $ | 0.02 | $ | 0.04 | $ | 0.05 | $ | 1.41 | $ | 0.06 | $ | 0.07 | $ | 0.10 | $ | 0.13 | ||||||||||||||||
|
|
|
| |||||||||||||||||||||||||||||
Per share amounts – diluted (A): | ||||||||||||||||||||||||||||||||
Income from continuing operations | $ | 0.09 | $ | 0.08 | $ | 0.10 | $ | 0.12 | ||||||||||||||||||||||||
|
|
|
| |||||||||||||||||||||||||||||
Net income | $ | 0.06 | $ | 0.07 | $ | 0.09 | $ | 0.11 | ||||||||||||||||||||||||
|
|
|
| |||||||||||||||||||||||||||||
|
|
|
| |||||||||||||||||||||||||||||
Weighted average number of common shares outstanding: | ||||||||||||||||||||||||||||||||
Basic | 10,828 | 10,892 | 10,908 | 10,909 | 10,979 | 11,102 | 11,119 | 11,145 | ||||||||||||||||||||||||
|
|
|
|
|
|
|
| |||||||||||||||||||||||||
Diluted | 11,348 | 11,398 | 11,445 | 11,464 | 11,463 | 11,531 | 11,653 | 11,688 | ||||||||||||||||||||||||
|
|
|
|
|
|
|
| |||||||||||||||||||||||||
| 2012 | 2013 | |||||||||||||||||||||||||||||||
| For the Three Months Ended March 31 | For the Three Months Ended June 30 | For the Three Months Ended September 30 | For the Three Months Ended December 31 | For the Three Months Ended March 31 | For the Three Months Ended June 30 | For the Three Months Ended September 30 | For the Three Months Ended December 31 | |||||||||||||||||||||||||
Subscription revenue | $ | 7,298 | $ | 7,522 | $ | 7,827 | $ | 8,581 | $ | 8,234 | $ | 8,498 | $ | 8,780 | $ | 9,209 | ||||||||||||||||
|
|
|
|
|
|
|
| |||||||||||||||||||||||||
Income from continuing operations (A) | $ | 136 | $ | 498 | $ | 860 | $ | 6,519 | ||||||||||||||||||||||||
Income from continuing operations (B) | $ | 402 | $ | 522 | $ | 705 | $ | 16,304 | ||||||||||||||||||||||||
|
|
|
|
|
|
|
| |||||||||||||||||||||||||
Net (loss) income (A)(C) | $ | (14,209 | ) | $ | 2,193 | $ | 666 | $ | 7,066 | |||||||||||||||||||||||
Net income (B) | $ | 250 | $ | 484 | $ | 649 | $ | 16,214 | ||||||||||||||||||||||||
|
|
|
|
|
|
|
| |||||||||||||||||||||||||
Per share amounts – basic (B): | ||||||||||||||||||||||||||||||||
Per share amounts – basic (A): | ||||||||||||||||||||||||||||||||
Income from continuing operations | $ | 0.01 | $ | 0.05 | $ | 0.08 | $ | 0.61 | $ | 0.04 | $ | 0.05 | $ | 0.06 | $ | 1.49 | ||||||||||||||||
|
|
|
|
|
|
|
| |||||||||||||||||||||||||
Net (loss) income | $ | (1.34 | ) | $ | 0.21 | $ | 0.06 | $ | 0.66 | |||||||||||||||||||||||
Net income | $ | 0.02 | $ | 0.04 | $ | 0.06 | $ | 1.49 | ||||||||||||||||||||||||
|
|
|
|
|
|
|
| |||||||||||||||||||||||||
Per share amounts – diluted (B): | ||||||||||||||||||||||||||||||||
Per share amounts – diluted (A): | ||||||||||||||||||||||||||||||||
Income from continuing operations | $ | 0.01 | $ | 0.05 | $ | 0.08 | $ | 0.58 | $ | 0.04 | $ | 0.05 | $ | 0.05 | $ | 1.42 | ||||||||||||||||
|
|
|
|
|
|
|
| |||||||||||||||||||||||||
Net (loss) income | $ | (1.29 | ) | $ | 0.20 | $ | 0.06 | $ | 0.63 | |||||||||||||||||||||||
Net income | $ | 0.02 | $ | 0.04 | $ | 0.05 | $ | 1.41 | ||||||||||||||||||||||||
|
|
|
| |||||||||||||||||||||||||||||
|
|
|
| |||||||||||||||||||||||||||||
Weighted average number of common shares outstanding: | ||||||||||||||||||||||||||||||||
Basic | 10,624 | 10,686 | 10,703 | 10,728 | 10,828 | 10,892 | 10,908 | 10,909 | ||||||||||||||||||||||||
|
|
|
|
|
|
|
| |||||||||||||||||||||||||
Diluted | 11,011 | 10,950 | 11,094 | 11,233 | 11,348 | 11,398 | 11,445 | 11,464 | ||||||||||||||||||||||||
|
|
|
|
|
|
|
| |||||||||||||||||||||||||
| ||||||||||||||||||||||||||||||||
| (A) |
Aggregate quarterly per share amounts may not equal annual or period to date amounts presented elsewhere in these consolidated financial statements due to rounding differences. |
The fourth quarter of |
F-28