| | | | | Title of Class | | Name of Exchange on which Registered | Common stock, $0.01 par value per share | | The NASDAQ Capital Market |
Securities registered pursuant to Section 12(g) of the Act: None
Indicate by check mark if the registrant is a well-known seasoned issuer, as defined in Rule 405 of the Securities Act. Yes ¨◻ No þ☑ Indicate by check mark if the registrant is not required to file reports pursuant to Section 13 or Section 15(d) of the Exchange Act. Yes ¨◻ No þ☑ Indicate by check mark whether the registrant (1) has filed all reports required to be filed by Section 13 or 15(d) of the Securities Exchange Act of 1934 during the preceding 12 months (or for such shorter period that the registrant was required to file such reports), and (2) has been subject to such filing requirements for the past 90 days. Yes þ☑ No ¨◻ Indicate by check mark whether the registrant has submitted electronically and posted on its corporate Website, if any, every Interactive Data File required to be submitted and posted pursuant to Rule 405 of Regulation S-T (§232.405 of this chapter) during the preceding 12 months (or for such shorter period that the registrant was required to submit and post such files). Yes þ☑ No ¨◻ Indicate by check mark if disclosure of delinquent filers pursuant to Item 405 of Regulation S-K is not contained herein, and will not be contained, to the best of registrant’s knowledge, in definitive proxy or information statements incorporated by reference in Part III of this Form 10-K or any amendment to this Form 10-K. ¨◻ Indicate by check mark whether the registrant is a large accelerated filer, an accelerated filer, a non-accelerated filer, or a smaller reporting company. See the definitions of “large accelerated filer,” “accelerated filer” and “smaller reporting company” in Rule 12b-2 of the Exchange Act. | | | | | Large accelerated filer ¨ ◻ | | | Accelerated filer ¨ | ◻ | Non-accelerated filer þ◻ (Do not check if a smaller reporting company) | | | Smaller Reporting Company ¨ | ☑ |
Indicate by check mark whether the registrant is a shell company (as defined in Rule 12b-2 of the Exchange Act). Yes ¨◻ No þ☑ At June 30, 2013,2016, the last business day of the registrant’s most recently completed second fiscal quarter, the aggregate market value of the registrant’s common stock held by non-affiliates of the registrant, based upon the closing price of a share of the registrant’s common stock as reported by the NASDAQ Capital Market on that date was $45,186,980.$3,672,097. As of February 28, 2014, 66,568,9372017, 6,873,878 shares of the registrant’s Common Stock were outstanding. DOCUMENTS INCORPORATED BY REFERENCE Specified portions of the registrant’s Definitive Proxy Statement, which will be filed with the Commission pursuant to Regulation 14A in connection with the registrant’s 20142017 Annual Meeting of Stockholders, to be held May 7, 20143, 2017 (the Proxy Statement), are incorporated by reference into Part III of this report. Except with respect to information specifically incorporated by reference in this report, the Proxy Statement is not deemed to be filed as a part hereof. ENTEROMEDICS INC. FORM 10-K TABLE OF CONTENTS Registered Trademarks and Trademark Applications: In the United States we have registered trademarks for VBLOCvBLOC®, ENTEROMEDICS® and MAESTRO®, each registered with the United States Patent and Trademark Office, and trademark applications for VBLOCvBLOC POWER TO CHOOSE and VBLOCvBLOC POWER TO CHOOSE AND DESIGN. In addition, some or all of the marks VBLOC,vBLOC, ENTEROMEDICS, MAESTRO, MAESTRO SYSTEM ORCHESTRATING OBESITY SOLUTIONS, VBLOCvBLOC POWER TO CHOOSE and VBLOCvBLOC POWER TO CHOOSE AND DESIGN are the subject of either a trademark registration or application for registration in Australia, Brazil, China, the European Community, India, Kuwait, Mexico, Saudi Arabia, Switzerland and the United Arab Emirates. This Annual Report on Form 10-K contains other trade names and trademarks and service marks of EnteroMedics and of other companies. PART I. ITEM 1.BUSINESS This Annual Report on Form 10-K contains forward-looking statements. These forward-looking statements are based on our current expectations about our business and industry. In some cases, these statements may be identified by terminology such as “may,” “will,” “should,” “expects,” “could,” “intends,” “might,” “plans,” “anticipates,” “believes,” “estimates,” “predicts,” “potential,” or “continue,” or the negative of such terms and other comparable terminology. These statements involve known and unknown risks and uncertainties that may cause our results, levels of activity, performance or achievements to be materially different from those expressed or implied by the forward-looking statements. Factors that may cause or contribute to such differences include, among others, those discussed in this report in Item 1A “Risk Factors.” Except as may be required by law, we undertake no obligation to update any forward-looking statement to reflect events after the date of this report. Overview
Our Company We are a development stage medical device company with approvals to commercially launch our product, in Australia, the European Economic Area and other countries that recognize the European CE Mark.vBloc Neuromodulation System (vBloc System). We are focused on the design and development of devices that use neuroblocking technology to treat obesity, metabolic diseases and other gastrointestinal disorders. Our proprietary neuroblocking technology, which we refer to as VBLOC therapy,vBloc Therapy, is designed to intermittently block the vagus nerve using high-frequency, low-energy,high frequency, low energy, electrical impulses. The vagus nerve regulates many activitiesWe have a limited operating history and only recently received U.S. Food and Drug Administration (FDA) approval to sell our product in the human body, affecting digestion, energy metabolism, blood pressure regulationUnited States. In addition, we have regulatory approval to sell our product in the European Economic Area and activitiesother countries that recognize the European CE Mark and do not have any other source of revenue. We were incorporated in Minnesota on December 19, 2002 and later reincorporated in Delaware on July 22, 2004. We have devoted substantially all of our resources to the development and commercialization of the stomach, intestine and pancreas, providing direct two-way communication betweenvBloc System, which was formerly known as the brain and body. OurMaestro or vBloc Rechargeable System. The vBloc System, our initial product, is the Maestro System, which uses VBLOC therapyvBloc Therapy to affect metabolic regulatory control, limit the expansion of the stomach, help control hunger sensations between meals, reduce the frequency and intensity of stomach contractions and produce a feeling of early and prolonged fullness. Based on our understanding of vagal nerve function and nerve blocking from our preclinical studies and the results of our clinical trials, weWe believe the MaestrovBloc System may offeroffers obese patients a minimally-invasive treatment that has the potential tocan result in significant, durable and sustained weight loss. In addition, data from sub-group analyses demonstrateWe believe that VBLOC therapy may hold promise in improving obesity-related comorbiditiesour vBloc System allows bariatric surgeons to offer a new option to obese patients who are concerned about the risks and complications associated with currently available anatomy-altering, restrictive or malabsorptive surgical procedures. We received FDA approval on January 14, 2015 for vBloc Therapy, delivered via the vBloc System, for the treatment of adult patients with obesity who have a Body Mass Index (BMI) of at least 40 to 45 kg/m2, or a BMI of at least 35 to 39.9 kg/m2 with a related health condition such as diabeteshigh blood pressure or high cholesterol levels, and hypertension. We continuewho have tried to evaluatelose weight in a supervised weight management program and failed within the Maestro System in human clinical trialspast five years. In 2015 we began a controlled commercial launch at select surgical centers in the United States Australia, Mexico and Norway.had our first commercial sales. During 2015, we initiated a controlled expansion of our commercial operations and started the process of building a sales force. In January 2016, we hired new executives to oversee this expansion. Our direct sales force is supported by field clinical engineers who provide training, technical and other support services to our customers. Throughout 2016, our sales force called directly on key opinion leaders and bariatric surgeons at commercially-driven surgical centers that met our certification criteria. Additionally, in 2016, through a distribution agreement with Academy Medical, LLC, U.S. Department of Veterans Affairs (VA) medical facilities now offer the vBloc System as a treatment option for veterans at little to no cost to veterans in accordance with their veteran healthcare benefits. We plan to build on these efforts in 2017 with self-pay and veteran focused direct-to-patient marketing, key opinion leader and center-specific partnering, and a multi-faceted reimbursement strategy. To date, we have not observed any mortality relatedrelied on, and anticipate that we will continue to our device or any unanticipated adverse device effectsrely on, third-party manufacturers and suppliers for the production of the vBloc System.
In 2016, we sold 62 units for $787,000 in these clinical trials.revenue, and in 2015 we sold 24 units for $292,000 in revenue. We have also not observed any long-term problematic clinical side effectsincurred and expect to continue to incur significant sales and marketing expenses prior to recording sufficient revenue to offset these expenses. Additionally, our selling, general and administrative expenses have increased since we commenced commercial operations, and we expect that they will continue to increase as we continue to build the infrastructure necessary to support our expanding commercial sales, operate as a public company and develop our intellectual property portfolio. For these reasons, we expect to continue to incur operating losses for the next several years. We have financed our operations to date principally through the sale of equity securities, debt financing and interest earned on cash investments. Data from our ReCharge trial was used to support the premarket approval (PMA) application for the vBloc System, submitted to the FDA in any patients, including in those patients who have been using the Maestro System for more than one year. In October 2010, we received an unconditional Investigational Device Exemption (IDE) Supplement approval from the U.S. Food and Drug Administration (FDA) to conductJune 2013. The ReCharge trial is a randomized, double-blind,sham-controlled, multicenter pivotal clinical trial, called the ReCharge trial testing the effectiveness and safety of VBLOC therapyvBloc Therapy utilizing our second generation Maestro Rechargeable (RC)vBloc System. Enrollment and implantation in the ReCharge trial was completed in December 2011 in 239 randomized patients (233 implanted) at 10 centers. All patients in the trial received an implanted device and were randomized in a 2:1 allocation to treatment or sham control groups. The sham control group received a non-functional device during the trial period. All patients were expected to participate in a standard weight management counseling program. The primary endpoints of efficacy and safety were evaluated at 12 months. As announced, on February 7, 2013, the ReCharge trial met its primary safety endpoint though it did not meet its predefined co-primary efficacy endpoints.with a 3.7% serious adverse event rate. The safety profile at 12 months was further supported by positive cardiovascular signals including a 5.5 mmHg drop in systolic blood pressure, a 2.8 mmHg drop in diastolic blood pressure and a 3.6 bpm drop in average heart rate.
Additionally, the trial did however demonstratedemonstrated in the intent to treat (ITT) population (n=239) a clinically meaningful and statistically significant excess weight loss (EWL) of 24.4% (approximately 10% total body weight loss (TBL)) for VBLOC therapy-treatedvBloc Therapy-treated patients, with 52.5% of patients achieving at least 20% EWL, although it did not meet its co-primary efficacy endpoints due to higher than expected weight loss levels in the sham control group. In the per protocol population, the trial demonstrated an EWL of 26.3% for vBloc Therapy-treated patients, with 56.8% of patients achieving at least 20% EWL. On December 3, 2013 weWe subsequently announced 18 month efficacy and safety results from the ReCharge trial showing that VBLOCtherapy-treatedvBloc Therapy-treated patients were maintaining their weight loss whileat 18 months and 24 months with an EWL of 23.5% and 21.1%, respectively. The trial’s positive safety profile also continued throughout this reported time period. In the sham control group gained back over 40% ReCharge trial, two-thirds of the weight loss seenvBloc Therapy-treated patients achieved at least 5% TBL at 12 months. The 18 monthAccording to the Centers for Disease Control and Prevention (CDC), 5% TBL can have significant health benefits on obesity related risk factors, or comorbidities, including reduction in blood pressure, improvements in Type 2 diabetes and reductions in triglycerides and cholesterol. Further analysis of our data also continued to show positive safety signals. See additional discussion regarding theat 12 and 18 month ReCharge trial datamonths showed a meaningful impact on these comorbidities as noted in the “Clinical Development” section below.below table showing the improvements seen at 10% TBL, the average weight loss in vBloc Therapy-treated patients. As a result of the positive safety and efficacy profile of VBLOC therapy, we used the data from the ReCharge trial to support a premarket
| | | Risk Factor | | 10% TBL | Systolic BP (mmHg) | | (9) | Diastolic BP (mmHg) | | (6) | Heart Rate (bpm) | | (6) | Total Cholesterol (mg/dL) | | (15) | LDL (mg/dL) | | (9) | Triglycerides (mg/dL) | | (41) | HDL (mg/dL) | | 3 | Waist Circumference (inches) | | (7) | HbA1c (%) | | (0.5) |
We obtained European CE Mark approval (PMA) applicationfor our vBloc System in 2011 for the Maestro Rechargeabletreatment of obesity. The CE Mark approval for our vBloc System which we announced was submitted to the FDAexpanded in June 2013 and was accepted for review and filing in July 2013. The FDA has scheduled an Advisory Panel meeting for June 17, 2014 to reviewalso include use for the management of Type 2 diabetes in obese patients. Additionally, the final vBloc System components were previously listed on the Australian Register of Therapeutic Goods by the Therapeutic Goods Administration. The costs and resources required to successfully commercialize the vBloc System internationally are currently beyond our PMA application for approval of the Maestro System. If the FDA grants us approval, we anticipatecapability. Accordingly, we will be ablecontinue to devote our near-term efforts toward mounting a successful system launch in the United States. We intend to explore select international markets to commercialize the Maestro RechargeablevBloc System in the United States in late 2014. If we obtain FDA approval ofas our Maestro Rechargeable System we intend to market our products in the United States through a direct sales force supported by field technical and marketing managers who provide training, technical and other support services to our customers. Outside the United States we intend to useresources permit, using direct, dealer and distributor sales models as the targeted geographymarket best dictates.
To date, we have relied on third-party manufacturers and suppliers for the production of our Maestro System. We currently anticipate that we will continue to rely on third-party manufacturers and suppliers for the production of the Maestro System. We obtained European CE Mark approval for our Maestro Rechargeable System in 2011. In January 2012, the final Maestro Rechargeable System components were listed on the Australian Register of Therapeutic Goods (ARTG) by the Therapeutic Goods Administration (TGA). We have entered into exclusive, multi-year agreements with Device Technologies Australia Pty Limited and Bader Sultan & Brothers Co. W.L.L., for commercialization and distribution of the Maestro ReChargeable System in Australia and the Gulf Coast Countries, including Saudi Arabia, Kuwait, Bahrain, Qatar and the United Arab Emirates, respectively. We continue to explore additional select international markets to commercialize the Maestro Rechargeable System, including Europe.
The method of assessing conformity with applicable regulatory requirements varies depending on the class of the device, but for our Maestro System (which is considered an Active Implantable Medical Device (AIMD) in Australia and the European Economic Area, and falls into Class III within the United States), the method involved a combination of self-assessment and issuance of declaration and conformity by the manufacturer of the safety and performance of the device, and a third-party assessment by a Notified Body of the design of the device and of our quality system. We use DEKRA Certification B.V. (formerly known as KEMA Quality) in the Netherlands as the Notified Body for our CE marking approval process.
The Obesity and Metabolic Disease Epidemic
Obesity is a disease that has been increasing at an alarming rate with significant medical repercussions and associated economic costs. Overweight and obesity are the fifth leading risk for global deaths and more than 10% of the world’s adult population are obese. Currently, as many as 500 million people worldwide are estimated to be obese and more than 1.4 billion adults are estimated to be overweight, according to the World Health Organization (WHO). At least 2.8 million adults die each year as a result of being overweight or obese.
Many people with obesity also have severe and complex problems related to their disease, including Type 2 diabetes and hypertension, often referred to collectively as metabolic disease. 44% of the diabetes burden, 23% of the heart disease burden and between 7% and 41% of certain cancer burdens are attributable to overweight and obesity. WHO predicts that approximately 2.3 billion adults will be overweight and more than 700 million people worldwide will be obese by 2015.
Obesity has been identified by the U.S. Surgeon General as the fastest growing cause of disease and death in the United States. Currently, the Centers for Disease Control and Prevention (CDC) estimates that 35.7% of U.S. adults are obese, having a Body Mass Index (BMI) of 30 or higher. BMI is calculated by dividing a person’s weight
in kilograms by the square of their height in meters. It is estimated that by 2015, over 40% of American adults could be obese. According to data from the U.S. Department of Health and Human Services, almost 80% of adults with a BMI above 30 have an obesity-related disease or disorder, also called a co-morbidity, and almost 40% have two or more of these comorbidities. According to The Obesity Society (formerly the North American Association for the Study of Obesity) and the CDC, obesity is associated with many significant weight-related comorbidities including Type 2 diabetes, high blood-pressure, sleep apnea, certain cancers, high cholesterol, coronary artery disease, osteoarthritis and stroke. In addition, a number of disorders involving the central nervous system may be complicated by obesity, such as anxiety, bipolar disorder, agoraphobia, depression and insomnia. Currently, medical costs associated with obesity in the U.S. were estimated to be up to $210 billion annually; the medical costs paid by third-party payors for people who are obese were $1,429 higher per year than those of normal weight. As noted by the CDC, even a modest reduction in weight can result in benefits to ones health.
We believe that this epidemic will continue to grow worldwide given dietary trends in developed nations that favor highly processed sugars, larger meals and fattier foods, as well as increasingly sedentary lifestyles. Despite the growing obesity rate, increasing public interest in the obesity epidemic and significant medical repercussions and economic costs associated with obesity, there continues to be a significant unmet need for effective treatments. We believe existing options for the treatment of obesity have seen limited adoption to date due to patient concerns and potential side effects including morbidity. The principal treatment alternatives available today for obesity include:
Behavioral modification. Behavioral modification, which includes diet and exercise, is an important component in the treatment of obesity; however, most obese patients find it difficult to achieve and maintain significant weight loss with a regimen of diet and exercise alone.
Pharmaceutical therapy. Pharmaceutical therapies often represent a first option in the treatment of obese patients within lower BMI ranges but carry significant safety risks and may present troublesome side effects and compliance issues.
Bariatric surgery. In more severe cases of obesity, patients may pursue more aggressive surgical treatment options such as gastric banding, sleeve gastrectomy and gastric bypass. These procedures promote weight loss by surgically restricting the stomach’s capacity and outlet size. While largely effective, these procedures generally result in major lifestyle changes including dietary restrictions and food intolerances and they may present substantial side effects and carry short- and long-term safety and side effect risks that have limited their adoption.
Given the limitations of behavioral modification, pharmaceutical therapy and bariatric surgical approaches, we believe there is a substantial need for a patient-friendly, safer, effective and durable solution that:
preserves normal anatomy;
is “non-punitive” in that it supports continued ingestion and digestion of foods and micronutrients such as vitamins and minerals found in a typical, healthy diet while allowing the user to modify his or her eating behavior appropriately without inducing punitive physical restrictions that physically force a limitation of food intake;
enables non-invasive adjustability while reducing the need for frequent clinic visits;
minimizes undesirable side-effects;
minimizes the risks of re-operations, malnutrition and mortality; and
reduces the natural hunger drive of patients.
EnteroMedics’ Solution
The vagus nerve regulates many activities in the human body, including those affecting digestion, energy metabolism, blood pressure regulation and activities of the stomach, intestine and pancreas, and provides direct two-way communication between the brain and body. By intermittently blocking, or interrupting, naturally occurring neural impulses on the vagus nerve, our therapy is designed to affect metabolic regulatory control, reduce hunger feelings between meals, limit the expansion of the stomach during eating and reduce the frequency and intensity of stomach contractions. In addition, we believe VBLOC therapy also reduces the absorption of calories by decreasing the secretion of digestive enzymes. The resulting physiologic effects of VBLOC therapy are intended to produce a feeling of early and prolonged fullness following smaller meal portions and, by intermittently blocking the vagus nerve and allowing it to return to full function between therapeutic episodes, we have limited the body’s natural tendency to circumvent the therapy, all of which we believe will result in long-term weight loss.
We have designed our Maestro System to address a significant market opportunity that exists for a patient-friendly, safe, effective, less-invasive and durable therapy that is intended to address the underlying causes of hunger and obesity. Our Maestro System is designed to offer each of the following benefits, which we believe will lead to the adoption of VBLOC as the surgical therapy of choice for obesity and its comorbidities:
preserves normal anatomy;
allows continued ingestion and digestion of most foods;
may be implanted on an outpatient basis and adjusted non-invasively;
offers a favorable safety profile; and
targets multiple factors that contribute to hunger and obesity.
The Vagus Nerve and the Digestive System
Beginning in the brain, the vagus nerve travels down alongside the esophagus to the stomach and other gastrointestinal organs and is primarily responsible for autonomic regulation involved in heart, lung and gastrointestinal function. The vagus nerve regulates many activities in the human body, affecting digestion, energy metabolism, blood pressure regulation and activities of the stomach, intestine and pancreas, providing direct two-way communication between the brain and body. Vagus nerve function has been shown to play a role in enabling multiple gastrointestinal and metabolic mechanisms, including:
expansion of the stomach as food enters;
stomach contractions that break food into smaller particles;
release of gastric acid to continue food processing;
emptying of the stomach contents into the small intestine;
secretion of digestive pancreatic enzymes that enable absorption of calories;
control of natural production of glucose within the body (endogenous or hepatic gluconeogenesis); and
sensations of hunger, satisfaction and fullness.
VBLOC Therapy
Several studies of the vagus nerve and its effect on the digestive system have focused on the effects of surgical vagotomy, the permanent severing of the vagus nerve at the level of the junction between the esophagus and the stomach. Given the role of the vagus nerve in regulating the release of gastric acid, early researchers originally used vagotomy as a treatment for peptic ulcers. They discovered that their patients often experienced weight loss or, at a minimum, failure to gain weight following vagotomy. However, weight loss after vagotomy alone, particularly over the long-term, likely dissipates as the body compensates for, or circumvents, the anatomical disruption by partial restoration of nervous system function.
VBLOC therapy is designed to block the gastrointestinal effects of the vagus nerve by replicating a vagotomy using high-frequency, low-energy electrical impulses to intermittently interrupt naturally occurring neural impulses on the vagus nerve between the brain and the digestive system. Our therapy is designed to affect metabolic regulatory control, control hunger sensations between meals, limit the expansion of the stomach and reduce the frequency and intensity of stomach contractions, leading to earlier fullness. In addition, we believe VBLOC therapy also reduces the absorption of calories by decreasing the secretion of digestive enzymes. The resulting physiologic effects of VBLOC therapy are intended to produce a feeling of early and prolonged fullness following smaller meal portions. By intermittently blocking the vagus nerve and allowing it to return to full function between therapeutic episodes, we believe we have limited the body’s natural tendency to circumvent the therapy, which can result in long-term weight loss.
We have designed our Maestro System to address a significant market opportunity that we believe exists for a patient-friendly, safe, effective, less-invasive and durable therapy that is intended to address the underlying causes of hunger and obesity. Our Maestro System is designed to offer each of the following benefits, which we believe could lead to the adoption of VBLOC as the surgical therapy of choice for obesity and its comorbidities:
| • | | Preserves Normal Anatomy. The Maestro System is designed to deliver therapy that blocks the neural signals that influence a patient’s hunger and sense of fullness without altering digestive system anatomy. Accordingly, patients should experience fewer and less severe side effects compared to treatments that incorporate anatomical alterations.
|
| • | | Allows Continued Ingestion and Digestion of Foods Found in a Typical, Healthy Diet. Because our therapy leaves the digestive anatomy unaltered, we believe that patients will be able to maintain a more consistent nutritional balance compared to existing surgical approaches, thus allowing them to effect positive changes in their eating behavior in a non-forced and potentially more consistent way.
|
| • | | May be Implanted on an Outpatient Basis and Adjusted Non-Invasively. The Maestro System is designed to be laparoscopically implanted within a 60-90 minute procedure, allowing patients to leave the hospital or clinic on the same day. The implantable system is designed to be turned off and left in place for patients who reach their target weight. When desired, the follow-up physician can simply and non-invasively turn the therapy back on. Alternatively, the implantable system can be removed in a laparoscopic procedure.
|
| • | | Offers Favorable Safety Profile. We have designed our ReCharge and EMPOWER clinical trials to demonstrate the safety of the Maestro System. In our clinical trials to date, including the ReCharge and EMPOWER trials, we have not observed any mortality related to our device or any unanticipated adverse device effects. We have also not observed any long-term problematic clinical side effects in any patients, including in those patients who have been using the Maestro System for more than one year.
|
| • | | Targets Multiple Factors that Contribute to Hunger and Obesity. We designed VBLOC therapy to target the multiple digestive, metabolic and information transmission functions of the vagus nerve and to affect the perception of hunger and fullness, which together contribute to obesity and its metabolic consequences.
|
VBLOC therapy, delivered via our Maestro System, is intended to offer patients what we believe could be an effective, safe, outpatient solution that minimizes complications. We believe it will enable patients to lose weight and maintain long-term weight loss while enjoying a normal, healthy diet. We also believe that the Maestro System will appeal to physicians based on the inherent physiological approach of VBLOC therapy and its favorable safety profile.
Our Strategy
Our goal is to establish VBLOC therapy, delivered via our Maestro System, as the leading obesity management solution. The key business strategies by which we intend to achieve these objectives include:
Achieve Further Regulatory Approvals for VBLOC Therapy Using Our Maestro System. We received an IDE from the FDA for use of the Maestro Rechargeable System in the United States in our ReCharge trial in October 2010 and completed enrollment and implantation in December 2011. As announced on February 7, 2013, the ReCharge trial met its primary safety endpoint, though it did not meet its predefined co-primary efficacy endpoints. The trial did however demonstrate in the ITT population (n=239) a clinically meaningful and statistically significant EWL of 24.4% (approximately 10% TBL) for VBLOC therapy-treated patients, with 52.5% of patients achieving at least 20% EWL. On December 3, 2013 we announced 18 month efficacy and safety results from the ReCharge trial showing that VBLOC therapy-treated patients were maintaining their weight loss, while the sham control group gained back over 40% of the weight loss seen at 12 months. The 18 month data also continued to show positive safety signals. See additional discussion regarding the 12 and 18 month ReCharge trial data in the “Clinical Development” section below.
As a result of the positive safety and efficacy profile of VBLOC therapy, we used the data from the ReCharge trial to support a PMA application for the Maestro Rechargeable System, which we announced was submitted to the FDA in June 2013 and was accepted for review and filing in July 2013. The FDA has scheduled an Advisory Panel meeting for June 17, 2014 to review our PMA application for approval of the Maestro System. If the FDA grants us approval, it will allow us to commence sales in the United States.
We obtained European CE Mark approval for our Maestro Rechargeable System in 2011. In January 2012, the final Maestro Rechargeable System components were listed on the ARTG by the Australian TGA. We have entered into exclusive, multi-year agreements with Device Technologies Australia Pty Limited and Bader Sultan & Brothers Co. W.L.L., for commercialization and distribution of the Maestro ReChargeable System in Australia and the Gulf Coast Countries, including Saudi Arabia, Kuwait, Bahrain, Qatar and the United Arab Emirates, respectively. We continue to explore additional select international markets to commercialize the Maestro Rechargeable System, including Europe.
The method of assessing conformity with applicable regulatory requirements varies depending on the class of the device, but for our Maestro System (which is considered an AIMD in Australia and the European Economic Area, and falls into Class III within the United States), the method involved a combination of self-assessment and issuance of declaration and conformity by the manufacturer of the safety and performance of the device, and a third-party assessment by a Notified Body of the design of the device and of our quality system. We used DEKRA Certification B.V. (formerly known as KEMA Quality) in the Netherlands as the Notified Body for our CE marking approval process.
Drive the Adoption and Endorsement of VBLOC Therapy Through Obesity Therapy Experts. Our clinical development strategy is to collaborate closely with regulatory bodies, obesity therapy experts and others involved in the obesity management process, patients and their advocates and scientific experts. We have established credible and open relationships with obesity therapy experts and others involved in the obesity management process and scientific experts and we believe these individuals will be important in promoting patient awareness and gaining widespread adoption if the Maestro System is approved and commercialized.
Commercialize Our Products using a Distribution Network outside the United States. We plan to utilize specialized third-party medical device distributors in Australia, the Middle East and other non-U.S. markets to call directly on key opinion leaders and bariatric surgeons, which we believe will enable us to target them effectively. We expect that our distributor’s sales force will promote the Maestro System to physicians, work with our surgeon partners, provide training and maintain regulatory required records. They may also work with patients who have concerns with current bariatric surgical procedures. We also plan to call on physicians, weight-management specialists, nurses and others involved in the obesity management process who influence patient adoption.
Commercialize Our Products using a Direct Sales and Marketing Effort within the United States. We plan to build a sales force to call directly on key opinion leaders and bariatric surgeons, primarily within bariatric centers of excellence. We believe this currently represents over 450 facilities within the United States, which we believe will enable us to target them effectively with a small sales force. We expect that our direct sales force will promote the Maestro System to physicians and patients who have concerns with current bariatric surgical procedures. We also plan to call on physicians, weight-management specialists, nurses and others involved in the obesity management process who influence patient adoption.
Identify Appropriate Coding, Obtain Coverage and Payment for the Maestro Rechargeable System. While payors are not our direct customers, their coverage and reimbursement policies influence patient and physician selection of obesity treatment. We plan to employ a focused campaign to obtain payor support for VBLOC therapy. We plan to seek specific and appropriate coding, coverage and payment for our Maestro Recharegeable System from the Australia Medical Services Advisory Committee (MSAC) and the U.S. Centers for Medicare and Medicaid Services (CMS) and from private insurers. We have applied for unique CPT Category III codes with the American Medical Association’s CPT Advisory Committee for a Vagus Nerve Blocking Therapy procedure and received approval for six of them. The approved CPT Category III codes were listed in the July 2012 edition of the CPT billing codes. We intend to use the approved codes to build evidence for a possible application for a CPT Category I Code at a later date.
Expand and Protect Our Intellectual Property Position. We believe that our issued patents and our patent applications encompass a broad platform of neuromodulation therapies, including vagal blocking and combination therapy focused on obesity, diabetes, hypertension and other gastrointestinal disorders. We intend to continue to pursue further intellectual property protection through U.S. and foreign patent applications.
Leverage our VBLOC Technology for Other Disease States. We intend to continue to conduct research and development for other potential applications for our VBLOC therapy and believe we have a broad technology platform that will support the development of additional clinical applications and therapies for other metabolic and gastrointestinal disorders in addition to obesity.
The Maestro System, Implantation Procedure and Usage
The Maestro System. Our Maestro System delivers VBLOC therapy via two small electrodes that are laparoscopically implanted and placed in contact with the trunks of the vagus nerve just above the junction between the esophagus and the stomach, near the diaphragm. The Maestro System has been developed in two different energy configurations, the Maestro Radio Frequency (RF) System and the Maestro ReChargeable (RC) System, delivering the same VBLOC therapy. The Maestro RF System is powered by an external controller and transmit coil worn by the patient to receive therapy. The Maestro RC System (shown below) is powered by an internal rechargeable battery.

The major components of the Maestro RC System include:
| • | | Neuroregulator. The neuroregulator, a pacemaker-like device, is an implanted device that controls the delivery of VBLOC therapy to the vagus nerve. It is surgically implanted just below, and parallel to, the skin, typically on the side of the body over the ribs.
|
| • | | Lead System. Proprietary leads are powered by the neuroregulator and deliver electrical pulses to the vagus nerve via the electrodes. The leads and electrodes are similar to those used in traditional cardiac rhythm management products.
|
| • | | Mobile Charger. The mobile charger is an electronic device worn by the patient externally while recharging the device. It connects to the transmit coil and provides information on the battery status of the neuroregulator and the mobile charger.
|
| • | | Transmit Coil. The transmit coil is positioned for short periods of time over the implanted neuroregulator to deliver radiofrequency battery charging and therapy programming information across the skin into the device.
|
| • | | Clinician Programmer. The clinician programmer connects to the mobile charger to enable clinicians to customize therapy settings as necessary and retrieve reports stored in system components. The reports include patient use and system performance information used to manage therapy. The clinician programmer incorporates our proprietary software and is operated with a commercially available laptop computer.
|
We developed the Maestro System in two different energy configurations, the first generation Maestro RF System, used for the early feasibility trials and the EMPOWER trial, and the second generation Maestro RC System, which is currently in use in the VBLOC-DM2 ENABLE trial and the ReCharge U.S. pivotal trial and will be our commercial device. The Maestro RF System and the Maestro RC System differ in the following ways:
The neuroregulator within the Maestro RF System is powered by a battery in the externally-worn controller, which is connected to the external transmit coil. The transmit coil needs to be properly positioned over the approximately 20 cubic centimeter neuroregulator and worn daily during the patient’s waking hours to deliver therapy. The controller is recharged nightly using AC wall power.
The neuroregulator in the Maestro RC System is powered by an internal rechargeable battery. The RC neuroregulator is approximately 80 cubic centimeters in volume to accommodate its internal battery. An external mobile charger is connected to the external transmit coil to recharge the battery. The mobile charger is recharged using AC wall power.
Implantation Procedure. The Maestro System is implanted by a bariatric surgeon using a procedure that is typically performed within 60-90 minutes. During the procedure, the surgeon laparoscopically implants the electrodes in contact with the vagal nerve trunks and then connects the lead wires to the neuroregulator, which is subcutaneously implanted. The implantation procedure and usage of the Maestro System carry some risks, such as the risks generally associated with laparoscopic procedures as well as the possibility of device malfunction. Adverse events related to the therapy, device or procedure may include, but are not limited to: pain, heartburn, constipation, nausea, depression, diarrhea, infection, organ or nerve damage, surgical explant or revision, device movement, device malfunction and allergic reaction to the implant.
Usage of the Maestro System. The physician activates the Maestro System after implantation. VBLOC therapy is then delivered intermittently each day as scheduled (recommended during the patient’s waking hours) through the neuroregulator. The scheduled delivery of the intermittent pulses blocking the vagus nerve is customized for each patient’s weight loss and overall treatment objectives.
The physician is able to download reports to monitor patient use and system performance information. This information is particularly useful to physicians to ensure that patients are properly using the system. Although usage of our Maestro System generally proceeds without complications, as part of the therapy or intentional
weight loss, patients in our clinical trials have observed side-effects such as heartburn, bloating, diarrhea, sweating, nausea, constipation, greasy bowel movements, tiredness and excessive feelings of fullness, especially after meals. In addition, patient noncompliance with wearing the external components of the Maestro RF System or properly charging the Maestro RC System or Maestro RF System may render VBLOC therapy less effective in achieving long-term weight loss.
Clinical Development
We are developing our Maestro System to deliver VBLOC therapy for the long-term treatment of obesity and obesity-related comorbidities. Based on our preclinical and clinical findings, we believe that our Maestro System has the potential to offer a compelling combination of efficacy and safety. We are continuing to evaluate the Maestro System in human clinical studies conducted in the United States and internationally. As announced on February 7, 2013, the ReCharge trial met its primary safety endpoint, though it did not meet its predefined co-primary efficacy endpoints. The trial did however demonstrate in the ITT population (n=239) a clinically meaningful and statistically significant EWL of 24.4% (approximately 10% TBL) for VBLOC therapy-treated patients, with 52.5% of patients achieving at least 20% EWL. On December 3, 2013 we announced 18 month efficacy and safety results from the ReCharge trial showing that VBLOC therapy-treated patients were maintaining their weight loss, while the sham control group gained back over 40% of the weight loss seen at 12 months. The 18 month data also continued to show positive safety signals. See additional discussion regarding the 12 and 18 month ReCharge trial data below.
As a result of the positive safety and efficacy profile of VBLOC therapy, we used the data from the ReCharge trial to support a PMA application for the Maestro Rechargeable System, which we announced was submitted to the FDA in June 2013 and was accepted for review and filing in July 2013. The FDA has scheduled an Advisory Panel meeting for June 17, 2014 to review our PMA application for approval of the Maestro System.
Preclinical Experience
We have completed several preclinical animal studies, primarily in pigs and rats, to evaluate the safety of our Maestro System and to refine our implantation procedure. These studies have also shown that VBLOC therapy could completely block activated nerve signals, with the nerve regaining normal function within minutes after each intermittent application of therapy. Over a 12-week period of VBLOC therapy, over 91% of all nerve axons showed normal histology and the animals demonstrated unimpaired heart rate, respiration, blood pressure and glucose regulation. Additionally, we observed that VBLOC therapy resulted in a greater than 80% reduction in pancreatic exocrine secretions, which are composed of digestive enzymes, water and bicarbonate that facilitate food digestion and caloric intake.
As a result of the findings of our preclinical studies, we were able to refine the implant technique, demonstrate the biocompatibility of our Maestro System in animals and collect the data necessary to begin human clinical trials. Several publications resulting from these preclinical studies were peer-reviewed and accepted for podium presentation at the Digestive Disease Week meeting in 2006, the American Society for Bariatric Surgery meeting in 2006 and the International Federation for Surgery of Obesity meeting in 2006.
Clinical Experience
We began evaluating VBLOC therapy with our initial Maestro System, the RF1 system, in a clinical trial in February 2006. The first generation RF2 system is distinguished from the RF1 system by an improved user interface, improvements in the energy management within the neuroregulator and a more robust transmission link for delivering energy from the coil to the neuroregulator in the RF2 system. The second generation system, the RC system, has a fully implanted battery and requires the user to charge it less frequently than with the RF system. Our early clinical experience has shown that VBLOC therapy using the Maestro System offers physicians a programmable method to selectively and reversibly block the vagus nerve and results in clinically
and statistically significant EWL. Excess weight represents the difference between a patient’s actual weight and the patient’s weight assuming a BMI of 25, which is considered healthy. EWL is reported as the percentage of excess weight that is lost by the patient.
We have not observed any mortality related to our device or any unanticipated adverse device effects in our human clinical trials. We have also not observed any of our completed or ongoing studies. Reported events include those associated with laparoscopic surgery orlong-term problematic clinical side effects in any implantable electronic device. The effects of VBLOC therapy include changes in appetite, and, in some patients, effects that may be expected with decreased intra-abdominal vagus nerve activity, such as temporary abdominal discomfort and short episodes of belching, bloating, cramping or nausea.
Findingspatients. In addition, data from our clinical feasibility trials have resulted in more than 30 publications peer-reviewed and accepted for presentation between 2006 and 2013 at the following meetings: Digestive Disease Week, American Society for Metabolic and Bariatric Surgery, International Federation for Surgery of Obesity, Obesity Surgery Society of Australia & New Zealand and The Obesity Society (formerly the North American Association for the Study of Obesity).
Below is a summary of our ongoing clinical studies.
ReCharge Trial
In October 2010, we received an unconditional IDE Supplement approval from the FDA to conduct a randomized, double-blind, sham-controlled, multicenter pivotal clinicalVBLOC-DM2 ENABLE trial called the ReCharge trial, testing the effectiveness and safety of VBLOC therapy utilizing our second generation Maestro Rechargeable System. Enrollment and implantation in the ReCharge trial was completed in December 2011 in 239 randomized patients (233 implanted) at 10 centers. All patients in the trial received an implanted device and were randomized in a 2:1 allocation to treatment or control groups. The control group received a non-functional device during the trial period. All patients were expected to participate in a standard weight management counseling program. The primary endpoints of efficacy and safety were evaluated at 12 months. As announced on February 7, 2013, the ReCharge trial met its primary safety endpoint, though it did not meet its predefined co-primary efficacy endpoints. The trial did however demonstrate in the ITT population (n=239) a clinically meaningful and statistically significant EWL of 24.4% (approximately 10% TBL) for VBLOC therapy-treated patients, with 52.5% of patients achieving at least 20% EWL.
As a result of the positive safety and efficacy profile of VBLOC therapy, we used the data from the ReCharge trial to support a PMA application for the Maestro Rechargeable System, which we announced was submitted to the FDA in June 2013 and was accepted for review and filing in July 2013. The FDA has scheduled an Advisory Panel meeting for June 17, 2014 to review our PMA application for approval of the Maestro System. If the FDA grants us approval, we anticipate we will be able to commercialize the Maestro Rechargeable System inoutside the United States demonstrate that vBloc Therapy may
hold promise in late 2014. Further analysisimproving obesity-related comorbidities such as diabetes and hypertension. We are conducting, or plan to conduct, further studies in each of the 12 month data show thatthese comorbidities to assess vBloc Therapy’s potential in the primary analysis (intent-to-treat) population (n=239), VBLOC therapy-treated patients achieved a 24.4% average EWL (approximately 10% TBL) compared to 15.9% for sham control patients. This 8.5% difference demonstrated statistical superiority over sham control (p=0.002), but not super-superiority at the pre-specified 10% margin (p=0.705). In total, 52.5% of VBLOC therapy-treated patients had 20% or more EWL compared to 32.5% in the control group (p=0.004), and 38.3% of VBLOC therapy-treated patients had 25% or more EWL compared to 23.4% in the sham control group (p=0.02). While the respective co-primary endpoint targets of 55% and 45% were not met, the endpoint targets were within the 95% confidence intervals for the observed rates and therefore the observed rates were not significantly lower than these pre-specified rates. These efficacy data demonstrate VBLOC therapy’s positive effect on weight loss.
In the per protocol group, which included only those patients who received therapy per the trial design (n=211), the VBLOC therapy-treated patients had a 26.3% average EWL (approximately 10% TBL) compared
to 17.3% for the sham control group (p=0.003). In total, 56.8% of VBLOC therapy-treated patients achieved at least 20% EWL, which was above the predefined threshold of 55% compared to 35.4% in the sham control group (p=0.004). 41.8% of VBLOC therapy-treated patients also achieved at least 25% EWL in this population, which is slightly less than the predefined threshold of 45%, compared to 26.2% in the sham control group (p=0.03).
The rate of device-related serious adverse events was 3.1% for the treatment arm, significantly lower than the threshold of 15% (p<0.0001). The safety results also confirmed VBLOC therapy had no adverse cardiovascular effect. An overall reduction in blood pressure and heart rate was also observed in the treatment arm. Approximately 93% of patients reached the 12 month assessment in the trial, consistent with a rigorously executed trial.
On December 3, 2013 we announced 18 month efficacy and safety results from the ReCharge trial showing that VBLOC therapy-treated patients were maintaining their weight loss, while the sham control group gained back over 40% of the weight loss seen at 12 months. Specifically, using a completer analysis, VBLOC therapy-treated patients (n=117) achieved a 25% average EWL (approximately 10% TBL), compared to 12% (approximately 4% TBL) for sham control group patients (n=42). The 13% difference in EWL demonstrated statistical superiority over sham control (p<0.001). In total, 54% of VBLOC therapy-treated patients achieved at least 20% EWL and 41% achieved at least 25% EWL, compared to 26% and 17%, respectively, for the sham control group. The rate of device-related serious adverse events was 4.3% for the treatment arm, meaningfully lower than the 12 month threshold of 15% (p<0.0001). The safety results continued to confirm VBLOC therapy had no adverse cardiovascular effect. An overall reduction in blood pressure and heart rate was observed in the treatment arm.
VBLOC-DM2 ENABLE Trialaddressing multiple indications.
Enrollment of the VBLOC-DM2 ENABLE trial began in the second quarter of 2008. The VBLOC-DM2 ENABLE trial is designed to evaluate the effectsefficacy and safety of VBLOC therapyvBloc Therapy on obese subjects as well as its effect on glucose regulation and blood pressure in approximately 30 patients who were hypertensiveare using the Maestro RCvBloc System. The trial is an international, open-label, prospective, multi-center study. We plan to evaluateAt each designated trial endpoint the efficacy of VBLOC therapyvBloc Therapy is evaluated by measuring average percentage EWL, HbA1c (blood sugar), FPG (fasting plasma glucose), blood pressure, calorie intake, appetite and other endpoints at one week, one month, three, six, 12 and 18 months and longer. The following results were reported at 12 month intervals. | · | | Percent EWL (from implant, Company updated interim data): |
| | | | | Visit (post-device activation) | | % EWL | | N | 12 Months | | (24.5) | | 26 | 24 Months | | (22.7) | | 22 | 36 Months | | (24.3) | | 18 |
| · | | HbA1c change in percentage points (Baseline HbA1c = 7.8 + 0.2%) (Company updated interim data): |
| | | | | | | % HbA1c | | | Visit (post-device activation) | | change | | N | 12 Months | | (1) | | 26 | 24 Months | | (0.5) | | 24 | 36 Months | | (0.6) | | 17 |
| · | | Fasting Plasma Glucose change (Baseline 151.4 + 6.5 mg/dl average) (Company updated interim data): |
| | | | | | | Glucose | | | | | change | | | Visit (post-device activation) | | (mg/dl) | | N | 12 Months | | (27.6) | | 25 | 24 Months | | (20.3) | | 24 | 36 Months | | (24) | | 17 |
| · | | Change in mean arterial pressure (MAP) in hypertensive patients (baseline 99.5 mmHg) (Company updated interim data): |
| | | | | | | MAP | | | | | change | | | Visit (post-device activation) | | (mmHg) | | N | 12 Months | | (7.8) | | 14 | 24 Months | | (7.5) | | 12 | 36 Months | | (7.3) | | 10 |
To date, no deaths related to our device or unanticipated adverse device effects have been reported during the VBLOC-DM2 ENABLE trial and the safety profile is similar to that seen in the other VBLOCvBloc trials. As announced in June 2011 and October 2011, follow-up of patients showed the below data. Percent EWL (from implant, Company updated interim data):
| | | | | | | | | Visit (post-device activation) | | % EWL (³ 12
hours therapy
delivery per day) | | | N | | Week 1 | | | -9.5 | | | | 25 | | 3 Months | | | -20.8 | | | | 26 | | 6 Months | | | -25.2 | | | | 24 | | 12 Months | | | -27.2 | | | | 24 | | 18 Months | | | -24.6 | | | | 22 | |
% EWL for all patients (N=24) is -22.6 at 18 months. Two patients were not receiving therapy for unrelated medical reasons.
Interim analysis. N is patients who have reached those time points and were seen for the scheduled visit.
| • | | HbA1c change in percentage points (Baseline HbA1c = 7.8+ 0.2%) (Company updated interim data):
|
| | | | | | | | | | | | | Visit (post-device activation) | | % HbA1c
change | | | N | | | p | | Week 1 | | | -0.3 | | | | 28 | | | | 0.002 | | 6 Months | | | -0.9 | | | | 25 | | | | 0.002 | | 12 Months | | | -1.0 | | | | 26 | | | | 0.002 | | 18 Months | | | -1.1 | | | | 18 | | | | 0.002 | |
Fasting Plasma Glucose change (Baseline 151.4 + 6.5 mg/dl average) (Company updated interim data):
| | | | | | | | | | | | | Visit (post-device activation) | | Glucose
change
(mg/dl) | | | N | | | P | | Week 1 | | | -20.9 | | | | 28 | | | | 0.01 | | 6 Months | | | -28.7 | | | | 25 | | | | 0.01 | | 12 Months | | | -27.6 | | | | 25 | | | | 0.01 | | 18 Months | | | -32.0 | | | | 17 | | | | 0.01 | |
Change in diastolic blood pressure (DBP) in hypertensive patients (baseline 87.2 mmHg) (Company updated interim data):
| | | | | | | | | | | | | Visit (post-device activation) | | DBP
change
(mmHg) | | | N | | | p | | Week 1 | | | -10.1 | | | | 12 | | | | <0.001 | | 6 Months | | | -13.8 | | | | 10 | | | | <0.001 | | 12 Months | | | -10.2 | | | | 11 | | | | 0.009 | | 18 Months | | | -15.9 | | | | 10 | | | | <0.001 | |
Change in mean arterial pressure (MAP) in hypertensive patients (baseline 99.5 mmHg) (Company updated interim data):
| | | | | | | | | | | | | Visit (post-device activation) | | MAP
change
(mmHg) | | | N | | | p | | Week 1 | | | -6.8 | | | | 15 | | | | 0.04 | | 6 Months | | | -12.5 | | | | 13 | | | | <0.001 | | 12 Months | | | -7.8 | | | | 14 | | | | 0.03 | | 18 Months | | | -13.0 | | | | 13 | | | | 0.002 | |
As announced in April 2012, the metabolic effects at 2.5 years in diabetes, hypertension and weight loss were consistent with previous findings (above) and were all statistically significant. Change for HbA1c and fasting plasma glucose, both Type 2 diabetes indicators, were reductions of 0.8 percentage points (p=0.0492) and 29.0 mg/dl (p=0.0306) from a baseline of 7.7% and 162.8 mg/dl, respectively (n=12). Change in mean arterial pressure (n=9) and diastolic blood pressure (n=8), indicators of hypertension, showed sustained improvement, with reductions of 11.5 mmHg (p=0.0053) and 13.2 mmHg (p=0.0037) at 30 months from baselines of 99.1 mmHg and 85.9 mmHg, respectively. EWL was 22.5% (p<0.0001) for the 19 subjects who reported for their30-month visit.
Caloric Intake Sub-study:A sub-study, conducted as part of the VBLOC-DM2 ENABLE trial, evaluated 12-month satiety and calorie intake in 10 patients with Type 2 diabetes mellitus enrolled in the trial. Follow-up measures among patients enrolled in the sub-study included EWL, 7-day diet records assessed by a nutritionist, calorie calculations and visual analogue scale (VAS) questions to assess satiety by 7-day or 24-hour recall at the following time periods: baseline, 4 and 12 weeks and 6 and 12 months post device initiation. A validated program, Food Works™, was used to determine calorie and nutrition content. Results include: | •· | | Mean EWL for the sub-study was 33+5% (p<0.001) at 12 months; |
| · | | Calorie intake decreased by 45% (p<0.001), 48% (p<0.001), 38% (p<0.001) and 30% (p=0.02), at 4 and 12 weeks, 6 months and 12 months, respectively, from a baseline of 2,062 kcal/day; and |
| · | | VAS recall data, using a repeated measures analysis, documented fullness at the beginning of meals (p=0.005), less food consumption (p=0.02) and less hunger at the beginning of meal (p=0.03) corroborating the reduction in caloric intake. |
Our Product The vBloc System, our initial product, uses vBloc Therapy to limit the expansion of the stomach, help control hunger sensations between meals, reduce the frequency and intensity of stomach contractions and produce a feeling of early and prolonged fullness. We believe the vBloc System offers obese patients a minimally-invasive treatment that can result in significant, durable and sustained weight loss. We believe that our vBloc System allows laproscopically trained surgeons to offer a new option to obese patients who are concerned about the risks and complications associated with currently available anatomy-altering, restrictive or malabsorptive surgical procedures. The vBloc System delivers vBloc Therapy via two small electrodes that are laparoscopically implanted and placed in contact with the trunks of the vagus nerve just above the junction between the esophagus and the stomach, near the diaphragm and connected to a neuroregulator, which is subcutaneously implanted. The vBloc System is powered by an internal rechargeable battery. The vBloc System is implanted by a laproscopically trained surgeon using a procedure that is typically performed within 60-90 minutes as an outpatient procedure. The physician activates the vBloc System after implantation. vBloc Therapy is then delivered intermittently through the neuroregulator each day as scheduled (recommended during the patient’s waking hours when food is consumed). The scheduled delivery of the intermittent pulses blocking the vagus nerve is customized for each patient’s weight loss and overall treatment objectives. The physician is able to download reports to monitor patient use and system performance information. This information is particularly useful to physicians to ensure that patients are properly using the system. Our Market The Obesity and Metabolic Disease Epidemic Obesity is a disease that has been increasing at an alarming rate with significant medical repercussions and associated economic costs. Since 1980, the worldwide obesity rate has more than doubled, with about 13% of the world’s adult population now being obese. The World Health Organization (WHO) currently estimates that as many as 600 million people worldwide are estimated to be obese and more than 1.9 billion adults are estimated to be overweight. Being overweight or obese is also the fifth leading risk for global deaths, with approximately 3.4 million adults dying each year as a result. According to the WHO, there are over 70 progressive obesity-related diseases and disorders associated with obesity, which are also known as comorbidities, including Type 2 diabetes, hypertension, infertility and certain cancers. Worldwide, 44% of the diabetes burden, 23% of the heart disease burden and between 7% and 41% of certain cancer burdens are attributable to overweight and obesity. We believe that this epidemic will continue to grow worldwide given dietary trends in developed nations that favor highly processed sugars, larger meals and fattier foods, as well as increasingly sedentary lifestyles. Despite the growing obesity rate, increasing public interest in the obesity epidemic and significant medical repercussions and economic costs associated with obesity, there continues to be a significant unmet need for effective treatments. The United States Market Obesity has been identified by the U.S. Surgeon General as the fastest growing cause of disease and death in the United States. Currently, the Center for Disease Control (the CDC) estimates that 35.7% of U.S. adults (or approximately 73,000,000 people) are obese, having a BMI of 30 or higher. BMI is calculated by dividing a person’s weight in kilograms by the square of their height in meters. It is estimated that if obesity rates stay consistent, 51% of the U.S. population will be obese by 2030. According to data from the U.S. Department of Health and Human Services, almost 80% of adults with a BMI above 30 have a co-morbidity, and almost 40% have two or more of these comorbidities. According to The Obesity Society and the CDC, obesity is associated with many significant weight-related comorbidities including Type 2 diabetes, high blood-pressure, sleep apnea, certain cancers, high cholesterol, coronary artery disease, osteoarthritis and stroke. According to the American Cancer Society, 572,000 Americans die of cancer each year, about one-third of which are linked to excess body weight, poor nutrition and/or physical inactivity. Over 75% of hypertension cases are directly linked to obesity, and approximately two-thirds of U.S. adults with Type 2 diabetes are overweight or have obesity. Currently, medical costs associated with obesity in the U.S. are estimated to be up to $210 billion per year and nearly 21% of medical costs in the U.S. can be attributed to obesity. Researchers estimate that if obesity trends continue, obesity related medical costs could rise by another $44-$66 billion each year in the U.S. by 2030. The medical costs paid by third-party payers for people who are obese were $2,741 per year, or 42% higher than those of people who are normal weight and the average cost to employers is $6,627 to $8,067 per year per obese employee (BMI of 35 to 40 and higher). Current Treatment Options and Their Limitations We believe existing options for the treatment of obesity have seen limited adoption to date due to patient concerns and potential side effects including morbidity. The principal treatment alternatives available today for obesity include: • Behavioral modification. Behavioral modification, which includes diet and exercise, is an important component in the treatment of obesity; however, most obese patients find it difficult to achieve and maintain significant weight loss with a regimen of diet and exercise alone. • Pharmaceutical therapy. Pharmaceutical therapies often represent a first option in the treatment of obese patients but carry significant safety risks and may present troublesome side effects and compliance issues. • Bariatric surgery. In more severe cases of obesity, patients may pursue more aggressive surgical treatment options such as gastric balloon, gastric banding, sleeve gastrectomy and gastric bypass. These procedures promote weight loss by surgically restricting the stomach’s capacity and outlet size. While largely effective, these procedures generally result in major lifestyle changes including dietary restrictions and food intolerances and they may present substantial side effects and carry short- and long-term safety and side effect risks that have limited their adoption. Market Opportunity Given the limitations of behavioral modification, pharmaceutical therapy and bariatric surgical approaches, we believe there is a substantial need for a patient-friendly, safer, effective and durable solution that: | · | | preserves normal anatomy; |
| · | | is “non-punitive” in that it supports continued ingestion and digestion of foods and micronutrients such as vitamins and minerals found in a typical, healthy diet while allowing the user to modify his or her eating behavior appropriately without inducing punitive physical restrictions that physically force a limitation of food intake; |
| · | | enables non-invasive adjustability while reducing the need for frequent clinic visits; |
| · | | minimizes undesirable side-effects; |
| · | | minimizes the risks of re-operations, malnutrition and mortality; and |
| · | | reduces the natural hunger drive of patients. |
Obesity is a disease that has been increasing at an alarming rate with significant medical repercussions and associated economic costs. Since 1980, the worldwide obesity rate has more than doubled, with about 13% of the world’s adult population now being obese. The World Health Organization (WHO) currently estimates that as many as 600 million people worldwide are estimated to be obese and more than 1.9 billion adults are estimated to be overweight. Being overweight or obese is also the fifth leading risk for global deaths, with approximately 3.4 million adults dying each year as a result. We believe that this epidemic will continue to grow worldwide given dietary trends in developed nations that favor highly processed sugars, larger meals and fattier foods, as well as increasingly sedentary lifestyles. Despite the growing obesity rate, increasing public interest in the obesity epidemic and significant medical repercussions and economic costs associated with obesity, there continues to be a significant unmet need for effective treatments. Our Technology vBloc Therapy is designed to block the gastrointestinal effects of the vagus nerve using high-frequency, low-energy electrical impulses to intermittently interrupt naturally occurring neural impulses on the vagus nerve between the brain and the digestive system. Our therapy controls hunger sensations between meals, limits the expansion of the stomach and reduces the frequency and intensity of stomach contractions, leading to earlier fullness. The resulting physiologic effects of vBloc Therapy produce a feeling of early and prolonged fullness following smaller meal portions. By intermittently blocking the vagus nerve and allowing it to return to full function between therapeutic episodes, our therapy limits the body’s natural tendency to circumvent the therapy, which can result in long-term weight loss. We have designed our vBloc System to address a significant market opportunity that we believe exists for a patient-friendly, safe, effective, less-invasive and durable therapy that is intended to address the underlying causes of hunger and obesity. Our vBloc System offers each of the following benefits, which we believe could lead to the adoption of vBloc Therapy as the surgical therapy of choice for obesity and its comorbidities: | · | | Preserves Normal Anatomy. The vBloc System is designed to deliver therapy that blocks the neural signals that influence a patient’s hunger and sense of fullness without altering digestive system anatomy. Accordingly, patients should experience fewer and less severe side effects compared to treatments that incorporate anatomical alterations. |
| · | | Allows Continued Ingestion and Digestion of Foods Found in a Typical, Healthy Diet. Because our therapy leaves the digestive anatomy unaltered, patients are able to maintain a more consistent nutritional balance compared to existing surgical approaches, thus allowing them to effect positive changes in their eating behavior in a non-forced and potentially more consistent way. |
| · | | May be Implanted on an Outpatient Basis and Adjusted Non-Invasively. The vBloc System is designed to be laparoscopically implanted within a 60-90 minute procedure, allowing patients to leave the hospital or clinic on the same day. The implantable system is designed to be turned off and left in place for patients who reach their target weight. When desired, the follow-up physician can simply and non-invasively turn the therapy back on. Alternatively, the implantable system can be removed in a laparoscopic procedure. |
| · | | Offers Favorable Safety Profile. We have designed our ReCharge and EMPOWER clinical trials to demonstrate the safety of the vBloc System. In our clinical trials to date, including the ReCharge and EMPOWER trials, we have not observed any mortality related to our device or any unanticipated adverse device effects. We have also not observed any long-term problematic clinical side effects in any patients, including in those patients who have been using vBloc Therapy for more than one year. |
| · | | Targets Multiple Factors that Contribute to Hunger and Obesity. We designed vBloc Therapy to target the digestive, metabolic and information transmission functions of the vagus nerve and to affect the perception of hunger and fullness, which together contribute to obesity and its metabolic consequences. |
vBloc Therapy, delivered via our vBloc System, is intended to offer patients an effective, safe, outpatient solution that minimizes complications. It enables patients to lose weight and maintain long-term weight loss while enjoying a normal, healthy diet. We also believe that the vBloc System will appeal to physicians based on the inherent physiological approach of vBloc Therapy and its favorable safety profile. Our Commercialization Strategy Our goal is to establish vBloc Therapy, delivered via our vBloc System, as the leading obesity management solution. The key business strategies by which we intend to achieve these objectives include: Commercialize Our Products Using a Geography Focused Direct-to-Patient Marketing Effort Within the United States. Since we received FDA approval on January 14, 2015 for vBloc Therapy, delivered via the vBloc System, we have begun a controlled commercial launch at select bariatric centers of excellence in the United States. We had our first commercial sales in 2015 and sold 62 units in 2016. During 2015, we started the process of building a sales force and a controlled expansion of our operations and hired three new executives in January 2016 to oversee this expansion. The direct sales force is supported by field technical managers who provide training, technical and other support services to our customers. Throughout 2015 and 2016 our sales force called directly on key opinion leaders and bariatric surgeons at commercially-driven bariatric centers of excellence that met our certification criteria. Additionally, in 2016, through a distribution agreement with Academy Medical, VA medical facilities now offer the vBloc System as a treatment option to veteran healthcare benefits. We intend to continue to build on these efforts in 2017 through self-pay patient and veteran focused direct-to-patient marketing and key opinion leader and center specific partnering. Account management and patient registration processes used during the clinical trial are being transitioned to a commercial registration structure. Centers responsible for implanting our product will be expanded and trained to perform patient selection, implant the vBloc System and manage appropriate follow-up procedures. Our sales representatives are supported by field clinical experts who are responsible for training, technical support, and other support services at various implant centers. Our sales representatives implement consumer marketing programs and provide surgical centers and implanting surgeons with educational patient materials. We market directly to patients but sell our product to select surgical centers throughout the United States that have patients that would like to use the vBloc System to treat obesity and its comorbidities. The surgical centers then sell our product to the patients and implant and administer vBloc Therapy. In 2015 and 2016, almost all the patients that purchased the vBloc System paid for the therapy themselves and did not receive reimbursement from an insurance provider, and we expect that most of our sales will come from self-pay patients and veterans in 2017. Additionally, through our distribution agreement with Academy Medical, VA medical facilities now offer the the vBloc System as a treatment option for veterans at little to no cost to veterans in accordance with their veteran healthcare benefits. We are working to obtain coverage for our product from the U.S. Centers for Medicare and Medicaid Services (CMS), Medicare Administrative Contractors (MACs), major insurance carriers, local coverage entities and self-insured plans, including Integrated Delivery Networks (IDNs). We received coverage from one significant IDN in the northeast, Winthrop University Hospital, in 2016 and are in active discussions with other IDNs throughout the country. Identify Appropriate Coding, Obtain Coverage and Payment for the vBloc System. While payers are not our direct customers, their coverage and reimbursement policies influence patient and physician selection of obesity treatment. We are employing a focused campaign to obtain payer support for vBloc Therapy. We are seeking specific and appropriate coding, coverage and payment for our vBloc System from private insurers and CMS. We plan to establish a market price for the vBloc System in the United States that is competitive with other available weight loss surgical procedures and comparable to other active implantable devices such as implantable cardioverter defibrillators, neurostimulation devices for chronic pain and depression, and cochlear implant systems. CMS issued a national coverage determination for several specific types of bariatric surgery in 2006, which we view as positive potential precedent and guidance factors that CMS might use in deciding to cover our therapy. Although Medicare policies are often emulated or adopted by other third-party payers, other governmental and private insurance coverage currently varies by carrier and geographic location. We are actively working with major insurance carriers, local coverage entities and self-insured plans, as well as CMS, on obtaining coverage for procedures using our product. Initial coverage for vBloc will likely occur in self-contained healthcare systems that operate as IDNs, as these systems are able to evaluate risk-benefit ratios in a closed environment. For example, in the first quarter of 2016, we announced that the Winthrop Hospital System in New York, a significant IDN in the northeast, would cover our therapy for their employees. Other similar arrangements are in active discussion. Drive the Adoption and Endorsement of vBloc Therapy Through Obesity Therapy Experts and Patient Ambassadors. Our Clinical Development strategy is to collaborate closely with regulatory bodies, obesity therapy experts and others involved in the obesity management process, patients and their advocates and scientific experts. We have established credible and open relationships with obesity therapy experts and have identified vBloc Therapy patient ambassadors and we believe these individuals will be important in promoting patient awareness and gaining widespread adoption of the vBloc System. Expand and Protect Our Intellectual Property Position. We believe that our issued patents and our patent applications encompass a broad platform of neuromodulation therapies, including vagal blocking and combination therapy focused on obesity, diabetes, hypertension and other gastrointestinal disorders. We intend to continue to pursue further intellectual property protection through U.S. and foreign patent applications. Leverage our vBloc Technology for Other Disease States. We intend to continue to conduct research and development for other potential applications for our vBloc Therapy and believe we have a broad technology platform that will support the development of additional clinical applications and therapies for other metabolic and gastrointestinal disorders in addition to obesity. Concentrate Our Resources on the U.S. Market. We intend to devote our near-term efforts toward mounting a successful system launch in the United States. We intend to explore select international markets to commercialize the vBloc System as our resources permit, using direct, dealer and distributor sales models as the targeted market best dictates. Specifically, we are currently evaluating Canada as a market due to its relatively low barrier to entry and an established cash-pay bariatric patient market. The vBloc System, Implantation Procedure and Usage The vBloc System. Our vBloc System delivers vBloc Therapy via two small electrodes that are laparoscopically implanted and placed in contact with the trunks of the vagus nerve just above the junction between the esophagus and the stomach, near the diaphragm. The vBloc System (shown below) is powered by an internal rechargeable battery. 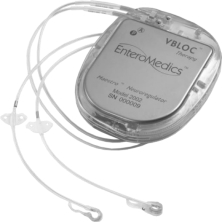
The major components of the vBloc System include: | · | | Neuroregulator. The neuroregulator, a pacemaker-like device, is an implanted device that controls the delivery of vBloc Therapy to the vagus nerve. It is surgically implanted just below, and parallel to, the skin, typically on the side of the body over the ribs. |
| · | | Lead System. Proprietary leads are powered by the neuroregulator and deliver electrical pulses to the vagus nerve via the electrodes. The leads and electrodes are similar to those used in traditional cardiac rhythm management products. |
| · | | Mobile Charger. The mobile charger is an electronic device worn by the patient externally while recharging the device. It connects to the transmit coil and provides information on the battery status of the neuroregulator and the mobile charger. |
| · | | Transmit Coil. The transmit coil is positioned for short periods of time on top of the skin over the implanted neuroregulator to deliver radiofrequency battery charging and therapy programming information across the skin into the device. |
| · | | Clinician Programmer. The clinician programmer connects to the mobile charger to enable clinicians to customize therapy settings as necessary and retrieve reports stored in system components. The reports include patient use and system performance information used to manage therapy. The clinician programmer incorporates our proprietary software and is operated with a commercially available laptop computer. |
Implantation Procedure. The vBloc System is implanted by a laproscopically trained surgeon using a procedure that is typically performed within 60-90 minutes. During the procedure, the surgeon laparoscopically implants the electrodes in contact with the vagal nerve trunks and then connects the lead wires to the neuroregulator, which is subcutaneously implanted. The implantation procedure and usage of the vBloc System carry some risks, such as the risks generally associated with laparoscopic procedures as well as the possibility of device malfunction. Adverse events related to the therapy, device or procedure may include, but are not limited to: transient pain at the implant site, heartburn, constipation, nausea, depression, diarrhea, infection, organ or nerve damage, surgical explant or revision, device movement, device malfunction and allergic reaction to the implant. Usage of the vBloc System. The physician activates the vBloc System after implantation. vBloc Therapy is then delivered intermittently through the neuroregulator each day as scheduled (recommended during the patient’s waking hours when food is consumed) through the neuroregulator. The scheduled delivery of the intermittent pulses blocking the vagus nerve is customized for each patient’s weight loss and overall treatment objectives. The physician is able to download reports to monitor patient use and system performance information. This information is particularly useful to physicians to ensure that patients are properly using the system. Although usage of our vBloc System generally proceeds without complications, as part of the therapy or intentional weight loss, patients in our clinical trials have observed side-effects such as transient pain at the implant site, heartburn, bloating, dysphagia, eructation, cramps, diarrhea, nausea, constipation, and excessive feelings of fullness, especially after meals. In addition, patient noncompliance with properly charging the vBloc System may render vBloc Therapy less effective in achieving long-term weight loss. Our Clinical Experience We have conducted a series of clinical trials to date, which have shown that vBloc Therapy offers physicians a programmable method to selectively and reversibly block the vagus nerve resulting in clinically and statistically significant EWL. We have not observed any mortality related to our device or any unanticipated adverse device effects in any of our completed or ongoing studies. Reported events include those associated with laparoscopic surgery or any implantable electronic device. The effects of vBloc Therapy include changes in appetite, and, in some patients, effects that may be expected with decreased intra-abdominal vagus nerve activity, such as temporary abdominal discomfort and short episodes of belching, bloating, cramping or nausea. Findings from our clinical trials have resulted in publication in numerous peer-reviewed journals including The Journal of the American Medical Association, Journal of Obesity, Obesity Surgery, Surgery for Obesity and Related Diseases, Journal of Diabetes and Obesity, Surgery and Journal of Neural Engineering, and data have been presented at several scientific sessions including the American Society for Metabolic and Bariatric Surgery, International Federation for Surgery of Obesity and Metabolic Disorders, the Obesity Surgery Society of Australia & New Zealand and The Obesity Society. Below is a more detailed description of our ongoing clinical studies: ReCharge Trial In October 2010, we received an unconditional Investigational Device Exemption (IDE) Supplement approval from the FDA to conduct a randomized, double-blind, sham-controlled, multicenter pivotal clinical trial, called the ReCharge trial, testing the effectiveness and safety of vBloc Therapy utilizing our second generation vBloc System. Enrollment and implantation in the ReCharge trial was completed in December 2011 in 239 randomized patients (233 implanted) at 10 centers. All patients in the trial received an implanted device and were randomized in a 2:1 allocation to treatment or control groups. The control group received a non-functional device during the trial period. All patients were expected to participate in a standard weight management counseling program. The primary endpoints of efficacy and safety were evaluated at 12 months. The ReCharge trial met its primary safety endpoint with a 3.7% serious adverse event rate, significantly lower than the threshold of 15% (p<0.0001). The safety profile at 12 months was further supported by positive cardiovascular signals including a 5.5 mmHg drop in systolic blood pressure, a 2.8 mmHg drop in diastolic blood pressure and a 3.6 bpm drop in average heart rate. Although the trial did not meet its predefined co-primary efficacy endpoints, it did demonstrate in the ITT population (n=239) a clinically meaningful and statistically significant EWL of 24.4% (approximately 10% TBL) for vBloc Therapy-treated patients, with 52.5% of patients achieving at least 20% EWL. In the per protocol population, the trial demonstrated an EWL of 26.3% for vBloc Therapy-treated patients, with 56.8% of patients achieving at least 20% EWL. As a result of the positive safety and efficacy profile of vBloc Therapy, we used the data from the ReCharge trial to support a PMA application for the vBloc System, which was submitted to the FDA in June 2013 and was accepted for review and filing in July 2013. An Advisory Panel meeting was held on June 17, 2014 to review our PMA application for approval of the vBloc System. The Advisory Panel voted 8 to 1 “in favor” that the vBloc System is safe when used as designed and voted 4 to 5 “against” on the issue of a reasonable assurance of efficacy. The final vote, on whether the relative benefits outweighed the relative risk, was 6 to 2 “in favor,” with 1 abstention. We received FDA approval on January 14, 2015 for vBloc Therapy, delivered via the vBloc System, for the treatment of adult patients with obesity who have a BMI of at least 40 to 45 kg/m2, or a BMI of at least 35 to 39.9 kg/m2 with a related health condition such as high blood pressure or high cholesterol levels, and who have tried to lose weight in a supervised weight management program and failed within the past five years. Further analysis of the 12 month data show that in the primary analysis (ITT) population (n=239), vBloc Therapy-treated patients achieved a 24.4% average EWL (approximately 10% TBL) compared to 15.9% for sham control patients. This 8.5% difference demonstrated statistical superiority over sham control (p=0.002), but not super-superiority at the pre-specified 10% margin (p=0.705). In total, 52.5% of vBloc Therapy-treated patients had 20% or more EWL compared to 32.5% in the control group (p=0.004), and 38.3% of vBloc Therapy-treated patients had 25% or more EWL compared to 23.4% in the sham control group (p=0.02). While the respective co-primary endpoint targets of 55% and 45% were not met, the endpoint targets were within the 95% confidence intervals for the observed rates and therefore the observed rates were not significantly lower than these pre-specified rates. These efficacy data demonstrate vBloc Therapy’s positive effect on weight loss. In the per protocol group, which included only those patients who received therapy per the trial design (n=211), the vBloc Therapy-treated patients had a 26.3% average EWL (approximately 10% TBL) compared to 17.3% for the sham control group (p=0.003). In total, 56.8% of vBloc Therapy-treated patients achieved at least 20% EWL, which was above the predefined threshold of 55% compared to 35.4% in the sham control group (p=0.004). 41.8% of vBloc Therapy-treated patients also achieved at least 25% EWL in this population, which is slightly less than the predefined threshold of 45%, compared to 26.2% in the sham control group (p=0.03). Additionally, two-thirds of vBloc Therapy-treated patients achieved at least 5% TBL at 12 months. According to the CDC, 5% TBL can have significant health benefits on obesity related risk factors, or comorbidities, including reduction in blood pressure, improvements in Type 2 diabetes and reductions in triglycerides and cholesterol. Further analysis of our data at 12 months showed a meaningful impact on these comorbidities as noted in the below table showing the improvements seen at 10% TBL, the average weight loss in vBloc Therapy-treated patients. | | | Risk Factor | | 10% TBL | Systolic BP (mmHg) | | (9) | Diastolic BP (mmHg) | | (6) | Heart Rate (bpm) | | (6) | Total Cholesterol (mg/dL) | | (15) | LDL (mg/dL) | | (9) | Triglycerides (mg/dL) | | (41) | HDL (mg/dL) | | 3 | Waist Circumference (inches) | | (7) | HbA1c (%) | | (0.5) |
Approximately 93% of patients reached the 12 month assessment in the trial, consistent with a rigorously executed trial. vBloc Therapy-treated patients maintained their weight loss at 18 months and 24 months with an EWL of 23.5% and 21.1%, respectively. The trial’s positive safety profile also continued throughout this reported time period. VBLOC-DM2 ENABLE Trial Enrollment of the VBLOC-DM2 ENABLE trial began in 2008. The VBLOC-DM2 ENABLE trial is designed to evaluate the efficacy and safety of vBloc Therapy on obese subjects as well as its effect on glucose regulation in approximately 30 patients who are using the vBloc System. The trial is an international, open-label, prospective, multi-center study. At each designated trial endpoint the efficacy of vBloc Therapy is evaluated by measuring average percentage EWL, HbA1c (blood sugar), FPG (fasting plasma glucose), blood pressure, calorie intake, appetite and other endpoints at one week, one month, three, six, 12 and 18 months and longer. The following results were reported at 12 month intervals. | · | | Percent EWL (from implant, Company updated interim data): |
| | | | | Visit (post-device activation) | | % EWL | | N | 12 Months | | (24.5) | | 26 | 24 Months | | (22.7) | | 22 | 36 Months | | (24.3) | | 18 |
| · | | HbA1c change in percentage points (Baseline HbA1c = 7.8 + 0.2%) (Company updated interim data): |
| | | | | | | % HbA1c | | | Visit (post-device activation) | | change | | N | 12 Months | | (1) | | 26 | 24 Months | | (0.5) | | 24 | 36 Months | | (0.6) | | 17 |
| · | | Fasting Plasma Glucose change (Baseline 151.4 + 6.5 mg/dl average) (Company updated interim data): |
| | | | | | | Glucose | | | | | change | | | Visit (post-device activation) | | (mg/dl) | | N | 12 Months | | (27.6) | | 25 | 24 Months | | (20.3) | | 24 | 36 Months | | (24) | | 17 |
| · | | Change in mean arterial pressure (MAP) in hypertensive patients (baseline 99.5 mmHg) (Company updated interim data): |
| | | | | | | MAP | | | | | change | | | Visit (post-device activation) | | (mmHg) | | N | 12 Months | | (7.8) | | 14 | 24 Months | | (7.5) | | 12 | 36 Months | | (7.3) | | 10 |
To date, no deaths related to our device or unanticipated adverse device effects have been reported during the VBLOC-DM2 ENABLE trial and the safety profile is similar to that seen in the other vBloc trials. Caloric Intake Sub-study: A sub-study, conducted as part of the VBLOC-DM2 ENABLE trial, evaluated 12-month satiety and calorie intake in 10 patients with Type 2 diabetes mellitus enrolled in the trial. Follow-up measures among patients enrolled in the sub-study included EWL, 7-day diet records assessed by a nutritionist, calorie calculations and visual analogue scale (VAS) questions to assess satiety by 7-day or 24-hour recall at the following time periods: baseline, 4 and 12 weeks and 6 months and 12 months respectively, from a baseline of 2,062 kcal/day;post device initiation. A validated program, Food Works™, was used to determine calorie and nutrition content. Results include: | · | | Mean EWL for the sub-study was 33+5% (p<0.001) at 12 months; |
VAS recall data, using a repeated measures analysis, documented fullness at the beginning of meals (p=0.005), less food consumption (p=0.02) and less hunger at the beginning of meal (p=0.03) corroborating the reduction in caloric intake.
| · | | Calorie intake decreased by 45% (p<0.001), 48% (p<0.001), 38% (p<0.001) and 30% (p=0.02), at 4 and 12 weeks, 6 months and 12 months, respectively, from a baseline of 2,062 kcal/day; and |
| · | | VAS recall data, using a repeated measures analysis, documented fullness at the beginning of meals (p=0.005), less food consumption (p=0.02) and less hunger at the beginning of meal (p=0.03) corroborating the reduction in caloric intake. |
EMPOWER Trial The EMPOWER trial is a randomized, double-blind, controlled pivotal study that began in 294 patients2006 and was designed to evaluate the safety and efficacy of our first-generation MaestrovBloc RF System in the treatment of obesity.obesity in 294 patients. The purpose of the EMPOWER trial wasis to measure the safety and efficacy of our MaestrovBloc RF System in obese patients after 12 months of VBLOC therapy.vBloc Therapy. After all patients completed 12 months of follow up, the trial was unblinded and all patients, including those in the control group, had the option to receive ongoing VBLOC therapy.vBloc Therapy. Patients will continue to be followed out to 60 months as part of the trial and we will continue to monitor average percentage EWL and safety during this extended period. The EMPOWER trial met its safety endpoint but did not meet its comparative primary and secondary efficacy endpoints due to an unanticipated therapeutic effect seen in the control arm. The trial produced the following safety results:
No deaths, a one-year surgical revision rate of 4.8% and serious adverse event rate related to the device or implant/revision procedure of 3%;
No therapy-related serious adverse events in the entire study population through 12 months; and
No changes in intra-cardiac conduction, ventricular repolarization or ventricular arrhythmias were seen in either study group.
The trial produced the following efficacy results:
Both the treatment and control arm patients experienced comparable, significant, dose-dependent EWL atAt 12 months which resulted in the trial not meeting its efficacy endpoints; and
The ‘dose effect’ showed a correlation between average EWL and the number of hours of device use;from implant, patients in the treated group who used the system for greater than or equal to 12 hours a day saw an average EWL of nearly 30% at 12 months from implant while those in. The trial produced the control group who usedfollowing safety results:
| · | | No deaths, a one-year surgical revision rate of 4.8% and serious adverse event rate related to the device or implant/revision procedure of 3%; |
| · | | No therapy-related serious adverse events in the entire study population through 12 months; and |
| · | | No changes in intra-cardiac conduction, ventricular repolarization or ventricular arrhythmias were seen in either study group. |
At the system for greater than or equal to 12 hours a day saw an average EWL of 22% at 12 months from implant. As announced in June 2011, the 3036 month endpoint, EMPOWER EWL was approximately 20% in 10745 subjects to reach that time point.receiving at least 9 hours of therapy per day. In addition, it was announced in November 2012 that a subgroup analysis of EMPOWER trial patients was conducted to determine if VBLOC therapyvBloc Therapy would improve blood pressure prior to significant weight loss in obese subjects with hypertension, as defined by elevated blood pressure at baseline by JNC-7 guidelines (n=37, Group A) or history of hypertension (n=58, Group B) at baseline. The analysis was performed in a subset of subjects who had greater than or equal toreceiving at least 9 hours of therapy delivered per day to 12 months.
Subject demographics:
| · | | Change in systolic blood pressure (SBP) and diastolic blood pressure (DBP) from baseline: |
| | | | | | | | | | | | Group A
(Elevated
Blood
Pressure) | | | Group B
(History of
Hypertension) | | # of Subjects | | | 37 | | | | 58 | | BMI (kg/m2) | | | 41+/-1 | | | | 41+/-1 | | Age (Years) | | | 50+/-1 | | | | 51+/-1 | | Female/Male | | | 31/6 | | | | 47/11 | |
| | | | | | | | Change in systolic blood pressure (SBP) and diastolic blood pressure (DBP) from baseline:
| | | | | | | | | | | | | | | | | | | Baseline | | | Week 2 | | | Week 4 | | | 12 Months | | Group A (subjects with elevated blood pressure) (p<0.001) | | | | | | | | | | | | | | | | | SBP (mmHg) | | | 145+/-2 | | | | -17+/-3 | | | | -17+/-3 | | | | -18+(18+/-3 | (3) | DBP (mmHg) | | | 89+/-2 | | | | -9+/-2 | | | | -8+/-2 | | | | -10+(10+/-2 | (2) | % EWL | | N/A | N/A | | | | 9+/-2 | | | | 12+/-1 | | | | 21+/-4 | | Group B (subjects with history of hypertension) (p<0.001) | | | | | | | | | | | | | | | | | SBP (mmHg) | | | 134+/-2 | | | | -10+/-2 | | | | -9+/-2 | | | | -13+(13+/-2 | (2) | DBP (mmHg) | | | 84+/-1 | | | | -6+/-1 | | | | -6+/-1 | | | | -7+(7+/-1 | (1) | % EWL | | NA | NA | | | | 9+/-1 | | | | 13+/-1 | | | | 23+/-3 | |
Our Research and Development Current R&D Focus We have an experienced research and development team, including clinical, regulatory affairs and quality assurance, comprised of scientists, electrical engineers, software engineers and mechanical engineers with significant clinical knowledge and expertise. Our research and development efforts are focused in the following major areas: identifying the effect of vagal blocking on nerve and organ function;
| · | | supporting the current vBloc System; |
developing the Maestro System; and
| · | | developing the next-generation vBloc System; |
| · | | identifying the effect of vagal blocking on nerve and organ function; and |
investigating the Maestro platform for gastrointestinal disorders in addition to obesity.
| · | | investigating the vBloc platform for the treatment of gastrointestinal disorders and comorbidities in addition to obesity. |
We have spent a significant portion of our capital resources on research and development. Our research and development expenses were $11.1$5.1 million in 2013, $10.72016, $8.1 million in 20122015 and $16.7$11.0 million in 2011. The slight increase2014. Having obtained FDA approval in January 2015, our main focus has been on commercialization efforts, resulting in decreases in spending on research and development expenditures in 2013 was primarily relatedeach of 2015 and 2016 compared to costs associated with the unblinding of the ReCharge trial and the resulting efforts toward our PMA application for the Maestro Rechargeable System which was submitted to2014, when we were still working through the FDA in June 2013. With the completion of enrollment and device implantation in our ReCharge pivotal trial for obesity in late 2011, research and development expenditures decreased in 2012 as costs were primarily associated with supporting the ReCharge trial in addition to the continued follow-up on existing trials, such as VBLOC-DM2 ENABLE and EMPOWER.approval process.
Other Diseases and Disorders We believe that our VBLOC therapyvBloc Therapy may have the potential, if validated through appropriate clinical studies, to treat a number of additional gastrointestinal disorders or comorbidities frequently associated with obesity, including the following: | •· | | Type 2 Diabetes. Type 2 diabetes is an escalating global health epidemic often related to obesity that affects nearly 200 million people worldwide, 50 million in the United States alone. Those with diabetes are susceptible to cardiovascular morbidity and mortality, and up to two out of three people with diabetes have high blood pressure. We believe that VBLOC therapyvBloc Therapy has significant potential in treating |
| metabolic syndrome (diabetes with high blood pressure). We have launched an international feasibility trial, VBLOC-DM2 ENABLE, to further explore the efficacy of VBLOC therapyvBloc Therapy in this patient population and have reported preliminary findings in the “Clinical Development”“Our Clinical Experience” section above. |
| •· | | Hypertension. Blood pressure normally rises and falls throughout the day. When it consistently stays too high for too long, it is called hypertension. Globally, nearly one billion people have high blood pressure (hypertension); of these, two-thirds are in developing countries. About one in three American adults has high blood pressure or hypertension. Hypertension is one of the most important causes of premature death worldwide and the problem is growing; in 2025, an estimated 1.56 billion adults will be living with hypertension. Hypertension kills nearly 8 million people every year worldwide. We believe that VBLOC therapyvBloc Therapy may improve mean systolic and diastolic blood pressure in hypertensive patients. We completed a subgroup analysis of EMPOWER trial patients and have included an evaluation of the blood pressure effects of VBLOC therapyvBloc Therapy in our international feasibility trial, VBLOC-DM2 ENABLE, to further explore the efficacy of VBLOC therapyvBloc Therapy in this patient population and have reported preliminary findings in the “Clinical Development”“Our Clinical Experience” section above. |
| •· | | Pancreatitis. Primary and recurrent cases of acute pancreatitis are estimated to number from 150,000 to 200,000 annually, resulting in approximately 80,000 hospital admissions each year in the United States. In animal studies, we have shown that VBLOC therapyvBloc Therapy suppresses pancreatic exocrine secretion, suggesting its potential efficacy in treating pancreatitis. |
| •· | | Other Gastrointestinal Disorders. We believe that VBLOC therapyvBloc Therapy may have potential in a number of other gastrointestinal disorders, including irritable bowel syndrome and inflammatory bowel disease. |
None of thesethe above conditions arewere included in our current IDE orPMA application that was approved by the FDA on January 14, 2015, nor are they approved for sale internationally. Additional approvals will be required to market the MaestrovBloc System for these indications in the United States or internationally. Mayo Clinic Relationship
Our research and development team has worked with clinicians from Mayo Clinic, Rochester, Minnesota pursuant to exclusive know-how, license, and consulting agreements from 2005 through 2013. Mayo Clinic clinicians with multiple specialties such as bariatric surgery, gastroenterology and laparoscopic surgery consulted with our research and development team on an exclusive basis to advise us as we developed our devices for vagal blocking therapy to treat obesity. Specifically, Mayo Clinic clinicians, along with other of our consultants, have offered their expertise to advise us with regard to our clinical trials and surgical techniques for our implantation procedure and participate on our medical advisory board and therapeutic algorithm panel. The agreements with Mayo Clinic also included a similar collaboration for the development of products to address a wide variety of disorders susceptible to treatment by electrically blocking neural impulses on the vagus nerve. We retain the exclusive rights to obesity-related device inventions developed through this collaboration. We have also licensed-in two issued obesity-related patents from Mayo Clinic, which are unrelated to our VBLOC technology.
Medical Advisors In addition to our collaboration with Mayo Clinic, we also have medical advisors who provide strategic guidance to our development programs, consult with us on clinical investigational plans and individual study protocols, and advise on clinical investigational site selection. Members of our medical advisory group also: | · | | serve on our Data Safety Monitoring Board and Clinical Events Committee; |
meet with governmental regulatory authorities;
| · | | provide consultation on professional meeting presentations and journal manuscript submissions; and |
provide consultation on professional meeting presentations and journal manuscript submissions; and
| · | | develop and participate in clinical site training programs, including study surgical technique training and study subject follow-up training. |
develop and participate in clinical site training programs, including study surgical technique training and study subject follow-up training.
Sales and Marketing
United States
We have no experience as a company in the marketing, sale or distribution of our proposed products and are just beginning the process of developing a sales and marketing organization. In the event that the Maestro System receives FDA approval, we expect to recruit and retain additional personnel responsible for commercial operations, sales and marketing, customer service, reimbursement and technical service in order to support the commercial launch of our product.
We expect that account management and patient registration processes used during the clinical trial will be transitioned to commercial registration structure. Centers responsible for implanting our product will be expanded, and trained to perform the patient selection, implant and manage appropriate follow-up procedures.
Initially, we anticipate that our sales representatives will exclusively target selected bariatric surgery centers of excellence and nationally recognized bariatric surgery centers. We believe this currently represents over 450 facilities in the United States.
We plan to support our sales representatives with field clinical experts who will be responsible for training and support at various implant centers. We also expect that our sales representatives will spend time implementing joint consumer marketing programs with surgical centers and implanting surgeons. We also intend to market to potential referral source clinicians such as general practitioners, internists, endocrinologists and nurses.
To achieve commercial success for any product that receives regulatory approval, we must either develop a sales organization or enter into arrangements with others to sell our products. Developing a direct sales force can be expensive and time consuming and can delay the success of any product launch. Any sales force we develop will likely be competing against the experienced and well-funded sales and marketing operations of our competitors.
Outside of the United States
Outside of the United States, we may sell and support our products either through direct sales or medical device distributors. We plan to target countries with reasonable regulatory and reimbursement barriers and a population interested in managing their obesity. Each country we target will require specific regulatory approval from the local government or agency. In some situations, we may be able to rely on FDA approval, European CE Mark or ISO quality certificates to satisfy local regulatory requirements.
We obtained European CE Mark approval for our Maestro Rechargeable System in 2011. In January 2012, the final Maestro Rechargeable System components were listed on the ARTG by the Australian TGA. We have entered into exclusive, multi-year agreements with Device Technologies Australia Pty Limited and Bader Sultan & Brothers Co. W.L.L., for commercialization and distribution of the Maestro ReChargeable System in Australia and the Gulf Coast Countries, including Saudi Arabia, Kuwait, Bahrain, Qatar and the United Arab Emirates, respectively. We continue to explore additional select international markets to commercialize the Maestro Rechargeable System, including Europe.
Competition
We compete primarily in the market for obesity treatment with surgical obesity procedures and various devices used to implement neurostimulation and gastric stimulation systems. These current surgical procedures are performed in approximately less than 1% of all eligible obese patients today. We also compete with pharmaceutical therapies. The market for obesity treatments is competitive, subject to technological change and significantly affected by new product development. Although we expect to competeOur primary competition in the obesity treatment market is currently from surgical obesity procedures and from various devices used to implement neurostimulation and gastric stimulation systems. We believe we are the first company having neuroblocking therapy for gastric
stimulation systems and other neurotechnology devices that treat obesity, therethe treatment of obesity. There are currently no other FDA-approved neuromodulation or neuroblocking therapies for the treatment of obesity, but in the future we expect other new stimulation systems and neurotechnology devices to come on the market.
We expect our vBloc System will compete with surgical obesity procedures, including gastric bypass, gastric balloon, gastric banding and sleeve gastrectomy. These current surgical procedures are performed in less than 1% of all eligible obese patients today. Current manufacturers of approved gastric balloon and banding products include Apollo Endosurgery Inc. (Lap-Band and ORBERA Intragastric Balloon System), ReShape Medical, Inc. (ReShape Integrated Dual Balloon System), Obalon Therapeutics, Inc. (Obalon Balloon System) and Johnson & Johnson (Realize Adjustable Gastric Band). In June of 2016, Aspire Bariatrics, Inc. received FDA approval on the Aspire Assist® System, an endoscopic alternative to weight loss surgery for people with moderate to severe obesity. We believe we are the first company pursuing neuroblocking therapy for the treatment of obesity.also aware that GI Dynamics, Inc. has received approvals in various international countries to sell its EndoBarrier Gastrointestinal Liner. We also compete against the manufacturers of pharmaceuticals that are directed at treating obesity.obesity and the 99% of obese patients eligible for surgery that are not willing to pursue a surgical option . We are aware of a number of drugs that are approved for long-term treatment of obesity in the United States: Sibutramine, marketed by Abbott Labs as Meridia, which was withdrawn in 2010 from the market worldwide by the manufacturer based on safety concerns, Orlistat, marketed by Roche as Xenical and GlaxoSmithKline as Alli, Belviq marketed by Arena Pharmaceuticals, Inc. and, Qsymia, marketed by VIVUS, Inc. and Contrave, marketed by Orexigen Therapeutics, Inc. We
In addition to competition from surgical obesity procedures, we compete with several private early-stage companies developing neurostimulation devices for application to the gastric region and related nerves for the treatment of obesity. These companies may prove to be significant competitors, particularly through collaborative arrangements with large and established companies. They also compete with us in recruiting and retaining qualified scientific and management personnel, establishing clinical trial sites and subject registration for clinical trials, as well as in acquiring technologies and technology licenses complementary to our programs or advantageous to our business. In addition, there are many larger potential competitors experimenting in the field of neurostimulation to treat various diseases and disorders. For example, Medtronic, Inc., which develops deep brain stimulators and spinal cord stimulators, acquired TransNeuronix, which sought to treat obesity by stimulating the smooth muscle of the stomach wall and nearby tissue. St. Jude Medical, Inc., through its acquisition of Advanced Neuromodulation Systems, is developing spinal cord stimulators. CyberonicsLivaNova PLC is developing vagus nerve stimulators to modulate epileptic seizures and other neurological disorders. Boston Scientific Corporation, through its Advanced Bionics division, is developing neurostimulation devices such as spinal cord stimulators and cochlear implants. Ethicon-Endo Surgery acquired Cyberonics’LivaNova PLC’s patents and patent applications pertaining to vagus nerve stimulation for the treatment of obesity and two related comorbidities, diabetes and hypertension, in overweight patients. In addition to competition from developers of neurostimulation and gastric modulation systems, we expect our Maestro System will also compete with surgical obesity procedures, including gastric bypass, gastric banding, sleeve gastrectomy, vertical-banded gastroplasty and biliopancreatic diversion. The leader in the field of gastric banding was Allergan, whose Lap-Band received FDA approval for marketing in 2001. In 2007, Allergan acquired EndoArt, a European band company that has developed the EasyBand, which uses RF telemetry to adjust the gastric band. Allergan sold its gastric banding business to Apollo Endosurgery in 2013. Additionally, Johnson & Johnson received approval in 2007 of their gastric band product known as the Realize Adjustable Gastric Band. We are also aware that GI Dynamics has received approvals in various international countries to sell its EndoBarrier Gastrointestinal Liner and in 2011 began trading on the Australian Securities Exchange.
We believe that the principal competitive factors in our market include: acceptance by healthcare professionals, patients and payors;
| · | | acceptance by healthcare professionals, patients and payers; |
| · | | published rates of safety and efficacy; |
| · | | reliability and high quality performance; |
| · | | effectiveness at controlling comorbidities such as diabetes and hypertension; |
| · | | invasiveness and the inherent reversibility of the procedure or device; |
| · | | cost and average selling price of products and relative rates of reimbursement; |
| · | | effective marketing, education, sales and distribution; |
| · | | regulatory and reimbursement expertise; |
| · | | technological leadership and superiority; and |
| · | | speed of product innovation and time to market. |
speed of product innovation and time to market.
Many of our competitors are either publicly-traded or are divisions of publicly-traded companies, and they enjoy several competitive advantages over us, including: | · | | significantly greater name recognition; |
established relations with healthcare professionals, customers and third-party payors;
| · | | established relations with healthcare professionals, customers and third-party payers; |
| · | | established distribution networks; |
| · | | greater experience in research and development, manufacturing, preclinical testing, clinical trials, obtaining regulatory approvals, obtaining reimbursement and marketing approved products; and |
| · | | greater financial and human resources. |
greater financial and human resources.
As a result, we cannot assure you that we will be able to compete effectively against these companies or their products. Third-party Coverage and Reimbursement
We plan to set a market price for the Maestro System in the United States that is comparable to other high-end, active implantable devices such as implantable cardioverter defibrillators, neurostimulation devices for chronic pain, and cochlear implant systems. We expect that the procedure will be performed in the outpatient setting.
We believe that establishing appropriate third-party coverage for the therapy should be achievable as important structural elements are already in place. Physician claims for payment use Current Procedural Terminology, Fourth Edition (CPT) billing codes to describe procedures and services performed. Currently, there are established CPT codes for the implantation of cranial nerve pulse generators and related leads, and we expect providers may seek payment for our therapy based on these codes. In addition, we have applied for unique CPT Category III codes with the American Medical Association’s CPT Advisory Committee for a Vagus Nerve Blocking Therapy procedure and received approval for six of them. The approved CPT Category III codes were listed in the July 2012 edition of the CPT billing codes. We intend to use the approved codes to build evidence for a possible application for a CPT Category I Code at a later date. With respect to possible usage of our product in the hospital inpatient setting, hospital inpatient billing is referenced by International Classifications of Diseases, 9th Revision, Clinical Modification (ICD-9-CM) procedure codes. There is an existing ICD-9-CM diagnosis code for morbid obesity and our studies are intended to provide the necessary outcomes data to link appropriate billing codes with the ICD-9 diagnosis code for morbid obesity. By October 2014, health plans and providers must replace the ICD-9-CM system and begin using the newer ICD-10-CM system for billing hospital inpatient procedures. The ICD-10-CM system should not impact coverage decisions, but could impact reimbursement for various procedures. Our clinical trial data substantiating VBLOC therapy will also be used to seek coverage of VBLOC therapy for patients with morbid obesity and appropriate reimbursement for surgeons and hospitals under the codes already in place.
CMS, the federal agency that administers the Medicare program, issued a national coverage determination for several specific types of bariatric surgery in 2006, which we view as positive, potential precedent and guidance to factors that CMS might use in deciding to cover our therapy. The policy indicates that Medicare will cover these bariatric surgical procedures when they are performed in an approved Bariatric Center of Excellence by a bariatric surgeon who also meets established requirements. Subjects with a BMI greater than or equal to 35, at least one obesity-related disease or disorder and who were previously unsuccessful with medical treatment for obesity are considered eligible. However, the policy reiterates that treatments for obesity alone are not covered, because such treatments are not considered reasonable and necessary. Although Medicare policies are often emulated or adopted by other third-party payors, other governmental and private insurance coverage currently varies by carrier and geographic location. We intend to actively work with major insurance carriers as well as CMS to obtain coverage for procedures using our product.
The Australian reimbursement landscape for medical devices is comprised of a number of different payers and schemes. There are informal funding pathways and formal reimbursement systems. There are three major
payers: private health insurers; the Federal government; and State and Territory governments. Private health insurers pay for private hospital services, surgically implanted prostheses and defined health appliances. The Federal government pays for professional medical services including diagnostic investigations and the majority of the cost of services in public hospitals. State and Territory governments pay for some of the cost of services in public hospitals. In addition, various ad hoc Federal and State government grants and programs exist to provide funding for new technologies. The Medical Services Advisory Committee advises the Australian Minister for Health and Ageing on evidence relating to the safety, effectiveness and cost-effectiveness of new medical technologies and procedures. This advice informs Australian Government decisions about public funding for new, and in some cases existing, medical procedures. Evaluation of evidence associated with medical services has been an integral part of the process for the listing of new medical technologies and services on the Medicare Benefits Schedule. In Australia, we plan to seek specific and appropriate coding, coverage and payment for our Maestro Rechargeable System from the MSAC.
Other manufacturers of neurostimulator devices for a variety of indications have been successful in securing third-party coverage and reimbursement for use of their devices after early commercialization. We will actively pursue all similar opportunities to secure appropriate payment for our device.
Intellectual Property Our success will depend in part on our ability to obtain and defend patent protection for our products and processes, to preserve our trade secrets and to operate without infringing or violating the proprietary rights of third parties. To date, weWe own numerous U.S. and foreign patents, and have 33 issued U.S. patents, 27numerous patent applications pending, most of which pertain to treating gastrointestinal disorders and we believe provide us with broad intellectual property protection covering electrically-induced vagal blocking and methods for treating obesity. Assuming timely payment of maintenance fees as they become due, mostmany of these patents will expire in 2023. We have four granted Europeanalso received or applied for patents and seven granted Australian patents. We also have 13 U.S. patent applications (including one provisional application), two pending PCT applications, and 30 national stage patent applications, including applications in Europe, Australia, China, India Europe and Japan, one granted application in China and one granted application in Japan. These applications primarily pertain to our vagal blocking technology and its application to obesity as well as other gastrointestinal disorders. In addition to our patents and applications, we have a license agreement with Mayo Foundation for Medical Education and Research for two issued U.S. patents, which are unrelated to our VBLOC therapy. We also register the trademarks and trade names through which we conduct our business. To date, in the United States we have registered trademarks for VBLOCvBLOC®, ENTEROMEDICS® and MAESTRO®, each registered with the United States Patent and Trademark Office, and trademark applications for VBLOCvBLOC POWER TO CHOOSE and VBLOCvBLOC POWER TO CHOOSE AND DESIGN. In addition, some or all of the marks VBLOC,vBLOC, ENTEROMEDICS, MAESTRO, MAESTRO SYSTEM ORCHESTRATING OBESITY SOLUTIONS, VBLOCvBLOC POWER TO CHOOSE and VBLOCvBLOC POWER TO CHOOSE AND DESIGN are the subject of either a trademark registration or application for registration in Australia, Brazil, China, the European Community, India, Kuwait, Mexico, Saudi Arabia, Switzerland and the United Arab Emirates. In addition to our patents, we rely on confidentiality and proprietary information agreements to protect our trade secrets and proprietary knowledge. These confidentiality and proprietary information agreements generally provide that all confidential information developed or made known to individuals by us during the course of their relationship with us is to be kept confidential and not disclosed to third parties, except in specific circumstances. The agreements also provide for ownership of inventions conceived during the course of such agreements. If our proprietary information is shared or our confidentiality agreements are breached, we may not have adequate remedies, or our trade secrets may otherwise become known to or independently developed by competitors. Our Manufacturers and Suppliers We have designed and developed all of the elements of our MaestrovBloc System, except for the clinician programmer hardware, which uses a commercially available laptop computer. To date, all of the materials and components of the system used in our clinical trials are procured from qualified suppliers and contract manufacturers in accordance with our proprietary specifications. We use third parties to manufacture our MaestrovBloc System to minimize our capital investment, help control costs and take advantage of the expertise these third parties have in the large-scale production of medical devices. We do not currently plan to manufacture our MaestrovBloc System ourselves. All of our key manufacturers and suppliers have experience working with commercial implantable device systems, are ISO certified and are regularly audited by us. Our key manufacturers and suppliers have a demonstrated record of compliance with international regulatory requirements. We
Since we received FDA approval on January 14, 2015, and commenced commercialization of the Maestro RechargeablevBloc System in Australia and the Middle East in the first half of 2012. We expect to increaseUnited States, we have increased our production volume slowly as we continue to bringin connection with the Maestro Rechargeable System to the Australian and Middle East markets through a controlled commercial launch. Inlaunch of the event thatvBloc System in the Maestro Rechargeable System receives FDA approval or approval from additional select international markets, we expect to increase our production volume by a significant amount.United States. Given that we rely primarily on third-party manufacturers and suppliers for the production of our products, our ability to increase production going forward will depend upon the experience, certification levels and large scale production capabilities of our suppliers and manufacturers. Qualified suppliers and contract manufacturers have been and will continue to be selected to supply products on a commercial scale according to our proprietary specifications. We also intend to increasehave modestly increased our inventory levels to support commercial forecasts as we expand our implanting centers.centers and intend to continue to increase our inventory levels as we determine necessary. Our FDA approval process requiresrequired us to name and obtain approval for the suppliers of key components of our Maestro RechargeablevBloc System. Many of our parts are custom designed and as a result, we may not be able to quickly qualify and establish additional or replacement suppliers for the components of our Maestro RechargeablevBloc System. A delay in the approval process withAny new approvals of vendors required by the FDA or other regulatory agencies in other international markets for our Maestro RechargeablevBloc System as a result of the need to qualify or obtain alternate vendors for any of our components would delay our ability to sell and market the Maestro RechargeablevBloc System and could have a material adverse effect on our business. We believe that our current manufacturing and supply arrangements will be adequate to continue our controlled international commercial launch and our ongoing and planned clinical trials. In order to produce the Maestro RechargeablevBloc System in the quantities we anticipate to meet future market demand, we will need our manufacturers and suppliers to increase, or scale up, manufacturing production and supply arrangements by a significant factor over the current level of production. There are technical challenges to scaling up manufacturing capacity and developing commercial-scale manufacturing facilities that may require the investment of substantial additional funds by our manufacturers and suppliers and hiring and retaining additional management and technical personnel who have the necessary experience. If our manufacturers or suppliers are unable to do so, we may not be able to meet the requirements forto expand the launch of the product internationally or in the United SatesStates or launch the product internationally or to meet future demand, if at all. We may also represent only a small portion of our suppliers’ or manufacturers’ business and if they become capacity constrained they may choose to allocate their available resources to other customers that represent a larger portion of their business. We currently anticipate that we will continue to rely on third-party manufacturers and suppliers for the production of the Maestro RechargeablevBloc System following commercialization.as we expand our commercial launch. If we are unable to obtain a sufficient supply of our product, our revenue, business and financial prospects would be adversely affected. Government Regulations
United States Our MaestrovBloc System is regulated by the FDA as a medical device under the Federal Food, Drug, and Cosmetic Act (FFDCA) and the regulations promulgated under the FFDCA. Pursuant to the FFDCA, the FDA regulates the research, design, testing, manufacture, safety, labeling, storage, record keeping, advertising, sales and distribution, post-market adverse event reporting, production and advertising and promotion of medical devices in the United States. Noncompliance with applicable requirements can result in warning letters, fines, injunctions, civil penalties, recall or seizure of products, total or partial suspension of production, failure of the government to grant premarket approval for devices and criminal prosecution. Medical devices in the United States are classified into one of three classes, Class I, II or III, on the basis of the amount of risk and the controls deemed by the FDA to be necessary to reasonably ensure their safety and effectiveness. Class I, low risk, devices are subject to general controls (e.g., labeling and adherence to good manufacturing practices). Class II, intermediate risk, devices are subject to general controls and to special controls (e.g., performance standards, and premarket notification). Generally, Class III devices are those which must receive premarket approval by the FDA to ensure their safety and effectiveness (e.g., life-sustaining, life-supporting and implantable devices, or new devices which have not been found substantially equivalent to legally marketed devices), and require clinical testing to ensure safety and effectiveness and FDA approval prior to marketing and distribution. The FDA also has the authority to require clinical testing of Class II devices. In both the United States and certain international markets, there have been a number of legislative and regulatory initiatives and changes, such as the Modernization Act, which could and have altered the healthcare system in ways that could impact our ability to sell our medical devices profitably. Recent, widely-publicized events concerning the safety of certain drug, food and medical device products have raised concerns among members of Congress, medical professionals, and the public regarding the FDA’s handling of these events and its perceived lack of oversight over regulated products. The increased attention to safety and oversight issues has resulted in a more cautious approach by the FDA to device clearances and approvals, as well as post-market compliance, which could prevent, delay clearance or approval of our new products or product modifications, or require us to expend additional resources on post-market studies and controls. The FFDCA provides two basic review procedures for medical devices. Certain products may qualify for a submission authorized by Section 510(k) of the FFDCA, where the manufacturer submits to the FDA a premarket notification of the manufacturer’s intention to commence marketing the product. The manufacturer must, among other things, establish that the product to be marketed is substantially equivalent to another legally marketed product. Marketing may commence when the FDA issues a letter finding substantial equivalence. If a medical device does not qualify for the 510(k) procedure, the manufacturer must file a PMApremarket approval (PMA) application with the FDA. This procedure requires more extensive pre-filing clinical and preclinical testing than the 510(k) procedure and involves a significantly longer FDA review process.
Premarket Approval Our product will require prior premarket approval from the FDA. Because our MaestrovBloc System is an implanted device it is deemed to pose a significant risk. To market the Maestro System in the United States,that required PMA from the FDA must approve the device after submission of a PMA. The FDA can also impose restrictions on the sale, distribution or use of devices at the time of their approval, or subsequent to marketing. The process of obtaining premarket approval is costly, lengthy and uncertain. A PMA must be supported by extensive data including, but not limited to, technical, pre-clinical and clinical trials to demonstrate to the FDA’s satisfaction the safety and effectiveness of the device. Among other information, the PMA must also contain a full description of the device and its components, a full description of the methods, facilities and controls used for manufacturing, and proposed device labeling. If the FDA determines that a PMA is complete, the FDA accepts the application and begins an in-depth review of the submitted information. The FDA, by statute and regulation, has 180 days to review an accepted PMA application, although the review and response activities generally occur over a significantly longer period of time, typically one year, and can take up to several years. During this review period, the FDA may request additional information or clarification of information already provided. Also during the review period, an advisory panel of experts from outside the FDA may be convened to review and evaluate the application and provide recommendations to the FDA as to the approvability of the device. In addition, the FDA will conduct a pre-approval inspection of the PMA sponsor and contract manufacturer facilities, where applicable, to evaluate
compliance with the Quality System Regulation. Under the Medical Device User Fee and Modernization Act of 2002, the fee to submit a PMA can be up to $258,520 per PMA, however, we qualify for a small business exemption and, therefore, the fee for our first PMA submission will be waived. If the FDA’s evaluation of the PMA is favorable, the PMA is approved, and the device may be marketedmarket in the United States. The FDA may approveapproved the PMAvBloc System on January 14, 2015 with post-approval conditions intended to ensure the safety and effectiveness of the device. Failure to comply with the conditions of approval can result in material adverse enforcement action, including the loss or withdrawal of the approval. Even after approval of athe PMA, new PMAs or supplemental PMAs arewill be required for significant modifications to the manufacturing process, labeling, use and design of a device that is approved through the premarket approval process. Premarket approval supplements often require submission of the same type of information as a PMA except that the supplement is limited to information needed to support any
changes from the device covered by the original PMA. In addition, holders of an approved PMA are required to submit annual reports to the FDA that include relevant information on the continued use of the device.
Clinical Trials A clinical trial is almost always required to support a PMA. Clinical trials for a “significant risk” device such as ours require submission to the FDA of an application for an IDE for clinical studies to be conducted within the United States. The IDE application must be supported by appropriate data, such as animal and laboratory testing results, showing that it is safe to test the device in humans and that the testing protocol is scientifically sound. Clinical trials for a significant risk device in the United States may begin once the IDE application is approved by the FDA and by the Institutional Review Boards (IRBs) overseeing the clinical trial at the various investigational sites. Clinical trials require extensive recordkeeping and detailed reporting requirements. Our clinical trials must be conducted under the oversight of an IRB atfor each participating clinical trial site and in accordance with applicable regulations and policies including, but not limited to, the FDA’s good clinical practice requirements. We, the trial Data Safety Monitoring Board, the FDA or the IRB atfor each site at which a clinical trial is being performed may suspend a clinical trial at any time for various reasons, including a belief that the risks to study subjects outweigh the anticipated benefits.
Pervasive and Continuing FDAU.S. Regulation Both before and after FDA approval, numerous
Numerous regulatory requirements apply. These include: | · | | Quality System Regulation, which requires manufacturers to follow design, testing, control, documentation, complaint handling and other quality assurance procedures during the design and manufacturing processes; |
| · | | regulations which govern product labels and labeling, prohibit the promotion of products for unapproved or “off-label” uses and impose other restrictions on labeling and promotional activities; |
medical device reporting regulations, which require that manufacturers report to the FDA if their device may have caused or contributed to a death or serious injury or malfunctioned in a way that would likely cause or contribute to a death or serious injury if it were to recur; and
| · | | medical device reporting regulations, which require that manufacturers report to the FDA if their device may have caused or contributed to a death or serious injury or malfunctioned in a way that would likely cause or contribute to a death or serious injury if it were to recur; |
| · | | notices of correction or removal and recall regulations; |
notices of correction or removal and recall regulations.
| · | | periodic reporting of progress related to clinical trials, post approval studies required as conditions of PMA approval and relevant changes to information contained within the PMA approval; and |
| · | | reporting of transfers of value and payments to physicians and teaching hospitals. |
Advertising and promotion of medical devices are also regulated by the Federal Trade Commission and by state regulatory and enforcement authorities. Recently, some promotional activities for FDA-regulated products have resulted in enforcement actions brought under healthcare reimbursement laws and consumer protection statutes. In addition, under the federal Lanham Act, competitors and others can initiate litigation relating to advertising claims. Compliance with regulatory requirements is enforced through periodic facility inspections by the FDA, which may be unannounced. Because we rely on contract manufacturing sites and service providers, these additional sites are also subject to these FDA inspections. Failure to comply with applicable regulatory requirements can result in enforcement action, by the FDA, which may include any of the following sanctions: | · | | warning letters or untitled letters; |
| · | | fines, injunction and civil penalties; |
| · | | recall or seizure of our products; |
| · | | customer notification, or orders for repair, replacement or refund; |
| · | | operating restrictions, partial suspension or total shutdown of production or clinical trials; |
operating restrictions, partial suspension or total shutdown of production or clinical trials;
| · | | refusing our request for premarket approval of new products; |
refusing our request for premarket approval of new products;
| · | | withdrawing premarket approvals that are already granted; and |
withdrawing premarket approvals that are already granted; and
| · | | criminal prosecution. |
International Australia
The Company’s Maestro Rechargeable System, which is listed on the ARTG by the TGA, is regulated as a medical device under the Therapeutic Goods Act (TG Act), which regulates the research, design, testing, manufacture, safety, labeling, storage, record keeping, advertising, sales and distribution, post-market adverse event reporting, production and advertising and promotion of medical devices in Australia. The TG Act requires medical devices to be included on the ARTG before they can be supplied in Australia. The TGA’s requirements in relation to the inclusion process depend on the classification of devices based on risk level and other factors. All implantable components of the Maestro Rechargeable System, and most of the external components, required a full conformity assessment prior to inclusion on the ARTG to satisfy the TGA that the device and its manufacturer comply with the “Essential Principles” under the TG Act relating to the safety and performance characteristics of medical devices. Accordingly, among other things, the TGA reviewed data demonstrating the safety and performance of the device including data obtained through clinical trials. TGA regulations continue to apply to a device after inclusion on the ARTG. For example, the sponsor will be required to submit annual reports to the TGA, and when applicable, report certain adverse events to the TGA, and if a recall is required, it will need to comply with TGA requirements. Even after the device is included, the TGA may conduct audits from time to time in relation to the product to ensure ongoing compliance. In addition, advertising material to consumers relating to the device is regulated by the TG Act and the Therapeutic Goods Advertising Code. Advertising material in general is also subject to trade practices legislation, the regulatory agency for which is the Australian Competition and Consumer Commission.
Other Countries
International sales of medical devices are subject to foreign government regulations, which vary substantially from country to country. The time required to obtain approval by a foreign country may be longer or shorter than that required for FDA approval, and the requirements may differ. The primary regulatory environment in Europe is that of the European Economic Community (EEC), which consists of 2728 European Union (EU) member states encompassing nearly all the major countries in Europe. Additional countries that are not part of the EU, but are part of the European Economic Area (EEA), and other countries, such as Switzerland, have voluntarily adopted laws and regulations that mirror those of the EEC with respect to medical devices. The EEC has adopted Directive 90/385/EEC as amended by 2007/47/EC for active implantable medical devices and numerous standards that govern and harmonize the national laws and standards regulating the design, manufacture, clinical trials, labeling and adverse event reporting for medical devices that are marketed in member states. Medical devices that comply with the requirements of the national law of the member state in which their Notified Body is located will be entitled to bear CE marking, indicating that the device conforms to applicable regulatory requirements, and, accordingly, can be commercially marketed within the EEA and other countries that recognize this mark for regulatory purposes. We obtained European CE Mark approval for our Maestro RechargeablevBloc System in 2011.2011 for the treatment of obesity. The CE Mark approval for our vBloc System was expanded in 2014 to also include use for the management of Type 2 diabetes in obese patients. The method of assessing conformity with applicable regulatory requirements varies depending on the class of the device, but for our MaestrovBloc System (which is considered an AIMDActive Implantable Medical Device (AIMD) in Australia and the EEA, and falls into Class III within the United States), the method involved a combination of self-assessment and issuance of declaration of conformity by the manufacturer of the safety and performance of the device, and a third-party assessment by a Notified Body of the design of the device and of the our quality system. A Notified Body is a private commercial entity that is designated by the national government of a member state as being competent to make independent judgments about whether a product complies with applicable regulatory requirements. The assessment included, among other things, a clinical evaluation of the conformity of the device with applicable regulatory requirements. We use DEKRA Certification B.V. (formerly known as KEMA Quality) in the Netherlands as the Notified Body for our CE marking approval process. Continued compliance with CE marking requirements is enforced through periodic facility inspections by the Notified Body, which may be unannounced. Because we rely on contract manufacturing sites and service providers, these additional sites may also be subject to these Notified Body inspections. Patient Privacy Laws United States and various international laws have been evolving to protect the confidentiality of certain patient health information, including patient medical records. These laws restrict the use and disclosure of certain patient health information. Enforcement actions, including financial penalties, related to patient privacy issues are globally increasing. The management of patient data may have an impact on certain clinical research activities and product design considerations. Employees As of December 31, 2013,2016, we had a total of 2732 employees. All of these employees are located in the United States. From time to time we also employ independent contractors, consultants and temporary employees to support our operations. None of our employees are subject to collective bargaining agreements. We have never experienced a work stoppage and believe that our relations with our employees are good. Executive Officers The following table sets forth information regarding our executive officers, including their ages, as of February 28, 2014:2017: | | | | | | | Name | | Age | | | Age | | Position | Mark B. Knudson, Ph.D.Dan W. Gladney
| | 64 | 65 | | | President and Chief Executive Officer Chairman and Director | Greg S. LeaScott P. Youngstrom
| | 57 | 61 | | | Senior Vice President, Chief Financial Officer and Chief OperatingCompliance Officer | Adrianus (Jos) DondersNaqeeb (Nick) A. Ansari
| | 55 | 60 | | | Senior Vice President of Research and Advanced DevelopmentSales | Katherine S. TwedenPeter M. DeLange
| | 48 | 53 | | | Senior Vice President Clinicalof Operations and RegulatoryBusiness Development | Paul F. Hickey | | 52 | | Senior Vice President of Marketing and Reimbursement |
Mark B. Knudson, Ph.D.Dan W. Gladney has served as our President and Chief Executive Officer since November 16, 2015 and as Chairman of our board of directors since October 14, 2016. Mr. Gladney joined the Board since December 2002. Dr. Knudson alsoCompany on November 2, 2015 as President-Elect and a member of the board of directors. Prior to joining us, Mr. Gladney served as Chairman and Chief Executive Officer of Lanx, Inc., a medical device company focused on developing and commercializing innovative devices for spinal surgery. Prior to his time at Lanx, Inc., Mr. Gladney was a Healthcare Operating Partner at Norwest Equity Partners (NEP) from 2008 until 2010, where he was responsible for strategic planning, business growth and corporate governance for NEP portfolio companies and executing new investment opportunities for the firm. Prior to joining NEP, Mr. Gladney served as President and Chief Executive Officer of Venturi Group, LLCseveral medical device companies including Heart Leaflet Technologies and Venturi Development, Inc., positions he held from 1999 and 2001 until their dissolutions in 2008 and 2009, respectively. Dr. KnudsonACIST Medical Systems, both of which were acquired by The Bracco Group. He also served as Chairman, Chief Executive Officer and President of the Board of Restore Medical, Inc.,Complex Technologies, a publicly-held medical devicepublicly traded orthopedic and health and wellness electro therapy company, focusedfrom 2002 until 2006. Mr. Gladney currently serves on the treatmentboard of sleep disordered breathing, from 1999 through July 2008 when it was acquired by Medtronic,directors of ARIA CV, Inc. Dr. Knudson was alsoand has been a member of a number of other private and public company boards. After the audit committeesale of Restore Medical. Dr. Knudson receivedLanx, he acted as a Bachelor of Science in biology from Pacific Lutheran Universityprivate investor and a Ph.D. in physiology from Washington State University.small business consultant.
Greg S. LeaScott P. Youngstrom has served as our Senior Vice President and Chief Financial Officer and Chief Compliance Officer since May 21, 2007October 3, 2016. Mr. Youngstrom has over 25 years of strategic financial and was appointed Chief Operating Officer on February 15, 2013. Prior to joining us, Mr. Leaoperational experience in a variety of medical device companies, most recently having served as Chief Financial Officer and Vice President, Finance at Galil Medical, a leading developer of Pemstar Inc.cryotherapy technology. Prior to Galil Medical, from July 2002 through January 2007 when it was acquired by Benchmark Electronics, Inc.2009-2014, Mr. Lea alsoYoungstrom served as Vice President, Chief Operating Officer, and Chief Financial Officer at DGIMED Ortho, Inc., a directordeveloper of Pemstar from April 2001 through January 2007 and held the position of Corporate Controller from April 2002 through July 2002. From 1993 to April 2002,orthopedic medical devices. Mr. LeaYoungstrom has previously served as a corporateChief Financial Officer and Vice President, for Jostens Corporation, a commemorativeFinance with Anulex Technologies, Enpath Medical, Compex Technologies, Acist Medical Systems, and affiliation products manufacturer, serving most recently as corporate Vice President-Business Ventures. Prior to that, Mr. Lea held several financial management and administrative positions at IBM Corporation from 1974 to 1993 and was President and a director of the Ability Building Center, Inc. from 1981 to 1993. Mr. Lea holds a B.S. in Accounting/Business Management from Minnesota State University, Mankato.Cardiotronics.
Adrianus (Jos) DondersNaqeeb (Nick) A. Ansari has served as our Senior Vice President of ResearchSales since January 6, 2016. Mr. Ansari has over 20 years of experience in the medical device industry, having held various senior sales positions at Stryker Corporation, DePuy, Medtronic, Inc., Lanx, Inc. and Advanced Development since April 2005. From September 2003Globus Medical Inc. Prior to April 2005, Mr. Donders was Director Communication Systems Engineering for Medtronic USA. From June 2000joining the Company he spent two years as the owner of an independent distributor solely selling Biomet products. Prior to August 2003, Mr. Dondersthis, he served as Director Clinical Study Management and Research and Development Europe for Medtronic Europe. Mr. Donders received a degree equivalentSenior Vice President of Sales at Lanx, Inc. from 2010 to a Masters of Electrical Engineering from the Institute of Technology Eindhoven Netherlands.2013.
Katherine S. Tweden, Ph.D.Peter M. DeLange has served as our Senior Vice President of ClinicalOperations and RegulatoryBusiness Development since May 2011.January 18, 2016. Mr. DeLange has spent the last 11 years as the owner and President of Devicix, LLC a medical device engineering development company that was sold in 2015. At Devicix, he contracted with large medical device companies and worked closely with individual surgeons to develop new technologies. Since 2011, Mr. DeLange has also served as a Co-Founder and Board Member of FocusStart LLC, an early stage technology development company utilizing a capital efficient business model to advance medical technology. Prior to that Dr. TwedenDevicix, he held software engineer and product development positions at numerous companies including ACIST Medical Systems, Nellcor Puritan Bennett, Emerson EMC and Quester Technology.
Paul F. Hickey has served as our Senior Vice President of ResearchMarketing and Clinical from September 2008 to May 2011 and our Vice PresidentReimbursement since January 18, 2016. Mr. Hickey has over 15 years of Research from January 2003 to September 2008. From November 2002 to January 2003, Dr. Tweden was a consultant to Venturi Group,experience as a medical device incubator company. From January 2003 through August 2004, Dr. Tweden worked for Venturi Development Inc.executive, most recently having served as Chief Executive Officer of Pantheon Spinal, a consultantsmall spine implant start-up company based in Austin, Texas, since 2014. Prior to us. From July 1997 to October 2002, Dr. Tweden held positions including Director of Research andPantheon, he spent three years as Senior Vice President, Global Commercialization at Lanx, Inc., which was acquired by Biomet Spine in 2013, where he oversaw marketing, clinical reimbursement and R&D. Mr. Hickey also spent 17 years at Zimmer-Spine where he held thenumerous marketing and developments positions, of Senior Research Scientistmost recently as Vice President, Global R&D and Principal Research Scientist at St. Jude Medical, Inc. Dr. Tweden received a Bachelor of Arts in chemistryEmerging Technology from Gustavus Adolphus College and a Masters degree and Ph.D. in biomedical engineering from Iowa State University.2004-2008. Our Corporate Information We were incorporated in Minnesota in December 2002 under the nameas two separate legal entities, Alpha Medical, Inc. and Beta Medical, Inc., both of which were owned 100% by a common stockholder. In October 2003, wethe two entities were combined and changed our name to EnteroMedics Inc. and inIn 2004 we reincorporated in Delaware. We file reports and other information with the Securities and Exchange Commission (SEC) including annual reports on Form 10-K, quarterly reports on Form 10-Q, current reports on Form 8-K and proxy or information statements. Those reports and statements as well as all amendments to those documents filed or furnished pursuant to Section 13(a) or 15(d) of the Securities Exchange Act of 1934, as amended (1) are available at the SEC’s Public Reference Room at 100 F Street, N.E., Washington, DC 20549, (2) may be obtained by sending an electronic message to the SEC atpublicinfo@sec.govor by sending a fax to the SEC at 1-202-777-1027, (3) are available at the SEC’s internet site (http://www.sec.gov), which contains reports, proxy and information statements and other information regarding issuers that file electronically with the SEC and (4) are available free of charge through our website as soon as reasonably practicable after electronic filing with, or furnishing to, the SEC. You may obtain information on the operation of the Public Reference Room by calling the SEC at 1-800-SEC-0330. Our principal executive offices are located at 2800 Patton Road, St. Paul, Minnesota 55113, and our telephone number is (651) 634-3003. Our website address iswww.enteromedics.com. The information on, or that may be accessed through, our website is not incorporated by reference into this Annual Report on Form 10-K and should not be considered a part of this Annual Report on Form 10-K. ITEM 1A. RISK FACTORSRisks Related to Our Business and Industry
We are a development stage medical device company with a limited history of operations, no significant history of sales in the United States and approval to sell our producta limited history of sales in limited countries outside of the United States, and we cannot assure you that we will ever generate substantial revenue or be profitable. We are a development stage medical device company with a limited operating history upon which you can evaluate our business. Currently,We received FDA approval to sell our product in the United States on January 14, 2015 and we only have methad commercial sales within the United States in 2015 and 2016. We have also completed the regulatory process required to sell our product in Australia, the European Economic Area and other countries that recognize the European CE Mark, and dohave not have any other sourcegenerated revenue from commercial sales outside of revenue. We completed the first commercial sale of our product outside the United States since 2012 and then only on a limited basis in Australia and the first quarter of 2012, but do not expect to have a commercial sale within the United States until late 2014, if at all.Middle East. We have been engaged in research and development and clinical trials since our inception in 2002 and have invested substantially all of our time and resources in developing our VBLOC therapy,vBloc Therapy, which we intendhave begun to commercialize initially in the form of our Maestro RechargeablevBloc System. The success of our business will depend on our ability to establish a sales force, make sales and control costs, as well as our ability to obtain additional regulatory approvals needed to market new versions of our Maestro RechargeablevBloc System and any other products we may develop in the future, and our ability to create product sales, successfully introduce new products, establish our sales force and control costs, all of which we may be unable to do. If we are unable to successfully develop, receive additional regulatory approvals for and commercializemarket our Maestro RechargeablevBloc System for its indicated use, we may never generate revenue or bebecome profitable and we may have to cease operations.operations as a result. Our lack of a significant operating history also limits your ability to make a comparative evaluation of us, our products and our prospects. We have incurred losses since inception and we anticipate that we will continue to incur increasing losses for the foreseeable future. We have incurred losses in each year since our formation in 2002. As of December 31, 2013, we had experienced net losses during the development stage of $225.8 million. Our net loss applicable to common stockholders for the fiscal years ended December 31, 2013, 20122016, 2015 and 20112014 was $25.8$23.4 million, $23.5$25.5 million and $26.0$26.1 million, respectively. We have funded our operations to date principally from the sale of our securities and through the issuance of indebtedness. Development of a new medical device, including conducting clinical trials and seeking regulatory approvals, is a long, expensive and uncertain process. Although we recently metreceived the regulatory processapproval required to sell our Maestro RechargeablevBloc System in Australia,the United States and have the approvals required for sales in the European Economic Area and other countries that recognize the European CE Mark, and commencedwe have only generated limited revenue from commercial sales in the first halfUnited States and have not generated revenue from commercial sales outside of the United States since 2012 and then only on a limited basis in Australia and the Middle East, weEast. We expect to incur significant sales and marketing expenses prior to recording sufficient revenue to offset these expenses. We expect our general and administrative expenses to increase as we continue to add the infrastructure necessary to support our initial commercial sales, operate as a public company and develop our intellectual property portfolio. For these reasons, we expect to continue to incur significant and increasing operating losses for the next several years. These losses, among other things, have had and will continue to have an adverse effect on our stockholders’ equity and working capital. Because of the numerous risks and uncertainties associated with developing new medical devices, we are unable to predict the extent of any future losses or when we will become profitable, if ever. We will need substantial additional funding and may be unable to raise capital when needed, which would force us to delay, reduce or eliminate our product development programs or liquidate some or all of our assets. Our operations have consumed substantial amounts of cash since inception. We expect to continue to spend substantial amounts on the commercialization of our product and on research and development, including conducting current and future clinical trials for our MaestrovBloc System and initiating the commercializationsubsequent versions of our product. Cash used in operations was $18.4$20.6 million, $22.5$22.6 million and $19.9$19.4 million for the fiscal years ended December 31, 2013, 20122016, 2015 and 2011,2014, respectively. We expect that our cash used in operations will continue to be significant in the upcoming years, and that we maywill need to raise additional capital to commercialize our vBloc System in the United States, the European Economic Area, other countries that recognize the European CE Mark and other international markets, to explore other indications for our product, to continue our research and development programs, commercialize our Maestro Rechargeable System in Australia, the Middle East, other international markets, or the United States, if approved by the FDA, explore other indications for our product, and to fund our ongoing operations. Our future funding requirements will depend on many factors, including: the scope, rate of progress, results and cost of our clinical trials and other research and development activities;
| · | | the cost and timing of establishing sales, marketing and distribution capabilities; |
the cost and timing of regulatory approvals;
| · | | the cost of establishing clinical and commercial supplies of our vBloc System and any products that we may develop; |
the cost and timing of establishing sales, marketing and distribution capabilities;
| · | | the rate of market acceptance of our vBloc System and vBloc Therapy and any other product candidates; |
the cost of establishing clinical and commercial supplies of our Maestro Rechargeable System and any products that we may develop;
| · | | the cost of filing and prosecuting patent applications and defending and enforcing our patent and other intellectual property rights; |
the rate of market acceptance of our Maestro Rechargeable System and VBLOC therapy and any other product candidates;
| · | | the cost of defending, in litigation or otherwise, any claims that we infringe third-party patent or other intellectual property rights; |
the cost of filing and prosecuting patent applications and defending and enforcing our patent and other intellectual property rights;
| · | | the effect of competing products and market developments; |
the cost of defending, in litigation or otherwise, any claims that we infringe third-party patent or other intellectual property rights;
| · | | the cost of explanting clinical devices; |
the effect of competing products and market developments;
| · | | the terms and timing of any collaborative, licensing or other arrangements that we may establish; |
the cost of explanting clinical devices;
| · | | any revenue generated by sales of our vBloc System or our future products; |
the terms and timing of any collaborative, licensing or other arrangements that we may establish;
| · | | the scope, rate of progress, results and cost of any clinical trials and other research and development activities; |
any revenue generated by sales of our Maestro Rechargeable System or our future products;
| · | | the cost and timing of obtaining any further required regulatory approvals; and |
| · | | the extent to which we invest in products and technologies, although we currently have no commitments or agreements relating to these types of transactions. |
Until the time, if ever, when we can generate a sufficient amount of product revenue, we expect to finance our future cash needs through public or private equity offerings, debt financings or corporate collaboration, licensing arrangements and grants, as well as through interest income earned on cash balances. Additional capital may not be available on terms favorable to us, or at all. If we raise additional funds by issuing equity securities, our stockholders may experience dilution. Debt financing, if available, may involve restrictive covenants or additional security interests in our assets. Any additional debt or equity financing that we complete may contain terms that are not favorable to us or our stockholders. If we raise additional funds through collaboration and licensing arrangements with third parties, it may be necessary to relinquish some rights to our technologies or products, or grant licenses on terms that are not favorable to us. If we are unable to raise adequate funds, we may have to delay, reduce the scope of, or eliminate some or all of, our development programs or liquidate some or all of our assets. We incur significant costs as a result of operating as a public company, and our management is required to devote substantial time to compliance initiatives. As a public company, we incur significant legal, accounting and other expenses. In addition, the Sarbanes-Oxley Act of 2002 (the Sarbanes-Oxley Act), as well as rules subsequently implemented by the SEC and NASDAQ have imposed various requirements on public companies, including establishment and maintenance of effective disclosure and financial controls and changes in corporate governance practices. Our management and other personnel devote a substantial amount of time to these compliance initiatives. Moreover, these rules and regulations result in increased legal and financial compliance costs and will make some activities more time-consuming and costly. The Sarbanes-Oxley Act requires, among other things, that we maintain effective internal controls for financial reporting and disclosure. In particular, we are required to perform system and process evaluation and testing of our internal controls over financial reporting to allow management to report on the effectiveness of our internal controls over financial reporting, as required by Section 404 of the Sarbanes-Oxley Act. Our testing may reveal deficiencies in our internal controls over financial reporting that are deemed to be material weaknesses. We have incurred and continue to expect to incur significant expense and devote substantial management effort toward ensuring compliance with Section 404. Moreover, if we do not comply with the requirements of Section 404, or if we identify deficiencies in our internal controls that are deemed to be material weaknesses, the market price of our stock could decline and we could be subject to sanctions or investigations by NASDAQ, the SEC or other regulatory authorities, which would entail expenditure of additional financial and management resources. We face significant uncertainty in the industry due to government healthcare reform.reform. In the United States, there have been and continue to be a number of legislative initiatives to contain healthcare costs. The Patient Protection and Affordable Care Act, as amended, (the PatientAffordable Care Act) as well as otherany future healthcare reform legislation, may have a significant impact on our business. The impact of the PatientAffordable Care Act on the health care industry is extensive and includes, among other things, the federal government assuming a larger role in the health care system, expanding healthcare coverage of United States citizens and mandating basic healthcare benefits. The Affordable Care Act contains many provisions designed to generate the revenues necessary to fund the coverage expansions and to reduce costs of Medicare and Medicaid, including imposing a 2.3% excise tax on domestic sales of many medical devices by manufacturers that began in 2013. Although a moratorium was placed on the medical device excise tax in 2016 and 2017, if it is reinstated, it may adversely affect our sales and the cost of goods sold. In January 2017, Congress voted in favor of a budget resolution that will produce legislation that would repeal certain aspects of the Affordable Care Act if enacted into law. Congress is also considering subsequent legislation to replace or repeal elements or all of the Affordable Care Act. In addition, there have been recent public announcements by members of Congress and the new presidential administration regarding their plans to repeal and replace the Affordable Care Act. Further, President Trump signed an Executive Order directing federal agencies with authorities and responsibilities under the Affordable Care Act to waive, defer, grant exemptions from, or delay the implementation of any provision of the Affordable Care Act that would impose a fiscal or regulatory burden on states, individuals, healthcare providers, health insurers, or manufacturers of pharmaceuticals or medical devices. At this time, it is not clear whether the Affordable Care Act will be repealed in whole or in part, and, if it is repealed, whether it will be replaced in whole or in part by another plan. and what impact those changes will have on coverage and reimbursement for healthcare items and services covered by plans that were authorized by the Affordable Care Act. We expect that additional state and federal healthcare reform measures will be adopted in the future, any of which could limit the amounts that federal and state governments will pay for healthcare products and services, and also indirectly affect the amounts that private payers are willing to pay. In addition, any healthcare reforms enacted in the future may, like the PatientAffordable Care Act, be phased in over a number of years but, if enacted, could reduce our revenue, increase our costs, or require us to revise the ways in which we conduct business or put us at risk for loss of business. In addition, our results of operations, financial position and cash flows could be materially adversely affected by changes under the PatientAffordable Care Act and changes under any federal or state legislation adopted in the future. We may beare subject, directly or indirectly, to United States federal and state healthcare fraud and abuse and false claims laws and regulations. Prosecutions under such laws have increased in recent years and we may become subject to such litigation. If we are unable to, or have not fully complied with such laws, we could face substantial penalties. If weOur operations are successful in achieving regulatory approval to market our Maestro System, our operations will be directly, or indirectly through our customers, subject to various state and federal fraud and abuse laws, including, without limitation, the federal Anti-Kickback Statute and federal False Claims Act. These laws may impact, among other things, our proposed sales, marketing and education programs.
The federal Anti-Kickback Statute prohibits persons from knowingly and willfully soliciting, offering, receiving or providing remuneration, directly or indirectly, in exchange for or to induce either the referral of an individual, or the furnishing or arranging for a good or service, for which payment may be made under a federal healthcare program such as the Medicare and Medicaid programs. Several courts have interpreted the statute’s intent requirement to mean that if any one purpose of an arrangement involving remuneration is to induce referrals of federal healthcare covered business, the statute has been violated. The Anti-Kickback Statute is broad and, despite a series of narrow safe harbors, prohibits many arrangements and practices that are lawful in businesses outside of the healthcare industry. Penalties for violations of the federal Anti-Kickback Statute include criminal penalties and civil sanctions such as fines, imprisonment and possible exclusion from Medicare, Medicaid and other federal healthcare programs. Many states have also adopted laws similar to the federal Anti-Kickback Statute, some of which apply to the referral of patients for healthcare items or services reimbursed by any source, not only the Medicare and Medicaid programs. The federal False Claims Act prohibits persons from knowingly filing, or causing to be filed, a false claim to, or the knowing use of false statements to obtain payment from the federal government. Suits filed under the False Claims Act, known as “qui tam” actions, can be brought by any individual on behalf of the government and such individuals, commonly known as “whistleblowers,” may share in any amounts paid by the entity to the government in fines or settlement. The frequency of filing qui tam actions has increased significantly in recent years, causing greater numbers of medical device, pharmaceutical and healthcare companies to have to defend a False Claim Act action. When an entity is determined to have violated the federal False Claims Act, it may be required to pay up to three times the actual damages sustained by the government, plus civil penalties for each separate false claim. Various states have also enacted laws modeled after the federal False Claims Act. We are unable to predict whether we could be subject to actions under any of these laws, or the impact of such actions. If we are found to be in violation of any of the laws described above andor other applicable state and federal fraud and abuse laws, we may be subject to penalties, including civil and criminal penalties, damages, fines, exclusion from government healthcare reimbursement programs and the curtailment or restructuring of our operations.
We operate in a highly competitive industry that is subject to rapid change. If our competitors are able to develop and market products that are safer or more effective than our products, our commercial opportunities will be reduced or eliminated. The health care industry is highly competitive, subject to rapid change and significantly affected by new product introductions and other market activities of industry participants. The obesity treatment market in which we operate has grown significantly in recent years and is expected to continue to expand as technology continues to evolve and awareness of the need to treat the obesity epidemic grows. Although we are not aware of any competitors in the neuroblocking market, we face potential competition from pharmaceutical and surgical obesity treatments. Many of our competitors in the obesity treatment field have significantly greater financial resources and expertise in research and development, manufacturing, preclinical testing, clinical trials, obtaining regulatory approvals and marketing approved products than we do. Smaller or early-stage companies may also prove to be significant competitors, particularly if they pursue competing solutions through collaborative arrangements with large and established companies, such as Allergan, Apollo Endosurgery, Boston Scientific, Cyberonics,LivaNova PLC, Johnson & Johnson, Medtronic or St. Jude Medical. Our competitors may develop and patent processes or products earlier than us, obtain regulatory approvals for competing products more rapidly than we are able to and develop more effective, safer and less expensive products or technologies that would render our products non-competitive or obsolete. Failure to protect our information technology infrastructure against cyber-based attacks, network security breaches, service interruptions, or data corruption could significantly disrupt our operations and adversely affect our business and operating results. We currently rely on information technology and telephone networks and systems, including the Internet, to process and transmit sensitive electronic information and will rely on such systems to manage or support a variety of business processes and activities, including sales, billing, customer service, procurement and supply chain, manufacturing, and distribution. We use enterprise information technology systems to record, process, and summarize financial information and results of operations for internal reporting purposes and to comply with regulatory financial reporting, legal, and tax requirements. Our information technology systems, some of which are managed by third-parties, may be susceptible to damage, disruptions or shutdowns due to computer viruses, attacks by computer hackers, failures during the process of upgrading or replacing software, databases or components thereof, power outages, hardware failures, telecommunication failures, user errors or catastrophic events. We are not aware of any breaches of our information technology infrastructure. Despite the precautionary measures we have taken to prevent breakdowns in our information technology and telephone systems, if our systems suffer severe damage, disruption or shutdown and we are unable to effectively resolve the issues in a timely manner, our business and operating results may suffer. Risks Associated with Development and Commercialization of the vBloc System Our Maestro Rechargeableefforts to commercialize our vBloc System may not succeed or may encounter delays which could significantly harm our ability to generate revenue. Our ability to generate revenue will depend upon the successful commercialization of our vBloc System. Our efforts to commercialize this product may not succeed for a number of reasons, including: | · | | our vBloc System may not be accepted in the marketplace by physicians, patients and third-party payers; |
| · | | the price of our vBloc System, associated costs of the surgical procedure and treatment and the availability of sufficient third-party reimbursement for the system implantation and follow-up procedures; |
| · | | appropriate reimbursement and/or coding options may not exist to enable billing for the system implantation and follow-up procedures; |
| · | | we may not be able to sell our vBloc System at a price that allows us to meet the revenue targets necessary to generate enough revenue for profitability; |
| · | | the frequency and severity of any side effects of our vBloc Therapy; |
| · | | physicians and potential patients may not be aware of the perceived effectiveness and sustainability of the results of vBloc Therapy provided by our vBloc System; |
| · | | we, or the investigators of our product, may not be able to have information on the outcome of the trials published in medical journals; |
| · | | the availability and perceived advantages and disadvantages of alternative treatments; |
| · | | any rapid technological change may make our product obsolete; |
| · | | we may not be able to have our vBloc System manufactured in commercial quantities or at an acceptable cost; |
| · | | we may not have adequate financial or other resources to complete the development and commercialization of our vBloc System or to develop sales and marketing capabilities for our vBloc System; and |
| · | | we may be sued for infringement of intellectual property rights and could be enjoined from manufacturing or selling our products. |
Besides requiring physician adoption, market acceptance of our vBloc System will depend on successfully communicating the benefits of our vBloc Therapy to three additional constituencies involved in deciding whether to treat a particular patient using such therapy: (1) the potential patients themselves; (2) institutions such as hospitals, where the procedure would be performed and opinion leaders in these institutions; and (3) third-party payers, such as private healthcare insurers and governmental payers, such as Medicare and Medicaid in the United States, which would ultimately bear most of the costs of the various providers and equipment involved in our vBloc Therapy. Marketing to each of these constituencies requires a different marketing approach, and we must convince each of these groups of the efficacy and utility of our vBloc Therapy to be successful. If our vBloc Therapy, or any other neuroblocking therapy for other gastrointestinal diseases and disorders that we may develop, does not achieve an adequate level of acceptance by the relevant constituencies, we may not generate significant product revenue and may not become profitable. After we received FDA approval on January 14, 2015, we began the commercialization process for our vBloc System in the United States, and had our first commercial sales within the United States in 2015. Previously, in 2012, we commenced commercial sales of our vBloc System in Australia and the Middle East, but have not generated revenue from commercial sales outside of the United States since 2012 as we focused our resources on the U.S. regulatory approval process and commercialization of our product in the United States and we do not know when, or if, we will have the resources to commercialize our vBloc System internationally. If we are not successful in the commercialization of our vBloc System for the treatment of obesity we may not generate enough revenue to offset our expenses and may be forced to cease operations as a result. We have not received, and may never receive, approval from the FDA or the regulatory body inbodies of any foreign country other than the Australian TGA or the European CommunityEconomic Area to market our Maestro RechargeablevBloc System for the treatment of obesity. We do not have the necessary regulatory approvals to market our MaestrovBloc System in the United States or in any foreign market other than Australia for which the final components of the Maestro Rechargeable System were listed on the ARTG in January 2012, the European CommunityEconomic Area for which we received CE Mark approval for our Maestro RechargeablevBloc System in March 2011 for the treatment of obesity and other countries which accept these regulatory approvals. Additionally, the vBloc System was previously listed on the Australian Register of Therapeutic Goods (ARTG). The CE Mark approval for our vBloc System was expanded in 2014 to also include use for the management of Type 2 diabetes in obese patients. We commenced commercialization of our product in Australia and the Middle East in 2012, but have not generated revenue from commercial sales outside of the first halfUnited States since 2012 as we focused our resources on the U.S. regulatory approval process and commercialization of our product in the United States and we do not know when, or if, we will have the resources to commercialize our vBloc System internationally. In order to market our MaestrovBloc System outside of the United States, we will need to establish and comply with the numerous and varying regulatory requirements of other countries regarding safety and efficacy. Approval procedures vary among countries and can involve additional product testing and additional administrative review periods. The time required to obtain approval in other countries may differ from that required to obtain FDA approval. The regulatory approval process in other countries may also include all of the risks detailed below regarding FDA approval in the United States. below. Regulatory approval in one country does not ensure regulatory approval in another, but a failure or delay in obtaining regulatory approval in one country may negatively impact the regulatory process in others. While the Maestro RechargeablevBloc System has beenwas previously listed on the ARTG and has received European CE Marking, and we commenced commercial sales in Australia and the Middle East in 2012, we cannot assure you when, or if, we will be able to restart sales in Australia or the Middle East, commence sales in the European Economic Area or other countries outsidethat recognize the United StatesCE Mark or obtain approval to market our MaestrovBloc System in other countries outside the United States. We cannot market our product in the United States unless it has been approved by the FDA. The FDA approval process involves, among other things, successfully completing clinical trials and obtaining a premarket approval (PMA). The PMA process requires us to prove the safety and efficacy of our Maestro System to the FDA’s satisfaction. This process can be expensive and uncertain, requires detailed and comprehensive scientific and human clinical data, generally takes one to three years after a PMA application is filed, and notwithstanding the effort and expense incurred, may never result in the FDA granting a PMA approval. Because VBLOC therapyvBloc Therapy represents a novel way to effect weight loss in the treatment of obesity, and because there is a large population of obese patients who might be eligible for treatment, it is possible that the FDA and other regulatory bodies will review an application for approval of our MaestrovBloc System with greater scrutiny, which could cause that process to be lengthier and more involved than that for products without such characteristics. The FDASuch regulatory bodies can delay, limit or deny approval of a PMA applicationour vBloc System for many reasons, including:
including our inability to demonstrate safety or effectiveness to the FDA’s satisfaction; thetheir satisfaction, insufficient or inadequate data from our preclinical studies and clinical trials, may be insufficient to support approval;
the facilities of our third-party manufacturers or suppliers may not meet applicable requirements; our failure or inability to comply with preclinical, clinical or other regulations;
our inability to demonstrate through our ongoing clinical trials that the Maestro System causes EWL greater than the control therapy;
our inability to meet the FDA’s statistical requirements or changes in statistical tests or significance levels the FDA requires for approval of a medical device, including ours; and
changes in the FDAregulatory bodies’ approval policies, expectations with regard to the type or amount of scientific data required or adoption of new regulations may require additional data or additional clinical studies. In addition, recent, widely-publicized events concerningWe have limited data and experience regarding the safety and efficacy of certain drug, food and medical device productsthe vBloc System. Any long-term data that is generated may not be positive or consistent with our limited short-term data, which would affect market acceptance of these products.
Because our technology is relatively new in the treatment of obesity, we have raised concerns among membersperformed clinical trials only with limited patient populations. The long-term effects of Congress, medical professionals,using the vBloc System in a large number of patients have not been studied and the public regarding the FDA’s handlingresults of these events and its perceived lack of oversight over regulated products. The increased attention to safety and oversight issues has resulted in a more cautious approach by the FDA to clearances and approvals for devices such as ours. We submitted a PMA application for our Maestro Rechargeable System in June 2013 and it was accepted for review and filing in July 2013. The FDA has scheduled an Advisory Panel meeting for June 17, 2014 to review our PMA application for approvalshort-term clinical use of the Maestro System. We mayvBloc System do not obtainnecessarily predict long-term clinical benefits or reveal long-term adverse effects.
Clinical trials conducted with the necessary regulatory approvals to market our MaestrovBloc System have involved procedures performed by physicians who are very technically proficient. Consequently, both short and long-term results reported in the United States or additional geographies. Even if we obtain approval, the FDA or other regulatory authorities may require expensive or burdensome post-market testing or controls. Any delay in, failure to receive or maintain, or significant limitation on approval for our Maestro System could prevent us from generating revenue or achieving profitability and wethese studies may be forced to cease operations. The preliminarysignificantly more favorable than typical results achieved by physicians, which could negatively impact market acceptance of the blinded segment ofvBloc System and materially harm our EMPOWER trial and the blinded segment of our ReCharge trial have created uncertainty regarding our ability to obtain regulatory approval of our Maestro System in the United States and have complicated our future financing plans.business.
Our inability to achieve the efficacy endpoints in our EMPOWER trial and our ReCharge trial have delayed our timeline for pursuing regulatory approval in the United States, have caused us to need additional capital and have resulted in uncertainty and complication regarding our future financing plans and the regulatory approval of our Maestro System in the United States.
EMPOWER: In September 2009, we completed the blinded segment of our EMPOWER pivotal trial, a randomized, prospective, placebo-controlled multi-center trial of our Maestro System in the United States. Based on our initial analysis, the EMPOWER trial did not meet its primary and secondary
| efficacy endpoints in that the weight loss for the treatment arm was not statistically different from the control arm in which therapy was turned off. The study did meet its safety endpoint. The preliminary results of the EMPOWER trial were not sufficient to support approval of a PMA application. The inability to achieve our primary and secondary efficacy endpoints in the EMPOWER trial delayed our timeline for achieving regulatory approval of the Maestro System in the United States and caused us to need additional capital to fund a new pivotal trial.
|
ReCharge: In October 2010, we received an unconditional IDE Supplement approval from the FDA to conduct a randomized, double-blind, sham-controlled, multicenter pivotal clinical trial, called the ReCharge trial, testing the effectiveness and safety of VBLOC therapy utilizing our second generation Maestro Rechargeable System. Enrollment and implantation in the ReCharge trial was completed in December 2011 in 239 randomized patients (233 implanted) at 10 centers. All patients in the trial received an implanted device and were randomized in a 2:1 allocation to treatment or control groups. The control group received a non-functional device during the trial period. All patients were expected to participate in a standard weight management counseling program. The primary endpoints of efficacy and safety were evaluated at 12 months. In February 2013, we announced the preliminary results of the ReCharge trial. Based on our initial analysis, the ReCharge trial did not meet its co-primary efficacy endpoints in that the pre-specified super-superiority margin for the difference in weight loss between the treatment arm and the control arm was not met and the pre-specified percent excess weight loss thresholds were not met. The ReCharge trial did meet its safety endpoint. A premarket approval (PMA) application for the Maestro Rechargeable System, was submitted to the FDA in June 2013 and was accepted for review and filing in July 2013. The FDA has scheduled an Advisory Panel meeting for June 17, 2014 to review our PMA application for approval of the Maestro System. The inability to achieve our co-primary efficacy endpoints in our ReCharge trial has created uncertainty regarding our ability to achieve regulatory approval of our Maestro Rechargeable System in the United States, has caused us to need additional capital to fund the regulatory process, and has created complications and uncertainty regarding our future financing options.
We may be unable to complete our current clinical trials or any additional clinical trials, or we may experience significant delays in completing ourthose clinical trials, which could prevent or delay regulatory approvalimpact market acceptance of our MaestrovBloc System and impair our financial position. We continue to evaluate the vBloc Therapy in human clinical trials, including the EMPOWER trial and ReCharge trial. Conducting a clinical trial, which involves screening, assessing, testing, treating and monitoring patients at several sites across the country and possibly internationally, and coordinating with patients and clinical institutions, is a complex and uncertain process. The completion of our ongoing and future clinical trials, could be delayed, suspended or terminated for several reasons, including: | · | | ongoing discussions with regulatory authorities regarding the scope or design of our preclinical results or clinical trial or requests for supplemental information with respect to our preclinical results or clinical trial results; |
| · | | our failure or inability to conduct the clinical trials in accordance with regulatory requirements; |
our failure or inability to conduct the clinical trials in accordance with regulatory requirements;
| · | | sites currently participating in the trial may drop out of the trial, which may require us to engage new sites or petition the FDA for an expansion of the number of sites that are permitted to be involved in the trial; |
sites currently participating in the trial may drop out of the trial, which may require us to engage new sites or petition the FDA for an expansion of the number of sites that are permitted to be involved in the trial;
| · | | patients may not remain in or complete, clinical trials at the rates we expect; |
patients may not remain in or complete, clinical trials at the rates we expect;
| · | | patients may experience serious adverse events or side effects during the trial, which, whether or not related to our product, could cause the FDA or other regulatory authorities to place the clinical trial on hold; |
patients may experience serious adverse events or side effects during the trial, which, whether or not related to our product, could cause the FDA or other regulatory authorities to place the clinical trial on hold;
| · | | clinical investigators may not perform our clinical trials on our anticipated schedule or consistent with the clinical trial protocol and good clinical practices; and |
we may be unable to obtain a sufficient supply of our Maestro
| · | | we may be unable to obtain a sufficient supply of our vBloc System necessary for the timely conduct of the clinical trials. |
Although we believe that we have adequate personnel and procedures in place to manage the clinical trial process, the complexity of managing this process while also commercializing our Maestro RechargeablevBloc System outside the United States and fulfilling our disclosure and other obligations to our stockholders, lenders, regulators and other constituents could result in our inadvertently taking actions outside the clinical trial process, which could adversely impact the trial. As is always the case, if the FDA ultimately determined that such actions materially violated the protocol for the trial, the FDA could suspend, terminate or reject the results of the clinical trial and require us to repeat the process. If our clinical trials are delayed, it will take us longer to ultimately commercialize a product and generate revenue in the United States or the delay could result in our being unable to do so. Moreover, our development costs will increase if we have material delays in our clinical trials or if we need to perform more or larger clinical trials than planned. Even if we obtain the necessary regulatory approvals, our efforts to commercialize our Maestro System may not succeed or may encounter delays which could significantly harm our ability to generate revenue.
Even if we obtain additional regulatory approval to market our Maestro Rechargeable System, as we recently have in Australia, the European Economic Area and other countries that recognize the European CE Mark, our ability to generate revenue will depend upon the successful commercialization of this product. Our efforts to commercialize our Maestro Rechargeable System may not succeed for a number of reasons, including:
our Maestro System may not be accepted in the marketplace by physicians, patients and third-party payors;
the price of our Maestro System, associated costs of the surgical procedure and treatment and the availability of sufficient third-party reimbursement for the procedure and therapy implantation and follow-up procedures;
appropriate reimbursement and/or coding options may not exist to enable billing for the system implantation and follow-up procedures;
we may not be able to sell our Maestro System at a price that allows us to meet the revenue targets necessary to generate revenue for profitability;
the frequency and severity of any side effects of our VBLOC therapy;
physicians and potential patients may not be aware of the perceived effectiveness and sustainability of the results of VBLOC therapy provided by our Maestro System;
we, or the investigators of our product, may not be able to have information on the outcome of the trials published in medical journals;
the availability and perceived advantages and disadvantages of alternative treatments;
any rapid technological change may make our product obsolete;
we may not be able to have our Maestro System manufactured in commercial quantities or at an acceptable cost;
we may not have adequate financial or other resources to complete the development and commercialization of our Maestro System or to develop sales and marketing capabilities for our Maestro System; and
we may be sued for infringement of intellectual property rights and could be enjoined from manufacturing or selling our products.
Besides requiring physician adoption, market acceptance of our Maestro System will depend on successfully communicating the benefits of our VBLOC therapy to three additional constituencies involved in deciding whether to treat a particular patient using such therapy: (1) the potential patients themselves; (2) institutions such as hospitals, where the procedure would be performed and opinion leaders in these institutions; and (3) third-party payors, such as private healthcare insurers and governmental payors, such as Medicare and Medicaid in the United States, and Medical Services Advisory Committee (MSAC) in Australia, which would ultimately bear most of the costs of the various providers and equipment involved in our VBLOC therapy. Marketing to each of these constituencies requires a different marketing approach, and we must convince each of these groups of the efficacy and utility of our VBLOC therapy to be successful.
If our VBLOC therapy, or any other neuroblocking therapy for other gastrointestinal diseases and disorders that we may develop, does not achieve an adequate level of acceptance by the relevant constituencies, we may not generate significant product revenue and may not become profitable. We commenced commercial sales of our Maestro Rechargeable System in Australia and the Middle East in the first half of 2012, but did not recognize any revenue in 2013 as we focused our resources on the U.S. regulatory approval process. The earliest we expect to be able to commercialize our Maestro Rechargeable System in the United States is late 2014, if at all. If we are not successful in the commercialization of our Maestro Rechargeable System for the treatment of obesity we may never generate any revenue and may be forced to cease operations.
We depend on clinical investigators and clinical sites to enroll patients in our clinical trials, and on other third parties to manage the trials and to perform related data collection and analysis, and, as a result, we may face costs and delays that are outside of our control. We rely on clinical investigators and clinical sites to enroll patients in our clinical trials and other third parties to manage the trials and to perform related data collection and analysis. However, we may not be able to control the amount and timing of resources that clinical sites may devote to our clinical trials. If these clinical investigators and clinical sites fail to enroll a sufficient number of patients in our clinical trials, to ensure compliance by patients with clinical protocols or comply with regulatory requirements, we will be unable to complete these trials, which could prevent us from obtaining or maintaining regulatory approvals for our product. Our agreements with clinical investigators and clinical trial sites for clinical testing place substantial responsibilities on these parties and, if these parties fail to perform as expected, our trials could be delayed or terminated. If these clinical investigators, clinical sites or other third parties do not carry out their contractual duties or obligations or fail to meet expected deadlines, or if the quality or accuracy of the clinical data they obtain is compromised due to their failure to adhere to our clinical protocols, regulatory requirements or for other reasons, our clinical trials may be extended, delayed or terminated, or the clinical data may be rejected by the FDA, and we may be unableadversely affecting our ability to obtain regulatory approval for, or successfully commercialize our product. Assuming we receive regulatory approval for the Maestro System, modificationsModifications to the MaestrovBloc System may require additional approval from regulatory authorities, which may not be obtained or may delay our commercialization efforts.
The FDA TGA and European Notified Body require medical device companies to initially make and document a determination of whether or not a modification requires a new approval, supplement or clearance; however, some of these regulatory authorities can review a company’s decision. Any modifications to an approved device that could significantly affect its safety or efficacy, or that would constitute a major change in its intended use could require additional clinical studies and separate regulatory applications. Product changes or revisions will require all the regulatory steps and associated risks discussed above possibly including testing, regulatory filings and clinical study. We may not be able to obtain approval of supplemental regulatory approvals for product modifications, new indications for our product or new products. Delays in obtaining future clearances would adversely affect our ability to introduce new or enhanced products in a timely manner, which in turn would harm our commercialization efforts and future growth. Our neuroblocking therapy for the treatment of obesity is a unique form of treatment. Physicians may not widely adopt our MaestrovBloc System and VBLOC therapyvBloc Therapy unless they determine, based on experience, long-term clinical data and published peer reviewed journal articles, that VBLOC therapyvBloc Therapy provides a safe and effective alternative to other existing treatments for obesity. We believe we are the first and only company currently pursuing neuroblocking therapy for the treatment of obesity. Physicians tend to be slow to change their medical treatment practices because of the time and skill required to learn a new procedure, the perceived liability risks arising from the use of new products and procedures, and the uncertainty of third-party coverage and reimbursement. Physicians may not widely adopt our MaestrovBloc System and VBLOC therapyvBloc Therapy unless they determine, based on experience, long-term clinical data and published peer reviewed journal articles, that the use of our VBLOC therapyvBloc Therapy provides a safe and effective alternative to other existing treatments for obesity, including pharmaceutical solutions and bariatric surgical procedures. We cannot provide any assurance that the data collected from our current and planned clinical trials will be sufficient to demonstrate that our VBLOC therapyvBloc Therapy is an attractive alternative to other obesity treatment procedures. We rely on experienced and highly trained surgeons to perform the procedures in our clinical trials and both short-and long-term results reported in our clinical trials may be significantly more favorable than typical results of practicing physicians, which could negatively impact rates of adoption of our MaestrovBloc System and VBLOC therapy.vBloc Therapy. We believe that published peer-reviewed journal articles and recommendations and support by influential physicians regarding our MaestrovBloc System and VBLOC therapyvBloc Therapy will be important for market acceptance and adoption, and we cannot assure you that we will receive these recommendations and support, or that supportive articles will be published. If we fail to obtain adequate coding, coverage or payment levels for our product by governmental healthcare programs and other third-party payors,payers, there may be no commercially viable markets for our MaestrovBloc System or other products we may develop or our target markets may be much smaller than expected. Healthcare providers generally rely on third-party payors,payers, including governmental payors,payers, such as Medicare and Medicaid in the United States, and MSAC in Australia, as well as private healthcare insurers, to adequately cover and reimburse the cost of medical devices. Importantly, third-party payorspayers are increasingly challenging the price of medical products and services and instituting cost containment measures to control or significantly influence the purchase of medical products and services. We expect that third-party payorspayers will continue to attempt to contain or reduce the costs of healthcare by challenging the prices charged for healthcare products and services. If reimbursement for our MaestrovBloc System and the related surgery and facility costs is unavailable or limited in scope or amount, or if pricing is set at unsatisfactory levels, market acceptance of our MaestrovBloc System will be impaired and our future revenue, if any, would be adversely affected. As such, even ifthough we obtain regulatory clearance orhave obtained FDA approval for our MaestrovBloc System and beginbegan to market it in 2015, the availability and level of third-party coverage and reimbursement could substantially affect our ability to successfully commercialize our MaestrovBloc System and other products we may develop. The efficacy, safety, ease of use and cost-effectiveness of our MaestrovBloc System and of any competing products will, in part, determine the availability and level of coverage and payment. In particular, we expect that securing coding, coverage and payment for our MaestrovBloc System will be more difficult if our clinical trialshealthcare providers and obese individuals do not demonstrate aconsider the percentage of EWL from a pre-implementation baseline that healthcare providers and obese individuals considerour clinical trials have demonstrated to be clinically meaningful, whether or not regulatory agencies consider the improvement of patients treated in clinical trials to have been clinically meaningful. In some international markets, pricing of medical devices is subject to government control. In the United States and international markets, we expect that both government and third-party payorspayers will continue to attempt to contain or reduce the costs of healthcare by challenging the prices charged for healthcare products and services. If payment for our MaestrovBloc System and the related surgery and facility costs is unavailable or limited in scope or amount, or if pricing is set at unsatisfactory levels, market acceptance of our MaestrovBloc System will be impaired and our future revenue, if any, would be adversely affected. We cannot predict the likelihood or pace of any significant regulatory or legislative action in any of these areas, nor can we predict whether or in what form healthcare legislation being formulated by various governments will be passed. We also cannot predict with precision what effect such governmental measures would have if they were ultimately enacted into law. However, in general, we believe that such legislative activity will likely continue. If adopted, such measures can be expected to have an impact on our business. Even if our Maestro System is approved by regulatory authorities, ifIf we or our suppliers fail to comply with ongoing regulatory requirements, or if we experience unanticipated product problems, our MaestrovBloc System could be subject to restrictions or withdrawal from the market.
Completion of our clinical trials and commercialization of our MaestrovBloc System will require access to manufacturing facilities that meet applicable regulatory standards to manufacture a sufficient supply of our product. We rely solely on third parties to manufacture and assemble our MaestrovBloc System, and do not currently plan to manufacture or assemble our MaestrovBloc System ourselves in the future. Any product for which we obtain marketing approval, along with the manufacturing processes, post-approval clinical data and promotional activities for such product, will be subject to continual review and periodic inspections by our European Notified Body and the FDA and other regulatory bodies. In particular we and our manufacturers and suppliers are required to comply with ISO requirements, Good Manufacturing Practices, which for medical devices is called the Quality System Regulation (QSR), and other regulations which cover the methods and documentation of the design, testing, production, control, quality assurance, labeling, packaging, storage and shipping of any product for which we obtain marketing approval. The FDA enforces the QSR through inspections, which may be unannounced, and the CE system enforces its certification through inspections and audits as well. We and our third-party manufacturers and suppliers are subject to inspection by the FDA during the PMA application review process and will have to successfully complete such inspections before we receive regulatory approvals for our Maestro System in the United States. Our quality system has received certification of compliance to the requirements of ISO 13485:2003 and will have to continue to successfully complete such inspections to maintain regulatory approvals for sales outside of the United States. Failure by us or one of our manufacturers or suppliers to comply with statutes and regulations administered by the FDA, CE authorities and other regulatory bodies, or failure to adequately respond to any observations, could result in enforcement actions against us or our manufacturers or suppliers, including, restrictions on our product or manufacturing processes, withdrawal of the product from the market, voluntary or mandatory recall, fines, suspension of regulatory approvals, product seizures, injunctions or the imposition of civil or criminal penalties. If any of these actions were to occur it would harm our reputation and cause our product sales to suffer. Furthermore, our key component suppliers may not currently be or may not continue to be in compliance with applicable regulatory requirements. If the FDA or any other regulatory body finds their compliance status to be unsatisfactory, our commercialization efforts could be delayed, which would harm our business and our results of operations. EvenAdditionally, if regulatory approval of a product is granted, the approval may be subject to limitations on the indicated uses for which the product may be marketed. If the FDA determines that our promotional materials, training or other activities constitute promotion of an unapproved use, we could be subject to significant liability, the FDA could request that we cease, correct or modify our training or promotional materials or subject us to regulatory enforcement actions. It is also possible that other federal, state or foreign enforcement authorities might take action if they consider our training or other promotional materials to constitute promotion of an unapproved use, which could result in significant fines or penalties under other statutory authorities, such as laws prohibiting false claims for reimbursement.
We will beare subject to medical device reporting regulations that require us to report to the FDA, TGA, Competent Authorities or other governmental authorities in other countries if our products cause or contribute to a death or serious injury or malfunction in a way that would be reasonably likely to contribute to death or serious injury if the malfunction were to recur. The FDA TGA and similar governmental authorities in other countries have the authority to require the recall of our products in the event of material deficiencies or defects in design or manufacturing. A government mandated, or voluntary, recall by us could occur as a result of component failures, manufacturing errors or design defects, including defects in labeling. Any recall would divert managerial and financial resources and could harm our reputation with customers. There can be no assurance that there will not be product recalls in the future or that such recalls would not have a material adverse effect on our business. Once the product is approved and implanted in a large number of patients, infrequently occurring adverse events may appear that were not observed in the clinical trials. This could cause health authorities in countries where the product is available to take regulatory action, including marketing suspension and recall. We may not be successful in our efforts to utilize our VBLOC therapyvBloc Therapy to treat comorbidities associated with obesity and other gastrointestinal diseases and disorders.disorders. As part of our long-term business strategy, we plan to research the application of our VBLOC therapyvBloc Therapy to treat comorbidities associated with obesity and other gastrointestinal diseases and disorders. Research to identify new target applications requires substantial technical, financial and human resources, whether or not any new applications for our VBLOC therapyvBloc Therapy are ultimately identified. We may be unable to identify or pursue other applications of our technology. Even if we identify potential new applications for our VBLOC therapy,vBloc Therapy, investigating the safety and efficacy of our therapy requires extensive clinical testing, which is expensive and time-consuming. If we terminate a clinical trial in which we have invested significant resources, our prospects will suffer, as we will have expended resources on a program that will not provide a return on our investment and missed the opportunity to allocate those resources to potentially more productive uses. We will also need to obtain regulatory approval for these new applications, as well as achieve market acceptance and an acceptable level of reimbursement. We depend on a limited number of manufacturers and suppliers of various critical components for our MaestrovBloc System. The loss of any of these manufacturer or supplier relationships could delay our clinical trials or prevent or delay commercialization of our MaestrovBloc System. We rely entirely on third parties to manufacture our MaestrovBloc System and to supply us with all of the critical components of our MaestrovBloc System, including our leads, implantable batteries, neuroregulators, transmit coils and controllers. If any of our existing suppliers were unable or unwilling to meet our demand for product components, or if the components or finished products that they supply do not meet quality and other specifications, completion of our clinical trials or commercialization of our product could be delayed. Alternatively, if we have to switch to a replacement manufacturer or replacement supplier for any of our product components, we may face additional regulatory delays, and the manufacture and delivery of our MaestrovBloc System could be interrupted for an extended period of time, which could delay completion of our clinical trials or commercialization of our MaestrovBloc System. In addition, we may be required to use different suppliers or components to obtain regulatory approval from the FDA. If our device manufacturers or our suppliers are unable to provide an adequate supply of our product, following the commencement of commercialization, our growth could be limited and our business could be harmed. In order to produce our MaestrovBloc System in the quantities that we anticipate will be required to meet anticipated market demand, we will need our manufacturers to increase, or scale-up, the production process by a significant factor over our current level of production. There are technical challenges to scaling-up manufacturing capacity and developing commercial-scale manufacturing facilities that may require the investment of substantial additional funds by our manufacturers and hiring and retaining additional management and technical personnel who have the necessary manufacturing experience. If our manufacturers are unable to do so, we may not be able to meet the requirements for the initial commercial launch of the product or to meet future demand, if any. We may also represent only a small portion of our supplier’s or manufacturer’s business and if they become capacity constrained they may choose to allocate their available resources to other customers that represent a larger portion of their business. We currently anticipate that we will continue to rely on third-party manufacturers and suppliers for the production of the MaestrovBloc System. If we develop and obtain regulatory approval for our product and are unable to obtain a sufficient supply of our product, our revenue, business and financial prospects would be adversely affected. If we are unable to establish sales and marketing capabilities or enter into and maintain arrangements with third parties to market and sell our MaestrovBloc System, our business may be harmed. We have nolimited experience as a company in sales, marketing and distribution of our product and are just beginningbegan the process of developing a sales and marketing organization.organization in 2015 and have continued its development in 2016 and 2017. We market our products in the United States through a direct sales force supported by field technical managers who provide training, technical and other support services to our customers. We have entered into an agreement with Device Technologies, a third-party distributor in Australia, to commence the commercial sale of our product in Australia and we have entered into an agreement with Bader Sultan & Brothers, a third-party distributor in Kuwait, to commence the commercial sale of our product in the Middle East. To generate sales in Australia and launch the commercialization of our product in other geographic regions we may need to identify and enter into other third-party distributor agreements. There is no assurance that we can do so on economically acceptable terms or that if we do so, that third party will be successful in selling our product. We will also needbegun to develop athe necessary sales and marketing infrastructure or contract with third partiesin order to perform that function before launching the commercialization ofcommercialize our product, in markets outside of Australia and the Middle East. Developingbut developing a sales force is expensive and time consuming and could delay or limit the success of any product launch. Even if we obtain approval from the FDA to market our Maestro System, we may be unable to develop an effective sales and marketing organization on a timely basis, if at all. If we developall, or maintain our owncurrent sales and marketing capabilities, oureither of which would delay or prevent us from generating enough revenue to become profitable. Our sales force will be competing with the experienced and well-funded marketing and sales organizations of our more established competitors. If we are unable to establish and maintain our own sales and marketing capabilities, we will need to contract with third parties to market and sell our product. In this event, our profit margins would likely be lower than if we performed these functions ourselves. In addition, we would necessarily be relying on the skills and efforts of others for the successful marketing of our product. If we are unable to establish and maintain effective sales and marketing capabilities, independently or with others, we may not be able to generate product revenue and may not become profitable. When we have sufficient resources to commercialize our vBloc System internationally, we intend to use direct, dealer and distributor sales models as the targeted geography best dictates. We have entered into an agreement with Device Technologies, a third-party distributor in Australia, to sell our product in Australia and we have entered into an agreement with Bader Sultan & Brothers, a third-party distributor in Kuwait, to sell our product in the Middle East. To generate sales and launch the commercialization of our product in other geographic regions we may need to identify and enter into other third-party distributor agreements. There is no assurance that we can do so on economically acceptable terms or that if we do so, that a third-party distributor will be successful in selling our product. The commercialization of our product in countries outside of the United States will expose our business to certain risks associated with international operations. WeWhen we have commenced commercialization ofsufficient resources to do so, we intend to commercialize our product internationally, in the European Economic Area, Australia and the Middle East and intend to commercialize our product in other international markets in which we obtain necessary regulatory approvals. Conducting international operations will subject us to unique risks, including:
| · | | unfamiliar legal requirements with which we would need to comply; |
| · | | fluctuations in currency exchange rates; |
| · | | potentially adverse tax consequences, including the complexities of foreign value added tax systems and restrictions on the repatriation of earnings; |
| · | | increased financial accounting and reporting burdens and complexities; and |
| · | | reduced or varied protection for intellectual property rights in some countries. |
The occurrence of any one of these risks could negatively affect our business and results of operations generally. Additionally, operating in international markets requires significant management attention. We cannot be certain that investments required to establish operations in other countries will produce desired levels of revenues or profitability. We may be unable to attract and retain management and other personnel we need to succeed. Our success depends on the services of our senior management and other key research and development employees. The loss of the services of one or more of our officers or key employees could delay or prevent the successful completion of our clinical trials and the commercialization of our MaestrovBloc System. Upon receiving regulatory approval for our product in the United States, we expect to expandWe have begun a controlled expansion of our operations and grow our research and development, product development and administrative operations.hired three new executives in January 2016 to oversee this expansion. Our continued growth will require hiring a number of qualified clinical, scientific, commercial and administrative personnel. Accordingly, recruiting and retaining such personnel in the future will be critical to our success. There is intense competition from other companies and research and academic institutions for qualified personnel in the areas of our activities. If we fail to identify, attract, retain and motivate these highly skilled personnel, we may be unable to continue our development and commercialization activities. We may be unable to manage our growth effectively. Our business strategy entails significant future growth. For example, we will have to expand existing operations in order to conduct additional clinical trials, increase our contract manufacturing capabilities, hire and train new personnel to handle the marketing and sales of our product, assist patients and healthcare providers in obtaining reimbursement for the use of our product and create and develop new applications for our technology. This growth may place significant strain on our management and financial and operational resources. Successful growth is also dependent upon our ability to implement appropriate financial and management controls, systems and procedures. Our ability to effectively manage growth depends on our success in attracting and retaining highly qualified personnel, for which the competition may be intense. If we fail to manage these challenges effectively, our business could be harmed.
We face the risk of product liability claims that could be expensive, divert management’s attention and harm our reputation and business. We may not be able to obtain adequate product liability insurance. Our business exposes us to a risk of product liability claims that is inherent in the testing, manufacturing and marketing of medical devices. The medical device industry has historically been subject to extensive litigation over product liability claims. We may be subject to product liability claims if our MaestrovBloc System, or any other products we may sell, causes, or appears to have caused, an injury. Claims may be made by consumers, healthcare providers, third-party strategic collaborators or others selling our products. We have product liability insurance, which covers the use of our MaestrovBloc System and VBLOC therapyvBloc Therapy in our clinical trials and any commercial sales, in an amount we believe is appropriate. Our current product liability insurance may not continue to be available to us on acceptable terms, if at all, and, if available, the coverage may not be adequate to protect us against any future product liability claims. If we are unable to obtain insurance at an acceptable cost and on acceptable terms for an adequate coverage amount, or otherwise to protect against potential product liability claims, we could be exposed to significant liabilities, which may harm our business. A product liability claim, recall or other claim with respect to uninsured liabilities or for amounts in excess of insured liabilities could have a material adverse effect on our business, financial condition and results of operations. These liabilities could prevent or interfere with our product commercialization efforts. Defending a suit, regardless of merit, could be costly, could divert management attention and might result in adverse publicity, which could result in the withdrawal of, or inability to recruit, clinical trial volunteers or result in reduced acceptance of our MaestrovBloc System and VBLOC therapyvBloc Therapy in the market. We may be subject to product liability claims even if it appears that the claimed injury is due to the actions of others. For example, we rely on the expertise of surgeons and other associated medical personnel to perform the medical procedure to implant and remove our MaestrovBloc System and to perform the related VBLOC therapy.vBloc Therapy. If these medical personnel are not properly trained or are negligent, the therapeutic effect of our Maestro System and VBLOC therapyvBloc Therapy may be diminished or the patient may suffer critical injury, which may subject us to liability. In addition, an injury that is caused by the negligence of one of our suppliers in supplying us with a defective component that injures a patient could be the basis for a claim against us. A product liability claim, regardless of its merit or eventual outcome, could result in decreased demand for our products; injury to our reputation; diversion of management’s attention; withdrawal of clinical trial participants; significant costs of related litigation; substantial monetary awards to patients; product recalls or market withdrawals; loss of revenue; and the inability to commercialize our products under development. Risks Related to Intellectual Property If we are unable to obtain or maintain intellectual property rights relating to our technology and neuroblocking therapy, the commercial value of our technology and any future products will be adversely affected and our competitive position will be harmed. Our commercial success depends in part on our ability to obtain protection in the United States and other countries for our MaestrovBloc System and VBLOC therapyvBloc Therapy by establishing and maintaining intellectual property rights relating to or incorporated into our technology and products. To date, weWe own numerous U.S. and foreign patents and have 33 issued U.S. patents, 27numerous patent applications pending, most of which pertain to treating gastrointestinal disorders, and 13 U.S. patent applications.disorders. We have four granted Europeanalso received or applied for patents and seven granted Australian patents. We also have 30 national stage patent applications, including applications in Europe, Australia, China, India Europe and Japan, one granted Chinese application and one granted application in Japan. In addition, we are the exclusive licensee to twoof three U.S. patents owned by the Mayo Foundation for Medical Education and Research, which are unrelated to our VBLOC therapy.vBloc Therapy. Our pending and future patent applications may not issue as patents or, if issued, may not issue in a form that will provide us any competitive advantage. We expect to incur substantial costs in obtaining patents and, if necessary, defending our proprietary rights. The patent positions of medical device companies, including ours, can be highly uncertain and involve complex and evolving legal and factual questions. We do not know whether we will obtain the patent protection we seek, or that the protection we do obtain will be found valid and enforceable if challenged. If we fail to obtain adequate protection of our intellectual property, or if any protection we obtain is reduced or eliminated, others could use our intellectual property without compensating us, resulting in harm to our business. We may also determine that it is in our best interests to voluntarily challenge a third party’sthird-party’s products or patents in litigation or administrative proceedings, including patent interferences, re-examinations or re-examinations.under more recently promulgated Inter Partes Review proceedings, depending on when the patent application was filed. In the event that we seek to enforce any of our owned or exclusively licensed patents against an infringing party, it is likely that the party defending the claim will seek to invalidate the patents we assert, which, if successful could result in the loss of the entire patent or the relevant portion of our patent, which would not be limited to any particular party. Any litigation to enforce or defend our patent rights, even if we were to prevail, could be costly and time-consuming and could divert the attention of our management and key personnel from our business operations. Even if we were to prevail in any litigation, we cannot assure you that we can obtain an injunction that prevents our competitors from practicing our patented technology. Our competitors may independently develop similar or alternative technologies or products without infringing any of our patent or other intellectual property rights, or may design around our proprietary technologies. We cannot assure you that we will obtain any patent protection that we seek, that any protection we do obtain will be found valid and enforceable if challenged or that it will confer any significant commercial advantage. U.S. patents and patent applications may also be subject to interference proceedings and U.S. patents may be subject to re-examination proceedings in the U.S. Patent and Trademark Office (USPTO), or under more recently promulgated Inter Partes Review proceedings, depending on when the patent application was filed, and foreign patents may be subject to opposition or comparable proceedings in the corresponding foreign patent offices, which proceedings could result in either loss of the patent or denial of the patent application, or loss or reduction in the scope of one or more of the claims of, the patent or patent application. In addition, such interference, re-examination and opposition proceedings may be costly. Moreover, the U.S. patent laws may change,have recently changed with the adoption of the America Invents Act (AIA), possibly making it easier to challenge patents. Some of our technology was, and continues to be, developed in conjunction with third parties, and thus there is a risk that such third parties may claim rights in our intellectual property. Thus, any patents that we own or license from others may provide limited or no protection against competitors. Our pending patent applications, those we may file in the future, or those we may license from third parties, may not result in patents being issued. If issued, they may not provide us with proprietary protection or competitive advantages against competitors with similar technology. Non-payment or delay in payment of patent fees or annuities, whether intentional or unintentional, may result in loss of patents or patent rights important to our business. Many countries, including certain countries in Europe, have compulsory licensing laws under which a patent owner may be compelled to grant licenses to third parties. In addition, many countries limit the enforceability of patents against third parties, including government agencies or government contractors. In these countries, the patent owner may have limited remedies, which could materially diminish the value of the patent. In addition, the laws of some foreign countries do not protect intellectual property rights to the same extent as do the laws of the United States, particularly in the field of medical products and procedures. Many of our competitors have significant resources and incentives to apply for and obtain intellectual property rights that could limit or prevent our ability to commercialize our current or future products in the United States or abroad. Many of our competitors who have significant resources and have made substantial investments in competing technologies may seek to apply for and obtain patents that will prevent, limit or interfere with our ability to make, use or sell our products either in the United States or in international markets. Our current or future U.S. or foreign patents may be challenged, circumvented by competitors or others or may be found to be invalid, unenforceable or insufficient. Since patent applications are confidential until patents are issuedIn most cases in the United States or in most cases, until afterpatent applications are published 18 months fromafter filing of the application, or corresponding applications are published in other countries, and since publication of discoveries in the scientific or patent literature often lags behind actual discoveries, we cannot be certain that we were the first to make the inventions covered by each of our pending patent applications, or that we were the first to file patent applications for such inventions. If we are unable to protect the confidentiality of our proprietary information and know-how, the value of our technology and products could be adversely affected. In addition to patented technology, we rely on our unpatented proprietary technology, trade secrets, processes and know-how. We generally seek to protect this information by confidentiality agreements with our employees, consultants, scientific advisors and third parties. These agreements may be breached, and we may not have adequate remedies for any such breach. In addition, our trade secrets may otherwise become known or be independently developed by competitors. To the extent that our employees, consultants or contractors use intellectual property owned by others in their work for us, disputes may arise as to the rights in related or resulting know-how and inventions.
Intellectual property litigation is a common tactic in the medical device industry to gain competitive advantage. If we become subject to a lawsuit, we may be required to expend significant financial and other resources and our management’s attention may be diverted from our business. There has been a history of frequent and extensive litigation regarding patent and other intellectual property rights in the medical device industry, and companies in the medical device industry have employed intellectual property litigation to gain a competitive advantage. Accordingly, we may become subject to patent infringement claims or litigation in a court of law, or interference proceedings declared by the USPTO to determine the priority of inventions or an opposition to a patent grant in a foreign jurisdiction. We may also become subject to claims or litigation seeking payment of royalties based on sales of our product in connection with licensing or similar joint development arrangements with third parties or in connection with claims of patent infringement. The defense and prosecution of intellectual property suits, USPTO interference proceedings, reexamination proceedings, or under more recently promulgated Inter Partes Review proceedings, depending on when the patent application was filed, or opposition proceedings and related legal and administrative proceedings, are both costly and time consuming and could result in substantial uncertainty to us. Litigation or regulatory proceedings may also be necessary to enforce patent or other intellectual property rights of ours or to determine the scope and validity of other parties’ proprietary rights. Any litigation, opposition or interference proceedings, with or without merit, may result in substantial expense to us, cause significant strain on our financial resources, divert the attention of our technical and management personnel and harm our reputation. We may not have the financial resources to defend our patents from infringement or claims of invalidity. An adverse determination in any litigation could subject us to significant liabilities to third parties, require us to seek licenses from or pay royalties to third parties or prevent us from manufacturing, selling or using our proposed products, any of which could have a material adverse effect on our business and prospects. We are not currently a party to any patent or other litigation. Our VBLOC therapyvBloc Therapy or MaestrovBloc System may infringe or be claimed to infringe patents that we do not own or license, including patents that may issue in the future based on patent applications of which we are currently aware, as well as applications of which we are unaware. For example, we are aware of other companies that are investigating neurostimulation, including neuroblocking, and of patents and published patent applications held by companies in those fields. While we believe that none of such patents and patent applications are applicable to our products and technologies under development, third parties who own or control these patents and patent applications in the United States and abroad could bring claims against us that would cause us to incur substantial expenses and, if such claims are successfully asserted against us, they could cause us to pay substantial damages, could result in an injunction preventing us from selling, manufacturing or using our proposed products and would divert management’s attention. Because patent applications in many countries such as the United States are maintained under conditions of confidentiality and can take many years to issue, there may be applications now pending of which we are unaware and which may later result in issued patents that our products infringe. If a patent infringement suit were brought against us, we could be forced to stop our ongoing or planned clinical trials, or delay or abandon commercialization of the product that is subject of the suit. As a result of patent infringement claims, or to avoid potential claims, we may choose or be required to seek a license from a third partythird-party and be required to pay license fees or royalties, or both. A license may not be available at all or on commercially reasonable terms, and we may not be able to redesign our products to avoid infringement. Modification of our products or development of new products could require us to conduct additional clinical trials and to revise our filings with the FDA and other regulatory bodies, which would be time-consuming and expensive. Even if we were able to obtain a license, the rights may be nonexclusive, which could result in our competitors gaining access to the same intellectual property. Ultimately, we could be forced to cease some aspect of our business operations if, as a result of actual or threatened patent infringement claims, we are unable to enter into licenses on acceptable terms. This could harm our business significantly. Risks Relating to Ownership of Our Common Stock The trading price of our common stock has been volatile and is likely to be volatile in the future. The trading price of our common stock has been highly volatile. Further, our common stock has a limited trading history. Since our public offering in November 2007 through February 28, 20142017 our stock price has fluctuated from a low of $0.81$1.75 to a high of $64.62,$67,851.00, as adjusted for the 1-for-61-for-70 reverse split of our common stock that was effected after trading on December 27, 2016 and the 1-for-15 reverse split of our common stock that was effected on July 9, 2010.January 6, 2016. The market price for our common stock will be affected by a number of factors, including: | · | | the denial or delay of regulatory clearances or approvals of our product or receipt of regulatory approval of competing products; |
| · | | our ability to accomplish clinical, regulatory and other product development milestones and to do so in accordance with the timing estimates we have publicly announced; |
| · | | changes in policies affecting third-party coverage and reimbursement in the United States and other countries; |
| · | | changes in government regulations and standards affecting the medical device industry and our product; |
| · | | ability of our product if it receives regulatory approval, to achieve market success; |
| · | | the performance of third-party contract manufacturers and component suppliers; |
our ability to develop sales and marketing capabilities;
actual or anticipated variations in our results of operations or those of our competitors;
| · | | our ability to develop sales and marketing capabilities; |
announcements
| · | | actual or anticipated variations in our results of operations or those of new products, technological innovations or product advancements by us or our competitors; |
developments with respect to patents and other intellectual property rights;
| · | | announcements of new products, technological innovations or product advancements by us or our competitors; |
sales of common stock or other securities by us or our stockholders in the future;
| · | | developments with respect to patents and other intellectual property rights; |
additions or departures of key scientific or management personnel;
| · | | sales of common stock or other securities by us or our stockholders in the future; |
disputes or other developments relating to proprietary rights, including patents, litigation matters and our ability to obtain patent protection for our technologies;
| · | | additions or departures of key scientific or management personnel; |
trading volume of our common stock;
| · | | disputes or other developments relating to proprietary rights, including patents, litigation matters and our ability to obtain patent protection for our technologies; |
changes in earnings estimates or recommendations by securities analysts, failure to obtain or maintain analyst coverage of our common stock or our failure to achieve analyst earnings estimates;
| · | | the trading volume of our common stock; |
public statements by analysts or clinicians regarding their perceptions of our clinical results or the effectiveness of our products;
| · | | changes in earnings estimates or recommendations by securities analysts, failure to obtain or maintain analyst coverage of our common stock or our failure to achieve analyst earnings estimates; |
decreases in market valuations of medical device companies; and
| · | | public statements by analysts or clinicians regarding their perceptions of our clinical results or the effectiveness of our products; |
| · | | decreases in market valuations of medical device companies; and |
| · | | general market conditions and other factors unrelated to our operating performance or the operating performance of our competitors. |
The stock prices of many companies in the medical device industry have experienced wide fluctuations that have often been unrelated to the operating performance of these companies. Following periods of volatility in the market price of a company’s securities, securities class action litigation often has been initiated against a company. If class action litigation is initiated against us, we may incur substantial costs and our management’s attention may be diverted from our operations, which could significantly harm our business.
Our inability to comply with the listing requirements of the NASDAQ CapitalStock Market could result in our common stock being delisted, which could affect its market price and liquidity and reduce our ability to raise capital. We are required to meet certain qualitative and financial tests (including a minimum closing bid price of $1.00 per share for our common stock) to maintain the listing of our common stock on the NASDAQ CapitalStock Market. If we do not maintain compliance with the continued listing requirements for the NASDAQ CapitalStock Market within specified periods and subject to permitted extensions, our common stock may be recommended for delisting (subject to any appeal we would file). If our common stock were delisted, it could be more difficult to buy or sell our common stock and to obtain accurate quotations, and the price of our stock could suffer a material decline. Delisting would also impair our ability to raise capital. Our directors and executive officers hold a significant amount of our outstanding stock and could limit your ability to influence the outcome of key transactions, including changes of control.
Our executive officers and directors and entities affiliated with them beneficially own, in the aggregate (including options and warrants exercisable currently or within 60 days of December 31, 2013), approximately 20.7% of our outstanding common stock. Our executive officers, directors and affiliated entities, if acting together, could be able to influence significantly all matters requiring approval by our stockholders, including the election of directors and the approval of mergers or other significant corporate transactions. The concentration of ownership of our common stock may have the effect of delaying, preventing or deterring a change of control of our company, could deprive our stockholders of an opportunity to receive a premium for their common stock as part of a sale of our company and may affect the market price of our common stock. This concentration of stock ownership may adversely affect the trading price of our common stock due to investors’ perception that conflicts of interest may exist or arise.
Sales of a substantial number of shares of our common stock in the public market by existing stockholders, or the perception that they may occur, could cause our stock price to decline. Sales of substantial amounts of our common stock by us or by our stockholders, announcements of the proposed sales of substantial amounts of our common stock or the perception that substantial sales may be made, could cause the market price of our common stock to decline. We may issue additional shares of our common stock in follow-on offerings to raise additional capital, upon the exercise of options or warrants, or in connection with acquisitions or corporate alliances and wealliances. We also plan to issue additional shares to our employees, directors or consultants in connection with their services to us. All of the currently outstanding shares of our common stock are freely tradable under federal and state securities laws, except for shares held by our directors, officers and certain greater than five percent stockholders, which may be subject to volume limitations. Due to these factors, sales of a substantial number of shares of our common stock in the public market could occur at any time and could reduce the market price of our common stock. You may experience future dilution as a result of future equity offerings. In addition, certainorder to raise additional capital for general corporate purposes, in the future we may offer additional shares of our stockholders and warrantholderscommon stock or other securities convertible into or exchangeable for our common stock at prices that may be lower than the current price per share of our common stock. In addition, investors purchasing shares or other securities in the future could have rights subjectsuperior to some conditions, to require us to file registration statements covering their shares or to include their shares in registration statements that we may file for ourselves or otherexisting stockholders. If we were to include in a company-initiated registration statement shares held by those holders pursuant to the exercise of their registration rights, the sale of those shares could impair our ability to raise needed capital by depressing theThe price per share at which we could sell additional shares of our common stock.stock, or securities convertible or exchangeable into common stock, in future transactions may be higher or lower than the price per share paid by investors in prior offerings. Our organizational documents and Delaware law make a takeover of our company more difficult, which may prevent certain changes in control and limit the market price of our common stock. Our certificate of incorporation and bylaws and Section 203 of the Delaware General Corporation Law contain provisions that may have the effect of deterring or delaying attempts by our stockholders to remove or replace management, engage in proxy contests and effect changes in control. These provisions include: | · | | the ability of our board of directors to create and issue preferred stock without stockholder approval, which could be used to implement anti-takeover devices; |
| · | | the authority for our board of directors to issue without stockholder approval up to the number of shares of common stock authorized in our certificate of incorporation, that, if issued, would dilute the ownership of our stockholders; |
| · | | the advance notice requirement for director nominations or for proposals that can be acted upon at stockholder meetings; |
| · | | a classified and staggered board of directors, which may make it more difficult for a person who acquires control of a majority of our outstanding voting stock to replace all or a majority of our directors; |
| · | | the prohibition on actions by written consent of our stockholders; |
| · | | the limitation on who may call a special meeting of stockholders; |
the limitation on who may call a special meeting of stockholders;
| · | | the prohibition on stockholders accumulating their votes for the election of directors; and |
the prohibition on stockholders accumulating their votes for the election of directors; and
| · | | the ability of stockholders to amend our bylaws only upon receiving a majority of the votes entitled to be cast by holders of all outstanding shares then entitled to vote generally in the election of directors, voting together as a single class. |
the ability of stockholders to amend our bylaws only upon receiving a majority of the votes entitled to be cast by holders of all outstanding shares then entitled to vote generally in the election of directors, voting together as a single class.
In addition, as a Delaware corporation, we are subject to Delaware law, including Section 203 of the Delaware General Corporation Law. In general, Section 203 prohibits a Delaware corporation from engaging in any business combination with any interested stockholder for a period of three years following the date that the stockholder became an interested stockholder unless certain specific requirements are met as set forth in Section 203. These provisions, alone or together, could have the effect of deterring or delaying changes in incumbent management, proxy contests or changes in control. These provisions also could discourage proxy contests and make it more difficult for you and other stockholders to elect directors and take other corporate actions. The existence of these provisions could limit the price that investors might be willing to pay in the future for shares of our common stock. Some provisions in our certificate of incorporation and bylaws may deter third parties from acquiring us, which may limit the market price of our common stock. We have not paid dividends in the past and do not expect to pay dividends in the future, and any return on investment may be limited to the value of our common stock. We have never paid dividends on our common stock and do not anticipate paying dividends on our common stock in the foreseeable future. The payment of dividends on our common stock will depend on our earnings, financial condition and other business and economic factors affecting us at such time as our board of directors may consider relevant. Our credit agreement also restricts our ability to pay dividends. If we do not pay dividends, our common stock may be less valuable because a return on your investment will only occur if our stock price appreciates. ITEM1B. | UNRESOLVED STAFF COMMENTS |
ITEM 1B. UNRESOLVED STAFF COMMENTS Not applicable. ITEM 2. PROPERTIES We lease approximately 28,388 square feet of lab and office space in St. Paul, Minnesota. The original lease agreement began October 1, 2008 and endswas set to expire September 30, 2015. On August 25, 2015 we entered into an amendment extending the term of the lease for three years until September 30, 2018. ITEM 3. LEGAL PROCEEDINGS On February 28, 2017, we received a class action and derivative complaint filed on February 24, 2017 in U. S. District Court for the District of Delaware by Vinh Du, one of our shareholders. The complaint names as defendants EnteroMedics, our board of directors and four members of our senior management, namely, Scott Youngstrom, Nick Ansari, Peter DeLange and Paul Hickey, and contains a purported class action claim for breach of fiduciary duty against our board of directors and derivative claims for breach of fiduciary duty against our board of directors and unjust enrichment against our senior management. The allegations in the complaint relate to the increase in the number of shares authorized for grant under our Second Amended and Restated 2003 Stock Incentive Plan (the “Plan”), which was approved by our shareholders at the Special Meeting of Shareholders held on December 12, 2016 (the “Special Meeting”), and to our subsequent grant of stock options on February 8, 2017, to our Directors and senior management to purchase an aggregate of 1,093,450 shares of our common stock (the “Option Grants”). In the complaint, the plaintiff contends that (i) the number of shares authorized for grant under the Plan, as adjusted by our board of directors after the Special Meeting for the subsequent recapitalization of the Company, resulted from an alleged breach of fiduciary duties by the Board, and (ii) our senior management was allegedly unjustly enriched by the subsequent Option Grants. The plaintiff seeks relief in the form of an order rescinding the Plan as approved by the shareholders at the Special Meeting, an order cancelling the Option Grants, and an award to plaintiff for his costs, including fees and disbursements of attorneys, experts and accountants. We believe the allegations in the complaint are without merit, and intend to defend the action vigorously. Except as disclosed in the foregoing paragraph, we are not currently a party to any litigation and we are not aware of any pending or threatened litigation against us that could have a material adverse effect on our business, operating results or financial condition. The medical device industry in which we operate is characterized by frequent claims and litigation, including claims regarding patent and other intellectual property rights as well as improper hiring practices. As a result, we may be involved in various legal proceedings from time to time. ITEM 4. | MINE SAFETY DISCLOSURES |
ITEM 4. MINE SAFETY DISCLOSURES Not applicable. PART II. ITEM 5. | MARKET FOR REGISTRANT’S COMMON EQUITY, RELATED STOCKHOLDER MATTERS AND ISSUER PURCHASES OF EQUITY SECURITIES |
ITEM 5. MARKET FOR REGISTRANT’S COMMON EQUITY, RELATED STOCKHOLDER MATTERS AND ISSUER PURCHASES OF EQUITY SECURITIES Market For Our Common Stock Our common stock has been traded on the NASDAQ Stock Market under the symbol “ETRM” since our initial public offering (IPO) on November 15, 2007. Prior to that date, there was no public market for our common stock. Our stock was traded on the NASDAQ Global Market from its initial listing at the time of our IPO until January 21, 2010. Subsequently, in anticipation of not curing our deficiencies with the continued listing requirements of the NASDAQ Global Market, we requested and were approved to transfer to the NASDAQ Capital Market, effective January 22, 2010. As of February 28, 2014,2017, there were approximately 7537 holders of record of our common stock and 66,568,9376,873,878 shares of common stock outstanding. No dividends have been paid on our common stock to date, and we do not anticipate paying any dividends in the foreseeable future. The following table sets forth the high and low sales prices of our common stock as quoted on the NASDAQ Stock Market for the periods indicated. These prices have been adjusted to reflect the 1-for-70 reverse split of our common stock that was effected after trading on December 27, 2016 and the 1-for-15 reverse split of our common stock that was effected after trading on January 6, 2016. Price Range of Common Stock | | | | | | | | | | | | | | Price Range | | | Price Range | | | | High | | | Low | | | High | | Low | Fiscal 2012 | | | | | | Fiscal 2015 | | | | | | | | First Quarter | | $ | 2.40 | | | $ | 1.73 | | | $ | 2,152.50 | | $ | 955.50 | Second Quarter | | $ | 3.77 | | | $ | 2.15 | | | $ | 1,470.00 | | $ | 619.50 | Third Quarter | | $ | 4.40 | | | $ | 2.86 | | | $ | 693.00 | | $ | 210.00 | Fourth Quarter | | $ | 3.93 | | | $ | 2.25 | | | $ | 346.50 | | $ | 105.00 | Fiscal 2013 | | | | | | Fiscal 2016 | | | | | | | | First Quarter | | $ | 3.23 | | | $ | 0.81 | | | $ | 157.50 | | $ | 57.40 | Second Quarter | | $ | 1.47 | | | $ | 0.81 | | | $ | 86.80 | | $ | 18.90 | Third Quarter | | $ | 1.37 | | | $ | 1.00 | | | $ | 31.50 | | $ | 7.70 | Fourth Quarter | | $ | 2.24 | | | $ | 1.11 | | | $ | 9.80 | | $ | 1.95 |
The closing price for our common stock as reported by the NASDAQ CapitalStock Market on February 28, 20142017 was $2.43$6.36 per share. Securities Authorized for Issuance Under Equity Compensation Plans The information required by this Item regarding equity compensation plans is incorporated by reference to the information set forth in PARTPart III, Item 12 of this Annual Report on Form 10-K. Unregistered Sales of Equity Securities None. Uses of Proceeds from Sale of Registered Securities None. Dividend Policy We have never paid cash dividends on our common stock. The board of directors presently intends to retain all earnings for use in our business and does not anticipate paying cash dividends in the foreseeable future. We do not have a dividend reinvestment plan or a direct stock purchase plan. Issuer Purchases of Equity Securities None.
Stock Performance Graph
The following performance graph and related information shall not be deemed “soliciting material” or to be “filed” with the SEC, nor shall such information be incorporated by reference into any future filing under the Securities Act of 1933 or Securities Exchange Act of 1934, each as amended, except to the extent that we specifically incorporate it by reference into such filing.
The following graph shows a comparison of cumulative total return for our common stock, the NASDAQ Composite Index and the NASDAQ Medical Equipment Index. Such returns are based on historical results and are not intended to suggest future performance. The graph assumes $100 was invested in our common stock and in each of the indexes on December 31, 2008.
Data for the NASDAQ Composite Index and the NASDAQ Medical Equipment Index assume reinvestment of dividends. The Company has never paid dividends on its common stock and has no present plans to do so.
The stockholder return shown on the graph below is not necessarily indicative of future performance, and we do not make or endorse any predictions as to future stockholder returns.
COMPARISON OF 5 YEAR CUMULATIVE TOTAL RETURN*
Among EnteroMedics, the NASDAQ Composite Index
and the NASDAQ Medical Equipment Index
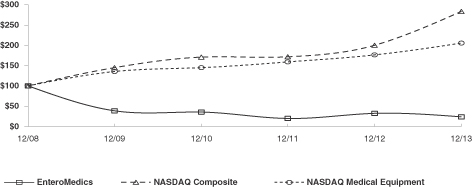
* $100 invested on 12/31/08 in stock or index, including reinvestment of dividends. No dividends have been declared or paid on our common stock. Stock performance shown in the above chart for the common stock is historical and should not be considered indicative of future price performance. The graph was prepared by Research Data Group, Inc.None.
| | | | | | | | | | | | | | | | | | | | | | | | | | | | December 31,
2008 | | | December 31,
2009 | | | December 31,
2010 | | | December 31,
2011 | | | December 31,
2012 | | | December 31,
2013 | | EnteroMedics Inc. | | $ | 100.00 | | | $ | 38.36 | | | $ | 35.16 | | | $ | 19.41 | | | $ | 31.96 | | | $ | 23.29 | | NASDAQ Composite | | | 100.00 | | | | 144.88 | | | | 170.58 | | | | 171.30 | | | | 199.99 | | | | 283.39 | | NASDAQ Medical Equipment | | | 100.00 | | | | 135.05 | | | | 144.86 | | | | 158.78 | | | | 175.96 | | | | 205.02 | |
ITEM 6. SELECTED FINANCIAL DATAITEM 6. | SELECTED FINANCIAL DATA |
The following table sets forth certain financial data with respect to our business. The information set forth below is not necessarily indicative of results of future operations and should be read in conjunction with “Management’s Discussion and Analysis of Financial Condition and Results of Operations” in Item 7 and the consolidated financial statements and related notes thereto in Item 8 of this Annual Report on Form 10-K.
| | | | | | | | | | | | | | | | | | | | | | | | Fiscal Years | | | | | 2013 | | | 2012 | | | 2011 | | | 2010(1) | | | 2009 | | | | | (In thousands, except per share data) | | Sales | | $ | — | | | $ | 311 | | | $ | — | | | $ | — | | | $ | — | | Operations: | | | | | | | | | | | | | | | | | | | | | Loss from operations | | | (24,734 | ) | | | (22,549 | ) | | | (25,257 | ) | | | (16,177 | ) | | | (24,212 | ) | Net loss | | | (25,781 | ) | | | (23,460 | ) | | | (25,997 | ) | | | (17,347 | ) | | | (31,929 | ) | Basic and diluted net loss per share | | | (0.47 | ) | | | (0.59 | ) | | | (0.86 | ) | | | (2.06 | ) | | | (6.42 | ) | Shares used to compute basic and diluted net loss per share | | | 55,010 | | | | 39,537 | | | | 30,205 | | | | 8,420 | | | | 4,974 | | | | | | | | Financial Position: | | | | | | | | | | | | | | | | | | | | | Cash, cash equivalents, restricted cash and short-term investments | | | 23,297 | | | | 22,509 | | | | 29,693 | | | | 37,368 | | | | 14,618 | | Working capital (current assets less current liabilities) | | | 16,150 | | | | 16,866 | | | | 22,003 | | | | 33,807 | | | | 8,821 | | Total assets | | | 26,388 | | | | 26,096 | | | | 32,486 | | | | 38,687 | | | | 16,214 | | Long-term debt, net of current portion and discounts | | | 2,868 | | | | 6,684 | | | | 2,881 | | | | 4,983 | | | | 3,881 | | Deficit accumulated during development stage | | | (225,953 | ) | | | (200,172 | ) | | | (176,712 | ) | | | (150,715 | ) | | | (133,368 | ) | Total stockholders’ equity | | | 14,679 | | | | 11,875 | | | | 20,041 | | | | 29,707 | | | | 5,581 | |
Not applicable. (1) | Basic and diluted net loss per share and shares used to compute basic and diluted net loss per share include the impact of converting 3,394,309 shares of convertible preferred stock into common stock immediately following the closing of our public offering on December 14, 2010. |
ITEM 7. | MANAGEMENT’S DISCUSSION AND ANALYSIS OF FINANCIAL CONDITION AND RESULTS OF OPERATIONS |
ITEM 7. MANAGEMENT’S DISCUSSION AND ANALYSIS OF FINANCIAL CONDITION AND RESULTS OF OPERATIONS Except for the historical information contained herein, the matters discussed in this “Management’s Discussion and Analysis of Financial Condition and Results of Operations,” and elsewhere in this Form 10-K are forward-looking statements that involve risks and uncertainties. The factors listed in Item 1A “Risk Factors,” as well as any cautionary language in this Form 10-K, provide examples of risks, uncertainties and events that may cause our actual results to differ materially from those projected. Except as may be required by law, we undertake no obligation to update any forward-looking statement to reflect events after the date of this report. Overview We are a development stage medical device company with approvals to commercially launch our product, the vBloc Neuromodulation System (vBloc System), in Australia,the United States, the European Economic Area and other countries that recognize the European CE Mark. We are focused on the design and development of devices that use neuroblocking technology to treat obesity, metabolic diseases and other gastrointestinal disorders. Our proprietary neuroblocking technology, which we refer to as VBLOC therapy,vBloc Therapy, is designed to intermittently block the vagus nerve using high frequency, low energy, electrical impulses. We have a limited operating history and currently,only recently received U.S. Food and Drug Administration (FDA) approval to sell our product in the United States. In addition, we only have regulatory approval to sell our product in Australia, the European Economic Area and other countries that recognize the European CE Mark and currently do not have any other source of revenue. Our initial product isWe were incorporated in Minnesota on December 19, 2002 and later reincorporated in Delaware on July 22, 2004. We have devoted substantially all of our resources to the development and commercialization of the vBloc System, which was formerly known as the Maestro Rechargeable System. The vBloc System which uses VBLOC therapyvBloc Therapy to affect metabolic regulatory control, limit the expansion of the stomach, help control hunger sensations between meals, reduce the frequency and intensity of stomach contractions and produce a feeling of early and prolonged fullness. We were formerly known as Beta Medical, Inc. and were incorporated in Minnesota on December 19, 2002. We later reincorporated in Delaware on July 22, 2004. Since inception, we have devoted substantially all of our resources to the development and commercialization of our Maestro System. Based on our understanding of vagal nerve function and nerve blocking from our preclinical studies and the results of our clinical trials, we believe the MaestrovBloc System may offeroffers obese patients a minimally-invasive treatment that has the potential tocan result in significant, durable and sustained weight loss. We believe that our MaestrovBloc System will allowallows bariatric surgeons to helpoffer a new option to obese patients who are concerned about the risks and complications associated with currently available anatomy-altering, restrictive andor malabsorptive surgical procedures. In addition, data from our VBLOC-DM2 ENABLE trial outside
We received FDA approval on January 14, 2015 for vBloc Therapy, delivered via the United States demonstrate that VBLOC therapy may hold promise in improving obesity-related comorbiditiesvBloc System, for the treatment of adult patients with obesity who have a Body Mass Index (BMI) of at least 40 to 45 kg/m2, or a BMI of at least 35 to 39.9 kg/m2 with a related health condition such as diabeteshigh blood pressure or high cholesterol levels, and hypertension. We are conducting, or planwho have tried to conduct, further studieslose weight in each of these comorbidities to assess VBLOC therapy’s potential in addressing multiple indications. We continue to evaluatea supervised weight management program and failed within the Maestro System in human clinical trialspast five years. In 2015 we began a controlled commercial launch at select surgical centers in the United States Australia, Mexico and Norway.had our first commercial sales. During 2015, we initiated a controlled expansion of our commercial operations and started the process of building a sales force. In January 2016, we hired new executives to oversee this expansion. Our direct sales force is supported by field clinical engineers who provide training, technical and other support services to our customers. Throughout 2016, our sales force called directly on key opinion leaders and bariatric surgeons at commercially-driven surgical centers that met our certification criteria. Additionally, in 2016, through a distribution agreement with Academy Medical, LLC, U.S. Department of Veterans Affairs (VA) medical facilities now offer the vBloc System as a treatment option to veterans using their veteran healthcare benefits. We plan to build on these efforts in 2017 with self-pay and veteran patient focused direct-to-patient marketing, key opinion leader and center specific partnering, and a multi-faceted reimbursement strategy. To date, we have not observed any mortality relatedrelied on, and anticipate that we will continue to rely on, third-party manufacturers and suppliers for the production of the vBloc System.
Recharge Trial Data from our device or any unanticipated adverse device effectsReCharge trial was used to support the premarket approval (PMA) application for the vBloc System, submitted to the FDA in these clinical trials. We have also not observed any long-term problematic clinical side effects in any patients, including in those patients who have been using the Maestro System for more than one year. In October 2010, we received an unconditional Investigational Device Exemption (IDE) Supplement approval from the U.S. Food and Drug Administration (FDA) to conductJune 2013. The ReCharge trial is a randomized, double-blind, sham-controlled, multicenter pivotal clinical trial called the ReCharge trial, testing the effectiveness and safety of VBLOC therapyvBloc Therapy utilizing our second generation Maestro Rechargeable (RC)vBloc System. Enrollment and implantation in the ReCharge trial was completed in December 2011 in 239 randomized patients (233 implanted) at 10 centers. All patients in the trial received an implanted device and were randomized in a 2:1 allocation to treatment or sham control groups. The sham control group received a non-functional device during the trial period. All patients were expected to participate in a standard weight management counseling program. The primary endpoints of efficacy and safety were
evaluated at 12 months. As announced, on February 7, 2013, the ReCharge trial met its primary safety endpoint though it did not meet its predefined co-primary efficacy endpoints.with a 3.7% serious adverse event rate. The safety profile at 12 months was further supported by positive cardiovascular signals including a 5.5 mmHg drop in systolic blood pressure, a 2.8 mmHg drop in diastolic blood pressure and a 3.6 bpm drop in average heart rate. Additionally, the trial did however demonstratedemonstrated in the intent to treat (ITT) population (n=239) a clinically meaningful and statistically significant excess weight loss (EWL) of 24.4% (approximately 10% total body weight loss (TBL)) for VBLOC therapy-treatedvBloc Therapy-treated patients, with 52.5% of patients achieving at least 20% EWL, although it did not meet its co-primary efficacy endpoints. In the per protocol population, the trial demonstrated an EWL of 26.3% for vBloc Therapy-treated patients, with 56.8% of patients achieving at least 20% EWL. On December 3, 2013 weWe subsequently announced 18 month efficacy and safety results from the ReCharge trial showing that VBLOC therapy-treatedvBloc Therapy-treated patients were maintaining their weight loss while the sham control group gained back over 40%at 18 months and 24 months with an EWL of the weight loss seen at 12 months.23.5% and 21.1%, respectively. The 18 month datatrial’s positive safety profile also continued to show positive safety signals. See additional discussion regarding the 12throughout this reported time period. For more information on our Recharge Trial and 18 month ReCharge trial data in the “Clinical Development” section included inour other ongoing clinical trials, please see Item 1, ofBusiness, “Our Clinical Experience,” in this Annual Report on Form 10-K. As a result of the positive safety and efficacy profile of VBLOC therapy, we used the data from the ReCharge trial to support a premarket approval (PMA) application10-K for the Maestro Rechargeable System, which we announced was submitted to the FDA in June 2013 and was accepted for review and filing in July 2013. The FDA has scheduled an Advisory Panel meeting for June 17, 2014 to review our PMA application for approval of the Maestro System. If the FDA grants us approval, we anticipate we will be able to commercialize the Maestro Rechargeable System in the United States in late 2014.
If we obtain FDA approval of our Maestro Rechargeable System we intend to market our products in the United States through a direct sales force supported by field technical and marketing managers who provide training, technical and other support services to our customers. Outside the United States, we intend to use direct, dealer and distributor sales models as the targeted geography best dictates. To date, we have relied on third-party manufacturers and suppliers for the production of our Maestro System. We currently anticipate that we will continue to rely on third-party manufacturers and suppliers for the production of the Maestro System.Year Ended December 31, 2016.
We obtained European CE Mark approval for our Maestro RechargeablevBloc System in 2011.2011 for the treatment of obesity. The CE Mark approval for our vBloc System was expanded in 2014 to also include use for the management of Type 2 diabetes in obese patients. In January 2012, the final Maestro RechargeablevBloc System components were listed on the Australian Register of Therapeutic Goods (ARTG) by the Therapeutic Goods Administration (TGA). We have entered into exclusive, multi-year agreements with Device Technologies Australia Pty LimitedThe costs and Bader Sultan & Brothers Co. W.L.L., for commercialization and distribution ofresources required to successfully commercialize the Maestro ReChargeablevBloc System internationally are currently beyond our capability. Accordingly, we will continue to devote our near-term efforts toward mounting a successful system launch in Australia and the Gulf Coast Countries, including Saudi Arabia, Kuwait, Bahrain, Qatar and the United Arab Emirates, respectively.States. We continueintend to explore additional select international markets to commercialize the Maestro RechargeablevBloc System including Europe.as our resources permit, using direct, dealer and distributor sales models as the targeted market best dictates. The method of assessing conformity with applicable regulatory requirements varies depending on the class of theTo date, we have not observed any mortality related to our device but foror any unanticipated adverse device effects in our Maestro System (which is considered an Active Implantable Medical Device (AIMD)human clinical trials. We have also not observed any long-term problematic clinical side effects in Australia and the European Economic Area, and falls into Class III withinany patients. In addition, data from our VBLOC-DM2 ENABLE trial outside the United States), the method involved a combinationStates demonstrate that vBloc Therapy may hold promise in improving obesity-related comorbidities such as diabetes and hypertension. We are conducting, or plan to conduct, further studies in each of self-assessment and issuance of declaration and conformity by the manufacturer of the safety and performance of the device, and a third-party assessment by a Notified Body of the design of the device and ofthese comorbidities to assess vBloc Therapy’s potential in addressing multiple indications.
In 2016, we continued our quality system. We use DEKRA Certification B.V. (formerly known as KEMA Quality)commercialization efforts in the Netherlands as the Notified Body forUnited States, deriving revenues from our CE marking approval process. Thus far, we have only generated revenue from the sale of products in 2012 and did not have sales in 2013 as we continued to focus our resources on the U.S. regulatory approval process, and we have incurred net losses in each year since our inception. As of December 31, 2013, we had experienced net losses during the development stage of $225.8 million. Although we have received ARTG listings to sell our Maestro Rechargeable System in Australia and European CE Mark to sell our Maestro Rechargeable System in the European Economic Area and other countries that recognize the European CE Mark, resulting in our first commercial sales in 2012, weprimary business activity. We expect to incur significant sales and marketing expenses prior to recording sufficient revenue to offset these expenses. We expect our selling, general and administrative expenses to increase as we continue to add the infrastructure necessary to support our initial commercial sales, operate as a public company and develop our intellectual property portfolio. For these reasons, we expect to continue to incur significant and increasing operating losses for the next several years. We have financed our operations to date principally through the sale of equity securities, debt financing and interest earned on investments.
During 2016, our board of directors and stockholders approved two reverse stock splits (collectively, the Reverse Stock Splits). Neither reverse stock split changed the par value of our common stock or the number of preferred shares authorized by our certificate of incorporation. The first reverse stock split was a 1-for-15 reverse split (the First Reverse Stock Split) of our outstanding common stock that became effective after trading on January 6, 2016. The First Reverse Stock Split also decreased the number of shares of common stock authorized by our certificate of incorporation proportionately, and proportional adjustments were also made to our outstanding stock options and warrants and the number of shares authorized under our Amended and Restated 2003 Stock Incentive Plan . In connection with the First Reverse Stock Split, an amendment to our certificate of incorporation was also approved to increase the number of shares of our common stock authorized for issuance to 150 million shares, effective immediately after the First Reverse Stock Split on January 6, 2016. The second reverse stock split was a 1-for-70 reverse split (the Second Reverse Stock Split) of our outstanding common stock that became effective after trading on December 27, 2016 pursuant to our Sixth Amended and Restated Certificate of Incorporation, which was filed in connection with the Second Reverse Stock Split. In connection with the Second Reverse Stock Split, proportional adjustments were also made to our outstanding stock options and warrants. Additionally, in connection with the Second Reverse Stock Split, a second amendment was approved to increase the number of shares of our common stock authorized for issuance to 300 million shares, effective after the Second Reverse Stock Split on December 27, 2016. Critical Accounting Policies and Significant Judgments and Estimates Our management’s discussion and analysis of our financial condition and results of operations are based on our consolidated financial statements, which have been prepared in accordance with accounting principles generally accepted in the United States. The preparation of these financial statements requires us to make estimates and assumptions that affect the reported amounts of assets and liabilities and the disclosure of contingent assets and liabilities at the date of the financial statements as well as the reported expenses during the reporting periods. We evaluate our estimates and judgments on an ongoing basis. Actual results may differ materially from these estimates under different assumptions or conditions. While our significant accounting policies are more fully described in Note 2 to our consolidated financial statements included in Item 8 of this Annual Report on Form 10-K, we believe that the following accounting policies and estimates are most critical to a full understanding and evaluation of our reported financial results.
Revenue Recognition Revenue is recognized when persuasive evidence of an arrangement exists, title or risk of loss has passed, the selling price is fixed or determinable and collection is reasonably assured. Products are sold internationally through direct sales or medical device distributors and revenue is recognized upon sale to thea bariatric center of excellence or a medical device distributor as these sales are considered to be final andwhen no right of return or price protection exists. Terms of sales to international distributors are generally EXW, reflecting that goods are shipped “ex works,” in which risk of loss is assumed by the distributor at the shipping point. We doA provision for returns is recorded only if product sales provide for a right of return. No provision for returns was recorded for the year ended December 31, 2016, as the product sales recorded did not provide for rights of return to customers on product sales and therefore do not record a provision for returns.return. Inventory
SinceInventory
From inception, inventory related purchases primarily havehad been used for research and development related activities and havehad accordingly been expensed as incurred. In December 2011, we began receiving ARTG listings for components of the Maestro RechargeablevBloc System from the Australian TGA, with the final components being listed on the ARTG in January 2012. As a result, we determined certain assets were recoverable as inventory beginning in December 2011 and have recorded a current inventory balance of approximately $1.1 million$1,790,000 and $1.3 million$1,686,000 as of December 31, 20132016 and 2012,2015, respectively. We account for inventory at the lower of cost or market and record any long-term inventory as other assets in the consolidated balance sheets. There was approximately $794,000$676,000 and $862,000$519,000 of long-term inventory as of December 31, 20132016 and 2012,2015, respectively. Stock-Based Compensation
PriorSenior Amortizing Convertible Notes
The senior amortizing convertible notes issued on November 9, 2015, January 11, 2016 and May 2, 2016 (the Notes) included a conversion feature which requires bifurcation and liability classification and measurement, at fair value, and requires evaluation at each reporting period. Under Accounting Standards Codification (ASC) 825, Financial Instruments, the Financial Accounting Standards Board (FASB) provides an alternative to January 1, 2006, we accountedbifurcation and companies may instead elect fair value measurement for stock-based employee compensation arrangements using the intrinsicentire instrument, including the debt and conversion feature. We have elected the fair value methodalternative in order to simplify our accounting and reporting of the senior amortizing convertible notes upon issuance. The fair value of these senior amortizing convertible notes is re-measured at each financial reporting period, with any changes in fair value being recognized as a component of other income (expense) in the expense over the option vesting period. The intrinsic value method is calculated as the difference, if any, betweenconsolidated statements of operations. We concluded that the fair value of our common stock and the exercise price onNotes at issuance is equal to the date ofgross proceeds received less the grant. We also followed the minimum value disclosure provisions. Using the intrinsic value method, we were not required to recognize stock-based compensation expense for employee stock options granted from inception through 2005 as the exercise prices, for financial reporting purposes, were determined to be at or above the deemed fair value of the underlying common stock onwarrants issued in conjunction with the Notes. Both at the date of grant.issuance and during the years ended December 31, 2016 and 2015, a Binomial Lattice model was used to value the Notes. The fair value of ourthe warrants was recorded as a discount to the Notes and amortized to interest expense following the effective interest rate method over the term of the Notes. During the year ended December 31, 2016, all remaining principal and interest amounts outstanding under the Notes were paid off, primarily via conversions to common shares. Common Stock Warrant Liability Common stock warrants that were issued in connection with the July 8, 2015 public offering (the Series A Warrants) and the Notes (the Note Warrants) are classified as a liability in the consolidated balance sheets, as the common stock was assessed and approved by our board of directors, the members of which have extensive experiencewarrants issued provide for certain anti-dilution protections in the life sciences industryevent shares of common stock or securities convertible into shares of common stock are issued below the then-existing exercise price. The fair value of these common stock warrants is re-measured at each financial reporting period and all but oneimmediately before exercise, with any changes in fair value being recognized as a component of whom are nonemployee directors. In determiningother income (expense) in the appropriatenessconsolidated statements of operations. The fair value of the Company’s common stock warrant liability is calculated using a Black-Scholes valuation model and is classified as Level 2 in the fair value of our common stock, the board of directors considered several factors, such as our life cycle, results of research and development, recent financings and financial projections.hierarchy. The fair values are presented below along with valuation assumptions Effective January 1, 2006, we adopted
| | | | | | | | | | | | | | Series A Warrants | | November 2015 Note Warrants | | | | December 31, 2016 | | | July 8, 2015 | | | December 31, 2016 | | | November 9, 2015 | | Risk-free interest rates | | 1.20 | % | | 0.91 | % | | 1.47 | % | | 1.75 | % | Expected life | | 24 | months | | 42 | months | | 46 | months | | 60 | months | Expected dividends | | — | % | | — | % | | — | | | — | % | Expected volatility | | 122.03 | % | | 89.89 | % | | 102.29 | % | | 84.85 | % | Fair value | $ | 36,000 | | $ | 6,004,000 | | $ | 449 | | $ | 169,000 | |
| | | | | | | | | | | | | | | | | January 2016 Note Warrants | | | May 2016 Note Warrants | | | | December 31, 2016 | | January 11, 2016 | | December 31, 2016 | | May 2, 2016 | | Risk-free interest rates | | | 1.93 | % | | 1.58 | % | | 1.93 | % | | 1.32 | % | Expected life | | | 48 | months | | 60 | months | | 52 | months | | 60 | months | Expected dividends | | | — | % | | — | % | | — | % | | — | % | Expected volatility | | | 108.57 | % | | 85.90 | % | | 106.37 | % | | 89.28 | % | Fair value | | $ | 1,633 | | $ | 515,157 | | $ | 1,037 | | $ | 150,195 | |
Stock-Based Compensation We account for share-based payments using the fair value method, of accounting for share-based payments, which superseded the previous accounting method, and requires compensation expense to be recognized using a fair-value-based method for costs related to all share-based payments including stock options. Companies are required to estimate the fair value of share-based payment awards on the date of grant using an option-pricing model. We adopted the new provisions using the prospective transition method. Under this method, compensation cost is recognized for all share-based payments granted or modified subsequent to December 31, 2005. All option grants valued after January 1, 2006 are expensed on a straight-line basis over the vesting period. Calculating stock-based compensation expense requires the input of highly subjective assumptions, which represent our best estimates and involve inherent uncertainties and the application of management’s judgment. Estimates of stock-based compensation expenses are significant to our consolidated financial statements, but these expenses are based on the Black-Scholes pricing model and will never result in the payment of cash by us. All option grants are expensed on a straight-line basis over the vesting period. The application of share-based payment principles may be subject to further interpretation and refinement over time. There are significant differences among option valuation models, and this may result in a lack of comparability with other companies that use different models, methods and assumptions. If factors change and we employ different assumptions in the application of share-based payment accounting in future periods, or if we decide to use a different valuation model, the compensation expense that we record in the future may differ significantly from what we have recorded in the current period and could materially affect our operating loss, net loss and net loss per share. The fair value method is applied to all share-based payment awards issued to employees and where appropriate, nonemployees, unless another source of literature applies. When determining the measurement date of a nonemployee’s share-based payment award, the Company measures the stock options at fair value and remeasures such stock options to the current fair value until the performance date has been reached. For stock options granted to nonemployees, the fair value of the stock options is estimated using the Black-Scholes valuation model. This model utilizes the estimated fair value of common stock and requires that, at the date of grant and each subsequent reporting period until the services are completed or a significant disincentive for nonperformance occurs, we make assumptions with respect to the expected term of the option, the volatility of the fair value of our common stock, risk free interest rates and expected dividend yields of our common stock. Different estimates of volatility and expected life of the option could materially change the value of an option and the resulting expense. Common Stock Warrant Liability
Effective January 1, 2009, we adopted new authoritative accounting guidance regarding the financial reporting for outstanding equity-linked financial instruments. This adoption required certain warrants issued by us to be recorded as a liability and recorded at fair value. Calculating the fair value
Net Operating Losses and Tax Credit Carryforwards At December 31, 2013,2016, we had federal net operating loss carryforwards of approximately $81.2$161.4 million. Of this amount, approximately $33.1 million is available after the application of Internal Revenue Code (IRC) Section 382 limitations, discussed below. These net operating loss carryforwards will expire in varying amounts from 2022 through 2033,2035, if not utilized. The IRCInternal Revenue Code (IRC) imposes restrictions on the utilization of various carryforward tax attributes in the event of a change in ownership of the Company, as defined by IRC Section 382. In addition, IRC Section 382 may limit the Company’sour built-in items of deduction, including capitalized start-up costs and research and development costs. During 2011, we completed an IRC Section 382 review and the results of this review indicate ownership changes have occurred which would cause a limitation on the utilization of carryforward attributes. The Company’sOur gross net operating loss carryforwards, start-up costs and research and development credits are all subject to limitation. Under these tax provisions, the limitation is applied first to any built-in losses, then to any net operating losses and then to any general business credits. The Section 382 limitation and accompanying recognized built-in loss limitationIt is currently estimated to result in the expiration of $48.1 million of our gross federal net operating loss carryforward, as well as a write-off of $5.9 million of capitalized start-up costs, $11.1 million of capitalized research and development costs, $1.5 million of property and equipment and $2.4 million of research and development credits. Anylikely that ownership changes have occurred since we completed our IRC Section 382 review in 2011 and could result in further limitations on the utilization of carryforward attributes. A valuation allowance has been established to reserve for the potential benefits of the remaining carryforwards and tax credits in our consolidated financial statements to reflect the uncertainty of future taxable income required to utilize available tax loss carryforwards and other deferred tax assets. Financial Overview
Revenue We received FDA approval on January 14, 2015 for vBloc Therapy. In 2015 we began a controlled commercial launch at select surgical centers in the United States and had our first commercial sales. During 2015, we initiated a controlled expansion of our commercial operations and started the process of building a sales force. In January 2016, we hired new executives to oversee this expansion. Our direct sales force is supported by field clinical engineers who provide training, technical and other support services to our customers. Throughout 2016, our sales force called directly on key opinion leaders and bariatric surgeons at commercially-driven surgical centers that met our certification criteria. Additionally, in 2016, through a distribution agreement with Academy Medical, VA medical facilities now offer the vBloc System as a treatment option to veterans using their veteran healthcare benefits. We plan to build on these efforts in 2017 with self-pay and veteran patient focused direct-to-patient marketing, key opinion leader and center specific partnering, and a multi-faceted reimbursement strategy. We had our first commercial sales within the United States in 2015 and for the year ended December 31, 2015 and we recognized $292,000 in revenue. During the year ended December 31, 2016, we continued our commercialization efforts and recognized $787,000 in revenue. We obtained European CE Mark approval for our Maestro RechargeablevBloc System in 2011 for the treatment of obesity, which enables commercialization in the European Economic Area and other countries that recognize the European CE Mark. In January 2012,The CE Mark approval for our vBloc System was expanded in 2014 to also include use for the final Maestro Rechargeable System components were listed on the ARTG by the Australian TGA.management of Type 2 diabetes in obese patients. We have entered into exclusive, multi-year agreements with Device Technologies Australia Pty Limited and Bader Sultan & Brothers Co. W.L.L., for commercialization and distributionnot generated revenue from commercial sales outside of the Maestro ReChargeable System in Australia and the Gulf Coast Countries, including Saudi Arabia, Kuwait, Bahrain, Qatar and the United Arab Emirates, respectively.States. We made our first commercial shipmentsintend to Device Technologies Australia Pty Limited and Bader Sultan & Brothers Co. W.L.L. during the year ended December 31, 2012 and recognized $311,000 in revenue. We did not recognize any revenue for the year ended December 31, 2013, primarily due to focusing our resources on the U.S. regulatory approval process. In the United States, we completed enrollment and device implantation in our ReCharge pivotal trial for obesity in December 2011. The primary endpoints of efficacy and safety were evaluated at 12 months. As announced on February 7, 2013, the ReCharge trial met its primary safety endpoint, though it did not meet its predefined co-primary efficacy endpoints. The trial did however demonstrate in the ITT population (n=239) a clinically meaningful and statistically significant EWL of 24.4% (approximately 10% TBL) for VBLOC therapy-treated patients, with 52.5% of patients achieving at least 20% EWL. On December 3, 2013 we announced 18 month efficacy and safety results from the ReCharge trial showing that VBLOC therapy-treated patients were maintaining their weight loss, while the sham control group gained back over 40% of the weight loss seen at 12 months. The 18 month data also continued to show positive safety signals. See additional discussion regarding the 12 and 18 month ReCharge trial data in the “Clinical Development” section included in Item 1 of this Annual Report on Form 10-K. As a result of the positive safety and efficacy profile of VBLOC therapy, we used the data from the ReCharge trial to support a PMA application for the Maestro Rechargeable System, which we announced was submitted to the FDA in June 2013 and was accepted for review and filing in July 2013. The FDA has scheduled an Advisory Panel meeting for June 17, 2014 to review our PMA application for approval of the Maestro System. If the FDA grants us approval, we anticipate we will be ableexplore select international markets to commercialize the Maestro RechargeablevBloc System inas our resources permit, using direct, dealer and distributor sales models as the United States in late 2014. Any revenue from initial sales oftargeted market best dictates. Specifically, Canada is a market with a relatively low barrier to entry and an established cash-pay bariatric patient market.
The vBloc System remains a relatively new product in the United States orand internationally and it is difficult to predict and inthe amount of revenue it will generate going forward. In any event, such revenue will only modestly reduce our continued losses resulting from our research and development and other activities.
Selling, General and Administrative Expenses Our selling, general and administrative expenses consist primarily of compensation for executive, finance, market development and administrative personnel, including stock-based compensation. Other significant expenses include costs associated with attending medical conferences, professional fees for legal services, including legal services associated with our efforts to obtain and maintain broad protection for the intellectual property related to our products, reimbursement development and accounting services, cash management fees, consulting fees and travel expenses. Research and Development Expenses Our research and development expenses primarily consist of engineering, product development, quality assurance and clinical and regulatory expenses, incurred in the development of our MaestroVBloc System. Research and development expenses also include employee compensation, including stock-based compensation, consulting services, outside services, materials, clinical trial expenses, including supplies, devices, explants and revisions, depreciation and travel. We expense research and development costs as they are incurred. From inception through December 31, 2013, we have incurred a total of $138.5 million in research and development expenses. Selling, General and Administrative Expenses
Our selling, general and administrative expenses consist primarily of compensation for executive, finance, market development and administrative personnel, including stock-based compensation. Other significant expenses include costs associated with attending medical conferences, professional fees for legal, including legal services associated with our efforts to obtain and maintain broad protection for the intellectual property related to our products, and accounting services, cash management fees, consulting fees and travel expenses. From inception through December 31, 2013, we have incurred $73.8 million in selling, general and administrative expenses.
Results of Operations
Comparison of the Years Ended December 31, 20132016 and 20122015 Sales. ThereSales were no sales$787,000 for the year ended December 31, 2013, which was primarily the result of focusing our resources on the U.S. regulatory approval process,2016 compared to $311,000 saleswith $292,000 for the year ended December 31, 2012.2016. The $311,000increase of $495,000 is the result of the continued controlled commercial launch of the vBloc System at select surgical centers in the United States which resulted in sales of 62 units during 2016 versus 24 units during 2015. We received FDA approval to sell the vBloc System on January 14, 2015. Cost of Goods Sold. Cost of goods sold were $431,000 for the year ended December 31, 2012 were the result of our first commercial shipments of the Maestro ReChargeable System beginning in the first quarter of 2012. Cost of Goods Sold. There were no cost of goods sold2016 compared to $125,000 for the year ended December 31, 2013, compared to $232,0002015. The increase was driven primarily by the 158% increase in the number of units sold in 2016 over 2015. Gross margin percentage for 2016 was 45.2% versus 57.2% for the year ended December 31, 2012. Grossprior year. The decline in gross margin percentage was 25.7% for the year ended December 31, 2012.primarily due to higher supply chain costs in 2016 than in 2015.
ResearchSelling, General and DevelopmentAdministrative Expenses. Research Selling, general and developmentadministrative expenses were $11.1$18.0 million for the year ended December 31, 2013,2016, compared to $10.7$19.9 million for the year ended December 31, 2012.2015. The increasedecrease of $407,000,$1.9 million, or 3.8%9.6%, was primarily due to increases of $925,000, $448,000 and $234,000a $3.4 million decrease in payroll-related expenses, partially offset by a $1.1 million increase in professional services employee stock-based compensation and device costs, respectively, offset by decreases of $852,000 and $247,000 in payroll-related expenses and travel costs, respectively.a $366,000 increase in severance expenses. The increase in professional services was primarily related to costs associated with the unblinding of the ReCharge trial and the resulting work around our PMA application for the Maestro Rechargeable System, which was submitted to the FDA in June 2013 and the increased utilization of consultants in place of permanent employees lost to attrition. The increase in employee stock-based compensation wasexpenses are the result of stock option grants made to management on July 10, 2012 and May 31, 2013. The increase in device costs was primarilyincreasing commercialization efforts as we continue the resultcontrolled commercial launch of ReCharge sham control patients beginning to convert to active devices. The increased use of consultants also resultedthe vBloc System at select surgical centers in the decreases to payroll-related expensesUnited States.
Research and travel.Development Expenses. Selling, General Research and Administrative Expenses. Selling, general and administrativedevelopment expenses were $13.7$5.2 million for the year ended December 31, 2013,2016, compared to $12.0$8.1 million for the year ended December 31, 2012.2015. The increasedecrease of $1.7$3.0 million or 14.2%36.5%, was primarily due to an increasesdecreases of $1.2$2.0 million, $436,000 and $527,000$119,000 in employee stock-based compensationpayroll-related expenses, supply expenses and professional services expenses, respectively. The increase in employee stock-based compensation wasdecreases are the result of stock option grants madea continued shift away from a research and development focus toward commercialization. The Company plans to management on July 10, 2012increase it research and May 31, 2013. The increasedevelopment expenses in professional services was primarily related2017 to costs associated with the unblinding of the ReChargesupport a next generation product and to support our post-clinical trial and ongoing international commercialization efforts.requirements.
Interest Expense. Interest expense was $932,000$4.1 million for the year ended December 31, 2013,2016, compared to $902,000$939,000 for the year ended December 31, 2012.2015. The increase of $31,000, or 3.4%,$3.2 million was driven by interest costs from the three Note closings that occurred on November 9, 2015, January 11, 2016 and May 2, 2016, and increased interest costs due to conversions of remaining amounts due under the Notes into common shares by holders of the Notes during the year ended December 31, 2016, and, as a result, accelerations of a loan modification which occurred“make whole” interest amounts due under the Notes. Additionally, $277,000 in April 2012 increasingdebt issuance costs were expensed during the principal balance from $4.7 million to $10.0 million and increasing the interest rate from 6.25% to 8.00% with interest only payments through March 31, 2013.quarter ended June 30, 2016. Change in Value of Warrant Liability. The value of the common stock warrant liability increased $217,000 for the year ended December 31, 2016, compared to the year ended December 31, 2015. Common stock warrant liabilities were recorded during the year ended December 31, 2015 for the Series A Warrants on July 8, 2015 and for the Note Warrants issued on November 9, 2015. In addition, Note Warrants were issued on January 11, 2016 and May 2, 2016. The decline in the value of the warrants was driven by the decrease in the Company’s stock price, which declined throughout 2016, from $136.50 per share on December 31, 2015 to $2.00 on December 31, 2016. Comparison of the Years Ended December 31, 20122015 and 20112014 Sales. Sales were $311,000$292,000 for the year ended December 31, 2012,2015, compared to no sales for the year ended December 31, 2011.2014. The $311,000increase of sales$292,000 is the result of receiving FDA approval on January 14, 2015 and commencing a controlled commercial launch of the vBloc System at select bariatric centers of excellence in the United States. Cost of Goods Sold. Cost of goods sold were $125,000 for the year ended December 31, 2012 were the result of beginning a controlled commercial launch of the Maestro ReChargeable System in Australia and the Gulf Coast Countries of the Middle East with our first commercial shipments occurring in the first quarter of 2012.
Cost of Goods Sold. Cost of goods sold were $232,000 for the year ended December 31, 2012,2015, compared to no cost of goods sold for the year ended December 31, 2011.2014. Gross margin was 25.7%57.2% for the year ended December 31, 2012.2015.
ResearchSelling, General and DevelopmentAdministrative Expenses. Research Selling, general and developmentadministrative expenses were $10.7$19.9 million for the year ended December 31, 2012,2015, compared to $16.7$14.6 million for the year ended December 31, 2011.2014. The increase of $5.3 million, or 36.6%, was primarily due to increases of $2.1 million, $1.7 million, $1.0 million and $505,000 in payroll-related expenses, professional services, employee stock-based compensation and travel, respectively. The increases in payroll-related expenses, professional services and travel are primarily the result of receiving FDA approval on January 14, 2015 and beginning a controlled commercial launch at select bariatric centers of excellence in the United States. The increase in payroll-related expenses is also the result of a special one-time bonus and an increase in the 2014 management incentive plan accrual in recognition of achieving FDA approval on January 14, 2015. The increase in employee stock-based compensation is also a result of stock option grants made in recognition of the receipt of FDA approval and in connection with new hires in 2015.
Research and Development Expenses. Research and development expenses were $8.1 million for the year ended December 31, 2015, compared to $11.0 million for the year ended December 31, 2014. The decrease of $6.0$2.9 million, or 36.0%26.2%, was primarily due to decreases of $4.8$2.3 million, $254,000, $171,000 and $984,000$160,000 in professional services, payroll-related expenses, devices and device costs, respectively. The decreasestravel. Professional services in professional services2014 were primarily related to preparation for the advisory panel meeting with the FDA, which was held June 17, 2014. Decreases in payroll-related expenses, devices and device costs aretravel were primarily the result of decreased emphasis in research and development as efforts were focused on the completioncommercial launch as a result of enrollments and device implantation in our ReCharge trial in late 2011. Ongoing costs in 2012 were for follow-up visits, which are significantly less than the implantation costs.receiving FDA approval on January 14, 2015. Selling, GeneralInterest Expense. Interest expense was $939,000 for the year ended December 31, 2015, compared to $530,000 for the year ended December 31, 2014. The increase of $409,000, or 77.1%, is primarily due to $532,000 and Administrative Expenses. Selling, general$33,000 of financing costs that were assigned to the common stock warrants issued with the July 8, 2015 financing and administrative expensesthe Notes, respectively, both being recognized immediately as interest expense as the warrants are exercisable upon issuance, together with a $187,000 success fee paid to Silicon Valley Bank as a result of achieving FDA approval on January 14, 2015. These increases were $12.0offset by a reduction of interest expense due to the declining principal balance through monthly principal and interest loan payments that began on April 1, 2013.
Change in Value of Warrant Liability. The value of the common stock warrant liability decreased $3.3 million for the year ended December 31, 2012,2015, compared to $8.6 millionno change for the year ended December 31, 2011. The increase of $3.4 million, or 39.4%, was primarily due to an increase of $2.1 million in compensation and benefits, including $1.3 million in stock-based compensation, and an increase of $1.1 million in professional services. The increase in compensation and benefits, including stock-based compensation, was the result of increased staff to support international commercialization efforts as well as2014. Common stock option grants made to managementwarrant liabilities were recorded on July 10, 2012.8, 2015 and November 9, 2015 as the common stock warrants issued with the July 8, 2015 public offering and with the Notes provide for certain anti-dilution protections in the event shares of common stock or securities convertible into shares of common stock are issued below the then-existing exercise price. The increasefair market value was calculated using the Black-Scholes valuation model, which resulted in professional services was also the result of international commercialization efforts. Interest Expense. Interest expense was $902,000$3.2 million and $51,000 decreases for the year ended December 31, 2012, compared to $723,0002015 for the year endedcommon stock warrants issued with the July 8, 2015 public offering and the Notes, respectively as our stock price decreased from $388.50 on July 8, 2015 and $178.50 on November 9, 2015 to $136.50 on December 31, 2011, an increase of $179,000, or 24.8%. Modifications to the loan agreement with Silicon Valley Bank (SVB) occurred in March 2011 and April 2012. The March 2011 loan modification reduced the interest rate from 11.00% to 6.25% with interest only payments through September 30, 2011. The principal balance was approximately $6.0 million at the time of the modification. The April 2012 loan modification increased the interest rate from 6.25% to 8.00% effective April 23, 2012 with interest only payments through March 31, 2013. The April 2012 loan modification resulted in the principal balance increasing from $4.7 million to $10.0 million.2015.
Liquidity and Capital Resources We have incurred losses since our inception in December 2002 and, as of December 31, 2013 we had experienced net losses during the development stage of $225.8 million. We have financed our operations to date principally through the sale of equity securities, debt financing and interest earned on investments. Through December 31, 2012, we had received net proceeds of $178.5 million from the sale of common stock and preferred stock, including $39.1 million from our initial public offering in November 2007 and $76.2 million from public, private placement and registered direct offerings from 2009 through 2012. In addition, through December 31, 2012 we had received $41.2 million in debt financing, $746,000 to finance equipment purchases and $40.4 million to finance working capital. We had also received approximately $6.5 million from the exercise of common stock warrants. On February 27, 2013, we closed a public offering, selling 13,770,000 shares of common stock, together with warrants to purchase approximately 5,508,000 shares of common stock at an aggregate price of $0.95 per share and corresponding warrant, for gross proceeds of $13.1 million before deducting offering expenses. As of December 31, 2013 we had also received gross proceeds of $11.0 million before deducting offering expenses, from draws on our “at-the-market” equity offering program (ATM) with Canaccord Genuity Inc., and have received an additional $5.8 million in gross proceeds under the ATM and $2.0 million in proceeds from the exercise of common stock warrants subsequent to December 31, 2013 through March 27, 2014.
As of December 31, 2013,2016, we had $23.3$3.3 million in cash and cash equivalents. Of this amount $16.6 million was investedbank deposits. While we had no short-term money market funds or other investments at December 31, 2016, we periodically invest in short-term money market funds that are not considered to be bank deposits and are not insured or guaranteed by the Federal Deposit Insurance Company or other government agency. These money market funds seek to preserve the value of the investment at $1.00 per share; however, it is possible to lose money investing in these funds. CashPeriodically, we invest cash in excess of immediate requirements is invested in accordance with our investment policy, primarily with a view to liquidity and capital preservation. At times, such deposits may be in excess of insured limits. We have not experienced any losses on our deposits of cash and cash equivalents. We believe thathave financed our operations to date principally through the sale of equity securities, debt financing and interest earned on investments. As of December 31, 2016, we had $3.3 million of cash and cash equivalents balanceto fund its operations into early 2017. On January 23, 2017, we received $19.0 million in gross proceeds, prior to deducting offering expenses of $23.3approximately $2.5 million, asat the closing of an underwritten public offering of units in order to fund our future operations (see Note 18, “Subsequent Events,” to the Consolidated Financial Statements on Form 10-K for the Year Ended December 31, 2013,2016). The following financing transactions occurred in addition2015, 2016 and early 2017 to $5.8 million and $2.0 million of gross proceeds received fromfund the sale of common stock underCompany’s operations: Early 2017 (see Note 18, “Subsequent Events,” to the ATM (see discussion below) and fromConsolidated Financial Statements on Form 10-K for the exercise of common stock warrants, respectively, subsequent toYear Ended December 31, 2013 through March 27, 2014,2016) | · | | On January 23, 2017, the Company closed an underwritten public offering consisting of units of common stock, convertible preferred stock and warrants to purchase common stock. Gross proceeds of the offering were $19.0 million, prior to deducting underwriting discounts and commissions and offering expenses of approximately $2.5 million. |
| · | | Between January 1, 2017 and March 6, 2017, common stock warrants for 559,256 shares of common stock were exercised by warrant holders with proceeds to the Company of $3.1 million |
2015 and any interest income we earn2016 | · | | On July 8, 2015, we closed a public offering of units consisting of common stock and the Series A Warrants. Gross proceeds of the offering were $16.0 million, prior to deducting offering expenses of approximately $2.5 million. |
| · | | On November 4, 2015, we entered into a securities purchase agreement (the Purchase Agreement) with institutional investors to issue up to $25.0 million of senior amortizing convertible notes (the Notes) and Note Warrants, in three separate closings, $18.75 million of which were issued. $1.5 million of the Notes was funded at the first closing on November 9, 2015 (the First Closing). $11.0 million of the Notes was funded at the second closing on January 11, 2016 (the Second Closing) and after entering into an amendment to the Purchase Agreement on May 2, 2016 (the First Amendment) that divided the scheduled third closing into two separate closings, $6.25 million was funded at the third closing on May 2, 2016 (the Third Closing). Pursuant to a second amendment to the Purchase Agreement entered into on July 14, 2016 (the Second Amendment), a deadline of December 30, 2016 was set for the final closing. As the final closing did not occur prior to December 30, 2016, the remaining $6.25 million of Notes was not funded. |
The Company’s anticipated operations include plans to expand the controlled commercial launch of vBloc Therapy, delivered via the vBloc System. The Company believes that it has the flexibility to manage the growth of its expenditures and operations depending on these balances,the amount of available cash flows. However, the Company will be sufficient to meet our anticipated cash requirements (including scheduled or potentially accelerated debt obligations) into 2015, assuming we do not receive any additional funds. In order to fund on-going operating cash requirements beyond that point or to further accelerate and execute our business plan, including commercialization of the Maestro Rechargeable System, we willultimately need to raiseachieve sufficient revenues from product sales and/or obtain additional funds. See further discussion in the below section titled “Operating Capital and Capital Expenditure Requirements.”debt or equity financing to support its operations. Sales Agreement—June 2014 On April 16, 2012,June 13, 2014, we entered into a Loan and Security Agreement (the Loan Agreement) with SVB pursuant to which SVB agreed to make term loans in an aggregate principal amount of up to $20.0 million ($10.0 million of which is not available as we did not meet the predefined primary efficacy measures of the ReCharge trial and did not meet certain financial objectives for 2012), on the terms and conditions set forth in the Loan Agreement. Pursuant to the Loan Agreement, a term loan was funded in the aggregate principal amount of $10.0 million on April 23, 2012. The term loan required interest only payments monthly through March 31, 2013 followed by 30 equal payments of principal in the amount of $333,333 plus accrued interest beginning on April 1, 2013 and ending on September 1, 2015, payable monthly. Amounts borrowed under the Loan Agreement bear interest at a fixed annual rate equal to 8.0%. A 5.0% final payment fee will be due on September 1, 2015. We may voluntarily prepay the term loan in full, but not in part, and any voluntary or mandatory prepayment is subject to applicable prepayment premiums and will also include the final payment fee. We were required to comply with certain financial covenants that required us to generate certain minimum amounts of revenue from the sale of our Maestro System and to implant certain minimum numbers of Maestro Systems during cumulative quarterly measurement periods beginning with the period ended March 31, 2013 and ending with the period ending June 30, 2015. We did not meet the financial covenants for the period ended March 31, 2013 and therefore entered into a First Amendment (the First Amendment) to the Loan Agreement on May 9, 2013 pursuant to which we agreed to new financial covenants.
The First Amendment eliminated the financial covenants that required us to generate certain minimum amounts of revenue from the sale of our Maestro System and to implant certain minimum numbers of Maestro Systems during cumulative quarterly measurement periods beginning with the period ended March 31, 2013 and ending with the period ending June 30, 2015. It also removed SVB’s ability to require us to maintain a restricted cash balance of $7.5 million in an SVB account as a result of not meeting the predefined primary efficacy measures of the ReCharge trial.
The First Amendment added two new financial covenants, one of which requires us to receive cumulative aggregate proceeds of at least $5.0 million by November 15, 2013, which has been fulfilled through the use of the equity distributionsales agreement with Canaccord Genuity Inc. (see discussion below),Cowen and $10.0 million by April 15, 2014 from new capital transactions. The amount required will adjust up or down based on our actual cash position compared to our financial plan. The second financial covenant requires us to maintain a liquidity ratio (unrestricted cash divided by outstanding debt) of at least 1.25:1.00 until we receive FDA approval for the Maestro Rechargeable System at which point it will be reduced to 0.75:1.00. The First Amendment did not change the interest rate or the amortization structure. We will pay SVB a $187,000 success fee in the event we receive FDA approval for the Maestro Rechargeable System.
On July 31, 2013, we entered into an equity distribution agreement with Canaccord Genuity Inc. (Canaccord)Company, LLC (Cowen) to sell shares of our common stock having aggregate gross sales proceeds of up to $20.0$25.0 million, from time to time, through an ATMat-the market facility (ATM) under which CanaccordCowen will act as our sales agent.agent (the Cowen ATM). We will determine, at our sole discretion, the timing and number of shares to be sold under thisthe Cowen ATM. We will pay CanaccordCowen a commission for its services in acting as agent in the sale of common stock equal to 2.0%3.0% of the gross sales price per share of all shares sold through it as agent under the equity distributionsales agreement. As of December 31, 2013,2015, we hadhave sold 7,917,7555,256 shares under the Cowen ATM at a weighted-average selling price of $1.39$1,442.00 per share for gross proceeds of approximately $11.0$7.6 million before deducting offering expenses. SubsequentThere have been no shares sold under the Cowen ATM subsequent to December 31, 20132015 through March 27, 2014,6, 2017. We can direct Cowen to sell up to $17.4 million in common stock, provided we have sold an additional 2,506,222 sharesremain in compliance with all of the conditions under the ATMCowen ATM.
Sales Agreement—July 2015 On July 8, 2015, we closed a public offering, where we sold 30,476 units at a weighted-average sellingan aggregate price of $2.33$525.00 per shareunit, for gross proceeds of approximately $5.8$16.0 million, before deducting estimated offering expenses.expenses of approximately $1.4 million, of which $532,000 was assigned to the warrants issued with each unit sold. Each unit consisted of: (A)(i) one share of common stock or (ii) one pre-funded Series C warrant to purchase one share of common stock at an exercise price equal to $525.00 per share (Series C Warrant); and (B) one Series A warrant to purchase one share of common stock at an exercise price equal initially to $630.00 per share (Series A Warrant). Each purchaser of a unit could elect to receive a Series C Warrant in lieu of a share of common stock. No Series C Warrants were issued. The Series A Warrants are exercisable for a period of 42 months from the closing date of the public offering. The exercise price and number of shares of common stock issuable on the exercise of the Series A Warrants are subject to adjustment upon the issuance of any shares of common stock or securities convertible into shares of common stock below the then-existing exercise price, with certain exceptions, and in the event of any stock split, reverse stock split, recapitalization, reorganization or similar transaction. The holder of the Series A Warrant does not have the right to exercise any portion of the Series A Warrant if the holder, together with its affiliates, would, subject to certain limited exceptions, beneficially own in excess of 9.99% of our common stock outstanding immediately after the exercise or 4.99% as may be elected by the purchaser. The exercise price of the Series A Warrants was reduced to $168.00 per share on November 9, 2015 as a result of the issuance of the Notes and was further reduced to $67.90 per share on January 29, 2016, the 16th trading day following the First Reverse Stock Split, per the terms of the Series A Warrants and was further reduced at various times during the year ended December 31, 2016 as a result of installment and acceleration payments made on the Notes. As of December 31, 2016, the exercise price of the Series A Warrants was $2.80 per share and on January 20, 2017, the 16th trading day following the Second Reverse Stock Split, the exercise price of the Series A Warrants was adjusted to $2.18 per share, per the terms of the Series A Warrants. Senior Amortizing Convertible Notes On November 4, 2015, we entered into the Purchase Agreement to issue and sell to four institutional investors 7% senior amortizing convertible notes due 2017 in three separate closings. The Notes were initially convertible into shares of our common stock at a price equal to $304.50 per share with an aggregate principal amount of $25.0 million. Each Note was sold with a Note Warrant with an exercise price of $325.50 per share. We issued and sold Notes and Note Warrants for aggregate total proceeds of $12.5 million in the First Closing and Second Closing. Subsequent to the Second Closing, we entered into the First Amendment, which provided that the scheduled third closing would be divided into two separate closings, issued and sold Notes and Note Warrants for aggregate total proceeds of $6.25 million in the Third Closing. After the Third Closing, we entered into the Second Amendment, which set a deadline of December 30, 2016 for the final closing and provided the consent of the holders of the Notes to we reduce the conversion price of the Notes from time to time in order to incentivize the holders of the Notes to convert their Notes into shares of our common stock. As the final closing did not occur prior to the December 30, 2016 deadline, the remaining $6.25 million of Notes was not funded. Additionally, after entering into the Second Amendment, we reduced the conversion price of the Notes frequently in order to incentivize the holders of the Notes to convert all of the outstanding amounts outstanding under the Notes. As of December 31, 2016, all of the Notes were fully repaid. During the year ended December 31, 2016, $18.7 million of aggregate principal amount of Notes were converted by holders of the Notes into approximately 2,632,000 shares of the Company’s common stock. Description of the Notes The Notes were payable in monthly installments, accrued interest at a rate of 7.0% per annum from the date of issuance and had a maturity date 24 months after the First Closing. The Notes were repayable, at the Company’s election, in either cash or shares of our common stock at a discount to the then-current market price. The Notes were also convertible from time to time, at the election of the holders, into shares of our common stock at an initial conversion price of $304.50 per share. The conversion price was adjusted to $76.30 per share on January 29, 2016, the 16th trading day following the First Reverse Stock Split, per the terms of the Notes. The Notes also allowed us to reduce the conversion price from time-to-time, upon the holders’ consent, which was provided in the Second Amendment. The holder of each Note has the right to convert any portion of such Note unless the holder, together with its affiliates, beneficially owned in excess of 4.99% of the number of shares of our common stock outstanding immediately after giving effect to the conversion, as such percentage ownership was determined in accordance with the terms of the Notes. The holders were also able to increase or decrease such percentage to any other percentage, but in no event above 9.99%, provided that any increase of such percentage would not be effective until 61 days after providing us notice. The First Closing occurred on November 9, 2015. At the First Closing, we issued and sold Notes with an aggregate principal amount of $1.5 million, along with Note Warrants exercisable for 1,679 shares. During the quarter ended September 30, 2016, all remaining principal and interest amounts outstanding under the Notes issued at the First Closing were paid off via conversions to common shares. The Second Closing occurred on January 11, 2016 after we received approval of the offering by the Company’s stockholders and the satisfaction of certain customary closing conditions. At the Second Closing, we issued and sold Notes with an aggregate principal amount of $11.0 million, along with Note Warrants exercisable for 12,312 shares. The fair value of Note Warrants issued on January 11, 2016 was determined to be $515,000 using a Black-Scholes valuation model and the following assumptions: (1) dividend yield of 0%; (2) expected volatility of 85.90%; (3) weighted average risk –free interest rate of 1.58%; and (4) expected life of 5.0 years. During the year and quarter ended December 31, 2016, all remaining principal and interest amounts outstanding under Notes issued at the Second Closing were paid off via conversions to common shares. The Third Closing occurred on May 2, 2016 after we entered into the First Amendment and satisfied certain closing conditions. At the Third Closing, we issued and sold Notes with an aggregate principal amount of $6.25 million, along with Note Warrants exercisable for 6,995 shares. The fair value of the Note Warrants issued on May 2, 2016 was determined to be $150,195 using a Black-Scholes valuation model and the following assumptions: (1) dividend yield of 0%; (2) expected volatility of 89.28%; (3) weighted average risk –free interest rate of 1.32%; and (4) expected life of 5.0 years. During the quarter and year ended December 31, 2016, all remaining principal and interest amounts outstanding under Notes issued at the Third Closing were paid off via conversions to common shares. The following table summarizes the installment amounts and additional conversions by the holders of the Notes through December 31, 2016: First Closing: | | | | | | | | | | | | | | | | | | | | | | | | Common | | | | Principal | | Interest | | Total | | Shares | | Installment amount at December 31, 2015 | | $ | 65,217 | | $ | 23,651 | | $ | 88,868 | | 814 | | Holder conversions during the quarter ended December 31, 2015 | | | 18,261 | | | 2,375 | | | 20,636 | | 189 | | Total installments and conversions, December 31, 2015 | | | 83,478 | | | 26,026 | | | 109,504 | | 1,003 | | Installment amount at February 29, 2016 | | | 65,217 | | | 23,681 | | | 88,898 | | 1,314 | | Installment amount at March 31, 2016 | | | 65,217 | | | 14,827 | | | 80,044 | | 1,271 | | Holder conversions during the quarter ended March 31, 2016 | | | 104,784 | | | 12,762 | | | 117,546 | | 1,524 | | Total installments and conversions, March 31, 2016 | | | 318,696 | | | 77,296 | | | 395,992 | | 5,112 | | Installment amount at April 30, 2016 | | | 65,217 | | | 13,853 | | | 79,070 | | 1,454 | | Installment amount at May 31, 2016 | | | 65,217 | | | 13,082 | | | 78,299 | | 2,121 | | Installment amount at June 30, 2016 | | | 54,217 | | | 11,275 | | | 65,492 | | 3,590 | | Holder conversions during the quarter ended June 30, 2016 | | | 1,627 | | | 174 | | | 1,801 | | 29 | | Total installments and conversions, June 30, 2016 | | | 504,974 | | | 115,680 | | | 620,654 | | 12,306 | | Installment amount at July 31, 2016 | | | 65,217 | | | 10,148 | | | 75,365 | | 5,521 | | Installment amount at August 31, 2016 | | | 46,957 | | | 5,830 | | | 52,787 | | 4,593 | | Holder conversions during the quarter ended September 30, 2016 | | | 882,852 | | | 78,634 | | | 961,486 | | 72,528 | | Total installments and conversions, September 30, 2016 and December 31, 2016 | | $ | 1,500,000 | | $ | 210,292 | | $ | 1,710,292 | | 94,948 | |
Second Closing: | | | | | | | | | | | | | | | | | | | | | | | | Common | | | | Principal | | | Interest | | | Total | | Shares | | | | | | | | | | | | | | | Installment amount at March 2, 2016 | | $ | 404,762 | | $ | 149,300 | | $ | 554,062 | | * | | Holder conversions during the quarter ended March 31, 2016 | | | 987,000 | | | 124,050 | | | 1,111,050 | | 14,974 | | Total installments and conversions, March 31, 2016 | | | 1,391,762 | | | 273,350 | | | 1,665,112 | | 14,974 | | Installment amount at April 29, 2016 | | | 404,762 | | | 149,497 | | | 554,259 | | 10,190 | | Installment amount at May 31, 2016 | | | 291,428 | | | 86,518 | | | 377,946 | | 10,238 | | Installment amount at June 30, 2016 | | | 404,762 | | | 82,913 | | | 487,675 | | 22,842 | | Holder conversions during the quarter ended June 30, 2016 | | | 25,373 | | | 2,995 | | | 28,368 | | 414 | | Total installments and conversions, June 30, 2016 | | | 2,518,087 | | | 595,273 | | | 3,113,360 | | 58,658 | | Installment amount at July 31, 2016 | | | 213,429 | | | 47,457 | | | 260,886 | | 19,113 | | Installment amount at August 31, 2016 | | | 631,429 | | | 116,511 | | | 747,940 | | 64,810 | | Installment amount at September 30, 2016 | | | 404,762 | | | 45,846 | | | 450,608 | | 51,698 | | Holder conversions during the quarter ended September 30, 2016 | | | 4,868,679 | | | 418,847 | | | 5,287,526 | | 418,253 | | Total installments and conversions, September 30, 2016 | | | 8,636,386 | | | 1,223,934 | | | 9,860,320 | | 612,532 | | Installment amount at Oct 31, 2016 | | | 340,000 | | | 24,738 | | | 364,738 | | 70,665 | | Installment amount at Nov 30, 2016 | | | 291,429 | | | 27,528 | | | 318,957 | | 81,952 | | Installment amount at December 31, 2016 | | | 156,867 | | | 11,425 | | | 168,292 | | 57,453 | | Holder conversions during the quarter ended December 31, 2016 | | | 1,575,318 | | | 122,624 | | | 1,697,942 | | 450,385 | | Total installments and conversions, December 31, 2016 | | $ | 11,000,000 | | $ | 1,410,249 | | $ | 12,410,249 | | 1,272,987 | |
Third Closing: | | | | | | | | | | | | | | | | | | | | | | | | Common | | | | | Principal | | | Interest | | | Total | | Shares | | | | | | | | | | | | | | | Installment amount at June 30, 2016 | | $ | 212,158 | | $ | 90,659 | | $ | 302,817 | | 16,600 | | Holder conversions during the quarter ended June 30, 2016 | | | — | | | — | | | — | | — | | Total installments and conversions, June 30, 2016 | | | 212,158 | | | 90,659 | | | 302,817 | | 16,600 | | Installment amount at July 31, 2016 | | | 147,368 | | | 32,374 | | | 179,742 | | 13,168 | | Cash Payment – July 31, 2016 installment | | | 42,105 | | | 6,107 | | | 48,212 | | * | | Installment amount at August 31, 2016 | | | 336,842 | | | 62,059 | | | 398,901 | | 34,684 | | Installment amount at September, 2016 | | | 263,158 | | | 41,822 | | | 304,980 | | 34,523 | | Holder conversions during the quarter ended September 30, 2016 | | | 1,915,698 | | | 175,092 | | | 2,090,790 | | 155,272 | | Total installments and conversions, September 30, 2016 | | | 2,917,329 | | | 408,113 | | | 3,325,442 | | 254,247 | | Installment amount at Oct 31, 2016 | | | 221,053 | | | 35,004 | | | 256,057 | | 48,192 | | Installment amount at Nov 30, 2016 | | | 221,053 | | | 31,259 | | | 252,312 | | 64,828 | | Installment amount at December 31, 2016 | | | 221,053 | | | 14,526 | | | 235,579 | | 81,872 | | Holder conversions during the quarter ended December 31, 2016 | | | 2,669,512 | | | 170,359 | | | 2,839,871 | | 816,707 | | Total installments and conversions, December 31, 2016 | | $ | 6,250,000 | | $ | 659,261 | | $ | 6,909,261 | | 1,265,846 | |
* Cash payments Description of the Note Warrants Each Note Warrant is exercisable immediately and for a period of 60 months from the date of the issuance of the Warrant. The Note Warrants entitle the holders of the Note Warrants to purchase, in aggregate, 27,982 shares of our common stock upon the completion of the Third Closing, subject to certain adjustments. The Note Warrants are initially exercisable at an exercise price equal to $325.50, subject to adjustment on the eighteen month anniversary of issuance, and certain other adjustments. The exercise price and number of shares of common stock issuable on the exercise of the Note Warrants is subject to adjustment upon the issuance of any shares of common stock or securities convertible into shares of common stock below the then-existing exercise price, with certain exceptions, and in the event of any stock split, reverse stock split, recapitalization, reorganization or similar transaction. The holder of each Note Warrant does not have the right to exercise any portion of such Note Warrant if the holder, together with its affiliates, beneficially owns in excess of 4.99% of the number of shares of the Company’s common stock outstanding immediately after giving effect to the exercise, as such percentage ownership is determined in accordance with the terms of the Note Warrants. However, any holder may increase or decrease such percentage to any other percentage, but in no event above 9.99%, provided that any increase of such percentage will not be effective until 61 days after providing us notice. The exercise price of the Note Warrants issued November 9, 2015 was reduced to $76.30 per share on January 29, 2016, the 16th trading day following the First Reverse Stock Split, per the terms of the Note Warrants. Per the terms of the Note Warrants, the exercise price of each of the Note Warrants issued January 11, 2016 and May 2, 2016 remained $325.50 until January 20, 2017, the 16th trading day following the Second Reverse Stock Split, at which point the exercise price of all of the Note Warrants was adjusted to $2.18 per share. All of the Note Warrants remain subject to adjustment on the eighteen month anniversary of issuance. Net Cash Used in Operating Activities Net cash used in operating activities was $18.4$20.6 million, $22.5$22.6 million and $19.9$19.4 million for the years ended December 31, 2013, 20122016, 2015 and 2011,2014, respectively. Net cash used in operating activities primarily reflects the net loss for those periods, which was partially offset byless noncash expenses for stock-based compensation, depreciation and amortization, provision for doubtful accounts, change in value of warrant liability, and partially offset by changes in operating assets and liabilities, including inventory which was recorded as an asset beginning in 2011 as we began receiving ARTG listings for components of the Maestro Rechargeable System from the Australian TGA in December 2011.liabilities.
Net Cash (Used in) Provided byUsed in Investing Activities Net cash used in investing activities was $216,000 for the year ended December 31, 2013, compared to net cash provided by investing activities of $1.0 million$14,000, $39,000 and $5.1 million$89,000 for the years ended December 31, 20122016, 2015 and 2011,2014, respectively. Net cash used in investing activities for the year ended December 31, 2013 is primarily related to the purchase of $416,000 in property and equipment offset by a decrease in restricted cash of $200,000 due to the expiration of the requirement in our lease agreement with Roseville Properties Management Company to maintain an irrevocable, unconditional, standby letter of credit until October 1, 2013. Net cash provided by investing activities for the year ended December 31, 2012 is primarily related to $1.0 million in maturities of short-term investments available for sale offset by the purchase of $76,000 in property and equipment. Net cash provided by investing activities for the year ended December 31, 2011 is primarily related to a $6.3 million decrease in the restricted cash balance as a result of an amendment to a the loan agreement with SVB and $4.0 million in maturities of short-term investments available for sale offset by the purchase of $5.0 million in short-term investments available for sale and $252,000 in property and equipment.
Net Cash Provided by Financing Activities Net cash provided by financing activities was $19.6$16.0 million, $15.4$19.0 million and $12.5$7.8 million for the years ended December 31, 2013, 20122016, 2015 and 2011,2014, respectively. For the year ended December 31, 2013,2016, net cash provided by financing activities was primarily the result of agross proceeds from the Second Closing and Third Closing of the Notes, which totaled $17.3 million, less cash principal payments on Notes of $447,000 and debt issuance costs of $750,000. For the year ended December 31, 2015, net cash provided by financing activities was primarily the result of gross proceeds of $16.0 million from the July 8, 2015 public offering, that resultedATM draws of $6.7 million and $1.5 million in gross proceeds of $13.1 million forfrom the issuance of common stock and common stock warrants and gross proceeds from ATM draws of $11.0 million,the Notes on November 9, 2015. These increases were offset by $1.4$1.7 million in financing costs, $477,000 of debt issuance costs and principal repayments of $3.0 million on our long-term debt. For the year ended December 31, 2012,2014, net cash provided by financing activities was primarily the result of $5.3 million in netgross proceeds from the initial term loan funded pursuant to the new loan agreement entered into on April 16, 2012 with SVB, netATM draws of $9.8 million and proceeds of $4.7 million from the April 16, 2012 registered direct offering and $6.1$2.2 million from the exercise of common stock warrants. These increases were partially offset by $285,000 in financing costs and $4.0 million in principal repayments of $753,000 on our long-term debt. For the year ended December 31, 2011, net cash provided by financing activities was primarily attributable to the completion of a public offering that resulted in gross proceeds of $14.5 million for the issuance of common stock and common stock warrants, offset by $1.2 million in financing costs and the repayment of $922,000 on our long-term debt.
Operating Capital and Capital Expenditure Requirements We have only generated revenue fromreceived FDA approval on January 14, 2015 for vBloc Therapy, delivered via the salevBloc System, and began a controlled commercial launch at select bariatric centers of productsexcellence in 2012 and did not have sales in 2013 as we continued to focus our resources on the U.S. regulatory approval process. We obtained European CE Mark approval for our Maestro Rechargeable System in 2011. In January 2012, the final Maestro Rechargeable System components were listed on the ARTG by the Australian TGA. We have entered into exclusive, multi-year agreements with Device Technologies Australia Pty Limited and Bader Sultan & Brothers Co. W.L.L., for commercialization and distribution of the Maestro ReChargeable System in Australia and the Gulf Coast Countries, including Saudi Arabia, Kuwait, Bahrain, Qatar and the United Arab Emirates, respectively.States. We continue to explore additional select international markets to commercialize the Maestro Rechargeable System, including Europe. In the United States, we completed enrollment and device implantation inhad our ReCharge pivotal trial for obesity in December 2011. The primary endpoints of efficacy and safety were evaluated at 12 months. As announced on February 7, 2013, the ReCharge trial met its primary safety endpoint, though it did not meet its predefined co-primary efficacy endpoints. The trial did however demonstrate in the ITT population (n=239) a clinically meaningful and statistically significant EWL of 24.4% (approximately 10% TBL) for VBLOC therapy-treated patients, with 52.5% of patients achieving at least 20% EWL. On December 3, 2013 we announced 18 month efficacy and safety results from the ReCharge trial showing that VBLOC therapy-treated patients were maintaining their weight loss, while the sham control group gained back over 40% of the weight loss seen at 12 months. The 18 month data also continued to show positive safety signals. See additional discussion regarding the 12 and 18 month ReCharge trial data in the “Clinical Development” section included in Item 1 of this Annual Report on Form 10-K. As a result of the positive safety and efficacy profile of VBLOC therapy, we used the data from the ReCharge trial to support a PMA application for the Maestro Rechargeable System, which we announced was submitted to the FDA in June 2013 and accepted for review and filing in July 2013. The FDA has scheduled an Advisory Panel meeting for June 17, 2014 to review our PMA application for approval of the Maestro System. If the FDA grants us approval, we anticipate we will be able to commercialize the Maestro Rechargeable System infirst commercial sales within the United States in late 2014.2015 and for the years ended December 31, 2015 and 2016, we recognized $292,000 and $787,000 in revenue, respectively. We anticipate that we will continue to incur substantial net losses for the next several years as we develop our products, prepare for the potential commercial launch ofcommercialize our Maestro RechargeablevBloc System, develop the corporate infrastructure required to sell our products, operate as a publicly-traded company and pursue additional applications for our technology platform. We believe thathave financed our operations to date principally through the sale of equity securities, debt financing and interest earned on investments. As of December 31, 2016, we had $3.3 million of cash and cash equivalents balanceto fund our anticipated operations into early 2017. On January 23, 2017, we received $19.0 million in gross proceeds, prior to deducting offering expenses of approximately $23.3$2.5 million, asat the closing of December 31, 2013, in addition to $5.8 million and $2.0 millionan underwritten public offering of gross proceeds received from the saleunits consisting of common stock, under the ATMconvertible preferred stock and from the exercisecommon stock warrants in order to fund our operations. Additionally, between January 1, 2017 and March 6, 2017, common stock warrants for 559,256 shares of common stock warrants, respectively, subsequentwere exercised by warrant holders with proceeds to the Company of $3.1 million (see also Note 18, “Subsequent Events,” to the Consolidated Financial Statements on Form 10-K for the Year Ended December 31, 2013 through March 27, 2014,2016). Our anticipated operations include plans that consider the controlled commercial launch of vBloc Therapy, delivered via the vBloc System. We believe that we have the flexibility to manage the growth of our expenditures and any interest incomeoperations depending on the amount of our cash flows However, we earn on these balances, will beultimately need to achieve sufficient to meet our anticipated cash requirements (including scheduled revenues from product sales and/or potentially acceleratedobtain additional debt obligations) into 2015, assuming we do not receive any additional funds. Inor equity financing in order to fund on-going operating cash requirements beyond that point or to further accelerate and executesupport our business plan, including commercialization of the Maestro Rechargeable System, we will need to raise additional funds. If our available cash and cash equivalents balances are insufficient to satisfy our liquidity requirements, we may seek additional funding through the ATM, sell additional equity or debt securities or enter into a credit facility.operations. Obtaining funds through the ATMwarrant holders’ exercise of outstanding common stock warrants or through the sale of additional equity and debt securities may result in dilution to our stockholders. If we raise additional funds through the issuance of debt securities, these securities could have rights senior to those of our common stock and could contain covenants that would restrict our operations. The sale of additional equity may require us to obtain approval from our stockholders to increase the number of shares of common stock we have authorized under our certificate of incorporation. We may require additional capital beyond our currently forecasted amounts. Any such required additional capital may not be available on reasonable terms, if at all. If we are unable to obtain additional financing, or the FDA does not approve the Maestro Rechargeable System for commercial use in the U.S., we may be required to reduce the scope of, delay, or eliminate some or all of, our planned research, development and commercialization activities, which could materially harm our business. In addition, if we raise additional funds through collaboration, licensing or other similar arrangements, it may be necessary to relinquish valuable rights to products or proprietary technologies, or grant licenses on terms that are not favorable. Our forecast of the period of time through which our financial resources will be adequate to support our operations, the costs to complete development of products and the cost to commercialize our products are forward-looking statements and involve risks and uncertainties, and actual results could vary materially and negatively as a result of a number of factors, including the factors discussed in Part I, Item 1A,Risk Factors, of thisour Annual Report on Form 10-K. We have based these estimates on assumptions that may prove to be wrong, and we could utilize our available capital resources sooner than we currently expect. Because of the numerous risks and uncertainties associated with the development of medical devices, such as our MaestrovBloc System, we are unable to estimate the exact amounts of capital outlays and operating expenditures necessary to complete the development of the products and successfully deliver a commercial product to the market. Our future capital requirements will depend on many factors, including, but not limited to, the following: | · | | the cost and timing of establishing sales, marketing and distribution capabilities; |
| · | | the cost of establishing clinical and commercial supplies of our vBloc System and any products that we may develop; |
| · | | the rate of market acceptance of our vBloc System and vBloc Therapy and any other product candidates; |
| · | | the cost of filing and prosecuting patent applications and defending and enforcing our patent and other intellectual property rights; |
| · | | the cost of defending, in litigation or otherwise, any claims that we infringe third-party patent or other intellectual property rights; |
| · | | the effect of competing products and market developments; |
| · | | the cost of explanting clinical devices; |
| · | | the terms and timing of any collaborative, licensing or other arrangements that we may establish; |
| · | | any revenue generated by sales of our vBloc System or our future products; |
| · | | the scope, rate of progress, results and cost of our clinical trials and other research and development activities; |
| · | | the cost and timing of obtaining any further required regulatory approvals; and |
| · | | the extent to which we invest in products and technologies, although we currently have no commitments or agreements relating to any of these types of transactions. |
Contractual Obligations On August 25, 2015, we entered into an amendment extending the term of our clinical trials and other research and development activities; the cost and timing of regulatory approvals;
the cost and timing of establishing sales, marketing and distribution capabilities;
the cost of any recalls or other field actions required either by us or by regulatory bodies in those countries in which we market our products;
the cost of establishing clinical and commercial supplies of our Maestro System and any products that we may develop;
the rate of market acceptance of our Maestro System and VBLOC therapy and any other product candidates;
the cost of filing and prosecuting patent applications and defending and enforcing our patent and other intellectual property rights;
the cost of defending, in litigation or otherwise, any claims that we infringe third-party patent or other intellectual property rights;
the effect of competing products and market developments;
the cost of explanting clinical devices;
the terms and timing of any collaborative, licensing or other arrangements that we may establish;
any revenue generated by sales of our Maestro System or our future products; and
the extentoperating lease for three years until September 30, 2018, with monthly base rent ranging from $18,925 to which we invest in products and technologies, although we currently have no commitments or agreements relating to any of these types of transactions.
Contractual Obligations
$20,345. The following table summarizes our contractual obligations as of December 31, 20132016 and the effect those obligations are expected to have on our financial condition and liquidity position in future periods: | | | | | | | | | | | | | | | | | | | | | | | | | | | | | Payments Due By Period | | | | Payments Due By Period | | | | | Less Than 1 | | | | | | More than | Contractual Obligations | | Total | | | Less Than 1
Year | | | 1-3 Years | | | 3-5 Years | | | More than
5 Years | | | Total | | Year | | 1-3 Years | | 3-5 Years | | 5 Years | Operating lease | | $ | 513,158 | | | $ | 291,369 | | | $ | 221,789 | | | $ | — | | | $ | — | | | $ | 420,852 | | $ | 237,749 | | $ | 183,103 | | $ | — | | $ | — | Long-term debt, including interest | | | 8,020,074 | | | | 4,418,889 | | | | 3,601,185 | | | | — | | | | — | | | | | | | | | | | | | | | | | | | | Total contractual cash obligations | | $ | 8,533,232 | | | $ | 4,710,258 | | | $ | 3,822,974 | | | $ | — | | | $ | — | | | $ | 420,852 | | $ | 237,749 | | $ | 183,103 | | $ | — | | $ | — | | | | | | | | | | | | | | | | | |
The table above reflects only payment obligations that are fixed and determinable based on our current agreements and does not reflect the potential accelerated debt payments in the event of a default.agreements. Our operating lease commitments relatecommitment relates to our corporate headquarters in St. Paul, Minnesota. The above table does not include the Notes due to the variability in timing and the option to settle the Notes through the issuance of shares. Off-balance-sheet Arrangements Since our inception, we have not engaged in any off-balance-sheet arrangements, including the use of structured finance, special purpose entities or variable interest entities as defined by rules enacted by the SEC and Financial Accounting Standards Board (FASB),FASB, and accordingly, no such arrangements are likely to have a current or future effect on our financial position, revenues or expenses, results of operations, liquidity, capital expenditures or capital resources. Recent Accounting Pronouncements In April 2015, FASB issued Simplifying the Presentation of Debt Issuance Costs, (Accounting Standards Update No. 2015-03 (ASU 2015-03)), which changes the presentation of debt issuance costs in the financial statements. Under ASU 2015-03, an entity presents such costs in the balance sheet as a direct deduction from the recognized debt liability rather than as an asset. Amortization of the costs is reported as interest expense. This guidance will be effective for interim and annual reporting periods beginning after December 15, 2015. We have evaluated the impact of adopting ASU 2015-03 and do not believe the new guidance will have a material effect on our financial position, results of operations or cash flows. In May 2014, FASB issued Revenue from Contracts with Customers, Topic 606 (Accounting Standards Update No. 2014-09 (ASU 2014-09)), which provides a framework for the recognition of revenue, with the objective that recognized revenues properly reflect amounts an entity is entitled to receive in exchange for goods and services. This guidance will be effective for interim and annual reporting periods beginning after December 15, 2017. We do not believe that the adoption of the new standard will have a material effect on our consolidated financial statements in that the accounting related to our current revenue-based business practices will not change under the new standard. In August 2014, FASB issued Disclosure of Uncertainties About an Entity’s Ability to Continue as a Going Concern, (Accounting Standards Update No. 2014-15 (ASU 2014-15)), which provides a framework for entities to evaluate going concern issues as well as potential related disclosures. This guidance became effective and the Company adopted it for the year ended December 31, 2016. See Note 3, Liquidity and Management’s Plans. In March 2016, FASB issued Improvements to Employee Share-Based Payment Accounting, (Accounting Standards Update No. 2016-09 (ASU 2016-09)), which is intended to simplify several aspects of the accounting for share-based payment transactions, including the income tax consequences, classification of awards as either equity or liabilities, the estimation of forfeitures, shares withheld for taxes and classification of shares withheld for taxes on the statement of cash flows. As part of the adoption of this guidance we have elected to account for forfeitures of share- based awards as they occur. The Company will adopt ASU 2016-09 as required on January 1, 2017 and the adoption will not have a material effect on its consolidated financial statements. Various other accounting standards and interpretations have been issued with 20132016 effective dates and effective dates subsequent to December 31, 2013.2016. We have evaluated the recently issued accounting pronouncements that are currently effective or will be effective in 20142016 and believe that none of them have had or will have a material effect on our financial position, results of operations or cash flows. ITEM 7A. | QUANTITATIVE AND QUALITATIVE DISCLOSURE ABOUT MARKET RISK |
ITEM 7A. QUANTITATIVE AND QUALITATIVE DISCLOSURE ABOUT MARKET RISKOur exposure to market risk is confined to our cash and cash equivalents. As of December 31, 2013,2016 we had approximately $23.3$3.3 million in cash and cash equivalents. The goals of our investment policy are preservation of capital, fulfillment of liquidity needs and fiduciary control of cash and investments. We also seek to maximize income from our investments without assuming significant risk. To achieve our goals, we may maintain a portfolio of cash equivalents and investments in a variety of securities of high credit quality. The securities in our investment portfolio, if any, are not leveraged, are classified as either available for sale or held-to-maturity and are, due to their very short-term nature, subject to minimal interest rate risk. We currently do not hedge interest rate exposure. Because of the short-term maturities of our cash equivalents, we do not believe that an increase in market rates would have any material negative impact on the valueinterest income recognized in our statement of our investment portfolio.operations. We have no investments denominated in foreign currencies and therefore our investments are not subject to foreign currency exchange risk. ITEM 8. | FINANCIAL STATEMENTS AND SUPPLEMENTARY DATA |
ITEM 8. FINANCIAL STATEMENTS AND SUPPLEMENTARY DATA Index to Financial Statements Report of Independent Registered Public Accounting Firm To the Board of Directors and Stockholders of EnteroMedics Inc. St. Paul, Minnesota We have audited the accompanying consolidated balance sheets of EnteroMedics Inc. and subsidiary (a development stage company) (the “Company”"Company") as of December 31, 20132016 and 20122015, and the related consolidated statements of operations, comprehensive loss, stockholders’stockholders' equity, (deficit), and cash flows for each of the three years in the period ended December 31, 2013 and for the period from December 19, 2002 (date of inception) to December 31, 2013.2016. These consolidated financial statements are the responsibility of the Company’sCompany's management. Our responsibility is to express an opinion on thesethe financial statements based on our audits. We conducted our audits in accordance with the standards of the Public Company Accounting Oversight Board (United States). Those standards require that we plan and perform the audit to obtain reasonable assurance about whether the financial statements are free of material misstatement. The Company is not required to have, nor were we engaged to perform, an audit of its internal control over financial reporting. Our audits included consideration of internal control over financial reporting as a basis for designing audit procedures that are appropriate in the circumstances, but not for the purpose of expressing an opinion on the effectiveness of the Company’sCompany's internal control over financial reporting. Accordingly, we express no such opinion. An audit also includes examining, on a test basis, evidence supporting the amounts and disclosures in the financial statements,statements. An audit also includes assessing the accounting principles used and significant estimates made by management, as well as evaluating the overall financial statement presentation. We believe that our audits provide a reasonable basis for our opinion. In our opinion, such consolidated financial statements present fairly, in all material respects, the financial position of the Company and its subsidiary as ofat December 31, 20132016 and 2012,2015, and the results of itstheir operations and itstheir cash flows for each of the three years in the period ended December 31, 2013, and for the period from December 19, 2002 (date of inception) to December 31, 2013,2016, in conformity with accounting principles generally accepted in the United States of America. | /s/ DELOITTE & TOUCHE LLP Minneapolis, Minnesota March 8, 2017 /s/ DELOITTE & TOUCHE LLP
| | Minneapolis, MN
March 27, 2014
|
ENTEROMEDICS INC. (A development stage company)
Consolidated Balance Sheets | | | | | | | | | | | | December 31, | | | | 2013 | | | 2012 | | | ASSETS | | | | | | | | | Current assets: | | | | | | | | | Cash and cash equivalents | | $ | 23,297,479 | | | $ | 22,308,781 | | Restricted cash | | | — | | | | 200,000 | | Accounts receivable | | | 17,742 | | | | 52,406 | | Inventory | | | 1,127,941 | | | | 1,271,207 | | Prepaid expenses and other current assets | | | 546,744 | | | | 571,654 | | | | | | | | | | | Total current assets | | | 24,989,906 | | | | 24,404,048 | | Property and equipment, net | | | 577,095 | | | | 609,672 | | Other assets | | | 820,767 | | | | 1,082,765 | | | | | | | | | | | Total assets | | $ | 26,387,768 | | | $ | 26,096,485 | | | | | | | | | | | | | | | LIABILITIES AND STOCKHOLDERS’ EQUITY | | | | | | | | | Current liabilities: | | | | | | | | | Current portion of notes payable | | $ | 4,000,000 | | | $ | 3,000,000 | | Accounts payable | | | 127,329 | | | | 340,555 | | Accrued expenses | | | 4,186,060 | | | | 3,673,609 | | Accrued interest payable | | | 526,672 | | | | 523,678 | | | | | | | | | | | Total current liabilities | | | 8,840,061 | | | | 7,537,842 | | Notes payable, less current portion (net of discounts of $131,670 and $316,028 at December 31, 2013 and 2012, respectively) | | | 2,868,330 | | | | 6,683,972 | | | | | | | | | | | Total liabilities | | | 11,708,391 | | | | 14,221,814 | | | | | | | | | | | Commitments and contingencies (note 14) | | | | | | | | | Stockholders’ equity: | | | | | | | | | Common stock, $0.01 par value; 125,000,000 shares authorized; 63,551,350 and 41,843,270 shares issued and outstanding at December 31, 2013 and 2012, respectively | | | 635,514 | | | | 418,433 | | Additional paid-in capital | | | 239,996,934 | | | | 211,628,650 | | Deficit accumulated during development stage | | | (225,953,071 | ) | | | (200,172,412 | ) | | | | | | | | | | Total stockholders’ equity | | | 14,679,377 | | | | 11,874,671 | | | | | | | | | | | Total liabilities and stockholders’ equity | | $ | 26,387,768 | | | $ | 26,096,485 | | | | | | | | | | |
See accompanying notes to consolidated financial statements.
ENTEROMEDICS INC.
(A development stage company)
Consolidated Statements of Operations
| | | | | | | | | | | | | | | | | | | | Years ended December 31, | | | Period from
December 19,
2002
(inception) to
December 31,
2013 | | | | | 2013 | | | 2012 | | | 2011 | | | Sales | | $ | — | | | $ | 311,493 | | | $ | — | | | $ | 311,493 | | Cost of goods sold | | | — | | | | 231,520 | | | | — | | | | 231,520 | | | | | | | | | | | | | | | | | | | Gross profit | | | — | | | | 79,973 | | | | — | | | | 79,973 | | | | | | | | | | | | | | | | | | | Operating expenses: | | | | | | | | | | | | | | | | | Research and development | | | 11,075,493 | | | | 10,668,044 | | | | 16,673,238 | | | | 138,525,111 | | Selling, general and administrative | | | 13,658,824 | | | | 11,960,893 | | | | 8,583,347 | | | | 73,788,687 | | | | | | | | | | | | | | | | | | | Total operating expenses | | | 24,734,317 | | | | 22,628,937 | | | | 25,256,585 | | | | 212,313,798 | | | | | | | | | | | | | | | | | | | Operating loss | | | (24,734,317 | ) | | | (22,548,964 | ) | | | (25,256,585 | ) | | | (212,233,825 | ) | | | | | | | | | | | | | | | | | | Other income (expense): | | | | | | | | | | | | | | | | | Interest income | | | 5,717 | | | | 9,877 | | | | 12,241 | | | | 4,051,857 | | Interest expense | | | (932,364 | ) | | | (901,835 | ) | | | (722,859 | ) | | | (13,396,969 | ) | Change in value of warrant liability | | | — | | | | — | | | | — | | | | (3,840,622 | ) | Other, net | | | (119,695 | ) | | | (19,181 | ) | | | (30,119 | ) | | | (402,544 | ) | | | | | | | | | | | | | | | | | | Net loss | | $ | (25,780,659 | ) | | $ | (23,460,103 | ) | | $ | (25,997,322 | ) | | $ | (225,822,103 | ) | | | | | | | | | | | | | | | | | | Net loss per share—basic and diluted | | $ | (0.47 | ) | | $ | (0.59 | ) | | $ | (0.86 | ) | | | | | | | | | | | | | | | | | | | | | | Shares used to compute basic and diluted net loss per share | | | 55,009,916 | | | | 39,536,500 | | | | 30,205,447 | | | | | | | | | | | | | | | | | | | | | | |
See accompanying notes to consolidated financial statements.
ENTEROMEDICS INC.
(A development stage company)
Consolidated Statements of Comprehensive Loss
| | | | | | | | | | | | | | | | | | | | Years ended December 31, | | | Period from
December 19,
2002
(inception) to
December 31,
2013 | | | | | 2013 | | | 2012 | | | 2011 | | | Net loss | | $ | (25,780,659 | ) | | $ | (23,460,103 | ) | | $ | (25,997,322 | ) | | $ | (225,822,103 | ) | Change in unrealized gain (loss) on available for sale investments | | | — | | | | (692 | ) | | | 692 | | | | — | | | | | | | | | | | | | | | | | | | Comprehensive loss | | $ | (25,780,659 | ) | | $ | (23,460,795 | ) | | $ | (25,996,630 | ) | | $ | (225,822,103 | ) | | | | | | | | | | | | | | | | | |
See accompanying notes to consolidated financial statements.
ENTEROMEDICS INC.
(A development stage company)
Consolidated Statements of Stockholders’ Equity (Deficit)
Period from December 19, 2002 (inception) to December 31, 2013
| | | | | | | | | | | | | | | | | | | | | | | | | | | | | | | | | | | | | | | | | | | | | | | | | | | | | | | | Series C
Convertible
Preferred Stock | | | Series B
Convertible
Preferred Stock | | | Series A
Convertible
Preferred Stock | | | Common Stock | | | Additional
Paid-in
Capital | | | Deferred
Compensation | | | Accumulated
Other
Comprehensive
Income | | | Deficit
Accumulated
During the
Development
Stage | | | Total
Stockholders’
Equity
(Deficit) | | | | | Shares | | | Amount | | | Shares | | | Amount | | | Shares | | | Amount | | | Shares | | | Amount | | | | | | | Common stock issued at inception of Alpha Medical, Inc. on December 19, 2002 at $0.54 per share for cash | | | — | | | $ | — | | | | — | | | $ | — | | | | — | | | $ | — | | | | 18,315 | | | $ | 183 | | | $ | 9,817 | | | $ | — | | | $ | — | | | $ | — | | | $ | 10,000 | | Common stock issued at inception of Beta Medical, Inc. on December 19, 2002 at $0.54 per share for cash | | | — | | | | — | | | | — | | | | — | | | | — | | | | — | | | | 18,315 | | | | 183 | | | | 9,817 | | | | — | | | | — | | | | — | | | | 10,000 | | Alpha Medical, Inc. Series A convertible preferred stock issued on December 31, 2002 at $54.60 per share for cash | | | — | | | | — | | | | — | | | | — | | | | 5,525 | | | | 55 | | | | — | | | | — | | | | 301,619 | | | | — | | | | — | | | | — | | | | 301,674 | | Beta Medical, Inc. Series A convertible preferred stock issued on December 31, 2002 at $54.60 per share for cash | | | — | | | | — | | | | — | | | | — | | | | 5,525 | | | | 55 | | | | — | | | | — | | | | 301,619 | | | | — | | | | — | | | | — | | | | 301,674 | | Net loss | | | — | | | | — | | | | — | | | | — | | | | — | | | | — | | | | — | | | | — | | | | — | | | | — | | | | — | | | | (603,348 | ) | | | (603,348 | ) | | | | | | | | | | | | | | | | | | | | | | | | | | | | | | | | | | | | | | | | | | | | | | | | | | | | | | Balance, December 31, 2002 | | | — | | | $ | — | | | | — | | | $ | — | | | | 11,050 | | | $ | 110 | | | | 36,630 | | | $ | 366 | | | $ | 622,872 | | | $ | — | | | $ | — | | | $ | (603,348 | ) | | $ | 20,000 | | | | | | | | | | | | | | | | | | | | | | | | | | | | | | | | | | | | | | | | | | | | | | | | | | | | | | | Alpha Medical, Inc. Series A convertible preferred stock issued on October 1, 2003 at $54.60 per share for cash | | | — | | | $ | — | | | | — | | | $ | — | | | | 6,410 | | | $ | 64 | | | | — | | | $ | — | | | $ | 349,936 | | | $ | — | | | $ | — | | | $ | — | | | $ | 350,000 | | Beta Medical, Inc. Series A convertible preferred stock issued on October 1, 2003 at $54.60 per share for cash | | | — | | | | — | | | | — | | | | — | | | | 15,568 | | | | 156 | | | | — | | | | — | | | | 849,844 | | | | — | | | | — | | | | — | | | | 850,000 | | Cancellation of Alpha Medical, Inc. Series A convertible preferred stock and common stock upon merger with Beta Medical, Inc. effective October 1, 2003 | | | — | | | | — | | | | — | | | | — | | | | (11,936 | ) | | | (119 | ) | | | (18,315 | ) | | | (183 | ) | | | (661,372 | ) | | | — | | | | — | | | | — | | | | (661,674 | ) | Issuance of Series A convertible preferred stock upon merger of Alpha Medical, Inc. and Beta Medical, Inc. effective October 1, 2003 | | | — | | | | — | | | | — | | | | — | | | | 10,989 | | | | 110 | | | | — | | | | — | | | | 661,564 | | | | — | | | | — | | | | — | | | | 661,674 | | Common stock issued in October 2003 at $0.54 per share for cash | | | — | | | | — | | | | — | | | | — | | | | — | | | | — | | | | 19,229 | | | | 192 | | | | 10,308 | | | | — | | | | — | | | | — | | | | 10,500 | | Warrants issued for the purchase of 3,919 shares of Series B convertible preferred stock for cash at $0.03 per share in connection with the November 13, 2003 convertible bridge notes | | | — | | | | — | | | | — | | | | — | | | | — | | | | — | | | | — | | | | — | | | | 107 | | | | — | | | | — | | | | — | | | | 107 | | Net loss | | | — | | | | — | | | | — | | | | — | | | | — | | | | — | | | | — | | | | — | | | | — | | | | — | | | | — | | | | (1,900,288 | ) | | | (1,900,288 | ) | | | | | | | | | | | | | | | | | | | | | | | | | | | | | | | | | | | | | | | | | | | | | | | | | | | | | | Balance, December 31, 2003 | | | — | | | $ | — | | | | — | | | $ | — | | | | 32,081 | | | $ | 321 | | | | 37,544 | | | $ | 375 | | | $ | 1,833,259 | | | $ | — | | | $ | — | | | $ | (2,503,636 | ) | | $ | (669,681 | ) | | | | | | | | | | | | | | | | | | | | | | | | | | | | | | | | | | | | | | | | | | | | | | | | | | | | | |
| | | | | | | | | December 31, | | December 31, | | | 2016 | | 2015 | ASSETS | | | | | | | Current assets: | | | | | | | Cash and cash equivalents | | $ | 3,310,787 | | $ | 7,927,240 | Accounts receivable (net of allowance for bad debts of $20,000 at December 31, 2016) | | | 143,692 | | | 57,928 | Inventory | | | 1,789,578 | | | 1,686,324 | Prepaid expenses and other current assets | | | 476,624 | | | 831,495 | Total current assets | | | 5,720,681 | | | 10,502,987 | Property and equipment, net | | | 200,720 | | | 326,296 | Other assets | | | 1,119,405 | | | 757,802 | Total assets | | $ | 7,040,806 | | $ | 11,587,085 | LIABILITIES AND STOCKHOLDERS’ EQUITY | | | | | | | Current liabilities: | | | | | | | Current portion of convertible notes payable | | $ | — | | $ | 717,391 | Accounts payable | | | 1,311,706 | | | 172,050 | Accrued expenses | | | 2,751,415 | | | 3,595,415 | Accrued interest payable | | | — | | | 1,172 | Total current liabilities | | | 4,063,121 | | | 4,486,028 | Convertible notes payable, less current portion (net of discounts of $149,340 at December 31, 2015) | | | — | | | 549,791 | Common stock warrant liability | | | 39,119 | | | 2,877,817 | Total liabilities | | | 4,102,240 | | | 7,913,636 | Commitments and contingencies (Note 16) | | | | | | | Stockholders’ equity: | | | | | | | Common stock, $0.01 par value; 300,000,000 and 13,333,333 shares authorized; 2,736,621 and 102,415 shares issued and outstanding at December 31, 2016 and 2015 respectively | | | 27,366 | | | 1,024 | Additional paid-in capital | | | 303,852,582 | | | 281,252,963 | Accumulated deficit | | | (300,941,382) | | | (277,580,538) | Total stockholders’ equity | | | 2,938,566 | | | 3,673,449 | Total liabilities and stockholders’ equity | | $ | 7,040,806 | | $ | 11,587,085 |
See accompanying notes to consolidated financial statements. ENTEROMEDICS INC. (A development stage company)
Consolidated Statements of Stockholders’ Equity (Deficit) (Continued)Operations Period from December 19, 2002 (inception) to December 31, 2013
| | | | | | | | | | | | | | | | | | | | | | | | | | | | | | | | | | | | | | | | | | | | | | | | | | | | | | | | Series C
Convertible
Preferred Stock | | | Series B
Convertible
Preferred Stock | | | Series A
Convertible
Preferred Stock | | | Common Stock | | | Additional
Paid-in
Capital | | | Deferred
Compensation | | | Accumulated
Other
Comprehensive
Income | | | Deficit
Accumulated
During the
Development
Stage | | | Total
Stockholders’
Equity
(Deficit) | | | | | Shares | | | Amount | | | Shares | | | Amount | | | Shares | | | Amount | | | Shares | | | Amount | | | | | | | Balance, December 31, 2003 | | | — | | | $ | — | | | | — | | | $ | — | | | | 32,081 | | | $ | 321 | | | | 37,544 | | | $ | 375 | | | $ | 1,833,259 | | | $ | — | | | $ | — | | | $ | (2,503,636 | ) | | $ | (669,681 | ) | Warrants issued for the purchase of 1,081 shares of Series B convertible preferred stock for cash at $0.03 per share in connection with the April 23, 2004 convertible bridge notes | | | — | | | | — | | | | — | | | | — | | | | — | | | | — | | | | — | | | | — | | | | 30 | | | | — | | | | — | | | | — | | | | 30 | | Exercise of 20,963 Series A convertible preferred stock warrants on April 23, 2004 for cash at $8.95 per share | | | — | | | | — | | | | — | | | | — | | | | 20,963 | | | | 209 | | | | — | | | | — | | | | 187,443 | | | | — | | | | — | | | | — | | | | 187,652 | | Warrants issued for the purchase of 733 shares of Series B convertible preferred stock for cash at $0.03 per share in connection with the June 30, 2004 convertible bridge notes | | | — | | | | — | | | | — | | | | — | | | | — | | | | — | | | | — | | | | — | | | | 20 | | | | — | | | | — | | | | — | | | | 20 | | Fair value of warrants related to convertible bridge notes | | | — | | | | — | | | | — | | | | — | | | | — | | | | — | | | | — | | | | — | | | | 153,722 | | | | — | | | | — | | | | — | | | | 153,722 | | Series B convertible preferred stock issued upon conversion of $1,564,843 of convertible bridge notes and $34,809 of accrued interest payable on July 30, 2004 at $23.66 per share | | | — | | | | — | | | | 67,615 | | | | 676 | | | | — | | | | — | | | | — | | | | — | | | | 1,598,976 | | | | — | | | | — | | | | — | | | | 1,599,652 | | Series B convertible preferred stock issued on July 30, 2004 for cash at $23.66 per share, net of financing costs of $94,776 | | | — | | | | — | | | | 319,128 | | | | 3,191 | | | | — | | | | — | | | | — | | | | — | | | | 7,452,034 | | | | — | | | | — | | | | — | | | | 7,455,225 | | Warrants issued for the purchase of 7,556 shares of Series B convertible preferred stock on December 1, 2004 valued at $6.45 per warrant for debt commitment | | | — | | | | — | | | | — | | | | — | | | | — | | | | — | | | | — | | | | — | | | | 48,720 | | | | — | | | | — | | | | — | | | | 48,720 | | Issuance of 3,819 common stock options to nonemployees in 2004 valued at $0.94 per option | | | — | | | | — | | | | — | | | | — | | | | — | | | | — | | | | — | | | | — | | | | 3,610 | | | | (3,610 | ) | | | — | | | | — | | | | — | | Amortization of deferred compensation | | | — | | | | — | | | | — | | | | — | | | | — | | | | — | | | | — | | | | — | | | | — | | | | 830 | | | | — | | | | — | | | | 830 | | Net loss | | | — | | | | — | | | | — | | | | — | | | | — | | | | — | | | | — | | | | — | | | | — | | | | — | | | | — | | | | (3,448,752 | ) | | | (3,448,752 | ) | | | | | | | | | | | | | | | | | | | | | | | | | | | | | | | | | | | | | | | | | | | | | | | | | | | | | | Balance, December 31, 2004 | | | — | | | $ | — | | | | 386,743 | | | $ | 3,867 | | | | 53,044 | | | $ | 530 | | | | 37,544 | | | $ | 375 | | | $ | 11,277,814 | | | $ | (2,780 | ) | | $ | — | | | $ | (5,952,388 | ) | | $ | 5,327,418 | | | | | | | | | | | | | | | | | | | | | | | | | | | | | | | | | | | | | | | | | | | | | | | | | | | | | | |
| | | | | | | | | | | | | Year Ended December 31, | | | | 2016 | | 2015 | | 2014 | | Sales | | $ | 786,660 | | $ | 292,000 | | $ | — | | Cost of goods sold | | | 431,476 | | | 125,047 | | | — | | Gross profit | | | 355,184 | | | 166,953 | | | — | | Operating expenses: | | | | | | | | | | | Selling, general and administrative | | | 17,981,525 | | | 19,892,424 | | | 14,561,656 | | Research and development | | | 5,169,286 | | | 8,141,323 | | | 11,031,619 | | Total operating expenses | | | 23,150,811 | | | 28,033,747 | | | 25,593,275 | | Operating loss | | | (22,795,627) | | | (27,866,794) | | | (25,593,275) | | Other income (expense): | | | | | | | | | | | Interest income | | | 5,837 | | | 1,819 | | | 3,331 | | Interest expense | | | (4,104,003) | | | (939,182) | | | (530,222) | | Change in value of warrant liability | | | 3,512,816 | | | 3,295,536 | | | — | | Other, net | | | 20,133 | | | 9,874 | | | (8,554) | | Net loss | | $ | (23,360,844) | | $ | (25,498,747) | | $ | (26,128,720) | | Net loss per share—basic and diluted | | $ | (37.53) | | $ | (298.97) | | $ | (404.25) | | Shares used to compute basic and diluted net loss per share | | | 622,431 | | | 85,290 | | | 64,635 | |
See accompanying notes to consolidated financial statements. ENTEROMEDICS INC. (A development stage company)
Consolidated Statements of Stockholders’ Equity (Deficit) (Continued) Period from December 19, 2002 (inception) to December 31, 2013
| | | | | | | | | | | | | | | | | | | | | | | | | | | | | | | | | | | | | | | | | | | | | | | | | | | | | | | | Series C
Convertible
Preferred Stock | | | Series B
Convertible
Preferred Stock | | | Series A
Convertible
Preferred Stock | | | Common Stock | | | Additional
Paid-in
Capital | | | Deferred
Compensation | | | Accumulated
Other
Comprehensive
Income | | | Deficit
Accumulated
During the
Development
Stage | | | Total
Stockholders’
Equity
(Deficit) | | | | | Shares | | | Amount | | | Shares | | | Amount | | | Shares | | | Amount | | | Shares | | | Amount | | | | | | | Balance, December 31, 2004 | | | — | | | $ | — | | | | 386,743 | | | $ | 3,867 | | | | 53,044 | | | $ | 530 | | | | 37,544 | | | $ | 375 | | | $ | 11,277,814 | | | $ | (2,780 | ) | | $ | — | | | $ | (5,952,388 | ) | | $ | 5,327,418 | | Series B convertible preferred stock issued on June 17, 2005 for cash at $23.66 per share, net of financing costs of $5,218 | | | — | | | | — | | | | 126,806 | | | | 1,268 | | | | — | | | | — | | | | — | | | | — | | | | 2,993,514 | | | | — | | | | — | | | | — | | | | 2,994,782 | | Warrants issued for the purchase of 11,624 shares of Series B convertible preferred stock in September 2005 valued at $6.42 per warrant for debt commitment and funding | | | — | | | | — | | | | — | | | | — | | | | — | | | | — | | | | — | | | | — | | | | 74,636 | | | | — | | | | — | | | | — | | | | 74,636 | | Warrants issued for the purchase of 28,389 shares of common stock on December 12, 2005 for cash at $0.54 per warrant | | | — | | | | — | | | | — | | | | — | | | | — | | | | — | | | | — | | | | — | | | | 15,500 | | | | — | | | | — | | | | — | | | | 15,500 | | Series B convertible preferred stock issued on December 12, 2005 at $23.66 per share, net of financing costs of $11,085 | | | — | | | | — | | | | 200,776 | | | | 2,008 | | | | — | | | | — | | | | — | | | | — | | | | 4,736,908 | | | | — | | | | — | | | | — | | | | 4,738,916 | | Common stock issued to nonemployees in 2005 valued at $2.76 per share | | | — | | | | — | | | | — | | | | — | | | | — | | | | — | | | | 37,546 | | | | 376 | | | | 102,124 | | | | (102,500 | ) | | | — | | | | — | | | | — | | Issuance of 7,757 common stock options to nonemployees in 2005 valued at $0.94 per option | | | — | | | | — | | | | — | | | | — | | | | — | | | | — | | | | — | | | | — | | | | 7,288 | | | | (7,288 | ) | | | — | | | | — | | | | — | | Exercise of 4,927 common stock options in 2005 for cash at $2.76 per share | | | — | | | | — | | | | — | | | | — | | | | — | | | | — | | | | 4,927 | | | | 49 | | | | 13,401 | | | | — | | | | — | | | | — | | | | 13,450 | | Amortization of deferred compensation | | | — | | | | — | | | | — | | | | — | | | | — | | | | — | | | | — | | | | — | | | | — | | | | 25,041 | | | | — | | | | — | | | | 25,041 | | Net loss | | | — | | | | — | | | | — | | | | — | | | | — | | | | — | | | | — | | | | — | | | | — | | | | — | | | | — | | | | (11,215,191 | ) | | | (11,215,191 | ) | | | | | | | | | | | | | | | | | | | | | | | | | | | | | | | | | | | | | | | | | | | | | | | | | | | | | | Balance, December 31, 2005 | | | — | | | $ | — | | | | 714,325 | | | $ | 7,143 | | | | 53,044 | | | $ | 530 | | | | 80,017 | | | $ | 800 | | | $ | 19,221,185 | | | $ | (87,527 | ) | | $ | — | | | $ | (17,167,579 | ) | | $ | 1,974,552 | | | | | | | | | | | | | | | | | | | | | | | | | | | | | | | | | | | | | | | | | | | | | | | | | | | | | | |
| | | | | | | | | | | | | | | | | | | Additional | | | | | Total | | | Common Stock | | Paid-in | | Accumulated | | Stockholders’ | | | Shares | | Amount | | Capital | | Deficit | | Equity | Balance December 31, 2013 | | 60,599 | | $ | 606 | | $ | 240,631,842 | | $ | (225,953,071) | | $ | 14,679,377 | Net loss | | — | | | — | | | — | | | (26,128,720) | | | (26,128,720) | Employee stock-based compensation expense | | — | | | — | | | 6,138,384 | | | — | | | 6,138,384 | Nonemployee stock-based compensation expense | | — | | | — | | | 181,323 | | | — | | | 181,323 | Issuance of common stock through “at-the-market” equity offerings in 2014 for cash from $1,157.80 to $2,664.20 per share, net of financing costs of $284,698 | | 4,468 | | | 44 | | | 9,551,722 | | | — | | | 9,551,766 | Exercise of 1,265 warrants in 2014 for cash from $1,197.00 to $2,299.50 per share | | 1,265 | | | 13 | | | 2,242,252 | | | — | | | 2,242,265 | Balance December 31, 2014 | | 66,332 | | $ | 663 | | $ | 258,745,523 | | $ | (252,081,791) | | $ | 6,664,395 | Net loss | | — | | | — | | | — | | | (25,498,747) | | | (25,498,747) | Employee stock-based compensation expense | | — | | | — | | | 6,974,489 | | | — | | | 6,974,489 | Nonemployee stock-based compensation expense | | — | | | — | | | (34,712) | | | — | | | (34,712) | Issuance of common stock through “at-the-market” equity offerings in 2015 for cash from $1,162.00 to $1,589.00 per share, net of financing costs of $259,560 | | 4,604 | | | 46 | | | 6,392,326 | | | — | | | 6,392,372 | Issuance of common stock, net of warrants to purchase approximately 301,905 shares of common stock valued at $6,003,932, in registered public offering in July 2015 for cash at an aggregate price of $525.00 per unit, net of financing costs of $929,920 | | 30,476 | | | 305 | | | 9,065,843 | | | — | | | 9,066,148 | Issuance of common stock for payments made in shares on convertible notes payable | | 1,003 | | | 10 | | | 109,494 | | | — | | | 109,504 | Balance December 31, 2015 | | 102,415 | | | 1,024 | | | 281,252,963 | | | (277,580,538) | | | 3,673,449 | Net loss | | — | | | — | | | — | | | (23,360,844) | | | (23,360,844) | Employee stock-based compensation expense | | — | | | — | | | 2,327,402 | | | — | | | 2,327,402 | Nonemployee stock-based compensation expense | | — | | | — | | | 3,535 | | | — | | | 3,535 | Common stock financing costs | | — | | | — | | | (28,000) | | | — | | | (28,000) | Exercise of 1,428 warrants in 2016 for cash at $3.50 per share | | 1,428 | | | 14 | | | 4,986 | | | — | | | 5,000 | Issuance of common stock for payments made in shares on convertible notes payable | | 2,632,778 | | | 26,328 | | | 20,291,696 | | | — | | | 20,318,024 | Balance December 31, 2016 | | 2,736,621 | | $ | 27,366 | | $ | 303,852,582 | | $ | (300,941,382) | | $ | 2,938,566 |
See accompanying notes to consolidated financial statements. ENTEROMEDICS INC. (A development stage company)
Consolidated Statements of Stockholders’ Equity (Deficit) (Continued)Cash Flows Period from December 19, 2002 (inception) to December 31, 2013
| | | | | | | | | | | | | | | | | | | | | | | | | | | | | | | | | | | | | | | | | | | | | | | | | | | | | | | | Series C
Convertible
Preferred Stock | | | Series B
Convertible
Preferred Stock | | | Series A
Convertible
Preferred Stock | | | Common Stock | | | Additional
Paid-in
Capital | | | Deferred
Compensation | | | Accumulated
Other
Comprehensive
Income | | | Deficit
Accumulated
During the
Development
Stage | | | Total
Stockholders’
Equity
(Deficit) | | | | | Shares | | | Amount | | | Shares | | | Amount | | | Shares | | | Amount | | | Shares | | | Amount | | | | | | | Balance, December 31, 2005 | | | — | | | $ | — | | | | 714,325 | | | $ | 7,143 | | | | 53,044 | | | $ | 530 | | | | 80,017 | | | $ | 800 | | | $ | 19,221,185 | | | $ | (87,527 | ) | | $ | — | | | $ | (17,167,579 | ) | | $ | 1,974,552 | | Warrants issued for the purchase of 5,812 shares of Series B convertible preferred stock in March 2006 valued at $17.55 per warrant for debt funding | | | — | | | | — | | | | — | | | | — | | | | — | | | | — | | | | — | | | | — | | | | 102,022 | | | | — | | | | — | | | | — | | | | 102,022 | | Series C convertible preferred stock issued upon conversion of $5,250,003 of convertible bridge notes and $131,013 of accrued interest payable on July 6, 2006 at $48.56 per share | | | 110,820 | | | | 1,108 | | | | — | | | | — | | | | — | | | | — | | | | — | | | | — | | | | 5,379,908 | | | | — | | | | — | | | | — | | | | 5,381,016 | | Series C convertible preferred stock issued on July 6, 2006 for cash at $48.56 per share, net of financing costs of $2,222,342 | | | 820,190 | | | | 8,202 | | | | — | | | | — | | | | — | | | | — | | | | — | | | | — | | | | 37,594,459 | | | | — | | | | — | | | | — | | | | 37,602,661 | | Warrants issued for the purchase of 24,606 shares of Series C convertible preferred stock on July 6, 2006 valued at $29.89 per warrant for equity financing | | | — | | | | — | | | | — | | | | — | | | | — | | | | — | | | | — | | | | — | | | | 735,438 | | | | — | | | | — | | | | — | | | | 735,438 | | Series C convertible preferred stock issued on December 11, 2006 for cash at $48.56 per share | | | 20,595 | | | | 206 | | | | — | | | | — | | | | — | | | | — | | | | — | | | | — | | | | 999,794 | | | | — | | | | — | | | | — | | | | 1,000,000 | | Series C convertible preferred stock warrants reclassified to convertible preferred stock warrant liability on December 11, 2006 | | | — | | | | — | | | | — | | | | — | | | | — | | | | — | | | | — | | | | — | | | | (735,438 | ) | | | — | | | | — | | | | — | | | | (735,438 | ) | Common stock issued to nonemployees in 2006 valued at $2.76 per share | | | — | | | | — | | | | — | | | | — | | | | — | | | | — | | | | 1,648 | | | | 16 | | | | 4,484 | | | | (4,500 | ) | | | — | | | | — | | | | — | | Common stock issued to nonemployees in 2006 valued at $11.46 per share | | | — | | | | — | | | | — | | | | — | | | | — | | | | — | | | | 458 | | | | 5 | | | | 5,245 | | | | (5,250 | ) | | | — | | | | — | | | | — | | Employee stock-based compensation expense | | | — | | | | — | | | | — | | | | — | | | | — | | | | — | | | | — | | | | — | | | | 47,479 | | | | — | | | | — | | | | — | | | | 47,479 | | Nonemployee stock-based compensation expense | | | — | | | | — | | | | — | | | | — | | | | — | | | | — | | | | — | | | | — | | | | 86,125 | | | | — | | | | — | | | | — | | | | 86,125 | | Exercise of 14,504 common stock options in 2006 for cash at $2.76 per share | | | — | | | | — | | | | — | | | | — | | | | — | | | | — | | | | 14,504 | | | | 145 | | | | 39,451 | | | | — | | | | — | | | | — | | | | 39,596 | | Amortization of deferred compensation | | | — | | | | — | | | | — | | | | — | | | | — | | | | — | | | | — | | | | — | | | | — | | | | 30,798 | | | | — | | | | — | | | | 30,798 | | Net loss | | | — | | | | — | | | | — | | | | — | | | | — | | | | — | | | | — | | | | — | | | | — | | | | — | | | | — | | | | (17,690,477 | ) | | | (17,690,477 | ) | | | | | | | | | | | | | | | | | | | | | | | | | | | | | | | | | | | | | | | | | | | | | | | | | | | | | | Balance, December 31, 2006 | | | 951,605 | | | $ | 9,516 | | | | 714,325 | | | $ | 7,143 | | | | 53,044 | | | $ | 530 | | | | 96,627 | | | $ | 966 | | | $ | 63,480,152 | | | $ | (66,479 | ) | | $ | — | | | $ | (34,858,056 | ) | | $ | 28,573,772 | | | | | | | | | | | | | | | | | | | | | | | | | | | | | | | | | | | | | | | | | | | | | | | | | | | | | | |
| | | | | | | | | | | | | Year Ended December 31, | | | | 2016 | | 2015 | | 2014 | | Cash flows from operating activities: | | | | | | | | | | | Net loss | | $ | (23,360,844) | | $ | (25,498,747) | | $ | (26,128,720) | | Adjustments to reconcile net loss to net cash used in operating activities: | | | | | | | | | | | Depreciation and amortization | | | 139,576 | | | 188,606 | | | 188,904 | | Provision for doubtful accounts | | | 20,000 | | | | | | | | Loss on sale of equipment | | | — | | | 885 | | | — | | Stock-based compensation | | | 2,330,937 | | | 6,939,777 | | | 6,319,707 | | Amortization of commitment fees, debt issuance costs and original issue discount | | | 1,836,340 | | | 825,735 | | | 123,068 | | Change in value of warrant liability | | | (3,512,816) | | | (3,295,536) | | | — | | Change in operating assets and liabilities: | | | | | | | | | | | Accounts receivable | | | (105,625) | | | (55,116) | | | 14,930 | | Inventory | | | (103,254) | | | (705,805) | | | 147,422 | | Prepaid expenses and other current assets | | | 354,732 | | | (409,822) | | | 125,071 | | Other assets | | | (600,634) | | | 349,709 | | | (74,372) | | Accounts payable | | | 1,139,656 | | | (222,636) | | | 267,356 | | Accrued expenses | | | (891,060) | | | (235,351) | | | (355,294) | | Accrued interest payable | | | 2,097,199 | | | (487,739) | | | (11,735) | | Net cash used in operating activities | | | (20,655,793) | | | (22,606,040) | | | (19,383,663) | | Cash flows from investing activities: | | | | | | | | | | | Purchases of property and equipment | | | (14,000) | | | (38,915) | | | (88,680) | | Net cash used in investing activities | | | (14,000) | | | (38,915) | | | (88,680) | | Cash flows from financing activities: | | | | | | | | | | | Proceeds from warrants exercised | | | 5,000 | | | — | | | 2,242,265 | | Proceeds from sale of common stock and warrants for purchase of common stock | | | — | | | 22,651,932 | | | 9,836,464 | | Common stock financing costs | | | (28,000) | | | (1,721,794) | | | (284,698) | | Proceeds from convertible notes payable | | | 17,250,000 | | | 1,500,000 | | | — | | Repayments on convertible notes payable | | | (446,867) | | | — | | | — | | Repayments on notes payable | | | — | | | (3,000,000) | | | (4,000,000) | | Debt issuance costs | | | (726,793) | | | (477,110) | | | — | | Net cash provided by financing activities | | | 16,053,340 | | | 18,953,028 | | | 7,794,031 | | Net (decrease) increase in cash and cash equivalents | | | (4,616,453) | | | (3,691,927) | | | (11,678,312) | | Cash and cash equivalents: | | | | | | | | | | | Beginning of period | | | 7,927,240 | | | 11,619,167 | | | 23,297,479 | | End of period | | $ | 3,310,787 | | $ | 7,927,240 | | $ | 11,619,167 | | Supplemental disclosure: | | | | | | | | | | | Cash paid for interest | | $ | 155,407 | | $ | 601,185 | | $ | 418,889 | | Noncash investing and financing activities: | | | | | | | | | | | Conversion of convertible notes and interest payable | | $ | 20,318,024 | | $ | 109,504 | | | — | |
See accompanying notes to consolidated financial statements. ENTEROMEDICS INC.
(A development stage company)
Consolidated Statements of Stockholders’ Equity (Deficit) (Continued)
Period from December 19, 2002 (inception) to December 31, 2013
EnteroMedics Inc. | | | | | | | | | | | | | | | | | | | | | | | | | | | | | | | | | | | | | | | | | | | | | | | | | | | | | | | | Series C
Convertible
Preferred Stock | | | Series B
Convertible
Preferred Stock | | | Series A
Convertible
Preferred Stock | | | Common Stock | | | Additional
Paid-in
Capital | | | Deferred
Compensation | | | Accumulated
Other
Comprehensive
Income | | | Deficit
Accumulated
During the
Development
Stage | | | Total
Stockholders’
Equity
(Deficit) | | | | | Shares | | | Amount | | | Shares | | | Amount | | | Shares | | | Amount | | | Shares | | | Amount | | | | | | | Balance, December 31, 2006 | | | 951,605 | | | $ | 9,516 | | | | 714,325 | | | $ | 7,143 | | | | 53,044 | | | $ | 530 | | | | 96,627 | | | $ | 966 | | | $ | 63,480,152 | | | $ | (66,479 | ) | | $ | — | | | $ | (34,858,056 | ) | | $ | 28,573,772 | | Employee stock-based compensation expense | | | — | | | | — | | | | — | | | | — | | | | — | | | | — | | | | — | | | | — | | | | 883,310 | | | | — | | | | — | | | | — | | | | 883,310 | | Nonemployee stock-based compensation expense | | | — | | | | — | | | | — | | | | — | | | | — | | | | — | | | | — | | | | — | | | | 1,289,349 | | | | — | | | | — | | | | — | | | | 1,289,349 | | Warrants issued for the purchase of 11,327 shares of Series C convertible preferred stock in May 2007 valued at $48.56 per warrant for debt facility commitment | | | — | | | | — | | | | — | | | | — | | | | — | | | | — | | | | — | | | | — | | | | 550,212 | | | | — | | | | — | | | | — | | | | 550,212 | | Warrants issued for the purchase of 5,664 shares of Series C convertible preferred stock in May 2007 valued at $49.67 per warrant for debt funding | | | — | | | | — | | | | — | | | | — | | | | — | | | | — | | | | — | | | | — | | | | 281,321 | | | | — | | | | — | | | | — | | | | 281,321 | | Warrants issued for the purchase of 2,832 shares of Series C convertible preferred stock in August 2007 valued at $69.83 per warrant for debt funding | | | — | | | | — | | | | — | | | | — | | | | — | | | | — | | | | — | | | | — | | | | 197,731 | | | | — | | | | — | | | | — | | | | 197,731 | | Warrants issued for the purchase of 2,832 shares of Series C convertible preferred stock in October 2007 valued at $68.76 per warrant for debt funding | | | — | | | | — | | | | — | | | | — | | | | — | | | | — | | | | — | | | | — | | | | 194,716 | | | | — | | | | — | | | | — | | | | 194,716 | | Series C convertible preferred stock warrants reclassified from convertible preferred stock warrant liability | | | — | | | | — | | | | — | | | | — | | | | — | | | | — | | | | — | | | | — | | | | 1,090,345 | | | | — | | | | — | | | | — | | | | 1,090,345 | | Issuance of common stock in initial public offering (IPO) in November 2007 for cash at $48.00 per share, net of financing costs of $4,552,663 | | | — | | | | — | | | | — | | | | — | | | | — | | | | — | | | | 833,333 | | | | 8,333 | | | | 35,439,004 | | | | — | | | | — | | | | — | | | | 35,447,337 | | Conversion of preferred stock to common stock in November 2007 in connection with the IPO | | | (951,605 | ) | | | (9,516 | ) | | | (714,325 | ) | | | (7,143 | ) | | | (53,044 | ) | | | (530 | ) | | | 1,748,030 | | | | 17,480 | | | | (291 | ) | | | — | | | | — | | | | — | | | | — | | Reclassification of amounts due to shareholders for fractional shares upon reverse stock split | | | — | | | | — | | | | — | | | | — | | | | — | | | | — | | | | — | | | | — | | | | (355 | ) | | | — | | | | — | | | | — | | | | (355 | ) | Common stock issued to Mayo Foundation upon closing the IPO in November 2007 with a fair value of $48.30 per share | | | — | | | | — | | | | — | | | | — | | | | — | | | | — | | | | 34,341 | | | | 343 | | | | 1,658,311 | | | | — | | | | — | | | | — | | | | 1,658,654 | | Exercise of over-allotment option by underwriters in December 2007 in connection with the IPO for cash at $48.00 per share, net of financing costs of $274,315 | | | — | | | | — | | | | — | | | | — | | | | — | | | | — | | | | 81,642 | | | | 817 | | | | 3,643,660 | | | | — | | | | — | | | | — | | | | 3,644,477 | | Exercise of 5,854 common stock options in 2007 for cash at $3.60 per share | | | — | | | | — | | | | — | | | | — | | | | — | | | | — | | | | 5,854 | | | | 59 | | | | 21,128 | | | | — | | | | — | | | | — | | | | 21,187 | | Amortization of deferred compensation | | | — | | | | — | | | | — | | | | — | | | | — | | | | — | | | | — | | | | — | | | | — | | | | 24,812 | | | | — | | | | — | | | | 24,812 | | Net loss | | | — | | | | — | | | | — | | | | — | | | | — | | | | — | | | | — | | | | — | | | | — | | | | — | | | | — | | | | (28,575,348 | ) | | | (28,575,348 | ) | | | | | | | | | | | | | | | | | | | | | | | | | | | | | | | | | | | | | | | | | | | | | | | | | | | | | | Balance, December 31, 2007 | | | — | | | $ | — | | | | — | | | $ | — | | | | — | | | $ | — | | | | 2,799,827 | | | $ | 27,998 | | | $ | 108,728,593 | | | $ | (41,667 | ) | | $ | — | | | $ | (63,433,404 | ) | | $ | 45,281,520 | | | | | | | | | | | | | | | | | | | | | | | | | | | | | | | | | | | | | | | | | | | | | | | | | | | | | | |
See accompanying notes to consolidated financial statements.
ENTEROMEDICS INC.
(A development stage company)
Consolidated Statements of Stockholders’ Equity (Deficit) (Continued)
Period from December 19, 2002 (inception) to December 31, 2013
| | | | | | | | | | | | | | | | | | | | | | | | | | | | | | | | | | | | | | | | | | | | | | | | | | | | | | | | Series C
Convertible
Preferred Stock | | | Series B
Convertible
Preferred Stock | | | Series A
Convertible
Preferred Stock | | | Common Stock | | | Additional
Paid-in
Capital | | | Deferred
Compensation | | | Accumulated
Other
Comprehensive
Income | | | Deficit
Accumulated
During the
Development
Stage | | | Total
Stockholders’
Equity
(Deficit) | | | | | Shares | | | Amount | | | Shares | | | Amount | | | Shares | | | Amount | | | Shares | | | Amount | | | | | | | Balance, December 31, 2007 | | | — | | | $ | — | | | | — | | | $ | — | | | | — | | | $ | — | | | | 2,799,827 | | | $ | 27,998 | | | $ | 108,728,593 | | | $ | (41,667 | ) | | $ | — | | | $ | (63,433,404 | ) | | $ | 45,281,520 | | Net loss | | | — | | | | — | | | | — | | | | — | | | | — | | | | — | | | | — | | | | — | | | | — | | | | — | | | | — | | | | (37,874,028 | ) | | | (37,874,028 | ) | Change in unrealized gain (loss) on available for sale investments | | | — | | | | — | | | | — | | | | — | | | | — | | | | — | | | | — | | | | — | | | | — | | | | — | | | | 12,988 | | | | — | | | | 12,988 | | Employee stock-based compensation expense | | | — | | | | — | | | | — | | | | — | | | | — | | | | — | | | | — | | | | — | | | | 2,648,410 | | | | — | | | | — | | | | — | | | | 2,648,410 | | Nonemployee stock-based compensation expense | | | — | | | | — | | | | — | | | | — | | | | — | | | | — | | | | — | | | | — | | | | (147,855 | ) | | | — | | | | — | | | | — | | | | (147,855 | ) | Warrants issued for the purchase of 233,117 shares of common stock in November 2008 valued at $7.80 per warrant for debt funding | | | — | | | | — | | | | — | | | | — | | | | — | | | | — | | | | — | | | | — | | | | 1,398,702 | | | | — | | | | — | | | | — | | | | 1,398,702 | | Exercise of 16,829 common stock options in 2008 for cash from $2.76 to $11.46 per share | | | — | | | | — | | | | — | | | | — | | | | — | | | | — | | | | 16,829 | | | | 169 | | | | 65,238 | | | | — | | | | — | | | | — | | | | 65,407 | | Amortization of deferred compensation | | | — | | | | — | | | | — | | | | — | | | | — | | | | — | | | | — | | | | — | | | | — | | | | 20,000 | | | | — | | | | — | | | | 20,000 | | | | | | | | | | | | | | | | | | | | | | | | | | | | | | | | | | | | | | | | | | | | | | | | | | | | | | | Balance, December 31, 2008 | | | — | | | $ | — | | | | — | | | $ | — | | | | — | | | $ | — | | | | 2,816,656 | | | $ | 28,167 | | | $ | 112,693,088 | | | $ | (21,667 | ) | | $ | 12,988 | | | $ | (101,307,432 | ) | | $ | 11,405,144 | | | | | | | | | | | | | | | | | | | | | | | | | | | | | | | | | | | | | | | | | | | | | | | | | | | | | | |
See accompanying notes to consolidated financial statements.
ENTEROMEDICS INC.
(A development stage company)
Consolidated Statements of Stockholders’ Equity (Deficit) (Continued)
Period from December 19, 2002 (inception) to December 31, 2013
| | | | | | | | | | | | | | | | | | | | | | | | | | | | | | | | | | | | | | | | | | | | | | | | | | | | | | | | Series C
Convertible
Preferred Stock | | | Series B
Convertible
Preferred Stock | | | Series A
Convertible
Preferred Stock | | | Common Stock | | | Additional
Paid-in
Capital | | | Deferred
Compensation | | | Accumulated
Other
Comprehensive
Income | | | Deficit
Accumulated
During the
Development
Stage | | | Total
Stockholders’
Equity
(Deficit) | | | | | Shares | | | Amount | | | Shares | | | Amount | | | Shares | | | Amount | | | Shares | | | Amount | | | | | | | Balance, December 31, 2008 | | | — | | | $ | — | | | | — | | | $ | — | | | | — | | | $ | — | | | | 2,816,656 | | | $ | 28,167 | | | $ | 112,693,088 | | | $ | (21,667 | ) | | $ | 12,988 | | | $ | (101,307,432 | ) | | $ | 11,405,144 | | Net loss | | | — | | | | — | | | | — | | | | — | | | | — | | | | — | | | | — | | | | — | | | | — | | | | — | | | | — | | | | (31,929,200 | ) | | | (31,929,200 | ) | Change in unrealized gain (loss) on available for sale investments | | | — | | | | — | | | | — | | | | — | | | | — | | | | — | | | | — | | | | — | | | | — | | | | — | | | | (12,988 | ) | | | — | | | | (12,988 | ) | Employee stock-based compensation expense | | | — | | | | — | | | | — | | | | — | | | | — | | | | — | | | | — | | | | — | | | | 2,209,216 | | | | — | | | | — | | | | — | | | | 2,209,216 | | Nonemployee stock-based compensation expense | | | — | | | | — | | | | — | | | | — | | | | — | | | | — | | | | — | | | | — | | | | 210,075 | | | | — | | | | — | | | | — | | | | 210,075 | | Issuance of common stock and warrants to purchase approximately 1,092,533 shares or common stock in private investment public equity offering in February 2009 for cash at an aggregate price of $7.28 per share and corresponding warrant, net of financing costs of $806,499 | | | — | | | | — | | | | — | | | | — | | | | — | | | | — | | | | 2,185,066 | | | | 21,851 | | | | 15,068,002 | | | | — | | | | — | | | | — | | | | 15,089,853 | | Issuance of common stock in registered direct offering in October 2009 for cash at $4.80 per share, net of financing costs of $92,470 | | | — | | | | — | | | | — | | | | — | | | | — | | | | — | | | | 1,026,845 | | | | 10,268 | | | | 4,826,117 | | | | — | | | | — | | | | — | | | | 4,836,385 | | Common stock warrants reclassified to common stock warrant liability on January 1, 2009 | | | — | | | | — | | | | — | | | | — | | | | — | | | | — | | | | — | | | | — | | | | (1,398,702 | ) | | | — | | | | — | | | | (130,968 | ) | | | (1,529,670 | ) | Cashless exercise of 159,420 warrants with an exercise price of $6.90 per share in exchange for 125,470 shares of common stock in September 2009 | | | — | | | | — | | | | — | | | | — | | | | — | | | | — | | | | 125,470 | | | | 1,255 | | | | 4,748,871 | | | | — | | | | — | | | | — | | | | 4,750,126 | | Cashless exercise of 104,700 warrants with exercise prices ranging from $6.90 to $23.64 per share in exchange for 62,244 shares of common stock in October 2009 | | | — | | | | — | | | | — | | | | — | | | | — | | | | — | | | | 62,244 | | | | 622 | | | | 494,030 | | | | — | | | | — | | | | — | | | | 494,652 | | Exercise of 13,450 common stock options in 2009 for cash from $2.76 to $22.20 per share | | | — | | | | — | | | | — | | | | — | | | | — | | | | — | | | | 13,450 | | | | 134 | | | | 37,383 | | | | — | | | | — | | | | — | | | | 37,517 | | Amortization of deferred compensation | | | — | | | | — | | | | — | | | | — | | | | — | | | | — | | | | — | | | | — | | | | — | | | | 20,000 | | | | — | | | | — | | | | 20,000 | | | | | | | | | | | | | | | | | | | | | | | | | | | | | | | | | | | | | | | | | | | | | | | | | | | | | | | Balance, December 31, 2009 | | | — | | | $ | — | | | | — | | | $ | — | | | | — | | | $ | — | | | | 6,229,731 | | | $ | 62,297 | | | $ | 138,888,080 | | | $ | (1,667 | ) | | $ | — | | | $ | (133,367,600 | ) | | $ | 5,581,110 | | | | | | | | | | | | | | | | | | | | | | | | | | | | | | | | | | | | | | | | | | | | | | | | | | | | | | |
See accompanying notes to consolidated financial statements.
ENTEROMEDICS INC.
(A development stage company)
Consolidated Statements of Stockholders’ Equity (Deficit) (Continued)
Period from December 19, 2002 (inception) to December 31, 2013
| | | | | | | | | | | | | | | | | | | | | | | | | | | | | | | | | | | | | | | | | | | | | | | | | | | | | | | | Series C
Convertible
Preferred Stock | | | Series B
Convertible
Preferred Stock | | | Series A
Convertible
Preferred Stock | | | Common Stock | | | Additional
Paid-in
Capital | | | Deferred
Compensation | | | Accumulated
Other
Comprehensive
Income | | | Deficit
Accumulated
During the
Development
Stage | | | Total
Stockholders’
Equity
(Deficit) | | | | | Shares | | | Amount | | | Shares | | | Amount | | | Shares | | | Amount | | | Shares | | | Amount | | | | | | | Balance, December 31, 2009 | | | — | | | $ | — | | | | — | | | $ | — | | | | — | | | $ | — | | | | 6,229,731 | | | $ | 62,297 | | | $ | 138,888,080 | | | $ | (1,667 | ) | | $ | — | | | $ | (133,367,600 | ) | | $ | 5,581,110 | | Net loss | | | — | | | | — | | | | — | | | | — | | | | — | | | | — | | | | — | | | | — | | | | — | | | | — | | | | — | | | | (17,347,387 | ) | | | (17,347,387 | ) | Employee stock-based compensation expense | | | — | | | | — | | | | — | | | | — | | | | — | | | | — | | | | — | | | | — | | | | 2,529,355 | | | | — | | | | — | | | | — | | | | 2,529,355 | | Nonemployee stock-based compensation expense | | | — | | | | — | | | | — | | | | — | | | | — | | | | — | | | | — | | | | — | | | | 33,204 | | | | — | | | | — | | | | — | | | | 33,204 | | Issuance of common stock in registered direct offering in January 2010 for cash at $3.90 per share, net of financing costs of $339,547 | | | — | | | | — | | | | — | | | | — | | | | — | | | | — | | | | 1,239,717 | | | | 12,398 | | | | 4,482,949 | | | | — | | | | — | | | | — | | | | 4,495,347 | | Common stock warrants reclassified to equity from common stock warrant liability on May 18, 2010 | | | — | | | | — | | | | — | | | | — | | | | — | | | | — | | | | — | | | | — | | | | 312,751 | | | | — | | | | — | | | | — | | | | 312,751 | | Warrants issued for the purchase of 150,642 shares of common stock in July 2010 valued at $1.92 per share for debt modification | | | — | | | | — | | | | — | | | | — | | | | — | | | | — | | | | — | | | | — | | | | 289,257 | | | | — | | | | — | | | | — | | | | 289,257 | | Adjustment for fractional shares upon reverse stock split | | | — | | | | — | | | | — | | | | — | | | | — | | | | — | | | | 45 | | | | — | | | | — | | | | — | | | | — | | | | — | | | | — | | Issuance of Series A convertible preferred stock in September 2010 at $1.72 per share for cash, net of financing costs of $60,679 | | | — | | | | — | | | | — | | | | — | | | | 3,394,309 | | | | 33,943 | | | | — | | | | — | | | | 5,743,589 | | | | — | | | | — | | | | — | | | | 5,777,532 | | Warrants issued for the purchase of 3,394,309 shares of common stock in September 2010 for cash at $0.125 per warrant | | | — | | | | — | | | | — | | | | — | | | | — | | | | — | | | | — | | | | — | | | | 424,289 | | | | — | | | | — | | | | — | | | | 424,289 | | Issuance of common stock and warrants to purchase approximately 17,020,000 shares of common stock in public offering in December 2010 for cash at an aggregate price of $1.75 per share and corresponding warrant, net of financing costs of $2,198,865 | | | — | | | | — | | | | — | | | | — | | | | — | | | | — | | | | 17,020,000 | | | | 170,200 | | | | 27,415,935 | | | | — | | | | — | | | | — | | | | 27,586,135 | | Warrants issued for the purchase of 340,400 shares of common stock in December 2010 for $100 cash | | | — | | | | — | | | | — | | | | — | | | | — | | | | — | | | | — | | | | — | | | | 100 | | | | — | | | | — | | | | — | | | | 100 | | Conversion of Series A convertible preferred stock to common stock upon closing of the public offering in December 2010 | | | — | | | | — | | | | — | | | | — | | | | (3,394,309 | ) | | | (33,943 | ) | | | 3,394,309 | | | | 33,943 | | | | — | | | | — | | | | — | | | | — | | | | — | | Exercise of 8,586 common stock options in 2010 for cash at $2.76 per share | | | — | | | | — | | | | — | | | | — | | | | — | | | | — | | | | 8,586 | | | | 86 | | | | 23,611 | | | | — | | | | — | | | | — | | | | 23,697 | | Amortization of deferred compensation | | | — | | | | — | | | | — | | | | — | | | | — | | | | — | | | | — | | | | — | | | | — | | | | 1,667 | | | | — | | | | — | | | | 1,667 | | | | | | | | | | | | | | | | | | | | | | | | | | | | | | | | | | | | | | | | | | | | | | | | | | | | | | | Balance, December 31, 2010 | | | — | | | $ | — | | | | — | | | $ | — | | | | — | | | $ | — | | | | 27,892,388 | | | $ | 278,924 | | | $ | 180,143,120 | | | $ | — | | | $ | — | | | $ | (150,714,987 | ) | | $ | 29,707,057 | | | | | | | | | | | | | | | | | | | | | | | | | | | | | | | | | | | | | | | | | | | | | | | | | | | | | | |
See accompanying notes to consolidated financial statements.
ENTEROMEDICS INC.
(A development stage company)
Consolidated Statements of Stockholders’ Equity (Deficit) (Continued)
Period from December 19, 2002 (inception) to December 31, 2013
| | | | | | | | | | | | | | | | | | | | | | | | | | | | | | | | | | | | | | | | | | | | | | | | | | | | | | | | Series C
Convertible
Preferred Stock | | | Series B
Convertible
Preferred Stock | | | Series A
Convertible
Preferred Stock | | | Common Stock | | | Additional
Paid-in
Capital | | | Deferred
Compensation | | | Accumulated
Other
Comprehensive
Income | | | Deficit
Accumulated
During the
Development
Stage | | | Total
Stockholders’
Equity
(Deficit) | | | | | Shares | | | Amount | | | Shares | | | Amount | | | Shares | | | Amount | | | Shares | | | Amount | | | | | | | Balance, December 31, 2010 | | | — | | | $ | — | | | | — | | | $ | — | | | | — | | | $ | — | | | | 27,892,388 | | | $ | 278,924 | | | $ | 180,143,120 | | | $ | — | | | $ | — | | | $ | (150,714,987 | ) | | $ | 29,707,057 | | Net loss | | | — | | | | — | | | | — | | | | — | | | | — | | | | — | | | | — | | | | — | | | | — | | | | — | | | | — | | | | (25,997,322 | ) | | | (25,997,322 | ) | Change in unrealized gain (loss) on available for sale investments | | | — | | | | — | | | | — | | | | — | | | | — | | | | — | | | | — | | | | — | | | | — | | | | — | | | | 692 | | | | — | | | | 692 | | Employee stock-based compensation expense | | | — | | | | — | | | | — | | | | — | | | | — | | | | — | | | | — | | | | — | | | | 2,817,082 | | | | — | | | | — | | | | — | | | | 2,817,082 | | Nonemployee stock-based compensation expense | | | — | | | | — | | | | — | | | | — | | | | — | | | | — | | | | — | | | | — | | | | 75,614 | | | | — | | | | — | | | | — | | | | 75,614 | | Additional financing costs related to December 2010 public offering | | | — | | | | — | | | | — | | | | — | | | | — | | | | — | | | | — | | | | — | | | | (45,745 | ) | | | — | | | | — | | | | — | | | | (45,745 | ) | Exercise of 1,139 common stock options in 2011 for cash at $1.90 per share | | | — | | | | — | | | | — | | | | — | | | | — | | | | — | | | | 1,139 | | | | 11 | | | | 2,153 | | | | — | | | | — | | | | — | | | | 2,164 | | Exercise of 59,219 warrants in 2011 for cash at $2.19 per share | | | — | | | | — | | | | — | | | | — | | | | — | | | | — | | | | 59,219 | | | | 592 | | | | 129,097 | | | | — | | | | — | | | | — | | | | 129,689 | | Issuance of common stock and warrants to purchase approximately 1,760,000 shares of common stock in registered public offering in September 2011 for cash at an aggregate price of $1.65 per share and corresponding warrant, net of financing costs of $1,168,326 | | | — | | | | — | | | | — | | | | — | | | | — | | | | — | | | | 8,800,000 | | | | 88,000 | | | | 13,263,674 | | | | — | | | | — | | | | — | | | | 13,351,674 | | | | | | | | | | | | | | | | | | | | | | | | | | | | | | | | | | | | | | | | | | | | | | | | | | | | | | | Balance, December 31, 2011 | | | — | | | $ | — | | | | — | | | $ | — | | | | — | | | $ | — | | | | 36,752,746 | | | $ | 367,527 | | | $ | 196,384,995 | | | $ | — | | | $ | 692 | | | $ | (176,712,309 | ) | | $ | 20,040,905 | | | | | | | | | | | | | | | | | | | | | | | | | | | | | | | | | | | | | | | | | | | | | | | | | | | | | | |
See accompanying notes to consolidated financial statements.
ENTEROMEDICS INC.
(A development stage company)
Consolidated Statements of Stockholders’ Equity (Deficit) (Continued)
Period from December 19, 2002 (inception) to December 31, 2013
| | | | | | | | | | | | | | | | | | | | | | | | | | | | | | | | | | | | | | | | | | | | | | | | | | | | | | | | Series C
Convertible
Preferred Stock | | | Series B
Convertible
Preferred Stock | | | Series A
Convertible
Preferred Stock | | | Common Stock | | | Additional
Paid-in
Capital | | | Deferred
Compensation | | | Accumulated
Other
Comprehensive
Income | | | Deficit
Accumulated
During the
Development
Stage | | | Total
Stockholders’
Equity
(Deficit) | | | | | Shares | | | Amount | | | Shares | | | Amount | | | Shares | | | Amount | | | Shares | | | Amount | | | | | | | Balance, December 31, 2011 | | | — | | | $ | — | | | | — | | | $ | — | | | | — | | | $ | — | | | | 36,752,746 | | | $ | 367,527 | | | $ | 196,384,995 | | | $ | — | | | $ | 692 | | | $ | (176,712,309 | ) | | $ | 20,040,905 | | Net loss | | | — | | | | — | | | | — | | | | — | | | | — | | | | — | | | | — | | | | — | | | | — | | | | — | | | | — | | | | (23,460,103 | ) | | | (23,460,103 | ) | Change in unrealized gain (loss) on available for sale investments | | | — | | | | — | | | | — | | | | — | | | | — | | | | — | | | | — | | | | — | | | | — | | | | — | | | | (692 | ) | | | — | | | | (692 | ) | Employee stock-based compensation expense | | | — | | | | — | | | | — | | | | — | | | | — | | | | — | | | | — | | | | — | | | | 4,173,132 | | | | — | | | | — | | | | — | | | | 4,173,132 | | Nonemployee stock-based compensation expense | | | — | | | | — | | | | — | | | | — | | | | — | | | | — | | | | — | | | | — | | | | 52,190 | | | | — | | | | — | | | | — | | | | 52,190 | | Issuance of common stock in registered direct offering in April 2012 for cash at $2.22 per share, net of financing costs of $367,871 | | | — | | | | — | | | | — | | | | — | | | | — | | | | — | | | | 2,271,705 | | | | 22,717 | | | | 4,659,412 | | | | — | | | | — | | | | — | | | | 4,682,129 | | Warrants issued for the purchase of 106,746 shares of common stock in April 2012 valued at $2.22 per warrant for debt funding | | | — | | | | — | | | | — | | | | — �� | | | | — | | | | — | | | | — | | | | — | | | | 237,349 | | | | — | | | | — | | | | — | | | | 237,349 | | Exercise of 5,219 common stock options in 2012 for cash from $1.90 to $2.58 per share | | | — | | | | — | | | | — | | | | — | | | | — | | | | — | | | | 5,219 | | | | 53 | | | | 12,613 | | | | — | | | | — | | | | — | | | | 12,666 | | Exercise of 2,813,600 warrants in 2012 for cash from $1.90 to $2.19 per share | | | — | | | | — | | | | — | | | | — | | | | — | | | | — | | | | 2,813,600 | | | | 28,136 | | | | 6,108,959 | | | | — | | | | — | | | | — | | | | 6,137,095 | | | | | | | | | | | | | | | | | | | | | | | | | | | | | | | | | | | | | | | | | | | | | | | | | | | | | | | Balance, December 31, 2012 | | | — | | | $ | — | | | | — | | | $ | — | | | | — | | | $ | — | | | | 41,843,270 | | | $ | 418,433 | | | $ | 211,628,650 | | | $ | — | | | $ | — | | | $ | (200,172,412 | ) | | $ | 11,874,671 | | | | | | | | | | | | | | | | | | | | | | | | | | | | | | | | | | | | | | | | | | | | | | | | | | | | | | |
See accompanying notes to consolidated financial statements.
ENTEROMEDICS INC.
(A development stage company)
Consolidated Statements of Stockholders’ Equity (Deficit) (Continued)
Period from December 19, 2002 (inception) to December 31, 2013
| | | | | | | | | | | | | | | | | | | | | | | | | | | | | | | | | | | | | | | | | | | | | | | | | | | | | | | | Series C
Convertible
Preferred Stock | | | Series B
Convertible
Preferred Stock | | | Series A
Convertible
Preferred Stock | | | Common Stock | | | Additional
Paid-in
Capital | | | Deferred
Compensation | | | Accumulated
Other
Comprehensive
Income | | | Deficit
Accumulated
During the
Development
Stage | | | Total
Stockholders’
Equity
(Deficit) | | | | | Shares | | | Amount | | | Shares | | | Amount | | | Shares | | | Amount | | | Shares | | | Amount | | | | | | | Balance, December 31, 2012 | | | — | | | $ | — | | | | — | | | $ | — | | | | — | | | $ | — | | | | 41,843,270 | | | $ | 418,433 | | | $ | 211,628,650 | | | $ | — | | | $ | — | | | $ | (200,172,412 | ) | | $ | 11,874,671 | | Net loss | | | — | | | | — | | | | — | | | | — | | | | — | | | | — | | | | — | | | | — | | | | — | | | | — | | | | — | | | | (25,780,659 | ) | | | (25,780,659 | ) | Employee stock-based compensation expense | | | — | | | | — | | | | — | | | | — | | | | — | | | | — | | | | — | | | | — | | | | 5,788,249 | | | | — | | | | — | | | | — | | | | 5,788,249 | | Nonemployee stock-based compensation expense | | | — | | | | — | | | | — | | | | — | | | | — | | | | — | | | | — | | | | — | | | | 166,679 | | | | — | | | | — | | | | — | | | | 166,679 | | Issuance of common stock and warrants to purchase approximately 5,508,000 shares of common stock in registered public offering in February 2013 for cash at an aggregate price of $0.95 per share and corresponding warrant, net of financing costs of $1,066,200 | | | — | | | | — | | | | — | | | | — | | | | — | | | | — | | | | 13,770,000 | | | | 137,700 | | | | 11,877,600 | | | | — | | | | — | | | | — | | | | 12,015,300 | | Issuance of common stock through “at-the-market” equity offerings beginning in September 2013 for cash from $1.10 to $2.10 per share, net of financing costs of $381,981 | | | — | | | | — | | | | — | | | | — | | | | — | | | | — | | | | 7,917,755 | | | | 79,178 | | | | 10,507,939 | | | | — | | | | — | | | | — | | | | 10,587,117 | | Exercise of 20,325 warrants in 2013 for cash from $1.14 to $1.90 per share | | | — | | | | — | | | | — | | | | — | | | | — | | | | — | | | | 20,325 | | | | 203 | | | | 27,817 | | | | — | | | | — | | | | — | | | | 28,020 | | | | | | | | | | | | | | | | | | | | | | | | | | | | | | | | | | | | | | | | | | | | | | | | | | | | | | | Balance, December 31, 2013 | | | — | | | $ | — | | | | — | | | $ | — | | | | — | | | $ | — | | | | 63,551,350 | | | $ | 635,514 | | | $ | 239,996,934 | | | $ | — | | | $ | — | | | $ | (225,953,071 | ) | | $ | 14,679,377 | | | | | | | | | | | | | | | | | | | | | | | | | | | | | | | | | | | | | | | | | | | | | | | | | | | | | | |
See accompanying notes to consolidated financial statements.
ENTEROMEDICS INC.
(A development stage company)
Consolidated Statements of Cash Flows
| | | | | | | | | | | | | | | | | | | | Years ended December 31, | | | Period from
December 19,
2002
(inception) to
December 31,
2013 | | | | | 2013 | | | 2012 | | | 2011 | | | Cash flows from operating activities: | | | | | | | | | | | | | | | | | Net loss | | $ | (25,780,659 | ) | | $ | (23,460,103 | ) | | $ | (25,997,322 | ) | | $ | (225,822,103 | ) | Adjustments to reconcile net loss to net cash used in operating activities: | | | | | | | | | | | | | | | | | Depreciation | | | 174,629 | | | | 226,990 | | | | 303,972 | | | | 2,661,657 | | Loss on sale of equipment | | | — | | | | 767 | | | | 1,269 | | | | 74,894 | | Stock-based compensation | | | 5,954,928 | | | | 4,225,322 | | | | 2,892,696 | | | | 24,643,416 | | Amortization of commitment fees, debt issuance costs and original issue discount | | | 199,592 | | | | 207,310 | | | | 234,740 | | | | 4,293,525 | | Amortization of short-term investment premium or discount | | | — | | | | 4,719 | | | | 3,261 | | | | (300,071 | ) | Change in value of warrant liability | | | — | | | | — | | | | — | | | | 3,840,622 | | Other, net | | | 8,030 | | | | — | | | | — | | | | 8,030 | | Change in operating assets and liabilities: | | | | | | | | | | | | | | | | | Accounts receivable | | | 26,634 | | | | (52,406 | ) | | | — | | | | (25,772 | ) | Inventory | | | 143,266 | | | | (202,584 | ) | | | (1,068,623 | ) | | | (1,127,941 | ) | Prepaid expenses and other current assets | | | 24,910 | | | | 233,145 | | | | (368,261 | ) | | | (546,744 | ) | Other assets | | | 246,764 | | | | (813,063 | ) | | | (176,985 | ) | | | (803,632 | ) | Accounts payable | | | 60,732 | | | | (224,562 | ) | | | 367,491 | | | | 137,310 | | Accrued expenses | | | 512,451 | | | | (2,699,761 | ) | | | 3,834,999 | | | | 4,186,060 | | Accrued interest payable | | | 2,994 | | | | 74,857 | | | | 37,329 | | | | 692,494 | | | | | | | | | | | | | | | | | | | Net cash used in operating activities | | | (18,425,729 | ) | | | (22,479,369 | ) | | | (19,935,434 | ) | | | (188,088,255 | ) | | | | | | | | | | | | | | | | | | Cash flows from investing activities: | | | | | | | | | | | | | | | | | Decrease in restricted cash | | | 200,000 | | | | — | | | | 6,327,031 | | | | — | | Purchases of short-term investments available for sale | | | — | | | | — | | | | (5,007,980 | ) | | | (19,890,213 | ) | Maturities of short-term investments available for sale | | | — | | | | 1,000,000 | | | | 4,000,000 | | | | 19,854,414 | | Purchases of short-term investments held to maturity | | | — | | | | — | | | | — | | | | (22,414,130 | ) | Maturities of short-term investments held to maturity | | | — | | | | — | | | | — | | | | 22,750,000 | | Purchases of property and equipment | | | (416,010 | ) | | | (76,394 | ) | | | (252,274 | ) | | | (3,323,626 | ) | | | | | | | | | | | | | | | | | | Net cash (used in) provided by investing activities | | | (216,010 | ) | | | 923,606 | | | | 5,066,777 | | | | (3,023,555 | ) | | | | | | | | | | | | | | | | | | Cash flows from financing activities: | | | | | | | | | | | | | | | | | Proceeds from stock options exercised | | | — | | | | 12,666 | | | | 2,164 | | | | 215,684 | | Proceeds from warrants exercised | | | 28,020 | | | | 6,137,095 | | | | 129,689 | | | | 6,482,456 | | Proceeds from sale of common stock and warrants for purchase of common stock | | | 24,050,598 | | | | 5,050,000 | | | | 14,520,000 | | | | 143,455,037 | | Common stock financing costs | | | (1,448,181 | ) | | | (367,871 | ) | | | (1,214,071 | ) | | | (11,294,482 | ) | Payment to shareholders for fractional shares upon reverse stock split | | | — | | | | — | | | | — | | | | (355 | ) | Proceeds from sale of Series A, B and C convertible preferred stock | | | — | | | | — | | | | — | | | | 63,766,564 | | Series A, B and C convertible preferred stock financing costs | | | — | | | | — | | | | — | | | | (1,658,662 | ) | Proceeds from notes payable and convertible notes payable | | | — | �� | | | 5,347,807 | | | | — | | | | 47,993,774 | | Repayments on notes payable | | | (3,000,000 | ) | | | (752,841 | ) | | | (921,997 | ) | | | (34,178,928 | ) | Debt issuance costs | | | — | | | | (50,000 | ) | | | — | | | | (371,799 | ) | | | | | | | | | | | | | | | | | | Net cash provided by financing activities | | | 19,630,437 | | | | 15,376,856 | | | | 12,515,785 | | | | 214,409,289 | | | | | | | | | | | | | | | | | | | Net increase (decrease) in cash and cash equivalents | | | 988,698 | | | | (6,178,907 | ) | | | (2,352,872 | ) | | | 23,297,479 | | Cash and cash equivalents: | | | | | | | | | | | | | | | | | Beginning of period | | | 22,308,781 | | | | 28,487,688 | | | | 30,840,560 | | | | — | | | | | | | | | | | | | | | | | | | End of period | | $ | 23,297,479 | | | $ | 22,308,781 | | | $ | 28,487,688 | | | $ | 23,297,479 | | | | | | | | | | | | | | | | | | | Supplemental disclosure: | | | | | | | | | | | | | | | | | Interest paid | | $ | 729,778 | | | $ | 619,668 | | | $ | 450,751 | | | $ | 8,402,346 | | Noncash investing and financing activities: | | | | | | | | | | | | | | | | | Cancellation of Alpha Medical, Inc. Series A convertible preferred stock and common stock | | $ | — | | | $ | — | | | $ | — | | | $ | (661,674 | ) | Issuance of Beta Medical, Inc. Series A convertible preferred stock in exchange for Alpha Medical, Inc. Series A convertible preferred stock and common stock | | | — | | | | — | | | | — | | | | 661,674 | | Value of warrants issued with debt and for debt commitment | | | — | | | | 237,349 | | | | — | | | | 4,070,532 | | Value of warrants issued with sale of common and preferred stock offerings | | | — | | | | — | | | | — | | | | 1,684,832 | | Cashless exercise of warrants | | | — | | | | — | | | | — | | | | 5,244,778 | | Conversion of notes and interest payable to Series B and C convertible preferred shares | | | — | | | | — | | | | — | | | | 6,980,668 | | Options issued for deferred compensation | | | — | | | | — | | | | — | | | | 10,898 | | Common stock issued to Mayo Foundation and for deferred compensation | | | — | | | | — | | | | — | | | | 1,770,904 | | Reclassification of warrant liability | | | — | | | | — | | | | — | | | | 2,932,766 | | Conversion of convertible preferred stock to common stock | | | — | | | | — | | | | — | | | | 51,132 | |
See accompanying notes to consolidated financial statements.
EnteroMedics Inc.
(A development stage company)
Notes to Consolidated Financial Statements (1) | Formation and Business of the Company |
(1)Description of the Business; Risks and Uncertainties of the Business Description of Business EnteroMedics Inc. (EnteroMedics or the(the Company) is developingdevelops and sells implantable systems to treat obesity, metabolic diseases and other gastrointestinal disorders. The Company was incorporated in the state of Minnesota on December 19, 2002, originally as two separate legal entities, Alpha Medical, Inc. and Beta Medical, Inc., both of which were owned 100% by a common stockholder. Effective October 1, 2003, the two entities were combined and the combined entity changed its name to EnteroMedics Inc. The Company reincorporated in Delaware on July 22, 2004. The Company is in the development stage, as defined by the Accounting Standards Codification. Since inception the Company has devoted substantially all of its resources to recruiting personnel, developing its product technology, obtaining patents to protect its intellectual property, commercialization activities and raising capital and thus far has only derivedrecently commenced commercial operations in the United States deriving revenues from its primary business activity in 2012.2015. The Company is headquartered in St. Paul, Minnesota. EnteroMedics Europe Sárl (EnteroMedics Europe), a wholly owned subsidiary of the Company, was formed in January 2006. EnteroMedics Europe is a Swiss entity established as a means to conduct clinical trials in Switzerland. Upon establishment there were 20 shares of EnteroMedics Europe issued and outstanding with a par value of 1,000 Swiss Francs. EnteroMedics purchased 100% of the shares and then issued one share to a fiduciary agent. The one share is the property of EnteroMedics and is held by the fiduciary in a fiduciary capacity under terms of the Fiduciary Agreement. The functional currency of EnteroMedics Europe has been determined to be the U.S. Dollar. In November 2007,
During 2016, the Company completed its initial public offeringCompany’s board of directors and stockholders approved two reverse stock splits (collectively, the Reverse Stock Splits). Neither reverse stock split changed the par value of the Company’s common stock or the number of preferred shares authorized by the Company’s certificate of incorporation. The first reverse stock split was a 1-for-15 reverse split (the First Reverse Stock Split) of the Company’s outstanding common stock that became effective after trading on January 6, 2016. The First Reverse Stock Split also decreased the number of shares of common stock (IPO), issuingauthorized by the Company’s certificate of incorporation proportionately, and proportional adjustments were also made to the Company’s outstanding stock options and warrants and the number of shares authorized under the Company’s Amended and Restated 2003 Stock Incentive Plan . In connection with the First Reverse Stock Split, an amendment to the Company’s certificate of incorporation was also approved to increase the number of shares of the Company’s common stock authorized for issuance to 150 million shares, effective immediately after the First Reverse Stock Split on January 6, 2016. The second reverse stock split was a total1-for-70 reverse split (the Second Reverse Stock Split) of 914,975the Company’s outstanding common stock that became effective after trading on December 27, 2016pursuant to the Company’s Sixth Amended and Restated Certificate of Incorporation. In connection with the Second Reverse Stock Split, proportional adjustments were also made to the Company’s outstanding stock options and warrants. Additionally, in connection with the Second Reverse Stock Split, a second amendment was approved to increase the number of shares of the Company’s common stock authorized for net proceedsissuance to 300 million shares, effective after the Second Reverse Stock Split on December 27, 2016. All share and per-share amounts have been retroactively adjusted to reflect the Reverse Stock Splits for all periods presented. Risks and Uncertainties The Company is focused on the design and development of approximately $39.1 million after expensesmedical devices that use neuroblocking technology to treat obesity, metabolic diseases and underwriters’ discountsother gastrointestinal disorders and commissions,currently has approvals to commercially launch the vBloc System in the United States, the European Economic Area and other countries that recognize the European CE Mark. The Company has devoted substantially all of its resources to recruiting personnel, developing its product technology, obtaining patents to protect its intellectual property and raising capital, and has recently commenced commercial operations in the United States deriving revenues from its primary business activity in 2015 and 2016. The Company’s products require approval from the U.S. Food and Drug Administration (FDA) or corresponding foreign regulatory agencies prior to commercial sales. The Company received FDA approval on January 14, 2015 for vBloc Therapy, delivered via the vBloc System, and has begun a controlled commercial launch at select surgical centers in the United States. The vBloc System has also received CE Mark and was previously listed on the Australian Register of Therapeutic Goods (ARTG). The medical device industry is characterized by frequent and extensive litigation and administrative proceedings over patent and other intellectual property rights. Whether a product infringes a patent involves complex legal and factual issues, the determination of which is often difficult to predict, and the outcome may be uncertain until the court has entered final judgment and all appeals are exhausted. The Company’s competitors may assert that its products or the use of the Company’s products are covered by U.S. or foreign patents held by them. The Company’s activities are subject to significant risks and uncertainties, including the exercise of the underwriters’ over-allotment option. Since inception, EnteroMedics has incurred losses through December 31, 2013 totaling approximately $225.8 million and has not generated positive cash flows from operations. The Company expects such losses to continue into the foreseeable future as it continues to develop and commercialize its technologies. The Company may needability to obtain additional financing, and there can be no assurance that the Company will be successful in obtaining additional financing on favorable terms, or at all. If adequate funds are not available, the Company may have to further reduce its cost structure until financing is obtained and/or delay development or commercialization of products or license to third parties the rights to commercialize products or technologies that the Company would otherwise seek to commercialize. See Notes 7 and 8 for additional discussion of financing activities.
(2) | Summary of Significant Accounting Policies |
(2)Summary of Significant Accounting Policies Basis of Presentation The Company has prepared the accompanying consolidated financial statements in conformity with accounting principles generally accepted in the United States of America. The Company’s fiscal year ends on December 31.
Use of Estimates The preparation of financial statements in conformity with accounting principles generally accepted in the United States of America requires management to make estimates and assumptions that affect the amounts reported in the financial statements and accompanying notes. Actual results could differ from those estimates.
Principles of Consolidation The consolidated financial statements include the accounts of the Company and its wholly owned subsidiary. All intercompany transactions and accounts have been eliminated in consolidation. EnteroMedics Inc.
(A development stage company)
Notes to Consolidated Financial Statements (Continued)
Concentration of Credit Risk and Other Risks and Uncertainties Financial instruments that potentially subject the Company to significant concentrations of credit risk consist primarily of cash and cash equivalents. Cash and cash equivalents are primarily deposited in demand and money market accounts. At times, such deposits may be in excess of insured limits. Investments in money market funds are not considered to be bank deposits and are not insured or guaranteed by the federal deposit insurance company or other government agency. These money market funds seek to preserve the value of the investment at $1.00 per share; however, it is possible to lose money investing in these funds. The Company has not experienced any losses on its deposits of cash and cash equivalents. Most of the products developed by the Company will require approval from the U.S. Food and Drug Administration (FDA) or corresponding foreign regulatory agencies prior to commercial sales. There can be no assurance the Company’s products will receive the necessary approvals. If the Company is denied approval or approval is delayed, it will have a material adverse impact on the Company.
The medical device industry is characterized by frequent and extensive litigation and administrative proceedings over patent and other intellectual property rights. Whether a product infringes a patent involves complex legal and factual issues, the determination of which is often difficult to predict, and the outcome may be uncertain until the court has entered final judgment and all appeals are exhausted. The Company’s competitors may assert that its products or the use of the Company’s products are covered by U.S. or foreign patents held by them.
Fair Value of Financial Instruments Carrying amounts of certain of the Company’s financial instruments, including cash and cash equivalents, restricted cash, accounts receivable, prepaid expenses and other current assets, accounts payable and accrued liabilities approximate fair value due to their short maturities. The Company’s common stock warrants are required to be reported at fair value and the Company elected to report its senior amortizing convertible notes at fair value. The fair values of common stock warrants and investments in debt and equity securities, if any, are disclosed in Note 3.4. The fair value of the Company’s long-term debtsenior amortizing convertible notes is approximately $7.3 milliondisclosed in Notes 4 and 8. Common Stock Warrant Liability The common stock warrants that were issued in connection with the July 8, 2015 public offering (the Series A Warrants) and the common stock warrants issued in connection with the November 9, 2015, January 11, 2016 and May 2, 2016 senior amortizing convertible notes (the Note Warrants) are classified as of December 31, 2013 based on the present value of estimated future cash flows using a discount rate commensurate with borrowing rates available to the Company. If measured at fair valueliability in the consolidated financial statements, long-term debt (includingbalance sheets, as the current portion) would be classified as Level 2common stock warrants issued provide for certain anti-dilution protections in the event shares of common stock or securities convertible into shares of common stock are issued below the then-existing exercise price. The fair value hierarchy.of these common stock warrants is re-measured at each financial reporting period and immediately before exercise, with any changes in fair value being recognized as a component of other income (expense) in the consolidated statements of operations.
Cash and Cash Equivalents The Company considers highly liquid investments generally with maturities of 90 days or less when purchased to be cash equivalents. Cash equivalents are stated at cost, which approximates market value. The Company’s cash equivalents are primarily in money market funds and certificates of deposit. The Company deposits its cash and cash equivalents in high-quality credit institutions. Under terms of the Company’s notes payable agreements (see Note 7), in the event of default, the lender has the right to enforce account control agreements and restrict the Company’s access to their cash and investment accounts. Restricted Cash
The Company had $200,000 in a cash collateral money market account as of December 31, 2012. Pursuant to the Lease Agreement the Company entered into with Roseville Properties Management Company in July 2008, the Company was required to deliver to Roseville Properties an irrevocable, unconditional, standby letter
EnteroMedics Inc.
(A development stage company)
Notes to Consolidated Financial Statements (Continued)
of credit in the amount of $200,000 on the second anniversary of the commencement of lease payments. The irrevocable standby letter of credit was issued by Silicon Valley Bank, who required the Company to set up a restricted cash collateral money market account to fully secure the standby letter of credit. The fully secured standby letter of credit was maintained through October 1, 2013, per the terms of the lease agreement.
Short-Term Investments The Company considers all investments with maturities greater than three months and less than one year at the time of purchase as short-term investments and classifies them as either available for sale or held to maturity. The Company also considers certain investments with maturities greater than one year but which are also held for liquidity purposes and are available for sale as short-term investments. Available-for-sale securities are carried at fair value based on quoted market prices, with the unrealized gains and losses included in other comprehensive income within stockholders’ equity (deficit) in the consolidated balance sheets. Realized gains and losses and declines in value judged to be other than temporary on available-for-sale securities are included in interest and other income. Interest and dividends on securities classified as available for sale are included in interest income. The cost of securities sold is based on the specific identification method. Short-term investments in debt securities which the Company has the positive intent and ability to hold to maturity are reported at cost, adjusted for premiums and discounts that are recognized in interest income, using the interest method, over the period to maturity. Unrealized losses on held-to-maturity securities reflecting a decline in value determined to be other than temporary are charged to income.
Inventory The Company accounts for inventory at the lower of cost or market and records any long-term inventory as other assets in the consolidated balance sheets.
Property and Equipment, Net Property and equipment are stated at cost less accumulated depreciation and amortization. Depreciation of property and equipment is computed using the straight-line method over their estimated useful lives of five to seven years for furniture and equipment and three to seven years.five years for computer hardware and software. Leasehold improvements are amortized on a straight-line basis over the lesser of their useful life or the term of the lease. Upon retirement or sale, the cost and related accumulated depreciation or amortization are removed from the consolidated balance sheets and the resulting gain or loss is reflected in the consolidated statements of operations. Repairs and maintenance are expensed as incurred.
Impairment of Long-Lived Assets The Company evaluates its long-lived assets for impairment by comparison of the carrying amounts to future net undiscounted cash flows expected to be generated by such assets when events or changes in circumstances indicate the carrying amount of an asset may not be recoverable. Should an impairment exist, the impairment loss would be measured based on the excess carrying value of the asset over the asset’s fair value or estimates of future discounted cash flows. The Company has not identified any such impairment losses to date. EnteroMedics Inc.
(A development stage company)
Notes to Consolidated Financial Statements (Continued)
Income Taxes Income Taxes
Income taxes are accounted for under the asset and liability method. Deferred tax assets and liabilities are recognized for the future tax consequences attributable to differences between the financial statement carrying amounts of existing assets and liabilities and their respective tax bases and operating loss and tax credit carry-forwards. Deferred tax assets and liabilities are measured using enacted tax rates expected to apply to taxable income in the years in which those temporary differences are expected to be recovered or settled. The effect on deferred tax assets and liabilities of a change in tax rates is recognized in income in the period that includes the enactment date. A valuation allowance for deferred income tax assets is recorded when it is more likely than not that some portion or all of the deferred income tax assets will not be realized. The Company has provided a full valuation allowance against the gross deferred tax assets as of December 31, 20132016 and 20122015 (see Note 10)12). The Company’s policy is to classify interest and penalties related to income taxes as income tax expense in the consolidated statements of operations.
Medical Device Excise Tax On January 14, 2015, the Company received FDA approval for vBloc Therapy, delivered via the vBloc Rechargeable System, and starting in the second quarter of 2015 revenues were generated from sales in the United States. As a result, the Company is now required to pay a quarterly medical device tax under the Affordable Care Act, which imposes a 2.3% excise tax on the sale of certain medical devices by device manufactures, producers or importers (the Medical Device Tax). The Medical Device Tax was effective on sales of devices made after December 31, 2012. The Company records the Medical Device Tax as an operating expense in the consolidated statements of operations, which totaled $1,363 for 2015. A moratorium was placed on the Medical Device Tax for 2016 and 2017 and, consequently, the Company was not required to pay the Medical Device Tax in 2016. Comprehensive Loss Comprehensive loss is defined as the change in equity of a company during a period from transactions and other events and circumstances excluding transactions resulting from investment owners and distributions to owners. There was no difference from reported net loss for the year ended December 31, 2013. The difference from reported net loss for the years ended December 31, 20122016, 2015 and 2011 related entirely to changes in unrealized gains (losses) on available-for-sale investments.2014.
Revenue Recognition The Company recognizes revenue
Revenue is recognized when persuasive evidence of an arrangement exists, title or risk of loss has passed, the selling price is fixed or determinable and collection is reasonably assured. The Company sells products internationallyProducts are sold through direct sales or medical device distributors and recognizes revenue is recognized upon sale to thea bariatric center of excellence or a medical device distributor as these sales are considered to be final andwhen no right of return or price protection exists. Terms of sales to international distributors are generally EXW, reflecting that goods are shipped “ex works,” in which risk of loss is assumed by the distributor at the shipping point. The Company doesA provision for returns is recorded only if product sales provide for a right of return. No provision for returns was recorded for the years ended December 31, 2015 and December 31, 2016, as the product sales recorded did not provide for rights of return to customers on product sales and therefore does not record a provision for returns.return.
Research and Development Expenses Research and development expenses are charged to expense as incurred. Research and development expenses include, but are not limited to, product development, clinical trial expenses, including supplies, devices, explants and revisions, quality assurance, regulatory expenses, payroll and other personnel expenses, materials and consulting costs.
Patent Costs Costs associated with the submission of a patent application are expensed as incurred given the uncertainty of the patents resulting in probable future economic benefits to the Company. Patent-related legal expenses included in general and administrative costs were $296,575, $278,987$269,000, $200,000, and $271,105$338,000 for the years ended December 31, 2013, 20122016, 2015 and 2011, respectively, and $2,739,844 for the period from December 19, 2002 (inception) to December 31, 2013. Derivative Instruments
The Company accounts for outstanding warrants that are not indexed to the Company’s stock or warrants issued when the Company has insufficient authorized and unissued stock available to share settle the outstanding
EnteroMedics Inc.
(A development stage company)
Notes to Consolidated Financial Statements (Continued)
2014, respectively. warrants as derivative instruments, which require that the warrants be classified as a liability and measured at fair value with changes in fair value recognized currently in earnings and recorded separately in the consolidated statements
Effective January 1, 2009, the Company adopted new authoritative accounting guidance regarding the financial reporting for outstanding equity-linked financial instruments. As a result of this change in accounting guidance, the Company assessed any outstanding equity-linked financial instruments and concluded that warrants issued in November 2008 with a recorded value of $1.4 million on December 31, 2008 were to be reclassified from equity to a liability. The cumulative effect of the change in accounting principle on January 1, 2009 was a $130,968 increase to the deficit accumulated during development stage. See Note 7 for details.
Stock-Based Compensation Prior to January 1, 2006, the Company accounted for stock-based employee compensation using the intrinsic value method and recognized the expense over the option vesting period. The intrinsic value method is calculated as the difference, if any, between the fair value of the Company’s stock and the exercise price on the date of the grant. The Company also followed the minimum value disclosure provisions.
Effective January 1, 2006, the Company adopted the fair value method of accounting for share-based payments, which superseded the previous accounting method, and requires compensation expense to be recognized using a fair-value-based method for costs related to all share-based payments including stock options. Companies are required to estimate the fair value of share-based payment awards on the date of grant using an option-pricing model. The Company adopted the new provisions using the prospective transition method, which requires that for nonpublic entities that used the minimum value method for either pro forma or financial statement recognition purposes, to apply the new accounting provisions only to option grants or modifications to existing options that occur after the required effective date. For options granted prior to January 1, 2006, the Company applied the intrinsic value provisions on unvested awards. All options granted prior to January 1, 2006, have fully vested. All option grants valued after January 1, 2006 are expensed on a straight-line basis over the vesting period.
The fair value method is applied to all share-based payment awards issued to employees and where appropriate, nonemployees, unless another source of literature applies. When determining the measurement date of a nonemployee’s share-based payment award, the Company measures the stock options at fair value and remeasures such stock options to the current fair value until the performance date has been reached. All option grants are expensed on a straight-line basis over the vesting period.
Net Loss Per Share Basic net loss per share is computed by dividing net loss by the weighted-average number of common shares outstanding during the period. Diluted net loss per share is based on the weighted-average common shares outstanding during the period plus dilutive potential common shares calculated using the treasury stock method. Such potentially dilutive shares are excluded when the effect would be to reduce a net loss per share. The Company’s potential dilutive shares, which include outstanding common stock options and warrants, have not been included in the computation of diluted net loss per share for all periods as the result would be anti-dilutive. EnteroMedics Inc.
(A development stage company)
Notes to Consolidated Financial Statements (Continued)
The following table sets forth the computation of basic and diluted net loss per share for the years ended December 31, 2013, 20122016, 2015 and 2011:2014: | | | | | | | | | | | | | | | | | | | | Year Ended | | | | | Years ended
December 31, | | | December 31, | | | | | 2013 | | 2012 | | 2011 | | | 2016 | | 2015 | | 2014 | | Numerator: | | | | | | | | | | | | | | | | | Net loss | | $ | (25,780,659 | ) | | $ | (23,460,103 | ) | | $ | (25,997,322 | ) | | $ | (23,360,844) | | $ | (25,498,747) | | $ | (26,128,720) | | | | | | | | | | | | | Denominator for basic and diluted net loss per share: | | | | | | | | | | | | | | | | | Weighted-average common shares outstanding | | | 55,009,916 | | | | 39,536,500 | | | | 30,205,447 | | | | 622,431 | | | 85,290 | | | 64,635 | | | | | | | | | | | | | Net loss per share—basic and diluted | | $ | (0.47 | ) | | $ | (0.59 | ) | | $ | (0.86 | ) | | $ | (37.53) | | $ | (298.97) | | $ | (404.25) | | | | | | | | | | | | |
The following table sets forth the potential shares of common stock that are not included in the calculation of diluted net loss per share because to do so would be anti-dilutive as of the end of each period presented: | | | | | | | | | | | | | | | December 31, | | | December 31, | | | | 2013 | | | 2012 | | | 2011 | | | 2016 | | 2015 | | Stock options outstanding | | | 11,687,300 | | | | 7,835,533 | | | | 3,470,908 | | | 19,840 | | 21,935 | | Warrants to purchase common stock | | | 25,550,625 | | | | 21,216,447 | | | | 23,923,301 | | | 55,044 | | 54,875 | |
Recently Issued Accounting Standards In April 2015, the Financial Accounting Standards Board (FASB) issued Simplifying the Presentation of Debt Issuance Costs, (Accounting Standards Update No. 2015-03 (ASU 2015-03)), which changes the presentation of debt issuance costs in the financial statements. Under ASU 2015-03, an entity presents such costs in the balance sheet as a direct deduction from the recognized debt liability rather than as an asset. Amortization of the costs is reported as interest expense. This guidance was effective for interim and annual reporting periods beginning after December 15, 2015. The new guidance did not have a material effect on the Company’s financial position, results of operations or cash flows. In May 2014, FASB issued Revenue from Contracts with Customers, Topic 606 (Accounting Standards Update No. 2014-09 (ASU 2014-09)), which provides a framework for the recognition of revenue, with the objective that recognized revenues properly reflect amounts an entity is entitled to receive in exchange for goods and services. This guidance will be effective for interim and annual reporting periods beginning after December 15, 2017. The Company does not believe that the adoption of the new standard will have a material effect on its consolidated financial statements in that the accounting related to its current revenue-based business practices will not change under the new standard. In August 2014, FASB issued Disclosure of Uncertainties About an Entity’s Ability to Continue as a Going Concern, (Accounting Standards Update No. 2014-15 (ASU 2014-15)), which provides a framework for entities to evaluate going concern issues as well as potential related disclosures. This guidance became effective and the Company adopted it for the year ended December 31, 2016. See Note 3, Liquidity and Management’s Plans. In March 2016, FASB issued Improvements to Employee Share-Based Payment Accounting, (Accounting Standards Update No. 2016-09 (ASU 2016-09)), which is intended to simplify several aspects of the accounting for share-based payment transactions, including the income tax consequences, classification of awards as either equity or liabilities, the estimation of forfeitures, shares withheld for taxes and classification of shares withheld for taxes on the statement of cash flows. As part of the adoption of this guidance the Company has elected to account for forfeitures of share-based awards as they occur. The Company will adopt ASU 2016-09 as required on January 1, 2017 and the adoption will not have a material effect on its consolidated financial statements. Various other accounting standards and interpretations have been issued with 20132016 effective dates and effective dates subsequent to December 31, 2013.2016. The Company has evaluated the recently issued accounting pronouncements that are currently effective or will be effective in 20142016 and believe that none of them have had or will have a material effect on the Company’s financial position, results of operations or cash flows. (3)Liquidity and Management’s Plans The accompanying consolidated financial statements have been prepared assuming the Company will continue as a going concern. The Company has financed its operations to date principally through the sale of equity securities, debt financing and interest earned on investments. As of December 31, 2016, the Company had $3.3 million of cash and cash equivalents to fund its operations into early 2017. On January 23, 2017, the Company received $19.0 million in gross proceeds, prior to deducting offering expenses of approximately $2.5 million, at the closing of an underwritten public offering of units in order to fund its operations (see Note 18, Subsequent Events).: The following financing transactions occurred in 2015, 2016 and early 2017 to fund the Company’s operations: (3) | Short-term Investments· | | On July 8, 2015, the Company closed a public offering of units consisting of common stock and Fair Value Measurementsthe Series A Warrants. Gross proceeds of the offering were $16.0 million, prior to deducting offering expenses of approximately $1.4 million |
| · | | On November 4, 2015 the Company entered into a securities purchase agreement (the Purchase Agreement) with institutional investors to issue up to $25.0 million of senior amortizing convertible notes (the Notes) and Note Warrants, in three separate closings. $1.5 million of the Notes was funded at the first closing on November 9, 2015 (the First Closing). |
| · | | An additional $11.0 million of the Notes was funded at the second closing on January 11, 2016 (the Second Closing). |
| · | | An additional $6.25 million of the Notes was funded at the third closing on May 2, 2016 (the Third Closing). |
| · | | On January 23, 2017, the Company closed an underwritten public offering consisting of units of common stock, convertible preferred stock and warrants to purchase common stock. Gross proceeds of the offering were $19.0 million, prior to deducting underwriting discounts and commissions and offering expenses of approximately $2.5 million (see Note18, Subsequent Events). |
| · | | Between January 1, 2017 and March 6, 2017, common stock warrants for 559,256 shares of common stock were exercised by warrant holders with proceeds to the Company of $3.1 million (see Note 18, Subsequent Events). |
The Company’s anticipated operations include plans to expand the controlled commercial launch of vBloc Therapy, delivered via the vBloc System. The Company believes that it has the flexibility to manage the growth of its expenditures and operations depending on the amount of available cash flows. Additionally, the Company has evaluated its projected cash flows through March 2018 using the guidance of ASU 2014-15, Disclosure of Uncertainties About an Entity’s Ability to Continue as a Going Concern (ASC 205-40), and believes that its current available cash should enable it to sustain operations into March 2018. However, the Company will ultimately need to achieve sufficient revenues from product sales and/or obtain additional debt or equity financing to support its operations. (4)Fair Value Measurements Fair value of financial assets and liabilities is defined as the price that would be received to sell an asset or transfer a liability in an orderly transaction between market participants at the measurement date. A fair value hierarchy has been established that prioritizes the inputs to valuation techniques used to measure fair value. The hierarchy gives the highest priority to unadjusted quoted prices in active markets for identical assets or liabilities (Level 1 measurements) and the lowest priority to unobservable inputs (Level 3 measurements). The three levels of the fair value hierarchy are described below: | · | | Level 1—Unadjusted quoted prices in active markets that are accessible at the measurement date for identical, unrestricted assets or liabilities. |
| · | | Level 2—Quoted prices for similar assets and liabilities in active markets, quoted prices for identical or similar assets or liabilities in markets that are not active or model-derived valuations for which all significant inputs are observable, either directly or indirectly. |
| · | | Level 3—Prices or valuation techniques that require inputs that are both significant to the fair value measurement and unobservable. |
The Company’s assets that are measured at fair value on a recurring basis are classified within Level 1 or Level 2 of the fair value hierarchy. The Company does not hold any assets that are measured at fair value using Level 3 inputs. The types of instruments the Company invests in that are valued based on quoted market prices in
EnteroMedics Inc.
(A development stage company)
Notes to Consolidated Financial Statements (Continued)
active markets include U.S. treasury securities. Such instruments are classified by the company within Level 1 of the fair value hierarchy. U.S. treasuries are valued using unadjusted quoted prices for identical assets in active markets that the Company can access.
The types of instruments the Company invests in that are valued based on quoted prices in less active markets, broker or dealer quotations, or alternative pricing sources with reasonable levels of price transparency include the Company’s U.S. agency securities, commercial paper, U.S. corporate bonds and municipal obligations. Such instruments are classified by the Company within Level 2 of the fair value hierarchy. The Company values these types of assets using consensus pricing or a weighted average price, which is based on multiple pricing sources received from a variety of industry standard data providers (e.g. Bloomberg), security master files from large financial institutions, and other third-party sources. The multiple prices obtained are then used as inputs into a distribution-curve-based algorithm to determine the daily market price.
The Company did not hold any short-term investments classified as available for sale or held to maturity as of December 31, 20132016 and 2012.2015. The fair value of the Company’s common stock warrant liability is calculated using a Black-Scholes valuation model and is classified as Level 2 in the fair value hierarchy. The fair values are presented below along with valuation assumptions: | | | | | | | | | | | | | | | | | Series A Warrants | | | November 2015 Note Warrants | | | | December 31, 2016 | | December 31, 2015 | | December 31, 2016 | | December 31, 2015 | | Risk-free interest rates | | | 1.20 | % | | 0.91 | % | | 1.47 | % | | 1.75 | % | Expected life | | | 24 | months | | 42 | months | | 46 | months | | 60 | months | Expected dividends | | | — | % | | — | % | | — | % | | — | % | Expected volatility | | | 122.03 | % | | 89.89 | % | | 102.29 | % | | 84.85 | % | Fair value | | $ | 36,000 | | $ | 2,759,583 | | $ | 449 | | $ | 118,234 | |
| | | | | | | | | | | | | | | | | January 2016 Note Warrants | | | May 2016 Note Warrants | | | | December 31, 2016 | | January 11, 2016 | | December 31, 2016 | | May 2, 2016 | | Risk-free interest rates | | | 1.93 | % | | 1.58 | % | | 1.93 | % | | 1.32 | % | Expected life | | | 48 | months | | 60 | months | | 52 | months | | 60 | months | Expected dividends | | | — | % | | — | % | | — | % | | — | % | Expected volatility | | | 108.57 | % | | 85.90 | % | | 106.37 | % | | 89.28 | % | Fair value | | $ | 1,633 | | $ | 515,157 | | $ | 1,037 | | $ | 150,195 | |
The following table summarizes fair value measurements of the Note Warrants issued in 2016 by level at December 31, 2016: | | | | | | | | | | | | | | | Level 1 | | Level 2 | | Level 3 | | Total | December 31, 2015 | | | | | | | | | | | | | Senior amortizing convertible notes (net of discounts of $149,340) | | $ | — | | $ | — | | $ | 1,267,182 | | $ | 1,267,182 | Common stock warrants | | | — | | | 2,877,817 | | | — | | | 2,877,817 | Total December 31, 2015 | | $ | — | | $ | 2,877,817 | | $ | 1,267,182 | | $ | 4,144,999 | December 31, 2016 | | | | | | | | | | | | | Common stock warrants | | $ | — | | $ | 39,119 | | $ | — | | $ | 39,119 |
During the year ended December 31, 2016 all the amounts outstanding under the Notes were paid off via conversions into shares of common stock. As of December 31, 2015, the fair value of the outstanding Notes from the First Closing was determined to be $1.3 million. The fair value of the Notes issued with the Second Closing was determined to be $2.4 million on the January 11, 2016 issue date. The fair value of the Notes issued with the Third Closing was determined to be $6.0 million on the May 2, 2016 issue date. The fair values were calculated using a Binomial Lattice model and the following assumptions: | | | | | | | | | | | | | | | | | | November 2015 Notes | | | January 2016 Notes | | | | December 31, 2016 | | | December 31, 2015 | | | | December 31, 2016 | | | January 11, 2016 | | Risk-free interest rates | | | N/A | | | 1.11 | % | | | N/A | | | 1.01 | % | Expected life | | | N/A | | | 1.86 | years | | | N/A | | | 1.83 | years | Expected dividends | | | N/A | | | — | % | | | N/A | | | — | % | Expected volatility | | | N/A | | | 57.5 | % | | | N/A | | | 60.0 | % | Fair value per share of common stock | | | N/A | | $ | 1.95 | | | | N/A | | $ | 1.33 | |
(4) | | | | | | | | | | | InventoryMay 2016 Notes
| | | | | December 31, 2016 | | | May 2, 2016 | | Risk-free interest rates | | | N/A | | | 0.69 | % | Expected life | | | N/A | | | 1.52 | years | Expected dividends | | | N/A | | | — | % | Expected volatility | | | N/A | | | 65.0 | % | Fair value per share of common stock | | | N/A | | $ | 0.80 | |
For the years ended December 31, 2016 and December 31, 2015, respectively, the Company converted $20.3 million and $0.1 million of principal and interest of the Notes into shares of common stock. There were no gains or losses resulting from the Notes recognized in the consolidated statements of operations for the years ended December 31, 2016 or December 31, 2015. (5)Inventory From inception, inventory related purchases had been used for research and development related activities and had accordingly been expensed as incurred. In December 2011, the Company began receiving Australian Register of Therapeutic Goods (ARTG) listings for components of the Maestro RechargeablevBloc System from the Australian Therapeutic Goods Administration, (TGA), with the final components being listed on the ARTG in January 2012. As a result, the Company determined certain assets were recoverable as inventory beginning in December 2011. The Company accounts for inventory at the lower of cost or market and records any long-term inventory as other assets in the consolidated balance sheets. There was approximately $794,000$676,000 and $862,000$519,000 of long-term inventory, primarily consisting of raw materials, as of December 31, 20132016 and 2012,2015, respectively. Current inventory consists of the following as of: | | | | | | | | | | | | | | December 31, | | | December 31, | | December 31, | | | | 2013 | | | 2012 | | | 2016 | | 2015 | Raw materials | | $ | 385,565 | | | $ | 198,647 | | | $ | 335,606 | | $ | 576,898 | Work-in-process | | | 624,530 | | | | 1,051,286 | | | | 1,437,957 | | | 1,066,345 | Finished goods | | | 117,846 | | | | 21,274 | | | | 16,015 | | | 43,081 | | | | | | | | | Inventory | | $ | 1,127,941 | | | $ | 1,271,207 | | | $ | 1,789,578 | | $ | 1,686,324 | | | | | | | | |
(5) | Property and Equipment |
(6)Property and Equipment Property and equipment consists of the following as of: | | | | | | | | | | | | | | December 31, | | | December 31, | | | | 2013 | | 2012 | | | 2016 | | 2015 | Furniture and equipment | | $ | 2,274,633 | | | $ | 2,143,025 | | | $ | 2,302,878 | | $ | 2,299,290 | Computer hardware and software | | | 499,922 | | | | 489,478 | | | | 596,292 | | | 585,880 | Leasehold improvements | | | 46,754 | | | | 46,754 | | | | 62,651 | | | 62,651 | | | | | | | | | | 2,961,821 | | | 2,947,821 | | | | 2,821,309 | | | | 2,679,257 | | | Less accumulated depreciation and amortization | | | (2,244,214 | ) | | | (2,069,585 | ) | | | (2,761,101) | | | (2,621,525) | | | | | | | | | Property and equipment, net | | $ | 577,095 | | | $ | 609,672 | | | $ | 200,720 | | $ | 326,296 | | | | | | | | |
EnteroMedics Inc.
(A development stage company)
Notes to Consolidated Financial Statements (Continued)
(7)Accrued Expenses Accrued expenses consistsconsist of the following as of: | | | | | | | | | | | | | | December 31, | | | December 31, | | | | 2013 | | | 2012 | | | 2016 | | 2015 | Professional service related expenses | | $ | 2,650,163 | | | $ | 2,229,057 | | | $ | 1,858,912 | | $ | 1,912,775 | Payroll related expenses | | | 1,043,028 | | | | 1,099,713 | | | | 507,327 | | | 1,270,208 | Other expenses | | | 492,869 | | | | 344,839 | | | | 385,176 | | | 412,432 | | | | | | | | | Accrued expenses | | $ | 4,186,060 | | | $ | 3,673,609 | | | $ | 2,751,415 | | $ | 3,595,415 | | | | | | | | |
Notes payable consists of the following as of:
| | | | | | | | | | | | December 31, | | | | | 2013 | | | 2012 | | Growth capital loan dated April 16, 2012 (net of discounts of $131,670 and $316,028 at December 31, 2013 and 2012, respectively) | | $ | 6,868,330 | | | $ | 9,683,972 | | Less current portion | | | (4,000,000 | ) | | | (3,000,000 | ) | | | | | | | | | | Total long-term debt | | $ | 2,868,330 | | | $ | 6,683,972 | | | | | | | | | | |
November 18, 2008 Debt Facility with Silicon Valley Bank, Venture Lending & Leasing V, Inc. and Compass Horizon Funding Company LLC(8)Senior Amortizing Convertible Notes
On November 18, 2008,4, 2015, the Company entered into a Loanthe Purchase Agreement to issue and Security Agreement (the Prior Loan Agreement) with Silicon Valley Bank (SVB), Venture Lending & Leasing V, Inc. (a private equity fund under the management of Western Technology Investment (WTI)) and Compass Horizon Funding Company LLC (Horizon and, collectively with SVB and WTI, the Lenders),sell to four institutional investors 7% senior amortizing convertible notes due 2017 in an aggregate principal amount of up to $20.0 million. On November 21, 2008, SVB and WTI each funded a term loan in the aggregate principal amount of $10.0 million and $5.0 million, respectively.three separate closings. The additional $5.0 million term loan was automatically funded by Horizon on April 28, 2009 when the trading price of the Company’s common stock on the NASDAQ Global Market exceeded a target amount specified in the Prior Loan Agreement. Interest-only paymentsNotes were required on the term loans during a period beginning on the term loan funding date and continuing through June 30, 2009, followed thereafter by equal monthly payments of principal and interest over the remaining term of the term loan. Amounts borrowed under the Prior Loan Agreement had an annual interest rate equal to 12.0% during the period of interest-only payments, and thereafter, at a rate of 11.0% per annum for the remainder of the term. Per the Prior Loan Agreement, the Company was also required to make a final payment in an aggregate amount equal to 5.0% of the term loans funded by the Lenders (the Final Payment Fee).
The debt financing was collateralized by a first security priority lien on all of the Company’s assets, excluding intellectual property. The Company enteredinitially convertible into account control agreements in order to perfect the Lenders’ first security interest in the Company’s cash and investment accounts.
EnteroMedics Inc.
(A development stage company)
Notes to Consolidated Financial Statements (Continued)
On December 1, 2009, the Company voluntarily prepaid both the WTI and Horizon term loans in full. Both WTI and Horizon released their right to future interest when the term loans were paid in full.
During 2010 and 2011, the Company and SVB entered into four amendments to the Prior Loan Agreement, which modified the payment terms, annual interest rate and financial covenants. A brief summary of the four amendments is provided below.
On February 8, 2010, the Company and SVB entered into the First Amendment to the Prior Loan Agreement, which reduced the annual interest rate from 11.0% to a fixed annual rate of 10.0%, payable monthly, revised the liquidity financial covenant and added a New Capital Transaction covenant.
On July 8, 2010, the Company and SVB entered into a Second Amendment (the Second Amendment) to the Prior Loan Agreement, which modified the repayment terms of the loan such that interest only payments were required through December 31, 2010 followed by 30 equal payments of principal and interest, increased the annual interest rate from 10.0% to a fixed annual rate of 11.0%, payable monthly, revised the liquidity financial covenant and added additional New Capital Transaction requirements.
On November 4, 2010, the Company and SVB entered into a Third Amendment (the Third Amendment) to the Prior Loan Agreement, which modified the New Capital Transaction covenant, suspended the liquidity financial covenant and required the Company to maintain a blocked cash collateral account with funds equal to the principal balance outstanding.
On March 3, 2011, the Company entered into a Fourth Amendment (the Fourth Amendment) to the Prior Loan Agreement with SVB. The Fourth Amendment modified the repayment terms of the term loan such that beginning April 1, 2011 through September 30, 2011, the Company was required to make interest only monthly payments on the term loan. Then, beginning on October 1, 2011, the remaining balance due on the term loan started to amortize over 30 equal payments of principal and interest, payable monthly. In addition, the Fourth Amendment amended the interest rate due effective March 1, 2011 on the remaining principal amount of the term loan from 11.0% to a fixed annual rate of 6.25%, payable monthly. The Fourth Amendment reinstated the liquidity financial covenant and eliminated SVB’s springing lien on the Company’s intellectual property, the New Capital Transactions requirement and the requirement of the Third Amendment to maintain a blocked cash collateral account with funds equal to the principal balance outstanding.
Warrants Issued
The Prior Loan Agreement required the issuance of warrants to the Lenders with an aggregate exercise price equal to 11.0% of the loan commitment. The warrants gave the Lenders the option to purchase either (i) shares of the Company’s common stock withat a per share exercise price equal to $9.51, or (ii) shares of the Company’s stock (including common stock) issued in an equity financing that occurred within 18 months after November 18, 2008 at the$304.50 per share price of the stock sold in the financing. On November 18, 2008 (i) SVB was issued a warrant to purchasewith an aggregate numberprincipal amount of shares equal to $1,100,000 divided by the per share exercise price of the warrant, (ii) WTI$25.0 million. Each Note was issued a warrant to purchase an aggregate number of shares equal to $550,000 divided by the per share exercise price of the warrant, and (iii) Horizon received a warrant to purchase an aggregate number of shares equal to $55,000 divided by the per share exercise price of the warrant. On April 28, 2009 Horizon was issued an additional warrant to purchase an aggregate number of shares equal to $495,000 divided by the per share exercise price of the warrant in connectionsold with the additional $5.0 million term loan that was automatically funded by Horizon pursuant to the Prior Loan Agreement.
EnteroMedics Inc.
(A development stage company)
Notes to Consolidated Financial Statements (Continued)
On November 18, 2008, the Company issued a total of 179,328 common stock warrantsNote Warrant with an exercise price of $9.51$325.50 per shareshare. The Company issued and sold Notes and Note Warrants for aggregate total proceeds of $12.5 million in the First Closing and Second Closing and after entering into the First Amendment, which provided that the scheduled third closing would be split into two separate closings, issued and sold Notes and Note Warrants for aggregate total proceeds of $6.25 million in the Third Closing. After the Third Closing, the Company entered into the Second Amendment, which set a ten year lifedeadline of December 30, 2016 for the final closing and provided the consent of the holders of the Notes to the Lenders, or a calculated fair value of $1.4 million. This fair value was calculated using a Black-Scholes valuation model andCompany reducing the following assumptions: volatility of 78.9%, dividend rate of 0%, risk-free interest rate of 3.54% and a ten year life. The exerciseconversion price of the Notes from time to time in order to incentivize the holders of the Notes to convert their Notes into shares of the Company’s common stock warrants issued on November 18, 2008stock. As the final closing did not occur prior to the December 30, 2016 deadline, the remaining $6.25 million of Notes was adjusted to $6.90,not funded. Additionally, after entering into the price per share sold in an equity financing that closed on February 24, 2009, resulting in an additional 67,773 common stock warrants for the Lenders. On April 28, 2009,Second Amendment, the Company issued a total of 49,460 common stock warrants with an exercise price of $10.01 per share and a ten year life to Horizon, or a calculated fair value of $542,144. This fair value was calculated using a Black-Scholes valuation model andreduced the following assumptions: volatility of 99.1%, dividend rate of 0%, risk-free interest rate of 3.00% and a ten year life. The exerciseconversion price of the common stock warrants issuedNotes frequently in order to Horizon on both November 18, 2008 and April 28, 2009 was further adjusted to $4.80,incentivize the price per share sold in an equity financing that closed October 7, 2009, resulting in an additional 57,152 common stock warrants for Horizon. The exercise price of Horizon’s outstanding common stock warrants was further adjusted to $3.90, the price per share sold in an equity financing that closed January 20, 2010, resulting in an additional 26,442 common stock warrants for Horizon.
As discussed in Note 2, effective January 1, 2009, as a result of a change in accounting guidance, the Company revalued the warrants issued in November 2008 and reclassified them from equity to a liability. The fair valueholders of the warrant liability on January 1, 2009 was $1.5 million andNotes to convert all of the change in fair value was recorded as an increase tooutstanding amounts outstanding under the deficit accumulated during development stage. This fair value was calculated using a weighted-average Black-Scholes valuation model and the following assumptions: volatility of 79.6%, dividend rate of 0%, risk-free interest rate of 2.24% and a remaining life of 9.88 years.
Notes. As of December 31, 2009, Horizon had outstanding 114,583 common stock warrants with an exercise price of $4.80 per share. The fair value2016, all of the warrant liability associated with these warrants was $471,585 as of December 31, 2009. This fair value was calculated using a weighted-average Black-Scholes valuation model and the following assumptions: volatility between 103.9% and 104.8%, dividend rate of 0%, risk-free interest rate of 3.84% and a remaining life between 8.89 and 9.33 years. The Company recorded a decrease of $119,904 in the change in value of the warrant liability forNotes were fully repaid. During the year ended December 31, 2009 for this portion2016, $18.7 million of aggregate principal amount of Notes were converted by holders of the warrant liability. As of December 31, 2010, Horizon had outstanding 141,025 common stock warrants with an exercise price of $3.90 per share. The fair valueNotes into approximately 2,632,000 shares of the warrant liability associated with these warrants was $312,751 asCompany’s common stock.
Description of the Notes The Notes were payable in monthly installments, accrued interest at a rate of 7.0% per annum from the date on whichof issuance and had a maturity date 24 months after the warrants’ down round protection expired. This Level 3 fair value was calculated using a weighted-average Black-Scholes valuation model andFirst Closing. The Notes were repayable, at the following assumptions: volatility between 113.25% and 113.33%, dividend rate of 0%, risk-free interest rate of 3.38% and a remaining life between 8.51 and 8.95 years. As a result of the down round protection expiring, on May 18, 2010 the Company recorded a decrease of $158,834Company’s election, in the change in value of the warrant liability for the year ended December 31, 2010 and reclassified the warrant liability to equity. On July 8, 2010, per the terms of the Second Amendment to the Prior Loan Agreement, SVB was issued a warrant to purchase 150,642either cash or shares of the Company’s common stock withat a discount to the then-current market price. The Notes were also convertible from time to time, at the election of the holders, into shares of the Company’s common stock at an exerciseinitial conversion price of $2.10 per share.
Warrants Exercised
On September 29, 2009, SVB completed a cashless exercise of the warrants issued to them as part of the Prior Loan Agreement. SVB held a total of 159,420 common stock warrants with an exercise price of $6.90$304.50 per share. The cashless exerciseconversion price was adjusted to $76.30 per share on January 29, 2016, the 16th trading day following the First Reverse Stock Split, per the terms of the warrants resultedNotes. The Notes also allowed the Company to reduce the conversion price from time-to-time, upon the holders’ consent, which was provided for in the Company issuing 125,470Second Amendment.
The holder of each Note had the right to convert any portion of such Note unless the holder, together with its affiliates, beneficially owned in excess of 4.99% of the number of shares of the Company’s common stock outstanding immediately after giving effect to the conversion, as such percentage ownership was determined in accordance with the terms of the Notes. The holders were also able to increase or decrease such percentage to any other percentage, but in no event above 9.99%, provided that any increase of such percentage would not be effective until 61 days after providing notice to the Company. The Company determined that the conversion feature in the Notes requires bifurcation and liability classification and measurement, at fair value, and requires evaluation at each reporting period. Under Accounting Standards Codification (ASC) 825, Financial Instruments, the FASB provides an alternative to bifurcation and companies may instead elect fair value measurement for the entire instrument, including the debt and conversion feature. The Company elected the fair value alternative in order to simplify its common stock.accounting and reporting of the Notes upon issuance. The fair value of the warrant liability on the date of exerciseNote Warrants was $4.8 million. This fair value was calculated EnteroMedics Inc.
(A development stage company)
Notes to Consolidated Financial Statements (Continued)
using a weighted-average Black-Scholes valuation model and the following assumptions: volatility of 108.0%, dividend rate of 0%, risk-free interest rate of 3.29% and a remaining life of 9.14 years. As a result of the warrants being exercised, the warrant liability was reclassified to equity with $3.8 million being recorded as a change indiscount to the Notes and amortized to interest expense following the effective interest rate method over the term of the Notes.
The First Closing occurred on November 9, 2015. At the First Closing, the Company issued and sold Notes with an aggregate principal amount of $1.5 million, along with Note Warrants exercisable for 1,679 shares. During the quarter ended September 30, 2016, all remaining principal and interest amounts outstanding under the Notes issued at the First Closing were paid off via conversions to common shares. The Second Closing occurred on January 11, 2016 after the Company received approval of the offering by the Company’s stockholders and the satisfaction of certain customary closing conditions. At the Second Closing, the Company issued and sold Notes with an aggregate principal amount of $11.0 million, along with Note Warrants exercisable for 12,312 shares. The fair value of Note Warrants issued on January 11, 2016 was determined to be $515,000 using a Black-Scholes valuation model. During the warrant liability for the yearquarter ended December 31, 2009.2016, all remaining principal and interest amounts outstanding under Notes issued at the Second Closing were paid off via conversions to common shares. On OctoberThe Third Closing occurred on May 2, 2009, WTI completed a cashless exercise of2016 after the warrants issued to them as part of the Prior Loan AgreementCompany entered into on November 18, 2008. WTI held a total of 79,710 common stock warrantsthe First Amendment and satisfied certain closing conditions. At the Third Closing, the Company issued and sold Notes with an exercise priceaggregate principal amount of $6.90 per share. The cashless exercise of the warrants resulted in the Company issuing 59,248 shares of its common stock.$6.25 million, along with Note Warrants exercisable for 6,995 shares. The fair value of the warrant liabilityNote Warrants issued on May 2, 2016 was determined to be $150,195 using a Black-Scholes valuation model. During the quarter ended December 31, 2016, all remaining principal and interest amounts outstanding under Notes issued at the Third Closing were paid off via conversions to common shares.
On December 31, 2015, the fair value of the outstanding Notes was determined to be $1.3 million using a Binomial Lattice model. The following table summarizes the installment amounts and additional conversions by the holders of the Notes through December 31, 2016: First Closing: | | | | | | | | | | | | | | | | | | | | | | | | Common | | | | Principal | | Interest | | Total | | Shares | | Installment amount at December 31, 2015 | | $ | 65,217 | | $ | 23,651 | | $ | 88,868 | | 814 | | Holder conversions during the quarter ended December 31, 2015 | | | 18,261 | | | 2,375 | | | 20,636 | | 189 | | Total installments and conversions, December 31, 2015 | | | 83,478 | | | 26,026 | | | 109,504 | | 1,003 | | Installment amount at February 29, 2016 | | | 65,217 | | | 23,681 | | | 88,898 | | 1,314 | | Installment amount at March 31, 2016 | | | 65,217 | | | 14,827 | | | 80,044 | | 1,271 | | Holder conversions during the quarter ended March 31, 2016 | | | 104,784 | | | 12,762 | | | 117,546 | | 1,524 | | Total installments and conversions, March 31, 2016 | | | 318,696 | | | 77,296 | | | 395,992 | | 5,112 | | Installment amount at April 30, 2016 | | | 65,217 | | | 13,853 | | | 79,070 | | 1,454 | | Installment amount at May 31, 2016 | | | 65,217 | | | 13,082 | | | 78,299 | | 2,121 | | Installment amount at June 30, 2016 | | | 54,217 | | | 11,275 | | | 65,492 | | 3,590 | | Holder conversions during the quarter ended June 30, 2016 | | | 1,627 | | | 174 | | | 1,801 | | 29 | | Total installments and conversions, June 30, 2016 | | | 504,974 | | | 115,680 | | | 620,654 | | 12,306 | | Installment amount at July 31, 2016 | | | 65,217 | | | 10,148 | | | 75,365 | | 5,521 | | Installment amount at August 31, 2016 | | | 46,957 | | | 5,830 | | | 52,787 | | 4,593 | | Holder conversions during the quarter ended September 30, 2016 | | | 882,852 | | | 78,634 | | | 961,486 | | 72,528 | | Total installments and conversions, September 30, 2016 and December 31, 2016 | | $ | 1,500,000 | | $ | 210,292 | | $ | 1,710,292 | | 94,948 | |
Second Closing: | | | | | | | | | | | | | | | | | | | | | | | | Common | | | | Principal | | | Interest | | | Total | | Shares | | | | | | | | | | | | | | | Installment amount at March 2, 2016 | | $ | 404,762 | | $ | 149,300 | | $ | 554,062 | | * | | Holder conversions during the quarter ended March 31, 2016 | | | 987,000 | | | 124,050 | | | 1,111,050 | | 14,974 | | Total installments and conversions, March 31, 2016 | | | 1,391,762 | | | 273,350 | | | 1,665,112 | | 14,974 | | Installment amount at April 29, 2016 | | | 404,762 | | | 149,497 | | | 554,259 | | 10,190 | | Installment amount at May 31, 2016 | | | 291,428 | | | 86,518 | | | 377,946 | | 10,238 | | Installment amount at June 30, 2016 | | | 404,762 | | | 82,913 | | | 487,675 | | 22,842 | | Holder conversions during the quarter ended June 30, 2016 | | | 25,373 | | | 2,995 | | | 28,368 | | 414 | | Total installments and conversions, June 30, 2016 | | | 2,518,087 | | | 595,273 | | | 3,113,360 | | 58,658 | | Installment amount at July 31, 2016 | | | 213,429 | | | 47,457 | | | 260,886 | | 19,113 | | Installment amount at August 31, 2016 | | | 631,429 | | | 116,511 | | | 747,940 | | 64,810 | | Installment amount at September 30, 2016 | | | 404,762 | | | 45,846 | | | 450,608 | | 51,698 | | Holder conversions during the quarter ended September 30, 2016 | | | 4,868,679 | | | 418,847 | | | 5,287,526 | | 418,253 | | Total installments and conversions, September 30, 2016 | | | 8,636,386 | | | 1,223,934 | | | 9,860,320 | | 612,532 | | Installment amount at Oct 31, 2016 | | | 340,000 | | | 24,738 | | | 364,738 | | 70,665 | | Installment amount at Nov 30, 2016 | | | 291,429 | | | 27,528 | | | 318,957 | | 81,952 | | Installment amount at December 31, 2016 | | | 156,867 | | | 11,425 | | | 168,292 | | 57,453 | | Holder conversions during the quarter ended December 31, 2016 | | | 1,575,318 | | | 122,624 | | | 1,697,942 | | 450,385 | | Total installments and conversions, December 31, 2016 | | $ | 11,000,000 | | $ | 1,410,249 | | $ | 12,410,249 | | 1,272,987 | |
Third Closing | | | | | | | | | | | | | | | | | | | | | | | | Common | | | | | Principal | | | Interest | | | Total | | Shares | | | | | | | | | | | | | | | Installment amount at June 30, 2016 | | $ | 212,158 | | $ | 90,659 | | $ | 302,817 | | 16,600 | | Holder conversions during the quarter ended June 30, 2016 | | | — | | | — | | | — | | — | | Total installments and conversions, June 30, 2016 | | | 212,158 | | | 90,659 | | | 302,817 | | 16,600 | | Installment amount at July 31, 2016 | | | 147,368 | | | 32,374 | | | 179,742 | | 13,168 | | Cash Payment – July 31, 2016 installment | | | 42,105 | | | 6,107 | | | 48,212 | | * | | Installment amount at August 31, 2016 | | | 336,842 | | | 62,059 | | | 398,901 | | 34,684 | | Installment amount at September, 2016 | | | 263,158 | | | 41,822 | | | 304,980 | | 34,523 | | Holder conversions during the quarter ended September 30, 2016 | | | 1,915,698 | | | 175,092 | | | 2,090,790 | | 155,272 | | Total installments and conversions, September 30, 2016 | | | 2,917,329 | | | 408,113 | | | 3,325,442 | | 254,247 | | Installment amount at Oct 31, 2016 | | | 221,053 | | | 35,004 | | | 256,057 | | 48,192 | | Installment amount at Nov 30, 2016 | | | 221,053 | | | 31,259 | | | 252,312 | | 64,828 | | Installment amount at December 31, 2016 | | | 221,053 | | | 14,526 | | | 235,579 | | 81,872 | | Holder conversions during the quarter ended December 31, 2016 | | | 2,669,512 | | | 170,359 | | | 2,839,871 | | 816,707 | | Total installments and conversions, December 31, 2016 | | $ | 6,250,000 | | $ | 659,261 | | $ | 6,909,261 | | 1,265,846 | |
* Cash payments Description of the Note Warrants Each Note Warrant is exercisable immediately and for a period of 60 months from the date of exercise was $494,652. This fair value was calculated using a weighted-average Black-Scholes valuation model and the following assumptions: volatility of 108.0%, dividend rate of 0%, risk-free interest rate of 3.22% and a remaining life of 9.13 years. As a resultissuance of the warrants being exercised, the warrant liability was reclassified to equity with $1,210 being recorded as a change in valueNote Warrant. After completion of the warrant liability forThird Closing, the year ended December 31, 2009. WTI also completed a cashless exerciseNote Warrants entitle their holders to purchase, in aggregate, 27,982 shares of an additional 24,990the Company’s common stock warrants withstock. The Note Warrants were initially exercisable at an exercise price of $23.64 per share. The cashless exercise of the warrants resulted in the Company issuing 2,996 shares of its common stock. These warrants were not included as part of the warrant liability. April 16, 2012 Debt Facility with Silicon Valley Bank
On April 16, 2012, the Company entered into a new Loan and Security Agreement (the Loan Agreement) with SVB, pursuantequal to which SVB agreed$325.50, subject to make term loans to the Company in an aggregate principal amount of up to $20.0 million ($10.0 million of which is not available as the Company did not meet the predefined primary efficacy measures of the ReCharge trial as well as certain financial objectives for 2012),adjustment on the termseighteen month anniversary of issuance, and conditions set forth in the Loan Agreement.certain other adjustments. The Loan Agreement amendsexercise price and restates the Prior Loan Agreement, as amended.
Pursuant to the Loan Agreement, a term loan was funded in the aggregate principal amountnumber of $10.0 million on April 23, 2012, a portion of which was used to repay in full the outstanding debt of approximately $4.7 million. The term loan required interest only payments monthly through March 31, 2013 followed by 30 equal payments of principal in the amount of $333,333 plus accrued interest beginning on April 1, 2013 and ending on September 1, 2015, payable monthly. Amounts borrowed under the Loan Agreement bear interest at a fixed annual rate equal to 8.0%. A 5.0% final payment fee from the Prior Loan Agreement will be due on September 1, 2015. The Company may voluntarily prepay the term loan in full, but not in part, and any voluntary or mandatory prepayment is subject to applicable prepayment premiums and will also include the final payment fee. The Company was required to comply with certain financial covenants that require the Company to generate certain minimum amounts of revenue from the sale of its Maestro System and to implant certain minimum numbers of Maestro Systems during cumulative quarterly measurement periods beginning with the period ended March 31, 2013 and ending with the period ending June 30, 2015. The Company did not meet the financial covenants for the period ended March 31, 2013 and therefore entered into a First Amendment (the First Amendment) to the Loan Agreement on May 9, 2013 pursuant to which the Company and SVB agreed to new financial covenants.
The First Amendment eliminated the financial covenants that required the Company to generate certain minimum amounts of revenue from the sale of its Maestro System and to implant certain minimum numbers of Maestro Systems during cumulative quarterly measurement periods beginning with the period ended March 31, 2013 and ending with the period ending June 30, 2015. It also removed SVB’s ability to require the Company to maintain a restricted cash balance of $7.5 million in an SVB account as a result of the Company not meeting the predefined primary efficacy measures of the ReCharge trial.
EnteroMedics Inc.
(A development stage company)
Notes to Consolidated Financial Statements (Continued)
The First Amendment added two new financial covenants, one of which requires the Company to receive cumulative aggregate net proceeds of at least $5.0 million by November 15, 2013, which has been fulfilled through the use of the equity distribution agreement with Canaccord Genuity Inc. (see Note 8), and $10.0 million by April 15, 2014 from new capital transactions. The amount required will adjust up or down based on the Company’s actual cash position compared to its financial plan. The second financial covenant requires the Company to maintain a liquidity ratio (unrestricted cash divided by outstanding debt) of at least 1.25:1.00 until it receives FDA approval for the Maestro Rechargeable System at which point it will be reduced to 0.75:1.00. The First Amendment did not change the interest rate or the amortization structure. The Company will pay SVB a $187,000 success fee in the event the Company receives FDA approval for the Maestro Rechargeable System.
The Company has granted SVB a security interest in all of the Company’s assets, excluding intellectual property except with respect to all license, royalty fees and other revenues and income arising out of or relating to any of the intellectual property and all proceeds of the intellectual property. The Company also has entered into a negative pledge arrangement with SVB pursuant to which it has agreed not to encumber any of its intellectual property without SVB’s prior written consent.
Pursuant to the Loan Agreement, on April 16, 2012, the Company issued SVB a warrant to purchase 106,746 shares of common stock exercisable for ten years fromissuable on the dateexercise of grant, at anthe Note Warrants is subject to adjustment upon the issuance of any shares of common stock or securities convertible into shares of common stock below the then-existing exercise price, with certain exceptions. Additionally, the exercise price and number of shares of common stock issuable upon the exercise of the Note Warrants are subject to adjustment in the event of any stock split, reverse stock split, recapitalization, reorganization or similar transaction. The holder of each Note Warrant does not have the right to exercise any portion of such Note Warrant if the holder, together with its affiliates, beneficially owns in excess of 4.99% of the number of shares of the Company’s common stock outstanding immediately after giving effect to the exercise, as such percentage ownership is determined in accordance with the terms of the Note Warrants. However, any holder may increase or decrease such percentage to any other percentage, but in no event above 9.99%, provided that any increase of such percentage will not be effective until 61 days after providing notice to the Company.
The exercise price of $2.34the Note Warrants issued November 9, 2015 was reduced to $76.30 per share on January 29, 2016, the 16th trading day following the First Reverse Stock Split, per the terms of the Note Warrants. Per the terms of the Note Warrants, the exercise price of each of the Note Warrants issued January 11, 2016 and May 2, 2016 remained $325.50 until January 20, 2017, the 16th trading day following the Second Reverse Stock Split, at which point the price of all of the Note Warrants was adjusted to $2.18 per share. All of the Note Warrants remain subject to adjustment on the eighteen month anniversary of issuance. Scheduled debt principal payments are as follows as
(9)Preferred Stock The Company’s Sixth Amended and Restated Certificate of Incorporation currently authorizes 5,000,000 shares of $0.01 par value preferred stock. As of December 31, 2013:2016 and 2015, there were no shares of preferred stock issued or outstanding. | | | | | Years Ending December 31: | | | | 2014 | | $ | 4,000,000 | | 2015 | | | 3,000,000 | | | | | | | | | | 7,000,000 | | Less original issue discount | | | (131,670 | ) | | | | | | Notes payable, net | | $ | 6,868,330 | | | | | | |
On January 23, 2017, the Company closed an underwritten public offering that included 12,531 shares of convertible preferred stock. On January 23 and January 24, 2017 all shares of preferred stock issued in conjunction with the offering were converted by their holders into 2,359,894 shares of common stock. See Note 18, Subsequent Events. Public Offering—September 2011(10)Stock Sales
Sales Agreement—July 2015 On September 28, 2011,July 8, 2015, the Company closed a public offering, selling 8,800,000 shareswhere it sold 30,476 units at an aggregate price of $525.00 per unit, for gross proceeds of $16.0 million before deducting estimated offering expenses of approximately $1.4 million, of which $532,000 was assigned to the warrants issued with each unit sold and was recognized immediately as interest expense in the consolidated statements of operations as the warrants are exercisable upon issuance. Each unit consisted of: (A)(i) one share of common stock together with warrantsor (ii) one pre-funded Series C warrant to purchase approximately 1,760,000 sharesone share of common stock at an aggregateexercise price of $1.65equal to $525.00 per share (Series C Warrant); and corresponding warrant, for gross proceeds of $14.5 million before deducting offering expenses. Certain directors of the Company participated in the public offering (see Note 13). The warrants have(B) one Series A Warrant with an exercise price initially equal to $630.00 per share (Series A Warrant). Each purchaser of $1.90 pera unit could elect to receive a Series C Warrant in lieu of a share of common stock andstock. No Series C Warrants were issued.
The Series A Warrants are exercisable for a period of five years42 months from September 28, 2011. Holdersthe closing date of the warrants are not permitted topublic offering. The exercise those warrants for an amountprice and number of shares of common stock that would resultissuable on the exercise of the Series A Warrants are subject to adjustment upon the issuance of any shares of common stock or securities convertible into shares of common stock below the then-existing exercise price, with certain exceptions, and in the event of any stock split, reverse stock split, recapitalization, reorganization or similar transaction. The holder owning more than 19.99%of the Series A Warrant does not have the right to exercise any portion of the Series A Warrant if the holder, together with its affiliates, would, subject to certain limited exceptions, beneficially own in excess of 9.99% of the Company’s common stock. The warrantsstock outstanding immediately after the exercise or 4.99% as may be redeemed in whole or in part atelected by the option of the Company, at a redemption price of $0.01 per warrant at any time after any date on which the closing salepurchaser. The exercise price of the common stock,Series A Warrants issued July 8, 2015 was reduced to $168.00 per share on November 9, 2015 as reporteda result of the issuance of the Notes and was further reduced to $67.90 per share on January 29, 2016, the 16th trading day following the First Reverse Stock Split, per the terms of the Series A Warrants and was further reduced at various times during the year ended December 31, 2016 as a result of installment and acceleration payments made on the principal exchange or trading facility on which it is then traded, has equaled or exceeded $1.00 more thanNotes. As of December 31, 2016, the exercise price of the warrants for 10 consecutivewas $2.80 per share and on January 20, 2017, the 16th trading days. The Company is required to provide 30 days’ prior written notice today following the warrantholderSecond Reverse Stock Split, the exercise price of the Company’s intentionSeries A Warrants was adjusted to redeem$2.18 per share, per the warrant; provided, thatterms of the Company may not provide this notice until the earlier of (i) 30 days following the date the Company initially EnteroMedics Inc.
(Series A development stage company)Warrants.
Notes to Consolidated Financial Statements (Continued)
releases the results of the blinded portion of the ReCharge trial or (ii) Sales Agreement—June 30, 2013. The Company may not redeem any portion of a warrant if, had the holder exercised that portion of the warrant in lieu of redemption, it would have resulted in such holder owning more than 19.99% of the common stock outstanding after such exercise.
Registered Direct Offering—April 20122014
On April 16, 2012,June 13, 2014, the Company entered into a securities purchasesales agreement with a current investor for the sale of 2,271,705 shares of its common stock in a registered direct offering, at a purchase price of $2.223 per share. On April 20, 2012, the offering closedCowen and the Company, received gross proceeds of $5.0 million before deducting estimated offering expenses. Public Offering—February 2013
On February 27, 2013, the Company closed a public offering, selling 13,770,000 shares of common stock, together with warrants to purchase approximately 5,508,000 shares of common stock at an aggregate price of $0.95 per share and corresponding warrant, for gross proceeds of $13.1 million before deducting offering expenses. Certain directors of the Company participated in the public offering (see Note 13).
The warrants have an exercise price of $1.14 per share of common stock and are exercisable for a period of five years from February 27, 2013. Holders of the warrants are not permitted to exercise those warrants for an amount of common stock that would result in the holder owning more than 19.99% of the Company’s common stock.
Equity Distribution Agreement—July 2013
On July 31, 2013, the Company entered into an equity distribution agreement with Canaccord Genuity Inc. (Canaccord)LLC (Cowen) to sell shares of the Company’s common stock having aggregate gross sales proceeds of up to $20.0$25.0 million, from time to time, through an “at-the-market” equity offering programat-the-market (ATM) facility under which CanaccordCowen will act as the Company’s sales agent.agent (the Cowen ATM). The Company will determine, at its sole discretion, the timing and number of shares to be sold under thisthe Cowen ATM. The Company will pay CanaccordCowen a commission for its services in acting as agent in the sale of common stock equal to 2.0%3.0% of the gross sales price per share of all shares sold through it as agent under the equity distributionsales agreement. As of December 31, 2013,2015, the Company had sold 7,917,7555,256 shares under the Cowen ATM at a weighted-average selling price of $1.39$1,442.00 per share for gross proceeds of approximately $11.0$7.6 million before deducting offering expenses. SubsequentThere have been no shares sold under the Cowen ATM subsequent to December 31, 20132015 through March 27, 2014,6, 2017. The Company can direct Cowen to sell up to $17.4 million in common stock, provided we remain in compliance with all of the Company has sold an additional 2,506,222 sharesconditions under the ATM at a weighted-average selling priceCowen ATM.
(11)Income Taxes (9) | Convertible Preferred Stock |
The Company’s Amended and Restated Certificate of Incorporation, currently authorizes 5,000,000 shares of $0.01 par value convertible preferred stock. As of December 31, 2013 and 2012, there were no shares of convertible preferred stock issued or outstanding as all shares of Series A, Series B and Series C convertible preferred stock converted into shares of common stock upon completion of the Company’s IPO utilizing the quotient obtained by dividing the original purchase price per share of $6.5593, $3.9430 and $8.0926 by $4.2379, $3.9430 and $8.0926 per share, respectively, and all shares of Series A convertible preferred stock issued with the September 29, 2010 private placement converted to common stock on a 1:1 basis upon the December 14, 2010 closing of the Company’s public offering.
EnteroMedics Inc.
(A development stage company)
Notes to Consolidated Financial Statements (Continued)
The Company has incurred net operating losses (NOLs) since inception. The Company has not reflected any benefit of such net operating loss carryforwards in the accompanying consolidated financial statements. The income tax expense benefit differed from the amount computed by applying the U.S. federal income tax rate of 34% to income before income taxes as a result of the following: | | | | | | | | | | | | | | | | | 2013 | | 2012 | | 2011 | | | 2016 | | 2015 | | 2014 | | Computed ‘expected’ tax benefit | | | 34.0 | % | | | 34.0 | % | | | 34.0 | % | | 34 | % | 34 | % | 34 | % | Other permanent adjustments | | | -2.3 | % | | | -2.2 | % | | | -1.8 | % | | 3.1 | % | 1.6 | % | (2.3) | % | Research and development credit | | | 3.5 | % | | | 0.0 | % | | | 1.6 | % | | 0.6 | % | 0.9 | % | 0.3 | % | Federal valuation allowance | | | -35.2 | % | | | -31.8 | % | | | -33.8 | % | | (37.7) | % | (36.5) | % | (32) | % | | | | | | | | | | | | — | % | — | % | — | % | | | | 0.0 | % | | | 0.0 | % | | | 0.0 | % | | | | | | | | | | | | |
The tax effect of temporary differences that give rise to significant portions of the deferred tax assets as of December 31 is presented below: | | | | | | | | | | | | | | 2013 | | 2012 | | | 2016 | | 2015 | Deferred tax assets (liabilities): | | | | | | | | | | | Start-up costs | | $ | 8,851,000 | | | $ | 10,367,000 | | | $ | 6,662,000 | | $ | 8,886,000 | Capitalized research and development costs | | | 24,844,000 | | | | 23,658,000 | | | | 23,012,000 | | | 29,781,000 | Reserves and accruals | | | 4,530,000 | | | | 3,447,000 | | | | 8,933,000 | | | 8,121,000 | Property and equipment | | | 105,000 | | | | 143,000 | | | | 83,000 | | | 107,000 | Research and development credit | | | 1,508,000 | | | | 486,000 | | | | 2,198,000 | | | 1,972,000 | Net operating loss carryforwards | | | 12,198,000 | | | | 9,185,000 | | | | 41,657,000 | | | 25,695,000 | | | | | | | | | Total gross deferred tax assets | | | 52,036,000 | | | | 47,286,000 | | | | 82,545,000 | | | 74,562,000 | Valuation allowance | | | (52,036,000 | ) | | | (47,286,000 | ) | | | (82,545,000) | | | (74,562,000) | | | | | | | | | Net deferred tax assets | | $ | — | | | $ | — | | | $ | — | | $ | — | | | | | | | | |
In assessing the realization of deferred tax assets, management considers whether it is more likely than not that some portion or all of the deferred tax assets will not be realized. The ultimate realization of deferred tax assets is dependent upon the generation of future taxable income during periods in which those temporary differences become deductible. In addition, certain limitations imposed under the Internal Revenue Code (IRC) could further limit the Company’s realization of these deferred tax assets in the event of changes in ownership of the Company, (as described below). as defined by IRC Section 382. Based on the level of historical taxable losses and projections of future taxable income (losses) over the periods in which the deferred tax assets can be realized, management currently believes that it is more likely than not that the Company will not realize the benefits of these deductible differences. Accordingly, the Company has provided a valuation allowance against the gross deferred tax assets as of December 31, 20132016 and 2012.2015. As of December 31, 2013, the Company has generated U.S. federal
The Company’s ability to utilize its net operating loss carryforwards of approximately $81.2 million. Of this amount, approximately $33.1 million is available after the application of Section 382 limitations described below. Of the total federal net operating loss, $221,000 would result in tax benefits recorded to additional paid-in capital. The federal net operating loss carryforwards expire in the years 2022 through 2033. EnteroMedics Inc.
(A development stage company)
Notes to Consolidated Financial Statements (Continued)
The IRC imposes restrictions on the utilization of various carryforward tax attributes in the event of a change in ownership of the Company, as defined by IRC Section 382. In addition, IRC Section 382 may limit the Company’sand built-in items of deduction, including capitalized start-up costs and research and development costs.costs, may be substantially limited due to ownership changes that may have occurred or that could occur in the future. These ownership changes may limit the amount of net operating loss carryforwards and built-in items of deduction that can be utilized annually to offset future taxable income. In general, an ownership change, as defined in IRC Section 382, results from a transaction or series of transactions over a three-year period resulting in an ownership change of more than 50% of the outstanding stock of a company by certain stockholders or public groups. During 2011, the Company completed an IRC Section 382 review and the results of thisthe review indicateindicated that ownership changes had occurred. While the Company has not completed an IRC Section 382 review since 2011, it believes that it is likely that additional ownership changes have occurred which would cause a limitation onsince then. Since the Company has experienced an ownership change, utilization of carryforward attributes. The Company’s gross net operating loss carryforwards, start-up costs and research and development creditsattributes are all subject to limitation. Under these tax provisions,an annual limitation, which is determined by first multiplying the limitation is applied first to any built-in losses, then to any net operating lossesvalue of the Company’s common stock at the time of the ownership change by the applicable long-term, tax-exempt rate, and then could be subject to any general business credits. The Section 382additional adjustments, as required. Any such limitation and accompanying recognized built-in loss limitation is currently estimated tomay result in the expiration of $48.1 milliona significant portion of the Company’s gross federal net operatingcarryforward attributes before utilization and the permanent loss of built-in items of deduction. Any carryforward as wellattributes that expire prior to utilization or permanent loss of built-in items of deduction as a write-offresult of $5.9 millionsuch limitations will be removed from deferred tax assets with a corresponding adjustment to the valuation allowance.
As of December 31, 2013 and 2012, there were no unrecognized tax benefits. Accordingly, a tabular reconciliation from beginning to ending periods is not provided. The2016, the Company has generated U.S. federal net operating loss carryforwards of approximately $161.4 million. Of the total federal net operating loss, $48.0 million will classify any future interest and penaltiesexpire unused as a componentresult of the 2011 Section 382 limitation and $221,000 are generated from excess tax benefits not yet recorded to the income tax expense if incurred. To date, there have been no interest or penalties charged or accrued in relation to unrecognized tax benefits. The Company doespayable, such that they are not anticipate that the total amount of unrecognized tax benefits will change significantlyreflected in the next twelve months.deferred tax asset balance. The federal net operating loss carryforwards expire in the years 2022 through 2036. The Company’s research and development credit carryforwards, if not used, begin to expire in 2024.
The
Net operating loss carryforwards of the Company are subject to review and possible adjustment by the taxing authorities. With certain exceptions (e.g. the net operating loss carryforwards), the Company is no longer subject to U.S. federal, state or local examinations by tax authorities for the years 2010 forward.prior to 2013. There are no tax examinations currently in progress. (12)Stock Options The Company has adopted the Second Amended and Restated 2003 Stock Incentive Plan (the Plan) that includes both incentive stock options and nonqualified stock options to be granted to employees, officers, consultants, independent contractors, directors and affiliates of the Company. At December 31, 20132016 and 2012,2015, according to the Plan 12,300,00040,000,000 and 18,857 shares, have beenrespectively, were authorized and reserved. Pursuant to the terms of the Plan, the shares authorized under the Plan were not adjusted automatically as part of the Second Reverse Stock Split. Instead, pursuant to the terms of the Plan, the board of directors exercised its power to adjust the number of shares authorized under the Plan as it determines is necessary after a stock split or other similar event to prevent dilution or enlargement of the benefits intended to be made available under the Plan. On February 8, 2017, pursuant to the terms of the Plan, the board of directors adjusted the number of shares authorized under the Plan to 3,000,000 shares as a result of the recapitalization of the Company consisting of the Second Reverse Stock Split and the public offering of the Company’s stock which closed on January 23, 2017. Pursuant to the terms of the Plan, the board of directors is required to adjust the number of shares authorized under the Plan as it determines necessary after a recapitalization or other similar corporate transaction to prevent dilution or enlargement of the benefits or potential benefits intended to be made available under the Plan. The board of directors establishes the terms and conditions of all stock option grants, subject to the Plan and applicable provisions of the IRC. Incentive stock options must be granted at an exercise price not less than the fair market value of the common stock on the grant date. The options granted to participants owning more than 10% of the Company’s outstanding voting stock must be granted at an exercise price not less than 110% of fair market value of the common stock on the grant date. The options expire on the date determined by the board of directors, but may not extend more than 10 years from the grant date, while incentive stock options granted to participants owning more than 10% of the Company’s outstanding voting stock expire five years from the grant date. The vesting period for employees is generally over four years. The vesting period for nonemployees is determined based on the services being provided. On September 27, 2012, a special meeting
EnteroMedics Inc.
(A development stage company)
Notes to Consolidated Financial Statements (Continued)
Stock option activity for the Plan is as follows: | | | | | | | | | | | | | | | | | | | | Shares
Available For
Grant | | | Outstanding Options | | | Aggregate
Intrinsic
Value | | | | | | Number of
Shares | | | Weighted-Average
Exercise Price | | | Shares reserved at Plan inception | | | 7,143 | | | | — | | | $ | — | | | | | | | | | | | | | | | | | | | | | | | Balance, December 31, 2003 | | | 7,143 | | | | — | | | | — | | | | | | Shares reserved | | | 73,260 | | | | — | | | | — | | | | | | Options granted | | | (57,466 | ) | | | 57,466 | | | | 2.76 | | | | | | Options exercised | | | — | | | | — | | | | — | | | | | | Options cancelled | | | 641 | | | | (641 | ) | | | 2.76 | | | | | | | | | | | | | | | | | | | | | | | Balance, December 31, 2004 | | | 23,578 | | | | 56,825 | | | | 2.76 | | | | | | Shares reserved | | | 113,148 | | | | — | | | | — | | | | | | Options granted | | | (84,028 | ) | | | 84,028 | | | | 2.76 | | | | | | Options exercised | | | — | | | | (4,926 | ) | | | 2.76 | | | | | | Options cancelled | | | 7,209 | | | | (7,209 | ) | | | 2.76 | | | | | | | | | | | | | | | | | | | | | | | Balance, December 31, 2005 | | | 59,907 | | | | 128,718 | | | | 2.76 | | | | | | Shares reserved | | | 94,449 | | | | — | | | | — | | | | | | Options granted | | | (113,277 | ) | | | 113,277 | | | | 6.90 | | | | | | Options exercised | | | — | | | | (14,498 | ) | | | 2.76 | | | | | | Options cancelled | | | 17,237 | | | | (17,237 | ) | | | 2.76 | | | | | | | | | | | | | | | | | | | | | | | Balance, December 31, 2006 | | | 58,316 | | | | 210,260 | | | | 5.00 | | | | | | Shares reserved | | | 362,183 | | | | — | | | | — | | | | | | Options granted | | | (176,098 | ) | | | 176,098 | | | | 45.78 | | | | | | Options exercised | | | — | | | | (5,851 | ) | | | 3.65 | | | | | | Options cancelled | | | 30,416 | | | | (30,416 | ) | | | 74.71 | | | | | | | | | | | | | | | | | | | | | | | Balance, December 31, 2007 | | | 274,817 | | | | 350,091 | | | | 19.48 | | | | | | Shares reserved | | | — | | | | — | | | | — | | | | | | Options granted | | | (221,838 | ) | | | 221,838 | | | | 45.56 | | | | | | Options exercised | | | — | | | | (16,820 | ) | | | 3.89 | | | | | | Options cancelled | | | 89,019 | | | | (89,019 | ) | | | 38.69 | | | | | | | | | | | | | | | | | | | | | | | Balance, December 31, 2008 | | | 141,998 | | | | 466,090 | | | | 28.79 | | | | | | Shares reserved | | | 500,000 | | | | — | | | | — | | | | | | Options granted | | | (692,645 | ) | | | 692,645 | | | | 14.68 | | | | | | Options exercised | | | — | | | | (13,437 | ) | | | 2.79 | | | | | | Options cancelled | | | 149,736 | | | | (149,736 | ) | | | 31.20 | | | | | | | | | | | | | | | | | | | | | | | Balance, December 31, 2009 | | | 99,089 | | | | 995,562 | | | | 18.96 | | | | | | Shares reserved | | | 1,149,817 | | | | — | | | | — | | | | | | Options granted | | | (423,789 | ) | | | 423,789 | | | | 1.96 | | | | | | Options exercised | | | — | | | | (8,592 | ) | | | 2.76 | | | | | | Options cancelled | | | 598,244 | | | | (598,244 | ) | | | 25.29 | | | | | | | | | | | | | | | | | | | | | | | Balance, December 31, 2010 | | | 1,423,361 | | | | 812,515 | | | | 5.60 | | | | | | Shares reserved | | | 2,000,000 | | | | — | | | | — | | | | | | Options granted | | | (2,716,464 | ) | | | 2,716,464 | | | | 2.44 | | | | | | Options exercised | | | — | | | | (1,139 | ) | | | 1.90 | | | | | | Options cancelled | | | 56,932 | | | | (56,932 | ) | | | 3.21 | | | | | | | | | | | | | | | | | | | | | | | Balance, December 31, 2011 | | | 763,829 | | | | 3,470,908 | | | | 3.17 | | | | | | Shares reserved | | | 8,000,000 | | | | — | | | | — | | | | | | Options granted | | | (4,462,873 | ) | | | 4,462,873 | | | | 3.35 | | | | | | Options exercised | | | — | | | | (5,219 | ) | | | 2.43 | | | | | | Options cancelled | | | 93,029 | | | | (93,029 | ) | | | 2.79 | | | | | | | | | | | | | | | | | | | | | | | Balance, December 31, 2012 | | | 4,393,985 | | | | 7,835,533 | | | | 3.28 | | | $ | 1,359,840 | | | | | | | | | | | | | | | | | | | Shares reserved | | | — | | | | — | | | | — | | | | | | Options granted | | | (4,346,000 | ) | | | 4,346,000 | | | | 1.32 | | | | | | Options exercised | | | — | | | | — | | | | — | | | | | | Options cancelled | | | 494,233 | | | | (494,233 | ) | | | 3.00 | | | | | | | | | | | | | | | | | | | | | | | Balance, December 31, 2013 | | | 542,218 | | | | 11,687,300 | | | $ | 2.56 | | | $ | 3,284,696 | | | | | | | | | | | | | | | | | | |
| | | | | | | | | | | | | | | Outstanding Options | | | | | | | | | | | | | | | | | Shares | | | | | | | Aggregate | | | Available For | | Number of | | Weighted-Average | | Intrinsic | | | Grant | | Shares | | Exercise Price | | Value | Balance, December 31, 2013 | | 519 | | 11,129 | | $ | 2,660.00 | | | | Shares reserved | | 7,143 | | — | | | — | | | | Options granted | | (1,197) | | 1,197 | | | 1,712.00 | | | | Options exercised | | — | | — | | | — | | | | Options cancelled | | 275 | | (275) | | | 2,528.00 | | | | | | | | | | | | | | | Balance, December 31, 2014 | | 6,740 | | 12,051 | | | 2,597.00 | | $ | 519,546 | Shares reserved | | — | | — | | | | | | | Options granted | | (3,238) | | 3,238 | | | 1,104.00 | | | | Options exercised | | — | | — | | | | | | | Options cancelled | | 735 | | (735) | | | 1,942.00 | | | | | | | | | | | | | | | Balance, December 31, 2015 | | 4,237 | | 14,554 | | | 2,298.00 | | | | Shares reserved (1) | | 2,976,486 | | — | | | — | | | | Options granted | | (2,174) | | 2,174 | | | 45.35 | | | | Options exercised | | — | | — | | | — | | | | Options cancelled | | 9,694 | | (9,694) | | | 2,134.47 | | | | | | | | | | | | | | | Balance, December 31, 2016 | | 2,988,243 | | 7,034 | | $ | 1,824.87 | | $ | — |
EnteroMedics Inc.(1)Reflects the board of directors’ February 8, 2017 adjustment of number of shares reserved under the Plan from 40,000,000 to 3,000,000.
(A development stage company)
NotesOn June 27, 2016 the Company completed an option exchange offer to Consolidated Financial Statements (Continued)its employees whereby certain outstanding options to purchase shares of the Company’s common stock were tendered by employees in exchange for new options with the exercise price to be set at the then current market price of the Company’s common stock. Options to purchase 6,424 shares of the Company’s common stock, which included all the options eligible for exchange, were tendered by employees and cancelled by the Company. On the same date, options to purchase 1,083 shares of the Company’s common stock were issued with an exercise price of $23.28 per share, which was the Company’s closing stock price on June 27, 2016. Because the fair value of the tendered options immediately before the exchange approximated the fair value of the new options granted, no additional compensation expense was recognized.
In addition to the stock options granted pursuant to the Plan, the Company from time to time grants options to individuals as an inducement to accepting management positions (Inducement Grants). These Inducement Grants are made at the discretion of the board of directors and our issued outside of the Plan. Inducement Grants are summarized below: | | | | | | | | | | | | | | | Outstanding Options | | | | | | | | | | | | | | | | | Shares | | | | | | | Aggregate | | | Available For | | Number of | | Weighted-Average | | Intrinsic | | | Grant | | Shares | | Exercise Price | | Value | Balance, December 31, 2014 | | — | | — | | | — | | | | Shares reserved | | 7,380 | | — | | | | | | | Options granted | | (7,380) | | 7,380 | | $ | 262.50 | | | | Options exercised | | — | | — | | | | | | | Options cancelled | | — | | — | | | — | | | | | | | | | | | | | | | Balance, December 31, 2015 | | — | | 7,380 | | | 262.50 | | $ | — | Shares reserved | | 5,426 | | — | | | — | | | | Options granted | | (5,426) | | 5,426 | | | 94.05 | | | | Options exercised | | — | | — | | | — | | | | Options cancelled | | — | | — | | | — | | | | | | | | | | | | | | | Balance, December 31, 2016 | | — | | 12,806 | | $ | 191.12 | | $ | — |
Each of the Inducement Grants will vest as follows: 25% of the shares will vest as of one year from the date of the officer’s employment agreement, and the remaining 75% of the shares will then vest in equal 2.0833% installments each month thereafter for 36 months. The options awarded as Inducement Grants were not eligible for the option exchange program The options outstanding, vested and currently exercisable for the Plan and Inducement Grants are set forth by exercise price at December 31, 2013:2016 in the following table: | | | | | | | | | | | | | | | | | | | | | | | | | Outstanding Options and Expected to Vest | | | Options Exercisable and Vested | | Exercise
Price | | Number of
Shares
Outstanding | | | Weighted-Average
Remaining
Contractual Life
(Years) | | | Aggregate
Intrinsic
Value | | | Number of
Options | | | Weighted-Average
Exercise Price | | | Aggregate
Intrinsic
Value | | $0.01 to $2.00 | | | 5,274,326 | | | | 8.7 | | | $ | 3,284,696 | | | | 1,339,740 | | | $ | 1.61 | | | $ | 573,861 | | $2.01 to $3.00 | | | 2,208,857 | | | | 6.8 | | | | — | | | | 1,508,012 | | | | 2.63 | | | | — | | $3.01 to $5.00 | | | 4,086,635 | | | | 8.4 | | | | — | | | | 1,551,542 | | | | 3.43 | | | | — | | $5.01 to $10.00 | | | 4,166 | | | | 5.1 | | | | — | | | | 4,166 | | | | 8.40 | | | | — | | > $10.00 | | | 113,316 | | | | 4.3 | | | | — | | | | 113,316 | | | | 23.97 | | | | — | | | | | | | | | | | | | | | | | | | | | | | | | | | | | | 11,687,300 | | | | | | | $ | 3,284,696 | | | | 4,516,776 | | | $ | 3.14 | | | $ | 573,861 | | | | | | | | | | | | | | | | | | | | | | | | | | |
| | | | | | | | | | | | | | | | | | Outstanding Options and Expected to Vest | | Options Exercisable and Vested | | | | | Weighted-Average | | | | | | | | | | | | | | Number of | | Remaining | | Aggregate | | | | | | | Aggregate | Exercise | | Shares | | Contractual Life | | Intrinsic | | Number of | | Weighted-Average | | Intrinsic | Price | | Outstanding | | (Years) | | Value | | Options | | Exercise Price | | Value | $0.01 to $25.00 | | 829 | | 9.5 | | $ | — | | 498 | | $ | 23.12 | | $ | — | $25.01 to $175.00 | | 6,416 | | 9.1 | | | — | | 846 | | | 72.56 | | | — | $175.01 to $350.00 | | 7,644 | | 8.8 | | | — | | 2,407 | | | 260.78 | | | — | $350.01 to $1,475.00 | | 2,073 | | 7.2 | | | — | | 2,041 | | | 1,321.12 | | | — | > $1,475.00 | | 2,878 | | 5.1 | | | — | | 2,870 | | | 3,460.40 | | | — | | | 19,840 | | | | $ | — | | 8,662 | | $ | 1,538.71 | | $ | — |
Stock-Based Compensation for Nonemployees Stock-based compensation expenses related to stock options granted to nonemployees is recognized as the stock options are earned. The Company believes that the fair value of the stock options is more reliably measurable than the fair value of the services received. The fair value of the stock options granted is calculated at each reporting date, using the Black-Scholes option-pricing model, until the award vests or there is a substantial disincentive for the nonemployee not to perform the required services. The fair value for the years ended December 31, 2013, 20122015 and 20112014 was calculated using the following assumptions, defined below: | | | | | | | | | | | | | | | | | Year Ended December 31, | | | | | Years Ended December 31, | | | | | | | | | | | 2013 | | 2012 | | 2011 | | 2016 | | 2015 | | 2014 | | Risk-free interest rates | | 0.26%–2.98% | | 0.24%–2.05% | | 0.26%–3.45% | | N/A | | 0.02%–2.10% | | 0.08%–2.63% | | Expected life | | 1.50 years–9.76 years | | 2.00 years–9.25 years | | 2.04 years–9.95 years | | N/A | | 0.08 years–8.51 years | | 0.50 years–9.51 years | | Expected dividends | | 0% | | 0% | | 0% | | N/A | | 0% | | 0% | | Expected volatility | | 80.00%–143.00% | | 63.48%–142.25% | | 79.50%–123.80% | | N/A | | 37.36%–132.01% | | 56.54%–139.65% | |
Stock-based compensation expense charged to operations on options granted to nonemployees for the years ended December 31, 2013, 20122016, 2015 and 20112014 was $166,679, $52,190$3,535, $(34,712) and $75,614, respectively, and $1,776,280 for the period from December 19, 2002 (inception) to December 31, 2013.$181,323, respectively.
Employee Stock-Based Awards Granted on or Subsequent to January 1, 2006 On January 1, 2006, the Company adopted the fair value method of accounting for the issuance of stock-based payments, using the prospective transition method. Under this transition method, beginning January 1, 2006, compensation cost recognized includes: (a) compensation cost for all stock-based awards granted prior to, but not yet vested as of December 31, 2005, based on the intrinsic value method, and (b) compensation cost for all stock-based payments granted or modified subsequent to December 31, 2005, based on the estimated grant-date fair value.
Compensation cost for employee stock-based awards is based on the estimated grant-date fair value and is recognized over the vesting period of the applicable award on a straight-line basis. The weighted average estimated fair value of the employee stock options granted for the years ended December 31, 2013, 20122016, 2015 and 20112014 was $1.22, $3.19$60.00, $426.30, and $2.13$1,486.00 per share, respectively. EnteroMedics Inc.
(A development stage company)
Notes to Consolidated Financial Statements (Continued)
The Company uses the Black-Scholes pricing model to determine the fair value of stock options. The determination of the fair value of stock-based payment awards on the date of grant is affected by the Company’s stock price as well as assumptions regarding a number of complex and subjective variables. These variables include the Company’s expected stock price volatility over the term of the awards, actual and projected employee stock option exercise behaviors, risk-free interest rates and expected dividends. The estimated grant-date fair values of the employee stock options were calculated using the Black-Scholes valuation model, based on the following assumptions for the years ended December 31, 2013, 20122016, 2015 and 2011:2014: | | | | | | | | | | | | | | | | | Year Ended December 31, | | | | | Years Ended December 31, | | | | | | | | | | | 2013 | | 2012 | | 2011 | | 2016 | | 2015 | | 2014 | | Risk-free interest rates | | 0.94%–1.33% | | 0.90%–1.09% | | 1.13%–2.68% | | 0.87%–1.64% | | 1.49%–1.80% | | 1.73%–1.96% | | Expected life | | 6.00 years–6.25 years | | 6.00 years–6.25 years | | 5.42 years–6.25 years | | 4.0 years–6.25 years | | 5.50 years–6.25 years | | 6.00 years–6.25 years | | Expected dividends | | 0% | | 0% | | 0% | | 0% | | 0% | | 0% | | Expected volatility | | 148.00%–149.00% | | 137.58%–143.98% | | 114.80%–124.40% | | 88.43%–114.38% | | 83.36%–111.77% | | 118.64%–120.70% | |
Expected Life. The expected life is based on the “simplified” method described in the SEC Staff Accounting Bulletin, Topic 14:Share-Based Payment. Volatility. Since the Company was a private entity for most of 2007 and a limited amount of historical data regarding the volatility of its common stock was available, the expected volatility used for 2012 and 2011 was based on both the volatility of similar entities, referred to as “guideline” companies, and the Company’s historical volatility. In evaluating similarity, the Company considered factors such as industry, stage of life cycle and size. Effective with the year ended December 31, 2013, the The expected volatility was based solely on the Company’s historical volatility. Risk-Free Interest Rate. The risk-free rate is based on the daily yield curve rate from the U.S. Treasury with remaining terms similar to the expected term on the options. Dividend Yield. The Company has never declared or paid any cash dividends and does not plan to pay cash dividends in the foreseeable future, and, therefore, used an expected dividend yield of zero in the valuation model. Forfeitures.The Company is required to estimate forfeitures at the time of grant, and revise those estimates in subsequent periods if actual forfeitures differ from those estimates. The Company uses historical data to estimate pre-vesting option forfeitures and record stock-based compensation expense only for those awards that are expected to vest. All stock-based payment awards are amortized on a straight-line basis over the requisite service periods of the awards, which are generally the vesting periods. If the Company’s actual forfeiture rate is materially different from its estimate, the stock-based compensation expense could be significantly different from what the Company has recorded in the current period. As of December 31, 20132016 there was approximately $13.9$2.8 million of total unrecognized compensation costs, net of estimated forfeitures, related to employee unvested stock option awards, granted after January 1, 2006, which are expected to be recognized over a weighted-average period of 3.662.2 years. The aggregate intrinsic value of stock options (the amount by which the market price of the stock on the date of exercise exceeded the exercise price of the option) exercised during the years ended December 31, 2012 and 2011, was $3,044 and $588, respectively.
There were no stock option exercises for the yearyears ended December 31, 2013. EnteroMedics Inc.
(A development stage company)
Notes to Consolidated Financial Statements (Continued)
2016, 2015 and 2014. (13)Warrants Stock warrant activity is as follows: | | | | | | | | | | | | | | | | | | | | | | | | | | | | | | | | | | | | Common
Shares | | | Price(1) | | | Series A
Preferred
Shares | | | Price(1) | | | Series B
Preferred
Shares | | | Price(1) | | | Series C
Preferred
Shares | | | Price(1) | | Balance as of: | | | | | | | | | | | | | | | | | | | | | | | | | | | | | | | | | December 31, 2002 | | | — | | | | | | | | — | | | | | | | | — | | | | | | | | — | | | | | | Granted | | | — | | | | | | | | 20,963 | | | $ | 5.46 | | | | 3,916 | | | $ | 23.68 | | | | — | | | | | | Exercised | | | — | | | | | | | | — | | | | | | | | — | | | | | | | | — | | | | | | Cancelled | | | — | | | | | | | | — | | | | | | | | — | | | | | | | | — | | | | | | | | | | | | | | | | | | | | | | | | | | | | | | | | | | | | | | | December 31, 2003 | | | — | | | | | | | | 20,963 | | | $ | 5.46 | | | | 3,916 | | | $ | 23.68 | | | | — | | | | | | Granted | | | — | | | | | | | | — | | | | | | | | 16,859 | | | $ | 23.68 | | | | — | | | | | | Exercised | | | — | | | | | | | | (20,963 | ) | | $ | 8.95 | | | | — | | | | | | | | — | | | | | | Cancelled | | | — | | | | | | | | — | | | | | | | | — | | | | | | | | — | | | | | | | | | | | | | | | | | | | | | | | | | | | | | | | | | | | | | | | December 31, 2004 | | | — | | | | | | | | — | | | | | | | | 20,775 | | | $ | 23.68 | | | | — | | | | | | Granted | | | 28,385 | | | $ | 2.76 | | | | — | | | | | | | | 11,624 | | | $ | 23.68 | | | | — | | | | | | Exercised | | | — | | | | | | | | — | | | | | | | | — | | | | | | | | — | | | | | | Cancelled | | | — | | | | | | | | — | | | | | | | | — | | | | | | | | — | | | | | | | | | | | | | | | | | | | | | | | | | | | | | | | | | | | | | | | December 31, 2005 | | | 28,385 | | | $ | 2.76 | | | | — | | | | | | | | 32,399 | | | $ | 23.68 | | | | — | | | | | | Granted | | | — | | | | | | | | — | | | | | | | | 5,811 | | | $ | 23.68 | | | | 24,605 | | | $ | 48.56 | | Exercised | | | — | | | | | | | | — | | | | | | | | — | | | | | | | | — | | | | | | Cancelled | | | — | | | | | | | | — | | | | | | | | — | | | | | | | | — | | | | | | | | | | | | | | | | | | | | | | | | | | | | | | | | | | | | | | | December 31, 2006 | | | 28,385 | | | $ | 2.76 | | | | — | | | | | | | | 38,210 | | | $ | 23.68 | | | | 24,605 | | | $ | 48.56 | | Granted | | | — | | | | | | | | — | | | | | | | | — | | | | | | | | 22,650 | | | $ | 48.56 | | Exercised | | | — | | | | | | | | — | | | | | | | | — | | | | | | | | — | | | | | | Cancelled | | | — | | | | | | | | — | | | | | | | | — | | | | | | | | — | | | | | | Converted upon close of IPO | | | 85,465 | | | $ | 37.44 | | | | — | | | | | | | | (38,210 | ) | | $ | 23.68 | | | | (47,255 | ) | | $ | 48.56 | | | | | | | | | | | | | | | | | | | | | | | | | | | | | | | | | | | December 31, 2007 | | | 113,850 | | | $ | 28.79 | | | | — | | | | | | | | — | | | | | | | | — | | | | | | Granted(2) | | | 179,328 | | | $ | 9.51 | | | | — | | | | | | | | — | | | | | | | | — | | | | | | Exercised | | | — | | | | | | | | — | | | | | | | | — | | | | | | | | — | | | | | | Cancelled | | | — | | | | | | | | — | | | | | | | | — | | | | | | | | — | | | | | | | | | | | | | | | | | | | | | | | | | | | | | | | | | | | | | | | December 31, 2008 | | | 293,178 | | | $ | 17.00 | | | | — | | | | | | | | — | | | | | | | | — | | | | | | Granted(2)(3) | | | 1,540,036 | | | $ | 7.86 | | | | — | | | | | | | | — | | | | | | | | — | | | | | | Exercised(3) | | | (264,120 | ) | | $ | 8.49 | | | | — | | | | | | | | — | | | | | | | | — | | | | | | Cancelled(3) | | | (236,759 | ) | | $ | 9.53 | | | | — | | | | | | | | — | | | | | | | | — | | | | | | | | | | | | | | | | | | | | | | | | | | | | | | | | | | | | | | | December 31, 2009 | | | 1,332,335 | | | $ | 9.44 | | | | — | | | | | | | | — | | | | | | | | — | | | | | | Granted(2)(3) | | | 21,046,376 | | | $ | 2.19 | | | | — | | | | | | | | — | | | | | | | | — | | | | | | Exercised | | | — | | | | | | | | — | | | | | | | | — | | | | | | | | — | | | | | | Cancelled(3) | | | (153,993 | ) | | $ | 5.78 | | | | — | | | | | | | | — | | | | | | | | — | | | | | | | | | | | | | | | | | | | | | | | | | | | | | | | | | | | | | | | December 31, 2010 | | | 22,224,718 | | | $ | 2.60 | | | | — | | | | | | | | — | | | | | | | | — | | | | | | Granted(2) | | | 1,759,997 | | | $ | 1.90 | | | | — | | | | | | | | — | | | | | | | | — | | | | | | Exercised | | | (59,219 | ) | | $ | 2.19 | | | | — | | | | | | | | — | | | | | | | | — | | | | | | Cancelled | | | (2,195 | ) | | $ | 23.68 | | | | — | | | | | | | | — | | | | | | | | — | | | | | | | | | | | | | | | | | | | | | | | | | | | | | | | | | | | | | | | December 31, 2011 | | | 23,923,301 | | | $ | 2.55 | | | | — | | | | | | | | — | | | | | | | | — | | | | | | Granted(2) | | | 106,746 | | | $ | 2.34 | | | | — | | | | | | | | — | | | | | | | | — | | | | | | Exercised | | | (2,813,600 | ) | | $ | 2.18 | | | | — | | | | | | | | — | | | | | | | | — | | | | | | Cancelled | | | — | | | | | | | | — | | | | | | | | — | | | | | | | | — | | | | | | | | | | | | | | | | | | | | | | | | | | | | | | | | | | | | | | | December 31, 2012 | | | 21,216,447 | | | $ | 2.60 | | | | — | | | | | | | | — | | | | | | | | — | | | | | | Granted(2) | | | 5,508,000 | | | $ | 1.14 | | | | — | | | | | | | | — | | | | | | | | — | | | | | | Exercised | | | (20,325 | ) | | $ | 1.38 | | | | — | | | | | | | | — | | | | | | | | — | | | | | | Cancelled | | | (1,153,497 | ) | | $ | 9.14 | | | | — | | | | | | | | — | | | | | | | | — | | | | | | | | | | | | | | | | | | | | | | | | | | | | | | | | | | | | | | | December 31, 2013 | | | 25,550,625 | | | $ | 1.99 | | | | — | | | | | | | | — | | | | | | | | — | | | | | | | | | | | | | | | | | | | | | | | | | | | | | | | | | | | | | | |
(1) | Represents weighted-average exercise price per share. |
(2) | See Notes 7 and 8 for discussions relating to the issuance of warrants in 2013, 2012, 2011, 2010, 2009 and 2008. |
(3) | See Note 7 for discussions relating to both the cashless exercises of warrants in 2009 and the cancellation and reissuance of warrants following down round equity financings. |
| | | | | | | | | | Weighted | | | | | Average | | | Common | | Exercise | | | Shares | | Price | Balance, December 31, 2013 | | 24,331 | | $ | 1,964.90 | Granted | | — | | | — | Exercised | | (1,265) | | | 1,772.40 | Cancelled | | (22) | | | 50,988.00 | Balance, December 31, 2014 | | 23,044 | | | 1,929.20 | Granted (1) | | 32,155 | | | 116.20 | Exercised | | — | | | — | Cancelled | | (324) | | | 2,299.50 | Balance, December 31, 2015 | | 54,875 | | | 1,929.20 | Granted (1) | | 19,308 | | | 325.50 | Exercised | | (1,428) | | | 3.50 | Cancelled | | (17,706) | | | 2,257.50 | Balance, December 31, 2016 | | 55,049 | | $ | 238.90 |
EnteroMedics Inc.
(A development stage company)
(1)See Notes 8 and 10 for discussions relating to Consolidated Financial Statements (Continued)the issuance of warrants in 2016 and 2015. At December 31, 20132016 and 2012,2015, the weighted-average remaining contractual life of outstanding warrants was 2.872.76 and 3.332.18 years, respectively. All of the warrants outstanding are currently exercisable at the option of the holder into the equivalent number of shares of common stock. (13)(14) | Related Party Transactions |
Public Offerings
As discussed in Note 8, on September 28, 2011, the Company closed a public offering, selling 8,800,000 shares of common stock, together with warrants to purchase approximately 1,760,000 shares of common stock at an aggregate price of $1.65 per share and corresponding warrant. The following principal stockholder, purchased shares of common stock and warrants at a price of $1.65 per share and corresponding warrant. The shares purchased, together with the proceeds, before expenses, to the Company, are shown in the table below:.
| | | | | | | | | | | | | Beneficial Owner | | Shares
Purchased | | | Warrants
Purchased | | | Proceeds, before
expenses, to the Company | | Bay City Capital | | | 840,000 | | | | 167,999 | | | $ | 1,386,000 | |
Carl Goldfischer, M.D. is a director of the Company and is a managing director of Bay City Capital LLC.
As discussed in Note 8, on February 27, 2013, the Company closed a public offering, selling 13,770,000 shares of common stock, together with warrants to purchase approximately 5,508,000 shares of common stock at an aggregate price of $0.95 per share and corresponding warrant. The following principal stockholder, purchased shares of common stock and warrants at a price of $0.95 per share and corresponding warrant. The shares purchased, together with the proceeds, before expenses, to the Company, are shown in the table below:
| | | | | | | | | | | | | Beneficial Owner | | Shares
Purchased | | | Warrants
Purchased | | | Proceeds, before
expenses, to the Company | | Anthony Jansz | | | 150,000 | | | | 60,000 | | | $ | 142,500 | |
Anthony Jansz is a director of the Company.
Consulting Agreement—Anthony Jansz Effective June 1, 2011, the
The Company entered into a four year consulting agreement with Anthony Jansz, who is a former member of the board of directors. Pursuant todirectors, for the agreement, inperiod from June 1, 2011 through April 30, 2015. In exchange for consulting services provided, Mr. Jansz iswas entitled to receive a consulting fee of $96,000 AUD (approximately $86,000 USD as of December 31, 2013) per yearfees and the reimbursement of reasonable expenses. Mr. Jansz also received an optionoptions to purchase 50,00016,663 shares of common stock at $2.76 per share that vest in 48 equal monthly installments beginning on July 1, 2011. The full grant date fair valuea weighted average exercise price of the option grant was approximately $108,000. On December 20, 2012, the Company entered into an amendment, effective October 1, 2012, to the consulting agreement with Mr. Jansz. Pursuant to the amendment, during the period from October 1, 2012 until June 30, 2013, Mr. Jansz agreed to commit additional time to performing consulting services for the Company. In exchange for these additional services, Mr. Jansz is entitled to receive a consulting fee of $12,000 AUD (approximately $11,000 USD as of December 31, 2013) per month from October 1, 2012 until June 30, 2013. Mr. Jansz also received an option to purchase 75,000 shares of the Company’s common stock on January 22, 2013 at $2.65 per share, which vests as follows: (A) 16,667 of such 75,000 shares vested on January 22, 2013,
EnteroMedics Inc.
(A development stage company)
Notes to Consolidated Financial Statements (Continued)
the date of grant; (B) 16,667 of such 75,000 shares vested on January 22, 2014; (C) 16,666 of such 75,000 shares will vest on January 22, 2015; and (D) the remaining 25,000 of such 75,000 shares will vest upon the occurrence of both (i) the Company successfully obtaining full Australian reimbursement approval for both surgeon’s fees and hospital fees for the VBLOC vagal blocking therapy and the Maestro Rechargeable System from the Australian Medical Services Advisory Committee prior to June 30, 2014 and (ii) the Company successfully obtaining device listing for the Maestro Rechargeable System on the Australian Prostheses List prior to June 30, 2014. The full grant date fair value of the option grant was approximately $153,000.
The Company has continued to pay Mr. Jansz a consulting fee of $12,000 AUD per month subsequent to June 30, 2013 as a result of the additional time he continues to spend providing consulting services to the Company. Mr. Jansz also received an additional option to purchase 100,000 shares of the Company’s common stock on May 31, 2013 at $1.31 per share, which vests as follows: (A) 16,667 of such 100,000 shares vested on May 31, 2013, the date of the grant; (B) 16,667 of such 100,000 shares will vest on May 31, 2014; (C) 16,666 of such 100,000 shares will vest on May 31, 2015; (D) 25,000 of such 100,000 shares would have vested upon the implementation of the Australian Specialty Clinic Commercial Validation Project as evidenced by the implantation of 10 or more Maestro Rechargeable Systems in an Australian Clinic prior to December 31, 2013; and (E) the remaining 25,000 of such 100,000 shares will vest upon the Company successfully obtaining an Item Listing for Maestro Rechargeable System implantation by December 31, 2014. The Australian Specialty Clinic Commercial Validation Project was not implemented prior to December 31, 2013 resulting in 25,000 shares not vesting. The full grant date fair value of the option grant was approximately $103,000.
$29.78. Total stock-based compensation expense recorded was approximately $126,000, $23,000$600 and $10,000$40,000 for the years ended December 31, 2013, 20122015 and 2011,2014, respectively. Due to a failure to meet certain performance conditions, 471 shares of the options granted to Mr. Jansz did not vest. In addition to the option grant,grants, the Company paid Mr. Jansz approximately $154,000, $195,000$75,000 and $67,000$196,000 in fees and expenses for consulting services provided during the years ended December 31, 2013, 20122015 and 2011,2014, respectively. No consulting fees or expenses were paid to Mr. Jansz in 2016.
Consulting Agreement—Jon Tremmel Effective August 10, 2015, the Company entered into a one year consulting agreement with Jon Tremmel & Associates, LLC, which is wholly-owned by Jon Tremmel, a member of the board of directors. In exchange for consulting services provided, Mr. Tremmel was entitled to receive consulting fees and an option to purchase 16,666 shares of common stock at $3.45 per share. Total stock-based compensation expense recorded was approximately $3,000 and $13,000 for the years ended December 31, 2016 and 2015, respectively. In addition to the option grant, the Company paid Mr. Tremmel approximately $50,000 in fees and expenses for consulting services provided during the year ended December 31, 2015. No consulting fees or expenses were paid to Mr. Tremmel in 2016. Other The Company has entered into an agreement with an advisory firm to provide various consulting services. The advisory firm is partially owned by a company with whom a member of our board of directors is a partner. The Company recognized $146,000$253,000 in selling, general and administrative expense for the year ended December 31, 20132014 for consulting services provided by the advisory firm. (14) | Commitments and Contingencies |
Effective October 1, 2008
(15)Commitments and Contingencies Operating Lease The Company rents its office, warehouse and laboratory facilities under an operating lease, which was originally set to expire on September 30, 2015. On August 25, 2015, the Company entered into a seven-year non-cancelablean amendment extending the term of the operating lease agreement for office/warehouse space. The lease expires onthree years until September 30, 20152018, with monthly base rent ranging from $19,570$18,925 to $24,643.$20,345. Total rent expense recognized for the years ended December 31, 2013, 20122016, 2015 and 20112014, respectively, was $270,872, $270,872$229,000, $262,000 and $270,872 respectively, and $1,894,800 for the period from December 19, 2002 (inception) to December 31, 2013.$271,000. Facility related expenses are included as general and administrative costs on the consolidated statements of operations. The following is a schedule of total future minimum lease payments due as of December 31, 2013:2016: | | | | | Years ending December 31: | | | | 2014 | | $ | 291,369 | | 2015 | | | 221,789 | | | | | | | | | $ | 513,158 | | | | | | |
| | | | Year ending December 31, | | | | 2017 | | $ | 237,749 | 2018 | | | 183,103 | | | $ | 420,852 |
EnteroMedics Inc.
(A development stage company)
Notes to Consolidated Financial Statements (Continued)
Product Liability Claims The Company is exposed to product liability claims that are inherent in the testing, production, marketing and sale of medical devices. Management believes any losses that may occur from these matters are adequately covered by insurance, and the ultimate outcome of these matters will not have a material effect on the Company’s financial position or results of operations. The Company is not currently a party to any litigation and is not aware of any pending or threatened litigation that could have a material adverse effect on the Company’s business, operating results or financial condition. Clinical Trials The Company is evaluating its product, the MaestrovBloc System in human clinical trials, including the EMPOWER trial and ReCharge trial. Both of these clinical trials require patients to be followed out to 60 months. The Company is required to pay for patient follow up visits only to the extent they occur. In the event a patient does not attend a follow up visit, the Company has no financial obligation. The Company is also required to pay for explants or revisions, including potential conversions of ReCharge control devices to active devices, should a patient request or be required to have one during the course of the clinical trials. The Company has no financial obligation unless an explant, revision or conversion is requested or required. Clinical trial costs are expensed as incurred. In 2005,Litigation
On February 28, 2017, the Company received a class action and derivative complaint filed on February 24, 2017 in U. S. District Court for the District of Delaware by Vinh Du, one of the Company’s shareholders. The complaint names as defendants EnteroMedics, entered into an exclusive collaborative obesity device researchthe board of directors and development agreement withfour members of our senior management, namely, Scott Youngstrom, Nick Ansari, Peter DeLange and Paul Hickey, and contains a purported class action claim for breach of fiduciary duty against the Mayo Foundationboard of directors and derivative claims for Medical Educationbreach of fiduciary duty against the board of directors and Research (Mayo Foundation), Rochester, Minnesota. Through this agreement, EnteroMedics collaborated with a group of physicians and researchers at Mayo Clinicunjust enrichment against our senior management. The allegations in the fieldcomplaint relate to the increase in the number of obesity. Undershares authorized for grant under our Second Amended and Restated 2003 Stock Incentive Plan (the “Plan”), which was approved by our shareholders at the termsSpecial Meeting of this five-year agreement, EnteroMedicsShareholders held on December 12, 2016 (the “Special Meeting”), and this groupto our subsequent grant of Mayo specialists collectively worked towardstock options on February 8, 2017, to the developmentCompany’s Directors and senior management to purchase an aggregate of new and innovative medical devices1,093,450 shares of our common stock (the “Option Grants”). In the complaint, the plaintiff contends that (i) the number of shares authorized for grant under the Plan, as adjusted by the board of directors after the Special Meeting for the treatmentsubsequent recapitalization of obesity.the Company, resulted from an alleged breach of fiduciary duties by the board of directors, and (ii) our senior management was allegedly unjustly enriched by the subsequent Option Grants. The agreement also includesplaintiff seeks relief in the form of an order rescinding the Plan as approved by the shareholders at the Special Meeting, an order cancelling the Option Grants, and an award to plaintiff for his costs, including fees and disbursements of attorneys, experts and accountants. We believe the allegations in the complaint are without merit, and intend to defend the action vigorously. Except as disclosed in the foregoing paragraph, the Company is not currently a similar collaboration forparty to any litigation and the developmentCompany is not aware of products to addressany pending or threatened litigation against it that could have a wide variety of disorders susceptible to treatment by electrically blocking neural impulsesmaterial adverse effect on the vagus nerve. Under this agreement,Company’s business, operating results or financial condition. The medical device industry in which the Company issued 36,630 shares of common stock to the Mayo Foundation in 2005operates is characterized by frequent claims and recorded $100,000litigation, including claims regarding patent and other intellectual property rights as deferred compensation, which was amortized over the term of the five-year agreement and was fully amortized in 2010. In accordance with the agreement, upon the closing of the IPO in November 2007,well as improper hiring practices. As a result, the Company was also obligatedmay be involved in various legal proceedings from time to issue 34,341 shares of common stock as consideration to the Mayo Foundation and recorded a one-time stock-based compensation expense of $1.7 million. The stock-based compensation expense is recorded on the consolidated statements of operations as research and development expense.
The Mayo Foundation received an annual $250,000 retainer fee which commenced in 2005 and continued through January 2009. The annual retainer fee paid to the Mayo Foundation is recorded on the consolidated statements of operations as research and development expense.
On March 11, 2010, the Company entered into Amendment No. 1 to the agreement with the Mayo Foundation extending the Company’s collaboration with the Mayo Foundation for a period of two years. Pursuant to the amendment, the Mayo Foundation granted the Company certain royalty-bearing, worldwide exclusive and non-exclusive licenses and committed to the joint collaboration between the Company and a designated group of physicians and researchers at the Mayo Clinic for the development and testing of products for the treatment of obesity, including devices that use electrical signaling to block the vagal nerve, and for the treatment of other gastrointestinal diseases, solely using devices that use electrical signaling to block the vagal nerve. The Mayo Foundation received an annual retainer of $100,000 in 2010 and 2011. The agreement was further amended on January 15, 2011 with Amendment No. 2. Under the terms of Amendment No. 2, the annual retainer the Mayo Foundation received for 2011 was reduced to $75,000. The agreement was further amended on February 3, 2012 with Amendment No. 3. Under the terms of Amendment No. 3, beginning in 2012 the Mayo
EnteroMedics Inc.time.
(A development stage company)(16)
Notes to Consolidated Financial Statements (Continued)Retirement Plan
Foundation will be reimbursed for services provided at an hourly rate only. Amendment No. 3 does not provide for additional annual retainer payments. No other terms were changed by Amendment Nos. 2 or 3. The agreement was further amended on February 3, 2013 and on February 3, 2014 with Amendment Nos. 4 and 5, respectively, extending the joint collaboration between the company and a designated group of physicians and researchers at the Mayo Clinic. No other terms were changed by Amendment Nos. 4 or 5.
The Company may also be obligated to pay the Mayo Foundation, contingent upon the occurrence of certain future events, earned royalty payments, including a minimum annual royalty as defined by the agreement, as amended, for the commercial sale of products developed and patented by the Mayo Foundation, jointly patented by the Company and the Mayo Foundation, or a product where the Mayo Foundation provided know-how as defined by the agreement, as amended. If no products are patented, the minimum royalty is not due.
The Company has a 401(k) profit-sharing plan that provides retirement benefits to employees. Eligible employees may contribute a percentage of their annual compensation, subject to Internal Revenue Service limitations. The Company’s matching is at the discretion of the Company’s board of directors. For the years ended December 31, 2013, 20122016, 2015 and 2011 and for the period from December 19, 2002 (inception) to December 31, 2013,2014, the Company did not provide any matching of employees’ contributions. (16) | Quarterly Data (unaudited) |
(17)Quarterly Data (unaudited) The following table represents certain unaudited quarterly information for each of the eight quarters in the period ended December 31, 2013.2016. In management’s opinion, this information has been prepared on the same basis as the audited consolidated financial statements and includes all the adjustments necessary to fairly state the unaudited quarterly results of operations (in thousands, except per share data). | | | | | | | | | | | | | | | | | | | | | | | | First
Quarter | | Second
Quarter | | Third
Quarter | | Fourth
Quarter | | | First | | Second | | Third | | Fourth | 2013: | | | | | | | | | | | | | Quarter | | Quarter | | Quarter | | Quarter (1) | 2016: | | | | | | | | | | | | | | Revenue | | | $ | 72 | | $ | 276 | | $ | 297 | | $ | 142 | Net loss | | $ | (6,581 | ) | | $ | (6,323 | ) | | $ | (6,303 | ) | | $ | (6,573 | ) | | $ | (7,409) | | $ | (4,995) | | $ | (6,522) | | $ | (4,434) | Basic and diluted net loss per share | | $ | (0.14 | ) | | $ | (0.11 | ) | | $ | (0.11 | ) | | $ | (0.11 | ) | | $ | (66.14) | | $ | (33.96) | | $ | (11.77) | | $ | (2.65) | 2012: | | | | | | | | | | 2015: | | | | | | | | | | | | | | Revenue | | | $ | — | | $ | 79 | | $ | 64 | | $ | 149 | Net loss | | $ | (5,633 | ) | | $ | (4,954 | ) | | $ | (5,847 | ) | | $ | (7,027 | ) | | $ | (7,174) | | $ | (7,404) | | $ | (4,151) | | $ | (6,770) | Basic and diluted net loss per share | | $ | (0.15 | ) | | $ | (0.13 | ) | | $ | (0.14 | ) | | $ | (0.17 | ) | | $ | (103.56) | | $ | (104.48) | | $ | (41.92) | | $ | (66.70) |
ITEM 9. | CHANGES IN AND DISAGREEMENTS WITH ACCOUNTANTS ON ACCOUNTING AND FINANCIAL DISCLOSURE |
(1)The $2.4 million reduction in the 2016 fourth quarter net loss compared with the 2015 fourth quarter net loss reflects a $3.5 mllion decrease in operating expenses partially offset by a $0.6 million increase in interest expense and a $0.5 million increase in expenses from net changes in warrant liability and convertible note liability valuations. (18) Subsequent Events On January 23, 2017, the Company closed an underwritten public offering consisting of units of common stock, convertible preferred stock and warrants to purchase common stock. Gross proceeds of the offering were $19.0 million, prior to deducting underwriting discounts and commissions and offering expenses of approximately $2.5 million. The offering was comprised of Class A Units, priced at a public offering price of $5.31 per unit, with each unit consisting of one share of common stock and one five-year warrant (each, a "2017 Warrant") to purchase one share of common stock with an exercise price of $5.84 per share, and Class B Units, priced at a public offering price of $1,000 per unit, with each unit comprised of one share of Series A Preferred Stock (the Preferred Stock), which was convertible into 188 shares of common stock, and 2017 Warrants to purchase 188 shares of common stock. The conversion price of the Preferred Stock issued in the transaction as well as the exercise price of the 2017 Warrants are fixed priced and do not contain any variable pricing features nor any price based anti-dilutive features apart from customary adjustments for splits and reverse splits of common stock. The Preferred Stock included a beneficial ownership limitation of 4.99%, but had no dividend preference (except to extent dividends are also paid on the common stock), liquidation preference or other preferences over common stock. The securities comprising the units were immediately separable were issued separately. A total of 1,218,107 shares of common stock, 12,531 shares of Preferred Stock convertible into 2,359,894 shares of common stock, and 2017 Warrants to purchase 3,577,994 shares of common stock were issued in the offering including the underwriters’ exercise of their over-allotment option to purchase 466,695 shares of common stock and 2017 Warrants to purchase an additional 466,695 shares of common stock. On January 23 and January 24, 2017 all shares of Preferred Stock issued in conjunction with the offering were converted by their holders into 2,359,894 shares of common stock. Between January 1, 2017 and March 6, 2017, common stock warrants for 559,256 shares of common stock were exercised by warrant holders with proceeds to the Company of $3.1 million. ITEM 9. CHANGES IN AND DISAGREEMENTS WITH ACCOUNTANTS ON ACCOUNTING AND FINANCIAL DISCLOSURE None. ITEM 9A. | CONTROLS AND PROCEDURES |
ITEM 9A. CONTROLS AND PROCEDURES Evaluation of Disclosure Controls and Procedures We have evaluated the effectiveness of the design and operation of our disclosure controls and procedures (as defined in Rules 13a-15(e) and 15d-15(e) of the Securities Exchange Act of 1934, as amended (the Exchange Act)), as of the end of the period covered by this report (the Evaluation Date). Our management, including the Chief Executive Officer and the Chief Financial Officer, supervised and participated in the evaluation. Based on the evaluation, we concluded that, as of the Evaluation Date, our disclosure controls and procedures were effective in providing reasonable assurance that information required to be disclosed by us in the reports we file or submit under the Exchange Act is recorded, processed, summarized and reported within the time periods specified in the SEC’s forms and rules, and the material information relating to the Company is accumulated and communicated to management, including our Chief Executive Officer and Chief Financial Officer, as appropriate, to allow timely decisions regarding required disclosure. Control systems, no matter how well designed and operated, can provide only reasonable, not absolute, assurance that control objectives are met. Because of inherent limitations in all control systems, no evaluation of controls can provide assurance that all control issues and instances of fraud, if any, within a company will be detected. Additionally, controls can be circumvented by individuals, by collusion of two or more people or by management override. Over time, controls can become inadequate because of changes in conditions or the degree of compliance may deteriorate. Further, the design of any system of controls is based in part upon assumptions about the likelihood of future events. There can be no assurance that any design will succeed in achieving its stated goals under all future conditions. Because of the inherent limitations in any cost-effective control system, misstatements due to errors or fraud may occur and not be detected. Changes in Internal Control Over Financial Reporting There was no change in our internal control over financial reporting (as defined in Rules 13a-15(f) and 15d-15(f) of the Exchange Act) that occurred during the quarter ended December 31, 20132016 that has materially affected, or is reasonably likely to materially affect, our internal control over financial reporting. Management’s Report on Internal Control Over Financial Reporting Management is responsible for establishing and maintaining adequate internal control over financial reporting for the Company as defined in Rules 13a-15(c) and 15d-15(c) of the Exchange Act. Internal control over financial reporting is a process designed to provide reasonable assurance regarding the reliability of financial reporting and the preparation of financial statements for external purposes in accordance with accounting principles generally accepted in the United States of America. The Company’s internal control over financial reporting includes those policies and procedures that (i) pertain to the maintenance of records that, in reasonable detail, accurately and fairly reflect the transactions and dispositions of the assets of the Company; (ii) provide reasonable assurance that transactions are recorded as necessary to permit preparation of financial statements in accordance with U.S. generally accepted accounting principles, and that receipts and expenditures of the Company are being made only in accordance with authorizations of management and directors of the Company; and (iii) provide reasonable assurance regarding prevention or timely detection of unauthorized acquisition, use, or disposition of the Company’s assets that could have a material effect on the financial statements. Because of the inherent limitations of internal control over financial reporting, including the possibility of collusion or improper management override of controls, material misstatements due to error or fraud may not be prevented or detected on a timely basis. Also, projections of any evaluation of the effectiveness of the internal control over financial reporting to future periods are subject to the risk that the controls may become inadequate because of changes in conditions, or that the degree of compliance with the policies or procedures may deteriorate. Management has evaluated the design and operating effectiveness of our internal control over financial reporting as of December 31, 20132016 utilizing the criteria set forth by the Committee of Sponsoring Organizations of the Treadway Commission in Internal Control—Integrated Framework (1992)(2013). Based upon the evaluation, management has concluded that our internal control over financial reporting was effective as of December 31, 2013.2016. This annual report does not include an attestation report of the Company’s registered public accounting firm regarding internal control over financial reporting. Management’s report was not subject to attestation by the Company’s registered public accounting firm pursuant to permanent exemption rules of the Dodd-Frank Wall Street Reform and Consumer Protection Act that permit the Company to provide only management’s report in this annual report. ITEM 9B. | OTHER INFORMATION |
ITEM 9B. OTHER INFORMATION None. PART III. Certain information required by Part III is omitted from this report, and is incorporated by reference to our Definitive Proxy Statement to be filed with the SEC pursuant to Regulation 14A (the Proxy Statement) in connection with our 20142017 Annual Meeting of Stockholders. ITEM 10. | DIRECTORS, EXECUTIVE OFFICERS AND CORPORATE GOVERNANCE |
ITEM 10. DIRECTORS, EXECUTIVE OFFICERS AND CORPORATE GOVERNANCE The information required by this Item concerning our directors and executive officers is hereby incorporated by reference to the sections of our Proxy Statement under the headings “Nominees,” “Executive Officers,” “Section 16(a) Beneficial Ownership Reporting Compliance” and “Board Meetings and Committees—Audit Committee.” We have adopted a code of business conduct and ethics, which applies to all directors and employees, including executive officers, including, without limitation, our principal executive officer, principal financial officer, principal accounting officer and persons performing similar functions. A copy of this code of business conduct and ethics is available on our website atwww.enteromedics.com (under “Investors”,“Investors,” “Corporate Governance”) and we intend to satisfy the disclosure requirement under Item 5.05 of Form 8-K regarding any waivers from or amendments to any provision of the code of business conduct and ethics by disclosing such information on the same website. In addition, we intend to promptly disclose (1) the nature of any amendment to our code of business conduct and ethics that applies to our principal executive officer, principal financial officer, principal accounting officer or controller, or persons performing similar functions and (2) the nature of any waiver, including an implicit waiver, from a provision of our code of business conduct and ethics that is granted to one of these specified officers, the name of such person who is granted the waiver and the date of the waiver on our website in the future. ITEM 11. | EXECUTIVE COMPENSATION |
ITEM 11. EXECUTIVE COMPENSATION The information required by this Item is hereby incorporated by reference to the sections of our Proxy Statement entitled “Director Compensation,” “Executive Compensation,” “Compensation Committee Interlocks and Insider Participation” and “Compensation Committee Report.” ITEM 12. | SECURITY OWNERSHIP OF CERTAIN BENEFICIAL OWNERS AND MANAGEMENT AND RELATED STOCKHOLDER MATTERS |
ITEM 12. SECURITY OWNERSHIP OF CERTAIN BENEFICIAL OWNERS AND MANAGEMENT AND RELATED STOCKHOLDER MATTERS (a) Equity Compensation Plans The following table sets forth information as of December 31, 20132016 with respect to our equity compensation plans: | | | | | | | | | | | | | | | | | | Number of Securities | | | | | Number of | | Weighted- | | Remaining Available | | | | | Securities to be | | Average | | for Future Issuance | | | | | Issued Upon | | Exercise Price | | Under Equity | | | | | Exercise of | | of Outstanding | | Compensation Plans | | | | | Outstanding | | Options, | | (Excluding Securities | | | | | | | | | | Options, Warrants | | Warrants and | | Reflected in Second | | Plan Category | | Number of
Securities to be
Issued Upon
Exercise of
Outstanding
Options, Warrants
and Rights | | Weighted-
Average
Exercise Price
of Outstanding
Options,
Warrants and
Rights | | | Number of Securities
Remaining Available
for Future Issuance
Under Equity
Compensation Plans
(Excluding Securities
Reflected in Second
Column) | | | and Rights | | Rights | | Column) | | Equity compensation plans approved by security holders | | | 11,687,300 | (1) | | $ | 2.56 | | | | 542,218 | (2) | | 7,034 | (1) | $ | 1,824.87 | | 2,988,243 | (2) | Equity compensation plans not approved by security holders | | | — | | | | — | | | | — | | | 12,806 | (3) | | 191.12 | | — | | | | | | | | | | | | Total | | | 11,687,300 | | | $ | 2.56 | | | | 542,218 | | | 19,840 | | $ | 770.35 | | 2,988,243 | | | | | | | | | | | |
(1)Consists of options awarded under the Amended and Restated 2003 Stock Incentive Plan, which was amended and restated as the Second Amended and Restated 2003 Stock Incentive Plan (the “Plan) on December 12, 2016. (2)Represents the maximum number of shares of common stock available to be awarded under the Plan as of December 31, 2016 adjusted to reflect the Company’s board of directors’ February 8, 2017 action to adjust the number of shares reserved under the Plan from 40,000,000 to 3,000,000 in connection with the Company’s recapitalization. (3)Consists of the inducement grants awarded in 2015 and 2016 to four executives in connection with their hiring. (1) | Consists of options awarded under the Amended and Restated 2003 Stock Incentive Plan. |
(2) | Represents the maximum number of shares of common stock available to be awarded as of December 31, 2013. |
(b) Security Ownership The information required by this Item is hereby incorporated by reference to the section of our Proxy Statement entitled “Security Ownership of Certain Beneficial Owners and Management.” ITEM 13. | CERTAIN RELATIONSHIPS AND RELATED TRANSACTIONS, AND DIRECTOR INDEPENDENCE |
ITEM 13. CERTAIN RELATIONSHIPS AND RELATED TRANSACTIONS, AND DIRECTOR INDEPENDENCE The information required by this Item is hereby incorporated by reference to the section of our Proxy Statement entitled “Certain Relationships and Related Transactions, and Director Independence.” ITEM 14. | PRINCIPAL ACCOUNTANT FEES AND SERVICES |
ITEM 14. PRINCIPAL ACCOUNTANT FEES AND SERVICES The information required by this Item is hereby incorporated by reference to the section of our Proxy Statement entitled “Principal Accountant Fees and Services” and “Administration of Engagement of Independent Auditor.” PART IV. ITEM 15. | EXHIBITS, FINANCIAL STATEMENTS AND FINANCIAL STATEMENT SCHEDULES |
ITEM 15. EXHIBITS, FINANCIAL STATEMENTS AND FINANCIAL STATEMENT SCHEDULES (a)Financial Statements and Schedules: Consolidated Financial Statements for the three years ended December 31, 20132016 are included in Part II, Item 8 of this Annual Report on Form 10-K. All schedules are omitted because they are not applicable or the required information is shown in the consolidated financial statements or notes thereto. (b)Exhibits: The list of exhibits on the Exhibit Index on page 10989 of this report is incorporated herein by reference. ITEM 16. FORM 10-K SUMMARY Not applicable SIGNATURES Pursuant to the requirements of Section 13 or 15(d) of the Securities Exchange Act of 1934, the registrant has duly caused this report to be signed on its behalf by the undersigned, thereunto duly authorized. | | | | | ENTEROMEDICS INC. | | | | | By: | | /S/ MARK B. KNUDSON, PH.D. S/ DAN W. GLADNEY | | | Mark B. Knudson, Ph.D.Dan W. Gladney | | | Chairman, President and Chief Executive Officer |
Dated: March 27, 20148, 2017 POWERS OF ATTORNEY KNOW ALL PERSONS BY THESE PRESENTS, that each person whose signature appears below constitutes and appoints Mark B. KnudsonDan W. Gladney and Greg S. Lea,Scott P. Youngstrom, and each of them, as his true and lawful attorney-in-fact and agent, with full power of substitution and resubstitution, for him and in his name, place and stead, in any and all capacities, to sign any and all amendments to this report, and to file the same, with exhibits thereto and other documents in connection therewith, with the Securities Exchange Commission, granting unto said attorneys-in-fact and agents, and each of them, full power and authority to do and perform each and every act and thing requisite and necessary to be done, as fully to all intents and purposes as he might or could do in person, hereby ratifying and confirming all that said attorneys-in-fact and agents, or any of them or their substitutes may lawfully do or cause to be done by virtue hereof. Pursuant to the requirements of the Securities Exchange Act of 1934, this report has been signed below by the following persons on behalf of the Registrant and in the capacities and on the dates indicated. | | | | | Signature | | Title | | Date | | | | | | /S/ MARK B. KNUDSON, PH.D. Mark B. Knudson, Ph.D.S/ DAN W. GLADNEY
| | Chairman of the Board, President, and Chief Executive Officer Chairman and Director
(principal executive officer) | | March 27, 2014 | | | 8, 2017 | /S/ GREG S. LEA Dan W. Gladney
| Greg S. Lea
| | Senior Vice President,
| | | /S/ SCOTT P. YOUNGSTROM | | Chief Financial Officer and Chief OperatingCompliance Officer (principal (principal financial and accounting officer)
| | March 27, 2014 | | | 8, 2017 | /S/ LUKE EVNIN, PH.D.
Luke Evnin, Ph.D.Scott P. Youngstrom
| | Director | | March 27, 2014 | | | | /S/ CATHERINE FRIEDMAN
Catherine Friedman
| | Director | | March 27, 2014 | | | | /SS/ GARY D. BLACKFORD | | Director | | March 8, 2017 | Gary D. Blackford | | | | | | | | / CARL GOLDFISCHER,S/ CARL GOLDFISCHER, M.D. | | Director | | March 8, 2017 | Carl Goldfischer, M.D. | | Director | | March 27, 2014 | | | | | | | | | /S/ BOBBYS/ BOBBY I. GRIFFIN GRIFFIN | | Director | | March 8, 2017 | Bobby I. Griffin | | Director | | March 27, 2014 | | | | /S/ ANTHONY P. JANSZ
Anthony P. Jansz
| | Director | | March 27, 2014 |
| | | | | Signature/S/ LORI MCDOUGAL
| | TitleDirector
| | DateMarch 8, 2017
| Lori McDougal | | | | | | | | /S/ NICHOLASS/ NICHOLAS L. TETI, JR. TETI, JR. | | Director | | March 8, 2017 | Nicholas L. Teti, Jr. | | Director | | March 27, 2014 | | | | | | /S/ JON T. TREMMEL | | Director | | March 8, 2017 | Jon T. Tremmel | |
| | | /S/ JON T. TREMMEL Exhibit
Number
Jon T. Tremmel
| | Director | | March 27, 2014 |
EXHIBIT INDEX
| | | Exhibit
Number
| | Description of Document | 3.1 | | 3.1 | | FifthSixth Amended and Restated Certificate of Incorporation of the Company and all amendments thereto.Company. (Incorporated herein by reference to Exhibit 3.1 to the Company’s QuarterlyCurrent Report on Form 10-Q8-K filed on November 8, 2012December 28, 2016 (File No. 1-33818)). | 3.2 | | Form of Certificate of Designation of Series A Preferred Stock. (Incorporated herein by reference to Exhibit 4.1 to the Company’s Registration Statement on Form S-1 filed on January 11, 2017 (File No. 333-213704)). | 3.23.3 | | Form of Series A Preferred Stock Certificate. (Incorporated herein by reference to Exhibit 4.1 to the Company’s Registration Statement on Form S-1 filed on January 11, 2017 (File No. 333-213704)). | 3.4 | | Amended and Restated Bylaws of the Company, as currently in effect. (Incorporated herein by reference to Exhibit 3.4 to Amendment No. 1 to the Company’s Registration Statement on Form S-1 filed on July 6, 2007 (File No. 333-143265)). | 10.1 | | 4.1 | | Amended and Restated Investors’ Rights Agreement, dated as of July 6, 2006, by and between the Company and the parties named therein. (Incorporated herein by reference to Exhibit 4.2 to the Company’s Registration Statement on Form S-1 filed on May 25, 2007 (File No. 333-143265)). | | | 10.1 | | Loan and Security Agreement, dated November 18, 2008, between the Company and Silicon Valley Bank, Compass Horizon Funding Company LLC, and Venture Lending & Leasing V, Inc. (Incorporated herein by reference to Exhibit 10.1 to the Company’s Current Report on Form 8-K filed on November 24, 2008 (File No. 1-33818)). | | | 10.2 | | Form of Warrant to purchase stock under Loan and Security Agreement, dated November 18, 2008, between the Company and Silicon Valley Bank, Compass Horizon Funding Company LLC, and Venture Lending & Leasing V, Inc. (Incorporated herein by reference to Exhibit 10.20 to the Company’s Annual Report on Form 10-K filed on March 12, 2009 (File No. 1-33818)). | | | 10.3 | | First Amendment to Loan and Security Agreement, dated as of February 8, 2010, by and between Silicon Valley Bank and the Company. (Incorporated herein by reference to Exhibit 10.1 to the Company’s Current Report on Form 8-K filed on February 12, 2010 (File No. 1-33818)). | | | 10.4 | | Second Amendment to Loan and Security Agreement, dated as of July 8, 2010, by and between Silicon Valley Bank and the Company. (Incorporated herein by reference to Exhibit 10.1 to the Company’s Current Report on Form 8-K filed on July 13, 2010 (File No. 1-33818)). | | | 10.5 | | Third Amendment to Loan and Security Agreement, dated as of November 4, 2010, by and between Silicon Valley Bank and the Company. (Incorporated herein by reference to Exhibit 10.8 to the Company’s Quarterly Report on Form 10-Q filed on November 8, 2010 (File No. 1-33818)). | | | 10.6 | | Fourth Amendment to Loan and Security Agreement, dated as of March 3, 2011, by and between Silicon Valley Bank and the Company. (Incorporated herein by reference to Exhibit 10.42 to the Company’s Annual Report on Form 10-K filed on March 7, 2011 (File No. 1-33818)). | | | 10.7 | | Loan and Security Agreement, dated April 16, 2012, between the Company and Silicon Valley Bank. (Incorporated herein by reference to Exhibit 10.3 to the Company’s Quarterly Report onForm 10-Q/A filed on August 3, 2012 (File No. 1-33818)). | | | 10.8 | | Form of Warrant to purchase stock under Loan and Security Agreement, dated April 16, 2012, between the Company and Silicon Valley Bank. (Incorporated herein by reference to Exhibit 10.4 to the Company’s Quarterly Report on Form 10-Q filed on May 10, 2012 (File No. 1-33818)). | | | 10.9 | | First Amendment to Loan and Security Agreement, dated as of May 9, 2013, by and between Silicon Valley Bank and the Company. (Incorporated herein by reference to Exhibit 10.3 to the Company’s Quarterly Report on Form 10-Q filed on May 10, 2013 (File No. 1-33818)). | | | 10.10 | | Securities Purchase Agreement, dated as of October 2, 2009. (Incorporated herein by reference to Exhibit 10.1 to the Company’s Current Report on Form 8-K filed on October 5, 2009(File No. 1-33818)). |
| | | Exhibit
Number10.2
| | Description of Document
| | | 10.11 | | Securities Purchase Agreement, dated as of January 14, 2010. (Incorporated herein by reference to Exhibit 10.1 to the Company’s Current Report on Form 8-K filed on January 15, 2010(File No. 1-33818)). | | | 10.12 | | Securities Purchase Agreement, dated as of September 29, 2010. (Incorporated herein by reference to Exhibit 10.1 to the Company’s Current Report on Form 8-K filed on October 5, 2010(File No. 1-33818)). | | | 10.13 | | Form of Up Front Warrant, dated September 29, 2010, by and between the Company and several accredited investors. (Incorporated herein by reference to Exhibit 10.2 to the Company’s Current Report on Form 8-K filed on October 5, 2010 (File No. 1-33818)). | | | 10.14 | | Form of Conversion Warrant. (Incorporated herein by reference to Exhibit 10.3 to the Company’s Current Report on Form 8-K filed on October 5, 2010 (File No. 1-33818)). | | | 10.15 | | Form of Common Stock Warrant, dated as of December 14, 2010, by and between the Company and several accredited investors. (Incorporated herein by reference to Exhibit 4.3 to Amendment No. 1 to the Company’s Registration Statement on Form S-1 filed on December 6, 2010(File No. 333-170503)). | | | 10.16 | | Form of Underwriter Warrant, dated as of December 14, 2010, by and between the Company and Craig-Hallum Capital Group LLC. (Incorporated herein by reference to Exhibit 10.1 to the Company’s Current Report on Form 8-K filed on December 14, 2010 (File No. 1-33818)). | | | 10.17 | | Securities Purchase Agreement, dated as of September 23, 2011, by and between Craig-Hallum Capital Group LLC and the Company. (Incorporated herein by reference to Exhibit 1.1 to the Company’s Current Report on Form 8-K filed on September 23, 2011 (File No. 1-33818)). | | | 10.18 | | Form of Common Stock Warrant, dated as of September 23, 2011, by and between the Company and several accredited investors. (Incorporated herein by reference to Exhibit 4.1 to the Company’s Current Report on Form 8-K filed on September 23, 2011 (File No. 1-33818)). | | | 10.19 | | Securities Purchase Agreement, dated as of April 16, 2012, between the Company and the purchasers identified on Schedule A thereto. (Incorporated herein by reference to Exhibit 10.1 to the Company’s Current Report on Form 8-K filed on April 17, 2012 (File No. 1-33818)). | | | 10.20 | | Common Stock Purchase Agreement, dated as of October 4, 2012, by and between Terrapin Opportunity, L.P. and the Company. (Incorporated herein by reference to Exhibit 10.1 to the Company’s Current Report on Form 8-K filed on October 4, 2012 (File No. 1-33818)). | | | 10.21 | | Securities Purchase Agreement, dated as of February 22, 2013, by and between Craig-Hallum Capital Group LLC and the Company. (Incorporated herein by reference to Exhibit 1.1 to the Company’s Current Report on Form 8-K filed on February 22, 2013 (File No. 1-33818)). | 10.3 | | 10.22 | | Form of Common Stock Warrant, dated as of February 22, 2013, by and between the Company and several accredited investors. (Incorporated herein by reference to Exhibit 4.1 to the Company’s Current Report on Form 8-K filed on February 22, 2013 (File No. 1-33818)). | 10.4 | | 10.23 | | Equity DistributionSales Agreement, dated as of July 31, 2013,June 13, 2014, by and between Canaccord Genuity Inc.Cowen and Company, LLC and the Company. (Incorporated herein by reference to Exhibit 10.1 to the Company’s Current Report on Form 8-K filed on July 31, 2013June 13, 2014 (File No. 1-33818)). | 10.5 | | Amendment No. 1 to the Sales Agreement, dated as of August 25, 2015, by and between Cowen and Company, LLC and the Company. (Incorporated herein by reference to Exhibit 10.1 to the Company’s Current Report on Form 8-K filed on September 1, 2015 (File No. 1-33818)). | 10.24†10.6 | | Underwriting Agreement, dated as of July 7, 2015, by and between Canaccord Genuity Inc. and the Company. (Incorporated herein by reference to Exhibit 1.1 to the Company’s Current Report on Form 8-K filed on July 7, 2015 (File No. 1-33818)). | 10.7 | | Form of Series A Warrant, dated as of July 8, 2015, by and between the Company and several accredited investors. (Incorporated herein by reference to Exhibit 4.1 to the Company’s Current Report on Form 8-K filed on July 7, 2015 (File No. 1-33818)). | 10.8 | | Form of Series C Warrant, dated as of July 8, 2015, by and between the Company and several accredited investors. (Incorporated herein by reference to Exhibit 4.2 to the Company’s Current Report on Form 8-K filed on July 7, 2015 (File No. 1-33818)). | 10.9 | | Form of Securities Purchase Agreement. (Incorporated herein by reference to Exhibit 10.1 to the Company’s Current Report on Form 8-K filed on November 5, 2015 (File No. 1-33818)). | 10.10 | | Form of Amendment No. 1 to the Securities Purchase Agreement dated November 4, 2015, between the Company and the buyers listed therein. (Incorporated herein by reference to Exhibit 10.1 to the Company’s Current Report on Form 8-K filed on May 6, 2016 (File No. 1-33818)). | 10.11 | | Form of Amendment No. 2 to the Securities Purchase Agreement dated November 4, 2015, as amended by Amendment No.1 thereto dated May 2, 2016, among the Company and the buyers listed therein. (Incorporated herein by reference to Exhibit 10.1 to the Company’s Current Report on Form 8-K filed on July 15, 2016 (File No. 1-33818)). |
| | | Exhibit
Number | | Description of Document | 10.12 | | Form of Senior Convertible Note. (Incorporated herein by reference to Exhibit 4.1 to the Company’s Current Report on Form 8-K filed on November 5, 2015 (File No. 1-33818)). | 10.13 | | Form of Warrant. (Incorporated herein by reference to Exhibit 4.2 to the Company’s Current Report on Form 8-K filed on November 5, 2015 (File No. 1-33818)). | 10.14 | | Form of Underwriting Agreement. (Incorporated herein by reference to Exhibit 1.1 to the Company’s Registration Statement on Form S-1 filed on January 11, 2017 (File No. 333-213704)). | 10.15 | | Form of Warrant to purchase shares of Common Stock. (Incorporated herein by reference to Exhibit 4.3 to the Company’s Registration Statement on Form S-1 filed on January 11, 2017 (File No. 333-213704)). | 10.16 | | Warrant Agency Agreement, by and between the Company and Wells Fargo Bank, National Association, dated January 20, 2017. (Incorporated herein by reference to Exhibit 10.1 to the Company’s Current Report on Form 8-K filed on January 24, 2017 (File No. 1-33818)). | 10.17† | | Second Amended and Restated 2003 Stock Incentive Plan. (Incorporated herein by reference to Exhibit 10.1 to the Company’s Current Report on Form 8-K filed on September 28, 2012February 14, 2017 (File No. 1-33818)). | 10.18† | | 10.25† | | Standard form of Incentive Stock Option Agreement pursuant to the Amended and Restated 2003 Stock Incentive Plan. (Incorporated herein by reference to Exhibit 10.13 to the Company’s Registration Statement on Form S-1 filed on May 25, 2007 (File No. 333-143265)). |
| | | Exhibit
Number10.19†
| | Description of Document
| | | 10.26† | | Standard form of Non-Incentive Stock Option Agreement pursuant to the Amended and Restated 2003 Stock Incentive Plan. (Incorporated herein by reference to Exhibit 10.14 to the Company’s Registration Statement on Form S-1 filed on May 25, 2007 (File No. 333-143265)). | 10.20† | | 10.27† | | Form of Non-Incentive Stock Option Agreement for the new options granted October 29, 2010 pursuant to the option exchange program. (Incorporated herein by reference to Exhibit 10.7 to the Company’s Quarterly Report on Form 10-Q filed on November 8, 2010 (File No. 1-33818)). | 10.21† | | 10.28† | | Form of 2012 Senior Management Non-Incentive Stock Option Agreement pursuant to the Amended and Restated 2003 Stock Incentive Plan. (Incorporated herein by reference to Exhibit 10.1 to the Company’s Current Report on Form 8-K filed on July 13, 2012 (File No. 1-33818)). | 10.22† | | 10.29† | | Standard form of Restricted Stock Agreement. (Incorporated herein by reference to Exhibit 10.15 to the Company’s Registration Statement on Form S-1 filed on May 25, 2007 (File No. 333-143265)). | 10.23† | | 10.30 | | Form of Indemnification Agreement entered into by and between the Company and each of its executive officers and directors. (Incorporated herein by reference to Exhibit 10.17 to Amendment No. 1 to the Company’s Registration Statement on Form S-1 filed on July 6, 2007(File (File No. 333-143265)). | 10.24† | | Form of Tandem Stock Purchase Right and Bonus Share Agreement. (Incorporated herein by reference to Exhibit 10.1 to the Company’s Current Report on Form 8-K filed on October 13, 2015 (File No. 1-33818)). | 10.3110.25† | | Inducement Option Plan. (Incorporated herein by reference to Exhibit 10.4 to the Company’s Current Report on Form 8-K filed on January 22, 2016 (File No. 1-33818)). | 10.26† | | Form of Non-Incentive Stock Option Agreement pursuant to the Inducement Option Plan. (Incorporated herein by reference to Exhibit 10.33 to the Company’s Annual Report on Form 10-K filed on March 28, 2016 (File No. 1-33818)). | 10.27† | | Form of Non-Incentive Stock Option Agreement for New Options granted June 27, 2016 pursuant to the option exchange offer. (Incorporated herein by reference to Exhibit (d)(6) to the Company’s Tender Offer Statement under Section 14(d)(1) on Schedule TO filed on May 27, 2016). | 10.28† | | Consulting Agreement, effective June 1, 2011,dated as of August 21, 2015, by and between Anthony JanszJon Tremmel & Associates, LLC and the Company. (Incorporated herein by reference to Exhibit 10.1 to the Company’s Current Report on Form 8-K filed on July 8, 2011August 25, 2015 (File No. 1-33818)). |
| | | Exhibit
Number | | Description of Document | 10.3210.29† | | Amendment to Consulting Agreement, effective October 1, 2012, by and between Anthony Jansz and the Company. (Incorporated herein by reference to Exhibit 10.1 to the Company’s Current Report on Form 8-K filed on January 24, 2013 (File No. 1-33818)). | | | 10.33† | | Executive Employment Agreement, dated June 22, 2005, by and between the Company and Mark B. Knudson. (Incorporated herein by reference to Exhibit 10.8 to the Company’s Registration Statement on Form S-1 filed on May 25, 2007 (File No. 333-143265)). | | | 10.34† | | Amended and Restated Executive Employment Agreement, dated May 4, 2009, by and between the Company and Mark B. Knudson. (Incorporated herein by reference to Exhibit 10.3 to the Company’s Quarterly Report on Form 10-Q filed on May 7, 2009 (File No. 1-33818)). | | | 10.35† | | Executive Employment Agreement, dated May 21, 2007, by and between the Company and Greg S. Lea. (Incorporated herein by reference to Exhibit 10.9 to the Company’s Registration Statement on Form S-1 filed on May 25, 2007 (File No. 333-143265)). | 10.30† | | 10.36† | | Amendment No. 1 to Executive Employment Agreement, dated May 21, 2007, by and between the Company and Greg S. Lea. (Incorporated herein by reference to Exhibit 10.1 to the Company’s Current Report on Form 8-K filed on April 19, 2010 (File No. 1-33818)). | 10.31† | | 10.37† | | Amendment No. 2 to Executive Employment Agreement, dated February 9,May 21, 2007, by and between the Company and Adrianus Donders.Greg S. Lea, dated January 27, 2016. (Incorporated herein by reference to Exhibit 10.1010.1 to the Company’s Registration StatementCurrent Report on Form S-18-K filed on May 25, 2007February 3, 2016 (File No. 333-143265)1-33818)). | 10.32† | | 10.38† | | Executive Employment Agreement, dated August 5, 2008, by and between the Company and Katherine S. Tweden. (Incorporated herein by reference to Exhibit 10.4 to the Company’s Quarterly Report on Form 10-Q filed on May 7, 2009 (File No. 1-33818)). | 10.33† | | Executive Employment Agreement, by and between the Company and Brad Hancock, dated November 17, 2014. (Incorporated herein by reference to Exhibit 4.1 to the Company’s Current Report on Form 8-K filed on May 12, 2015 (File No. 1-33818)). | 10.39†10.34† | | Separation Agreement, by and between the Company and Brad Hancock, dated February 24, 2016. (Incorporated herein by reference to Exhibit 10.45 to the Company’s Annual Report on Form 10-K filed on March 28, 2016 (File No. 1-33818)). | 10.35† | | Executive Employment Agreement, dated October 28, 2015, by and between the Company and Dan W. Gladney. (Incorporated herein by reference to Exhibit 10.1 to the Company’s Current Report on Form 8-K filed on November 2, 2015 (File No. 1-33818)). | 10.36† | | Form of Non-Incentive Stock Option Agreement for non-plan executive inducement option grants. (Incorporated herein by reference to Exhibit 10.47 to the Company’s Annual Report on Form 10-K filed on March 28, 2016 (File No. 1-33818)). | 10.37† | | Executive Employment Agreement, dated January 19, 2016, by and between the Company and Naqeeb “Nick” Ansari. (Incorporated herein by reference to Exhibit 10.1 to the Company’s Current Report on Form 8-K filed on January 22, 2016 (File No. 1-33818)). | 10.38† | | Executive Employment Agreement, dated January 18, 2016, by and between the Company and Peter DeLange. (Incorporated herein by reference to Exhibit 10.2 to the Company’s Current Report on Form 8-K filed on January 22, 2016 (File No. 1-33818)). | 10.39† | | Executive Employment Agreement, dated January 22, 2016, by and between the Company and Paul Hickey. (Incorporated herein by reference to Exhibit 10.3 to the Company’s Current Report on Form 8-K filed on January 22, 2016 (File No. 1-33818)). | 10.40† | | Executive Employment Agreement, dated October 3, 2016, by and between the Company and Scott Youngstrom. (Incorporated herein by reference to Exhibit 10.1 to the Company’s Current Report on Form 8-K filed on October 6, 2016 (File No. 1-33818)). | 10.41† | | Management Incentive Plan. (Incorporated herein by reference to Exhibit 10.1 to the Company’s Current Report on Form 8-K filed on February 12, 2008 (File No. 1-33818)). | 10.42† | | 10.40 | | Licensing Agreement, by and between Mayo Foundation for Medical Education and Research andAmendments to the Company, dated February 3, 2005.Management Incentive Plan described in Item 5.02(e). (Incorporated herein by reference to Exhibit 10.1 to Amendment No. 2 to the Company’s Registration Statement on Form S-1 filed on August 14, 2007 (File No. 333-143265)). |
| | | Exhibit
Number
| | DescriptionItem 5.02(e) of Document
| | | 10.41 | | Amendment No. 1, effective as of February 3, 2010, to License Agreement between Mayo Foundation for Medical Education and Research and the Company. (Incorporated herein by reference to Exhibit 10.1 to the Company’s Current Report on Form 8-K filed on March 17, 2010(FileMay 10, 2016 (File No. 1-33818)). | 10.43† | | 10.42 | | Amendment No. 2, effective as of January 4, 2011,Amendments to License Agreement between Mayo Foundation for Medical Education and Research and the Company.Management Incentive Plan described in Item 5.02(e). (Incorporated herein by reference to Exhibit 10.34 toItem 5.02(e) of the Company’s AnnualCurrent Report on Form 10-K8-K filed on March 7, 2011(File No. 1-33818)). | | | 10.43 | | Amendment No. 3, effective as of February 3, 2012, to License Agreement between Mayo Foundation for Medical Education and Research and the Company. (Incorporated herein by reference to Exhibit 10.5 to the Company’s Quarterly Report on Form 10-Q filed on August 8, 2012September 20, 2016 (File No. 1-33818)). | 10.44 | | 10.44* | | Amendment No. 4, effective as of February 3, 2013, to License Agreement between Mayo Foundation for Medical Education and Research and the Company. | | | 10.45* | | Amendment No. 5, effective as of February 3, 2014, to License Agreement between Mayo Foundation for Medical Education and Research and the Company. | | | 10.46 | | Lease Agreement, effective October 1, 2008, by and between the Company and Roseville Properties Management Company. (Incorporated herein by reference to Exhibit 10.23 to the Company’s Annual Report on Form 10-K filed on March 12, 2009 (File No. 1-33818)). |
| | | Exhibit
Number | | Description of Document | 10.4710.45 | | First Amendment to Lease Agreement, entered into August 25, 2015, by and between the Company and Roseville Properties Management Company. (Incorporated herein by reference to Exhibit 10.2 to the Company’s Current Report on Form 8-K filed on September 1, 2015 (File No. 1-33818)). | 10.46 | | Distribution Agreement, dated as of March 28, 2011, by and between Device Technologies Australia Pty Limited and the Company. (Incorporated herein by reference to Exhibit 10.2 to the Company’s Quarterly Report on Form 10-Q filed on May 6, 2011 (File No. 1-33818)). | 10.47 | | 10.48 | | Amendment No. 1, effective as of July 10, 2012, to Distribution Agreement by and between Device Technologies Australia Pty Limited and the Company. (Incorporated herein by reference to Exhibit 10.6 to the Company’s Quarterly Report on Form 10-Q filed on August 8, 2012(File (File No. 1-33818)). | 10.48 | | 10.49 | | Distribution Agreement, dated as of February 21, 2012, by and between Bader Sultan & Brothers Co. W.L.L. and the Company. (Incorporated herein by reference to Exhibit 10.1 to the Company’s Quarterly Report on Form 10-Q filed on May 10, 2012 (File No. 1-33818)). | 10.49 | | Exclusive Federal Government Business Channel Sales Agreement, effective April 25, 2016, by and between the Company and Academy Medical, LLC, as amended July 26, 2016. (Incorporated herein by reference to Exhibit 10.1 to the Company’s Quarterly Report on Form 10-Q filed on August 12, 2016 (File No. 1-33818)). | 14.1 | | Code of Conduct and Ethics of the Company. (Incorporated herein by reference to Exhibit 14.1 to the Company’s Registration Statement on Form S-1 filed on May 25, 2007 (File No. 333-143265)). | 23.1* | | 23.1* | | Consent of Deloitte & Touche LLP, Independent Registered Public Accounting Firm. | 24.1* | | 24.1* | | Power of Attorney (included on signature page to this Form 10-K). | 31.1* | | 31.1* | | Certification of Chief Executive Officer pursuant to Section 302 of the Sarbanes-Oxley Act of 2002. | 31.2* | | 31.2* | | Certification of Chief Financial Officer pursuant to Section 302 of the Sarbanes-Oxley Act of 2002. | 32.1* | | 32.1* | | Certification of Chief Executive Officer pursuant to Section 906 of the Sarbanes-Oxley Act of 2002. | 32.2* | | 32.2* | | Certification of Chief Financial Officer pursuant to Section 906 of the Sarbanes-Oxley Act of 2002. | 101* | | 101* | | Financial statements from the Annual Report on Form 10-K of the Company for the year ended December 31, 2013,2016, formatted in Extensible Business Reporting Language: (i) the Consolidated Balance Sheets, (ii) the Consolidated Statements of Operations, (iii) the Consolidated Statements of Comprehensive Loss,Stockholders’ Equity; (iv) the Consolidated Statements of Stockholders’ Equity (Deficit); (v) the Consolidated Statements of Cash Flows and (vi)(v) the Notes to Consolidated Financial Statements. |
† | Indicates management contract or compensation plan or agreement. |
† Indicates management contract or compensation plan or agreement.
|
|