Delaware | ||
77-0528806 | ||
(State or
| (I.R.S. Employer
|
777 Mariners Island Boulevard, Suite 300 San Mateo, California | 94404 | |
| ||
| (Address of | (Zip Code) |
Registrant’s telephone number, including area code: (650) 610-4600
(Registrant’s Telephone Number, Including Area Code)
Securities Registeredregistered pursuant to Section 12(b) of the Act: Common Stock, Par Value $0.00015 Per Share; Common stock traded on the New York Stock Exchange stock market
|
| |
Securities registered pursuant to Section 12(g) of the Act: None
Indicate by check mark if the registrantRegistrant is a well-known seasoned issuer, as defined in Rule 405 of the Securities Act: YesAct. YES ¨☐ NoNO x☒
Indicate by check mark if the registrantRegistrant is not required to file reports pursuant to Section 13 or Section 15(d) of the Act: YesAct. YES ¨☐ NoNO x☒
Indicate by check mark whether the registrant:Registrant: (1) has filed all reports required to be filed by Section 13 or 15(d) of the Securities Exchange Act of 1934 during the preceding 12 months (or for such shorter period that the registrantRegistrant was required to file such reports), and (2) has been subject to such filing requirements for the past 90 days. YesYES x☒ NoNO ¨☐
Indicate by checkmarkcheck mark whether the registrantRegistrant has submitted electronically and posted on its corporate Web site, if any, every Interactive Data File required to be submitted and posted pursuant to Rule 405 of Regulation S-T (§232.405 of this chapter) during the preceding 12 months (or for such shorter time period that the registrantRegistrant was required to submit and post such files). YesYES x☒ NoNO ¨☐
Indicate by check mark if disclosure of delinquent filers pursuant to Item 405 of Regulation S-K (§229.405) is not contained herein, and will not be contained, to the best of registrant’sRegistrant’s knowledge, in definitive proxy or information statements incorporated by reference in Part III of this Form 10-K or any amendment to this Form 10-K. x☐
Indicate by check mark whether the registrant is a large accelerated filer, an accelerated filer, a non-accelerated filer, or a smaller reporting company, or an emerging growth company. See definitionthe definitions of “large accelerated filer,” “accelerated filer”filer,” “smaller reporting company,” and “smaller reporting“emerging growth company” in Rule 12b-2 of the Exchange Act. (Check one):
Large accelerated filer | ☐ | Accelerated filer | ☒ | |||
Non-accelerated filer |
| Smaller reporting company | ☐ | |||
Emerging growth company | ☒ | |||||
If an emerging growth company, indicate by check mark if the registrant has elected not to use the extended transition period for complying with any new or revised financial accounting standards provided pursuant to Section 13(a) of the Exchange Act. ☒
Indicate by check mark whether the registrantRegistrant is a shell company (as defined in Rule 12b-2 of the Exchange Act). YesYES ¨☐ NoNO x☒
The aggregate market value of the voting stockand non-voting common equity held by non-affiliates of the registrant as of March 31, 2014, the last business day of the registrant’s most recently completed second fiscal quarter,Registrant, based on the closing price of $10.11 per sharethe shares of the registrant’s common stock as reported by theon The New York Stock Exchange Stock Market on March 31, 2017, was approximately $163$243 million. Shares of common stock held by each executive officer, director, and their affiliated holders have been excluded in that such persons may be deemed to be affiliates. This determination of affiliate status is not necessarily a conclusive determination for other purposes.
The number of shares outstanding of the registrant’sRegistrant’s Common Stock outstanding as of November 11, 20143, 2017 was 25,111,617 shares.
Documents Incorporated by Reference
Information required in response to Part III of Form 10-K (Items 10, 11, 12, 13 and 14) is hereby incorporated by reference to portions29,329,972. Portions of the registrant’sRegistrant’s Definitive Proxy Statement forrelating to the Annual Meeting of StockholdersShareholders, scheduled to be held in 2015. The Proxy Statement will be filedon February 16, 2018, are incorporated by the Registrant with the Securities and Exchange Commission no later than 120 days after the endreference into Part III of the registrant’s fiscal year ended September 30, 2014.this Report.
Page | ||||||
PART I | ||||||
Item 1. | 1 | |||||
Item 1A. | 9 | |||||
Item 1B. | 29 | |||||
Item 2. | 29 | |||||
Item 3. | 29 | |||||
Item 4. | 29 | |||||
PART II | ||||||
Item 5. | 30 | |||||
Item 6. | 32 | |||||
Item 7. | Management’s Discussion and Analysis of Financial Condition and Results of Operations | 34 | ||||
Item 7A. | 51 | |||||
Item 8. | 52 | |||||
Item 9. | Changes in and Disagreements With Accountants on Accounting and Financial Disclosure | 81 | ||||
Item 9A. | 81 | |||||
Item 9B. | 82 | |||||
PART III | ||||||
Item 10. | 83 | |||||
Item 11. | 83 | |||||
Item 12. | Security Ownership of Certain Beneficial Owners and Management and Related Stockholder Matters | 83 | ||||
Item 13. | Certain Relationships and Related Transactions, and Director Independence | 83 | ||||
Item 14. | 83 | |||||
PART IV | ||||||
Item 15. | 84 |
PART I.
SPECIAL NOTE REGARDING FORWARD-LOOKING STATEMENTS
This report contains forward-looking statements regarding future events and our future results that are subject to the safe harbors created under the Securities Act of 1933 (Securities Act) and the Securities Exchange Act of 1934 (Exchange Act). All statements contained in this report other than statements of historical fact, including statements regarding our future results of operations and financial position, our business strategy and plans, and our objectives for future operations, are forward-looking statements. The words “believe,” “may,” “will,” “estimate,” “continue,” “anticipate,” “goal,” “plan,” “intend,” “expect,” “seek”, and similar expressions are intended to identify forward-looking statements. We have based these forward-looking statements largely on our current expectations and projections about future events and trends. These forward-looking statements are subject to a number of risks, uncertainties and assumptions, including those described under “Part I, Item 1A. Risk Factors,” and elsewhere in this report. Moreover, we operate in a very competitive and rapidly changing environment. New risks emerge from time to time. It is not possible for our management to predict all risks, nor can we assess the impact of all factors on our business or the extent to which any factor, or combination of factors, may cause actual results to differ materially from those contained in any forward-looking statements we may make. In light of these risks, uncertainties and assumptions, the future events and trends discussed in this report may not occur and actual results could differ materially and adversely from those anticipated or implied in the forward-looking statements.
You should not rely upon forward-looking statements as predictions of future events. The events and circumstances reflected in the forward-looking statements may not be achieved or occur. Although we believe that the expectations reflected in the forward-looking statements are reasonable, we cannot guarantee future results, levels of activity, performance, or achievements. We are under no duty to update any of these forward-looking statements after the date of this report or to conform these statements to actual results or revised expectations.
As used in this report, the terms “Model N,” “Registrant,” “we,” “us,” “our,” and “the Company” mean Model N, Inc. and its subsidiaries unless the context indicates otherwise.
Overview
Model N is thea leader in Revenue Management cloud solutions. We help our customers maximize their revenues by maximizing sell time, revenues per opportunity and number of opportunities. Our cloud solutions manage every dollar that impacts the customer’s top line and transformstransform the revenue lifecycle from a series of disjointed operations into a strategic end-to-end process. With deep industry expertise, Model N supportswe support the uniquecomplex business needs of the world’s leading brands in life sciencesciences and technology companies across tens of thousands of users located in more than 100 countries. A representative list of our customers based on our total revenues for the fiscal year ended September 30, 2014from life sciences and technology includes our life science customers Actavis, Allergan, Amgen,AstraZeneca, Boston Scientific, Bristol-Meyers Squibb, Boehringer Ingelheim, Hospira, Johnson & Johnson, Microchip Technology and Merck, and our technology customers Cambridge Silicon Radio, Maxim, Microsoft Mobile, ST Micro and VMware.Novartis.
Many companies, in particular in the life sciencesciences and technology companies faceindustries, experience a gap between the strategic importance of revenue management and the current state of their revenue management processes. Historically, most companies have reliedtended to rely on a disjointed patchwork of manual processes, spreadsheets, point applications and legacy systems to manage their revenue processes. These processes and systems areoperated in isolation from one another and were labor intensive, error prone, inflexible siloed and costly, often resulting in missed revenue opportunities, suboptimal margins and increased revenue compliance risk. IndustryCurrent industry trends, includingwhich include shortening product lifecycles, tightening compliance and regulatory controls, increasing channel complexity and growing volumes of transactional data are now causing these outdated processes and legacy systems to become increasingly ineffective.
Our domain expertise in cloud-based revenue management solutions forand knowledge of the life sciencesciences and technology industries has enabled us to develop applicationssoftware designed to meet the unique, strategic needs of these industries, such as managed care and government pricing for life sciencesciences companies and channel incentives based on design wins for technology companies.
Our portfolio includes several complementary software applications:
These applications can be configuredsolutions are also applicable to meetcompanies in industries that sell complicated configurations of products such as in manufacturing. Model N Revenue Cloud transforms the revenue lifecycle into a strategic, end-to-end process aligned across the enterprise. Our industry specific needssolution suites – Revenue Cloud for Pharma, Revenue Cloud for Med Tech and Revenue Cloud for High Tech – offer a range of our customers, and enables them to maximize:
Our customer deployments rangesolutions from individual applicationsproducts to our complete product suites. Our on premise implementations are typically purchased through perpetual licenses and related implementation services and usually include ongoing maintenance support and application support. We recognize revenuesDeployments may vary from the salespecific divisions or territories to enterprise-wide implementations. In addition to industry specific clouds, Revenue Cloud provides a broad set of our perpetual licenses and related implementation services onmulti-tenant cloud-based products for a percentage-of-completion basis over the expected implementation period. Our cloud-based solutions are purchased through a subscription to our solutions and related implementation services. We recognize revenues from the subscription and related implementation services ratably beginning the day the customer is provided access to the subscription service through the longervariety of the initial contractual period or term of the customer relationship. In fiscal year 2014, we took several steps to transform our business model in order to increase the percentage of our business coming from Software as a Service (SaaS) and maintenance revenues. We believe we have an opportunity to accelerate the shift in our business model to recurring revenues, as SaaS is gaining wide acceptance as a delivery model, particularly in the technology sector and mid-market life science companies. We have started marketing and selling some of our products and services (such as Revvy) only as a SaaS offering.industries.
Overview of the Life ScienceSciences and Technology Industries
The life sciencesciences and technology industries are large and highly fragmented andfragmented. Companies in both industries market their products to a global customer base through diverse channels. Significant costs are required to launch a drug to the market; regulatoryglobal market. Regulatory pressures, consolidation, and other factors are drivingin these industries continue to drive a significant focus on revenue management.
Management of the revenue lifecycle is becoming a strategic imperative and source of competitive advantage for life sciencesciences and technology companies as they address increasingly globalized markets, sophisticated buyers, complex channels and expanding volumes of data from internal and market sources.
Several trends specific to the life science and technologythese industries further complicate revenue management.
Life Science:
sciences:
the emergence of large group purchasing, managed care organizations and integrated healthcare delivery networks which drive increased pricing pressure, contract volume and complexity;
Technology:
shortened product lifecycles which drive rapid pricing changes and require quick responses to quotes and competitive bidding;
Challenges to Effective Revenue Management
Traditionally, many life science and technology companies have addressed revenue management through a patchwork of manual processes and inflexible and costly custom systems. The current state ofsolutions. This outdated approach to revenue management systems impedes the ability of companies to respond to rapidly changing market conditions, which preventspreventing them from maximizing revenue and increasesincreasing their revenue compliance risk. Critical challenges include:
Incomplete and unreliable information for key strategic decisions.Legacy manual processes and systems used to manage the revenue lifecycle creates silos of data causing companies to make strategic marketing, pricing and resource allocation decisions that are often based on incomplete or inaccurate information. As a result, revenue strategies can be suboptimal, budgets may be misallocated, and sales and marketing efforts can fail to positively impact revenues.
Revenue leakage due to inadequate contract management and enforcement.Customer-specific contracts with complex pricing and commercial terms are common in many industries, in particular life sciences and technology. When the commercial terms of these contracts are not automated and monitored systematically, deviations from contract pricing can occur, volume commitments can be missed, unearned discounts may be given, and revenue can be lost.
Ineffective pricing across geographies and complex channels. Sophisticated buyers deploy global procurement strategies to discover and exploit regional and channel differences in pricing and contracting. The inability to enforce a single price for a specific sales opportunity across regions and channels can result in channel conflicts, which result in price and revenue erosion.
Inaccurate financial reporting. Complex contracts and distribution channels have made it more difficult to obtain and process financial information, which can result in inaccurate financial reporting. For example, technology companies face significant complexity in financial reporting and revenue recognition at the point of sale in their distribution channels. Life sciences companies have significant challenges correctly accruing their massive rebate and incentive claim volumes.
Difficulty complying with complicated government regulations. Satisfying the regulatory requirements of numerous federal and state programs is increasingly complex for life sciences companies. For example, government-driven programs require complex monitoring and reporting to compute and pay mandated rebates and fees under numerous federal and state programs. Government audits can expose ineffective management of these regulatory requirements and can result in penalties or program ineligibility.
Our Solutions
Our solutions enable customers to achieve significant returns on investment through increased revenues and gross margins while addressing vital business objectives:
Driving optimal pricing and contracting strategies. Our customers use our solutions to achievedevelop, deploy, monitor and drive optimal pricing and contracting strategies. Our solutions consolidate information across the revenue lifecycle and provide visibility into historical volume, price and contract performance trends. Our pricing analytics enable our customers to identify untapped revenue opportunities across customers or products and make better pricing and contracting decisions.
Realizing greater value from contracts. Our solutions enable customers to codify and automate complex pricing, incentives and financial and fulfillment terms that previously resided mainly on paper contracts. Our customers are able to maximize the value of contracts and realize additional revenue by tracking their customers’ performance and enforcing contract terms. Our solutions automatically price orders in real-time and enforce contract pricing and commercial terms. Our solutions also enable customers to track and execute other revenue-enhancing financial terms, such as negotiated price increases.
Maximizing revenue by standardizing and enforcing pricing and discounting policies. Our solutions allow customers to standardize pricing policies that can be enforced automatically across the enterprise and the channels to restrict unauthorized sales practices and discounting by sales personnel. By raising the visibility of, requiring authorization of, and enabling rapid resolution of, non-standard pricing, our customers can use our solutions to reduce unauthorized discounting. Through our channel solutions, our customers can gain visibility into and enforce channel pricing, and reduce price erosion caused by different price quotes for the same end customer.
Executing and optimizing channel incentives. Our solutions enable customers to manage the entire incentive lifecycle, from contracting to recognition and payment. Accurate management allows our customers to eliminate unearned discounts and overpayment of incentives. Our solutions also provide our customers with greater cross channel visibility to manage the effectiveness of their channel incentive programs. With this insight, our customers can better utilize their channel incentives to positively influence channel behavior and thus increase revenue.
Achieving accurate financial reporting. With our solutions, customers can manage all aspects of the contract-to-payment process related to calculating, monitoring, processing and triggering payments to end customers and channel intermediaries. For example, by automating all rebates, these liabilities can be accurately accrued, enabling our customers to consistently record accruals in compliance with financial accounting requirements, while ensuring customers and channels are credited on a timely basis.
Automating government regulatory compliance to reduce revenue risk. Our solutions enable customers to comply systematically with government regulations, policies, procedures, and pricing and reporting requirements. Further, by automating and integrating contract terms, incentives and pricing into mandated price and payment calculations, our life sciences customers are better able to manage compliance with the terms of critical government programs that provide significant returns on investment, improve gross margins and address vital business objectives by:sources of revenue.
Our Competitive Strengths
We believe our key competitive strengths include:
Comprehensive approach to revenue management. Our solutions address the end-to-end revenue management lifecycle. Our integrated, end-to-end application suites enable our customers to transform their revenue management processes from disjointed tactical operations into a cohesive, strategic, end-to-end process. Providing suites of cloud-based solutions is an advantage that enables us to address both decision making and process automation.
Deep domain knowledge. Our expertise in the revenue management needs of life sciences and technology companies enables us to develop solutions that address the unique demands of these industries. By incorporating best practices into our industry-specific solutions, implementation methodologies and support programs, our customers can experience significantly accelerated time to value. Our team possesses the deep industry expertise in life sciences and technology to enable our customers to maximize and accelerate the transformational benefits of our solutions.
Our Strategy
Our leadership strategy for revenue management solutions includesto leading life sciences and technology customers. Our close customer relationships provide us with insight into how these companies use our solutions and help us to maintain a competitive advantage by anticipating their future requirements. We also believe that the followinguse of our products by respected industry leaders also increases the value of our brand in these industries.
Talented team focused on customer success. We employ experts from the life sciences and technology industries in key elements:customer-facing and development roles. Additionally, we have established strong core values that start with a focus on customer success. Our customer focus has resulted in close relationships with our customers and a strong reference base for sales opportunities.
Products
We provide solutions that span the organizational and operational boundaries of functions such as sales, marketing and finance, and serve as a system of record for key revenue management processes including pricing, contracts, rebates, incentives, channel management, and regulatory compliance. Our application suitessolutions are purpose-built for the life sciencesciences and technology industries and are designed to work with enterprise resource planning (ERP) and customer relationship management (CRM) applications that do not typically provide revenue management capabilities by enablingcapabilities. Our solutions enable real-time pricing, managing contractscontract management, vertical sales management (such as for the semiconductor industry), and automating channel incentives management, including rebates. Each suite isrebates, incentives and regulatory compliance. Our Revenue Cloud suites are comprised of several applications,solutions, which are integrated to work together but which may also be deployed individually. For example, when deployed as an interconnected suite, our applicationssolutions allow prices that are set up in the price management process to flow into the quoting process. Similarly, closed deals are captured in contract management and can be synchronized with ERP systems and into regulatory reporting as required by government agencies. Our solutions provide critical data that is typically not available in either CRM or ERP systems, such as prices, quotes, contracts, incentives and rebate claims. Our applicationssolutions can also can provide
customers predictive revenue insight optimization of sales and marketing investments and offers, andas well as customer profitability intelligence. We have also developed an additional solution that we offer only throughOur solutions are delivered via four distinct cloud-based offerings:
Revenue Clouds for Pharma and Med Tech – These Revenue Clouds help life science companies optimize revenue throughout the cloudcommercialization process and thatreduces revenue leakage, while adhering to government regulations.
Government Pricing. Helps customers optimize revenue and reduces risk of fines and other penalties due to non-compliance with regulatory pricing requirements.
Medicaid. Helps customers comply with regulatory requirements and pay rebate claims timely and at correct rates for government Medicaid programs.
Global Pricing Management. Enables a streamlined pricing process by consolidating information into a single system of record, which provides users’ access to accurate and up-to-date information.
Global Tender Management. Optimizes revenue regionally and globally by enabling opportunity segmentation and targeting, optimal bid pricing and post-award tracking to manage the contract lifecycle and award value.
Provider Management. Reduces the risk of non-compliance with regulatory requirements throughout the institutional contracting process.
Payer Management. Reduces the risk of non-compliance with regulatory requirements throughout the pharmacy benefit manager and payer contracting process.
Revenue Cloud for High Tech- Revenue Cloud for High Tech enables customers to modernize their sales processes by adopting a strategic approach to manage the revenue lifecycle by planned revenue.
Deal Management. This subscription increases deal conversion and pricing consistency with pricing, quotes and contracts natively supporting the High Tech Channel end-to-end.
Deal Intelligence. This subscription controls price concessions and determines ideal prices using in context analytics.
Channel Management. This subscription provides manufacturers a clearer view of inventory, including the ability to evaluate and perform actions, such as price protection and stock rotation and match available inventory to quotes.
Sales Conductor. This subscription extends revenueSalesforce Sales Cloud with purpose-built capabilities for the semiconductor and electronic component industries.
Rebates Management. This subscription centralizes control of rebate programs to reduce upfront discounts and effective management to sophisticated sales quotes.of all rebate programs.
Channel Data Management. This subscription automates the process of collection, cleansing, validation and standardization of channel partner data, such as POS, inventory, and claims.
Revenue Management Enterprise—Cloud – a suite of enterprise applicationssoftware-as-a-service (SaaS) subscriptions designed to automate the end-to-end revenue management processes including:
Revenue Management Intelligence—lifecycle:
Configure Price Quote. Streamlines the quote to contract process by enabling the configuration of complex services, bundles and solutions into a suitesingle interface. This application provides integration with the SAP ERP system and SAP Variant Configurator.
Contract Lifecycle Management. Enables organizations to create and manage all types of revenue management business intelligence applications that enable customerssell-side contracts in one place including service contracts, sales contracts, NDAs, statements of work, and more. The solution enables users to analyze revenue driverscreate and optimize revenue outcomes by delivering industry-specific visualizations, analysesmanage contracts directly.
Rebate Management. The solution enables companies to define rebate programs, track and actions including:calculate rebate earnings and accruals on transactions, point-of-sale, inventory, or any data set, and provide visibility across the organization.
Technology
TheOur suites of Revenue Management application suitesCloud solutions are architected in layers. The first layer is composed of end-user operational and analysis applications.solutions. The middle layer consistsis comprised of supporting services and business engines, and the lowest layer consistsis comprised of a unified technology platform used to construct and support all modules at thein higher layers. The platform also provides access to the normalized operational database where the transactional revenue management data used by the operational applicationssolutions are stored. It also provides access and facilitates the synchronization with the de-normalized analytics database where the revenue management data used by the analytics applicationssolutions are stored.
TheOur Revenue Management Enterprise and Revenue Management Intelligence suitesCloud solutions are built on a variety of industry standards, depending on the solution, such as Java EE, HTML5, Amazon Web Service and HTML5,Force.com, which give the end-users of our applications an intuitive and familiar browsing experience. These standard technologies enable us to offer our customers a familiar technology environment that is widely understood and utilized.
Revvy is builtutilized, as well as the ability to use certain solutions on the SalesForce1 Platform with engines built using industry standards such as NodeJS. These technologies enables us to offer our customers cloud-based applications through desktop,a tablet and other mobile devices.devices, including smart phones running iOS and Android.
Our technology platform has allowed us to quickly develop new applications,solutions, features and functionalities. We believe that the platform is configured to meet the needs of abroad horizontal markets as well as specific vertical marketmarkets and, within each instance, to meet the specific needs of each of our customers. The flexibility of the technology platform has also allowed us to add mobile device support and deploy cloud-based solutions in a rapid and efficient manner, and we believe it will enable us to continue to add new capabilities in the future.
Our technology is designed specifically to handle the complex calculations and massive data sets associated with revenue management processes typical in the life sciencesciences and technology industries. With the expansion of global deployments, scalability has also been a key requirement of our customers and has been a focus for us across all of the layers of our application suites.
Our solutions have been designed to ensure high reliability, strong security and the technology platform includes a comprehensive set of built-in features and management tools to allow optimal and continuous operation. The Revenue Management EnterpriseCloud for Pharma, Revenue Cloud for Med Tech, Revenue Cloud for High Tech and Revenue Management IntelligenceCloud suites are availableonly offered to our customers both on-premise and through the cloud. The Revvy suite is available only through the cloud. We operate a reliable architecture designed to reduce the risk associated with infrastructure outages, improvesimprove system scalability and security, and allowsallow for flexibility in deployment. The environment for our cloud-based solutions is secured and is designed to be secure and provide high availability with disaster recovery capabilities. Our cloud-based solutions are operated through three third-party data centers located in Missouri, Texas, and Massachusetts.
Services and Customer Support
Leveraging deep industry and subject matter expertise, weWe offer a comprehensive set of services to assist our customers through the full lifecycle of new business transformations or upgrades of existing solutions. We help our customers define, implement and then support or manage our solutions. We provide implementation services, managed services and strategic services both on and off-shore, as described below.
Implementation services. We assist our customers in the implementation or upgrade of our Revenue Cloud, including project management, design and solution blueprint, process improvement, application configuration or customization, systems integration, data cleansing and migration, testing and performance tuning, production cutover and post go-live support.
Managed services. We offer managed services for customers using our solutions either on-premise through a legacy contract or in the cloud, which include systems administration and infrastructure management, application support, and education services, including process, application and end-user training.
Strategic services. We assist our customers in defining best practices and strategies in revenue management, assessing the capability of existing transaction and decision support solutions, developing business cases for change and transformation plans and answering strategic questions.
Customer support. We deliver customer support from support centers located in United States, as well as at our offices in India. We offer a range of support offerings, including 24x7x365, packaged into varying levels of access to our support resources.
For project delivery, we use a standard implementation methodology incorporating lessons learned from past work to ensure the success of our current projects. This methodology enables us to predictably estimate project costs and schedule, and proactively mitigate most implementation challenges.
In addition, we have cultivated relationships to promote and assist with the implementation of our solutions with consulting firms, including global firms such as IMS Health Incorporated and industry specialists such as HighPoint Solutions, LLC.firms. While we do not maintain formal contractual relationships with these firms that require them to promote our solutions to their clients, we work with them for implementation and other professional services projects. As a result, these firms have expertise in our technologies and best practices and have invested in building out their practice areas with our revenue management solutions.
We deploy our resources globally through offices located in the United States, India, the United Kingdom and Switzerland.
Customers
We market and sell our solutions to customers in the life science and technology industries. As of September 30, 2014,2017, we had 80 license and subscription customers across the life science and technology industries, excluding five divisions or subsidiaries of certain of our162 customers. For the fiscal year ended September 30, 2014,2017, revenues from our life sciencesciences and technology customers accounted for approximately 86%80% and 14%20% of our total revenues, respectively. Our customers range in size from the largest multi-national corporations to smaller companies. Our customers represent a range of sub-verticals within thesethe larger life sciences and technology industries, including biotechnology, pharmaceutical, medical device, semiconductor, electronic component, consumer electronics and software markets.software.
We pursue close, long-term relationships with our customers because we believe strong customer relationships are the key to our success. Our agreements withCustomers of our on premise customers typically provideRevenue Cloud solutions enter into a software-as-a-service agreement that provides for the purchase of a perpetual licensesubscription to the software and relatedour solutions as well as implementation services. A majority of these implementation services are determined at the initial purchase of the software. Customers can order additional implementation services pursuant to additional statements of work on a project by project basis, but they do not have any obligation for future purchases beyond what is agreed to in the initial contract or statement of work. Customersmaintaining on-premise implementations under legacy contracts also purchase, at their discretion, maintenance and support services on an annual basis. Each of our SaaS customers enter into a subscription agreement that provides for a subscription to our applications as well as related implementation services for a specified term. We often sell to multiple divisions within our customers’ organizations, which have the ability to independently purchase solutions and services directly. However,directly; however, we treat multiple divisions as a single customer to the extent they are part of a single organization. During the fiscal years ended September 30, 2017 and 2015, one customer, Johnson & Johnson, accounted for approximately 11% of our total revenues. However, during the fiscal year ended September 30, 2014, one2017, no customer Johnson and Johnson, accounted for approximately 15%represented more than 10% of our totalsubscription revenues. During the fiscal year ended September 30, 2013, two different customers,2016, no customer accounted for approximately 12% eachmore than 10% of our total revenues. During the fiscal year ended September 30, 2012, two customers accounted for approximately 14% and 10% of our total revenues, respectively
Sales and Marketing
Our sales and marketing team is focused on expanding relationships with existing customers and adding new customers. We primarily target large and mid-sized organizations worldwide through our direct sales force. Our sales and marketing programs are also organized by geographic region. We have historically focused our sales efforts in the United States and Western Europe, but we believe markets outside of the United Statesthese regions offer a significant opportunity for growth and we intend to make additional investments in sales and marketing to expand in these markets. We augment our sales professionals with solutions engineers and industry domain experts whovia our Center of Excellence. These professionals work closely with prospective customers during the sales process. Our marketing team supports sales with demand generation, competitive analysis and sales tools, and contributes to the sales process through lead generation, brand building, industry analyst relations, presspublic relations and industry research.
Our sales and marketing efforts are tailored to communicate effectively to senior executives in our target industries. We believe our industry expertise enables a better understanding of our customers’ unique needs, including the specialized business requirements of industry segments, such as pharmaceutical, biotechnology,
medical device, semiconductor, consumer electronics and software. As a result, we believe we are able to engage our customers during the sales process using quantitative and qualitative benchmarks built on a combination of comparative data from our customers and from surveys of these industries.
We host an annual customer conference, Rainmaker, which plays a significant role in driving sales forof our solutions. Customers are invited both as attendees and participants to deliver sessions relevant to the interests and practices of the life sciencesciences and technology industries. We also invite potential customers to this conference in order to leverage our strong customer referencesrelationships to accelerate sales cycles. In addition, Rainmaker provides a forum to build our eco-system of strategic partner relationships, offering partners the opportunity to work closely with our sales force on joint sales pursuits.
Research and Development
Our reputation benefits from our continuous commitment to research and development and our ability to make timely introductions of new products, technologies, features and functionality. Our research and development organization is responsible for the definition, design, development, testing, certification and ongoing maintenance of our applications.solutions. Our research and development expenses were $18.7$31.1 million, $16.8$23.7 million, and $17.7$17.9 million in the fiscal years ended September 30, 2014, 2013,2017, 2016, and 2012,2015, respectively. We also capitalized $0.4 million, $3.9$1.1 million and $1.2$2.5 million of software development costs in the fiscal years ended September 30, 2014, 20132017, 2016, and 2012,2015, respectively, related to the development of certain additional software as a service offeringofferings that will only be offered through the cloud. These capitalized costs include all direct employee related costs. Our efforts are focused on developing new applicationssolutions and core technologies and further enhancing the functionality, reliability, performance and flexibility of existing solutions. When considering improvements and enhancements to our applications,solutions, we communicate with our customers and partners who provide significant feedback for product development and innovation. We focus our efforts on anticipating customer demand by quicklyand bringing our new applicationssolutions and new versionsenhancements of existing applicationssolutions to market through a seasonal release schedule (Spring, Summer, and Winter) in order to remain competitive in the marketplace. We also closely monitor the changes in business environment and regulations in our target industries, particularly in life science,sciences, where quick deliveries of updates to our applicationssolutions are critical to allowing our customers to remain in compliance with government regulations.
Because our solutions often serve as a system-of-record for our customers’ revenue management processes, our research and development efforts reflect the extensive IT needs of our customers in both life sciencesciences and technology. Our research and development efforts continue to focus on enhancing our solutions to meet the increasingly complex infrastructure requirements of our customers in these industries.
Our product development process is based on deep industry knowledge and familiarity with the specific requirements of individual customers, combined with continued innovation using state of the art software development processes and tools. We follow an “agile” development process, which helps us clarify requirements and receive feedback early, accommodate changes and deliver products that better match the overall needs of our customers with higher quality.
As of September 30, 2014,2017, our research and development team consisted of 202249 full-time employees globally.
Competition
The market for revenue management solutions is highly competitive, fragmented and subject to rapid changes in technology. We face competition from spreadsheet-assisted manual processes, internally developed solutions, large integrated systems vendors, providers of business process outsourcing services, horizontal revenue management solutions and smaller companies that offer point solutions. Companies lacking information technology (IT) resources often resort to spreadsheet-assisted manual processes or personal database applications. In addition, some potential customers, particularly large enterprises, may elect to develop their own internal solutions, including custom-built solutions that are designed to support the needs of a single organization. Companies with large investments in ERP or CRM applications, which do not typically provide
revenue management capabilities, may extend these horizontal applications with customizations or point solution applications in order to address single or a small set of revenue management sub processes or drivers. Common horizontal applications that customers attempt to configure for this purpose in the life sciencesciences and technology industries include large integrated systems vendors like SAP AG and Oracle Corporation. We also encounter competition from small independent companies, which compete on the basis of price, unique product features or functions and custom developments.
We believe we compete based primarily on the following factors:
access to prospective customers through strategic partnerships;
global system and support capabilities; and
While we believe that we compete favorably on the basis of each of the factors listed above, many of our competitors have greater name recognition, larger sales and marketing budgets and greater resources than we do and may have pre-existing relationships with our potential customers, including relationships with, and access to, key decision makers within these organizations, and major distribution agreements with consultants and system integrators. Moreover, many software vendors could bundle solutions or offer them at a low price as part of a larger product sale.
With the introduction of new technologies and market entrants, we expect competition to intensify in the future. We also expect enterprise software vendors that focus on enterprise resource planning or back-office applications to enter our market with competing products. In addition, we expect sales force automation vendors to acquire or develop additional solutions that may compete with our solutions.
Intellectual Property
We rely upon a combination of copyright, trade secret, trademark and, to a lesser extent, patent laws, and we also rely on contractual restrictions, such as confidentiality agreements and licenses, to establish and protect our proprietary rights. As of September 30, 2014,2017, we had four U.S.eight patent applications pending and nofive issued patents.patents expiring between 2023 and 2034. We have a number of registered and unregistered trademarks. We maintain a policy requiring our employees, consultants and other third parties to enter into confidentiality and proprietary rights agreements and to control access to our software, documentation and other proprietary information. We also believe that factors resulting from our length of presence in the market and significant research and development investments, such as our deep expertise in life sciencesciences and technology revenue management practices, the ability of our solutions to handle the complexities of revenue management processes, the technological and creative skills of our personnel, the creation of new features and functionality and frequent enhancements to our solutions are essential to establishing and maintaining our technology leadership position.
Despite our efforts to protect our proprietary rights, unauthorized parties may attempt to copy or obtain and use our technology to develop products with the same functionality as our solutions. Policing unauthorized use of our technology is difficult. The laws of other countries in which we market our application suite may offer little or no effective protection of our proprietary technology. Our competitors could also independently develop technologies equivalent to ours, and our intellectual property rights may not be broad enough for us to prevent competitors from selling products incorporating those technologies. Reverse engineering, unauthorized copying or other misappropriation of our proprietary technology could enable third parties to benefit from our technology without paying us for it, which would significantly harm our business.
Employees
As of September 30, 2014,2017, we employed 589864 people, including 222407 in services and customer support, 202249 in research and development, 114138 in sales and marketing and 5170 in a general and administrative capacity. As of such date, we had 318475 employees in the United States and 271389 employees in international locations. We also engage a number of temporary employees and consultants. None of our employees are represented by a labor union with respect to his or her employment with us. We have not experienced any work stoppages and we consider our relations with our employees to be good.
Segments
We have one operating segment with one business activity, developing and monetizing revenue management solutions,solutions. Our Chief Operating Decision Maker (CODM) is our Chief Executive Officer, who manages operations on a consolidated basis for purposes of allocating resources. When evaluating performance and there are no segment managers who are held accountable for operations, operating results or plans for levels or components belowallocating resources, the CODM reviews financial information as presented on a consolidated unit level.basis. Accordingly, we have determined that we operate in a single reporting segment. For a discussion of revenues, operating profit or loss and total assets, please see Part II, Item 8 of this Form 10-K.
Geographic Information
See Note 912 of Notes to Consolidated Financial Statements included in Part II, Item 8 of this Form 10-K.
Corporate Information
We were incorporated in Delaware on December 14, 1999. Our principal offices are located at 1600 Seaport777 Mariners Island Boulevard, Suite 400, Pacific Shores Center, Building 6, Redwood City,300, San Mateo, CA 94063,94404, and our telephone number is (650) 610-4600. Our website address is www.modeln.com. The information contained on, or that can be accessed through, our website is not part of this report. Model N is our registered trademark in the United States and in various international jurisdictions. Model N, the Model N logo and all of our product names appearing in this report are our trademarks. Other trademarks appearing in this report are the property of their respective holders.
Available Information
We file annual, quarterly and other reports, proxy statements and other information with the Securities and Exchange Commission (SEC) under the Securities Exchange Act of 1934, as amended (Exchange Act). We also make available, free of charge on the investor relations portion of our website at investor.modeln.com, our annual report on Form 10-K, quarterly reports on Form 10-Q, current reports on Form 8-K, and amendments to those reports filed or furnished pursuant to Section 13(a) or 15(d) of the Exchange Act as soon as reasonably practicable after they are filed electronically with the SEC. You can inspect and copy our reports, proxy statements and other information filed with the SEC at the offices of the SEC’s Public Reference Room located at 100 F Street, NE, Washington D.C. 20549. Please call the SEC at 1-800-SEC-0330 for further information on the operation of Public Reference Rooms. The SEC also maintains an Internet website at http://www.sec.gov/ where you can obtain most of our SEC filings. You can also obtain paper copies of these reports, without charge, by contacting Investor Relations at (650) 610-4998.610-4600.
Our operating and financial results are subject to various risks and uncertainties. You should carefully consider the risks and uncertainties including those described below, together with all of the other information in this report, including the Consolidated Financial Statements and the related notes included elsewhere in this report, before deciding whether to invest in shares of our common stock. The risks and uncertainties described below are not the only ones we face. Additional risks and uncertainties that we are unaware of, or that we currently believe are not material, may also become important factors that adversely affect our business. If any of the following risks or others not specified below actually occurs, our business, financial condition, results of operations, and future prospects could be materially and adversely affected. In that event, the market price of our common stock could decline, and you could lose part or all of your investment.
Risks Related to Our Business
We have incurred losses in the past, and we may not be profitable in the future.
We have incurred net losses of $20.9 million, $0.9$39.5 million and $5.7$33.1 million for the fiscal years ended September 30, 2014, 2013,2017 and 2012,2016, respectively. As of September 30, 2014,2017, we had an accumulated deficit of $83.0$175.3 million. We expect that our expenses will increase in future periods due to our recent acquisition and as we implement additional initiatives designed to grow our business, including, among other things, increasing sales to existing customers, expanding our customer base, introducing new applications, for example, our new configure, price and quote solution,solutions, enhancing existing solutions, extending into the mid-market and continuing to penetrate the technology industry and pursuing selective acquisitions. Increased operatingintegrating the personnel, products, technologies and customers of Revitas. Operating expenses related to personnel costs such as salary, bonus, commissions and stock-based compensation and overhead allocation as well as third-party contractors, travel-related expenses and marketing programs will alsomay increase our expenses in future periods. In the near-term, we do not expect that our revenues willmay not be sufficient to offset these expected increases in operating expenses, and we expect that we will incur losses. Additionally, we may encounter unforeseen expenses, difficulties, complications, delays and other unknown factors that may result in losses in future periods. You should not consider our historical growth rates in revenues as indicative of our future performance, and weWe cannot assure you that we will again obtain and maintain profitability in the future. Any failure to return to profitability may materially and adversely affect our business, results of operations and financial condition.
Our operating results are likely to vary significantly from period to period and be unpredictable, which could cause the trading price of our common stock to decline.
Our operating results have historically varied from period to period, and we expect that this trend will continue as a result of a number of factors, many of which are outside of our control and may be difficult to predict, including:
our ability to successfully expand our business domestically and internationally;
disruptions in our relationships with partners;
the timing of new orders and revenue recognition for new and prior period orders;
changes in the competitive landscape of our industry, including mergers or consolidation among our customers or competitors;
the complexity of implementations and the scheduling and staffing of the related personnel, each of which can affect the timing and duration of revenue recognition;
issues related to changes in customers’ business requirements, project scope, implementations or market needs;
the mix of revenues in any particular period between license and implementation, and SaaS and maintenance;
the timing of upfront recognition of sales commission expense relative to the deferred recognition of our revenues;
entry of new competitors into our market.
Any one of the factors above or discussed elsewhere in this report or the cumulative effect of some of the factors referred to above may result in significant fluctuations in our financial and other operating results. This variability and unpredictability could result in our failure to meet expectations of investors for our revenues or other operating results for a particular period. If we fail to meet or exceed such expectations for these or any other reasons, the market price of our common stock could fall.decrease.
We must improve our sales execution and increase our sales channels and opportunities in order to grow our revenues, and if we are unsuccessful, our operating results may be adversely affected.
We must improve our sales execution in order to, among other things, increase the number of our sales opportunities and grow our revenue. We must improve the market awareness of our solutions and expand our relationships with our channel partners in order to increase our revenues. Further, we believe that we must continue to develop our relationships with new and existing customers and partners, and create additional sales opportunities to effectively and efficiently extend our geographic reach and market penetration. Our efforts to improve our sales execution could result in a material increase in our sales and marketing expense and general and administrative expense, and there can be no assurance that such efforts will be successful. We have experienced challenges in sales execution in past fiscal quarters, and if we are unable to significantly improve our sales execution, increase the awareness of our solutions, create additional sales opportunities, expand our relationships with channel partners, leverage our relationship with strategic partners, such as Salesforce, or effectively manage the costs associated with these efforts, our operating results and financial condition could be materially and adversely affected.
Failure to adequately expand and train our direct sales force will impede our growth.
We rely almost exclusively on our direct sales force to sell our solutions. We believe that our future growth will depend, to a significant extent, on the continued development of our direct sales force and its ability to manage and retain our existing customer base, expand the sales of our solutions to existing customers and obtain new customers. Because our software is complex and often must interoperate with complex computing requirements, it can take longer for our sales personnel to become fully productive compared to other software companies. Our ability to achieve significant growth in revenues in the future will depend, in large part, on our success in recruiting, training and retaining a sufficient number of direct sales personnel. New hires require significant training and may, in some cases, take more than a year before becoming fully productive, if at all. If we are unable to hire and develop sufficient numbers of productive direct sales personnel, and if these sales personnel are unable to achieve full productivity, sales of our solutions will suffer and our growth will be impeded.
Our sales cycles are time-consuming, and it is difficult for us to predict when or if sales will occur and when we will begin to recognize the revenues from our future sales.occur.
Our sales efforts are often targeted at larger enterprise customers, and as a result, we face greater costs, must devote greater sales support to individual customers, have longer sales cycles and have less predictability in completing some of our sales. Also, sales to large enterprises often require us to provide greater levels of education regarding the use and benefits of our solutions. We believe that our customers view the purchase of our solutions as a significant and strategic decision. As a result, customers carefully evaluate our solutions, often over long periods with a variety of internal constituencies. In addition, the sales of our solutions may be subject to delays if the customer has lengthy internal budgeting, approval and evaluation processes, which are quite common in the context of introducing large enterprise-wide technology solutions. As a result it is difficult to predict the timing of our future sales.
Our transition from an on premise to a cloud-based business model is subject to numerous risks and uncertainties.
We must improveOur business model has shifted away from sales of on premise software licenses to focus on sales of subscriptions for our cloud-based solutions, which provide our customers the right to access certain of our software in a hosted environment for a specified subscription period. This cloud-based strategy may give rise to a number of risks, including the following:
if customers are uncomfortable with cloud-based solutions and desire only perpetual licenses, we may experience longer than anticipated sales cycles and sales of our cloud-based solutions may lag behind our expectations;
our cloud-based strategy may raise concerns among our customer base, including concerns regarding changes to pricing over time, service availability, information security of a cloud-based solution and access to files while offline or once a subscription has expired;
we may be unsuccessful in maintaining our target pricing, adoption and projected renewal rates;
we may select a target price that is not optimal and could negatively affect our sales executionor earnings; and increase
we may incur costs at a higher than forecasted rate as we expand our cloud-based solutions.
Our cloud-based strategy also requires a considerable investment of technical, financial, legal and sales channelsresources, and opportunitiesa scalable organization. Market acceptance of such offerings is affected by a variety of factors, including but not limited to: security, reliability, scalability, customization, performance, current license terms, customer preference, customer concerns with entrusting a third party to store and manage their data, public concerns regarding privacy and the enactment of restrictive laws or regulations. Whether our business model transition will prove successful and will accomplish our business and financial objectives is subject to numerous uncertainties, including but not limited to: customer demand, renewal rates, channel acceptance, our ability to further develop and scale infrastructure, our ability to include functionality and usability in ordersuch solutions that address customer requirements, tax and accounting implications, pricing and our costs. In addition, the metrics we use to grow our revenues, and if we are unsuccessful, our operating results may be adversely affected.
We must improve our sales execution in order to, among other things, increasegauge the numberstatus of our sales opportunities and grow our revenue. We must improvebusiness may evolve over the market awarenesscourse of our solutions and expand our relationships with our channel and other partners in order to increase our revenues. Further, we believe that we must continue to develop our relationships with new and existing customers and partners, and create additional sales opportunities to effectively and efficiently extend our geographic reach and market penetration. For example, our partnership with salesforce.com presents us with an opportunity to create additional sales opportunities with our Revvy solutions. Our efforts to improve our sales execution could result in a material increase in our sales and marketing expense and general and administrative expense, and there can be no assurance that such efforts will be successful. In addition, there can be no assurance that our relationships with channel and other partners will be successful. the transition as significant trends emerge.
If we are unable to significantly improvesuccessfully establish our sales execution, increasecloud-based strategy and navigate our business model transition in light of the awareness of solutions, create additional sales opportunities, including additional sales opportunities with our Revvy solutions, expand our relationships with channelforegoing risks and other partners, prevent disruptions in our relationships with partners, or effectively manage the costs associated with these efforts, our operating results and financial condition could be materially and adversely affected.
Our implementation cycle is lengthy and variable and depends upon factors outside our control and could cause us to expend significant time and resources prior to earning associated revenues.
The implementation and testing of our solutions may range from a few months to up to three years, and unexpected implementation delays and difficulties can occur. Implementing our solutions typically involves integration with our customers’ systems, as well as adding their data to our system. This can be complex, time-consuming and expensive for our customers and can result in delays in the implementation and deployment of our solutions. The lengthy and variable implementation cycle may also have a negative impact on the timing of our revenues, causing our revenues and results of operations to vary significantly from period to period.
A substantial majority of our total revenues have come from our Revenue Management Enterprise suite, and decreases in demand for our Revenue Management Enterprise suite could adversely affectuncertainties, our results of operations and financial condition.could be negatively impacted.
Historically, a substantial majority of our total revenues has been associated with our Revenue Management Enterprise suite, whether deployed as individual applications or as a complete suite. We expect our Revenue Management Enterprise suite to continue to generate a substantial majority of our total revenues for the foreseeable future. Declines and variability in demand for our Revenue Management Enterprise suite could occur for a number of reasons, including improved products or product versions being offered by competitors, competitive pricing pressures, failure to release new or enhanced versions on a timely basis, technological changes that we are unable to address or that change the way our customers utilize our solutions, reductions in technology spending, export restrictions or other regulatory or legislative actions that could limit our ability to sell those products to key customer or market segments. Our business, results of operations, financial condition and cash flows would be adversely affected by a decline in demand for our Revenue Management Enterprise suite.
Our revenues are dependent on our ability to maintain and expand existing customer relationships and our ability to attract new customers.
Our total revenues are largely dependent on the sale of software licenses and the related implementation services we provide. For example, our license and implementation revenues constituted approximately 43%, 58%, and 59% of our total revenues for the fiscal years ended September 30, 2014, 2013 and 2012, respectively. Customers purchasing software licenses for our solutions generally make large orders and the revenues related to these sales are recognized over the subsequent implementation period, which may range from a few months to up to three years. The continued growth of our revenues is dependent in part on our ability to expand the use of our solutions by existing customers and attract new customers. Likewise, it is also important that customers using our on premiseon-premise solutions renew their maintenance agreements and that customers using our cloud-based solutions renew
their subscription agreements with us. Our customers have no obligation to renew their maintenance or subscription agreements after the expiration of the initial term, and we cannot assure youthere can be no assurance that they will do so. We have had in the past and may in the future have disputes with customers regarding our solutions, which may impact such customers’ decisions to continue to use our solutions and pay for maintenance and support in the future.
If we are unable to expand our customers’ use of our solutions, sell additional solutions to our customers, maintain our renewal rates for maintenance and subscription agreements and expand our customer base, our revenues may decline or fail to increase at historical growth rates, which could adversely affect our business and operating results. In addition, if we experience customer dissatisfaction with customers in the future, we may find it more difficult to increase use of our solutions within our existing customer base and it may be more difficult to attract new customers, or we may be required to grant credits or refunds, any of which could negatively impact our operating results and materially harm our business.
The loss of one or more of our key customers could slow our revenue growth or cause our revenues to decline.
A substantial portion of our total revenues in any given period may come from a relatively small number of customers. As of September 30, 2014,2017, we had 80 customers across the life science and technology industries, excluding five divisions or subsidiaries of certain of our162 customers. Although our largest customers typically change from period to period, for the fiscal year ended September 30, 2014,2017, our 15 largest customers accounted for more than 69%53% of our total revenues, and one customer, Johnson & Johnson, accounted for approximately 15%11% of our total revenues in 2017. However, during the fiscal year ended September 30, 2017, no customer represented more than 10% of our subscription revenues. We expect that we will continue to depend upon a relatively small number of customers for a significant portion of our total revenues for the foreseeable future. The loss of any of our significant customers or groups of customers for any reason, or a change of relationship with any of our key customers may cause a significant decrease in our total revenues.
Additionally, mergers or consolidations among our customers especially those in the life science industry,sciences and semiconductor industries, both of which isare currently undergoing significant consolidation, could reduce the number of our customers and could adversely affect our revenues and sales. In particular, if our customers are acquired by entities that are not also our customers, that do not use our solutions or that have more favorable contract terms and choose to discontinue, reduce or change the terms of their use of our solutions, our business and operating results could be materially and adversely affected.
If our solutions experience data security breaches, and there is unauthorized access to our customers’ data, we may lose current or future customers, our reputation and business may be harmed and we may incur significant liabilities.
Our solutions are used by our customers often require significant configuration efforts to matchmanage and store personally identifiable information, proprietary information and sensitive or confidential data relating to their complex business processes. The failurebusiness. Although we maintain security features in our solutions, our security measures may not detect or prevent hacker interceptions, break-ins, security breaches, the introduction of viruses or malicious code, such as “ransomware,” and other disruptions that may jeopardize the security of information stored in and transmitted by our solutions. Cyber-attacks and other malicious Internet-based activity continue to meetincrease generally. A party that is able to circumvent our security measures in our solutions could misappropriate our or our customers’ proprietary or confidential information, cause interruption in their requirements could resultoperations, damage or misuse their computer systems and misuse any information that they misappropriate. Because techniques
used to obtain unauthorized access or sabotage systems change frequently and generally are not identified until they are launched against a target, we may be unable to anticipate these techniques or to implement adequate preventative measures.
There can be no assurance that limitation of liability, indemnification or other protective provisions in customer disputes, lossour contracts would be applicable, enforceable or adequate in connection with a security breach, or would otherwise protect us from any such liabilities or damages with respect to any particular claim. We also cannot be sure that our existing general liability insurance coverage and coverage for errors or omissions will continue to be available on acceptable terms or will be available in sufficient amounts to cover one or more large claims, or that the insurer will not deny coverage as to any future claim. One or more large claims may be asserted against us that exceed our available insurance coverage, or changes in our insurance policies may occur, including premium increases or the imposition of anticipated revenueslarge deductible or co-insurance requirements. If any compromise of the security of our solutions were to occur, we may be subject to litigation, indemnity obligations and additional costs,other possible liabilities, and we may lose existing customers and the ability to attract future customers, any of which could harm our reputation, business, financial condition and results of operations and result in significant liability.
Changes in privacy laws, regulations and standards may cause our business to suffer.
Personal privacy and data security have become significant issues in the United States, Europe and in many other jurisdictions where we offer our solutions. The regulatory framework for privacy and security issues worldwide is rapidly evolving and is likely to remain uncertain for the foreseeable future. For example, the Court of Justice of the European Union ruled in October 2015 that the US-EU Safe Harbor framework was invalid, and the framework’s successor, the US-EU Privacy Shield, while adopted, has been criticized and challenged by multiple privacy advocacy groups. Furthermore, federal, state or foreign government bodies or agencies have in the past adopted, and may in the future adopt, laws and regulations affecting data privacy. Industry organizations also regularly adopt and advocate for new standards in this area. In the United States, these include rules and regulations promulgated under the authority of federal agencies and state attorneys general and legislatures and consumer protection agencies. Internationally, many jurisdictions in which we operate have established their own data security and privacy legal framework with which we or our customers must comply, including but not limited to, the Data Protection Directive (Directive) established in the European Union and data protection legislation of the individual member states subject to the Directive. The Directive will be replaced starting in 2018 with the recently adopted European General Data Protection Regulation, which will impose additional obligations and risks upon our business. In many jurisdictions, enforcement actions and consequences for noncompliance are also rising. In addition to government regulation, privacy advocates and industry groups may propose new and different self-regulatory standards that either legally or contractually applies to us.
Any inability to adequately address privacy and security concerns, even if unfounded, or comply with applicable privacy and data security laws, regulations and policies, could result in additional cost and liability to us, damage our reputation, inhibit sales and adversely affect our business. Furthermore, the costs of compliance with, and other burdens imposed by, the laws, regulations, and policies that are applicable to the businesses of our customers may limit the use and adoption of, and reduce the overall demand for, our solutions. Privacy and data security concerns, whether valid or not valid, may inhibit market adoption of our solutions, particularly in foreign countries. If we are not able to adjust to changing laws, regulations and standards related to privacy or security, our business may be harmed.
Our customers oftenacquisition of other companies could require significant configuration services to address their uniquemanagement attention, disrupt our business, processes. Supporting such a diversitydilute stockholder value and adversely affect our operating results.
As part of configured settings and implementations could become difficult as the number of customersour business strategy, we serve grows. In addition, supporting our customers could require us to devote significant development services and support personnel and strain our personnel resources and infrastructure. We have had in the past and may in the future have disputes with customers regardingmake investments in other companies, solutions or technologies to, among other reasons, expand or enhance our product offerings. In the performance and implementationfuture, any significant acquisition would require the consent of our solutions. Iflenders. Any failure to receive such consent could delay or prohibit us from acquiring companies that we are unable to address the needs ofbelieve could enhance our business.
We may not ultimately strengthen our competitive position or achieve our goals from any future acquisition, and any acquisitions we complete could be viewed negatively by users, customers, in a timely fashion, our customers may decide to seek to terminate their relationship, renew on less favorable terms, not renew their maintenance agreementspartners or subscriptions,investors. In addition, if we fail to purchase additional solutionsintegrate successfully such acquisitions, or services or assert legal claims against us. If any of these were to occur,the technologies associated with such acquisitions, into our company, the revenues may decline or we may be required to refund amounts to customers and our operating results may be harmed.
Our future growth is, in large part, dependent upon the increasing adoption of revenue management solutions.
Revenue management is at an early stage of market development and adoption, and the extent to which revenue management solutions will become widely adopted remains uncertain. It is difficult to predict customer adoption rates, customer demand for revenue management solutions, including our solutions in particular, the
future growth rate and size of this market and the timing of the introduction of additional competitive solutions. Any expansion of the revenue management market depends on a number of factors, including the cost, performance and perceived value associated with revenue management solutions. For example, many companies have invested substantial personnel, infrastructure and financial resources in other revenue management infrastructure and therefore may be reluctant to implement solutions such as ours. Additionally, organizations that use legacy revenue management products may believe that these products sufficiently address their revenue management needs. Because this market is relatively undeveloped, we must spend considerable time educating customers as to the benefits of our solutions. If revenue management solutions do not achieve widespread adoption, or if there is a reduction in demand for revenue management solutions caused by a lack of customer acceptance, technological challenges, competing technologies and products, decreases in corporate spending or otherwise, it could result in lower sales, reduced renewal and upsell rates and decreased revenues and our businesscombined company could be adversely affected.
We are highly dependent upon In addition, we may not be able to successfully retain the life science industry,customers and factors that adversely affect this industrykey personnel of such acquisitions over the longer term, which could also adversely affect us.
Our future growth depends, in large part, upon continued sales to companies in the life science industry. Demand for our solutions could be affected by factors that adversely affect demand for the underlying life science products and services that are purchased and sold pursuant to contracts managed through our solutions.business. The life science industry is affected by certain factors, including the emergenceintegration of large group purchasing and managed care organizations and integrated healthcare delivery networks, increased customer and channel incentives and rebates, the shift of purchasing influence from physicians to economic buyers, increased spending on healthcare by governments instead of commercial entities and increased scope of government mandates, frequency of regulatory reporting and audits, and fines. In addition, the life science industry has been adversely affected by the recent economic downturn and has experienced periods of considerable consolidation. Accordingly, our future operating results could be materially and adversely affected as a result of factors that affect the life science industry generally.
The revenues we recognize from our software licenses and implementation services are based to a certain extent upon our ability to reasonably estimate theany future-acquired business will require significant time and resources, required to complete our implementation projects, whichand we may be difficult to do.
We recognize a substantial portion of our revenues from the sale of software licenses for our on premise solutions and related implementation services over the period during which such services are performed using the percentage-of-completion method. We estimate the length of this period based on a number of factors, including the number of licensed applications and the scope and complexity of the customer’s deployment requirements. Under the percentage-of-completion method, the revenues we recognize during a reporting period are based on the resources expended during the reporting period as compared to the estimated total resources required to implement our solutions. If we are unable to reasonably estimate the overall total personnel resources required to implement our solutions, the timing of our revenues could be materially and adversely affected. In addition, changes in customer requirements or scope of the engagement could impact the timing of our revenue recognition. Any change in the timing of revenue recognition could adversely impact our quarterly or annual operating results.
Our efforts to expand the adoption of our solutions in the technology industry will be affected by our ability to provide solutions that adequately address trends in that industry.
We are attempting to expand the use of our solutions by companies in the technology industry, and our future growth depends in part on our ability to increase sales of solutions to customers in this industry and potentially other industries. The technology industry is affected by many factors, including shortening of product lifecycles, core technology products being sold into different end markets with distinct pricing, increasing complexity of multi-tiered global distribution channels, changing financial reporting requirements due to channel
complexity and increasing use of off-invoice discounting. If our solutions are not perceived by existing or potential customers in the technology industry as capable of providing revenue management tools that will assist them in adequately addressing these trends, then our efforts to expand the adoption of our solutions in this industry may not be successful, which would adversely impact our business and operating results.
Most of our implementation contracts are on a time and materials basis and may be terminated by the customer.
The contracts under which we perform most of our implementation services may have a term ranging between a few months to up to three years and are on a time and materials basis and may be terminated by the customer at any time. If an implementation project is terminated sooner than we anticipated or a portion of the implementation is delayed, we would lose the anticipated revenues that we might not be able to replacemanage the process successfully. We may not successfully evaluate or itutilize the acquired technology and accurately forecast the financial impact of the acquisition, including accounting charges.
It is also possible that a governmental entity could initiate an antitrust investigation at any time. Among other things, an investigation that is resolved unfavorably to us could delay or prevent the completion of a transaction, require us to divest or sell the
assets or businesses we acquired, limit the ability to realize the expected financial or strategic benefits of a transaction or have other adverse effects on our current business and operations.
We may take significant timehave to replacepay cash, incur debt or issue equity securities to pay for any acquisition, each of which could affect our financial condition or the lost revenuesvalue of our capital stock. For example, in connection with other work orthe Revitas acquisition, we borrowed $50 million to fund the cash portion of the purchase price and issued two promissory notes with an aggregate value of $10 million. To fund any future acquisition, we may be unableissue equity, which would result in dilution to eliminate the associated costs. Consequently, we may recognize fewer revenues than we anticipatedour stockholders, or incur unnecessary costs,more debt, which would result in increased fixed obligations and could subject us to additional covenants or other restrictions that would impede our ability to manage our operations.
We depend on our management team and our resultskey sales and development and services personnel, and the loss of operationsone or more key employees or groups could harm our business and prevent us from implementing our business plan in a timely manner.
Our success depends on the expertise, efficacy and continued services of our executive officers, who are geographically dispersed. We have in the past and may in the future continue to experience changes in our executive management team resulting from the departure of executives or subsequent periodshiring of new executives, which may be disruptive to our business. For example, in August 2017, we hired a new Chief Product Officer, in May 2017, we hired a new Chief Financial Officer, in January 2017, we hired a new Chief Revenue Officer, and in November 2016, Zack Rinat re-assumed the role of Chief Executive Officer. The impact of hiring new executives may not be immediately realized. We are also substantially dependent on the continued service of our existing development and services personnel because of their familiarity with the inherent complexities of our solutions.
Our personnel do not have employment arrangements that require them to continue to work for us for any specified period and, therefore, they could be materially lower than expected.terminate their employment with us at any time. We do not maintain key person life insurance policies on any of our employees. The loss of one or more of our key employees or groups could seriously harm our business.
Because we recognize a majority of our SaaS and maintenance revenues from our customers over the term of their agreements, downturns or upturns in sales of our cloud-based solutions may not be immediately reflected in our operating results.
SaaS and maintenance revenues primarily include subscription and related implementation fees from customers accessing our cloud-based solutions and revenues associated with maintenance contracts from license customers. We recognize a majority of our SaaS and maintenance revenues over the terms of our customer agreements, which are typically one year or longer in some cases. As a result, most of our quarterly SaaS and maintenance revenues result from agreements entered into during previous quarters. Consequently, a shortfall in sales of our cloud-based solutions or renewal of maintenance and support agreements in any quarter may not significantly reduce our SaaS and maintenance revenues for that quarter but would negatively affect SaaS and maintenance revenues in future quarters. Accordingly, the effect of significant downturns in sales of our cloud-based solutions or renewals of our maintenance and support agreements may not be fully reflected in our results of operations until future periods. We may be unable to adjust our cost structure to compensate for this potential shortfall in SaaS and maintenance revenues. Our revenue recognition model for our cloud-based solutions and maintenance and support agreements also makes it difficult for us to rapidly increase our revenues through additional sales in any period, as a significant amount of our revenues are recognized over the applicable agreement term. As a result, changes in the volume of sales of our cloud-based solutions or the renewals of our maintenance and support agreements in a particular period would not be fully reflected in our revenues until future periods.
FailureOur indebtedness could adversely affect our business and limit our ability to adequately expand our business or respond to changes, and trainwe may be unable to generate sufficient cash flow to satisfy our directdebt service obligations.
In January 2017, we incurred $50 million of indebtedness to fund the cash portion of our Revitas acquisition. These term loans are secured by substantially all of our assets and mature in January 2022. We also issued two promissory notes for an aggregate of $10 million. The incurrence of significant indebtedness could have adverse consequences, including the following:
reducing the availability of our cash flow for our operations, capital expenditures, future business opportunities and other purposes;
limiting our flexibility in planning for, or reacting to, changes in our business and the industries in which we operate; and
increasing our vulnerability to general adverse economic and industry conditions.
Lengthening our sales forceprocess as customers diligence our financial viability
We must repay 0.625% of the aggregate principal amount of the $50 million term loans on the last business day of each fiscal quarter, beginning with the fiscal quarter ending March 31, 2019, and the term loans must be repaid in full in January 2022. Our promissory notes will impedemature in July 2018 and January 2020. Our ability to generate cash to repay our growth.indebtedness is subject to the
performance of our business, as well as general economic, financial, competitive and other factors that are beyond our control. If our business does not generate sufficient cash flow from operating activities or if future borrowings are not available to us in amounts sufficient to enable us to fund our liquidity needs, our operating results, financial condition and ability to expand our business may be adversely affected.
The term loans bear interest at a variable rate of either a base rate plus 9.25% or LIBOR plus 8.25%, which exposes us to interest rate risk. Changes in economic conditions outside of our control could result in higher interest rates, thereby increasing our interest expense even though the amount borrowed remained the same.
Additionally, the financing agreement governing our term loans contains various restrictive covenants, including achieving certain levels of revenue from specified sources, as outlined in the agreement, and maintaining cash and cash-equivalents of $20.0 million net of accounts payable in excess of $0.5 million 90 days overdue, restricting our ability to dispose of assets, changing our organizational documents or amending our material agreements in a manner adverse to the lenders, changing a method of accounting, merging with or acquiring other entities, incurring other indebtedness, making investments. Our ability to comply with some of these restrictive covenants can be affected by events beyond our control, and we may be unable to do so. Upon the occurrence of an event of default, our lenders could elect to declare all amounts outstanding under our financing agreement to be immediately due and payable. If we are unable to repay that amount, our lenders could seize our assets securing the loans and our financial condition could be adversely affected.
We rely almost exclusivelymay face risks related to securities litigation that could result in significant legal expenses and settlement or damage awards.
We have been in the past and may in the future become subject to claims and litigation alleging violations of the securities laws or other related claims, which could harm our business and require us to incur significant costs. Significant litigation costs could impact our ability to comply with certain financial covenants under our financing agreement. We are generally obliged, to the extent permitted by law, to indemnify our current and former directors and officers who are named as defendants in these types of lawsuits. Regardless of the outcome, litigation may require significant attention from management and could result in significant legal expenses, settlement costs or damage awards that could have a material impact on our direct sales forcefinancial position, results of operations and cash flows.
Our implementation cycle is lengthy and variable, depends upon factors outside our control and could cause us to sellexpend significant time and resources prior to earning associated revenues.
The implementation and testing of our solutions typically range from a few months to up to twelve months, and unexpected implementation delays and difficulties can occur. Implementing our solutions typically involves integration with our customers’ systems, as well as adding their data to our system. This can be complex, time-consuming and expensive for our customers and can result in delays in the implementation and deployment of our solutions. We believe that our future growth will depend, toThe lengthy and variable implementation cycle may also have a significant extent,negative impact on the continued developmenttiming of our direct sales forcerevenues, causing our revenues and its abilityresults of operations to manage and retainvary significantly from period to period.
A substantial majority of our existing customer base, expand thetotal revenues have come from sales of our enterprise application suite, and decreases in demand for our enterprise application suite could adversely affect our results of operations and financial condition.
Historically, a substantial majority of our total revenues has been associated with our enterprise application suite, whether deployed as individual solutions or as a complete suite. We expect our enterprise application suite to continue to generate a substantial majority of our total revenues for the foreseeable future. Declines and variability in demand for our enterprise application suite could occur for a number of reasons, including improved products or product versions being offered by competitors, competitive pricing pressures, failure to release new or enhanced versions on a timely basis, technological changes that we are unable to address or that change the way our customers utilize our solutions, reductions in technology spending, export restrictions or other regulatory or legislative actions that could limit our ability to sell those products to key customer or market segments. Our business, results of operations, financial condition and cash flows would be adversely affected by a decline in demand for our enterprise application suite.
Our customers often require significant configuration efforts to match their complex business processes. The failure to meet their requirements could result in customer disputes, loss of anticipated revenues and additional costs, which could harm our business.
Our customers often require significant configuration services to address their unique business processes. Supporting such a diversity of configured settings and implementations could become difficult as the number of customers we serve grows. In addition, supporting our customers could require us to devote significant development services and support personnel and strain our personnel resources and infrastructure. We have had in the past and may in the future have disputes with customers regarding the performance and implementation of our solutions. If we are unable to address the needs of our customers in a timely fashion, our customers may decide to seek to terminate their relationship, renew on less favorable terms, not renew their maintenance agreements or subscriptions,
fail to purchase additional solutions or services, assert legal claims against us or cease to be a reference. If any of these were to occur, our revenues may decline or we may be required to refund amounts to customers and our operating results may be harmed.
Our future growth is, in large part, dependent upon the increasing adoption of revenue management solutions.
Revenue management is at an early stage of market development and adoption, and the extent to which revenue management solutions will become widely adopted remains uncertain. It is difficult to predict customer adoption rates, customer demand for revenue management solutions, including our solutions in particular, the future growth rate and size of this market and the timing of the introduction of additional competitive solutions. Any expansion of the revenue management market depends on a number of factors, including the cost, performance and perceived value associated with revenue management solutions. For example, many companies have invested substantial personnel, infrastructure and financial resources in other revenue management infrastructure and therefore may be reluctant to implement solutions such as ours. Additionally, organizations that use legacy revenue management products may believe that these products sufficiently address their revenue management needs. Because this market is relatively undeveloped, we must spend considerable time educating customers as to the benefits of our solutions. If revenue management solutions do not achieve widespread adoption, or if there is a reduction in demand for revenue management solutions caused by a lack of customer acceptance, technological challenges, competing technologies and products, decreases in corporate spending or otherwise, it could result in lower sales, reduced renewal and upsell rates and decreased revenues and our business could be adversely affected.
If we are unable to enhance existing solutions and develop new solutions that achieve market acceptance or that keep pace with technological developments, our business could be harmed.
Our ability to increase revenues from existing customers and obtainattract new customers. Because our software is complex and often must interoperate with complex computing requirements, it can take longer for our sales personnel to become fully productive compared to other software companies. Our ability to achieve significant growth in revenues in the future will depend,customers depends in large part on our ability to enhance and improve our existing solutions and to develop and introduce new solutions. The success of any enhancement or new application depends on several factors, including timely completion, adequate quality testing, introduction and market acceptance. Any enhancement or new application that we develop (such as our Revenue Cloud and Revenue Management as a Service) or acquire may not be introduced in recruiting, training and retaining a sufficient number of direct sales personnel. New hires requiretimely or cost-effective manner, may contain defects or may not achieve the broad market acceptance necessary to generate significant training and may, in some cases, take more than a year before becoming fully productive, if at all.revenues. If we are unable to hiresuccessfully enhance our existing solutions and develop sufficient numbersnew solutions to meet customer requirements, our business and operating results will be adversely affected.
Because we designed our solutions to operate on a variety of productive direct sales personnel,network, hardware and if these sales personnelsoftware platforms, we will need to continuously modify and enhance our solutions to keep pace with changes in networking, internet-related hardware, and software, communication, browser and database technologies. If we are unable to achieve full productivity,respond in a timely manner to these rapid technological developments in a cost-effective manner, our solutions may become less marketable and less competitive or obsolete and our operating results may be negatively impacted.
We are highly dependent upon the life sciences industry, and factors that adversely affect this industry could also adversely affect us.
Our future growth depends, in large part, upon continued sales to companies in the life sciences industry, and our recent acquisition of Revitas, which was also highly dependent upon the life sciences industry, increases our dependency. Demand for our solutions could be affected by factors that adversely affect demand for the underlying life sciences products and services that are purchased and sold pursuant to contracts managed through our solutions. The life sciences industry is affected by certain factors, including the emergence of large group purchasing and managed care organizations and integrated healthcare delivery networks, increased customer and channel incentives and rebates, the shift of purchasing influence from physicians to economic buyers, increased spending on healthcare by governments instead of commercial entities and increased scope of government mandates, frequency of regulatory reporting and audits, and fines. Accordingly, our future operating results could be materially and adversely affected as a result of factors that affect the life sciences industry generally.
Our efforts to expand the adoption of our solutions in the technology industry will sufferbe affected by our ability to provide solutions that adequately address trends in that industry.
We are attempting to expand the use of our solutions by companies in the technology industry, and our future growth depends in part on our ability to increase sales of solutions to customers in this industry and potentially other industries. The technology industry is affected by many factors, including shortening of product lifecycles, core technology products being sold into different end markets with distinct pricing, increasing complexity of multi-tiered global distribution channels, changing financial reporting requirements due to channel complexity and increasing use of off-invoice discounting. If our solutions are not perceived by existing or potential customers in the technology industry as capable of providing revenue management tools that will assist them in adequately addressing these trends, then our efforts to expand the adoption of our solutions in this industry may not be impeded.successful, which would adversely impact our business and operating results.
Most of our implementation contracts are on a time and materials basis and may be terminated by the customer.
The contracts under which we perform most of our implementation services may have a term typically ranging between a few months to up to twelve months and are on a time and materials basis and may be terminated by the customer at any time. If an implementation project is terminated sooner than we anticipated or a portion of the implementation is delayed, we would lose the anticipated revenues that we might not be able to replace or it may take significant time to replace the lost revenues with other work or we may be unable to eliminate the associated costs. Consequently, we may recognize fewer revenues than we anticipated or incur unnecessary costs, and our results of operations in subsequent periods could be materially lower than expected.
Our efforts to expand our solutions into other verticals within the life sciencesciences and technology industries or other industries may not succeed and may reduce our revenue growth rate. Even if we are successful in doing so, such efforts may be costly and may impact our ability to achieve profitability.
Our solutions are currently designed primarily for customers in certain verticals of the life sciencesciences and technology industries and potentially into other industries outside of the life sciencesciences and technology industries. Our ability to attract new customers and increase our revenues depends in part on our ability to enter into new industries and verticals. Developing and marketing new solutions to serve other industries and verticals will require us to devote substantial additional resources in advance of consummating new sales or realizing additional revenues. Our ability to leverage the expertise we have developed in the life sciencesciences and technology industries into new industries is unproven and it is likely that we will be required to hire additional personnel, partner with additional third parties and incur considerable research and development expense in order to gain suchand develop additional expertise for new industries where we lack experience and expertise.
Our efforts to expand our solutions beyond the verticals within the life sciencesciences and technology industries in which we have already developed expertise may not be successful and may reduce our revenue growth rate. Any early stage interest in our solutions in areas beyond the industries we already address may not result in long term success or significant revenues for us. Even if we achieve long-term success in expanding our solutions into other industries and verticals, the costs associated with such expansion may be high, which may impact our ability to achieve profitability.
The market for cloud-based solutions is at an early stage of acceptance relative to on-premise solutions, and if it does not develop or develops more slowly than we expect, our business could be harmed.
Although gaining wider acceptance, the market for cloud-based solutions is at an early stage relative to on-premise solutions, and these types of deployments may not achieve and sustain high levels of demand and market acceptance. We plan to accelerate the shift in our business model to recurring revenues, including revenues derived from our cloud-based solutions, by continuing to expand the implementation of our cloud-based solutions both within our current installed base of customers as well as new customers and additional markets in the future. Many companies have invested substantial personnel and financial resources to integrate traditional enterprise software into their businesses, and therefore may be reluctant or unwilling to migrate to a cloud-based solution. Other factors that may affect the market acceptance of cloud-based solutions include:
perceived security capabilities and reliability;
perceived concerns about ability to scale operations for large enterprise customers;
concerns with entrusting a third party to store and manage critical data;
the level of configurability or customizability of the solutions; and
ability to perform at or near the capabilities of our on-premise solutions.
If organizations do not perceive the benefits of our cloud-based solutions, or if our competitors or new market entrants are able to develop cloud-based solutions that are or are perceived to be more effective than ours, our plan to accelerate the shift in our business model to recurring revenues may not succeed or may develop more slowly than we expect, if at all, or may result in short-term declines in recognized revenue, any of which would adversely affect our business.
We rely on a small number of third-party service providers to host and deliver our cloud-based solutions, and any interruptions or delays in services from these third parties could impair the delivery of our cloud-based solutions and harm our business.
We currently operate our cloud-based solutions primarily through third party data centers. We do not control the operation of these facilities. These facilities are vulnerable to damage or interruption from natural disasters, fires, power loss, telecommunications failures and similar events. They are also subject to break-ins, computer viruses, sabotage, intentional acts of vandalism and other
misconduct. The occurrence of a natural disaster or an act of terrorism, a decision to close the facilities without adequate notice or other unanticipated problems could result in lengthy interruptions, which would have a serious adverse impact on our business. Additionally, our data center agreements are of limited duration, subject to early termination rights in certain circumstances, may include inadequate indemnification and liability provisions, and the providers of our data centers have no obligation to renew their agreements with us on commercially reasonable terms, or at all.
If we continue to add data centers and add capacity in our existing data centers, we may transfer data to other locations. Despite precautions taken during this process, any unsuccessful data transfers may impair the delivery of our service. Interruptions in our service, data loss or corruption may subject us to liability to our customers, cause customers to terminate their agreements and adversely affect our renewal rates and our ability to attract new customers. Data transfers may also subject us to regional privacy and data protection laws that apply to the transmission of customer data across international borders.
We also depend on access to the Internet through third-party bandwidth providers to operate our cloud-based solution. If we lose the services of one or more of our bandwidth providers, or if these providers experience outages, for any reason, we could experience disruption in delivering our cloud-based solutions or we could be required to retain the services of a replacement bandwidth provider. Any Internet outages or delays could adversely affect our ability to provide our solutions to our customers. Our data center operations also rely heavily on the availability of electricity, which also comes from third-party providers. If we or the third-party data center facilities that we use to deliver our services were to experience a major power outage or if the cost of electricity were to increase significantly, our operations and financial results could be harmed. If we or our third-party data centers were to experience a major power outage, we or they would have to rely on back-up generators, which might not work properly or might not provide an adequate supply during a major power outage. Such a power outage could result in a significant disruption of our business.We license technology from third parties, and our inability to maintain those licenses could harm our business. Certain third-party technology that we use may be difficult to replace or could cause errors or failures of our service.
We incorporate technology that we purchase or license from third parties, including hardware and software, into our solutions. We cannot be certain that this technology will continue to be available on commercially reasonable terms, or at all. We cannot be certain that our licensors are not infringing the intellectual property rights of third parties or that our licensors have sufficient rights to the licensed intellectual property in all jurisdictions in which we may sell our solutions. Some of our agreements with our licensors may be terminated for convenience by them. If we are unable to continue to license any of this technology because of intellectual property infringement claims brought by third parties against our licensors or against us, or if we are unable to continue our license agreements or enter into new licenses on commercially reasonable terms, our ability to develop and sell solutions containing that technology would be severely limited and our business could be harmed. Additionally, if we are unable to license or obtain the necessary technology from third parties, we may be forced to acquire or develop alternative technology of lower quality or performance standards. This would limit and delay our ability to offer new or competitive solutions and increase our costs of production. In addition, errors or defects in third-party hardware or software used in our cloud-based solutions could result in errors or a failure of our cloud-based solutions, which could harm our business.
If our solutions fail to perform properly, our reputation and customer relationships could be harmed, our market share could decline and we could be subject to liability claims.
Our solutions are inherently complex and may contain material defects or errors. Any defects in solution functionality or that cause interruptions in availability could result in:
The costs incurred in correcting any material defects or errors might be substantial and could adversely affect our operating results. Because our customers often use our solutions as a system of record and many of our customers are subject to regulation of pricing of their products or otherwise have complex pricing commitments and revenue recognition policies, errors could result in an inability to process sales or lead to a violation of pricing requirements or misreporting of revenues by our customers that could potentially expose them to fines or other substantial claims or penalties. Accordingly, we could face increased exposure to product
liability and warranty claims, litigation and other disputes and claims, resulting in potentially material losses and costs. Our limitation of liability provisions in our customer agreements may not be sufficient to protect us against any such claims.
Given the large amount of data that our solutions collect and manage, it is possible that failures or errors in our software could result in data loss or corruption, or cause the information that we collect to be incomplete or contain inaccuracies that our customers regard as significant. We may be required to issue credits or refunds or indemnify or otherwise be liable to our customers or third parties for damages they may incur resulting from certain of these events.
Our insurance may be inadequate or may not be available in the future on acceptable terms, or at all. In addition, our policy may not cover any claim against us for claims related to any product defects or errors or other indirect or consequential damages and defending a suit, regardless of its merit, could be costly and divert management’s attention.
The market in which we participate is highly competitive, and if we do not compete effectively, our operating results could be harmed.
The market for revenue management solutions is highly competitive, fragmented and subject to rapid changes in technology. We face competition from spreadsheet-assisted manual processes, internally developed solutions, large integrated systems vendors, providers of business process outsourcing services and smaller companies that offer point solutions.
Companies lacking IT resources often resort to spreadsheet-assisted manual processes or personal database applications. In addition, some potential customers, particularly large enterprises, may elect to develop their own internal solutions, including custom-built solutions that are designed to support the needs of a single organization. Companies with large investments in packaged ERP or CRM applications, which do not typically provide revenue management capabilities, may extend these horizontal applications with configurations or point solution applications in order to address one or a small set of revenue management sub processes or drivers. Common horizontal applications that customers attempt to configure for this purpose in the life sciencesciences and technology industries include large integrated systems vendors like SAP AG and Oracle Corporation. We also encounter competition from small independent companies, which compete on the basis of price, unique product features or functions and custom developments.
Many of our competitors have greater name recognition, larger sales and marketing budgets and greater resources than we do and may have pre-existing relationships with our potential customers, including relationships with, and access to, key decision makers within these organizations, and major distribution agreements with consultants and system integrators. Moreover, many software vendors could bundle solutions or offer them at a low price as part of a larger product sale.
With the introduction of new technologies and market entrants, we expect competition to intensify in the future. We also expect enterprise software vendors that focus on enterprise resource planning or back-office applications to enter our market with competing products. In addition, we expect sales force automation vendors to acquire or develop additional solutions that may compete with our solutions. If we fail to compete effectively, our business will be harmed. In addition, pricing pressures and increased competition generally could result in reduced sales, reduced margins, losses or the failure of our solutions to achieve or maintain more widespread market acceptance, any of which could harm our business.
If we are not able to maintain and enhance our brand, our business and operating results may be adversely affected.
We believe that maintaining and enhancing the “Model N” brand identity is critical to our relationships with our customers and partners and to our ability to attract new customers and partners. The successful promotion of our brand will depend largely upon our marketing efforts, our ability to continue to offer high-quality solutions and our ability to successfully differentiate our solutions from those of our competitors. Our brand promotion activities may not be successful or yield increased revenues. In addition, independent industry analysts often provide reviews of our solution, as well as those of our competitors, and perception of our solution in the marketplace may be significantly influenced by these reviews. If these reviews are negative, or less positive as compared to those of our competitors’ products and services, our brand may be adversely affected.
The promotion of our brand requires us to make substantial expenditures, and we anticipate that the expenditures will increase as our market becomes more competitive and as we expand into new verticals within the life sciencesciences and technology industries. To the extent that these activities yield increased revenues, these
revenues may not offset the increased expenses we incur. If we do not successfully maintain and enhance our brand, our business may not grow, we may have reduced pricing power relative to competitors with stronger brands and we could lose customers and partners, all of which would adversely affect our business operations and financial results.
Our organization continues to grow and experience rapid changes. If we fail to manage our growth, we may be unable to execute our business plan, maintain high levels of service or adequately address competitive challenges, and our business and operating results could be adversely affected.
We have experienced and may continue to experience growth in our headcount and operations, which has placed and will continue to place significant demands on our management and our operational and financial infrastructure. For example, in connection with the Revitas acquisition, we hired 145 employees from Revitas. As we grow, we must effectively integrate, develop and motivate a significant number of new employees, while maintaining the effectiveness of our business execution and the beneficial aspects of our corporate culture. In particular, we intend to continue to make directed and substantial investments to expand our research and development, sales and marketing, and general and administrative organizations, as well as our international operations. Failure to effectively manage organizational changes including our recent hiring of a new Chief Financial Officer and a new Chief Marketing Officer as well as integrating and training new sales and marketing personnel, could result in attrition of existing employees and difficulties in executing on our business plan, implementing customer requests, declines in quality or customer satisfaction, increases in costs and difficulties in introducing new features or other operational difficulties, and any of these difficulties could adversely impact our business performance and results of operations.
Additionally, our growth could require significant capital expenditures and may divert financial resources from other projects, such as the development of new solutions or enhancements to existing solutions. For example, since it may take as long as six months to hire and train a new member of our implementation services staff, we make decisions regarding the size of our implementation services staff based upon our expectations with respect to customer demand for our solutions. If these expectations are incorrect, and we increase the size of our implementation services organization without experiencing an increase in sales of our solutions, we will experience reductions in our gross and operating margins and net income.
To effectively manage growth, we must continue to improve our operational, financial and management controls, and our reporting systems and procedures by, among other things:
We have recently implemented a new ERP system for our company. We expect that, this new ERP system will combine and streamline the management of our financial, accounting, human resources, sales and marketing and other functions, enabling us to more effectively manage operations and track performance. Failure of our new ERP system to perform as we anticipate may result in transaction errors, processing inefficiencies and the loss of sales, may otherwise disrupt our operations and materially and adversely affect our business, results of operations and financial condition and may harm our ability to accurately forecast sales demand, fulfill customer orders and report financial and management information on a timely and accurate basis. In addition, ERP systems typically contain information and features that are part of a company’s internal control over financial reporting, and if we experience difficulties with our ERP system that may affect our internal control over financial reporting.
If we fail to use this newly implemented system effectively, our ability to manage our expected growth, ensure uninterrupted operation of key business systems and comply with the rules and regulations that are applicable to public reporting companies will be impaired. Additionally, if we do not effectively manage the growth of our business and operations, the quality of our solutions could suffer, our expenses may increase more than expected, our revenues could decline or grow more slowly than expected and we may be unable to implement our business strategy.
The market for cloud-based solutions is at a relatively early stage of development relative to on premise solutions, and if it does not develop or develops more slowly than we expect, our business could be harmed.
The market for cloud-based solutions is at an early stage relative to on premise solutions, and these types of deployments may not achieve and sustain high levels of demand and market acceptance. We plan to continue to expand the implementation of our cloud-based solutions by targeting additional markets in the future. Many companies have invested substantial personnel and financial resources to integrate traditional enterprise software into their businesses, and therefore may be reluctant or unwilling to migrate to a cloud-based solution. Other factors that may affect the market acceptance of cloud-based solutions include:
If organizations do not perceive the benefits of our cloud-based solutions, or if our competitors or new market entrants are able to develop cloud-based solutions that are or are perceived to be more effective than ours, this portion of our business may not grow further or may develop more slowly than we expect, either of which would adversely affect our business.
If we are unable to maintain successful relationships with system integrators, our business operations, financial results and growth prospects could be adversely affected.
Our relationships with system integrators are generally non-exclusive, which means they may recommend to their customers the solutions of several different companies, including solutions that compete with ours, and they may also assist in the implementation of software or systems that compete with ours. If our system integrators do not choose to continue to refer our solutions, assist in implementing our solutions, choose to use greater efforts to market and sell their own solutions or those of our competitors, or fail to meet the needs of our customers, our ability to grow our business and sell our solutions may be adversely affected. The loss of a substantial number of our system integrators, our possible inability to replace them or the failure to recruit additional system integrators could harm our business.
Our ability to achieve revenue growth in the future will depend in part on our success in maintaining successful relationships with our system integrators and in helping our system integrators enhance their ability to independently market and implement our solutions. Our growth in revenues, particularly in international markets, will be influenced by the development and maintenance of relationships with these companies. Although we have established relationships with some of the leading system integrators, our solutions compete directly against the solutions of other leading system integrators. We are unable to control the resources that our system integrators commit to implementing our solutions or the quality of such implementation. If they do not commit sufficient resources to these activities, or if we are unable to maintain our relationships with these system integrators or otherwise develop and expand our indirect distribution channel, our business, results of operations, financial condition or cash flows could be adversely affected.
Any failure to offer high-quality customer support services may adversely affect our relationships with our customers and harm our financial results.
Once our solutions are implemented, our customers use our support organization to resolve technical issues relating to our solutions. In addition, we also believe that our success in selling our solutions is highly dependent on our business reputation and on favorable recommendations from our existing customers. Any failure to maintain high-quality customer support, or a market
perception that we do not maintain high-quality support, could harm our reputation, adversely affect our ability to maintain existing customers or sell our solutions to existing and prospective customers, and harm our business, operating results and financial condition.
We may be unable to respond quickly enough to accommodate short-term increases in customer demand for support services. Increased customer demand for these services, without corresponding revenues, could also increase costs and adversely affect our operating results.
If our solutions do not interoperate with our customers’ IT infrastructure, sales of our solutions could be negatively affected, which would harm our business.
Our solutions must interoperate with our customers’ existing IT infrastructure, which often have different specifications, complex configuration, utilize multiple protocol standards, deploy products from multiple vendors and contain multiple generations of products that have been added over time. As a result, when problems occur in a network, it may be difficult to identify the sources of these problems. If we find errors in the existing products or defects in the hardware used in our customers’ IT infrastructure or problematic network configurations or settings, we may have to modify our solutions or platform so that our solutions will interoperate with our customers’ IT infrastructure. Any delays in identifying the sources of problems or in providing necessary modifications to our solutions could have a negative impact on our reputation and our customers’ satisfaction with our solutions, and our ability to sell solutions could be adversely affected.
Incorrect or improper implementation or use of our solutions could result in customer dissatisfaction and negatively affect our business, operations, financial results and growth prospects.
Our customers and third-party partners may need training in the proper use of and the variety of benefits that can be derived from our solutions to maximize their potential. If our solutions are not implemented or used correctly or as intended, inadequate performance may result. Since our customers rely on our solutions and customer support to manage key areas of their businesses, the incorrect or improper implementation or use of our solutions, our failure to train customers on how to efficiently and effectively use our solutions or our failure to provide services to our customers, may result in negative publicity, failure of customers to renew their SaaS or maintenance agreements or potentially make legal claims against us. Also, as we continue to expand our customer base, any failure by us to properly provide these services will likely result in lost opportunities for follow-on sales of our solutions.
Competition for our target employees is intense, and we may not be able to attract and retain the quality employees we need to support our planned growth.
Our future success depends, in part, upon our ability to recruit and retain key management, technical, sales, marketing, finance, and other critical personnel. Competition for qualified management, technical and other personnel is intense, and we may not be successful in attracting and retaining such personnel. If we fail to attract and retain qualified employees, including internationally, our ability to grow our business could be harmed. Competition for people with the specific skills that we require is significant. In order to attract and retain personnel in a competitive marketplace, we believe that we must provide a competitive compensation package, including cash and equity-based compensation. Volatility in our stock price may from time to time adversely affect our ability to recruit or retain employees. If we are unable to hire and retain qualified employees, or conversely, if we fail to manage employee performance or reduce staffing levels when required by market conditions, our business and operating results could be adversely affected.
We depend on our management team, particularly our Chief Executive Officer and our key sales and development and services personnel, and the loss of one or more key employees or groups could harm our business and prevent us from implementing our business plan in a timely manner.
Our success depends on the expertise and continued services of our executive officers, particularly our Chief Executive Officer. We have in the past and may in the future continue to experience changes in our executive management team resulting from the hiring or departure of executives, which may be disruptive to our business. For example, we recently hired a new Chief Financial Officer and a new Chief Marketing Officer, who are tasked with implementing initiatives to expand and enhance our operating and marketing strategy, respectively. In addition, we recently hired additional sales and marketing personnel. The impact of hiring new executives, as well as the new additional sales and marketing personnel, and implementing these initiatives may not be immediately realized. We are also substantially dependent on the continued service of our existing development and services personnel because of their familiarity with the inherent complexities of our solutions.
Our personnel do not have employment arrangements that require them to continue to work for us for any specified period and, therefore, they could terminate their employment with us at any time. We do not maintain key person life insurance policies on any of our employees. The loss of one or more of our key employees or groups could seriously harm our business.
If we are not able to enhance existing solutions and develop new applications that achieve market acceptance or that keep pace with technological developments, our business could be harmed.
Our ability to increase revenues from existing customers and attract new customers depends in large part on our ability to enhance and improve our existing solutions and to develop and introduce new applications. For example, we recently announced our intention to develop new applications, such as our Revvy solutions, built on the Salesforce1 Platform from salesforce.com. The success of any enhancement or new application depends on several factors, including timely completion, adequate quality testing, introduction and market acceptance. Any enhancement or new application that we develop, including our Revvy solutions, or acquire may not be introduced in a timely or cost-effective manner may contain defects or may not achieve the broad market acceptance necessary to generate significant revenues. If we are unable to successfully enhance our existing solutions and develop new applications to meet customer requirements, our business and operating results will be adversely affected.
Because we designed our solutions to operate on a variety of network, hardware and software platforms, we will need to continuously modify and enhance our solutions to keep pace with changes in networking, Internet-related hardware, and software, communication, browser and database technologies. If we are unable to respond in a timely manner to these rapid technological developments in a cost-effective manner, our solutions may become less marketable and less competitive or obsolete and our operating results may be negatively impacted.
If our solutions experience data security breaches, and there is unauthorized access to our customers’ data, we may lose current or future customers and our reputation and business may be harmed.
Our solutions are used by our customers to manage and store proprietary information and sensitive or confidential data relating to their business. Although we maintain security features in our solutions, our security measures may not detect or prevent hacker interceptions, break-ins, security breaches, the introduction of viruses or malicious code and other disruptions that may jeopardize the security of information stored in and transmitted by our solutions. A party that is able to circumvent our security measures in our solutions could misappropriate our or our customers’ proprietary or confidential information, cause interruption in their operations, damage or misuse their computer systems and misuse any information that they misappropriate. Because techniques used to obtain unauthorized access or sabotage systems change frequently and generally are not identified until they are launched against a target, we may be unable to anticipate these techniques or to implement adequate preventative measures.
If any compromise of the security of our solutions were to occur, we may lose customers and our reputation, business, financial condition and results of operations could be harmed and we could incur significant liability. In addition, if there is any perception that we cannot protect our customers’ proprietary and confidential information, we may lose the ability to retain existing customers and attract new customers and our revenues could decline.
We rely on a small number of third-party service providers to host and deliver our cloud-based solutions, and any interruptions or delays in services from these third parties could impair the delivery of our cloud-based solutions and harm our business.
We currently operate our cloud-based solutions from three data centers. We do not control the operation of these facilities. These facilities are vulnerable to damage or interruption from natural disasters, fires, power loss, telecommunications failures and similar events. They are also subject to break-ins, computer viruses, sabotage, intentional acts of vandalism and other misconduct. The occurrence of a natural disaster or an act of terrorism, a decision to close the facilities without adequate notice or other unanticipated problems could result in lengthy interruptions, which would have a serious adverse impact on our business. Additionally, our data center agreements are of limited duration and are subject to early termination rights in certain circumstances, and the providers of our data centers have no obligation to renew their agreements with us on commercially reasonable terms, or at all.
If we continue to add data centers and add capacity in our existing data centers, we may transfer data to other locations. Despite precautions taken during this process, any unsuccessful data transfers may impair the delivery of our service. Interruptions in our service, data loss or corruption may cause customers to terminate their agreements and adversely affect our renewal rates and our ability to attract new customers. Data transfers may also subject us to regional privacy and data protection laws that apply to the transmission of customer data across international borders.
We also depend on access to the Internet through third-party bandwidth providers to operate our cloud-based solution. If we lose the services of one or more of our bandwidth providers, or if these providers experience outages, for any reason, we could experience disruption in delivering our cloud-based solutions or we could be required to retain the services of a replacement bandwidth provider. Any Internet outages or delays could adversely affect our ability to provide our solutions to our customers.
Our data center operations also rely heavily on the availability of electricity, which also comes from third-party providers. If we or the third-party data center facilities that we use to deliver our services were to experience a major power outage or if the cost of electricity were to increase significantly, our operations and financial results could be harmed. If we or our third-party data centers were to experience a major power outage, we or they would have to rely on back-up generators, which might not work properly or might not provide an adequate supply during a major power outage. Such a power outage could result in a significant disruption of our business.
We license technology from third parties, and our inability to maintain those licenses could harm our business. Certain third-party technology that we use may be difficult to replace or could cause errors or failures of our service.
We incorporate technology that we purchase or license from third parties, including hardware and software, into our solutions. We cannot be certain that this technology will continue to be available on commercially reasonable terms, or at all. We cannot be certain that our licensors are not infringing the intellectual property rights of third parties or that our licensors have sufficient rights to the licensed intellectual property in all jurisdictions in which we may sell our solutions. Some of our agreements with our licensors may be terminated for convenience by them. If we are unable to continue to license any of this technology because of intellectual property infringement claims brought by third parties against our licensors or against us, or if we are unable to
continue our license agreements or enter into new licenses on commercially reasonable terms, our ability to develop and sell solutions containing that technology would be severely limited and our business could be harmed. Additionally, if we are unable to license or obtain the necessary technology from third parties, we may be forced to acquire or develop alternative technology of lower quality or performance standards. This would limit and delay our ability to offer new or competitive solutions and increase our costs of production. In addition, errors or defects in third-party hardware or software used in our cloud-based solutions could result in errors or a failure of our cloud-based solutions, which could harm our business.
Our significant international operations subject us to additional risks that can adversely affect our business, results of operations and financial condition.
We have significant international operations, including in emerging markets such as India, and we are continuing to expand our international operations as part of our growth strategy. As of September 30, 2014,2017, approximately 44% of45% our total employees were located in India, where we conduct a portion of our research and development activities, implementation services and support services. Our current international operations and our plans to expand our international operations have placed, and will continue to place, a strain on our employees, management systems and other resources.
Operating in international markets requires significant resources and management attention and will subject us to regulatory, economic and political risks and competition that are different from those in the United States. Because of our limited experience with international operations, we cannot assure that our international expansion efforts will be successful or that returns on such investments will be achieved in the future. In addition, our international operations may fail to succeed due to other risks inherent in operating businesses internationally, including:
Our failure to manage any of these risks successfully could harm our existing and future international operations and seriously impair our overall business.
We are exposed to fluctuations in currency exchange rates, which could negatively affect our financial condition and operating results.
Our sales contracts are primarily denominated in U.S. dollars, and therefore, substantially all of our revenues are not subject to foreign currency risk. However, a strengthening of the U.S. dollar could increase the real cost of our solutions to our customers outside of the United States, which could adversely affect our financial condition and operating results. In addition, an increasing portion of our operating expenses are incurred in India, are denominated in Indian Rupees and are subject to fluctuations due to changes in foreign currency exchange rates.
We may be sued by third parties for alleged infringement of their proprietary rights which could result in significant costs and harm our business.
There is considerable patent and other intellectual property development activity in our industry. Our success depends upon us not infringing upon the intellectual property rights of others. Companies in the software and technology industries, including some of our current and potential competitors, own large numbers of patents, copyrights, trademarks and trade secrets and frequently enter into litigation based on allegations of infringement, misappropriation or other violations of intellectual property rights. In addition, many of these companies have the capability to dedicate substantially greater resources to enforce their intellectual property rights and to defend claims that may be brought against them. The litigation may involve patent holding companies or other adverse patent owners who have no relevant product revenue and against whom our potential patents may provide little or no deterrence. We have received, and may in the future receive, notices that claim we have infringed, misappropriated or otherwise violated other parties’ intellectual property rights. To the extent we gain greater visibility, we face a higher risk of being the subject of intellectual property infringement claims, which is not uncommon with respect to software technologies in general and information security technology in particular. There may be third-party intellectual property rights, including issued or pending patents that cover significant aspects of our
technologies or business methods. Any intellectual property claims, with or without merit, could be very time consuming, could be expensive to settle or litigate and could divert our management’s attention and other resources. These claims could also subject us to significant liability for damages, potentially including treble damages if we are found to have willfully infringed patents or copyrights. These claims could also result in our having to stop using technology found to be in violation of a third party’s rights. We might be required to seek a license for the intellectual property, which may not be available on reasonable terms or at all. Even if a license were available, we could be required to pay significant royalties, which would increase our operating expenses. As a result, we may be required to develop alternative non-infringing technology, which could require significant effort and expense. If we cannot license or develop technology for any infringing aspect of our business, we would be forced to limit or stop sales of one or more of our solutions or features of our solutions and may be unable to compete effectively. Any of these results would harm our business, operating results and financial condition.
In addition, our agreements with customers and partners include indemnification provisions under which we agree to indemnify them for losses suffered or incurred as a result of claims of intellectual property infringement and, in some cases, for damages caused by us to property or persons. Large indemnity payments could harm our business, operating results and financial condition.
Our use of open source and third-party technology could impose limitations on our ability to commercialize our solutions.
We use open source software in our solutions and in our services engagements on behalf of customers. As we increasingly handle configured implementation of our solutions on behalf of customers, we use additional open source software that we obtain from all over the world. Although we try to monitor our use of open source software, the terms of many open source licenses have not been interpreted by U.S. courts, and there is a risk that such licenses could be construed in a manner that imposes unanticipated conditions or restrictions on our ability to market our solutions. In such event, we could be required to seek licenses from third parties in order to continue offering our solutions, to re-engineer our technology or to discontinue offering our solutions in the event re-engineering cannot be accomplished on a timely basis, any of which could cause us to breach contracts, harm our reputation, result in customer losses or claims, increase our costs or otherwise adversely affect our business, operating results and financial condition.
Some open source licenses contain requirements that we make available source code for modifications or derivative works we create based upon the type of open source software we use. If we combine our proprietary software with open source software in a certain manner, we could, under certain open source licenses, be required to release the source code of our proprietary software to the public. This would allow our competitors to create similar solutions with lower development effort and time and ultimately could result in a loss of product sales for us.
Any failure to protect our intellectual property rights could impair our ability to protect our proprietary technology and our brand, which would substantially harm our business and operating results.
The success of our business and the ability to compete depend in part upon our ability to protect and enforce our patents, trade secrets, trademarks, copyrights and other intellectual property rights. We primarily rely on patent, copyright, trade secret and trademark laws, trade secret protection and confidentiality or license agreements with our employees, customers, partners and others to protect our intellectual property rights. However, the steps we take to protect our intellectual property rights may be inadequate or we may be unable to secure intellectual property protection for all of our solutions. Any of our copyrights, trademarks or other intellectual property rights may be challenged by others or invalidated through administrative process or litigation. Competitors may independently develop technologies or solutions that are substantially equivalent or superior to our solutions or that inappropriately incorporate our proprietary technology into their solutions. Competitors may hire our former employees who may misappropriate our proprietary technology or misuse our confidential information. Although we rely in part upon confidentiality agreements with our employees, consultants and other third parties to protect our trade secrets and other confidential information, those agreements may not effectively prevent disclosure of trade secrets and other confidential information and may not provide an adequate remedy in the event of misappropriation of trade secrets or unauthorized disclosure of confidential information. In addition, others may independently discover our trade secrets and confidential information, and in such cases we could not assert any trade secret rights against such parties.
In order to protect our intellectual property rights, we may be required to spend significant resources to monitor and protect these rights. Litigation to protect and enforce our intellectual property rights could be costly, time-consuming and distracting to management and could result in the impairment or loss of portions of our intellectual property. Furthermore, our efforts to enforce our intellectual property rights may be met with defenses, counterclaims and countersuits attacking the validity and enforceability of our intellectual property rights. Any litigation, whether or not it is resolved in our favor, could result in significant expense to us and divert the efforts of our technical and management personnel, which may adversely affect our business, operating results and financial condition. Certain jurisdictions may not provide adequate legal infrastructure for effective protection of our intellectual property rights. Changing legal interpretations of liability for unauthorized use of our solutions or lessened sensitivity by corporate, government or institutional users to refraining from intellectual property piracy or other infringements of intellectual property could also harm our business.
It is possible that innovations for which we seek patent protection may not be protectable. Additionally, the process of obtaining patent protection is expensive and time consuming, and we may not be able to prosecute all necessary or desirable patent applications at a reasonable cost or in a timely manner. Given the cost, effort, risks and downside of obtaining patent protection, including the requirement to ultimately disclose the invention to the public, we may not choose to seek patent protection for certain innovations. However, such patent protection could later prove to be important to our business. Even if issued, there can be no assurance that any patents will have the coverage originally sought or adequately protect our intellectual property, as the legal standards relating to the validity, enforceability and scope of protection of patent and other intellectual property rights are uncertain. Any patents that are issued may be invalidated or otherwise limited, or may lapse or may be abandoned, enabling other companies to better develop products that compete with our solutions, which could adversely affect our competitive business position, business prospects and financial condition.
We cannot assure you that the measures we have taken to protect our intellectual property will adequately protect us, and any failure to protect our intellectual property could harm our business.
We may not be able to enforce our intellectual property rights throughout the world, which could adversely impact our international operations and business.
The laws of some foreign countries do not protect intellectual property rights to the same extent as federal and state laws in the United States. Many companies have encountered significant problems in protecting and enforcing intellectual property rights in certain foreign jurisdictions. The legal systems of certain countries, particularly certain developing countries, do not favor the enforcement of patents and other intellectual property protection. This could make it difficult for us to stop the infringement or misappropriation of our intellectual property rights. Proceedings to enforce our proprietary rights in foreign jurisdictions could result in substantial costs and divert our efforts and attention from other aspects of our business. Accordingly, our efforts to enforce our intellectual property rights in such countries may be inadequate to obtain a significant commercial advantage from the intellectual property that we develop, which could have a material adverse effect on our business, financial condition and results of operations.
We may face risks relatedChanges to securities litigation that could result in significant legal expenses and settlement or damage awards.
We are currently and may in the future become subject to claims and litigation alleging violations of the securities laws or other related claims, which could harm our business and require us to incur significant costs. For example, in September 2014, a purported securities class action lawsuit was filed in the Supreme Court of the State of California against the Company, its current and former directors, executive officer and underwriters of its initial public offering. This lawsuit alleges certain misrepresentations in connection with our initial public offering in March 2013 and thereafter concerning our business and prospects. The lawsuits seek unspecified damages. We are generally obliged, to the extent permitted by law, to indemnify our current and former directors and officers who are named as defendants in these types of lawsuits. Although, we plan to defend this lawsuit vigorously, regardless of the outcome, this or future litigation may require significant attention from management and could result in significant legal expenses, settlement costs or damage awards that could have a material impact on our financial position, results of operations and cash flows.
Additional government regulations may reduce the size of market for our solutions, harm demand for our solutions, force us to update our solutions or implement changes in our services and increase our costs of doing business.
Any changes in government regulations that impact our customers or their end customers could have a harmful effect on our business by reducing the size of our addressable market, forcing us to update the solutions we offer or otherwise increasing our costs. For example, with respect to our life sciencesciences customers, regulatory developments related to government-sponsored entitlement programs or U.S. Food and Drug Administration or
foreign equivalent regulation of, or denial, withholding or withdrawal of approval of, our customers’ products could lead to a lack of demand for our solutions. Other changes in government regulations, in areas such as privacy, export compliance or anti-bribery statutes, such as the U.S. Foreign Corrupt Practices Act, could require us to implement changes in our solutions, services or operations that increase our cost of doing business and thereby adversely affecting our financial performance.
Failure to comply with certain certifications and standards pertaining to our solutions, as may be required by governmental authorities or other standards-setting bodies could harm our business. Additionally, failure to comply with governmental laws and regulations could harm our business.
Customers may require our solutions to comply with certain security or other certifications and standards, which are promulgated by governmental authorities or other standards-setting bodies. The requirements necessary to comply with these certifications and standards are complex and often change significantly. If our solutions are late in achieving or fail to achieve compliance with these certifications and standards, including when they revised or otherwise change, or our competitors achieve compliance with these certifications and standards, we may be disqualified from selling our solutions to such customers, or at a competitive disadvantage, which would harm our business, operating results and financial condition.
We are subject to governmental export and import controls that could subject us to liability or impair our ability to compete in international markets.
Certain of our solutions are subject to U.S. export controls and may be exported outside the United States only with the required export license or through an export license exception. Additionally, we incorporate encryption technology into our solutions, which may require additional filings prior to export. If we were to fail to comply with U.S. export licensing requirements, U.S. customs regulations, U.S. economic sanctions or other laws, we could be subject to substantial civil and criminal penalties, including fines, incarceration for responsible employees and managers, and the possible loss of export or import privileges. Obtaining the necessary export license for a particular sale may be time-consuming and may result in the delay or loss of sales opportunities. Furthermore, U.S. export control laws and economic sanctions prohibit the shipment of certain products to U.S. embargoed or sanctioned countries,
governments and persons. Even though we take precautions to ensure that our channel partners comply with all relevant regulations, any failure by our channel partners to comply with such regulations could have negative consequences, including reputational harm, government investigations and penalties.
In addition, various countries regulate the import of certain encryption technology, including through import permit and license requirements, and have enacted laws that could limit our ability to distribute our solutions or could limit our customers’ ability to implement our solutions in those countries. Changes in our solutions or changes in export and import regulations may create delays in the introduction of our solutions into international markets, prevent our customers with international operations from deploying our solutions globally or, in some cases, prevent the export or import of our solutions to certain countries, governments or personsperson’s altogether. Any change in export or import regulations, economic sanctions or related legislation, shift in the enforcement or scope of existing regulations, or change in the countries, governments, persons or technologies targeted by such regulations, could result in decreased use of our solutions by, or in our decreased ability to export or sell our solutions to, existing or potential customers with international operations. Any decreased use of our solutions or limitation on our ability to export or sell our solutions would likely adversely affect our business, financial condition, and operating results.
We may acquire other businesses, which could require significant management attention, disrupt our business, dilute stockholder value and adversely affect our operating results.
As part of our business strategy, we have in the past and may in the future make investments in other companies, solutions or technologies. We may not be able to find suitable acquisition candidates, and we may not be able to complete acquisitions on favorable terms, if at all. If we do complete acquisitions, we may not
ultimately strengthen our competitive position or achieve our goals, and any acquisitions we complete could be viewed negatively by users or investors. In addition, if we fail to integrate successfully such acquisitions, or the technologies associated with such acquisitions, into our company, the revenues and operating results of the combined company could be adversely affected. Any integration process will require significant time and resources, and we may not be able to manage the process successfully. We may not successfully evaluate or utilize the acquired technology and accurately forecast the financial impact of an acquisition transaction, including accounting charges. We may have to pay cash, incur debt or issue equity securities to pay for any such acquisition, each of which could affect our financial condition or the value of our capital stock. The sale of equity or issuance of debt to finance any such acquisitions could result in dilution to our stockholders. If we incur more debt it would result in increased fixed obligations and could also subject us to covenants or other restrictions that would impede our ability to manage our operations.
If we are required to collect sales and use taxes on the solutions we sell, we may be subject to liability for past sales and our future sales may decrease.
State and local taxing jurisdictions have differing rules and regulations governing sales and use taxes, and these rules and regulations are subject to varying interpretations that may change over time. In particular, the applicability of sales taxes to our subscription services in various jurisdictions is unclear. Although we have historically collected and remitted sales tax in certain circumstances, it is possible that we could face sales tax audits and that our liability for these taxes could exceed our estimates as state tax authorities could still assert that we are obligated to collect additional amounts as taxes from our customers and remit those taxes to those authorities. We could also be subject to audits with respect to state and international jurisdictions for which we have not accrued tax liabilities. A successful assertion that we should be collecting additional sales or other taxes on our services in jurisdictions where we have not historically done so and do not accrue for sales taxes could result in substantial tax liabilities for past sales, discourage customers from purchasing our solutions or otherwise harm our business and operating results.
Uncertainty in global economic conditions may adversely affect our business, operating results or financial condition.
Our operations and performance depend on global economic conditions. Challenging or uncertain economic conditions make it difficult for our customers and potential customers to accurately forecast and plan future business activities, and may cause our customers and potential customers to slow or reduce spending, or vary order frequency, on our solutions. Furthermore, during challenging or uncertain economic times, our customers may face difficulties gaining timely access to sufficient credit and experience decreasing cash flow, which could impact their willingness to make purchases and their ability to make timely payments to us. Global economic conditions have in the past and could continue to have an adverse effect on demand for our solutions, including new bookings and renewal and upsell rates, on our ability to predict future operating results and on our financial condition and operating results. If global economic conditions remain uncertain or deteriorate, it may materially impact our business, operating results and financial condition.
Our business is subject to the risks of earthquakes, fire, power outages, floods and other catastrophic events, and to interruption by manmade problems such as terrorism.
Our corporate headquarters and facilities are located near known earthquake fault zones and are vulnerable to significant damage from earthquakes. The corporate headquarters and facilities are also vulnerable to damage or interruption from human error, intentional bad acts, earthquakes, hurricanes, floods, fires, war, terrorist attacks, power losses, hardware failures, systems failures, telecommunications failures and similar events. The occurrence of a natural disaster or an act of terrorism or vandalism or other misconduct or other unanticipated problems with our facilities could result in lengthy interruptions to our services. If any disaster were to occur, our ability to operate our business at our facilities could be seriously or completely impaired or destroyed. The insurance we maintain may not be adequate to cover our losses resulting from disasters or other business interruptions.
Our financial results may be adversely affected by changes in accounting principles generally accepted in the United States.
Generally accepted accounting principles in the United States (U.S. GAAP) is subject to interpretation by the Financial Accounting Standards Board (FASB), the American Institute of Certified Public Accountants, the SEC and various bodies formed to promulgate and interpret appropriate accounting principles. AFor example, in May 2014, the FASB issued accounting standards update No. 2014-09 (Topic 606), Revenue from Contracts with Customers, which supersedes nearly all existing revenue recognition guidance under U.S. GAAP. We will be required to implement this guidance in the first quarter of our fiscal year 2019. We have not yet determined the effect of the standard on our ongoing financial reporting. Any difficulties in implementing this guidance could cause us to fail to meet our financial reporting obligations, which could result in regulatory discipline and harm investors’ confidence in us.
Additionally, the implementation of this guidance or a change in theseother principles or interpretations could have a significant effect on our financial results, and could affect the reporting of transactions completed before the announcement of a change.
If our estimates or judgments relating to our critical accounting policies are based on assumptions that changechange or prove to be incorrect, our operating results could fall below expectations of securities analysts and investors, resulting in a decline in our stock price.
The preparation of financial statements in conformity with U.S. GAAP requires management to make estimates and assumptions that affect the amounts reported in the Consolidated Financial Statements and accompanying notes. For example, our revenue recognition policy is complex and we often must make estimates and assumptions that could prove to be inaccurate. We base our estimates on historical experience and on various other assumptions that we believe to be reasonable under the circumstances, as provided in the section entitled “Management’s Discussion and Analysis of Financial Condition and Results of Operations,” the results of which form the basis for making judgments about revenue recognition, capitalized software, the carrying values of assets, taxes, liabilities, equity, revenues and expenses that are not readily apparent from other sources. Our operating results may be adversely affected if our assumptions change or if actual circumstances differ from those in our assumptions, which could cause our operating results to fall below the expectations of securities analysts and investors, resulting in a decline in our stock price. Significant assumptions and estimates used in preparing our Consolidated Financial Statements include those related to revenue recognition, share-based compensation and income taxes.
We incur significant costs and devote substantial management time as a result of operating as a public company, which may increase when we are no longer an “emerging growth company.”
As a public company, we incur significant legal, accounting and other expenses. For example, we are required to comply with the requirements of the Sarbanes-Oxley Act of 2002 (Sarbanes-Oxley Act) and the Dodd Frank Wall Street Reform and Consumer Protection Act, as well as rules and regulations subsequently implemented by the SEC and the New York Stock Exchange, including the establishment and maintenance of effective disclosure and financial controls and changes in corporate governance practices. Despite reform made possible by the Jumpstart Our Business Startups Act (JOBS Act), which allows us to take advantage of certain exemptions from various reporting requirements applicable to other public companies that are notas long as we remain an “emerging growth companies,company,” compliance with these requirements has and we expect to continue to increase ourresults in legal and financial compliance costs and make some activities more time consumingconsuming.
Additionally, as of September 30, 2018, we will no longer be an emerging growth company and costly. In addition,will need to comply with additional disclosure and reporting requirements, including an attestation report on internal control over financial reporting as of September 30, 2018 issued by our independent registered public accounting firm. We will also be required to include additional information regarding executive compensation in our 2019 proxy statement and hold a nonbinding advisory vote on executive compensation at our 2019 annual meeting of stockholders. These additional reporting requirements may increase our legal and financial compliance costs and cause management and other personnel have and will need to divert attention from operational and other business matters to devote substantial time to these public company requirements.
In particular, we expect to incur significant expenses and devote substantial management effort toward ensuring compliance with the requirements of Section 404 of the Sarbanes-Oxley Act, when applicable to us. We cannot predict or estimate the costs we may incur as a result of being a public company or the timing of such costs.
We are an “emerging growth company,” and we cannot be certain if reduced disclosure requirements applicable to emerging growth companies will make our common stock less attractive to investors.
We are an “emerging growth company.” Under the JOBS Act, emerging growth companies can delay adopting new or revised accounting standards until such time as those standards apply to private companies. We
have irrevocably elected not to avail ourselves of this exemption from new or revised accounting standards and, therefore, we will be subject to the same new or revised accounting standards as other public companies that are not emerging growth companies.
We will remain an emerging growth company for up to five years following our IPO, although if our annual gross revenues exceed $1 billion in any fiscal year before that time, or if the market value of our common stock that is held by non-affiliates exceeds $700 million as of March 31 of any year before that time, or if we issue more than $1 billion in non-convertible debt over a three-year period, we would cease to be an emerging growth company.
As a newly public company, we have and intend to continue to take advantage of certain exemptions from various reporting requirements that are applicable to many public companies that are not emerging growth companies, including not being required to comply with the auditor attestation requirements of Section 404 of the Sarbanes-Oxley Act, reduced disclosure obligations regarding executive compensation in our periodic reports and proxy statements and exemptions from the requirements of holding a nonbinding advisory vote on executive compensation and stockholder approval of any golden parachute payments not previously approved by our stockholders. We cannot predict if investors will find our common stock less attractive because we rely on these exemptions. If some investors find our common stock less attractive as a result, there may be a less active trading market for our common stock and our stock price may be more volatile.
If we fail to maintain an effective system of internal controls, our ability to produce timely and accurate financial statements or comply with applicable regulations could be impaired.
As a public company, we are subject to the reporting requirements of the Exchange Act, the Sarbanes-Oxley Act and the rules and regulations of the applicable listing exchange. We expect that the requirements of these rules and regulations will continue to increase our legal, accounting and financial compliance costs, make some activities more difficult, time consuming and costly, and place significant strain on our personnel, systems and resources.
The Sarbanes-Oxley Act requires, among other things, that we maintain effective disclosure controls and procedures and internal control over financial reporting. We are continuing to develop and refine our disclosure controls and other procedures that are designed to ensure that information required to be disclosed by us in the reports that we file with the SEC is recorded, processed, summarized and reported within the time periods specified in SEC rules and forms, and that information required to be disclosed in reports under the Exchange Act is accumulated and communicated to our principal executive and financial officers.
Our current controls and any new controls that we develop may become inadequate because of changes in conditions in our business. For example, our recent acquisition of Revitas may present additional challenges as we integrate their business. Further, weaknesses in our internal controls may be discovered in the future. Any failure to develop or maintain effective controls, or any difficulties encountered in their implementation or improvement, could harm our operating results or cause us to fail to meet our reporting obligations and may result in a restatement of our financial statements for prior periods. Any failure to implement and maintain effective internal controls also could adversely affect the results of periodic management evaluations and, if applicable, annual independent registered public accounting firm attestation reports regarding the effectiveness of our internal control over financial reporting that we are required to include in our periodic reports we file with the SEC under Section 404 of the Sarbanes-OxleySarbanes-
Oxley Act. Ineffective disclosure controls and procedures and internal control over financial reporting could also cause investors to lose confidence in our reported financial and other information, which would likely have a negative effect on the trading price of our common stock.
In order to maintain and improve the effectiveness of our disclosure controls and procedures and internal control over financial reporting, we have expended, and anticipate that we will continue to expend, significant resources, including accounting-related costs, and provide significant management oversight. Any failure to maintain the adequacy of our internal controls, or consequent inability to produce accurate financial statements
on a timely basis, could increase our operating costs and could materially impair our ability to operate our business. In the event that our internal controls are perceived as inadequate or that we are unable to produce timely or accurate financial statements, investors may lose confidence in our operating results and our stock price could decline. In addition, if we are unable to continue to meet these requirements, we may not be able to remain listed on the New York Stock Exchange.
Our independent registered public accounting firm is not required to formally attest to the effectiveness of our internal control over financial reporting until after we are no longer an emerging growth company. At such time, our independent registered public accounting firm may issue a report that is adverse in the event it is not satisfied with the level at which our controls are documented, designed or operating. Our remediation efforts may not enable us to avoid a material weakness in the future.
We may need additional capital, and we cannot be certain that additional financing will be available.
We may require additional financing in the future.future to operate or expand our business, acquire assets or repay or refinance our existing debt. Our ability to obtain financing will depend, among other things, on our development efforts, business plans, operating performance and condition of the capital markets at the time we seek financing. We cannot assure you that additional financing will be available to us on favorable terms when required, or at all. Additionally, under our financing agreement, we are restricted from incurring additional debt, subject to certain exceptions. If we raise additional funds through the issuance of equity, equity-linked or debt securities, those securities may have rights, preferences or privileges senior to the rights of our common stock or preferred stock, and our stockholders may experience dilution.
If we need additional capital and cannot raise it on acceptable terms, we may not be able to, among other things:
repay or refinance our existing debt;
acquire complementary technologies, solutions or businesses;
Our failure to do any of these things could seriously harm our business, financial condition, and operating results.
Our ability to use our net operating losses to offset future taxable income may be subject to certain limitations.
In general, under Section 382 of the U.S. Internal Revenue Code of 1986, as amended (Code), and similar state law provisions, a corporation that undergoes an “ownership change” is subject to limitations on its ability to utilize its pre-change net operating losses (NOLs) to offset future taxable income. If our existing NOLs are subject to limitations arising from ownership changes, our ability to utilize NOLs could be limited by Section 382 of the Code. Future changes in our stock ownership, some of which are outside of our control, also could result in an ownership change under Section 382 of the Code. There is also a risk that our NOLs could expire, or otherwise be unavailable to offset future income tax liabilities due to changes in the law, including regulatory changes, such as suspensions on the use of NOLs or other unforeseen reasons. For these reasons, we may not be able to utilize a material portion of the NOLs, even if we attain profitability. For example, certain NOLs have begun to expire in 2016.
Risks Related to the Ownership of Our Common Stock
Our stock price may be volatile, and you may be unable to sell your shares at or above your purchase price.
The market price of our common stock could be subject to wide fluctuations in response to, among other things, the factors described in this “Risk Factors” section or otherwise and other factors beyond our control, such as fluctuations in the valuations of companies perceived by investors to be comparable to us.
Furthermore, the stock markets have experienced price and volume fluctuations that have affected and continue to affect the market prices of equity securities of many companies. These fluctuations often have been unrelated or disproportionate to the operating performance of those companies. These broad market fluctuations, as well as general economic, systemic, political and market conditions, such as recessions, interest rate changes or international currency fluctuations, may negatively affect the market price of our common stock.
In the past, many companies that have experienced volatility in the market price of their stock have become subject to securities class action litigation. We may be the target of this type of litigation in the future. Securities litigation against us could result in substantial costs and divert our management’s attention, which could harm our business.
If securities analysts do not publish research or reports or if they publish unfavorable or inaccurate research about our business and our stock, the price of our stock and the trading volume could decline.
We expect that the trading market for our common stock will be affected by research or reports that industry or financial analysts publish about us or our business. There are many large, well-established companies active in our industry and portions of the markets in which we compete, which may mean that we receive less widespread analyst coverage than our competitors. If one or more of the analysts who covers us downgrades their evaluations of our company or our stock, the price of our stock could decline. If one or more of these analysts cease coverage of our company, our stock may lose visibility in the market, which in turn could cause our stock price to decline.
The concentration of ownership of our common stock among our existing executive officers, directors and significant stockholders may limit your ability to influence corporate matters.
As of September 30, 2014, our executive officers, directors, current five percent or greater stockholders and entities affiliated with them together beneficially owned approximately 53.4% of our common stock. This significant concentration of share ownership may adversely affect the trading price for our common stock because investors often perceive disadvantages in owning stock in companies with concentrated bases of stockholders. Also, these stockholders, acting together, will be able to control our management and affairs and matters requiring stockholder approval, including the election of directors and the approval of significant corporate transactions, such as mergers, consolidations or the sale of substantially all of our assets. Consequently, this concentration of ownership may have the effect of delaying or preventing a change of control, including a merger, consolidation or other business combination involving us, or discouraging a potential acquirer from making a tender offer or otherwise attempting to obtain control, even if that change of control would benefit our other stockholders.
Our restated certificate of incorporation and restated bylaws and Delaware law could prevent a takeover that stockholders consider favorable and could also reduce the market price of our stock.
Our restated certificate of incorporation and restated bylaws contain provisions that could delay or prevent a change in control of us. These provisions could also make it more difficult for stockholders to elect directors and take other corporate actions. These provisions include:
In addition, we are subject to Section 203 of the Delaware General Corporation Law which may prohibit large stockholders, in particular those owning fifteen percent or more of our outstanding voting stock, from merging or combining with us for a certain period of time without the consent of our board of directors.
These and other provision in our restated certificate of incorporation and our restated bylaws and under the Delaware General Corporation Law could discourage potential takeover attempts, reduce the price that investors might be willing to pay in the future for shares of our common stock and result in the market price of our common stock being lower than it would be without these provisions.
We do not anticipate paying any dividends on our common stock.
We do not anticipate paying any cash dividends on our common stock in the foreseeable future. If we do not pay cash dividends, you would receive a return on your investment in our common stock only if the market price of our common stock is greater at the time you sell your shares than the market price at the time you bought your shares.
ITEM 1B.Unresolved Staff Comments
None.
Our corporate headquarters are located in Redwood City,San Mateo, California, and consist of approximately 34,60035,000 square feet of space under a lease that expires in December 2017. Our cloud-based solutions are operated through third-party data centers located in Missouri, Texas and Massachusetts.on November 30, 2020.
We have additional U.S. offices in California, Colorado, Illinois, Maine, Massachusetts and New Jersey. We also have offices in international office locations in India, Switzerland and the United Kingdom.Switzerland. We believe our facilities are adequate for our current needs and for the foreseeable future; however, we will continue to seek additional space as needed to accommodate our growth. See Note 58 to the Consolidated Financial Statements and “Management’s Discussion and Analysis of Financial Condition and Results of Operations—Contractual Payment Obligations” for information regarding our lease obligations.
Information with respectWe are not currently a party to this itemany pending material legal proceedings. From time to time, we may be foundbecome involved in Note 5—Commitmentslegal proceedings arising in the ordinary course of our business. Regardless of outcome, litigation can have an adverse impact on us due to defense and Contingencies—Legal Proceeds to the Consolidated Financial Statements in Item 8, which is incorporated herein by reference.settlement costs, diversion of management resources, negative publicity and reputational harm and other factors.
Not applicable.applicable
PART II
ITEM 5. | Market for Registrant’s Common Equity, Related Stockholder Matters and Issuer Purchases of Equity Securities |
Market Information for Common Stock
Model N common stock is traded on the New York Stock Exchange under the symbol “MODN”. There were no cash dividends declared or paid on Model N’s common stock during fiscal 2014 and 2013. The high and low sales prices per share of common stock for each of the quarters in the last two fiscal years were as follows:
| Fiscal 2014 | Fiscal 2013 | |||||||||||||||
Fiscal Quarter | High | Low | High | Low | ||||||||||||
First quarter | $ | 12.00 | $ | 7.55 | (1) | (1) | ||||||||||
Second quarter | $ | 12.97 | $ | 9.20 | $ | 22.25 | (2) | $ | 17.71 | (2) | ||||||
Third quarter | $ | 11.57 | $ | 8.69 | $ | 23.78 | $ | 17.13 | ||||||||
Fourth quarter | $ | 11.42 | $ | 8.56 | $ | 24.80 | $ | 8.92 | ||||||||
|
| Fiscal Year 2017 |
|
| Fiscal Year 2016 |
| ||||||||||
|
| High |
|
| Low |
|
| High |
|
| Low |
| ||||
First Quarter |
| $ | 11.00 |
|
| $ | 6.98 |
|
| $ | 11.84 |
|
| $ | 9.76 |
|
Second Quarter |
| $ | 11.23 |
|
| $ | 8.45 |
|
| $ | 11.33 |
|
| $ | 9.19 |
|
Third Quarter |
| $ | 13.55 |
|
| $ | 9.95 |
|
| $ | 13.98 |
|
| $ | 10.24 |
|
Fourth Quarter |
| $ | 15.05 |
|
| $ | 12.40 |
|
| $ | 13.87 |
|
| $ | 9.75 |
|
Dividend Policy
We have never declared or paid, and do not anticipate declaring or paying in the foreseeable future, any cash dividends on our capital stock. Any future determination as to the declaration and payment of dividends, if any, will be at the discretion of our board of directors, subject to applicable laws and will depend on then existing conditions, including our financial condition, operating results, contractual restrictions, capital requirements, business prospects, and other factors our board of directors may deem relevant.
Stockholders
As of November 11, 2014,3, 2017, there were 14377 holders of record of our common stock, including The Depository Trust Company, which holds shares of our common stock on behalf of an indeterminate number of beneficial owners.
Securities Authorized for Issuance under Equity Compensation Plans
The information called for by this item is incorporated by reference to our Proxy Statement for the Annual Meeting of Stockholders to be held in 20152018 (Proxy Statement). See Part III, Item 12 “Security Ownership of Certain Beneficial Owners and Management” and “Equity Compensation Plan Information.”
Stock Performance Graph
The following shall not be deemed “filed” for purposes of Section 18 of the Exchange Act, or incorporated by reference into any of our other filings under the Exchange Act or the Securities Act of 1933, as amended, except to the extent we specifically incorporate it by reference into such filing.
This chart compares the cumulative total return on our common stock with that of the NASDAQ Composite Index and the NASDAQ Computer Index. The chart assumes $100 was invested at the close of market on March 20, 2013 (the first day our common stock began trading publicly on the NYSE), in our common stock, the NASDAQ Composite Index and the NASDAQ Computer Index, and assumes the reinvestment of any dividends.
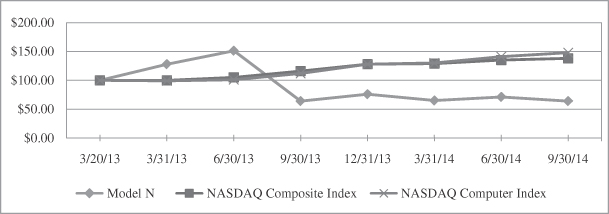

| 3/20/2013 | 3/31/2013 | 6/30/2013 | 9/30/2013 | 12/31/2013 | 3/31/2014 | 6/30/2014 | 9/30/2014 |
| 3/20/2013 |
|
| 3/31/2013 |
|
| 6/30/2013 |
|
| 9/30/2013 |
| |||||||||||||||||||||||||||||
Model N | $ | 100.00 | $ | 127.87 | $ | 150.71 | $ | 63.87 | $ | 76.06 | $ | 65.23 | $ | 71.29 | $ | 63.61 |
| $ | 100.00 |
|
| $ | 127.87 |
|
| $ | 150.71 |
|
| $ | 63.87 |
| ||||||||||||||||
NASDAQ Composite Index | $ | 100.00 | $ | 100.41 | $ | 104.58 | $ | 115.90 | $ | 128.34 | $ | 129.03 | $ | 135.46 | $ | 138.08 |
| $ | 100.00 |
|
| $ | 100.41 |
|
| $ | 104.58 |
|
| $ | 115.90 |
| ||||||||||||||||
NASDAQ Computer Index | $ | 100.00 | $ | 99.28 | $ | 101.16 | $ | 112.32 | $ | 128.13 | $ | 130.12 | $ | 140.68 | $ | 147.67 |
| $ | 100.00 |
|
| $ | 99.28 |
|
| $ | 101.16 |
|
| $ | 112.32 |
| ||||||||||||||||
|
| 12/31/2013 |
|
| 3/31/2014 |
|
| 6/30/2014 |
|
| 9/30/2014 |
| ||||||||||||||||||||||||||||||||||||
Model N |
| $ | 76.06 |
|
| $ | 65.23 |
|
| $ | 71.29 |
|
| $ | 63.61 |
| ||||||||||||||||||||||||||||||||
NASDAQ Composite Index |
| $ | 128.34 |
|
| $ | 129.03 |
|
| $ | 135.46 |
|
| $ | 138.08 |
| ||||||||||||||||||||||||||||||||
NASDAQ Computer Index |
| $ | 128.13 |
|
| $ | 130.12 |
|
| $ | 140.68 |
|
| $ | 147.67 |
| ||||||||||||||||||||||||||||||||
|
| 12/31/2014 |
|
| 3/31/2015 |
|
| 6/30/2015 |
|
| 9/30/2015 |
| ||||||||||||||||||||||||||||||||||||
Model N |
| $ | 68.52 |
|
| $ | 77.16 |
|
| $ | 76.84 |
|
| $ | 64.58 |
| ||||||||||||||||||||||||||||||||
NASDAQ Composite Index |
| $ | 145.54 |
|
| $ | 150.60 |
|
| $ | 153.24 |
|
| $ | 141.98 |
| ||||||||||||||||||||||||||||||||
NASDAQ Computer Index |
| $ | 153.60 |
|
| $ | 155.57 |
|
| $ | 155.89 |
|
| $ | 148.06 |
| ||||||||||||||||||||||||||||||||
|
| 12/31/2015 |
|
| 3/31/2016 |
|
| 6/30/2016 |
|
| 9/30/2016 |
| ||||||||||||||||||||||||||||||||||||
Model N |
| $ | 72.00 |
|
| $ | 69.48 |
|
| $ | 86.13 |
|
| $ | 71.68 |
| ||||||||||||||||||||||||||||||||
NASDAQ Composite Index |
| $ | 153.88 |
|
| $ | 149.65 |
|
| $ | 148.81 |
|
| $ | 163.24 |
| ||||||||||||||||||||||||||||||||
NASDAQ Computer Index |
| $ | 163.19 |
|
| $ | 164.59 |
|
| $ | 158.09 |
|
| $ | 181.12 |
| ||||||||||||||||||||||||||||||||
|
| 12/31/2016 |
|
| 3/31/2017 |
|
| 6/30/2017 |
|
| 9/30/2017 |
| ||||||||||||||||||||||||||||||||||||
Model N |
| $ | 57.10 |
|
| $ | 67.42 |
|
| $ | 85.81 |
|
| $ | 96.45 |
| ||||||||||||||||||||||||||||||||
NASDAQ Composite Index |
| $ | 165.42 |
|
| $ | 181.67 |
|
| $ | 188.69 |
|
| $ | 199.62 |
| ||||||||||||||||||||||||||||||||
NASDAQ Computer Index |
| $ | 183.21 |
|
| $ | 206.82 |
|
| $ | 215.47 |
|
| $ | 234.31 |
| ||||||||||||||||||||||||||||||||
Use of Proceeds from Public Offering of Common Stock
On March 19, 2013, our registration statements on Form S-1 (File Nos. 333-186668 and 333-187370) were declared effective by the SEC for our initial public offering (IPO) pursuant to which we sold an aggregate of 7,751,000 shares of our common stock (inclusive of 1,011,000 shares of common stock pursuant to the full exercise of an overallotment option granted to the underwriters and 740,000 shares of common stock sold by a selling stockholder) at a price to the public of $15.50 per share. There has been no material change in the planned use of proceeds from our IPO as described in our final prospectus filed with the SEC on March 20, 2013 pursuant to Rule 424(b).
The following selected consolidated financial data should be read in conjunction with our audited Consolidated Financial Statements and related notes thereto and with Management’s Discussion and Analysis of Financial Condition and Results of Operation, which are included elsewhere in this Form 10-K. The consolidated statement of operations data for the fiscal years ended September 30, 2014, 2013,2017, 2016 and 2012,2015 and the selected consolidated balance sheet data as of September 30, 20142017 and 20132016 are derived from and are qualified by reference to, theour audited consolidated financial statements and are included in this Form 10-K. The consolidated statement of operations data for fiscal years ended September 30, 20112014 and 2010,2013, and the selected consolidated balance sheet data as of September 30, 20122015, 2014 and 20112013 are derived from audited consolidated financial statements that are not included in the Form 10-K.The information set forth below is not necessarily indicative of results of future operations, and should be read in conjunction with Item 7, “Management's Discussion and Analysis of Financial Condition and Results of Operations” and the consolidated financial statements and related notes included in Part II, Item 8, "Consolidated Financial Statements and Supplementary Data" in this Annual Report on Form 10-K.
| Fiscal Years Ended September 30, | ||||||||||||||||||||
| 2014 | 2013 | 2012 | 2011 | 2010 | ||||||||||||||||
| (in thousands, except per share data) | ||||||||||||||||||||
Consolidated Statements of Operations Data: | ||||||||||||||||||||
Revenues: | ||||||||||||||||||||
License and implementation | $ | 35,333 | $ | 59,134 | $ | 49,756 | $ | 41,499 | $ | 31,759 | ||||||||||
SaaS and maintenance | 46,423 | 42,770 | 34,502 | 23,672 | 18,682 | |||||||||||||||
|
|
|
|
|
|
|
|
|
| |||||||||||
Total revenues | 81,756 | 101,904 | 84,258 | 65,171 | 50,441 | |||||||||||||||
|
|
|
|
|
|
|
|
|
| |||||||||||
Cost of Revenues: | ||||||||||||||||||||
License and implementation(1) | 16,652 | 26,832 | 22,483 | 18,092 | 12,087 | |||||||||||||||
SaaS and maintenance(1) | 21,092 | 19,350 | 18,053 | 8,828 | 6,328 | |||||||||||||||
|
|
|
|
|
|
|
|
|
| |||||||||||
Total cost of revenues | 37,744 | 46,182 | 40,536 | 26,920 | 18,415 | |||||||||||||||
|
|
|
|
|
|
|
|
|
| |||||||||||
Gross profit | 44,012 | 55,722 | 43,722 | 38,251 | 32,026 | |||||||||||||||
Operating Expenses: | ||||||||||||||||||||
Research and development(1) | 18,710 | 16,772 | 17,695 | 13,809 | 12,702 | |||||||||||||||
Sales and marketing(1) | 25,998 | 21,144 | 19,640 | 13,935 | 11,221 | |||||||||||||||
General and administrative(1) | 19,671 | 16,063 | 10,584 | 7,860 | 6,945 | |||||||||||||||
Restructuring | 26 | 1,215 | — | — | — | |||||||||||||||
|
|
|
|
|
|
|
|
|
| |||||||||||
Total operating expenses | 64,405 | 55,194 | 47,919 | 35,604 | 30,868 | |||||||||||||||
|
|
|
|
|
|
|
|
|
| |||||||||||
(Loss) income from operations | (20,393 | ) | 528 | (4,197 | ) | 2,647 | 1,158 | |||||||||||||
Interest (income) expense, net | (12 | ) | 357 | 655 | 677 | 353 | ||||||||||||||
Other expenses, net | 116 | 658 | 540 | 316 | 20 | |||||||||||||||
|
|
|
|
|
|
|
|
|
| |||||||||||
(Loss) income before income taxes | (20,497 | ) | (487 | ) | (5,392 | ) | 1,654 | 785 | ||||||||||||
Provision for income taxes | 384 | 439 | 301 | 172 | 161 | |||||||||||||||
|
|
|
|
|
|
|
|
|
| |||||||||||
Net (loss) income | $ | (20,881 | ) | $ | (926 | ) | $ | (5,693 | ) | $ | 1,482 | $ | 624 | |||||||
|
|
|
|
|
|
|
|
|
| |||||||||||
Net loss per share attributable to common stockholders(2): | ||||||||||||||||||||
Basic and diluted | $ | (0.86 | ) | $ | (0.06 | ) | $ | (0.73 | ) | $ | — | $ | — | |||||||
|
|
|
|
|
|
|
|
|
| |||||||||||
Weighted average number of shares used in computing net loss per share attributable to common stockholders(2): | ||||||||||||||||||||
Basic and diluted | 24,399 | 15,979 | 7,815 | 7,324 | 7,028 | |||||||||||||||
|
|
|
|
|
|
|
|
|
| |||||||||||
Other Financial Data: | ||||||||||||||||||||
Adjusted EBITDA(3) | $ | (6,241 | ) | $ | 9,621 | $ | 4,957 | $ | 4,389 | $ | 3,230 | |||||||||
|
| Fiscal Years Ended September 30, |
| |||||||||||||||||
|
| 2017 (1) |
|
| 2016 |
|
| 2015 |
|
| 2014 |
|
| 2013 |
| |||||
|
| (in thousands, except per share data) |
| |||||||||||||||||
Consolidated Statements of Operations Data: |
|
|
|
|
|
|
|
|
|
|
|
|
|
|
|
|
|
|
|
|
Revenues: |
|
|
|
|
|
|
|
|
|
|
|
|
|
|
|
|
|
|
|
|
License and implementation |
| $ | 23,114 |
|
| $ | 20,579 |
|
| $ | 36,172 |
|
| $ | 35,333 | �� |
| $ | 59,134 |
|
SaaS and maintenance |
|
| 108,055 |
|
|
| 86,392 |
|
|
| 57,596 |
|
|
| 46,423 |
|
|
| 42,770 |
|
Total revenues |
|
| 131,169 |
|
|
| 106,971 |
|
|
| 93,768 |
|
|
| 81,756 |
|
|
| 101,904 |
|
Cost of Revenues: |
|
|
|
|
|
|
|
|
|
|
|
|
|
|
|
|
|
|
|
|
License and implementation |
|
| 14,224 |
|
|
| 12,976 |
|
|
| 15,555 |
|
|
| 16,652 |
|
|
| 26,832 |
|
SaaS and maintenance |
|
| 46,872 |
|
|
| 40,717 |
|
|
| 26,014 |
|
|
| 21,092 |
|
|
| 19,350 |
|
Total cost of revenues |
|
| 61,096 |
|
|
| 53,693 |
|
|
| 41,569 |
|
|
| 37,744 |
|
|
| 46,182 |
|
Gross profit |
|
| 70,073 |
|
|
| 53,278 |
|
|
| 52,199 |
|
|
| 44,012 |
|
|
| 55,722 |
|
Operating Expenses: |
|
|
|
|
|
|
|
|
|
|
|
|
|
|
|
|
|
|
|
|
Research and development |
|
| 31,064 |
|
|
| 23,706 |
|
|
| 17,906 |
|
|
| 18,710 |
|
|
| 16,772 |
|
Sales and marketing |
|
| 41,339 |
|
|
| 32,261 |
|
|
| 30,300 |
|
|
| 25,998 |
|
|
| 21,144 |
|
General and administrative |
|
| 36,281 |
|
|
| 30,051 |
|
|
| 23,132 |
|
|
| 19,671 |
|
|
| 16,063 |
|
Restructuring |
|
| — |
|
|
| — |
|
|
| — |
|
|
| 26 |
|
|
| 1,215 |
|
Total operating expenses |
|
| 108,684 |
|
|
| 86,018 |
|
|
| 71,338 |
|
|
| 64,405 |
|
|
| 55,194 |
|
(Loss) income from operations |
|
| (38,611 | ) |
|
| (32,740 | ) |
|
| (19,139 | ) |
|
| (20,393 | ) |
|
| 528 |
|
Interest (income) expense, net |
|
| 4,159 |
|
|
| (50 | ) |
|
| (6 | ) |
|
| (12 | ) |
|
| 357 |
|
Other (income) expenses, net |
|
| 62 |
|
|
| 86 |
|
|
| (22 | ) |
|
| 116 |
|
|
| 658 |
|
Loss before income taxes |
|
| (42,832 | ) |
|
| (32,776 | ) |
|
| (19,111 | ) |
|
| (20,497 | ) |
|
| (487 | ) |
(Benefit) provision for income taxes |
|
| (3,285 | ) |
|
| 335 |
|
|
| 528 |
|
|
| 384 |
|
|
| 439 |
|
Net loss |
| $ | (39,547 | ) |
| $ | (33,111 | ) |
| $ | (19,639 | ) |
| $ | (20,881 | ) |
| $ | (926 | ) |
Net loss per share attributable to common stockholders (2): |
|
|
|
|
|
|
|
|
|
|
|
|
|
|
|
|
|
|
|
|
Basic and diluted |
| $ | (1.38 | ) |
| $ | (1.21 | ) |
| $ | (0.76 | ) |
| $ | (0.86 | ) |
| $ | (0.06 | ) |
Weighted average number of shares used in computing net loss per share attributable to common stockholders (2): |
|
|
|
|
|
|
|
|
|
|
|
|
|
|
|
|
|
|
|
|
Basic and diluted |
|
| 28,649 |
|
|
| 27,379 |
|
|
| 26,015 |
|
|
| 24,399 |
|
|
| 15,979 |
|
|
|
|
|
|
|
|
|
|
|
|
|
|
|
|
|
|
|
|
|
|
Other Financial Data: |
|
|
|
|
|
|
|
|
|
|
|
|
|
|
|
|
|
|
|
|
Adjusted EBITDA (3) |
| $ | (8,269 | ) |
| $ | (12,571 | ) |
| $ | (3,332 | ) |
| N/A |
|
| N/A |
| ||
(1) |
| Fiscal Years Ended September 30, | ||||||||||||||||||||
| 2014 | 2013 | 2012 | 2011 | 2010 | ||||||||||||||||
Cost of revenues: | ||||||||||||||||||||
License and implementation | $ | 905 | $ | 591 | $ | 298 | $ | 92 | $ | 134 | ||||||||||
SaaS and maintenance | 749 | 622 | 561 | 29 | 41 | |||||||||||||||
Operating expenses: | ||||||||||||||||||||
Research and development | 1,278 | 747 | 297 | 127 | 133 | |||||||||||||||
Sales and marketing | 2,789 | 1,687 | 1,103 | 108 | 173 | |||||||||||||||
General and administrative | 4,228 | 1,209 | 262 | 175 | 276 | |||||||||||||||
|
|
|
|
|
|
|
|
|
| |||||||||||
Stock-based compensation in operating (loss) income | $ | 9,949 | $ | 4,856 | $ | 2,521 | $ | 531 | $ | 757 | ||||||||||
|
|
|
|
|
|
|
|
|
| |||||||||||
| On January 5, 2017, we completed the Revitas acquisition. See Note |
(2) | See Note 11 to our consolidated financial statements for a description of the method used to compute basic and diluted net loss per share attributable to common stockholders. |
(3) | See “Management’s Discussion and Analysis of Financial Condition and Results of Operations—Non-GAAP Financial Measure” in Item 7 for more information and a reconciliation of adjusted EBITDA to net |
| As of September 30, | ||||||||||||||||
| 2014 | 2013 | 2012 | 2011 | |||||||||||||
| (in thousands) | ||||||||||||||||
Consolidated Balance Sheet Data | ||||||||||||||||
Cash and cash equivalents | $ | 101,006 | $ | 103,350 | $ | 15,768 | $ | 18,420 | ||||||||
Working capital (deficit) | 82,370 | 86,842 | (12,584 | ) | 1,082 | |||||||||||
Total assets | 129,131 | 134,472 | 40,598 | 36,954 | ||||||||||||
Loan obligations, current and long-term | — | — | 5,127 | 7,378 | ||||||||||||
Total liabilities | 40,167 | 40,854 | 51,085 | 44,881 | ||||||||||||
Convertible preferred stock | — | — | 41,776 | 41,776 | ||||||||||||
Total stockholders’ equity (deficit) | 88,964 | 93,618 | (52,263 | ) | (49,703 | ) | ||||||||||
|
| As of September 30, |
| |||||||||||||||||
|
| 2017 (1) |
|
| 2016 |
|
| 2015 |
|
| 2014 |
|
| 2013 |
| |||||
|
| (in thousands) |
| |||||||||||||||||
Consolidated Balance Sheet Data |
|
|
|
|
|
|
|
|
|
|
|
|
|
|
|
|
|
|
|
|
Cash and cash equivalents |
| $ | 57,558 |
|
| $ | 66,149 |
|
| $ | 91,019 |
|
| $ | 101,006 |
|
| $ | 103,350 |
|
Working capital |
|
| 10,172 |
|
|
| 48,588 |
|
|
| 74,814 |
|
|
| 82,370 |
|
|
| 86,842 |
|
Total assets |
|
| 171,936 |
|
|
| 112,967 |
|
|
| 121,970 |
|
|
| 129,131 |
|
|
| 134,472 |
|
Loan obligations, current and long-term |
|
| 57,205 |
|
|
| — |
|
|
| — |
|
|
| — |
|
|
| — |
|
Total liabilities |
|
| 130,675 |
|
|
| 46,765 |
|
|
| 38,908 |
|
|
| 40,167 |
|
|
| 40,854 |
|
Total stockholders' equity |
|
| 41,261 |
|
|
| 66,202 |
|
|
| 83,062 |
|
|
| 88,964 |
|
|
| 93,618 |
|
(1) | On January 5, 2017, we completed the Revitas acquisition. See Note 3 to our consolidated financial statements for more information. |
You should read the following discussion and analysis of our financial condition and results of operations together with the consolidated financial statements and related notes that are included elsewhere in this report. This discussion contains forward-looking statements based upon current expectations that involve risks and uncertainties. Our actual results may differ materially from those anticipated in these forward-looking statements as a result of various factors, including those set forth under “Risk Factors” or in other parts of this report.
Overview
We are thea leader in Revenue Management cloud solutions. We help oursolutions for life sciences and technology companies. Our solutions enable customers maximize their revenues by maximizing sell time, revenues per opportunity and number of opportunities. Our cloud solutions manage every dollar that impacts the customer’s top line and transformsto transform the revenue lifecycle from a series of disjointed operations into a strategic end-to-end process. With deep industry expertise, we supportssupport the uniquecomplex business needs of the world’s leading brands in life sciencesciences and high technology companies across tens of thousands of users in more than 100 countries.
Our solutions comprisedindustry specific clouds – Revenue Cloud for Pharma, Revenue Cloud for Med Tech and Revenue Cloud for High Tech – offer a range of several complementary software applications: Revenue Management Enterprise, Revenue Management Intelligence and Revvy. Sales of our solutions range from individual applicationsproducts to complete suites and deployments may vary from specific divisions or territories to enterprise-wide implementations. In addition to industry specific clouds, Revenue Cloud provides a broad set of multi-tenant cloud applications for a variety of industries.
We derive revenues primarily from the sale of subscriptions to our on premise and cloud-basedRevenue Cloud solutions and related implementationprofessional services, as well as maintenance and support and application support.managed support services. We price our solutions based on a number of factors, including revenues under management and number of users. Our license and implementationWe also derive revenues are comprised offrom selling professional services related to past sales of perpetual license and related implementation services, which revenues are recognized over the implementation period, which commences when implementation work begins and typically ranges from a few months to three years.licenses. Maintenance and support revenues are recognized ratably over the support period, which is typically one year. SaaS revenues for cloud-based solutions are derived from subscription fees from customers accessing our cloud-based solutions, as well as from associated implementationprofessional services. The actual timing of revenue recognition may vary based on our customers’ implementation requirements and availability of our services personnel.
We market and sell our solutions to customers in the life sciencesciences and technology industries. While we have historically generated the substantial majority of our revenues from companies in the life sciencesciences industry, we have also grown our base of technology customers and intend to continue to focus on increasing the revenues from customers in the technology industry. Our most significant customers in any given period generally vary from period to period due to the timing in the delivery of implementationour professional services and related revenue recognition over those periodsrecognition. During the fiscal years ended September 30, 2017 and 2015, one customer, Johnson & Johnson, accounted for approximately 11% of larger projects. Duringour total revenues. However, during the fiscal year ended September 30, 2014, one2017, no customer Johnson and Johnson,represented more than 10% of our subscription revenues. No customer accounted for approximately 15%more than 10% of our total revenues. Duringrevenues during the fiscal year ended September 30, 2013, two customers, accounted for approximately 12% each of our total revenues. During the fiscal year ended September 30, 2012, two customers accounted for approximately 14% and 10% of our total revenues, respectively.2016. For the fiscal year ended September 30, 2014,2017, approximately 11% of our total revenues were derived from customers located outside the United States.
For the fiscal years ended September 30, 2014, 20132017, 2016 and 2012,2015, our total revenues were $81.8$131.2 million, $101.9$107.0 million and $84.3$93.8 million, respectively, representing a year-over-year declineincrease of approximately 20%23% from 20132016 to 2014,2017 and year-over-over increase of approximately a year-over-over growth of 21%14% from 20122015 to 2013.2016. Revenues decreasedincreased in the 20142017 fiscal year primarily due to improvement in sales execution challenges, our lengthy sales cycles and our continued dependence onthe acquisition of Revitas.
Significant Transactions
On January 5, 2017, we acquired Revitas, for cash consideration of $52.8 million. In addition, $10 million was paid in the form of two promissory notes, one which matures 18 months after the closing and the other which matures 36 months after the closing. These notes bear interest at the rate of 3% per annum, and are subject to a relatively small numberright of customersset-off as partial security for the indemnification obligations of Revitas’ stockholders under the merger agreement.
On January 5, 2017, we borrowed $50.0 million under a significantfinancing agreement that we entered into with various lenders to fund the cash portion of our revenues.the acquisition of Revitas, Inc. The rate on the term loans is based on (i) the Base Rate plus 9.25% or (ii) the LIBOR Rate plus 8.25%, as selected by us. The term loan matures on January 5, 2022. We made progressmust repay 0.625% of the aggregate principal amount of the term loans on the last business day of each fiscal quarter, beginning with the fiscal quarter ending March 31, 2019. We may voluntarily prepay the terms loans, subject to a 3% premium during the first 24 months and 1% premium after 24 months and prior to 36 months. The loan contains various covenants with which we must remain in improving our sales execution over recent fiscal quarters and we expectcompliance. See Note 6 to continue to improve into fiscal year 2015.Consolidated Financial Statements for further information.
Key Business Metrics
In addition to the measures of financial performance presented in our Consolidated Financial Statements, we use certain key metricsadjusted EBITDA to evaluate and manage our business including four-quarter revenues from current customers and Adjusted EBITDA. We use these key metricsadjusted EBITDA internally to manage the business, and we believe they areit is useful for investors to compare key financial data from various periods.
See “—Non-GAAP Financial Measure
Adjusted EBITDA
Adjusted EBITDA is a financial measure that is not calculated in accordance with generally accepted accounting principles in the United States (U.S. GAAP). We define Adjusted EBITDA as net loss before LeapFrogRx compensation charges, stock-based compensation, depreciation and amortization, restructuring, interest (income) expense, net, other expenses, net, and provision for income taxes. We believe Adjusted EBITDA provides investors with consistency and comparability with our past financial performance and facilitates period-to-period comparisons of our operating results and our competitors’ operating results. We also use this measure internally to establish budgets and operational goals to manage our business and evaluate our performance.
We understand that, although Adjusted EBITDA is frequently used by investors and securities analysts in their evaluations of companies, Adjusted EBITDA has limitations as an analytical tool, and it should not be considered in isolation or as a substitute for analysis of our results of operations as reported under U.S. GAAP. These limitations include:Measure” below.
| Fiscal Years Ended September 30, | ||||||||||||
| 2014 | 2013 | 2012 | ||||||||||
| (in thousands) | ||||||||||||
Reconciliation of Adjusted EBITDA: | ||||||||||||
Net loss | $ | (20,881 | ) | $ | (926 | ) | $ | (5,693 | ) | |||
Adjustments: | ||||||||||||
Stock-based compensation | 9,949 | 4,856 | 2,521 | |||||||||
Depreciation and amortization | 3,716 | 2,207 | 1,760 | |||||||||
LeapFrogRx Compensation charges | 461 | 815 | 4,873 | |||||||||
Restructuring | 26 | 1,215 | — | |||||||||
Interest (income) expense, net | (12 | ) | 357 | 655 | ||||||||
Other expenses, net | 116 | 658 | 540 | |||||||||
Provision for income taxes | 384 | 439 | 301 | |||||||||
|
|
|
|
|
| |||||||
Adjusted EBITDA | $ | (6,241 | ) | $ | 9,621 | $ | 4,957 | |||||
|
|
|
|
|
| |||||||
Adjusted EBITDA was $(6.2) million, $9.6 million, and $5.0 million for the fiscal years ended September 30, 2014, 2013, and 2012, respectively. Our Adjusted EBITDA for the fiscal year ended September 30, 2014 decreased primarily due to a decrease in total revenues partially offset by a decrease in operating expenses. Revenues decreased primarily due to sales execution challenges, our lengthy sales cycles and our continued dependence on a relatively small number of customers for a significant portion of our total revenues. The decrease in expenses was primarily due to a decrease in personnel cost and third-party contractors cost.
Key Components of Results of Operations
Revenues
Revenues are comprised of license and implementation revenues and SaaS and maintenance revenues.
License and Implementation
License and implementation revenues are generated from the sale of software licenses for our on premiseon-premise solutions and related implementation and professional services. We expect our license and implementation revenues for the fiscal year 20152018 to be higher thanlower both in absolute dollars and as a percentage of total revenue from those recorded in the current fiscal year ended on September 30, 2014 due to improvement in sales execution during the 2014 fiscal year.2017, as we no longer sell perpetual licenses.
SaaS and Maintenance
SaaS and maintenance revenues primarily include subscription and related implementation fees from customers accessing our cloud-based solutions and revenues associated with maintenance contracts from license customers.solutions. Also included in SaaS and maintenance revenues are other revenues, including revenues related to applicationmaintenance and support, managed support services, training and customer-reimbursed expenses. In fiscal year 2014,The SaaS model is the primary way we took several stepssell to transform our business model in order to increase the percentage of our business coming from SaaS and maintenance revenues. We believe we have an opportunity to accelerate the shiftcustomers in our business model to recurring revenues, as SaaS is gaining wide acceptance as a delivery model, particularly in the technology sector and mid-market life science companies. We have started marketing and selling some of our products and services (such as Revvy) only as a SaaS offering. vertical markets. Accordingly, we expect that SaaS and maintenance revenues for the fiscal year 20152018 will be higher than fiscal year 2014both in absolute dollars and we believe will increase as a percentage of total revenues than fiscal year 2017 as we continue to acquire new SaaS customers and expand our SaaS offerings within our existing customers.
Deferred revenue on our consolidated balance sheet does not represent the total contract value of annual or multi-year, noncancelable subscription agreements. Backlog represents expected future billings which are contractually committed under our existing subscription agreements that have not been invoiced. Backlog was approximately $37.4 million and $16.0 million as of September 30, 2017 and 2016, respectively. Out of backlog as of September 30, 2017 and 2016, approximately $20.2 million and $6.3 million was long-term backlog and $17.2 million and $9.7 million was short-term backlog, respectively. We expect that the amount of backlog may change from year-to-year for several reasons, including billing cycles, timing of customer renewals, remaining duration of arrangement, and the timing of when unbilled deferred revenue is to be recognized as revenues. For multi-year subscription agreements, the associated backlog is typically high at the beginning of the contract period, zero immediately prior to expiration and increases if the agreement is renewed. Low backlog attributable to a particular subscription agreement is typically associated with an impending renewal and is not an indicator of the likelihood of renewal or future revenue of that customer. Accordingly, we expect that the amount of backlog may change from year to year depending in part upon the number of subscription agreements in particular stages in their renewal cycle. Such fluctuations are not reliable indicators of future revenues.
Cost of Revenues
Our total cost of revenues is comprised of the following:
License and Implementation
Cost of license and implementation revenues includes costs related to the implementation of our on premiseon-premise solutions. Cost of license and implementation revenues primarily consists of personnel-related costs including salary, bonus, stock-based compensation, and overhead allocation as well as third-party contractorscontractor costs and royalty fees paid to third parties for rights to their intellectual property. Cost of license and implementation revenues may vary from period to period depending on a number of factors, including the amount of implementation services required to deploy our solutions and the level of involvement of third-party contractors providing implementation services. We expect our cost of license and implementation revenues for fiscal year 2018 to be lower in absolute dollars from those recorded in fiscal 2017.
SaaS and Maintenance
Cost of SaaS and maintenance revenues includes those costs related to the implementation of our cloud-based solutions, maintenance and support and applicationmanaged support services for our on premise solutions, revenue management as a service, training and training.customer-
reimbursed expenses. Cost
of SaaS and maintenance revenues primarily consists of personnel-related costs including salary, customer reimbursable expense, bonus, stock-based compensation, LeapFrogRx compensation charges and overhead allocation, third-party contractors,royalty, facility expense, amortization of costs recorded on internally developedintangible assets and depreciation related to server equipment and capitalized software, reimbursable expenses, third-party contractors and data center-related expenses. We believe that cost of SaaS and maintenance revenues will continue to increase in absolute dollars as we continue to focus on building infrastructure for our cloud-based solutions.sell more products.
Operating Expenses
Our operating expenses consist of research and development, sales and marketing and general and administrative expenses.
Research and Development
Our research and development expenses consist primarily of personnel-related costs including salary, bonus, stock-based compensation and overhead allocation as well as third-party contractors and travel-related expenses. Our software development costs for new software solutions and enhancements to existing software solutions are generally expensed as incurred. However,In the past, we capitalizecapitalized development costs incurred in connection with the development of certain additional service offerings that will only be offered through the cloud.new cloud-based services. As of September 30, 2014,2017, the net book value of capitalized software development costs was $3.8 million, of which $3.4 million is related to the software that was made available for use by our customers in fiscal year 2014. The remaining amount of $0.4 million relates to the development of a product that is not completed as of September 30, 2014.$1.9 million. We expect our research and development expenses to increasedecrease in absolute dollars as we continue to develop new applications and enhance our existing software solutions.fiscal year 2018 from those recorded in fiscal year 2017.
Sales and Marketing
Our sales and marketing expenses consist primarily of personnel-related costs including salary, bonus, commissions, stock-based compensation, and overhead allocation as well as third-party contractors,amortization of intangible assets, travel-related expenses and marketing programs. For fiscal year 2014, weWe recognize sales commission expense upon the booking of a contract, while we recognize revenue over the period services were provided. We expect our sales and marketing expenses to increasebe flat to marginally higher in absolute dollars as we continue to investfiscal year 2018 from those recorded in our sales and marketing organization, increase the number of our sales and marketing employees and increase market program spend to grow in our business.fiscal 2017.
General and Administrative
Our general and administrative expenses consist primarily of personnel-related costs including salary, bonus, stock-based compensation, and overhead allocation, audit and legal fees as well as third-party contractors, facilities and travel-related expenses. We expect our general and administrative expense to continue to incur significant accounting and legal costs related to being a public company, as well as insurance, investor relations and other costs.
LeapFrogRx Compensation Charges
In January 2012, we acquired LeapFrogRx for initial cash consideration of $3.0 million as well as potential additional payments to former LeapFrogRx stockholders totaling up to $8.3 million, which are expected to be incurred through January 2015. These additional payments are, among other things, subject to future continued employment and are therefore considered compensatorydecrease in nature and are being recognized as compensation expense (LeapFrogRx compensation charges) over the term of each component. As of September 30, 2014 we had expensed an aggregate of $6.1 million of LeapFrogRx compensation charges.
Accounting Pronouncements
For a summary of recent accounting pronouncements with application to our consolidated financial statements see Note 1 to the Consolidated Financial Statementsfiscal year 2018 from those recorded in Item 8, which is incorporated herein by reference.fiscal year 2017.
Results of Operations
The following tables set forth our consolidated results of operations for the periods presented and as a percentage of our total revenues for those periods. The period-to-period comparison of financial results is not necessarily indicative of financial results to be achieved in future periods.
| Fiscal Years Ended September 30, | �� | Fiscal Years Ended September 30, |
| |||||||||||||||||||||
| 2014 | 2013 | 2012 |
| 2017 |
|
| 2016 |
|
| 2015 |
| |||||||||||||
| (in thousands, except per share data) |
| (in thousands) |
| |||||||||||||||||||||
Consolidated Statements of Operations Data: |
|
|
|
|
|
|
|
|
|
|
|
| ||||||||||||
Revenues: |
|
|
|
|
|
|
|
|
|
|
|
| ||||||||||||
License and implementation | $ | 35,333 | $ | 59,134 | $ | 49,756 |
| $ | 23,114 |
|
| $ | 20,579 |
|
| $ | 36,172 |
| ||||||
SaaS and maintenance | 46,423 | 42,770 | 34,502 |
|
| 108,055 |
|
|
| 86,392 |
|
|
| 57,596 |
| |||||||||
|
|
| ||||||||||||||||||||||
Total revenues | 81,756 | 101,904 | 84,258 |
|
| 131,169 |
|
|
| 106,971 |
|
|
| 93,768 |
| |||||||||
|
|
| ||||||||||||||||||||||
Cost of Revenues: |
|
|
|
|
|
|
|
|
|
|
|
| ||||||||||||
License and implementation(1) | 16,652 | 26,832 | 22,483 | |||||||||||||||||||||
SaaS and maintenance(1) | 21,092 | 19,350 | 18,053 | |||||||||||||||||||||
|
|
| ||||||||||||||||||||||
License and implementation |
|
| 14,224 |
|
|
| 12,976 |
|
|
| 15,555 |
| ||||||||||||
SaaS and maintenance |
|
| 46,872 |
|
|
| 40,717 |
|
|
| 26,014 |
| ||||||||||||
Total cost of revenues | 37,744 | 46,182 | 40,536 |
|
| 61,096 |
|
|
| 53,693 |
|
|
| 41,569 |
| |||||||||
|
|
| ||||||||||||||||||||||
Gross profit | 44,012 | 55,722 | 43,722 |
|
| 70,073 |
|
|
| 53,278 |
|
|
| 52,199 |
| |||||||||
Operating Expenses: |
|
|
|
|
|
|
|
|
|
|
|
| ||||||||||||
Research and development(1) | 18,710 | 16,772 | 17,695 | |||||||||||||||||||||
Sales and marketing(1) | 25,998 | 21,144 | 19,640 | |||||||||||||||||||||
General and administrative(1) | 19,671 | 16,063 | 10,584 | |||||||||||||||||||||
Restructuring | 26 | 1,215 | — | |||||||||||||||||||||
|
|
| ||||||||||||||||||||||
Research and development |
|
| 31,064 |
|
|
| 23,706 |
|
|
| 17,906 |
| ||||||||||||
Sales and marketing |
|
| 41,339 |
|
|
| 32,261 |
|
|
| 30,300 |
| ||||||||||||
General and administrative |
|
| 36,281 |
|
|
| 30,051 |
|
|
| 23,132 |
| ||||||||||||
Total operating expenses | 64,405 | 55,194 | 47,919 |
|
| 108,684 |
|
|
| 86,018 |
|
|
| 71,338 |
| |||||||||
|
|
| ||||||||||||||||||||||
(Loss) income from operations | (20,393 | ) | 528 | (4,197 | ) | |||||||||||||||||||
Interest (income) expense, net | (12 | ) | 357 | 655 | ||||||||||||||||||||
Other expenses, net | 116 | 658 | 540 | |||||||||||||||||||||
|
|
| ||||||||||||||||||||||
Loss from operations |
|
| (38,611 | ) |
|
| (32,740 | ) |
|
| (19,139 | ) | ||||||||||||
Interest (expense) income, net |
|
| 4,159 |
|
|
| (50 | ) |
|
| (6 | ) | ||||||||||||
Other (income) expenses, net |
|
| 62 |
|
|
| 86 |
|
|
| (22 | ) | ||||||||||||
Loss before income taxes | (20,497 | ) | (487 | ) | (5,392 | ) |
|
| (42,832 | ) |
|
| (32,776 | ) |
|
| (19,111 | ) | ||||||
Provision for income taxes | 384 | 439 | 301 | |||||||||||||||||||||
|
|
| ||||||||||||||||||||||
(Benefit) provision for income taxes |
|
| (3,285 | ) |
|
| 335 |
|
|
| 528 |
| ||||||||||||
Net loss | $ | (20,881 | ) | $ | (926 | ) | $ | (5,693 | ) |
| $ | (39,547 | ) |
| $ | (33,111 | ) |
| $ | (19,639 | ) | |||
|
|
| ||||||||||||||||||||||
| Fiscal Years Ended September 30, | ||||||||||||
| 2014 | 2013 | 2012 | ||||||||||
| (in thousands) | ||||||||||||
Cost of revenues: | ||||||||||||
License and implementation | $ | 905 | $ | 591 | $ | 298 | ||||||
SaaS and maintenance | 749 | 622 | 561 | |||||||||
Operating expenses: | ||||||||||||
Research and development | 1,278 | 747 | 297 | |||||||||
Sales and marketing | 2,789 | 1,687 | 1,103 | |||||||||
General and administrative | 4,228 | 1,209 | 262 | |||||||||
|
|
|
|
|
| |||||||
Stock-based compensation in operating (loss) income | $ | 9,949 | $ | 4,856 | $ | 2,521 | ||||||
|
|
|
|
|
| |||||||
Revenues: License and implementation SaaS and maintenance Total revenues Cost of Revenues: License and implementation SaaS and maintenance Total cost of revenues Total cost of revenues Gross profit Operating Expenses: Research and development Sales and marketing General and administrative Restructuring Total operating expenses (Loss) income from operations Interest (income) expense, net Other expenses, net Loss before income taxes Provision for income taxes Net loss Fiscal Years Ended September 30, 2014 2013 2012 43 % 58 % 59 % 57 42 41 100 100 100 20 26 27 26 19 21 46 45 48 54 55 52 23 17 21 32 21 23 24 16 13 — 1 — 79 55 57 (25 ) — (5 ) — — 1 — 1 1 (25 ) (1 ) (7 ) 1 — — (26 )% (1 )% (7 )%
Comparison of the Fiscal Years Ended September 30, 20142017 and 20132016
Revenues
|
| Fiscal Years Ended September 30, |
|
|
|
|
|
|
|
|
|
| |||||||||||||||||||||||||||||||||||||||
| 2017 |
|
|
| 2016 |
|
|
|
|
|
|
|
|
|
| ||||||||||||||||||||||||||||||||||||
| Fiscal Years Ended September 30, |
|
|
|
|
| % of |
|
|
|
|
|
| % of |
|
|
|
|
|
|
|
|
|
| ||||||||||||||||||||||||||||
| 2014 | 2013 | Change |
|
|
|
|
| Total |
|
|
|
|
|
| Total |
|
| Change |
|
| |||||||||||||||||||||||||||||||
| Amount | % of Total Revenues | Amount | % of Total Revenues | ($) | (%) |
| Amount |
|
| Revenues |
|
| Amount |
|
| Revenues |
|
| ($) |
|
| (%) |
|
| |||||||||||||||||||||||||||
| (in thousands, except percentages) |
| (in thousands, except percentages) |
|
| |||||||||||||||||||||||||||||||||||||||||||||||
Revenues: |
|
|
|
|
|
|
|
|
|
|
|
|
|
|
|
|
|
|
|
|
|
|
|
|
| ||||||||||||||||||||||||||
License and implementation | $ | 35,333 | 43 | % | $ | 59,134 | 58 | % | $ | (23,801 | ) | (40 | )% |
| $ | 23,114 |
|
|
| 18 |
| % |
| $ | 20,579 |
|
|
| 19 |
| % |
| $ | 2,535 |
|
|
| 12 |
| % | |||||||||||
SaaS and maintenance | 46,423 | 57 | 42,770 | 42 | 3,653 | 9 | % |
|
| 108,055 |
|
|
| 82 |
|
|
| 86,392 |
|
|
| 81 |
|
|
| 21,663 |
|
|
| 25 |
|
| |||||||||||||||||||
|
|
|
|
|
| ||||||||||||||||||||||||||||||||||||||||||||||
Total revenues | $ | 81,756 | 100 | % | $ | 101,904 | 100 | % | $ | (20,148 | ) | (20 | )% |
| $ | 131,169 |
|
|
| 100 |
| % |
| $ | 106,971 |
|
|
| 100 |
| % |
| $ | 24,198 |
|
|
| 23 |
| % | |||||||||||
|
|
|
|
|
| ||||||||||||||||||||||||||||||||||||||||||||||
License and Implementation
License and implementation revenues decreased $23.8increased $2.5 million, or 40%12%, to $35.3$23.1 million for the fiscal year ended September 30, 20142017 from $59.1$20.6 million for the fiscal year ended September 30, 2013. 2016. As a percentage to total revenues, license and implementation revenue decreased from 19% to 18%. The decrease in these revenues as a percentage of total revenue was primarily due to a reductionfewer sales of perpetual licenses and related implementation services as we shifted our business model towards cloud-based solutions and stopped selling perpetual licenses. The increase in sales volume, whichrevenue in absolute dollars was primarily due to sales execution challenges andthe revenue attributable from the acquisition of Revitas, which historically prior to our continued dependence onacquisition derived a relatively small number of customers for a significantgreater portion of our revenues. We made progress in improving our sales execution over recent fiscal quarters and we expect to continue to improve into fiscal year 2015.
SaaS and Maintenance
SaaS and maintenance revenues increased $3.7$21.7 million, or 9%25%, to $46.4$108.1 million for the fiscal year ended September 30, 20142017 from $42.8$86.4 million for the fiscal year ended September 30, 2013.2016. The increase in these revenues was primarily due to the revenue attributable from the acquisition of Revitas on January 5, 2017 as well as continued growth in our SaaS business. The increase in our SaaS and maintenance revenues included a $12.5 million increase in our SaaS subscription revenues, a $8.8 million increase in our maintenance and support and managed support services revenues, and $0.4 million in our training and customer reimbursable expense. We intend to focus on growing our recurring revenue from SaaS and maintenance in future periods and also as a percentage of total revenues.
Cost of Revenues
|
| Fiscal Years Ended September 30, |
|
|
|
|
|
|
|
|
|
|
| ||||||||||||||
|
| 2017 |
|
|
| 2016 |
|
|
|
|
|
|
|
|
|
|
| ||||||||||
|
|
|
|
|
| % of |
|
|
|
|
|
|
| % of |
|
|
| Change |
|
| |||||||
|
| Amount |
|
| Revenues |
|
|
| Amount |
|
| Revenues |
|
|
| ($) |
|
| (%) |
|
| ||||||
|
| (in thousands, except percentages) |
|
| |||||||||||||||||||||||
Cost of revenues |
|
|
|
|
|
|
|
|
|
|
|
|
|
|
|
|
|
|
|
|
|
|
|
|
|
|
|
License and implementation |
| $ | 14,224 |
|
|
| 62 |
| % |
| $ | 12,976 |
|
|
| 63 |
| % |
| $ | 1,248 |
|
|
| 10 |
| % |
SaaS and maintenance |
|
| 46,872 |
|
|
| 43 |
|
|
|
| 40,717 |
|
|
| 47 |
|
|
|
| 6,155 |
|
|
| 15 |
|
|
Total cost of revenues |
| $ | 61,096 |
|
|
| 47 |
| % |
| $ | 53,693 |
|
|
| 50 |
| % |
| $ | 7,403 |
|
|
| 14 |
| % |
|
|
|
|
|
|
|
|
|
|
|
|
|
|
|
|
|
|
|
|
|
|
|
|
|
|
|
|
Gross profit |
|
|
|
|
|
|
|
|
|
|
|
|
|
|
|
|
|
|
|
|
|
|
|
|
|
|
|
License and implementation |
| $ | 8,890 |
|
|
| 38 |
| % |
| $ | 7,603 |
|
|
| 37 |
| % |
| $ | 1,287 |
|
|
| 17 |
| % |
SaaS and maintenance |
|
| 61,183 |
|
|
| 57 |
|
|
|
| 45,675 |
|
|
| 53 |
|
|
|
| 15,508 |
|
|
| 34 |
|
|
Total gross profit |
| $ | 70,073 |
|
|
| 53 |
| % |
| $ | 53,278 |
|
|
| 50 |
| % |
| $ | 16,795 |
|
|
| 32 |
| % |
License and Implementation
Cost of license and implementation revenues increased $1.2 million, or 10%, to $14.2 million during the fiscal year ended September 30, 2017 from $13.0 million for the fiscal year ended September 30, 2016 due to the increase in related revenue. As a percentage of revenue, cost of license and implementation revenues decreased to 62% in fiscal year 2017 from 63% in fiscal year 2016. The decrease in these costs as a percentage of total revenues was primarily due to a more favorable mix of services engagements, partially offset by an increase in the accelerated amortization of a prepaid royalty agreement resulting from a shift to cloud-based solutions.
SaaS and Maintenance
Cost of SaaS and maintenance revenues increased $6.2 million, or 15%, to $46.9 million during the fiscal year ended September 30, 2017 from $40.7 million for the fiscal year ended September 30, 2016. As a percentage of SaaS and maintenance revenues, cost of SaaS and maintenance revenues decreased from 47% to 43% in fiscal year 2017. The decreases in costs as a percentage of revenue were driven by our increased ability to drive efficiencies and synergies associated with the acquisition of Revitas and the increase in efficiencies as we continuously modernize our cloud platform.
|
| Fiscal Years Ended September 30, |
|
|
|
|
|
|
|
|
|
| |||||
|
| 2017 |
|
| 2016 |
|
| Change |
|
| |||||||
|
| Amount |
|
| Amount |
|
| ($) |
|
| (%) |
|
| ||||
|
| (in thousands, except percentages) |
|
| |||||||||||||
Operating expenses: |
|
|
|
|
|
|
|
|
|
|
|
|
|
|
|
|
|
Research and development |
| $ | 31,064 |
|
| $ | 23,706 |
|
| $ | 7,358 |
|
|
| 31 |
| % |
Sales and marketing |
|
| 41,339 |
|
|
| 32,261 |
|
|
| 9,078 |
|
|
| 28 |
|
|
General and administrative |
|
| 36,281 |
|
|
| 30,051 |
|
|
| 6,230 |
|
|
| 21 |
|
|
Total operating expenses |
| $ | 108,684 |
|
| $ | 86,018 |
|
| $ | 22,666 |
|
|
| 26 |
| % |
Research and Development
Research and development expenses increased by $7.4 million, or 31%, to $31.1 million during the fiscal year ended September 30, 2017 from $23.7 million for the fiscal year ended September 30, 2016. Employee related expenses increased $4.1 million due to severance, salaries, bonus and stock-based compensation. We also had a $0.9 million increase in consulting costs, $0.8 million increases software-related costs, an $1.3 million increase in costs that had been previously capitalized, and a $0.3 million increase in travel and entertainment expense and other costs.
Sales and Marketing
Sales and marketing expenses increased by $9.1 million, or 28%, to $41.3 million during the fiscal year ended September 30, 2017 from $32.3 million for the fiscal year ended September 30, 2016. Employee-related expenses increased $6.4 million due to severance and commissions, bonus and salaries as a result of increased headcount. We also had a $2.5 million increase of amortization expense related to intangible assets and an $0.7 million increase in marketing program, facility and equipment related expense, partially offset by decrease in $0.5 million consulting cost, travel and entertainment expense and other costs.
General and Administrative
General and administrative expenses increased by $6.2 million, or 21%, to $36.3 million during the fiscal year ended September 30, 2017 from $30.1 million for the fiscal year ended September 30, 2016. Employee-related costs increased $3.2 million dues to severance and increased headcount, inclusive of transitional employees, related to our acquisition of Revitas. We also had an $1.0 million increased in facility costs, $0.6 million increased in consulting costs and a $1.4 million increase in depreciation and other expenses.
Interest and Other (Income) Expense, Net
|
| Fiscal Years Ended September 30, |
|
|
|
|
|
|
|
|
|
| |||||
|
| 2017 |
|
| 2016 |
|
| Change |
|
| |||||||
|
| Amount |
|
| Amount |
|
| ($) |
|
| (%) |
|
| ||||
|
| (in thousands, except percentages) |
|
| |||||||||||||
Interest (income) expense, net |
| $ | 4,159 |
|
| $ | (50 | ) |
| $ | 4,209 |
|
|
| (8,418 | ) | % |
Other (income) expense, net |
| $ | 62 |
|
| $ | 86 |
|
| $ | (24 | ) |
|
| (28 | ) | % |
Interest expense increased $4.4 million during fiscal year 2017 primarily due to borrowings in January 2017 in connection with the acquisition of Revitas as described in the Notes to the Consolidated Financial Statement, partially offset by $0.2 million interest income.
Change in other (income) expenses, net was immaterial and primarily related to currency fluctuation.
Provision (Benefit) for Income Taxes
|
| Fiscal Years Ended September 30, |
|
|
|
|
|
|
|
|
|
| |||||
|
| 2017 |
|
| 2016 |
|
| Change |
|
| |||||||
|
| Amount |
|
| Amount |
|
| ($) |
|
| (%) |
|
| ||||
|
| (in thousands, except percentages) |
|
| |||||||||||||
Provision (benefit) for income taxes |
| $ | (3,285 | ) |
| $ | 335 |
|
| $ | (3,620 | ) |
|
| (1,081 | ) | % |
The change in income tax provision is primarily due to a discrete tax benefit of $4.2 million recorded in the second quarter of fiscal 2017. The discrete item is a result of releasing a portion of our valuation allowance resulting from the acquisition of Revitas.
Comparison of the Fiscal Years Ended September 30, 2016 and 2015
Revenues
|
| Fiscal Years Ended September 30, |
|
|
|
|
|
|
|
|
|
|
| ||||||||||||||
|
| 2016 |
|
|
| 2015 |
|
|
|
|
|
| |||||||||||||||
|
|
|
|
|
| % of |
|
|
|
|
|
|
| % of |
|
|
|
|
|
|
|
|
|
|
| ||
|
|
|
|
|
| Total |
|
|
|
|
|
|
| Total |
|
|
| Change |
|
| |||||||
|
| Amount |
|
| Revenues |
|
|
| Amount |
|
| Revenues |
|
|
| ($) |
|
| (%) |
|
| ||||||
|
| (in thousands, except percentages) |
|
| |||||||||||||||||||||||
Revenues: |
|
|
|
|
|
|
|
|
|
|
|
|
|
|
|
|
|
|
|
|
|
|
|
|
|
|
|
License and implementation |
| $ | 20,579 |
|
|
| 19 |
| % |
| $ | 36,172 |
|
|
| 39 |
| % |
| $ | (15,593 | ) |
|
| (43 | ) | % |
SaaS and maintenance |
|
| 86,392 |
|
|
| 81 |
|
|
|
| 57,596 |
|
|
| 61 |
|
|
|
| 28,796 |
|
|
| 50 |
|
|
Total revenues |
| $ | 106,971 |
|
|
| 100 |
| % |
| $ | 93,768 |
|
|
| 100 |
| % |
| $ | 13,203 |
|
|
| 14 |
| % |
License and Implementation
License and implementation revenues decreased $15.6 million, or 43%, to $20.6 million for the fiscal year ended September 30, 2016 from $36.2 million for the fiscal year ended September 30, 2015. As a percentage to total revenues, license and implementation revenue decreased from 39% to 19%. The decrease in these revenues as a percentage of revenues and in absolute dollars was primarily due to fewer sales of software licenses for our on-premise solutions and related implementation services in fiscal year 2016, as our business model continued to focus on sales of our cloud-based solutions in fiscal year 2016.
SaaS and Maintenance
SaaS and maintenance revenues increased $28.8 million, or 50%, to $86.4 million for the fiscal year ended September 30, 2016 from $57.6 million for the fiscal year ended September 30, 2015. The increase in SaaS and maintenance revenues was primarily driven by an increase in the number of $3.5subscription contracts and included a $18.9 million increase in application support revenuesour SaaS and $0.9 million inRevenue Cloud subscription revenue, primarily due to ana $6.9 million increase in number of customers. These increases were primarily offset by decrease of $0.8revenue from channel data management, a $1.2 million increase in revenues from RMaaS, and a $1.8 million increase in ourmaintenance and support, managed support services revenues, training and customer reimbursable expenses due to less travel and other expenses incurred on customer projects.expense. We intend to focus on growing our recurring revenue from SaaS and maintenance year over yearin future periods and also as a percentage of total revenues.
Cost of Revenues
| Fiscal Years Ended September 30, |
|
|
| |||||||||||||||||||||||||||||||||||||||||||||||
| Fiscal Years Ended September 30, |
| 2016 |
|
|
| 2015 |
|
|
|
|
|
|
|
|
|
| |||||||||||||||||||||||||||||||||||
| 2014 | 2013 | Change |
|
|
|
|
| % of |
|
|
|
|
|
| % of |
|
| Change |
|
| |||||||||||||||||||||||||||||||
| Amount | % of Revenues | Amount | % of Revenues | ($) | (%) |
| Amount |
|
| Revenues |
|
| Amount |
|
| Revenues |
|
| ($) |
|
| (%) |
|
| |||||||||||||||||||||||||||
| (in thousands, except percentages) |
| (in thousands, except percentages) |
|
| |||||||||||||||||||||||||||||||||||||||||||||||
Cost of Revenues: | |||||||||||||||||||||||||||||||||||||||||||||||||||
Cost of revenues |
|
|
|
|
|
|
|
|
|
|
|
|
|
|
|
|
|
|
|
|
|
|
|
|
| ||||||||||||||||||||||||||
License and implementation | $ | 16,652 | 47 | % | $ | 26,832 | 45 | % | $ | (10,180 | ) | (38 | )% |
| $ | 12,976 |
|
|
| 63 |
| % |
| $ | 15,555 |
|
|
| 43 |
| % |
| $ | (2,579 | ) |
|
| (17 | ) | % | |||||||||||
SaaS and maintenance | 21,092 | 45 | 19,350 | 45 | 1,742 | 9 | % |
|
| 40,717 |
|
|
| 47 |
|
|
| 26,014 |
|
|
| 45 |
|
|
| 14,703 |
|
|
| 57 |
|
| |||||||||||||||||||
|
|
|
|
|
| ||||||||||||||||||||||||||||||||||||||||||||||
Total cost of revenues | $ | 37,744 | 46 | % | $ | 46,182 | 45 | % | $ | (8,438 | ) | (18 | )% |
| $ | 53,693 |
|
|
| 50 |
| % |
| $ | 41,569 |
|
|
| 44 |
| % |
| $ | 12,124 |
|
|
| 29 |
| % | |||||||||||
|
|
|
|
|
|
|
|
|
|
|
|
|
|
|
|
|
|
|
|
|
|
|
|
|
|
|
|
|
|
| |||||||||||||||||||||
Gross profit |
|
|
|
|
|
|
|
|
|
|
|
|
|
|
|
|
|
|
|
|
|
|
|
|
| ||||||||||||||||||||||||||
License and implementation | $ | 18,681 | 53 | % | $ | 32,302 | 55 | % | $ | (13,621 | ) | (42 | )% |
| $ | 7,603 |
|
|
| 37 |
| % |
| $ | 20,617 |
|
|
| 57 |
| % |
| $ | (13,014 | ) |
|
| (63 | ) | % | |||||||||||
SaaS and maintenance | 25,331 | 55 | 23,420 | 55 | 1,911 | 8 |
|
| 45,675 |
|
|
| 53 |
|
|
| 31,582 |
|
|
| 55 |
|
|
| 14,093 |
|
|
| 45 |
|
| ||||||||||||||||||||
|
|
|
|
|
| ||||||||||||||||||||||||||||||||||||||||||||||
| $ | 44,012 | 54 | % | $ | 55,722 | 55 | % | $ | (11,710 | ) | (21 | )% | |||||||||||||||||||||||||||||||||||||||
|
|
|
|
|
| ||||||||||||||||||||||||||||||||||||||||||||||
Total gross profit |
| $ | 53,278 |
|
|
| 50 |
| % |
| $ | 52,199 |
|
|
| 56 |
| % |
| $ | 1,079 |
|
|
| 2 |
| % | ||||||||||||||||||||||||
License and Implementation
Cost of license and implementation revenues decreased $10.2$2.6 million, or 38%17%, to $16.7$13.0 million during the fiscal year ended September 30, 20142016 from $26.8$15.6 million for the fiscal year ended September 30, 2013. The decrease was primarily the result of a $7.2 million reduction in personnel costs primarily associated with our workforce reduction and a $3.2 million reduction in third-party contractors costs.2015. As a percentage of revenue, cost of license and implementation revenues increased to 47%63% in fiscal year 20142016 from 45%43% in fiscal year 2013, 2015. The increase in cost of revenue as a percentage of revenue was primarily due to the sale of fewer software licenses for our on-premise solutions. The cost of revenues recognized in fiscal year 2016 was primarily from the sale of standalone professional services which has a decrease in license and implementation revenues.lower margin than sales of licenses.
SaaS and Maintenance
Cost of SaaS and maintenance revenues increased $1.7$14.7 million, or 9%57%, to $21.1$40.7 million during the fiscal year ended September 30, 20142016 from $19.4$26.0 million for the fiscal year ended September 30, 2013. 2015. As a percentage of SaaS and maintenance revenues, cost of SaaS and maintenance revenues increased slightly from 45% to 47% in fiscal year 2016. The increase in SaaS and maintenance cost during the period was primarily due to $1.7 of million amortization costs recorded on internally developed software capitalizedan increase in the fiscal year 2013our SaaS and a $0.5 millionmaintenance revenues. This increase in these revenues resulted in an increase in personnel costs, partially offset by a $0.5 million decrease in customer reimbursable expenses and certain other related costs.
Operating Expenses
| Fiscal Years Ended September 30, | ||||||||||||||||
| 2014 | 2013 | |||||||||||||||
| Amount | Amount | ($) | (%) | |||||||||||||
| (in thousands, except percentages) | ||||||||||||||||
Operating Expenses: | ||||||||||||||||
Research and development | $ | 18,710 | $ | 16,772 | $ | 1,938 | 12 | % | ||||||||
Sales and marketing | 25,998 | 21,144 | 4,854 | 23 | ||||||||||||
General and administrative | 19,671 | 16,063 | 3,608 | 22 | ||||||||||||
Restructuring | 26 | 1,215 | (1,189 | ) | (98 | ) | ||||||||||
|
|
|
|
|
| |||||||||||
Total operating expenses | $ | 64,405 | $ | 55,194 | $ | 9,211 | 17 | % | ||||||||
|
|
|
|
|
| |||||||||||
Operating Expenses
|
| Fiscal Years Ended September 30, |
|
|
|
|
|
|
|
|
|
| |||||
|
| 2016 |
|
| 2015 |
|
| Change |
|
| |||||||
|
| Amount |
|
| Amount |
|
| ($) |
|
| (%) |
|
| ||||
|
| (in thousands, except percentages) |
|
| |||||||||||||
Operating expenses: |
|
|
|
|
|
|
|
|
|
|
|
|
|
|
|
|
|
Research and development |
| $ | 23,706 |
|
| $ | 17,906 |
|
| $ | 5,800 |
|
|
| 32 |
| % |
Sales and marketing |
|
| 32,261 |
|
|
| 30,300 |
|
|
| 1,961 |
|
|
| 6 |
|
|
General and administrative |
|
| 30,051 |
|
|
| 23,132 |
|
|
| 6,919 |
|
|
| 30 |
|
|
Total operating expenses |
| $ | 86,018 |
|
| $ | 71,338 |
|
| $ | 14,680 |
|
|
| 21 |
| % |
Research and Development
Research and development expenses increased by $1.9$5.8 million, or 12%32%, to $18.7$23.7 million during the fiscal year ended September 30, 20142016 from $16.8$17.9 million for the fiscal year ended September 30, 2013 due to an increase in employee-related costs as we capitalized a higher amount of costs incurred in connection with internally-developed software in fiscal year 2013. For the fiscal year 2014, the2015. The increase was primarily due to a $2.0$2.1 million increase in personnelemployee related costs due to an increase in headcount, a $1.0 million increase in consulting costs paid to third party consultants, a $1.0 million increase in software and equipment related costs, a $0.3 million increase in travel costs and a $0.5$1.4 million increase in stock-based compensation expenses, mainly due to decrease inthe costs that were capitalized in connection with the development of internally-developed software partially offset by a reduction of $0.3 millionwhich was previously capitalized in consulting costs.fiscal year 2015.
Sales and Marketing
Sales and marketing expenses increased by $4.9$2.0 million, or 23%6%, to $26.0$32.3 million during the fiscal year ended September 30, 20142016 from $21.1$30.3 million for the fiscal year ended September 30, 2013. The2015. This increase was primarily the result of andue to a $1.3 million increase of $4.0in employee related costs resulting from increased headcount, a $0.2 million increase in both personnelmarketing related activities, a $0.4 million increase in travel and other costs, asand a result of our effort to expand our sales and marketing team and increases$0.4 million increase in sales commission. Furtheramortization expense, partially offset by a $0.3 million decrease in fiscal year 2013, we capitalized an incremental cost of $1.1 million in connection with internally developed software.consulting costs.
General and Administrative
General and administrative expenses increased by $3.6$7.0 million, or 22%30%, to $19.7$30.1 million during the fiscal year ended September 30, 20142016 from $16.1$23.1 million for the fiscal year ended September 30, 2013. This2015. The increase was dueprimarily to higher employee related costs of $3.8 million resulting from increased headcount, third party contractor costs of $2.3 million, equipment related costs of $0.2 million and facility costs and other costs of $0.5 million mainly due to higher employee-relatedrent for office lease and travel costs of $3.4 million, mainly associated with stock-based compensation expense of $3.0 million, an increase of $0.3 million$0.2 million. These increases are in office expense (primarily insurance), an increase of $0.3 million in equipment costs mainly associated withpart driven by our Channel Data Management business, which we acquired on October 30, 2015, and the purchase of software licenses.additions to our executive team.
Restructuring
On September 30, 2013, we announced a plan to align our workforce with our strategic initiatives. This plan was completed by December 31, 2013 and resulted in a reduction in the size of our workforce, primarily in professional services. Restructuring charges for the fiscal year ended September 30. 2014 were approximately $26,000 as compared to $1.2 million for the fiscal year ended September 30, 2013.
Interest and Other Expense, Net
| Fiscal Years Ended September 30, | ||||||||||||||||
| 2014 | 2013 | |||||||||||||||
| Amount | Amount | ($) | (%) | |||||||||||||
| (in thousands, except percentages) | ||||||||||||||||
Interest (income) expense, net | $ | (12 | ) | $ | 357 | $ | (369 | ) | (103 | )% | ||||||
Other expenses, net | 116 | 658 | (542 | ) | (82 | ) | ||||||||||
|
| Fiscal Years Ended September 30, |
|
|
|
|
|
|
|
|
|
| |||||
|
| 2016 |
|
| 2015 |
|
| Change |
|
| |||||||
|
| Amount |
|
| Amount |
|
| ($) |
|
| (%) |
|
| ||||
|
| (in thousands, except percentages) |
|
| |||||||||||||
Interest income |
| $ | (50 | ) |
| $ | (6 | ) |
| $ | (44 | ) |
|
| 733 |
| % |
Other (income) expense, net |
| $ | 86 |
|
| $ | (22 | ) |
| $ | 108 |
|
|
| (491 | ) | % |
For fiscal year 2014, interest (income) expense, netInterest income primarily related to interest income earned from our invested cash, net of financing costsbank service charges.
Other (income) expenses, net primarily related to currency fluctuation recorded for our capital leases. The decrease in interest expense, net in the fiscal year ended September 30, 2014 as compared to same period the previous year was primarily due to the repayment in full of our term loan in May 2013 and continued repayment of existing capital leases.foreign operations.
Other expense, net decreased primarily due a $0.7 million re-measurement in the fair value of a convertible preferred stock warrant during the fiscal year ended September 30, 2013, partially offset by a $0.1 million foreign exchange gain.
Provision for Income Taxes
| Fiscal Years Ended September 30, | ||||||||||||||||
| 2014 | 2013 | |||||||||||||||
| Amount | Amount | ($) | (%) | |||||||||||||
| (in thousands, except percentages) | ||||||||||||||||
Provision for income taxes | $ | 384 | $ | 439 | $ | (55 | ) | (13 | )% | |||||||
|
| Fiscal Years Ended September 30, |
|
|
|
|
|
|
|
|
|
| |||||
|
| 2016 |
|
| 2015 |
|
| Change |
|
| |||||||
|
| Amount |
|
| Amount |
|
| ($) |
|
| (%) |
|
| ||||
|
| (in thousands, except percentages) |
|
| |||||||||||||
Provision for income taxes |
| $ | 335 |
|
| $ | 528 |
|
| $ | (193 | ) |
|
| (37 | ) | % |
Provision for income taxes is primarily related to the state minimum tax and foreign tax on our profitable foreign operations. The change in income tax provision is primarily due to the change in income related to our foreign operations.
For the fiscal year ended September 30, 2014, the tax expense computed using the statutory federal tax rate would have been a benefit of $7.0 million as compared to the income tax provision of $0.4 million. The difference was primarily due to the valuation allowance, partially offset by research and development tax credits and state taxes net of federal benefit.
For the fiscal year ended September 30, 2013, the tax expense computed using the statutory federal tax rate would have been a benefit of $0.2 million as compared to the income tax provision of $0.4 million. The difference was primarily due to permanent differences, partially offset by research and development tax credits.
Comparison of the Fiscal Years Ended September 30, 2013 and 2012
Revenues
| Fiscal Years Ended September 30, | ||||||||||||||||||||||||
| 2013 | 2012 | Change | ||||||||||||||||||||||
| Amount | % of Total Revenues | Amount | % of Total Revenues | ($) | (%) | |||||||||||||||||||
| (in thousands, except percentages) | ||||||||||||||||||||||||
Revenues: | ||||||||||||||||||||||||
License and implementation | $ | 59,134 | 58 | % | $ | 49,756 | 59 | % | $ | 9,378 | 19 | % | ||||||||||||
SaaS and maintenance | 42,770 | 42 | 34,502 | 41 | 8,268 | 24 | ||||||||||||||||||
|
|
|
|
|
|
|
|
|
|
|
| |||||||||||||
Total revenues | $ | 101,904 | 100 | % | $ | 84,258 | 100 | % | $ | 17,646 | 21 | % | ||||||||||||
|
|
|
|
|
|
|
|
|
| |||||||||||||||
License and Implementation
License and implementation revenues increased $9.4 million, or 19%, to $59.1 million for the fiscal year ended September 30, 2013 from $49.8 million for the fiscal year ended September 30, 2012. Our revenues from existing customers were $46.6 million for the fiscal year ended September 30, 2013 and $41.9 million for the fiscal year ended September 30, 2012. The increase was due to an increased volume of activity.
SaaS and Maintenance
SaaS and maintenance revenues increased $8.3 million, or 24%, to $42.8 million for the fiscal year ended September 30, 2013 from $34.5 million for the fiscal year ended September 30, 2012. The increase in SaaS and maintenance revenues was primarily driven by an increase of $4.6 million in SaaS revenues. Our maintenance and support, application support and training revenues increased $3.7 million in the period primarily due to an increase in the number of service contracts.
Cost of Revenues
| Fiscal Years Ended September 30, | ||||||||||||||||||||||||
| 2013 | 2012 | Change | ||||||||||||||||||||||
| Amount | % of Revenues | Amount | % of Revenues | ($) | (%) | |||||||||||||||||||
| (in thousands, except percentages) | ||||||||||||||||||||||||
Cost of revenues: | ||||||||||||||||||||||||
License and implementation | $ | 26,832 | 45 | % | $ | 22,483 | 45 | % | $ | 4,349 | 19 | % | ||||||||||||
SaaS and maintenance | 19,350 | 45 | 18,053 | 52 | 1,297 | 7 | ||||||||||||||||||
|
|
|
|
|
| |||||||||||||||||||
Total cost of revenues | $ | 46,182 | 45 | $ | 40,536 | 48 | $ | 5,646 | 14 | |||||||||||||||
|
|
|
|
|
| |||||||||||||||||||
Gross profit: | ||||||||||||||||||||||||
License and implementation | $ | 32,302 | 55 | % | $ | 27,273 | 55 | % | $ | 5,029 | 18 | % | ||||||||||||
SaaS and maintenance | 23,420 | 55 | 16,449 | 48 | 6,971 | 42 | ||||||||||||||||||
|
|
|
|
|
| |||||||||||||||||||
Total gross profit | $ | 55,722 | 55 | $ | 43,722 | 52 | $ | 12,000 | 27 | |||||||||||||||
|
|
|
|
|
| |||||||||||||||||||
License and Implementation
Cost of license and implementation revenues increased $4.3 million, or 19%, to $26.8 million during the fiscal year ended September 30, 2013 from $22.5 million for the fiscal year ended September 30, 2012. This increase was in line with the 19% year-on-year increase in license and implementation revenue during the fiscal year ended September 30, 2013. As a percentage of revenue, cost of license and implementation revenues remained at 45% in fiscal year 2013. The increase in the cost of license and implementation revenue was primarily the result of an increase of $4.7 million in personnel costs due primarily to increased headcount and stock-based compensation expense and a $0.2 million increase in royalty fees paid to third parties, partially offset by a reduction of $0.6 million in outside services, travel and other expenses.
SaaS and Maintenance
Cost of SaaS and maintenance revenues increased $1.3 million, or 7%, to $19.4 million during the fiscal year ended September 30, 2013 from $18.1 million for the fiscal year ended September 30, 2012. This increase was associated with the 24% year-on-year increase in SaaS and maintenance revenue during the fiscal year ended September 30, 2013, which was primarily due to an increase of $0.8 million in third-party contractors, an increase of $0.3 million in personnel costs and other expenses and an increase of $0.2 million in customer reimbursable expenses. As a percentage of revenue, cost of SaaS and maintenance revenues decreased from 52% in fiscal year 2012 to 45% in fiscal year 2013 primarily due to the increase in overall revenues and the relatively fixed nature of certain associated costs.
Operating Expenses
| Fiscal Years Ended September 30, | ||||||||||||||||
| 2013 | 2012 | Change | ||||||||||||||
| Amount | Amount | ($) | (%) | |||||||||||||
| (in thousands, except percentages) | ||||||||||||||||
Operating expenses: | ||||||||||||||||
Research and development | $ | 16,772 | $ | 17,695 | $ | (923 | ) | (5 | )% | |||||||
Sales and marketing | 21,144 | 19,640 | 1,504 | 8 | ||||||||||||
General and administrative | 16,063 | 10,584 | 5,479 | 52 | ||||||||||||
Restructuring | 1,215 | — | 1,215 | |||||||||||||
|
|
|
|
|
| |||||||||||
Total operating expenses | $ | 55,194 | $ | 47,919 | $ | 7,275 | 15 | |||||||||
|
|
|
|
|
| |||||||||||
Research and Development
Research and development expenses decreased by $0.9 million, or 5%, to $16.8 million during the fiscal year ended September 30, 2013 from $17.7 million for the fiscal year ended September 30, 2012. The decrease was primarily the result of an increase of $2.0 million in capitalization of software development costs, partially offset by an increase of $0.5 million in personnel costs due primarily to increased headcount and an increase in stock-based compensation of $0.5 million.
Sales and Marketing
Sales and marketing expenses increased by $1.5 million, or 8%, to $21.1 million during the fiscal year ended September 30, 2013 from $19.6 million for the fiscal year ended September 30, 2012. The increase was primarily the result of an increase of $1.2 million in personnel costs due to increased headcount, an increase of $0.7 million in travel-related expenses, an increase in stock-based compensation of $0.6 million, an increase in third-party contractor expense of $0.3 million and an increase of $0.2 million in expenses related to direct marketing events, partially offset by a reduction of $0.9 million in LeapFrogRx compensation charges and an increase of $0.7 million in capitalization of software development costs.
General and Administrative
General and administrative expenses increased by $5.5 million, or 52%, to $16.1 million during the fiscal year ended September 30, 2013 from $10.6 million for the fiscal year ended September 30, 2012. This increase was primarily due to an increase in personnel costs of $2.7 million due to increased headcount, an increase in third-party contractor expense of $1.2 million (primarily audit fees and legal fees), an increase in stock-based compensation of $0.9 million, an increase in office expense of $0.6 million (primarily insurances), and an increase in depreciation of $0.3 million in line with the increase in property and equipment, partially offset by a reduction of $0.6 million in LeapFrogRx compensation charges.
Restructuring
On September 30, 2013, the Company commenced a plan to align its workforce with the company’s strategic initiatives. This plan is expected to be complete by December 31, 2013 and will result in a reduction in the size of the company’s workforce, primarily in professional services. We intend to hire employees primarily in research and development and sales and marketing to continue to support our strategic initiatives in the future. The Company recorded a workforce reduction restructuring charge of $1.2 million primarily related to employee separation packages, which included severance pay, benefits continuation and outplacement costs to be fully paid through March 31, 2014. There was no corresponding charge for the fiscal year ended September 30, 2012.
Interest and Other Expense, Net
| Fiscal Years Ended September 30, | ||||||||||||||||
| 2013 | 2012 | Change | ||||||||||||||
| Amount | Amount | ($) | (%) | |||||||||||||
| (in thousands, except percentages) | ||||||||||||||||
Interest expense, net | $ | 357 | $ | 655 | $ | (298 | ) | (45 | )% | |||||||
Other expense, net | 658 | 540 | 118 | 22 | ||||||||||||
Interest expense, net primarily relates to financing costs related to our term loan and capital leases. The decrease in interest expense, net in the fiscal year ended September 30, 2013 as compared to same period the previous year was primarily due to the repayment of the term loan in full in May 2013.
Other expense, net increased primarily due to an increase of $0.3 million in changes in the fair value of a convertible preferred stock warrant during the fiscal year ended September 30, 2013 as compared to the fiscal year ended September 30, 2012. Upon the closing of our IPO, the convertible preferred stock warrant automatically converted into a warrant to purchase 86,655 shares of our common stock. In May 2013, the warrant was converted into 71,847 shares of our common stock, net of the warrant price. Therefore, we do not expect to incur other expense, net related to these warrants.
Provision for Income Taxes
| Fiscal Years Ended September 30, | ||||||||||||||||
| 2013 | 2012 | Change | ||||||||||||||
| Amount | Amount | ($) | (%) | |||||||||||||
| (in thousands, except percentages) | ||||||||||||||||
Provision for income taxes | $ | 439 | $ | 301 | $ | 138 | 46 | % | ||||||||
Provision for income taxes is primarily related to the state minimum tax and foreign tax on our profitable foreign operations. The change in income tax provision is primarily due to the change in income related to our foreign operations.
For the fiscal year ended September 30, 2013, the tax expense computed using the statutory federal tax rate would have been a benefit of $0.2 million as compared to the income tax provision of $0.4 million. The difference was primarily due to permanent differences, partially offset by research and development tax credits.
For the fiscal year ended September 30, 2012, the tax expense computed using the statutory federal tax rate would have been a benefit of $1.8 million as compared to the income tax provision of $0.3 million. The difference was primarily due to the valuation allowance, partially offset by research and development tax credits and state taxes net of federal benefit.
Quarterly Results of Operations (Unaudited)
The following table sets forth our unaudited quarterly statements of operations data for the last eight fiscal quarters. The information for each of these quarters has been prepared on the same basis as the audited annual financial statements included elsewhere in this annual report and, in the opinion of management, includes all adjustments, which includes only normal recurring adjustments, necessary for the fair presentation of the results of operations for these periods. This data should be read in conjunction with our audited consolidated financial statements and related notes included elsewhere in this annual report. These quarterly operating results are not necessarily indicative of our operating results for any future period.
| Three Months Ended |
| ||||||||||||||||||||||||||||||||||||||||||||||||||||||||||||||
| Three Months Ended |
| Sep 30, |
|
| Jun 30, |
|
| Mar 31, |
|
| Dec 31, |
|
| Sep 30, |
|
| Jun 30, |
|
| Mar 31, |
|
| Dec 31, |
| ||||||||||||||||||||||||||||||||||||||||
| Dec 31, 2012 | Mar 31, 2013 | Jun 30, 2013 | Sep 30, 2013 | Dec 31, 2013 | Mar 31, 2014 | Jun 30, 2014 | Sep 30, 2014 |
| 2017 |
|
| 2017 |
|
| 2017 |
|
| 2016 |
|
| 2016 |
|
| 2016 |
|
| 2016 |
|
| 2015 |
| |||||||||||||||||||||||||||||||||
| (in thousands, except per share amounts) |
| (in thousands, except per share amounts) |
| |||||||||||||||||||||||||||||||||||||||||||||||||||||||||||||
Revenues: |
|
|
|
|
|
|
|
|
|
|
|
|
|
|
|
|
|
|
|
|
|
|
|
|
|
|
|
|
|
|
|
| ||||||||||||||||||||||||||||||||
License and implementation | $ | 12,462 | $ | 14,481 | $ | 16,419 | $ | 15,772 | $ | 9,530 | $ | 9,846 | $ | 8,073 | $ | 7,884 |
| $ | 5,977 |
|
| $ | 5,714 |
|
| $ | 6,000 |
|
| $ | 5,423 |
|
| $ | 6,075 |
|
| $ | 5,119 |
|
| $ | 4,823 |
|
| $ | 4,562 |
| ||||||||||||||||
SaaS and maintenance | 9,879 | 10,078 | 10,828 | 11,985 | 12,029 | 10,804 | 11,196 | 12,394 |
|
| 29,628 |
|
|
| 28,530 |
|
|
| 27,257 |
|
|
| 22,640 |
|
|
| 22,433 |
|
|
| 22,798 |
|
|
| 21,236 |
|
|
| 19,925 |
| ||||||||||||||||||||||||
|
|
|
|
|
|
|
| |||||||||||||||||||||||||||||||||||||||||||||||||||||||||
Total revenues | 22,341 | 24,559 | 27,247 | 27,757 | 21,559 | 20,650 | 19,269 | 20,278 |
|
| 35,605 |
|
|
| 34,244 |
|
|
| 33,257 |
|
|
| 28,063 |
|
|
| 28,508 |
|
|
| 27,917 |
|
|
| 26,059 |
|
|
| 24,487 |
| ||||||||||||||||||||||||
|
|
|
|
|
|
|
| |||||||||||||||||||||||||||||||||||||||||||||||||||||||||
Cost of Revenues: | ||||||||||||||||||||||||||||||||||||||||||||||||||||||||||||||||
License and implementation(1) | 5,560 | 6,800 | 7,527 | 6,945 | 4,599 | 4,544 | 3,812 | 3,697 | ||||||||||||||||||||||||||||||||||||||||||||||||||||||||
SaaS and maintenance(1) | 4,523 | 4,781 | 4,865 | 5,181 | 5,346 | 5,269 | 5,302 | 5,175 | ||||||||||||||||||||||||||||||||||||||||||||||||||||||||
|
|
|
|
|
|
|
| |||||||||||||||||||||||||||||||||||||||||||||||||||||||||
Total cost of revenues | 10,083 | 11,581 | 12,392 | 12,126 | 9,945 | 9,813 | 9,114 | 8,872 | ||||||||||||||||||||||||||||||||||||||||||||||||||||||||
|
|
|
|
|
|
|
| |||||||||||||||||||||||||||||||||||||||||||||||||||||||||
Gross profit | 12,258 | 12,978 | 14,855 | 15,631 | 11,614 | 10,837 | 10,155 | 11,406 | ||||||||||||||||||||||||||||||||||||||||||||||||||||||||
Operating Expenses: | ||||||||||||||||||||||||||||||||||||||||||||||||||||||||||||||||
Research and development(1) | 4,119 | 4,483 | 4,063 | 4,107 | 4,867 | 4,681 | 4,814 | 4,348 | ||||||||||||||||||||||||||||||||||||||||||||||||||||||||
Sales and marketing(1) | 5,336 | 5,770 | 5,256 | 4,782 | 5,293 | 6,336 | 6,664 | 7,705 | ||||||||||||||||||||||||||||||||||||||||||||||||||||||||
General and administrative(1) | 3,877 | 3,758 | 3,883 | 4,545 | 4,398 | 4,717 | 5,403 | 5,153 | ||||||||||||||||||||||||||||||||||||||||||||||||||||||||
Restructuring | — | — | — | 1,215 | 69 | — | (43 | ) | — | |||||||||||||||||||||||||||||||||||||||||||||||||||||||
|
|
|
|
|
|
|
| |||||||||||||||||||||||||||||||||||||||||||||||||||||||||
Total operating expenses | 13,332 | 14,011 | 13,202 | 14,649 | 14,627 | 15,734 | 16,838 | 17,206 | ||||||||||||||||||||||||||||||||||||||||||||||||||||||||
|
|
|
|
|
|
|
| |||||||||||||||||||||||||||||||||||||||||||||||||||||||||
Income (loss) from operations | (1,074 | ) | (1,033 | ) | 1,653 | 982 | (3,013 | ) | (4,897 | ) | (6,683 | ) | (5,800 | ) | ||||||||||||||||||||||||||||||||||||||||||||||||||
Interest (income) expense, net | 126 | 115 | 85 | 31 | (4 | ) | (3 | ) | (3 | ) | (2 | ) | ||||||||||||||||||||||||||||||||||||||||||||||||||||
Other (income) expenses, net | 52 | 660 | (48 | ) | (6 | ) | 31 | 56 | 24 | 5 | ||||||||||||||||||||||||||||||||||||||||||||||||||||||
|
|
|
|
|
|
|
| |||||||||||||||||||||||||||||||||||||||||||||||||||||||||
Income (loss) before income taxes | (1,252 | ) | (1,808 | ) | 1,616 | 957 | (3,040 | ) | (4,950 | ) | (6,704 | ) | (5,803 | ) | ||||||||||||||||||||||||||||||||||||||||||||||||||
Provision for income taxes | 61 | 88 | 81 | 209 | 83 | 82 | 96 | 123 | ||||||||||||||||||||||||||||||||||||||||||||||||||||||||
|
|
|
|
|
|
|
| |||||||||||||||||||||||||||||||||||||||||||||||||||||||||
Net income (loss) | (1,313 | ) | (1,896 | ) | 1,535 | 748 | (3,123 | ) | (5,032 | ) | (6,800 | ) | (5,926 | ) | ||||||||||||||||||||||||||||||||||||||||||||||||||
|
|
|
|
|
|
|
| |||||||||||||||||||||||||||||||||||||||||||||||||||||||||
(1) Includes stock-based compensation as follows:
|
| |||||||||||||||||||||||||||||||||||||||||||||||||||||||||||||||
Cost of Revenues: |
|
|
|
|
|
|
|
|
|
|
|
|
|
|
|
|
|
|
|
|
|
|
|
|
|
|
|
|
|
|
|
| ||||||||||||||||||||||||||||||||
License and implementation | 40 | 90 | 240 | 221 | 216 | 330 | 206 | 153 |
|
| 3,118 |
|
|
| 3,333 |
|
|
| 4,159 |
|
|
| 3,614 |
|
|
| 2,437 |
|
|
| 3,521 |
|
|
| 3,601 |
|
|
| 3,417 |
| ||||||||||||||||||||||||
SaaS and maintenance | 74 | 114 | 215 | 219 | 225 | 184 | 167 | 173 |
|
| 12,345 |
|
|
| 12,439 |
|
|
| 11,880 |
|
|
| 10,208 |
|
|
| 11,137 |
|
|
| 10,330 |
|
|
| 10,238 |
|
|
| 9,012 |
| ||||||||||||||||||||||||
Total cost of revenues |
|
| 15,463 |
|
|
| 15,772 |
|
|
| 16,039 |
|
|
| 13,822 |
|
|
| 13,574 |
|
|
| 13,851 |
|
|
| 13,839 |
|
|
| 12,429 |
| ||||||||||||||||||||||||||||||||
Gross profit |
|
| 20,142 |
|
|
| 18,472 |
|
|
| 17,218 |
|
|
| 14,241 |
|
|
| 14,934 |
|
|
| 14,066 |
|
|
| 12,220 |
|
|
| 12,058 |
| ||||||||||||||||||||||||||||||||
Operating Expenses: |
|
|
|
|
|
|
|
|
|
|
|
|
|
|
|
|
|
|
|
|
|
|
|
|
|
|
|
|
|
|
|
| ||||||||||||||||||||||||||||||||
Research and development | 54 | 98 | 305 | 290 | 262 | 400 | 310 | 306 |
|
| 7,762 |
|
|
| 8,393 |
|
|
| 8,934 |
|
|
| 5,975 |
|
|
| 6,057 |
|
|
| 6,190 |
|
|
| 6,175 |
|
|
| 5,284 |
| ||||||||||||||||||||||||
Sales and marketing | 259 | 454 | 686 | 288 | 542 | 668 | 721 | 858 |
|
| 10,258 |
|
|
| 10,739 |
|
|
| 11,608 |
|
|
| 8,734 |
|
|
| 8,265 |
|
|
| 7,982 |
|
|
| 8,307 |
|
|
| 7,707 |
| ||||||||||||||||||||||||
General and administrative | 130 | 186 | 361 | 532 | 727 | 1,234 | 1,258 | 1,009 |
|
| 9,332 |
|
|
| 8,096 |
|
|
| 11,668 |
|
|
| 7,185 |
|
|
| 8,278 |
|
|
| 8,409 |
|
|
| 6,644 |
|
|
| 6,720 |
| ||||||||||||||||||||||||
|
|
|
|
|
|
|
| |||||||||||||||||||||||||||||||||||||||||||||||||||||||||
Total stock-based compensation expense | 557 | 942 | 1,807 | 1,550 | 1,972 | 2,816 | 2,662 | 2,499 | ||||||||||||||||||||||||||||||||||||||||||||||||||||||||
|
|
|
|
|
|
|
| |||||||||||||||||||||||||||||||||||||||||||||||||||||||||
Total operating expenses |
|
| 27,352 |
|
|
| 27,228 |
|
|
| 32,210 |
|
|
| 21,894 |
|
|
| 22,600 |
|
|
| 22,581 |
|
|
| 21,126 |
|
|
| 19,711 |
| ||||||||||||||||||||||||||||||||
Loss from operations |
|
| (7,210 | ) |
|
| (8,756 | ) |
|
| (14,992 | ) |
|
| (7,653 | ) |
|
| (7,666 | ) |
|
| (8,515 | ) |
|
| (8,906 | ) |
|
| (7,653 | ) | ||||||||||||||||||||||||||||||||
Interest (income) expense, net |
|
| 1,370 |
|
|
| 1,442 |
|
|
| 1,380 |
|
|
| (33 | ) |
|
| (22 | ) |
|
| (14 | ) |
|
| (13 | ) |
|
| (1 | ) | ||||||||||||||||||||||||||||||||
Other (income) expenses, net |
|
| (15 | ) |
|
| 3 |
|
|
| 228 |
|
|
| (154 | ) |
|
| 63 |
|
|
| (22 | ) |
|
| (12 | ) |
|
| 57 |
| ||||||||||||||||||||||||||||||||
Loss before income taxes |
|
| (8,565 | ) |
|
| (10,201 | ) |
|
| (16,600 | ) |
|
| (7,466 | ) |
|
| (7,707 | ) |
|
| (8,479 | ) |
|
| (8,881 | ) |
|
| (7,709 | ) | ||||||||||||||||||||||||||||||||
Provision (benefit) for income taxes |
|
| 457 |
|
|
| 234 |
|
|
| (4,110 | ) |
|
| 134 |
|
|
| 49 |
|
|
| 167 |
|
|
| 29 |
|
|
| 90 |
| ||||||||||||||||||||||||||||||||
Net loss |
|
| (9,022 | ) |
|
| (10,435 | ) |
|
| (12,490 | ) |
|
| (7,600 | ) |
|
| (7,756 | ) |
|
| (8,646 | ) |
|
| (8,910 | ) |
|
| (7,799 | ) | ||||||||||||||||||||||||||||||||
Liquidity and Capital Resources
Our principal sources of liquidity are our cash and cash equivalents. As of September 30, 2014,2017, we had cash and cash equivalents of $101.0$57.6 million. Since inception, we have financed our operations primarily through proceeds from the issuance of capital stock and since 2006 through cash flows from operations. In addition, in March 2013, upon the closing of our IPO, we received aggregate net proceeds of $101.1 million, net of underwriting discounts and commissions.
We expect that our operating losses will continue through at least the foreseeable future. Based on our future expectations and historical usage, we believe our current cash and cash equivalents are sufficient to meet our cashoperating needs for at least the next 12 months. Our future capital requirements will depend on many factors, including our rate of revenue growth, the expansion of our sales and marketing activities, and the timing and extent of spending to support research and development efforts and expansion of our business and capital expenditures for the purchase of computer hardware and software. To the extent that existing cash and cash
equivalents and cash from operations are insufficient to fund our future activities, we may elect to raise additional capital through the sale of additional equity or debt securities, obtain a credit facility or sell certain assets. If additional funds are raised through the issuance of debt securities, these securities could have rights, preferences and privileges senior to holders of common stock, and terms of any debt could impose restrictions on our operations. The sale of additional equity or convertible debt securities could result in additional dilution to our stockholders and additional financing may not be available in amounts or on terms acceptable to us. We may also seek to invest in or acquire complementary businesses or technologies, any of which could also require us to seek additional equity or debt financing. Additional funds may not be available on terms favorable to us or at all.
Term Loan
In January 2017, we entered into a financing agreement pursuant to which we borrowed an aggregate principal amount of $50 million, which was used to fund part of the cash portion of the Revitas acquisition.
The term loan will bear interest at a rate of either (i) the Base Rate (as defined in the Financing Agreement) plus 9.25% or (ii) the LIBOR Rate (as defined in the Financing Agreement) plus 8.25%, as selected by us. As of September 30, 2017, the Company selected LIBOR Rate plus 8.25%. The term loans mature on January 5, 2022. We must repay 0.625% of the aggregate principal amount, or $312,500, of the term loans on the last business day of each fiscal quarter, beginning with the fiscal quarter ending March 31, 2019. We may voluntarily prepay the terms loans, subject to a 3% premium for 24 months and 1% premium after 24 months and prior to 36 months. Certain mandatory prepayments are required upon the sale of certain assets, the receipt of certain insurance or condemnation proceeds or extraordinary receipts, the issuance of certain securities or debt, the occurrence of excess cash flows and the occurrence of certain restrictions on the business of the combined company or certain divestitures.
The Financing Agreement requires us to maintain certain financial covenants, including achieving certain levels of revenue from specified sources, as outlined in the agreement, and maintaining cash and cash-equivalents of $20.0 million net of accounts payable in excess of $0.5 million 90 days overdue. The financing agreement also contains certain non-financial covenants, including restricting our ability to dispose of assets, changing our organizational documents or amending our material agreements in a manner adverse to the lender, changing a method of accounting, merging with or acquiring other entities, incurring other indebtedness and making certain investments. We were in compliance with all of the covenants described in the Financing Agreement as of September 30, 2017.
Our subsidiary guarantors have jointly and severally guaranteed the payment in full of all obligations under the Financing Agreement. Our and our subsidiary guarantor obligations under the financing agreement are secured by substantially all of our and their assets and a pledge of certain of our and their subsidiaries’ stock.
Cash Flows
| Years Ended September 30, | ||||||||||||
| 2014 | 2013 | 2012 | ||||||||||
| (in thousands) | ||||||||||||
Cash flows from operating activities | $ | (6,050 | ) | $ | (414 | ) | $ | 5,723 | ||||
Cash flows from investing activities | (2,216 | ) | (5,140 | ) | (5,905 | ) | ||||||
Cash flows from financing activities | 5,914 | 93,216 | (2,449 | ) | ||||||||
|
| Fiscal Years Ended September 30, |
| |||||||||
|
| 2017 |
|
| 2016 |
|
| 2015 |
| |||
|
| (in thousands) |
| |||||||||
Cash flows used in operating activities |
| $ | (11,965 | ) |
| $ | (12,324 | ) |
| $ | (8,772 | ) |
Cash flows used in investing activities |
|
| (48,501 | ) |
|
| (15,789 | ) |
|
| (4,606 | ) |
Cash flows provided by financing activities |
|
| 51,866 |
|
|
| 3,279 |
|
|
| 3,450 |
|
Cash Flows from Operating Activities
Net cash used in operating activities during the fiscal year ended September 30, 2017 was primarily the result of our net loss of $39.5 million and an $11.9 million change in operating assets and liabilities, partially offset by $15.7 million of non-cash adjustments of deferred income taxes benefits, stock-based compensation and depreciation and amortization. The $11.9 million net change in operating assets and liabilities consisted of a $1.4 million decrease in accounts receivable, primarily reflective of collections in excess of invoicing during the period, a $2.1 million decrease in prepaid expense and other assets , a $1.5 million decrease in deferred cost of implementation services, an $5.8 million increase in deferred revenue primarily due to timing of amount invoiced and revenue recognized, a $2.6 million increase in accrued employee compensation primarily due to accrual of bonuses and other employee benefits, and a $1.6 million decrease in accounts payable.
Net cash used in operating activities was $6.1 million for the fiscal year ended September 30, 2014. Net cash used in operating activities was $0.4 million for the fiscal year ended September 30, 2013 compared to net cash provided by operating activities of $5.7 million for the fiscal year ended September 30, 2012.
Net cash used in operating activities was $6.1$12.3 million during fiscal year ended September 30, 2014,2016, and was primarily the result of our net loss of $20.9$33.1 million partially offset by $1.1and $1.6 million increasechange in net cash provided by operating assets and liabilities, and $13.7partially offset by $19.1 million of non-cash adjustments comprised of $10.0$13.1 million in stock-based compensation, $6.0 million in depreciation and amortization and $0.2 million in other non-cash charges. The net change in operating assets and liabilities consisted of a $2.9 million increase in accounts receivable primarily reflective of invoicing in excess of collection during the year, a $1.0 million increase in deferred cost of
implementation services, a $5.9 million increase in deferred revenue primarily due to timing of amount invoiced and revenue recognized, a $1.5 million increase in prepaid expenses and other assets, a $1.5 million increase in accounts payable, a $0.7 million decrease in accrued employee compensation primarily due to payment of bonuses and other employee benefits and a $0.3 million increase in other accrued and long term liabilities.
Net cash used in operating activities was $8.8 million during fiscal year ended September 30, 2015, and was primarily the result of our net loss of $19.6 million and a $3.8 million change in operating assets and liabilities, partially offset by a $14.7 million of non-cash adjustments comprised of $10.4 million in stock-based compensation and $3.7$4.1 million in depreciation and amortization. The net cash increase provided bychange in operating assets and liabilities consisted of a $3.9$2.6 million increasedecrease in deferred revenue associated with arrangements for which revenues were deferred at the outset of the arrangements, a $1.0$0.9 million decreaseincrease in accounts receivables, primarily reflective of collectionshigher invoicing in excessfourth quarter of billings,2015, a $0.2$0.5 million decreaseincrease in deferred cost of implementation services and a decreasean increase of $0.4$1.2 million in prepaid expenses and other assets. These were partially offset by decrease of $4.6 million in accrued employee compensation primarily reflecting the purchases made under our Employee Stock Purchase Plan (ESPP) program, and payment of bonuses, LeapFrogRx compensation charges and accrued restructuring charges.
Net cash of $0.4 million used in operating activities during the fiscal year ended September 30, 2013 was principally the result of our net loss of $0.9 million and a net change of $7.4 million in operating assets and liabilities, partially offset by non-cash adjustments such as stock-based compensation, depreciation and
amortization, changes in fair value of preferred stock warrant liability etc. aggregating to $7.9 million. The net changes in operating assets and liabilities primarily related to a reduction of $9.0 million in deferred revenue mainly driven by higher revenues recognized upon completion of customer projects; an increase of $3.7 million in accounts receivable due to higher invoicing and revenue in the fourth quarter of 2013 as compared to 2012, and an increase of $3.0 million in prepaid expenses and other current assets as the Company prepaid cash towards some of its future commitments, partially offset by an increase of $6.3 million in accrued employee compensation primarily due to an accrual of bonus expected to be paid out in fiscal year 2014 and beyond, and cash contributed by employees who participated in the Company’s employees stock purchase program; a reduction of $0.9 million in deferred cost of implementation services due to an increase in the number of SaaS contracts; an increase of $0.9$1.0 million in other accrued and long-termlong term liabilities and an$0.5 million increase of $0.3 million in accounts payable.payable which primarily due to the timing of accruals and payments made.
Net cash of $5.7 million provided by operating activities during the fiscal year ended September 30, 2012 was principally the result of changes in assets and liabilities of $6.6 million and non-cash adjustments of $4.8 million, offset by our net loss of $5.7 million. The significant components of the assets and liabilities changes included increased deferred revenues of $3.1 million, increased accrued employee compensation of $1.9 million, increased other accrued and long-term liabilities of $2.1 million, and reduced accounts receivable of $0.9 million, partially offset by $0.9 million of increases in prepaid expenses and other current assets. Our significant non-cash charges included $2.5 million of stock-based compensation and $1.8 million of depreciation and amortization expense during that period.
Cash Flows from Investing Activities
Net cash used in investing activities was $2.2 million, $5.1 million, and $5.9 million for the fiscal years ended September 30, 2014, 2013, and 2012, respectively.
Net cash used in investing activities for the fiscal year ended September 30, 20142017 was primarily due to purchases$47.8 million net cash paid for the acquisition of property and equipment of $1.8 million andRevitas, $0.4 million associated with capitalization of software development costs.
Net cash used in investing activities for the fiscal year ended September 30, 2013 was primarily due to the capitalized software development costs of $3.7 million and purchases of property and equipment of $1.4$0.4 million.
Net cash used in investing activities for the fiscal year ended September 30, 20122016 was primarily due to cash paid for the acquisition of LeapFrogRx for $3.0a business of $12.6 million, $1.1 million associated with capitalization of software development costs and purchases of property and equipment of $1.8$2.1 million.
Net cash used in investing activities for the fiscal year ended September 30, 2015 was primarily due to purchases of property and equipment of $2.1 million and capitalized$2.5 million associated with capitalization of software development costs of $1.1 million.costs.
Cash Flows from Financing Activities
Net cash provided by financing activities was $5.9 million and $93.2 million for the fiscal years ended September 30, 2014 and 2013, respectively. Net cash used in financing activities was $2.4 million for the fiscal year ended September 30, 2012.2017 was primarily related to our borrowing activities related to the Revitas transaction, for which we received net cash proceeds of $47.9 million during fiscal 2017, as well as $4.0 million from the exercises of stock options and purchase made under our employee stock purchase plan.
Net cash provided by financing activities for the fiscal year ended September 30, 20142016 was from the exercises of stock options and purchases made under our employee stock purchase plan.
Net cash provided by financing activities for the fiscal year ended September 30, 2015 primarily consisted of $6.2$3.5 million from exercises of stock options and purchases made under our ESPP, partially offset by $0.3 million related to the repayment of capital lease obligations.
Net cash provided by financing activities for the for the fiscal year ended September 30, 2013 primarily consisted of IPO proceeds of $101.1 million, net of underwriting discounts, and $0.9 million from exercises of stock options, partially offset by $2.9 million in initial public offering costs and $5.8 million related to the repayment of our term loan and capital lease.
Net cash used in financing activities for the fiscal year ended September 30, 2012 was primarily due to loan repayment of $2.3 million and payments of capital leases of $0.5 million, partially offset by proceeds from issuance of common stock under our stock option plans of $0.6 million.ESPP.
Contractual Obligations
The following summarizes our contractual obligations as of September 30, 2014:2017:
| Contractual Payment Obligations Due by Period | ||||||||||||||||||||
| Total | Less than 1 Year | 1 to 3 Years | 2 to 5 Years | More than 5 Years | ||||||||||||||||
Operating lease obligations(1) | $ | 6,400 | $ | 2,100 | $ | 3,800 | $ | 500 | $ | — | ||||||||||
LeapFrogRx compensation charges(2) | 964 | 964 | — | — | — | |||||||||||||||
|
|
|
|
|
|
|
|
|
| |||||||||||
Total | $ | 7,364 | $ | 3,064 | $ | 3,800 | $ | 500 | $ | — | ||||||||||
|
|
|
|
|
|
|
|
|
| |||||||||||
|
| Contractual Payment Obligations Due by Period |
| |||||||||||||||||
|
| Total |
|
| Less than 1 Year |
|
| 1 to 3 Years |
|
| 3 to 5 Years |
|
| More than 5 Years |
| |||||
Operating lease obligations(1) |
| $ | 4,300 |
|
| $ | 1,600 |
|
| $ | 1,700 |
|
| $ | 1,000 |
|
| $ | — |
|
(1) | Operating lease obligations represent our obligations to make payments under the lease agreements for our facilities leases. |
Off-Balance Sheet Arrangements
As of September 30, 2014,2017, we did not have any relationships with unconsolidated entities or financial partnerships, such as entities often referred to as structured finance or special purpose entities, which would have been established for the purpose of facilitating off-balance sheet arrangements or other contractually narrow or limited purposes.
Critical Accounting Policies and Estimates
Our consolidated financial statements have been prepared in conformity with generally accepted accounting principles in the United States.States (“U.S. GAAP”). The preparation of the accompanying consolidated financial statements in conformity with U.S. GAAP requires our management to make certain estimates and assumptions that affect the amounts of assets and liabilities reported disclosures about contingent assets and liabilities and reported amounts of revenues and expenses during the reporting periods. Significant items subject to such estimates include revenue recognition, legal contingencies, income taxes, stock-based compensation, software development costs and valuation of goodwill and intangibles. These estimates and assumptions are based on our management’s best estimates and judgment. Our management regularly evaluates these estimates and assumptions using historical experience and other factors; however, actual results could differ significantly from these estimates.
We believe that the assumptions and estimates associated with revenue recognition, share-based compensation, business combinations and income taxes have the greatest potential impact on our consolidated financial statements. Therefore, we consider these to be our critical accounting policies and estimates. Accordingly, we believe these are the most critical to fully understand and evaluate our financial condition and results of operations.
For further information on
Revenue recognition
We generate revenue from two sources: License and implementation and SaaS and maintenance.
License and implementation revenues include revenues from the sale of perpetual software licenses for our solutions and the related implementation services. SaaS and maintenance revenues primarily include subscription and the related implementation fees from customers accessing our cloud-based solutions and revenues associated with maintenance and support contracts from customers using on-premise solutions. Also included in SaaS and maintenance revenues are other revenues, such as managed support services, training and customer-reimbursed expenses. We commence revenue recognition when all of the following conditions are satisfied:
there is persuasive evidence of an arrangement exists,
delivery has occurred or services have been rendered,
the price is fixed or determinable and
the collection of the fees is probable or reasonably estimable.
However, determining whether and when some of these criteria have been satisfied often involves assumptions and judgments that can have a significant impact on the timing and amount of revenues we report.
License and implementation revenue is recognized based on the nature and scope of the implementation services, we have concluded that generally the implementation services are essential to our customers’ use of the on-premise solutions, and therefore, we recognize revenues from the sale of software licenses for our on-premise solutions and the related implementation services on a percentage-of-completion basis over the expected implementation period which is estimated at a few months to three years. The percentage-of-completion computation is measured as the hours expended on the implementation during the reporting period as a percentage of the total estimated hours needed to complete the implementation.
For SaaS arrangements related to Revenue Cloud for Life Science and High Tech companies we historically concluded that the SaaS deliverable did not have standalone value without the implementation services primarily because other vendors could not perform the services, and in some cases the complexity of the customer environment in which the SaaS deliverable was deployed. During fiscal year 2016, we concluded that a sufficient number of implementation projects had been completed with several third-party consulting companies participating in either a primary or sub-contractor role, such that the third-party vendors have the requisite know-how to complete, and, have completed the implementation services independently. Therefore, the Company concluded that the SaaS deliverable has standalone value to the customer without the implementation services. The total arrangement fee for a multiple-element arrangement is allocated based on the relative selling price method. The consideration allocated to subscription fees is recognized as revenue ratably over the contract period. The consideration allocated to implementation services is recognized as revenue as services are performed, in accordance with the provisions of Financial Accounting Standards Board (FASB) Accounting Standards Update (ASU) No. 2009-13, Revenue Recognition (Accounting Standards Codification (ASC) Topic 605)—Multiple-Deliverable Revenue Arrangements.”
Prior to fiscal year 2016, for SaaS arrangements related to Revenue Cloud for Life Science and High Tech companies we treated the entire arrangement consideration, including subscription fees and related implementation services fees, as a single unit of
accounting and recognized the revenues ratably beginning the day the customer was provided access to the subscription service through the end of contractual period.
For the remaining SaaS arrangements subscription fees and implementation services continue to have standalone value and we allocate revenue to each element in the arrangement based on a selling price hierarchy. The selling price for a deliverable is based on its vendor-specific objective evidence (VSOE), if available, third-party evidence (TPE), if VSOE is not available, or best estimated selling price (BESP), if neither VSOE nor TPE is available. For SaaS arrangements, where we utilize BESP, we established the BESP for each element by considering specific factors such as existing pricing and discounting. The total arrangement fee for a multiple element arrangement is allocated based on the relative BESP of each element. The consideration allocated to subscription fees is recognized as revenue ratably over the contract period. The consideration allocated to services is recognized as revenue as services are performed.
For SaaS arrangements, where we utilize BESP, we established the BESP for each element by considering specific factors such as existing pricing and discounting. The total arrangement fee for a multiple element arrangement is allocated based on the relative BESP of each element. The consideration allocated to subscription fees is recognized as revenue ratably over the contract period. The consideration allocated to services is recognized as revenue as services are performed.
Revenue related to up-front fees are deferred and recognized ratably over the estimated period that the customer benefits from the related service.
Maintenance and support revenue include post-contract customer support and the right to unspecified software updates and enhancements on a when and if available basis. Managed support services revenue includes supporting, managing and administering our software solutions, and providing additional end user support. Maintenance and support revenue and managed support services revenue are recognized ratably over the period in which the services are provided. The revenue from training and customer-reimbursed expenses is recognized as we deliver services.
Arrangements that include term-based licenses for current products with the right to use unspecified future versions of the software during the coverage period, are also accounted for as subscriptions, with revenue recognized ratably over the coverage period.
Stock-based compensation
We recognize compensation expense for stock option, restricted stock units, employee stock purchase plan (“ESPP”) and performance based restricted stock units. We use the Black-Scholes-Merton valuation model to estimate the fair value of stock option awards and ESPP shares. However, we have not granted stock options since fiscal year 2013. The fair value of restricted stock units is determined based on the intrinsic value of the award on the grant date. Our performance share unit grants included market condition performance criteria so we used a Monte Carlo simulation model to determine their fair value on the grant date. The fair value of these grants with a market condition is recognized using the graded-vesting attribution method over the requisite service period. The Monte-Carlo simulation model takes into account the same input assumptions as the Black-Scholes model; however, it also further incorporates into the fair value determination the possibility that the performance criteria may not be satisfied. The weighted-average assumptions used to estimate the fair values of these awards were determined using the following assumptions:
Fiscal Year Ended September 30, 2017 | ||||
Risk-free interest rate | 0.63 - 1.45% | |||
Dividend yield | — | |||
Volatility | 32 - 45% | |||
Changes in the estimates used to determine the fair value of share-based equity compensation instruments could result in changes to our compensation charges.
Business Combinations
We use all available information to estimate fair values. We typically engage outside appraisal firms to assist in the fair value determination of identifiable assets such as customer contracts and any other significant accounting policies, see Note 2assets or liabilities and contingent consideration. We adjust the preliminary purchase price allocation, as necessary, up to one year after the acquisition closing date if we obtain more information regarding asset valuation and liabilities assumed.
Our purchase price allocation methodology contains uncertainties because it requires assumptions and management’s judgment to estimate the fair value of assets acquired and liabilities assumed at the acquisition date. Management estimates the fair value of assets and liabilities based upon quoted market prices, the carrying value of the acquired assets and widely accepted valuation techniques, including discounted cash flows and market multiple analyses. Our estimates are inherently uncertain and subject to refinement. Unanticipated events or circumstances may occur which could affect the accuracy of our accompanying Notesfair value estimates, including assumptions regarding industry economic factors and business strategies.
During the last three years, we have completed two business combinations, including the Revitas acquisition in January 2017 and the Channelinsight acquisition in October 2015. We do not believe there is a reasonable likelihood that there will be a material change in the estimates or assumptions we used for the purchase price allocations and the fair value of assets acquired and liabilities assumed. However, if actual results are not consistent with our estimates or assumptions, we may be exposed to Consolidatedlosses that could be material.
Income Taxes
We account for income taxes in accordance with the FASB ASC No. 740—Accounting for Income Taxes (ASC 740). We make certain estimates and judgments in determining income tax expense for financial statement purposes. These estimates and judgments occur in the calculation of tax credits, tax benefits and deductions and in the calculation of certain tax assets and liabilities, which arise from differences in the timing of recognition of revenue and expense for tax and financial statement purposes. Significant changes to these estimates may result in an increase or decrease to our tax provision in the subsequent period when such a change in estimate occurs.
We regularly assess the likelihood that our deferred income tax assets will be realized from future taxable income based on the realization criteria set forth in ASC 740. To the extent that we believe any amounts are not more likely than not to be realized, we record a valuation allowance to reduce the deferred income tax assets. In assessing the need for a valuation allowance, we consider all available evidence, including past operating results, estimates of future taxable income and the feasibility of tax planning strategies. In the event we determine that all or part of the net deferred tax assets are not realizable in the future, an adjustment to the valuation allowance would be charged to earnings in the period such determination is made. Similarly, if we subsequently realize deferred income tax assets that were previously determined to be unrealizable, the respective valuation allowance would be reversed, resulting in an adjustment to earnings in the period such determination is made.
As of September 30, 2017, we had gross deferred income tax assets, related primarily to net operating loss (NOL) carry forward, deferred revenues, stock compensation, accruals and reserves that are not currently deductible, depreciation and amortization and research and development tax credits of $92.5 million, which have been fully offset by deferred tax liabilities and valuation allowance. Utilization of these net loss carry forwards is subject to the limitations of IRC Section 382. During the year ended September 30, 2013, we undertook a study of NOL carry forwards and determined that most of the NOLs carry forwards are not subject to the limitations of IRC Section 382. However, in the future, some portion or all of these carry forwards may not be available to offset any future taxable income. The federal and California net operating losses will begin expiring in 2021 and 2018, respectively.
In the second quarter, as a result of acquiring Revitas, we recorded an income tax benefit of $4.2 million due to a partial release of valuation allowance.
Recent Accounting Pronouncements
In May 2017, the Financial StatementsAccounting Standard Board (“FASB”) issued ASU 2017-09, Compensation-Stock Compensation (Topic 718): providing clarification on when modification accounting should be used for changes to the terms or conditions of a share-based payment award. This ASU does not change the accounting for modifications but clarifies that modification accounting guidance should only be applied if there is a change to the value, vesting conditions or award classification and would not be required if the changes are considered non-substantive. The amendments of this ASU are effective for reporting periods beginning after December 15, 2017, with early adoption permitted. The Company is currently evaluating the impact of this standard, but does not believe this will have material impact on its consolidated financial statements.
In January 2017, the FASB issued ASU 2017-04, Intangibles—Goodwill and Other (Topic 350): Simplifying the Test for Goodwill Impairment. This new accounting standard update simplifies the measurement of goodwill by eliminating the Step two impairment test. Step two measures a goodwill impairment loss by comparing the implied fair value of goodwill with the carrying amount of that goodwill. The new guidance requires a comparison of our fair value of with carrying amount and we are required to
recognize an impairment charge for the amount by which the carrying amount exceeds the fair value. Additionally, we should consider income tax effects from any tax deductible goodwill on the carrying amount when measuring the goodwill impairment loss, if applicable. The new guidance becomes effective for goodwill impairment tests in fiscal years beginning after December 15, 2019, though early adoption is permitted. The Company is currently evaluating the impact this standard will have on its consolidated financial statements.
In January 2017, the FASB issued ASU 2017-01, Business Combination (Topic 805):clarifying the definition of a business. The amendments in this guidance change the definition of a business to assist with evaluating when a set of transferred assets and activities is a business. The guidance becomes effective for the Company at the beginning of its first quarter of fiscal 2019. Early adoption is permitted. We are currently evaluating the impact this standard will have on its consolidated financial statements.
In November 2016, the FASB issued ASU 2016-18, Restricted Cash (Topic 230), clarifying the classification and presentation of restricted cash in the statement of cash flows. The standard requires that restricted cash and restricted cash equivalents are included in Part II, Item 8, “Financial Statementsthe cash and Supplementary Data”cash equivalent balance in the statement of cash flows. Further, reconciliation between the balance sheet and statement of cash flows is required when the balance sheet includes more than one line item for cash, cash equivalents, restricted cash, and restricted cash equivalents. Therefore, transfers between these balances should no longer be presented as a cash flow activity. The guidance becomes effective for fiscal years, and interim periods within those fiscal years, beginning after December 15, 2017, with early adoption permitted. We are currently evaluating the impact this standard will have on its consolidated financial statements.
In August 2016, the FASB issued ASU 2016-15, statement of cash flow (topic 230), amended the existing accounting standards for the statement of cash flows. The amendments provide guidance on how companies present and classify certain cash receipts and cash payments in the statement of cash flows. The guidance becomes effective for the Company at the beginning of its first quarter of fiscal 2019. Early adoption is permitted, including adoption in an interim period. We are currently evaluating the impact this standard will have on its consolidated financial statements.
In March 2016, the FASB issued ASU 2016-09, guidance related to stock-based compensation, which includes the income tax consequences, classification of awards as either equity or liabilities, and classification on the statement of cash. The guidance becomes effective for the Company at the beginning of its first quarter of fiscal 2018 but permits adoption in an earlier period. We are currently evaluating the impact this standard, but does not believe this will have material impact on its consolidated financial statements.
In February 2016, the FASB issued ASU 2016-02, guidance on the recognition and measurement of leases. Under the new guidance, lessees are required to recognize a lease liability, which represents the discounted obligation to make future minimum lease payments, and a corresponding right-of-use asset on the balance sheet for most leases. The guidance retains the current accounting for lessors and does not make significant changes to the recognition, measurement, and presentation of expenses and cash flows by a lessee. Enhanced disclosures will also be required to give financial statement users the ability to assess the amount, timing and uncertainty of cash flows arising from leases. The guidance will require modified retrospective application at the beginning of the Company’s first quarter of fiscal 2020, with optional practical expedients, but permits adoption in an earlier period. We are currently evaluating the impact this guidance will have on its consolidated financial statements.
In August 2014, the FASB issued ASU No. 2014-15, “Disclosure of Uncertainties about an Entity’s Ability to Continue as a Going Concern” that requires management to evaluate whether there are conditions and events that raise substantial doubt about the Company’s ability to continue as a going concern within one year after the financial statements are issued on both an interim and annual basis. Management is required to provide certain footnote disclosures if it concludes that substantial doubt exists or when its plans alleviate substantial doubt about the Company’s ability to continue as a going concern. The standard became effective to us in the fourth quarter of fiscal year 2017. The adoption of the standard had no material impact on our consolidated financial statements.
In May 2014, the FASB issued a new standard, Accounting Standards Update (ASU) 2014-09, Revenue from Contracts with Customers, as amended, which will supersede nearly all existing revenue recognition guidance. Under ASU 2014-09, an entity is required to recognize revenue upon transfer of promised goods or services to customers in an amount that reflects the expected consideration received in exchange for those goods or services. ASU 2014-09 defines a five-step process in order to achieve this core principle, which may require the use of judgment and estimates, and also requires expanded qualitative and quantitative disclosures relating to the nature, amount, timing and uncertainty of revenue and cash flows arising from contracts with customers, including significant judgments and estimates used.
The FASB has issued several amendments to the new standard, including clarification on accounting for licenses of intellectual property and identifying performance obligations. The amendments include ASU 2016-08, Revenue from Contracts with Customers (Topic 606)—Principal versus Agent Considerations, which was issued in March 2016, and clarifies the implementation guidance for principal versus agent considerations in ASU 2014-09, and ASU 2016-10, Revenue from Contracts with Customers (Topic 606)—
Identifying Performance Obligations and Licensing, which was issued in April 2016, and amends the guidance in ASU 2014-09 related to identifying performance obligations and accounting for licenses of intellectual property.
The new standard permits adoption either by using (i) a full retrospective approach for all periods presented in the period of adoption or (ii) a modified retrospective approach with the cumulative effect of initially applying the new standard recognized at the date of initial application and providing certain additional disclosures. The new standard is effective for annual reporting periods beginning after December 15, 2017, with early adoption permitted for annual reporting periods beginning after December 15, 2016. We do not plan to early adopt, and accordingly, we will adopt the new standard effective October 1, 2018. We currently anticipate adopting the standard using the modified retrospective method.
We have identified, and are in the process of implementing, appropriate changes to our business processes, systems and controls to support recognition and disclosure under the new standard. Based on our ongoing evaluation, we believe the impacts of this Annual ReportASU will be related to the capitalization and amortization of sales commissions, the timing of revenue recognition for certain sales contracts, and their respective disclosures. There will be changes to the capitalization of the sales commission and the period over which sales commissions will be amortized to align to an expected period of benefit, which sales commission is currently expensed as incurred. In addition, there will be a change in relation to the timing of revenue recognition for certain sales contracts, due primarily to the removal of the current limitation on Form 10-K.contingent revenue. These changes are being evaluated to determine the potential impact to our financial statements and disclosures. While we continue to assess the potential impacts of the new standard, including the areas described above, our preliminary conclusions may change.
Non-GAAP Financial Measure
Adjusted EBITDA
Adjusted EBITDA is a financial measure that is not calculated in accordance with generally accepted accounting principles in U.S. GAAP. We define adjusted EBITDA as net loss before items discussed below, including: stock-based compensation expense, depreciation and amortization, acquisition and integration related expense, deferred revenue adjustment related to the acquisition of Revitas, interest (income) expenses, net, other (income) expenses, net, certain legal expenses and provision (benefit) for income taxes. We believe adjusted EBITDA provides investors with consistency and comparability with our past financial performance and facilitates period-to-period comparisons of our operating results and our competitors’ operating results. We also use this measure internally to establish budgets and operational goals to manage our business and evaluate our performance.
We understand that, although adjusted EBITDA is frequently used by investors and securities analysts in their evaluations of companies, adjusted EBITDA has limitations as an analytical tool, and it should not be considered in isolation or as a substitute for analysis of our results of operations as reported under U.S. GAAP. These limitations include:
adjusted EBITDA does not include deferred revenue adjustment, integration, and expense related LeapFrogRx, Channelinsight and Revitas acquisition;
adjusted EBITDA does not reflect stock-based compensation expense;
depreciation and amortization are non-cash charges, and the assets being depreciated or amortized will often have to be replaced in the future; adjusted EBITDA does not reflect any cash requirements for these replacements;
adjusted EBITDA does not reflect legal expense related to class action lawsuits;
adjusted EBITDA does not reflect cash requirements for income taxes and the cash impact of interest income and other income or expense; and
other companies in our industry may calculate adjusted EBITDA differently than we do, limiting its usefulness as a comparative measure.
|
| Fiscal Years Ended September 30, |
| |||||||||
|
| 2017 |
|
| 2016 |
|
| 2015 |
| |||
|
| (in thousands) |
| |||||||||
Reconciliation of Adjusted EBITDA: |
|
|
|
|
|
|
|
|
|
|
|
|
Net loss |
| $ | (39,547 | ) |
| $ | (33,111 | ) |
|
| (19,639 | ) |
Adjustments: |
|
|
|
|
|
|
|
|
|
|
|
|
Stock-based compensation expense |
|
| 10,560 |
|
|
| 13,068 |
|
|
| 10,355 |
|
Depreciation and amortization |
|
| 8,185 |
|
|
| 5,929 |
|
|
| 4,076 |
|
Deferred revenue adjustments |
|
| 5,151 |
|
|
| — |
|
|
| — |
|
Acquisition and integration related expense |
|
| 6,446 |
|
|
| 867 |
|
|
| 91 |
|
Interest (income) expense, net |
|
| 4,159 |
|
|
| (50 | ) |
|
| (6 | ) |
Other (income) expenses, net |
|
| 62 |
|
|
| 86 |
|
|
| (22 | ) |
Legal expenses |
|
| — |
|
|
| 305 |
|
|
| 1,285 |
|
Provision for income taxes |
|
| (3,285 | ) |
|
| 335 |
|
|
| 528 |
|
Adjusted EBITDA |
| $ | (8,269 | ) |
| $ | (12,571 | ) |
| $ | (3,332 | ) |
Adjusted EBITDA was $(8.3) million, $(12.6) million and $(3.3) million for the fiscal years ended September 30, 2017, 2016 and 2015, respectively. The decrease in our adjusted EBITDA loss for the fiscal year ended September 30, 2017 as compared to fiscal year ended September 30, 2016, primarily due to an increase in our revenues for our SaaS and maintenance business as we acquired new customers, Revitas acquisition and synergies associated with the acquisition.
Item 7A.Quantitative and Qualitative Disclosures about Market Risk
We are exposed to market risks in the ordinary course of our business. Market risk represents the risk of loss that may impact our financial position due to adverse changes in financial market prices and rates. Our market risk exposure is primarily a result of fluctuations in interest rates and foreign currency exchange rates. We do not hold or issue financial instruments for trading purposes.
Interest Rate Sensitivity
Our exposure to market risk for changes in interest rates relates primarily to our cash and cash equivalents, bearswhich bear interest at a fixed interest rate. Our primary exposure to market risk is interest income and expense sensitivity, which is affected by changes in the general level of the interest rates in the United States. However, because of the short-term nature of our interest-bearing securities, a 10% change in market interest rates would not be expected to have a material impact on our consolidated financial condition or results of operations. In addition, as of September 30, 2017, we had approximately $57.2 million, respectively, in short-term and long-term debt with variable interest components. With respect to our interest expense for the fiscal year ended September 30, 2017, a 10% hypothetical change in interest rates would have resulted in an increase of $0.5 million, respectively, in our interest expense for such period.
Foreign Currency Exchange Risk
Our customers typically pay us in U.S. dollars,dollars; however, in foreign jurisdictions;jurisdictions, our expenses are typically denominated in local currency. Our expenses and cash flows are subject to fluctuations due to changes in foreign currency exchange rates, particularly changes in the Indian Rupee. The volatility of exchange rates depends on many factors that we cannot forecast with reliable accuracy. However, we believe that a 10% change in foreign exchange rates would not have a material impact on our results of operations. To date, we have not entered into foreign currency hedging contracts, but may consider entering into such contracts in the future. During fiscal 2017, the effect of a hypothetical 10% change in foreign currency exchange rates applicable to our business would have had an impact of approximately $1.7 million on our Consolidated Financial Statements. As our international operations grow, we will continue to reassess our approach to manage our risk relating to fluctuations in currency rates.
MODEL N, INC.
Index to Consolidated Financial Statements
Page | ||||
53 | ||||
54 | ||||
55 | ||||
56 | ||||
Consolidated Statements of | 57 | |||
58 | ||||
59 | ||||

The supplementary financial information required by this Item 8 is included in Item 7 under the caption “Quarterly Results of Operations (Unaudited)”.
REPORT OF INDEPENDENT REGISTERED PUBLIC ACCOUNTING FIRM
To the Board of Directors and Stockholders of Model N, Inc.:
In our opinion, the accompanying consolidated balance sheets and the related consolidated statements of operations, comprehensive loss, convertible preferred stock and stockholders’ equity (deficit) and cash flows present fairly, in all material respects, the financial position of Model N, Inc. and its subsidiaries atas of September 30, 20142017 and 2013,2016, and the results of their operations and their cash flows for each of the three years in the period ended September 30, 20142017 in conformity with accounting principles generally accepted in the United States of America. In addition, in our opinion, the financial statement schedulesschedule listed in the index appearing under Item 15 (2) presentpresents fairly, in all material respects, the information set forth therein when read in conjunction with the related consolidated financial statements. These financial statements and financial statement schedule are the responsibility of the Company’s management. Our responsibility is to express an opinion on these financial statements and financial statement schedule based on our audits. We conducted our audits of these financial statements in accordance with the standards of the Public Company Accounting Oversight Board (United States). Those standards require that we plan and perform the audit to obtain reasonable assurance about whether the financial statements are free of material misstatement. An audit includes examining, on a test basis, evidence supporting the amounts and disclosures in the financial statements, assessing the accounting principles used and significant estimates made by management, and evaluating the overall financial statement presentation. We believe that our audits provide a reasonable basis for our opinion.
/s/ PricewaterhouseCoopers LLP
/s/ PricewaterhouseCoopers LLP |
San Jose, California |
November 15, 2017 |
San Jose, California
November 18, 2014

MODEL N, INC.
(in thousands, except per share data)
| As of September 30, | ||||||||
| 2014 | 2013 | |||||||
Assets | ||||||||
Current Assets: | ||||||||
Cash and cash equivalents | $ | 101,006 | $ | 103,350 | ||||
Accounts receivable, (net of allowance for doubtful accounts of $0 and $46 at September 30, 2014 and 2013, respectively) | 15,203 | 16,140 | ||||||
Deferred cost of implementation services, current portion | 251 | 491 | ||||||
Prepaid expenses | 2,092 | 3,225 | ||||||
Other current assets | 322 | 342 | ||||||
|
|
|
| |||||
Total current assets | 118,874 | 123,548 | ||||||
Property and equipment, net | 6,889 | 7,871 | ||||||
Goodwill | 1,509 | 1,509 | ||||||
Intangible assets, net | 587 | 918 | ||||||
Other assets | 1,272 | 626 | ||||||
|
|
|
| |||||
Total assets | $ | 129,131 | $ | 134,472 | ||||
|
|
|
| |||||
Liabilities, Convertible Preferred Stock And Stockholders’ Equity | ||||||||
Current Liabilities: | ||||||||
Accounts payable | $ | 1,369 | $ | 468 | ||||
Accrued employee compensation | 9,194 | 13,941 | ||||||
Accrued liabilities | 1,998 | 2,848 | ||||||
Deferred revenue, current portion | 23,943 | 19,131 | ||||||
Capital lease obligations, current portion | — | 318 | ||||||
|
|
|
| |||||
Total current liabilities | 36,504 | 36,706 | ||||||
Deferred revenue, net of current portion | 2,585 | 3,507 | ||||||
Other long-term liabilities | 1,078 | 641 | ||||||
|
|
|
| |||||
Total liabilities | 40,167 | 40,854 | ||||||
|
|
|
| |||||
Commitments and contingencies (Note 5) | ||||||||
Convertible Preferred Stock | ||||||||
Convertible preferred stock, $0.00005 par value; no shares authorized, issued and outstanding at September 30, 2014 and 2013, respectively | — | — | ||||||
|
|
|
| |||||
Stockholders’ Equity: | ||||||||
Common Stock, $0.00015 par value; 200,000 shares authorized; 25,085 and 22,999 shares issued and outstanding at September 30, 2014 and 2013, respectively | 4 | 3 | ||||||
Preferred Stock, $0.00015 par value; 5,000 shares authorized; no shares issued and outstanding | — | — | ||||||
Additional paid-in capital | 172,245 | 156,032 | ||||||
Accumulated other comprehensive loss | (289 | ) | (302 | ) | ||||
Accumulated deficit | (82,996 | ) | (62,115 | ) | ||||
|
|
|
| |||||
Total stockholders’ equity | 88,964 | 93,618 | ||||||
|
|
|
| |||||
Total liabilities, convertible preferred stock and stockholders’ equity | $ | 129,131 | $ | 134,472 | ||||
|
|
|
| |||||
The accompanying notes are an integral part of these consolidated financial statements.
MODEL N, INC.
Consolidated Statements of Operations
(in thousands, except per share data)
| Fiscal Years Ended September 30, | ||||||||||||
| 2014 | 2013 | 2012 | ||||||||||
Revenues: | ||||||||||||
License and implementation | $ | 35,333 | $ | 59,134 | $ | 49,756 | ||||||
SaaS and maintenance | 46,423 | 42,770 | 34,502 | |||||||||
|
|
|
|
|
| |||||||
Total revenues | 81,756 | 101,904 | 84,258 | |||||||||
|
|
|
|
|
| |||||||
Cost of Revenues: | ||||||||||||
License and implementation | 16,652 | 26,832 | 22,483 | |||||||||
SaaS and maintenance | 21,092 | 19,350 | 18,053 | |||||||||
|
|
|
|
|
| |||||||
Total cost of revenues | 37,744 | 46,182 | 40,536 | |||||||||
|
|
|
|
|
| |||||||
Gross profit | 44,012 | 55,722 | 43,722 | |||||||||
Operating Expenses: | ||||||||||||
Research and development | 18,710 | 16,772 | 17,695 | |||||||||
Sales and marketing | 25,998 | 21,144 | 19,640 | |||||||||
General and administrative | 19,671 | 16,063 | 10,584 | |||||||||
Restructuring | 26 | 1,215 | — | |||||||||
|
|
|
|
|
| |||||||
Total operating expenses | 64,405 | 55,194 | 47,919 | |||||||||
|
|
|
|
|
| |||||||
(Loss) income from operations | (20,393 | ) | 528 | (4,197 | ) | |||||||
Interest (income) expense, net | (12 | ) | 357 | 655 | ||||||||
Other expenses, net | 116 | 658 | 540 | |||||||||
|
|
|
|
|
| |||||||
Loss before income taxes | (20,497 | ) | (487 | ) | (5,392 | ) | ||||||
Provision for income taxes | 384 | 439 | 301 | |||||||||
|
|
|
|
|
| |||||||
Net loss | $ | (20,881 | ) | $ | (926 | ) | $ | (5,693 | ) | |||
|
|
|
|
|
| |||||||
Net loss per share attributable to common stockholders: | ||||||||||||
Basic and diluted | $ | (0.86 | ) | $ | (0.06 | ) | $ | (0.73 | ) | |||
|
|
|
|
|
| |||||||
Weighted average number of shares used in computing net loss per share attributable to common stockholders: | ||||||||||||
Basic and diluted | 24,399 | 15,979 | 7,815 | |||||||||
|
|
|
|
|
| |||||||
|
| As of September 30, |
| |||||
|
| 2017 |
|
| 2016 |
| ||
Assets |
|
|
|
|
|
|
|
|
Current assets: |
|
|
|
|
|
|
|
|
Cash and cash equivalents |
| $ | 57,558 |
|
| $ | 66,149 |
|
Accounts receivable, net of allowance for doubtful accounts of $85 and $0 at September 30, 2017 and 2016 |
|
| 24,784 |
|
|
| 19,925 |
|
Deferred cost of implementation services, current portion |
|
| 493 |
|
|
| 1,630 |
|
Prepaid expenses |
|
| 3,733 |
|
|
| 4,845 |
|
Other current assets |
|
| 520 |
|
|
| 283 |
|
Total current assets |
|
| 87,088 |
|
|
| 92,832 |
|
Property and equipment, net |
|
| 4,611 |
|
|
| 6,141 |
|
Goodwill |
|
| 39,283 |
|
|
| 6,939 |
|
Intangible assets, net |
|
| 40,156 |
|
|
| 5,684 |
|
Other assets |
|
| 798 |
|
|
| 1,371 |
|
Total assets |
| $ | 171,936 |
|
| $ | 112,967 |
|
Liabilities and Stockholders' Equity |
|
|
|
|
|
|
|
|
Current liabilities: |
|
|
|
|
|
|
|
|
Accounts payable |
| $ | 3,002 |
|
| $ | 3,334 |
|
Accrued employee compensation |
|
| 14,996 |
|
|
| 8,349 |
|
Accrued liabilities |
|
| 4,979 |
|
|
| 3,707 |
|
Deferred revenue, current portion |
|
| 49,186 |
|
|
| 28,854 |
|
Short-term debt |
|
| 4,753 |
|
|
| — |
|
Total current liabilities |
|
| 76,916 |
|
|
| 44,244 |
|
Deferred revenue, net of current portion |
|
| 227 |
|
|
| 1,924 |
|
Long-term debt |
|
| 52,452 |
|
|
| — |
|
Other long-term liabilities |
|
| 1,080 |
|
|
| 597 |
|
Total liabilities |
|
| 130,675 |
|
|
| 46,765 |
|
Commitments and contingencies (Note 8) |
|
|
|
|
|
|
|
|
Convertible preferred stock: |
|
|
|
|
|
|
|
|
Convertible preferred stock, $0.0005 par value; no shares authorized, issued and outstanding at September 30, 2017 and 2016, respectively |
|
| — |
|
|
| — |
|
Stockholders' equity: |
|
|
|
|
|
|
|
|
Common Stock, $0.00015 par value; 200,000 shares authorized; 29,323 and 27,891 shares issued and outstanding at September 30, 2017 and September 30, 2016, respectively |
|
| 4 |
|
|
| 4 |
|
Preferred Stock, $0.00015 par value; 5,000 shares authorized; no shares issued and outstanding |
|
| — |
|
|
| — |
|
Additional paid-in capital |
|
| 217,052 |
|
|
| 202,506 |
|
Accumulated other comprehensive loss |
|
| (502 | ) |
|
| (562 | ) |
Accumulated deficit |
|
| (175,293 | ) |
|
| (135,746 | ) |
Total stockholders' equity |
|
| 41,261 |
|
|
| 66,202 |
|
Total liabilities and stockholders' equity |
| $ | 171,936 |
|
| $ | 112,967 |
|
The accompanying notes are an integral part of these consolidated financial statements.
MODEL N, INC.
Consolidated Statements of Comprehensive LossOperations
(in thousands)thousands, except per share data)
| Fiscal Years Ended September 30, | ||||||||||||
| 2014 | 2013 | 2012 | ||||||||||
Net loss | $ | (20,881 | ) | $ | (926 | ) | $ | (5,693 | ) | |||
Foreign currency translation gain (loss), net of taxes | 13 | (182 | ) | — | ||||||||
|
|
|
|
|
| |||||||
Other comprehensive income (loss), net | 13 | (182 | ) | — | ||||||||
|
|
|
|
|
| |||||||
Total comprehensive loss | $ | (20,868 | ) | $ | (1,108 | ) | $ | (5,693 | ) | |||
|
|
|
|
|
| |||||||
|
| Fiscal Years Ended September 30, |
| |||||||||
|
| 2017 |
|
| 2016 |
|
| 2015 |
| |||
Revenues: |
|
|
|
|
|
|
|
|
|
|
|
|
License and implementation |
| $ | 23,114 |
|
| $ | 20,579 |
|
| $ | 36,172 |
|
SaaS and maintenance |
|
| 108,055 |
|
|
| 86,392 |
|
|
| 57,596 |
|
Total revenues |
|
| 131,169 |
|
|
| 106,971 |
|
|
| 93,768 |
|
Cost of revenues: |
|
|
|
|
|
|
|
|
|
|
|
|
License and implementation |
|
| 14,224 |
|
|
| 12,976 |
|
|
| 15,555 |
|
SaaS and maintenance |
|
| 46,872 |
|
|
| 40,717 |
|
|
| 26,014 |
|
Total cost of revenues |
|
| 61,096 |
|
|
| 53,693 |
|
|
| 41,569 |
|
Gross profit |
|
| 70,073 |
|
|
| 53,278 |
|
|
| 52,199 |
|
Operating expenses: |
|
|
|
|
|
|
|
|
|
|
|
|
Research and development |
|
| 31,064 |
|
|
| 23,706 |
|
|
| 17,906 |
|
Sales and marketing |
|
| 41,339 |
|
|
| 32,261 |
|
|
| 30,300 |
|
General and administrative |
|
| 36,281 |
|
|
| 30,051 |
|
|
| 23,132 |
|
Total operating expenses |
|
| 108,684 |
|
|
| 86,018 |
|
|
| 71,338 |
|
Loss from operations |
|
| (38,611 | ) |
|
| (32,740 | ) |
|
| (19,139 | ) |
Interest expense (income), net |
|
| 4,159 |
|
|
| (50 | ) |
|
| (6 | ) |
Other expenses (income), net |
|
| 62 |
|
|
| 86 |
|
|
| (22 | ) |
Loss before income taxes |
|
| (42,832 | ) |
|
| (32,776 | ) |
|
| (19,111 | ) |
(Benefit) provision for income taxes |
|
| (3,285 | ) |
|
| 335 |
|
|
| 528 |
|
Net loss |
| $ | (39,547 | ) |
| $ | (33,111 | ) |
| $ | (19,639 | ) |
Net loss per share attributable to common stockholders: |
|
|
|
|
|
|
|
|
|
|
|
|
Basic and diluted |
| $ | (1.38 | ) |
| $ | (1.21 | ) |
| $ | (0.76 | ) |
Weighted average number of shares used in computing net loss per share attributable to common stockholders: |
|
|
|
|
|
|
|
|
|
|
|
|
Basic and diluted |
|
| 28,649 |
|
|
| 27,379 |
|
|
| 26,015 |
|
The accompanying notes are an integral part of these consolidated financial statements.
MODEL N, INC.
Consolidated Statements of Convertible Preferred Stock and Stockholders’ Equity (Deficit)Comprehensive Loss
(in thousands)
| Convertible Preferred Stock | Common Stock | Additional Paid-In Capital | Accumulated Other Comprehensive Loss | Accumulated Deficit | Total Stockholders’ Equity (Deficit) | |||||||||||||||||||||||||||
| Shares | Amount | Shares | Amount | |||||||||||||||||||||||||||||
Balance at September 30, 2011 | 20,103 | $ | 41,776 | 7,583 | $ | 1 | $ | 5,912 | $ | (120 | ) | $ | (55,496 | ) | $ | (49,703 | ) | |||||||||||||||
Issuance of common stock upon exercise of stock options | — | — | 348 | — | 600 | — | — | 600 | ||||||||||||||||||||||||
Issuance of restricted stock awards | — | — | 200 | — | — | — | — | — | ||||||||||||||||||||||||
Stock-based compensation | — | — | — | — | 2,533 | — | — | 2,533 | ||||||||||||||||||||||||
Net loss | — | — | — | — | — | — | (5,693 | ) | (5,693 | ) | ||||||||||||||||||||||
|
|
|
|
|
|
|
|
|
|
|
|
|
| |||||||||||||||||||
Balance at September 30, 2012 | 20,103 | $ | 41,776 | 8,131 | 1 | 9,045 | (120 | ) | (61,189 | ) | (52,263 | ) | ||||||||||||||||||||
Issuance of common stock upon initial public offering (IPO) | — | — | 7,011 | 1 | 101,063 | — | — | 101,064 | ||||||||||||||||||||||||
Reclassification of deferred offering cost from other assets to additional paid-in capital upon IPO | — | — | — | — | (3,256 | ) | — | — | (3,256 | ) | ||||||||||||||||||||||
Conversion of convertible preferred stock to common stock upon IPO | (20,103 | ) | (41,776 | ) | 7,250 | 1 | 41,775 | — | — | 41,776 | ||||||||||||||||||||||
Reclassification of preferred stock warrant liability to additional paid-in capital upon IPO | — | — | — | — | 1,419 | — | — | 1,419 | ||||||||||||||||||||||||
Adjustment to deferred offering cost | — | — | — | — | 88 | — | — | 88 | ||||||||||||||||||||||||
Issuance of common stock upon exercise of preferred stock warrant | — | — | 72 | — | — | — | — | — | ||||||||||||||||||||||||
Issuance of common stock upon exercise of stock options | — | — | 565 | — | 860 | — | — | 860 | ||||||||||||||||||||||||
Issuance of common stock upon release of restricted stock units | — | — | 7 | — | — | — | — | — | ||||||||||||||||||||||||
Cancellation of forfeited restricted stock awards | — | — | (37 | ) | — | — | — | — | — | |||||||||||||||||||||||
Stock-based compensation | — | — | — | — | 5,038 | — | — | 5,038 | ||||||||||||||||||||||||
Other comprehensive loss | — | — | — | — | — | (182 | ) | — | (182 | ) | ||||||||||||||||||||||
Net loss | — | — | — | — | — | — | (926 | ) | (926 | ) | ||||||||||||||||||||||
|
|
|
|
|
|
|
|
|
|
|
|
|
|
|
| |||||||||||||||||
Balance at September 30, 2013 | — | $ | — | 22,999 | $ | 3 | $ | 156,032 | $ | (302 | ) | $ | (62,115 | ) | $ | 93,618 | ||||||||||||||||
Issuance of common stock upon exercise of stock options | — | — | 1,689 | �� | 1 | 3,034 | — | — | 3,035 | |||||||||||||||||||||||
Issuance of common stock upon release of restricted stock units | — | — | 58 | — | — | — | — | — | ||||||||||||||||||||||||
Issuance of common stock under stock purchase plans | — | — | 339 | — | 3,203 | — | — | 3,203 | ||||||||||||||||||||||||
Stock-based compensation | — | — | — | — | 9,976 | — | — | 9,976 | ||||||||||||||||||||||||
Other comprehensive income | — | — | — | — | — | 13 | — | 13 | ||||||||||||||||||||||||
Net loss | — | — | — | — | — | — | (20,881 | ) | (20,881 | ) | ||||||||||||||||||||||
|
|
|
|
|
|
|
|
|
|
|
|
|
|
|
| |||||||||||||||||
Balance at September 30, 2014 | — | $ | — | 25,085 | $ | 4 | $ | 172,245 | $ | (289 | ) | $ | (82,996 | ) | $ | 88,964 | ||||||||||||||||
|
|
|
|
|
|
|
|
|
|
|
|
|
|
|
| |||||||||||||||||
|
| Fiscal Years Ended September 30, |
| |||||||||
|
| 2017 |
|
| 2016 |
|
| 2015 |
| |||
Net loss |
| $ | (39,547 | ) |
| $ | (33,111 | ) |
| $ | (19,639 | ) |
Other comprehensive income (loss), net: |
|
|
|
|
|
|
|
|
|
|
|
|
Change in foreign currency translation adjustment |
|
| 60 |
|
|
| (96 | ) |
|
| (177 | ) |
Total comprehensive loss |
| $ | (39,487 | ) |
| $ | (33,207 | ) |
| $ | (19,816 | ) |
The accompanying notes are an integral part of these consolidated financial statements.
MODEL N, INC.
Consolidated Statements of Cash FlowsStockholders’ Equity
(in thousands)
| Fiscal Years Ended September 30, | ||||||||||||
| 2014 | 2013 | 2012 | ||||||||||
Cash Flows From Operating Activities: | ||||||||||||
Net loss | $ | (20,881 | ) | $ | (926 | ) | $ | (5,693 | ) | |||
Adjustments to reconcile net loss to net cash used in operating activities | ||||||||||||
Depreciation and amortization | 3,385 | 1,877 | 1,526 | |||||||||
Amortization of intangible assets | 331 | 330 | 234 | |||||||||
Stock-based compensation | 9,949 | 4,856 | 2,521 | |||||||||
Changes in fair value of preferred stock warrant liability and other, net | — | 671 | 345 | |||||||||
Other non cash charges, net | 83 | 151 | 221 | |||||||||
Changes in assets and liabilities: | ||||||||||||
Accounts receivable | 983 | (3,719 | ) | 936 | ||||||||
Prepaid expenses and other assets | 407 | (3,043 | ) | (852 | ) | |||||||
Deferred cost of implementation services | 242 | 925 | (314 | ) | ||||||||
Accounts payable | 685 | 264 | (284 | ) | ||||||||
Accrued employee compensation | (4,624 | ) | 6,275 | 1,871 | ||||||||
Other accrued and long-term liabilities | (500 | ) | 900 | 2,103 | ||||||||
Deferred revenue | 3,890 | (8,975 | ) | 3,109 | ||||||||
|
|
|
|
|
| |||||||
Net cash (used in) provided by operating activities | (6,050 | ) | (414 | ) | 5,723 | |||||||
|
|
|
|
|
| |||||||
Cash Flows From Investing Activities: | ||||||||||||
Purchases of property and equipment | (1,835 | ) | (1,392 | ) | (1,760 | ) | ||||||
Capitalization of software development costs | (381 | ) | (3,741 | ) | (1,145 | ) | ||||||
Net purchase of short-term investments | — | (7 | ) | — | ||||||||
Acquisition of a business | — | — | (3,000 | ) | ||||||||
|
|
|
|
|
| |||||||
Net cash used in investing activities | (2,216 | ) | (5,140 | ) | (5,905 | ) | ||||||
|
|
|
|
|
| |||||||
Cash Flows From Financing Activities: | ||||||||||||
Proceeds from initial public offering, net of offering costs of $7.6 million | — | 101,064 | — | |||||||||
Proceeds from exercise of stock options and employee stock purchase plan | 6,238 | 860 | 600 | |||||||||
Payments for deferred offering costs | (6 | ) | (2,914 | ) | (220 | ) | ||||||
Principal payments on capital lease obligations | (318 | ) | (586 | ) | (537 | ) | ||||||
Principal payments on loan | — | (5,208 | ) | (2,292 | ) | |||||||
|
|
|
|
|
| |||||||
Net cash (used in) provided by financing activities | 5,914 | 93,216 | (2,449 | ) | ||||||||
|
|
|
|
|
| |||||||
Effect of exchange rate changes on cash and cash equivalents | 8 | (80 | ) | (21 | ) | |||||||
Net increase (decrease) in cash and cash equivalents | (2,344 | ) | 87,582 | (2,652 | ) | |||||||
Cash and cash equivalents | ||||||||||||
Beginning of year | 103,350 | 15,768 | 18,420 | |||||||||
|
|
|
|
|
| |||||||
End of year | $ | 101,006 | $ | 103,350 | $ | 15,768 | ||||||
|
|
|
|
|
| |||||||
Supplemental Disclosure of Cash Flow Data: | ||||||||||||
Cash paid for income taxes | $ | 246 | $ | 270 | $ | 273 | ||||||
Cash paid for interest | 11 | 298 | 634 | |||||||||
Noncash Investing and Financing Activities: | ||||||||||||
Acquisition of property and equipment under capital leases | $ | — | $ | — | $ | 95 | ||||||
Capitalized stock options in software development costs | 27 | 182 | 12 | |||||||||
Conversion of preferred stock warrant to common stock warrant | — | 1,419 | — | |||||||||
Net settlement for exercise of common stock warrant | — | 300 | — | |||||||||
Conversion of convertible preferred stock to common stock | — | 41,776 | — | |||||||||
Deferred offering costs not yet paid | — | 6 | 473 | |||||||||
|
|
|
|
|
|
|
|
|
|
|
|
|
| Accumulated |
|
|
|
|
|
|
|
|
| |
|
|
|
|
|
|
|
|
|
| Additional |
|
| Other |
|
|
|
|
|
| Total |
| |||
|
| Common Stock |
|
| Paid-In |
|
| Comprehensive |
|
| Accumulated |
|
| Stockholders' |
| |||||||||
|
| Shares |
|
| Amount |
|
| Capital |
|
| Loss |
|
| Deficit |
|
| Equity |
| ||||||
Balance at September 30, 2014 |
|
| 25,085 |
|
| $ | 4 |
|
| $ | 172,245 |
|
| $ | (289 | ) |
| $ | (82,996 | ) |
| $ | 88,964 |
|
Issuance of common stock upon exercise of stock options |
|
| 354 |
|
|
| — |
|
|
| 1,312 |
|
|
| — |
|
|
| — |
|
|
| 1,312 |
|
Issuance of common stock upon release of restricted stock units |
|
| 963 |
|
|
| — |
|
|
| — |
|
|
| — |
|
|
| — |
|
|
| — |
|
Issuance of common stock under stock purchase plans |
|
| 264 |
|
|
| — |
|
|
| 2,138 |
|
|
| — |
|
|
| — |
|
|
| 2,138 |
|
Stock-based compensation |
|
| — |
|
|
| — |
|
|
| 10,464 |
|
|
| — |
|
|
| — |
|
|
| 10,464 |
|
Other comprehensive loss |
|
| — |
|
|
| — |
|
|
| — |
|
|
| (177 | ) |
|
| — |
|
|
| (177 | ) |
Net loss |
|
| — |
|
|
| — |
|
|
| — |
|
|
| — |
|
|
| (19,639 | ) |
|
| (19,639 | ) |
Balance at September 30, 2015 |
|
| 26,666 |
|
|
| 4 |
|
|
| 186,159 |
|
|
| (466 | ) |
|
| (102,635 | ) |
|
| 83,062 |
|
Issuance of common stock upon exercise of stock options |
|
| 233 |
|
|
| — |
|
|
| 923 |
|
|
| — |
|
|
| — |
|
|
| 923 |
|
Issuance of common stock upon release of restricted stock units |
|
| 719 |
|
|
| — |
|
|
| — |
|
|
| — |
|
|
| — |
|
|
| — |
|
Issuance of common stock under stock purchase plans |
|
| 273 |
|
|
| — |
|
|
| 2,356 |
|
|
| — |
|
|
| — |
|
|
| 2,356 |
|
Stock-based compensation |
|
| — |
|
|
| — |
|
|
| 13,068 |
|
|
| — |
|
|
| — |
|
|
| 13,068 |
|
Other comprehensive loss |
|
| — |
|
|
| — |
|
|
| — |
|
|
| (96 | ) |
|
| — |
|
|
| (96 | ) |
Net loss |
|
| — |
|
|
| — |
|
|
| — |
|
|
| — |
|
|
| (33,111 | ) |
|
| (33,111 | ) |
Balance at September 30, 2016 |
|
| 27,891 |
|
|
| 4 |
|
|
| 202,506 |
|
|
| (562 | ) |
|
| (135,746 | ) |
|
| 66,202 |
|
Issuance of common stock upon exercise of stock options |
|
| 329 |
|
|
| — |
|
|
| 1,339 |
|
|
| — |
|
|
| — |
|
|
| 1,339 |
|
Issuance of common stock upon release of restricted stock units |
|
| 813 |
|
|
| — |
|
|
| — |
|
|
| — |
|
|
| — |
|
|
| — |
|
Issuance of common stock under stock purchase plans |
|
| 290 |
|
|
| — |
|
|
| 2,647 |
|
|
| — |
|
|
| — |
|
|
| 2,647 |
|
Stock-based compensation |
|
| — |
|
|
| — |
|
|
| 10,560 |
|
|
| — |
|
|
| — |
|
|
| 10,560 |
|
Other comprehensive income |
|
| — |
|
|
| — |
|
|
| — |
|
|
| 60 |
|
|
| — |
|
|
| 60 |
|
Net loss |
|
| — |
|
|
| — |
|
|
| — |
|
|
| — |
|
|
| (39,547 | ) |
|
| (39,547 | ) |
Balance at September 30, 2017 |
|
| 29,323 |
|
| $ | 4 |
|
| $ | 217,052 |
|
| $ | (502 | ) |
| $ | (175,293 | ) |
| $ | 41,261 |
|
The accompanying notes are an integral part of these consolidated financial statements.
MODEL N, INC.
Consolidated Statements of Cash Flows
(in thousands)
|
| Fiscal Years Ended September 30, |
| |||||||||
|
| 2017 |
|
| 2016 |
|
| 2015 |
| |||
Cash flows from operating activities: |
|
|
|
|
|
|
|
|
|
|
|
|
Net loss |
| $ | (39,547 | ) |
| $ | (33,111 | ) |
| $ | (19,639 | ) |
Adjustments to reconcile net loss to net cash used in operating activities |
|
|
|
|
|
|
|
|
|
|
|
|
Depreciation and amortization |
|
| 8,185 |
|
|
| 5,929 |
|
|
| 4,076 |
|
Stock-based compensation |
|
| 10,560 |
|
|
| 13,068 |
|
|
| 10,355 |
|
Amortization of debt discount and issuance costs |
|
| 683 |
|
|
| — |
|
|
| — |
|
Deferred income taxes |
|
| (3,952 | ) |
|
| 172 |
|
|
| 33 |
|
Other non-cash charges |
|
| 216 |
|
|
| (94 | ) |
|
| 194 |
|
Changes in assets and liabilities, net of acquisition: |
|
|
|
|
|
|
|
|
|
|
|
|
Accounts receivable |
|
| 1,420 |
|
|
| (2,850 | ) |
|
| (925 | ) |
Prepaid expenses and other assets |
|
| 2,117 |
|
|
| (1,458 | ) |
|
| (1,218 | ) |
Deferred cost of implementation services |
|
| 1,502 |
|
|
| (996 | ) |
|
| (518 | ) |
Accounts payable |
|
| (1,558 | ) |
|
| 1,494 |
|
|
| 457 |
|
Accrued employee compensation |
|
| 2,626 |
|
|
| (677 | ) |
|
| (16 | ) |
Other accrued and long-term liabilities |
|
| 13 |
|
|
| 253 |
|
|
| 976 |
|
Deferred revenue |
|
| 5,770 |
|
|
| 5,946 |
|
|
| (2,547 | ) |
Net cash used in operating activities |
|
| (11,965 | ) |
|
| (12,324 | ) |
|
| (8,772 | ) |
Cash flows from investing activities: |
|
|
|
|
|
|
|
|
|
|
|
|
Purchases of property and equipment |
|
| (359 | ) |
|
| (2,102 | ) |
|
| (2,075 | ) |
Acquisition of business, net of cash acquired |
|
| (47,773 | ) |
|
| (12,615 | ) |
|
| — |
|
Capitalization of software development costs |
|
| (369 | ) |
|
| (1,072 | ) |
|
| (2,531 | ) |
Net cash used in investing activities |
|
| (48,501 | ) |
|
| (15,789 | ) |
|
| (4,606 | ) |
Cash flows from financing activities: |
|
|
|
|
|
|
|
|
|
|
|
|
Proceeds from exercise of stock options and issuance of employee stock purchase plan |
|
| 3,986 |
|
|
| 3,279 |
|
|
| 3,450 |
|
Proceeds from term loan |
|
| 48,686 |
|
|
| — |
|
|
| — |
|
Debt issuance costs |
|
| (806 | ) |
|
| — |
|
|
| — |
|
Net cash provided by financing activities |
|
| 51,866 |
|
|
| 3,279 |
|
|
| 3,450 |
|
Effect of exchange rate changes on cash and cash equivalents |
|
| 9 |
|
|
| (36 | ) |
|
| (59 | ) |
Net decrease in cash and cash equivalents |
|
| (8,591 | ) |
|
| (24,870 | ) |
|
| (9,987 | ) |
Cash and cash equivalents |
|
|
|
|
|
|
|
|
|
|
|
|
Beginning of period |
|
| 66,149 |
|
|
| 91,019 |
|
|
| 101,006 |
|
End of period |
| $ | 57,558 |
|
| $ | 66,149 |
|
| $ | 91,019 |
|
|
|
|
|
|
|
|
|
|
|
|
|
|
Supplemental Disclosure of Cash Flow Data: |
|
|
|
|
|
|
|
|
|
|
|
|
Cash paid for income taxes |
| $ | 677 |
|
| $ | 233 |
|
| $ | 364 |
|
Cash paid for interest |
|
| 3,462 |
|
|
| — |
|
|
| — |
|
Noncash Investing and Financing Activities: |
|
|
|
|
|
|
|
|
|
|
|
|
Promissory notes issued for acquisition |
| $ | 8,643 |
|
|
| — |
|
|
| — |
|
Capitalized stock options in software development costs |
|
| — |
|
|
| — |
|
|
| 109 |
|
The accompanying notes are an integral part of these consolidated financial statements.
58
MODEL N, INC.
Notes to Consolidated Financial Statements
Model N, Inc. (Company) was incorporated in Delaware on December 14, 1999. The Company is a provider of revenue management solutions for the life sciencesciences and technology industries. The Company’s solutions enable its customers to maximize revenues and reduce revenue compliance risk by transforming their revenue life cycle from a series of tactical, disjointed operations into a strategic end-to-end process, which enables them to manage the strategy and execution of pricing, contracting, incentives and rebates. The Company’s corporate headquarters are located in Redwood City,San Mateo, California, with additional offices in the United States, India the United Kingdom and Switzerland.
Fiscal Year
The Company’s fiscal year ends on September 30. References to fiscal year 2014,2017, for example, refer to the fiscal year ended September 30, 2014.2017.
2. Summary of Significant Accounting Policies and Estimates
Basis for Presentation
The Company’s consolidated financial statements and accompanying notes are prepared in accordance with accounting principles generally accepted in the United States of America (U.S. GAAP)(“U.S. GAAP”) and include the accounts of the Company and its wholly owned subsidiaries. All significant intercompany balances and transactions have been eliminated upon consolidation. The Company has evaluated subsequent events through the date that the financial statements were issued.
Use of Estimates
The preparation of the accompanying consolidated financial statements in conformity with U.S. GAAP requires management to make certain estimates and assumptions that affect the amounts of assets and liabilities reported, disclosures about contingent assets and liabilities, and reported amounts of revenues and expenses during the reporting periods. Significant items subject to such estimates include revenue recognition, legal contingencies, income taxes, stock-based compensation software development costs and valuation of goodwill and intangibles. These estimates and assumptions are based on management’s best estimates and judgment. Management regularly evaluates its estimates and assumptions using historical experience and other factors; however, actual results could differ significantly from these estimates.
Revenue Recognition
Revenues are comprised of license and implementation revenues and Software as a Service (SaaS)(“SaaS”) and maintenance revenues.
License and Implementation
License and implementation revenues include revenues from the sale of perpetual software licenses for the Company’s solutions and the related implementation services. Based on the nature and scope of the implementation services, the Company has concluded that generally the implementation services are essential to its customers’ usabilityuse of its on premisethe on-premise solutions, and therefore, the Company recognizes revenues from the sale of software licenses for its on premiseon-premise solutions and the related implementation services on a percentage-of-completion basis over the expected implementation period. The Company estimates the length of this period based on a number of
MODEL N, INC.
Notes to Consolidated Financial Statements
factors, including the number of licensed applications and the scope and complexity of the customer’s deployment requirements. The percentage-of-completion computation is measured byas the hours expended on the implementation of the Company’s software solutions during the reporting period as a percentage of the total estimated hours estimated to be necessaryneeded to complete the implementation of the Company’s software solutions.implementation.
SaaS and Maintenance
SaaS and maintenance revenues primarily include subscription and the related implementation fees from customers accessing the Company’s cloud-based solutions and revenues associated with maintenance and support contracts from customers using on premiseon-premise solutions. Also included in SaaS and maintenance revenues are other revenues, including revenues related to applicationmanaged support services, training and customer-reimbursed expenses.
SaaS arrangements include multiple elements, comprised of subscription fees and related implementation services. In SaaS arrangements where59
MODEL N, INC.
Notes to Consolidated Financial Statements
The Company has determined that its subscriptions have standalone value without the implementation services are complex and do not have a stand-alone value to the customers, the Company considers the entire arrangement consideration, including subscription fees and related implementation services, as a single unit of accounting in accordance with the provisions of Financial Accounting Standards Board (FASB) Accounting Standards Update (ASU) No. 2009-13, Revenue Recognition (Accounting Standards Codification (ASC) Topic 605)—Multiple-Deliverable Revenue Arrangements. In such arrangements, the Company recognizes SaaS revenues ratably beginning the day the customer is provided access to the subscription service through the longer of the initial contractual period or term of the expected customer relationship.
In SaaS arrangements where subscription fees and implementation services have a standalone value, the Company allocates revenue to each elementdeliverable in the arrangement based on a selling price hierarchy. The selling price for a deliverable is based on its vendor-specific objective evidence (VSOE), if available, third-party evidence (TPE), if VSOE is not available, or best estimated selling price (BESP), if neither VSOE nor TPE isare available. As the Company has been unable to establish VSOE or TPE for the elements of its SaaS arrangements, the Company establishesestablished the BESP for each element by considering company-specific factors such as existing pricing and discounting. The total arrangement fee for a multiple element arrangement is allocated based on the relative selling price method, taking into consideration contingent revenue restraints. The consideration allocated to subscription fees is recognized as revenue ratably over the contract period. The consideration allocated to implementation services is recognized as revenue as services are performed. The total
Prior to fiscal year 2016, for SaaS arrangements related to Revenue Cloud for Life Science and High Tech companies the Company treated the entire arrangement fee forconsideration, including subscription fees and related implementation services fees, as a multiple element arrangement is allocated based onsingle unit of accounting and recognized the relative BESPrevenues ratably beginning the day the customer was provided access to the subscription service through the end of each element.contractual period. During fiscal year 2016, the Company concluded that the SaaS deliverable has standalone value to the customer without the implementation services, primarily due to the number of third-party consulting companies that have the know-how to be able to independently perform the implementation services.
Revenue related to up-front fees are deferred and recognized ratably over the estimated period that the customer benefits from the related service.
Maintenance and support revenuesrevenue include post-contract customer support and the right to unspecified software updates and enhancements on a when and if available basis. ApplicationManaged support revenues includeservices revenue includes supporting, managing and administering our software solutions, and providing additional end user support. Maintenance and support revenuesrevenue and applicationmanaged support revenuesservices revenue are recognized ratably over the period in which the services are provided. The revenuesrevenue from training and customer-reimbursed expenses areis recognized as the Company delivers these services.
Arrangements that include term-based licenses for current products with the right to use unspecified future versions of the software and maintenance and support during the coverage period, are also accounted for as subscriptions, with revenue recognized ratably over the coverage period.
Revenue Recognition
The Company commences revenue recognition when all of the following conditions are satisfied: persuasive evidence of an arrangement exists, delivery has occurred or services have been rendered, the price is fixed or determinable and collection is probable.probable or reasonable estimable. However, determining whether and when some of these criteria have been satisfied often involves assumptions and judgments that can have a significant impact on the timing and amount of revenues the Company reports.
MODEL N, INC.
Notes to Consolidated Financial Statements
For multiple software element arrangements, the Company allocates the sales price among each of the deliverables using the residual method, under which revenue is allocated to undelivered elements based on their VSOE of fair value. VSOE is the price charged when an element is sold separately or a price set by management with the relevant authority. The Company has established VSOE for maintenance and support and training.
The Company does not offer any contractual rights of return rebates or price protection.concessions. The Company’s implementation projects generally have a term ranging from a few months to three yearstwelve months and may be terminated by the customer at any time. Should a loss be anticipated on a contract, the full amount of the loss is recorded when the loss is determinable. The Company updates its estimates regarding the completion of implementations based on changes to the expected contract value and revisions to its estimates of time required to complete each implementation project. Amounts that may be payable to customers to settle customer disputes are recorded as a reduction in revenues or reclassified from deferred revenue to customer payables in accrued liabilities and other long-term liabilities.
60
MODEL N, INC.
Notes to Consolidated Financial Statements
Costs of Revenues
Cost of license and implementation revenues consists primarily of personnel-related costs including salary, bonus, stock-based compensation, and overhead allocation as well as third-party contractors,contractor costs and royalty fees paid to third parties for the right to intellectual property and travel-related expenses.property. Cost of SaaS and maintenance revenues consists primarily of personnel-related costs including salary, customer reimbursable expense, bonus, stock-based compensation, and overhead allocation as well as reimbursable expenses, third-partythird party contractors, facility expense, amortization of costs recorded on internally developedintangibles and depreciation expense related to server equipment including capitalized software and data center-related expenses.
Deferred cost of implementation services consists of costs related to implementation services that were provided to the customer but the revenues for the services have not yet been recognized, provided however that the customer is contractually required to pay for the services. These costs primarily consist of personnel costs. As of September 30, 20142017 and 2013,2016, the deferred cost of implementation services totaled $0.6 million and $0.8$2.1 million, respectively.
Warranty
The Company provides limited warranties on all sales and provides for the estimated cost of warranties at the date of sale. The estimated cost of warranties has not been material to date.
Foreign Currency Translation
The functional currency of the Company’s foreign subsidiaries is their respective local currency. The Company translates all assets and liabilities of foreign subsidiaries to U.S. dollars at the current exchange rate as of the applicable consolidated balance sheet date. Revenues and expenses are translated at the average exchange rate prevailing during the period. The effects of foreign currency translations are recorded in accumulated other comprehensive loss as a separate component of stockholders’ equity (deficit) in the accompanying consolidated statements of stockholders’ equity. Realized gains and losses from foreign currency transactions are included in other expenses, net in the consolidated statements of operations and have not been material for all periods presented.
Cash and Cash Equivalents
The Company considers all highly liquid investments with an original or remaining maturity of three months at date of purchase to be cash equivalents. The Company’s cash equivalents are comprised of U.S. treasury bills and money market funds, and are maintained with financial institutions with high credit ratings. The deposits in money market funds are not federally insured.
MODEL N, INC.
Notes to Consolidated Financial Statements
Concentration of Credit Risk and Significant Customers
The Company maintains cash and cash equivalents with major financial institutions. The Company’s cash and cash equivalents consist of bank deposits held with banks, money market funds that, at times, exceed federally insured limits. The Company limits its credit risk by dealing with counterparties that are considered to be of high credit quality and by performing periodic evaluations of its investments and of the relative credit standing of these financial institutions.
Credit risk is the risk of loss from amounts owed by financial counterparties. Credit risk can occur at multiple levels; as a result of broad economic conditions, challenges within specific sectors of the economy, or from issues affecting individual companies. Financial instruments that potentially subject the Company to credit risk consist of cash equivalents and accounts receivable.
The Company maintains cash and cash equivalents with major financial institutions. The Company’s cash and cash equivalents consist of bank deposits held with banks, U.S. treasury bills and money market funds that, at times, exceed federally insured limits. The Company limits its credit risk by dealing with counterparties that are considered to be of high credit quality and by performing periodic evaluations of its investments and of the relative credit standing of these financial institutions.
In the normal course of business, the Company is exposed to credit risk from its customers. To reduce credit risk, the Company performs ongoing credit evaluations of its customers.
The following customers comprised 10% or more of the Company’s accounts receivable at September 30, 20142017 and 20132016 and of the Company’s total revenues for the fiscal years ended September 30, 2014, 20132017, 2016 and 2012,2015, respectively:
| As of September 30, | ||||||||||||||
| 2014 | 2013 |
| As of September 30, |
| ||||||||||
Accounts Receivable |
| 2017 |
| 2016 |
| |||||||||
Company A | 12 | % | 21 | % |
| N/A |
|
| 12% |
| ||||
Company B | * | 14 | ||||||||||||
Company C | * | 10 | ||||||||||||
|
|
|
|
|
|
| ||||||||
61
MODEL N, INC.
Notes to Consolidated Financial Statements
| Fiscal Years Ended September 30, | ||||||||||||
| 2014 | 2013 | 2012 | ||||||||||
Revenue | ||||||||||||
Company A | * | 12 | % | 14 | % | |||||||
Company B | * | * | 10 | % | ||||||||
Company C | 15 | % | 12 | % | * | |||||||
|
| Fiscal Years Ended September 30, |
| |||||||
Revenue |
| 2017 |
|
| 2016 |
| 2015 |
| ||
Company B |
|
| 11% |
|
| N/A |
|
| 11% |
|
Accounts Receivable and Allowance for Doubtful Accounts
Accounts receivable are recorded at the invoiced amount, net of allowances for doubtful accounts. The allowance for doubtful accounts is based on management’s assessment of the collectability of accounts. The Company regularly reviews the adequacy of this allowance for doubtful accounts by considering historical experience, the age of the accounts receivable balances, the credit quality of the customers, current economic conditions, and other factors that may affect customers’ ability to pay to determine whether a specific allowance is appropriate. Accounts receivable deemed uncollectable are charged against the allowance for doubtful accounts when identified.
Revenue that has been recognized, but for which the Company has not invoiced the customer, amounting to $0.8 $4.6million and $1.6and $2.8 million is recorded as unbilled receivables and is included in accounts receivables in the consolidated balance sheets as of September 30, 20142017 and 2013,2016, respectively. Invoices that have been issued before revenue has been recognized are recorded as deferred revenue in the consolidated balance sheets.
MODEL N, INC.
Notes to Consolidated Financial Statements
Property and Equipment, Net
Property and equipment are recorded at cost less accumulated depreciation. Depreciation of property and equipment is calculated using on a straight-line basis over the estimated useful lives of the assets. Leasehold improvements are amortized on a straight-line basis over the shorter of lease term or estimated useful lives of the assets.
The estimated useful lives of property and equipment are as follows:
Computer software and equipment | 2-5 years | |
Furniture and fixtures | 2-5 years | |
Leasehold improvements | Shorter of the lease term or estimated useful life | |
Software development costs | 3 years |
Costs of maintenance and repairs that do not improve or extend the lives of the respective assets are charged to expense as incurred. Upon retirement or sale of property and equipment, the cost and related accumulated depreciation are removed from the balance sheet and the resulting gain or loss is reflected in statement of operations.
Capital Leases
Computer equipment leases are capitalized when the Company assumes substantially all risks and benefits of ownership of the computer equipment. Accordingly, the Company records the asset and obligation at an amount equal to the lesser of the fair market value of the computer equipment or the net present value of the minimum lease payments at the inception of the lease. Leased computer equipment is depreciated using the straight-line basis over the shorter of its estimated useful life or the lease term.
Long-lived Assets
The Company continually monitors events and changes in circumstances that could indicate that carrying amounts of its long-lived assets, including property and equipment and intangible assets may not be recoverable. When such events or changes in circumstances occur, the Company assesses the recoverability of long-lived assets by determining whether the carrying value of such assets will be recovered through their undiscounted expected future cash flows. If the future undiscounted cash flows are less than the carrying amount of these assets, the Company recognizes an impairment loss based on the excess of the carrying amount over the fair value of the assets. The Company did not recognize any impairment charges on its long-lived assets during any periods presented.
62
MODEL N, INC.
Notes to Consolidated Financial Statements
Goodwill and Other Intangible Assets
The Company records goodwill when consideration paid in a purchasean acquisition exceeds the fair value of the net tangible assets and the identified intangible assets acquired. Goodwill is not amortized, but rather is tested for impairment annually or more frequently if facts andevents or changes in circumstances warrant a review. The Company has determinedindicate that there is a single reporting unit for the purposecarrying value may not be recoverable. We conducted our annual impairment test of goodwill impairment tests. The Company performs a goodwill impairment test annually duringas of September 30, 2017 and 2016. We have elected to first assess the fourth quarter of its fiscal year and more frequently if an event or circumstance indicates that impairment may have occurred. Such events or circumstances may include significant adverse changes in the general business environment, among other things. If the conclusion of a qualitative assessment is thatfactors to determine whether it is more likely than not that the fair value of aour single reporting unit is less than its carrying amount as a basis for determining whether it is necessary to perform the Company estimatestwo-step goodwill impairment under Accounting Standards Update (ASU) No. 2011-08, Goodwill and Other (Topic 350): Testing Goodwill for Impairment, issued by the Financial Accounting Standards Board (FASB). If we determine that it is more likely than not that its fair value is less than its carrying amount, then the two-step goodwill impairment test is performed. The first step, identifying a potential impairment, compares the fair value of the reporting unit andwith its carrying amount. If the carrying amount exceeds its fair value, the second step would need to be performed; otherwise, no further step is required. The second step, measuring the impairment loss, compares this amount to the
MODEL N, INC.
Notes to Consolidated Financial Statements
carrying implied fair value of the reporting unit. Ifgoodwill with the Company determines thatcarrying amount of the goodwill. Any excess of the goodwill carrying amount over the applied fair value is recognized as an impairment loss, and the carrying value of the reporting unit exceeds itsgoodwill is written down to fair value, an impairment charge would be required. During the fourth quarter of fiscal 2014, the Company completed its annual impairment test of goodwill. Based upon the qualitative assessment, the Company determined that its goodwill was not impaired as of September 30, 2014. There are no impairment charges related to purchased intangible assets during the fiscal year 2014 and 2013. Other intangiblevalue.
Intangible assets, consisting of developed technology, backlog, non-competition agreements and customer relationships and trade name, are stated at fair value less accumulated amortization. All intangible assets have been determined to have finite lives and are amortized on a straight-line basis over their estimated remaining economic lives, ranging from three to fiveten years. Amortization expense related to developed technology is included in cost of SaaS and maintenance revenue while amortization expense related to backlog, non-competition agreements, trade name and customer relationships is included in sales and marketing expense. No goodwill or intangible assets impairment has been identified in any of the years presented.
Research and Development and Capitalization of Software Development Costs
The Company generally expenses costs related to research and development, including those activities related to software solutions to be sold, leased or otherwise marketed. As such development work is essentially completed concurrently with the establishment of technological feasibility, and accordingly, the Company has not capitalized any such development costs.
The Company capitalizes certain software development costs incurred in connection with its cloud-based software platform for internal use. The Company capitalizes software development costs when application development begins, it is probable that the project will be completed, and the software will be used as intended. When development becomes substantially complete and ready for its intended use, such capitalized costs are amortized on a straight-line basis over the estimated useful life of the related asset, which is generally three years. Costs associated with preliminary project stage activities, training, maintenance and all post implementation stage activities are expensed as incurred. The Company capitalized software development costs of $0.4 million, $1.1 million and $2.5 million during the fiscal years ended September 30, 2017, 2016 and 2015, respectively.
Fair Value of Financial Instruments
The financial instruments of the Company consist primarily of cash and cash equivalents, accounts receivable, accounts payable and certain accrued liabilities. The Company regularly reviews its financial instruments portfolio to identify and evaluate such instruments that have indications of possible impairment. When there is no readily available market data, fair value estimates are made by the Company, which involves some level of management estimation and judgment and may not necessarily represent the amounts that could be realized in a current or future sale of these assets.
Based on borrowing rates currently available to the Company for financing obligations with similar terms and considering the Company’s credit risks, the carrying value of the financing obligation approximates fair value.
Fair value is defined as the exchange price that would be received for an asset or an exit price paid to transfer a liability in the principal or most advantageous market for the asset or liability in an orderly transaction between market participants on the measurement date. Valuation techniques used to measure fair value must maximize the use of observable inputs and minimize the use of unobservable inputs. The current accounting guidance for fair value instruments defines a three-level valuation hierarchy for disclosures as follows:
Level 1—Unadjusted quoted prices in active markets for identical assets or liabilities;
Level 2—Input other than quoted prices included in Level I that are observable, unadjusted quoted prices in markets that are not active, or other inputs for similar assets and liabilities that are observable or can be corroborated by observable market data; and
63
MODEL N, INC.
Notes to Consolidated Financial Statements
Level 3—Unobservable inputs that are supported by little or no market activity, which requires the Company to develop its own models and involves some level of management estimation and judgment.
The Company’s Level 1 assets consist of U.S. treasury bills and money market funds.cash equivalent. These instruments are classified within Level 1 of the fair value hierarchy because they are valued based on quoted market prices in active markets.
There were no Level 2 or 3 securities as of September 30, 2014 or 2013, respectively.
Research and Development and Capitalization of Software Development Costs
The Company generally expenses costs related to research and development, including those activities related to software solutions to be sold, leased or otherwise marketed. As such development work is essentially completed concurrently with the establishment of technological feasibility, and accordingly, the Company has not capitalized any such development costs.
MODEL N, INC.
Notes to Consolidated Financial Statements
The Company capitalizes certain software development costs incurred in connection with its cloud-based software platform for internal use. The Company capitalizes software development costs when application development begins, it is probable that the project will be completed, and the software will be used as intended. When development becomes substantially complete and ready for its intended use, such capitalized costs are amortized on a straight-line basis over the estimated useful life of the related asset, which is generally three years. Costs associated with preliminary project stage activities, training, maintenance and all post implementation stage activities are expensed as incurred. The Company capitalized software development costs of $0.4 million and $3.9 million during the fiscal years ended September 30, 2014 and 2013, respectively.
Sales Commissions
Sales commissions are recognized as an expense upon booking the contract. Substantially all of the compensation due to the sales force is earned at the time of the contract signing, with limited ability to recover any commissions paid if a contract is terminated.
Advertising and Promotion Costs
Advertising and promotion costs are expensed as incurred. The Company incurred no$0.3million in advertising and promotionpromotions costs during the fiscal years ended September 30, 20142017, 2016, and 2012. The Company incurred $1,000 of advertising and promotion costs during the fiscal year ended September 30, 2013.2015, respectively.
Employee Benefit Plan
The Company has a savings plan that qualifies under Section 401(k) of the Internal Revenue Code (IRC). There were noUnder these 401(k) Plans, matching or discretionary employer contributions madeare based upon the amount of the employees’ contributions subject to this plan during any periods presented.certain limitations. We contributed approximately $0.7 million, $0.6 million and $0.4 million for the years ended September 30, 2017, 2016 and 2015.
Stock-Based Compensation
Stock-based compensation expense for all share-based payment awards granted to our employees and directors including stock options employee stock purchase plan, performance-basedand restricted stock units and restricted stock(“RSUs”) is measured and recognized based on the estimated fair value of the award on the grant date. The Company uses the Black-Scholes-Merton valuation model to estimate the fair value of stock options and ESPP shares. For restricted stock awards and units, fair value is based on the closing price of our common stock on the grant date. The fair value is recognized as an expense, net of estimated forfeitures on a straight-lineratable basis, over the requisite service period, which is generally the vesting period of the respective award. In addition, theThe Company uses the Monte-Carloa Monte Carlo simulation option-pricing model to determine the fair value of its performance-based restricted stock units that contain(“PB-RSUs”) on the grant date. The fair value of these grants with a market condition such as thoseis recognized using the graded-vesting attribution method over the requisite service period. As the PB-RSUs are only granted to the Company’s three senior executives and approved byleadership team, the Compensation Committee ofCompany has determined no forfeiture rate would be applied to the Board on December 6, 2013.PB-RSUs. The Monte-Carlo simulation option-pricing model takes into account the same input assumptions asCompany uses the Black-Scholes-Merton model; however, it also further incorporates into the fair-value determination, the possibility that the market condition may not be satisfied. The determination ofvaluation model to estimate the fair value of performance-based restricted stock units using an option-pricingoption awards and employee stock purchase plan (“ESPP”). The Black-Scholes-Merton valuation model is affected by the Company’s stock price and its performance in relation to its peer group. The compensation costs related to performance-based restricted stock units with a market-based condition are recognized regardless of whether the market condition is satisfied, provided that the requisite service has been provided. The models requires the use of subjective assumptions to determine the fair value of stock option awards, including the expected stock price volatility over the expected term of the options, stock option exercise and cancellation behaviors, risk-free interest rates and expected dividends. The Company periodically estimates the portion of awards which will ultimately vest based on its historical forfeiture experience. These estimates are adjusted over the requisite service period to the extent that actual forfeitures differ, or are expected to differ, from the prior estimates.
MODEL N, INC.
Notes to Consolidated Financial Statements
Income Taxes
The Company accounts for income taxes in accordance with the FASB ASC No. 740—Accounting for Income Taxes (ASC 740). The Company makes certain estimates and judgments in determining income tax expense for financial statement purposes. These estimates and judgments occur in the calculation of tax credits, tax benefits and deductions and in the calculation of certain tax assets and liabilities, which arise from differences in the timing of recognition of revenue and expense for tax and financial statement purposes. Significant changes to these estimates may result in an increase or decrease to our tax provision in the subsequent period when such a change in estimate occurs.
64
MODEL N, INC.
Notes to Consolidated Financial Statements
The Company regularly assesses the likelihood that its deferred income tax assets will be realized from future taxable income based on the realization criteria set forth in ASC 740. To the extent that the Company believes any amounts are not more likely than not to be realized, the Company records a valuation allowance to reduce the deferred income tax assets. In assessing the need for a valuation allowance, the Company considers all available evidence, including past operating results, estimates of future taxable income and the feasibility of tax planning strategies. In the event the Company determines that all or part of the net deferred tax assets are not realizable in the future, an adjustment to the valuation allowance would be charged to earnings in the period such determination is made. Similarly, if the Company subsequently realizes deferred income tax assets that were previously determined to be unrealizable, the respective valuation allowance would be reversed, resulting in an adjustment to earnings in the period such determination is made.
As of September 30, 20142017 and 2013,2016, the Company had gross deferred income tax assets, related primarily to net operating loss (NOL) carry forwards, deferred revenues, accruals and reserves that are not currently deductible and depreciable and amortizable itemsitems of $34.7$92.5 million and $26.9$56.1 million, respectively, which have been fully offset by a valuation allowance. Utilization of these net loss carry forwards is subject to the limitations of IRC Section 382.382 (“the “Section 382 Limitations”). During the year ended September 30, 2013, the Company undertook a study of NOL carry forwards and determined that most of its NOL carry forwards that are not subject to the limitations of IRC Section 382.382 are not material. However, in the future, some portion or all of these carry forwards may not be available to offset any future taxable income.
Segment
The Company has one operating segment with one business activity, developing and monetizing revenue management solutions. The Company’s Chief Operating Decision Maker (CODM) is its Chief Executive Officer, who manages operations on a consolidated basis for purposes of allocating resources. When evaluating performance and allocating resources, the CODM reviews financial information as presented on a consolidated basis, accompaniedbasis.
Comprehensive Loss
Comprehensive loss is comprised of net loss and other comprehensive (loss) income. Other comprehensive loss includes foreign currency translation adjustments.
Recent Accounting Pronouncements
In May 2017, the FASB issued ASU 2017-09, Compensation-Stock Compensation (Topic 718): providing clarification on when modification accounting should be used for changes to the terms or conditions of a share-based payment award. This ASU does not change the accounting for modifications but clarifies that modification accounting guidance should only be applied if there is a change to the value, vesting conditions or award classification and would not be required if the changes are considered non-substantive. The amendments of this ASU are effective for reporting periods beginning after December 15, 2017, with early adoption permitted. The Company is currently evaluating the impact of this standard, but does not believe this will have material impact on its consolidated financial statements.
In January 2017, the FASB issued ASU 2017-04, Intangibles—Goodwill and Other (Topic 350): Simplifying the Test for Goodwill Impairment. This new accounting standard update simplifies the measurement of goodwill by disaggregated informationeliminating the Step two impairment test. Step two measures a goodwill impairment loss by comparing the implied fair value of goodwill with the carrying amount of that goodwill. The new guidance requires a comparison of the Company’s fair value of with carrying amount and the Company is required to recognize an impairment charge for the amount by which the carrying amount exceeds the fair value. Additionally, we should consider income tax effects from any tax deductible goodwill on the carrying amount when measuring the goodwill impairment loss, if applicable. The new guidance becomes effective for goodwill impairment tests in fiscal years beginning after December 15, 2019, though early adoption is permitted. The Company is currently evaluating the impact this standard will have on its consolidated financial statements.
In January 2017, the FASB issued ASU 2017-01, Business Combination (Topic 805):clarifying the definition of a business. The amendments in this guidance change the definition of a business operationsto assist with evaluating when a set of revenue management solutions.
Net (Loss) Income per Share
transferred assets and activities is a business. The Company’s basic net (loss) income per share attributable to common stockholders is calculated by dividing the net (loss) income attributable to common stockholders by the weighted average number of shares of common stock outstandingguidance becomes effective for the period, which excludes unvested restricted stock awards.Company at the beginning of its first quarter of fiscal 2019. Early adoption is permitted. The diluted net (loss) income per share attributable to common stockholdersCompany is computed by giving effect to all potentially dilutive common stock equivalents outstanding forcurrently evaluating the period. For purposes ofimpact this calculation, convertible preferred stock, warrants outstanding, options to purchase common stock, unvested restricted stock awards and unvested restricted stock units are considered to be common stock equivalents.
65
MODEL N, INC.
Notes to Consolidated Financial Statements
Since the Company has issued securities other than common stock that participate in dividends with the common stock, or participating securities, it is required to apply the two-class method to compute the net (loss) income per share attributable to common stockholders. The Company determined that as of the end of the fiscal year 2012, it had participating securities outstanding in the form of noncumulative convertible preferred stock that share in dividends with common stock. The two-class method requires that the Company calculate the net (loss) income per share using net income attributable to the common stockholders which will differ from the Company’s net income. Net (loss) income attributable to the common stockholders is generally equal to the net (loss) income less assumed periodic preferred stock dividends with any remaining earnings, after deducting assumed dividends, to be allocated on a pro rata basis between the outstanding common and preferred stock as of the end of each period.
Comprehensive (Loss) Income
Comprehensive income (loss) income is comprised of net income (loss) income and other comprehensive (loss) income. Other comprehensive (loss) income primarily includes foreign currency translation adjustments.
Recently Adopted Accounting Pronouncements
In December 2011,November 2016, the FASB issued ASU No. 2011-11—Balance Sheet2016-18, Restricted Cash (Topic 210): Disclosures about Offsetting Assets230), clarifying the classification and Liabilities requiring enhanced disclosures about certain financial instruments and derivative instruments that are offsetpresentation of restricted cash in the consolidatedstatement of cash flows. The standard requires that restricted cash and restricted cash equivalents are included in the cash and cash equivalent balance sheets or that are subject to enforceable master netting arrangements or similar agreements. This updatein the statement of cash flows. Further, reconciliation between the balance sheet and statement of cash flows is required when the balance sheet includes more than one line item for cash, cash equivalents, restricted cash, and restricted cash equivalents. Therefore, transfers between these balances should no longer be presented as a cash flow activity. The guidance becomes effective for fiscal years, and interim periods within those fiscal years, beginning on or after January 1, 2013.December 15, 2017, with early adoption permitted. The Company adoptedis currently evaluating the impact this updatestandard will have on its consolidated financial statements.
In August 2016, the Financial Accounting Standard Board (“FASB”) issued ASU 2016-15, Statement of Cash Flow (Topic 230), amended the existing accounting standards for the statement of cash flows. The amendments provide guidance on how companies present and classify certain cash receipts and cash payments in the statement of cash flows. The guidance becomes effective for the Company at the beginning of its first quarter of fiscal year 2014.2019. Early adoption is permitted, including adoption in an interim period. The Company is currently evaluating the impact this standard will have on its consolidated financial statements, but does not believe this will have material impact on its consolidated financial statements.
New Accounting Pronouncements
In March 2016, the FASB issued ASU 2016-09, guidance related to stock-based compensation, which includes the income tax consequences, classification of awards as either equity or liabilities, and classification on the statement of cash flows. The guidance becomes effective for the Company at the beginning of its first quarter of fiscal 2018 but permits adoption in an earlier period. The Company is currently evaluating the impact this standard will have on its consolidated financial statements, but does not believe this will have material impact on its consolidated financial statements.
In February 2016, the FASB issued ASU 2016-02, guidance on the recognition and measurement of leases. Under the new guidance, lessees are required to recognize a lease liability, which represents the discounted obligation to make future minimum lease payments, and a corresponding right-of-use asset on the balance sheet for most leases. The guidance retains the current accounting for lessors and does not make significant changes to the recognition, measurement, and presentation of expenses and cash flows by a lessee. Enhanced disclosures will also be required to give financial statement users the ability to assess the amount, timing and uncertainty of cash flows arising from leases. The guidance will require modified retrospective application at the beginning of the Company’s first quarter of fiscal 2020, with optional practical expedients, but permits adoption in an earlier period. The Company is currently evaluating the impact this standard will have on its consolidated financial statements.
In August 2014, the FASB issued ASU No. 2014-15—Presentation of Financial Statements—Going Concern (Subtopic 205-40): Disclosure2014-15, “Disclosure of Uncertainties about an Entity’s Ability to Continue as a Going Concern.The update provides guidance on evaluatingConcern” that requires management to evaluate whether there isare conditions and events that raise substantial doubt about the organization’sCompany’s ability to continue as a going concern within one year after the financial statements are issued on both an interim and how underlying conditions should be disclosedannual basis. Management is required to provide certain footnote disclosures if it concludes that substantial doubt exists or when its plans alleviate substantial doubt about the Company’s ability to continue as a going concern. The standard became effectives to the Company in the footnotes to the financial statements. The update is effective for thefourth quarter of fiscal year beginning after December 15, 2016, with early application permitted.2017. The Company does not anticipate that adoption of this update will have athe standard had no material impact on its consolidated financial statements.
In June 2014, the FASB issued ASU No. 2014-12—Compensation—Stock Compensation: Accounting for Share-Based Payments When the Terms of an Award Provide that a Performance Target Could be Achieved after the Requisite Service Period (Topic 718). This update requires that a performance target which affects vesting, and that could be achieved after the requisite service period, be treated as a performance condition. As such, the performance target should not be reflected in estimating the grant date fair value of the award. This update further clarifies that compensation cost should be recognized in the period in which it becomes probable that the performance target will be achieved and should represent the compensation cost attributable to the periods for which the requisite service has already been rendered. The Company does not anticipate that the adoption of this update will have a material impact on itsCompany’s consolidated financial statements.
In May 2014, the Financial Accounting Standards Board (FASB) issued a new standard, Accounting Standards Update (ASU) 2014-09, Revenue from Contracts with Customers, as amended, which will supersede nearly all existing revenue recognition guidance. Under ASU 2014-09, an entity is required to recognize revenue upon transfer of promised goods or services to customers in an amount that reflects the expected consideration received in exchange for those goods or services. ASU 2014-09 defines a five-step process in order to achieve this core principle, which may require the use of judgment and estimates, and also requires expanded qualitative and quantitative disclosures relating to the nature, amount, timing and uncertainty of revenue and cash flows arising from contracts with customers, including significant judgments and estimates used.
The FASB has issued several amendments to the new standard, including clarification on accounting for licenses of intellectual property and identifying performance obligations. The amendments include ASU No. 2014-09—2016-08, Revenue from Contracts with Customers (Topic 606). This update outlines a new, single comprehensive model—Principal versus Agent Considerations, which was issued in March 2016, and clarifies the implementation guidance for entitiesprincipal versus agent considerations in ASU 2014-09, and ASU 2016-10, Revenue from Contracts with Customers (Topic 606)—Identifying Performance Obligations and Licensing, which was issued in April 2016, and amends the guidance in ASU 2014-09 related to use inidentifying performance obligations and accounting for revenue arising from contracts with customers and supersedes most current revenue recognition guidance, including industry-specific guidance. This new revenue recognition model provides a five-step analysis in determining when and how revenue is recognized. The new model will require revenue recognition to depict the transferlicenses of promised goods
66
MODEL N, INC.
Notes to Consolidated Financial Statements
The new standard permits adoption either by using (i) a full retrospective approach for all periods presented in the period of adoption or services to customers in an amount that reflects(ii) a modified retrospective approach with the consideration a company expects to receive in exchange for those goods or services. This updatecumulative effect of initially applying the new standard recognized at the date of initial application and providing certain additional disclosures. The new standard is effective for fiscal years and interimannual reporting periods within those yearsbeginning after December 15, 2017, with early adoption permitted for annual reporting periods beginning after December 15, 2016. The Company does not plan to early adopt, and accordingly, the Company will adopt the new standard effective October 1, 2018. The Company currently anticipate adopting the standard using the modified retrospective method.
The Company has identified, and are in the process of implementing, appropriate changes to the Company’s business processes, systems and controls to support recognition and disclosure under the new standard. Based on the Company’s ongoing evaluation, the Company believes the impacts of this ASU will be related to the capitalization and amortization of sales commissions, the timing of revenue recognition for certain sales contracts, and their respective disclosures. There will be changes to the capitalization of the sales commission and the period over which sales commissions will be amortized to align to an expected period of benefit, which sales commission is currently assessingexpensed as incurred. In addition, there will be a change in relation to the timing of revenue recognition for certain sales contracts, due primarily to the removal of the current limitation on contingent revenue. These changes are being evaluated to determine the potential impact that adopting this update will have on its consolidatedto our financial statements and footnote disclosures.
In April 2014, the FASB ASU No. 2014-08—Presentation of Financial Statements (Topic 205) and Property, Plant, and Equipment (Topic 360): Reporting Discontinued Operations and Disclosures of Disposalsof Components of an Entity. This update changes the criteria for reporting discontinued operations. The update expands the definition of discontinued operations to include the sale or disposal of a component of a Company, if the sale or disposal creates a strategic shift or major effect in the Company’s operations and financial results. A component of a Company includes any segment, reporting unit, subsidiary, or asset group. The update requires expanded disclosures about a disposal of a component. The update is effective beginning January 1, 2015 with early adoption permitted for disposals that have not been reported in previously-issued financial statements. The impact to While the Company will be dependent on any transaction that is withincontinues to assess the scope of this update.
In July 2013, the FASB issued ASU No. 2013-11—Income Taxes (Topic 740): Presentation of an Unrecognized Tax Benefit When a Net Operating Loss Carryforward, a Similar Tax Loss, or a Tax Credit Carryforward Exists. This update generally requires, with some exceptions, an entity to present its unrecognized tax benefits as it relates to its NOL carry forwards, similar tax losses, or tax credit carry forwards, as a reduction of deferred tax assets when settlement in this regard is available under the tax law of the applicable taxing jurisdiction as of the balance sheet reporting date. This update is effective for fiscal years beginning after December 15, 2013 with retrospective application permitted. This update requires a change in financial statement presentation. The Company does not anticipate that the adoption of this update will have a material impact on its consolidated financial statements.
In March 2013, the FASB issued ASU No. 2013-05—Parent’s Accounting for the Cumulative Translation Adjustment upon Derecognition of Certain Subsidiaries or Groups of Assets within a Foreign Entity or of an Investment in a Foreign Entity (Topic 830)to resolve the diversity in practice regarding the release into net income of the cumulative translation adjustment upon derecognition of a subsidiary or group of assets within a foreign entity. This update will be effective for fiscal years beginning after December 15, 2013. The impact to the Company will be dependent on any transaction that is within the scopepotential impacts of the new guidance.standard, including the areas described above, our preliminary conclusions may change.
3. Consolidated Balance Sheet ComponentsBusiness Combinations
ComponentsRevitas Acquisition
On January 5, 2017, the Company completed the acquisition of prepaid expenses, property and equipment, goodwill and intangibles, other assets, accrued employee compensation and accrued liabilities consisted100% of the following:
Prepaid Expensesequity interests of Sapphire Stripe Holdings, Inc., the parent company of Revitas, Inc. (“Revitas”). Pursuant to the Agreement and Plan of Merger (“Merger Agreement”), the Company paid approximately $52.8 million in cash and issued to the sellers two $5.0 million promissory notes, one which will mature 18 months after the closing and the other which will mature 36 months after the closing. The Company acquired Revitas to, among other things, expand the Company’s revenue management solutions for customers.
| As of September 30, | ||||||||
| 2014 | 2013 | |||||||
| (in thousands) | ||||||||
Prepaid royalties | $ | 392 | $ | 190 | ||||
Prepaid taxes | 44 | 185 | ||||||
Other prepaid expenses | 1,656 | 2,850 | ||||||
|
|
|
| |||||
Total prepaid expenses | $ | 2,092 | $ | 3,225 | ||||
|
|
|
| |||||
In connection with Revitas acquisition, the Company funded the cash portion of the purchase price, in part with a five year term loan in the aggregate amount of $50.0 million. See Note 6, “Debt”, for additional information.
The Company included Revitas’ results of operations from the date of acquisition and the estimated fair value of assets and liabilities in its consolidated balance sheets. The Company incurred acquisition and transactional costs associated with the acquisition of Revitas of approximately $2.2 million for the fiscal year ended September 30, 2017, which were recorded as general and administrative expenses.
67
MODEL N, INC.
Notes to Consolidated Financial Statements
Property and EquipmentPurchase Price Allocation
| As of September 30, | ||||||||
| 2014 | 2013 | |||||||
| (in thousands) | ||||||||
Computer software and equipment | $ | 6,931 | $ | 6,820 | ||||
Furniture and fixtures | 477 | 1,130 | ||||||
Leasehold improvements | 804 | 733 | ||||||
Software development costs | 5,488 | 5,080 | ||||||
|
|
|
| |||||
Total property and equipment | 13,700 | 13,763 | ||||||
Less: Accumulated depreciation and amortization | (6,811 | ) | (5,894 | ) | ||||
|
|
|
| |||||
Property and equipment, net | 6,889 | 7,869 | ||||||
Add: Construction in progress | — | 2 | ||||||
| �� |
|
|
|
| ||||
Total property and equipment, net | $ | 6,889 | $ | 7,871 | ||||
|
|
|
| |||||
Computer equipmentThe total preliminary purchase price for Revitas was approximately $61.5 million, which was comprised of $52.8 million in cash and the fair value of the promissory note of $8.6 million, see Note 6, “Debt”, for additional details. The preliminary allocation of the purchase price is based on valuations derived from estimated fair value assessments and assumptions used by the Company. While the Company believes that its estimates and assumptions underlying the valuations are reasonable, different estimates and assumptions could result in different valuations assigned to the individual assets acquired underand liabilities assumed, and the capital leasesresulting amount of goodwill. The fair value of the assets acquired and liabilities assumed is subject to change within the measurement period (up to one year from the acquisition date). As of the acquisition date, the preliminary allocation of the purchase price is as follows:
|
| Estimated Fair |
| |
|
| Value (in thousands) |
| |
Cash and cash equivalents |
| $ | 5,067 |
|
Accounts receivable |
|
| 6,184 |
|
Prepaid expenses |
|
| 1,067 |
|
Other current assets |
| 47 |
| |
Property, plant and equipment |
|
| 1,506 |
|
Intangible assets |
|
| 39,100 |
|
Goodwill |
|
| 32,344 |
|
Other assets |
| 25 |
| |
Total assets acquired |
|
| 85,340 |
|
|
|
|
|
|
Accounts payable |
|
| (1,352 | ) |
Accrued employee compensation |
|
| (3,983 | ) |
Accrued liabilities |
|
| (1,410 | ) |
Deferred revenue liability |
|
| (12,856 | ) |
Other liabilities |
|
| (4,256 | ) |
Total liabilities assumed |
|
| (23,857 | ) |
Net acquired assets |
| $ | 61,483 |
|
The following table presents certain information on the acquired identifiable assets:
Intangible assets |
| Fair value (in thousands) |
|
| Estimated useful lives (years) |
|
| Weighted-average estimated useful lives (years) |
| |||
Developed technology |
| $ | 6,770 |
|
|
| 6 |
|
|
| 6 |
|
Customer relationship |
| $ | 32,180 |
|
|
| 10 |
|
|
| 10 |
|
Trade name |
| $ | 150 |
|
|
| 1 |
|
|
| 1 |
|
The purchase accounting allocation resulted in an ascribed value to the acquired intangible assets of $39.1 million and goodwill of $32.3 million. The key factors attributable to the creation of goodwill by the transaction are synergies in skill-sets, return on future technology and customer development.
We do not expect the goodwill recognized as a part of the acquisition to be deductible for income tax purposes. See Note 5, “Goodwill” for additional information.
Unaudited Pro Forma Combined Consolidated Financial Information
The results of operations for Revitas and the estimated fair values of the assets acquired and liabilities assumed have been included in the Company’s consolidated financial statements since the respective dates of acquisition. Since the close of the acquisition, Revitas contributed approximately $20.7 million to the Company’s revenue and increased net losses by $6.3 million.
68
MODEL N, INC.
Notes to Consolidated Financial Statements
The unaudited pro forma combined consolidated financial information is presented for illustrative purpose only and is not necessarily indicative of the result of operations that would have actually been reported had the acquisitions occurred on the above dates, nor is it necessarily indicative of the future results of operations of the combined company. The unaudited pro forma combined consolidated financial information reflects certain adjustments, such as amortization, interest expense, deferred tax valuation allowance and transaction related costs.
The following unaudited pro forma combined consolidated financial information has been prepared by the Company using the acquisition method of accounting to give effect to the Revitas acquisition as if it had occurred on October 1, 2015. The following table sets forth the unaudited pro forma consolidated combined results of operations:
|
| Fiscal Year Ended September 30, |
| |||||
|
| 2017 |
|
| 2016 |
| ||
|
| (in thousands, except per share data) |
| |||||
Revenue |
| $ | 140,227 |
|
| $ | 149,632 |
|
Net loss |
|
| (45,346 | ) |
|
| (38,656 | ) |
Net loss per shares-basic and diluted |
| $ | (1.58 | ) |
| $ | (1.41 | ) |
Channelinsight Inc. (CI) Acquisition
On October 30, 2015, the Company acquired certain assets and liabilities of Channelinsight Inc. (CI), a privately held cloud-based channel data management solution provider. The Company paid a total purchase price of $12.6 million in cash. Pro forma results have not been presented as the Company does not consider the acquisition to be significant.
The purchase consideration was allocated to tangible, identifiable intangible assets acquired and liabilities assumed based on their respective fair values as of the acquisition date. This allocation resulted in fair value allocated to intangible assets of $6.8 million and goodwill of $5.4 million. The goodwill is deductible for tax purposes. Intangible assets acquired included developed technology, backlog, patents, trade names and customer relationships, and are being amortized on a straight-line basis over their estimated useful lives of 1 to 10 years. The key factors attributable to the creation of goodwill by the transaction are synergies in skill-sets, operations, customer base and organizational cultures. The results of operations and the fair values of the assets acquired and liabilities assumed have been included in the accompanying financial statements since the acquisition date.
4. Consolidated Balance Sheet Components
Components of property and equipment, and intangible assets consisted of the following:
Property and Equipment
| As of September 30, | ||||||||
| 2014 | 2013 | |||||||
| (in thousands) | ||||||||
Computer software and equipment | $ | 823 | $ | 1,376 | ||||
Less: Accumulated depreciation and amortization | (819 | ) | (1,096 | ) | ||||
|
|
|
| |||||
Total computer software and equipment, net | $ | 4 | $ | 280 | ||||
|
|
|
| |||||
|
| As of September 30, |
| |||||
|
| 2017 |
|
| 2016 |
| ||
|
| (in thousands) |
| |||||
Computer software and equipment |
| $ | 10,274 |
|
| $ | 9,319 |
|
Furniture and fixtures |
|
| 1,284 |
|
|
| 1,117 |
|
Leasehold improvements |
|
| 1,466 |
|
|
| 1,240 |
|
Software development costs |
|
| 9,416 |
|
|
| 8,254 |
|
Total property and equipment |
|
| 22,440 |
|
|
| 19,930 |
|
Less: Accumulated depreciation and amortization |
|
| (17,829 | ) |
|
| (14,582 | ) |
Property and equipment, net |
|
| 4,611 |
|
|
| 5,348 |
|
Add: Capital projects in progress |
|
| — |
|
|
| 793 |
|
Total property and equipment, net |
| $ | 4,611 |
|
| $ | 6,141 |
|
Depreciation and amortization expense including depreciation of assets under capital leases totaled $3.4$3.5 million $1.9, $4.5 million and $1.53.8 million for the fiscal years ended September 30, 2014, 20132017, 2016 and 2012,2015, respectively.
Goodwill and Intangible Assets69
MODEL N, INC.
Notes to Consolidated Financial Statements
| Estimated Useful Life (in Years) | As of September 30, | |||||||||||
| 2014 | 2013 | |||||||||||
| (in thousands) | ||||||||||||
Intangible Assets: | ||||||||||||
Developed technology | 5 | $ | 2,214 | $ | 2,214 | |||||||
Backlog | 5 | 100 | 100 | |||||||||
Non-competition agreement | 3 | 100 | 100 | |||||||||
Customer relationships | 3 | 1,018 | 1,018 | |||||||||
Less: Accumulated amortization | (2,845 | ) | (2,514 | ) | ||||||||
|
|
|
| |||||||||
Total intangible assets | $ | 587 | $ | 918 | ||||||||
|
|
|
| |||||||||
Goodwill | $ | 1,509 | $ | 1,509 | ||||||||
|
|
|
| |||||||||
Intangible Assets
|
|
|
| As of September 30, 2017 |
| |||||||||
|
| Estimated Useful Life (in years) |
| Gross Carrying Amount |
|
| Accumulated Amortization |
|
| Net Carrying Amount |
| |||
|
|
|
| (in thousands) |
|
|
|
|
| |||||
Intangible Assets: |
|
|
|
|
|
|
|
|
|
|
|
|
|
|
Developed technology |
| 5-6 |
| $ | 12,083 |
|
| $ | (4,545 | ) |
| $ | 7,538 |
|
Backlog |
| 5 |
|
| 280 |
|
|
| (215 | ) |
|
| 65 |
|
Non-competition agreement |
| 3 |
|
| 100 |
|
|
| (100 | ) |
|
| — |
|
Customer relationships |
| 3-10 |
|
| 36,599 |
|
|
| (4,084 | ) |
|
| 32,515 |
|
Trade name |
| 1 |
|
| 260 |
|
|
| (222 | ) |
|
| 38 |
|
Total |
|
|
| $ | 49,322 |
|
| $ | (9,166 | ) |
| $ | 40,156 |
|
|
|
|
| As of September 30, 2016 |
| |||||||||
|
| Estimated Useful Life (in years) |
| Gross Carrying Amount |
|
| Accumulated Amortization |
|
| Net Carrying Amount |
| |||
|
|
|
| (in thousands) |
|
|
|
|
| |||||
Intangible Assets: |
|
|
|
|
|
|
|
|
|
|
|
|
|
|
Developed technology |
| 5 |
| $ | 5,313 |
|
| $ | (2,857 | ) |
| $ | 2,456 |
|
Backlog |
| 5 |
|
| 280 |
|
|
| (149 | ) |
|
| 131 |
|
Non-competition agreement |
| 3 |
|
| 100 |
|
|
| (100 | ) |
|
| — |
|
Customer relationships |
| 3-10 |
|
| 4,419 |
|
|
| (1,331 | ) |
|
| 3,088 |
|
Trade name |
| 1 |
|
| 110 |
|
|
| (101 | ) |
|
| 9 |
|
Total |
|
|
| $ | 10,222 |
|
| $ | (4,538 | ) |
| $ | 5,684 |
|
The Company recorded amortization expense related to the acquired intangible assets of $0.3$4.6 million, $0.3$1.4 million and $0.2$0.3 million during the fiscal years ended September 30, 2014, 2013,2017, 2016 and 2012,2015, respectively.
MODEL N, INC.
Notes to Consolidated Financial Statements
Estimated future amortization expense for the intangible assets as of September 30, 20142017 is as follows:
| Fiscal Years Ending September 30, | ||||
| (in thousands) | ||||
2015 | $ | 270 | ||
2016 | 245 | |||
2017 | 72 | |||
|
| |||
Total future amortization | $ | 587 | ||
|
| |||
|
| Fiscal Years Ending September 30, |
| |
|
| (in thousands) |
| |
2018 |
|
| 5,559 |
|
2019 |
|
| 5,466 |
|
2020 |
|
| 4,751 |
|
2021 |
|
| 4,687 |
|
2022 and thereafter |
|
| 19,693 |
|
Total future amortization |
| $ | 40,156 |
|
Other Assets
5. Goodwill
| As of September 30, | ||||||||
| 2014 | 2013 | |||||||
| (in thousands) | ||||||||
Deferred cost of implementation services, net of current portion | $ | 317 | $ | 319 | ||||
Other | 955 | 307 | ||||||
|
|
|
| |||||
Total other assets | $ | 1,272 | $ | 626 | ||||
|
|
|
| |||||
Accrued Employee CompensationThe following table presents goodwill activity for the years ended September 30, 2017 and 2016 (in thousands):
| As of September 30, | ||||||||
| 2014 | 2013 | |||||||
| (in thousands) | ||||||||
Consideration in connection with acquisition (Note 11) | $ | 870 | $ | 1,373 | ||||
Restructuring (Note 10) | — | 1,182 | ||||||
Accrued employee benefits | 8,324 | 11,386 | ||||||
|
|
|
| |||||
Total accrued employee compensation | $ | 9,194 | $ | 13,941 | ||||
|
|
|
| |||||
Balance as at September 30, 2015 |
| $ | 1,509 |
|
Add: Goodwill from acquisition of business |
|
| 5,430 |
|
Balance as at September 30, 2016 |
| $ | 6,939 |
|
Add: Goodwill from acquisition of business |
|
| 32,344 |
|
Balance as at September 30, 2017 |
| $ | 39,283 |
|
Accrued Liabilities
As a result of the acquisition of Revitas in fiscal 2017, the Company recognized preliminary goodwill of $32.3 million. See Note 3, “Business Combination”, for additional details.
| As of September 30, | ||||||||
| 2014 | 2013 | |||||||
| (in thousands) | ||||||||
Taxes payable | $ | 191 | $ | 232 | ||||
Other customer payables | 141 | 150 | ||||||
Other accrued liabilities | 1,666 | 2,466 | ||||||
|
|
|
| |||||
Total accrued liabilities | $ | 1,998 | $ | 2,848 | ||||
|
|
|
| |||||
4.
70
MODEL N, INC.
Notes to Consolidated Financial Statements
6.Debt
Term Loan
In connection with the Revitas acquisition, on January 5, 2017, the Company entered into a Financing Agreement (“Financing Agreement)” by and among the Company, the Subsidiaries, as guarantors, Crystal Financial SPV, LLC and TC Lending, LLC (collectively, the “Lenders”), as administrative agent for the lenders, sole lead arranger, and collateral agent for the Lenders, pursuant to which the Lenders have extended term loan to the Company in an aggregate principle amount of $50.0 million.
The term loan made pursuant to the Financing Agreement will bear interest at a rate of either (i) the Base Rate (as defined in the Financing Agreement) plus 9.25% or (ii) the LIBOR Rate (as defined in the Financing Agreement) plus 8.25%, as selected by the Company. The term loans mature on January 5, 2022. As of September 30, 2017, the Company selected LIBOR Rate plus 8.25%. The Company must repay 0.625% of the aggregate principal amount of the term loans on the last business day of each fiscal quarter, beginning with the fiscal quarter ending March 31, 2019. The Company may voluntarily prepay the terms loans, subject to a 3% premium during the first 24 months and 1% premium after 24 months and prior to 36 months. Certain mandatory prepayments are required upon the sale of certain assets, the receipt of certain insurance or condemnation proceeds or extraordinary receipts, the issuance of certain securities or debt, the occurrence of excess cash flows and the occurrence of certain restrictions on the business of the combined company or certain divestitures.
The Financing Agreement requires the Company and the subsidiaries to maintain certain financial covenants, including achieving certain levels of revenue from specified sources, as outlined in the agreement, and maintaining cash and cash-equivalents of $20.0 million net of accounts payable in excess of $0.5 million 90 days overdue. The Financing Agreement also contains certain non-financial covenants, including restricting our ability to dispose of assets, changing our organizational documents or amending our material agreements in a manner adverse to the lender, changing a method of accounting, merging with or acquiring other entities, incurring other indebtedness and making certain investments.
The Company in compliance with all of the covenants described in the Financing Agreements as of September 30, 2017.
The subsidiary guarantors have jointly and severally guaranteed the payment in full of all obligations under the Financing Agreement. The Company and the subsidiary guarantors’ obligations under the Financing Agreement are secured by substantially all of their assets and a pledge of certain of the Company and the subsidiaries’ stock.
Promissory Notes
Also, in connection with the Revitas acquisition, the Company incurred $10.0 million in debt in the form of two promissory notes with the sellers, one which will mature on July 5, 2018 and the other which will mature on January 5, 2020. These promissory notes bear interest at the rate of 3% per annum, and are subject to a right of set-off as partial security for the indemnification obligations of target’s stockholders under the Merger Agreement. These promissory notes are subordinate to the term loan. The preliminary fair value of the promissory notes of $8.6 million was determined based on a discounted future cash flow at 9.96% interest rate, which represents an arm’s length interest rate.
As of September 30, 2017, the term loan and promissory notes consisted of the following:
| Amount |
| |
| (in thousands) |
| |
Principal | $ | 60,000 |
|
Unamortized debt discount and issuance costs |
| (2,795 | ) |
Net carrying amount | $ | 57,205 |
|
The Company incurred approximately $0.8 million in transaction costs in connection with the term loan. These costs are included as part of the Company’s debt. The effective interest rate for the term loan is 10.5%, the 18 month promissory note is 9.74% and the 36 month promissory note is 9.89%.
71
MODEL N, INC.
Notes to Consolidated Financial Statements
The future scheduled principal payments for the term loan and promissory notes as of September 30, 2017 were as follows (in thousands):
Fiscal Year: |
|
|
|
2018 | $ | 5,000 |
|
2019 |
| 937 |
|
2020 |
| 6,250 |
|
2021 |
| 1,250 |
|
2022 |
| 46,563 |
|
Total | $ | 60,000 |
|
7. Financial Instruments
The table below sets forth the Company’s cash equivalents as of September 30, 20142017 and 2013,2016, which are measured at fair value on a recurring basis by level within the fair value hierarchy. The assets are classified based on the lowest level of input that is significant to the fair value measurement. The Company had no liabilities measured at fair value on a recurring basis.
MODEL N, INC.
Notes to Consolidated Financial Statements
|
| Level 1 |
|
| Level 2 |
|
| Level 3 |
|
| Total |
| ||||
|
| (in thousands) |
| |||||||||||||
As of September 30, 2017: |
|
|
|
|
|
|
|
|
|
|
|
|
|
|
|
|
Assets: |
|
|
|
|
|
|
|
|
|
|
|
|
|
|
|
|
Cash equivalents |
| $ | 47,754 |
|
| $ | — |
|
| $ | — |
|
| $ | 47,754 |
|
Total |
| $ | 47,754 |
|
| $ | — |
|
| $ | — |
|
| $ | 47,754 |
|
As of September 30, 2016: |
|
|
|
|
|
|
|
|
|
|
|
|
|
|
|
|
Assets: |
|
|
|
|
|
|
|
|
|
|
|
|
|
|
|
|
Cash equivalents |
| $ | 64,658 |
|
| $ | — |
|
| $ | — |
|
| $ | 64,658 |
|
Total |
| $ | 64,658 |
|
| $ | — |
|
| $ | — |
|
| $ | 64,658 |
|
Cash equivalents in the tables below exclude $55.5 million and $7.8 million held in cash by the Company in its bank and investment accounts as of September 30, 2014 and 2013, respectively.
There were no transfers of assets and liabilities measured at fair value between Level 1 and Level 2, or between Level 2 and Level 3, during the fiscal years ended September 30, 2014 and 2013.
The following tables show the Company’s available-for-sale securities’ adjusted cost; gross unrealized gains, gross unrealized losses and fair value recorded as cash equivalents as of September 30, 20142017 and 2013:2016 consisted of money market funds with original maturity dates of less than three months from the date of their respective purchase. Cash equivalents are classified as Level 1. The fair value of the Company’s money market funds approximated amortized cost and, as such, there were no unrealized gains or losses on money market funds as of September 30, 2017 and 2016. The Company’s financial instruments not measured at fair value on a recurring basis include cash, accounts receivable, accounts payable and accrued liabilities, and are reflected in the financial statements at cost and approximates their fair value due to their short-term nature. The term loan carrying value is approximately fair value since the term loan bears interest at rates that fluctuate with the changes in the Base Rate or the Libor Rate as selected by the Company. The promissory notes carrying values approximate their fair value as of September 30, 2017. As of September 30, 2017 and 2016, amounts of $9.8 million and $1.5 million, respectively, were held in bank deposits.
| Level 1 | Level 2 | Level 3 | Total | |||||||||||||
| (in thousands) | ||||||||||||||||
As of September 30, 2014: | ||||||||||||||||
Assets: | ||||||||||||||||
Cash equivalents: | ||||||||||||||||
Money market fund deposits | $ | 11,463 | $ | — | $ | — | $ | 11,463 | ||||||||
U.S. treasury bills | 34,050 | — | — | 34,050 | ||||||||||||
|
|
|
|
|
|
|
| |||||||||
Total | $ | 45,513 | $ | — | $ | — | $ | 45,513 | ||||||||
|
|
|
|
|
|
|
| |||||||||
As of September 30, 2013: | ||||||||||||||||
Assets: | ||||||||||||||||
Cash equivalents: | ||||||||||||||||
U.S. treasury bills | $ | 95,508 | $ | — | $ | — | $ | 95,508 | ||||||||
|
|
|
|
|
|
|
| |||||||||
| Adjusted Cost | Unrealized Gains | Unrealized Losses | Fair Value | |||||||||||||
| (in thousands) | ||||||||||||||||
As of September 30, 2014: | ||||||||||||||||
Cash equivalents: | ||||||||||||||||
Money market fund deposits | $ | 11,463 | $ | — | $ | — | $ | 11,463 | ||||||||
U.S. treasury bills | 34,050 | — | — | 34,050 | ||||||||||||
|
|
|
|
|
|
|
| |||||||||
Total | $ | 45,513 | $ | — | $ | — | $ | 45,513 | ||||||||
|
|
|
|
|
|
|
| |||||||||
As of September 30, 2013: | ||||||||||||||||
Cash equivalents: | ||||||||||||||||
U.S. treasury bills | $ | 95,508 | $ | — | $ | — | $ | 95,508 | ||||||||
|
|
|
|
|
|
|
| |||||||||
5.8. Commitments and Contingencies
Leases
The Company leases facilities under noncancelable operating leases, and leases certain computer equipment under capital leases and acquired certain equipment under an equipment loan. The Company entered into a new operating lease for the Company’s facility in Redwood City, California for a period of 42 months beginning in July 2014. Rent expense under noncancelable operating leases for the fiscal years ended September 30, 2014, 2013 and 2012 was $2.0 million, $1.7 million and $1.5 million, respectively.
MODEL N, INC.
Notes to Consolidated Financial Statements
leases. As of September 30, 2014,2017, future minimum payments under operating leases were as follows:
| Contractual Payment Obligations Due by Period | ||||||||||||||||||||
| Total | Less than 1 Year | 1 to 3 Years | 2 to 5 Years | More than 5 Years | ||||||||||||||||
Operating lease obligations(1) | $ | 6,400 | $ | 2,100 | $ | 3,800 | $ | 500 | $ | — | ||||||||||
|
|
|
|
|
|
|
|
|
| |||||||||||
|
| Contractual Payment Obligations Due by Period |
| |||||||||||||||||
|
| Total |
|
| Less than 1 Year |
|
| 1 to 3 Years |
|
| 3 to 5 Years |
|
| More than 5 Years |
| |||||
Operating lease obligations(1) |
| $ | 4,300 |
|
| $ | 1,600 |
|
| $ | 1,700 |
|
| $ | 1,000 |
|
| $ | — |
|
(1) | Operating lease obligations represent our obligations to make payments under the lease agreements for our facilities leases. |
Loan Financing Arrangements
In October 2010, the Company entered into an amended and restated loan and security agreement with a lender and refinanced its revolving `credit facility with a term loan of $7.5 million. The principal amount outstanding bears a fixed interest rate at 8.0% per annum. The amended and restated loan and security agreement required interest only payments until October 1, 2011 and thirty six (36) equal monthly installments of principal with accrued interest thereafter until maturity on October 1, 2014. The Company pledged all assets excluding any intellectual property to the lender as collateral. The Company repaid this term loan in full in May 2013.
In connection with the amended and restated loan and security agreement, the Company issued a warrant to purchase 86,655 shares of Series C Preferred Stock at an exercise price of $3.462 per share to the lender (see Note 12).
ForRent expense under noncancelable operating leases for the fiscal years ended September 30, 2014, 20132017, 2016 and 2012, the Company recorded an interest expense of $0, $0.42015 was $3.2 million, $2.7 million and $0.5$2.3 million, respectively.
72
MODEL N, INC.
Notes to Consolidated Financial Statements
Indemnification Obligations
Each of the Company’s software licenses contains the terms of the contractual arrangement with the customer and generally includes certain provisions for defending the customer against any claims that the Company’s software infringes upon a patent, copyright, trademark, or other proprietary right of a third party. The software license also provides for indemnification by the Company of the customer against losses, expenses, and liabilities from damages that may be assessed against the customer in the event the Company’s software is found to infringe upon such third party rights.
The Company has not had to reimburse any of its customers for losses related to indemnification provisions, and there were no material claims against the Company outstanding as of September 30, 20142017 and 2013.2016. For several reasons, including the lack of prior indemnification claims and the lack of a monetary liability limit for certain infringement cases under the software license, the Company cannot estimate the amount of potential future payments, if any, related to indemnification provisions.
As permitted under Delaware law, the Company has indemnification arrangements with respect to its officers and directors, indemnifying them for certain events or occurrences while they serve as officers or directors of the Company.
Legal Proceedings
The Company isWe are not currently a party to any pending material legal proceedings. From time to time, we may become involved in legal proceedings arising in the ordinary course of our business. Regardless of outcome, litigation arising from the Company’s initial public offering, or IPO. The Company accrues a liability whencan have an adverse impact on us due to defense and settlement costs, diversion of management believes that it is both probable that a liability has been incurred
MODEL N, INC.
Notes to Consolidated Financial Statementsresources, negative publicity and reputational harm and other factors.
9. Stock-Based Compensation
2000 Stock Plan
The 2000 Stock Plan (the “2000 Plan”) authorized the board of directors to grant incentive share options and the amount of loss can be reasonably estimated. As of September 30, 2014, it was not reasonably possible that any material loss had been incurred. The Company reviews these matters at least quarterly and adjusts its accrualsnon-statutory share options to reflect the impact of negotiations, settlements, rulings, advice of legal counsel,employees, directors and other informationeligible participants. Stock purchase rights may also be granted under the 2000 Plan. The exercise price of the stock options shall not be less than the estimated fair value of the underlying shares of the common stock on the grant date. Options generally vest over four years and events pertainingexpire ten years from the date of grant. In connection with the adoption of the 2010 Equity Incentive Plan (the “2010 Plan”) in June 2010, the 2000 Plan was terminated and all shares of common stock previously reserved but unissued were transferred to 2010 Plan.
2010 Equity Incentive Plan
On June 15, 2010, the case discussed below. TheCompany’s Board adopted the 2010 Equity Incentive Plan under which employees, directors, and other eligible participants of the Company believes thator any damage amounts claimed insubsidiary of the specific matter discussed below is not a meaningful indicatorCompany may be granted incentive stock options, nonstatutory stock options and all other types of awards to purchase shares of the Company’s potential liability. Litigation is inherently unpredictable. However,common stock. The total number of shares reserved and available for grant and issuance pursuant to this 2010 Plan consists of (a) any authorized shares not issued or subject to outstanding grants under the 2000 Plan on the adoption date, (b) shares that are subject to issuance upon exercise of options granted under the Plan but cease to exist for any reason other than exercise of such options; and (c) shares that were issued under the Plan which are repurchased by the Company believes that it has valid defenses with respect to legal matters pending against it. Nevertheless, cash flowsat the original issue price or results of operations could be materially affected in any particular period by the resolution of one or more of these contingencies.
On September 5, 2014, a purported securities class action lawsuit was filed in the Superior Court of the State of California, County of San Mateo, against the Company, certain of the Company’s current and former directors and executive officers and underwriters of the Company’s IPO. The lawsuit was brought by a purported stockholder of the Company seeking to represent a class consisting of all those who purchased Company stock pursuant and/or traceable to the Company’s Registration Statement and Prospectus issued inforfeited. In connection with the Company’s IPO. The lawsuit asserts claims under Sections 11, 12(a)(2) and 15adoption of the Securities Act2013 Equity Incentive Plan in February 2013, the 2010 Plan was terminated and all shares of 1933 and seeks unspecified damages and other relief. The Company believes that the claims are without merit and intendscommon stock previously reserved but unissued were transferred to defend the lawsuit vigorously.2013 Plan.
6. Stock-Based Compensation
Stock Plans2013 Equity Incentive Plan
The Company’s board of directors (Board) adopted the 2013 Equity Incentive Plan (2013 Plan) in February 2013, and the stockholders approved the 2013 Plan in March 2013. The 2013 Plan became effective on March 18, 2013 and will terminate in February 2023. The 2013 Plan serves as the successor equity compensation plan to the 2010 Equity Incentive Plan (2010 Plan). The 2013 Plan was approved with a reserve of 8.0 million shares, which consists of 2.5 million shares of the Company’s common stock reserved for future issuance under the 2013 Plan and shares of common stock previously reserved but unissued under the 2010 Plan. In addition, any shares of common stock subject
73
MODEL N, INC.
Notes to outstanding awards under the 2010 Plan and 2000 Stock Plan (2000 Plan) that are issuable upon the exercise of options that expire without having been exercised in full, are forfeited or repurchased by us at the original purchase price or are used to pay the exercise price or withholding obligations related to any award will be available for future grant and issuance under the 2013 Plan. Consolidated Financial Statements
Additionally, the 2013 Plan provides for automatic increases in the number of shares available for issuance under it on October 1 of each of the first four calendar years during the term of the 2013 Plan by the lesser of 5% of the number of shares of common stock issued and outstanding on each September 30 immediately prior to the date of increase or the number determined by our board of directors. No further grants will be made under the 2010 Plan, and the balances under the 2010 Plan have been transferred to the 2013 Plan. The 2013 Plan provides for the grant of incentive stock options, nonqualified stock options, restricted stock awards, stock appreciation rights, performance stock awards, restricted stock units and stock bonuses. Awards generally vest over four years and expire ten years from the date of grant.
On June 15, 2010, the Board adopted the 2010 Plan under which employees, directors, and other eligible participants of the Company or any subsidiary of the Company may be granted incentive stock options, nonstatutory stock options and all other types of awards to purchase shares of the Company’s common stock.
In 2000, the Board adopted the 2000 Plan under which employees, directors and other eligible participants may be granted incentive stock options or nonstatutory stock options to purchase shares of the Company’s common stock.
MODEL N, INC.
Notes to Consolidated Financial Statements
Employee Stock Purchase Plan
The 2013 Employee Stock Purchase Plan (ESPP) became effective on March 19, 2013. The ESPP allows eligible employees to purchase shares of the Company’s common stock at a discount through payroll deductions of up to 15% of their eligible compensation, at not less than 85% of the fair market value, as defined in the ESPP, subject to any plan limitations. Except for the initial offering period, the ESPP provides for six-month offering periods, starting on February 20 and August 20 of each year. The initial offering period began on March 19, 2013 and ended on February 19, 2014.
Restricted Stock Awards Issued to Certain Employees in Connection with the LeapFrogRx Acquisition
In January 2012, the Company issued 200,000 shares of common stock to certain employees of LeapFrogRx in connection with the acquisition of LeapFrogRx. Of these shares, 36,818 shares were forfeited during fiscal year 2013. There were 29,849 shares subject to repurchase as of September 30, 2013 and no shares subject to repurchase as of September 30, 2014 as these shares were fully vested. The total fair value on their respective vesting dates of the restricted stock awards that vested during the fiscal years ended September 30, 2014 and 2013 was $ 0.1 million and $0.4 million, respectively.
Performance-based Restricted Stock Units
On December 6, 2013, the Compensation Committee of the Board approved initial grants of an aggregate of 280,000 performance-based restricted stock units to three of the Company’s senior officers, including the Chief Executive Officer and the Chief Financial Officer. Under the terms of these grants, the actual number of shares released could be 0% to 250% of the initial grant based on the Company’s total shareholder return (TSR) relative to the TSR of the Russell 3000 index (Index) over a three-year period. In any of the three years, no shares will be released if the TSR of the Company’s common stock is below the 30th percentile relative to the Index; 100% of the initial grant will be released if the Company’s TSR is at the 50th percentile relative to the Index; and 250% of the initial grant will be released if the Company’s TSR is over the 90th percentile relative to the Index. These grants vest as to one-third on each annual anniversary of November 22, 2013, with a “catch-up” provision such that shares not earned in a prior year may be earned in a subsequent year subject to the Company’s TSR achieving a certain level relative to the Index and exceeding the prior year’s TSR. These grants have a ten-year term, subject to their earlier termination upon certain events including the awardee’s termination of employment. As of September 30, 2014 approximately 43,000 of performance based2017, 4.4 million shares were available for future stock unitsawards under the plans and any additional releases resulting from an over-achievement relating to performance-based restricted stock units.
Stock Options
There were forfeited. The weighted-average assumptions used to estimate the fair values of these awards were determined using the following assumptions for the fiscal year ended September 30, 2014:
| ||||
| ||||
|
MODEL N, INC.
Notes to Consolidated Financial Statements
Activities of Stock Options, Restricted Stock Units, Performance-based Restricted Stock Units and Restricted Stock Awards
| Outstanding Awards | ||||||||||||||||||||||||
| Shares Available for Grant | Number of Stock Options | Weighted Average Exercise Price | Number of Restricted Stock Units | Weighted Average Grant Date Fair Value | Number of Restricted Stock Awards | |||||||||||||||||||
| (in thousands, except exercise price and grant date fair value) | ||||||||||||||||||||||||
Balance at September 30, 2011 | 989 | 3,787 | $ | 1.62 | — | $ | — | — | ||||||||||||||||
Increase in shares reserved | 1,333 | — | — | — | — | — | ||||||||||||||||||
Granted | (1,788 | ) | 1,568 | 10.05 | 20 | 10.92 | 200 | |||||||||||||||||
Exercised/released | — | (348 | ) | 1.74 | — | — | (200 | ) | ||||||||||||||||
Forfeited | 282 | (282 | ) | 4.44 | — | — | — | |||||||||||||||||
Expired | 166 | (166 | ) | 1.59 | — | — | — | |||||||||||||||||
|
|
|
|
|
|
|
|
|
|
|
| |||||||||||||
Balance at September 30, 2012 | 982 | 4,559 | 4.34 | 20 | 10.92 | — | ||||||||||||||||||
Increase in shares reserved | 2,761 | — | — | — | — | — | ||||||||||||||||||
Granted | (1,360 | ) | 272 | 13.86 | 1,088 | 15.73 | — | |||||||||||||||||
Exercised/released | — | (565 | ) | 1.52 | (7 | ) | 12.27 | — | ||||||||||||||||
Forfeited | 502 | (355 | ) | 8.00 | (110 | ) | 15.57 | (37 | ) | |||||||||||||||
Cancelled | — | — | — | — | — | 37 | ||||||||||||||||||
Expired | 43 | (43 | ) | 4.35 | — | — | — | |||||||||||||||||
|
|
|
|
|
|
|
|
|
|
|
| |||||||||||||
Balance at September 30, 2013 | 2,928 | 3,868 | $ | 5.07 | 991 | $ | 15.68 | — | ||||||||||||||||
Increase in shares reserved | 1,150 | — | — | — | — | — | ||||||||||||||||||
Granted(1) | (1,774 | ) | — | — | 1,774 | 9.89 | — | |||||||||||||||||
Exercised/released | — | (1,689 | ) | 1.80 | (58 | ) | 16.83 | — | ||||||||||||||||
Forfeited(1) | 620 | (178 | ) | 11.29 | (442 | ) | 8.79 | — | ||||||||||||||||
Expired | 120 | (120 | ) | 10.60 | — | — | — | |||||||||||||||||
|
|
|
|
|
|
|
|
|
|
|
| |||||||||||||
Balance at September 30, 2014(1) | 3,044 | 1,881 | $ | 7.07 | 2,265 | $ | 12.46 | — | ||||||||||||||||
|
|
|
|
|
|
|
|
|
|
|
| |||||||||||||
The following table summarizes certain information of the stock options as of September 30, 2014:
| Options Outstanding | ||||||||||||||||
| Number of Shares | Weighted Average Exercise Price | Weighted Average Remaining Contractual Term (in Years) | Aggregate Intrinsic Value | |||||||||||||
| (in thousands) | (in millions) | |||||||||||||||
Vested and expected to vest | 1,881 | $ | 7.07 | 5.98 | $ | 7.1 | ||||||||||
Exercisable | 1,470 | $ | 5.80 | 5.45 | $ | 6.9 | ||||||||||
The following table summarizes certain information of the unvested awards as of September 30, 2014:
| Stock Options | Restricted Stock | ESPP | ||||||||||
Total compensation cost for unvested (in millions) | $ | 1.4 | $ | 12.1 | $ | 0.3 | ||||||
Weighted-average period to recognize (in years) | 2.0 | 2.2 | 0.4 | |||||||||
MODEL N, INC.
Notes to Consolidated Financial Statements
The following table summarizes certain information of the stock options for periods presented:
| Fiscal Years Ended September 30, | ||||||||||||
| 2014 | 2013 | 2012 | ||||||||||
| (in millions, expect grant date fair value) | ||||||||||||
Weighted average per share grant date fair value | $ | — | $ | 6.64 | $ | 4.50 | ||||||
Total intrinsic value of stock options exercised | $ | 13.8 | $ | 7.0 | $ | 3.0 | ||||||
Total fair value of shares vested | $ | 0.6 | $ | 0.6 | $ | 0.3 | ||||||
Stock-based Compensation
Stock-based compensation is as follows:
| Fiscal Years Ended September 30, | ||||||||||||
| 2014 | 2013 | 2012 | ||||||||||
| (in thousands) | ||||||||||||
Cost of revenues: | ||||||||||||
License and implementation | $ | 905 | $ | 591 | $ | 298 | ||||||
SaaS and maintenance | 749 | 622 | 561 | |||||||||
|
|
|
|
|
| |||||||
Total stock-based compensation in cost of revenues | 1,654 | 1,213 | 859 | |||||||||
|
|
|
|
|
| |||||||
Operating expenses: | ||||||||||||
Research and development | 1,278 | 747 | 297 | |||||||||
Sales and marketing | 2,789 | 1,687 | 1,103 | |||||||||
General and administrative | 4,228 | 1,209 | 262 | |||||||||
|
|
|
|
|
| |||||||
Total stock-based compensation included in operating expenses | 8,295 | 3,643 | 1,662 | |||||||||
|
|
|
|
|
| |||||||
Stock-based compensation included in operating loss | 9,949 | 4,856 | 2,521 | |||||||||
Stock-based compensation capitalized as software development cost | 27 | 182 | 12 | |||||||||
|
|
|
|
|
| |||||||
Total stock-based compensation | $ | 9,976 | $ | 5,038 | $ | 2,533 | ||||||
|
|
|
|
|
| |||||||
Valuation Assumptions
The following table presents the weighted-average assumptions used to estimate the fair value ofno stock options granted during the periods presented:
| Fiscal Years Ended September 30, | ||||||||||||
| 2014(1) | 2013 | 2012 | ||||||||||
Common stock valuation | $ | — | $ | 13.95 | $ | 9.57 | ||||||
Risk-free interest rate | — | 1.10 | % | 0.97 | % | |||||||
Dividend yield | — | — | — | |||||||||
Volatility | — | 50 | % | 50 | % | |||||||
Expected term (in years) | — | 6.08 | 6.01 | |||||||||
in fiscal years 2017, 2016 and 2015, respectively. The expected terms of options granted were calculated using the simplified method, determined as the average of the contractual term and the vesting period. Estimated volatility is derived from the historical closing prices of common shares of similar entities whose share prices are publicly available for the expected term of the option. The risk-free interest rate is based on the U.S. treasury constant maturities in effect at the time of grant for the expected term of the option. We use historical data to estimate the number of future stock option forfeitures.
The following table summarized the stock option activity and related information under all stock option plans:
|
|
|
|
|
|
|
|
|
| Weighted |
|
|
|
|
| |
|
|
|
|
|
| Weighted |
|
| Average |
|
| Aggregate |
| |||
|
| Number of |
|
| Average |
|
| Remaining |
|
| Intrinsic |
| ||||
|
| Shares |
|
| Exercised |
|
| Contract |
|
| Value |
| ||||
|
| (in thousands) |
|
| Price |
|
| Term (in years) |
|
| (in thousands) |
| ||||
Balance at September 30, 2014 |
|
| 1,881 |
|
|
| 7.07 |
|
|
| 5.98 |
|
| $ | 7,055 |
|
Exercised |
|
| (354 | ) |
|
| 3.71 |
|
|
| — |
|
|
|
|
|
Forfeited |
|
| (177 | ) |
|
| 12.01 |
|
|
| — |
|
|
|
|
|
Expired |
|
| (231 | ) |
|
| 12.18 |
|
|
| — |
|
|
|
|
|
Balance at September 30, 2015 |
|
| 1,119 |
|
|
| 6.29 |
|
|
| 4.68 |
|
| $ | 4,904 |
|
Exercised |
|
| (233 | ) |
|
| 3.96 |
|
|
| — |
|
|
|
|
|
Forfeited |
|
| (12 | ) |
|
| 13.70 |
|
|
| — |
|
|
|
|
|
Expired |
|
| (68 | ) |
|
| 12.72 |
|
|
| — |
|
|
|
|
|
Balance at September 30, 2016 |
|
| 806 |
|
| $ | 6.31 |
|
|
| 3.56 |
|
| $ | 4,103 |
|
Exercised |
|
| (329 | ) |
|
| 4.06 |
|
|
| — |
|
|
|
|
|
Forfeited |
|
| — |
|
|
| — |
|
|
| — |
|
|
|
|
|
Expired |
|
| (24 | ) |
|
| 11.69 |
|
|
| — |
|
|
|
|
|
Balance at September 30, 2017 |
|
| 453 |
|
| $ | 7.71 |
|
|
| 3.53 |
|
| $ | 3,281 |
|
|
|
|
|
|
|
|
|
|
|
|
|
|
|
|
|
|
Options exercisable as of September 30, 2017 |
|
| 453 |
|
| $ | 7.71 |
|
|
| 3.53 |
|
| $ | 3,281 |
|
|
|
|
|
|
|
|
|
|
|
|
|
|
|
|
|
|
Options vested and expected to vest as of September 30, 2017 |
|
| 453 |
|
| $ | 7.71 |
|
|
| 3.53 |
|
| $ | 3,281 |
|
The intrinsic value of options exercised during 2017, 2016 and 2015 was $2.5 million, $1.7 million and $2.6 million, respectively. The total estimated fair value of options vested during 2017, 2016 and 2015 was $22 thousand, $0.4 million and $1.6 million respectively.
Employee Stock Purchase Plan
The 2013 Employee Stock Purchase Plan (ESPP) became effective on March 19, 2013. The ESPP allows eligible employees to purchase shares of the Company’s common stock at a discount through payroll deductions of up to 15% of their eligible compensation, at not less than 85% of the fair market value, as defined in the ESPP, subject to any plan limitations. Except for the initial offering period, the ESPP provides for six-month offering periods, starting on February 20 and August 20 of each year.
74
MODEL N, INC.
Notes to Consolidated Financial Statements
The following table presentssummarizes the weighted-average assumptions used to estimate the fair value of rights to acquire stock granted under the Company’s Employee Stock Purchase Plan:ESPP plan during the periods presented:
| Fiscal Years Ended September 30, |
| Fiscal Years Ended September 30, |
| |||||||||||||||||||||
| 2014 | 2013 | 2012 |
| 2017 |
|
| 2016 |
|
| 2015 |
| |||||||||||||
Risk-free interest rate | 0.12 | % | 0.15 | % | — | % |
|
| 0.75 | % |
|
| 0.38 | % |
|
| 0.12 | % | ||||||
Dividend yield | — | — | — |
|
| — |
|
|
| — |
|
|
| — |
| |||||||||
Volatility | 34 | % | 36 | % | — | % |
|
| 29 | % |
|
| 34 | % |
|
| 33 | % | ||||||
Expected term (in years) | 0.77 | 0.91 | — |
|
| 0.50 |
|
|
| 0.50 |
|
|
| 0.50 |
| |||||||||
7.
Restricted Stock Units and Performance-based Restricted Stock Units
During the years ending September 30, 2017, 2016 and 2015, the Compensation Committee of the Board approved grants of performance-based restricted stock units to the Company’s certain senior officers, including the Chief Executive Officer and the Chief Financial Officer. Under the terms of these grants, the actual number of shares that will vest and be released will range from 0% to 250% of the grant based on the performance of the Company’s TSR relative to the TSR of the Index over a three-year period. No shares will vest and be released in the first year. In any of the two remaining years, no shares will vest and be released if the TSR of the Company’s common stock is below the 30th percentile relative to the Index; 100% of the grant will vest and be released if the Company’s TSR is at the 50th percentile relative to the Index; and 250% of the grant will vest and be released if the Company’s TSR is over the 90th percentile relative to the Index. These grants vest over a three-year period with 50% vesting on each of the second and the third annual anniversary of the vesting commencing date. In addition, these grants have a “catch-up” provision such that if the Company’s TSR relative to the Index for the three-year period exceeds that of the two-year period, additional shares for the two-year period will vest and be released based on the three-year achievement level. These grants have a ten-year term, subject to their earlier termination upon certain events including the awardee’s termination of employment. As of September 30, 2017, 1.3 million shares were reserved for any additional release resulting from over-achievement relating to performance-based restricted stock units.
The fair value of these grants with a market condition is recognized using the graded-vesting attribution method over the requisite service period. The Company used the Monte-Carlo simulation model to calculate the fair value of these awards on the grant date. The Monte-Carlo simulation model takes into account the same input assumptions as the Black-Scholes model; however, it also further incorporates into the fair value determination the possibility that the performance criteria may not be satisfied.
The grant date fair values of these awards were determined using the following assumptions:
|
| Fiscal Year Ended September 30, |
| |||||||||
|
| 2017 |
|
| 2016 |
|
| 2015 |
| |||
Risk-free interest rate |
| 1.32%-1.45% |
|
| 0.86%-1.15% |
|
|
| 1.10 | % | ||
Dividend yield |
|
| — |
|
|
| — |
|
|
| — |
|
Volatility |
| 38%-40% |
|
| 45% |
|
|
| 32 | % | ||
75
MODEL N, INC.
Notes to Consolidated Financial Statements
The following table summarizes the Company’s restricted stock unit activity (including performance based restricted stock awards) under all equity award plans:
|
|
|
|
|
| Weighted |
| |
|
| Restricted Stock |
|
| Average |
| ||
|
| Units Outstanding |
|
| Grant Date |
| ||
|
| (in thousands) |
|
| Fair Value |
| ||
Balance at September 30, 2014 |
|
| 2,265 |
|
| $ | 12.46 |
|
Granted |
|
| 1,505 |
|
|
| 11.17 |
|
Released |
|
| (963 | ) |
|
| 11.20 |
|
Forfeited |
|
| (505 | ) |
|
| 11.66 |
|
Balance at September 30, 2015 |
|
| 2,302 |
|
| $ | 12.32 |
|
Granted |
|
| 2,064 |
|
|
| 10.61 |
|
Released |
|
| (720 | ) |
|
| 10.50 |
|
Forfeited |
|
| (529 | ) |
|
| 11.24 |
|
Balance at September 30, 2016 |
|
| 3,117 |
|
| $ | 11.81 |
|
Granted |
|
| 1,817 |
|
|
| 11.67 |
|
Released |
|
| (813 | ) |
|
| 10.58 |
|
Forfeited |
|
| (1,204 | ) |
|
| 10.65 |
|
Balance at September 30, 2017 |
|
| 2,917 |
|
| $ | 12.55 |
|
The total fair value of restricted stock and restricted stock awards vested for the years ended September 30, 2017, 2016 and 2015 was $8.6 million, $7.6 million and $10.7 million, respectively.
The following table summarizes certain information of the unvested awards as of September 30, 2017:
|
| Restricted Stock Units (1) |
|
| ESPP |
| ||
Total compensation cost for unvested (in millions) |
| $ | 20.6 |
|
| $ | 0.3 |
|
Weighted-average period to recognize (in years) |
|
| 2.3 |
|
|
| 0.4 |
|
(1): | Includes restricted stock units and performance-based restricted stock awards. |
Stock-based Compensation
Stock-based compensation recorded in the statements of operations is as follows:
|
| Fiscal Years Ended September 30, |
| |||||||||
|
| 2017 |
|
| 2016 |
|
| 2015 |
| |||
|
| (in thousands) |
| |||||||||
Cost of revenues: |
|
|
| |||||||||
License and implementation |
| $ | 1,015 |
|
| $ | 918 |
|
| $ | 699 |
|
SaaS and maintenance |
|
| 1,007 |
|
|
| 1,032 |
|
|
| 799 |
|
Total stock-based compensation in cost of revenues |
|
| 2,022 |
|
|
| 1,950 |
|
|
| 1,498 |
|
Operating expenses: |
|
|
|
|
|
|
|
|
|
|
|
|
Research and development |
|
| 1,744 |
|
|
| 1,393 |
|
|
| 1,353 |
|
Sales and marketing |
|
| 2,651 |
|
|
| 3,307 |
|
|
| 3,202 |
|
General and administrative |
|
| 4,143 |
|
|
| 6,418 |
|
|
| 4,302 |
|
Total stock-based compensation in operating expenses |
|
| 8,538 |
|
|
| 11,118 |
|
|
| 8,857 |
|
Stock-based compensation in operating loss |
|
| 10,560 |
|
|
| 13,068 |
|
|
| 10,355 |
|
Stock-based compensation capitalized as software development cost |
|
| — |
|
|
| — |
|
|
| 109 |
|
Total stock-based compensation |
| $ | 10,560 |
|
| $ | 13,068 |
|
| $ | 10,464 |
|
76
MODEL N, INC.
Notes to Consolidated Financial Statements
10. Income Taxes
The components of loss before income taxes are as follows:
| Fiscal Years Ended September 30, |
| Fiscal Years Ended September 30, |
| |||||||||||||||||||||
| 2014 | 2013 | 2012 |
| 2017 |
|
| 2016 |
|
| 2015 |
| |||||||||||||
| (in thousands) |
| (in thousands) |
| |||||||||||||||||||||
Domestic | $ | (21,279 | ) | $ | (1,340 | ) | $ | (6,114 | ) |
| $ | (43,753 | ) |
| $ | (34,527 | ) |
| $ | (20,292 | ) | |||
Foreign | 782 | 853 | 722 |
|
| 921 |
|
|
| 1,751 |
|
|
| 1,181 |
| |||||||||
|
|
| ||||||||||||||||||||||
Loss before taxes | $ | (20,497 | ) | $ | (487 | ) | $ | (5,392 | ) |
| $ | (42,832 | ) |
| $ | (32,776 | ) |
| $ | (19,111 | ) | |||
|
|
| ||||||||||||||||||||||
The Company has made no provision for U.S. income taxes on approximately $2.1$4.4 million of cumulative undistributed earnings of certain foreign subsidiaries at September 30, 20142017 because it is the Company’sCompany's intention to reinvest such earnings permanently. The determination of the amount of unrecognized deferred tax liability related to these earnings is not practicable.
The components of the provision (benefit) for income taxes are as follows:
| Fiscal Years Ended September 30, | ||||||||||||
| 2014 | 2013 | 2012 | ||||||||||
| (in thousands) | ||||||||||||
Current | ||||||||||||
State | $ | 53 | $ | 54 | $ | 8 | ||||||
Foreign | 295 | 355 | 267 | |||||||||
|
|
|
|
|
| |||||||
| 348 | 409 | 275 | ||||||||||
|
|
|
|
|
| |||||||
Deferred | ||||||||||||
Federal | 27 | 27 | 23 | |||||||||
State | 9 | 3 | 3 | |||||||||
|
|
|
|
|
| |||||||
| 36 | 30 | 26 | ||||||||||
|
|
|
|
|
| |||||||
Total provision for income taxes | $ | 384 | $ | 439 | $ | 301 | ||||||
|
|
|
|
|
| |||||||
MODEL N, INC.
Notes to Consolidated Financial Statements
|
| Fiscal Years Ended September 30, |
| |||||||||
|
| 2017 |
|
| 2016 |
|
| 2015 |
| |||
|
| (in thousands) |
| |||||||||
Current |
|
|
|
|
|
|
|
|
|
|
|
|
State |
| $ | 37 |
|
| $ | 23 |
|
| $ | 13 |
|
Foreign |
|
| 647 |
|
|
| 140 |
|
|
| 482 |
|
|
|
| 684 |
|
|
| 163 |
|
|
| 495 |
|
Deferred |
|
|
|
|
|
|
|
|
|
|
|
|
Federal |
|
| (3,436 | ) |
|
| 150 |
|
|
| 27 |
|
State |
|
| (533 | ) |
|
| 22 |
|
|
| 6 |
|
|
|
| (3,969 | ) |
|
| 172 |
|
|
| 33 |
|
Total provision (benefit) for income taxes |
| $ | (3,285 | ) |
| $ | 335 |
|
| $ | 528 |
|
Reconciliation of the statutory federal income tax to the Company’s effective tax:
| Fiscal Years Ended September 30, |
| Fiscal Years Ended September 30, |
| |||||||||||||||||||||
| 2014 | 2013 | 2012 |
| 2017 |
|
| 2016 |
|
| 2015 |
| |||||||||||||
| (in thousands) |
| (in thousands) |
| |||||||||||||||||||||
Tax at statutory federal rate | $ | (6,969 | ) | $ | (165 | ) | $ | (1,833 | ) |
| $ | (14,563 | ) |
| $ | (11,147 | ) |
| $ | (6,498 | ) | |||
State tax, net of federal benefit | 53 | 54 | (214 | ) |
|
| 37 |
|
|
| 23 |
|
|
| 13 |
| ||||||||
Permanent differences | 727 | 1,053 | 87 |
|
| 96 |
|
|
| 571 |
|
|
| 729 |
| |||||||||
Foreign tax rate differential | 29 | 65 | 22 |
|
| 334 |
|
|
| (453 | ) |
|
| 81 |
| |||||||||
Change in valuation allowance | 6,625 | 128 | 2,670 |
|
| 15,279 |
|
|
| 12,008 |
|
|
| 6,648 |
| |||||||||
Research and development tax credits | (175 | ) | (726 | ) | (393 | ) |
|
| (656 | ) |
|
| (834 | ) |
|
| (450 | ) | ||||||
Foreign tax credits | 35 | (27 | ) | — |
|
| — |
|
|
| — |
|
|
| (7 | ) | ||||||||
Change in deferred tax liabilities | 36 | 30 | — |
|
| (3,390 | ) |
|
| 173 |
|
|
| 33 |
| |||||||||
Other | 23 | 27 | (38 | ) |
|
| (422 | ) |
|
| (6 | ) |
|
| (21 | ) | ||||||||
|
|
| ||||||||||||||||||||||
Total provision for income taxes | $ | 384 | $ | 439 | $ | 301 | ||||||||||||||||||
|
|
| ||||||||||||||||||||||
Total provision (benefit) for income taxes |
| $ | (3,285 | ) |
| $ | 335 |
|
| $ | 528 |
| ||||||||||||
The Company is subject to income taxes in U.S. federal and various state, local and foreign jurisdictions. The tax years ended from September 2000 to September 20142017 remain open to examination due to the carryover of unused net operating losses or tax credits.
77
MODEL N, INC.
Notes to Consolidated Financial Statements
Deferred tax assets and liabilityliabilities consisted of the following:
| As of September 30, |
| As of September 30, |
| |||||||||||||
| 2014 | 2013 |
| 2017 |
|
| 2016 |
| |||||||||
| (in thousands) |
| (in thousands) |
| |||||||||||||
Deferred tax assets: |
|
|
|
|
|
|
|
| ||||||||
Depreciation and amortization | $ | (425 | ) | $ | (1,147 | ) |
| $ | 842 |
|
| $ | 436 |
| ||
Accruals and other | 6,833 | 5,005 |
|
| 5,541 |
|
|
| 2,616 |
| ||||||
Deferred revenue | 3,045 | 877 |
|
| 3,288 |
|
|
| 4,295 |
| ||||||
NOL carry-forward | 18,917 | 16,416 |
|
| 68,190 |
|
|
| 35,885 |
| ||||||
Stock compensation |
|
| 4,840 |
|
|
| 4,389 |
| ||||||||
Research and development tax credits | 6,315 | 5,744 |
|
| 9,792 |
|
|
| 8,492 |
| ||||||
|
| |||||||||||||||
Total deferred tax assets | 34,685 | 26,895 |
|
| 92,493 |
|
|
| 56,113 |
| ||||||
Valuation allowance | (34,685 | ) | (26,895 | ) |
|
| (78,003 | ) |
|
| (56,113 | ) | ||||
|
| |||||||||||||||
Net deferred tax assets | $ | — | $ | — |
| $ | 14,490 |
|
| $ | — |
| ||||
|
| |||||||||||||||
Deferred tax liabilities: |
|
|
|
|
|
|
|
| ||||||||
Intangibles | $ | 89 | $ | 56 |
|
| (14,983 | ) |
|
| (295 | ) | ||||
Net deferred tax liabilities |
| $ | (493 | ) |
| $ | (295 | ) | ||||||||
A valuation allowance is provided when it is more likely than not that the deferred tax assets will not be realized. The Company had established a valuation allowance to offset net deferred tax assets at September 30, 2014, 20132017, 2016, and 20122015 due to the uncertainty of realizing future tax benefits from its net operating loss carry-forwards and other deferred tax assets. In the second quarter of fiscal 2017, as a result of acquiring Revitas, we recorded an income tax benefit of $4.2 million due to a partial release of valuation allowance. The net change in the total valuation allowance for the year ended September 30, 20142017 was an increase of approximately $7.8$21.9 million.
At September 30, 2014,2017, the Company has federal and California net operating loss carry-forwards of approximately $58.5$191.3 million and $26.3$45.2 million, respectively. The federal and California net operating losses will begin expiring in 2021 and 2015,2018, respectively. At September 30, 2014,2017, the Company also had other state net operating loss carry-forwards of approximately $0.5$5.2 million which will begin expiring in 2016. 2018. At September 30,
MODEL N, INC.
Notes to Consolidated Financial Statements
2014, 2017, the Company had federal and state research credit carry forwards of approximately $4.3$5.3 million and $5.3$6.5 million, respectively. The federal research and development credit carry-forwards will begin expiring in 2020. The California tax credit can be carried forward indefinitely.
The Company is tracking its deferred tax assets attributable to stock option benefits in a separate memo account pursuant to ASC 718. Therefore, these amounts are not included in the Company’sCompany's gross or net deferred tax assets. As of September 30, 2014, 20132017, 2016 and 2012,2015, the Company had stock option benefits of approximately $3.1$4.7 million, $0.9$3.9 million and $0.5$3.7 million, respectively. Pursuant to ASC 718-740-25-10, the stock option benefits will be recorded to equity when they reduce cash taxes payable.payable.
As of September 30, 2014,2017, the Company had unrecognized tax benefits of approximately $2.5$3.1 million. It is unlikely that the amount of liability for unrecognized tax benefits will significantly change over the next twelve months. The Company’sCompany's policy is to recognize interest and penalties accrued on any unrecognized tax benefits as a component of income tax expense. As of September 30, 2014,2017, there was a liability of $0.3$0.2 million related to uncertain tax positions recorded on the financial statementsstatements.
Internal Revenue Code section 382 places a limitation (the “Section"Section 382 Limitation”Limitation") on the amount of taxable income can be offset by net operating (“NOL”("NOL") carry-forwards after a change in control (generally greater than 50% change in ownership) of a loss corporation. California has similar rules. The Company’sCompany's capitalization described herein may have resulted in such a change. Generally, after a control change, a loss corporation cannot deduct NOL carry-forwards in excess of the Section 382 limitation. A high levelAn IRC Section 382 analysis has been performed as of September 30, 20132017 and determined there would be no effect on the NOL Deferred Tax Asset if ownership changes occurred.
78
MODEL N, INC.
Notes to Consolidated Financial Statements
A reconciliation of the beginning and ending amount of unrecognized tax benefits is as follows:
| Fiscal Years Ended September 30, | ||||||||||||
| 2014 | 2013 | 2012 | ||||||||||
| (in thousands) | ||||||||||||
Unrecognized tax benefits at the beginning of the period | $ | 1,979 | $ | 1,683 | $ | 1,438 | ||||||
Gross increase based on tax positions during the prior period | 18 | 78 | — | |||||||||
Gross increase based on tax positions during the current period | 516 | 218 | 245 | |||||||||
|
|
|
|
|
| |||||||
Unrecognized tax benefits at the end of the period | $ | 2,513 | $ | 1,979 | $ | 1,683 | ||||||
|
|
|
|
|
| |||||||
|
| Fiscal Years Ended September 30, |
| |||||||||
|
| 2017 |
|
| 2016 |
|
| 2015 |
| |||
|
| (in thousands) |
| |||||||||
Unrecognized tax benefits at the beginning of the period |
| $ | 3,310 |
|
| $ | 3,119 |
|
| $ | 2,513 |
|
Gross decrease based on tax positions during the prior period |
|
| (584 | ) |
|
| (147 | ) |
|
| — |
|
Gross increase based on tax positions during the prior period |
|
| — |
|
|
| — |
|
| $ | 58 |
|
Gross increase based on tax positions during the current period |
|
| 417 |
|
|
| 338 |
|
| 548 |
| |
Unrecognized tax benefits at the end of the period |
| $ | 3,143 |
|
| $ | 3,310 |
|
| $ | 3,119 |
|
MODEL N, INC.
Notes to Consolidated Financial Statements
8.11. Net Loss Per Share
The following table sets forth the computation of the Company’s basic and diluted net income (loss)loss per share attributable to common stockholders underis calculated by dividing the two-class method duringnet loss attributable to common stockholders by the weighted average number of shares of common stock outstanding for the period, presented:which excludes unvested restricted stock awards. The diluted net loss per share attributable to common stockholders is computed by giving effect to all potentially dilutive common stock equivalents outstanding for the period. For purposes of this calculation, options to purchase common stock, unvested restricted stock awards and unvested restricted stock units are considered to be common stock equivalents.
|
| Fiscal Years Ended September 30, |
| |||||||||
|
| 2017 |
|
| 2016 |
|
| 2015 |
| |||
|
| (in thousands, except per share data) |
| |||||||||
Numerator: |
|
|
|
|
|
|
|
|
|
|
|
|
Basic and diluted: |
|
|
|
|
|
|
|
|
|
|
|
|
Net loss attributable to common stockholders |
| $ | (39,547 | ) |
| $ | (33,111 | ) |
| $ | (19,639 | ) |
Denominator: |
|
|
|
|
|
|
|
|
|
|
|
|
Basic and diluted: |
|
|
|
|
|
|
|
|
|
|
|
|
Weighted Average Shares Used in Computing Net Loss per Share Attributable to Common Stockholders |
|
| 28,649 |
|
|
| 27,379 |
|
|
| 26,015 |
|
Net Loss per Share Attributable to Common Stockholders: |
|
|
|
|
|
|
|
|
|
|
|
|
Basic and diluted |
| $ | (1.38 | ) |
| $ | (1.21 | ) |
| $ | (0.76 | ) |
The following weighted average shares of common stock equivalents were excluded from the computation of diluted net loss per share attributable to common stockholders for the periods presented because including them would have been antidilutive:
| Fiscal Years Ended September 30, | ||||||||||||
| 2014 | 2013 | 2012 | ||||||||||
| (in thousands, except share and per share data) | ||||||||||||
Numerator: | ||||||||||||
Basic and diluted: | ||||||||||||
Net loss attributable to common stockholders | $ | (20,881 | ) | $ | (926 | ) | $ | (5,693 | ) | |||
|
|
|
|
|
| |||||||
Denominator: | ||||||||||||
Basic and diluted: | ||||||||||||
Weighted Average Shares Used in Computing Net Loss per Share Attributable to Common Stockholders; basic and diluted | 24,399,387 | 15,979,481 | 7,815,258 | |||||||||
|
|
|
|
|
| |||||||
Net Loss per Share Attributable to Common Stockholders; basic and diluted | $ | (0.86 | ) | $ | (0.06 | ) | $ | (0.73 | ) | |||
|
|
|
|
|
| |||||||
|
| Fiscal Years Ended September 30, |
| |||||||||
|
| 2017 |
|
| 2016 |
|
| 2015 |
| |||
|
| (in thousands) |
| |||||||||
Stock options |
|
| 414 |
|
|
| 650 |
|
|
| 1,228 |
|
Performance-based restricted stock units and restricted stock units |
|
| 1,074 |
|
|
| 736 |
|
|
| 724 |
|
ESPP |
|
| — |
|
|
| — |
|
|
| 20 |
|
The following weighted average shares of common stock equivalents were excluded from the computation of diluted net loss per share attributable to common stockholders for the periods presented because including them would have been antidilutive:
| Fiscal Years Ended September 30, | ||||||||||||
| 2014 | 2013 | 2012 | ||||||||||
Stock options | 1,971,126 | 4,254,831 | 4,089,654 | |||||||||
Restricted stock awards, performance-based restricted stock units and restricted stock units | 1,016,181 | 620,528 | 93,807 | |||||||||
Preferred stock warrant | — | 44,398 | 86,655 | |||||||||
ESPP | 22,588 | 9,313 | — | |||||||||
9.12. Geographic Information
The Company has one operating segment with one business activity—activity - developing and monetizing revenue management solutions.
Revenues from External Customers
Revenues from customers outside the United States were 11%, 14%10% and 9%6% of total revenues for the fiscal years ended September 30, 2014, 20132017, 2016 and 2012,2015, respectively.
79
MODEL N, INC.
Notes to Consolidated Financial Statements
Long-Lived Assets
The following table sets forth the Company’s property and equipment, net by geographic region:
| As of September 30, | ||||||||
| 2014 | 2013 | |||||||
| (in thousands) | ||||||||
United States | $ | 5,858 | $ | 6,811 | ||||
Other | 1,031 | 1,060 | ||||||
|
|
|
| |||||
Total property and equipment, net | $ | 6,889 | $ | 7,871 | ||||
|
|
|
| |||||
10. Restructuring Charges
On September 30, 2013, the Company announced a plan to align its workforce with the Company’s strategic initiatives that included a reduction in the size of the Company’s workforce, primarily in professional services. The Company recorded a workforce reduction restructuring charge of $26,000 and $1.2 million in fiscal years 2014 and 2013, respectively, primarily related to employee separation packages, which included severance pay, benefits continuation and outplacement costs. As of September 30, 2014 the Company had completed its restructuring activities.
A roll-forward of the restructuring activity is summarized below:
|
| As of September 30, |
| |||||
|
| 2017 |
|
| 2016 |
| ||
|
| (in thousands) |
| |||||
United States |
| $ | 3,867 |
|
| $ | 4,817 |
|
India |
|
| 744 |
|
|
| 1,324 |
|
Total property and equipment, net |
| $ | 4,611 |
|
| $ | 6,141 |
|
| Fiscal Years Ended September 30, | ||||||||
| 2014 | 2013 | |||||||
| (in thousands) | ||||||||
Opening balance | $ | 1,182 | $ | — | ||||
Amounts accrued | 26 | 1,215 | ||||||
Cash payments | (1,208 | ) | (33 | ) | ||||
|
|
|
| |||||
Balance of accrual | $ | — | $ | 1,182 | ||||
|
|
|
| |||||
11. Acquisition
On January 18, 2012, the Company acquired certain assets of LeapFrogRx, Inc. (LeapFrogRx), a privately held cloud-based analytics solution provider for the pharmaceutical industry. The Company paid total purchase consideration of $3.0 million in cash.
The purchase price was allocated to tangible and identifiable intangible assets acquired and liabilities assumed based on their respective fair values on the date of acquisition. The purchase accounting allocation resulted in intangible assets of $1.5 million and goodwill of $1.2 million. Intangible assets acquired included developed technology, backlog, non-competition agreements and customer relationships, and are being amortized on a straight-line basis over their estimated useful lives of 3 to 5 years. The key factors attributable to the creation of goodwill by the transaction are synergies in skill-sets, operations, customer base and organizational cultures.
MODEL N, INC.
Notes to Consolidated Financial Statements
The allocation of the purchase price was as follows:13. Subsequent Event
| Amount | ||||
| (in thousands) | ||||
Tangible assets | $ | 685 | ||
Intangible assets: | ||||
Developed technology | 1,124 | |||
Backlog | 100 | |||
Non-competition agreements | 100 | |||
Customer relationships | 158 | |||
Liabilities assumed | (1,024 | ) | ||
Payments due from seller | 667 | |||
Goodwill | 1,190 | |||
|
| |||
Total purchase price | $ | 3,000 | ||
|
| |||
Retention-Related Payments
In addition to the total purchase consideration of $3.0 million, the Company is contingently obligated to make additional payments, as described below, which are expected to be incurred through January 2015. These cash payments are subject to future employment and are considered compensatory in nature and are being recognized as compensation expense.
The Company paid $1.0 million each in January 2014 and 2013 and $3.0 million in July 2012. A future payment of $1.0 million is due January, 2015. Due to the employment service criteria associated with these payments, expenses are being recognized ratably over the term of each payment beginning from the date of the acquisition. The Company recognized compensation expenses of $0.5 million, $1.1 million and $4.3 million during the fiscal year ended September 30, 2014, 2013 and 2012, respectively.
In accordance with the terms of the purchase consideration, up to $1.0 million of earn-out consideration is payable each year based on revenue recognized during the twelve-month period ending January 2013 and the twelve-month period ending January 2014. Due to the employment service criteria associated with these payments, expenses are being recognized ratably over the term of each payment beginning from the date of acquisition. The Company recognized an expense of $0 million, a credit of $0.4 million and an expense of $0.4 million during the fiscal years ended September 30, 2014, 2013 and 2012, respectively. The Company offered one-time retention bonus amounts to the former employees of LeapFrogRx, totaling $0.3 million payable in January 2013 and guaranteed bonus payments totaling $0.4 million for the fiscal year ended September 30, 2012, subject to continuous employment. In addition, the Company issued 200,000 shares of restricted stock to certain employees of LeapFrogRx (see Note 6).
Included in the Company’s consolidated statement of operations for the fiscal year ended September 30, 2012, were revenues of approximately $6.0 million from LeapFrogRx since its acquisition in January 2012.
The Company did not make any acquisitions during fiscal years 2013 and 2014.
12. Convertible Preferred Stock
Upon the closing of the IPO, all outstanding shares of convertible preferred stock were converted into shares of common stock, and an outstanding warrant to purchase convertible preferred stock automatically converted into a warrant to purchase 86,655 shares of common stock.
MODEL N, INC.
Notes to Consolidated Financial Statements
Convertible Preferred Stock Warrant
On October 19, 2010, in connection with05, 2017, The Company entered into a loan agreement,lease agreement. The thirty-seven month lease began on October 30, 2017, provides the Company issued a warrant to purchase 86,655 shareswith approximately 35,000 square feet of office space in San Mateo, California. Base annual rent is initially set at approximately $140,000 per month. Total base rent payable over the Company’s Series C Preferred Stock at an exercise price of $3.462 per share. The warrantlease period is exercisable in whole or in part at any time on or before the expiration date of the 10-year anniversary from the issuance date. Upon the closing of the IPO, this warrant automatically converted into a warrant to purchase the same number of shares of common stock at the same exercise price per share.
Prior to the closing of the IPO, the Company re-measured the fair value of the preferred stock warrant at each balance sheet date. The fair value of the outstanding warrant was classified within non-current liabilities on the consolidated balance sheets, and any changes in fair value were recognized as a component of other expenses, net in the consolidated statements of operations.
Upon the closing of the IPO, the warrant was reclassified from liability to equity and the Company will no longer record any mark-to-market changes in the fair value of the warrant.$4.9 million. The Company performed the final re-measurementmay renew this lease for two additional periods of the warrant on March 25, 2013, the closing date of the IPO, and recorded an expense of $0.7 million arising from the revaluation during the three months ended March 31, 2013. In May 2013, the warrant was converted into 71,847 shares of common stock, net of the warrant price.
The fair value of the outstanding warrant was determined using the Black-Scholes-Merton option-pricing model. The fair value of the warrant was estimated using the following assumptions for the periods presented below.five years each.
| Fiscal Years Ended September 30, | ||||||||
| 2013 | 2012 | |||||||
Risk-free interest rate | 0.92 | % | 0.83 | % | ||||
Dividend yield | — | — | ||||||
Volatility | 45 | % | 53 | % | ||||
Expected term (in years) | 5.92 | 8.05 | ||||||
The change in the fair value of the convertible preferred stock warrant liability is summarized below:
| Fiscal Years Ended September 30, | ||||||||
| 2013 | 2012 | |||||||
Opening balance | $ | 748 | $ | 403 | ||||
Issuance of convertible preferred stock warrant | — | — | ||||||
Increase in fair value | 671 | 345 | ||||||
Reclassification of warrant liability to additional paid-in capital | (1,419 | ) | — | |||||
|
|
|
| |||||
Closing balance | $ | — | $ | 748 | ||||
|
|
|
| |||||
ITEM 9. | Changes in and Disagreements with |
Evaluation of Disclosure Controls and Procedures
Our management, with the participation of our Chief Executive Officer and our Chief Financial Officer, evaluated the effectiveness of our disclosure controls and procedures as of September 30, 2014.2017. The term “disclosure controls and procedures,” as defined in Rules 13a-15(e) and 15d-15(e) under the Exchange Act, means controls and other procedures of a company that are designed to ensure that information required to be disclosed by a company in the reports that it files or submits under the Exchange Act is recorded, processed, summarized and reported, within the time periods specified in the SEC’s rules and forms. Disclosure controls and procedures include, without limitation, controls and procedures designed to ensure that information required to be disclosed by a company in the reports that it files or submits under the Exchange Act is accumulated and communicated to the company’s management, including its principal executive and principal financial officers, as appropriate to allow timely decisions regarding required disclosure. Based on the evaluation of our disclosure controls and procedures as of September 30, 2014,2017, our Chief Executive Officer and Chief Financial Officer concluded that, as of such date, our disclosure controls and procedures were effective at the reasonable assurance level.
Management’s Annual Report on Internal Control over Financial Reporting
Our management is responsible for establishing and maintaining adequate internal control over financial reporting as defined in Rule 13a-15(f) under the Exchange Act. Under the supervision and with the participation of our management, including our Chief Executive Officer and Chief Financial Officer, we conducted an evaluation of the effectiveness of our internal control over financial reporting as of September 30, 20142017 using the criteria established inInternal Control—Integrated Framework (1992) (2013 framework) issued by the Committee of Sponsoring Organizations of the Treadway Commission (COSO).
Based on our evaluation under the COSO framework, our management has concluded that our internal control over financial reporting is effective as of September 30, 20142017 to provide reasonable assurance regarding the reliability of financial reporting and the preparation of financial statements for external purposes in accordance with generally accepted accounting principles.
This Annual Report on Form 10-K does not include an attestation report of our registered public accounting firm on our internal control over financial reporting due to an exemption established by the JOBS Act for “emerging growth companies.”
Changes in Internal Control over Financial Reporting
There was no change in our internal control over financial reporting identified in connection with the evaluation required by Rule 13a-15(d) and 15d-15(d) of the Exchange Act that occurred during the quarter ended September 30, 20142017 that has materially affected, or is reasonably likely to materially affect, our internal control over financial reporting.
Inherent Limitations on Effectiveness of Controls
Our management, including our Chief Executive Officer and Chief Financial Officer, believes that our disclosure controls and procedures and internal control over financial reporting are designed to provide reasonable assurance of achieving their objectives and are effective at the reasonable assurance level. However, our management does not expect that our disclosure controls and procedures or our internal control over financial
reporting will prevent all errors and all fraud. A control system, no matter how well conceived and operated, can provide only reasonable, not absolute, assurance that the objectives of the control system are met. Further, the design of a control system must reflect the fact that there are resource constraints, and the benefits of controls must be considered relative to their costs. Because of the inherent limitations in all control systems, no evaluation of controls can provide absolute assurance that all control issues and instances of fraud, if any, have been detected. These inherent limitations include the realities that judgments in decision making can be faulty, and that breakdowns can occur because of a simple error or mistake. Additionally, controls can be circumvented by the individual acts of some persons, by collusion of two or more people or by management override of the controls. The design of any system of controls also is based in part upon certain assumptions about the likelihood of future events, and there can be no assurance that any design will succeed in achieving its stated goals under all potential future conditions; over time, controls may become inadequate because of changes in conditions, or the degree of compliance with policies or procedures may deteriorate. Because of the inherent limitations in a cost-effective control system, misstatements due to error or fraud may occur and not be detected.
None.
PART III
Information about our Executive Officers and our Directors is incorporated by reference to information contained in the Proxy Statement for the 20152018 Annual Meeting of Stockholders to be filed with the SEC within 120 days of September 30, 2014.2017.
We have adopted a code of business conduct for directors and a code of business conduct for all of our employees, including our executive officers, and those employees responsible for financial reporting. Both codes of business conduct are available on the investor relations portion of our website at investor.modeln.com. A copy may also be obtained without charge by contacting Investor Relations, Model N, Inc., 1600 Seaport777 Mariners Island Boulevard, Suite 400, Pacific Shores Center, Building 6, Redwood City,300, San Mateo, CA 9406394404 or by calling (650) 610-4998.
We plan to post on our website at the address described above any future amendments or waivers of our codes of business conduct.
The information required by this item is incorporated by reference to information contained in the Proxy Statement for the 2015 2018 Annual Meeting of Stockholders to be filed with the SEC within 120 days of September 30, 2014.2017.
ITEM 12. | Security Ownership of Certain Beneficial Owners and Management and Related Stockholder Matters |
The information required by this item is incorporated by reference to information contained in the Proxy Statement for the 20152018 Annual Meeting of Stockholders to be filed with the SEC within 120 days of September 30, 2014.2017.
The information required by this item is incorporated by reference to information contained in the Proxy Statement for the 20152018 Annual Meeting of Stockholders to be filed with the SEC within 120 days of September 30, 2014.2017.
The information required by this item is incorporated by reference to information contained in the Proxy Statement for the 20152018 Annual Meeting of Stockholders to be filed with the SEC within 120 days of September 30, 2014.
PART IV
(1) | Financial Statements |
The financial statements are set forth in Item 8 of this Annual Report on Form 10-K.
(2) | Financial Statement Schedule |
Schedule II—II - Valuation and qualifying accounts
The table below presents the changes in the allowance for doubtful receivables and valuation allowance for deferred tax assetsaccounts for the fiscal years ended September 30, 2014, 2013,2017, 2016, and 2012,2015, respectively.
Description | Balance at Beginning of Period | Additions Charged to Costs and Expenses | Write-offs and Deductions | Balance at End of Period | ||||||||||||
Allowance for doubtful receivables | ||||||||||||||||
Year Ended September 30, 2014 | $ | 46 | — | 46 | $ | — | ||||||||||
Year Ended September 30, 2013 | $ | 55 | 48 | 57 | $ | 46 | ||||||||||
Year Ended September 30, 2012 | $ | 10 | 55 | 10 | $ | 55 | ||||||||||
Valuation allowance for deferred tax assets | ||||||||||||||||
Year Ended September 30, 2014 | $ | 26,895 | 7,790 | — | $ | 34,685 | ||||||||||
Year Ended September 30, 2013 | $ | 27,515 | — | 620 | $ | 26,895 | ||||||||||
Year Ended September 30, 2012 | $ | 24,845 | 2,670 | — | $ | 27,515 | ||||||||||
Description |
| Balance at Beginning of Period |
|
| Additions Charges to Costs and Expenses |
|
| Write-offs and Deductions |
|
| Balance at End of Period |
| ||||
Allowance for doubtful receivables |
|
|
|
|
|
|
|
|
|
|
|
|
|
|
|
|
For the Year Ended September 30, 2017 |
| $ | — |
|
|
| 85 |
|
|
| — |
|
| $ | 85 |
|
For the Year Ended September 30, 2016 |
| $ | — |
|
|
| — |
|
|
| — |
|
| $ | — |
|
For the Year Ended September 30, 2015 |
| $ | — |
|
|
| — |
|
|
| — |
|
| $ | — |
|
|
|
|
|
|
|
|
|
|
|
|
|
|
|
|
|
|
Valuation allowance for deferred tax assets |
|
|
|
|
|
|
|
|
|
|
|
|
|
|
|
|
For the Year Ended September 30, 2017 |
| $ | 56,113 |
|
|
| 21,890 |
|
|
| — |
|
| $ | 78,003 |
|
For the Year Ended September 30, 2016 |
| $ | 42,128 |
|
|
| 13,985 |
|
|
| — |
|
| $ | 56,113 |
|
For the Year Ended September 30, 2015 |
| $ | 34,685 |
|
|
| 7,443 |
|
|
| — |
|
| $ | 42,128 |
|
(3) | Exhibits |
The following exhibits are included herein or incorporated herein by reference:
| Incorporated by Reference | ||||||||||||||||||||
Exhibit Number | Exhibit Description | Form | File No. | Exhibit | Filing Date | Filed Herewith | ||||||||||||||
| 3.1 | Amended and Restated Certificate of Incorporation of the Registrant | 10-Q | 001-35840 | 3.1 | 5/10/2013 | |||||||||||||||
| 3.2 | Amended and Restated Bylaws of the Registrant | 10-Q | 001-35840 | 3.2 | 5/10/2013 | |||||||||||||||
| 4.1 | Form of Registrant’s Common Stock certificate | S-1 | 333-186668 | 4.01 | 3/7/2013 | |||||||||||||||
| 4.2 | Amended and Restated Investor Rights Agreement dated December 12, 2003 by and among Registrant and certain of its stockholders | S-1 | 333-186668 | 4.02 | 2/13/2013 | |||||||||||||||
| 10.1 | Form of Indemnity Agreement to be entered into between Registrant and each of its officers and directors | S-1 | 333-186668 | 10.01 | 3/12/2013 | |||||||||||||||
| 10.2† | 2000 Stock Plan and forms of stock option agreement and stock option exercise agreement | S-1 | 333-186668 | 10.02 | 2/13/2013 | |||||||||||||||
| 10.3† | 2010 Equity Incentive Plan and forms of stock option agreement and stock option exercise agreement | S-1 | 333-186668 | 10.03 | 2/13/2013 | |||||||||||||||
| 10.4† | 2013 Equity Incentive Plan and forms of stock option agreement and stock option exercise agreement | S-1 | 333-186668 | 10.04 | 3/7/2013 | |||||||||||||||
Exhibit Number Exhibit Description Incorporated by Reference Form File No. Exhibit Filing Date Filed
Herewith 10.5† 2013 Employee Stock Purchase Plan S-8 333-187388 99.4 3/20/2013 10.6† Employment offer letter dated April 27, 2014 by and between Registrant and Mark Tisdel. X 10.7† Employment offer letter dated October 2, 2013 by and between Registrant and Chris Larsen. X 10.9† Form of Restricted Stock Unit Agreement 10-K 001-35840 10.12 12/6/2013 10.10 Sublease Agreement by and among Openwave Mobility, Inc., Openwave Messaging, Inc. and Registrant dated May 12, 2014 10-Q 001-35840 10.12 8/8/2014 21.1 List of Subsidiaries of Registrant X 23.1 Consent of PricewaterhouseCoopers LLP, independent registered public accounting firm X 24.1 Power of Attorney (included on the signature page to this report) X 31.1 Certification of Periodic Report by Principal Executive Officer under Section 302 of the Sarbanes-Oxley Act of 2002 X 31.2 Certification of Periodic Report by Principal Financial Officer under Section 302 of the Sarbanes-Oxley Act of 2002 X 32.1* Certification of Chief Executive Officer Pursuant to 18 U.S.C. Section 1350 as Adopted Pursuant to Section 906 of the Sarbanes-Oxley Act of 2002 X 32.2* Certification of Chief Financial Officer Pursuant to 18 U.S.C. Section 1350 as Adopted Pursuant to Section 906 of the Sarbanes-Oxley Act of 2002 X 101.INS XBRL Instance Document X 101.SCH XBRL Taxonomy Extension Schema Document X 101.CAL XBRL Taxonomy Extension Calculation Linkbase Document X 101.DEF XBRL Taxonomy Extension Definition Linkbase Document X 101.LAB XBRL Taxonomy Extension Label Linkbase Document X 101.PRE XBRL Taxonomy Extension Presentation Linkbase Document X
|
|
|
| Incorporated by Reference |
|
|
| ||||||
Exhibit Number |
| Exhibit Description |
| Form |
| File No. |
| Exhibit |
| Filing Date |
| Filed Herewith |
|
|
|
|
|
|
|
|
|
|
|
|
|
|
|
3.1 |
| Amended and Restated Certificate of Incorporation of the Registrant |
| 10-Q |
| 001-35840 |
| 3.1 |
| 5/10/2013 |
|
|
|
|
|
|
|
|
|
|
|
|
|
|
|
|
|
3.2 |
|
| 10-Q |
| 001-35840 |
| 3.2 |
| 5/10/2013 |
|
|
| |
|
|
|
|
|
|
|
|
|
|
|
|
|
|
4.1 |
|
| S-1 |
| 333-186668 |
| 4.01 |
| 3/7/2013 |
|
|
| |
|
|
|
|
|
|
|
|
|
|
|
|
|
|
4.2 |
|
| S-1 |
| 333-186668 |
| 4.02 |
| 2/13/2013 |
|
|
| |
|
|
|
|
|
|
|
|
|
|
|
|
|
|
10.1 |
|
| S-1 |
| 333-186668 |
| 10.01 |
| 3/12/2013 |
|
|
| |
|
|
|
|
|
|
|
|
|
|
|
|
|
|
10.2† |
| 2000 Stock Plan and forms of stock option agreement and stock option exercise agreement |
| S-1 |
| 333-186668 |
| 10.02 |
| 2/13/2013 |
|
|
|
|
|
|
|
|
|
|
|
|
|
|
|
|
|
10.3† |
| 2010 Equity Incentive Plan and forms of stock option agreement and stock option exercise agreement |
| S-1 |
| 333-186668 |
| 10.03 |
| 2/13/2013 |
|
|
|
|
|
|
|
|
|
|
|
|
|
|
|
|
|
10.4† |
| 2013 Equity Incentive Plan and forms of stock option agreement and stock option exercise agreement |
| S-1 |
| 333-186668 |
| 10.04 |
| 3/7/2013 |
|
|
|
|
|
|
|
|
|
|
|
|
|
|
|
|
|
10.5† |
|
| S-8 |
| 333-187388 |
| 99.4 |
| 3/20/2013 |
|
|
| |
| Incorporated by Reference | ||||||||||||
Exhibit Number | Exhibit Description | Form | File No. | Exhibit | Filing Date | Filed Herewith | |||||||
10.6† | Employment offer letter dated February 4, 2016 by and between Registrant and Edward Sander. | 10-Q | 001-35840 | 10.1 | 2/9/2016 | ||||||||
10.7† | X | ||||||||||||
10.8† | Employment offer letter dated December 9, 2016 by and between Registrant and Russell Mellott. | X | |||||||||||
10.9† | 10-K | 001-35840 | 10.12 | 12/6/2013 | |||||||||
10.10 | Sublease by and between Dynatrace LLC and Registrant dated August 8, 2017 | X | |||||||||||
21.1 | X | ||||||||||||
23.1 | Consent of PricewaterhouseCoopers LLP, independent registered public accounting firm | X | |||||||||||
24.1 | Power of Attorney (included on the signature page to this report) | X | |||||||||||
31.1 | X | ||||||||||||
31.2 | X | ||||||||||||
32.1* | X | ||||||||||||
32.2* | X | ||||||||||||
101.INS | XBRL Instance Document | X | |||||||||||
101.SCH | XBRL Taxonomy Extension Schema Document | X | |||||||||||
101.CAL | XBRL Taxonomy Extension Calculation Linkbase Document | X | |||||||||||
101.DEF | XBRL Taxonomy Extension Definition Linkbase Document | X | |||||||||||
101.LAB | XBRL Taxonomy Extension Label Linkbase Document | X | |||||||||||
101.PRE | XBRL Taxonomy Extension Presentation Linkbase Document | X | |||||||||||
† | Indicates a management contract or compensatory plan. |
* | These exhibits are furnished with this Annual Report on Form 10-K and are not deemed filed with the Securities and Exchange Commission and are not incorporated by reference in any filing of the Registrant under the Securities Act of 1933 or the Exchange Act of 1934, whether made before or after the date hereof and irrespective of any general incorporation language in such filings. |
Pursuant to the requirements of Section 13 or 15(d) of the Securities Exchange Act of 1934, the Registrant has duly caused this Annual Report on Form 10-K to be signed on its behalf by the undersigned, thereunto duly authorized, in Redwood City,San Mateo, State of California, on this 18th15th day of November 2014.2017.
MODEL N, INC. | ||
By: | /S/ | |
David Barter | ||
Chief Financial Officer | ||
KNOW ALL PERSONS BY THESE PRESENTS, that each person whose signature appears below constitutes and appoints Zack Rinat or Mark Tisdel,David Barter, or any of them, his attorneys-in-fact, for such person in any and all capacities, to sign any amendments to this report and to file the same, with exhibits thereto, and other documents in connection therewith, with the Securities and Exchange Commission, hereby ratifying and confirming all that either of said attorneys-in-fact, or substitute or substitutes, may do or cause to be done by virtue hereof.
Pursuant to the requirements of the Securities Exchange Act of 1934, this report has been signed below by the following persons on behalf of the Registrant and in the capacities and on the dates indicated.
Name | Title | Date | ||
/S/ ZACK RINAT Zack Rinat | Founder, Chairman and Chief Executive Officer (Principal Executive Officer) | November | ||
/S/
| Chief Financial Officer (Principal Financial Officer and Accounting Officer) | November | ||
Additional Directors: | ||||
/S/
| Director | November | ||
/S
|
| |||
David Bonnette | Director | November | ||
/S/ CHARLES J. ROBEL Charles J. Robel | Director | November | ||
/S/
| Director | November | ||
Exhibits
| Incorporated by Reference | ||||||||||||||||||||||
Exhibit Number | Exhibit Description | Form | File No. | Exhibit | Filing Date | Filed Herewith | ||||||||||||||||
| 3.1 | Amended and Restated Certificate of Incorporation of the Registrant | 10-Q | 001-35840 | 3.1 | 5/10/2013 | |||||||||||||||||
| 3.2 | Amended and Restated Bylaws of the Registrant | 10-Q | 001-35840 | 3.2 | 5/10/2013 | |||||||||||||||||
| 4.1 | Form of Registrant’s Common Stock certificate | S-1 | 333-186668 | 4.01 | 3/7/2013 | |||||||||||||||||
| 4.2 | Amended and Restated Investor Rights Agreement dated December 12, 2003 by and among Registrant and certain of its stockholders | S-1 | 333-186668 | 4.02 | 2/13/2013 | |||||||||||||||||
| 10.1 | Form of Indemnity Agreement to be entered into between Registrant and each of its officers and directors | S-1 | 333-186668 | 10.01 | 3/12/2013 | |||||||||||||||||
| 10.2† | 2000 Stock Plan and forms of stock option agreement and stock option exercise agreement | S-1 | 333-186668 | 10.02 | 2/13/2013 | |||||||||||||||||
| 10.3† | 2010 Equity Incentive Plan and forms of stock option agreement and stock option exercise agreement | S-1 | 333-186668 | 10.03 | 2/13/2013 | |||||||||||||||||
| 10.4† | 2013 Equity Incentive Plan and forms of stock option agreement and stock option exercise agreement | S-1 | 333-186668 | 10.04 | 3/7/2013 | |||||||||||||||||
| 10.5† | 2013 Employee Stock Purchase Plan | S-8 | 333-187388 | 99.4 | 3/20/2013 | |||||||||||||||||
| 10.6† | Employment offer letter dated April 27, 2014 by and between Registrant and Mark Tisdel. | X | ||||||||||||||||||||
| 10.7† | Employment offer letter dated October 2, 2013 by and between Registrant and Chris Larsen. | X | ||||||||||||||||||||
| 10.9† | Form of Restricted Stock Unit Agreement | 10-K | 001-35840 | 10.12 | 12/6/2013 | |||||||||||||||||
| 10.10 | Sublease Agreement by and among Openwave Mobility, Inc., Openwave Messaging, Inc. and Registrant dated May 12, 2014 | 10-Q | 001-35840 | 10.12 | 8/8/2014 | |||||||||||||||||
| 21.1 | List of Subsidiaries of Registrant | X | ||||||||||||||||||||
| 23.1 | Consent of PricewaterhouseCoopers LLP, independent registered public accounting firm | X | ||||||||||||||||||||
| 24.1 | Power of Attorney (included on the signature page to this report) | X | ||||||||||||||||||||
|
| |||||||||||||||
/S/ ALAN HENRICKS | Director | November 15, 2017 | ||||||||||||||
Alan Henricks | ||||||||||||||||
/S/ BALJIT DAIL | Director | November 15, 2017 | ||||||||||||||
Baljit Dail | ||||||||||||||||
98
87