We also face risks associated with changes in foreign currency exchange rates, including those arising from our operations, investments and financing transactions related to our international business. Volatility in foreign currency exchange
we will not be allowed a deduction for distributions to stockholders in computing our taxable income;
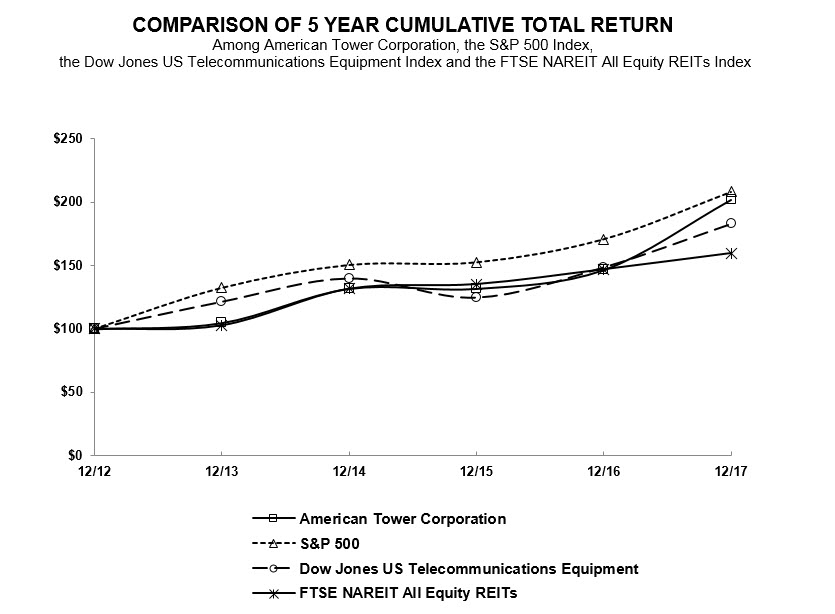
The following graph compares the cumulative total stockholder return on our common stock with the cumulative total return of the S&P 500 Index, the Dow Jones U.S. Telecommunications Equipment Index and the FTSE NAREITNareit All Equity REITs Index. The performance graph assumes that on December 31, 2009,2012, $100 was invested in each of our common stock, the S&P 500 Index, the Dow Jones U.S. Telecommunications Equipment Index and the FTSE NAREITNareit All Equity REITs Index. The
Wireless service providers continue to acquire additional spectrum, and as a result are expected to add additional sites and equipment to their networknetworks as they seek to optimize their network configuration.configuration and utilize additional spectrum.
$3.4 million of other revenue growth, primarily attributable to
an increase in both of our rental and management segments, including organic revenue growth attributable to our legacy sites and revenue growth attributable to the approximately 21,520 new sites that we have constructed or acquired since January 1, 2013. Approximately $260.6 million of the increase was attributable to revenues generated by MIPT.Domestic rental and management segment revenue growth for the year ended December 31, 2014 was comprised of:
Revenue growth of approximately 11%, attributable to the addition of approximately 4,860 domestic sites, as well as managed rooftop and tower sites and land interests under third-party sites, in connection with our acquisition of MIPT;
Revenue growth from legacy sites of approximately 9%, including approximately 8% primarily generated by new tenant leases and amendments to existing tenant leases and approximately 1% attributable to contractual rent escalations, net of tenant lease cancellations;
Revenue growth of over 2% from approximately 1,300 new sites, as well as land interests under third-party sites, constructed or acquired since January 1, 2013 (excluding MIPT); and
A decrease of approximately 1% from the impact of straight-line lease accounting.
International rental and management segment
Segment revenue growth
for the year ended December 31, 2014 was
comprised of:Revenue growth of approximately 20% from approximately 15,360 new sites constructed or acquired since January 1, 2013 (including approximately 460 sites in Costa Rica in connection with our acquisition of MIPT);
Revenue growth from legacy sites of approximately 15%, which includes approximately 12% due to incremental revenue primarily generated from new tenant leases and amendments to existing tenant leases and approximately 3% attributable to contractual rent escalations, net of tenant lease cancellations;
Revenue growth of approximately 1% from the impact of straight-line lease accounting; and
Apartially offset by a decrease of approximately 11%$41.1 million attributable to the negative impact fromof foreign currency translation, which includes,included, among others, the negative impact of approximately 4%$35.0 million related to fluctuations in Nigerian Naira (“NGN”) and $14.5 million related to fluctuations in Ghanaian Cedi (“GHS”), approximately 3%partially offset by an increase of $9.8 million related to fluctuations in South African Rand (“ZAR”).
Latin America property segment revenue growth of $183.7 million was attributable to:
Tenant billings growth of $92.4 million, which was driven by:
$38.9 million due to colocations and amendments;
$32.7 million from contractual escalations, net of churn;
$18.7 million generated from newly acquired or constructed sites; and
$2.1 million from other tenant billings;
Pass-through revenue growth of $22.2 million; and
$17.6 million of other revenue growth, due in part to $7.1 million from our newly acquired fiber business in Mexico and a $7.0 million reduction in revenue in the prior-year period resulting from a judicial reorganization of a tenant in Brazil, partially offset by the impact of straight-line accounting.
Segment revenue also increased $51.5 million attributable to the positive impact of foreign currency translation, which included, among others, $49.9 million related to fluctuations in Brazilian Reais (“BRL”) and approximately 1%$2.8 million related to fluctuations in Colombian Pesos (“COP”), partially offset by a decrease of $3.3 million related to fluctuations in Mexican PesoPesos (“MXN”).
Network development
The increase in services segment revenue growth for the yearof $25.4 million was primarily attributable to an increase in site acquisition projects.
Year ended December 31, 20142016 - Revenue
U.S. property segment revenue growth of $212.6 million was attributable to:
Tenant billings growth of $257.1 million, which was driven by:
$128.8 million due to colocations and amendments;
$91.3 million generated from newly acquired or constructed sites, including sites associated with the Verizon Transaction;
$34.1 million from contractual escalations, net of churn; and
$2.9 million from other tenant billings.
Segment revenue growth was partially offset by a decrease of $44.5 million, primarily due to the impact of straight-line accounting.
Asia property segment revenue growth of $585.4 million was attributable to:
Tenant billings growth of $368.9 million, which was driven by:
$341.2 million generated from newly acquired sites, primarily due to the Viom Acquisition;
$22.2 million due to colocations and amendments; and
$8.6 million generated from newly constructed sites;
Partially offset by,
| |
| ▪ | A decrease of $2.2 million from churn in excess of contractual escalations; and |
| |
| ▪ | A decrease of $0.9 million from other tenant billings; |
Pass-through revenue growth of $243.6 million, primarily due to the Viom Acquisition; and
$6.3 million of other revenue growth, primarily due to the impact of straight-line accounting.
Segment revenue growth was partially offset by a decrease of $33.4 million attributable to the negative impact of foreign currency translation related to fluctuations in INR.
EMEA property segment revenue growth of $134.4 million was attributable to:
Tenant billings growth of $124.1 million, which was driven by:
$82.8 million generated from newly acquired or constructed sites, including sites acquired from Airtel in Nigeria;
$22.1 million due to colocations and amendments;
$17.4 million from contractual escalations, net of churn;
$1.8 million from other tenant billings; and
Pass-through revenue growth of $65.6 million;
Partially offset by a decrease of $4.6 million, attributable in part to the impact of straight-line accounting.
Segment revenue growth was partially offset by a decrease of $50.7 million attributable to the negative impact of foreign currency translation, which included, among others, $29.0 million related to fluctuations in NGN, $12.1 million related to fluctuations in ZAR and $5.5 million related to fluctuations in GHS.
Latin America property segment revenue growth of $100.3 million was attributable to:
Tenant billings growth of $131.3 million, which was driven by:
$49.5 million generated from newly acquired or constructed sites;
$42.5 million from contractual escalations, net of churn;
$37.2 million due to colocations and amendments;
$2.1 million from other tenant billings;
Pass-through revenue growth of $60.6 million; and
$5.7 million of other revenue growth, primarily due to a $12.8 million impact of straight-line accounting offset in part by a $7.0 million reduction in revenue resulting from a judicial reorganization of a tenant in Brazil.
Segment revenue growth was partially offset by a decrease of $97.3 million attributable to the negative impact of foreign currency translation, which included, among others, $57.5 million related to fluctuations in MXN, $28.2 million related to fluctuations in BRL and $9.4 million related to fluctuations in COP.
The decrease in services segment revenue of $18.5 million was primarily attributable to a decrease in zoning, permitting and site acquisition projects.
Gross Margin
|
| | | | | | | | | | | | | | | | | |
| | Year Ended December 31, | | Percent Change 2017 vs 2016 | | Percent Change 2016 vs 2015 |
| | 2017 | | 2016 | | 2015 | |
| Property | | | | | | | | | |
| U.S. | $ | 2,859.2 |
| | $ | 2,636.7 |
| | $ | 2,479.0 |
| | 8 | % | | 6 | % |
| Asia | 515.4 |
| | 361.7 |
| | 115.3 |
| | 42 |
| | 214 |
|
| EMEA | 387.9 |
| | 305.8 |
| | 231.3 |
| | 27 |
| | 32 |
|
| Latin America | 794.3 |
| | 658.8 |
| | 592.2 |
| | 21 |
| | 11 |
|
| Total property | 4,556.8 |
| | 3,963.0 |
| | 3,417.8 |
| | 15 |
| | 16 |
|
| Services | 64.2 |
| | 45.6 |
| | 58.1 |
| | 41 | % | | (22 | )% |
Year ended December 31, 2017 - Gross Margin
The increase in U.S. property segment gross margin was primarily attributable to the increase in revenue described above, partially offset by an increase in direct expenses of $13.1 million.
The increase in Asia property segment gross margin was primarily attributable to the increase in revenue described above, partially offset by an increase in direct expenses of $163.1 million, primarily due to the Viom Acquisition. Direct expenses increased by an additional $20.0 million attributable to the impact of foreign currency translation.
The increase in EMEA property segment gross margin was primarily attributable to the increase in revenue described above and a benefit of $35.1 million attributable to the impact of foreign currency translation on direct expenses, partially offset by an increase in direct expenses of $49.7 million, partially due to the FPS Acquisition.
The increase in Latin America property segment gross margin was primarily attributable to the increase in revenue described above, partially offset by an increase in direct expenses of $29.6 million, partially due to our acquisitions of
urban telecommunications assets and fiber, in Mexico and Argentina. Direct expenses increased by an additional $18.6 million due to the impact of foreign currency translation.
The increase in services segment gross margin was primarily due to an increase in site acquisition zoning and permitting services associated with certain tenants’ next generation technology network upgrade projects, includingprojects.
Year ended December 31, 2016 - Gross Margin
The increase in U.S. property segment gross margin was primarily attributable to the increase in revenue described above, partially offset by an increase in volumedirect expenses of $54.9 million. Direct expense growth was primarily due to sites associated with the Verizon Transaction.
The increase in Asia property segment gross margin was primarily attributable to the increase in revenue described above and a benefit of $18.6 million attributable to the impact of foreign currency translation on direct expenses, partially offset by an increase in direct expenses of $357.6 million. Direct expense growth was primarily due to sites associated with the Viom Acquisition.
The increase in EMEA property segment gross margin was primarily attributable to the increase in revenue described above and a benefit of $32.8 million attributable to the impact of foreign currency translation on direct expenses, partially offset by an increase in direct expenses of $92.7 million. Direct expense growth was primarily due to sites acquired from Airtel.
The increase in Latin America property segment gross margin was primarily attributable to the increase in revenue described above and a benefit of $31.9 million attributable to the impact of foreign currency translation on direct expenses, partially offset by an increase in direct expenses of $65.6 million. Direct expense growth was primarily due to newly acquired or constructed sites.
The decrease in services segment gross margin was attributable to the decrease in revenue described above.
Selling, General, Administrative and Development Expense (“SG&A”)
|
| | | | | | | | | | | | | | | | | |
| | Year Ended December 31, | | Percent Change 2017 vs 2016 | | Percent Change 2016 vs 2015 |
| | 2017 | | 2016 | | 2015 | |
| Property | | | | | | | | | |
| U.S. | $ | 151.4 |
| | $ | 147.6 |
| | $ | 138.6 |
| | 3 | % | | 6 | % |
| Asia | 82.4 |
| | 48.2 |
| | 22.7 |
| | 71 |
| | 112 |
|
| EMEA | 67.9 |
| | 60.9 |
| | 48.7 |
| | 11 |
| | 25 |
|
| Latin America | 77.5 |
| | 60.7 |
| | 62.2 |
| | 28 |
| | (2 | ) |
| Total property | 379.2 |
| | 317.4 |
| | 272.2 |
| | 19 |
| | 17 |
|
| Services | 13.7 |
| | 12.5 |
| | 15.7 |
| | 10 |
| | (20 | ) |
| Other | 244.1 |
| | 213.5 |
| | 209.9 |
| | 14 |
| | 2 |
|
| Total selling, general, administrative and development expense | $ | 637.0 |
| | $ | 543.4 |
| | $ | 497.8 |
| | 17 | % | | 9 | % |
Year Ended December 31, 2017 - SG&A
The increases in each of our property segments’ SG&A were primarily driven by increased personnel costs to support our business, including additional costs as a result of the
additional sites acquired as part ofViom Acquisition in our Asia property segment and the
acquisition of MIPT.Gross Margin
| | | | | | | | | | | | | | | | |
| | | Year Ended December 31, | | | Amount of
Increase
(Decrease) | | | Percent
Increase
(Decrease) | |
| | | 2014 | | | 2013 | | | |
Rental and management | | | | | | | | | | | | | | | | |
Domestic | | $ | 2,124,048 | | | $ | 1,783,946 | | | $ | 340,102 | | | | 19 | % |
International | | | 838,573 | | | | 697,614 | | | | 140,959 | | | | 20 | |
| | | | | | | | | | | | | | | | |
Total rental and management | | | 2,962,621 | | | | 2,481,560 | | | | 481,061 | | | | 19 | |
Network development services | | | 55,546 | | | | 43,753 | | | | 11,793 | | | | 27 | % |
Domestic rental and management segment gross margin growth for the year ended December 31, 2014 was comprised of:
Gross margin growth of approximately 10% attributable to the addition of approximately 4,860 domestic sites, as well as managed rooftop and tower sites and land interests under third-party sites,FPS Acquisition in connection with our acquisition of MIPT;
Gross margin growth from legacy sites of approximately 9%, primarily associated with theEMEA property segment. The increase in revenue, as described above;
Gross margin growth from new sites (excluding MIPT) of over 2%, primarily associated with theour Asia property segment SG&A was partially driven by an increase in revenue, as described above; and
A decreasebad debt expense of approximately 2% from the impact of straight-line lease accounting.
International rental and management segment gross margin growth for the year ended December 31, 2014 was comprised of:
Gross margin growth from new sites (including MIPT) of approximately 15%, primarily associated with the increase in revenue, as described above;
Gross margin growth from legacy sites of approximately 13%, primarily associated with the increase in revenue, as described above, which includes the negative impact of approximately 1%$24.6 million as a result of aged receivables with certain tenants and the early termination of a portion of the notes receivable with TV Azteca, which provided a positive impact to 2013 gross margin;
Gross margin growth of approximately 2% fromincrease in our EMEA property segment SG&A was partially offset by the impact of straight-line lease accounting; and
A decrease of approximately 10% attributable to the negative impact from foreign currency translation, which includes, among others, the negative impactfluctuations and a reduction in bad debt expense of approximately 3% related to fluctuations in GHS, approximately 3% related to fluctuations in BRL and approximately 1% related to fluctuations in MXN.
$3.7 million.Network development services segment gross margin growth for the year ended December 31, 2014 was primarily due to the increase in revenue as described above.
Selling, General, Administrative and Development Expense
| | | | | | | | | | | | | | | | |
| | | Year Ended December 31, | | | Amount of
Increase
(Decrease) | | | Percent
Increase
(Decrease) | |
| | | 2014 | | | 2013 | | | |
Rental and management | | | | |
Domestic | | $ | 124,944 | | | $ | 103,989 | | | $ | 20,955 | | | | 20 | % |
International | | | 133,978 | | | | 123,338 | | | | 10,640 | | | | 9 | |
| | | | | | | | | | | | | | | | |
Total rental and management | | | 258,922 | | | | 227,327 | | | | 31,595 | | | | 14 | |
Network development services | | | 12,469 | | | | 9,257 | | | | 3,212 | | | | 35 | |
Other | | | 175,151 | | | | 178,961 | | | | (3,810 | ) | | | (2 | ) |
| | | | | | | | | | | | | | | | |
Total selling, general, administrative and development expense | | $ | 446,542 | | | $ | 415,545 | | | $ | 30,997 | | | | 7 | % |
The increase in domestic rentalour services segment SG&A was primarily attributable to an increase in personnel costs within our tower services group.
The increase in other SG&A was primarily attributable to an increase in stock-based compensation expense of $18.1 million and management segment selling, general, administrative and development expense (“an increase in corporate SG&A”) for the year ended&A.
Year Ended December 31, 2014 was2016 - SG&A
The increases in each of our U.S., Asia and EMEA property segments’ SG&A were primarily driven by
increasingincreased personnel costs to support our business, including additional costs associated with the
acquisition of MIPT, as well asViom Acquisition in our Asia property segment. The EMEA property segment SG&A increase also included an increase
in bad debt expense of
approximately $11.0$2.2 million
associated with project cancellation costs.and was partially offset by the impact of foreign currency fluctuations. The increase in international rental and managementthe Asia property segment SG&A for the year ended December 31, 2014 was primarily due to the impact of increased personnel costs to support our business, including additional costs associated with acquisitions, partially offset by decreases attributable to impacts of foreign currency fluctuations, as well as the reversal of bad debt expense for amounts previously reserved.
of $1.4 million.
The increasedecrease in network developmentour Latin America property segment SG&A was primarily due to the impacts of foreign currency fluctuations and a decrease in bad debt expense, partially offset by increased personnel costs to support the growth of our business.
The decrease in our services segment SG&A
for the year ended December 31, 2014 was primarily
due to higher personnel costs related to the additional site acquisition, zoning and permitting services associated with certain tenants’ next generation technology network upgrade projects, including an increase in volume as a result of the additional sites acquired as part of the acquisition of MIPT.The decrease in other SG&A for the year ended December 31, 2014 was primarily dueattributable to a decrease in corporatepersonnel costs from a lower volume of business in our tower services group.
The increase in other SG&A of $15.5$4.6 million which was attributable to an increase in corporate and international headquarters SG&A, partially offset by an increase of $11.7 million related toa decrease in stock-based compensation expense. The decrease in corporate SG&A was primarily related to a reduction in legal expensesexpense of $22.5 million, including the recovery of expenses during the year ended$1.0 million.
Operating Profit
|
| | | | | | | | | | | | | | | | | |
| | Year Ended December 31, | | Percent Change 2017 vs 2016 | | Percent Change 2016 vs 2015 |
| | 2017 | | 2016 | | 2015 | |
| Property | | | | | | | | | |
| U.S. | $ | 2,707.8 |
| | $ | 2,489.1 |
| | $ | 2,340.4 |
| | 9 | % | | 6 | % |
| Asia | 433.0 |
| | 313.5 |
| | 92.6 |
| | 38 |
| | 239 |
|
| EMEA | 320.0 |
| | 244.9 |
| | 182.6 |
| | 31 |
| | 34 |
|
| Latin America | 716.8 |
| | 598.1 |
| | 530.0 |
| | 20 |
| | 13 |
|
| Total property | 4,177.6 |
| | 3,645.6 |
| | 3,145.6 |
| | 15 |
| | 16 |
|
| Services | 50.5 |
| | 33.1 |
| | 42.4 |
| | 53 | % | | (22 | )% |
Year Ended December 31,
2014, and the reversal of a $2.8 million reserve associated with a non-recurring state tax item. The decrease in corporate SG&A was partially offset by an increase in personnel costs to support our business.2017 - Operating Profit
| | | | | | | | | | | | | | | | |
| | | Year Ended December 31, | | | Amount of
Increase
(Decrease) | | | Percent
Increase
(Decrease) | |
| | | 2014 | | | 2013 | | | |
Rental and management | | | | | | | | | | | | | | | | |
Domestic | | $ | 1,999,104 | | | $ | 1,679,957 | | | $ | 319,147 | | | | 19 | % |
International | | | 704,595 | | | | 574,276 | | | | 130,319 | | | | 23 | |
| | | | | | | | | | | | | | | | |
Total rental and management | | | 2,703,699 | | | | 2,254,233 | | | | 449,466 | | | | 20 | |
Network development services | | | 43,077 | | | | 34,496 | | | | 8,581 | | | | 25 | % |
Domestic rental and management segment
The growth in operating profit
growth for
the year ended December 31, 2014each of our property segments was primarily attributable to an increase in our
domestic rental and management segment gross margin,
(19%) and was partially offset by
an increaseincreases in our
domestic rental and management segment SG
&A (20%).International rental and management segment&A.
The growth in operating profit
growth for
the year ended December 31, 2014our services segment was primarily attributable to an increase in our
international rental and management segment gross margin,
(20%) and was partially offset by an increase in our
international rental and management segment SG
&A (9%).Network development services segment&A.
Year Ended December 31, 2016 - Operating Profit
The growth in operating profit growth for the year ended December 31, 2014each of our property segments was primarily attributable to an increase in network development servicesour segment gross margin (27%)margin. The increases in our U.S., Asia and wasEMEA property segments were partially offset by an increaseincreases in our network developmentsegment SG&A. The growth in operating profit in our Latin America property segment was also attributable to a slight decrease in our segment SG&A.
The decrease in operating profit for our services segment
SG&A (35%).Depreciation, Amortization and Accretion
| | | | | | | | | | | | | | | | |
| | | Year Ended December 31, | | | Amount of
Increase
(Decrease) | | | Percent
Increase
(Decrease) | |
| | | 2014 | | | 2013 | | | |
Depreciation, amortization and accretion | | $ | 1,003,802 | | | $ | 800,145 | | | $ | 203,657 | | | | 25 | % |
The increase in Depreciation, amortization and accretion expense for the year ended December 31, 2014 was primarily attributable to thea decrease in our segment gross margin, partially offset by a decrease in our segment SG&A.
Depreciation, Amortization and Accretion
|
| | | | | | | | | | | | | | | | | |
| | Year Ended December 31, | | Percent Change 2017 vs 2016 | | Percent Change 2016 vs 2015 |
| | 2017 | | 2016 | | 2015 | |
| Depreciation, amortization and accretion | $ | 1,715.9 |
| | $ | 1,525.6 |
| | $ | 1,285.3 |
| | 12 | % | | 19 | % |
The increases in depreciation, amortization and accretion expense
associated withwere primarily attributable to the acquisition,
lease or construction of
approximately 21,520new sites since
January 1, 2013,the beginning of the prior-year period, which resulted in an increase in property and equipment and intangible assets subject to amortization.
Other Operating Expenses
| | | | | | | | | | | | | | | | |
| | | Year Ended December 31, | | | Amount of
Increase
(Decrease) | | | Percent
Increase
(Decrease) | |
| | | 2014 | | | 2013 | | | |
Other operating expenses | | $ | 68,517 | | | $ | 71,539 | | | $ | (3,022 | ) | | | (4 | )% |
|
| | | | | | | | | | | | | | | | | |
| | Year Ended December 31, | | Percent Change 2017 vs 2016 | | Percent Change 2016 vs 2015 |
| | 2017 | | 2016 | | 2015 | |
| Other operating expenses | $ | 256.0 |
| | $ | 73.3 |
| | $ | 66.8 |
| | 249 | % | | 10 | % |
The decreaseincrease in Otherother operating expenses for the year ended December 31, 20142017 was primarily attributable to a decrease of $4.0 million froman increase in impairment charges of $182.9 million. These charges included $81.0 million related to tower and netnetwork intangible assets and $100.1 million related to tenant relationships in our Asia property segment, primarily due to carrier consolidation-driven churn. The increase in other operating expenses also included an increase of $7.7 million in losses on sales or disposals of long-lived assets and $10.0 million to fund our charitable foundation. These items were partially offset by aggregate purchase price refunds of $22.2 million of acquisition costs, primarily relating to an acquisition in Brazil completed in 2014.
The increase in other operating expenses for the year ended December 31, 2016 was
primarily attributable to an increase of $23.8 million in losses on sales or disposals of assets and impairments, partially offset by a
net increasedecrease of
$2.4$17.3 million in integration, acquisition and merger related
costs.Interest Income, TV Azteca, net
| | | | | | | | | | | | | | | | |
| | | Year Ended December 31, | | | Amount of
Increase
(Decrease) | | | Percent
Increase
(Decrease) | |
| | | 2014 | | | 2013 | | | |
Interest income, TV Azteca, net | | $ | 10,547 | | | $ | 22,235 | | | $ | (11,688 | ) | | | (53 | )% |
During the year ended December 31, 2013, we received a payment from TV Azteca, which included $28.0 million of principal on the notes receivable from TV Azteca, related interest and a prepayment penalty of $4.9 million. In addition, we recorded additional interest income of $2.7 million related to the write-off of a portion of the unamortized discount associated with the original notes receivable.
Interest Expense
| | | | | | | | | | | | | | | | |
| | | Year Ended December 31, | | | Amount of
Increase
(Decrease) | | | Percent
Increase
(Decrease) | |
| | | 2014 | | | 2013 | | | |
Interest expense | | $ | 580,234 | | | $ | 458,296 | | | $ | 121,938 | | | | 27 | % |
The increase in Interest expense for the year ended December 31, 2014 was primarily attributable to an increase of $3.9 billion in our average debt outstanding, partially offset by a decrease in our annualized weighted average cost of borrowing from 4.40% to 4.06%. The weighted average contractual interest rate was 4.02% at December 31, 2014.
Loss on Retirement of Long-Term Obligations
| | | | | | | | | | | | | | | | |
| | | Year Ended December 31, | | | Amount of
Increase
(Decrease) | | | Percent
Increase
(Decrease) | |
| | | 2014 | | | 2013 | | | |
Loss on retirement of long-term obligations | | $ | 3,473 | | | $ | 38,701 | | | $ | (35,228 | ) | | | (91 | )% |
During the year ended December 31, 2014, we paid prepayment consideration, which was partially offset by the write-off of unamortized premium associated with the fair value adjustments of assumed debt, in connection with our (i) repayment of an aggregate of $568.3 million in assumed debt, including debt assumed in connection with our acquisition of MIPT, and (ii) acquisition of the outstanding preferred stock of BR Towers. In addition, we recorded a loss of approximately $1.4 million as a result of settling our previously existing interest rate swap agreement related to a previously existing Colombian Peso (“COP”) denominated long-term credit facility entered into in October 2012 (the “Colombian Long-Term Credit Facility”).
During the year ended December 31, 2013, we recorded a loss of $35.3 million due to the repayment of the $1.75 billion outstanding balance of the Commercial Mortgage Pass-Through Certificates, Series 2007-1 (the “Certificates”) issued in the securitization transaction completed in May 2007 and incurred prepayment consideration and recorded the acceleration of deferred financing costs. In addition, during the year ended December 31, 2013, we recorded a loss of $3.4 million related to the acceleration of the remaining deferred financing costs associated with our $1.0 billion revolving credit facility entered into in April 2011 (the “2011 Credit Facility”), which was terminated in June 2013, and our $750.0 million unsecured term loan entered into in June 2012 (the “2012 Term Loan”), which was terminated in October 2013.
expenses.
Total Other Expense
| | | | | | | | | | | | | | | | |
| | | Year Ended December 31, | | | Amount of
Increase
(Decrease) | | | Percent
Increase
(Decrease) | |
| | | 2014 | | | 2013 | | | |
Other expense | | $ | 62,060 | | | $ | 207,500 | | | $ | (145,440 | ) | | | (70 | )% |
During the year ended December 31, 2014,
|
| | | | | | | | | | | | | | | | | |
| | Year Ended December 31, | | Percent Change 2017 vs 2016 | | Percent Change 2016 vs 2015 |
| | 2017 | | 2016 | | 2015 | |
| Total Other expense | $ | 742.3 |
| | $ | 727.1 |
| | $ | 782.8 |
| | 2 | % | | (7 | )% |
Total other expense reflected $49.3 millionconsists primarily of interest expense and realized and unrealized foreign currency losses, as compared to $211.7 million of unrealized foreign currency losses during the year ended December 31, 2013.gains and losses. We record unrealized foreign currency gains or losses as a result of fluctuations in the foreign currency exchange ratesfluctuations primarily associated with our intercompany notes and similar unaffiliated balances denominated in a currency other than the subsidiaries’ functional currencies. During the year ended December 31, 2014, we recorded unrealized foreign currency losses of $468.6 million, of which $419.3 million was recorded
The increase in Accumulatedtotal other comprehensive income (loss) (“AOCI”) and $49.3 million was recorded in Other expense (see note 1 to the consolidated financial statements included in this Annual Report).Income Tax Provision
| | | | | | | | | | | | | | | | |
| | | Year Ended December 31, | | | Amount of
Increase
(Decrease) | | | Percent
Increase
(Decrease) | |
| | | 2014 | | | 2013 | | | |
Income tax provision | | $ | 62,505 | | | $ | 59,541 | | | $ | 2,964 | | | | 5 | % |
Effective tax rate | | | 7.2 | % | | | 11.0 | % | | | | | | | | |
The effective tax rate (“ETR”) during the year ended December 31, 2013 included nonrecurring
2017 was primarily due to a loss on retirement of long-term obligations of $70.2 million attributable to the redemptions of the 7.25% senior unsecured notes due 2019 (the “7.25% Notes”) and the 4.500% senior unsecured notes due 2018 (the “4.500% Notes”) and the repayment of the Secured Cellular Site Revenue Notes, Series 2012-2 Class A, Series 2012-2 Class B and Series 2012-2 Class C and Secured Cellular Site Revenue Notes, Series 2010-2, Class C and Series 2010-2, Class F, compared to the year ended December 31, 2016, where we recorded a gain on retirement of long-term obligations of $1.2 million attributable to the repayment of the Secured Tower Cellular Site Revenue Notes, Series 2012-1, Class A and the Secured Cellular Site Revenue Notes, Series 2010-1, Class C. The increase was also attributable to additional interest expense of $32.5 million due to a $0.9 billion increase in our average debt outstanding. These items were partially offset by foreign currency gains of $26.4 million compared to foreign currency losses of $48.9 million in the prior-year period, as well an additional $9.8 million in interest income compared to the prior-year period.
The decrease in total other expense during the year ended December 31, 2016 was primarily due to foreign currency losses of $48.9 million in the current period, compared to foreign currency losses of $134.7 million in 2015, and a gain on retirement of long-term obligations of $1.2 million in the current period attributable to the repayment of the Secured Cellular Site Revenue Notes, Series 2012-1 Class A and the Secured Cellular Site Revenue Notes, Series 2010-1, Class C compared to the year ended December 31, 2015, where we recorded a loss of $79.6 million, primarily due to the restructuringredemption of the 7.000%
senior notes due 2017 and 4.625% senior notes due 2015. This decrease was partially offset by incremental interest expense of $121.2 million, due to an increase of $2.1 billion in our
domestic TRSs.average debt outstanding and an increase in our annualized weighted average cost of borrowing from 3.67% to 3.92%.
Income Tax Provision
|
| | | | | | | | | | | | | | | | | | |
| | | Year Ended December 31, | | Percent Change 2017 vs 2016 | | Percent Change 2016 vs 2015 |
| | | 2017 | | 2016 | | 2015 | |
| Income tax provision | | $ | 30.7 |
| | $ | 155.5 |
| | $ | 158.0 |
| | (80 | )% | | (2 | )% |
| Effective tax rate | | 2.4 | % | | 13.8 | % | | 19.0 | % | | | | |
As a REIT, we may deduct earnings distributed to stockholders against the income generated
inby our
QRSs.REIT operations. In addition, we are able to offset
certain income
in both our TRSs and QRSs by utilizing our NOLs, subject to specified limitations.
The ETR Consequently, the effective tax rate on income from continuing operations for each of the years ended December 31, 20142017, 2016 and 20132015 differs from the federal statutory rate primarily due to our qualification for taxation as a REIT and adjustments for foreign items.
Net Income/Adjusted EBITDA
| | | | | | | | | | | | | | | | |
| | | Year Ended December 31, | | | Amount of
Increase
(Decrease) | | | Percent
Increase
(Decrease) | |
| | | 2014 | | | 2013 | | | |
Net income | | $ | 803,199 | | | $ | 482,208 | | | $ | 320,991 | | | | 67 | % |
Income tax provision | | | 62,505 | | | | 59,541 | | | | 2,964 | | | | 5 | |
Other expense | | | 62,060 | | | | 207,500 | | | | (145,440 | ) | | | (70 | ) |
Loss on retirement of long-term obligations | | | 3,473 | | | | 38,701 | | | | (35,228 | ) | | | (91 | ) |
Interest expense | | | 580,234 | | | | 458,296 | | | | 121,938 | | | | 27 | |
Interest income | | | (14,002 | ) | | | (9,706 | ) | | | 4,296 | | | | 44 | |
Other operating expenses | | | 68,517 | | | | 71,539 | | | | (3,022 | ) | | | (4 | ) |
Depreciation, amortization and accretion | | | 1,003,802 | | | | 800,145 | | | | 203,657 | | | | 25 | |
Stock-based compensation expense | | | 80,153 | | | | 68,138 | | | | 12,015 | | | | 18 | |
| | | | | | | | | | | | | | | | |
Adjusted EBITDA | | $ | 2,649,941 | | | $ | 2,176,362 | | | $ | 473,579 | | | | 22 | % |
rate.
The increasedecrease in netthe income tax provision for the year ended December 31, 20142017 was primarily attributable to lower uncertain tax position reserve recorded in 2017 than in 2016, a decrease in foreign earnings in India due to the increase in our operating profit,impairments, as well as decreaseschanges in other expensetax laws in certain foreign jurisdictions.
The decrease in the income tax provision for the year ended December 31, 2016 was primarily attributable to a tax election filed in 2015, pursuant to which MIPT no longer operates as a separate REIT for federal and loss on retirementstate income tax purposes. In connection with this and related elections, we incurred a one-time cash tax charge of long-term obligations. $93.0 million and a one-time deferred income tax benefit of $5.8 million for the year ended December 31, 2015. These items were offset by a one-time increase in tax reserves for the year ended December 31, 2016.
Net Income / Adjusted EBITDA and Net Income / Nareit FFO attributable to American Tower Corporation common stockholders / Consolidated AFFO / AFFO attributable to American Tower Corporation common stockholders
|
| | | | | | | | | | | | | | | | | | |
| | | Year Ended December 31, | | Percent Change 2017 vs 2016 | | Percent Change 2016 vs 2015 |
| | | 2017 | | 2016 | | 2015 | |
| Net income | | $ | 1,225.4 |
| | $ | 970.4 |
| | $ | 672.0 |
| | 26 | % | | 44 | % |
| Income tax provision | | 30.7 |
| | 155.5 |
| | 158.0 |
| | (80 | ) | | (2 | ) |
| Other (income) expense | | (31.3 | ) | | 47.7 |
| | 135.0 |
| | (166 | ) | | (65 | ) |
| Loss (gain) on retirement of long-term obligations | | 70.2 |
| | (1.2 | ) | | 79.6 |
| | (5,950 | ) | | (101 | ) |
| Interest expense | | 749.6 |
| | 717.1 |
| | 595.9 |
| | 5 |
| | 20 |
|
| Interest income | | (35.4 | ) | | (25.6 | ) | | (16.5 | ) | | 38 |
| | 55 |
|
| Other operating expenses | | 256.0 |
| | 73.3 |
| | 66.8 |
| | 249 |
| | 10 |
|
| Depreciation, amortization and accretion | | 1,715.9 |
| | 1,525.6 |
| | 1,285.3 |
| | 12 |
| | 19 |
|
| Stock-based compensation expense | | 108.5 |
| | 89.9 |
| | 90.5 |
| | 21 |
| | (1 | ) |
| Adjusted EBITDA | | $ | 4,089.6 |
| | $ | 3,552.7 |
| | $ | 3,066.6 |
| | 15 | % | | 16 | % |
|
| | | | | | | | | | | | | | | | | |
| | Year Ended December 31, | | Percent Change 2017 vs 2016 | | Percent Change 2016 vs 2015 |
| | 2017 | | 2016 | | 2015 | |
| Net income | $ | 1,225.4 |
| | $ | 970.4 |
| | $ | 672.0 |
| | 26 | % | | 44 | % |
| Real estate related depreciation, amortization and accretion | 1,516.9 |
| | 1,358.9 |
| | 1,128.3 |
| | 12 |
| | 20 |
|
| Losses from sale or disposal of real estate and real estate related impairment charges | 244.4 |
| | 54.5 |
| | 29.4 |
| | 348 |
| | 85 |
|
| Dividends on preferred stock | (87.4 | ) | | (107.1 | ) | | (90.2 | ) | | (18 | ) | | 19 |
|
| Dividend to noncontrolling interest | (13.2 | ) | | — |
| | — |
| | 100 |
| | — |
|
| Adjustments for unconsolidated affiliates and noncontrolling interests | (189.1 | ) | | (88.2 | ) | | (6.3 | ) | | (114 | ) | | (1,271 | ) |
| Nareit FFO attributable to American Tower Corporation common stockholders | $ | 2,697.0 |
| | $ | 2,188.5 |
| | $ | 1,733.2 |
| | 23 |
| | 26 |
|
| Straight-line revenue | (194.4 | ) | | (131.7 | ) | | (155.0 | ) | | 48 |
| | (15 | ) |
| Straight-line expense | 62.3 |
| | 67.8 |
| | 56.1 |
| | (8 | ) | | 21 |
|
| Stock-based compensation expense | 108.5 |
| | 89.9 |
| | 90.5 |
| | 21 |
| | (1 | ) |
| Deferred portion of income tax | (105.8 | ) | | 59.2 |
| | 1.0 |
| | (279 | ) | | 6,506 |
|
| Non-real estate related depreciation, amortization and accretion | 199.0 |
| | 166.7 |
| | 157.0 |
| | 19 |
| | 6 |
|
| Amortization of deferred financing costs, capitalized interest, debt discounts and premiums and long-term deferred interest charges | 26.8 |
| | 23.1 |
| | 22.6 |
| | 16 |
| | 2 |
|
| Other (income) expense (1) | (31.3 | ) | | 47.7 |
| | 135.0 |
| | (166 | ) | | (65 | ) |
| Loss (gain) on retirement of long-term obligations | 70.2 |
| | (1.2 | ) | | 79.6 |
| | (5,950 | ) | | (101 | ) |
| Other operating expenses (2) | 11.6 |
| | 18.8 |
| | 37.3 |
| | (38 | ) | | (50 | ) |
| Capital improvement capital expenditures | (114.2 | ) | | (110.2 | ) | | (89.9 | ) | | 4 |
| | 23 |
|
| Corporate capital expenditures | (17.0 | ) | | (16.4 | ) | | (16.4 | ) | | 4 |
| | — |
|
| Adjustments for unconsolidated affiliates and noncontrolling interests | 189.1 |
| | 88.2 |
| | 6.3 |
| | 114 |
| | 1,271 |
|
| MIPT one-time cash tax charge (3) | — |
| | — |
| | 93.0 |
| | N/A |
| | (100 | ) |
| Consolidated AFFO | $ | 2,901.8 |
| | $ | 2,490.4 |
| | $ | 2,150.3 |
| | 17 | % | | 16 | % |
| Adjustments for unconsolidated affiliates and noncontrolling interests (4) | (147.0 | ) | | (90.2 | ) | | (34.0 | ) | | 63 | % | | 166 | % |
| AFFO attributable to American Tower Corporation common stockholders | $ | 2,754.8 |
| | $ | 2,400.2 |
|
| $ | 2,116.3 |
| | 15 | % | | 13 | % |
_______________
| |
| (1) | Includes unrealized (gains) losses on foreign currency exchange rate fluctuations of ($26.5 million), $23.4 million and $71.5 million, respectively. |
| |
| (2) | Primarily includes acquisition-related costs and integration costs. For the year ended December 31, 2017, amount also includes refunds for acquisition costs and a charitable contribution. |
| |
| (3) | As the one-time tax charge incurred in connection with the MIPT tax election is nonrecurring, we do not believe it is an indication of our operating performance and believe it is more meaningful to present AFFO excluding this impact. Accordingly, we present AFFO for the year ended December 31, 2015 before this charge. |
| |
| (4) | Includes adjustments for the impact on both Nareit FFO attributable to American Tower Corporation common stockholders as well as the other line items included in the calculation of Consolidated AFFO. |
Year Ended December 31, 2017 - Adjusted EBITDA & AFFO metrics
The increase in net income was
primarily due to an increase in our operating profit, decreases in our income tax provision and foreign currency losses included in other expense, partially offset by
increasesan increase in depreciation, amortization and accretion expense,
and increases in other operating expenses, interest expense and
stock-based compensation expense.a loss on retirement of long-term obligations of $70.2 million.
The increase in Adjusted EBITDA
for the year ended December 31, 2014 was primarily attributable to the increase in our gross margin and was partially offset by an increase in SG&A of
$19.3$75.5 million, excluding the impact of stock-based compensation expense.
Net Income/NAREIT FFO/AFFO
| | | | | | | | | | | | | | | | |
| | | Year Ended December 31, | | | Amount of
Increase
(Decrease) | | | Percent
Increase
(Decrease) | |
| | | 2014 | | | 2013 | | | |
Net income | | $ | 803,199 | | | $ | 482,208 | | | $ | 320,991 | | | | 67 | % |
Real estate related depreciation, amortization and accretion | | | 878,714 | | | | 701,292 | | | | 177,422 | | | | 25 | |
Losses from sale or disposal of real estate and real estate related impairment charges | | | 18,160 | | | | 32,475 | | | | (14,315 | ) | | | (44 | ) |
Dividends declared on preferred stock | | | (23,888 | ) | | | — | | | | (23,888 | ) | | | N/A | |
Adjustments for unconsolidated affiliates and noncontrolling interest | | | (1,815 | ) | | | 41,000 | | | | (42,815 | ) | | | (104 | ) |
| | | | | | | | | | | | | | | | |
NAREIT FFO | | $ | 1,674,370 | | | $ | 1,256,975 | | | $ | 417,395 | | | | 33 | % |
Straight-line revenue | | | (123,716 | ) | | | (147,664 | ) | | | (23,948 | ) | | | (16 | ) |
Straight-line expense | | | 38,378 | | | | 29,732 | | | | 8,646 | | | | 29 | |
Stock-based compensation expense | | | 80,153 | | | | 68,138 | | | | 12,015 | | | | 18 | |
Non-cash portion of tax provision | | | (6,707 | ) | | | 7,865 | | | | (14,572 | ) | | | (185 | ) |
Non-real estate related depreciation, amortization and accretion | | | 125,088 | | | | 98,853 | | | | 26,235 | | | | 27 | |
Amortization of deferred financing costs, capitalized interest, debt discounts and premiums and long-term deferred interest charges | | | 8,622 | | | | 22,955 | | | | (14,333 | ) | | | (62 | ) |
Other expense(1) | | | 62,060 | | | | 207,500 | | | | (145,440 | ) | | | (70 | ) |
Loss on retirement of long-term obligations | | | 3,473 | | | | 38,701 | | | | (35,228 | ) | | | (91 | ) |
Other operating expenses(2) | | | 50,357 | | | | 39,064 | | | | 11,293 | | | | 29 | |
Capital improvement capital expenditures | | | (75,041 | ) | | | (81,218 | ) | | | (6,177 | ) | | | (8 | ) |
Corporate capital expenditures | | | (24,146 | ) | | | (30,383 | ) | | | (6,237 | ) | | | (21 | ) |
Adjustments for unconsolidated affiliates and noncontrolling interest | | | 1,815 | | | | (41,000 | ) | | | (42,815 | ) | | | (104 | ) |
| | | | | | | | | | | | | | | | |
AFFO | | $ | 1,814,706 | | | $ | 1,469,518 | | | $ | 345,188 | | | | 23 | % |
(1) | Primarily includes unrealized losses on foreign currency exchange rate fluctuations. |
(2) | Primarily includes acquisition-related costs, integration costs, losses from sale of assets and impairment charges. |
The growth in Consolidated AFFO growthand AFFO attributable to American Tower Corporation common stockholders was primarily attributable to the increase in our operating profit and a decrease in dividends on preferred stock, partially offset by increases in straight-line revenue, cash paid for interest and income taxes and corporate SG&A and capital improvement expenditures.
Year Ended December 31, 2016 - Adjusted EBITDA & AFFO metrics
The increase in net income was primarily due to an increase in our operating profit, a decrease in foreign currency losses included in other expense, a reduction of $80.8 million in loss on retirement of long-term obligations, partially offset by increases in depreciation, amortization and corporate capital expenditures,accretion expense and interest expense.
The increase in Adjusted EBITDA was primarily attributable to the increase in our gross margin and was partially offset by an increase in SG&A of $46.6 million, excluding the impact of stock-based compensation expense.
The growth in Consolidated AFFO and AFFO attributable to American Tower Corporation common stockholders was primarily attributable to the increase in our operating profit, partially offset by increases in cash paid for interest and
income taxes,
and dividends declared on preferred stock.Results of Operations
Years Ended December 31, 2013 and 2012
(in thousands, except percentages)
Revenue
| | | | | | | | | | | | | | | | |
| | | Year Ended December 31, | | | Amount of
Increase
(Decrease) | | | Percent
Increase
(Decrease) | |
| | | 2013 | | | 2012 | | | |
Rental and management | | | | | | | | | | | | | | | | |
Domestic | | $ | 2,189,365 | | | $ | 1,940,689 | | | $ | 248,676 | | | | 13 | % |
International | | | 1,097,725 | | | | 862,801 | | | | 234,924 | | | | 27 | |
| | | | | | | | | | | | | | | | |
Total rental and management | | | 3,287,090 | | | | 2,803,490 | | | | 483,600 | | | | 17 | |
Network development services | | | 74,317 | | | | 72,470 | | | | 1,847 | | | | 3 | |
| | | | | | | | | | | | | | | | |
Total revenues | | $ | 3,361,407 | | | $ | 2,875,960 | | | $ | 485,447 | | | | 17 | % |
Total revenues forother than the year ended December 31, 2013 increased 17% to $3,361.4 million. The increase was primarily attributable toMIPT one-time cash tax charge, and an increase in both of our rentalcapital improvement expenditures.
Liquidity and
management segments, including organic revenue growth attributable to our legacy sites and revenue growth attributable to the approximately 21,880 new sites that we have constructed or acquired since January 1, 2012. Approximately $84.1 million of the increase was attributable to revenues generated by MIPT.Domestic rental and management segment revenue for the year ended December 31, 2013 increased 13% to $2,189.4 million. This growth was comprised of:
Capital Resources Revenue growth from legacy sites of approximately 7%, which includes approximately 6% due to incremental revenue primarily generated from new tenant leases and amendments to existing tenant leases on our legacy sites and approximately 2% attributable to contractual rent escalations, net of tenant lease cancellations, partially offset by approximately 1% due to a tenant billing settlement and a lease termination settlement during the year ended December 31, 2012, which totaled $15.6 million;
OverviewRevenue growth of approximately 4% attributable to the addition of approximately 4,860 domestic sites, as well as managed rooftop and tower sites and land interests under third-party sites in connection with our acquisition of MIPT;
Revenue growth from new sites (excluding MIPT) of approximately 3%, resulting from the construction or acquisition of approximately 1,360 new sites, as well as land interests under third-party sites since January 1, 2012; and
A decrease of approximately 1% from the impact of straight-line lease accounting.
International rental and management segment revenue for the year ended December 31, 2013 increased 27% to $1,097.7 million. This growth was comprised of:
Revenue growth from new sites (excluding MIPT) of approximately 22%, resulting from the construction or acquisition of approximately 15,150 new sites since January 1, 2012;
Revenue growth from legacy sites of approximately 12%, which includes approximately 11% due to incremental revenue primarily generated from new tenant leases and amendments to existing tenant leases on our legacy sites and approximately 2% attributable to contractual rent escalations, net of tenant lease cancellations, partially offset by less than 1% for the reversal of revenue reserves during the year ended December 31, 2012;
Revenue growth of less than 1% attributable to the addition of approximately 510 sites in Costa Rica and Panama in connection with our acquisition of MIPT; and
A decrease of approximately 7% attributable to the negative impact from foreign currency translation, which includes, among others, the negative impact of approximately 3% related to fluctuations in BRL, approximately 2% related to fluctuations in South African Rand (“ZAR”) and approximately 2% related to fluctuations in the Indian Rupee (“INR”).
Network development services segment revenue for the year ended December 31, 2013 increased 3% to $74.3 million. The growth was primarily attributable to an increase in structural engineering services and site acquisition, zoning and permitting services as a result of an increase in tenant lease applications, which are primarily associated with certain tenants’ next generation technology network upgrade projects during the year ended December 31, 2013.
Gross Margin
| | | | | | | | | | | | | | | | |
| | | Year Ended December 31, | | | Amount of
Increase
(Decrease) | | | Percent
Increase
(Decrease) | |
| | | 2013 | | | 2012 | | | |
Rental and management | | | | |
Domestic | | $ | 1,783,946 | | | $ | 1,583,134 | | | $ | 200,812 | | | | 13 | % |
International | | | 697,614 | | | | 548,726 | | | | 148,888 | | | | 27 | |
| | | | | | | | | | | | | | | | |
Total rental and management | | | 2,481,560 | | | | 2,131,860 | | | | 349,700 | | | | 16 | |
Network development services | | | 43,753 | | | | 37,640 | | | | 6,113 | | | | 16 | % |
Domestic rental and management segment gross margin for the year ended December 31, 2013 increased 13% to $1,783.9 million, which was comprised of:
Gross margin growth from legacy sites of approximately 7%, primarily associated with the increase in revenue, as described above;
Gross margin growth of approximately 4% attributable to the addition of approximately 4,860 domestic sites, as well as managed rooftop and tower sites and land interests under third-party sites, in connection with our acquisition of MIPT; and
Gross margin growth from new sites (excluding MIPT) of approximately 2%, resulting from the construction or acquisition of approximately 1,360 new sites, as well as land interests under third-party sites since January 1, 2012.
International rental and management segment gross margin for the year ended December 31, 2013 increased 27% to $697.6 million, which was comprised of:
Gross margin growth from new sites (excluding MIPT) of approximately 22%, resulting from the construction or acquisition of approximately 15,150 new sites since January 1, 2012;
Gross margin growth from legacy sites of approximately 11%, primarily associated with the increase in revenue, as described above, and the impact of the early termination of a portion of the notes receivable with TV Azteca, which had a positive impact of less than 2%;
Gross margin growth of less than 1% attributable to the addition of approximately 510 sites in Costa Rica and Panama in connection with our acquisition of MIPT; and
A decrease of over 6% attributable to the negative impact from foreign currency translation, which includes, among others, the negative impact of approximately 3% related to fluctuations in BRL, approximately 2% related to fluctuations in ZAR and approximately 1% related to fluctuations in INR.
Network development services segment gross margin for the year ended December 31, 2013 increased 16% to $43.8 million. The increase was primarily attributable to a change in the mix of services rendered, which generated higher margins.
Selling, General, Administrative and Development Expense
| | | | | | | | | | | | | | | | |
| | | Year Ended December 31, | | | Amount of
Increase
(Decrease) | | | Percent
Increase
(Decrease) | |
| | | 2013 | | | 2012 | | | |
Rental and management | | | | |
Domestic | | $ | 103,989 | | | $ | 85,663 | | | $ | 18,326 | | | | 21 | % |
International | | | 123,338 | | | | 95,579 | | | | 27,759 | | | | 29 | |
| | | | | | | | | | | | | | | | |
Total rental and management | | | 227,327 | | | | 181,242 | | | | 46,085 | | | | 25 | |
Network development services | | | 9,257 | | | | 6,744 | | | | 2,513 | | | | 37 | |
Other | | | 178,961 | | | | 139,315 | | | | 39,646 | | | | 28 | |
| | | | | | | | | | | | | | | | |
Total selling, general, administrative and development expense | | $ | 415,545 | | | $ | 327,301 | | | $ | 88,244 | | | | 27 | % |
Total SG&A for the year ended December 31, 2013 increased 27% to $415.5 million. The increase was primarily attributable to an increase in our international rental and management segment and other SG&A.
Domestic rental and management segment SG&A for the year ended December 31, 2013 increased 21% to $104.0 million. The increase was primarily driven by increasing personnel costs and professional fees to support our business.
International rental and management segment SG&A for the year ended December 31, 2013 increased 29% to $123.3 million. The increase was primarily due to increases in personnel costs and professional fees to support the growth in our international markets, including Uganda and Germany, which commenced operations in 2012.
Network development services segment SG&A for the year ended December 31, 2013 increased 37% to $9.3 million. The increase was primarily attributable to a reversal of $1.4 million of bad debt expense during the year ended December 31, 2012 upon the receipt of tenant payments for amounts previously reserved, as well as incremental costs to support our business.
Other SG&A for the year ended December 31, 2013 increased 28% to $179.0 million. The increase was primarily due to a $16.4 million increase in SG&A related stock-based compensation expense, which included an incremental $7.8 million due to the timing of recognition of expense associated with awards granted to retirement eligible employees. In addition, other SG&A increased $23.2 million, which included, among other things, an increase of $26.9 million in corporate expenses, partially offset by a $3.7 million non-recurring state tax item recorded during the year ended December 31, 2012. The increase in corporate expenses included approximately $14.8 million of legal expenses.
Operating Profit
| | | | | | | | | | | | | | | | |
| | | Year Ended December 31, | | | Amount of
Increase
(Decrease) | | | Percent
Increase
(Decrease) | |
| | | 2013 | | | 2012 | | | |
Rental and management | | | | |
Domestic | | $ | 1,679,957 | | | $ | 1,497,471 | | | $ | 182,486 | | | | 12 | % |
International | | | 574,276 | | | | 453,147 | | | | 121,129 | | | | 27 | |
| | | | | | | | | | | | | | | | |
Total rental and management | | | 2,254,233 | | | | 1,950,618 | | | | 303,615 | | | | 16 | |
Network development services | | | 34,496 | | | | 30,896 | | | | 3,600 | | | | 12 | % |
Domestic rental and management segment operating profit for the year ended December 31, 2013 increased 12% to $1,680.0 million. The growth was primarily attributable to the increase in our domestic rental and management segment gross margin (13%), as described above, and was partially offset by increases in our domestic rental and management segment SG&A (21%), as described above.
International rental and management segment operating profit for the year ended December 31, 2013 increased 27% to $574.3 million. The growth was primarily attributable to the increase in our international rental and management segment gross margin (27%), as described above, and was partially offset by increases in our international rental and management segment SG&A (29%), as described above.
Network development services segment operating profit for the year ended December 31, 2013 increased 12% to $34.5 million. The growth was primarily attributable to the increase in network development services segment gross margin (16%), as described above, and was partially offset by an increase in our network development services segment SG&A (37%), as described above.
Depreciation, Amortization and Accretion
| | | | | | | | | | | | | | | | |
| | | Year Ended December 31, | | | Amount of
Increase
(Decrease) | | | Percent
Increase
(Decrease) | |
| | | 2013 | | | 2012 | | | |
Depreciation, amortization and accretion | | $ | 800,145 | | | $ | 644,276 | | | $ | 155,869 | | | | 24 | % |
Depreciation, amortization and accretion for the year ended December 31, 2013 increased 24% to $800.1 million. The increase was primarily attributable to the depreciation, amortization and accretion associated with the acquisition or construction of approximately 21,880 sites since January 1, 2012, which resulted in an increase in property and equipment and intangible assets subject to amortization.
Other Operating Expenses
| | | | | | | | | | | | | | | | |
| | | Year Ended December 31, | | | Amount of
Increase
(Decrease) | | | Percent
Increase
(Decrease) | |
| | | 2013 | | | 2012 | | | |
Other operating expenses | | $ | 71,539 | | | $ | 62,185 | | | $ | 9,354 | | | | 15 | % |
Other operating expenses for the year ended December 31, 2013 increased 15% to $71.5 million primarily due to an increase of approximately $11.9 million in acquisition related costs. This increase was partially offset by a decrease of approximately $1.9 million in losses from the sale or disposal of assets and impairment charges.
Interest Income, TV Azteca, net
| | | | | | | | | | | | | | | | |
| | | Year Ended December 31, | | | Amount of
Increase
(Decrease) | | | Percent
Increase
(Decrease) | |
| | | 2013 | | | 2012 | | | |
Interest income, TV Azteca, net | | $ | 22,235 | | | $ | 14,258 | | | $ | 7,977 | | | | 56 | % |
Interest income, TV Azteca, net for the year ended December 31, 2013 increased 56% to $22.2 million. During the year ended December 31, 2013,2017, we received a payment from TV Azteca, which included $28.0 million of principal on the notes receivable from TV Azteca, related interest and a prepayment penalty of $4.9 million. In addition, we recorded additional interest income of $2.7 million related to the write-off of a portion of the unamortized discount associated with the original notes receivable.
Interest Expense
| | | | | | | | | | | | | | | | |
| | | Year Ended December 31, | | | Amount of
Increase
(Decrease) | | | Percent
Increase
(Decrease) | |
| | | 2013 | | | 2012 | | | |
Interest expense | | $ | 458,296 | | | $ | 401,665 | | | $ | 56,631 | | | | 14 | % |
Interest expense for the year ended December 31, 2013 increased 14% to $458.3 million. The increase was primarily attributable to an increase in our average debt outstanding of approximately $2.9 billion, which was primarily used to fund our acquisitions, partially offset by a decrease in our annualized weighted average cost of borrowing from 5.37% to 4.40%. The weighted average contractual interest rate was 3.84% at December 31, 2013.
Loss on Retirement of Long-Term Obligations
| | | | | | | | | | | | | | | | |
| | | Year Ended December 31, | | | Amount of
Increase
(Decrease) | | | Percent
Increase
(Decrease) | |
| | | 2013 | | | 2012 | | | |
Loss on retirement of long-term obligations | | $ | 38,701 | | | $ | 398 | | | $ | 38,303 | | | | 9,624 | % |
During the year ended December 31, 2013, loss on retirement of long-term obligations increased to $38.7 million. We recorded a loss of $35.3 million due to the repayment of the $1.75 billion outstanding balance of the Certificates and incurred prepayment consideration and recorded the acceleration of deferred financing costs. In addition, we recorded a loss of $3.4 million related to the acceleration of the remaining deferred financing costs associated with the 2011 Credit Facility, which was terminated in June 2013, and the 2012 Term Loan, which was terminated in October 2013.
Other Expense
| | | | | | | | | | | | | | | | |
| | | Year Ended December 31, | | | Amount of
Increase
(Decrease) | | | Percent
Increase
(Decrease) | |
| | | 2013 | | | 2012 | | | |
Other expense | | $ | 207,500 | | | $ | 38,300 | | | $ | 169,200 | | | | 442 | % |
During the year ended December 31, 2013, other expense increased to $207.5 million. The increase was primarily a result of an increase in unrealized foreign currency losses of $177.4 million. During the years ended December 31, 2013 and 2012, we recorded unrealized foreign currency losses of approximately $211.7 million and $34.3 million, respectively, resulting primarily from fluctuations in the foreign currency exchange rates associated with our intercompany notes and similar unaffiliated balances denominated in a currency other than the subsidiaries’ functional currencies. The increase in unrealized foreign currency losses is primarily due to the negative impact associated with fluctuations in GHS and BRL.
Income Tax Provision
| | | | | | | | | | | | | | | | |
| | | Year Ended December 31, | | | Amount of
Increase
(Decrease) | | | Percent
Increase
(Decrease) | |
| | | 2013 | | | 2012 | | | |
Income tax provision | | $ | 59,541 | | | $ | 107,304 | | | $ | (47,763 | ) | | | (45 | )% |
Effective tax rate | | | 11.0 | % | | | 15.3 | % | | | | | | | | |
The income tax provision for the year ended December 31, 2013 decreased 45% to $59.5 million. The ETR for the year ended December 31, 2013 decreased to 11.0% from 15.3%. The ETR during the year ended December 31, 2012 included an increase of 8% due to a valuation allowance recorded on certain previously unreserved deferred tax assets. The ETR during the year ended December 31, 2013 included an increase of 4% due to the restructuring of our domestic TRSs.
As a REIT, we may deduct earnings distributed to stockholders against the income generated in our QRSs. In addition, we are able to offset income in both our TRSs and QRSs by utilizing our NOLs, subject to specified limitations.
The ETR on income from continuing operations for the years ended December 31, 2013 and 2012 differs from the federal statutory rate primarily due to our qualification for taxation as a REIT effective as of January 1, 2012 and adjustments for foreign items.
Net Income/Adjusted EBITDA
| | | | | | | | | | | | | | | | |
| | | Year Ended December 31, | | | Amount of
Increase
(Decrease) | | | Percent
Increase
(Decrease) | |
| | | 2013 | | | 2012 | | | |
Net income | | $ | 482,208 | | | $ | 594,025 | | | $ | (111,817 | ) | | | (19 | )% |
Income on equity method investments | | | — | | | | (35 | ) | | | (35 | ) | | | (100 | ) |
Income tax provision | | | 59,541 | | | | 107,304 | | | | (47,763 | ) | | | (45 | ) |
Other expense | | | 207,500 | | | | 38,300 | | | | 169,200 | | | | 442 | |
Loss on retirement of long-term obligations | | | 38,701 | | | | 398 | | | | 38,303 | | | | 9,624 | |
Interest expense | | | 458,296 | | | | 401,665 | | | | 56,631 | | | | 14 | |
Interest income | | | (9,706 | ) | | | (7,680 | ) | | | 2,026 | | | | 26 | |
Other operating expenses | | | 71,539 | | | | 62,185 | | | | 9,354 | | | | 15 | |
Depreciation, amortization and accretion | | | 800,145 | | | | 644,276 | | | | 155,869 | | | | 24 | |
Stock-based compensation expense | | | 68,138 | | | | 51,983 | | | | 16,155 | | | | 31 | |
| | | | | | | | | | | | | | | | |
Adjusted EBITDA | | $ | 2,176,362 | | | $ | 1,892,421 | | | $ | 283,941 | | | | 15 | % |
Net income for the year ended December 31, 2013 decreased 19% to $482.2 million. The increase in our operating profit of $307.2 million, as described above, was partially offset by increases in corporate SG&A, depreciation, amortization and accretion expense, interest expense and a loss on retirement of long-term obligations recorded during the year ended December 31, 2013. In addition, the increase in our operating profit was partially offset by an increase in other expenses, primarily due to unrealized foreign currency losses. Net income was positively impacted by a decrease in our income tax provision.
Adjusted EBITDA for the year ended December 31, 2013 increased 15% to $2,176.4 million. Adjusted EBITDA growth was primarily attributable to the increase in our gross margin of $355.8 million, and was partially offset by an increase in SG&A of $71.9 million, excluding the impact of stock-based compensation expense.
Net Income/NAREIT FFO/AFFO
| | | | | | | | | | | | | | | | |
| | | Year Ended December 31, | | | Amount of
Increase
(Decrease) | | | Percent
Increase
(Decrease) | |
| | | 2013 | | | 2012 | | | |
Net income | | $ | 482,208 | | | $ | 594,025 | | | $ | (111,817 | ) | | | (19 | )% |
Real estate related depreciation, amortization and accretion | | | 701,292 | | | | 562,298 | | | | 138,994 | | | | 25 | |
Losses from sale or disposal of real estate and real estate related impairment charges | | | 32,475 | | | | 23,650 | | | | 8,825 | | | | 37 | |
Adjustments for unconsolidated affiliates and noncontrolling interest | | | 41,000 | | | | 20,238 | | | | 20,762 | | | | 103 | |
| | | | | | | | | | | | | | | | |
NAREIT FFO | | $ | 1,256,975 | | | $ | 1,200,211 | | | $ | 56,764 | | | | 5 | % |
Straight-line revenue | | | (147,664 | ) | | | (165,806 | ) | | | (18,142 | ) | | | (11 | ) |
Straight-line expense | | | 29,732 | | | | 33,700 | | | | (3,968 | ) | | | (12 | ) |
Stock-based compensation expense | | | 68,138 | | | | 51,983 | | | | 16,155 | | | | 31 | |
Non-cash portion of tax provision | | | 7,865 | | | | 38,027 | | | | (30,162 | ) | | | (79 | ) |
Non-real estate related depreciation, amortization and accretion | | | 98,853 | | | | 81,978 | | | | 16,875 | | | | 21 | |
Amortization of deferred financing costs, capitalized interest, debt discounts and premiums and long-term deferred interest charges | | | 22,955 | | | | 21,008 | | | | 1,947 | | | | 9 | |
Other expense(1) | | | 207,500 | | | | 38,300 | | | | 169,200 | | | | 442 | |
Loss on retirement of long-term obligations | | | 38,701 | | | | 398 | | | | 38,303 | | | | 9,624 | |
Other operating expenses(2) | | | 39,064 | | | | 38,535 | | | | 529 | | | | 1 | |
Capital improvement capital expenditures | | | (81,218 | ) | | | (75,444 | ) | | | 5,774 | | | | 8 | |
Corporate capital expenditures | | | (30,383 | ) | | | (20,047 | ) | | | 10,336 | | | | 52 | |
Adjustments for unconsolidated affiliates and noncontrolling interest | | | (41,000 | ) | | | (20,238 | ) | | | 20,762 | | | | 103 | |
| | | | | | | | | | | | | | | | |
AFFO | | $ | 1,469,518 | | | $ | 1,222,605 | | | $ | 246,913 | | | | 20 | % |
(1) | Primarily includes unrealized loss on foreign currency exchange rate fluctuations. |
(2) | Primarily includes transaction related costs. |
NAREIT FFO for the year ended December 31, 2013 was $1,257.0 million as compared to NAREIT FFO of $1,200.2 million for the year ended December 31, 2012. AFFO for the year ended December 31, 2013 increased 20% to $1,469.5 million as compared to $1,222.6 million for the year ended December 31, 2012. AFFO growth was primarily attributable to the increase in our operating profit and a decrease in cash paid for income taxes, partially offset by an increase in corporate SG&A, cash paid for interest and capital improvement and corporate capital expenditures.
Liquidity and Capital Resources
Overview
During the year ended December 31, 2014, we raised capital, thereby increasing our financial flexibility and our ability to grow our business while reducing our leverage, consistent withmaintaining our long-term financial policies. Our significant 20142017 financing transactions included:
The completion ofA registered public offerings (i) through a reopeningoffering of 500.0 million Euros ($532.2 million at the 3.40% Notes and a reopeningdate of the 5.00% Notes, in aggregate principal amounts of $250.0 million and $500.0 million, respectively and (ii) of the 3.450% Notes in anissuance) aggregate principal amount of $650.0 million. We used the net proceeds from each offering to repay certain indebtedness under our existing credit facilities.
1.375% senior unsecured notes due 2025 (the “1.375% Notes”).The completion of aA registered public offering of 6,000,000 shares$750.0 million aggregate principal amount of Mandatory Convertible Preferred Stock. We used3.55% senior unsecured notes due 2027 (the “3.55% Notes”).
Registered public offerings of $700.0 million aggregate principal amount of 3.000% senior unsecured notes due 2023 (the “3.000% Notes”) and $700.0 million aggregate principal amount of 3.600% senior unsecured notes due 2028 (the “3.600% Notes”).
Amendment of our multicurrency senior unsecured revolving credit facility entered into in June 2013, as amended (the “2013 Credit Facility”), our senior unsecured revolving credit facility entered into in January 2012, as amended and restated in September 2014, as further amended (the “2014 Credit Facility”) and our unsecured term loan entered into in October 2013, as amended (the “Term Loan”) to, among other things, extend the net proceeds of $582.9 million to fund acquisitions initially fundedmaturity dates by indebtedness incurred underone year and reduce the Applicable Margins (as defined in the 2013 Credit Facility) and the commitment fees set forth in the 2013 Credit Facility.
Redemptions of the 7.25% Notes and the 4.500% Notes for an aggregate of $1.3 billion.
As a holding company, our cash flows are derived primarily from the operations of, and distributions from, our operating subsidiaries or funds raised through borrowings under our credit facilities and debt or equity offerings.
The amendment and restatement offollowing table summarizes our 2012 Credit Facility, which, among other things, increased the commitments thereunder to $1.5 billion and extended the maturity date to January 31, 2020.
Asliquidity as of December 31, 2014,2017 (in millions):
|
| | | |
| Available under the 2013 Credit Facility | $ | 674.4 |
|
| Available under the 2014 Credit Facility | 1,505.0 |
|
| Letters of credit | (10.3 | ) |
| Total available under credit facilities, net | 2,169.1 |
|
| Cash and cash equivalents | 802.1 |
|
| Total liquidity | $ | 2,971.2 |
|
Subsequent to December 31, 2017, we
had approximately $2.7 billion of total liquidity, comprised of approximately $313.5borrowed an additional $325.0 million
in cash and cash equivalents and the ability to borrow up to $2.4 billion, net of outstanding letters of credit, under the 2013 Credit Facility and
$600.0 million under the 2014 Credit
Facility.Facility, which were primarily used for general corporate purposes.
Summary cash flow information
is set forth below for the years ended December 31,
2014, 2013 and 2012 is set forth below (in
thousands)millions):
| | | | | | | | | | | | |
| | | 2014 | | | 2013 | | | 2012 | |
Net cash provided by (used for): | | | | | | | | | | | | |
Operating activities | | $ | 2,134,589 | | | $ | 1,599,047 | | | $ | 1,414,391 | |
Investing activities | | | (1,949,548 | ) | | | (5,173,337 | ) | | | (2,558,385 | ) |
Financing activities | | | (134,591 | ) | | | 3,525,565 | | | | 1,170,366 | |
Net effect of changes in exchange rates on cash and cash equivalents | | | (30,534 | ) | | | (26,317 | ) | | | 12,055 | |
| | | | | | | | | | | | |
Net increase (decrease) in cash and cash equivalents | | $ | 19,916 | | | $ | (75,042 | ) | | $ | 38,427 | |
| | | | | | | | | | | | |
|
| | | | | | | | | | | |
| | 2017 | | 2016 | | 2015 |
| Net cash provided by (used for): | | | | | |
| Operating activities | $ | 2,925.6 |
| | $ | 2,701.7 |
| | $ | 2,166.9 |
|
| Investing activities | (2,800.9 | ) | | (2,102.3 | ) | | (7,741.7 | ) |
| Financing activities | (113.0 | ) | | (99.3 | ) | | 5,593.1 |
|
| Net effect of changes in foreign currency exchange rates on cash and cash equivalents | 6.7 |
| | (26.5 | ) | | (29.1 | ) |
| Net increase (decrease) in cash and cash equivalents, and restricted cash | $ | 18.4 |
| | $ | 473.6 |
| | $ | (10.8 | ) |
We use our cash flows to fund our operations and investments in our business, including tower maintenance and improvements, communications site construction and managed network installations and tower and land acquisitions. Additionally, we use our cash flows to make distributions, including distributions of our REIT taxable income to maintain our qualification for taxation as a REIT under the Code. We may also
repay or repurchase our existing indebtedness
or equity from time to time. We typically fund our international expansion efforts primarily through a combination of cash on hand, intercompany debt and equity contributions.
As of December 31, 2014,2017, we had total outstanding indebtedness of approximately $14.6$20.3 billion, with a current portion of $897.6$775.0 million. During the year ended December 31, 2014,2017, we generated sufficient cash flow from operations to fund our capital
expenditures and debt service obligations, as well as our required
REITdistributions. We believe the cash generated by operating activities during the year ending December 31, 2015,2018, together with our increased borrowing capacity under our credit facilities, and bridge loan commitment, will be sufficient to fund our required distributions, capital expenditures, debt service obligations (interest and principal repayments) and signed acquisitions. As of December 31, 2014,2017, we had approximately $185.8$632.8 million of cash and cash equivalents held by our foreign subsidiaries, of which $67.1$289.9 million was held by our joint ventures. Historically,While certain subsidiaries may pay us interest or principal on intercompany debt, it has not been our practice to repatriate cashearnings from our foreign subsidiaries primarily due to our ongoing expansion efforts and related capital needs. However, in the event that we do repatriate any funds, we may be required to accrue and pay taxes.
Cash Flows from Operating Activities
For the year ended December 31, 2014,2017, cash provided by operating activities increased $535.5$223.9 million as compared to the year ended December 31, 2013. This increase was primarily due2016. The primary factors that impacted cash provided by operating activities as compared to anthe year ended December 31, 2016, include:
An increase in theour operating profit of our rental and management segments, cash provided by working capital and a decrease in restricted cash, partially offset by increases$549.4 million;
An increase of approximately $67.0 million in cash paid for interestinterest;
An increase of approximately $62.7 million in straight-line revenue: and
An increase of approximately $40.3 million in cash paid for taxes.
Working capital was positively impacted by the receipt of capital contributions from tenants and a value added tax refund, partially offset by an increase in accounts receivable. For the year ended December 31, 2013,2016, cash provided by operating activities increased $184.7$534.8 million as compared to the year ended December 31, 2012. This increase was primarily due to an increase in the2015. The primary factors that impacted cash provided by operating profit of our rental and management segmentsactivities as compared to the year ended December 31, 2012, partially offset by increases2015, include:
An increase in Other SG&A andour operating profit of $490.7 million;
An increase of approximately $67.1 million in cash paid for interestinterest; and a
A decrease
of approximately $60.9 million in cash
provided by working capital. Working capital was positively impacted by the receipt of capital contributions from tenants and partially offset by an increase in prepaid assets.paid for taxes.
Cash Flows from Investing Activities
For the year ended December 31, 2014, cash used for investing activities decreased approximately $3,223.8 million, as compared to the year ended December 31, 2013.
Our significant investing activities
in 2014 included the following:We spent $974.4 million for purchases of property and equipment and construction activities, including (i) $521.6 million of capital expenditures for discretionary capital projects, such as completion of the construction of approximately 3,133 communications sites and the installation of approximately 530 shared generators domestically, (ii) $133.7 million spent to acquire land under our towers that was subject to ground agreements (including leases), (iii) $99.2 million of capital expenditures related to capital improvements primarily attributable to our communications sites and corporate capital expenditures primarily attributable to information technology improvements, (iv) $194.4 million for the redevelopment of existing communications sites to accommodate new tenant equipment and (v) $25.5 million of capital expenditures related to start-up capital projects primarily attributable to acquisitions and new market launches and costs that are contemplated in the business cases for these investments.
We completed the acquisition of 100% of the equity interests of BR Towers for an estimated preliminary purchase price of approximately $568.9 million, net of debt assumed and outstanding preferred stock.
We spent $441.7 million for the acquisition of an aggregate of approximately 400 communications sites in Brazil, Ghana, Mexico, Uganda and the United States, as well as to satisfy obligations related to sites acquired during the year ended December 31, 20132017 are highlighted below:
We spent approximately $2.0 billion for acquisitions, primarily related to the funding of the FPS Acquisition, as well as tower acquisitions in Brazil, South Africathe United States, and the United States.acquisition of urban telecommunications assets in Mexico.
For the year ended December 31, 2013, cash used
We spent $824.2 million for investing activities increased approximately $2,615.0 million,capital expenditures, as compared to the year ended December 31, 2012. follows (in millions):
|
| | | |
| Discretionary capital projects (1) | $ | 170.0 |
|
| Ground lease purchases | 131.2 |
|
| Capital improvements and corporate expenditures (2) | 131.2 |
|
| Redevelopment | 204.5 |
|
| Start-up capital projects | 187.3 |
|
| Total capital expenditures (3) | $ | 824.2 |
|
| |
| (1) | Includes the construction of 1,960 communications sites globally. |
| |
| (2) | Includes $31.8 million of capital lease payments included in Repayments of notes payable, credit facilities, senior notes, term loan and capital leases in the cash flow from financing activities in our consolidated statements of cash flows. |
| |
| (3) | Net of purchase credits of $11.2 million on certain assets, which are reported in operating activities in our consolidated statements of cash flows. |
Our significant investing transactions in
20132016 included the following:
We spent $724.5approximately $1.1 billion for the Viom Acquisition.
We spent $701.4 million for purchases of property and equipment and construction activities, including (i) $381.6 million of capital expenditures, for discretionary capital projects, such as completion of the construction of approximately 2,370 communications sites and the installation of approximately 1,310 shared generators domestically, (ii) $83.8 million spent to acquire land under our towers that was subject to ground agreements (including leases), (iii) $111.6 million of capital expenditures related to capital improvements primarily attributable to our communications sites and corporate capital expenditures primarily attributable to information technology improvements, (iv) $120.8 million for the redevelopment of existing communications sites to accommodate new tenant equipment and (v) $26.7 million of capital expenditures related to start-up capital projects primarily attributable to acquisitions and new market launches and costs that are contemplated in the business cases for these investments.follows (in millions):
We completed the acquisition of MIPT for a purchase price of approximately $4.9 billion, funded by cash payments of $3.3 billion and the assumption of approximately $1.5 billion of existing MIPT debt. In addition, we spent $1.2 billion to acquire approximately 5,330 communications sites in our legacy markets, primarily in Mexico and Brazil.
|
| | | |
| Discretionary capital projects (1) | $ | 149.7 |
|
| Ground lease purchases | 153.3 |
|
| Capital improvements and corporate expenditures (2) | 126.7 |
|
| Redevelopment | 147.4 |
|
| Start-up capital projects | 124.3 |
|
| Total capital expenditures | $ | 701.4 |
|
| |
| (1) | Includes the construction of 1,869 communications sites globally. |
| |
| (2) | Includes $18.9 million of capital lease payments included in Repayments of notes payable, credit facilities, term loan, senior notes and capital leases in the cash flow from financing activities in our consolidated statement of cash flows. |
We plan to continue to allocate our available capital, after satisfying our distribution requirements, among investment alternatives that meet our return on investment
criteria.criteria, while maintaining our commitment to our long-term financial policies. Accordingly, we expect to continue to deploy
our capital through our annual capital expenditure program, including land purchases and new site construction, and through acquisitions. We expect that our
20152018 total capital expenditures will be between
approximately $800$850 million and
$900$950 million,
including: (i) between $105 million and $115 million for capital improvements and corporate capital expenditures, (ii) between $30 million and $40 million for start-up capital projects, (iii) between $155 million and $175 million for the redevelopment of existing communications sites, (iv) between $170 million and $190 million for ground lease purchases and (v) between $340 million and $380 million for other discretionary capital projects including the construction of approximately 2,750 to 3,250 new communications sites.as follows (in millions):
|
| | | | | | | |
| Discretionary capital projects (1) | $ | 255 |
| to | $ | 285 |
|
| Ground lease purchases | 150 |
| to | 170 |
|
| Capital improvements and corporate expenditures | 155 |
| to | 175 |
|
| Redevelopment | 210 |
| to | 230 |
|
| Start-up capital projects | 80 |
| to | 90 |
|
| Total capital expenditures | $ | 850 |
| to | $ | 950 |
|
_______________
| |
| (1) | Includes the construction of approximately 2,500 to 3,500 communications sites globally. |
Cash Flows from Financing Activities
Our significant financing
transactionsactivities were as follows (in millions):
| | | | | | | | |
| | | Year ended December 31, 2014 | |
| | | 2014 | | | 2013 | |
Proceeds from term loan | | $ | — | | | $ | 1,500.0 | |
Proceeds from issuance of senior notes, net | | | 1,415.8 | | | | 2,221.8 | |
Proceeds from the issuance of preferred stock, net | | | 583.1 | | | | — | |
Proceeds from issuance of Securities | | | — | | | | 1,778.5 | |
Repayment of Certificates | | | — | | | | (1,750.0 | ) |
Repayment of term loan | | | — | | | | (750.0 | ) |
Purchases of common stock | | | — | | | | (145.0 | ) |
Distributions paid on common stock | | | (404.6 | ) | | | (434.7 | ) |
In addition
|
| | | | | | | | | | | |
| | Year ended December 31, |
| | 2017 | | 2016 | | 2015 |
| Proceeds from issuance of senior notes, net | $ | 2,674.0 |
| | $ | 3,236.4 |
| | $ | 1,492.3 |
|
| Proceeds from (repayments of) credit facilities, net | 628.6 |
| | (1,277.1 | ) | | 2,105.0 |
|
| Distributions paid on common and preferred stock | (1,164.4 | ) | | (993.2 | ) | | (795.5 | ) |
| Purchases of common stock | (766.3 | ) | | — |
| | — |
|
| Repayments of securitized notes | (302.5 | ) | | (161.1 | ) | | (964.9 | ) |
| Contributions from noncontrolling interest holders, net (1) | 264.3 |
| | 238.5 |
| | 7.2 |
|
| Repayment of senior notes | (1,300.0 | ) | | — |
| | (1,100.0 | ) |
| (Repayments of) proceeds from term loan | — |
| | (1,000.0 | ) | | 500.0 |
|
| Proceeds from the issuance of common stock, net | — |
| | — |
| | 2,440.3 |
|
| Proceeds from the issuance of preferred stock, net | — |
| | — |
| | 1,337.9 |
|
| Proceeds from issuance of securitized notes | — |
| | — |
| | 875.0 |
|
_______________
(1) 2017 contributions primarily relate to the
transactions noted above, our financing activities included borrowings and repayments under our credit facilities and other long-term borrowings.funding of the FPS Acquisition.
Senior Notes
Mandatory Convertible Preferred Stock1.375% Senior Notes Offering.On May 12, 2014,April 6, 2017, we completed a registered public offering of 6,000,000 shares of our Mandatory Convertible Preferred Stock.the 1.375% Notes. The net proceeds from this offering were approximately 489.8 million Euros (approximately $521.4 million at the date of issuance), after deducting commissions and estimated expenses. We used the net proceeds to repay existing indebtedness under the 2013 Credit Facility and for general corporate purposes.
The 1.375% Notes will mature on April 4, 2025 and bear interest at a rate of 1.375% per annum. Accrued and unpaid interest on the 1.375% Notes will be payable in Euros in arrears on April 4 of each year, beginning on April 4, 2018. Interest on the 1.375% Notes will be computed on the basis of the actual number of days in the period for which interest is being calculated and the actual number of days from and including the last date on which interest was paid on the 1.375% Notes and commenced accruing on April 6, 2017.
3.55% Senior Notes Offering. On June 30, 2017, we completed a registered public offering of the 3.55% Notes. The net proceeds from this offering were $582.9approximately $741.8 million, after deducting commissions and estimated expenses. We used the net proceeds from this offering to fund acquisitions, including the acquisition from Richland, initially funded by indebtedness incurred under the 2013 Credit Facility.
Unless converted earlier, each share of the Mandatory Convertible Preferred Stock will automatically convert on May 15, 2017, into between 0.9174 and 1.1468 shares of common stock, depending on the applicable market value of the common stock and subject to anti-dilution adjustments.
Dividends on shares of Mandatory Convertible Preferred Stock are payable on a cumulative basis when, as and if declared by our Board of Directors (or an authorized committee thereof) at an annual rate of 5.25% on the liquidation preference of $100.00 per share, on February 15, May 15, August 15 and November 15 of each year, commencing on August 15, 2014 to, and including, May 15, 2017. We may pay dividends in cash or, subject to certain limitations, in shares of common stock or any combination of cash and shares of common stock. The terms of the Mandatory Convertible Preferred Stock provide that, unless full cumulative dividends have been paid or set aside for payment on all outstanding Mandatory Convertible Preferred Stock for all prior dividend periods, no dividends may be declared or paid on common stock.
GTP Notes. In connection with our acquisition of MIPT, we assumed approximately $1.49 billion principal amount of existing indebtedness issued by certain subsidiaries of GTP in several securitization transactions. GTP Acquisition Partners I, LLC (“GTP Partners”) issued the Series 2011-1 notes, Series 2011-2 notes and Series 2013-1 notes, and GTP Cellular Sites, LLC (“GTP Cellular Sites,” and together with GTP Partners, the “GTP Issuers”) issued the Series 2012-1 notes and Series 2012-2 notes.
In August 2014, we repaid in full the aggregate principal amount outstanding of $250.0 million under the Series 2010-1 Class C Notes and the Series 2010-1 Class F Notes issued by GTP Towers Issuer, LLC (together, the “Series 2010-1 Notes”).
The following table sets forth certain terms of the GTP Notes:
| | | | | | | | | | | | | | | | | | | | |
GTP Notes | | Issue Date | | | Original
Principal
Amount
(in thousands) | | | Interest
Rate | | | Anticipated
Repayment Date | | | Final Maturity
Date | |
Series 2011-1 Class C notes | | | March 11, 2011 | | | $ | 70,000 | | | | 3.967 | % | | | June 15, 2016 | | | | June 15, 2041 | |
Series 2011-2 Class C notes | | | July 7, 2011 | | | $ | 490,000 | | | | 4.347 | % | | | June 15, 2016 | | | | June 15, 2041 | |
Series 2011-2 Class F notes | | | July 7, 2011 | | | $ | 155,000 | | | | 7.628 | % | | | June 15, 2016 | | | | June 15, 2041 | |
Series 2012-1 Class A notes(1) | | | February 28, 2012 | | | $ | 100,000 | | | | 3.721 | % | | | March 15, 2017 | | | | March 15, 2042 | |
Series 2012-2 Class A notes(1) | | | February 28, 2012 | | | $ | 114,000 | | | | 4.336 | % | | | March 15, 2019 | | | | March 15, 2042 | |
Series 2012-2 Class B notes | | | February 28, 2012 | | | $ | 41,000 | | | | 6.413 | % | | | March 15, 2019 | | | | March 15, 2042 | |
Series 2012-2 Class C notes | | | February 28, 2012 | | | $ | 27,000 | | | | 7.358 | % | | | March 15, 2019 | | | | March 15, 2042 | |
Series 2013-1 Class C notes | | | April 24, 2013 | | | $ | 190,000 | | | | 2.364 | % | | | May 15, 2018 | | | | May 15, 2043 | |
Series 2013-1 Class F notes | | | April 24, 2013 | | | $ | 55,000 | | | | 4.704 | % | | | May 15, 2018 | | | | May 15, 2043 | |
(1) | Does not reflect MIPT’s repayment of approximately $1.4 million aggregate principal amount prior to the date of acquisition and our repayment of approximately $3.5 million aggregate principal amount after the date of acquisition in accordance with the repayment schedules. |
BR Towers Debt.In connection with the acquisition of BR Towers, we assumed approximately 671.5 million BRL (approximately $261.1 million based on exchange rates at the date of closing) aggregate principal amount of existing indebtedness consisting of (i) 323.4 million of BRL denominated privately issued simple debentures (“BR Towers Private Debentures”) (with an original principal amount of 330.0 million BRL), (ii) 313.1 million BRL of denominated publicly issued simple debentures (“BR Towers Debentures”) (with an original principal amount of 300.0 million BRL) issued by a subsidiary of BR Towers (the “BRT Issuer”), and (iii) a BRL denominated credit facility with Banco Nacional de Desenvolvimento Economico e Social, which
allows a subsidiary of BR Towers (the “BRT Borrower”) to borrow up to 48.1 million BRL through an intermediary bank (the “BR Towers Credit Facility”).
On December 11, 2014, we repaid all amounts outstanding under the BR Towers Private Debentures, which included a prepayment penalty of 3.2 million BRL (approximately $1.2 million on the date of repayment).
The BR Towers Debentures were issued on October 15, 2013, and have a maturity date of October 15, 2023. The BR Towers Debentures bear interest at a rate of 7.40%. The aggregate principal amount of the BR Towers Debentures may be adjusted periodically relative to changes in the National Extended Consumer Price Index. Any such increase in the principal amount will be capitalized in a manner consistent with the agreement governing the BR Towers Debentures (the “Debenture Agreement”). Payments of principal and interest are made quarterly, beginning on January 15, 2014, in accordance with the amortization schedule set forth in the Debenture Agreement.
We may redeem the BR Towers Debentures beginning on October 15, 2018 at the then outstanding principal amount plus a surcharge, calculated in accordance with the Debenture Agreement, and all accrued and unpaid interest thereon. As of December 31, 2014, we had 315.3 million BRL (approximately $118.7 million) aggregate principal amount outstanding under the BR Towers Debentures.
The BR Towers Debentures are secured by (i) 100% of the shares of the BRT Issuer and (ii) all proceeds and rights from the issuance of the BR Towers Debentures, including amounts in a Resource Account (as defined in the applicable agreement). The Debenture Agreement includes contractual covenants and other restrictions customary for public debentures. Among other things, the Debenture Agreement requires that (i) the BRT Issuer maintain a debt service coverage ratio of at least 1.10, (ii) the risk rating of the BR Towers Debentures not be downgraded by two or more notches, (iii) the BRT Issuer meet certain conditions to distribute dividends or interest on the issuer’s own capital, (iv) the issuer not incur additional indebtedness in an aggregate amount greater than 5.0 million BRL (which amount is subject to adjustment as set forth in the agreement) and (v) the issuer maintain a leverage index (as defined in the Debenture Agreement) of at least 30%.
The BR Towers Credit Facility consists of three sublimits of 20.2 million BRL, 27.6 million BRL and 0.2 million BRL, respectively. The sublimits mature between July 15, 2020 and January 15, 2022 and had interest rates between 3.50% and 10.80% as of December 31, 2014.
As of December 31, 2014, 43.5 million BRL (approximately $16.4 million) was outstanding under the BR Towers Credit Facility and the BRT Borrower maintains the ability to draw down the remaining 4.6 million BRL (approximately $1.7 million) until June 26, 2015. The BR Towers Credit Facility is secured by the conditional assignment of receivables.
Mexican Loan.In connection with the acquisition of towers in Mexico from NII Holdings, Inc. (“NII”) during the fourth quarter of 2013, one of our Mexican subsidiaries entered into a 5.2 billion MXN denominated unsecured bridge loan (the “Mexican Loan”) and subsequently borrowed approximately 4.9 billion MXN (approximately $374.7 million at the date of borrowing). Our Mexican subsidiary’s ability to further draw under the Mexican Loan expired in February 2014. The Mexican Loan bears interest at a margin over the Equilibrium Interbank Interest Rate (“TIIE”). During the year ended December 31, 2014, our Mexican subsidiary repaid 1.1 billion MXN (approximately $80.4 million on the date of repayment) of the outstanding indebtedness using cash on hand. As of December 31, 2014, the current margin over TIIE was 1.50%.
Ghana Loan and 2014 Ghana Loan.During the year ended December 31, 2014, our joint venture in Ghana with MTN Group Limited converted $175.2 million of existing notes under the U.S. Dollar-denominated shareholder loan (the “Ghana Loan”) into a new 220.9 million GHS (approximately $68.7 million) denominated shareholder loan (the “2014 Ghana Loan”), as the borrower, with one of our wholly owned subsidiaries (the “ATC Ghana Subsidiary”) and a wholly owned subsidiary of MTN Ghana (the “MTN Ghana Subsidiary”), as the
lenders. The 2014 Ghana Loan accrues interest at 21.87% per annum and matures on December 31, 2019. The portion of the loans made by the ATC Ghana Subsidiary is eliminated in consolidation and the portion of the loans made by the MTN Ghana Subsidiary is reported as outstanding debt.
Colombian Credit Facility.On October 14, 2014, one of our Colombian subsidiaries (“ATC Sitios”) entered into a loan agreement for a new 200.0 billion COP (approximately $96.8 million at the date of borrowing) denominated long-term credit facility (the “Colombian Credit Facility”). On October 24, 2014, ATC Sitios used borrowings under the Colombian Credit Facility, together with cash on hand, to repay the Colombian Long-Term Credit Facility, as well as to repay six COP denominated bridge loans, which one of our Colombian subsidiaries had entered into in connection with the acquisition of communications sites in Colombia.
Any outstanding principal and accrued but unpaid interest will be due and payable in full at maturity. The Colombian Credit Facility may be prepaid in whole or in part, subject to certain limitations and prepayment consideration, at any time.
Principal and interest are payable quarterly in arrears with principal due in accordance with the repayment schedule included in the loan agreement. Interest accrues at a per annum rate equal to 4.00% above the three-month Inter-bank Rate (“IBR”) in effect at the beginning of each Interest Period (as defined in the loan agreement). The loan agreement also requires that ATC Sitios manage exposure to variability in interest rates on certain of the amounts outstanding under the Colombian Credit Facility. As of December 31, 2014, the interest rate, after giving effect to the interest rate swap agreements, is 9.05%.
The Colombian Credit Facility is secured by, among other things, liens on towers owned by ATC Sitios. The loan agreement contains certain reporting, information, financial ratios and operating covenants. Failure to comply with certain of the financial and operating covenants would constitute a default, which could result in, among other things, the amounts outstanding, including all accrued interest and unpaid fees, becoming immediately due and payable.
Colombian Loan.In connection with the establishment of our joint venture with Millicom International Cellular SA (“Millicom”) and the acquisition of certain communications sites in Colombia, ATC Colombia B.V., our majority owned subsidiary, entered into a U.S. Dollar-denominated shareholder loan agreement (the “Colombian Loan”), as the borrower, with our wholly owned subsidiary (the “ATC Colombian Subsidiary”), and a wholly owned subsidiary of Millicom (the “Millicom Subsidiary”), as the lenders. During the year ended December 31, 2014, the joint venture borrowed an additional $3.0 million under the Colombian Loan, which was subsequently converted from debt to equity. In July 2014, we purchased Millicom’s interest in the joint venture and the Colombian Loan using proceeds from borrowings under the 2013 Credit Facility.
Costa Rica Loan.In connection with our acquisition of MIPT, we assumed $32.6 million of secured debt in Costa Rica (the “Costa Rica Loan”), which we repaid in full in February 2014.
Richland Notes.In connection with our acquisition of entities holding a portfolio of communications sites from Richland, we assumed approximately $196.5 million of secured debt (the “Richland Notes”), which we repaid in full in June 2014.
Short-Term Credit Facility.In September 2013, we entered into a $1.0 billion senior unsecured revolving credit facility (the “Short-Term Credit Facility”), which matured on September 19, 2014. The Short-Term Credit Facility was undrawn at the time of maturity.
2013 Credit Facility.In June 2013, we entered into the 2013 Credit Facility. The 2013 Credit Facility has a term of five years and includes two optional one-year renewal periods. The current margin over the London Interbank Offered Rate (“LIBOR”) that we incur on borrowings (should we choose LIBOR Advances) is 1.250% and the current commitment fee on the undrawn portion is 0.150%.
On September 19, 2014, we entered into an amendment agreement with respect to the 2013 Credit Facility, which (i) amended the limitation on indebtedness of, and guaranteed by, our subsidiaries to the greater of (x) $800.0 million and (y) 50% of Adjusted EBITDA (as defined in the 2013 Credit Facility) on a consolidated basis as of the last day of the most recently completed fiscal quarter and (ii) permitted indebtedness owed by certain of our subsidiaries to our joint venture partners.
During the year ended December 31, 2014, we borrowed $912.0 million and repaid an aggregate of $2.8 billion of revolvingexisting indebtedness under the 2013 Credit Facility. As of December 31, 2014, we had no amounts outstanding and approximately $3.2 million of undrawn letters of credit under the 2013 Credit Facility. In February 2015, we borrowed a net amount of $115.0 million under the 2013 Credit Facility. We maintain the ability to draw down and repay amounts under the 2013 Credit Facility in the ordinary course.
2013 Term Loan.In October 2013, we entered into a $1.5 billion unsecured term loan (the “2013 Term Loan”).
The
2013 Term Loan includes an expansion option allowing us to request additional commitments of up to $500.0 million.On September 19, 2014, we entered into an amendment agreement with respect to the 2013 Term Loan, which (i) amended the limitation on indebtedness of, and guaranteed by, our subsidiaries to the greater of (x) $800.0 million and (y) 50% of Adjusted EBITDA (as defined in the 2013 Term Loan) on a consolidated basis as of the last day of the most recently completed fiscal quarter and (ii) permitted indebtedness owed by certain of our subsidiaries to our joint venture partners.
The 2013 Term Loan matures on January 3, 2019, and the current margin over LIBOR is 1.250%.
2014 Credit Facility.On September 19, 2014, we entered into the 2014 Credit Facility, which amended and restated the 2012 Credit Facility to, among other things, (i) increase the commitments thereunder to $1.5 billion, including a $50.0 million sublimit for swingline loans and a $200.0 million sublimit for letters of credit, (ii) extend the maturity date to January 31, 2020, including up to two optional renewal periods, (iii) amend the limitation on indebtedness of, and guaranteed by, our subsidiaries to the greater of (x) $800.0 million and (y) 50% of Adjusted EBITDA (as defined in the 2014 Credit Facility) on a consolidated basis as of the last day of the most recently completed fiscal quarter, (iv) permit indebtedness owed by certain of our subsidiaries to our joint venture partners and (v) add an expansion feature, which allows us to request up to an aggregate of $500.0 million in additional commitments upon satisfaction of certain conditions.
Amounts borrowed under the 2014 Credit Facility3.55% Notes will bear interest, at our option, at a margin above LIBOR or the Base Rate. For LIBOR based borrowings, interest rates will range from 1.125% to 2.000% above LIBOR. For Base Rate borrowings, interest rates will range from 0.125% to 1.000% above the Base Rate. In each case, the applicable margin is based upon our debt ratings. In addition, the 2014 Credit Facility requires a quarterly commitment fee on the undrawn portion of the commitments ranging from 0.125% to 0.400% per annum, based upon our debt ratings. The current margin over LIBOR that we incur on borrowings is 1.250%, and the current commitment fee on the undrawn portion of the commitments is 0.150%. The 2014 Credit Facility does not require amortization of principal and may be paid prior to maturity in whole or in part at our option without penalty or premium.
The loan agreement contains certain reporting, information, financial and operating covenants and other restrictions (including limitations on additional debt, guaranties, sales of assets and liens) with which we must comply. Any failure to comply with the financial and operating covenants of the loan agreement would not only prevent us from being able to borrow additional funds, but would constitute a default, which could result in, among other things, the amounts outstanding, including all accrued interest and unpaid fees, becoming immediately due and payable.
During the year ended December 31, 2014, we borrowed $1.3 billion and repaid an aggregate of $263.0 million of revolving indebtedness under the 2014 Credit Facility. As of December 31, 2014, we had $1.1 billion
outstanding and approximately $8.0 million of undrawn letters of credit. We maintain the ability to draw down and repay amounts under the 2014 Credit Facility in the ordinary course.
Amendments to Bank Facilities. On February 5, 2015 and February 20, 2015, we entered into amendment agreements with respect to the 2013 Term Loan, the 2013 Credit Facility and the 2014 Credit Facility. After giving effect to these amendments, our permitted ratio of Total Debt to Adjusted EBITDA (as defined in the loan agreements for each of the facilities) is (i) 6.00 to 1.00 for the fiscal quarters ended December 31, 2014 through the end of the fiscal quarter ending immediately prior to the closing of the Proposed Verizon Transaction, (ii) 7.25 to 1.00 for the first and second fiscal quarters ending on or after the closing of the Proposed Verizon Transaction, (iii) 7.00 to 1.00 for the two subsequent fiscal quarters and (iii) 6.00 to 1.00 thereafter. In addition, the maximum Incremental Term Loan Commitments (as defined in the agreement governing the 2013 Term Loan) was increased to $1.0 billion and the maximum Revolving Loan Commitments, after giving effect to any Incremental Commitments (each as defined in the loan agreements for each of the revolving credit facilities) was increased to $3.5 billion and $2.5 billion under the 2013 Credit Facility and the 2014 Credit Facility, respectively. Effective February 20, 2015, we received incremental commitments for an additional $500.0 million under each of the 2013 Term Loan and 2014 Credit Facility and $750.0 million under the 2013 Credit Facility. As a result, we have $2.0 billion outstanding under the 2013 Term Loan and may borrow up to $2.0 billion and $2.75 billion under the 2014 Credit Facility and the 2013 Credit Facility, respectively.
Bridge Facility. In connection with the signing of a definitive agreement for the Proposed Verizon Transaction, we entered into a commitment letter (the “Commitment Letter”), dated February 5, 2015, with Goldman Sachs Bank USA and Goldman Sachs Lending Partners LLC (collectively, the “Commitment Parties”), pursuant to which the Commitment Parties have committed to provide up to $5.05 billion in bridge loans (the “Bridge Loan Commitment”) to ensure financing for the Proposed Verizon Transaction. Effective February 20, 2015, the Bridge Loan Commitment was reduced to $3.3 billion as a result of an aggregate of $1.75 billion of additional committed amounts under our existing bank facilities, as described above.
The Commitment Letter contains, and the credit agreement in respect of the Bridge Loan Commitment, if any, will contain, certain customary conditions to funding, including, without limitation, (i) no material adverse effect with respect to Verizon’s land interests, towers, certain related improvements and tower related assets associated with each communications site having occurred since December 31, 2014, (ii) the execution and delivery of definitive financing agreements for the Bridge Loan Commitment and (iii) other customary closing conditions set forth in the Commitment Letter. We will pay certain customary commitment fees and, in the event we make any borrowings, funding and other fees in connection with the Bridge Loan Commitment.
Senior Notes Offerings
3.40% Senior Notes and 5.00% Senior Notes Offering.On January 10, 2014, we completed a registered public offering of reopened 3.40% Notes and reopened 5.00% Notes in aggregate principal amounts of $250.0 million and $500.0 million, respectively. The net proceeds from the offering were approximately $763.8 million, after deducting commissions and estimated expenses. As a result, the aggregate outstanding principal amount of each of the 3.40% Notes and the 5.00% Notes is $1.0 billion. We used a portion of the proceeds, together with cash on hand, to repay $88.0 million of outstanding indebtedness under the 2014 Credit Facility and $710.0 million of outstanding indebtedness under the 2013 Credit Facility.
The reopened 3.40% Notes issued on January 10, 2014 have identical terms as, are fungible with and are part of a single series of senior debt securities with the 3.40% Notes issued on August 19, 2013. The reopened 5.00% Notes issued on January 10, 2014 have identical terms as, are fungible with and are part of a single series of senior debt securities with the 5.00% Notes issued on August 19, 2013. The 3.40% Notes mature on FebruaryJuly 15, 20192027 and bear interest at a rate of 3.40% per annum. The 5.00% Notes mature on February 15, 2024 and bear interest at a rate of 5.00%3.55% per annum. Accrued and unpaid interest on the 3.40%3.55% Notes and the 5.00% Notes iswill be payable in U.S. Dollars semi-annually in arrears on FebruaryJanuary 15 and AugustJuly 15 of each year, beginning
on FebruaryJanuary 15, 2014.2018. Interest on the 3.40%3.55% Notes and the 5.00% Notes accrues from August 19, 2013 and is computed on the basis of a 360-day year comprised of twelve 30-day months.
months and commenced accruing on June 30, 2017.
3.450%3.000% Senior Notes Offering.and 3.600% Senior Notes Offerings. On August 7, 2014,December 8, 2017, we completed a registered public offeringofferings of the 3.450%3.000% Notes in an aggregate principal amount of $650.0 million.and the 3.600% Notes. The net proceeds from the offeringthese offerings were approximately $641.1$1,382.9 million, after deducting commissions and estimated expenses. We used the net proceeds to repay existing indebtedness under the 2013 Credit Facility and 2014 Credit Facility.
The
3.450%3.000% Notes
will mature on
SeptemberJune 15,
20212023 and bear interest at a rate of
3.450%3.000% per annum. The 3.600% Notes will mature on January 15, 2028 and bear interest at a rate of 3.600% per annum. Accrued and unpaid interest on the
3.450% Notes is3.000% notes will be payable in U.S. Dollars semi-annually in arrears on
MarchJune 15 and
SeptemberDecember 15 of each year, beginning on
MarchJune 15,
2015.2018. Accrued and unpaid interest on the 3.600% notes will be payable in U.S. Dollars semi-annually in arrears on January 15 and July 15 of each year, beginning on July 15, 2018. Interest on the
3.450%3.000% Notes
accrues from August 7, 2014 and
the 3.600% Notes is computed on the basis of a 360-day year comprised of twelve 30-day
months.months and commenced accruing on December 8, 2017. We entered into interest rate swaps, which were designated as fair value hedges at inception, to hedge against changes in fair value of $500.0 million of the $700.0 million under the 3.000% Notes resulting from changes in interest rates. As of December 31, 2017, the interest rate on the 3.000% Notes, after giving effect to the interest rate swap agreements, was 2.49%.
We may redeem
the 3.40% Notes, the 5.00% Notes and the 3.450% Noteseach series of senior notes at any time,
subject to the terms of the applicable supplemental indenture, in whole or in part, at a redemption price equal to 100% of the principal amount of
suchthe notes plus a make-whole premium, together with accrued interest to the redemption date. If we
redeem the 1.375% Notes on or after January 4, 2025, the 3.55% Notes on or after April 15, 2027 or the 3.600% Notes on or after October 15, 2027, we will not be required to pay a make-whole premium. In addition, if we undergo a change of control and
corresponding ratings decline, each as defined in the applicable supplemental indenture,
governing such notes, we may be required to repurchase all of the
3.40% Notes, the 5.00% Notes or the 3.450% Notesapplicable notes at a purchase price equal to 101% of the principal amount of such notes, plus accrued and unpaid interest (including additional interest, if any), up to but not including the repurchase date. The
3.40% Notes, the 5.00% Notes and the 3.450% Notesnotes rank equally with all of our other senior unsecured debt and are structurally subordinated to all existing and future indebtedness and other obligations of our subsidiaries.
Each
of the applicable supplemental
indenturesindenture for the
3.40% Notes, the 5.00% Notes and the 3.450% Notes containnotes contains certain covenants that restrict our ability to merge, consolidate or sell assets and
itsour (together with our subsidiaries’) ability to incur liens. These covenants are subject to a number of exceptions, including that we and our subsidiaries may incur certain liens on assets, mortgages or other liens securing indebtedness if the aggregate amount of such liens
shalldoes not exceed 3.5x Adjusted EBITDA, as defined in
each of the
applicable supplemental
indentures.indenture.
Redemption of 4.625%7.25% Senior Notes.On February 11, 2015,10, 2017, we redeemed all of the outstanding 4.625% senior notes due 2015 (the “4.625% Notes”). In accordance with the redemption provisions and the indenture for the 4.625%7.25% Notes the 4.625% Notes were redeemed at a price equal to 100.5898%112.0854% of the principal amount, plus accrued and unpaid interest up to, but excluding, February 11, 2015,10, 2017, for an aggregate purchaseredemption price of $613.6$341.4 million, including approximately $10.0$5.1 million ofin accrued and unpaid interest, whichinterest. The redemption was funded with borrowings under the 2013 Credit Facility.Facility and cash on hand. Upon completion of thisthe redemption, none of the 4.625%7.25% Notes remained outstanding. Redemption of 4.500% Senior Notes. On July 31, 2017, we redeemed all of the 4.500% Notes at a price equal to 101.3510% of the principal amount, plus accrued and unpaid interest up to, but excluding, July 31, 2017, for an aggregate redemption price of $1.0 billion, including $2.0 million in accrued and unpaid interest. The redemption was funded with borrowings under the 2013 Credit Facility and cash on hand. Upon completion of the redemption, none of the 4.500% Notes remained outstanding.
Bank Facilities
In December 2017, we entered into amendment agreements with respect to the 2013 Credit Facility, the 2014 Credit Facility and the Term Loan, which, among other things, (i) extend the maturity dates by one year to June 28, 2021, January 31, 2023 and January 31, 2023, respectively and (ii) reduces the Applicable Margins (as defined in the loan agreement) of the 2013 Credit Facility and the commitment fees set forth therein.
2013 Credit Facility. We have the ability to borrow up to $2.75 billion under the 2013 Credit Facility, which includes a $1.0 billion sublimit for multicurrency borrowings, a $200.0 million sublimit for letters of credit and a $50.0 million sublimit for swingline loans. During the year ended December 31, 2017, we borrowed an aggregate of $3.8 billion and repaid an aggregate of $2.3 billion of revolving indebtedness. We primarily used the borrowings to fund acquisitions, repay existing indebtedness and for general corporate purposes. We currently have $4.0 million of undrawn letters of credit and maintain the ability to draw down and repay amounts under the 2013 Credit Facility in the ordinary course.
2014 Credit Facility. We have the ability to borrow up to $2.0 billion under the 2014 Credit Facility, which includes a $200.0 million sublimit for letters of credit and a $50.0 million sublimit for swingline loans. During the year ended December 31, 2017, we borrowed an aggregate of $815.0 million and repaid an aggregate of $1.7 billion of revolving indebtedness. We primarily used the borrowings to fund acquisitions and for general corporate purposes.We currently have $6.3 million of undrawn letters of credit and maintain the ability to draw down and repay amounts under the 2014 Credit Facility in the ordinary course.
The Term Loan, the 2013 Credit Facility and the 2014 Credit Facility do not require amortization of principal and may be paid prior to maturity in whole or in part at our option without penalty or premium. We have the option of choosing either a defined base rate or the London Interbank Offered Rate (“LIBOR”) as the applicable base rate for borrowings under the Term Loan, the 2013 Credit Facility and the 2014 Credit Facility. The interest rate on the 2013 Credit Facility ranges between 0.875% to 1.750% above LIBOR for LIBOR based borrowings or up to 0.750% above the defined base rate for base rate borrowings, in each case based upon our debt ratings. The current margin over LIBOR and the base rate for the 2013 Credit Facility is 1.125% and 0.125%, respectively. The interest rates on the Term Loan and the 2014 Credit Facility range between 1.000% to 2.000% above LIBOR for LIBOR based borrowings or up to 1.000% above the defined base rate for base rate borrowings, in each case based upon our debt ratings. The current margin over LIBOR and the base rate for each of the Term Loan and the 2014 Credit Facility is 1.250% and 0.250%, respectively.
The 2013 Credit Facility and the 2014 Credit Facility are subject to two optional renewal periods and we must pay a quarterly commitment fee on the undrawn portion of each facility. The commitment fee for the 2013 Credit Facility ranges from 0.100% to 0.350% per annum, based upon our debt ratings, and is currently 0.1250%. The commitment fee for the 2014 Credit Facility ranges from 0.100% to 0.400% per annum, based upon our debt ratings, and is currently 0.150%.
The loan agreements for each of the Term Loan, the 2013 Credit Facility and the 2014 Credit Facility contain certain reporting, information, financial and operating covenants and other restrictions (including limitations on additional debt, guaranties, sales of assets and liens) with which we must comply. Failure to comply with the financial and operating covenants of the loan agreements could not only prevent us from being able to borrow additional funds under the revolving credit facilities, but may constitute a default, which could result in, among other things, the amounts outstanding, including all accrued interest and unpaid fees, becoming immediately due and payable.
India indebtedness. Amounts outstanding and key terms of the India indebtedness consisted of the following as of December 31, 2017 (in millions, except percentages):
|
| | | | | | | | | | | | | |
| | | | Amount Outstanding (INR) | | Amount Outstanding (USD) | | Interest Rate (Range) | | Maturity Date (Range) |
| Term loans | | 26,740 |
| | $ | 418.7 |
| | 7.90% - 8.65% |
| | January 24, 2018 - November 30, 2024 |
| Debenture | | 6,000 |
| | $ | 93.9 |
| | 9.55 | % | | April 28, 2020 |
| Working capital facilities | | 0 |
| | $ | 0 |
| | 8.05% - 8.75% |
| | March 18, 2018 - October 23, 2018 |
The India indebtedness includes several term loans, ranging from one to ten years, which are generally secured by the borrower’s short-term and long-term assets. Each of the term loans bear interest at the applicable bank’s Marginal Cost of Funds based Lending Rate (as defined in the applicable agreement) or base rate, plus a spread. Interest rates on the term loans are fixed until certain reset dates. Generally, the term loans can be repaid without penalty on the reset dates; repayments at dates other than the reset dates are subject to prepayment penalties, typically of 1% to 2%. Scheduled repayment terms include either
ratable or staggered amortization with repayments typically commencing between six and 36 months after the initial disbursement of funds.
The debentureis secured by the borrower’s long-term assets, including property and equipment and intangible assets. The debenture bears interest at a base rate plus a spread of 0.6%. The base rate is set in advance for each quarterly coupon period. Should the actual base rate be between 9.75% and 10.25%, the revised base rate is assumed to be 10.00% for purposes of the reset. Additionally, the spread is subject to reset 36 and 48 months from the issuance date of April 27, 2015. The holders of the debenture must reach a consensus on the revised spread and the borrower must redeem all of the debentures held by holders from whom consensus is not achieved. Additionally, the debenture is required to be redeemed by the borrower if it does not maintain a minimum credit rating.
The India indebtedness includes several working capital facilities, most of which are subject to annual renewal, and which are generally secured by the borrower’s short-term and long-term assets. The working capital facilities bear interest at rates that are comprised of the applicable bank’s Marginal Cost of Funds based Lending Rate (as defined in the applicable agreement) or base rate, plus a spread. Generally, the working capital facilities are payable on demand prior to maturity.
India preference shares. On March 2, 2017, ATC TIPL issued 166,666,666 mandatorily redeemable preference shares (the “Preference Shares”) and used the proceeds to redeem the preference shares previously issued by Viom (the “Viom Preference Shares”). The Preference Shares are to be redeemed on March 2, 2020 and have a dividend rate of 10.25% per annum. As of December 31, 2017, ATC TIPL had 166,666,666 mandatorily redeemable preference shares (the “Preference Shares”) outstanding, which are required to be redeemed in cash. Accordingly, we recognized debt of 1.67 billion INR ($26.1 million) related to the Preference Shares.
Stock Repurchase Program.In March 2011, our Board of Directors approved aPrograms. We have two stock repurchase programs, the 2011 Buyback and the 2017 Buyback.
During the year ended December 31, 2017, we resumed the 2011 Buyback and repurchased 6,099,150 shares of our common stock thereunder for an aggregate of $766.3 million, including commissions and fees. We had no repurchases under the 2017 Buyback.
Under each program, pursuant to which we are authorized to purchase upshares from time to $1.5time through open market purchases, in privately negotiated transactions not to exceed market prices, and (with respect to such open market purchases) pursuant to plans adopted in accordance with Rule 10b5-1 under the Exchange Act in accordance with securities laws and other legal requirements, and subject to market conditions and other factors.
We expect to continue managing the pacing of the remaining $344.8 million under the 2011 Buyback and the $2.0 billion
authorized under the 2017 Buyback in response to general market conditions and other relevant factors. We expect to fund further repurchases of
our common stock
(the “2011 Buyback”). In September 2013, we temporarily suspended repurchases in connection withthrough a combination of cash on hand, cash generated by operations and borrowings under our
acquisition of MIPT.credit facilities. Purchases under the 2011 Buyback and the 2017 Buyback are subject to us having available cash to fund repurchases.
Sales of Equity Securities. We receive proceeds from sales of our equity securities pursuant to our employee stock purchase plan (the “ESPP”) and upon exercise of stock options granted under our equity incentive plans. For the year ended December 31, 2014,2017, we received an aggregate of $62.3$119.7 million in proceeds upon exercises of stock options and from our employee stock purchase plan.sales pursuant to the ESPP. Distributions. As a REIT, we must annually distribute to our stockholders an amount equal to at least 90% of our REIT taxable income (determined before the deduction for distributed earnings and excluding any net capital gain). Generally, we have distributed, and expect to continue to distribute, all or substantially all of our REIT taxable income after taking into consideration our utilization of NOLs. Since our conversion to a REIT in 2012, weWe have distributed an aggregate of approximately $1.3$4.3 billion to our common stockholders, which isincluding the dividend paid in January 2018, primarily taxedclassified as ordinary income. The amount, timing and frequency of future distributions will be at the sole discretion of our Board of Directors and will
be declared based upondepend on various factors, a number of which may be beyond our control, including our financial condition and operating cash flows, the amount required to maintain our qualification for taxation as a REIT and reduce any income and excise taxes that we otherwise would be required to pay, limitations on distributions in our existing and future debt and preferred equity instruments, our ability to utilize NOLs to offset our distribution requirements, limitations on our ability to fund distributions using cash generated through our TRSs and other factors that our Board of Directors may deem relevant.
We had two series of preferred stock, the Series A Preferred Stock, with a dividend rate of 5.25%, and the Series B Preferred Stock, with a dividend rate of 5.50%. Dividends were payable quarterly in arrears, subject to declaration by our Board of Directors. During the year ended December 31, 2014,2017, we declaredpaid dividends of $2.625 per share, or $15.8 million, to Series A
preferred stockholders of record and $55.00 per share, or $75.6 million, to Series B preferred stockholders of record. During the year ended December 31, 2017, all outstanding shares of the Series A Preferred Stock converted at a rate of 0.9337 per share into an aggregate of $554.6 million in regular cash distributions to5,602,153 shares of our common stock pursuant to the provisions of the Certificate of Designations governing the Series A Preferred Stock.
In addition, on February 15, 2018, we paid dividends of $13.75 per share, or $18.9 million, to Series B Preferred Stockholders of record at the close of business on February 1, 2018. On February 15, 2018, all outstanding shares of the Series B Preferred Stock converted at a rate of 8.7420 per share of Series B Preferred Stock, or 0.8742 per depositary share, each representing a 1/10th interest in a share of Series B Preferred Stock, into shares of our common stock pursuant to the provisions of the Certificate of Designations governing the Series B Preferred Stock. As a result of the conversions of the Series B Preferred Stock in 2018, we issued an aggregate of 12,020,064 shares of our common stock.
During the year ended December 31, 2017, we paid $2.50 per share, or $1.1 billion, to common stockholders
which included our fourth quarterof record. In addition, we declared a distribution of
$0.38$0.70 per share,
(approximately $150.7 million) payableor $300.2 million, paid on January
13, 201516, 2018 to
our common stockholders of record at the close of business on December
16, 2014. During the year ended December 31, 2014, we declared an aggregate of $23.9 million in cash distributions to our preferred stockholders, which included a dividend of $1.3125 per share (approximately $7.9 million), payable on February 16, 2015 to preferred stockholders of record at the close of business on February 1, 2015.28, 2017.
We accrue distributions on unvested restricted stock unit awards granted subsequent to January 1, 2012,units, which are payable upon vesting. As of December 31, 2014,2017, the amount accrued for distributions payable related to unvested restricted stock units was $3.4$10.1 million. During the year ended December 31, 2014,2017, we paid $0.7$3.0 million of distributions upon the vesting of restricted stock units. For more details on the
regular cash distributions paid to our common
and preferred stockholders during the year ended December 31,
2014,2017, see note
1615 to our consolidated financial statements included in this Annual Report.
Contractual Obligations. The following table summarizes our contractual obligations as of December 31, 20142017 (in thousands)millions): | | | | | | | | | | | | | | | | | | | | | | | | | | | | |
Contractual Obligations | | 2015 | | | 2016 | | | 2017 | | | 2018 | | | 2019 | | | Thereafter | | | Total | |
Long-term debt, including current portion: | | | | | | | | | | | | | | | | | | | | | | | | | | | | |
American Tower subsidiary debt: | | | | | | | | | | | | | | | | | | | | | | | | | | | | |
Secured Tower Revenue Securities, Series 2013-1A(1) | | $ | — | | | $ | — | | | $ | — | | | $ | 500,000 | | | $ | — | | | $ | — | | | $ | 500,000 | |
Secured Tower Revenue Securities, Series 2013-2A(2) | | | — | | | | — | | | | — | | | | — | | | | — | | | | 1,300,000 | | | | 1,300,000 | |
GTP Notes(3) | | | 4,935 | | | | 720,640 | | | | 93,503 | | | | 245,000 | | | | 172,987 | | | | — | | | | 1,237,065 | |
BR Towers Debentures(4) | | | 5,623 | | | | 8,026 | | | | 9,904 | | | | 11,428 | | | | 15,978 | | | | 67,728 | | | | 118,687 | |
BR Towers Credit Facility(4) | | | 1,198 | | | | 2,874 | | | | 2,874 | | | | 2,874 | | | | 2,874 | | | | 3,695 | | | | 16,389 | |
Unison Notes, Series 2010-1 Class C, Series 2010-2 Class C and Series 2010-2 Class F notes(5) | | | — | | | | — | | | | 67,000 | | | | — | | | | — | | | | 129,000 | | | | 196,000 | |
Mexican loan(6) | | | 263,426 | | | | — | | | | — | | | | — | | | | — | | | | — | | | | 263,426 | |
South African Facility(7) | | | 9,448 | | | | 13,145 | | | | 14,788 | | | | 15,610 | | | | 17,253 | | | | 4,889 | | | | 75,133 | |
Colombian Credit Facility(8) | | | 4,180 | | | | 8,360 | | | | 12,539 | | | | 12,539 | | | | 12,539 | | | | 33,439 | | | | 83,596 | |
Shareholder Loans(9) | | | — | | | | — | | | | — | | | | — | | | | 137,655 | | | | — | | | | 137,655 | |
| | | | | | | | | | | | | | | | | | | | | | | | | | | | |
Total American Tower subsidiary debt | | | 288,810 | | | | 753,045 | | | | 200,608 | | | | 787,451 | | | | 359,286 | | | | 1,538,751 | | | | 3,927,951 | |
| | | | | | | | | | | | | | | | | | | | | | | | | | | | |
American Tower Corporation debt: | | | | | | | | | | | | | | | | | | | | | | | | | | | | |
2013 Credit Facility | | | — | | | | — | | | | — | | | | — | | | | — | | | | — | | | | — | |
2013 Term Loan | | | — | | | | — | | | | — | | | | — | | | | 1,500,000 | | | | — | | | | 1,500,000 | |
2014 Credit Facility | | | — | | | | — | | | | — | | | | — | | | | — | | | | 1,100,000 | | | | 1,100,000 | |
4.625% senior notes(10) | | | 600,000 | | | | — | | | | — | | | | — | | | | — | | | | — | | | | 600,000 | |
7.00% senior notes | | | — | | | | — | | | | 500,000 | | | | — | | | | — | | | | — | | | | 500,000 | |
4.50% senior notes | | | — | | | | — | | | | — | | | | 1,000,000 | | | | — | | | | — | | | | 1,000,000 | |
3.40% senior notes | | | — | | | | — | | | | — | | | | — | | | | 1,000,000 | | | | — | | | | 1,000,000 | |
7.25% senior notes | | | — | | | | — | | | | — | | | | — | | | | 300,000 | | | | — | | | | 300,000 | |
5.05% senior notes | | | — | | | | — | | | | — | | | | — | | | | — | | | | 700,000 | | | | 700,000 | |
3.450% senior notes | | | — | | | | — | | | | — | | | | — | | | | — | | | | 650,000 | | | | 650,000 | |
5.90% senior notes | | | — | | | | — | | | | — | | | | — | | | | — | | | | 500,000 | | | | 500,000 | |
4.70% senior notes | | | — | | | | — | | | | — | | | | — | | | | — | | | | 700,000 | | | | 700,000 | |
3.50% senior notes | | | — | | | | — | | | | — | | | | — | | | | — | | | | 1,000,000 | | | | 1,000,000 | |
5.00% senior notes | | | — | | | | — | | | | — | | | | — | | | | — | | | | 1,000,000 | | | | 1,000,000 | |
| | | | | | | | | | | | | | | | | | | | | | | | | | | | |
Total American Tower Corporation debt | | | 600,000 | | | | — | | | | 500,000 | | | | 1,000,000 | | | | 2,800,000 | | | | 5,650,000 | | | | 10,550,000 | |
| | | | | | | | | | | | | | | | | | | | | | | | | | | | |
| | | | | | | | | | | | | | | | | | | | | | | | | | | | |
Contractual Obligations | | 2015 | | | 2016 | | | 2017 | | | 2018 | | | 2019 | | | Thereafter | | | Total | |
Long-term obligations, excluding capital leases | | | 888,810 | | | | 753,045 | | | | 700,608 | | | | 1,787,451 | | | | 3,159,286 | | | | 7,188,751 | | | | 14,477,951 | |
Cash interest expense | | | 550,000 | | | | 517,000 | | | | 485,000 | | | | 399,000 | | | | 315,000 | | | | 654,000 | | | | 2,920,000 | |
Capital lease payments (including interest) | | | 15,589 | | | | 14,049 | | | | 12,905 | | | | 12,456 | | | | 10,760 | | | | 173,313 | | | | 239,072 | |
| | | | | | | | | | | | | | | | | | | | | | | | | | | | |
Total debt service obligations | | | 1,454,399 | | | | 1,284,094 | | | | 1,198,513 | | | | 2,198,907 | | | | 3,485,046 | | | | 8,016,064 | | | | 17,637,023 | |
| | | | | | | | | | | | | | | | | | | | | | | | | | | | |
Operating lease payments(11) | | | 574,438 | | | | 553,864 | | | | 538,405 | | | | 519,034 | | | | 502,847 | | | | 4,214,600 | | | | 6,903,188 | |
Other non-current liabilities(12)(13) | | | 11,082 | | | | 20,480 | | | | 5,705 | | | | 13,911 | | | | 4,186 | | | | 1,860,071 | | | | 1,915,435 | |
| | | | | | | | | | | | | | | | | | | | | | | | | | | | |
Total | | $ | 2,039,919 | | | $ | 1,858,438 | | | $ | 1,742,623 | | | $ | 2,731,852 | | | $ | 3,992,079 | | | $ | 14,090,735 | | | $ | 26,455,646 | |
| | | | | | | | | | | | | | | | | | | | | | | | | | | | |
|
| | | | | | | | | | | | | | | | | | | | | | | | | | | | |
| Contractual Obligations | 2018 | | 2019 | | 2020 | | 2021 | | 2022 | | Thereafter | | Total |
| Long-term debt, including current portion: | | | | | | | | | | | | |
| American Tower Corporation debt: | | | | | | | | | | | | | |
| | 2013 Credit Facility | $ | — |
| | $ | — |
| | $ | — |
| | $ | 2,075.6 |
| | $ | — |
| | $ | — |
| | $ | 2,075.6 |
|
| | Term Loan | — |
| | — |
| | — |
| | — |
| | — |
| | 1,000.0 |
| | 1,000.0 |
|
| | 2014 Credit Facility | — |
| | — |
| | — |
| | — |
| | — |
| | 495.0 |
| | 495.0 |
|
| | 3.40% senior notes | — |
| | 1,000.0 |
| | — |
| | — |
| | — |
| | — |
| | 1,000.0 |
|
| | 2.800% senior notes | — |
| | — |
| | 750.0 |
| | — |
| | — |
| | — |
| | 750.0 |
|
| | 5.050% senior notes | — |
| | — |
| | 700.0 |
| | — |
| | — |
| | — |
| | 700.0 |
|
| | 3.300% senior notes | — |
| | — |
| | — |
| | 750.0 |
| | — |
| | — |
| | 750.0 |
|
| | 3.450% senior notes | — |
| | — |
| | — |
| | 650.0 |
| | — |
| | — |
| | 650.0 |
|
| | 5.900% senior notes | — |
| | — |
| | — |
| | 500.0 |
| | — |
| | — |
| | 500.0 |
|
| | 2.250% senior notes | — |
| | — |
| | — |
| | — |
| | 600.0 |
| | — |
| | 600.0 |
|
| | 4.70% senior notes | — |
| | — |
| | — |
| | — |
| | 700.0 |
| | — |
| | 700.0 |
|
| | 3.50% senior notes | — |
| | — |
| | — |
| | — |
| | — |
| | 1,000.0 |
| | 1,000.0 |
|
| | 3.000% senior notes | — |
| | — |
| | — |
| | — |
| | — |
| | 700.0 |
| | 700.0 |
|
| | 5.00% senior notes | — |
| | — |
| | — |
| | — |
| | — |
| | 1,000.0 |
| | 1,000.0 |
|
| | 1.375% senior notes | — |
| | — |
| | — |
| | — |
| | — |
| | 600.2 |
| | 600.2 |
|
| | 4.000% senior notes | — |
| | — |
| | — |
| | — |
| | — |
| | 750.0 |
| | 750.0 |
|
| | 4.400% senior notes | — |
| | — |
| | — |
| | — |
| | — |
| | 500.0 |
| | 500.0 |
|
| | 3.375% senior notes | — |
| | — |
| | — |
| | — |
| | — |
| | 1,000.0 |
| | 1,000.0 |
|
| | 3.125% senior notes | — |
| | — |
| | — |
| | — |
| | — |
| | 400.0 |
| | 400.0 |
|
| | 3.55% senior notes | — |
| | — |
| | — |
| | — |
| | — |
| | 750.0 |
| | 750.0 |
|
| | 3.600% senior notes | — |
| | — |
| | — |
| | — |
| | — |
| | 700.0 |
| | 700.0 |
|
| Total American Tower Corporation debt | — |
| | 1,000.0 |
| | 1,450.0 |
| | 3,975.6 |
| | 1,300.0 |
| | 8,895.2 |
| | 16,620.8 |
|
| | American Tower subsidiary debt: | | | | | | | | | | | |
| | Series 2013-1A securities (1) | 500.0 |
| | — |
| | — |
| | — |
| | — |
| | — |
| | 500.0 |
|
| | Series 2013-2A securities (2) | — |
| | — |
| | — |
| | — |
| | — |
| | 1,300.0 |
| | 1,300.0 |
|
| | Series 2015-1 notes (3) | — |
| | — |
| | 350.0 |
| | — |
| | — |
| | — |
| | 350.0 |
|
| | Series 2015-2 notes (4) | — |
| | — |
| | — |
| | — |
| | — |
| | 525.0 |
| | 525.0 |
|
| | India indebtedness (5) | 196.8 |
| | 59.1 |
| | 138.7 |
| | 33.0 |
| | 33.0 |
| | 52.1 |
| | 512.7 |
|
| | India preference shares (6) | — |
| | — |
| | 26.1 |
| | — |
| | — |
| | — |
| | 26.1 |
|
| | Shareholder loans (7) | — |
| | 66.5 |
| | — |
| | — |
| | — |
| | 34.1 |
| | 100.6 |
|
| | Other subsidiary debt (8) | 53.9 |
| | 49.1 |
| | 52.4 |
| | 29.6 |
| | 45.2 |
| | 17.5 |
| | 247.7 |
|
| Total American Tower subsidiary debt | 750.7 |
|
| 174.7 |
|
| 567.2 |
|
| 62.6 |
|
| 78.2 |
|
| 1,928.7 |
|
| 3,562.1 |
|
| Long-term obligations, excluding capital leases | 750.7 |
|
| 1,174.7 |
| | 2,017.2 |
| | 4,038.2 |
| | 1,378.2 |
| | 10,823.9 |
| | 20,182.9 |
|
| Cash interest expense | 720.2 |
| | 674.4 |
| | 610.3 |
| | 502.9 |
| | 385.3 |
| | 721.7 |
| | 3,614.8 |
|
| Capital lease payments (including interest) | 34.2 |
| | 30.5 |
| | 25.9 |
| | 21.4 |
| | 17.7 |
| | 166.5 |
| | 296.2 |
|
| Total debt service obligations | 1,505.1 |
| | 1,879.6 |
| | 2,653.4 |
| | 4,562.5 |
| | 1,781.2 |
| | 11,712.1 |
| | 24,093.9 |
|
| Operating lease payments (9) | 923.5 |
| | 887.1 |
| | 847.9 |
| | 810.8 |
| | 768.4 |
| | 6,533.3 |
| | 10,771.0 |
|
| Other non-current liabilities (10)(11) | 11.1 |
| | 10.7 |
| | 14.6 |
| | 7.1 |
| | 1.7 |
| | 3,038.6 |
| | 3,083.8 |
|
| Total | $ | 2,439.7 |
| | $ | 2,777.4 |
| | $ | 3,515.9 |
| | $ | 5,380.4 |
| | $ | 2,551.3 |
| | $ | 21,284.0 |
| | $ | 37,948.7 |
|
_______________
| |
| (1) | Represents anticipated repayment date; final legal maturity date is March 15, 2043. |
| |
| (2) | Represents anticipated repayment date; final legal maturity date is March 15, 2048. |
| |
| (3) | In connection with our acquisition of MIPT on October 1, 2013, we assumed approximately $1.49 billion aggregate principal amount of secured notes, $250.0 million of which we repaid in August 2014. The GTP Notes haveRepresents anticipated repayment dates beginningdate; final legal maturity is June 15, 2016.2045. |
| |
| (4) | Assumed in connection with our acquisition of BR Towers and denominated in BRL. The BR Towers Debenture amortizes through October 2023. The BR Towers Credit Facility amortizes through JanuaryRepresents anticipated repayment date; final legal maturity is June 15, 2022.2050. |
| |
| (5) | AssumedDenominated in INR. Debt includes India working capital facility, remaining debt assumed by us in connection with the UnisonViom Acquisition and have anticipated repayment dates of April 15, 2017, April 15, 2020 and April 15, 2020, respectively, and a final maturity date of April 15, 2040.debt that has been entered into by ATC TIPL. |
| |
| (6) | Denominated in MXN.Mandatorily redeemable preference shares classified as debt. |
(7) | Denominated in ZAR and amortizes through March 31, 2020. |
(8) | Denominated in COP and amortizes through April 24, 2021. |
(9)(7) | Reflects balances owed to our joint venture partners in Ghana and Uganda. The Ghana loan is denominated in GHS and the Uganda loan is denominated in USD.UGX. |
| |
| (8) | Includes the BR Towers debentures, which are denominated in BRL and amortize through October 15, 2023, the South African credit facility, which is denominated in ZAR and amortizes through December 17, 2020, the Colombian credit facility, which is denominated in COP and amortizes through April 24, 2021 and the Brazil credit facility, which is denominated in BRL and matures on January 15, 2022. |
(10) | On February 11, 2015, we redeemed all of the outstanding 4.625% Notes in accordance with the terms thereof. |
(11)(9) | Includes payments under non-cancellable initial terms, as well as payments for certain renewal periods at our option, which we expect to renew because failure to renew could result in a loss of the applicable communications sites and related revenues from tenant leases. |
(12) | |
| (10) | Primarily represents our asset retirement obligations and excludes certain other non-current liabilities included in our consolidated balance sheet, primarily our straight-line rent liability for which cash payments are included in operating lease payments and unearned revenue that is not payable in cash. |
(13) | |
| (11) | Excludes $26.6$94.8 million of liabilities for unrecognized tax positions and $24.9$29.0 million of accrued income tax related interest and penalties included in our consolidated balance sheet as we are uncertain as to when and if the amounts may be settled. Settlement of such amounts could require the use of cash flows generated from operations. We expect the unrecognized tax benefits to change over the next 12 months if certain tax matters ultimately settle with the applicable taxing jurisdiction during this timeframe. However, based on the status of these items and the amount of uncertainty associated with the outcome and timing of audit settlements, we are currently unable to estimate the impact of the amount of such changes, if any, to previously recorded uncertain tax positions. |
Off-Balance Sheet Arrangements. We have no material off-balance sheet arrangements as defined in Item 303(a)(4)(ii) of SEC Regulation S-K.Interest Rate Swap Agreements. We have entered into interest rate swap agreements to manage our exposure to variability in interest rates on debt in Colombia and South Africa. All of our interest rate swap agreements have been designated as cash flow hedges and have an aggregate notional amount of $79.9 million, interest rates ranging from 5.74% to 7.83% and expiration dates through April 2021. In February 2014, we repaid the Costa Rica Loan and subsequently terminated the associated interest rate swap agreements. Additionally, in connection with entering into the Colombian Credit Facility in October 2014, we terminated our pre-existing interest rate
swap agreement and entered into a new interest rate swap agreement with an aggregate notional value of 100.0 billion COP (approximately $41.8 million).
Factors Affecting Sources of Liquidity
OOurur liquidity is dependentdepends on our ability to generate cash flow from operating activities, borrow funds under our credit facilities and maintain compliance with the contractual agreements governing our indebtedness. We believe that the debt agreements discussed below represent our material debt agreements that contain covenants, our compliance with which would be material to an investor’s understanding of our financial results and the impact of those results on our liquidity.
Internally Generated Funds. Because the majority of our tenant leases are multi-yearmultiyear contracts, a significant majority of the revenues generated by our rental and managementproperty operations as of the end of 20142017 is recurring revenue that we should continue to receive in future periods. Accordingly, a key factor affecting our ability to generate cash flow from operating activities is to maintain this recurring revenue and to convert it into operating profit by minimizing operating costs and fully achieving our operating efficiencies. In addition, our ability to increase cash flow from operating activities is dependentdepends upon the demand for our communications sites and our related services and our ability to increase the utilization of our existing communications sites.
Restrictions Under Loan Agreements Relating to Our Credit Facilities. Facilities. The loan agreements for the 20142013 Credit Facility, the 20132014 Credit Facility and the 2013 Term Loan contain certain financial and operating covenants and other restrictions applicable to us and our subsidiaries that are not designated as unrestricted subsidiaries on a consolidated basis. These restrictions include limitations on additional debt, distributions and dividends, guaranties, sales of assets and liens. The loan agreements also contain covenants that establish three financial tests with which we and our restricted subsidiaries must comply related to (i) total leverage (ii)and senior secured leverage, and (iii) interest coverage, as set forth below. As of December 31, 2014, we were in compliance with each of these covenants.Consolidated Total Leverage Ratio: This ratio requires that we not exceed a ratio of Total Debt to Adjusted EBITDA (each as defined in the loan agreements) of 6.00 to 1.00. Based on our financial performance for the twelve months ended December 31, 2014, we could incur approximately $1.7 billion of additional indebtedness and still remain in compliance with this ratio. In addition, if we maintain our existing debt levels and our expenses do not change materially from current levels, our revenues could decrease by approximately $291 million and we would still remain in compliance with this ratio. On February 20, 2015, we entered into amendments to the 2013 Term Loan, 2013 Credit Facility and 2014 Credit Facility, pursuant to which this ratio will be increased upon the closing of the Proposed Verizon Transaction.
Consolidated Senior Secured Leverage Ratio: This ratio requires that we not exceed a ratio of Senior Secured Debt to Adjusted EBITDA (each as defined in the loan agreements) of 3.00 to 1.00. Based on our financial performance for the twelve months ended December 31, 2014, we could incur approximately $4.5 billion of additional Senior Secured Debt and still remain in compliance with the current ratio (effectively, however, this ratio would be limited to $1.7 billion to remain in compliance with other covenants). In addition, if we maintain our existing Senior Secured Debt levels and our expenses do not change materially from current levels, our revenues could decrease by approximately $1.5 billion and we would still remain in compliance with the current ratio.
Interest Coverage Ratio:table below. In the event that our debt ratings fall below investment grade, we will be required tomust maintain aan interest coverage ratio of Adjusted EBITDA to Interest Expense (each as defined in the applicable loan agreements)agreement) of not less than 2.50 to at least 2.50:1.00. Based on our financial performance for the twelve months endedAs of December 31, 2014, our interest expense, which was $549 million for that period, could increase by approximately $532 million and2017, we would still remainwere in compliance with each of these covenants.
|
| | | | | | |
| | | | Compliance Tests For 12 Months Ended December 31, 2017 ($ in billions) |
| | Ratio (1) | | Additional Debt Capacity Under Covenants (2) | | Capacity for Adjusted EBITDA Decrease Under Covenants (3) |
| Consolidated Total Leverage Ratio | | Total Debt to Adjusted EBITDA ≤ 6.00:1.00 | | ~ $5.0 | | ~ $0.8 |
| Consolidated Senior Secured Leverage Ratio | | Senior Secured Debt to Adjusted EBITDA ≤ 3.00:1.00 | | ~ $9.0 (4) | | ~ $3.0 (4) |
_______________
(1) Each component of the ratio as defined in the applicable loan agreement.
(2) Assumes no change to Adjusted EBITDA.
(3) Assumes no change to our debt levels.
(4) Effectively, however, additional Senior Secured Debt under this
ratio. In addition, if our expenses do not change materially from current levels, our revenues could decrease by approximately $1.3 billion and weratio would
still remain in compliance with this ratio.be limited to the capacity under the Consolidated Total Leverage Ratio.
The loan agreements for our credit facilities also contain reporting and information covenants that require us to provide financial and operating information
to the lenders within certain time periods. If we are unable to provide the required information on a timely basis, we would be in breach of these covenants.
Any failure
Failure to comply with the financial maintenance tests and
operatingcertain other covenants of the loan agreements for our credit facilities
wouldcould not only prevent us from being able to borrow additional funds under these credit facilities, but
wouldmay constitute a default under these credit facilities, which could result in, among other things, the amounts outstanding, including all accrued interest and unpaid fees, becoming immediately due and payable. If this were to occur, we may not have sufficient cash on hand to repay such indebtedness. The key factors affecting our ability to comply with the debt covenants described above are our financial performance relative to the financial maintenance tests defined in the loan agreements for these credit facilities and our ability to fund our debt service obligations. Based upon our current expectations, we believe our operating results during the next
twelve12 months will be sufficient to comply with these covenants.
Restrictions Under Agreements Relating to the 2015 Securitization and the GTP Notes2013 Securitization. The First Amendedindenture and Restated Loanrelated supplemental indentures governing the American Tower Secured Revenue Notes, Series 2015-1, Class A (the “Series 2015-1 Notes”) and Security Agreementthe American Tower Secured Revenue Notes, Series 2015-2, Class A (the “Series 2015-2 Notes,” and, together with the Series 2015-1 Notes, the “2015 Notes”) issued by GTP Acquisition Partners I, LLC (“GTP Acquisition Partners”) in the 2015 Securitization and the loan agreement related to the 2013 Securitization (the “Loan Agreement”) and indentures governing the GTP Notes (the “GTP Indentures”) include certain financial ratios and operating covenants and other restrictions customary for transactions subject to rated securitizations. Among other things, American Tower Asset Sub, LLC and American Tower Asset Sub II, LLC (the “Borrowers”(together, the “AMT Asset Subs”), and the GTP IssuersAcquisition Partners are prohibited from incurring other indebtedness for borrowed money or further encumbering their assets, subject to customary carve-outs for ordinary course trade payables and permitted encumbrances (as defined in the Loan Agreement or the applicable GTP Indenture)agreement). Under the terms of the agreements, amounts due will be paid from the cash flows generated by the assets securing the 2015 Notes or the assets securing the nonrecourse loan relating tothat secures the Secured Tower Revenue Securities, Series 2013-1A and Series 2013-2A issued in the 2013 Securitization (the “Loan”) or the GTP Notes (as applicable), as applicable, which must be deposited into certain reserve accounts, and thereafter distributed solely pursuant to the terms of the applicable agreement. On a monthly basis, after payment of all required amounts under the applicable agreement, subject to the conditions described in the table below, the excess cash flows generated from the operation of thesuch assets securing the Loan or the GTP Notes are released to the BorrowersGTP Acquisition Partners or the AMT Asset Subs, as applicable, GTP Issuer, which can then be distributed to, and used by, us. During the year endedAs of December 31, 2014,2017, $107.3 million held in such reserve accounts was classified as restricted cash.
Certain information with respect to the
Borrowers distributed excess cash to us of $715.7 million2015 Securitization and the
GTP Issuers have distributed excess cash to us of $164.1 million.In order to distribute this excess cash flow to us, the Borrowers and the GTP Issuers must maintain a specified2013 Securitization is set forth below. The debt service coverage ratio (“DSCR”), is generally calculated as the ratio of the net cash flow (as defined in the Loan Agreement or the applicable GTP Indenture)agreement) to the amount of interest, servicing fees and trustee fees required to be paid over the succeeding twelve12 months on the principal amount of the Loan2015 Notes or the principal amount of the GTP NotesLoan, as applicable, that will be outstanding on the payment date following such date of determination, plusdetermination.
|
| | | | | | | | |
| | Issuer or Borrower | Notes/Securities Issued | Conditions Limiting Distributions of Excess Cash | Excess Cash Distributed During Year Ended December 31, 2017 | DSCR as of December 31, 2017 | Capacity for Decrease in Net Cash Flow Before Triggering Cash Trap DSCR (1) | Capacity for Decrease in Net Cash Flow Before Triggering Minimum DSCR (1) |
| Cash Trap DSCR | Amortization Period |
| | | | | | | | | |
| 2015 Securitization | GTP Acquisition Partners | American Tower Secured Revenue Notes, Series 2015-1 and Series 2015-2 | 1.30x, Tested Quarterly (2) | (3)(4) | $195.4 | 8.42x | $190.0 | $194.0 |
| 2013 Securitization | AMT Asset Subs | Secured Tower Revenue Securities, Series 2013-1A and Series 2013-2A | 1.30x, Tested Quarterly (2) | (3)(5) | $548.2 | 12.14x | $520.9 | $528.1 |
_______________
| |
| (1) | Based on the net cash flow of the applicable issuer or borrower as of December 31, 2017 and the expenses payable over the next 12 months on the 2015 Notes or the Loan, as applicable. |
| |
| (2) | Once triggered, a Cash Trap DSCR condition continues to exist until the DSCR exceeds the Cash Trap DSCR for two consecutive calendar quarters. During a Cash Trap DSCR condition, all cash flow in excess of amounts required to make debt service payments, fund required reserves, pay management fees and budgeted operating expenses and make other payments required under the applicable transaction documents, referred to as excess cash flow, will be deposited into a reserve account (the “Cash Trap Reserve Account”) instead of being released to the applicable issuer or borrower. |
| |
| (3) | An amortization period commences if the DSCR is equal to or below 1.15x (the “Minimum DSCR”) at the end of any calendar quarter and continues to exist until the DSCR exceeds the Minimum DSCR for two consecutive calendar quarters. |
| |
| (4) | No amortization period is triggered if the outstanding principal amount of a series has not been repaid in full on the applicable anticipated repayment date. However, in such event, additional interest will accrue on the unpaid principal balance of the applicable series, and such series will begin to amortize on a monthly basis from excess cash flow. |
| |
| (5) | An amortization period exists if the outstanding principal amount has not been paid in full on the applicable anticipated repayment date and continues to exist until such principal has been repaid in full. |
A failure to meet the
amounts payable for trustee and servicing fees. Ifnoted DSCR tests could prevent GTP Acquisition Partners or the
DSCR with respect to the Secured Tower Revenue Securities, Series 2013-1A and Series 2013-2A issued in our Securitization (the “Securities”) or any series of GTP Notes issued by GTP Partners is equal to or below 1.30x (the “Cash Trap DSCR”) at the end of any calendar quarter and it continues for two consecutive calendar quarters, or if the DSCR with respect to any series of GTP Notes issued by GTP Cellular Sites is equal to or below the Cash Trap DSCR at the end of any calendar month and it continues for two consecutive calendar months, then allAMT Asset Subs from distributing excess cash flow
in excess of amounts required to
make debt service payments,us, which could affect our ability to fund
required reserves, pay management feesour capital expenditures, including tower construction and
budgeted operating expensesacquisitions, meet REIT distribution requirements and make
other payments required with respect to the particular series of Securities or GTP Notes under the Loan Agreement or GTP Indentures, as applicable, will be deposited into reserve accounts instead of being released to the Borrowers or the GTP Issuers. The funds in the reserve accounts will not be released to the Borrowers or GTP Partners for distribution to us unless the DSCR with respect to such series of Securities or GTP Notes exceeds the Cash Trap DSCR for two consecutive calendar quarters. Likewise, the funds in the reserve account will not be released to GTP Cellular Sites for distribution to us unless the DSCR with respect to such series of GTP Notes exceeds the Cash Trap DSCR for two consecutive calendar months.Additionally,preferred stock dividend payments. During an “amortization period,” commences as of the end of any calendar quarter with respect to the Securities and the series of GTP Notes issued by GTP Partners, and as of the end of any calendar month with respect to the series of GTP Notes issued by GTP Cellular Sites, if the DSCR of such series equals or falls below 1.15x (the “Minimum DSCR”). The “amortization period” will continue to exist until the end of any calendar quarter with respect to the Securities and the series of GTP Notes issued by GTP Partners for which the DSCR exceeds the Minimum DSCR for two consecutive calendar quarters. Similarly, the “amortization period” will continue to exist until the end of any calendar month with respect to the series of GTP Notes issued by GTP Cellular Sites, for which the DSCR exceeds the Minimum DSCR for two consecutive calendar months.
If on the anticipated repayment date, the outstanding principal amount with respect to any series of the GTP Notes or the component of the Loan corresponding to the applicable subclass of the Securities has not been paid in full, an “amortization period” will continue until such principal amount of the applicable series of GTP Notes or the component of the Loan corresponding to the applicable subclass of Securities is repaid in full.
During an amortization period, all excess cash flow and any amounts then in the reserve accounts because theapplicable Cash Trap DSCR was not metReserve Account would be applied to pay principal of the applicable subclass of Securities2015 Notes or series of GTP Notesthe Loan, as applicable, on each monthly payment date, and so would not be available for distribution to us. Further, additional interest will begin to accrue with respect to any series of the 2015 Notes or subclass of the Securities or series of GTP NotesLoan from and after the anticipated repayment date at a per annum rate determined in accordance with the Loan Agreement orapplicable agreement. With respect to the GTP Indentures, as applicable.
Consequently, a failure to meet2015 Notes, upon the noted DSCR tests could prevent the Borrowers or GTP Issuers from distributing excess cash flow to us, which could affect our ability to fund our capital expenditures, including tower construction and acquisitions, meet REIT distribution requirements, make Mandatory Convertible Preferred Stock dividend payments and fund our stock repurchase program. If the Borrowers were to default on the Loan, the trustee could seek to foreclose upon or otherwise convert the ownership of the 5,195 wireless and broadcast communications towers that secure the Loan (the “Secured Towers”), in which case we could lose the Secured Towers and the revenue associated with those towers. In addition, upon occurrence and during an event of default, the applicable trustee may, in its discretion or at the direction of holders of more than 50% of the aggregate outstanding principal of any series of GTPthe 2015 Notes, declare such series of GTP2015 Notes immediately due and payable, in which case any excess cash flow would need to be used to pay holders of such GTP Notes.notes. Furthermore, if GTP Acquisition Partners or the GTP IssuersAMT Asset Subs were to default on a series of the GTP2015 Notes or the Loan, the applicable trustee may demand, collect, take possessionseek to foreclose upon or otherwise convert the ownership of receive, settle, compromise, adjust, sue for, foreclose or realize upon all or any portion of the 2,845 towers and 1,035 property interests and other related assets that secure2015 Secured Sites or the GTP Notes (the “GTP2013 Secured Sites”) securing such series of the GTP Notes,Towers, respectively, in which case we could lose the GTP Secured Sitessuch sites and the revenue associated with those assets.
As of December 31, 2014, the Borrowers’ DSCR was 10.22x. Based on the Borrowers’ net cash flow for the calendar quarter ended December 31, 2014 and the amount of interest, servicing fees and trustee fees payable over the succeeding twelve months on the Loan, the Borrowers could endure a reduction of approximately $428.6 million in net cash flow before triggering the Cash Trap DSCR, and approximately $435.8 million in net cash flow before triggering the Minimum DSCR. As of December 31, 2014, the DSCR of GTP Partners and GTP Cellular Sites were 2.88x and 2.54x, respectively. Based on the net cash flow of GTP Partners and GTP Cellular Sites for the calendar quarter ended December 31, 2014 and the amount of interest, servicing fees and trustee fees payable over the succeeding twelve months on the applicable series of GTP Notes, GTP Partners and GTP Cellular Sites could endure a reduction of approximately $68.7 million and $16.4 million, respectively, in net cash flow before triggering the Cash Trap DSCR, and approximately $75.2 million and $18.4 million, respectively, in net cash flow before triggering the Minimum DSCR.
As discussed above, we use our available liquidity and seek new sources of liquidity to
refinance and repurchase our outstanding indebtedness. In addition, in order to fund capital expenditures, future growth and expansion initiatives,
and satisfy our
REIT distribution requirements
we may need to raise additional capitalthrough financing activities.and repay or repurchase our debt. If we determine that it is desirable or necessary to raise additional capital, we may be unable to do so, or such additional financing may be prohibitively expensive or restricted by the terms of our outstanding indebtedness. If we are unable to raise capital when our needs arise, we may not be able to fund capital expenditures, future growth and expansion initiatives, satisfy our REIT distribution requirements and debt service obligations, pay Mandatory Convertible Preferred Stockpreferred stock dividends or refinance our existing indebtedness.
In addition, our liquidity depends on our ability to generate cash flow from operating activities. As set forth under Item 1A of this Annual Report under the caption “Risk Factors,” we derive a substantial portion of our revenues from a small number of tenants and, consequently, a failure by a significant tenant to perform its contractual obligations to us could adversely affect our cash flow and liquidity.
Critical Accounting Policies and Estimates
Management’s discussion and analysis of financial condition and results of operations are based upon our consolidated financial statements, which have been prepared in accordance with GAAP. The preparation of these financial statements requires us to make estimates and assumptions that affect the reported amounts of assets, liabilities, revenues and expenses, as well as related disclosures of contingent assets and liabilities. We evaluate our policies and estimates on an ongoing basis. Management bases its estimates on historical experience and various other assumptions that are believed to be reasonable under the circumstances, the results of which form the basis for making judgments about the carrying amounts of assets and liabilities that are not readily apparent from other sources. Actual results may differ from these estimates under different assumptions or conditions.
We have reviewed our policies and estimates to determine our critical accounting policies for the year ended December 31,
2014.2017. We have identified the following policies as critical to an understanding of our results of operations and financial condition. This is not a comprehensive list of our accounting policies. See note 1 to our consolidated financial statements included in this Annual Report for a summary of our significant accounting policies. In many cases, the accounting treatment of a particular transaction is specifically dictated by GAAP, with no need for management’s judgment in its application. There are also areas in which management’s judgment in selecting any available alternative would not produce a materially different result.
| • | | Impairment of Assets—Assets Subject to Depreciation and Amortization: We review long-lived assets for impairment at least annually or whenever events, changes in circumstances or other indicators or evidence indicate that the carrying amount of our assets may not be recoverable.
|
Impairment of Assets—Assets Subject to Depreciation and Amortization: We review long-lived assets for impairment at least annually or whenever events, changes in circumstances or other indicators or evidence indicate that the carrying amount of our assets may not be recoverable.
We review our tower portfolio and network location intangible assets for indicators of impairment at the lowest level of identifiable cash flows, typically at an individual tower basis. Possible indicators include a tower not having current tenant leases or having expenses in excess of revenues. A cash flow modeling approach is utilized to assess recoverability and incorporates, among other items, the tower location, the tower location demographics, the timing of additions of new tenants, lease rates and estimated length of tenancy and ongoing cash requirements.
We review our
customer-relatedtenant-related intangible assets on a
customertenant by
customertenant basis for indicators of impairment, such as high levels of turnover or attrition, non-renewal of a significant number of contracts or the cancellation or termination of a relationship. We assess recoverability by determining whether the carrying amount of the
customer-relatedtenant-related intangible assets will be recovered
primarily through projected undiscounted
future cash flows.
If the sum of the estimated undiscounted future cash flows of our long-lived assets is less than the carrying amount of the assets, an impairment loss may be recognized. An impairment loss would be based on the fair value of the asset, which is based on an estimate of discounted future cash flows to be provided from the asset. We record any related impairment charge in the period in which we identify such impairment.
| • | | Impairment of Assets—Goodwill: We review goodwill for impairment at least annually (as of December 31) or whenever events or circumstances indicate the carrying amount of an asset may not be recoverable.
|
In October 2017, one of our tenants in Asia, Tata Teleservices, informed the Department of Telecommunications in India of its intent to exit the wireless telecommunications business and announced plans to transfer its business to another telecommunications provider.
We considered these recent developments regarding these events when conducting our annual impairment test for the Tata Teleservices tenant relationship, which did not result in an impairment since the estimated probability-weighted undiscounted cash flows were in excess of the carrying value of this asset by approximately $33.5 million, or 7%.
Key assumptions included in the undiscounted cash flows were future revenue projections, estimates of ongoing tenancies, operating margins and the probability weightings assigned to the future cash flow scenarios. For this tenant relationship intangible asset, we performed a sensitivity analysis on our significant assumptions and determined that a 7% reduction on projected cash flows, which we determined to be reasonable, would impact our conclusion that the undiscounted future cash flows to be generated from the tenant relationship exceeds its carrying value.
We will continue to monitor the status of these developments, as it is possible that the estimated future cash flows may differ from current estimates and changes in estimated cash flows from Tata Teleservices could have an impact on previously recorded tangible and intangible assets, including amounts originally recorded as tenant-related intangibles, which have a current net book value of $436.4 million.
Impairment of Assets—Goodwill: We review goodwill for impairment at least annually (as of December 31) or whenever events or circumstances indicate the carrying amount of an asset may not be recoverable.
Goodwill is recorded in the applicable segment and assessed for impairment at the reporting unit level. We utilize the two step impairment test
when testing goodwill for impairment and
we employ a discounted cash flow
analysis.analysis when testing goodwill for impairment. The key assumptions utilized in the discounted cash flow analysis include current operating performance, terminal sales growth rate, management’s expectations of future operating results and cash requirements, the current weighted average cost of capital and an expected tax rate. Under the first step of this test, we compare the fair value of the reporting unit, as calculated under an income approach using future discounted cash flows, to the carrying amount of the applicable reporting unit. If the carrying amount exceeds the fair value, we conduct the second step of this test, in which the implied fair value of the applicable reporting unit’s goodwill is compared to the carrying amount of that goodwill. If the carrying amount of goodwill exceeds its implied fair value, an impairment loss would be recognized for the amount of the excess.
During the year ended December 31, 2014,2017, no potential impairment was identified underas the first step of the test. The fair value of each of our reporting units was in excess of its carrying amount. The fair value of our India reporting unit, which is based on the present value of forecasted future value cash flows (the income approach) exceeded the carrying value by approximately $99.1 million, or 3%. As a result of the telecommunications carrier consolidation occurring in the India market, we lowered our discounted cash flow projections, which increases the sensitivity of these projections to changes in the key assumptions used in determining the fair value of the India reporting unit as of December 31, 2017. Key assumptions include future revenue growth rates and operating margins, capital expenditures, terminal period growth rate and the weighted-average cost of capital, which were determined considering historical data and current assumptions related to the impacts of the carrier consolidation.
For this reporting unit, we performed a sensitivity analysis on our significant assumptions and determined that (i) a 6% reduction on projected revenues, (ii) a 21 basis point increase in the weighted-average cost of capital or (iii) a 10% reduction in terminal sales growth rate, individually, each of which we determined to be reasonable, would impact our conclusion that the fair value of the India reporting unit exceeds its carrying value. Events that could negatively affect our India reporting units financial results include increased customer attrition exceeding our forecast resulting from the ongoing carrier consolidation, carrier tenant bankruptcies, and other factors set forth in Item 1A of this Annual Report under the caption “Risk Factors.”
The carrying value of goodwill in the India reporting unit was $1,095.0 million as of December 31, 2017, which represents 19% of our consolidated balance of $5,638.4 million.
Asset Retirement Obligations: When required, we recognize the fair value of obligations to remove our tower assets and remediate the leased land upon which certain of our tower assets are located. Generally, the associated retirement costs are capitalized as part of the carrying amount by a substantial margin. | • | | Asset Retirement Obligations: When required, we recognize the fair value of obligations to remove our tower assets and remediate the leased land upon which certain of our tower assets are located. Generally, the associated retirement costs are capitalized as part of the carrying amount of the related tower assets and depreciated over their estimated useful lives and the liability is accreted through the obligation’s estimated settlement date.
|
of the related tower assets and depreciated over their estimated useful lives and the liability is accreted through the obligation’s estimated settlement date.
We updated our assumptions used in estimating our aggregate asset retirement obligation, which resulted in a net increase in the estimated obligation of
$13.2$68.3 million during the year ended December 31,
2014.2017. The change in
20142017 primarily resulted from changes in timing of certain settlement date and cost assumptions. Fair value estimates of liabilities for asset retirement obligations generally involve discounting of estimated future cash flows. Periodic accretion of such liabilities due to the passage of time is included in Depreciation, amortization and accretion
expense in the consolidated statements of operations. The significant assumptions used in estimating our aggregate asset retirement obligation are: timing of tower removals; cost of tower removals; timing and number of land lease renewals; expected inflation rates; and credit-adjusted risk-free interest rates that approximate our incremental borrowing rate. While we feel the assumptions are appropriate, there can be no assurances that actual costs and the probability of incurring obligations will not differ from these estimates. We will continue to review these assumptions periodically and we may need to adjust them as necessary.
| • | | Acquisitions: For those acquisitions that meet the definition of a business combination, we apply the acquisition method of accounting where assets acquired and liabilities assumed are recorded at fair value at the date of each acquisition, and the results of operations are included with those of the Company from the dates of the respective acquisitions. Any excess of the purchase price paid over the amounts recognized for assets acquired and liabilities assumed is recorded as goodwill. We continue to evaluate acquisitions for a period not to exceed one year after the applicable acquisition date of each transaction to determine whether any additional adjustments are needed to the allocation of the purchase price paid for the assets acquired and liabilities assumed. The fair value of the assets acquired and liabilities assumed is typically determined by using either estimates of replacement costs or discounted cash flow valuation methods. When determining the fair value of tangible assets acquired, we must estimate the cost to replace the asset with a new asset taking into consideration such factors as age, condition and the economic useful life of the asset. When determining the fair value of intangible assets acquired, we must estimate the applicable discount rate and the timing and amount of future customer cash flows, including rate and terms of renewal and attrition.
|
| • | | Revenue Recognition: Our revenue from leasing arrangements, including fixed escalation clauses present in non-cancellable lease arrangements, is reported on a straight-line basis over the term of the respective leases when collectibility is reasonably assured. Escalation clauses tied to the Consumer Price Index or other inflation-based indices, and other incentives present in lease agreements with our
|
| tenants are excluded from the straight-line calculation. Total rental and management straight-line revenues for the years ended December 31, 2014, 2013 and 2012 approximated $123.7 million, $147.7 million and $165.8 million, respectively. Amounts billed upfront in connection with the execution of lease agreements are initially deferred and reflected in Unearned revenue in the accompanying consolidated balance sheets and recognized as revenue over the terms of the applicable leases. Amounts billed or received for services prior to being earned are deferred and reflected in Unearned revenue in the accompanying consolidated balance sheets until the criteria for recognition have been met.
|
Acquisitions: We evaluate each of our acquisitions under the accounting guidance framework to determine whether to treat an acquisition as an asset acquisition or a business combination. For those transactions treated as asset acquisitions, the purchase price is allocated to the assets acquired, with no recognition of goodwill. For those acquisitions that meet the definition of a business combination, we apply the acquisition method of accounting where assets acquired and liabilities assumed are recorded at fair value at the date of each acquisition, and the results of operations are included with our results from the dates of the respective acquisitions. Any excess of the purchase price paid over the amounts recognized for assets acquired and liabilities assumed is recorded as goodwill. We continue to evaluate acquisitions for a period not to exceed one year after the applicable acquisition date of each transaction to determine whether any additional adjustments are needed to the allocation of the purchase price paid for the assets acquired and liabilities assumed. The fair value of the assets acquired and liabilities assumed is typically determined by using either estimates of replacement costs or discounted cash flow valuation methods. When determining the fair value of tangible assets acquired, we must estimate the cost to replace the asset with a new asset taking into consideration such factors as age, condition and the economic useful life of the asset. When determining the fair value of intangible assets acquired, we must estimate the applicable discount rate and the timing and amount of future tenant cash flows, including rate and terms of renewal and attrition.
Revenue Recognition: Our revenue from leasing arrangements, including fixed escalation clauses present in non-cancellable lease arrangements, is reported on a straight-line basis over the term of the respective leases when collectibility is reasonably assured. Escalation clauses tied to the Consumer Price Index or other inflation-based indices, and other incentives present in lease agreements with our tenants are excluded from the straight-line calculation. Total property straight-line revenues for the years ended December 31, 2017, 2016 and 2015 were $194.4 million, $131.7 million and $155.0 million, respectively. Amounts billed upfront in connection with the execution of lease agreements are initially deferred and reflected in Unearned revenue in the accompanying consolidated balance sheets and recognized as revenue over the terms of the applicable leases. Amounts billed or received for services prior to being earned are deferred and reflected in Unearned revenue in the accompanying consolidated balance sheets until the criteria for recognition have been met.
We derive the largest portion of our revenues, corresponding trade receivables and the related deferred rent asset from a small number of tenants in the telecommunications industry, and approximately 56%with 53% of our revenues are derived from four tenants in the industry.tenants. In addition, we have concentrations of credit risk in certain geographic areas. We mitigate the concentrations of credit risk with respect to notes and trade receivables by actively monitoring the credit worthinesscreditworthiness of our borrowers and
tenants. In recognizing
customertenant revenue we assess the collectibility of both the amounts billed and the portion recognized on a straight-line basis. This assessment takes tenant credit risk and business and industry conditions into consideration to ultimately determine the collectibility of the amounts billed. To the extent the amounts, based on management’s estimates, may not be collectible, recognition is deferred until such point as the uncertainty is resolved. Any amounts that were previously recognized as revenue and subsequently determined to be uncollectible are charged to bad debt expense. Accounts receivable are reported net of allowances for doubtful accounts related to estimated losses resulting from a tenant’s inability to make required payments and allowances for amounts invoiced whose collectibility is not reasonably assured.
| • | | Rent Expense: Many of the leases underlying our tower sites have fixed rent escalations, which provide for periodic increases in the amount of ground rent payable over time. In addition, certain of our tenant leases require us to exercise available renewal options pursuant to the underlying ground lease if the tenant exercises its renewal option. We calculate straight-line ground rent expense for these leases based on the fixed non-cancellable term of the underlying ground lease plus all periods, if any, for which failure to renew the lease imposes an economic penalty to us such that renewal appears to be reasonably assured.
|
| • | | Stock-Based Compensation: The stock-based compensation expense recognized over the service period, which is generally the vesting period, is required to include an estimate of the awards that will not fully vest and be forfeited. The fair value of a stock option is determined using a Black-Scholes option-pricing model that takes into account a number of assumptions at the accounting measurement date including the stock price, the exercise price, the expected life of the option, the volatility of the underlying stock, the expected distributions, and the risk-free interest rate over the expected life of the option. These assumptions are highly subjective and could significantly impact the value of the option and the compensation expense. The fair value of restricted stock units is based on the fair value of our common stock on the grant date. We recognize stock-based compensation in either selling, general, administrative and development expense, costs of operations or as part of the costs associated with the construction of our tower assets.
|
| • | | Income Taxes: Accounting for income taxes requires us to estimate the timing and impact of amounts recorded in our financial statements that may be recognized differently for tax purposes. To the extent that the timing of amounts recognized for financial reporting purposes differs from the timing of recognition for tax reporting purposes, deferred tax assets or liabilities are required to be recorded. Deferred tax assets and liabilities are measured based on the rate at which we expect these items to be reflected in our tax returns, which may differ from the current rate. We do not expect to pay federal taxes on our REIT taxable income.
|
Rent Expense: Many of the leases underlying our tower sites have fixed rent escalations, which provide for periodic increases in the amount of ground rent payable over time. In addition, certain of our tenant leases require us to exercise available renewal options pursuant to the underlying ground lease if the tenant exercises its renewal option. We calculate straight-line ground rent expense for these leases based on the fixed non-cancellable term of the underlying ground lease plus all periods, if any, for which failure to renew the lease imposes an economic penalty to us such that renewal appears to be reasonably assured.
Income Taxes: Accounting for income taxes requires us to estimate the timing and impact of amounts recorded in our financial statements that may be recognized differently for tax purposes. To the extent that the timing of amounts recognized for financial reporting purposes differs from the timing of recognition for tax reporting purposes, deferred tax assets or liabilities are required to be recorded. Deferred tax assets and liabilities are measured based on the rate at which we expect these items to be reflected in our tax returns, which may differ from the current rate. We do not expect to pay federal taxes on our REIT taxable income.
We periodically review our deferred tax assets, and we record a valuation allowance if, based on the available evidence, it is more likely than not that some or all of the deferred tax assets will not be
realized. Management assesses the available positive and negative evidence to estimate if sufficient future taxable income will be generated to use the existing deferred tax assets. Valuation allowances would be reversed as a reduction to the provision for income taxes, if related deferred tax assets are deemed realizable based on changes in facts and circumstances relevant to the assets’ recoverability.
We recognize the benefit of uncertain tax positions when, in management’s judgment, it is more likely than not that positions we have taken in our tax returns will be sustained upon examination, which are measured at the largest amount that is greater than 50% likely of being realized upon settlement. We adjust our tax liabilities when our judgment changes as a result of the evaluation of new information or information not previously available. Due to the complexity of some of these uncertainties, the ultimate resolution may result in a payment that is materially different from our current estimate of the tax liabilities. These differences will be reflected as increases or decreases to income tax expense in the period in which additional information is available or the position is ultimately settled under audit.
The Tax Act significantly changes how the U.S. taxes corporations. The Tax Act contains several key provisions including, among other things, a one-time mandatory deemed repatriation of all post-1986 untaxed foreign earnings and profits, a reduction in the corporate income rate from 35% to 21% for tax years beginning after December 31, 2017 and the introduction of a new U.S. tax on certain off-shore earnings referred to as Global Intangible Low-Taxed Income (“GILTI”).
The SEC staff issued guidance to address the application of GAAP in situations when a registrant does not have the necessary information available, prepared, or analyzed in reasonable detail to complete the accounting for certain income tax effects of the Tax Act and allows the registrant to record provisional amounts during a measurement period not to extend beyond one year from the enactment date. We have recognized the provisional impacts of the Tax Act in our consolidated financial statements for the year ended December 31, 2017. We estimated these amounts to not be material, however, our estimates are provisional and subject to further analysis.
The Financial Accounting Standards Board also provided additional guidance to address the accounting for the effects of the provisions related to the taxation of GILTI, noting that companies should make an accounting policy election to recognize deferred taxes for temporary basis differences expected to reverse as GILTI in future years or to include the tax expense in the year it is incurred. We have not completed our analysis of the effects of the GILTI provisions and will further consider the
earnings of certain non-U.S. subsidiaries to be indefinitely invested outsideaccounting policy election within the
United States on the basis of estimates that future domestic cash generation will be sufficient to meet future domestic cash needs. Should we decide to repatriate the foreign earnings, we may have to adjust the income tax provision in the period we determined that the earnings will no longer be indefinitely invested outside of the United States.permitted measurement period.
Accounting Standards Update
For a discussion of recent accounting standards updates, see note 1 to our consolidated financial statements included in this Annual Report.
|
| |
| ITEM 7A. | QUANTITATIVE AND QUALITATIVE DISCLOSURES ABOUT MARKET RISK |
The following table provides information as of December 31,
20142017 about our market risk exposure associated with changing interest rates. For long-term debt obligations, the table presents principal cash flows by maturity date and average interest rates related to outstanding obligations. For interest rate swaps, the table presents notional principal amounts and weighted-average interest rates (in
thousands,millions, except percentages).
| | | | | | | | | | | | | | | | | | | | | | | | | | | | | | | | |
Long-Term Debt | | 2015 | | | 2016 | | | 2017 | | | 2018 | | | 2019 | | | Thereafter | | | Total | | | Fair Value | |
Fixed Rate Debt(a) | | $ | 614,310 | | | $ | 726,994 | | | $ | 667,726 | | | $ | 1,751,992 | | | $ | 1,547,555 | | | $ | 6,047,260 | | | $ | 11,355,837 | | | $ | 11,827,396 | |
Average Interest Rate(a) | | | 4.66 | % | | | 5.03 | % | | | 6.37 | % | | | 3.44 | % | | | 5.19 | % | | | 4.30 | % | | | | | | | | |
Variable Rate Debt(b) | | $ | 283,314 | | | $ | 31,060 | | | $ | 38,762 | | | $ | 41,108 | | | $ | 1,616,304 | | | $ | 1,206,948 | | | $ | 3,217,496 | | | $ | 3,208,106 | |
Average Interest Rate(b)(c) | | | 5.11 | % | | | 8.87 | % | | | 8.79 | % | | | 8.76 | % | | | 1.81 | % | | | 1.98 | % | | | | | | | | |
| | | | | | | | |
Interest Rate Swaps | | | | | | | | | | | | | | | | | | | | | | | | | | | | | | | | |
Notional Amount | | $ | 6,874 | | | $ | 10,837 | | | $ | 13,759 | | | $ | 14,175 | | | $ | 15,007 | | | $ | 19,226 | | | $ | 79,878 | | | $ | (559 | ) |
Fixed Rate Debt Rate(d) | | | | | | | | | | | | | | | | | | | | | | | | | | | | | | | 10.25 | % |
|
| | | | | | | | | | | | | | | | | | | | | | | | | | | | | | | | |
| Long-Term Debt | 2018 | | 2019 | | 2020 | | 2021 | | 2022 | | Thereafter | | Total | | Fair Value | |
| Fixed Rate Debt (a) | $ | 721.1 |
| | $ | 1,143.5 |
| | $ | 1,981.6 |
| | $ | 1,946.0 |
| | $ | 1,343.5 |
| | $ | 9,395.6 |
| | $ | 16,531.3 |
| | $ | 16,827.9 |
| |
| Weighted-Average Interest Rate (a) | 4.17 | % | | 5.24 | % | | 4.14 | % | | 4.17 | % | | 3.77 | % | | 3.58 | % | | | | | |
| Variable Rate Debt (b) | $ | 53.9 |
| | $ | 49.1 |
| | $ | 52.4 |
| | $ | 2,105.2 |
| | $ | 45.2 |
| | $ | 1,512.5 |
| | $ | 3,818.3 |
| | $ | 3,818.3 |
| |
| Weighted-Average Interest Rate (b)(c) | 8.58 | % | | 8.44 | % | | 8.45 | % | | 2.72 | % | | 8.24 | % | | 2.85 | % | | | | | |
| | | | | | | | | | | | | | | | | |
| Interest Rate Swaps | | | | | | | | | | | | | | | | |
| Hedged Variable-Rate Notional Amount | $ | 5.0 |
| | $ | 5.0 |
| | $ | 6.7 |
| | $ | 6.8 |
| | $ | — |
| | $ | — |
| | $ | 23.5 |
| | $ | — |
| (d) |
| Fixed Rate Debt Rate (e) | | | | | | | | | | | | | 9.74 | % | | | |
| Hedged Fixed-Rate Notional Amount | $ | — |
| | $ | — |
| | $ | — |
| | $ | — |
| | $ | — |
| | $ | 1,100.0 |
| | $ | 1,100.0 |
| | $ | 29.0 |
| (f) |
| Variable Rate Debt Rate (g) | | | | | | | | | | | | | 1.99 | % | | | |
_______________
| |
| (a) | Fixed rate debt consisted of: Securities issued in the Securitization ($1.8 billion); GTP Notes, acquired in connection with our acquisition of MIPT ($1.2 billion principal amount due at maturity,2013 Securitization; the balance as of December 31, 2014 was $1.3 billion); Sublimit B under the BR Towers Credit Facility, acquired in connection with our acquisition of BR Towers (the balance as of December 31, 2014 was $8.7 million); Unison Notes acquired in connection with the Unison Acquisition ($196.0 million principal amount due at maturity, the balance as of December 31, 2014 was $203.7 million); the 4.625% Notes (the balance as of December 31, 2014 was $600.0 million; we redeemed the 4.625% Notes in February 2015); the 7.00%3.40% senior notes due 2017 ($500.0 million principal due at maturity);2019; Securities issued in the 4.50%2015 Securitization; the 2.800% senior notes due 2018 ($1.0 billion principal amount due at maturity,2020; the balance as of December 31, 2014 was $1.0 billion); the 3.40% Notes ($1.0 billion principal amount due at maturity, the balance as of December 31, 2014 was $1.0 billion); the 7.25%5.050% senior notes due 2019 ($300.0 million principal amount due at maturity,2020; the balance as of December 31, 2014 was $297.3 million); the 5.05%3.300% senior notes due 2020 ($700.0 million principal amount due at maturity,2021; the balance as of December 31, 2014 was $699.5 million); the 3.450% Notes ($650.0 million principal amount due at maturity, the balance as of December 31, 2014 was $646.4 million); the 5.90% senior notes due 2021 ($500.0 million principal amount2021; the 5.900% senior notes due at maturity,2021; the balance as of December 31, 2014 was $499.5 million)2.250% senior notes due 2022 (the “2.250% Notes”); the 4.70% senior notes due 2022 ($700.0 million principal amount2022; the 3.50% senior notes due at maturity,2023; the balance as of3.000% Notes; the 5.00% senior notes due 2024; the 1.375% Notes; the 4.000% senior notes due 2025; the 4.400% senior notes due 2026; the 3.375% senior notes due 2026; the 3.125% senior notes due 2027; the 3.55% Notes; the 3.600% Notes; the Ghana loan which matures December 31, 2014 was $699.0 million);2019; the 3.50% Notes ($1.0 billion principal amount due at maturity, the balance as ofUganda loan which matures on December 31, 2014 was $1.0 billion);2023; the 5.00% Notes ($1.0 billion principal amount due atIndia indebtedness, with maturity the balance as of December 31, 2014 was $1.0 billion); and other debt of $164.0 million (including the 2014 Ghana Loandates ranging from January 24, 2018 to November 30, 2024; and other debt including capital leases).leases. |
| |
| (b) | Variable rate debt includedconsisted of: the 2013 Term Loan, ($1.5 billion), which matures on January 3, 2019 and the 2014 Credit Facility ($1.1 billion), which matures on January 31, 2020. Variable rate debt also included $118.7 million of indebtedness under2023; the 2014 Credit Facility, which matures on January 31, 2023; the 2013 Credit Facility, which matures on June 28, 2021; the BR Towers Debentures,debentures, which amortize through October 15, 2023, and $7.6 million of indebtedness under Sublimit A and Sublimit C under the BR Towers Credit Facility, which amortize through July 15, 2020, $263.4 million of indebtedness under the Mexican Loan, which matures on May 1, 2015, $69.0 million of indebtedness under the Uganda loan, which matures on June 29, 2019, $75.1 million of indebtedness outstanding under the South African Facility,credit facility, which amortizes through March 31, 2020 and $83.6 million of indebtedness underDecember 17, 2020; the Colombian Credit Facility,credit facility, which amortizes through April 24, 2021. Interest on the 2013 Credit Facility, the 2013 Term Loan2021; and the 2014 Credit Facility is payable in accordance with the applicable LIBOR agreement or quarterly and accrues at our option either at LIBOR plus margin (as defined) or the base rate plus margin (as defined). The interest rate in effect at December 31, 2014 for both the 2013 Term Loan and the 2014 Credit Facility was 1.41%. For the year ended December 31, 2014, the weighted average interest rate under the 2013 Credit Facility, the 2014 Credit Facility and the 2013 Term Loan was 1.43%. The BR Towers Debentures bear interest at a rate of 7.40%, and any increase in the aggregate principal amount relative to changes in the National Extended Consumer Price Index will be capitalized pursuant to the Debenture Agreement. InterestBrazil credit facility, which matures on Sublimit A and Sublimit C under the BR Towers Credit Facility is payable in accordance with the Long-Term Interest Rate disclosed by the Central Bank of Brazil plus margin (as defined), which resulted in an interest rate of 10.80% and 5.90%, respectively, at December 31, 2014. Interest on the Mexican Loan is payable in accordance with the applicable TIIE plus margin (as defined). The Mexican Loan accrued interest at 4.82% at December 31, 2014. Interest on the Uganda loan is payable in accordance with the applicable LIBOR plus margin (as defined). The Uganda loan accrued interest at 5.84% at December 31, 2014. Interest on the South African Facility is payable in accordance with the applicable Johannesburg Interbank Agreed Rate (“JIBAR”) agreement and accrues at JIBAR plus margin (as defined). The weighted average interest rate at December 31, 2014, after giving effect to our interest rate swap agreements in South Africa, was 10.34%. Interest on the Colombian Credit Facility is payable in accordance with the applicable Inter-bank Rate (“IBR”) agreement and accrues at IBR plus margin (as defined). The weighted average interest rate at December 31, 2014, after giving effect to our interest rate swap agreement in Colombia, was 9.05%.January 15, 2022. |
| |
| (c) | Based on rates effective as of December 31, 2014.2017. |
| |
| (d) | As of December 31, 2017, the interest rate swap agreement in Colombia was included in Other non-current liabilities on the consolidated balance sheet. |
| |
| (e) | Represents the fixed rate of interest based on contractual notional amount as a percentage of the total notional amount. The interest rate is comprised of fixed interest of 5.74%, per the interest rate agreement, and a fixed margin of 4.00%, per the loan agreement for the Colombian credit facility. |
| |
| (f) | As of December 31, 2017, the interest rate swap agreements in the U.S. were included in Other non-current liabilities on the consolidated balance sheet. |
| |
| (g) | Represents the weighted average fixedvariable rate of interest based on contractual notional amount as a percentage of total notional amounts. |
Interest Rate Risk
As of December 31, 2017, we have one interest rate swap agreement related to debt in Colombia. This swap has been designated as a cash flow hedge, has a notional amount of $23.5 million and an interest rate of 5.74% and expires in April 2021. We have
entered intothree interest rate swap agreements
related to
manage our exposure to variability in interest rates on debt in Colombia and South Africa. In connection with entering into the
Colombian Credit Facility in October2014, we terminated our pre-existing interest rate swap agreement and entered into a new interest rate swap agreement with an aggregate notional value of 100.0 billion COP (approximately $41.8 million). All of our interest rate swap agreements2.250% Notes. These swaps have been designated as cash flowfair value hedges, and have an aggregate notional amount of $79.9$600.0 million and an interest rates ranging from 5.74%rate of one-month LIBOR plus applicable spreads and expire in January 2022. In addition, we have three interest rate swap agreements related to 7.83%a portion of the 3.000% Notes. These swaps have been designated as fair value hedges, have an aggregate notional amount of $500.0 million and expiration dates through April 2021.
an interest rate of one-month LIBOR plus applicable spreads and expire in June 2023.
Changes in interest rates can cause interest charges to fluctuate on our variable rate debt. Variable rate debt as of December 31,
2014, was comprised2017 consisted of
$1,500.0 million under the 2013 Term Loan, $1,100.0$495.0 million under the 2014 Credit Facility,
$263.4$2,075.6 million under the
Mexican Loan, $118.72013 Credit Facility, $1,000.0 million under the
BR Towers Debentures, $69.0Term Loan, $600.0 million under the
Uganda loan, $37.1interest rate swap agreements related to the 2.250% Notes, $500.0 million under the interest rate swap agreements related to the 3.000% Notes, $70.5 million under the South African
Facilitycredit facility, $23.5 million under the Colombian credit facility after giving effect to our interest rate swap agreements,
$41.8$92.7 million
under the Colombian Credit Facility after giving effect to our interest rate swap agreements and $7.6 million under Sublimit A and Sublimit C under the BR Towers
Credit Facility.debentures and $37.6 million under the Brazil credit facility. A 10% increase in current interest rates would result in an additional
$7.0$13.7 million of interest expense for the year ended December 31,
2014.2017.
Foreign Currency Risk
We are exposed to market risk from changes in foreign currency exchange rates primarily in connection with our foreign subsidiaries and joint ventures internationally. Any transaction denominated in a currency other than the U.S. Dollar is reported in U.S. Dollars at the applicable exchange rate. All assets and liabilities are translated into U.S. Dollars at exchange rates in effect at the end of the applicable fiscal reporting period and all revenues and expenses are translated at average rates for the period. The cumulative translation effect is included in equity as a component of
AOCI.Accumulated other comprehensive loss. We may enter into additional foreign currency financial instruments in anticipation of future transactions
in order to minimize the impact of
foreign currency fluctuations. For the year ended December 31,
2014, approximately 33%2017, 44% of our revenues and
approximately 39%51% of our total operating expenses were denominated in foreign currencies.
We have performed a sensitivity analysis assuming a hypothetical 10% adverse movement in foreign currency exchange rates from the quoted foreign currency exchange rates at December 31, 2014.
As of December 31,
2014, the analysis indicated that such an adverse movement would cause our revenues, operating results and cash flows to fluctuate by approximately 3%.As of December 31, 2014,2017, we have incurred intercompany debt whichthat is not considered to be permanently reinvested, and similar unaffiliated balances that were denominated in a currency other than the functional currency of the subsidiary in which it is recorded. As this debt had not been designated as being ofa long-term investment in nature, any changes in the foreign currency exchange rates will result in unrealized gains or losses, which will be included in our determination of net income. An adverse change of 10% in the underlying exchange rates of our unsettled intercompany debt and similar unaffiliated balances would result in approximately $18.5$90.2 million of unrealized gains or losses that would be included in Other expense in our consolidated statements of operations for the year ended December 31, 2014.
2017.
|
| |
| ITEM 8. | FINANCIAL STATEMENTS AND SUPPLEMENTARY DATA |
|
| |
| ITEM 9. | CHANGES IN AND DISAGREEMENTS WITH ACCOUNTANTS ON ACCOUNTING AND FINANCIAL DISCLOSURE |
|
| |
| ITEM 9A. | CONTROLS AND PROCEDURES |
Disclosure Controls and Procedures
We have established disclosure controls and procedures designed to ensure that material information relating to us, including our consolidated subsidiaries, is made known to the officers who certify our financial reports and to other members of senior management and the Board of Directors.
Our management, with the participation of our principal executive officer and principal financial officer, evaluated the effectiveness of the design and operation of our disclosure controls and procedures (as defined in Rules 13a-15(e) and 15d-15(e) under the Exchange Act) as of the end of the period covered by this Annual
Report on Form 10-K.Report. Based on this evaluation, our principal executive officer and principal financial officer concluded that
ourthese disclosure controls and procedures were effective as of December 31,
20142017 and designed to ensure that the information required to be disclosed in our reports filed or submitted under the Exchange Act is recorded, processed, summarized and reported within the requisite time periods specified in the applicable rules and forms, and that it is accumulated and communicated to our management, including our principal executive officer and principal financial officer, as appropriate, to allow timely decisions regarding required disclosure.
Management’s Annual Report on Internal Control over Financial Reporting
Our management, with the participation of our principal executive officer and principal financial officer, is responsible for establishing and maintaining adequate internal control over financial reporting as defined in Rules 13a-15(f) and 15d-15(f) under the Exchange Act. Our internal control system is designed to provide reasonable assurance to our management and Board of Directors regarding the preparation and fair presentation of published financial statements.
Our management assessed the effectiveness of our internal control over financial reporting as of December 31, 2014. 2017.
In making its assessment of internal control over financial reporting, our management used the criteria set forth by the Committee of Sponsoring Organizations of the Treadway Commission inInternal Control—Integrated Framework (2013). Based on this assessment, management concluded that, as of December 31, 2014,2017, our internal control over financial reporting is effective.
Deloitte & Touche LLP, an independent registered public accounting firm that audited our financial statements included in this Annual Report, has issued an attestation report on management’s internal control over financial reporting, which is included in this Item 9A under the caption “Report of Independent Registered Public Accounting Firm.”
Changes in Internal Control over Financial Reporting
In October 2013, we acquired MIPT and, as permitted by the rules and regulations of the SEC, we excluded from our assessment the internal control over financial reporting at MIPT for the year ended December 31, 2013. We completed and integrated the controls of MIPT, which are included in our assessment of internal control over financial reporting for the year ended December 31, 2014.
Other than as described above, there
There have been no changes in our internal control over financial reporting (as defined in Rule 13a-15(f) under the Exchange Act) during the fiscal quarter ended December 31,
20142017 that have materially affected, or are reasonably likely to materially affect, our internal control over financial reporting.
Report of Independent Registered Public Accounting Firm
REPORT OF INDEPENDENT REGISTERED PUBLIC ACCOUNTING FIRM
To
the Stockholders and the Board of Directors
and Stockholders of
American Tower Corporation
Boston, Massachusetts
Opinion on Internal Control over Financial Reporting
We have audited the internal control over financial reporting of American Tower Corporation and subsidiaries (the “Company”) as of December 31, 2014,2017, based on criteria established inInternal Control—Control - Integrated Framework (2013) issued by the Committee of Sponsoring Organizations of the Treadway Commission. Commission (COSO). In our opinion, the Company maintained, in all material respects, effective internal control over financial reporting as of December 31, 2017, based on criteria established in Internal Control - Integrated Framework (2013) issued by COSO.
We have also audited, in accordance with the standards of the Public Company Accounting Oversight Board (United States) (PCAOB), the consolidated financial statements as of and for the year ended December 31, 2017, of the Company and our report dated February 27, 2018, expressed an unqualified opinion on those financial statements.
Basis for Opinion
The Company’s management is responsible for maintaining effective internal control over financial reporting and for its assessment of the effectiveness of internal control over financial reporting, included in the accompanying Management’s Annual Report on Internal Control over Financial Reporting. Our responsibility is to express an opinion on the Company’s internal control over financial reporting based on our audit.
We are a public accounting firm registered with the PCAOB and are required to be independent with respect to the Company in accordance with the U.S. federal securities laws and the applicable rules and regulations of the Securities and Exchange Commission and the PCAOB.
We conducted our audit in accordance with the standards of the
Public Company Accounting Oversight Board (United States).PCAOB. Those standards require that we plan and perform the audit to obtain reasonable assurance about whether effective internal control over financial reporting was maintained in all material respects. Our audit included obtaining an understanding of internal control over financial reporting, assessing the risk that a material weakness exists, testing and evaluating the design and operating effectiveness of internal control based on the assessed risk, and performing such other procedures as we considered necessary in the circumstances. We believe that our audit provides a reasonable basis for our opinion.
Definition and Limitations of Internal Control over Financial Reporting
A company’s internal control over financial reporting is a process designed
by, or under the supervision of, the company’s principal executive and principal financial officers, or persons performing similar functions, and effected by the company’s board of directors, management, and other personnel to provide reasonable assurance regarding the reliability of financial reporting and the preparation of financial statements for external purposes in accordance with generally accepted accounting principles. A company’s internal control over financial reporting includes those policies and procedures that (1) pertain to the maintenance of records that, in reasonable detail, accurately and fairly reflect the transactions and dispositions of the assets of the company; (2) provide reasonable assurance that transactions are recorded as necessary to permit preparation of financial statements in accordance with generally accepted accounting principles, and that receipts and expenditures of the company are being made only in accordance with authorizations of management and directors of the company; and (3) provide reasonable assurance regarding prevention or timely detection of unauthorized acquisition, use, or disposition of the company’s assets that could have a material effect on the financial statements.
Because of
theits inherent limitations,
of internal control over financial reporting
including the possibility of collusion or improper management override of controls, material misstatements due to error or fraud may not
be preventedprevent or
detected on a timely basis.detect misstatements. Also, projections of any evaluation of
the effectiveness
of the internal control over financial reporting to future periods are subject to the risk that
the controls may become inadequate because of changes in conditions, or that the degree of compliance with the policies or procedures may deteriorate.
In our opinion, the Company maintained, in all material respects, effective internal control over financial reporting as of December 31, 2014, based on the criteria established inInternal Control—Integrated Framework (2013) issued by the Committee of Sponsoring Organizations of the Treadway Commission.
We have also audited, in accordance with the standards of the Public Company Accounting Oversight Board (United States), the consolidated financial statements and financial statement schedule as of and for the year ended December 31, 2014 of the Company and our report dated February 24, 2015, expressed an unqualified opinion on those financial statements and financial statement schedule.
/s/
DELOITTEDeloitte &
TOUCHETouche LLP
February
24, 201527, 2018
|
| |
| ITEM 10. | DIRECTORS, EXECUTIVE OFFICERS AND CORPORATE GOVERNANCE |
Our executive officers and their respective ages and positions as of February
13, 201520, 2018 are set forth below:
|
| | | | | |
James D. Taiclet, Jr. | | 57 | 54 |
| | Chairman, President and Chief Executive Officer |
Thomas A. Bartlett | | 59 | 56 |
| | Executive Vice President, and Chief Financial Officer and Treasurer |
Edmund DiSanto | | 65 | 62 |
| | Executive Vice President, Chief Administrative Officer, General Counsel and Secretary |
William H. Hess | | 54 | 51 |
| | Executive Vice President, International Operations and President, Latin America and EMEA |
Steven C. Marshall | | 56 | 53 |
| | Executive Vice President and President, U.S. Tower Division |
Robert J. Meyer, Jr. | | 54 | 51 |
| | Senior Vice President, Finance and Corporate Controller |
Amit Sharma | | 67 | 64 |
| | Executive Vice President and President, Asia |
James D. Taiclet, Jr. is our Chairman, President and Chief Executive Officer. Mr. Taiclet was appointed President and Chief Operating Officer in September 2001, was named Chief Executive Officer in October 2003 and was selected as Chairman of the Board in February 2004. Prior to joining us, Mr. Taiclet served as President of Honeywell Aerospace Services, a unit of Honeywell International, and prior to that as Vice President, Engine Services at Pratt & Whitney, a unit of United Technologies Corporation. He was also previously a consultant at McKinsey & Company, specializing in telecommunications and aerospace strategy and operations. Mr. Taiclet began his career as a United States Air Force officer and pilot.pilot and served in the Gulf War. He holds a Masters DegreeMaster in Public Affairs degree from Princeton University, where he was awarded a Fellowship at the Woodrow Wilson School, and is a Distinguished Graduate of the United States Air Force Academy with majors in Engineering and International Relations. Mr. Taiclet is a member of the Council on Foreign Relations, the Business Roundtable and the Commercial Club of Boston. He is also a member of the Digital Communications Governors Community of the World Economic Forum (Davos). He also serves as a member of the Executive Board of Governors of theThe National Association of Real Estate Investment Trusts (NAREIT) and serves on(Nareit), the Board of Trustees of Brigham and Women’s Healthcare,Women's Health Care, Inc., in Boston, Massachusetts.the Advisory Council for the Princeton University Woodrow Wilson School of Public and International Affairs, and the board of directors of Lockheed Martin Corporation. In August 2015, Mr. Taiclet was appointed to the U.S.-India CEO Forum by the U.S. Department of Commerce.
Thomas A. Bartlett is our Executive Vice President, and Chief Financial Officer.Officer and Treasurer. Mr. Bartlett joined us in April 2009 as Executive Vice President and Chief Financial Officer and assumed the role of Treasurer in July 2017, having previously served in that role from February 2012 until December 2013. Prior to joining us, Mr. Bartlett served as Senior Vice President and Corporate Controller with Verizon Communications, Inc. sincefrom November 2005.2005 to March 2009. In this role, he was responsible for corporate-wide accounting, tax planning and compliance, SEC financial reporting, budget reporting and analysis and capital expenditures planning functions. Mr. Bartlett previously held the roles of Senior Vice President and Treasurer, as well as Senior Vice President Investor Relations. During his twenty-five year career with Verizon Communications and its predecessor companies and affiliates, he served in numerous operations and business development roles, including as the President and Chief Executive Officer of Bell Atlantic International Wireless from 1995 through 2000, where he was responsible for wireless activities in North America, Latin America, Europe and Asia, and was also an area President in Verizon’s U.S. wireless business responsible for all operational aspects in both the Northeast and Mid-Atlantic states. Mr. Bartlett began his career at Deloitte, Haskins & Sells. Mr. Bartlett currently serves on the board of directors of Equinix, Inc. Mr. Bartlett earned hisan M.B.A. degree from Rutgers University, and a Bachelor of Science in Engineering from Lehigh University and became a Certified Public Accountant.
Edmund DiSanto is our Executive Vice President, Chief Administrative Officer, General Counsel and Secretary. Prior to joining us in April 2007, Mr. DiSanto was with Pratt & Whitney, a unit of United Technologies Corporation. Mr. DiSanto started with United Technologies in 1989, where he first served as Assistant General Counsel of its Carrier subsidiary, then corporate Executive Assistant to the Chairman and Chief Executive Officer of United Technologies, and fromTechnologies. From 1997, he held various legal and business roles at its Pratt & Whitney unit, including Deputy General Counsel and most recently, Vice President, Global Service Partners, Business Development. Prior to joining United Technologies, Mr. DiSanto served in a number of legaland related positions at United Dominion Industries and New England Electric Systems. Mr. DiSanto earned hisa J.D. degree from Boston College Law School and a Bachelor of Science from Northeastern University. In 2013, Mr. DiSanto became a member of the board of directors of the Business Council for International Understanding.
William H. Hess is our Executive Vice President, International Operations and President, Latin America and EMEA. Mr. Hess joined us in March 2001 as Chief Financial Officer of American Tower International and was appointed Executive Vice President in June 2001. Mr. Hess was appointed Executive Vice President, General Counsel in September 2002, and in February 2007, Mr. Hess was also appointed Executive Vice President, International Operations. Mr. Hess relinquished the position of General Counsel in April 2007 when he was named President of our Latin American operations. In March 2009, Mr. Hess also became responsible for the Europe, Middle East and Africa (EMEA) territory. Prior to joining us, Mr. Hess had been a partner in the corporate and finance practice group of the law firm of King & Spalding LLP, which he joined in 1990. Prior to attending law school, Mr. Hess practiced as a Certified Public Accountant with Arthur Young & Co. Mr. Hess received hisa J.D. degree from Vanderbilt University School of Law and is a graduate of Harding University. Mr. Hess is on the Board of Trustees of the U.S.-Africa Business Center for the U.S. Chamber of Commerce and a participant of the World Economic Forum.
Steven C. Marshall is our Executive Vice President and President, U.S. Tower Division. Mr. Marshall served as our Executive Vice President, International Business Development from November 2007 through March 2009, at which time he was appointed our Executive Vice President and President, U.S. Tower Division.to his current position. Prior to joining us, Mr. Marshall was with National Grid Plc, where he served in a number of leadership and business development positions since 1997. Between 2003 and 2007, Mr. Marshall was Chief Executive Officer, National Grid Wireless, where he led National Grid’s wireless tower infrastructure business in the United States and United Kingdom, and held directorships with Digital UK and FreeView during this period. In addition, during his tenurewhile at National Grid, as well as during earlier tenures at Costain Group Plc and Tootal Group Plc, he led operational and business development efforts in Latin America, India, Southeast Asia, Africa and the Middle East. InMr. Marshall has served as director for WIA - The Wireless Infrastructure Association, formerly known as PCIA, since October 2010 Mr. Marshall was appointedand as its chairperson since June 2017, as a director of PCIA -TheCTIA - the Wireless Infrastructure Association. In April 2011, he was appointed a DirectorAssociation since January 2017 and as director of the Federated Wireless Board since September 2017. Mr. Marshall previously served as director of the Competitive Carriers Association, formerly known as the Rural Cellular Association.Association, from April 2011 to October 2017. Mr. Marshall earned hisan M.B.A. degree from Manchester Business School in Manchester, England and a Bachelor of Science with honors in Building and Civil Engineering from the Victoria University of Manchester, England.
Robert J. Meyer, Jr.is our Senior Vice President, Finance and Corporate Controller. Mr. Meyer joined us in August 2008. Prior to joining us, Mr. Meyer was with Bright Horizons Family Solutions since 1998, a provider of child care, early education and work/life consulting services, where he most recently served as Chief Accounting Officer. Mr. Meyer also served as Corporate Controller and Vice President of Finance while at Bright Horizons. Prior to that, from 1997 to 1998, Mr. Meyer served as Director of Financial Planning and Analysis at First Security Services Corp. Mr. Meyer earned hisa Masters in Finance from Bentley University and a Bachelor of Science in Accounting from Marquette University, and is also a Certified Public Accountant.
Amit Sharmais our Executive Vice President and President, Asia. Mr. Sharma joined us in September 2007. Prior to joining us, since 1992, Mr. Sharma worked at Motorola, where he led country teams in India and Southeast Asia, including as Country President, India and as Head of Strategy, Asia-Pacific. Mr. Sharma also served on Motorola’s Asia PacificAsia-Pacific Board and was a member of its senior leadership team. Mr. Sharma also worked at GE Capital, serving as Vice President, Strategy and Business Development, and prior to that, with McKinsey, New York, serving as a core member of the firm’sfirm's Electronics and Marketing Practices. Mr. Sharma earned hisan M.B.A. degree in International Business from the Wharton School, University of Pennsylvania, where he was on the Dean’s List and the Director’s Honors List. Mr. Sharma also holds an MSa Master of Science in Computer Science from the Moore School, University of Pennsylvania, and a Bachelor of Technology in Mechanical Engineering from the Indian Institute of Technology. The information under “Election of Directors” and “Section 16(a) Beneficial Ownership Reporting Compliance” from the Definitive Proxy Statement is incorporated herein by reference. Information required by this item pursuant to Item 407(c)(3) of SEC Regulation S-K relating to our procedures by which security holders
may recommend nominees to our Board of Directors, and pursuant to Item 407(d)(4) and 407(d)(5) of SEC Regulation S-K relating to our audit committee financial experts and identification of the audit committee of our Board of Directors, is contained in the Definitive Proxy Statement under “Corporate Governance” and is incorporated herein by reference.
Information regarding our Code of Conduct applicable to our principal executive officer, our principal financial officer, our controller and other senior financial officers appears in Item 1 of this Annual Report under the caption “Business—Available Information.”
|
| |
| ITEM 11. | EXECUTIVE COMPENSATION |
The information under “Compensation and Other Information Concerning Directors and Officers” from the Definitive Proxy Statement is incorporated herein by reference.
|
| |
| ITEM 12. | SECURITY OWNERSHIP OF CERTAIN BENEFICIAL OWNERS AND MANAGEMENT AND RELATED STOCKHOLDER MATTERS |
The information under “Security Ownership of Certain Beneficial Owners and Management” and “Securities Authorized for Issuance Under Equity Compensation Plans” from the Definitive Proxy Statement is incorporated herein by reference.
|
| |
| ITEM 13. | CERTAIN RELATIONSHIPS AND RELATED TRANSACTIONS, AND DIRECTOR INDEPENDENCE |
Information required by this item pursuant to Item 404 of SEC Regulation S-K relating to approval of related party transactions is contained in the Definitive Proxy Statement under “Corporate Governance” and is incorporated herein by reference.
Information required by this item pursuant to Item 407(a) of SEC Regulation S-K relating to director independence is contained in the Definitive Proxy Statement under “Corporate Governance” and is incorporated herein by reference.
|
| |
| ITEM 14. | PRINCIPAL ACCOUNTING FEES AND SERVICES |
The information under “Independent Auditor Fees and Other Matters” from the Definitive Proxy Statement is incorporated herein by reference.
|
| |
| ITEM 15. | EXHIBITS, FINANCIAL STATEMENT SCHEDULES |
(a) | The following documents are filed as a part of this report: |
(a) The following documents are filed as a part of this report:
1.Financial Statements. See Index to Consolidated Financial Statements, which appears on page F-1 hereof. The financial statements listed in the accompanying Index to Consolidated Financial Statements are filed herewith in response to this Item. 2.Financial Statement Schedules. American Tower Corporation and Subsidiaries Schedule III – Schedule of Real Estate and Accumulated Depreciation is filed herewith in response to this Item. 3.Exhibits. See Index to Exhibits. The exhibits listed in the Index to Exhibits immediately preceding the exhibits are filed herewith in response to this Item.
SIGNATURESPursuant to the requirements of Section 13 or 15(d) of the Securities Exchange Act of 1934, the Registrant has duly caused this report to be signed on its behalf by the undersigned, thereunto duly authorized on the 24th day of February, 2015.
| | |
AMERICAN TOWER CORPORATION |
| |
By: | | /S/ JAMES D. TAICLET, JR.
|
| | James D. Taiclet, Jr.
Chairman, President and
Chief Executive Officer
|
Pursuant to the requirements of the Securities Exchange Act of 1934, this report has been duly signed below by the following persons on behalf of the Registrant and in the capacities and on the dates indicated.
| | | | |
Signature
| | Title
| | Date
|
| | |
/S/ JAMES D. TAICLET, JR.
James D. Taiclet, Jr.
| | Chairman, President and Chief Executive Officer (Principal Executive Officer)
| | February 24, 2015 |
| | |
/S/ THOMAS A. BARTLETT
Thomas A. Bartlett
| | Executive Vice President and Chief Financial Officer (Principal Financial Officer)
| | February 24, 2015 |
| | |
/S/ ROBERT J. MEYER, JR
Robert J. Meyer, Jr.
| | Senior Vice President, Finance and Corporate Controller (Principal Accounting Officer)
| | February 24, 2015 |
| | |
/S/ RAYMOND P. DOLAN
Raymond P. Dolan
| | Director
| | February 24, 2015 |
| | |
/S/ RONALD M. DYKES
Ronald M. Dykes
| | Director
| | February 24, 2015 |
| | |
/S/ CAROLYN F. KATZ
Carolyn F. Katz
| | Director
| | February 24, 2015 |
| | |
/S/ GUSTAVO LARA CANTU
Gustavo Lara Cantu
| | Director
| | February 24, 2015 |
| | |
/S/ CRAIG MACNAB
Craig Macnab
| | Director
| | February 24, 2015 |
| | |
/S/ JOANN A. REED
JoAnn A. Reed
| | Director
| | February 24, 2015 |
| | |
/S/ PAMELA D. A. REEVE
Pamela D. A. Reeve
| | Director
| | February 24, 2015 |
| | |
/S/ DAVID E. SHARBUTT
David E. Sharbutt
| | Director
| | February 24, 2015 |
| | |
/S/ SAMME L. THOMPSON
Samme L. Thompson
| | Director
| | February 24, 2015 |
AMERICAN TOWER CORPORATION AND SUBSIDIARIES
INDEX TO CONSOLIDATED FINANCIAL STATEMENTS
REPORT OF INDEPENDENT REGISTERED PUBLIC ACCOUNTING FIRM
To the Board of Directors and Stockholders of
American Tower Corporation
Boston, Massachusetts
We have audited the accompanying consolidated balance sheets of American Tower Corporation and subsidiaries (the “Company”) as of December 31, 2014 and 2013, and the related consolidated statements of operations, comprehensive income, equity, and cash flows for each of the three years in the period ended December 31, 2014. Our audits also included the financial statement schedule listed in the Index at Item 15. These financial statements and financial statement schedule are the responsibility of the Company’s management. Our responsibility is to express an opinion on the financial statements and financial statement schedule based on our audits.
We conducted our audits in accordance with the standards of the Public Company Accounting Oversight Board (United States). Those standards require that we plan and perform the audit to obtain reasonable assurance about whether the financial statements are free of material misstatement. An audit includes examining, on a test basis, evidence supporting the amounts and disclosures in the financial statements. An audit also includes assessing the accounting principles used and significant estimates made by management, as well as evaluating the overall financial statement presentation. We believe that our audits provide a reasonable basis for our opinion.
In our opinion, such consolidated financial statements present fairly, in all material respects, the financial position of the Company as of December 31, 2014 and 2013, and the results of its operations and cash flows for each of the three years in the period ended December 31, 2014, in conformity with accounting principles generally accepted in the United States of America. Also, in our opinion, such financial statement schedule, when considered in relation to the basic consolidated financial statements taken as a whole, presents fairly, in all material respects, the information set forth therein.
We have also audited, in accordance with the standards of the Public Company Accounting Oversight Board (United States), the Company’s internal control over financial reporting as of December 31, 2014, based on the criteria established inInternal Control-Integrated Framework (2013) issued by the Committee of Sponsoring Organizations of the Treadway Commission, and our report dated February 24, 2015 expressed an unqualified opinion on the Company’s internal control over financial reporting.
/s/ DELOITTE & TOUCHE LLP
Boston, Massachusetts
February 24, 2015
AMERICAN TOWER CORPORATION AND SUBSIDIARIES
CONSOLIDATED BALANCE SHEETS
(in thousands, except share data)
| | | | | | | | |
| | | December 31,
2014 | | | December 31,
2013 | |
ASSETS | | | | | | | | |
CURRENT ASSETS: | | | | | | | | |
Cash and cash equivalents | | $ | 313,492 | | | $ | 293,576 | |
Restricted cash | | | 160,206 | | | | 152,916 | |
Short-term investments | | | 6,302 | | | | 18,612 | |
Accounts receivable, net | | | 198,714 | | | | 151,165 | |
Prepaid and other current assets | | | 254,622 | | | | 347,417 | |
Deferred income taxes | | | 14,632 | | | | 22,401 | |
| | | | | | | | |
Total current assets | | | 947,968 | | | | 986,087 | |
| | | | | | | | |
PROPERTY AND EQUIPMENT, net | | | 7,626,817 | | | | 7,177,728 | |
GOODWILL | | | 4,017,082 | | | | 3,854,802 | |
OTHER INTANGIBLE ASSETS, net | | | 6,889,331 | | | | 6,570,119 | |
DEFERRED INCOME TAXES | | | 253,186 | | | | 266,909 | |
DEFERRED RENT ASSET | | | 1,030,707 | | | | 918,847 | |
NOTES RECEIVABLE AND OTHER NON-CURRENT ASSETS | | | 566,454 | | | | 509,173 | |
| | | | | | | | |
TOTAL | | $ | 21,331,545 | | | $ | 20,283,665 | |
| | | | | | | | |
LIABILITIES AND EQUITY | | | | | | | | |
CURRENT LIABILITIES: | | | | | | | | |
Accounts payable | | $ | 90,366 | | | $ | 172,938 | |
Accrued expenses | | | 417,754 | | | | 421,188 | |
Distributions payable | | | 159,864 | | | | 575 | |
Accrued interest | | | 130,265 | | | | 105,751 | |
Current portion of long-term obligations | | | 897,624 | | | | 70,132 | |
Unearned revenue | | | 233,819 | | | | 162,079 | |
| | | | | | | | |
Total current liabilities | | | 1,929,692 | | | | 932,663 | |
| | | | | | | | |
LONG-TERM OBLIGATIONS | | | 13,711,084 | | | | 14,408,146 | |
ASSET RETIREMENT OBLIGATIONS | | | 609,035 | | | | 549,548 | |
OTHER NON-CURRENT LIABILITIES | | | 1,028,382 | | | | 803,268 | |
| | | | | | | | |
Total liabilities | | | 17,278,193 | | | | 16,693,625 | |
| | | | | | | | |
| | |
COMMITMENTS AND CONTINGENCIES | | | | | | | | |
| | |
EQUITY: | | | | | | | | |
Preferred stock: $.01 par value; 20,000,000 shares authorized; 5.25% Mandatory Convertible Preferred Stock, Series A, 6,000,000 and no shares issued and outstanding, respectively | | | 60 | | | | — | |
Common stock: $.01 par value; 1,000,000,000 shares authorized; 399,508,751 and 397,674,350 shares issued; and 396,698,725 and 394,864,324 shares outstanding, respectively | | | 3,995 | | | | 3,976 | |
Additional paid-in capital | | | 5,788,786 | | | | 5,130,616 | |
Distributions in excess of earnings | | | (837,320 | ) | | | (1,081,467 | ) |
Accumulated other comprehensive loss | | | (794,221 | ) | | | (311,220 | ) |
Treasury stock (2,810,026 shares at cost) | | | (207,740 | ) | | | (207,740 | ) |
| | | | | | | | |
Total American Tower Corporation equity | | | 3,953,560 | | | | 3,534,165 | |
Noncontrolling interest | | | 99,792 | | | | 55,875 | |
| | | | | | | | |
Total equity | | | 4,053,352 | | | | 3,590,040 | |
| | | | | | | | |
TOTAL | | $ | 21,331,545 | | | $ | 20,283,665 | |
| | | | | | | | |
See accompanying notes to consolidated financial statements.
AMERICAN TOWER CORPORATION AND SUBSIDIARIES
CONSOLIDATED STATEMENTS OF OPERATIONS
(in thousands, except per share data)
| | | | | | | | | | | | |
| | | Year Ended December 31, | |
| | | 2014 | | | 2013 | | | 2012 | |
REVENUES: | | | | | | | | | | | | |
Rental and management | | $ | 4,006,854 | | | $ | 3,287,090 | | | $ | 2,803,490 | |
Network development services | | | 93,194 | | | | 74,317 | | | | 72,470 | |
| | | | | | | | | | | | |
Total operating revenues | | | 4,100,048 | | | | 3,361,407 | | | | 2,875,960 | |
| | | | | | | | | | | | |
OPERATING EXPENSES: | | | | | | | | | | | | |
Costs of operations (exclusive of items shown separately below): | | | | | | | | | | | | |
Rental and management (including stock-based compensation expense of $1,397, $977 and $793, respectively) | | | 1,056,177 | | | | 828,742 | | | | 686,681 | |
Network development services (including stock-based compensation expense of $440, $567 and $968, respectively) | | | 38,088 | | | | 31,131 | | | | 35,798 | |
Depreciation, amortization and accretion | | | 1,003,802 | | | | 800,145 | | | | 644,276 | |
Selling, general, administrative and development expense (including stock-based compensation expense of $78,316, $66,594 and $50,222, respectively) | | | 446,542 | | | | 415,545 | | | | 327,301 | |
Other operating expenses | | | 68,517 | | | | 71,539 | | | | 62,185 | |
| | | | | | | | | | | | |
Total operating expenses | | | 2,613,126 | | | | 2,147,102 | | | | 1,756,241 | |
| | | | | | | | | | | | |
OPERATING INCOME | | | 1,486,922 | | | | 1,214,305 | | | | 1,119,719 | |
| | | | | | | | | | | | |
OTHER INCOME (EXPENSE): | | | | | | | | | | | | |
Interest income, TV Azteca, net of interest expense of $1,482, $1,483 and $1,485, respectively | | | 10,547 | | | | 22,235 | | | | 14,258 | |
Interest income | | | 14,002 | | | | 9,706 | | | | 7,680 | |
Interest expense | | | (580,234 | ) | | | (458,296 | ) | | | (401,665 | ) |
Loss on retirement of long-term obligations | | | (3,473 | ) | | | (38,701 | ) | | | (398 | ) |
Other expense (including unrealized foreign currency losses of $49,319, $211,722 and $34,330, respectively) | | | (62,060 | ) | | | (207,500 | ) | | | (38,300 | ) |
| | | | | | | | | | | | |
Total other expense | | | (621,218 | ) | | | (672,556 | ) | | | (418,425 | ) |
| | | | | | | | | | | | |
INCOME FROM CONTINUING OPERATIONS BEFORE INCOME TAXES AND INCOME ON EQUITY METHOD INVESTMENTS | | | 865,704 | | | | 541,749 | | | | 701,294 | |
Income tax provision | | | (62,505 | ) | | | (59,541 | ) | | | (107,304 | ) |
Income on equity method investments | | | — | | | | — | | | | 35 | |
| | | | | | | | | | | | |
NET INCOME | | | 803,199 | | | | 482,208 | | | | 594,025 | |
Net loss attributable to noncontrolling interest | | | 21,711 | | | | 69,125 | | | | 43,258 | |
| | | | | | | | | | | | |
NET INCOME ATTRIBUTABLE TO AMERICAN TOWER CORPORATION STOCKHOLDERS | | | 824,910 | | | | 551,333 | | | | 637,283 | |
Dividends declared on preferred stock | | | (23,888 | ) | | | — | | | | — | |
| | | | | | | | | | | | |
NET INCOME ATTRIBUTABLE TO AMERICAN TOWER CORPORATION COMMON STOCKHOLDERS | | $ | 801,022 | | | $ | 551,333 | | | $ | 637,283 | |
| | | | | | | | | | | | |
NET INCOME PER COMMON SHARE AMOUNTS: | | | | | | | | | | | | |
Basic net income attributable to American Tower Corporation common stockholders | | $ | 2.02 | | | $ | 1.40 | | | $ | 1.61 | |
| | | | | | | | | | | | |
Diluted net income attributable to American Tower Corporation common stockholders | | $ | 2.00 | | | $ | 1.38 | | | $ | 1.60 | |
| | | | | | | | | | | | |
WEIGHTED AVERAGE COMMON SHARES OUTSTANDING: | | | | | | | | | | | | |
BASIC | | | 395,958 | | | | 395,040 | | | | 394,772 | |
| | | | | | | | | | | | |
DILUTED | | | 400,086 | | | | 399,146 | | | | 399,287 | |
| | | | | | | | | | | | |
See accompanying notes to consolidated financial statements.
AMERICAN TOWER CORPORATION AND SUBSIDIARIES
CONSOLIDATED STATEMENTS OF COMPREHENSIVE INCOME
(in thousands)
| | | | | | | | | | | | |
| | | Year Ended December 31, | |
| | | 2014 | | | 2013 | | | 2012 | |
Net income | | $ | 803,199 | | | $ | 482,208 | | | $ | 594,025 | |
Other comprehensive (loss) income: | | | | | | | | | | | | |
Changes in fair value of cash flow hedges, net of taxes of $151, $(374) and $905, respectively | | | (1,931 | ) | | | 1,107 | | | | (5,315 | ) |
Reclassification of unrealized losses on cash flow hedges to net income, net of taxes of $(158), $(237) and $(208), respectively | | | 3,448 | | | | 2,572 | | | | 1,132 | |
Reclassification of unrealized losses on available-for-sale securities to net income | | | — | | | | — | | | | 495 | |
Foreign currency translation adjustments, net of taxes of $14,247, $9,207 and $7,677, respectively | | | (526,890 | ) | | | (135,079 | ) | | | (58,387 | ) |
| | | | | | | | | | | | |
Other comprehensive loss | | | (525,373 | ) | | | (131,400 | ) | | | (62,075 | ) |
| | | | | | | | | | | | |
Comprehensive income | | | 277,826 | | | | 350,808 | | | | 531,950 | |
| | | | | | | | | | | | |
Comprehensive loss attributable to noncontrolling interest | | | 64,083 | | | | 72,652 | | | | 64,603 | |
| | | | | | | | | | | | |
Comprehensive income attributable to American Tower Corporation stockholders | | $ | 341,909 | | | $ | 423,460 | | | $ | 596,553 | |
| | | | | | | | | | | | |
See accompanying notes to consolidated financial statements.
AMERICAN TOWER CORPORATION AND SUBSIDIARIES
CONSOLIDATED STATEMENTS OF EQUITY
(in thousands, except share data)
| | | | | | | | | | | | | | | | | | | | | | | | | | | | | | | | | | | | | | | | | | | | |
| | | Preferred Stock | | | Common Stock | | | Treasury Stock | | | Additional
Paid-in
Capital | | | Other
Comprehensive
Loss | | | Distributions
in Excess of
Earnings | | | Noncontrolling
Interest | | | Total
Equity | |
| | | Issued
Shares | | | Amount | | | Issued
Shares | | | Amount | | | Shares | | | Amount | | | | | | |
BALANCE, JANUARY 1, 2012 | | | — | | | | — | | | | 393,642,079 | | | $ | 3,936 | | | | — | | | $ | — | | | $ | 4,903,800 | | | $ | (142,617 | ) | | $ | (1,477,899 | ) | | $ | 122,922 | | | $ | 3,410,142 | |
| | | | | | | | | | | | | | | | | | | | | | | | | | | | | | | | | | | | | | | | | | | | |
Stock-based compensation related activity | | | — | | | | — | | | | 2,233,390 | | | | 22 | | | | — | | | | — | | | | 103,798 | | | | — | | | | — | | | | — | | | | 103,820 | |
Issuance of common stock—stock purchase plan | | | — | | | | — | | | | 87,749 | | | | 1 | | | | — | | | | — | | | | 4,526 | | | | — | | | | — | | | | — | | | | 4,527 | |
Treasury stock activity | | | — | | | | — | | | | — | | | | — | | | | (872,005 | ) | | | (62,728 | ) | | | — | | | | — | | | | — | | | | — | | | | (62,728 | ) |
Net change in fair value of cash flow hedges, net of tax | | | — | | | | — | | | | — | | | | — | | | | — | | | | — | | | | — | | | | (4,733 | ) | | | — | | | | (582 | ) | | | (5,315 | ) |
Reclassification of unrealized losses on cash flow hedges to net income | | | — | | | | — | | | | — | | | | — | | | | — | | | | — | | | | — | | | | 998 | | | | — | | | | 134 | | | | 1,132 | |
Reclassification of unrealized losses on available-for-sale securities to net income | | | — | | | | — | | | | — | | | | — | | | | — | | | | — | | | | — | | | | 495 | | | | — | | | | — | | | | 495 | |
Foreign currency translation adjustment, net of tax | | | — | | | | — | | | | — | | | | — | | | | — | | | | — | | | | — | | | | (37,490 | ) | | | — | | | | (20,897 | ) | | | (58,387 | ) |
Contributions from noncontrolling interest | | | — | | | | — | | | | — | | | | — | | | | — | | | | — | | | | — | | | | — | | | | — | | | | 53,341 | | | | 53,341 | |
Distributions to noncontrolling interest | | | — | | | | — | | | | — | | | | — | | | | — | | | | — | | | | — | | | | — | | | | — | | | | (580 | ) | | | (580 | ) |
Dividends/distributions declared | | | — | | | | — | | | | — | | | | — | | | | — | | | | — | | | | — | | | | — | | | | (356,291 | ) | | | — | | | | (356,291 | ) |
Net income (loss) | | | — | | | | — | | | | — | | | | — | | | | — | | | | — | | | | — | | | | — | | | | 637,283 | | | | (43,258 | ) | | | 594,025 | |
| | | | | | | | | | | | | | | | | | | | | | | | | | | | | | | | | | | | | | | | | | | | |
BALANCE, DECEMBER 31, 2012 | | | — | | | | — | | | | 395,963,218 | | | $ | 3,959 | | | | (872,005 | ) | | $ | (62,728 | ) | | $ | 5,012,124 | | | $ | (183,347 | ) | | $ | (1,196,907 | ) | | $ | 111,080 | | | $ | 3,684,181 | |
| | | | | | | | | | | | | | | | | | | | | | | | | | | | | | | | | | | | | | | | | | | | |
Stock-based compensation related activity | | | — | | | | — | | | | 1,633,380 | | | | 16 | | | | — | | | | — | | | | 113,566 | | | | — | | | | — | | | | — | | | | 113,582 | |
Issuance of common stock—stock purchase plan | | | — | | | | — | | | | 77,752 | | | | 1 | | | | — | | | | — | | | | 4,926 | | | | — | | | | — | | | | — | | | | 4,927 | |
Treasury stock activity | | | — | | | | — | | | | — | | | | — | | | | (1,938,021 | ) | | | (145,012 | ) | | | — | | | | — | | | | — | | | | — | | | | (145,012 | ) |
Net change in fair value of cash flow hedges, net of tax | | | — | | | | — | | | | — | | | | — | | | | — | | | | — | | | | — | | | | 867 | | | | — | | | | 240 | | | | 1,107 | |
Reclassification of unrealized losses on cash flow hedges to net income | | | — | | | | — | | | | — | | | | — | | | | — | | | | — | | | | — | | | | 2,420 | | | | — | | | | 152 | | | | 2,572 | |
Foreign currency translation adjustment, net of tax | | | — | | | | — | | | | — | | | | — | | | | — | | | | — | | | | — | | | | (131,160 | ) | | | — | | | | (3,919 | ) | | | (135,079 | ) |
Contributions from noncontrolling interest | | | — | | | | — | | | | — | | | | — | | | | — | | | | — | | | | — | | | | — | | | | — | | | | 18,020 | | | | 18,020 | |
Distributions to noncontrolling interest | | | — | | | | — | | | | — | | | | — | | | | — | | | | — | | | | — | | | | — | | | | — | | | | (573 | ) | | | (573 | ) |
Dividends/distributions declared | | | — | | | | — | | | | — | | | | — | | | | — | | | | — | | | | — | | | | — | | | | (435,893 | ) | | | — | | | | (435,893 | ) |
Net income (loss) | | | — | | | | — | | | | — | | | | — | | | | — | | | | — | | | | — | | | | — | | | | 551,333 | | | | (69,125 | ) | | | 482,208 | |
| | | | | | | | | | | | | | | | | | | | | | | | | | | | | | | | | | | | | | | | | | | | |
BALANCE, DECEMBER 31, 2013 | | | — | | | | — | | | | 397,674,350 | | | $ | 3,976 | | | | (2,810,026 | ) | | $ | (207,740 | ) | | $ | 5,130,616 | | | $ | (311,220 | ) | | $ | (1,081,467 | ) | | $ | 55,875 | | | $ | 3,590,040 | |
| | | | | | | | | | | | | | | | | | | | | | | | | | | | | | | | | | | | | | | | | | | | |
Stock-based compensation related activity | | | — | | | | — | | | | 1,753,286 | | | | 18 | | | | — | | | | — | | | | 119,716 | | | | — | | | | — | | | | — | | | | 119,734 | |
Issuance of common stock—stock purchase plan | | | — | | | | — | | | | 81,115 | | | | 1 | | | | — | | | | — | | | | 5,717 | | | | — | | | | — | | | | — | | | | 5,718 | |
Issuance of preferred stock | | | 6,000,000 | | | | 60 | | | | — | | | | — | | | | — | | | | — | | | | 582,599 | | | | | | | | | | | | | | | | 582,659 | |
Changes in fair value of cash flow hedges, net of tax | | | — | | | | — | | | | — | | | | — | | | | — | | | | — | | | | — | | | | (1,966 | ) | | | — | | | | 35 | | | | (1,931 | ) |
Reclassification of unrealized losses on cash flow hedges to net income | | | — | | | | — | | | | — | | | | — | | | | — | | | | — | | | | — | | | | 3,288 | | | | — | | | | 160 | | | | 3,448 | |
Foreign currency translation adjustment, net of tax | | | — | | | | — | | | | — | | | | — | | | | — | | | | — | | | | — | | | | (484,323 | ) | | | — | | | | (42,567 | ) | | | (526,890 | ) |
Contributions from noncontrolling interest | | | — | | | | — | | | | — | | | | — | | | | — | | | | — | | | | — | | | | — | | | | — | | | | 123,526 | | | | 123,526 | |
Distributions to noncontrolling interest | | | — | | | | — | | | | — | | | | — | | | | — | | | | — | | | | — | | | | — | | | | — | | | | (566 | ) | | | (566 | ) |
Purchase of noncontrolling interest | | | | | | | | | | | | | | | | | | | — | | | | — | | | | (49,862 | ) | | | | | | | | | | | (14,960 | ) | | | (64,822 | ) |
Common stock dividends/distributions declared | | | — | | | | — | | | | — | | | | — | | | | — | | | | — | | | | — | | | | — | | | | (556,875 | ) | | | — | | | | (556,875 | ) |
Preferred stock dividends declared | | | — | | | | — | | | | — | | | | — | | | | | | | | | | | | | | | | | | | | (23,888 | ) | | | — | | | | (23,888 | ) |
Net income (loss) | | | — | | | | — | | | | — | | | | — | | | | — | | | | — | | | | — | | | | — | | | | 824,910 | | | | (21,711 | ) | | | 803,199 | |
| | | | | | | | | | | | | | | | | | | | | | | | | | | | | | | | | | | | | | | | | | | | |
BALANCE, DECEMBER 31, 2014 | | | 6,000,000 | | | $ | 60 | | | | 399,508,751 | | | $ | 3,995 | | | | (2,810,026 | ) | | $ | (207,740 | ) | | $ | 5,788,786 | | | $ | (794,221 | ) | | $ | (837,320 | ) | | $ | 99,792 | | | $ | 4,053,352 | |
| | | | | | | | | | | | | | | | | | | | | | | | | | | | | | | | | | | | | | | | | | | | |
See accompanying notes to consolidated financial statements.
AMERICAN TOWER CORPORATION AND SUBSIDIARIES
CONSOLIDATED STATEMENTS OF CASH FLOWS
(in thousands)
| | | | | | | | | | | | |
| | | Year Ended December 31, | |
| | | 2014 | | | 2013 | | | 2012 | |
CASH FLOWS FROM OPERATING ACTIVITIES | | | | | | | | | | | | |
Net income | | $ | 803,199 | | | $ | 482,208 | | | $ | 594,025 | |
Adjustments to reconcile net income to cash provided by operating activities: | | | | | | | | | | | | |
Depreciation, amortization and accretion | | | 1,003,802 | | | | 800,145 | | | | 644,276 | |
Stock-based compensation expense | | | 80,153 | | | | 68,138 | | | | 51,983 | |
Decrease (increase) in restricted cash | | | 7,522 | | | | (52,717 | ) | | | (26,500 | ) |
Loss on investments, unrealized foreign currency loss and other non-cash expense | | | 65,881 | | | | 222,390 | | | | 60,002 | |
Impairments, net loss on sale of long-lived assets, non-cash restructuring and merger related expenses | | | 26,143 | | | | 32,672 | | | | 34,280 | |
Loss on early retirement of long-term obligations | | | 3,379 | | | | 35,288 | | | | — | |
Amortization of deferred financing costs, debt discounts and premiums and other non-cash interest | | | (4,870 | ) | | | 7,596 | | | | 11,090 | |
Provision for losses on accounts receivable | | | (1,748 | ) | | | (1,410 | ) | | | (4,155 | ) |
Deferred income taxes | | | 1,384 | | | | (29,485 | ) | | | 29,300 | |
Changes in assets and liabilities, net of acquisitions: | | | | | | | | | | | | |
Accounts receivable | | | (84,529 | ) | | | (19,080 | ) | | | (43,679 | ) |
Prepaid and other assets | | | (1,437 | ) | | | (96,038 | ) | | | 84,640 | |
Deferred rent asset | | | (122,230 | ) | | | (145,689 | ) | | | (164,219 | ) |
Accounts payable and accrued expenses | | | 34,711 | | | | 83,746 | | | | 21,880 | |
Accrued interest | | | 45,514 | | | | 51,076 | | | | 25,031 | |
Unearned revenue | | | 218,393 | | | | 108,487 | | | | 68,015 | |
Deferred rent liability | | | 38,378 | | | | 30,246 | | | | 33,707 | |
Other non-current liabilities | | | 20,944 | | | | 21,474 | | | | (5,285 | ) |
| | | | | | | | | | | | |
Cash provided by operating activities | | | 2,134,589 | | | | 1,599,047 | | | | 1,414,391 | |
| | | | | | | | | | | | |
CASH FLOWS FROM INVESTING ACTIVITIES | | | | | | | | | | | | |
Payments for purchase of property and equipment and construction activities | | | (974,404 | ) | | | (724,532 | ) | | | (568,048 | ) |
Payments for acquisitions, net of cash acquired | | | (1,010,637 | ) | | | (4,461,764 | ) | | | (1,997,955 | ) |
Net proceeds from sale of assets | | | 15,464 | | | | — | | | | — | |
Proceeds from sales of short-term investments, available-for-sale securities and other long-term assets | | | 1,434,831 | | | | 421,714 | | | | 374,682 | |
Payments for short-term investments | | | (1,395,316 | ) | | | (427,267 | ) | | | (352,306 | ) |
Deposits, restricted cash and other | | | (19,486 | ) | | | 18,512 | | | | (14,758 | ) |
| | | | | | | | | | | | |
Cash used in investing activities | | | (1,949,548 | ) | | | (5,173,337 | ) | | | (2,558,385 | ) |
| | | | | | | | | | | | |
CASH FLOWS FROM FINANCING ACTIVITIES | | | | | | | | | | | | |
Proceeds from (repayments of) short-term borrowings, net | | | — | | | | 8,191 | | | | (55,264 | ) |
Borrowings under credit facilities | | | 2,187,000 | | | | 3,507,000 | | | | 2,582,000 | |
Proceeds from issuance of senior notes, net | | | 1,415,844 | | | | 2,221,792 | | | | 698,670 | |
Proceeds from term loan | | | — | | | | 1,500,000 | | | | 750,000 | |
Proceeds from other long-term borrowings | | | 102,070 | | | | 402,688 | | | | 177,299 | |
Proceeds from issuance of Securities in Securitization transaction, net | | | — | | | | 1,778,496 | | | | — | |
Repayments of notes payable, credit facilities and capital leases | | | (3,903,144 | ) | | | (5,337,339 | ) | | | (2,658,566 | ) |
Contributions from noncontrolling interest holders, net | | | 9,098 | | | | 17,447 | | | | 52,761 | |
Purchases of common stock | | | — | | | | (145,012 | ) | | | (62,728 | ) |
Proceeds from stock options and stock purchase plan | | | 62,276 | | | | 45,496 | | | | 55,441 | |
Distributions paid on common stock | | | (404,631 | ) | | | (434,687 | ) | | | (355,574 | ) |
Distributions paid on preferred stock | | | (16,013 | ) | | | — | | | | — | |
Proceeds from the issuance of preferred stock, net | | | 583,105 | | | | — | | | | — | |
Purchase of preferred stock assumed in an acquisition | | | (59,111 | ) | | | — | | | | — | |
Payment for early retirement of long-term obligations | | | (11,593 | ) | | | (29,234 | ) | | | — | |
Deferred financing costs and other financing activities | | | (34,670 | ) | | | (9,273 | ) | | | (13,673 | ) |
Purchase of noncontrolling interest | | | (64,822 | ) | | | — | | | | — | |
| | | | | | | | | | | | |
Cash (used in) provided by financing activities | | | (134,591 | ) | | | 3,525,565 | | | | 1,170,366 | |
| | | | | | | | | | | | |
Net effect of changes in foreign currency exchange rates on cash and cash equivalents | | | (30,534 | ) | | | (26,317 | ) | | | 12,055 | |
| | | | | | | | | | | | |
NET INCREASE (DECREASE) IN CASH AND CASH EQUIVALENTS | | | 19,916 | | | | (75,042 | ) | | | 38,427 | |
CASH AND CASH EQUIVALENTS, BEGINNING OF YEAR | | | 293,576 | | | | 368,618 | | | | 330,191 | |
| | | | | | | | | | | | |
CASH AND CASH EQUIVALENTS, END OF YEAR | | $ | 313,492 | | | $ | 293,576 | | | $ | 368,618 | |
| | | | | | | | | | | | |
See accompanying notes to consolidated financial statements.
AMERICAN TOWER CORPORATION AND SUBSIDIARIES
NOTES TO CONSOLIDATED FINANCIAL STATEMENTS
1. BUSINESS AND SUMMARY OF SIGNIFICANT ACCOUNTING POLICIES
Business—American Tower Corporation is, through its various subsidiaries (collectively, “ATC” or the “Company”), a global independent owner, operator and developer of communications real estate. The Company’s primary business is the leasing of space on multi-tenant communications sites to wireless service providers, radio and television broadcast companies, wireless data and data providers, government agencies and municipalities and tenants in a number of other industries. The Company also manages rooftop and tower sites for property owners, operates in-building and outdoor distributed antenna system (“DAS”) networks, holds property interests under third-party communications sites and provides network development services that primarily support its rental and management operations.
ATC is a holding company that conducts its operations through its directly and indirectly owned subsidiaries and its joint ventures. ATC’s principal domestic operating subsidiaries are American Towers LLC and SpectraSite Communications, LLC. ATC conducts its international operations primarily through its subsidiary, American Tower International, Inc., which in turn conducts operations through its various international holding and operating subsidiaries and joint ventures.
The Company operates as a real estate investment trust for U.S. federal income tax purposes (“REIT”) and, therefore, is generally not subject to federal income taxes on its income and gains that it distributes to its stockholders, including the income derived from leasing space on its towers. However, even as a REIT, the Company remains obligated to pay income taxes on earnings from its taxable REIT subsidiaries (“TRSs”). In addition, the Company’s international assets and operations, including those designated as direct or indirect qualified REIT subsidiaries or other disregarded entities of a REIT (collectively, “QRSs”), continue to be subject to taxation in the foreign jurisdictions where those assets are held or those operations are conducted.
The use of TRSs enables the Company to continue to engage in certain businesses while complying with REIT qualification requirements. The Company may, from time to time, change the election of previously designated TRSs that hold certain of its operations to be treated as QRSs, and may reorganize and transfer certain assets or operations from its TRSs to other subsidiaries, including QRSs. For all periods subsequent to the conversion from a TRS to a QRS, the Company includes the income from the QRS as part of its REIT taxable income for the purpose of computing its REIT distribution requirements. During the year ended December 31, 2014, the Company restructured certain of its German subsidiaries and certain of its domestic TRSs, which included a portion of its network development services segment and indoor DAS networks business, to be treated as QRSs. As a result, as of December 31, 2014, the Company’s QRSs include its domestic tower leasing business, most of its operations in Costa Rica, Germany and Mexico and a portion of its network development services segment and indoor DAS networks business.
Principles of Consolidation and Basis of Presentation—The accompanying consolidated financial statements include the accounts of the Company and those entities in which it has a controlling interest. Investments in entities that the Company does not control are accounted for using the equity or cost method, depending upon the Company’s ability to exercise significant influence over operating and financial policies. All intercompany accounts and transactions have been eliminated.
Significant Accounting Policies and Use of Estimates—The preparation of financial statements in conformity with accounting principles generally accepted in the United States (“GAAP”) requires management to make estimates and assumptions that affect the amounts reported in the consolidated financial statements and accompanying notes. Actual results may differ from those estimates, and such differences could be material to the accompanying consolidated financial statements. The significant estimates in the accompanying consolidated
AMERICAN TOWER CORPORATION AND SUBSIDIARIES
NOTES TO CONSOLIDATED FINANCIAL STATEMENTS
financial statements include impairment of long-lived assets (including goodwill), asset retirement obligations, revenue recognition, rent expense, stock-based compensation, income taxes and accounting for business combinations. The Company considers events or transactions that occur after the balance sheet date but before the financial statements are issued as additional evidence for certain estimates or to identify matters that require additional disclosure.
Concentrations of Credit Risk—The Company is subject to concentrations of credit risk related to its cash and cash equivalents, notes receivable, accounts receivable, deferred rent asset and derivative financial instruments. The Company mitigates its risk with respect to cash and cash equivalents and derivative financial instruments by maintaining its deposits and contracts at high quality financial institutions and monitoring the credit ratings of those institutions.
The Company derives the largest portion of its revenues, corresponding accounts receivable and the related deferred rent asset from a relatively small number of tenants in the telecommunications industry, and approximately 56% of its current year revenues are derived from four tenants. In addition, the Company has concentrations of credit risk in certain geographic areas.
The Company mitigates its concentrations of credit risk with respect to notes and trade receivables and the related deferred rent assets by actively monitoring the credit worthiness of its borrowers and tenants. In recognizing customer revenue, the Company must assess the collectibility of both the amounts billed and the portion recognized in advance of billing on a straight-line basis.
This assessment takes tenant credit risk and business and industry conditions into consideration to ultimately determine the collectibility of the amounts billed. To the extent the amounts, based on management’s estimates, may not be collectible, recognition is deferred until such point as collectibility is determined to be reasonably assured. Any amounts that were previously recognized as revenue and subsequently determined to be uncollectible are charged to bad debt expense included in Selling, general, administrative and development expense in the accompanying consolidated statements of operations.
Accounts receivable is reported net of allowances for doubtful accounts related to estimated losses resulting from a tenant’s inability to make required payments and allowances for amounts invoiced whose collectibility is not reasonably assured. These allowances are generally estimated based on payment patterns, days past due and collection history, and incorporate changes in economic conditions that may not be reflected in historical trends, such as tenants in bankruptcy, liquidation or reorganization. Receivables are written-off against the allowances when they are determined to be uncollectible. Such determination includes analysis and consideration of the particular conditions of the account. Changes in the allowances were as follows for the years ended December 31, (in thousands):
| | | | | | | | | | | | |
| | | 2014 | | | 2013 | | | 2012 | |
Balance as of January 1 | | $ | 19,895 | | | $ | 20,406 | | | $ | 24,412 | |
Current year increases | | | 8,243 | | | | 7,025 | | | | 8,028 | |
Write-offs, net of recoveries and other | | | (10,832 | ) | | | (7,536 | ) | | | (12,034 | ) |
| | | | | | | | | | | | |
Balance as of December 31 | | $ | 17,306 | | | $ | 19,895 | | | $ | 20,406 | |
| | | | | | | | | | | | |
Functional Currency—The functional currency of each of the Company’s foreign operating subsidiaries is the respective local currency, except for Costa Rica, where the functional currency is the U.S. Dollar. All foreign currency assets and liabilities held by the subsidiaries are translated into U.S. Dollars at the exchange rate in
AMERICAN TOWER CORPORATION AND SUBSIDIARIES
NOTES TO CONSOLIDATED FINANCIAL STATEMENTS
effect at the end of the applicable fiscal reporting period and all foreign currency revenues and expenses are translated at the average monthly exchange rates. Translation adjustments are reflected in equity as a component of Accumulated other comprehensive income (loss) (“AOCI”) in the consolidated balance sheets and included as a component of comprehensive income.
Transactional gains and losses on foreign currency transactions are reflected in Other expense in the consolidated statements of operations. However, the effect from fluctuations in foreign currency exchange rates on intercompany notes whose payment is not planned or anticipated in the foreseeable future is reflected in AOCI in the consolidated balance sheets and included as a component of comprehensive income. During the year ended December 31, 2014, the Company recorded unrealized foreign currency losses of $468.6 million, of which $419.3 million was recorded in AOCI and $49.3 million was recorded in Other expense.
Cash and Cash Equivalents—Cash and cash equivalents include cash on hand, demand deposits and short-term investments, including money market funds, with remaining maturities of three months or less when acquired, whose cost approximates fair value.
Restricted Cash—The Company classifies as restricted cash all cash pledged as collateral to secure obligations and all cash whose use is otherwise limited by contractual provisions, including cash on deposit in reserve accounts relating to the (i) Secured Tower Revenue Securities, Series 2013-1A and Series 2013-2A issued in the Company’s 2013 securitization transaction (the “Securities”), (ii) Secured Cellular Site Revenue Notes, Series 2010-1 Class C, Series 2010-2 Class C and Series 2010-2 Class F (collectively, the “Unison Notes”), assumed by the Company in connection with an acquisition and (iii) six series, consisting of eleven separate classes, of Secured Tower Revenue Notes, of which the Company repaid one series, consisting of two classes, in August 2014 (the remaining notes, the “GTP Notes”) assumed by the Company in connection with an acquisition.
Short-Term Investments—Short-term investments consists of highly-liquid investments with original maturities in excess of three months.
Property and Equipment—Property and equipment is recorded at cost or, in the case of acquired properties, at estimated fair value on the date acquired. Cost for self-constructed towers includes direct materials and labor, capitalized interest and certain indirect costs associated with construction of the tower, such as transportation costs, employee benefits and payroll taxes. The Company begins the capitalization of costs during the pre-construction period, which is the period during which costs are incurred to evaluate the site, and continues to capitalize costs until the tower is substantially completed and ready for occupancy by a tenant. Labor costs capitalized for the years ended December 31, 2014, 2013 and 2012 were $48.5 million, $44.1 million and $41.6 million, respectively. Interest costs capitalized for the years ended December 31, 2014, 2013 and 2012 were $2.8 million, $1.8 million and $1.9 million, respectively.
Expenditures for repairs and maintenance are expensed as incurred. Augmentation and improvements that extend an asset’s useful life or enhance capacity are capitalized.
Depreciation is recorded using the straight-line method over the assets’ estimated useful lives. Towers and related assets on leased land are depreciated over the shorter of the estimated useful life of the asset or the term of the corresponding ground lease, taking into consideration lease renewal options and residual value.
Towers or assets acquired through capital leases are reflected in Property and equipment, net at the present value of future minimum lease payments or the fair value of the leased asset at the inception of the lease. Property and equipment, network location intangibles and assets held under capital leases are amortized over the shorter of the applicable lease term or the estimated useful life of the respective assets for periods generally not exceeding twenty years.
AMERICAN TOWER CORPORATION AND SUBSIDIARIES
NOTES TO CONSOLIDATED FINANCIAL STATEMENTS
Goodwill and Other Intangible Assets—The Company reviews goodwill for impairment at least annually (as of December 31) or whenever events or circumstances indicate the carrying value of an asset may not be recoverable.
Goodwill is recorded in the applicable segment and assessed for impairment at the reporting unit level. The Company utilizes the two-step impairment test when testing goodwill for impairment and employs a discounted cash flow analysis. The key assumptions utilized in the discounted cash flow analysis include current operating performance, terminal sales growth rate, management’s expectations of future operating results and cash requirements, the current weighted average cost of capital and an expected tax rate. Under the first step of this test, the Company compares the fair value of the reporting unit, as calculated under an income approach using future discounted cash flows, to the carrying amount of the applicable reporting unit. If the carrying amount exceeds the fair value, the Company conducts the second step of this test, in which the implied fair value of the applicable reporting unit’s goodwill is compared to the carrying amount of that goodwill. If the carrying amount of goodwill exceeds its implied fair value, an impairment loss would be recognized for the amount of the excess.
During the years ended December 31, 2014, 2013 and 2012, no potential impairment was identified under the first step of the test, as the fair value of each of the reporting units was in excess of its carrying amount.
Intangible assets that are separable from goodwill and are deemed to have a definite life are amortized over their useful lives, generally ranging from three to twenty years and are evaluated separately for impairment at least annually or whenever events or circumstances indicate that the carrying amount of an asset may not be recoverable.
Deferred Rent Asset—The Company’s deferred rent asset is associated with non-cancellable tenant leases that contain fixed escalation clauses over the terms of the applicable lease in which revenue is recognized on a straight-line basis over the lease term.
Notes Receivable and Other Non-Current Assets—Notes receivable and other non-current assets primarily consists of prepaid ground lease assets, value added tax receivable, notes receivable from TV Azteca, long-term deposits, favorable leasehold interests and other non-current assets.
Derivative Financial Instruments—Derivatives are recorded on the consolidated balance sheet at fair value. If a derivative is designated as a cash flow hedge, the effective portions of changes in the fair value of the derivative are recorded in AOCI, as well as a component of comprehensive income, and are recognized in the results of operations when the hedged item affects earnings. Changes in fair value of the ineffective portions of cash flow hedges are recognized in the results of operations. For derivative instruments not designated as hedging instruments, changes in fair value are recognized in the results of operations in the period that the change occurs.
The primary risk managed through the use of derivative instruments is interest rate risk. From time to time, the Company enters into interest rate protection agreements to manage exposure to variability in cash flows relating to forecasted interest payments. Under these agreements, the Company is exposed to credit risk to the extent that a counterparty fails to meet the terms of a contract. The Company’s credit risk exposure is limited to the current value of the contract at the time the counterparty fails to perform.
The Company assesses, both at the inception of the hedge and on an ongoing basis, whether the derivatives that are used in hedging transactions are highly effective in offsetting changes in cash flows of hedged items. The Company does not hold derivatives for trading purposes.
AMERICAN TOWER CORPORATION AND SUBSIDIARIES
NOTES TO CONSOLIDATED FINANCIAL STATEMENTS
The Company may also enter into foreign currency financial instruments in anticipation of future transactions in order to minimize the risk of currency fluctuations. These transactions do not typically qualify for hedge accounting, and as a result, the associated gains and losses are recognized in Other income (expense) in the consolidated statements of operations.
Fair Value Measurements—The Company determines the fair value of its financial instruments based on the fair value hierarchy, which requires an entity to maximize the use of observable inputs and minimize the use of unobservable inputs when measuring fair value.
Discount and Premium on Notes—The Company amortizes the discounts and premiums on its notes using the effective interest method over the term of the obligation. Such amortization is reflected in Interest expense and Interest income, TV Azteca, net in the accompanying consolidated statements of operations.
Asset Retirement Obligations—When required, the Company recognizes the fair value of obligations to remove its tower assets and remediate the leased land upon which certain of its tower assets are located. Generally, the associated retirement costs are capitalized as part of the carrying amount of the related tower assets and depreciated over their estimated useful lives and the liability is accreted through the obligation’s estimated settlement date. Fair value estimates of asset retirement obligations generally involve discounting of estimated future cash flows. Periodic accretion of such liabilities due to the passage of time is included in Depreciation, amortization and accretion in the consolidated statements of operations. Adjustments are also made to the asset retirement obligation liability to reflect changes in the estimates of timing and amount of expected cash flows, with an offsetting adjustment made to the related tangible long-lived asset. The significant assumptions used in estimating the Company’s aggregate asset retirement obligation are: timing of tower removals; cost of tower removals; timing and number of land lease renewals; expected inflation rates; and credit-adjusted, risk-free interest rates that approximate the Company’s incremental borrowing rate.
Income Taxes—As a REIT, the Company is generally not subject to federal income taxes on income and gains distributed to the Company’s stockholders. However, the Company remains obligated to pay income taxes on earnings from domestic TRSs. In addition, the Company’s international assets and operations continue to be subject to taxation in the foreign jurisdictions where those assets are held or where those operations are conducted, including those designated as QRSs for federal income tax purposes. Accordingly, the consolidated financial statements reflect provisions for federal, state, local and foreign income taxes. The Company recognizes deferred tax assets and liabilities for the future tax consequences attributable to differences between the financial statement carrying amounts of existing assets and liabilities and their respective tax basis, as well as operating loss and tax credit carryforwards. The Company measures deferred tax assets and liabilities using enacted tax rates expected to apply to taxable income in the years in which those temporary differences and carryforwards are expected to be recovered or settled. The effect on deferred tax assets and liabilities as a result of a change in tax rates is recognized in income in the period that includes the enactment date.
The Company periodically reviews its deferred tax assets, and records a valuation allowance if, based on the available evidence, it is more likely than not that some or all of the deferred tax assets will not be realized. Management assesses the available positive and negative evidence to estimate if sufficient future taxable income will be generated to use the existing deferred tax assets. Valuation allowances would be reversed as a reduction to the provision for income taxes if related deferred tax assets are deemed realizable based on changes in facts and circumstances relevant to the assets’ recoverability.
The Company classifies uncertain tax positions as non-current income tax liabilities unless expected to be paid within one year. The Company reports penalties and tax-related interest expense as a component of the income tax provision and interest income from tax refunds as a component of Other income (expense) in the consolidated statements of operations.
AMERICAN TOWER CORPORATION AND SUBSIDIARIES
NOTES TO CONSOLIDATED FINANCIAL STATEMENTS
Other Comprehensive Income (Loss)—Other comprehensive income (loss) refers to items excluded from net income that are recorded as an adjustment to equity, net of tax. The Company’s other comprehensive income (loss) is primarily comprised of changes in fair value of effective derivative cash flow hedges, foreign currency translation adjustments and reclassification of unrealized losses on effective derivative cash flow hedges.
Treasury Stock—The Company records repurchases of its common stock using the cost method, whereby the purchase price, including legal costs and commissions, is recorded in a contra equity account, Treasury stock. The equity accounts from which the shares were originally issued are not adjusted for any treasury stock purchases unless and until such time as the shares are formally retired or reissued. As part of the Company’s conversion to a REIT, all treasury stock outstanding at the time was retired.
Distributions—As a REIT, the Company must annually distribute to its stockholders an amount equal to at least 90% of its REIT taxable income (determined before the deduction for distributed earnings and excluding any net capital gain). Generally, the Company has distributed, and expects to continue to distribute all or substantially all of its REIT taxable income after taking into consideration its utilization of net operating loss carryforwards (“NOLs”). During the years ended December 31, 2014, 2013 and 2012, the Company declared regular cash distributions to its common stockholders of an aggregate of $554.6 million, or $1.40 per share, $434.5 million, or $1.10 per share, and $355.6 million, or $0.90 per share, respectively.
During the year ended December 31, 2014, the Company declared an aggregate of $23.9 million, or $3.98 per share in cash distributions to its preferred stockholders.
The amount, timing and frequency of future distributions will be at the sole discretion of the Board of Directors and will be declared based upon various factors, a number of which may be beyond the Company’s control, including the financial condition and operating cash flows, the amount required to maintain its qualification for taxation as a REIT and reduce any income and excise taxes that the Company otherwise would be required to pay, limitations on distributions in the Company’s existing and future debt and preferred equity instruments, the Company’s ability to utilize NOLs to offset the Company’s distribution requirements, limitations on its ability to fund distributions using cash generated through its TRSs and other factors that the Board of Directors may deem relevant.
Acquisitions—For acquisitions that meet the definition of a business combination, the Company applies the acquisition method of accounting where assets acquired and liabilities assumed are recorded at fair value at the date of each acquisition, and the results of operations are included with those of the Company from the dates of the respective acquisitions. Any excess of the purchase price paid by the Company over the amounts recognized for assets acquired and liabilities assumed is recorded as goodwill. The Company continues to evaluate acquisitions for a period not to exceed one year after the applicable acquisition date of each transaction to determine whether any additional adjustments are needed to the allocation of the purchase price paid for the assets acquired and liabilities assumed. The fair value of the assets acquired and liabilities assumed is typically determined by using either estimates of replacement costs or discounted cash flow valuation methods. When determining the fair value of tangible assets acquired, the Company must estimate the cost to replace the asset with a new asset taking into consideration such factors as age, condition and the economic useful life of the asset. When determining the fair value of intangible assets acquired, the Company must estimate the applicable discount rate and the timing and amount of future customer cash flows, including rate and terms of renewal and attrition.
Revenue Recognition—The Company’s revenue from leasing arrangements, including fixed escalation clauses present in non-cancellable lease agreements, is reported on a straight-line basis over the term of the respective
AMERICAN TOWER CORPORATION AND SUBSIDIARIES
NOTES TO CONSOLIDATED FINANCIAL STATEMENTS
leases when collectibility is reasonably assured. Escalation clauses tied to the Consumer Price Index (“CPI”) or other inflation-based indices, and other incentives present in lease agreements with the Company’s tenants are excluded from the straight-line calculation. Total rental and management straight-line revenues for the years ended December 31, 2014, 2013 and 2012 approximated $123.7 million, $147.7 million and $165.8 million, respectively. Amounts billed upfront in connection with the execution of lease agreements are initially deferred and reflected in Unearned revenue in the accompanying consolidated balance sheets and recognized as revenue over the terms of the applicable leases. Amounts billed or received for services prior to being earned are deferred and reflected in Unearned revenue in the accompanying consolidated balance sheets until the criteria for recognition have been met.
Network development services revenues are derived under contracts or arrangements with customers that provide for billings either on a fixed price basis or a variable price basis, which includes factors such as time and expenses. Revenues are recognized as services are performed, and include estimates for percentage completed. Amounts billed or received for services prior to being earned are deferred and reflected in Unearned revenue in the accompanying consolidated balance sheets until the criteria for recognition have been met.
Rent Expense—Many of the leases underlying the Company’s tower sites have fixed rent escalations, which provide for periodic increases in the amount of ground rent payable by the Company over time. In addition, certain of the Company’s tenant leases require the Company to exercise available renewal options pursuant to the underlying ground lease if the tenant exercises its renewal option. The Company calculates straight-line ground rent expense for these leases based on the fixed non-cancellable term of the underlying ground lease plus all periods, if any, for which failure to renew the lease imposes an economic penalty to the Company such that renewal appears to be reasonably assured.
Total rental and management straight-line ground rent expense for the years ended December 31, 2014, 2013 and 2012 approximated $38.4 million, $29.7 million and $33.7 million, respectively. The Company’s liability for straight-line ground rent expense is recorded in Other non-current liabilities. The Company records prepaid ground rent in Prepaid and other current assets and Notes receivable and other non-current assets in the accompanying consolidated balance sheets according to the anticipated period of benefit.
Selling, General, Administrative and Development Expense—Selling, general and administrative expense consists of overhead expenses related to the Company’s rental and management and services operations and corporate overhead costs not specifically allocable to any of the Company’s individual business operations. Development expense consists of costs related to the Company’s acquisition efforts, costs associated with new business initiatives and project cancellation costs.
Stock-Based Compensation—Stock-based compensation expense is measured at the accounting measurement date based on the fair value of the award and is recognized as an expense over the service period, which generally represents the vesting period. The Company’s Compensation Committee adopted a death, disability and retirement benefits program in connection with equity awards granted on or after January 1, 2013 that provides for accelerated vesting and extended exercise periods of stock options and restricted stock units upon an employee’s death or permanent disability, or upon an employee’s qualified retirement, provided certain eligibility criteria are met. Accordingly, for grants made on or after January 1, 2013, the Company recognizes compensation expense for all stock-based compensation over the shorter of (i) the four-year vesting period or (ii) the period from the date of grant to the date the employee becomes eligible for such retirement benefits, which may occur upon grant. The expense recognized over the service period includes an estimate of awards that will not fully vest and be forfeited. The fair value of stock options is determined using the Black-Scholes option-pricing model and the fair value of restricted stock units is based on the fair value of the Company’s common
AMERICAN TOWER CORPORATION AND SUBSIDIARIES
NOTES TO CONSOLIDATED FINANCIAL STATEMENTS
stock on the date of grant. The Company recognizes stock-based compensation expense in either Selling, general, administrative and development expense, costs of operations or as part of the costs associated with the construction of the tower assets.
Litigation Costs—The Company periodically becomes involved in various claims and lawsuits that are incidental to its business. The Company regularly monitors the status of pending legal actions to evaluate both the magnitude and likelihood of any potential loss. The Company accrues for these potential losses when it is probable that a liability has been incurred and the amount of loss, or possible range of loss, can be reasonably estimated. Should the ultimate losses on contingencies or litigation vary from estimates, adjustments to those liabilities may be required. The Company also incurs legal costs in connection with these matters and records estimates of these expenses, which are reflected in Selling, general, administrative and development expense in the accompanying consolidated statements of operations.
Other Operating Expenses—Other operating expenses includes the costs incurred by the Company in conjunction with acquisitions and mergers (including changes in estimated fair value of contingent consideration), impairments on long-lived assets and gains and losses recognized upon the disposal of long-lived assets and other discrete items of a non-recurring nature.
The Company reviews long-lived assets, including intangible assets subject to amortization, for impairment whenever events, changes in circumstances or other evidence indicate that the carrying amount of the Company’s assets may not be recoverable.
The Company reviews its tower portfolio and network location intangible assets for indications of impairment on an individual tower basis. Impairments primarily result from a tower not having current tenant leases or from having expenses in excess of revenues. The Company monitors its customer-related intangible assets on a customer by customer basis for indicators of impairment, such as high levels of turnover or attrition, non-renewal of a significant number of contracts, or the cancellation or termination of a relationship. The Company assesses recoverability by determining whether the carrying amount of the related assets will be recovered, either through projected undiscounted future cash flows or anticipated proceeds from sales of the assets. If the Company determines that the carrying amount of an asset may not be recoverable, the Company will measure any impairment loss based on the projected future discounted cash flows to be provided from the asset or available market information relative to the asset’s fair value, as compared to the asset’s carrying amount. The Company records any related impairment charge in the period in which the Company identifies such impairment.
Loss on Retirement of Long-Term Obligations—Loss on retirement of long-term obligations primarily includes cash paid to retire debt in excess of its carrying value, non-cash charges related to the write-off of deferred financing fees, losses associated with the settlement of interest rate swaps and the write-off of any discounts or premiums. In 2014, Loss on retirement of long-term obligations includes amounts associated with the acquisition of BR Towers’ preferred equity.
Earnings Per Common Share—Basic and Diluted—Basic net income per common share represents net income attributable to American Tower Corporation common stockholders divided by the weighted average number of common shares outstanding during the period. Diluted net income per common share represents net income attributable to American Tower Corporation common stockholders divided by the weighted average number of common shares outstanding during the period and any dilutive common share equivalents, including shares issuable (i) upon the vesting of restricted stock awards, (ii) upon exercise of stock options and (iii) upon conversion of the Mandatory Convertible Preferred Stock. Dilutive common share equivalents also include the dilutive impact of the ALLTEL transaction. The Company uses the treasury stock method to calculate the effect
AMERICAN TOWER CORPORATION AND SUBSIDIARIES
NOTES TO CONSOLIDATED FINANCIAL STATEMENTS
of its outstanding restricted stock awards and stock options and uses the if-converted method to calculate the effect of its outstanding Mandatory Convertible Preferred Stock.
Retirement Plan—The Company has a 401(k) plan covering substantially all employees who meet certain age and employment requirements. For the years ended December 31, 2014 and 2013, the Company matched 75% of the first 6% of a participant’s contributions. The Company’s matching contribution for the year ended December 31, 2012 was 50% of the first 6% of a participant’s contributions. For the years ended December 31, 2014, 2013 and 2012, the Company contributed approximately $6.5 million, $6.0 million and $4.4 million to the plan, respectively.
Accounting Standards Updates—In April 2014, the Financial Accounting Standards Board (the “FASB”) issued additional guidance on reporting discontinued operations. Under this guidance, only disposals representing a strategic shift in operations would be presented as discontinued operations. This guidance requires expanded disclosure that provides information about the assets, liabilities, income and expenses of discontinued operations. Additionally, the guidance requires additional disclosure for a disposal of a significant part of an entity that does not qualify for discontinued operations reporting. This guidance is effective for reporting periods beginning on or after December 15, 2014, with early adoption permitted for disposals or classifications of assets as held-for-sale that have not been reported in financial statements previously issued or available for issuance. The Company chose to early adopt this guidance during the year ended December 31, 2014 and the adoption did not have a material effect on the Company’s financial statements.
In May 2014, the FASB issued new revenue recognition guidance, which requires an entity to recognize revenue in an amount that reflects the consideration to which the entity expects to be entitled in exchange for the transfer of promised goods or services to customers. The standard will replace most existing revenue recognition guidance in GAAP and will become effective on January 1, 2017. The standard permits the use of either the retrospective or cumulative effect transition method, and leases are not included in the scope of this standard. The Company is evaluating the impact this standard may have on its financial statements.
2. PREPAID AND OTHER CURRENT ASSETS
Prepaid and other current assets consists of the following as of December 31, (in thousands):
| | | | | | | | |
| | | 2014 | | | 2013(1) | |
Prepaid operating ground leases | | $ | 88,508 | | | $ | 96,881 | |
Prepaid income tax | | | 34,512 | | | | 52,612 | |
Unbilled receivables | | | 25,352 | | | | 25,412 | |
Prepaid assets | | | 23,848 | | | | 34,243 | |
Value added tax and other consumption tax receivables | | | 23,228 | | | | 77,016 | |
Other miscellaneous current assets | | | 59,174 | | | | 61,253 | |
| | | | | | | | |
Balance as of December 31, | | $ | 254,622 | | | $ | 347,417 | |
| | | | | | | | |
(1) | December 31, 2013 balances have been revised to reflect purchase accounting measurement period adjustments. |
AMERICAN TOWER CORPORATION AND SUBSIDIARIES
NOTES TO CONSOLIDATED FINANCIAL STATEMENTS
3. PROPERTY AND EQUIPMENT
Property and equipment (including assets held under capital leases) consists of the following as of December 31, (in thousands):
| | | | | | | | | | | | |
| | | Estimated
Useful Lives
(years) (1) | | | 2014 | | | 2013 (2) | |
Towers | | | Up to 20 | | | $ | 8,300,387 | | | $ | 7,933,917 | |
Equipment | | | 2 - 15 | | | | 995,667 | | | | 762,738 | |
Buildings and improvements | | | 3 - 32 | | | | 618,889 | | | | 607,540 | |
Land and improvements (3) | | | Up to 20 | | | | 1,566,096 | | | | 1,369,969 | |
Construction-in-progress | | | | | | | 214,760 | | | | 170,292 | |
| | | | | | | | | | | | |
Total | | | | | | | 11,695,799 | | | | 10,844,456 | |
Less accumulated depreciation and amortization | | | | | | | (4,068,982 | ) | | | (3,666,728 | ) |
| | | | | | | | | | | | |
Property and equipment, net | | | | | | $ | 7,626,817 | | | $ | 7,177,728 | |
| | | | | | | | | | | | |
(1) | Assets on leased land are depreciated over the shorter of the estimated useful life of the asset or the term of the corresponding ground lease taking into consideration lease renewal options and residual value. |
(2) | December 31, 2013 balances have been revised to reflect purchase accounting measurement period adjustments. |
(3) | Estimated useful lives apply to land improvements only. |
Depreciation expense for the years ended December 31, 2014, 2013 and 2012 was $551.8 million, $483.6 million and $411.9 million, respectively. Property and equipment, net includes approximately $1,111.6 million and $839.0 million of capital leases, which are primarily classified as either towers or land and improvements as of December 31, 2014 and 2013, respectively.
4. GOODWILL AND OTHER INTANGIBLE ASSETS
The changes in the carrying value of goodwill for the Company’s business segments are as follows (in thousands):
| | | | | | | | | | | | | | | | |
| | | Rental and Management | | | Network
Development
Services | | | Total | |
| | | Domestic | | | International | | | |
Balance as of January 1, 2013 | | $ | 2,320,571 | | | $ | 520,072 | | | $ | 2,000 | | | $ | 2,842,643 | |
Additions | | | 973,328 | | | | 91,249 | | | | — | | | | 1,064,577 | |
Effect of foreign currency translation | | | — | | | | (52,418 | ) | | | — | | | | (52,418 | ) |
| | | | | | | | | | | | | | | | |
Balance as of December 31, 2013 (1) | | $ | 3,293,899 | | | $ | 558,903 | | | $ | 2,000 | | | $ | 3,854,802 | |
| | | | | | | | | | | | | | | | |
Additions | | | 48,247 | | | | 168,966 | | | | — | | | | 217,213 | |
Effect of foreign currency translation | | | — | | | | (51,280 | ) | | | — | | | | (51,280 | ) |
Other (2) | | | — | | | | (3,641 | ) | | | (12 | ) | | | (3,653 | ) |
| | | | | | | | | | | | | | | | |
Balance as of December 31, 2014 | | $ | 3,342,146 | | | $ | 672,948 | | | $ | 1,988 | | | $ | 4,017,082 | |
| | | | | | | | | | | | | | | | |
(1) | Balances have been revised to reflect purchase accounting measurement period adjustments. |
(2) | Other represents the goodwill associated with the Company’s operations in Panama and the Company’s third-party structural analysis business. Both businesses were sold during the year ended December 31, 2014 (see note 12). |
AMERICAN TOWER CORPORATION AND SUBSIDIARIES
NOTES TO CONSOLIDATED FINANCIAL STATEMENTS
The Company’s other intangible assets subject to amortization consist of the following:
| | | | | | | | | | | | | | | | | | | | | | | | | | | | |
| | | | | | As of December 31, 2014 | | | As of December 31, 2013 (1) | |
| | | Estimated
Useful
Lives | | | Gross
Carrying
Value | | | Accumulated
Amortization | | | Net Book
Value | | | Gross
Carrying
Value | | | Accumulated
Amortization | | | Net Book
Value | |
| | | (years) | | | (in thousands) | |
Acquired network location intangibles (2) | | | Up to 20 | | | $ | 2,513,763 | | | $ | (901,903 | ) | | $ | 1,611,860 | | | $ | 2,418,153 | | | $ | (791,359 | ) | | $ | 1,626,794 | |
Acquired customer-related intangibles | | | 15-20 | | | | 6,579,094 | | | | (1,429,572 | ) | | | 5,149,522 | | | | 6,017,849 | | | | (1,170,239 | ) | | | 4,847,610 | |
Acquired licenses and other intangibles | | | 3-20 | | | | 43,012 | | | | (3,514 | ) | | | 39,498 | | | | 6,583 | | | | (2,297 | ) | | | 4,286 | |
Economic Rights, TV Azteca | | | 70 | | | | 25,522 | | | | (12,960 | ) | | | 12,562 | | | | 28,783 | | | | (14,229 | ) | | | 14,554 | |
| | | | | | | | | | | | | | | | | | | | | | | | | | | | |
Total | | | | | | $ | 9,161,391 | | | $ | (2,347,949 | ) | | $ | 6,813,442 | | | $ | 8,471,368 | | | $ | (1,978,124 | ) | | $ | 6,493,244 | |
Deferred financing costs,
net (3) | | | N/A | | | | | | | | | | | | 75,889 | | | | | | | | | | | | 76,875 | |
| | | | | | | | | | | | | | | | | | | | | | | | | | | | |
Other intangible assets, net | | | | | | | | | | | | | | $ | 6,889,331 | | | | | | | | | | | $ | 6,570,119 | |
| | | | | | | | | | | | | | | | | | | | | | | | | | | | |
(1) | December 31, 2013 balances have been revised to reflect purchase accounting measurement period adjustments. |
(2) | Acquired network location intangibles are amortized over the shorter of the term of the corresponding ground lease taking into consideration lease renewal options and residual value or up to 20 years, as the Company considers these intangibles to be directly related to the tower assets. |
(3) | Deferred financing costs are amortized over the term of the respective debt instruments to which they relate using the effective interest method. This amortization is included in Interest expense, rather than in Depreciation, amortization and accretion expense. |
The acquired network location intangibles represent the value to the Company of the incremental revenue growth which could potentially be obtained from leasing the excess capacity on acquired communications sites. The acquired customer-related intangibles typically represent the value to the Company of customer contracts and relationships in place at the time of an acquisition, including assumptions regarding estimated renewals.
AMERICAN TOWER CORPORATION AND SUBSIDIARIES
NOTES TO CONSOLIDATED FINANCIAL STATEMENTS
The Company amortizes its acquired network location intangibles and customer-related intangibles on a straight-line basis over the estimated useful lives. As of December 31, 2014, the remaining weighted average amortization period of the Company’s intangible assets, excluding deferred financing costs and the TV Azteca Economic Rights detailed in note 5, is approximately 15 years. Amortization of intangible assets for the years ended December 31, 2014, 2013 and 2012 aggregated approximately $411.7 million, $282.5 million and $207.3 million, respectively. Amortization expense excludes amortization of deferred financing costs, which is included in Interest expense on the consolidated statements of operations. Based on current exchange rates, the Company expects to record amortization expense (excluding amortization of deferred financing costs) as follows over the next five subsequent years (in millions):
| | | | |
Year Ending December 31, | | | | |
2015 | | $ | 430.8 | |
2016 | | | 424.4 | |
2017 | | | 422.7 | |
2018 | | | 421.8 | |
2019 | | | 419.9 | |
5. NOTES RECEIVABLE AND OTHER NON-CURRENT ASSETS
Notes receivable and other non-current assets consists of the following as of December 31, (in thousands):
| | | | | | | | |
| | | 2014 | | | 2013 (1) | |
Long-term prepaid ground rent | | $ | 310,232 | | | $ | 217,983 | |
Notes receivable | | | 87,515 | | | | 89,381 | |
Other miscellaneous assets | | | 168,707 | | | | 201,809 | |
| | | | | | | | |
Balance as of December 31, | | $ | 566,454 | | | $ | 509,173 | |
| | | | | | | | |
(1) | December 31, 2013 balances have been revised to reflect purchase accounting measurement period adjustments. |
TV Azteca Note Receivable—In 2000, the Company loaned TV Azteca, S.A. de C.V. (“TV Azteca”), the owner of a major national television network in Mexico, $119.8 million. The loan has an interest rate of 13.11%, payable quarterly, which at the time of issuance was determined to be below market and therefore a corresponding discount was recorded. The term of the loan is seventy years; however, the loan may be prepaid by TV Azteca without penalty during the last fifty years of the agreement. The discount on the loan is being amortized to Interest income, TV Azteca, net of interest expense on the Company’s consolidated statements of operations, using the effective interest method over the seventy-year term of the loan.
During the year ended December 31, 2013, TV Azteca made a payment of $34.4 million, which included $28.0 million of principal on the loan, related interest and a prepayment penalty of $4.9 million in accordance with the terms of the agreement. In addition during the year ended December 31, 2013, the Company recorded additional interest income of $2.7 million related to the write-off of a portion of the unamortized discount associated with the original loan. As of December 31, 2014, the outstanding balance on the loan is $91.8 million, or $82.9 million, net of discount.
TV Azteca Economic Rights—Simultaneous with the signing of the loan agreement, the Company also entered into a seventy-year Economic Rights Agreement with TV Azteca regarding space not used by TV Azteca on approximately 190 of its broadcast towers. In exchange for the issuance of the below market interest rate loan
AMERICAN TOWER CORPORATION AND SUBSIDIARIES
NOTES TO CONSOLIDATED FINANCIAL STATEMENTS
and the annual payment of $1.5 million to TV Azteca (under the Economic Rights Agreement), the Company has the right to market and lease the unused tower space on the broadcast towers (the “Economic Rights”). TV Azteca retains title to these towers and is responsible for their operation and maintenance. The Company is entitled to 100% of the revenues generated from leases with tenants on the unused space and is responsible for any incremental operating expenses associated with those tenants.
The term of the Economic Rights Agreement is seventy years; however, TV Azteca has the right to purchase, at fair market value, the Economic Rights from the Company at any time during the last fifty years of the agreement. Should TV Azteca elect to purchase the Economic Rights, in whole or in part, it would also be obligated to repay a proportional amount of the loan discussed above at the time of such election. The Company’s obligation to pay TV Azteca $1.5 million annually would also be reduced proportionally.
The Company accounted for the annual payment of $1.5 million as a capital lease by initially recording an asset and a corresponding liability of approximately $18.6 million. The capital lease asset also includes the original discount on the note. The capital lease asset and original discount on the note aggregated approximately $30.2 million at the time of the transaction and represents the cost to acquire the Economic Rights. The Economic Rights asset is recorded as an intangible asset and is being amortized over the seventy-year life of the Economic Rights Agreement.
6. ACQUISITIONS
All of the acquisitions described below are accounted for as business combinations and are consistent with the Company’s strategy to expand in selected geographic areas.
The estimates of the fair value of the assets acquired and liabilities assumed at the date of the applicable acquisition are subject to adjustment during the measurement period (up to one year from the particular acquisition date). The primary areas of the accounting for the acquisitions that are not yet finalized relate to the fair value of certain tangible and intangible assets acquired and liabilities assumed, including contingent consideration, and residual goodwill and any related tax impact. The fair value of these net assets acquired are based on management’s estimates and assumptions, as well as other information compiled by management, including valuations that utilize customary valuation procedures and techniques. While the Company believes that such preliminary estimates provide a reasonable basis for estimating the fair value of assets acquired and liabilities assumed, it will evaluate any necessary information prior to finalization of the fair value. During the measurement period, the Company will adjust assets or liabilities if new information is obtained about facts and circumstances that existed as of the acquisition date that, if known, would have resulted in the revised estimated values of those assets or liabilities as of that date. The effect of measurement period adjustments to the estimated fair value is reflected as if the adjustments had been completed on the acquisition date. The impact of all changes that do not qualify as measurement period adjustments are included in current period earnings. If the actual results differ from the estimates and judgments used in these fair values, the amounts recorded in the consolidated financial statements could be subject to a possible impairment of the intangible assets or goodwill, or require acceleration of the amortization expense of intangible assets in subsequent periods. During the year ended December 31, 2014, the Company made certain measurement period adjustments related to several acquisitions consummated in 2013 and therefore retrospectively adjusted the fair value of the assets acquired and liabilities assumed in the consolidated balance sheet as of December 31, 2013.
Impact of current year acquisitions—The Company typically acquires communications sites from wireless carriers or other tower operators and subsequently integrates those sites into its existing portfolio of communications sites. The financial results of the Company’s acquisitions have been included in the Company’s
AMERICAN TOWER CORPORATION AND SUBSIDIARIES
NOTES TO CONSOLIDATED FINANCIAL STATEMENTS
consolidated statements of operations for the year ended December 31, 2014 from the date of the respective acquisition. The date of acquisition, and by extension the point at which the Company begins to recognize the results of an acquisition, may be dependent upon, among other things, the receipt of contractual consents, the commencement and extent of leasing arrangements and the timing of the transfer of title or rights to the assets, which may be accomplished in phases. Sites acquired from communications service providers may never have been operated as a business and may have been utilized solely by the seller as a component of its network infrastructure. An acquisition, depending on its size and nature, may or may not involve the transfer of business operations or employees.
The estimated aggregate impact of the 2014 acquisitions on the Company’s revenues and gross margin for the year ended December 31, 2014 is approximately $47.0 million and $37.6 million, respectively. The revenues and gross margin amounts also reflect incremental revenues from the addition of new tenants to the acquired sites subsequent to the date of acquisition. Incremental amounts of segment selling, general, administrative and development expense have not been reflected as the amounts attributable to acquisitions are not comparable.
The Company recognizes acquisition and merger related costs in the period in which they are incurred and services are received. Acquisition and merger related costs may include finder’s fees, advisory, legal, accounting, valuation and other professional or consulting fees, fair value adjustments to contingent consideration and general administrative costs directly related to the transaction, and are included in Other operating expenses in the consolidated statements of operations. During the years ended December 31, 2014, 2013 and 2012, the Company recognized acquisition and merger related expenses of $27.0 million, $36.2 million and $25.6 million, respectively. In addition, during the years ended December 31, 2014 and December 31, 2013, the Company recorded $13.1 million and $1.4 million, respectively, of integration costs related to recently closed acquisitions.
2014 Acquisitions
BR Towers Acquisition—On November 19, 2014, the Company completed the acquisition of 100% of the equity interests of BR Towers S.A., a Brazilian telecommunications real estate company (“BR Towers”). At closing, BR Towers owned 2,504 towers and four property interests, as well as the exclusive use rights for 2,113 additional towers and 43 property interests in Brazil. The Company completed the acquisition for an estimated preliminary purchase price of approximately $568.9 million and paid approximately $61.1 million to acquire all outstanding preferred equity. In addition, the Company assumed approximately $261.1 million of BR Towers’ existing indebtedness and repaid approximately $122.1 million of principal balance subsequent to closing. The purchase price is subject to post-closing adjustments.
Richland Acquisition—On April 3, 2014, the Company, through one of its wholly-owned subsidiaries, acquired entities holding a portfolio of 59 communications sites, which at the time of acquisition were leased primarily to radio and television broadcast tenants, and four property interests in the United States from Richland Properties LLC and other related entities (“Richland”) for a purchase price of $189.4 million, which includes approximately $6.5 million payable to the seller upon satisfaction of certain closing conditions. In addition, the Company assumed $196.5 million of Richland’s existing indebtedness. In June 2014, the Company repaid the outstanding indebtedness, paid prepayment consideration and wrote-off the unamortized premium associated with the fair value adjustment. The purchase price is subject to post-closing adjustments.
Other International Acquisitions—During the year ended December 31, 2014, the Company acquired a total of 159 communications sites and related assets in Brazil, Ghana, Mexico and Uganda, for total purchase price of $28.3 million (including value added tax of $1.2 million). The Company also acquired 299 communications sites in Mexico for a purchase price of $40.3 million (including value added tax of $5.6 million), which reflectsapproximately $3.4 million of net liabilities assumed. Total purchase price was satisfied by the issuance of approximately $36.3 million of credits to be applied against trade accounts receivable and cash consideration of approximately $4.0 million.
AMERICAN TOWER CORPORATION AND SUBSIDIARIES
NOTES TO CONSOLIDATED FINANCIAL STATEMENTS
Other U.S. Acquisitions—During the year ended December 31, 2014, the Company acquired a total of 184 communications sites and equipment, as well as six property interests, in the United States for total purchase price of $180.8 million (including $6.3 million for the estimated fair value of contingent consideration). The purchase price is subject to post-closing adjustments.
The following table summarizes the preliminary allocation, unless otherwise noted, of the purchase price for the fiscal year 2014 acquisitions based upon their estimated fair value at the date of acquisition (in thousands). Balances are reflected in the accompanying consolidated balance sheets as of December 31, 2014.
| | | | | | | | | | | | | | | | |
| | | BR Towers | | | Richland | | | International (1) | | | Other U.S. | |
Current assets | | $ | 31,832 | | | $ | 8,583 | | | $ | 7,072 | | | $ | 797 | |
Non-current assets | | | 9,135 | | | | — | | | | 1,521 | | | | — | |
Property and equipment | | | 141,422 | | | | 185,777 | | | | 32,225 | | | | 38,413 | |
Intangible assets (2): | | | | | | | | | | | | | | | | |
Customer-related intangible assets | | | 495,279 | | | | 169,452 | | | | 20,217 | | | | 89,990 | |
Network location intangible assets | | | 136,233 | | | | 1,700 | | | | 10,729 | | | | 39,470 | |
Other intangible assets | | | 37,664 | | | | — | | | | — | | | | — | |
Current liabilities | | | (23,930 | ) | | | (3,635 | ) | | | (863 | ) | | | (1,997 | ) |
Other non-current liabilities | | | (101,508 | ) | | | (2,922 | ) | | | (6,263 | ) | | | (1,675 | ) |
| | | | | | | | | | | | | | | | |
Net assets acquired | | | 726,127 | | | | 358,955 | | | | 64,638 | | | | 164,998 | |
Goodwill (3) | | | 164,955 | | | | 32,423 | | | | 4,011 | | | | 15,824 | |
| | | | | | | | | | | | | | | | |
Fair value of net assets acquired | | | 891,082 | | | | 391,378 | | | | 68,649 | | | | 180,822 | |
Debt assumed (4) | | | (261,136 | ) | | | (201,999 | ) | | | — | | | | — | |
Preferred stock outstanding | | | (61,056 | ) | | | — | | | | — | | | | — | |
| | | | | | | | | | | | | | | | |
Purchase Price | | $ | 568,890 | | | $ | 189,379 | | | $ | 68,649 | | | $ | 180,822 | |
| | | | | | | | | | | | | | | | |
(1) | The allocation of the purchase price was finalized during the year ended December 31, 2014. |
(2) | Customer-related intangible assets and network location intangible assets are amortized on a straight-line basis over periods of up to 20 years. Other intangible assets are amortized on a straight-line basis over the life of the lease, which is a period of 11 years. |
(3) | Goodwill was allocated to the Company’s domestic and international rental and management segments, as applicable, and the Company expects goodwill recorded will be deductible for tax purposes except for goodwill associated with BR Towers where goodwill is expected to be partially deductible. |
(4) | BR Towers debt assumed approximated fair value at the date of acquisition and includes $11.5 million of current indebtedness. Richland debt assumed includes $196.5 million of Richland’s indebtedness and a fair value adjustment of $5.5 million. The fair value adjustment was based primarily on reported market values using Level 2 inputs. |
2013 Acquisitions
MIPT Acquisition
On October 1, 2013, the Company, through its wholly owned subsidiary American Tower Investments LLC, acquired 100% of the outstanding common membership interests of MIP Tower Holdings LLC (“MIPT”), a private REIT and the parent company of Global Tower Partners (“GTP”), an owner and operator, through its various operating subsidiaries, of approximately 4,860 communications sites in the United States and approximately 510 communications sites in Costa Rica and Panama. GTP also manages rooftops and holds property interests that it leases to communications service providers and third-party tower operators. The Company sold its operations in Panama in September 2014.
The purchase price of $4.9 billion was satisfied with approximately $3.3 billion in cash, including an aggregate of approximately $2.8 billion from borrowings under the Company’s credit facilities, and the assumption of approximately $1.5 billion of MIPT’s existing indebtedness.
AMERICAN TOWER CORPORATION AND SUBSIDIARIES
NOTES TO CONSOLIDATED FINANCIAL STATEMENTS
The consideration consisted of the following (in thousands):
| | | | |
Cash consideration (1) | | $ | 3,330,462 | |
Assumption of existing indebtedness at historical cost | | | 1,527,621 | |
| | | | |
Estimated total purchase price | | $ | 4,858,083 | |
| | | | |
(1) | Cash consideration includes $14.5 million of an additional purchase price adjustment which was paid to the sellers during the year ended December 31, 2014 and is reflected in Accrued expenses on the consolidated balance sheet included in the Company’s Annual Report on Form 10-K for the year ended December 31, 2013. |
The allocation of the purchase price was finalized during the year ended December 31, 2014. The following table summarizes the allocation of the purchase price paid and the amounts of assets acquired and liabilities assumed for the MIPT acquisition based upon the estimated fair value at the date of acquisition (in thousands).
| | | | | | | | |
| | | Final Purchase Price
Allocation (1) | | | Preliminary Purchase
Price Allocation (2) | |
Cash and cash equivalents | | $ | 35,967 | | | $ | 35,967 | |
Restricted cash | | | 30,883 | | | | 30,883 | |
Accounts receivable, net | | | 10,102 | | | | 10,021 | |
Prepaid and other current assets | | | 40,865 | | | | 22,875 | |
Property and equipment | | | 910,713 | | | | 996,901 | |
Intangible assets (3): | | | | | | | | |
Customer-related intangible assets | | | 2,456,582 | | | | 2,629,188 | |
Network location intangible assets | | | 528,900 | | | | 467,300 | |
Notes receivable and other non-current assets | | | 68,388 | | | | 4,220 | |
Accounts payable | | | (9,969 | ) | | | (9,249 | ) |
Accrued expenses | | | (42,867 | ) | | | (37,004 | ) |
Accrued interest | | | (3,253 | ) | | | (3,253 | ) |
Current portion of long-term obligations | | | (2,820 | ) | | | (2,820 | ) |
Unearned revenue | | | (35,905 | ) | | | (35,753 | ) |
Long-term obligations (4) | | | (1,573,366 | ) | | | (1,573,366 | ) |
Asset retirement obligations | | | (57,965 | ) | | | (43,089 | ) |
Other non-current liabilities | | | (17,837 | ) | | | (37,326 | ) |
| | | | | | | | |
Fair value of net assets acquired | | $ | 2,338,418 | | | $ | 2,455,495 | |
| | | | | | | | |
Goodwill (5) | | | 992,044 | | | | 874,967 | |
(1) | Balances are reflected as updated in the accompanying consolidated balance sheets as of December 31, 2013. |
(2) | Balances are reflected in the consolidated balance sheets in the Company’s Annual Report on Form 10-K for the year ended December 31, 2013. |
(3) | Customer-related intangible assets and network location intangible assets are amortized on a straight-line basis over periods of up to 20 years. |
(4) | Long-term obligations included $1.5 billion of MIPT’s existing indebtedness and a fair value adjustment of $53.0 million. The fair value adjustment was based primarily on reported market values using Level 2 inputs. |
(5) | Goodwill was allocated to the Company’s domestic and international rental and management segments, as applicable, and the Company expects goodwill recorded will not be deductible for tax purposes. |
Other 2013 Acquisitions
Axtel Mexico Acquisition—On January 31, 2013, the Company acquired 883 communications sites from Axtel, S.A.B. de C.V. for a purchase price of $248.5 million.
AMERICAN TOWER CORPORATION AND SUBSIDIARIES
NOTES TO CONSOLIDATED FINANCIAL STATEMENTS
NII Acquisition—On August 8, 2013, the Company entered into an agreement with NII Holdings, Inc. (“NII”) to acquire up to 1,666 communications sites in Mexico and 2,790 communications sites in Brazil in two separate transactions.
On November 8, 2013, the Company acquired 1,473 communications sites in Mexico from NII for an initial purchase price of approximately $436.0 million (including value added tax of approximately $60.3 million) and net assets of approximately $0.9 million for total cash consideration of approximately $436.9 million. The purchase price was subsequently reduced to approximately $427.0 million (including value added tax of approximately $59.0 million) during the year ended December 31, 2014 as a result of post-closing adjustments. The Company’s right to purchase additional sites in Mexico expired on May 30, 2014.
On December 6, 2013, the Company acquired 1,931 communications sites in Brazil from NII for an initial purchase price of approximately $349.0 million. The purchase price was subsequently reduced to approximately $341.4 million during the year ended December 31, 2014 as a result of post-closing adjustments. In addition, in June 2014, the Company purchased an additional 103 communications sites for a purchase price of approximately $17.7 million, which are reflected above in “2014 Acquisitions.” The Company’s right to purchase additional sites in Brazil expired on December 31, 2014.
Z-Sites Acquisition—On November 29, 2013, the Company acquired 238 communications sites from Z-Sites Locação de Imóveis Ltda for a purchase price of approximately $122.8 million. The purchase price was subsequently increased to approximately $123.9 million during the year ended December 31, 2014.
Other International Acquisitions—During the year ended December 31, 2013, the Company acquired a total of 714 additional communications sites in Brazil, Chile, Colombia, Ghana, Mexico and South Africa, for a purchase price of $89.8 million (including contingent consideration of $4.1 million and value added tax of $4.9 million).
Other U.S. Acquisitions—During the year ended December 31, 2013, the Company acquired a total of 55 additional communications sites and 23 property interests in the United States for a purchase price of $65.6 million. The purchase price included cash paid of approximately $65.2 million and net liabilities assumed of approximately $0.4 million.
The following table summarizes the updated allocation of the purchase price paid and the amounts of assets acquired and liabilities assumed for the fiscal year 2013 acquisitions based upon their estimated fair value at the date of acquisition (in thousands). Balances are reflected in the accompanying consolidated balance sheets herein.
| | | | | | | | | | | | | | | | | | | | | | | | |
| | | Axtel
Mexico (1) | | | NII
Mexico (2) (3) | | | NII
Brazil (2) | | | Z-Sites (2) | | | Other
International (2) | | | Other
U.S. (2) | |
Current assets | | $ | — | | | $ | 59,938 | | | $ | — | | | $ | — | | | $ | 4,863 | | | $ | 1,220 | |
Non-current assets | | | 2,626 | | | | 10,738 | | | | 9,534 | | | | 6,718 | | | | 1,991 | | | | 44 | |
Property and equipment | | | 86,100 | | | | 143,680 | | | | 109,426 | | | | 26,881 | | | | 44,844 | | | | 23,537 | |
Intangible assets (4): | | | | | | | | | | | | | | | | | | | | | | | | |
Customer-related intangible assets | | | 119,392 | | | | 132,897 | | | | 142,125 | | | | 62,286 | | | | 20,590 | | | | 29,325 | |
Network location intangible assets | | | 43,031 | | | | 66,069 | | | | 82,111 | | | | 17,350 | | | | 20,727 | | | | 7,935 | |
Current liabilities | | | — | | | | — | | | | — | | | | — | | | | — | | | | (454 | ) |
Other non-current liabilities | | | (9,377 | ) | | | (10,478 | ) | | | (20,100 | ) | | | (2,331 | ) | | | (8,168 | ) | | | (848 | ) |
| | | | | | | | | | | | | | | | | | | | | | | | |
Fair value of net assets acquired | | $ | 241,772 | | | $ | 402,844 | | | $ | 323,096 | | | $ | 110,904 | | | $ | 84,847 | | | $ | 60,759 | |
| | | | | | | | | | | | | | | | | | | | | | | | |
Goodwill (5) | | | 6,751 | | | | 25,056 | | | | 18,312 | | | | 13,040 | | | | 4,970 | | | | 4,403 | |
(1) | The allocation of the purchase price was finalized during the year ended December 31, 2013. |
(2) | The allocation of the purchase price was finalized during the year ended December 31, 2014. |
(3) | Current assets includes approximately $59.0 million of value added tax. |
AMERICAN TOWER CORPORATION AND SUBSIDIARIES
NOTES TO CONSOLIDATED FINANCIAL STATEMENTS
(4) | Customer-related intangible assets and network location intangible assets are amortized on a straight-line basis over periods of up to 20 years. |
(5) | Goodwill was allocated to the Company’s domestic and international rental and management segments, as applicable, and the Company expects goodwill recorded will be deductible for tax purposes. |
The following table summarizes the preliminary allocation, unless otherwise noted, of the purchase price paid and the amounts of assets acquired and liabilities assumed for the fiscal year 2013 acquisitions. The allocation is based upon the estimated fair value at the date of acquisition (in thousands). Balances are reflected in the consolidated balance sheets in the Company’s Annual Report on Form 10-K for the year ended December 31, 2013.
| | | | | | | | | | | | | | | | | | | | | | | | |
| | | Axtel
Mexico (1) | | | NII
Mexico (2) | | | NII Brazil | | | Z-Sites | | | Other
International | | | Other U.S. | |
Current assets | | $ | — | | | $ | 61,183 | | | $ | — | | | $ | — | | | $ | 4,863 | | | $ | 1,220 | |
Non-current assets | | | 2,626 | | | | 11,969 | | | | 4,484 | | | | 6,157 | | | | 1,991 | | | | 44 | |
Property and equipment | | | 86,100 | | | | 147,364 | | | | 105,784 | | | | 24,832 | | | | 44,844 | | | | 23,803 | |
Intangible assets (3): | | | | | | | | | | | | | | | | | | | | | | | | |
Customer-related intangible assets | | | 119,392 | | | | 135,175 | | | | 149,333 | | | | 64,213 | | | | 20,590 | | | | 29,325 | |
Network location intangible assets | | | 43,031 | | | | 63,791 | | | | 93,867 | | | | 17,123 | | | | 20,727 | | | | 7,607 | |
Current liabilities | | | — | | | | — | | | | — | | | | — | | | | — | | | | (454 | ) |
Other non-current liabilities | | | (9,377 | ) | | | (10,478 | ) | | | (13,188 | ) | | | (1,502 | ) | | | (8,168 | ) | | | (786 | ) |
| | | | | | | | | | | | | | | | | | | | | | | | |
Fair value of net assets acquired | | $ | 241,772 | | | $ | 409,004 | | | $ | 340,280 | | | $ | 110,823 | | | $ | 84,847 | | | $ | 60,759 | |
| | | | | | | | | | | | | | | | | | | | | | | | |
Goodwill (4) | | | 6,751 | | | | 27,928 | | | | 8,704 | | | | 11,953 | | | | 4,970 | | | | 4,403 | |
(1) | The allocation of the purchase price was finalized during the year ended December 31, 2013. |
(2) | Current assets includes approximately $60.3 million of value added tax. |
(3) | Customer-related intangible assets and network location intangible assets are amortized on a straight-line basis over periods of up to 20 years. |
(4) | Goodwill was allocated to the Company’s domestic and international rental and management segments, as applicable, and the Company expects goodwill recorded will be deductible for tax purposes. |
Pro Forma Consolidated Results
The following table presents the unaudited pro forma financial results as if the 2014 acquisitions had occurred on January 1, 2013 and the 2013 acquisitions had occurred on January 1, 2012 (in thousands, except per share data). Management relied on various estimates and assumptions due to the fact that some of the acquisitions never operated as a business and were utilized solely by the seller as a component of their network infrastructure. As a result, historical operating results for these acquisitions are not available. The pro forma results do not include any anticipated cost synergies, costs or other effects of the planned integration of the acquisitions. Accordingly, such pro forma amounts are not necessarily indicative of the results that actually would have occurred had the acquisitions been completed on the dates indicated, nor are they indicative of the future operating results of the Company.
| | | | | | | | |
| | | Year Ended December 31, | |
| | | 2014 | | | 2013 | |
Pro forma revenues | | $ | 4,193,067 | | | $ | 3,848,549 | |
Pro forma net income attributable to American Tower Corporation common stockholders | | $ | 770,871 | | | $ | 394,253 | |
Pro forma net income per common share amounts: | | | | | | | | |
Basic net income attributable to American Tower Corporation common stockholders | | $ | 1.95 | | | $ | 1.00 | |
Diluted net income attributable to American Tower Corporation common stockholders | | $ | 1.93 | | | $ | 0.99 | |
AMERICAN TOWER CORPORATION AND SUBSIDIARIES
NOTES TO CONSOLIDATED FINANCIAL STATEMENTS
Other Signed Acquisitions
TIM Acquisition—On November 21, 2014, the Company entered into an agreement with TIM Celular S.A. (“TIM”), a wholly-owned subsidiary of TIM Participações S.A., a publicly traded subsidiary of Telecom Italia S.p.A., to acquire two portfolios of towers in Brazil, subject to customary closing conditions. The first portfolio includes approximately 5,240 towers and the second portfolio, which was previously subject to certain preemptive acquisition rights held by third parties, includes approximately 1,240 towers. On January 16, 2015, such third parties waived their preemptive rights. At signing, total purchase price was approximately 3.0 billion BRL (approximately $1.1 billion), subject to customary adjustments. In addition, the Company may be required to pay breakup fees of an aggregate of approximately 260 million BRL, in the event that the conditions to the Company’s obligation to close have all been satisfied and the Company fails to consummate the TIM transaction. In connection with this obligation, the Company entered into letters of credit with Banco Santander in an aggregate amount of 260 million BRL.
Airtel Acquisition—On November 24, 2014, the Company and Airtel Networks Limited entered into a definitive agreement, through Bharti Airtel Limited’s subsidiary company, Bharti Airtel International (Netherlands) BV (“Airtel”), for the sale of over 4,800 of Airtel’s communications towers in Nigeria, subject to customary closing conditions and regulatory approval. At signing, the total purchase price was approximately $1.1 billion, subject to adjustments.
In February 2015, the Company signed a definitive agreement with Verizon Communications, Inc. (“Verizon”), see note 24.
Acquisition-Related Contingent Consideration
The Company may be required to pay additional consideration under certain agreements for the acquisition of communications sites if specific conditions are met or events occur.
Colombia—Under the terms of the agreement with Colombia Movil S.A. E.S.P., the Company is required to make additional payments upon the conversion of certain barter agreements with other wireless carriers to cash paying lease agreements. Based on current estimates, the Company expects the value of potential contingent consideration payments required to be made under the agreement to be between zero and $29.5 million, based on current exchange rates, and estimates it to be $19.7 million using a probability weighted average of the expected outcomes as of December 31, 2014. During the year ended December 31, 2014, the Company recorded an increase in fair value of $1.4 million in Other operating expenses in the accompanying consolidated statements of operations.
Ghana—Under the terms of its agreement, as amended, with MTN Group Limited, the Company is required to make additional payments upon the conversion of certain barter agreements with other wireless carriers to cash paying lease agreements. Based on current estimates, the Company expects the value of potential contingent consideration payments required to be made under the amended agreement to be between zero and $0.6 million, based on current exchange rates, and estimates it to be $0.6 million using a probability weighted average of the expected outcomes as of December 31, 2014.
MIPT—In connection with the acquisition of MIPT, the Company assumed additional contingent consideration liability related to previously closed acquisitions in Costa Rica, Panama and the United States. The Company is required to make additional payments to the sellers if certain pre-designated tenant leases commence during a limited specified period of time after the applicable acquisition was completed, generally one year or less. The Company initially recorded $9.3 million of contingent consideration liability as part of the preliminary
AMERICAN TOWER CORPORATION AND SUBSIDIARIES
NOTES TO CONSOLIDATED FINANCIAL STATEMENTS
acquisition accounting upon closing of the acquisition. Based on current estimates, the Company expects the value of potential contingent consideration payments required to be made under these agreements to be between zero and $4.4 million. During the year ended December 31, 2014, the Company (i) recorded a decrease in fair value of $1.7 million in Other operating expenses in the accompanying consolidated statements of operations, (ii) recorded settlements under these agreements of $3.5 million, (iii) reduced its contingent consideration liability by $0.7 million as a portion of the Company’s obligations was assumed by the buyer in conjunction with the sale of operations in Panama and (iv) recorded additional liability of $0.1 million. As a result, the Company estimates the value of potential contingent consideration payments required under these agreements to be $2.3 million using a probability weighted average of the expected outcomes as of December 31, 2014.
Other U.S.—In connection with other acquisitions in the United States, the Company is required to make additional payments if certain pre-designated tenant leases commence during a specified period of time. During the year ended December 31, 2014, the Company recorded $6.3 million of contingent consideration liability as part of the preliminary acquisition accounting upon closing of certain acquisitions. During the year ended December 31, 2014, the Company recorded settlements under these agreements of $0.4 million. Based on current estimates, the Company expects the value of potential contingent consideration payments required to be made under these agreements to be between zero and $5.9 million and estimates it to be $5.9 million using a probability weighted average of the expected outcomes as of December 31, 2014.
For more information regarding contingent consideration, see note 12.
7. ACCRUED EXPENSES
Accrued expenses consists of the following as of December 31, (in thousands):
| | | | | | | | |
| | | 2014 | | | 2013 (1) | |
Accrued property and real estate taxes | | $ | 61,206 | | | $ | 54,529 | |
Payroll and related withholdings | | | 57,110 | | | | 50,843 | |
Accrued construction costs | | | 46,024 | | | | 52,446 | |
Accrued rent | | | 34,074 | | | | 28,456 | |
Other accrued expenses | | | 219,340 | | | | 234,914 | |
| | | | | | | | |
Balance as of December 31, | | $ | 417,754 | | | $ | 421,188 | |
| | | | | | | | |
(1) | December 31, 2013 balances have been revised to reflect purchase accounting measurement period adjustments. |
AMERICAN TOWER CORPORATION AND SUBSIDIARIES
NOTES TO CONSOLIDATED FINANCIAL STATEMENTS
8. LONG-TERM OBLIGATIONS
Outstanding amounts under the Company’s long-term obligations consist of the following as of December 31, (in thousands):
| | | | | | | | | | | | | | | | |
| | | 2014 | | | 2013 | | | Contractual
Interest
Rate (1) | | | Maturity Date (1) | |
American Tower subsidiary debt: | | | | | | | | | | | | | | | | |
Secured Tower Revenue Securities,
Series 2013-1A | | $ | 500,000 | | | $ | 500,000 | | | | 1.551 | % | | | March 15, 2018 | (2) |
Secured Tower Revenue Securities,
Series 2013-2A | | | 1,300,000 | | | | 1,300,000 | | | | 3.070 | % | | | March 15, 2023 | (2) |
GTP Notes (3) | | | 1,263,983 | | | | 1,537,881 | | | | 2.364% - 7.628 | % | | | Various | |
BR Towers Debentures (4) | | | 118,688 | | | | — | | | | 7.400 | % | | | October 15, 2023 | |
BR Towers Credit Facility (4) | | | 16,389 | | | | — | | | | 3.500% - 10.800 | % | | | Various | |
Unison Notes (5) | | | 203,683 | | | | 205,436 | | | | 5.349% - 9.522 | % | | | Various | |
Mexican Loan (6)(7) | | | 263,426 | | | | 377,470 | | | | 4.821 | % | | | May 1, 2015 | |
South African Facility (6)(8) | | | 75,133 | | | | 88,334 | | | | 9.875 | % | | | March 31, 2020 | |
Colombian Credit Facility (6)(9) | | | 83,596 | | | | — | | | | 8.360 | % | | | April 24, 2021 | |
Colombian Long-Term Credit Facility | | | — | | | | 70,063 | | | | N/A | | | | N/A | |
Colombian Bridge Loans | | | — | | | | 56,058 | | | | N/A | | | | N/A | |
Colombian Loan | | | — | | | | 35,697 | | | | N/A | | | | N/A | |
Costa Rica Loan | | | — | | | | 32,600 | | | | N/A | | | | N/A | |
Shareholder loans (10) | | | 137,655 | | | | 225,253 | | | | Various | | | | Various | |
| | | | | | | | | | | | | | | | |
Total American Tower subsidiary debt | | | 3,962,553 | | | | 4,428,792 | | | | | | | | | |
| | | | | | | | | | | | | | | | |
American Tower Corporation debt: | | | | | | | | | | | | | | | | |
2013 Credit Facility (6) | | | — | | | | 1,853,000 | | | | 1.410 | % | | | June 28, 2018 | |
2013 Term Loan (6) | | | 1,500,000 | | | | 1,500,000 | | | | 1.410 | % | | | January 3, 2019 | |
2014 Credit Facility (6)(11) | | | 1,100,000 | | | | 88,000 | | | | 1.410 | % | | | January 31, 2020 | |
4.625% Notes (12) | | | 599,958 | | | | 599,794 | | | | 4.625 | % | | | April 1, 2015 | |
7.00% Notes | | | 500,000 | | | | 500,000 | | | | 7.000 | % | | | October 15, 2017 | |
4.50% Notes | | | 999,631 | | | | 999,520 | | | | 4.500 | % | | | January 15, 2018 | |
3.40% Notes | | | 1,005,509 | | | | 749,373 | | | | 3.400 | % | | | February 15, 2019 | |
7.25% Notes | | | 297,260 | | | | 296,748 | | | | 7.250 | % | | | May 15, 2019 | |
5.05% Notes | | | 699,496 | | | | 699,413 | | | | 5.050 | % | | | September 1, 2020 | |
3.450% Notes | | | 646,394 | | | | — | | | | 3.450 | % | | | September 15, 2021 | |
5.90% Notes | | | 499,474 | | | | 499,414 | | | | 5.900 | % | | | November 1, 2021 | |
4.70% Notes | | | 698,987 | | | | 698,871 | | | | 4.700 | % | | | March 15, 2022 | |
3.50% Notes | | | 993,230 | | | | 992,520 | | | | 3.500 | % | | | January 31, 2023 | |
5.00% Notes | | | 1,010,834 | | | | 499,455 | | | | 5.000 | % | | | February 15, 2024 | |
| | | | | | | | | | | | | | | | |
Total American Tower Corporation debt | | | 10,550,773 | | | | 9,976,108 | | | | | | | | | |
| | | | | | | | | | | | | | | | |
Other debt, including capital lease obligations | | | 95,382 | | | | 73,378 | | | | | | | | | |
| | | | | | | | | | | | | | | | |
Total | | | 14,608,708 | | | | 14,478,278 | | | | | | | | | |
Less current portion of long-term obligations | | | (897,624 | ) | | | (70,132 | ) | | | | | | | | |
| | | | | | | | | | | | | | | | |
Long-term obligations | | $ | 13,711,084 | | | $ | 14,408,146 | | | | | | | | | |
| | | | | | | | | | | | | | | | |
(1) | Represents the interest rate and maturity date as of December 31, 2014 and does not reflect the impact of interest rate swap agreements. |
(2) | Represents anticipated repayment date. |
(3) | Includes approximately $26.9 million of the remaining portion of unamortized premium recorded as a result of fair value adjustments for debt assumed upon the acquisition of MIPT. |
AMERICAN TOWER CORPORATION AND SUBSIDIARIES
NOTES TO CONSOLIDATED FINANCIAL STATEMENTS
(4) | Denominated in Brazilian Real (“BRL”). As of December 31, 2014, the aggregate principal amount outstanding under the BR Towers Debentures and the BR Towers Credit Facility is 315.3 million BRL and 43.5 million BRL, respectively. A portion of the debt accrues interest at a variable rate. |
(5) | Includes approximately $7.7 million of the remaining portion of unamortized premium recorded as a result of fair value adjustments recognized upon the acquisition of Unison Holdings, LLC and Unison Site Management II, L.L.C. (collectively, “Unison”). |
(6) | Interest rate as of December 31, 2014. Debt accrues interest at a variable rate. |
(7) | Denominated in Mexican Pesos (“MXN”). As of December 31, 2014, the aggregate principal amount outstanding under the Mexican Loan is 3.9 billion MXN. |
(8) | Denominated in South African Rand (“ZAR”). As of December 31, 2014, the aggregate principal amount outstanding under the South African Facility is 869.3 million ZAR. |
(9) | Denominated in Colombian Pesos (“COP”). As of December 31, 2014, the aggregate principal amount outstanding under the Colombian Credit Facility is 200.0 billion COP. |
(10) | Reflects balances owed to the Company’s joint venture partners in Ghana and Uganda. The Ghana loan is denominated in Ghanaian Cedi (“GHS”) and the Uganda loan is denominated in USD. |
(11) | On September 19, 2014, the Company amended and restated its $1.0 billion senior unsecured revolving credit facility as described below. |
(12) | On February 11, 2015, the Company redeemed all of the outstanding 4.625% senior notes due 2015. See note 24. |
American Tower Subsidiary Debt
Secured Tower Revenue Securities, Series 2013-1A and Series 2013-2A—In March 2013, the Company completed a securitization transaction (the “Securitization”) involving assets related to 5,195 wireless and broadcast communications towers (the “Secured Towers”) owned by two special purpose subsidiaries of the Company, through a private offering of $1.8 billion of the Securities. The net proceeds of the transaction were $1.78 billion. The Securities were issued by American Tower Trust I (the “Trust”), a trust established by American Tower Depositor Sub, LLC, an indirect wholly owned special purpose subsidiary of the Company. The assets of the Trust consist of a nonrecourse loan (the “Loan”) to American Tower Asset Sub, LLC and American Tower Asset Sub II, LLC (the “Borrowers”), pursuant to a First Amended and Restated Loan and Security Agreement dated as of March 15, 2013 (the “Loan Agreement”). The Borrowers are special purpose entities formed solely for the purpose of holding the Secured Towers subject to a securitization.
The Securities were issued in two separate series of the same class pursuant to a First Amended and Restated Trust and Servicing Agreement (the “Trust Agreement”), with terms identical to the Loan. The effective weighted average life and interest rate of the Securities is 8.6 years and 2.648%, respectively, as of the date of issuance.
Amounts due under the Loan will be paid by the Borrowers from the cash flows generated by the Secured Towers. These funds in turn will be used by or on behalf of the Trust to service the payment of interest on the Securities and for any other payments required by the Loan Agreement or Trust Agreement. The Borrowers are required to make monthly payments of interest on the Loan. Subject to certain limited exceptions described below, no payments of principal will be required to be made prior to March 15, 2018, which is the anticipated repayment date for the component of the Loan associated with the Series 2013-1A Securities. On a monthly basis, after payment of all required amounts under the Loan Agreement and Trust Agreement, the excess cash flows generated from the operation of the Secured Towers are released to the Borrowers, and can then be distributed to, and used by, the Company. However, if the debt service coverage ratio (the “DSCR”), generally defined as the net cash flow divided by the amount of interest, servicing fees and trustee fees that the Borrowers will be required to pay over the succeeding twelve months on the principal amount of the Loan, as of the last day
AMERICAN TOWER CORPORATION AND SUBSIDIARIES
NOTES TO CONSOLIDATED FINANCIAL STATEMENTS
of any calendar quarter prior to the applicable anticipated repayment date, were equal to or below 1.30x (the “Cash Trap DSCR”) for such quarter, and the DSCR continues to be equal to or below the Cash Trap DSCR for two consecutive calendar quarters, then all cash flow in excess of amounts required to make debt service payments, to fund required reserves, to pay management fees and budgeted operating expenses and to make other payments required under the loan documents, referred to as excess cash flow, will be deposited into a reserve account instead of being released to the Borrowers. The funds in the reserve account will not be released to the Borrowers unless the DSCR exceeds the Cash Trap DSCR for two consecutive calendar quarters. An “amortization period” commences if (i) as of the end of any calendar quarter the DSCR equals or falls below 1.15x (the “Minimum DSCR”) for such calendar quarter and such amortization period will continue to exist until the DSCR exceeds the Minimum DSCR for two consecutive calendar quarters or (ii) on the anticipated repayment date the component of the Loan corresponding to the applicable subclass of the Securities has not been repaid in full, provided that such amortization period shall apply with respect to such component that has not been repaid in full. During an amortization period all excess cash flow and any amounts then in the reserve account because the Cash Trap DSCR was not met would be applied to payment of the principal on the Loan.
The Borrowers may prepay the Loan in whole or in part at any time provided it is accompanied by applicable prepayment consideration. If the prepayment occurs within twelve months of the anticipated repayment date for the Series 2013-1A Securities or eighteen months of the anticipated repayment date for the Series 2013-2A Securities, no prepayment consideration is due. The entire unpaid principal balance of the component of the Loan related to the Series 2013-1A Securities and the Series 2013-2A Securities has a final maturity date of March 2043 and March 2048, respectively. The Loan may be defeased in whole at any time prior to the anticipated repayment date for any component of the Loan then outstanding.
The Loan is secured by (1) mortgages, deeds of trust and deeds to secure debt on substantially all of the Secured Towers, (2) a pledge of the Borrowers’ operating cash flows from the Secured Towers, (3) a security interest in substantially all of the Borrowers’ personal property and fixtures and (4) the Borrowers’ rights under the tenant leases and the management agreement entered into in connection with the Securitization. American Tower Holding Sub, LLC, whose only material assets are its equity interests in each of the Borrowers, and American Tower Guarantor Sub, LLC, whose only material asset is its equity interest in American Tower Holding Sub, LLC, each have guaranteed repayment of the Loan and pledged their equity interests in their respective subsidiary or subsidiaries as security for such payment obligations. American Tower Guarantor Sub, LLC, American Tower Holding Sub, LLC, the Depositor and the Borrowers each were formed as special purpose entities solely for purposes of entering a securitization transaction, and the assets and credit of these entities are not available to satisfy the debts and other obligations of the Company or any other person, except as set forth in the Loan Agreement.
The Loan Agreement includes operating covenants and other restrictions customary for loans subject to rated securitizations. Among other things, the Borrowers are prohibited from incurring other indebtedness for borrowed money or further encumbering their assets subject to customary carve-outs for ordinary course trade payables and permitted encumbrances (as defined in the Loan Agreement). The organizational documents of the Borrowers contain provisions consistent with rating agency securitization criteria for special purpose entities, including the requirement that the Borrowers maintain at least two independent directors. The Loan Agreement also contains certain covenants that require the Borrowers to provide the trustee with regular financial reports and operating budgets, promptly notify the trustee of events of default and material breaches under the Loan Agreement and other agreements related to the Secured Towers, and allow the trustee reasonable access to the Secured Towers, including the right to conduct site investigations.
A failure to comply with the covenants in the Loan Agreement could prevent the Borrowers from taking certain actions with respect to the Secured Towers, and could prevent the Borrowers from distributing any excess cash
AMERICAN TOWER CORPORATION AND SUBSIDIARIES
NOTES TO CONSOLIDATED FINANCIAL STATEMENTS
from the operation of the Secured Towers to the Company. If the Borrowers were to default on the Loan, the servicer could seek to foreclose upon or otherwise convert the ownership of the Secured Towers, in which case the Company could lose the Secured Towers and the revenue associated with those assets.
Under the Loan Agreement, the Borrowers are required to maintain reserve accounts, including for ground rents, real estate and personal property taxes and insurance premiums, and to reserve a portion of advance rents from tenants on the Secured Towers. Based on the terms of the Loan Agreement, all rental cash receipts received for each month are reserved for the succeeding month and held in an account controlled by the trustee and then released. The $118.8 million held in the reserve accounts as of December 31, 2014 was classified as Restricted cash on the Company’s accompanying consolidated balance sheet.
GTP Notes—In connection with the acquisition of MIPT, the Company assumed approximately $1.49 billion principal amount of existing indebtedness issued by certain subsidiaries of GTP in several securitization transactions. GTP Acquisition Partners I, LLC (“GTP Partners”) issued the Series 2011-1 notes, Series 2011-2 notes and Series 2013-1 notes, and GTP Cellular Sites, LLC (“GTP Cellular Sites,” and together with GTP Partners, the “GTP Issuers”) issued the Series 2012-1 notes and Series 2012-2 notes.
In August 2014, the Company repaid in full the aggregate principal amount outstanding of $250.0 million under the Series 2010-1 Class C Notes and the Series 2010-1 Class F Notes issued by GTP Towers Issuer, LLC (together, the “Series 2010-1 Notes”) and wrote-off the unamortized premium associated with the fair value adjustment. As a result, the Company recorded a gain on retirement of long-term obligations in the accompanying consolidated statements of operations of $3.0 million.
The following table sets forth certain terms of the GTP Notes:
| | | | | | | | | | | | | | | | | | | | |
GTP Notes | | Issue Date | | | Original Principal
Amount
(in thousands) | | | Interest Rate | | | Anticipated
Repayment Date | | | Final Maturity
Date | |
Series 2011-1 Class C notes | | | March 11, 2011 | | | $ | 70,000 | | | | 3.967 | % | | | June 15, 2016 | | | | June 15, 2041 | |
Series 2011-2 Class C notes | | | July 7, 2011 | | | $ | 490,000 | | | | 4.347 | % | | | June 15, 2016 | | | | June 15, 2041 | |
Series 2011-2 Class F notes | | | July 7, 2011 | | | $ | 155,000 | | | | 7.628 | % | | | June 15, 2016 | | | | June 15, 2041 | |
Series 2012-1 Class A notes (1) | | | February 28, 2012 | | | $ | 100,000 | | | | 3.721 | % | | | March 15, 2017 | | | | March 15, 2042 | |
Series 2012-2 Class A notes (1) | | | February 28, 2012 | | | $ | 114,000 | | | | 4.336 | % | | | March 15, 2019 | | | | March 15, 2042 | |
Series 2012-2 Class B notes | | | February 28, 2012 | | | $ | 41,000 | | | | 6.413 | % | | | March 15, 2019 | | | | March 15, 2042 | |
Series 2012-2 Class C notes | | | February 28, 2012 | | | $ | 27,000 | | | | 7.358 | % | | | March 15, 2019 | | | | March 15, 2042 | |
Series 2013-1 Class C notes | | | April 24, 2013 | | | $ | 190,000 | | | | 2.364 | % | | | May 15, 2018 | | | | May 15, 2043 | |
Series 2013-1 Class F notes | | | April 24, 2013 | | | $ | 55,000 | | | | 4.704 | % | | | May 15, 2018 | | | | May 15, 2043 | |
(1) | Does not reflect MIPT’s repayment of approximately $1.4 million aggregate principal amount prior to the date of acquisition and the Company’s repayment of approximately $3.5 million aggregate principal amount after the date of acquisition in accordance with the repayment schedules. |
The GTP Notes may be prepaid in whole or in part at any time beginning two years after the date of issuance, provided such payment is accompanied by applicable prepayment consideration. If the prepayment occurs within one year of the anticipated repayment date, no prepayment consideration is due.
As of December 31, 2014, the GTP Notes are secured by, among other things, an aggregate of 2,845 sites and 1,035 property interests owned by subsidiaries of the GTP Issuers and other related assets (the “GTP Secured Sites”).
Cash flows generated by the GTP Secured Sites will be used to pay amounts due under the applicable series of GTP Notes, including the payment of interest on the applicable series of GTP Notes and for any other payments required by the indentures governing the GTP Notes (the “GTP Indentures”).
AMERICAN TOWER CORPORATION AND SUBSIDIARIES
NOTES TO CONSOLIDATED FINANCIAL STATEMENTS
On a monthly basis, after payment of all required amounts under the GTP Indentures, the excess cash flows generated from the operation of the GTP Secured Sites are released to the GTP Issuers, and can then be distributed to, and used by, the Company. The GTP Issuers must maintain a specified ratio with respect to their DSCR, calculated as the ratio of the net cash flow (as defined in the applicable GTP Indentures) to the amount of interest required to be paid over the succeeding twelve months on the principal amount of the GTP Notes that will be outstanding on the payment date following such date of determination, plus the amounts payable for trustee and servicing fees. If the DSCR with respect to any series of GTP Notes issued by GTP Partners is equal to or below the Cash Trap DSCR at the end of any calendar quarter and it continues for two consecutive calendar quarters, or if the DSCR with respect to any series of GTP Notes issued by GTP Cellular Sites is equal to or below the Cash Trap DSCR at the end of any calendar month and it continues for two consecutive calendar months, then all cash flow in excess of amounts required to make debt service payments, fund required reserves, pay management fees and budgeted operating expenses and make other payments required with respect to such series of GTP Notes under the GTP Indentures, will be deposited into reserve accounts instead of being released to the GTP Issuers. The funds in the reserve accounts will not be released to GTP Partners for distribution to the Company unless the DSCR with respect to such series of GTP Notes exceeds the Cash Trap DSCR for two consecutive calendar quarters. Likewise, the funds in the reserve account will not be released to GTP Cellular Sites for distribution to the Company unless the DSCR with respect to such series of GTP Notes exceeds the Cash Trap DSCR for two consecutive calendar months.
Additionally, an “amortization period” commences as of the end of any calendar quarter with respect to the series of GTP Notes issued by GTP Partners, and as of the end of any calendar month with respect to the series of GTP Notes issued by GTP Cellular Sites, if the DSCR of such series equals or falls below the Minimum DSCR. The “amortization period” will continue to exist until the end of any calendar quarter with respect to the series of GTP Notes issued by GTP Partners, for which the DSCR exceeds the Minimum DSCR for two consecutive calendar quarters. With respect to the series of GTP Notes issued by GTP Cellular Sites, the “amortization period” will continue to exist until the end of any calendar month for which the DSCR exceeds the Minimum DSCR for two consecutive calendar months. During an amortization period all excess cash flow and any amounts then in the reserve accounts because the Cash Trap DSCR was not met would be applied to payment of the principal of the applicable series of GTP Notes.
The GTP Indentures include operating covenants and other restrictions customary for note offerings subject to rated securitizations. Among other things, the GTP Issuers are prohibited from incurring other indebtedness for borrowed money or further encumbering their assets subject to customary exceptions for ordinary course trade payables and permitted encumbrances (as defined in the GTP Indentures). The GTP Indentures also contain certain covenants that require the GTP Issuers to provide the trustee with regular financial reports, operating budgets and budgets for capital improvements not included in annual financial statements in accordance with GAAP, promptly notify the trustee of events of default and material breaches under the GTP Indentures and other agreements related to the GTP Secured Sites, and allow the trustee reasonable access to the GTP Secured Sites, including the right to conduct site investigations.
A failure to comply with the covenants in the GTP Indentures could prevent the GTP Issuers from taking certain actions with respect to the GTP Secured Sites and could prevent the GTP Issuers from distributing excess cash flow to the Company. In addition, upon occurrence and during an event of default, the trustee may, in its discretion or at direction of holders of more than 50% of the aggregate outstanding principal of any series of GTP Notes, declare such series of GTP Notes immediately due and payable, in which case any excess cash flow would need to be used to pay holders of such GTP Notes. Furthermore, if the GTP Issuers were to default on a series of the GTP Notes, the trustee may demand, collect, take possession of, receive, settle, compromise, adjust, sue for, foreclose or realize upon all or any portion of the GTP Secured Sites securing such series, in which case the GTP Issuers could lose the GTP Secured Sites and the revenue associated with those assets.
AMERICAN TOWER CORPORATION AND SUBSIDIARIES
NOTES TO CONSOLIDATED FINANCIAL STATEMENTS
Under the GTP Indentures, the GTP Issuers are required to maintain reserve accounts, including for amounts received or due from tenants related to future periods, property taxes, insurance, ground rents, certain expenses and debt service. The $20.9 million held in the reserve accounts as of December 31, 2014 is classified as Restricted cash on the accompanying consolidated balance sheets.
BR Towers Debt—In connection with the acquisition of BR Towers, the Company assumed approximately 671.5 million BRL (approximately $261.1 million based on exchange rates at the date of closing) aggregate principal amount of existing indebtedness consisting of (i) 323.4 million of BRL denominated privately issued simple debentures (“BR Towers Private Debentures”) (with an original principal amount of 330.0 million BRL), (ii) 313.1 million BRL of denominated publicly issued simple debentures (“BR Towers Debentures”) (with an original principal amount of 300.0 million BRL) issued by a subsidiary of BR Towers (the “BRT Issuer”), and (iii) a BRL denominated credit facility with Banco Nacional de Desenvolvimento Economico e Social, which allows a subsidiary of BR Towers (the “BRT Borrower”) to borrow up to 48.1 million BRL through an intermediary bank (the “BR Towers Credit Facility”).
On December 11, 2014, the Company repaid all amounts outstanding under the BR Towers Private Debentures, which included a prepayment penalty of 3.2 million BRL (approximately $1.2 million on the date of repayment).
The BR Towers Debentures were issued on October 15, 2013, and have a maturity date of October 15, 2023. The BR Towers Debentures bear interest at a rate of 7.40%. The aggregate principal amount of the BR Towers Debentures may be adjusted periodically relative to changes in the National Extended Consumer Price Index. Any such increase in the principal amount will be capitalized in a manner consistent with the agreement governing the BR Towers Debentures (the “Debenture Agreement”). Payments of principal and interest are made quarterly, beginning on January 15, 2014, in accordance with the amortization schedule set forth in the Debenture Agreement.
The Company may redeem the BR Towers Debentures beginning on October 15, 2018 at the then outstanding principal amount plus a surcharge, calculated in accordance with the Debenture Agreement, and all accrued and unpaid interest thereon. As of December 31, 2014, 315.3 million BRL (approximately $118.7 million) aggregate principal amount is outstanding under the BR Towers Debentures.
The BR Towers Debentures are secured by (i) 100% of the shares of the BRT Issuer and (ii) all proceeds and rights from the issuance of the BR Towers Debentures, including amounts in a Resource Account (as defined in the applicable agreement). The Debenture Agreement includes contractual covenants and other restrictions customary for public debentures. Among other things, the Debenture Agreement requires that (i) the BRT Issuer maintain a debt service coverage ratio of at least 1.10, (ii) the risk rating of the BR Towers Debentures not be downgraded by two or more notches, (iii) the BRT Issuer meet certain conditions to distribute dividends or interest on the issuer’s own capital, (iv) the issuer not incur additional indebtedness in an aggregate amount greater than 5.0 million BRL (which amount is subject to adjustment as set forth in the agreement) and (v) the issuer maintain a leverage index (as defined in the Debenture Agreement) of at least 30%.
The BR Towers Credit Facility consists of three sublimits, the material terms of which are as follows:
| | | | | | | | | | | | |
| | | Maximum Borrowing
Amount
(BRL, in millions) | | | Maturity Date | | | Interest Rate as of
December 31, 2014 | |
Sublimit A | | | 20.2 BRL ($7.6 USD) | | | | July 15, 2020 | | | | 10.80 | %(1) |
Sublimit B | | | 27.6 BRL ($10.4 USD) | | | | January 15, 2022 | | | | 3.50 | % |
Sublimit C | | | 0.2 BRL ($0.1 USD) | | | | July 15, 2020 | | | | 5.90 | %(1) |
(1) | Sublimit A and Sublimit C accrue interest at a per annum rate equal to 4.80% plus 1.00% and 0.90%, respectively, above the Long-Term Interest Rates disclosed by the Central Bank of Brazil (the “LTIR”). If the LTIR exceeds 6.00%, the amount of interest payable on the portion of the LTIR exceeding 6.00% will be capitalized in a manner pursuant to the terms of the loan agreement. |
AMERICAN TOWER CORPORATION AND SUBSIDIARIES
NOTES TO CONSOLIDATED FINANCIAL STATEMENTS
As of December 31, 2014, 43.5 million BRL (approximately $16.4 million) is outstanding under the BR Towers Credit Facility and the BRT Borrower maintains the ability to draw down the remaining 4.6 million BRL (approximately $1.7 million) until June 26, 2015. The BRT Borrower is required to pay a fee on any amount that remains undrawn at such date, which fee will be equal to a monthly charge of 0.1% of the undrawn portion of the loan, calculated from January 15, 2014.
Any outstanding principal and accrued but unpaid interest on the BR Towers Credit Facility will be due and payable in full at maturity. The BR Towers Credit Facility may be prepaid in whole or in part, subject to certain limitations and prepayment consideration, at any time. Interest on the BR Towers Credit Facility is payable quarterly until the first amortization date, August 15, 2015, after which time principal and interest payments will be made on a monthly basis.
The BR Towers Credit Facility is secured by the conditional assignment of receivables. The loan agreements include certain reporting, information, financial ratios and operating covenants. Failure to comply with certain of the financial and operating covenants would constitute a default, which could result in, among other things, the amounts outstanding, including all accrued interest and unpaid fees, becoming immediately due and payable.
Unison Notes—In connection with the acquisition of Unison, the Company assumed $196.0 million of existing indebtedness with an acquisition date fair value of $209.3 million under the Unison Notes issued by Unison Ground Lease Funding, LLC (the “Unison Issuer”) in a securitization transaction (the “Unison Securitization”). The three classes of Unison Notes bear interest at rates of 5.349%, 6.392% and 9.522%, respectively, with anticipated repayment dates of April 15, 2017, April 15, 2020 and April 15, 2020, respectively, and a final maturity date of April 15, 2040.
The Unison Notes are secured by, among other things, liens on approximately 1,517 real property interests owned by two special purpose subsidiaries of the Unison Issuer (together with the Unison Issuer, the “Unison Obligors”) and other related assets. The indenture for the Unison Notes (the “Unison Indenture”) includes certain financial ratios and operating covenants and other restrictions customary for notes subject to rated securitizations. Among other things, the Unison Obligors are restricted from incurring other indebtedness or further encumbering their assets.
Under the terms of the Unison Indenture, the Unison Notes will be paid from the cash flows generated by the communications sites subject to the Unison Securitization. The Unison Issuer is required to make monthly payments of interest to holders of the Unison Notes. On a monthly basis, cash flows in excess of amounts needed to make debt service payments and other payments required under the Unison Indenture are to be distributed to the Unison Issuer, which may then be distributed to, and used by, the Company. The Unison Issuer may prepay the Unison Notes in whole or in part at any time, provided such payment is accompanied by applicable prepayment consideration. If the prepayment occurs within six months of the anticipated repayment date, no prepayment consideration is due.
A failure to comply with the covenants in the Unison Indenture could prevent the Unison Obligors from taking certain actions with respect to the property interests subject to the Unison Securitization and a failure to meet certain financial ratio tests could prevent excess cash flow from being distributed to the Unison Issuer. In addition, if the Unison Issuer were to default on the Unison Notes, the trustee could seek to foreclose upon the property interests subject to the Unison Securitization, in which case the Company could lose ownership of the property interests and the revenue associated with those property interests.
Mexican Loan—In connection with the acquisition of towers in Mexico from NII during the fourth quarter of 2013, one of the Company’s Mexican subsidiaries entered into a 5.2 billion MXN denominated unsecured bridge
AMERICAN TOWER CORPORATION AND SUBSIDIARIES
NOTES TO CONSOLIDATED FINANCIAL STATEMENTS
loan (the “Mexican Loan”) and subsequently borrowed approximately 4.9 billion MXN (approximately $374.7 million at the date of borrowing). The Mexican subsidiary’s ability to further draw under the Mexican Loan expired in February 2014. The Mexican Loan bears interest at a margin over the Equilibrium Interbank Interest Rate (“TIIE”). During the year ended December 31, 2014, the Mexican subsidiary repaid 1.1 billion MXN (approximately $80.4 million on the date of repayment) of the outstanding indebtedness using cash on hand. As of December 31, 2014, the current margin over TIIE is 1.50%.
Shareholder Loans—In connection with the establishment of certain of the Company’s joint ventures and related acquisitions of communications sites in Ghana and Uganda, the Company’s majority owned subsidiaries entered into shareholder loan agreements, as the borrower, and with wholly owned subsidiaries of the Company and of the Company’s joint venture partners, as lenders. The portions of the loans made by the Company’s wholly owned subsidiaries are eliminated in consolidation and the portions of the loans made by each of the Company’s joint venture partner’s wholly owned subsidiary are reported as outstanding debt of the Company. Outstanding amounts under each of the Company’s shareholder loans consist of the following as of December 31, (in thousands):
| | | | | | | | | | | | | | | | |
| | | 2014 | | | 2013 | | | Contractual Interest
Rate | | | Maturity Date | |
2014 Ghana Loan(1)(2) | | | 68,651 | | | | — | | | | 21.87 | % | | | December 31, 2019 | |
Uganda Loan(3)(4) | | | 69,004 | | | | 66,926 | | | | 5.842 | % | | | June 29, 2019 | |
Ghana Loan(2) | | | — | | | | 158,327 | | | | N/A | | | | N/A | |
(1) | Denominated in GHS. As of December 31, 2014, the aggregate principal amount outstanding under the 2014 Ghana Loan is 220.9 million GHS. |
(2) | During the year ended December 31, 2014, the joint venture in Ghana converted $175.2 million of existing notes under the U.S. Dollar-denominated Ghana Loan into a new 220.9 million GHS (approximately $68.7 million) denominated shareholder loan. The remaining balance of the Ghana Loan was converted into equity of the respective holders. |
(3) | Interest rate as of December 31, 2014. Debt accrues interest at a variable rate. |
(4) | Includes approximately $2.1 million of capitalized accrued interest pursuant to the terms of the loan agreement. |
South African Facility—One of the Company’s South African subsidiaries (the “SA Borrower”) entered into a 1.2 billion ZAR denominated credit facility (the “South African Facility”) in November 2011. In September 2013, the SA Borrower’s ability to draw on the South African Facility expired.
Principal and interest are payable quarterly in arrears with principal due in accordance with the repayment schedule included in the loan agreement. Outstanding principal and accrued but unpaid interest will be due and payable in full at maturity. The South African Facility may be prepaid in whole or in part without prepayment consideration.
The South African Facility is secured by, among other things, liens on towers owned by the SA Borrower. The loan agreement contains certain reporting, information, financial ratios and operating covenants. Failure to comply with certain of the financial and operating covenants would constitute a default, which could result in, among other things, the amounts outstanding, including all accrued interest and unpaid fees, becoming immediately due and payable. Under the terms of the South African Facility, interest is payable quarterly at a rate generally equal to 3.75% per annum, plus the three month Johannesburg Interbank Agreed Rate (“JIBAR”). The loan agreement requires that the SA Borrower manage exposure to variability in interest rates on at least fifty percent of the amounts outstanding under the South African Facility. After giving effect to the interest rate swap agreements, the facility accrues interest at a weighted average rate of 10.34%.
AMERICAN TOWER CORPORATION AND SUBSIDIARIES
NOTES TO CONSOLIDATED FINANCIAL STATEMENTS
Colombian Credit Facility—On October 14, 2014, one of the Company’s Colombian subsidiaries (“ATC Sitios”) entered into a loan agreement for a new 200.0 billion COP (approximately $96.8 million at the date of borrowing) denominated long-term credit facility (the “Colombian Credit Facility”), which it used, together with cash on hand, to repay a previously existing COP denominated long-term credit facility entered into in October 2012 (the “Colombian Long-Term Credit Facility”), as well as to repay six COP denominated bridge loans on October 24, 2014.
Any outstanding principal and accrued but unpaid interest will be due and payable in full at maturity. The Colombian Credit Facility may be prepaid in whole or in part, subject to certain limitations and prepayment consideration, at any time.
Principal and interest are payable quarterly in arrears with principal due in accordance with the repayment schedule included in the loan agreement. Interest accrues at a per annum rate equal to 4.00% above the three-month Inter-bank Rate (“IBR”) in effect at the beginning of each Interest Period (as defined in the loan agreement). The loan agreement also requires that ATC Sitios manage exposure to variability in interest rates on certain of the amounts outstanding under the Colombian Credit Facility. As of December 31, 2014, the interest rate, after giving effect to the interest rate swap agreements, is 9.05%.
The Colombian Credit Facility is secured by, among other things, liens on towers owned by ATC Sitios. The loan agreement contains certain reporting, information, financial ratios and operating covenants. Failure to comply with certain of the financial and operating covenants would constitute a default, which could result in, among other things, the amounts outstanding, including all accrued interest and unpaid fees, becoming immediately due and payable.
Colombian Long-Term Credit Facility—In October 2012, ATC Sitios entered into the Colombian Long-Term Credit Facility, which it used to refinance the previously existing COP denominated short-term credit facility. On October 24, 2014, the Company repaid the Colombian Long-Term Credit Facility using proceeds from the Colombian Credit Facility and cash on hand.
Colombian Bridge Loans—In connection with the acquisition of communications sites in Colombia, one of the Company’s Colombian subsidiaries entered into six COP denominated bridge loans, which were repaid in full on October 24, 2014 using proceeds from the Colombian Credit Facility and cash on hand.
Colombian Loan—In connection with the establishment of the Company’s joint venture with Millicom and the acquisition of certain communications sites in Colombia, ATC Colombia B.V., a majority owned subsidiary of the Company, entered into a U.S. Dollar-denominated shareholder loan agreement (the “Colombian Loan”), as the borrower, with the Company’s wholly owned subsidiary (the “ATC Colombian Subsidiary”), and a wholly owned subsidiary of Millicom (the “Millicom Subsidiary”), as the lenders. Pursuant to the loan agreement, accrued interest was periodically capitalized and added to the principal amount outstanding. The portion of the Colombian Loan made by the ATC Colombian Subsidiary was eliminated in consolidation, and the portion of the Colombian Loan made by the Millicom Subsidiary was reported as outstanding debt of the Company. During the year ended December 31, 2014, the joint venture borrowed an additional $3.0 million under the Colombian Loan, which was subsequently converted from debt to equity. In July 2014, the Company purchased Millicom’s interest in the joint venture and the Colombian Loan using proceeds from borrowings under the Company’s $2.0 billion multi-currency senior unsecured revolving credit facility. As a result, all amounts outstanding under the Colombian Loan are eliminated in consolidation as of December 31, 2014.
Costa Rica Loan—In connection with the acquisition of MIPT, the Company assumed $32.6 million of secured debt in Costa Rica (the “Costa Rica Loan”), which it repaid in full in February 2014.
AMERICAN TOWER CORPORATION AND SUBSIDIARIES
NOTES TO CONSOLIDATED FINANCIAL STATEMENTS
Richland Notes—In connection with its acquisition of entities holding a portfolio of communications sites from Richland, the Company assumed approximately $196.5 million of secured debt (the “Richland Notes”) and recorded a fair value premium of $5.5 million upon acquisition. In June 2014, the Company repaid the outstanding indebtedness, paid prepayment consideration and wrote-off the unamortized premium associated with the fair value adjustment. As a result, the Company recorded a loss on retirement of long-term obligations in the accompanying consolidated statements of operations of $1.3 million.
Indian Working Capital Facility—In April 2013, one of the Company’s Indian subsidiaries (“ATC India”) entered into a working capital facility agreement (the “Indian Working Capital Facility”), which allows ATC India to borrow an amount not to exceed the Indian Rupee (“INR”) equivalent of $10.0 million. Any advances made pursuant to the Indian Working Capital Facility will be payable on the earlier of demand or six months following the borrowing date and the interest rate will be determined at the time of advance by the bank. ATC India has no amounts outstanding under the Indian Working Capital Facility. ATC India maintains the ability to draw down and repay amounts under the Indian Working Capital Facility in the ordinary course.
American Tower Corporation Debt
2013 Credit Facility—In June 2013, the Company entered into a $1.5 billion multi-currency senior unsecured revolving credit facility, which was subsequently increased to $2.0 billion (the “2013 Credit Facility”), which includes a $1.0 billion sublimit for multicurrency borrowings, a $200.0 million sublimit for letters of credit, a $50.0 million sublimit for swingline loans and an expansion option allowing the Company to request additional commitments of up to $750.0 million including in the form of a term loan.
The 2013 Credit Facility has a term of five years and includes two optional one-year renewal periods. Any outstanding principal and accrued but unpaid interest will be due and payable in full at final maturity. The 2013 Credit Facility does not require amortization of principal and may be paid prior to maturity in whole or in part at the Company’s option without penalty or premium.
The Company has the option of choosing either a defined base rate or LIBOR as the applicable base rate for borrowings under the 2013 Credit Facility. The interest rate ranges between 1.125% to 2.000% above LIBOR for LIBOR based borrowings or between 0.125% to 1.000% above the defined base rate for base rate borrowings, in each case based upon the Company’s debt ratings. A quarterly commitment fee on the undrawn portion of the 2013 Credit Facility is required, ranging from 0.125% to 0.400% per annum, based upon the Company’s debt ratings. The current margin over LIBOR that the Company would incur on borrowings (should it choose LIBOR Advances) is 1.250%. The current commitment fee on the undrawn portion of the new credit facility is 0.150%.
The loan agreement contains certain reporting, information, financial and operating covenants and other restrictions (including limitations on additional debt, guaranties, sales of assets and liens) with which the Company must comply. Any failure to comply with the financial and operating covenants of the loan agreement would not only prevent the Company from being able to borrow additional funds, but would constitute a default, which could result in, among other things, the amounts outstanding, including all accrued interest and unpaid fees, becoming immediately due and payable.
On September 19, 2014, the Company entered into an amendment agreement with respect to the 2013 Credit Facility, which (i) amended the limitation on indebtedness of, and guaranteed by, the Company’s subsidiaries to the greater of (x) $800.0 million and (y) 50% of Adjusted EBITDA (as defined in the 2013 Credit Facility) on a consolidated basis as of the last day of the most recently completed fiscal quarter and (ii) permitted indebtedness owed by certain of the Company’s subsidiaries to its joint venture partners.
AMERICAN TOWER CORPORATION AND SUBSIDIARIES
NOTES TO CONSOLIDATED FINANCIAL STATEMENTS
During the year ended December 31, 2014, the Company borrowed $912.0 million and repaid an aggregate of $2.8 billion of revolving indebtedness under the 2013 Credit Facility. As of December 31, 2014, the Company has approximately $3.2 million of undrawn letters of credit under the 2013 Credit Facility and maintains the ability to draw down and repay amounts under the 2013 Credit Facility in the ordinary course.
In February 2015, the Company entered into amendments to the 2013 Credit Facility, see note 24.
Short-Term Credit Facility—In September 2013, the Company entered into a $1.0 billion senior unsecured revolving credit facility (the “Short-Term Credit Facility”), which matured on September 19, 2014. The Short-Term Credit Facility was undrawn at the time of maturity.
2013 Term Loan—In October 2013, the Company entered into a $1.5 billion unsecured term loan (the “2013 Term Loan”), which includes an expansion option allowing the Company to request additional commitments of up to $500.0 million.
Any outstanding principal and accrued but unpaid interest will be due and payable in full at maturity. The 2013 Term Loan may be paid prior to maturity in whole or in part at the Company’s option without penalty or premium. The Company has the option of choosing either a defined base rate or LIBOR as the applicable base rate. The interest rate ranges between 1.125% to 2.250% above LIBOR or between 0.125% to 1.250% above the defined base rate, in each case based upon the Company’s debt ratings. The current margin over LIBOR is 1.250%.
The loan agreement contains certain reporting, information, financial and operating covenants and other restrictions (including limitations on additional debt, guaranties, sales of assets and liens) with which the Company must comply. Any failure to comply with the financial and operating covenants of the loan agreement would constitute a default, which could result in, among other things, the amounts outstanding, including all accrued interest and unpaid fees, becoming immediately due and payable.
On September 19, 2014, the Company entered into an amendment agreement with respect to the 2013 Term Loan, which (i) amended the limitation on indebtedness of, and guaranteed by, the Company’s subsidiaries to the greater of (x) $800.0 million and (y) 50% of Adjusted EBITDA (as defined in the 2013 Term Loan) on a consolidated basis as of the last day of the most recently completed fiscal quarter and (ii) permitted indebtedness owed by certain of the Company’s subsidiaries to its joint venture partners.
In February 2015, the Company entered into amendments to the 2013 Term Loan, see note 24.
2014 Credit Facility—On September 19, 2014, the Company entered into an amendment and restatement of the $1.0 billion senior unsecured revolving credit facility entered into in January 2012 (as amended, the “2014 Credit Facility”), which, among other things, (i) increased the commitments thereunder to $1.5 billion, including a $50.0 million sublimit for swingline loans and a $200.0 million sublimit for letters of credit, (ii) extended the maturity date to January 31, 2020, including up to two optional renewal periods, (iii) amended the limitation on indebtedness of, and guaranteed by, the Company’s subsidiaries to the greater of (x) $800.0 million and (y) 50% of Adjusted EBITDA (as defined in the 2014 Credit Facility) on a consolidated basis as of the last day of the most recently completed fiscal quarter, (iv) permitted indebtedness owed by certain of the Company’s subsidiaries to its joint venture partners and (v) added an expansion feature, which allows the Company to request up to an aggregate of $500.0 million in additional commitments upon satisfaction of certain conditions.
Amounts borrowed under the 2014 Credit Facility will bear interest, at the Company’s option, at a margin above LIBOR or the Base Rate. For LIBOR based borrowings, interest rates will range from 1.125% to 2.000% above
AMERICAN TOWER CORPORATION AND SUBSIDIARIES
NOTES TO CONSOLIDATED FINANCIAL STATEMENTS
LIBOR. For Base Rate borrowings, interest rates will range from 0.125% to 1.000% above the Base Rate. In each case, the applicable margin is based upon the Company’s debt ratings. In addition, the 2014 Credit Facility requires a quarterly commitment fee on the undrawn portion of the commitments ranging from 0.125% to 0.400% per annum, based upon the Company’s debt ratings. The current margin over LIBOR that the Company incurs on borrowings is 1.250%, and the current commitment fee on the undrawn portion of the commitments is 0.150%. The 2014 Credit Facility does not require amortization of principal and may be paid prior to maturity in whole or in part at the Company’s option without penalty or premium.
The loan agreement contains certain reporting, information, financial and operating covenants and other restrictions (including limitations on additional debt, guaranties, sales of assets and liens) with which the Company must comply. Any failure to comply with the financial and operating covenants of the loan agreement would not only prevent the Company from being able to borrow additional funds, but would constitute a default, which could result in, among other things, the amounts outstanding, including all accrued interest and unpaid fees, becoming immediately due and payable.
During the year ended December 31, 2014, the Company borrowed $1.3 billion and repaid an aggregate of $263.0 million of revolving indebtedness under the 2014 Credit Facility. As of December 31, 2014, the Company has approximately $8.0 million of undrawn letters of credit under the 2014 Credit Facility and maintains the ability to draw down and repay amounts under the 2014 Credit Facility in the ordinary course.
In February 2015, the Company entered into amendments to the 2014 Credit Facility, see note 24.
Outstanding Senior Notes
3.40% Senior Notes and 5.00% Senior Notes Offering—On January 10, 2014, the Company completed a registered public offering through a reopening of its (i) 3.40% senior unsecured notes due 2019 (the “3.40% Notes”), in an aggregate principal amount of $250.0 million and (ii) 5.00% senior unsecured notes due 2024 (the “5.00% Notes”), in an aggregate principal amount of $500.0 million. The net proceeds from the offering were approximately $763.8 million, after deducting commissions and estimated expenses. As a result, the aggregate outstanding principal amount of each of the 3.40% Notes and the 5.00% Notes is $1.0 billion. The Company used a portion of the proceeds, together with cash on hand, to repay $88.0 million of outstanding indebtedness under the 2014 Credit Facility and $710.0 million of outstanding indebtedness under the 2013 Credit Facility.
The reopened 3.40% Notes issued on January 10, 2014 have identical terms as, are fungible with and are part of a single series of senior debt securities with the 3.40% Notes issued on August 19, 2013. The reopened 5.00% Notes issued on January 10, 2014 have identical terms as, are fungible with and are part of a single series of senior debt securities with the 5.00% Notes issued on August 19, 2013. The 3.40% Notes mature on February 15, 2019 and bear interest at a rate of 3.40% per annum. The 5.00% Notes mature on February 15, 2024 and bear interest at a rate of 5.00% per annum. Accrued and unpaid interest on the 3.40% Notes and the 5.00% Notes is payable in U.S. Dollars semi-annually in arrears on February 15 and August 15 of each year, beginning on February 15, 2014. Interest on the 3.40% Notes and the 5.00% Notes accrues from August 19, 2013 and is computed on the basis of a 360-day year comprised of twelve 30-day months.
3.450% Senior Notes Offering—On August 7, 2014, the Company completed a registered public offering of its 3.450% senior unsecured notes due 2021 (the “3.450% Notes”), in an aggregate principal amount of $650.0 million. The net proceeds from the offering were approximately $641.1 million, after deducting commissions and estimated expenses. The Company used the proceeds to repay existing indebtedness under the 2013 Credit Facility.
AMERICAN TOWER CORPORATION AND SUBSIDIARIES
NOTES TO CONSOLIDATED FINANCIAL STATEMENTS
The 3.450% Notes mature on September 15, 2021 and bear interest at a rate of 3.450% per annum. Accrued and unpaid interest on the 3.450% Notes is payable in U.S. Dollars semi-annually in arrears on March 15 and September 15 of each year, beginning on March 15, 2015. Interest on the 3.450% Notes accrues from August 7, 2014 and is computed on the basis of a 360-day year comprised of twelve 30-day months.
The following table outlines key terms related to the Company’s outstanding senior notes as of December 31, 2014:
| | | | | | | | | | | | | | | | | | | | | | | | |
| | | | | | Unamortized (Discount) Premium | | | | | | | | | | |
| | | Aggregate
Principal
Amount | | | 2014 | | | 2013 | | | Semi-annual
interest
payments due | | | Issue Date | | | Maturity Date | |
| | | | | | (in thousands) | | | | | | | | | | | | | |
4.625% Notes | | $ | 600,000 | | | $ | (42 | ) | | $ | (206 | ) | | | April 1 and October 1 | | | | October 20, 2009 | | | | April 1, 2015 | |
7.00% Notes | | | 500,000 | | | | — | | | | — | | | | April 15 and October 15 | | | | October 1, 2007 | | | | October 15, 2017 | |
4.50% Notes | | | 1,000,000 | | | | (369 | ) | | | (480 | ) | | | January 15 and July 15 | | | | December 7, 2010 | | | | January 15, 2018 | |
3.40 % Notes (1) | | | 1,000,000 | | | | 5,509 | | | | (627 | ) | | | February 15 and August 15 | | | | August 19, 2013 | | | | February 15, 2019 | |
7.25% Notes | | | 300,000 | | | | (2,740 | ) | | | (3,252 | ) | | | May 15 and November 15 | | | | June 10, 2009 | | | | May 15, 2019 | |
5.05% Notes | | | 700,000 | | | | (504 | ) | | | (587 | ) | | | March 1 and September 1 | | | | August 16, 2010 | | | | September 1, 2020 | |
3.450% Notes | | | 650,000 | | | | (3,606 | ) | | | — | | | | March 15 and September 15 | | | | August 7, 2014 | | | | September 15, 2021 | |
5.90% Notes | | | 500,000 | | | | (526 | ) | | | (586 | ) | | | May 1 and November 1 | | | | October 6, 2011 | | | | November 1, 2021 | |
4.70% Notes | | | 700,000 | | | | (1,013 | ) | | | (1,129 | ) | | | March 15 and September 15 | | | | March 12, 2012 | | | | March 15, 2022 | |
3.50% Notes | | | 1,000,000 | | | | (6,770 | ) | | | (7,480 | ) | | | January 31 and July 31 | | | | January 8, 2013 | | | | January 31, 2023 | |
5.00% Notes (1) | | | 1,000,000 | | | | 10,834 | | | | (545 | ) | | | February 15 and August 15 | | | | August 19, 2013 | | | | February 15, 2024 | |
(1) | The original issue date for the 3.40% Notes and the 5.00% Notes was August 19, 2013. The issue date for the reopened 3.40% Notes and the reopened 5.00% Notes was January 10, 2014. |
The Company may redeem each of the series of senior notes at any time at a redemption price equal to 100% of the principal amount of such notes, plus a make-whole premium, together with accrued interest to the redemption date. Each of the applicable indentures, including any supplemental indentures (the “Indentures”) for the notes contain certain covenants that restrict the Company’s ability to merge, consolidate or sell assets and its (together with its subsidiaries’) ability to incur liens. These covenants are subject to a number of exceptions, including that the Company and its subsidiaries may incur certain liens on assets, mortgages or other liens securing indebtedness, if the aggregate amount of such liens shall not exceed 3.5x Adjusted EBITDA, as defined in the applicable Indenture for each of the notes. If the Company undergoes a change of control and ratings decline, each as defined in the Indentures, the Company may be required to repurchase one or more series of notes at a purchase price equal to 101% of the principal amount, plus accrued and unpaid interest (including additional interest, if any) up to, but not including, the date of repurchase. The notes rank equally with all of the Company’s other senior unsecured debt and are structurally subordinated to all existing and future indebtedness and other obligations of the Company’s subsidiaries.
Capital Lease and Other Obligations—The Company’s capital lease and other obligations approximated $95.4 million and $73.4 million as of December 31, 2014 and 2013, respectively. These obligations are secured by the related assets, bear interest at rates of 2.27% to 8.00%, and mature in periods ranging from less than one year to approximately seventy years.
AMERICAN TOWER CORPORATION AND SUBSIDIARIES
NOTES TO CONSOLIDATED FINANCIAL STATEMENTS
Maturities—As of December 31, 2014, aggregate principal maturities of long-term debt, including capital leases, for the next five years and thereafter are expected to be (in thousands):
| | | | |
Year Ending December 31, | | | | |
2015 | | $ | 897,624 | |
2016 | | | 758,054 | |
2017 | | | 706,488 | |
2018 | | | 1,793,100 | |
2019 | | | 3,163,859 | |
Thereafter | | | 7,254,208 | |
| | | | |
Total cash obligations | | | 14,573,333 | |
Unamortized discounts and premiums, net | | | 35,375 | |
| | | | |
Balance as of December 31, 2014 | | $ | 14,608,708 | |
| | | | |
9. OTHER NON-CURRENT LIABILITIES
Other non-current liabilities consists of the following as of December 31, (in thousands):
| | | | | | | | |
| | | 2014 | | | 2013 (1) | |
Unearned revenue | | $ | 415,809 | | | $ | 278,295 | |
Deferred rent liability | | | 303,442 | | | | 273,318 | |
Other miscellaneous liabilities | | | 309,131 | | | | 251,655 | |
| | | | | | | | |
Balance as of December 31, | | $ | 1,028,382 | | | $ | 803,268 | |
| | | | | | | | |
(1) | December 31, 2013 balances have been revised to reflect purchase accounting measurement period adjustments. |
10. ASSET RETIREMENT OBLIGATIONS
The changes in the carrying amount of the Company’s asset retirement obligations are as follows (in thousands):
| | | | | | | | |
| | | 2014 | | | 2013 (1) | |
Beginning balance as of January 1, | | $ | 549,548 | | | $ | 435,624 | |
Additions | | | 52,623 | | | | 117,330 | |
Accretion expense | | | 40,325 | | | | 34,045 | |
Revisions in estimates (2) | | | (32,311 | ) | | | (36,492 | ) |
Settlements | | | (1,150 | ) | | | (959 | ) |
| | | | | | | | |
Balance as of December 31, | | $ | 609,035 | | | $ | 549,548 | |
| | | | | | | | |
(1) | December 31, 2013 balances have been revised to reflect purchase accounting measurement period adjustments. |
(2) | Revisions in estimates include the impact of approximately $(38.5) million and $(19.8) million of foreign currency translation for the years ended December 31, 2014 and 2013, respectively. |
As of December 31, 2014, the estimated undiscounted future cash outlay for asset retirement obligations is approximately $1.8 billion.
AMERICAN TOWER CORPORATION AND SUBSIDIARIES
NOTES TO CONSOLIDATED FINANCIAL STATEMENTS
11. DERIVATIVE FINANCIAL INSTRUMENTS
Certain of the Company’s foreign subsidiaries have entered into interest rate swap agreements, which have been designated as cash flow hedges, to manage exposure to variability in interest rates on debt.
South Africa
One of the Company’s South African subsidiaries has fifteen interest rate swap agreements outstanding, which mature on the earlier of termination of the underlying debt or March 31, 2020. The interest rate swap agreements provide that the Company pay a fixed interest rate ranging from 6.09% to 7.83% and receive variable interest at the three-month JIBAR over the term of the interest rate swap agreements. The notional value is reduced in accordance with the repayment schedule under the South African Facility.
Colombia
In connection with entering into the Colombian Credit Facility in October 2014, one of the Company’s Colombian subsidiaries entered into an interest rate swap agreement with an aggregate notional value of 100.0 billion COP (approximately $41.8 million) with certain of the lenders under the Colombian Credit Facility. The interest rate swap agreement matures on the earlier of termination of the underlying debt or April 24, 2021 and provides that the Company pay a fixed interest rate of 5.74% and receive variable interest at the three-month IBR over the term of the interest rate swap agreement. The notional value is reduced in accordance with the repayment schedule under the Colombian Credit Facility.
In October 2014, the Company settled its previously existing interest rate swap related to the Colombian Long-Term Credit Facility and recognized a 3.0 billion COP (approximately $1.4 million) loss included in Loss on retirement of long-term obligations in the consolidated statements of operations.
The notional amount and fair value of the interest rate swap agreements are as follows (in thousands):
| | | | | | | | | | | | | | | | |
| | | December 31, 2014 | | | December 31, 2013 | |
| | | Local | | | USD | | | Local | | | USD | |
South Africa (ZAR) | | | | | | | | | | | | | | | | |
Notional | | | 440,614 | | | | 38,080 | | | | 469,354 | | | | 44,732 | |
Fair Value | | | 1,016 | | | | 88 | | | | 939 | | | | 90 | |
Colombia (COP) | | | | | | | | | | | | | | | | |
Notional | | | 100,000,000 | | | | 41,798 | | | | 101,250,000 | | | | 52,547 | |
Fair Value | | | (1,548,688 | ) | | | (647 | ) | | | (3,000,236 | ) | | | (1,557 | ) |
Costa Rica (USD) (1) | | | | | | | | | | | | | | | | |
Notional | | | — | | | | — | | | | N/A | | | | 42,000 | |
Fair Value | | | — | | | | — | | | | N/A | | | | (628 | ) |
(1) | One of the Company’s Costa Rican subsidiaries had three interest rate swap agreements, which were terminated upon repayment of the Costa Rica Loan in February 2014. |
As of December 31, 2014 and 2013, the South African interest rate swap agreements are in an asset position and are included in Notes receivable and other non-current assets on the consolidated balance sheets. The Colombian interest rate swap agreement is in a liability position and is included in Other non-current liabilities on the consolidated balance sheets.
In addition to the interest rate swap agreements, the Company is amortizing the settlement cost of a treasury rate lock as additional interest expense over the term of the 7.00% senior unsecured notes due 2017.
AMERICAN TOWER CORPORATION AND SUBSIDIARIES
NOTES TO CONSOLIDATED FINANCIAL STATEMENTS
During the years ended December 31, 2014, 2013 and 2012, the interest rate swap agreements and treasury rate lock had the following impact on the Company’s consolidated financial statements (in thousands):
| | | | | | | | | | |
Year Ended
December 31, | | Gain(Loss)
Recognized in OCI - Effective Portion | | Gain(Loss)
Reclassified from
AOCI into
Income - Effective Portion | | Location of
Gain(Loss)
Reclassified from
AOCI into Income-
Effective Portion (1) | | Gain(Loss)
Recognized
in Income -
Ineffective Portion | | Location of
Gain(Loss)
Recognized in
Income - Ineffective Portion |
2014 | | $(2,082) | | $(3,606) | | Interest expense/Loss on retirement of long-term obligations | | N/A | | N/A |
2013 | | $ 1,481 | | $(2,809) | | Interest expense | | N/A | | N/A |
2012 | | $(6,220) | | $(1,340) | | Interest expense | | N/A | | N/A |
(1) | During the year ended December 31, 2014, amount includes $1.0 million reclassified from AOCI into Loss on retirement of long-term obligations in connection with the settlement of the interest rate swap related to the Colombian Long-Term Credit Facility. |
As of December 31, 2014, $0.7 million of the amount related to derivatives designated as cash flow hedges and recorded in AOCI is expected to be reclassified into earnings in the next twelve months.
The Company also recognized a gain on the settlement of interest rate swap agreements entered into in connection with the 2007 Securitization. The settlement was recognized as a reduction in interest expense over a five-year period for which the interest rate swaps were designated as hedges. During the year ended December 31, 2012, the Company recorded $0.2 million as a reduction in interest expense. The remaining portion of the gain was fully amortized during the year ended December 31, 2012.
For additional information on the Company’s interest rate swap agreements, see notes 12 and 13.
12. FAIR VALUE MEASUREMENTS
The Company determines the fair value of its financial instruments based on the fair value hierarchy, which requires an entity to maximize the use of observable inputs and minimize the use of unobservable inputs when measuring fair value. Below are the three levels of inputs that may be used to measure fair value:
| | |
Level 1
| | Quoted prices in active markets for identical assets or liabilities that the Company has the ability to access at the measurement date. |
| |
Level 2
| | Observable inputs other than Level 1 prices, such as quoted prices for similar assets or liabilities; quoted prices in markets that are not active; or other inputs that are observable or can be corroborated by observable market data for substantially the full term of the assets or liabilities. |
| |
Level 3
| | Unobservable inputs that are supported by little or no market activity and that are significant to the fair value of the assets or liabilities. |
AMERICAN TOWER CORPORATION AND SUBSIDIARIES
NOTES TO CONSOLIDATED FINANCIAL STATEMENTS
Items Measured at Fair Value on a Recurring Basis—The fair value of the Company’s financial assets and liabilities that are required to be measured on a recurring basis at fair value is as follows (in thousands):
| | | | | | | | | | | | | | |
| | | December 31, 2014 | |
| | | Fair Value Measurements Using | | | Assets/Liabilities
at Fair Value | |
| | | Level 1 | | Level 2 | | | Level 3 | | |
| | | | |
Assets: | | | | | | | | | | | | | | |
Short-term investments (1) | | | | $ | 6,302 | | | | | | | $ | 6,302 | |
Interest rate swap agreements | | | | $ | 88 | | | | | | | $ | 88 | |
| | | | |
Liabilities: | | | | | | | | | | | | | | |
Acquisition-related contingent consideration | | | | | | | | $ | 28,524 | | | $ | 28,524 | |
Interest rate swap agreements | | | | $ | 647 | | | | | | | $ | 647 | |
| | | | | | | | | | | | | | |
| | | December 31, 2013 | |
| | | Fair Value Measurements Using | | | Assets/Liabilities
at Fair Value | |
| | | Level 1 | | Level 2 | | | Level 3 | | |
| | | | |
Assets: | | | | | | | | | | | | | | |
Short-term investments (1) | | | | $ | 18,612 | | | | | | | $ | 18,612 | |
Interest rate swap agreements | | | | $ | 90 | | | | | | | $ | 90 | |
| | | | |
Liabilities: | | | | | | | | | | | | | | |
Acquisition-related contingent consideration | | | | | | | | $ | 31,890 | | | $ | 31,890 | |
Interest rate swap agreements | | | | $ | 2,185 | | | | | | | $ | 2,185 | |
(1) | Consists of highly liquid investments with original maturities in excess of three months. |
Interest Rate Swap Agreements
The fair value of the Company’s interest rate swap agreements is determined using pricing models with inputs that are observable in the market or can be derived principally from, or corroborated by, observable market data. Fair valuations of the interest rate swap agreements reflect the value of the instrument including the values associated with counterparty risk, the Company’s own credit standing and the value of the net credit differential between the counterparties to the derivative contract.
Acquisition-Related Contingent Consideration
The Company may be required to pay additional consideration under certain agreements for the acquisition of communications sites if specific conditions are met or events occur. In Colombia and Ghana, the Company may be required to pay additional consideration upon the conversion of certain barter agreements with other wireless carriers to cash-paying lease agreements. In addition, in Costa Rica and the United States, the Company may be required to pay additional consideration if certain pre-designated tenant leases commence during a specified period of time.
Acquisition-related contingent consideration is initially measured and recorded at fair value as an element of consideration in connection with an acquisition with subsequent adjustments recognized in Other operating expenses in the consolidated statements of operations. The Company determines the fair value of acquisition-related contingent consideration, and any subsequent changes in fair value, using a discounted probability-weighted approach. This approach takes into consideration Level 3 unobservable inputs including probability
AMERICAN TOWER CORPORATION AND SUBSIDIARIES
NOTES TO CONSOLIDATED FINANCIAL STATEMENTS
assessments of expected future cash flows over the period in which the obligation is expected to be settled and applies a discount factor that captures the uncertainties associated with the obligation. Changes in these unobservable inputs could significantly impact the fair value of the liabilities recorded in the accompanying consolidated balance sheets and adjustments recorded in the consolidated statements of operations.
As of December 31, 2014, the Company estimates that the value of all potential acquisition-related contingent consideration required payments to be between zero and $40.4 million. During the years ended December 31, 2014 and 2013, the fair value of the contingent consideration changed as follows (in thousands):
| | | | | | | | |
| | | 2014 | | | 2013 | |
Balance as of January 1 | | $ | 31,890 | | | $ | 23,711 | |
Additions | | | 6,412 | | | | 13,474 | |
Settlements | | | (3,889 | ) | | | (8,789 | ) |
Change in fair value | | | (225 | ) | | | 5,743 | |
Foreign currency translation adjustment | | | (4,934 | ) | | | (2,249 | ) |
Other (1) | | | (730 | ) | | | — | |
| | | | | | | | |
Balance as of December 31 | | $ | 28,524 | | | $ | 31,890 | |
| | | | | | | | |
(1) | In connection with the sale of operations in Panama, the buyer assumed the Company’s potential obligations related to additional purchase price consideration. |
Items Measured at Fair Value on a Nonrecurring Basis
Assets Held and Used—The Company’s long-lived assets are measured at fair value on a nonrecurring basis using Level 3 inputs. During the year ended December 31, 2014, certain long-lived assets held and used with a carrying value of $8,900.0 million were written down to their net realizable value of $8,888.8 million as a result of an asset impairment charge of $11.2 million. During the year ended December 31, 2013, certain long-lived assets held and used with a carrying value of $8,554.5 million were written down to their net realizable value of $8,538.6 million, as a result of an asset impairment charge of $15.9 million. The asset impairment charges are recorded in Other operating expenses in the accompanying consolidated statements of operations. These adjustments were determined by comparing the estimated proceeds from the sale of assets or the estimated fair value utilizing projected future discounted cash flows to be provided from the long-lived assets to the asset’s carrying value.
During the year ended December 31, 2014, NII, a U.S. corporation, filed for Chapter 11 bankruptcy protection on behalf of itself and certain of its subsidiaries. NII is the ultimate parent company of certain operating subsidiaries in Brazil, Chile and Mexico that collectively represent approximately 6% of the Company’s consolidated revenues for the year ended December 31, 2014. None of these subsidiaries were included in NII’s Chapter 11 filing. The Company’s assessment of the impact of the proceedings did not identify any indicators of impairment as of December 31, 2014.
Sale of Assets—During the year ended December 31, 2014, the Company completed the sale of its operations in Panama and its third-party structural analysis business for an aggregate sale price of $17.9 million, plus a working capital adjustment. At the time of sale, the carrying amount of these assets primarily included $8.1 million of property and equipment, $7.8 million of intangible assets and $3.6 million of goodwill. The Company recorded a net charge of $2.2 million in Other operating expenses in the accompanying consolidated statements of operations.
There were no other items measured at fair value on a nonrecurring basis during the year ended December 31, 2014.
AMERICAN TOWER CORPORATION AND SUBSIDIARIES
NOTES TO CONSOLIDATED FINANCIAL STATEMENTS
Fair Value of Financial Instruments—The Company’s financial instruments for which the carrying value reasonably approximates fair value at December 31, 2014 and 2013 include cash and cash equivalents, restricted cash, accounts receivable and accounts payable. The Company’s estimates of fair value of its long-term obligations, including the current portion, are based primarily upon reported market values. For long-term debt not actively traded, fair value is estimated using either indicative price quotes or a discounted cash flow analysis using rates for debt with similar terms and maturities. As of December 31, 2014, the carrying value and fair value of long-term obligations, including the current portion, are $14.6 billion and $15.0 billion, respectively, of which $9.7 billion is measured using Level 1 inputs and $5.3 billion is measured using Level 2 inputs. As of December 31, 2013, the carrying value and fair value of long-term obligations, including the current portion, were $14.5 billion and $14.7 billion, respectively, of which $8.6 billion was measured using Level 1 inputs and $6.1 billion was measured using Level 2 inputs.
13. ACCUMULATED OTHER COMPREHENSIVE LOSS
The changes in Accumulated other comprehensive loss for the years ended December 31, 2014 and 2013, are as follows (in thousands):
| | | | | | | | | | | | | | | | |
| | | Unrealized Losses on
Cash Flow Hedges | | | Deferred Loss
on the
Settlement of
the Treasury
Rate Lock | | | Foreign
Currency
Items | | | Total | |
Balance as of January 1, 2014 | | $ | (1,869 | ) | | $ | (3,029 | ) | | $ | (306,322 | ) | | $ | (311,220 | ) |
Other comprehensive loss before reclassifications, net of tax | | | (1,966 | ) | | | — | | | | (484,323 | ) | | | (486,289 | ) |
Amounts reclassified from accumulated other comprehensive loss, net of tax | | | 2,490 | | | | 798 | | | | — | | | | 3,288 | |
| | | | | | | | | | | | | | | | |
Net current-period other comprehensive income (loss) | | | 524 | | | | 798 | | | | (484,323 | ) | | | (483,001 | ) |
| | | | | | | | | | | | | | | | |
Balance as of December 31, 2014 | | $ | (1,345 | ) | | $ | (2,231 | ) | | $ | (790,645 | ) | | $ | (794,221 | ) |
| | | | | | | | | | | | | | | | |
| | | | |
| | | Unrealized Losses on
Cash Flow Hedges | | | Deferred Loss
on the
Settlement of
the Treasury
Rate Lock | | | Foreign
Currency
Items | | | Total | |
Balance as of January 1, 2013 | | $ | (4,358 | ) | | $ | (3,827 | ) | | $ | (175,162 | ) | | $ | (183,347 | ) |
Other comprehensive income (loss) before reclassifications, net of tax | | | 867 | | | | — | | | | (131,160 | ) | | | (130,293 | ) |
Amounts reclassified from accumulated other comprehensive loss, net of tax | | | 1,622 | | | | 798 | | | | — | | | | 2,420 | |
| | | | | | | | | | | | | | | | |
Net current-period other comprehensive income (loss) | | | 2,489 | | | | 798 | | | | (131,160 | ) | | | (127,873 | ) |
| | | | | | | | | | | | | | | | |
Balance as of December 31, 2013 | | $ | (1,869 | ) | | $ | (3,029 | ) | | $ | (306,322 | ) | | $ | (311,220 | ) |
| | | | | | | | | | | | | | | | |
During the year ended December 31, 2014, approximately $1.0 million was reclassified from Accumulated other comprehensive loss into Loss on retirement of long-term obligations in connection with the settlement of the interest rate swap related to the Colombian Long-Term Credit Facility. The remaining loss on cash flow hedges was reclassified into interest expense and the associated tax effect of $0.1 million and $0.2 million for the years ended December 31, 2014 and 2013, respectively, is included in Income tax provision.
AMERICAN TOWER CORPORATION AND SUBSIDIARIES
NOTES TO CONSOLIDATED FINANCIAL STATEMENTS
14. INCOME TAXES
The Company has filed, for prior taxable years through its taxable year ended December 31, 2011, consolidated U.S. federal tax returns, which included all of its then wholly owned domestic subsidiaries. For its taxable year commencing January 1, 2012, the Company filed, and intends to continue to file, as a REIT, and its domestic TRSs filed, and intend to continue to file, as C corporations. The Company also files tax returns in various states and countries. The Company’s state tax returns reflect different combinations of the Company’s subsidiaries and are dependent on the connection each subsidiary has with a particular state. The following information pertains to the Company’s income taxes on a consolidated basis.
The income tax provision from continuing operations is comprised of the following for the years ended December 31, (in thousands):
| | | | | | | | | | | | |
| | | 2014 | | | 2013 | | | 2012 | |
Current: | | | | | | | | | | | | |
Federal | | $ | (2,390 | ) | | $ | (30,322 | ) | | $ | (18,170 | ) |
State | | | (797 | ) | | | (13,731 | ) | | | (6,321 | ) |
Foreign | | | (57,934 | ) | | | (44,973 | ) | | | (53,513 | ) |
Deferred: | | | | | | | | | | | | |
Federal | | | (4,180 | ) | | | (16,318 | ) | | | (13,094 | ) |
State | | | (973 | ) | | | (5,139 | ) | | | (666 | ) |
Foreign | | | 3,769 | | | | 50,942 | | | | (15,540 | ) |
| | | | | | | | | | | | |
Income tax provision | | $ | (62,505 | ) | | $ | (59,541 | ) | | $ | (107,304 | ) |
| | | | | | | | | | | | |
The income tax provision for the years ended December 31, 2014 and 2013 include an expense of approximately $2.6 million and $21.5 million, respectively, resulting from the restructuring of certain of the Company’s domestic TRSs.
The domestic and foreign components of income from continuing operations before income taxes and income on equity method investments are as follows for the years ended December 31, (in thousands):
| | | | | | | | | | | | |
| | | 2014 | | | 2013 | | | 2012 | |
United States | | $ | 857,457 | | | $ | 766,772 | | | $ | 787,960 | |
Foreign | | | 8,247 | | | | (225,023 | ) | | | (86,666 | ) |
| | | | | | | | | | | | |
Total | | $ | 865,704 | | | $ | 541,749 | | | $ | 701,294 | |
| | | | | | | | | | | | |
Reconciliation between the U.S. statutory rate and the effective rate from continuing operations is as follows for the years ended December 31:
| | | | | | | | | | | | |
| | | 2014 | | | 2013 | | | 2012 | |
Statutory tax rate | | | 35 | % | | | 35 | % | | | 35 | % |
Tax adjustment related to REIT (1) | | | (35 | ) | | | (35 | ) | | | (35 | ) |
State taxes, net of federal benefit | | | 1 | | | | 3 | | | | 1 | |
Foreign taxes | | | 2 | | | | (5 | ) | | | 4 | |
Foreign withholding taxes | | | 3 | | | | 6 | | | | 4 | |
Domestic TRS restructuring | | | — | | | | 4 | | | | — | |
Change in valuation allowance | | | — | | | | — | | | | 8 | |
Other | | | 1 | | | | 3 | | | | (2 | ) |
| | | | | | | | | | | | |
Effective tax rate | | | 7 | % | | | 11 | % | | | 15 | % |
| | | | | | | | | | | | |
(1) | Includes 24%, 28% and 18% from dividend paid deductions in 2014, 2013 and 2012, respectively. |
AMERICAN TOWER CORPORATION AND SUBSIDIARIES
NOTES TO CONSOLIDATED FINANCIAL STATEMENTS
The components of the net deferred tax asset and related valuation allowance are as follows as of December 31, (in thousands):
| | | | | | | | |
| | | 2014 | | | 2013 (1) | |
Current assets: | | | | | | | | |
Allowances, accruals and other items not currently deductible | | $ | 20,525 | | | $ | 28,077 | |
Current deferred liabilities | | | (2,799 | ) | | | (4,547 | ) |
| | | | | | | | |
Subtotal | | | 17,726 | | | | 23,530 | |
Valuation allowance | | | (3,094 | ) | | | (3,638 | ) |
| | | | | | | | |
Net current deferred tax assets | | $ | 14,632 | | | $ | 19,892 | |
| | | | | | | | |
Non-current items: | | | | | | | | |
Assets: | | | | | | | | |
Net operating loss carryforwards | | | 242,701 | | | | 197,335 | |
Accrued asset retirement obligations | | | 103,975 | | | | 88,884 | |
Stock-based compensation | | | 693 | | | | 4,331 | |
Unearned revenue | | | 18,947 | | | | 46,788 | |
Unrealized loss on foreign currency | | | 15,952 | | | | 68,951 | |
Items not currently deductible and other | | | 22,142 | | | | 23,908 | |
Liabilities: | | | | | | | | |
Depreciation and amortization | | | (132,254 | ) | | | (82,068 | ) |
Deferred rent | | | (18,355 | ) | | | (17,814 | ) |
Other | | | (1,805 | ) | | | (5,302 | ) |
| | | | | | | | |
Subtotal | | | 251,996 | | | | 325,013 | |
Valuation allowance | | | (138,147 | ) | | | (132,368 | ) |
| | | | | | | | |
Net non-current deferred tax assets | | $ | 113,849 | | | $ | 192,645 | |
| | | | | | | | |
(1) | December 31, 2013 balances have been revised to reflect purchase accounting measurement period adjustments. |
The Company’s deferred tax assets as of December 31, 2014 in the table above do not include $0.5 million of excess tax benefits from the exercise of employee stock options that are a component of NOLs as these benefits can only be recognized when the related tax deduction reduces income taxes payable.
At December 31, 2014 and 2013, the Company has provided a valuation allowance of approximately $141.2 million and $136.0 million, respectively, which primarily relates to foreign items. During 2014, the Company increased amounts recorded as valuation allowances due to the uncertainty as to the timing of, and the Company’s ability to recover, net deferred tax assets in certain foreign operations in the foreseeable future. The amount of deferred tax assets considered realizable, however, could be adjusted if objective evidence in the form of cumulative losses is no longer present and additional weight may be given to subjective evidence such as the Company’s projections for growth.
The recoverability of the Company’s net deferred tax asset has been assessed utilizing projections based on its current operations. Accordingly, the recoverability of the net deferred tax asset is not dependent on material asset sales or other non-routine transactions. Based on its current outlook of future taxable income during the carryforward period, management believes that the net deferred tax asset will be realized.
The Company considers the earnings of certain non-U.S. subsidiaries to be indefinitely invested outside the United States on the basis of estimates that future domestic cash generation will be sufficient to meet future
AMERICAN TOWER CORPORATION AND SUBSIDIARIES
NOTES TO CONSOLIDATED FINANCIAL STATEMENTS
domestic cash needs. The Company has not recorded a deferred tax liability related to the U.S. federal and state income taxes and foreign withholding taxes on approximately $391.0 million of undistributed earnings of foreign subsidiaries indefinitely invested outside of the United States. Should the Company decide to repatriate the foreign earnings, it may have to adjust the income tax provision in the period it determined that the earnings will no longer be indefinitely invested outside of the United States.
At December 31, 2014, the Company had net federal, state and foreign operating loss carryforwards available to reduce future taxable income, which includes losses of approximately $0.3 billion related to employee stock options. If not utilized, the Company’s net operating loss carryforwards expire as follows (in thousands):
| | | | | | | | | | | | |
Years ended December 31, | | Federal | | | State | | | Foreign | |
2015 to 2019 | | $ | — | | | $ | 82,656 | | | $ | 11,896 | |
2020 to 2024 | | | — | | | | 290,466 | | | | 163,078 | |
2025 to 2029 | | | 510,016 | | | | 444,038 | | | | — | |
2030 to 2034 | | | 429,759 | | | | 217,367 | | | | — | |
Indefinite carryforward | | | — | | | | — | | | | 648,731 | |
| | | | | | | | | | | | |
Total | | $ | 939,775 | | | $ | 1,034,527 | | | $ | 823,705 | |
| | | | | | | | | | | | |
Of the above $939.8 million of federal net operating loss carryforwards, $647.3 million is restricted to offset taxable income of the subsidiaries of the Company.
In addition, the Company has Mexican tax credits of $2.1 million, which if not utilized will expire in 2017.
As of December 31, 2014 and 2013, the total amount of unrecognized tax benefits that would impact the effective tax rate, if recognized, is $31.9 million and $31.1 million, respectively. The Company expects the unrecognized tax benefits to change over the next 12 months if certain tax matters ultimately settle with the applicable taxing jurisdiction during this timeframe, or if the applicable statute of limitations lapses. The impact of the amount of such changes to previously recorded uncertain tax positions could range from zero to $18.2 million. A reconciliation of the beginning and ending amount of unrecognized tax benefits are as follows for the years ended December 31, (in thousands):
| | | | | | | | | | | | |
| | | 2014 | | | 2013 | | | 2012 | |
Balance at January 1 | | $ | 32,545 | | | $ | 34,337 | | | $ | 38,886 | |
Additions based on tax positions related to the current year | | | 4,187 | | | | 1,427 | | | | 1,037 | |
Additions for tax positions of prior years | | | 3,780 | | | | — | | | | — | |
Reductions for tax positions of prior years | | | — | | | | (320 | ) | | | (221 | ) |
Foreign currency | | | (3,216 | ) | | | (1,681 | ) | | | (439 | ) |
Reduction as a result of the lapse of statute of limitations and effective settlements (1) | | | (5,349 | ) | | | (1,218 | ) | | | (4,926 | ) |
| | | | | | | | | | | | |
Balance at December 31 | | $ | 31,947 | | | $ | 32,545 | | | $ | 34,337 | |
| | | | | | | | | | | | |
(1) | Includes $2.1 million of effective settlements for the year ended December 31, 2012. |
During the years ended December 31, 2014, 2013 and 2012, the statute of limitations on certain unrecognized tax benefits lapsed and certain positions were effectively settled, which resulted in a decrease of $5.3 million, $1.2 million and $4.9 million, respectively, in the liability for uncertain tax benefits, all of which reduced the income tax provision.
AMERICAN TOWER CORPORATION AND SUBSIDIARIES
NOTES TO CONSOLIDATED FINANCIAL STATEMENTS
The Company recorded penalties and tax-related interest expense (benefit) to the tax provision of ($3.4 million), $3.4 million and ($2.9 million) for the years ended December 31, 2014, 2013 and 2012, respectively. As of December 31, 2014 and 2013, the total unrecognized tax benefits included in the consolidated balance sheets were $31.9 million and $32.5 million, respectively. As of December 31, 2014 and 2013, the total amount of accrued income tax-related interest and penalties included the consolidated balance sheets were $24.9 million and $30.9 million, respectively.
The Company has filed for prior taxable years, and for its taxable year ended December 31, 2014 will file, numerous consolidated and separate income tax returns, including U.S. federal and state tax returns and foreign tax returns. The Company is subject to examination in the U.S. and various state and foreign jurisdictions for certain tax years. As a result of the Company’s ability to carryforward federal, state and foreign NOLs, the applicable tax years generally remain open to examination several years after the applicable loss carryforwards have been used or expired. The Company regularly assesses the likelihood of additional assessments in each of the tax jurisdictions resulting from these examinations. The Company believes that adequate provisions have been made for income taxes for all periods through December 31, 2014.
In September 2013, the Internal Revenue Service released final Tangible Property Regulations (the “Final Regulations”). The Final Regulations provide guidance on applying Section 263(a) of the Code to amounts paid to acquire, produce or improve tangible property, as well as rules for materials and supplies (Code Section 162). These regulations contain certain changes from the temporary and proposed tangible property regulations that were issued on December 27, 2011. The Final Regulations are generally effective for taxable years beginning on or after January 1, 2014. In addition, taxpayers were permitted to early adopt the Final Regulations for taxable years beginning on or after January 1, 2012. The Final Regulations did not have a material effect on the Company’s results of operations or financial condition.
15. STOCK-BASED COMPENSATION
The Company recognized stock-based compensation expense of $80.2 million, $68.1 million and $52.0 million for the years ended December 31, 2014, 2013 and 2012, respectively. Stock-based compensation expense for the years ended December 31, 2013 included $1.1 million, related to the modification of the vesting and exercise terms for certain employees’ equity awards. The Company did not modify the vesting or exercise terms of equity awards during the years ended December 31, 2014 and 2012. The Company capitalized $1.6 million of stock-based compensation expense as property and equipment during each of the years ended December 31, 2014 and 2013.
Summary of Stock-Based Compensation Plans—The Company maintains equity incentive plans that provide for the grant of stock-based awards to its directors, officers and employees. The 2007 Equity Incentive Plan (the “2007 Plan”) provides for the grant of non-qualified and incentive stock options, as well as restricted stock units, restricted stock and other stock-based awards. Exercise prices in the case of non-qualified and incentive stock options are not less than the fair value of the underlying common stock on the date of grant. Equity awards typically vest ratably over various periods, generally four years, and stock options generally expire ten years from the date of grant. As of December 31, 2014, the Company has the ability to grant stock-based awards with respect to an aggregate of 14.3 million shares of common stock under the 2007 Plan.
The Company’s Compensation Committee adopted a death, disability and retirement benefits program in connection with equity awards granted on or after January 1, 2013 that provides for accelerated vesting and extended exercise periods of stock options and restricted stock units upon an employee’s death or permanent disability, or upon an employee’s qualified retirement, provided certain eligibility criteria are met. Accordingly,
AMERICAN TOWER CORPORATION AND SUBSIDIARIES
NOTES TO CONSOLIDATED FINANCIAL STATEMENTS
for grants made on or after January 1, 2013, the Company recognizes compensation expense for all stock-based compensation over the shorter of (i) the four-year vesting period or (ii) the period from the date of grant to the date the employee becomes eligible for such retirement benefits, which may occur upon grant. Due to the accelerated recognition of stock-based compensation expense related to awards granted to retirement eligible employees, the Company recognized an incremental $14.8 million and $7.8 million of stock-based compensation expense during the years ended December 31, 2014 and 2013, respectively.
Stock Options—The fair value of each option grant is estimated on the date of grant using the Black-Scholes option pricing model based on the assumptions noted in the table below. The risk-free interest rate is based on the U.S. Treasury yield approximating the estimated life in effect at the accounting measurement date. The expected life of option grants (estimated period of time outstanding) is estimated using the vesting term and historical exercise behavior of the Company’s employees. The expected volatility of the underlying stock price is based on historical volatility for a period equal to the expected life of the stock options. The expected annual dividend yield is the Company’s best estimate of expected future dividend yield.
Key assumptions used to apply this pricing model are as follows:
| | | | | | |
| | | 2014 | | 2013 | | 2012 |
Range of risk-free interest rate | | 1.46% - 1.74% | | 0.75% - 1.42% | | 0.62% - 1.03% |
Weighted average risk-free interest rate | | 1.64% | | 0.91% | | 0.92% |
Expected life of option grants | | 4.5 years | | 4.4 years | | 4.4 years |
Range of expected volatility of the underlying stock price | | 21.94% - 23.35% | | 24.43% - 36.09% | | 36.53% - 37.86% |
Weighted average expected volatility of underlying stock price | | 23.08% | | 33.37% | | 37.84% |
Expected annual dividend yield | | 1.50% | | 1.50% | | 1.50% |
The weighted average grant date fair value per share during the years ended December 31, 2014, 2013 and 2012 was $14.86, $19.05 and $17.46, respectively. The intrinsic value of stock options exercised during the years ended December 31, 2014, 2013 and 2012 was $58.0 million, $42.1 million and $59.5 million, respectively. As of December 31, 2014, total unrecognized compensation expense related to unvested stock options is approximately $32.1 million and is expected to be recognized over a weighted average period of approximately two years. The amount of cash received from the exercise of stock options was approximately $56.6 million during the year ended December 31, 2014.
The Company’s option activity for the year ended December 31, 2014 is as follows:
| | | | | | | | | | | | | | | | |
| | | Options | | | Weighted
Average
Exercise Price | | | Weighted
Average
Remaining
Life (Years) | | | Aggregate
Intrinsic Value
(in millions) | |
Outstanding as of January 1, 2014 | | | 6,106,171 | | | $ | 52.81 | | | | | | | | | |
Granted | | | 1,879,594 | | | | 81.32 | | | | | | | | | |
Exercised | | | (1,267,320 | ) | | | 44.63 | | | | | | | | | |
Forfeited | | | (176,522 | ) | | | 74.80 | | | | | | | | | |
Expired | | | (33,488 | ) | | | 33.46 | | | | | | | | | |
| | | | | | | | | | | | | | | | |
Outstanding as of December 31, 2014 | | | 6,508,435 | | | $ | 62.14 | | | | 6.77 | | | $ | 238.9 | |
| | | | | | | | | | | | | | | | |
Exercisable as of December 31, 2014 | | | 2,992,252 | | | $ | 46.77 | | | | 4.84 | | | $ | 155.8 | |
Vested or expected to vest as of December 31, 2014 | | | 6,506,185 | | | $ | 62.13 | | | | 6.77 | | | $ | 238.9 | |
AMERICAN TOWER CORPORATION AND SUBSIDIARIES
NOTES TO CONSOLIDATED FINANCIAL STATEMENTS
The following table sets forth information regarding options outstanding at December 31, 2014:
| | | | | | | | | | |
| Options Outstanding | | Options Exercisable |
Outstanding Number of Options | | Range of Exercise
Price Per Share | | Weighted
Average Exercise
Price Per Share | | Weighted Average
Remaining Life
(Years) | | Options
Exercisable | | Weighted
Average Exercise
Price Per Share |
| 1,553,717 | | $ 18.60 — $43.11 | | $36.04 | | 3.54 | | 1,553,717 | | $36.04 |
| 971,207 | | 44.92 — 58.60 | | 49.25 | | 5.20 | | 744,434 | | 48.63 |
| 954,608 | | 62.00 — 74.06 | | 62.52 | | 7.24 | | 397,291 | | 62.30 |
| 1,232,856 | | 76.90 — 79.45 | | 76.95 | | 8.20 | | 256,378 | | 76.92 |
| 1,796,047 | | 81.18 — 93.45 | | 81.32 | | 9.20 | | 40,432 | | 81.18 |
| | | | | | | | | | |
| 6,508,435 | | $ 18.60 — $93.45 | | $62.14 | | 6.77 | | 2,992,252 | | $46.77 |
| | | | | | | | | | |
Restricted Stock Units—The Company’s restricted stock unit activity during the year ended December 31, 2014 is as follows:
| | | | | | | | |
| | | Number of
Units | | | Weighted Average Grant
Date Fair Value | |
Outstanding as of January 1, 2014 | | | 1,840,137 | | | $ | 64.75 | |
Granted | | | 807,582 | | | | 81.54 | |
Vested | | | (716,905 | ) | | | 59.65 | |
Forfeited | | | (171,997 | ) | | | 72.36 | |
| | | | | | | | |
Outstanding as of December 31, 2014 | | | 1,758,817 | | | $ | 73.80 | |
| | | | | | | | |
Expected to vest, net of estimated forfeitures, as of December 31, 2014 | | | 1,685,937 | | | $ | 73.59 | |
| | | | | | | | |
The total fair value of restricted stock units that vested during the year ended December 31, 2014 was $58.6 million.
As of December 31, 2014, total unrecognized compensation expense related to unvested restricted stock units granted under the 2007 Plan is $76.3 million and is expected to be recognized over a weighted average period of approximately two years.
Employee Stock Purchase Plan—The Company maintains an employee stock purchase plan (“ESPP”) for all eligible employees. Under the ESPP, shares of the Company’s common stock may be purchased on the last day of each bi-annual offering period at a 15% discount of the lower of the closing market value on the first or last day of such offering period. Employees may purchase shares having a value not exceeding 15% of their gross compensation during an offering period and may not purchase more than $25,000 worth of stock in a calendar year (based on market values at the beginning of each offering period). The offering periods run from June 1 through November 30 and from December 1 through May 31 of each year. During the 2014, 2013 and 2012 offering periods employee contributions were accumulated to purchase an estimated 81,000, 78,000 and 88,000 shares, respectively, at weighted average prices per share of $70.48, $64.74 and $51.59, respectively. During each six month offering period, employees accumulate payroll deductions to purchase the Company’s common stock. The fair value of the ESPP share purchase option is estimated on the offering period commencement date using a Black-Scholes pricing model with the expense recognized over the expected life, which is the
AMERICAN TOWER CORPORATION AND SUBSIDIARIES
NOTES TO CONSOLIDATED FINANCIAL STATEMENTS
six-month offering period. The weighted average fair value per share of ESPP share purchase options during the year ended December 31, 2014, 2013 and 2012 was $14.83, $13.42 and $13.64, respectively. At December 31, 2014, 3.4 million shares remain reserved for future issuance under the plan.
Key assumptions used to apply the Black-Scholes pricing model for shares purchased through the ESPP for the years ended December 31, are as follows:
| | | | | | |
| | | 2014 | | 2013 | | 2012 |
Range of risk-free interest rate | | 0.06% – 0.11% | | 0.07% – 0.13% | | 0.05% – 0.12% |
Weighted average risk-free interest rate | | 0.09% | | 0.10% | | 0.08% |
Expected life of shares | | 6 months | | 6 months | | 6 months |
Range of expected volatility of underlying stock price over the option period | | 11.29% – 16.59% | | 12.21% – 13.57% | | 33.16% – 33.86% |
Weighted average expected volatility of underlying stock price | | 14.14% | | 12.88% | | 33.54% |
Expected annual dividend yield | | 1.50% | | 1.50% | | 1.50% |
16. EQUITY
Mandatory Convertible Preferred Stock Offering—On May 12, 2014, the Company completed a registered public offering of 6,000,000 shares of its 5.25% Mandatory Convertible Preferred Stock, Series A, par value $0.01 per share (the “Mandatory Convertible Preferred Stock”). The net proceeds of the offering were $582.9 million after deducting commissions and estimated expenses. The Company used the net proceeds from this offering to fund acquisitions, including the acquisition from Richland, initially funded by indebtedness incurred under the 2013 Credit Facility.
Unless converted earlier, each share of the Mandatory Convertible Preferred Stock will automatically convert on May 15, 2017, into between 0.9174 and 1.1468 shares of common stock, depending on the applicable market value of the common stock and subject to anti-dilution adjustments. Subject to certain restrictions, at any time prior to May 15, 2017, holders of the Mandatory Convertible Preferred Stock may elect to convert all or a portion of their shares into common stock at the minimum conversion rate then in effect.
Dividends on shares of Mandatory Convertible Preferred Stock are payable on a cumulative basis when, as and if declared by the Company’s Board of Directors (or an authorized committee thereof) at an annual rate of 5.25% on the liquidation preference of $100.00 per share, on February 15, May 15, August 15 and November 15 of each year, commencing on August 15, 2014 to, and including, May 15, 2017. The Company may pay dividends in cash or, subject to certain limitations, in shares of common stock or any combination of cash and shares of common stock. The terms of the Mandatory Convertible Preferred Stock provide that, unless full cumulative dividends have been paid or set aside for payment on all outstanding Mandatory Convertible Preferred Stock for all prior dividend periods, no dividends may be declared or paid on common stock.
Stock Repurchase Program—In March 2011, the Board of Directors approved a stock repurchase program, pursuant to which the Company is authorized to purchase up to $1.5 billion of common stock (“2011 Buyback”). In September 2013, the Company temporarily suspended repurchases in connection with its acquisition of MIPT.
Under the 2011 Buyback, the Company is authorized to purchase shares from time to time through open market purchases or privately negotiated transactions at prevailing prices in accordance with securities laws and other legal requirements, and subject to market conditions and other factors. To facilitate repurchases, the Company
AMERICAN TOWER CORPORATION AND SUBSIDIARIES
NOTES TO CONSOLIDATED FINANCIAL STATEMENTS
makes purchases pursuant to trading plans under Rule 10b5-1 of the Securities Exchange Act of 1934, as amended, which allows the Company to repurchase shares during periods when it otherwise might be prevented from doing so under insider trading laws or because of self-imposed trading blackout periods.
The Company continues to manage the pacing of the remaining $1.1 billion under the 2011 Buyback in response to general market conditions and other relevant factors, including its financial policies. The Company expects to fund any further repurchases of its common stock through a combination of cash on hand, cash generated by operations and borrowings under its credit facilities. Purchases under the 2011 Buyback are subject to the Company having available cash to fund repurchases.
Sales of Equity Securities—The Company receives proceeds from sales of its equity securities pursuant to its ESPP and upon exercise of stock options granted under its equity incentive plans. For the year ended December 31, 2014, the Company received an aggregate of $62.3 million in proceeds upon exercises of stock options and from its ESPP.
Distributions—The following tables characterize the tax treatment of distributions declared per share of common stock and preferred stock.
| | | | | | | | | | | | | | | | | | | | | | | | |
| | | For the year ended December 31, | |
| | | 2014 | | | 2013 | | | 2012 | |
| | | Per Share | | | % | | | Per Share | | | % | | | Per Share | | | % | |
Common Stock | | | | | | | | | | | | | | | | | | | | | | | | |
Ordinary income | | $ | 1.4000 | | | | 100 | % | | $ | 1.1000 | | | | 100 | % | | $ | 0.9000 | | | | 100 | % |
Capital gain | | | — | | | | — | | | | — | | | | — | | | | — | | | | — | |
Return of capital | | | — | | | | — | | | | — | | | | — | | | | — | | | | — | |
| | | | | | | | | | | | | | | | | | | | | | | | |
Total | | $ | 1.4000 | | | | 100 | % | | $ | 1.1000 | | | | 100 | % | | $ | 0.9000 | | | | 100 | % |
| | | | | | | | | | | | | | | | | | | | | | | | |
| |
| | | For the year ended December 31, | |
| | | 2014 | | | 2013 (2) | | | 2012 (2) | |
| | | Per Share | | | % | | | Per Share | | | % | | | Per Share | | | % | |
Preferred Stock | | | | | | | | | | | | | | | | | | | | | | | | |
Ordinary income | | $ | 2.6688 | | | | 100 | % | | $ | — | | | | — | % | | $ | — | | | | — | % |
Capital gain | | | — | | | | — | | | | — | | | | — | | | | — | | | | — | |
Return of capital | | | — | | | | — | | | | — | | | | — | | | | — | | | | — | |
| | | | | | | | | | | | | | | | | | | | | | | | |
Total | | $ | 2.6688 | (1) | | | 100 | % | | $ | — | | | | — | % | | $ | — | | | | — | % |
| | | | | | | | | | | | | | | | | | | | | | | | |
(1) | In addition to the dividends disclosed above, on December 2, 2014, the Company declared a dividend of $1.3125 per share, payable on February 16, 2015 to preferred stockholders of record at the close of business on February 1, 2015. |
(2) | The Company had no preferred stock outstanding during the years ended December 31, 2013 and 2012. |
The Company accrues distributions on unvested restricted stock units granted subsequent to January 1, 2012, which are payable upon vesting. As of December��31, 2014, the amount accrued for distributions payable related to unvested restricted stock units is $3.4 million. During the year ended December 31, 2014, the Company paid $0.7 million of distributions payable upon the vesting of restricted stock units.
To maintain its qualification for taxation as a REIT, the Company expects to continue paying distributions, the amount, timing and frequency of which will be determined and be subject to adjustment by the Company’s Board of Directors.
AMERICAN TOWER CORPORATION AND SUBSIDIARIES
NOTES TO CONSOLIDATED FINANCIAL STATEMENTS
17. IMPAIRMENTS, NET LOSS ON SALES OF LONG-LIVED ASSETS
During the years ended December 31, 2014, 2013 and 2012, the Company recorded impairment charges and net losses on sales or disposals of long-lived assets of $28.5 million, $32.5 million and $34.4 million, respectively. These charges are primarily related to assets included in the Company’s domestic rental and management segment and are included in Other operating expenses in the consolidated statements of operations.
Included in these amounts are impairment charges of approximately $15.3 million, $15.9 million and $21.5 million for the years ended December 31, 2014, 2013 and 2012, respectively, to write down certain assets to net realizable value after an indicator of impairment was identified. Included in amounts recorded for the year ended December 31, 2012, was an impairment charge of approximately $10.8 million resulting from the impairment of one of the Company’s outdoor DAS networks upon the termination of a tenant lease.
Also included in these amounts are net losses associated with the sale or disposal of certain non-core towers, other assets and other miscellaneous items of $13.2 million, $16.6 million and $12.9 million for the years ended December 31, 2014, 2013 and 2012, respectively.
18. EARNINGS PER COMMON SHARE
The following table sets forth basic and diluted net income per common share computational data for the years ended December 31, 2014, 2013 and 2012 (in thousands, except per share data):
| | | | | | | | | | | | |
| | | 2014 | | | 2013 | | | 2012 | |
Net income attributable to American Tower Corporation stockholders | | $ | 824,910 | | | $ | 551,333 | | | $ | 637,283 | |
Dividends declared on preferred stock | | | (23,888 | ) | | | — | | | | — | |
| | | | | | | | | | | | |
Net income attributable to American Tower Corporation common stockholders | | | 801,022 | | | | 551,333 | | | | 637,283 | |
| | | | | | | | | | | | |
Basic weighted average common shares outstanding | | | 395,958 | | | | 395,040 | | | | 394,772 | |
Dilutive securities | | | 4,128 | | | | 4,106 | | | | 4,515 | |
| | | | | | | | | | | | |
Diluted weighted average common shares outstanding | | | 400,086 | | | | 399,146 | | | | 399,287 | |
| | | | | | | | | | | | |
Basic net income attributable to American Tower Corporation common stockholders per common share | | $ | 2.02 | | | $ | 1.40 | | | $ | 1.61 | |
| | | | | | | | | | | | |
Diluted net income attributable to American Tower Corporation common stockholders per common share | | $ | 2.00 | | | $ | 1.38 | | | $ | 1.60 | |
| | | | | | | | | | | | |
Shares Excluded From Dilutive Effect
The following shares were not included in the computation of diluted earnings per share for the years ended December 31, 2014, 2013 and 2012 because the effect would be anti-dilutive (in thousands, on a weighted average basis):
| | | | | | | | | | | | |
| | | 2014 | | | 2013 | | | 2012 | |
Restricted stock awards | | | 5 | | | | — | | | | 2 | |
Stock options | | | 1,290 | | | | 1,161 | | | | 981 | |
Preferred stock (1) | | | 4,303 | | | | — | | | | — | |
(1) | Issued on May 12, 2014. |
AMERICAN TOWER CORPORATION AND SUBSIDIARIES
NOTES TO CONSOLIDATED FINANCIAL STATEMENTS
19. COMMITMENTS AND CONTINGENCIES
Litigation—The Company periodically becomes involved in various claims, lawsuits and proceedings that are incidental to its business. In the opinion of management, after consultation with counsel, there are no matters currently pending that would, in the event of an adverse outcome, materially impact the Company’s consolidated financial position, results of operations or liquidity.
TriStar Litigation—The Company was involved in several lawsuits against TriStar Investors LLP and its affiliates (“TriStar”) in various states regarding single tower sites where TriStar had taken land interests under the Company’s owned or managed sites and the Company believes TriStar induced the landowner to breach obligations to the Company. In addition, on February 16, 2012, TriStar brought a federal action against the Company in the United States District Court for the Northern District of Texas (the “District Court”), in which TriStar principally alleged that the Company made misrepresentations to landowners when competing with TriStar for land under the Company’s owned or managed sites. On January 22, 2013, the Company filed an amended answer and counterclaim against TriStar and certain of its employees, denying Tristar’s claims and asserting that TriStar engaged in a pattern of unlawful activity, including: (i) entering into agreements not to compete for land under certain towers; and (ii) making widespread misrepresentations to landowners regarding both TriStar and the Company. Pursuant to a Settlement Agreement dated July 9, 2014, all pending state and federal actions between the Company and TriStar were dismissed with prejudice and without payment of damages.
Lease Obligations—The Company leases certain land, office and tower space under operating leases that expire over various terms. Many of the leases contain renewal options with specified increases in lease payments upon exercise of the renewal option. Escalation clauses present in operating leases, excluding those tied to CPI or other inflation-based indices, are recognized on a straight-line basis over the non-cancellable term of the leases.
Future minimum rental payments under non-cancellable operating leases include payments for certain renewal periods at the Company’s option because failure to renew could result in a loss of the applicable communications sites and related revenues from tenant leases, thereby making it reasonably assured that the Company will renew the leases. Such payments at December 31, 2014 are as follows (in thousands):
| | | | |
Year Ending December 31, | | | | |
2015 | | $ | 574,438 | |
2016 | | | 553,864 | |
2017 | | | 538,405 | |
2018 | | | 519,034 | |
2019 | | | 502,847 | |
Thereafter | | | 4,214,600 | |
| | | | |
Total | | $ | 6,903,188 | |
| | �� | | |
Aggregate rent expense (including the effect of straight-line rent expense) under operating leases for the years ended December 31, 2014, 2013 and 2012 approximated $655.0 million, $495.2 million and $419.0 million, respectively.
AMERICAN TOWER CORPORATION AND SUBSIDIARIES
NOTES TO CONSOLIDATED FINANCIAL STATEMENTS
Future minimum payments under capital leases in effect at December 31, 2014 are as follows (in thousands):
| | | | |
Year Ending December 31, | | | | |
2015 | | $ | 15,589 | |
2016 | | | 14,049 | |
2017 | | | 12,905 | |
2018 | | | 12,456 | |
2019 | | | 10,760 | |
Thereafter | | | 173,313 | |
| | | | |
Total minimum lease payments | | | 239,072 | |
Less amounts representing interest | | | (143,690 | ) |
| | | | |
Present value of capital lease obligations | | $ | 95,382 | |
| | | | |
Tenant Leases—The Company’s lease agreements with its tenants vary depending upon the region and the industry of the tenant, and typically have initial terms of at least ten years with multiple renewal terms at the option of the tenant.
Future minimum rental receipts expected from tenants under non-cancellable operating lease agreements in effect at December 31, 2014 are as follows (in thousands):
| | | | |
Year Ending December 31, | | | | |
2015 | | $ | 3,438,474 | |
2016 | | | 3,358,098 | |
2017 | | | 3,304,255 | |
2018 | | | 3,168,551 | |
2019 | | | 2,916,750 | |
Thereafter | | | 10,495,554 | |
| | | | |
Total | | $ | 26,681,682 | |
| | | | |
AT&T Transaction—The Company has an agreement with SBC Communications Inc., a predecessor entity to AT&T Inc. (“AT&T”), that currently provides for the lease or sublease of approximately 2,400 towers from AT&T with the lease commencing between December 2000 and August 2004. Substantially all of the towers are part of the Securitization. The average term of the lease or sublease for all sites at the inception of the agreement was approximately 27 years, assuming renewals or extensions of the underlying ground leases for the sites. The Company has the option to purchase the sites subject to the applicable lease or sublease upon its expiration. Each tower is assigned to an annual tranche, ranging from 2013 to 2032, which represents the outside expiration date for the sublease rights to that tower. The purchase price for each site is a fixed amount stated in the sublease for that site plus the fair market value of certain alterations made to the related tower by AT&T. During the year ended December 31, 2014, the Company purchased 27 of the subleased towers upon expiration of the applicable agreement for an aggregate purchase price of $8.8 million. The aggregate purchase option price for the remaining towers leased and subleased is approximately $644.9 million, and will accrete at a rate of 10% per annum through the applicable expiration of the lease or sublease of a site. As of December 31, 2014, the Company has purchased an aggregate of 31 of the subleased towers upon expiration of the applicable agreement. For all such sites purchased by the Company prior to June 30, 2020, AT&T will continue to lease the reserved space at the then-current monthly fee which shall escalate in accordance with the standard master lease
AMERICAN TOWER CORPORATION AND SUBSIDIARIES
NOTES TO CONSOLIDATED FINANCIAL STATEMENTS
agreement for the remainder of AT&T’s tenancy. Thereafter, AT&T shall have the right to renew such lease for up to four successive five-year terms. For all such sites purchased by the Company subsequent to June 30, 2020, AT&T has the right to continue to lease the reserved space for successive one-year terms at a rent equal to the lesser of the agreed upon market rate and the then current monthly fee, which is subject to an annual increase based on changes in the CPI.
ALLTEL Transaction—In December 2000, the Company entered into an agreement with ALLTEL, a predecessor entity to Verizon Wireless to acquire towers through a 15-year sublease agreement. Pursuant to the agreement, as amended, with Verizon Wireless, the Company acquired rights to approximately 1,800 towers in tranches between April 2001 and March 2002. The Company has the option to purchase each tower at the expiration of the applicable sublease, which will occur in tranches between April 2016 and March 2017 based on the original closing date for such tranche of towers. The purchase price per tower as of the original closing date was $27,500 and will accrete at a rate of 3% per annum through the expiration of the applicable sublease. The aggregate purchase option price for the subleased towers is approximately $73.2 million as of December 31, 2014. At Verizon Wireless’s option, at the expiration of the sublease, the purchase price would be payable in cash or with 769 shares of the Company’s common stock per tower, which would be valued at approximately $134.7 million in the aggregate based on the closing price at December 31, 2014.
Guaranties and Indemnifications—The Company enters into agreements from time to time in the ordinary course of business pursuant to which it agrees to guarantee or indemnify third parties for certain claims. The Company has also entered into purchase and sale agreements relating to the sale or acquisition of assets containing customary indemnification provisions. The Company’s indemnification obligations under these agreements generally are limited solely to damages resulting from breaches of representations and warranties or covenants under the applicable agreements, but do not guaranty future performance. In addition, payments under such indemnification clauses are generally conditioned on the other party making a claim that is subject to whatever defenses the Company may have and are governed by dispute resolution procedures specified in the particular agreement. Further, the Company’s obligations under these agreements may be limited in duration and/or amount, and in some instances, the Company may have recourse against third parties for payments made by the Company. The Company has not historically made any material payments under these agreements and, as of December 31, 2014, is not aware of any agreements that could result in a material payment.
Other Contingencies—The Company is subject to income tax and other taxes in the geographic areas where it operates, and periodically receives notifications of audits, assessments or other actions by taxing authorities. The Company evaluates the circumstances of each notification based on the information available, and records a liability for any potential outcome that is probable or more likely than not unfavorable, if the liability is also reasonably estimable. On January 21, 2014, the Company received an income tax assessment in the amount of 22.6 billion INR (approximately $369.0 million on the date of assessment), asserting tax liabilities arising out of a transfer pricing review of transactions by Essar Telecom Infrastructure Private Limited (“ETIPL”), and more specifically involving the issuance of share capital and the determination by the tax authority that an income tax obligation arose as a result of such issuance. The assessment was made with respect to transactions that took place in the tax year commencing in 2008, prior to the Company’s acquisition of ETIPL. Under the Company’s definitive acquisition agreement of ETIPL, the seller is obligated to indemnify and defend the Company with respect to any tax-related liability that may arise from activities prior to March 31, 2010. The Company believes that there is no basis upon which the tax assessment can be enforced under existing tax law and accordingly has not recorded an obligation in the consolidated financial statements. The assessment is being challenged with the appellate authorities.
AMERICAN TOWER CORPORATION AND SUBSIDIARIES
NOTES TO CONSOLIDATED FINANCIAL STATEMENTS
20. SUPPLEMENTAL CASH FLOW INFORMATION
Supplemental cash flow information and non-cash investing and financing activities for the years ended December 31, 2014, 2013 and 2012 are as follows (in thousands):
| | | | | | | | | | | | |
| | | 2014 | | | 2013 | | | 2012 | |
Supplemental cash flow information: | | | | | | | | | | | | |
Cash paid for interest | | $ | 548,089 | | | $ | 397,366 | | | $ | 366,458 | |
Cash paid for income taxes (net of refunds of $8,476, $19,701 and $20,847, respectively) | | | 69,212 | | | | 51,676 | | | | 69,277 | |
Non-cash investing and financing activities: | | | | | | | | | | | | |
Increase (decrease) in accounts payable and accrued expenses for purchases of property and equipment and construction activities | | | 1,121 | | | | 9,147 | | | | (10,244 | ) |
Purchases of property and equipment under capital leases | | | 36,486 | | | | 27,416 | | | | 19,219 | |
Fair value of debt assumed through acquisitions | | | 463,135 | | | | 1,576,186 | | | | — | |
Settlement of accounts receivable related to acquisitions | | | 31,849 | | | | — | | | | — | |
Conversion of third-party debt to equity | | | 111,181 | | | | — | | | | — | |
21. BUSINESS SEGMENTS
The Company operates in three business segments, (i) domestic rental and management, (ii) international rental and management and (iii) network development services. The Company’s primary business is leasing space on multi-tenant communications sites to wireless service providers, radio and television broadcast companies, wireless data and data providers, government agencies and municipalities and tenants in a number of other industries. This business is referred to as the Company’s rental and management operations and is comprised of domestic and international segments, which as of December 31, 2014, consist of the following:
Domestic: rental and management operations in the United States; and
International: rental and management operations in Brazil, Chile, Colombia, Costa Rica, Germany, Ghana, India, Mexico, Peru, South Africa and Uganda. In November 2014, the Company signed an agreement to acquire communications sites in Nigeria.
The Company has applied the aggregation criteria to operations within the international rental and management operating segments on a basis consistent with management’s review of information and performance evaluation.
The Company’s network development services segment offers tower-related services in the United States, including site acquisition, zoning and permitting services and structural analysis services, which primarily support its site leasing business and the addition of new tenants and equipment on its sites. The network development services segment is a strategic business unit that offers different services from the rental and management operating segments and requires different resources, skill sets and marketing strategies.
The accounting policies applied in compiling segment information below are similar to those described in note 1. Among other factors, in evaluating financial performance in each business segment, management uses segment gross margin and segment operating profit. The Company defines segment gross margin as segment revenue less segment operating expenses excluding stock-based compensation expense recorded in costs of operations; Depreciation, amortization and accretion; Selling, general, administrative and development expense; and Other operating expenses. The Company defines segment operating profit as segment gross margin less Selling, general, administrative and development expense attributable to the segment, excluding stock-based
AMERICAN TOWER CORPORATION AND SUBSIDIARIES
NOTES TO CONSOLIDATED FINANCIAL STATEMENTS
compensation expense and corporate expenses. For reporting purposes, the international rental and management segment gross margin and segment operating profit also include Interest income, TV Azteca, net. These measures of segment gross margin and segment operating profit are also before Interest income, Interest expense, Gain (loss) on retirement of long-term obligations, Other income (expense), Net income (loss) attributable to noncontrolling interest, Income (loss) on equity method investments, and Income tax benefit (provision). The categories of expenses indicated above, such as depreciation, have been excluded from segment operating performance as they are not considered in the review of information or the evaluation of results by management. There are no significant revenues resulting from transactions between the Company’s operating segments. All intercompany transactions are eliminated to reconcile segment results and assets to the consolidated statements of operations and consolidated balance sheets.
Summarized financial information concerning the Company’s reportable segments for the years ended December 31, 2014, 2013 and 2012 is shown in the following tables. The “Other” column (i) represents amounts excluded from specific segments, such as business development operations, stock-based compensation expense and corporate expenses included in Selling, general, administrative and development expense; Other operating expenses; Interest income; Interest expense; Gain (loss) on retirement of long-term obligations; and Other income (expense), and (ii) reconciles segment operating profit to Income from continuing operations before income taxes and income on equity method investments, as the amounts are not utilized in assessing each segment’s performance.
| | | | | | | | | | | | | | | | | | | | | | | | |
| | | Rental and Management | | | Total Rental and
Management | | | Network
Development
Services | | | | | | | |
Year ended December 31, 2014 | | Domestic | | | International | | | | | Other | | | Total | |
| | | (in thousands) | |
Segment revenues | | $ | 2,639,790 | | | $ | 1,367,064 | | | $ | 4,006,854 | | | $ | 93,194 | | | | | | | $ | 4,100,048 | |
Segment operating expenses (1) | | | 515,742 | | | | 539,038 | | | | 1,054,780 | | | | 37,648 | | | | | | | | 1,092,428 | |
Interest income, TV Azteca, net | | | — | | | | 10,547 | | | | 10,547 | | | | — | | | | | | | | 10,547 | |
| | | | | | | | | | | | | | | | | | | | | | | | |
Segment gross margin | | | 2,124,048 | | | | 838,573 | | | | 2,962,621 | | | | 55,546 | | | | | | | | 3,018,167 | |
| | | | | | | | | | | | | | | | | | | | | | | | |
Segment selling, general, administrative and development expense (1) | | | 124,944 | | | | 133,978 | | | | 258,922 | | | | 12,469 | | | | | | | | 271,391 | |
| | | | | | | | | | | | | | | | | | | | | | | | |
Segment operating profit | | $ | 1,999,104 | | | $ | 704,595 | | | $ | 2,703,699 | | | $ | 43,077 | | | | | | | $ | 2,746,776 | |
| | | | | | | | | | | | | | | | | | | | | | | | |
Stock-based compensation expense | | | | | | | | | | | | | | | | | | $ | 80,153 | | | | 80,153 | |
Other selling, general, administrative and development expense | | | | | | | | | | | | | | | | | | | 96,835 | | | | 96,835 | |
Depreciation, amortization and accretion | | | | | | | | | | | | | | | | | | | 1,003,802 | | | | 1,003,802 | |
Other expense (principally interest expense and other expense) | | | | | | | | | | | | | | | | | | | 700,282 | | | | 700,282 | |
| | | | | | | | | | | | | | | | | | | | | | | | |
Income from continuing operations before income taxes and income on equity method investments | | | | | | | | | | | | | | | | | | | | | | $ | 865,704 | |
| | | | | | | | | | | | | | | | | | | | | | | | |
Capital expenditures | | $ | 576,153 | | | $ | 374,105 | | | $ | 950,258 | | | $ | — | | | $ | 24,146 | | | $ | 974,404 | |
| | | | | | | | | | | | | | | | | | | | | | | | |
(1) | Segment operating expenses and segment selling, general, administrative and development expenses exclude stock-based compensation expense of $1.8 million and $78.3 million, respectively. |
AMERICAN TOWER CORPORATION AND SUBSIDIARIES
NOTES TO CONSOLIDATED FINANCIAL STATEMENTS
| | | | | | | | | | | | | | | | | | | | | | | | |
| | | Rental and Management | | | Total Rental and
Management | | | Network
Development
Services | | | | | | | |
Year ended December 31, 2013 | | Domestic | | | International | | | | | Other | | | Total | |
| | | (in thousands) | |
Segment revenues | | $ | 2,189,365 | | | $ | 1,097,725 | | | $ | 3,287,090 | | | $ | 74,317 | | | | | | | $ | 3,361,407 | |
Segment operating expenses (1) | | | 405,419 | | | | 422,346 | | | | 827,765 | | | | 30,564 | | | | | | | | 858,329 | |
Interest income, TV Azteca, net | | | — | | | | 22,235 | | | | 22,235 | | | | — | | | | | | | | 22,235 | |
| | | | | | | | | | | | | | | | | | | | | | | | |
Segment gross margin | | | 1,783,946 | | | | 697,614 | | | | 2,481,560 | | | | 43,753 | | | | | | | | 2,525,313 | |
| | | | | | | | | | | | | | | | | | | | | | | | |
Segment selling, general, administrative and development expense (1) | | | 103,989 | | | | 123,338 | | | | 227,327 | | | | 9,257 | | | | | | | | 236,584 | |
| | | | | | | | | | | | | | | | | | | | | | | | |
Segment operating profit | | $ | 1,679,957 | | | $ | 574,276 | | | $ | 2,254,233 | | | $ | 34,496 | | | | | | | $ | 2,288,729 | |
| | | | | | | | | | | | | | | | | | | | | | | | |
Stock-based compensation expense | | | | | | | | | | | | | | | | | | $ | 68,138 | | | | 68,138 | |
Other selling, general, administrative and development expense | | | | | | | | | | | | | | | | | | | 112,367 | | | | 112,367 | |
Depreciation, amortization and accretion | | | | | | | | | | | | | | | | | | | 800,145 | | | | 800,145 | |
Other expense (principally interest expense and other expense) | | | | | | | | | | | | | | | | | | | 766,330 | | | | 766,330 | |
| | | | | | | | | | | | | | | | | | | | | | | | |
Income from continuing operations before income taxes and income on equity method investments | | | | | | | | | | | | | | | | | | | | | | $ | 541,749 | |
| | | | | | | | | | | | | | | | | | | | | | | | |
Capital expenditures | | $ | 416,239 | | | $ | 277,910 | | | $ | 694,149 | | | $ | — | | | $ | 30,383 | | | $ | 724,532 | |
| | | | | | | | | | | | | | | | | | | | | | | | |
(1) | Segment operating expenses and segment selling, general, administrative and development expenses exclude stock-based compensation expense of $1.5 million and $66.6 million, respectively. |
| | | | | | | | | | | | | | | | | | | | | | | | |
| | | Rental and Management | | | Total Rental and
Management | | | Network
Development
Services | | | | | | | |
Year ended December 31, 2012 | | Domestic | | | International | | | | | Other | | | Total | |
| | | (in thousands) | |
Segment revenues | | $ | 1,940,689 | | | $ | 862,801 | | | $ | 2,803,490 | | | $ | 72,470 | | | | | | | $ | 2,875,960 | |
Segment operating expenses (1) | | | 357,555 | | | | 328,333 | | | | 685,888 | | | | 34,830 | | | | | | | | 720,718 | |
Interest income, TV Azteca, net | | | — | | | | 14,258 | | | | 14,258 | | | | — | | | | | | | | 14,258 | |
| | | | | | | | | | | | | | | | | | | | | | | | |
Segment gross margin | | | 1,583,134 | | | | 548,726 | | | | 2,131,860 | | | | 37,640 | | | | | | | | 2,169,500 | |
| | | | | | | | | | | | | | | | | | | | | | | | |
Segment selling, general, administrative and development expense (1) | | | 85,663 | | | | 95,579 | | | | 181,242 | | | | 6,744 | | | | | | | | 187,986 | |
| | | | | | | | | | | | | | | | | | | | | | | | |
Segment operating profit | | $ | 1,497,471 | | | $ | 453,147 | | | $ | 1,950,618 | | | $ | 30,896 | | | | | | | $ | 1,981,514 | |
| | | | | | | | | | | | | | | | | | | | | | | | |
Stock-based compensation expense | | | | | | | | | | | | | | | | | | $ | 51,983 | | | | 51,983 | |
Other selling, general, administrative and development expense | | | | | | | | | | | | | | | | | | | 89,093 | | | | 89,093 | |
Depreciation, amortization and accretion | | | | | | | | | | | | | | | | | | | 644,276 | | | | 644,276 | |
Other expense (principally interest expense and other expense) | | | | | | | | | | | | | | | | | | | 494,868 | | | | 494,868 | |
| | | | | | | | | | | | | | | | | | | | | | | | |
Income from continuing operations before income taxes and income on equity method investments | | | | | | | | | | | | | | | | | | | | | | $ | 701,294 | |
| | | | | | | | | | | | | | | | | | | | | | | | |
Capital expenditures | | $ | 268,997 | | | $ | 279,004 | | | $ | 548,001 | | | $ | — | | | $ | 20,047 | | | $ | 568,048 | |
| | | | | | | | | | | | | | | | | | | | | | | | |
(1) | Segment operating expenses and segment selling, general, administrative and development expenses exclude stock-based compensation expense of $1.8 million and $50.2 million, respectively. |
AMERICAN TOWER CORPORATION AND SUBSIDIARIES
NOTES TO CONSOLIDATED FINANCIAL STATEMENTS
Additional information relating to the total assets of the Company’s operating segments for the years ended December 31, is as follows (in thousands):
| | | | | | | | | | | | |
| | | 2014 | | | 2013 (1) | | | 2012 | |
Domestic rental and management | | $ | 14,348,892 | | | $ | 13,628,137 | | | $ | 8,471,169 | |
International rental and management (2) | | | 6,776,013 | | | | 6,428,438 | | | | 5,190,987 | |
Network development services | | | 57,367 | | | | 47,607 | | | | 63,956 | |
Other (3) | | | 149,273 | | | | 179,483 | | | | 363,317 | |
| | | | | | | | | | | | |
Total assets | | $ | 21,331,545 | | | $ | 20,283,665 | | | $ | 14,089,429 | |
| | | | | | | | | | | | |
(1) | Balances have been revised to reflect purchase accounting measurement period adjustments. |
(2) | Balances are translated at the applicable period end exchange rate and therefore may impact comparability between periods. |
(3) | Balances include corporate assets such as cash and cash equivalents, certain tangible and intangible assets and income tax accounts which have not been allocated to specific segments. |
Summarized geographic information related to the Company’s operating revenues for the years ended December 31, 2014, 2013 and 2012 and long-lived assets as of December 31, 2014 and 2013, is as follows (in thousands):
| | | | | | | | | | | | |
| | | 2014 | | | 2013 | | | 2012 | |
Operating Revenues: | | | | | | | | | | | | |
United States | | $ | 2,732,984 | | | $ | 2,263,682 | | | $ | 2,013,159 | |
International (1): | | | | | | | | | | | | |
Brazil | | | 331,089 | | | | 212,201 | | | | 198,068 | |
Chile | | | 31,756 | | | | 28,978 | | | | 22,114 | |
Colombia | | | 89,421 | | | | 70,901 | | | | 48,424 | |
Costa Rica | | | 16,742 | | | | 4,055 | | | | — | |
Germany | | | 64,946 | | | | 62,756 | | | | 4,030 | |
Ghana | | | 95,486 | | | | 92,114 | | | | 81,818 | |
India | | | 219,566 | | | | 191,355 | | | | 181,863 | |
Mexico | | | 354,116 | | | | 288,306 | | | | 217,473 | |
Panama (2) | | | 1,243 | | | | 424 | | | | — | |
Peru | | | 8,078 | | | | 5,824 | | | | 5,310 | |
South Africa | | | 98,334 | | | | 91,906 | | | | 80,202 | |
Uganda | | | 56,287 | | | | 48,905 | | | | 23,499 | |
| | | | | | | | | | | | |
Total international | | | 1,367,064 | | | | 1,097,725 | | | | 862,801 | |
| | | | | | | | | | | | |
Total operating revenues | | $ | 4,100,048 | | | $ | 3,361,407 | | | $ | 2,875,960 | |
| | | | | | | | | | | | |
(1) | Balances are translated at the applicable exchange rate and therefore may impact comparability between periods. |
(2) | In September 2014, the Company completed the sale of the operations in Panama. |
AMERICAN TOWER CORPORATION AND SUBSIDIARIES
NOTES TO CONSOLIDATED FINANCIAL STATEMENTS
| | | | | | | | |
| | | 2014 | | | 2013 (1) | |
Long-Lived Assets (2): | | | | | | | | |
United States | | $ | 12,843,271 | | | $ | 12,345,357 | |
International (3): | | | | | | | | |
Brazil | | | 2,162,698 | | | | 1,286,490 | |
Chile | | | 147,413 | | | | 167,318 | |
Colombia | | | 320,355 | | | | 390,197 | |
Costa Rica | | | 127,436 | | | | 129,229 | |
Germany | | | 456,698 | | | | 535,883 | |
Ghana | | | 235,523 | | | | 304,603 | |
India | | | 616,266 | | | | 610,744 | |
Mexico | | | 1,189,854 | | | | 1,348,987 | |
Panama (4) | | | — | | | | 17,177 | |
Peru | | | 61,490 | | | | 58,220 | |
South Africa | | | 186,270 | | | | 213,316 | |
Uganda | | | 185,956 | | | | 195,128 | |
| | | | | | | | |
Total international | | | 5,689,959 | | | | 5,257,292 | |
| | | | | | | | |
Total long-lived assets | | $ | 18,533,230 | | | $ | 17,602,649 | |
| | | | | | | | |
(1) | Balances have been revised to reflect purchase accounting measurement period adjustments. |
(2) | Includes Property and equipment, net, Goodwill and Other intangible assets, net. |
(3) | Balances are translated at the applicable period end exchange rate and therefore may impact comparability between periods. |
(4) | In September 2014, the Company completed the sale of the operations in Panama. |
The following tenants within the domestic and international rental and management segments and network development services segment individually accounted for 10% or more of the Company’s consolidated operating revenues for the years ended December 31, 2014, 2013 and 2012 is as follows:
| | | | | | | | | | | | |
| | | 2014 | | | 2013 | | | 2012 | |
AT&T Mobility | | | 20 | % | | | 18 | % | | | 18 | % |
Sprint Nextel | | | 15 | % | | | 16 | % | | | 14 | % |
Verizon Wireless | | | 11 | % | | | 11 | % | | | 11 | % |
T-Mobile | | | 10 | % | | | 11 | % | | | 8 | % |
22. RELATED PARTY TRANSACTIONS
During the years ended December 31, 2014, 2013, and 2012, the Company had no significant related party transactions.
AMERICAN TOWER CORPORATION AND SUBSIDIARIES
NOTES TO CONSOLIDATED FINANCIAL STATEMENTS
23. SELECTED QUARTERLY FINANCIAL DATA (UNAUDITED)
Selected quarterly financial data for the years ended December 31, 2014 and 2013 is as follows (in thousands, except per share data):
| | | | | | | | | | | | | | | | | | | | |
| | | Three Months Ended | | | Year Ended
December 31, | |
| | | March 31, | | | June 30, | | | September 30, | | | December 31, | | |
2014: | | | | | | | | | | | | | | | | | | | | |
Operating revenues | | $ | 984,089 | | | $ | 1,031,457 | | | $ | 1,038,188 | | | $ | 1,046,314 | | | $ | 4,100,048 | |
Cost of operations (1) | | | 260,769 | | | | 272,275 | | | | 284,202 | | | | 277,019 | | | | 1,094,265 | |
Operating income | | | 353,637 | | | | 402,499 | | | | 384,807 | | | | 345,979 | | | | 1,486,922 | |
Net income | | | 193,313 | | | | 221,659 | | | | 206,630 | | | | 181,597 | | | | 803,199 | |
Net income attributable to American Tower Corporation stockholders | | | 202,499 | | | | 234,431 | | | | 207,593 | | | | 180,387 | | | | 824,910 | |
Dividends declared on preferred stock | | | — | | | | (4,375 | ) | | | (7,700 | ) | | | (11,813 | ) | | | (23,888 | ) |
Net income attributable to American Tower Corporation common stockholders | | | 202,499 | | | | 230,056 | | | | 199,893 | | | | 168,574 | | | | 801,022 | |
Basic net income attributable to American Tower Corporation common stockholders | | | 0.51 | | | | 0.58 | | | | 0.50 | | | | 0.43 | | | | 2.02 | |
Diluted net income attributable to American Tower Corporation common stockholders | | | 0.51 | | | | 0.58 | | | | 0.50 | | | | 0.42 | | | | 2.00 | |
| | |
| | | Three Months Ended | | | Year Ended
December 31, | |
| | | March 31, | | | June 30, | | | September 30, | | | December 31, | | |
2013: | | | | | | | | | | | | | | | | | | | | |
Operating revenues | | $ | 802,728 | | | $ | 808,830 | | | $ | 807,880 | | | $ | 941,969 | | | $ | 3,361,407 | |
Cost of operations (1) | | | 201,766 | | | | 205,709 | | | | 200,829 | | | | 251,569 | | | | 859,873 | |
Operating income | | | 299,686 | | | | 312,812 | | | | 308,879 | | | | 292,928 | | | | 1,214,305 | |
Net income | | | 160,948 | | | | 84,113 | | | | 163,222 | | | | 73,925 | | | | 482,208 | |
Net income attributable to American Tower Corporation stockholders | | | 171,407 | | | | 99,821 | | | | 180,123 | | | | 99,982 | | | | 551,333 | |
Dividends declared on preferred stock | | | — | | | | — | | | | — | | | | — | | | | — | |
Net income attributable to American Tower Corporation common stockholders | | | 171,407 | | | | 99,821 | | | | 180,123 | | | | 99,982 | | | | 551,333 | |
Basic net income attributable to American Tower Corporation common stockholders | | | 0.43 | | | | 0.25 | | | | 0.46 | | | | 0.25 | | | | 1.40 | |
Diluted net income attributable to American Tower Corporation common stockholders | | | 0.43 | | | | 0.25 | | | | 0.45 | | | | 0.25 | | | | 1.38 | |
(1) | Represents Operating expenses, exclusive of Depreciation, amortization and accretion, Selling, general, administrative and development expense, and Other operating expense. |
AMERICAN TOWER CORPORATION AND SUBSIDIARIES
NOTES TO CONSOLIDATED FINANCIAL STATEMENTS
24. SUBSEQUENT EVENTS
Redemption of 4.625% Senior Notes—On February 11, 2015, the Company redeemed all of the outstanding 4.625% senior notes due 2015 (the “4.625% Notes”). In accordance with the redemption provisions and the indenture for the 4.625% Notes, the 4.625% Notes were redeemed at a price equal to 100.5898% of the principal amount, plus accrued and unpaid interest up to, but excluding, February 11, 2015, for an aggregate purchase price of $613.6 million, including approximately $10.0 million of accrued and unpaid interest, which was funded with borrowings under the 2013 Credit Facility. Upon completion of this redemption, none of the 4.625% Notes remained outstanding.
Proposed Verizon Transaction—On February 5, 2015, the Company announced that it has entered into a definitive agreement (the “Master Agreement”) pursuant to which American Tower expects to acquire rights to approximately 11,324 wireless communications towers and purchase approximately 165 additional towers from Verizon for $5.056 billion in cash at closing (the “Proposed Verizon Transaction”), subject to certain adjustments. Under the definitive agreement, American Tower will have the exclusive right to lease and operate the Verizon towers for a weighted average term of approximately 28 years. In addition, American Tower will have fixed price purchase options to acquire the towers based on their anticipated fair market values at the end of the lease terms. The Master Agreement contains various covenants and representations and warranties, which, among other things, includes the right of the Company and Verizon to terminate the Master Agreement if the Transaction does not close by August 4, 2015 (subject to extension to November 2, 2015 in certain circumstances). In addition, in certain circumstances, the Company may be required to pay a termination fee of approximately $354 million, in the event that the Verizon parties have irrevocably committed to consummate the Proposed Verizon Transaction, the conditions to the Company’s obligation to close the transaction have all been satisfied and the Company fails to consummate the Proposed Verizon Transaction.
In addition, at closing, Verizon will contract to sublease space on the towers for a minimum of 10 years with monthly rent of $1,900 per site and fixed annual rent escalators of 2%. Verizon will have customary renewal options. Verizon will also have access to certain additional space on the towers for its future use, subject to certain restrictions. American Tower will have the right to sublease other available capacity on the towers to additional tenants.
Amendments to Bank Facilities—On February 5, 2015 and February 20, 2015, the Company entered into amendment agreements with respect to the 2013 Term Loan, the 2013 Credit Facility and the 2014 Credit Facility. After giving effect to these amendments, the Company’s permitted ratio of Total Debt to Adjusted EBITDA (as defined in the loan agreements for each of the facilities) is (i) 6.00 to 1.00 for the fiscal quarters ended December 31, 2014 through the end of the fiscal quarter ending immediately prior to the closing of the Proposed Verizon Transaction, (ii) 7.25 to 1.00 for the first and second fiscal quarters ending on or after the closing of the Proposed Verizon Transaction, (iii) 7.00 to 1.00 for the two subsequent fiscal quarters and (iii) 6.00 to 1.00 thereafter. In addition, the maximum Incremental Term Loan Commitments (as defined in the agreement governing the 2013 Term Loan) was increased to $1.0 billion and the maximum Revolving Loan Commitments, after giving effect to any Incremental Commitments (each as defined in the loan agreements for each of the revolving credit facilities) was increased to $3.5 billion and $2.5 billion under the 2013 Credit Facility and the 2014 Credit Facility, respectively. Effective February 20, 2015, the Company received incremental commitments for an additional $500.0 million under each of the 2013 Term Loan and 2014 Credit Facility and $750.0 million under the 2013 Credit Facility. As a result, the Company has $2.0 billion outstanding under the 2013 Term Loan and may borrow up to $2.0 billion and $2.75 billion under the 2014 Credit Facility and the 2013 Credit Facility, respectively.
AMERICAN TOWER CORPORATION AND SUBSIDIARIES
NOTES TO CONSOLIDATED FINANCIAL STATEMENTS
Bridge Facility—In connection with the signing of a definitive agreement for the Proposed Verizon Transaction (the “Master Agreement”), the Company entered into a commitment letter (the “Commitment Letter”), dated February 5, 2015, withGoldman Sachs Bank USA and Goldman Sachs Lending Partners LLC (collectively, the “Commitment Parties”), pursuant to which the Commitment Parties have committed to provide up to $5.05 billion in bridge loans (the “Bridge Loan Commitment”) to ensure financing for the Proposed Verizon Transaction. Effective February 20, 2015, the Bridge Loan Commitment was reduced to $3.3 billion as a result of an aggregate of $1.75 billion of additional committed amounts under the Company’s existing bank facilities, as described above. The Bridge Loan Commitment will be further reduced on a dollar-for-dollar basis by, among other things, the net cash proceeds of any securities offering, debt incurrence and asset dispositions, subject to certain customary exceptions.
The Bridge Loan Commitment will expire if the Company does not make any borrowings thereunder on the earliest to occur of (i) the consummation of the Proposed Verizon Transaction, (ii) the termination of the Master Agreement or the public announcement by the Company of the abandonment of the Proposed Verizon Transaction and (iii) August 5, 2015 (or November 3, 2015, if the Termination Date (as defined in the Master Agreement) is extended pursuant to the Master Agreement).
The Commitment Letter contains, and the credit agreement in respect of the Bridge Loan Commitment, if any, will contain, certain customary conditions to funding, including, without limitation, (i) no material adverse effect with respect to Verizon’s land interests, towers, certain related improvements and tower related assets associated with each communications site having occurred since December 31, 2014, (ii) the execution and delivery of definitive financing agreements for the Bridge Loan Commitment and (iii) other customary closing conditions set forth in the Commitment Letter. The Company will pay certain customary commitment fees and, in the event the Company makes any borrowings, funding and other fees in connection with the Bridge Loan Commitment.
AMERICAN TOWER CORPORATION AND SUBSIDIARIES
SCHEDULE III—SCHEDULE OF REAL ESTATE
AND ACCUMULATED DEPRECIATION
| | | | | | | | | | | | | | | | | | | | | | | | | | | | |
Description | | Encumbrances | | | Initial cost
to company | | Cost
capitalized
subsequent to
acquisition | | Gross amount
carried at
close of
current
period | | | Accumulated
depreciation
at close of
current
period | | | Date of
construction | | | Date
acquired | | | Life on which
depreciation in
latest income
statements is
computed | |
75,164 sites (1) | | $ | 3,510,481 | (2) | | (3) | | (3) | | $ | 10,469,207 | (4) | | $ | (3,613,078 | ) | | | Various | | | | Various | | | | Up to 20 years | |
(1) | No single site exceeds 5% of the aggregate gross amounts at which the assets were carried at the close of the period set forth in the table above. |
(2) | Certain assets secure debt of approximately $3.5 billion. |
(3) | The Company has omitted this information, as it would be impracticable to compile such information on a site-by-site basis. |
(4) | Does not include those sites under construction. |
| | | | | | | | | | | | |
| | | 2014 (1) | | | 2013 (1) | | | 2012 | |
Gross amount at beginning | | $ | 9,921,276 | | | $ | 8,290,313 | | | $ | 7,192,641 | |
Additions during period: | | | | | | | | | | | | |
Acquisitions through foreclosure | | | — | | | | — | | | | — | |
Other acquisitions (2) | | | 397,837 | | | | 1,415,171 | | | | 739,144 | |
Discretionary capital projects (3) | | | 437,720 | | | | 314,126 | | | | 217,935 | |
Discretionary ground lease purchases (4) | | | 159,637 | | | | 102,991 | | | | 93,990 | |
Redevelopment capital expenditures (5) | | | 96,782 | | | | 89,960 | | | | 67,309 | |
Capital improvements (6) | | | 41,967 | | | | 58,960 | | | | 70,453 | |
Start-up capital expenditures (7) | | | 21,173 | | | | 15,757 | | | | — | |
Other (8) | | | 22,069 | | | | 8,764 | | | | 30,813 | |
| | | | | | | | | | | | |
Total additions | | | 1,177,185 | | | | 2,005,729 | | | | 1,219,644 | |
| | | | | | | | | | | | |
Deductions during period: | | | | | | | | | | | | |
Cost of real estate sold or disposed | | | (60,147 | ) | | | (48,467 | ) | | | (15,288 | ) |
Other (9) | | | (569,107 | ) | | | (243,958 | ) | | | (80,450 | ) |
| | | | | | | | | | | | |
Total deductions: | | | (629,254 | ) | | | (292,425 | ) | | | (95,738 | ) |
| | | | | | | | | | | | |
Balance at end | | $ | 10,469,207 | | | $ | 10,003,617 | | | $ | 8,316,547 | |
| | | | | | | | | | | | |
(1) | Balance has been revised to reflect purchase accounting measurement period adjustments. |
(2) | Includes acquisitions of sites. |
(3) | Includes amounts incurred primarily for the construction of new sites. |
(4) | Includes amounts incurred to purchase or otherwise secure the land under communications sites. |
(5) | Includes amounts incurred to increase the capacity of existing sites, which results in new incremental tenant revenue. |
(6) | Includes amounts incurred to maintain existing sites. |
(7) | Includes amounts incurred for acquisitions and new market launches and costs that are contemplated in the business cases for these investments. |
(8) | Primarily includes regional improvements and other additions. |
(9) | Primarily includes foreign currency exchange rate fluctuations. |
| | | | | | | | | | | | |
| | | 2014 | | | 2013 | | | 2012 | |
Gross amount of accumulated depreciation at beginning | | $ | (3,297,033 | ) | | $ | (2,968,230 | ) | | $ | (2,646,927 | ) |
Additions during period: | | | | | | | | | | | | |
Depreciation | | | (457,135 | ) | | | (408,693 | ) | | | (344,778 | ) |
Other | | | (761 | ) | | | (264 | ) | | | (253 | ) |
| | | | | | | | | | | | |
Total additions | | | (457,896 | ) | | | (408,957 | ) | | | (345,031 | ) |
| | | | | | | | | | | | |
Deductions during period: | | | | | | | | | | | | |
Amount of accumulated depreciation for assets sold or disposed | | | 20,953 | | | | 17,462 | | | | 10,920 | |
Other (1) | | | 120,898 | | | | 62,692 | | | | 12,808 | |
| | | | | | | | | | | | |
Total deductions | | | 141,851 | | | | 80,154 | | | | 23,728 | |
| | | | | | | | | | | | |
Balance at end | | $ | (3,613,078 | ) | | $ | (3,297,033 | ) | | $ | (2,968,230 | ) |
| | | | | | | | | | | | |
(1) | Primarily includes foreign currency exchange rate fluctuations. |
INDEX TO EXHIBITS
Pursuant to the rules and regulations of the SEC, the Company has filed certain agreements as exhibits to this Annual Report on Form 10-K. These agreements may contain representations and warranties by the parties. These representations and warranties have been made solely for the benefit of the other party or parties to such agreements and (i) may have been qualified by disclosures made to such other party or parties, (ii) were made only as of the date of such agreements or such other date(s) as may be specified in such agreements and are subject to more recent developments, which may not be fully reflected in the Company’s public disclosure, (iii) may reflect the allocation of risk among the parties to such agreements and (iv) may apply materiality standards different from what may be viewed as material to investors. Accordingly, these representations and warranties may not describe the Company’s actual state of affairs at the date hereof and should not be relied upon.
The exhibits below are included, either by being filed herewith or by incorporation by reference, as part of this Annual Report on Form 10-K. Exhibits are identified according to the number assigned to them in Item 601 of SEC Regulation S-K. Documents that are incorporated by reference are identified by their Exhibit number as set forth in the filing from which they are incorporated by reference. The filings of the Registrant from which various exhibits are incorporated by reference into this Annual Report are indicated by parenthetical numbering which corresponds to the following key:
|
| (1) | | |
| (1 | ) | | Annual Report on Form 10-K (File No. 001-14195) filed on April 2, 2001; |
| | (2) | |
| (2 | ) | | Annual Report on Form 10-K (File No. 001-14195) filed on March 15, 2006; |
| | (3) | |
| (3 | ) | | Tender Offer Statement on Schedule TO (File No. 005-55211) filed on November 29, 2006; |
| | (4) | |
| (4 | ) | | Definitive Proxy Statement on Schedule 14A (File No. 001-14195) filed on March 22, 2007; |
| | (5) | Current Report on Form 8-K (File No. 001-14195) filed on May 22, 2007; |
| |
(6)(5 | Quarterly Report on Form 10-Q (File No. 001-14195) filed on November 9, 2007;) |
| | (7) | Quarterly Report on Form 10-Q (File No. 001-14195) filed on August 6, 2008; |
| | (8) | |
| (6 | ) | | Current Report on Form 8-K (File No. 001-14195) filed on March 5, 2009; |
| | (9) | |
| (7 | ) | | Quarterly Report on Form 10-Q (File No. 001-14195) filed on May 8, 2009; |
| | (10) | Quarterly Report on Form 10-Q (File No. 001-14195) filed on August 6, 2009; |
| |
(11)(8 | Quarterly Report on Form 10-Q (File No. 001-14195) filed on November 5, 2009;) |
| | (12) | Annual Report on Form 10-K (File No. 001-14195) filed on March 1, 2010; |
| | (13) | |
| (9 | ) | | Registration Statement on Form S-3ASR (File No. 333-166805) filed on May 13, 2010; |
| | (14) | |
| (10 | ) | | Quarterly Report on Form 10-Q (File No. 001-14195) filed on November 5, 2010; |
| | (15) | Current Report on Form 8-K (File No. 001-14195) filed on December 9, 2010; |
| |
(16)(11 | ) | | Current Report on Form 8-K (File No. 001-14195) filed on August 25, 2011; |
| | (17) | |
| (12 | ) | | Current Report on Form 8-K (File No. 001-14195) filed on October 6, 2011; |
| | (18) | |
| (13 | ) | | Current Report on Form 8-K (File No. 001-14195) filed on January 3, 2012; |
| | (19) | Annual Report on Form 10-K (File No. 001-14195) filed on February 29, 2012; |
| |
(20)(14 | ) | | Current Report on Form 8-K (File No. 001-14195) filed on March 12, 2012; |
| | (21) | |
| (15 | ) | | Current Report on Form 8-K (File No. 001-14195) filed on January 8, 2013; |
| | (22) | |
| (16 | ) | | Annual Report on Form 10-K (File No. 001-14195) filed on February 27, 2013; |
EX-1
| | (23) | |
| (17 | ) | | Quarterly Report on Form 10-Q (File No. 001-14195) filed on May 1, 2013; |
| | (24) | Current Report on Form 8-K (File No. 001-14195) filed on May 22, 2013; |
| |
(25)(18 | ) | | Registration Statement on Form S-3ASR (File No. 333-188812) filed on May 23, 2013; |
|
| | | |
| (19 | ) | | Quarterly Report on Form 10-Q (File No. 001-14195) filed on July 31, 2013; |
| | (27) | |
| (20 | ) | | Current Report on Form 8-K (File No. 001-14195) filed on August 19, 2013; |
| | (28) | |
| (21 | ) | | Quarterly Report on Form 10-Q (File No. 001-14195) filed on October 30, 2013; |
| | (29) | Current Report on Form 8-K (File No. 001-14195) filed on December 12, 2013; |
| |
(30)(22 | ) | | Current Report on Form 8-K (File No. 001-14195) filed on May 12, 2014; |
| | (31) | |
| (23 | ) | | Current Report on Form 8-K (File No. 001-141195)001-14195) filed on August 7, 2014; |
| | (32) | |
| (24 | ) | | Quarterly Report on Form 10-Q (File No. 001-14195) filed on October 30, 2014; and |
| | (33) | |
| (25 | ) | | Current Report on Form 8-K (File No. 001-141195)001-14195) filed on February 23, 2015.2015; |
| | |
| (26 | ) | | Annual Report on Form 10-K (File No. 001-14195) filed on February 24, 2015; |
| | |
| (27 | ) | | Current Report on Form 8-K (File No. 001-14195) filed on March 3, 2015; |
| | |
| (28 | ) | | Quarterly Report on Form 10-Q (File No. 001-14195) filed on April 30, 2015; |
| | |
| (29 | ) | | Current Report on Form 8-K (File No. 001-14195) filed on May 7, 2015; |
| | |
| (30 | ) | | Quarterly Report on Form 10-Q (File No. 001-14195) filed on July 29, 2015; |
| | |
| (31 | ) | | Current Report on Form 8-K (File No. 001-14195) filed on January 12, 2016; |
| | |
| (32 | ) | | Current Report on Form 8-K (File No. 001-14195) filed on February 16, 2016; |
| | |
| (33 | ) | | Annual Report on Form 10-K (File No. 001-14195) filed on February 26, 2016; |
| | |
| (34 | ) | | Current Report on Form 8-K (File No. 001-14195) filed on March 9, 2016; |
| | |
| (35 | ) | | Current Report on Form 8-K (File No. 001-14195) filed on May 13, 2016; |
| | |
| (36 | ) | | Current Report on Form 8-K (File No. 001-14195) filed on September 30, 2016; |
| | |
| (37 | ) | | Annual Report on Form 10-K (File No. 001-14195) filed on February 27, 2017; |
| | |
| (38 | ) | | Current Report on Form 8-K (File No. 001-14195) filed on March 14, 2017; |
| | |
| (39 | ) | | Current Report on Form 8-K (File No. 001-14195) filed on April 6, 2017; |
| | |
| (40 | ) | | Current Report on Form 8-K (File No. 001-14195) filed on June 30, 2017; and |
| | |
| (41 | ) | | Current Report on Form 8-K (File No. 001-14195) filed on December 8, 2017. |
| | | | |
Exhibit No. | | Description of Document | | Exhibit File No. |
| | |
| 2.1 | | Agreement and Plan of Merger by and between American Tower Corporation and American Tower REIT, Inc., dated as of August 24, 2011 | | 2.1(16) |
| | |
| 3.1 | | Restated Certificate of Incorporation of the Company as filed with the Secretary of State of the State of Delaware, effective as of December 31, 2011 | | 3.1(18) |
| | |
| 3.2 | | Certificate of Merger, effective as of December 31, 2011 | | 3.2(18) |
| | |
| 3.3 | | Amended and Restated By-Laws of the Company, effective as of May 21, 2013 | | 3.1(24) |
| | |
| 3.4 | | Certificate of Designations of the 5.25% Mandatory Convertible Preferred Stock, Series A, of the Company as filed with the Secretary of State of the State of Delaware, effective as of May 12, 2014 | | 3.1(30) |
| | |
| 4.1 | | Indenture, dated as of October 1, 2007, by and between the Company and The Bank of New York, as Trustee, for the 7.00% Senior Notes due 2017, including the form of 7.00% Senior Note | | 10.2(6) |
| | |
| 4.2 | | Indenture dated as of June 10, 2009, by and between the Company and The Bank of New York Mellon Trust Company N.A., as Trustee, for the 7.25% Senior Notes due 2019 | | 10.1(10) |
| | |
| 4.3 | | Indenture dated as of October 20, 2009, by and between the Company and The Bank of New York Mellon Trust Company N.A., as Trustee, for the 4.625% Senior Notes due 2015 | | 10.1(11) |
| | |
| 4.4 | | Indenture dated May 13, 2010, by and between the Company and The Bank of New York Mellon Trust Company N.A., as Trustee | | 4.3(13) |
| | |
| 4.5 | | Indenture dated May 23, 2013, by and between the Company and U.S. Bank National Association, as Trustee | | 4.12(25) |
| | |
| 4.6 | | Supplemental Indenture No. 1, dated August 16, 2010, to Indenture dated May 13, 2010, by and between the Company and The Bank of New York Mellon Trust Company N.A., as Trustee, for the 5.05% Senior Notes due 2020 | | 4(14) |
| | |
| 4.7 | | Supplemental Indenture No. 2, dated December 7, 2010, to Indenture dated May 13, 2010, by and between the Company and The Bank of New York Mellon Trust Company N.A., as Trustee, for the 4.50% Senior Notes due 2018 | | 4.1(15) |
EX-2
| | | | |
Exhibit No. | | Description of Document | | Exhibit File No. |
| | |
| 4.8 | | Supplemental Indenture No. 3, dated as of October 6, 2011, to Indenture dated May 13, 2010, by and between the Company and The Bank of New York Mellon Trust Company N.A., as Trustee, for the 5.90% Senior Notes due 2021 | | 4.1(17) |
| | |
| 4.9 | | First Supplemental Indenture, dated as of December 2, 2008, to Indenture dated as of October 1, 2007, by and between the Company and the Bank of New York Mellon Trust Company N.A., as Trustee, for the 7.00% Senior Notes due 2017 | | 4.8(19) |
| | |
| 4.10 | | Second Supplemental Indenture, dated as of December 30, 2011, to Indenture dated as of October 1, 2007, with respect to the 7.000% Senior Notes of the Company’s predecessor prior to the REIT conversion (the “Predecessor Registrant”), by and among, the Predecessor Registrant, the Company and The Bank of New York Mellon Trust Company N.A., as Trustee | | 4.3(18) |
| | |
| 4.11 | | Supplemental Indenture No. 1, dated as of December 30, 2011, to Indenture dated as of June 10, 2009, with respect to the Predecessor Registrant’s 7.25% Senior Notes, by and among, the Predecessor Registrant, the Company and The Bank of New York Mellon Trust Company N.A., as Trustee | | 4.4(18) |
| | |
| 4.12 | | Supplemental Indenture No. 1, dated as of December 30, 2011, to Indenture dated as of October 20, 2009 with respect to the Predecessor Registrant’s 4.625% Senior Notes, by and among, the Predecessor Registrant, the Company and The Bank of New York Mellon Trust Company N.A., as Trustee | | 4.5(18) |
| | |
| 4.13 | | Supplemental Indenture No. 4, dated as of December 30, 2011, to Indenture dated May 13, 2010, by and among, the Predecessor Registrant, the Company and The Bank of New York Mellon Trust Company N.A., as Trustee | | 4.6(18) |
| | |
| 4.14 | | Supplemental Indenture No. 5, dated as of March 12, 2012, to Indenture dated May 13, 2010, by and between the Company and the Bank of New York Mellon Trust Company N.A., as Trustee, for the 4.70% Senior Notes due 2022 | | 4.1(20) |
| | |
| 4.15 | | Supplemental Indenture No. 6, dated as of January 8, 2013, to Indenture dated May 13, 2010, by and between the Company and the Bank of New York Mellon Trust Company N.A., as Trustee, for the 3.50% Senior Notes due 2023 | | 4.1(21) |
| | |
| 4.16 | | Supplemental Indenture No. 1, dated as of August 19, 2013, to Indenture dated May 23, 2013, by and between the Company and U.S. Bank National Association, as Trustee, for the 3.40% Senior Notes due 2019 and the 5.00% Senior Notes due 2024 | | 4.1(27) |
| | |
| 4.17 | | Supplemental Indenture No. 2, dated as of August 7, 2014, to Indenture dated May 23, 2013, by and between the Company and U.S. Bank National Association, as Trustee, for the 3.450% Senior Notes due 2021 | | 4.1(31) |
| | |
| 10.1 | | American Tower Systems Corporation 1997 Stock Option Plan, as amended | | (d)(1)(3)* |
| | |
| 10.2 | | American Tower Corporation 2000 Employee Stock Purchase Plan, as amended and restated | | 10.5(12) |
| | |
| 10.3 | | American Tower Corporation 2007 Equity Incentive Plan | | Annex A (4)* |
| | |
| 10.4 | | Form of Notice of Grant of Nonqualified Stock Option and Option Agreement (U.S. Employee) Pursuant to the American Tower Corporation 2007 Equity Incentive Plan | | 10.6(22)* |
| | |
| 10.5 | | Form of Notice of Grant of Nonqualified Stock Option and Option Agreement (Non-U.S. Employee) Pursuant to the American Tower Corporation 2007 Equity Incentive Plan | | 10.31(22)* |
EX-3
| | | | |
Exhibit No. | | Description of Document | | Exhibit File No. |
| | |
| 10.6 | | Notice of Grant of Nonqualified Stock Option and Option Agreement (Non-Employee Director) Pursuant to the American Tower Corporation 2007 Equity Incentive Plan | | 10.4(5)* |
| | |
| 10.7 | | Form of Restricted Stock Unit Agreement (U.S. Employee/ Non-U.S. Employee Director) Pursuant to the American Tower Corporation 2007 Equity Incentive Plan | | 10.8(22)* |
| | |
| 10.8 | | Form of Restricted Stock Unit Agreement (Non-U.S. Employee) Pursuant to the American Tower Corporation 2007 Equity Incentive Plan | | 10.9(22)* |
| | |
| 10.9 | | Form of Notice of Grant of Performance-Based Restricted Stock Units Agreement (U.S. Employee) Pursuant to the American Tower Corporation 2007 Equity Incentive Plan | | 10.1(33)* |
| | |
| 10.10 | | Noncompetition and Confidentiality Agreement dated as of January 1, 2004 between American Tower Corporation and William H. Hess | | 10.10(2)* |
| | |
| 10.11 | | Amendment, dated August 6, 2009, to Noncompetition and Confidentiality Agreement dated as of January 1, 2004 between American Tower Corporation and William H. Hess | | 10.1(7)* |
| | |
| 10.12 | | First Amended and Restated Loan and Security Agreement, dated as of March 15, 2013, by and between American Tower Asset Sub, LLC and American Tower Asset Sub II, LLC, as Borrowers, and U.S. Bank National Association, as Trustee for American Tower Trust I Secured Tower Revenue Securities, as Lender | | 10.1(23) |
| | |
| 10.13 | | First Amended and Restated Management Agreement, dated as of March 15, 2013, by and between American Tower Asset Sub, LLC and American Tower Asset Sub II, LLC, as Owners, and SpectraSite Communications, LLC, as Manager | | 10.2(23) |
| | |
| 10.14 | | First Amended and Restated Cash Management Agreement, dated as of March 15, 2013, by and among American Tower Asset Sub, LLC and American Tower Asset Sub II, LLC, as Borrowers, and U.S. Bank National Association, as Trustee for American Tower Trust I Secured Tower Revenue Securities, as Lender, Midland Loan Services, a Division of PNC Bank, National Association, as Servicer, U.S. Bank National Association, as Agent, and SpectraSite Communications, LLC, as Manager | | 10.3(23) |
| | |
| 10.15 | | First Amended and Restated Trust and Servicing Agreement, dated as of March 15, 2013, by and among American Tower Depositor Sub, LLC, as Depositor, Midland Loan Services, a Division of PNC Bank, National Association, as Servicer, and U.S. Bank National Association, as Trustee | | 10.4(23) |
| | |
| 10.16 | | Lease and Sublease by and among ALLTEL Communications, Inc. and the other entities named therein and American Towers, Inc. and American Tower Corporation, dated , 2001 | | 2.1(1) |
| | |
| 10.17 | | Agreement to Sublease by and among ALLTEL Communications, Inc. the ALLTEL entities and American Towers, Inc. and American Tower Corporation, dated December 19, 2000 | | 2.2(1) |
| | |
| 10.18 | | Lease and Sublease, dated as of December 14, 2000, by and among SBC Tower Holdings LLC, Southern Towers, Inc., SBC Wireless, LLC and SpectraSite Holdings, Inc. (incorporated by reference from Exhibit 10.2 to the SpectraSite Holdings, Inc. Quarterly Report on Form 10-Q (File No. 000-27217) filed on May 11, 2001) | | 10.2 |
EX-4
| | | | |
Exhibit No. | | Description of Document | | Exhibit File No. |
| | |
| 10.19 | | Summary Compensation Information for Current Named Executive Officers (incorporated by reference from Item 5.02(e) of Current Report on Form 8-K (File No. 001-14195) filed on February 23, 2015) | | * |
| | |
| 10.20 | | Amendment to Lease and Sublease, dated September 30, 2008, by and between SpectraSite, LLC, American Tower Asset Sub II, LLC, SBC Wireless, LLC and SBC Tower Holdings LLC | | 10.7(9)** |
| | |
| 10.21 | | Form of Waiver and Termination Agreement | | 10.4(8) |
| | |
| 10.22 | | American Tower Corporation Severance Plan, as amended | | 10.35(12)* |
| | |
| 10.23 | | American Tower Corporation Severance Plan, Program for Executive Vice Presidents and Chief Executive Officer, as amended | | 10.36(12)* |
| | |
| 10.24 | | Letter Agreement, dated as of February 9, 2015 by and between the Company and Steven C. Marshall | | Filed herewith
as Exhibit 10.24* |
| | |
| 10.25 | | Loan Agreement, dated as of June 28, 2013, among the Company, as Borrower, Toronto Dominion (Texas) LLC, as Administrative Agent and Swingline Lender, Barclays Bank PLC, Citibank, N.A. and Bank of America, N.A., as Syndication Agents, JPMorgan Chase Bank, N.A., as Documentation Agent, TD Securities (USA) LLC, Barclays Bank PLC, Citigroup Global Markets Inc. and Merrill Lynch, Pierce, Fenner & Smith, Incorporated, as Co-Lead Arrangers and Joint Bookrunners, and the several other lenders that are parties thereto | | 10.1 (26) |
| | |
| 10.26 | | Securities Purchase and Merger Agreement, dated as of September 6, 2013, among American Tower Investments LLC, as buyer, LMIF Pylon Guernsey Limited, Macquarie Specialised Asset Management Limited, solely in its capacity as responsible entity of Macquarie Global Infrastructure Fund IIIA, Macquarie Specialised Asset Management 2 Limited, solely in its capacity as responsible entity of Macquarie Global Infrastructure Fund IIIB, Macquarie Infrastructure Partners II U.S., L.P., Macquarie Infrastructure Partners II International, L.P., Macquarie Infrastructure Partners Canada, L.P., Macquarie Infrastructure Partners A, L.P., Macquarie Infrastructure Partners International, L.P., Stichting Depositary PGGM Infrastructure Funds, as sellers, Macquarie GTP Investments LLC, GTP Investments LLC, Macquarie Infrastructure Partners Inc., and the other parties thereto | | 10.1(28) |
| | |
| 10.27 | | First Amendment to the Securities Purchase and Merger Agreement, dated as of September 20, 2013, to the Securities Purchase and Merger Agreement dated September 6, 2013 | | 10.2(28) |
| | |
| 10.28 | | Second Amendment to the Securities Purchase and Merger Agreement, dated as of September 26, 2013, to the Securities Purchase and Merger Agreement dated September 6, 2013 | | 10.3(28) |
| | |
| 10.29 | | Loan Agreement, dated as of September 20, 2013, among the Company, as Borrower, JPMorgan Chase Bank, N.A., as administrative agent, The Royal Bank of Scotland plc and TD Securities (USA) LLC, as syndication agents, Citibank, N.A., as documentation agent and J.P. Morgan Securities LLC, RBS Securities Inc. and TD Securities (USA) LLC, as joint lead arrangers and joint bookrunners, and the several other lenders that are parties thereto | | 10.4(28) |
EX-5
| | | | |
Exhibit No. | | Description of Document | | Exhibit File No. |
| | |
| 10.30 | | First Amendment to Term Loan Agreement, dated as of September 20, 2013, among the Company, as borrower, The Royal Bank of Scotland plc, as administrative agent, and a majority of the lenders under the Company’s Term Loan Agreement entered into on June 29, 2012 | | 10.5(28) |
| | |
| 10.31 | | First Amendment to Loan Agreement, dated as of September 20, 2013, among the Company, as borrower, JPMorgan Chase Bank, N.A., as administrative agent, and all of the lenders under the Company’s Loan Agreement entered into on January 31, 2012 | | 10.6(28) |
| | |
| 10.32 | | First Amendment to Loan Agreement, dated as of September 20, 2013, among the Company, as borrower, Toronto Dominion (Texas) LLC, as administrative agent, and a majority of the lenders under the Company’s Loan Agreement entered into on June 28, 2013 | | 10.7(28) |
| | |
| 10.33 | | Term Loan Agreement, dated as of October 29, 2013, among the Company, as borrower, The Royal Bank of Scotland plc, as administrative agent, Royal Bank of Canada and TD Securities (USA) LLC, as co-syndication agents, JPMorgan Chase Bank, N.A., Barclays Bank PLC, Citibank, N.A, Morgan Stanley MUFG Loan Partners, LLC and CoBank, ACB as co-documentation agents, RBS Securities Inc., RBC Capital Markets, LLC, TD Securities (USA) LLC, J.P. Morgan Securities LLC and Barclays Bank PLC, as joint lead arrangers and joint bookrunners, and the several other lenders that are parties thereto | | 10.8(28) |
| | |
| 10.34 | | Amended and Restated Indenture, dated as of May 25, 2007, by and between GTP Acquisition Partners I, LLC, ACC Tower Sub, LLC, DCS Tower Sub, LLC, GTP South Acquisitions II, LLC, GTP Acquisition Partners II, LLC and GTP Acquisition Partners III, LLC, as obligors, and The Bank of New York, as indenture trustee | | 10.9 (28) |
| | |
| 10.35 | | Series 2011-1 Indenture Supplement, dated as of March 11, 2011, to the Amended and Restated Indenture, dated May 25, 2007 | | 10.12(28) |
| | |
| 10.36 | | Second Amended and Restated Indenture, dated as of July 7, 2011, by and between GTP Acquisition Partners I, LLC, ACC Tower Sub, LLC, DCS Tower Sub, LLC, GTP South Acquisitions II, LLC, GTP Acquisition Partners II, LLC and GTP Acquisition Partners III, LLC, as obligors, and The Bank of New York Mellon, as indenture trustee | | 10.13(28) |
| | |
| 10.37 | | Series 2011-2 Indenture Supplement, dated as of July 7, 2011, to the Second Amended and Restated Indenture, dated July 7, 2011 | | 10.14(28) |
| | |
| 10.38 | | Amended and Restated Indenture, dated as of February 28, 2012, by and between GTP Cellular Sites, LLC, Cell Tower Lease Acquisition LLC, GLP Cell Site I, LLC, GLP Cell Site II, LLC, GLP Cell Site III, LLC, GLP Cell Site IV, LLC, GLP Cell Site A, LLC, Cell Site NewCo II, LLC, as obligors, and Deutsche Bank Trust Company Americas, as indenture trustee | | 10.15(28) |
| | |
| 10.39 | | Series 2012-1 and Series 2012-2 Indenture Supplement, dated as of February 28, 2012, to the Amended and Restated Indenture dated February 28, 2012 | | 10.16(28) |
| | |
| 10.40 | | Series 2013-1 Indenture Supplement, dated as of April 24, 2013, to the Second Amended and Restated Indenture dated July 7, 2011 | | 10.17(28) |
EX-6
| | | | |
Exhibit No. | | Description of Document | | Exhibit File No. |
| | |
| 10.41 | | Second Amendment to Loan Agreement, dated as of December 10, 2013, among the Company, as borrower, JPMorgan Chase Bank, N.A., as administrative agent, and a majority of the lenders under the Company’s Loan Agreement entered into on January 31, 2012 | | 10.1(29) |
| | |
| 10.42 | | Amended and Restated Loan Agreement, dated as of September 19, 2014, among the Company, as borrower, Toronto Dominion (Texas) LLC, as administrative agent, and swingline lender, TD Securities (USA) LLC, Citigroup Global Markets Inc., J.P. Morgan Securities LLC, Morgan Stanley MUFG Loan Partners, LLC and RBS Securities Inc., as joint lead arrangers and joint bookrunners, Citibank, N.A., JPMorgan Chase Bank, N.A., Morgan Stanley MUFG Loan Partners, LLC and The Royal Bank of Scotland plc, as co-syndication agents, and the other lenders that are parties thereto | | 10.1(32) |
| | |
| 10.43 | | Second Amendment to Loan Agreement, dated as of September 19, 2014, among the Company, as borrower, Toronto Dominion (Texas) LLC, as administrative agent, and all of the lenders under the Company’s Loan Agreement entered into on June 28, 2013 | | 10.2(32) |
| | |
| 10.44 | | First Amendment to Term Loan Agreement, dated as of September 19, 2014, among the Company, as borrower, The Royal Bank of Scotland plc, as administrative agent, and a majority of the lenders under the Company’s Term Loan Agreement entered into on October 29, 2013 | | 10.3(32) |
| | |
| 10.45 | | Master Agreement, dated as of February 5, 2015, among the Company and Verizon Communications, Inc. | | Filed herewith
as Exhibit 10.45 |
| | |
| 10.46 | | Form of Master Prepaid Lease | | Filed herewith
as Exhibit 10.46 |
| | |
| 10.47 | | Form of Management Agreement | | Filed herewith
as Exhibit 10.47 |
| | |
| 10.48 | | Form of Sale Site Master Lease Agreement | | Filed herewith
as Exhibit 10.48 |
| | |
| 10.49 | | Form of MPL Site Master Lease Agreement | | Filed herewith
as Exhibit 10.49 |
| | |
| 10.50 | | Commitment Letter, dated as of February 5, 2015, among the Company, Goldman Sachs Bank USA and Goldman Sachs Lending Partners LLC | | Filed herewith
as Exhibit 10.50 |
| | |
| 10.51 | | First Amendment to Loan Agreement, dated as of February 5, 2015, among the Company, as borrower, Toronto Dominion (Texas) LLC, as administrative agent, and a majority of the lenders under the Company’s Amended and Restated Loan Agreement entered into on September 19, 2014 | | Filed herewith
as Exhibit 10.51 |
| | |
| 10.52 | | Second Amendment to Term Loan Agreement, dated as of February 5, 2015, among the Company, as borrower, The Royal Bank of Scotland plc, as administrative agent, and a majority of the lenders under the Company’s Term Loan Agreement entered into on October 29, 2013 | | Filed herewith
as Exhibit 10.52 |
| | |
| 10.53 | | Third Amendment to Loan Agreement, dated as of February 5, 2015, among the Company, as borrower, Toronto Dominion (Texas) LLC, as administrative agent, and a majority of the lenders under the Company’s Loan Agreement entered into on June 28, 2013 | | Filed herewith
as Exhibit 10.53 |
EX-7
| |
| | | | |
Exhibit No. | | Description of Document | | Exhibit File No. |
| | |
| 2.1 | | | | 2.1 (11) |
| | |
| 3.1 | | | | 3.1 (13) |
| | |
| 3.2 | | | | 3.2 (13) |
| | |
| 3.3 | | | | 3.1 (32) |
| | | | |
| 3.4 | | | | 3.1 (22) |
| | |
| 3.5 | | | | 3.1 (27) |
| | |
| 4.1 | | | | 4.3 (9) |
| | |
| 4.2 | | | | 4.12 (18) |
| | | | |
| 4.3 | | | | 4 (10) |
| | |
| 4.4 | | | | 4.1 (12) |
| | | | |
| 4.5 | | | | 4.6 (13) |
| | |
| 4.6 | | | | 4.1 (14) |
| | |
| 4.7 | | | | 4.1 (15) |
| | |
| 4.8 | | | | 4.1 (20) |
| | | | |
| 4.9 | | | | 4.1 (23) |
| | | | |
| 4.10 | | | | 4.1 (29) |
| | | | |
| 4.11 | | | | 4.1 (31) |
| | | | |
| 4.12 | | | | 4.1 (35) |
|
| | | | |
10.54Exhibit No. | | Description of Document | | Exhibit File No. |
| | | | |
| 4.13 | | | | 4.1 (36) |
| | | | |
| 4.14 | | Supplemental Indenture No. 7, dated as of April 6, 2017, to Indenture dated as of May 23, 2013, by and between the Company, U.S. Bank National Association, as trustee, and Elavon Financial Services DAC, UK Branch, as paying agent, for the 1.375% Senior Notes due 2025 | | 4.1 (39) |
| | | | |
| 4.15 | | | | 4.1 (40) |
| | | | |
| 4.16 | | | | 4.1 (41) |
| | | | |
| 4.17 | | | | 4.1 (27) |
| | | | |
| 4.18 | | Third Amended and Restated Indenture, dated May 29, 2015, by and between GTP Acquisition Partners I, LLC, ACC Tower Sub, LLC, DCS Tower Sub, LLC, GTP South Acquisitions II, LLC, GTP Acquisition Partners II, LLC, GTP Acquisition Partners, III, LLC, GTP Infrastructure I, LLC, GTP Infrastructure II, LLC, GTP Infrastructure III, LLC, GTP Towers VIII, LLC, GTP Towers I, LLC, GTP Towers II, LLC, GTP Towers IV, LLC, GTP Towers V, LLC, GTP Towers VII, LLC, GTP Towers IX, LLC, PCS Structures Towers, LLC and GTP TRS I LLC, as obligors, and The Bank of New York Mellon, as trustee | | 4.2 (30) |
| | | | |
| 4.19 | | | | 4.3 (30) |
| | | | |
| 4.20 | | | | 4.4 (30) |
| | | | |
| 10.1 | | | | (d)(1) (3)* |
| | |
| 10.2 | | | | 10.5 (8) |
| | |
| 10.3 | | | | Annex A (4)* |
| | |
| 10.4 | |
| | 10.1 (38) |
| | | | |
| 10.5 | | | | 10.6 (16)* |
| | |
| 10.6 | | | | 10.31 (16)* |
| | | | |
| 10.7 | | | | 10.8 (16)* |
| | |
| 10.8 | | | | 10.9 (16)* |
| | | | |
| 10.9 | | | | 10.1 (25)* |
| | | | |
|
| | | | |
| Exhibit No. | | Description of Document | | Exhibit File No. |
| 10.10 | | | | 10.1 (34)* |
| | | | | |
| 10.11 | | | | 10.2 (34)* |
| | | |
| 10.12 | | | | 10.10 (2)* |
| | | | | |
| 10.13 | | | | 10.1 (5)* |
| | | | | |
| 10.14 | | | | 10.1 (17) |
| | | | | |
| 10.15 | | | | 10.2 (17) |
| | | | | |
| 10.16 | | First Amended and Restated Cash Management Agreement, dated as of March 15, 2013, by and among American Tower Asset Sub, LLC and American Tower Asset Sub II, LLC, as Borrowers, and U.S. Bank National Association, as Trustee for American Tower Trust I Secured Tower Revenue Securities, as Lender, Midland Loan Services, a Division of PNC Bank, National Association, as Servicer, U.S. Bank National Association, as Agent, and SpectraSite Communications, LLC, as Manager | | 10.3 (17) |
| | | | | |
| 10.17 | | First Amended and Restated Trust and Servicing Agreement, dated as of March 15, 2013, by and among American Tower Depositor Sub, LLC, as Depositor, Midland Loan Services, a Division of PNC Bank, National Association, as Servicer, and U.S. Bank National Association, as Trustee | | 10.4 (17) |
| | | | | |
| 10.18 | | | | 2.1 (1) |
| | | | | |
| 10.19 | | | | 2.2 (1) |
| | | | | |
| 10.20 | | Lease and Sublease, dated as of December 14, 2000, by and among SBC Tower Holdings LLC, Southern Towers, Inc., SBC Wireless, LLC and SpectraSite Holdings, Inc. (incorporated by reference from Exhibit 10.2 to the SpectraSite Holdings, Inc. Quarterly Report on Form 10-Q (File No. 000-27217) filed on May 11, 2001) | | 10.2 |
| | | | | |
| 10.21 | | | | 10.7 (7)** |
| | | | | |
| 10.22 | | | | * |
| | | | | |
| 10.23 | | | | 10.4 (6) |
| | | | | |
| 10.24 | | | | 10.35 (8)* |
| | | | | |
| 10.25 | | | | 10.36 (8)* |
| | | |
| 10.26 | |
| | 10.2 (38)* |
| | | | | |
|
| | | | |
| Exhibit No. | | Description of Document | | Exhibit File No. |
| | | | |
| 10.27 | |
| | 10.3 (38)*
|
| | | | |
| 10.28 | | Loan Agreement, dated as of June 28, 2013, among the Company, as Borrower, Toronto Dominion (Texas) LLC, as Administrative Agent and Swingline Lender, Barclays Bank PLC, Citibank, N.A. and Bank of America, N.A., as Syndication Agents, JPMorgan Chase Bank, N.A., as Documentation Agent, TD Securities (USA) LLC, Barclays Bank PLC, Citigroup Global Markets Inc. and Merrill Lynch, Pierce, Fenner & Smith, Incorporated, as Co-Lead Arrangers and Joint Bookrunners, and the several other lenders that are parties thereto | | 10.1 (19) |
| | |
| 10.29 | | | | 10.7 (21) |
| | |
| 10.30 | | Term Loan Agreement, dated as of October 29, 2013, among the Company, as borrower, The Royal Bank of Scotland plc, as Administrative Agent, Royal Bank of Canada and TD Securities (USA) LLC, as co-syndication agents, JPMorgan Chase Bank, N.A., Barclays Bank PLC, Citibank, N.A, Morgan Stanley MUFG Loan Partners, LLC and CoBank, ACB as co-documentation agents, RBS Securities Inc., RBC Capital Markets, LLC, TD Securities (USA) LLC, J.P. Morgan Securities LLC and Barclays Bank PLC, as joint lead arrangers and joint bookrunners, and the several other lenders that are parties thereto | | 10.8 (21) |
| | |
| 10.31 | | Amended and Restated Loan Agreement, dated as of September 19, 2014, among the Company, as borrower, Toronto Dominion (Texas) LLC, as Administrative Agent, and Swingline Lender, TD Securities (USA) LLC, Citigroup Global Markets Inc., J.P. Morgan Securities LLC, Morgan Stanley MUFG Loan Partners, LLC and RBS Securities Inc., as joint lead arrangers and joint bookrunners, Citibank, N.A., JPMorgan Chase Bank, N.A., Morgan Stanley MUFG Loan Partners, LLC and The Royal Bank of Scotland plc, as co-syndication agents, and the other lenders that are parties thereto | | 10.1 (24) |
| | | | |
| 10.32 | | | | 10.2 (24) |
| | | | |
| 10.33 | | | | 10.3 (24) |
| | | | |
| 10.34 | | | | 10.51 (26) |
| | | | |
| 10.35 | | | | 10.52 (26) |
| | | | |
| 10.36 | | | | 10.53 (26) |
| | | | |
| 10.37 | | | | 10.54 (26) |
| |
| Filed herewith
as Exhibit 10.54 |
| |
| | |
10.5510.38 | | | |
10.55 (26) |
Filed herewith
as Exhibit 10.55 |
|
| | | | |
10.56Exhibit No. | | Description of Document | | Exhibit File No. |
| | | | |
| 10.39 | | | | 10.56 (26) |
| |
| | |
| 10.40 | | | | 10.43 (33) |
| | | | |
| 10.41 | | | | 10.44 (33) |
| | | | |
| 10.42 | | | | 10.45 (33) |
| | | | |
| 10.43 | | | | 10.44 (37) |
| | | | |
| 10.44 | | | | 10.45 (37) |
| | | | |
| 10.45 | | | | 10.46 (37) |
| | | | |
| 10.46 | |
| | Filed herewith
as Exhibit 10.5610.46 |
| | | | |
| 10.47 | | | | Filed herewith as Exhibit 10.47 |
| | | | |
| 10.48 | |
| | Filed herewith as Exhibit 10.48 |
| | | | |
| 10.49 | | | | 10.45 (26) |
| | | | |
| 10.50 | | | | 10.8 (28) |
| | | | |
| 10.51 | | | | 10.9 (28) |
| | | | |
| 10.52 | | | | 10.10 (28) |
| | | | |
| 10.53 | | | | 10.11 (28) |
| | | | |
| 10.54 | | | | 10.52 (33) |
|
| | | | |
| Exhibit No. | | Description of Document | | Exhibit File No. |
| | | | |
| 10.55 | | | | 10.53 (33)
|
| | | | |
| 12 | | | | Filed herewith as Exhibit 12 |
| |
| Filed herewith
as Exhibit 12 |
|
| | |
| 21 | | | | Filed herewith as Exhibit 21 |
| |
| Filed herewith
as Exhibit 21 |
|
| | |
| 23 | | | | Filed herewith as Exhibit 23 |
| |
| Filed herewith
as Exhibit 23 |
|
| | |
| 31.1 | | | | Filed herewith as Exhibit 31.1 |
| |
| Filed herewith
as Exhibit 31.1 |
|
| | |
| 31.2 | | | | Filed herewith as Exhibit 31.2 |
| |
| Filed herewith
as Exhibit 31.2 |
|
| | |
| 32 | | | | Filed herewith as Exhibit 32 |
| |
| Filed herewith
as Exhibit 32 |
|
| | |
| 101 | | The following materials from American Tower Corporation’s Annual Report on Form 10-K for the year ended December 31, 2011, formatted in XBRL (Extensible Business Reporting Language): 101.INS—XBRL Instance Document 101.SCH—XBRL Taxonomy Extension Schema Document 101.CAL—XBRL Taxonomy Extension Calculation Linkbase Document 101.LAB—XBRL Taxonomy Extension Label Linkbase Document 101.PRE—XBRL Taxonomy Extension Presentation Linkbase Document 101.DEF—XTRL Taxonomy Extension Definition | |
| as Exhibit 101 |
|
|
| |
| * | Management contracts and compensatory plans and arrangements required to be filed as exhibits to this Form 10-K pursuant to Item 15(a)(3). |
|
| |
| ** | The exhibit has been filed separately with the Commission pursuant to an application for confidential treatment. The confidential portions of the exhibit have been omitted and are marked by an asterisk. |
EX-8
|
| |
| ITEM 16. | FORM 10-K SUMMARY |
None.
SIGNATURES
Pursuant to the requirements of Section 13 or 15(d) of the Securities Exchange Act of 1934, the Registrant has duly caused this report to be signed on its behalf by the undersigned, thereunto duly authorized on the 27th day of February, 2018.
|
| | | | |
| AMERICAN TOWER CORPORATION |
| | | |
| | | By: | /S/ JAMES D. TAICLET, JR. |
| | | | James D. Taiclet, Jr. Chairman, President and Chief Executive Officer |
Pursuant to the requirements of the Securities Exchange Act of 1934, this report has been duly signed below by the following persons on behalf of the Registrant and in the capacities and on the dates indicated.
|
| | | | |
| Signature | | Title | | Date |
| | |
/S/ JAMES D. TAICLET, JR. | | Chairman, President and Chief Executive Officer (Principal Executive Officer) | | February 27, 2018 |
| James D. Taiclet, Jr. | | |
| | |
/S/ THOMAS A. BARTLETT | | Executive Vice President, Chief Financial Officer and Treasurer (Principal Financial Officer) | | February 27, 2018 |
| Thomas A. Bartlett | | |
| | |
/S/ ROBERT J. MEYER, JR | | Senior Vice President, Finance and Corporate Controller (Principal Accounting Officer) | | February 27, 2018 |
| Robert J. Meyer, Jr. | | |
| | |
/S/ RAYMOND P. DOLAN | | Director | | February 27, 2018 |
| Raymond P. Dolan | | |
| | | | |
/S/ ROBERT D. HORMATS | | Director | | February 27, 2018 |
| Robert D. Hormats | | |
| | |
/S/ GUSTAVO LARA CANTU | | Director | | February 27, 2018 |
| Gustavo Lara Cantu | | |
| | | | |
/S/ GRACE D. LIEBLEIN | | Director | | February 27, 2018 |
| Grace D. Lieblein | | |
| | | | |
/S/ CRAIG MACNAB | | Director | | February 27, 2018 |
| Craig Macnab | | |
| | |
/S/ JOANN A. REED | | Director | | February 27, 2018 |
| JoAnn A. Reed | | |
| | |
/S/ PAMELA D. A. REEVE | | Director | | February 27, 2018 |
| Pamela D. A. Reeve | | |
| | |
/S/ DAVID E. SHARBUTT | | Director | | February 27, 2018 |
| David E. Sharbutt | | |
| | |
/S/ SAMME L. THOMPSON | | Director | | February 27, 2018 |
| Samme L. Thompson | | |
AMERICAN TOWER CORPORATION AND SUBSIDIARIES
INDEX TO CONSOLIDATED FINANCIAL STATEMENTS
REPORT OF INDEPENDENT REGISTERED PUBLIC ACCOUNTING FIRM
To the Stockholders and the Board of Directors of American Tower Corporation
Opinion on the Financial Statements
We have audited the accompanying consolidated balance sheets of American Tower Corporation and subsidiaries (the "Company") as of December 31, 2017 and 2016, the related consolidated statements of operations, comprehensive income (loss), equity, and cash flows for each of the three years in the period ended December 31, 2017, and the related notes and the schedule listed in the Index at Item 15 (collectively referred to as the "financial statements"). In our opinion, the financial statements present fairly, in all material respects, the financial position of the Company as of December 31, 2017 and 2016, and the results of its operations and its cash flows for each of the three years in the period ended December 31, 2017, in conformity with accounting principles generally accepted in the United States of America.
We have also audited, in accordance with the standards of the Public Company Accounting Oversight Board (United States) (PCAOB), the Company's internal control over financial reporting as of December 31, 2017, based on criteria established in Internal Control - Integrated Framework (2013) issued by the Committee of Sponsoring Organizations of the Treadway Commission and our report dated February 27, 2018, expressed an unqualified opinion on the Company's internal control over financial reporting.
Basis for Opinion
These financial statements are the responsibility of the Company's management. Our responsibility is to express an opinion on the Company's financial statements based on our audits. We are a public accounting firm registered with the PCAOB and are required to be independent with respect to the Company in accordance with the U.S. federal securities laws and the applicable rules and regulations of the Securities and Exchange Commission and the PCAOB.
We conducted our audits in accordance with the standards of the PCAOB. Those standards require that we plan and perform the audit to obtain reasonable assurance about whether the financial statements are free of material misstatement, whether due to error or fraud. Our audits included performing procedures to assess the risks of material misstatement of the financial statements, whether due to error or fraud, and performing procedures that respond to those risks. Such procedures included examining, on a test basis, evidence regarding the amounts and disclosures in the financial statements. Our audits also included evaluating the accounting principles used and significant estimates made by management, as well as evaluating the overall presentation of the financial statements. We believe that our audits provide a reasonable basis for our opinion.
/s/ Deloitte & Touche LLP
Boston, Massachusetts
February 27, 2018
We have served as the Company's auditor since 1997.
AMERICAN TOWER CORPORATION AND SUBSIDIARIES
CONSOLIDATED BALANCE SHEETS
(in millions, except share data)
|
| | | | | | | | |
| | | December 31, 2017 | | December 31, 2016 |
| ASSETS | | | | |
| CURRENT ASSETS: | | | | |
| Cash and cash equivalents | | $ | 802.1 |
| | $ | 787.2 |
|
| Restricted cash | | 152.8 |
| | 149.3 |
|
| Short-term investments | | 1.0 |
| | 4.0 |
|
| Accounts receivable, net | | 513.6 |
| | 308.4 |
|
| Prepaid and other current assets | | 568.6 |
| | 441.0 |
|
| Total current assets | | 2,038.1 |
| | 1,689.9 |
|
| PROPERTY AND EQUIPMENT, net | | 11,101.0 |
| | 10,517.3 |
|
| GOODWILL | | 5,638.4 |
| | 5,070.7 |
|
| OTHER INTANGIBLE ASSETS, net | | 11,783.3 |
| | 11,274.6 |
|
| DEFERRED TAX ASSET | | 204.4 |
| | 195.7 |
|
| DEFERRED RENT ASSET | | 1,499.0 |
| | 1,289.5 |
|
| NOTES RECEIVABLE AND OTHER NON-CURRENT ASSETS | | 950.1 |
| | 841.5 |
|
| TOTAL | | $ | 33,214.3 |
| | $ | 30,879.2 |
|
| LIABILITIES | | | | |
| CURRENT LIABILITIES: | | | | |
| Accounts payable | | $ | 142.9 |
| | $ | 118.7 |
|
| Accrued expenses | | 854.3 |
| | 620.5 |
|
| Distributions payable | | 304.4 |
| | 250.6 |
|
| Accrued interest | | 166.9 |
| | 157.3 |
|
| Current portion of long-term obligations | | 774.8 |
| | 238.8 |
|
| Unearned revenue | | 268.8 |
| | 245.4 |
|
| Total current liabilities | | 2,512.1 |
| | 1,631.3 |
|
| LONG-TERM OBLIGATIONS | | 19,430.3 |
| | 18,294.7 |
|
| ASSET RETIREMENT OBLIGATIONS | | 1,175.3 |
| | 965.5 |
|
| DEFERRED TAX LIABILITY | | 898.1 |
| | 777.6 |
|
| OTHER NON-CURRENT LIABILITIES | | 1,244.2 |
| | 1,142.6 |
|
| Total liabilities | | 25,260.0 |
| | 22,811.7 |
|
| COMMITMENTS AND CONTINGENCIES | |
|
| |
|
|
| REDEEMABLE NONCONTROLLING INTERESTS | | 1,126.2 |
| | 1,091.3 |
|
| EQUITY (shares in thousands): | | | | |
| Preferred stock: $.01 par value; 20,000 shares authorized; | | | | |
| 5.25%, Series A, 6,000 shares issued, 0 and 6,000 shares outstanding; aggregate liquidation value of $0.0 and $0.6, respectively | | — |
| | 0.1 |
|
| 5.50%, Series B, 1,375 shares issued, 1,375 shares outstanding; aggregate liquidation value of $1.4 | | 0.0 |
| | 0.0 |
|
| Common stock: $.01 par value; 1,000,000 shares authorized; 437,729 and 429,913 shares issued; and 428,820 and 427,103 shares outstanding, respectively | | 4.4 |
| | 4.3 |
|
| Additional paid-in capital | | 10,247.5 |
| | 10,043.5 |
|
| Distributions in excess of earnings | | (1,058.1 | ) | | (1,077.0 | ) |
| Accumulated other comprehensive loss | | (1,978.3 | ) | | (1,999.3 | ) |
| Treasury stock (8,909 and 2,810 shares at cost, respectively) | | (974.0 | ) | | (207.7 | ) |
| Total American Tower Corporation equity | | 6,241.5 |
| | 6,763.9 |
|
| Noncontrolling interests | | 586.6 |
| | 212.3 |
|
| Total equity | | 6,828.1 |
| | 6,976.2 |
|
| TOTAL | | $ | 33,214.3 |
| | $ | 30,879.2 |
|
AMERICAN TOWER CORPORATION AND SUBSIDIARIES
CONSOLIDATED STATEMENTS OF OPERATIONS
(in millions, except share and per share data)
|
| | | | | | | | | | | |
| | Year Ended December 31, |
| | 2017 | | 2016 | | 2015 |
| REVENUES: | | | | | |
| Property | $ | 6,565.9 |
| | $ | 5,713.1 |
| | $ | 4,680.4 |
|
| Services | 98.0 |
| | 72.6 |
| | 91.1 |
|
| Total operating revenues | 6,663.9 |
| | 5,785.7 |
| | 4,771.5 |
|
| OPERATING EXPENSES: | | | | | |
| Costs of operations (exclusive of items shown separately below): | | | | | |
| Property (including stock-based compensation expense of $2.1, $1.7 and $1.6, respectively) | 2,022.0 |
| | 1,762.7 |
| | 1,275.4 |
|
| Services (including stock-based compensation expense of $0.8, $0.7 and $0.4, respectively) | 34.6 |
| | 27.7 |
| | 33.4 |
|
| Depreciation, amortization and accretion | 1,715.9 |
| | 1,525.6 |
| | 1,285.3 |
|
| Selling, general, administrative and development expense (including stock-based compensation expense of $105.6, $87.5 and $88.5, respectively) | 637.0 |
| | 543.4 |
| | 497.8 |
|
| Other operating expenses | 256.0 |
| | 73.3 |
| | 66.8 |
|
| Total operating expenses | 4,665.5 |
| | 3,932.7 |
| | 3,158.7 |
|
| OPERATING INCOME | 1,998.4 |
| | 1,853.0 |
| | 1,612.8 |
|
| OTHER INCOME (EXPENSE): | | | | | |
| Interest income, TV Azteca, net of interest expense of $1.2, $1.2 and $0.8, respectively | 10.8 |
| | 10.9 |
| | 11.2 |
|
| Interest income | 35.4 |
| | 25.6 |
| | 16.5 |
|
| Interest expense | (749.6 | ) | | (717.1 | ) | | (595.9 | ) |
| (Loss) gain on retirement of long-term obligations | (70.2 | ) | | 1.2 |
| | (79.6 | ) |
| Other income (expense) (including unrealized foreign currency gains (losses) of $26.5, ($23.4), and ($71.5), respectively) | 31.3 |
| | (47.7 | ) | | (135.0 | ) |
| Total other expense | (742.3 | ) | | (727.1 | ) | | (782.8 | ) |
| INCOME FROM CONTINUING OPERATIONS BEFORE INCOME TAXES | 1,256.1 |
| | 1,125.9 |
| | 830.0 |
|
| Income tax provision | (30.7 | ) | | (155.5 | ) | | (158.0 | ) |
| NET INCOME | 1,225.4 |
| | 970.4 |
| | 672.0 |
|
| Net loss (income) attributable to noncontrolling interests | 13.5 |
| | (14.0 | ) | | 13.1 |
|
| NET INCOME ATTRIBUTABLE TO AMERICAN TOWER CORPORATION STOCKHOLDERS | 1,238.9 |
| | 956.4 |
| | 685.1 |
|
| Dividends on preferred stock | (87.4 | ) | | (107.1 | ) | | (90.2 | ) |
| NET INCOME ATTRIBUTABLE TO AMERICAN TOWER CORPORATION COMMON STOCKHOLDERS | $ | 1,151.5 |
| | $ | 849.3 |
| | $ | 594.9 |
|
| NET INCOME PER COMMON SHARE AMOUNTS: | | | | | |
| Basic net income attributable to American Tower Corporation common stockholders | $ | 2.69 |
| | $ | 2.00 |
| | $ | 1.42 |
|
| Diluted net income attributable to American Tower Corporation common stockholders | $ | 2.67 |
| | $ | 1.98 |
| | $ | 1.41 |
|
| WEIGHTED AVERAGE COMMON SHARES OUTSTANDING (in thousands): | | | | | |
| BASIC | 428,181 |
| | 425,143 |
| | 418,907 |
|
| DILUTED | 431,688 |
| | 429,283 |
| | 423,015 |
|
See accompanying notes to consolidated financial statements.
AMERICAN TOWER CORPORATION AND SUBSIDIARIES
CONSOLIDATED STATEMENTS OF COMPREHENSIVE INCOME (LOSS)
(in millions)
|
| | | | | | | | | | | | |
| | | Year Ended December 31, |
| | | 2017 | | 2016 | | 2015 |
| Net income | | $ | 1,225.4 |
| | $ | 970.4 |
| | $ | 672.0 |
|
| Other comprehensive (loss) income: | | | | | | |
| Changes in fair value of cash flow hedges, net of tax expense of $0, $0 and $0.1, respectively | | (0.4 | ) | | (0.4 | ) | | 0.9 |
|
| Reclassification of unrealized losses on cash flow hedges to net income, net of tax expense of $0, $0 and $0.1, respectively | | (0.1 | ) | | (0.3 | ) | | 2.4 |
|
| Foreign currency translation adjustments, net of tax expense (benefit) of $1.0, $3.8 million, and $(24.9), respectively | | 144.4 |
| | (202.9 | ) | | (1,078.9 | ) |
| Other comprehensive income (loss) | | 143.9 |
| | (203.6 | ) | | (1,075.6 | ) |
| Comprehensive income (loss) | | 1,369.3 |
| | 766.8 |
| | (403.6 | ) |
| Comprehensive (income) loss attributable to noncontrolling interest | | (109.4 | ) | | 18.2 |
| | 45.9 |
|
| Comprehensive income (loss) attributable to American Tower Corporation stockholders | | $ | 1,259.9 |
| | $ | 785.0 |
| | $ | (357.7 | ) |
See accompanying notes to consolidated financial statements.
AMERICAN TOWER CORPORATION AND SUBSIDIARIES
CONSOLIDATED STATEMENTS OF EQUITY
(in millions, except share counts)
|
| | | | | | | | | | | | | | | | | | | | | | | | | | | | | | | | | | | | | | | | | | | | | | |
| | Preferred Stock - Series A | | Preferred Stock - Series B | | Common Stock | | Treasury Stock | | Additional Paid-in Capital | | Accumulated Other Comprehensive Loss | | Distributions in Excess of Earnings | | Noncontrolling Interest | | Total Equity |
| | Issued Shares | | Amount | | Issued Shares | | Amount | | Issued Shares | | Amount | | Shares | | Amount | |
| BALANCE, JANUARY 1, 2015 | 6,000 |
| | $ | 0.1 |
| | — |
| $ | — |
| | 399,509 |
| | $ | 4.0 |
| | (2,810 | ) | | $ | (207.7 | ) | | $ | 5,788.8 |
| | $ | (794.2 | ) | | $ | (837.3 | ) | | $ | 99.7 |
| | $ | 4,053.4 |
|
| Stock-based compensation related activity | — |
| | — |
| | — |
| | — |
| | 1,253 |
| | 0.0 |
| | — |
| | — |
| | 117.2 |
| | — |
| | — |
| | — |
| | 117.2 |
|
| Issuance of common stock—stock purchase plan | — |
| | — |
| | — |
| | — |
| | 83 |
| | 0.0 |
| | — |
| | — |
| | 6.6 |
| | — |
| | — |
| | — |
| | 6.6 |
|
| Issuance of common stock | — |
| | — |
| | — |
| | — |
| | 25,850 |
| | 0.3 |
| | — |
| | — |
| | 2,440.1 |
| | — |
| | — |
| | — |
| | 2,440.4 |
|
| Issuance of preferred stock | — |
| | — |
| | 1,375 |
| | 0.0 |
| | — |
| | — |
| | — |
| | — |
| | 1,337.9 |
| | — |
| | — |
| | — |
| | 1,337.9 |
|
| Changes in fair value of cash flow hedges, net of tax | — |
| | — |
| | — |
| | — |
| | — |
| | — |
| | — |
| | — |
| | — |
| | 0.9 |
| | — |
| | 0.0 |
| | 0.9 |
|
| Reclassification of unrealized gains on cash flow hedges to net income, net of tax | — |
| | — |
| | — |
| | — |
| | — |
| | — |
| | — |
| | — |
| | — |
| | 2.5 |
| | — |
| | (0.1 | ) | | 2.4 |
|
| Foreign currency translation adjustment, net of tax | — |
| | — |
| | — |
| | — |
| | — |
| | — |
| | — |
| | — |
| | — |
| | (1,046.2 | ) | | — |
| | (32.7 | ) | | (1,078.9 | ) |
| Contributions from noncontrolling interest | — |
| | — |
| | — |
| | — |
| | — |
| | — |
| | — |
| | — |
| | — |
| | — |
| | — |
| | 8.1 |
| | 8.1 |
|
| Distributions to noncontrolling interest | — |
| | — |
| | — |
| | — |
| | — |
| | — |
| | — |
| | — |
| | — |
| | — |
| | — |
| | (0.9 | ) | | (0.9 | ) |
| Common stock distributions declared | — |
| | — |
| | — |
| | — |
| | — |
| | — |
| | — |
| | — |
| | — |
| | — |
| | (769.5 | ) | | — |
| | (769.5 | ) |
| Preferred stock dividends declared | — |
| | — |
| | — |
| | — |
| | — |
| | — |
| | — |
| | — |
| | — |
| | — |
| | (76.8 | ) | | — |
| | (76.8 | ) |
| Net income (loss) | — |
| | — |
| | — |
| | — |
| | — |
| | — |
| | — |
| | — |
| | — |
| | — |
| | 685.1 |
| | (13.1 | ) | | 672.0 |
|
| BALANCE, DECEMBER 31, 2015 | 6,000 |
| | $ | 0.1 |
| | 1,375 |
| $ | 0.0 |
| | 426,695 |
| | $ | 4.3 |
| | (2,810 | ) | | $ | (207.7 | ) | | $ | 9,690.6 |
| | $ | (1,837.0 | ) | | $ | (998.5 | ) | | $ | 61.0 |
| | $ | 6,712.8 |
|
| Stock-based compensation related activity | — |
| | — |
| | — |
| | — |
| | 1,959 |
| | 0.0 |
| | — |
| | — |
| | 155.1 |
| | — |
| | — |
| | — |
| | 155.1 |
|
| Issuance of common stock- stock purchase plan | — |
| | — |
| | — |
| | — |
| | 88 |
| | 0.0 |
| | — |
| | — |
| | 7.5 |
| | — |
| | — |
| | — |
| | 7.5 |
|
| Issuance of common stock | — |
| | — |
| | — |
| | — |
| | 1,171 |
| | 0.0 |
| | — |
| | — |
| | 120.8 |
| | — |
| | — |
| | — |
| | 120.8 |
|
| Changes in fair value of cash flow hedges, net of tax | — |
| | — |
| | — |
| | — |
| | — |
| | — |
| | — |
| | — |
| | — |
| | (0.4 | ) | | — |
| | — |
| | (0.4 | ) |
| Reclassification of unrealized gains on cash flow hedges to net income | — |
| | — |
| | — |
| | — |
| | — |
| | — |
| | — |
| | — |
| | — |
| | (0.3 | ) | | — |
| | — |
| | (0.3 | ) |
| Foreign currency translation adjustment, net of tax | — |
| | — |
| | — |
| | — |
| | — |
| | — |
| | — |
| | — |
| | — |
| | (170.7 | ) | | — |
| | (8.7 | ) | | (179.4 | ) |
| Contributions from noncontrolling interest holders | — |
| | — |
| | — |
| | — |
| | — |
| | — |
| | — |
| | — |
| | 69.5 |
| | 9.1 |
| | — |
| | 160.9 |
| | 239.5 |
|
| Distributions to noncontrolling interest holders | — |
| | — |
| | — |
| | — |
| | — |
| | — |
| | — |
| | — |
| | — |
| | — |
| | — |
| | (1.0 | ) | | (1.0 | ) |
| Common stock distributions declared | — |
| | — |
| | — |
| | — |
| | — |
| | — |
| | — |
| | — |
| | — |
| | — |
| | (927.8 | ) | | — |
| | (927.8 | ) |
| Preferred stock dividends declared | — |
| | — |
| | — |
| | — |
| | — |
| | — |
| | — |
| | — |
| | — |
| | — |
| | (107.1 | ) | | — |
| | (107.1 | ) |
| Net income | — |
| | — |
| | — |
| | — |
| | — |
| | — |
| | — |
| | — |
| | — |
| | — |
| | 956.4 |
| | 0.1 |
| | 956.5 |
|
| BALANCE, DECEMBER 31, 2016 | 6,000 |
| | $ | 0.1 |
| | 1,375 |
| $ | 0.0 |
| | 429,913 |
| | $ | 4.3 |
| | (2,810 | ) | | $ | (207.7 | ) | | $ | 10,043.5 |
| | $ | (1,999.3 | ) | | $ | (1,077.0 | ) | | $ | 212.3 |
| | $ | 6,976.2 |
|
| Stock-based compensation related activity | — |
| | — |
| | — |
| | — |
| | 2,121 |
| | 0.0 |
| | — |
| | — |
| | 195.0 |
| | — |
| | — |
| | — |
| | 195.0 |
|
| Issuance of common stock—stock purchase plan | — |
| | — |
| | — |
| | — |
| | 93 |
| | 0.0 |
| | — |
| | — |
| | 9.0 |
| | — |
| | — |
| | — |
| | 9.0 |
|
| Conversion of preferred stock | (6,000 | ) | | (0.1 | ) | | 0 |
| | 0.0 |
| | 5,602 |
| | 0.1 |
| | — |
| | — |
| | 0.0 |
| | — |
| | — |
| | — |
| | 0.0 |
|
| Treasury stock activity | — |
| | — |
| | — |
| | — |
| | — |
| | — |
| | (6,099 | ) | | (766.3 | ) | | — |
| | — |
| | — |
| | — |
| | (766.3 | ) |
| Changes in fair value of cash flow hedges, net of tax | — |
| | — |
| | — |
| | — |
| | — |
| | — |
| | — |
| | — |
| | — |
| | (0.4 | ) | | — |
| | — |
| | (0.4 | ) |
| Reclassification of unrealized gains on cash flow hedges to net income | — |
| | — |
| | — |
| | — |
| | — |
| | — |
| | — |
| | — |
| | — |
| | (0.1 | ) | | — |
| | — |
| | (0.1 | ) |
| Foreign currency translation adjustment, net of tax | — |
| | — |
| | — |
| | — |
| | — |
| | — |
| | — |
| | — |
| | — |
| | 21.5 |
| | — |
| | 54.6 |
| | 76.1 |
|
| Contributions from noncontrolling interest holders | — |
| | — |
| | — |
| | — |
| | — |
| | — |
| | — |
| | — |
| | — |
| | — |
| | — |
| | 314.1 |
| | 314.1 |
|
| Distributions to noncontrolling interest holders | — |
| | — |
| | — |
| | — |
| | — |
| | — |
| | — |
| | — |
| | — |
| | — |
| | — |
| | (14.3 | ) | | (14.3 | ) |
| Common stock distributions declared | — |
| | — |
| | — |
| | — |
| | — |
| | — |
| | — |
| | — |
| | — |
| | — |
| | (1,128.6 | ) | | — |
| | (1,128.6 | ) |
| Preferred stock dividends declared | — |
| | — |
| | — |
| | — |
| | — |
| | — |
| | — |
| | — |
| | — |
| | — |
| | (91.4 | ) | | — |
| | (91.4 | ) |
| Net income | — |
| | — |
| | — |
| | — |
| | — |
| | — |
| | — |
| | — |
| | — |
| | — |
| | 1,238.9 |
| | 19.9 |
| | 1,258.8 |
|
| BALANCE, DECEMBER 31, 2017 | — |
| | $ | — |
| | 1,375 |
| $ | 0.0 |
| | 437,729 |
| | $ | 4.4 |
| | (8,909 | ) | | $ | (974.0 | ) | | $ | 10,247.5 |
| | $ | (1,978.3 | ) | | $ | (1,058.1 | ) | | $ | 586.6 |
| | $ | 6,828.1 |
|
See accompanying notes to consolidated financial statements.
AMERICAN TOWER CORPORATION AND SUBSIDIARIES
CONSOLIDATED STATEMENTS OF CASH FLOWS
|
| | | | | | | | | | | | |
| | | Year Ended December 31, |
| | | 2017 | | 2016 | | 2015 |
| CASH FLOWS FROM OPERATING ACTIVITIES | | | | | | |
| Net income | | $ | 1,225.4 |
| | $ | 970.4 |
| | $ | 672.0 |
|
| Adjustments to reconcile net income to cash provided by operating activities: | | | | | | |
| Depreciation, amortization and accretion | | 1,715.9 |
| | 1,525.6 |
| | 1,285.3 |
|
| Stock-based compensation expense | | 108.5 |
| | 89.9 |
| | 90.5 |
|
| (Gain) loss on investments, unrealized foreign currency loss and other non-cash expense | | (18.0 | ) | | 127.4 |
| | 146.2 |
|
| Impairments, net loss on sale of long-lived assets, non-cash restructuring and merger related expenses | | 242.4 |
| | 50.7 |
| | 29.9 |
|
| Loss (gain) on early retirement of long-term obligations | | 70.2 |
| | (1.2 | ) | | 79.8 |
|
| Amortization of deferred financing costs, debt discounts and premiums and other non-cash interest | | 20.0 |
| | 17.7 |
| | 6.9 |
|
| Deferred income taxes | | (86.6 | ) | | 27.0 |
| | 7.8 |
|
| Changes in assets and liabilities, net of acquisitions: | | | | | | |
| Accounts receivable | | (191.1 | ) | | 11.4 |
| | (56.3 | ) |
| Prepaid and other assets | | (179.9 | ) | | (80.0 | ) | | (91.1 | ) |
| Deferred rent asset | | (194.4 | ) | | (131.7 | ) | | (155.0 | ) |
| Accounts payable and accrued expenses | | 95.8 |
| | (42.9 | ) | | 95.9 |
|
| Accrued interest | | 9.2 |
| | 34.4 |
| | (15.6 | ) |
| Unearned revenue | | 59.3 |
| | 16.6 |
| | 12.9 |
|
| Deferred rent liability | | 62.3 |
| | 67.8 |
| | 56.1 |
|
| Other non-current liabilities | | (13.4 | ) | | 18.6 |
| | 1.6 |
|
| Cash provided by operating activities | | 2,925.6 |
| | 2,701.7 |
| | 2,166.9 |
|
| CASH FLOWS FROM INVESTING ACTIVITIES | | | | | | |
| Payments for purchase of property and equipment and construction activities | | (803.6 | ) | | (682.5 | ) | | (728.8 | ) |
| Payments for acquisitions, net of cash acquired | | (2,007.0 | ) | | (1,411.3 | ) | | (1,961.1 | ) |
| Payment for Verizon transaction | | — |
| | (4.7 | ) | | (5,059.5 | ) |
| Proceeds from sales of short-term investments and other non-current assets | | 14.7 |
| | 13.1 |
| | 1,032.3 |
|
| Payments for short-term investments | | — |
| | (0.8 | ) | | (1,022.8 | ) |
| Deposits and other | | (5.0 | ) | | (16.1 | ) | | (1.8 | ) |
| Cash used for investing activities | | (2,800.9 | ) | | (2,102.3 | ) | | (7,741.7 | ) |
| CASH FLOWS FROM FINANCING ACTIVITIES | | | | | | |
| Proceeds from short-term borrowings, net | | — |
| | — |
| | 9.0 |
|
| Borrowings under credit facilities | | 5,359.4 |
| | 2,446.8 |
| | 6,126.6 |
|
| Proceeds from issuance of senior notes, net | | 2,674.0 |
| | 3,236.4 |
| | 1,492.3 |
|
| Proceeds from term loan | | — |
| | — |
| | 500.0 |
|
| Proceeds from other borrowings | | — |
| | — |
| | 54.5 |
|
| Proceeds from issuance of securities in securitization transaction | | — |
| | — |
| | 875.0 |
|
| Repayments of notes payable, credit facilities, term loan, senior notes and capital leases | | (6,484.4 | ) | | (5,093.7 | ) | | (6,393.4 | ) |
| Contributions from noncontrolling interest holders, net | | 264.3 |
| | 238.5 |
| | 7.2 |
|
| Purchases of common stock | | (766.3 | ) | | — |
| | — |
|
| Proceeds from stock options and stock purchase plan | | 119.7 |
| | 92.5 |
| | 50.7 |
|
| Distributions paid on common stock | | (1,073.0 | ) | | (886.1 | ) | | (710.9 | ) |
| Distributions paid on preferred stock | | (91.4 | ) | | (107.1 | ) | | (84.6 | ) |
| Proceeds from the issuance of common stock, net | | — |
| | — |
| | 2,440.3 |
|
| Proceeds from the issuance of preferred stock, net | | — |
| | — |
| | 1,337.9 |
|
| Payment for early retirement of long-term obligations | | (75.3 | ) | | (0.1 | ) | | (85.7 | ) |
| Deferred financing costs and other financing activities | | (40.0 | ) | | (26.5 | ) | | (25.8 | ) |
| Cash (used for) provided by financing activities | | (113.0 | ) | | (99.3 | ) | | 5,593.1 |
|
| Net effect of changes in foreign currency exchange rates on cash and cash equivalents, and restricted cash | | 6.7 |
| | (26.5 | ) | | (29.1 | ) |
| NET INCREASE (DECREASE) IN CASH AND CASH EQUIVALENTS, AND RESTRICTED CASH | | 18.4 |
| | 473.6 |
| | (10.8 | ) |
| CASH AND CASH EQUIVALENTS, AND RESTRICTED CASH, BEGINNING OF YEAR | | 936.5 |
| | 462.9 |
| | 473.7 |
|
| CASH AND CASH EQUIVALENTS, AND RESTRICTED CASH, END OF YEAR | | $ | 954.9 |
| | $ | 936.5 |
| | $ | 462.9 |
|
See accompanying notes to consolidated financial statements.
AMERICAN TOWER CORPORATION AND SUBSIDIARIES
NOTES TO CONSOLIDATED FINANCIAL STATEMENTS
(Tabular amounts in millions, unless otherwise disclosed)
1. BUSINESS AND SUMMARY OF SIGNIFICANT ACCOUNTING POLICIES
Business—American Tower Corporation (together with its subsidiaries, “ATC” or the “Company”) is one of the largest global real estate investment trusts and a leading independent owner, operator and developer of multitenant communications real estate. The Company’s primary business is the leasing of space on communications sites to wireless service providers, radio and television broadcast companies, wireless data providers, government agencies and municipalities and tenants in a number of other industries. The Company refers to this business as its property operations. Additionally, the Company offers tower-related services in the United States, which the Company refers to as its services operations. These services include site acquisition, zoning and permitting and structural analysis, which primarily support the Company’s site leasing business, including the addition of new tenants and equipment on its sites.
The Company’s portfolio primarily consists of towers that it owns and towers that it operates pursuant to long-term lease arrangements, as well as distributed antenna system (“DAS”) networks, which provide seamless coverage solutions in certain in-building and certain outdoor wireless environments. In addition to the communications sites in its portfolio, the Company manages rooftop and tower sites for property owners under various contractual arrangements. The Company also holds other telecommunications infrastructure, including fiber, concrete poles and other assets, and property interests that it leases to communications service providers and third-party tower operators.
American Tower Corporation is a holding company that conducts its operations through its directly and indirectly owned subsidiaries and its joint ventures. ATC’s principal domestic operating subsidiaries are American Towers LLC and SpectraSite Communications, LLC. ATC conducts its international operations primarily through its subsidiary, American Tower International, Inc., which in turn conducts operations through its various international holding and operating subsidiaries and joint ventures.
The Company operates as a real estate investment trust for U.S. federal income tax purposes (“REIT”). Accordingly, the Company generally is not subject to U.S. federal income taxes on income generated by its REIT operations, including the income derived from leasing space on its towers, as it receives a dividends paid deduction for distributions to stockholders that generally offsets its REIT income and gains. However, the Company remains obligated to pay U.S. federal income taxes on earnings from its domestic taxable REIT subsidiaries (“TRSs”). In addition, the Company’s international assets and operations, regardless of their classification for U.S. tax purposes, continue to be subject to taxation in the foreign jurisdictions where those assets are held or those operations are conducted.
The use of TRSs enables the Company to continue to engage in certain businesses while complying with REIT qualification requirements. The Company may, from time to time, change the election of previously designated TRSs to be included as part of the REIT. As of December 31, 2017, the Company’s REIT qualified businesses included its U.S. tower leasing business, most of its operations in Costa Rica and Mexico, a majority of its operations in Germany and a majority of its indoor DAS networks business and services segment. As of January 2018, the Company’s operations in Nigeria became part of the REIT.
Principles of Consolidation and Basis of Presentation—The accompanying consolidated and condensed consolidated financial statements include the accounts of the Company and those entities in which it has a controlling interest. Investments in entities that the Company does not control are accounted for using the equity or cost method, depending upon the Company’s ability to exercise significant influence over operating and financial policies. All intercompany accounts and transactions have been eliminated. As of December 31, 2017, the Company holds (i) a 51% controlling interest, and MTN Group Limited holds a 49% noncontrolling interest, in each of two joint ventures, one in Ghana and one in Uganda, (ii) a 51% controlling interest, and PGGM holds a 49% noncontrolling interest, in a joint venture (“ATC Europe”) comprised primarily of the Company’s operations in Germany and France, (iii) an approximate 75% controlling interest, and the South African investors hold an approximate 25% noncontrolling interest, in a subsidiary of the Company in South Africa and (iv) a 51% controlling interest in ATC Telecom Infrastructure Private Limited (“ATC TIPL”), formerly Viom Networks Limited (“Viom”), in India.
Significant Accounting Policies and Use of Estimates—The preparation of financial statements in conformity with accounting principles generally accepted in the United States (“GAAP”) requires management to make estimates and assumptions that affect the amounts reported in the consolidated financial statements and accompanying notes. Actual results may differ from those estimates, and such differences could be material to the accompanying consolidated financial statements. The significant estimates in the accompanying consolidated financial statements include impairment of long-lived assets (including goodwill), asset retirement obligations, revenue recognition, rent expense, income taxes and accounting for business combinations and acquisitions of assets. The Company considers events or transactions that occur after the balance sheet date but before the
AMERICAN TOWER CORPORATION AND SUBSIDIARIES
NOTES TO CONSOLIDATED FINANCIAL STATEMENTS
(Tabular amounts in millions, unless otherwise disclosed)
financial statements are issued as additional evidence for certain estimates or to identify matters that require additional disclosure.
Changes to Prior Year Amounts—The Company has converted its disclosure from thousands to millions and, as a result, any necessary rounding adjustments have been made to prior year disclosed amounts.
Accounts Receivable and Deferred Rent Asset—The Company derives the largest portion of its revenues, corresponding accounts receivable and the related deferred rent asset from a relatively small number of tenants in the telecommunications industry, and 53% of its current year revenues are derived from four tenants.
The Company’s deferred rent asset is associated with non-cancellable tenant leases that contain fixed escalation clauses over the terms of the applicable lease in which revenue is recognized on a straight-line basis over the lease term.
The Company mitigates its concentrations of credit risk with respect to notes and trade receivables and the related deferred rent assets by actively monitoring the creditworthiness of its borrowers and tenants. In recognizing tenant revenue, the Company assesses the collectibility of both the amounts billed and the portion recognized in advance of billing on a straight-line basis. This assessment takes tenant credit risk and business and industry conditions into consideration to ultimately determine the collectibility of the amounts billed. To the extent the amounts, based on management’s estimates, may not be collectible, recognition is deferred until such point as collectibility is determined to be reasonably assured. Any amounts that were previously recognized as revenue and subsequently determined to be uncollectible are charged to bad debt expense included in Selling, general, administrative and development expense in the accompanying consolidated statements of operations.
Accounts receivable is reported net of allowances for doubtful accounts related to estimated losses resulting from a tenant’s inability to make required payments and allowances for amounts invoiced whose collectibility is not reasonably assured. These allowances are generally estimated based on payment patterns, days past due and collection history, and incorporate changes in economic conditions that may not be reflected in historical trends, such as tenants in bankruptcy, liquidation or reorganization. Receivables are written-off against the allowances when they are determined to be uncollectible. Such determination includes analysis and consideration of the particular conditions of the account. Changes in the allowances were as follows:
|
| | | | | | | | | | | |
| | Year Ended December 31, |
| | 2017 | | 2016 | | 2015 |
| Balance as of January 1, | $ | 45.9 |
| | $ | 23.1 |
| | $ | 17.3 |
|
| Current year increases | 87.2 |
| | 50.0 |
| | 19.9 |
|
| Write-offs, recoveries and other (1) | (2.1 | ) | | (27.2 | ) | | (14.1 | ) |
| Balance as of December 31, | $ | 131.0 |
| | $ | 45.9 |
| | $ | 23.1 |
|
_______________
| |
| (1) | Recoveries includes recognition of revenue resulting from collections of previously reserved amounts. |
Functional Currency—The functional currency of each of the Company’s foreign operating subsidiaries is the respective local currency, except for Costa Rica, where the functional currency is the U.S. Dollar. All foreign currency assets and liabilities held by the subsidiaries are translated into U.S. Dollars at the exchange rate in effect at the end of the applicable fiscal reporting period and all foreign currency revenues and expenses are translated at the average monthly exchange rates. Translation adjustments are reflected in equity as a component of Accumulated Other Comprehensive Income Loss (“AOCL”) in the consolidated balance sheets and included as a component of Comprehensive income (loss) in the consolidated statements of comprehensive income (loss).
Gains and losses on foreign currency transactions are reflected in Other expense in the consolidated statements of operations. However, the effect from fluctuations in foreign currency exchange rates on intercompany debt that for which repayment is not anticipated in the foreseeable future is reflected in AOCL in the consolidated balance sheets and included as a component of comprehensive income (loss). During the year ended December 31, 2017, the Company recorded net foreign currency losses of $25.1 million, of which $51.6 million was recorded in AOCL and $(26.5) million was recorded in Other expense.
Cash and Cash Equivalents—Cash and cash equivalents include cash on hand, demand deposits and short-term investments with original maturities of three months or less. The Company maintains its deposits at high quality financial institutions and monitors the credit ratings of those institutions.
Restricted Cash—Restricted cash includes cash pledged as collateral to secure obligations and all cash whose use is otherwise limited by contractual provisions.
AMERICAN TOWER CORPORATION AND SUBSIDIARIES
NOTES TO CONSOLIDATED FINANCIAL STATEMENTS
(Tabular amounts in millions, unless otherwise disclosed)
The reconciliation of cash and cash equivalents, and restricted cash reported within the statement of financial position that sum to the total of the same such amounts shown in the statement of cash flows is as follows:
|
| | | | | | | | | | | |
| | Year Ended December 31, |
| | 2017 | | 2016 | | 2015 |
| Cash and cash equivalents | $ | 802.1 |
| | $ | 787.2 |
| | $ | 320.7 |
|
| Restricted cash | 152.8 |
| | 149.3 |
| | 142.2 |
|
| Total cash, cash equivalents and restricted cash | $ | 954.9 |
| | $ | 936.5 |
| | $ | 462.9 |
|
Short-Term Investments—Short-term investments consists of highly liquid investments with original maturities in excess of three months.
Property and Equipment—Property and equipment is recorded at cost or, in the case of acquired properties at estimated fair value on the date acquired. Cost for self-constructed towers includes direct materials and labor, capitalized interest and certain indirect costs associated with construction of the tower, such as transportation costs, employee benefits and payroll taxes. The Company begins the capitalization of costs during the pre-construction period, which is the period during which costs are incurred to evaluate the site, and continues to capitalize costs until the tower is substantially completed and ready for occupancy by a tenant. Labor and related costs capitalized for the years ended December 31, 2017, 2016 and 2015 were $50.9 million, $47.7 million and $44.7 million, respectively. Capitalized interest costs were not material for the years ended December 31, 2017, 2016 and 2015.
Expenditures for repairs and maintenance are expensed as incurred. Augmentation and improvements that extend an asset’s useful life or enhance capacity are capitalized.
Depreciation expense is recorded using the straight-line method over the assets’ estimated useful lives. Towers and related assets on leased land are depreciated over the shorter of the estimated useful life of the asset or the term of the corresponding ground lease, taking into consideration lease renewal options and residual value.
Towers or assets acquired through capital leases are recorded net at the present value of future minimum lease payments or the fair value of the leased asset at the inception of the lease. Property and equipment and assets held under capital leases are amortized over the shorter of the applicable lease term or the estimated useful life of the respective assets for periods generally not exceeding twenty years.
The Company reviews its tower portfolio for indicators of impairment on an individual tower basis. Impairments primarily result from a tower not having current tenant leases or from having expenses in excess of revenues. The Company reviews other long-lived assets for impairment whenever events, changes in circumstances or other evidence indicate that the carrying amount of the Company’s assets may not be recoverable. The Company records impairment charges in Other operating expenses in the consolidated statements of operations in the period in which the Company identifies such impairment.
Goodwill and Other Intangible Assets—The Company reviews goodwill for impairment at least annually (as of December 31) or whenever events or circumstances indicate the carrying value of an asset may not be recoverable.
Goodwill is recorded in the applicable segment and assessed for impairment at the reporting unit level. The Company utilizes the two-step impairment test and employs a discounted cash flow analysis when testing goodwill for impairment. The key assumptions utilized in the discounted cash flow analysis include current operating performance, terminal sales growth rate, management’s expectations of future operating results and cash requirements, the current weighted average cost of capital and an expected tax rate. Under the first step of the test, the Company compares the fair value of the reporting unit, as calculated under an income approach using future discounted cash flows, to the carrying amount of the applicable reporting unit. If the carrying amount exceeds the fair value, the Company conducts the second step of this test, in which the implied fair value of the applicable reporting unit’s goodwill is compared to the carrying amount of that goodwill. If the carrying amount of goodwill exceeds its implied fair value, an impairment loss would be recognized for the amount of the excess.
During the years ended December 31, 2017, 2016 and 2015, no potential impairment was identified under the first step of the test, as the fair value of each of the reporting units was in excess of its carrying amount.
Intangible assets that are separable from goodwill and are deemed to have a definite life are amortized over their useful lives, generally ranging from three to twenty years and are evaluated separately for impairment at least annually or whenever events or circumstances indicate that the carrying amount of an asset may not be recoverable.
AMERICAN TOWER CORPORATION AND SUBSIDIARIES
NOTES TO CONSOLIDATED FINANCIAL STATEMENTS
(Tabular amounts in millions, unless otherwise disclosed)
The Company reviews its network location intangible assets for indicators of impairment on an individual tower basis. Impairments primarily result from a tower not having current tenant leases or from having expenses in excess of revenues. The Company monitors its tenant-related intangible assets on a tenant by tenant basis for indicators of impairment, such as high levels of turnover or attrition, non-renewal of a significant number of contracts or the cancellation or termination of a relationship. The Company assesses recoverability by determining whether the carrying amount of the related assets will be recovered primarily through projected undiscounted future cash flows. If the Company determines that the carrying amount of an asset may not be recoverable, the Company measures any impairment loss based on the projected future discounted cash flows to be provided from the asset or available market information relative to the asset’s fair value, as compared to the asset’s carrying amount. The Company records impairment charges in Other operating expenses in the consolidated statements of operations in the period in which the Company identifies such impairment.
Derivative Financial Instruments—Derivatives are recorded on the consolidated balance sheet at fair value. If a derivative is designated as a cash flow hedge, the effective portions of changes in the fair value of the derivative are recorded in AOCL, as well as a component of comprehensive income (loss), and are recognized in the results of operations when the hedged item affects earnings. Changes in fair value of the ineffective portions of cash flow hedges are recognized in the results of operations. For derivative instruments that are designated and qualify as fair value hedges, changes in value of the derivatives are recorded in Other expense in the consolidated statements of operations in the current period, along with the offsetting gain or loss on the hedged item attributable to the hedged risk. For derivative instruments not designated as hedging instruments, changes in fair value are recognized in the results of operations in the period that the change occurs.
The primary risks managed through the use of derivative instruments is interest rate risk, exposure to changes in the fair value of debt attributable to interest rate risk and currency risk. From time to time, the Company enters into interest rate swap agreements or foreign currency contracts to manage exposure to these risks. Under these agreements, the Company is exposed to counterparty credit risk to the extent that a counterparty fails to meet the terms of a contract. The Company’s exposure is limited to the current value of the contract at the time the counterparty fails to perform. The Company assesses, both at the inception of the hedge and on an ongoing basis, whether the derivatives that are used in hedging transactions are highly effective in offsetting changes in cash flows or fair values of hedged items. The Company does not hold derivatives for trading purposes.
Fair Value Measurements—The Company determines the fair value of its financial instruments based on the fair value hierarchy, which requires an entity to maximize the use of observable inputs and minimize the use of unobservable inputs when measuring fair value.
Asset Retirement Obligations—When required, the Company recognizes the fair value of obligations to remove its tower assets and remediate the leased land upon which certain of its tower assets are located. Generally, the associated retirement costs are capitalized as part of the carrying amount of the related tower assets and depreciated over their estimated useful lives and the liability is accreted through the obligation’s estimated settlement date. Fair value estimates of asset retirement obligations generally involve discounting of estimated future cash flows associated with takedown costs. Periodic accretion of such liabilities due to the passage of time is included in Depreciation, amortization and accretion expense in the consolidated statements of operations. Adjustments are also made to the asset retirement obligation liability to reflect changes in the estimates of timing and amount of expected cash flows, with an offsetting adjustment made to the related long-lived tangible asset. The significant assumptions used in estimating the Company’s aggregate asset retirement obligation are: timing of tower removals; cost of tower removals; timing and number of land lease renewals; expected inflation rates; and credit-adjusted, risk-free interest rates that approximate the Company’s incremental borrowing rate.
Income Taxes—As a REIT, the Company generally is not subject to U.S. federal income taxes on income generated by its U.S. REIT operations. However, the Company remains obligated to pay U.S. federal income taxes on certain earnings and continues to be subject to taxation in its foreign jurisdictions. Accordingly, the consolidated financial statements reflect provisions for federal, state, local and foreign income taxes. The Company recognizes deferred tax assets and liabilities for the future tax consequences attributable to differences between the financial statement carrying amounts of existing assets and liabilities and their respective tax basis, as well as operating loss and tax credit carryforwards. The Company measures deferred tax assets and liabilities using enacted tax rates expected to apply to taxable income in the years in which those temporary differences and carryforwards are expected to be recovered or settled. The effect on deferred tax assets and liabilities as a result of a change in tax rates is recognized in income in the period that includes the enactment date.
The Company periodically reviews its deferred tax assets, and provides valuation allowances if, based on the available evidence, it is more likely than not that some or all of the deferred tax assets will not be realized. Management assesses the available positive and negative evidence to estimate if sufficient future taxable income will be generated to use the existing
AMERICAN TOWER CORPORATION AND SUBSIDIARIES
NOTES TO CONSOLIDATED FINANCIAL STATEMENTS
(Tabular amounts in millions, unless otherwise disclosed)
deferred tax assets. Valuation allowances would be reversed as a reduction to the provision for income taxes if related deferred tax assets are deemed realizable based on changes in facts and circumstances relevant to the assets’ recoverability.
The Company classifies uncertain tax positions as non-current income tax liabilities unless expected to be paid within one year. The Company reports penalties and tax-related interest expense as a component of the income tax provision and interest income from tax refunds as a component of Other expense in the consolidated statements of operations.
Other Comprehensive Income (Loss)—Other comprehensive income (loss) refers to items excluded from net income that are recorded as an adjustment to equity, net of tax. The Company’s other comprehensive income (loss) primarily consisted of changes in fair value of effective derivative cash flow hedges, foreign currency translation adjustments and reclassification of unrealized losses on effective derivative cash flow hedges. The AOCL balance included foreign currency translation losses of $2.0 billion, $2.0 billion and $1.8 billion for the years ended December 31, 2017, 2016 and 2015, respectively.
Distributions—As a REIT, the Company must annually distribute to its stockholders an amount equal to at least 90% of its REIT taxable income (determined before the deduction for distributed earnings and excluding any net capital gain). Generally, the Company has distributed, and expects to continue to distribute, all or substantially all of its REIT taxable income after taking into consideration its utilization of net operating losses (“NOLs”).
The amount, timing and frequency of future distributions will be at the sole discretion of the Board of Directors and will depend upon various factors, a number of which may be beyond the Company’s control, including the Company’s financial condition and operating cash flows, the amount required to maintain its qualification for taxation as a REIT and reduce any income and excise taxes that the Company otherwise would be required to pay, limitations on distributions in the Company’s existing and future debt and preferred equity instruments, the Company’s ability to utilize NOLs to offset the Company’s distribution requirements, limitations on its ability to fund distributions using cash generated through its TRSs and other factors that the Board of Directors may deem relevant.
Acquisitions—For acquisitions that meet the definition of a business combination, the Company applies the acquisition method of accounting where assets acquired and liabilities assumed are recorded at fair value at the date of each acquisition, and the results of operations are included with those of the Company from the dates of the respective acquisitions. Any excess of the purchase price paid by the Company over the amounts recognized for assets acquired and liabilities assumed is recorded as goodwill. The Company continues to evaluate acquisitions for a period not to exceed one year after the applicable acquisition date of each transaction to determine whether any additional adjustments are needed to the allocation of the purchase price paid for the assets acquired and liabilities assumed. All other acquisitions are accounted for as asset acquisitions and the purchase price is allocated to the net assets acquired with no recognition of goodwill. The purchase price is not subsequently adjusted.
The fair value of the assets acquired and liabilities assumed is typically determined by using either estimates of replacement costs or discounted cash flow valuation methods. When determining the fair value of tangible assets acquired, the Company must estimate the cost to replace the asset with a new asset taking into consideration such factors as age, condition and the economic useful life of the asset. When determining the fair value of intangible assets acquired and liabilities assumed, the Company must estimate the applicable discount rate and the timing and amount of future tenant cash flows, including rate and terms of renewal and attrition.
Revenue Recognition—The Company’s revenue from leasing and similar arrangements, including fixed escalation clauses present in non-cancellable agreements, is reported on a straight-line basis over the term of the respective agreements when collectibility is reasonably assured. Escalation clauses tied to the Consumer Price Index (“CPI”) or other inflation-based indices, and other incentives present in agreements with the Company’s tenants are excluded from the straight-line calculation. Total property straight-line revenues for the years ended December 31, 2017, 2016 and 2015 were $194.4 million, $131.7 million and $155.0 million, respectively. Amounts billed upfront in connection with the execution of lease and other agreements are initially deferred and reflected in Unearned revenue in the accompanying consolidated balance sheets and recognized as revenue over the terms of the applicable agreements. Amounts billed or received for services prior to being earned are deferred and reflected in Unearned revenue in the accompanying consolidated balance sheets until the criteria for recognition have been met.
Services revenues are derived under contracts or arrangements with customers that provide for billings either on a fixed price basis or a variable price basis, which includes factors such as time and expenses. Revenues are recognized as or when services are performed, and may include estimates for percentage completed. Amounts billed or received for services prior to being earned are deferred and reflected in Unearned revenue in the accompanying consolidated balance sheets until the criteria for recognition have been met.
AMERICAN TOWER CORPORATION AND SUBSIDIARIES
NOTES TO CONSOLIDATED FINANCIAL STATEMENTS
(Tabular amounts in millions, unless otherwise disclosed)
Rent Expense—Many of the leases underlying the Company’s tower sites have fixed rent escalations, which provide for periodic increases in the amount of ground rent payable by the Company over time. In addition, certain of the Company’s tenant leases require the Company to exercise available renewal options pursuant to the underlying ground lease if the tenant exercises its renewal option. The Company calculates straight-line ground rent expense for these leases based on the fixed non-cancellable term of the underlying ground lease plus all periods, if any, for which failure to renew the lease imposes an economic penalty to the Company such that renewal appears to be reasonably assured.
Total property straight-line ground rent expense for the years ended December 31, 2017, 2016 and 2015 was $62.3 million, $67.8 million and $56.1 million, respectively. The Company records a liability for straight-line ground rent expense in Other non-current liabilities. The Company records prepaid ground rent in Prepaid and other current assets and Notes receivable and other non-current assets in the accompanying consolidated balance sheets according to the anticipated period of benefit.
Selling, General, Administrative and Development Expense—Selling, general and administrative expense consists of overhead expenses related to the Company’s property and services operations and corporate overhead costs not specifically allocable to any of the Company’s individual business operations. Development expense consists of costs related to the Company’s acquisition efforts, costs associated with new business initiatives and project cancellation costs.
Stock-Based Compensation—Stock-based compensation expense is measured at the accounting measurement date based on the fair value of the award and is generally recognized as an expense over the service period, which typically represents the vesting period. The Company provides for accelerated vesting and extended exercise periods of stock options and restricted stock units upon an employee’s death or permanent disability, or upon an employee’s qualified retirement, provided certain eligibility criteria are met. Accordingly, the Company recognizes compensation expense for stock options and time-based restricted stock units (“RSUs”) over the shorter of (i) the four-year vesting period or (ii) the period from the date of grant to the date the employee becomes eligible for such retirement benefits, which may occur upon grant. The expense recognized includes the impact of forfeitures as they occur.
In March 2015, 2016 and 2017, the Company granted performance-based restricted stock units (“PSUs”) to its executive officers. Threshold, target and maximum parameters were established for the metrics for each year in the three-year performance period for the March 2015 grants, and for a three-year performance period for the March 2016 and 2017 grants. The metrics will be used to calculate the number of shares that will be issuable when the awards vest, which may range from zero to 200% of the target amounts. The Company recognizes compensation expense for PSUs over the three-year vesting period, subject to adjustment based on the date the employee becomes eligible for retirement benefits as well as performance relative to grant parameters.
The fair value of stock options is determined using the Black-Scholes option-pricing model and the fair value of RSUs and PSUs is based on the fair value of the Company’s common stock on the date of grant. The Company recognizes all stock-based compensation expense in either Selling, general, administrative and development expense, costs of operations or as part of the costs associated with the construction of the tower assets.
In connection with the vesting of RSUs, the Company withholds from issuance a number of shares of common stock to satisfy certain employee tax withholding obligations arising from such vesting. The shares withheld are considered constructively retired. The Company recognizes the fair value of the shares withheld in Additional paid-in capital on the consolidated balance sheets. As of December 31, 2017, the Company has withheld from issuance an aggregate of 1,442,506 shares, including 222,751 shares related to the vesting of RSUs during the year ended December 31, 2017.
Litigation Costs—The Company periodically becomes involved in various claims and lawsuits that are incidental to its business. The Company regularly monitors the status of pending legal actions to evaluate both the magnitude and likelihood of any potential loss. The Company accrues for these potential losses when it is probable that a liability has been incurred and the amount of loss, or possible range of loss, can be reasonably estimated. Should the ultimate losses on contingencies or litigation vary from estimates, adjustments to those liabilities may be required. The Company also incurs legal costs in connection with these matters and records estimates of these expenses, which are reflected in Selling, general, administrative and development expense in the accompanying consolidated statements of operations.
Earnings Per Common Share—Basic and Diluted—Basic net income per common share represents net income attributable to American Tower Corporation common stockholders divided by the weighted average number of common shares outstanding during the period. Diluted net income per common share represents net income attributable to American Tower Corporation common stockholders divided by the weighted average number of common shares outstanding during the period and any dilutive common share equivalents, including (A) shares issuable upon (i) the vesting of RSUs, (ii) exercise of stock options,
AMERICAN TOWER CORPORATION AND SUBSIDIARIES
NOTES TO CONSOLIDATED FINANCIAL STATEMENTS
(Tabular amounts in millions, unless otherwise disclosed)
and (iii) conversion of the Company’s mandatory convertible preferred stock and (B) shares earned upon the achievement of the parameters established for the PSUs, each to the extent not anti-dilutive. Dilutive common share equivalents also include the dilutive impact of the shares issuable in the Alltel transaction, which is described in notes 15 and 18. The Company uses the treasury stock method to calculate the effect of its outstanding RSUs, PSUs and stock options and uses the if-converted method to calculate the effect of its outstanding mandatory convertible preferred stock.
Retirement Plan—The Company has a 401(k) plan covering substantially all employees who meet certain age and employment requirements. For the year ended December 31, 2017, the Company matched 100% of the first 5% of a participant's contributions. For the years ended December 31, 2016 and 2015, the Company matched 75% of the first 6% of a participant’s contributions. For the years ended December 31, 2017, 2016 and 2015, the Company contributed $11.0 million, $9.1 million and $7.4 million to the plan, respectively.
Accounting Standards Updates—In May 2014, the Financial Accounting Standards Board (the “FASB”) issued new guidance on revenue recognition, which requires an entity to recognize revenue in an amount that reflects the consideration to which the entity expects to be entitled in exchange for the transfer of promised goods or services to customers. The standard will replace most existing revenue recognition guidance and will become effective for the Company on January 1, 2018. The standard permits the use of either the retrospective or cumulative effect transition method. Leases are not included in the scope of this standard. The revenue to which the Company must apply this standard is generally limited to services revenue, certain power and fuel charges and other fees charged to tenants. As of December 31, 2017, this revenue was approximately 14% of total revenue. The Company is finalizing the required disclosures and has completed its analysis of the impact of this standard and has determined that the impact on the timing of revenue recognition as a result of its adoption will not have a material effect on the Company’s financial statements. The Company intends to adopt this standard using a modified retrospective approach.
In January 2016, the FASB issued new guidance on the recognition and measurement of financial assets and financial liabilities. The guidance amends certain aspects of recognition, measurement, presentation and disclosure of financial instruments. This standard is effective for fiscal years, and for interim periods within those fiscal years, beginning after December 15, 2017. The Company does not expect the adoption of this guidance to have a material effect on its financial statements.
In February 2016, the FASB issued new guidance on the accounting for leases. The guidance amends the existing accounting standards for lease accounting, including the requirement that lessees recognize right of use assets and lease liabilities for leases with terms greater than twelve months in the statement of financial position. Under the new guidance, lessor accounting is largely unchanged. This guidance is effective for fiscal years, and for interim periods within those fiscal years, beginning after December 15, 2018. The standard is required to be applied using a modified retrospective approach for all leases existing at, or entered into after, the beginning of the earliest comparative period presented. The Company (i) has established a multidisciplinary team to assess and implement the new guidance, (ii) expects the guidance to have a material impact on its consolidated balance sheets due to the recording of right of use assets and lease liabilities for leases in which it is a lessee and which it currently treats as operating leases and (iii) continues to evaluate the impact of the new guidance.
In November 2016, the FASB issued new guidance on amounts described as restricted cash or restricted cash equivalents within the statement of cash flows. The guidance requires amounts generally described as restricted cash and restricted cash equivalents be included with cash and cash equivalents when reconciling the beginning-of-period and end-of-period balances on the statement of cash flows. The guidance is effective for fiscal years, and for interim periods within those fiscal years, beginning after December 15, 2017. The standard is required to be applied using a retrospective transition method to each period presented. The Company early adopted this guidance during the fourth quarter of 2017. The adoption of this guidance did not have a material effect on the Company’s financial statements.
In January 2017, the FASB issued new guidance that clarifies the definition of a business that an entity uses to determine whether a transaction should be accounted for as an asset acquisition (or disposal) or a business combination. The Company early adopted this guidance during the first quarter of 2017. As a result, more transactions have been accounted for as asset acquisitions instead of business combinations.
In January 2017, the FASB issued new guidance on accounting for goodwill impairments. The guidance eliminates Step 2 from the goodwill impairment test and requires, among other things, recognition of an impairment loss when the carrying value of a reporting unit exceeds its fair value. The loss recognized is limited to the total amount of goodwill allocated to that reporting unit. The guidance is effective for fiscal years, and for interim periods within those fiscal years, beginning after December 15, 2019. Early adoption is permitted for interim or annual goodwill impairment tests performed on testing dates after January 1,
AMERICAN TOWER CORPORATION AND SUBSIDIARIES
NOTES TO CONSOLIDATED FINANCIAL STATEMENTS
(Tabular amounts in millions, unless otherwise disclosed)
2017. The Company does not expect the adoption of this guidance to have a material effect on the Company’s financial statements.
In May 2017, the FASB issued new guidance on accounting for stock-based compensation. The guidance clarifies when changes to the terms or conditions of a share-based payment award must be accounted for as modifications. The guidance is effective for fiscal years, and for interim periods within those fiscal years, beginning after December 15, 2017. The Company early adopted this guidance during the second quarter of 2017. The adoption of this guidance did not have a material effect on the Company’s financial statements.
In August 2017, the FASB issued new guidance on hedge and derivative accounting. The guidance simplifies accounting rules around hedge accounting and the disclosures of hedging arrangements. Among other things, the guidance eliminates the need to separately measure and report hedge ineffectiveness and generally requires the entire change in fair value of a hedging instrument to be presented in the same income statement line as the hedged item. The guidance is effective for fiscal years, and for interim periods within those fiscal years, beginning after December 15, 2018, with early adoption permitted. The Company does not expect the adoption of this guidance to have a material effect on the Company’s financial statements.
In January 2018, the FASB issued new guidance on the treatment of land easements. The guidance provides a practical expedient to not evaluate existing or expired land easements under the new lease accounting standards if those easements were not previously accounted for as leases under the existing lease guidance. The Company does not expect the adoption of this guidance to have a material effect on the Company’s financial statements or its adoption of the lease accounting guidance.
In February 2018, the FASB issued new guidance on the treatment of tax effects that are presented in other comprehensive income. The guidance allows a reclassification from accumulated other comprehensive income to retained earnings for stranded tax effects as a result of the December 2017 legislation commonly referred to as the Tax Cuts and Jobs Act (“the Tax Act”). The guidance is effective for fiscal years, and for interim periods within those fiscal years, beginning after December 15, 2018, with early adoption permitted. The Company does not expect the adoption of this guidance to have a material effect on the Company’s financial statements.
2. PREPAID AND OTHER CURRENT ASSETS
Prepaid and other current assets consisted of the following as of December 31,:
|
| | | | | | | |
| | 2017 | | 2016 |
| Prepaid operating ground leases | $ | 148.6 |
| | 134.2 |
|
| Prepaid income tax | 136.5 |
| | 127.1 |
|
| Unbilled receivables | 107.9 |
| | 57.7 |
|
| Value added tax and other consumption tax receivables | 64.2 |
| | 31.6 |
|
| Prepaid assets | 39.6 |
| | 36.3 |
|
| Other miscellaneous current assets | 71.8 |
| | 54.1 |
|
| Prepaids and other current assets | $ | 568.6 |
| | $ | 441.0 |
|
AMERICAN TOWER CORPORATION AND SUBSIDIARIES
NOTES TO CONSOLIDATED FINANCIAL STATEMENTS
(Tabular amounts in millions, unless otherwise disclosed)
3. PROPERTY AND EQUIPMENT
Property and equipment (including assets held under capital leases) consisted of the following as of December 31,:
|
| | | | | | | | | |
| | Estimated Useful Lives (years) (1) | | 2017 | | 2016 |
| Towers | Up to 20 | | $ | 12,500.5 |
| | $ | 11,740.5 |
|
| Equipment | 2 - 15 | | 1,423.0 |
| | 1,176.3 |
|
| Buildings and improvements | 3 - 32 | | 631.4 |
| | 621.9 |
|
| Land and improvements (2) | Up to 20 | | 2,112.9 |
| | 1,909.7 |
|
| Construction-in-progress | | | 282.1 |
| | 203.4 |
|
| Total | | | 16,949.9 |
| | 15,651.8 |
|
| Less accumulated depreciation | | | (5,848.9 | ) | | (5,134.5 | ) |
| Property and equipment, net | | | $ | 11,101.0 |
| | $ | 10,517.3 |
|
_______________
| |
| (1) | Assets on leased land are depreciated over the shorter of the estimated useful life of the asset or the term of the corresponding ground lease taking into consideration lease renewal options and residual value. |
| |
| (2) | Estimated useful lives apply to improvements only. |
Depreciation expense for the years ended December 31, 2017, 2016 and 2015 was $835.5 million, $758.9 million and $661.4 million, respectively.
As of December 31, 2017, property and equipment included $4,944.2 million and $1,370.4 million of capital lease assets and accumulated depreciation, respectively. As of December 31, 2016, property and equipment included $4,735.3 million and $1,198.0 million of capital lease assets and accumulated depreciation, respectively. As of December 31, 2017 and 2016, capital lease assets were primarily classified as towers and land and improvements.
4. GOODWILL AND OTHER INTANGIBLE ASSETS
The changes in the carrying value of goodwill for the Company’s business segments were as follows:
|
| | | | | | | | | | | | | | | | | | | | | | | | |
| | | Property | | Services | | Total |
| | | U.S. | | Asia | | EMEA | | Latin America | |
| Balance as of January 1, 2016 | | $ | 3,379.2 |
| | $ | 170.7 |
| | $ | 132.6 |
| | $ | 407.4 |
| | $ | 2.0 |
| | $ | 4,091.9 |
|
| Additions | | — |
| | 881.8 |
| (1) | 40.4 |
| | 53.5 |
| | — |
| | 975.7 |
|
| Effect of foreign currency translation | | — |
| | (23.2 | ) | | (22.5 | ) | | 48.8 |
| | — |
| | 3.1 |
|
| Balance as of January 1, 2017 | | $ | 3,379.2 |
| | $ | 1,029.3 |
| | $ | 150.5 |
| | $ | 509.7 |
| | $ | 2.0 |
| | $ | 5,070.7 |
|
| Additions (2) | | — |
| | 0.4 |
| | 220.9 |
| | 264.8 |
| | — |
| | 486.1 |
|
| Effect of foreign currency translation | | — |
| | 65.3 |
| | 33.5 |
| | (17.2 | ) | | — |
| | 81.6 |
|
| Balance as of December 31, 2017 | | $ | 3,379.2 |
| | $ | 1,095.0 |
| | $ | 404.9 |
| | $ | 757.3 |
| | $ | 2.0 |
| | $ | 5,638.4 |
|
_______________
| |
| (1) | Assumed in the acquisition of Viom (see note 6). |
| |
| (2) | Additions consist of $485.1 million resulting from 2017 acquisitions and $1.0 million from revisions to prior year acquisitions resulting from measurement period adjustments. |
The Company’s other intangible assets subject to amortization consisted of the following:
|
| | | | | | | | | | | | | | | | | | | | | | | | | | |
| | | | As of December 31, 2017 | | As of December 31, 2016 |
| | Estimated Useful Lives | | Gross Carrying Value | | Accumulated Amortization | | Net Book Value | | Gross Carrying Value | | Accumulated Amortization | | Net Book Value |
| | (years) | | |
| Acquired network location intangibles (1) | Up to 20 |
| | $ | 4,858.8 |
| | $ | (1,525.3 | ) | | $ | 3,333.5 |
| | $ | 4,622.3 |
| | $ | (1,280.3 | ) | | $ | 3,342.0 |
|
| Acquired tenant-related intangibles | 15-20 |
| | 11,150.9 |
| | (2,754.7 | ) | | 8,396.2 |
| | 10,130.5 |
| | (2,224.1 | ) | | 7,906.4 |
|
| Acquired licenses and other intangibles | 3-20 |
| | 58.8 |
| | (8.1 | ) | | 50.7 |
| | 28.1 |
| | (4.8 | ) | | 23.3 |
|
| Economic Rights, TV Azteca | 70 |
| | 14.5 |
| | (11.6 | ) | | 2.9 |
| | 13.9 |
| | (11.0 | ) | | 2.9 |
|
| Total other intangible assets | | | $ | 16,083.0 |
| | $ | (4,299.7 | ) | | $ | 11,783.3 |
| | $ | 14,794.8 |
| | $ | (3,520.2 | ) | | $ | 11,274.6 |
|
_______________
| |
| (1) | Acquired network location intangibles are amortized over the shorter of the term of the corresponding ground lease taking into consideration lease renewal options and residual value or up to 20 years, as the Company considers these intangibles to be directly related to the tower assets. |
The acquired network location intangibles represent the value to the Company of the incremental revenue growth that could potentially be obtained from leasing the excess capacity on acquired communications sites. The acquired tenant-related
AMERICAN TOWER CORPORATION AND SUBSIDIARIES
NOTES TO CONSOLIDATED FINANCIAL STATEMENTS
(Tabular amounts in millions, unless otherwise disclosed)
intangibles typically represent the value to the Company of tenant contracts and relationships in place at the time of an acquisition or similar transaction, including assumptions regarding estimated renewals.
The Company amortizes its acquired network location intangibles and tenant-related intangibles on a straight-line basis over the estimated useful lives. As of December 31, 2017, the remaining weighted average amortization period of the Company’s intangible assets, excluding the TV Azteca Economic Rights detailed in note 5, was 15 years. Amortization of intangible assets for the years ended December 31, 2017, 2016 and 2015 was $785.9 million, $699.8 million and $568.3 million, respectively. Based on current exchange rates, the Company expects to record amortization expense as follows over the next five years:
|
| | | |
| Year Ending December 31, | |
| 2018 | $ | 810.5 |
|
| 2019 | 806.7 |
|
| 2020 | 787.2 |
|
| 2021 | 768.7 |
|
| 2022 | 766.1 |
|
5. NOTES RECEIVABLE AND OTHER NON-CURRENT ASSETS
Notes receivable and other non-current assets consisted of the following as of December 31,:
|
| | | | | | | |
| | 2017 | | 2016 |
| Long-term prepaid ground rent | $ | 552.8 |
| | $ | 467.8 |
|
| Notes receivable | 83.7 |
| | 83.7 |
|
| Other miscellaneous assets | 313.6 |
| | 290.0 |
|
| Notes receivable and other non-current assets | $ | 950.1 |
| | $ | 841.5 |
|
TV Azteca Note Receivable—In 2000, the Company loaned TV Azteca, S.A. de C.V. (“TV Azteca”), the owner of a major national television network in Mexico, $119.8 million. The loan has an interest rate of 13.11%, payable quarterly, which at the time of issuance was determined to be below market and therefore a corresponding discount was recorded. The term of the loan is 70 years; however, the loan may be prepaid by TV Azteca without penalty during the last 50 years of the agreement. The
AMERICAN TOWER CORPORATION AND SUBSIDIARIES
NOTES TO CONSOLIDATED FINANCIAL STATEMENTS
(Tabular amounts in millions, unless otherwise disclosed)
discount on the loan is being amortized to Interest income, TV Azteca, net of interest expense on the Company’s consolidated statements of operations, using the effective interest method over the 70-year term of the loan.
Since inception, TV Azteca has repaid $28.0 million of principal on the loan. As of December 31, 2017 and 2016, the outstanding balance on the loan was $91.8 million, or $82.9 million, net of discount.
TV Azteca Economic Rights—Simultaneous with the signing of the loan agreement, the Company also entered into a 70-year Economic Rights Agreement with TV Azteca regarding space not used by TV Azteca on approximately 190 of its broadcast towers. In exchange for the issuance of the below market interest rate loan and the annual payment of $1.5 million to TV Azteca (under the Economic Rights Agreement), the Company has the right to market and lease the unused tower space on the broadcast towers (the “Economic Rights”). TV Azteca retains title to these towers and is responsible for their operation and maintenance. The Company is entitled to 100% of the revenues generated from leases with tenants on the unused space and is responsible for any incremental operating expenses associated with those tenants.
While the term of the Economic Rights Agreement is 70 years, TV Azteca has the right to purchase, at fair market value, the Economic Rights from the Company at any time during the last 50 years of the agreement. Should TV Azteca elect to purchase the Economic Rights, in whole or in part, it would also be obligated to repay a proportional amount of the loan discussed above at the time of such election. The Company’s obligation to pay TV Azteca $1.5 million annually would also be reduced proportionally.
The Company accounted for the annual payment of $1.5 million as a capital lease by initially recording an asset and a corresponding liability of $18.6 million. The capital lease asset also included the original discount on the note. The capital lease asset and original discount on the note aggregated $30.2 million at the time of the transaction and represents the cost to acquire the Economic Rights. The Economic Rights asset was recorded as an intangible asset and is being amortized over the 70-year life of the Economic Rights Agreement.
6. ACQUISITIONS
The Company evaluates each of its acquisitions under the accounting guidance framework to determine whether to treat an acquisition as an asset acquisition or a business combination. For those transactions treated as asset acquisitions, the purchase price is allocated to the assets acquired and liabilities assumed, with no recognition of goodwill. For those transactions treated as business combinations, the estimates of the fair value of the assets or rights acquired and liabilities assumed at the date of the applicable acquisition are subject to adjustment during the measurement period (up to one year from the particular acquisition date). The primary areas of the accounting for the acquisitions that are not yet finalized relate to the fair value of certain tangible and intangible assets acquired and liabilities assumed, which may include contingent consideration, residual goodwill and any related tax impact.
The fair value of these net assets acquired are based on management’s estimates and assumptions, as well as other information compiled by management, including valuations that utilize customary valuation procedures and techniques. While the Company believes that such preliminary estimates provide a reasonable basis for estimating the fair value of assets acquired and liabilities assumed, it evaluates any necessary information prior to finalization of the fair value. During the measurement period, the Company will adjust assets or liabilities if new information is obtained about facts and circumstances that existed as of the acquisition date that, if known, would have resulted in the revised estimated values of those assets or liabilities as of that date.
Impact of current year acquisitions—The Company typically acquires communications sites from wireless carriers or other tower operators and subsequently integrates those sites into its existing portfolio of communications sites. The financial results of the Company’s acquisitions have been included in the Company’s consolidated statements of operations for the year ended December 31, 2017 from the date of the respective acquisition. The date of acquisition, and by extension the point at which the Company begins to recognize the results of an acquisition, may depend on, among other things, the receipt of contractual consents, the commencement and extent of leasing arrangements and the timing of the transfer of title or rights to the assets, which may be accomplished in phases. Sites acquired from communications service providers may never have been operated as a business and may instead have been utilized solely by the seller as a component of its network infrastructure. An acquisition may or may not involve the transfer of business operations or employees.
For those acquisitions accounted for as business combinations, the Company recognizes acquisition and merger related expenses in the period in which they are incurred and services are received; for transactions accounted for as asset acquisitions, these costs are capitalized as part of the purchase price. Acquisition and merger related costs may include finder’s fees, advisory, legal, accounting, valuation and other professional or consulting fees and general administrative costs directly related to the transaction. Integration costs include incremental and non-recurring costs necessary to convert data, retain employees and otherwise enable the Company to operate new businesses or assets efficiently. The Company records acquisition and merger related expenses for business combinations, as well as integration costs for all acquisitions, in Other operating expenses in the consolidated statements of operations.
During the years ended December 31, 2017, 2016 and 2015, the Company recorded the following acquisition and merger related expenses for business combinations and integration costs:
|
| | | | | | | | | | | | |
| | | Year Ended December 31, |
| | | 2017 | | 2016 | | 2015 |
| | | | | | | |
| Acquisition and merger related expenses | | $ | 16.3 |
| | $ | 15.9 |
| | $ | 18.8 |
|
| Integration costs | | $ | 11.5 |
| | $ | 9.9 |
| | $ | 18.1 |
|
The Company also recorded aggregate purchase price refunds of $22.2 million during the year ended December 31, 2017. The refunds primarily related to an acquisition in Brazil in 2014 for which the measurement period has closed.
2017 Transactions
The estimated aggregate impact of the 2017 acquisitions on the Company’s revenues and gross margin for the year ended December 31, 2017 was approximately $82.1 million and $59.3 million, respectively. The revenues and gross margin amounts also reflect incremental revenues from the addition of new tenants to such sites subsequent to the transaction date.
AMERICAN TOWER CORPORATION AND SUBSIDIARIES
NOTES TO CONSOLIDATED FINANCIAL STATEMENTS
(Tabular amounts in millions, unless otherwise disclosed)
FPS Towers France—OnFebruary 15, 2017, ATC Europe acquired 100% of the outstanding shares of FPS Towers (“FPS”) from Antin Infrastructure Partners and the individuals party to the purchase agreement (the “FPS Acquisition”), for total consideration of 727.2 million Euros ($771.2 million at the date of acquisition). FPS owns and operates nearly 2,500 wireless tower sites in France. The Company made a loan to fund 225.0 million Euros ($238.6 million at the date of acquisition) of the total consideration. The remainder of the purchase price of 502.2 million Euros ($532.6 million at the date of acquisition) was funded by the Company and PGGM in proportion to their respective interests in ATC Europe. The Company funded its portion of the purchase price with borrowings under its multicurrency senior unsecured revolving credit facility entered into in June 2013, as amended (the “2013 Credit Facility”) and cash on hand. The acquisition is consistent with the Company’s strategy to expand in selected geographic areas. The acquisition was accounted for as a business combination and was subject to post-closing adjustments. All measurement-period adjustments were finalized as of December 31, 2017.
Mexico Acquisition—On November 17, 2017, the Company acquired 100% of the outstanding shares of entities holding urban telecommunications assets in Mexico, including more than 50,000 concrete poles and approximately 2,100 route miles of fiber, for total consideration of $505.8 million, including value-added tax (at the date of acquisition). The acquisition was accounted for as a business combination and is subject to post-closing adjustments.
Other Acquisitions—During the year ended December 31, 2017, the Company acquired a total of 2,453 communications sites in the United States, Brazil, Chile, Colombia, Germany, Mexico, Nigeria, Paraguay and Peru for an aggregate purchase price of $814.0 million. Of the aggregate purchase price, $22.5 million is reflected in Accounts payable in the consolidated balance sheet as of December 31, 2017. These acquisitions were accounted for as asset acquisitions.
The following table summarizes the allocations of the purchase prices for the fiscal year 2017 acquisitions based upon their estimated fair value at the date of acquisition:
|
| | | | | | | | | | | | |
| | | EMEA | | Latin America | | |
| | | FPS Towers France (1) | | Mexico (1) | | Other (2) (3) |
| | | Final Allocation | | Preliminary Allocation | | |
| Current assets | | $ | 34.5 |
| | $ | 44.4 |
| | $ | 12.7 |
|
| Non-current assets | | 15.0 |
| | — |
| | 19.7 |
|
| Property and equipment | | 122.9 |
| | 94.0 |
| | 290.0 |
|
| Intangible assets (4): | | | | | | |
| Tenant-related intangible assets | | 440.7 |
| | 153.3 |
| | 364.7 |
|
| Network location intangible assets | | 113.0 |
| | — |
| | 154.3 |
|
| Other intangible assets | | 8.5 |
| | 22.0 |
| | — |
|
| Current liabilities | | (29.0 | ) | | (28.8 | ) | | (10.5 | ) |
| Deferred tax liability | | (135.4 | ) | | (38.8 | ) | | (2.7 | ) |
| Other non-current liabilities | | (19.9 | ) | | (4.5 | ) | | (14.2 | ) |
| Net assets acquired | | 550.3 |
| | 241.6 |
| | 814.0 |
|
| Goodwill (5) | | 220.9 |
| | 264.2 |
| | — |
|
| Fair value of net assets acquired | | 771.2 |
| | 505.8 |
| | 814.0 |
|
| Debt assumed | | — |
| | — |
| | — |
|
| Purchase price | | $ | 771.2 |
| | $ | 505.8 |
| | $ | 814.0 |
|
| |
| (1) | Accounted for as a business combination. |
| |
| (2) | Accounted for as asset acquisitions. |
| |
| (3) | Includes 127 sites in Peru held pursuant to long-term capital leases. |
| |
| (4) | Tenant-related intangible assets, network location intangible assets and other intangible assets are amortized on a straight-line basis over periods of up to 20 years. |
| |
| (5) | Primarily results from purchase accounting adjustments, which are not deductible for tax purposes. |
AMERICAN TOWER CORPORATION AND SUBSIDIARIES
NOTES TO CONSOLIDATED FINANCIAL STATEMENTS
(Tabular amounts in millions, unless otherwise disclosed)
2016 Transactions
During the year ended December 31, 2017, post-closing adjustments impacted the 2016 acquisitions as follows:
Viom Acquisition—On April 21, 2016, the Company acquired a 51% controlling ownership interest in Viom, a telecommunications infrastructure company that owns and operates wireless communications towers and indoor DAS networks in India (the “Viom Acquisition”). Consideration for the acquisition included 76.4 billion Indian Rupees (“INR”) in cash ($1.1 billion at the date of acquisition), as well as the assumption of approximately 52.3 billion INR ($0.8 billion at the date of the acquisition) of existing debt, which included 1.7 billion INR ($25.1 million at the date of the acquisition) of mandatorily redeemable preference shares issued by Viom (the “Viom Preference Shares”).
Other Acquisitions—During the year ended December 31, 2016, the Company acquired a total of 891 communications sites in the United States, Brazil, Chile, Germany, Mexico, Nigeria and South Africa, and a company holding urban telecommunications assets and fiber in Argentina, for an aggregate purchase price of $304.4 million (including contingent consideration of $8.8 million).
The following table summarizes the preliminary and updated allocations of the purchase prices paid and the amounts of assets acquired and liabilities assumed for the fiscal year 2016 acquisitions based upon their estimated fair value at the date of acquisition. Balances are reflected in the accompanying consolidated balance sheet as of December 31, 2017.
|
| | | | | | | | | | | | | | | | |
| | | Preliminary Allocation (1) | | Updated Allocation |
| | | Asia | | Other (2) | | Asia | | Other (2) |
| | | Viom | | | Viom (3) | |
| Current assets | | $ | 276.6 |
| | $ | 25.5 |
| | $ | 281.9 |
| | $ | 24.5 |
|
| Non-current assets | | 57.6 |
| | 2.3 |
| | 52.3 |
| | 2.3 |
|
| Property and equipment | | 702.0 |
| | 81.5 |
| | 705.8 |
| | 81.5 |
|
| Intangible assets (4): | | | | | | | | |
| Tenant-related intangible assets | | 1,369.6 |
| | 105.6 |
| | 1,369.6 |
| | 105.6 |
|
| Network location intangible assets | | 666.4 |
| | 83.6 |
| | 666.4 |
| | 83.6 |
|
| Current liabilities | | (195.9 | ) | | (14.8 | ) | | (201.1 | ) | | (14.8 | ) |
| Deferred tax liability | | (619.1 | ) | | (43.8 | ) | | (619.1 | ) | | (43.4 | ) |
| Other non-current liabilities | | (102.8 | ) | | (29.4 | ) | | (101.8 | ) | | (29.4 | ) |
| Net assets acquired | | 2,154.4 |
| | 210.5 |
| | 2,154.0 |
| | 209.9 |
|
| Goodwill (5) | | 881.8 |
| | 93.9 |
| | 882.2 |
| | 94.5 |
|
| Fair value of net assets acquired | | 3,036.2 |
| | 304.4 |
| | 3,036.2 |
| | 304.4 |
|
| Debt assumed | | (786.8 | ) | | — |
| | (786.8 | ) | | — |
|
| Redeemable noncontrolling interests | | (1,100.9 | ) | | — |
| | (1,100.9 | ) | | — |
|
| Purchase Price | | $ | 1,148.5 |
| | $ | 304.4 |
| | $ | 1,148.5 |
| | $ | 304.4 |
|
_______________
| |
| (1) | As reported for the year ended December 31, 2016. |
| |
| (2) | Of the total purchase price, $12.1 million was reflected in Accounts payable in the consolidated balance sheet as of December 31, 2016. |
| |
| (3) | The allocation of the purchase price for the Viom Acquisition was finalized during the year ended December 31, 2017. |
| |
| (4) | Tenant-related intangible assets and network location intangible assets are amortized on a straight-line basis over periods of up to 20 years. |
| |
| (5) | Primarily results from purchase accounting adjustments, which are at least partially deductible for tax purposes. |
Pro Forma Consolidated Results (Unaudited)
The following table presents the unaudited pro forma financial results as if the 2017 acquisitions had occurred on January 1, 2016 and the 2016 acquisitions had occurred on January 1, 2015. The pro forma results do not include any anticipated cost synergies, costs or other integration impacts. Accordingly, such pro forma amounts are not necessarily indicative of the results that actually would have occurred had the transactions been completed on the dates indicated, nor are they indicative of the future operating results of the Company.
AMERICAN TOWER CORPORATION AND SUBSIDIARIES
NOTES TO CONSOLIDATED FINANCIAL STATEMENTS
(Tabular amounts in millions, unless otherwise disclosed)
|
| | | | | | | | |
| | | Year Ended December 31, |
| | | 2017 | | 2016 |
| Pro forma revenues | | $ | 6,775.3 |
| | $ | 6,240.6 |
|
| Pro forma net income attributable to American Tower Corporation common stockholders | | $ | 1,145.5 |
| | $ | 822.8 |
|
| Pro forma net income per common share amounts: | | | | |
| Basic net income attributable to American Tower Corporation common stockholders | | $ | 2.68 |
| | $ | 1.94 |
|
| Diluted net income attributable to American Tower Corporation common stockholders | | $ | 2.65 |
| | $ | 1.92 |
|
Other Signed Acquisitions
Idea Cellular Limited—On November 13, 2017, the Company entered into an agreement with Idea Cellular Limited (“Idea”) and Idea’s subsidiary, Idea Cellular Infrastructure Services Limited (“ICISL”), to acquire 100% of the outstanding shares of ICISL, a telecommunications company that owns and operates approximately 9,900 communication sites in India, for cash consideration of approximately 40 billion INR ($611.4 million at the date of signing), subject to certain adjustments (the “Idea Transaction”).
Vodafone India Limited—On November 13, 2017, the Company entered into an agreement with Vodafone India Limited and Vodafone Mobile Services Limited (together, “Vodafone”) to acquire their telecommunications site businesses, which consist of an aggregate of approximately 10,235 communication sites, for aggregate cash consideration of approximately 38.5 billion INR ($588.4 million at the date of signing), subject to certain adjustments (the “Vodafone Transaction” and, together with the Idea Transaction, the “India Transactions”).
Consummation of the India Transactions is subject to certain conditions, including regulatory approval. The India Transactions are expected to close in the first half of 2018.
Airtel Tanzania—On March 17, 2016, the Company entered into a definitive agreement with Bharti Airtel Limited, through its subsidiary company Airtel Tanzania Limited (“Airtel Tanzania”), pursuant to which the Company could, subject to a number of conditions, acquire certain of Airtel Tanzania’s communications sites in Tanzania. In light of subsequent legislation in Tanzania, the Company did not extend the agreement beyond the expiration date therein. Accordingly, on March 17, 2017, the agreement expired pursuant to its terms and is no longer in effect.
Acquisition-Related Contingent Consideration
The Company may be required to pay additional consideration under certain agreements for the acquisition of communications sites if specific conditions are met or events occur. In Ghana, the Company may be required to pay additional consideration upon the conversion of certain barter agreements with other wireless carriers to cash-paying lease agreements. In the United States and South Africa, the Company may be required to pay additional consideration if certain pre-designated tenant leases commence during a specified period of time.
A summary of the value of the Company’s contingent consideration obligations are as follows: |
| | | | | | | | | | | | | | | | | | | | |
| | | | | | | Year Ended December 31, 2017 |
| | | Maximum potential value (1) | | Estimated value at December 31, 2017 | | Additions | | Settlements | | Change in Fair Value |
| Colombia | | $ | — |
| | $ | — |
| | $ | — |
| | $ | — |
| | $ | (5.4 | ) |
| Ghana | | 0.6 |
| | 0.6 |
| | — |
| | — |
| | 0.0 |
| South Africa | | 9.1 |
| | 9.1 |
| | — |
| | — |
| | (0.9 | ) |
| United States | | 0.4 |
| | 0.4 |
| | — |
| | — |
| | 0.0 |
| Total | | $ | 10.1 |
| | $ | 10.1 |
| | $ | — |
| | $ | — |
| | $ | (6.3 | ) |
_______________
| |
| (1) | The maximum potential value is based on exchange rates at December 31, 2017. The minimum value would be no less than $9.1 million. |
For more information regarding acquisition-related contingent consideration, see note 11.
AMERICAN TOWER CORPORATION AND SUBSIDIARIES
NOTES TO CONSOLIDATED FINANCIAL STATEMENTS
(Tabular amounts in millions, unless otherwise disclosed)
7. ACCRUED EXPENSES
Accrued expenses consisted of the following as of December 31,:
|
| | | | | | | |
| | 2017 | | 2016 |
| Accrued property and real estate taxes | $ | 154.4 |
| | $ | 138.4 |
|
| Payroll and related withholdings | 82.2 |
| | 76.1 |
|
| Amounts payable to tenants | 60.8 |
| | 32.3 |
|
| Accrued rent | 54.0 |
| | 51.0 |
|
| Accrued income tax payable | 15.3 |
| | 11.6 |
|
| Accrued pass-through costs | 59.7 |
| | 68.5 |
|
| Accrued construction costs | 31.9 |
| | 28.6 |
|
| Accrued pass-through taxes | 25.3 |
| | 1.0 |
|
| Other accrued expenses | 370.7 |
| | 213.0 |
|
| Accrued expenses | $ | 854.3 |
| | $ | 620.5 |
|
AMERICAN TOWER CORPORATION AND SUBSIDIARIES
NOTES TO CONSOLIDATED FINANCIAL STATEMENTS
(Tabular amounts in millions, unless otherwise disclosed)
8. LONG-TERM OBLIGATIONS
Outstanding amounts under the Company’s long-term obligations, reflecting discounts, premiums, debt issuance costs and fair value adjustments due to interest rate swaps consisted of the following as of December 31,:
|
| | | | | | | | | | | | |
| | 2017 | | 2016 | | Contractual Interest Rate (1) | | Maturity Date (1) |
| 2013 Credit Facility (2) | $ | 2,075.6 |
| | $ | 540.0 |
| | 2.649 | % | | June 28, 2021 |
| Term Loan (2) | 994.5 |
| | 993.9 |
| | 2.790 | % | | January 31, 2023 |
| 2014 Credit Facility (2) | 495.0 |
| | 1,385.0 |
| | 2.820 | % | | January 31, 2023 |
| 4.500% senior notes | — |
| | 998.7 |
| | N/A |
| | N/A |
| 3.40% senior notes | 999.8 |
| | 999.7 |
| | 3.400 | % | | February 15, 2019 |
| 7.25% senior notes | — |
| | 297.0 |
| | N/A |
| | N/A |
| 2.800% senior notes | 746.3 |
| | 744.9 |
| | 2.800 | % | | June 1, 2020 |
| 5.050% senior notes | 698.0 |
| | 697.4 |
| | 5.050 | % | | September 1, 2020 |
| 3.300% senior notes | 746.0 |
| | 744.8 |
| | 3.300 | % | | February 15, 2021 |
| 3.450% senior notes | 645.1 |
| | 643.8 |
| | 3.450 | % | | September 15, 2021 |
| 5.900% senior notes | 497.8 |
| | 497.3 |
| | 5.900 | % | | November 1, 2021 |
| 2.250% senior notes | 572.4 |
| | 572.8 |
| | 2.250 | % | | January 15, 2022 |
| 4.70% senior notes | 696.7 |
| | 696.0 |
| | 4.700 | % | | March 15, 2022 |
| 3.50% senior notes | 990.9 |
| | 989.3 |
| | 3.500 | % | | January 31, 2023 |
| 3.000% senior notes | 692.5 |
| | — |
| | 3.000 | % | | June 15, 2023 |
| 5.00% senior notes | 1,002.4 |
| | 1,002.7 |
| | 5.000 | % | | February 15, 2024 |
| 1.375% senior notes | 589.1 |
| | — |
| | 1.375 | % | | April 4, 2025 |
| 4.000% senior notes | 741.0 |
| | 740.0 |
| | 4.000 | % | | June 1, 2025 |
| 4.400% senior notes | 495.6 |
| | 495.2 |
| | 4.400 | % | | February 15, 2026 |
| 3.375% senior notes | 984.8 |
| | 983.4 |
| | 3.375 | % | | October 15, 2026 |
| 3.125% senior notes | 397.1 |
| | 396.7 |
| | 3.125 | % | | January 15, 2027 |
| 3.55% senior notes | 742.8 |
| | — |
| | 3.550 | % | | July 15, 2027 |
| 3.600% senior notes | 691.1 |
| | — |
| | 3.600 | % | | January 15, 2028 |
| Total American Tower Corporation debt | 16,494.5 |
| | 14,418.6 |
| | | | |
| | | | | | | | |
| Series 2013-1A Securities (3) | 499.8 |
| | 498.6 |
| | 1.551 | % | | March 15, 2018 |
| Series 2013-2A Securities (4) | 1,291.8 |
| | 1,290.3 |
| | 3.070 | % | | March 15, 2023 |
| Series 2015-1 Notes (5) | 348.0 |
| | 347.1 |
| | 2.350 | % | | June 15, 2020 |
| Series 2015-2 Notes (6) | 520.1 |
| | 519.4 |
| | 3.482 | % | | June 16, 2025 |
| 2012 GTP Notes | — |
| | 179.5 |
| | N/A |
| | N/A |
| Unison Notes | — |
| | 133.0 |
| | N/A |
| | N/A |
| India indebtedness (7) | 512.6 |
| | 549.5 |
| | 7.90% - 9.55% |
| | Various |
| India preference shares (8) | 26.1 |
| | 24.5 |
| | 10.250 | % | | March 2, 2020 |
| Shareholder loans (9) | 100.6 |
| | 151.1 |
| | Various |
| | Various |
| Other subsidiary debt (1) (10) | 246.1 |
| | 286.0 |
| | Various |
| | Various |
| Total American Tower subsidiary debt | 3,545.1 |
| | 3,979.0 |
| | | | |
| Other debt, including capital lease obligations | 165.5 |
| | 135.9 |
| | | | |
| Total | 20,205.1 |
| | 18,533.5 |
| | | | |
| Less current portion long-term obligations | (774.8 | ) | | (238.8 | ) | | | | |
| Long-term obligations | $ | 19,430.3 |
| | $ | 18,294.7 |
| | | | |
_______________
AMERICAN TOWER CORPORATION AND SUBSIDIARIES
NOTES TO CONSOLIDATED FINANCIAL STATEMENTS
(Tabular amounts in millions, unless otherwise disclosed)
| |
| (1) | Represents the interest rate or maturity date as of December 31, 2017; interest rate does not reflect the impact of interest rate swap agreements. |
| |
| (2) | Accrues interest at a variable rate. |
| |
| (3) | Maturity date reflects the anticipated repayment date; final legal maturity is March 15, 2043. |
| |
| (4) | Maturity date reflects the anticipated repayment date; final legal maturity is March 15, 2048. |
| |
| (5) | Maturity date reflects the anticipated repayment date; final legal maturity is June 15, 2045. |
| |
| (6) | Maturity date reflects the anticipated repayment date; final legal maturity is June 15, 2050. |
| |
| (7) | Denominated in INR. Includes India working capital facility, remaining debt assumed by the Company in connection with the Viom Acquisition and debt that has been entered into by ATC TIPL. |
| |
| (8) | Mandatorily redeemable preference shares (the “Preference Shares”) classified as debt. The Preference Shares are to be redeemed on March 2, 2020 and have a dividend rate of 10.25% per annum. |
| |
| (9) | Reflects balances owed to the Company’s joint venture partners in Ghana and Uganda. The Ghana loan is denominated in Ghanaian Cedi (“GHS”) and the Uganda loan is denominated in Ugandan Shillings (“UGX”). |
| |
| (10) | Includes the BR Towers debentures and the Brazil Credit Facility (as defined below), which are denominated in Brazilian Reais (“BRL”) and amortize through October 15, 2023 and January 15, 2022, respectively, the South African Credit Facility (as defined below), which is denominated in South African Rand (“ZAR”) and amortizes through December 17, 2020 and the Colombian Credit Facility (as defined below), which is denominated in Colombian Pesos (“COP”) and amortizes through April 24, 2021. |
American Tower Corporation Debt
Bank Facilities—In December 2017, the Company entered into amendment agreements with respect to (i) the 2013 Credit Facility, (ii) its senior unsecured revolving credit facility entered into in January 2012, as amended and restated in September 2014, as further amended (the “2014 Credit Facility”) and (iii) its unsecured term loan entered into in October 2013, as amended (the “Term Loan”), which, among other things, extend the maturity dates by one year to June 28, 2021, January 31, 2023 and January 31, 2023, respectively. In addition, the amendment to the 2013 Credit Facility reduces the Applicable Margins (as defined in the 2013 Credit Facility) and the commitment fees set forth therein.
2013 Credit Facility—The Company has the ability to borrow up to $2.75 billion under the 2013 Credit Facility, which includes a $1.0 billion sublimit for multicurrency borrowings, a $200.0 million sublimit for letters of credit and a $50.0 million sublimit for swingline loans. During the year ended December 31, 2017, the Company borrowed an aggregate of $3.8 billion and repaid an aggregate of $2.3 billion of revolving indebtedness under the 2013 Credit Facility. The Company primarily used the borrowings to fund acquisitions, repay existing indebtedness and for general corporate purposes.
2014 Credit Facility—The Company has the ability to borrow up to $2.0 billion under the 2014 Credit Facility, which includes a $200.0 million sublimit for letters of credit and a $50.0 million sublimit for swingline loans. During the year ended December 31, 2017, the Company borrowed an aggregate of $815.0 million and repaid an aggregate of $1.7 billion of revolving indebtedness under the 2014 Credit Facility. The Company primarily used the borrowings to fund acquisitions and for general corporate purposes.
The Term Loan, the 2013 Credit Facility and the 2014 Credit Facility do not require amortization of principal and may be paid prior to maturity in whole or in part at the Company’s option without penalty or premium. The Company has the option of choosing either a defined base rate or the London Interbank Offered Rate (“LIBOR”) as the applicable base rate for borrowings under the Term Loan, the 2013 Credit Facility and the 2014 Credit Facility. The interest rate on the 2013 Credit Facility ranges between 0.875% to 1.750% above LIBOR for LIBOR based borrowings or up to 0.750% above the defined base rate for base rate borrowings, in each case based upon the Company’s debt ratings. The interest rates on the Term Loan and the 2014 Credit Facility range between 1.000% to 2.000% above LIBOR for LIBOR based borrowings or up to 1.000% above the defined base rate for base rate borrowings, in each case based upon the Company’s debt ratings.
As of December 31, 2017, the key terms under the 2013 Credit Facility, the 2014 Credit Facility and the Term Loan were as follows:
|
| | | | | | | | | | | | | | |
| | Outstanding Principal Balance | | Undrawn letters of credit | | Maturity Date | | Current margin over LIBOR | Current commitment fee (1) |
| 2013 Credit Facility | $ | 2,075.6 |
| (2) | $ | 4.0 |
| | June 28, 2021 | (3) | 1.125 | % | 0.125 | % |
| 2014 Credit Facility | $ | 495.0 |
| (2) | $ | 6.3 |
| | January 31, 2023 | (3) | 1.250 | % | 0.150 | % |
| Term Loan | $ | 1,000.0 |
| (2) | $ | — |
| | January 31, 2023 | | 1.250 | % | N/A |
|
_______________
(1) Fee on undrawn portion of each credit facility.
(2) Borrowed at LIBOR.
(3) Subject to two optional renewal periods.
AMERICAN TOWER CORPORATION AND SUBSIDIARIES
NOTES TO CONSOLIDATED FINANCIAL STATEMENTS
(Tabular amounts in millions, unless otherwise disclosed)
Senior Notes
1.375% Senior Notes Offering—On April 6, 2017, the Company completed a registered public offering of 500.0 million Euros ($532.2 million at the date of issuance) aggregate principal amount of 1.375% senior unsecured notes due 2025 (the “1.375% Notes”). The net proceeds from this offering were approximately 489.8 million Euros (approximately $521.4 million at the date of issuance), after deducting commissions and estimated expenses. The Company used the net proceeds to repay existing indebtedness under the 2013 Credit Facility and for general corporate purposes.
The 1.375% Notes will mature on April 4, 2025 and bear interest at a rate of 1.375% per annum. Accrued and unpaid interest on the 1.375% Notes will be payable in Euros in arrears on April 4 of each year, beginning on April 4, 2018. Interest on the 1.375% Notes will be computed on the basis of the actual number of days in the period for which interest is being calculated and the actual number of days from and including the last date on which interest was paid on the 1.375% Notes and commenced accruing on April 6, 2017.
3.55% Senior Notes Offering—On June 30, 2017, the Company completed a registered public offering of $750.0 million aggregate principal amount of 3.55% senior unsecured notes due 2027 (the “3.55% Notes”). The net proceeds from this offering were approximately $741.8 million, after deducting commissions and estimated expenses. The Company used the net proceeds to repay existing indebtedness under the 2013 Credit Facility.
The 3.55% Notes will mature on July 15, 2027 and bear interest at a rate of 3.55% per annum. Accrued and unpaid interest on the 3.55% Notes will be payable in U.S. Dollars semi-annually in arrears on January 15 and July 15 of each year, beginning on January 15, 2018. Interest on the 3.55% Notes is computed on the basis of a 360-day year comprised of twelve 30-day months and commenced accruing on June 30, 2017.
3.000% Senior Notes and 3.600% Senior Notes Offerings—On December 8, 2017, the Company completed registered public offerings of $700.0 million aggregate principal amount of 3.000% senior unsecured notes due 2023 (the “3.000% Notes”) and $700.0 million aggregate principal amount of 3.600% senior unsecured notes due 2028 (the “3.600% Notes”). The net proceeds from these offerings were approximately $1,382.9 million, after deducting commissions and estimated expenses. The Company used the net proceeds to repay existing indebtedness under the 2013 Credit Facility and the 2014 Credit Facility.
The 3.000% Notes will mature on June 15, 2023 and bear interest at a rate of 3.000% per annum. The 3.600% Notes will mature on January 15, 2028 and bear interest at a rate of 3.600% per annum. Accrued and unpaid interest on the 3.000% Notes will be payable in U.S. Dollars semi-annually in arrears on June 15 and December 15 of each year, beginning on June 15, 2018. Accrued and unpaid interest on the 3.600% Notes will be payable in U.S. Dollars semi-annually in arrears on January 15 and July 15 of each year, beginning on July 15, 2018. Interest on the 3.000% Notes and the 3.600% Notes is computed on the basis of a 360-day year comprised of twelve 30-day months and commenced accruing on December 8, 2017.
The Company entered into interest rate swaps, which were designated as fair value hedges at inception, to hedge against changes in fair value of $500.0 million of the $700.0 million under the 3.000% Notes resulting from changes in interest rates. As of December 31, 2017, the interest rate on the 3.000% Notes, after giving effect to the interest rate swap agreements, was 2.49%.
AMERICAN TOWER CORPORATION AND SUBSIDIARIES
NOTES TO CONSOLIDATED FINANCIAL STATEMENTS
(Tabular amounts in millions, unless otherwise disclosed)
The following table outlines key terms related to the Company’s outstanding senior notes as of December 31, 2017:
|
| | | | | | | | | | | | | |
| | | | Adjustments to Principal Amount (1) | | | | | |
| | Aggregate Principal Amount | | 2017 | | 2016 | | Interest payments due (2) | | Issue Date | Par Call Date (3) |
| 3.40% Notes (4) | 1,000.0 |
| | (0.2 | ) | | (0.3 | ) | | February 15 and August 15 | | August 19, 2013 | N/A |
| 2.800% Notes | 750.0 |
| | (3.7 | ) | | (5.1 | ) | | June 1 and December 1 | | May 7, 2015 | May 1, 2020 |
| 5.050% Notes | 700.0 |
| | (2.0 | ) | | (2.6 | ) | | March 1 and September 1 | | August 16, 2010 | N/A |
| 3.300% Notes | 750.0 |
| | (4.0 | ) | | (5.2 | ) | | February 15 and August 15 | | January 12, 2016 | January 15, 2021 |
| 3.450% Notes | 650.0 |
| | (4.9 | ) | | (6.2 | ) | | March 15 and September 15 | | August 7, 2014 | N/A |
| 5.900% Notes | 500.0 |
| | (2.2 | ) | | (2.7 | ) | | May 1 and November 1 | | October 6, 2011 | N/A |
| 2.250% Notes (5) | 600.0 |
| | (27.6 | ) | | (27.2 | ) | | January 15 and July 15 | | September 30, 2016 | N/A |
| 4.70% Notes | 700.0 |
| | (3.3 | ) | | (4.0 | ) | | March 15 and September 15 | | March 12, 2012 | N/A |
| 3.50% Notes | 1,000.0 |
| | (9.1 | ) | | (10.7 | ) | | January 31 and July 31 | | January 8, 2013 | N/A |
| 3.000% Notes (6) | 700.0 |
| | (7.5 | ) | | — |
| | June 15 and December 15 | | December 8, 2017 | N/A |
| 5.00% Notes (4) | 1,000.0 |
| | 2.4 |
| | 2.7 |
| | February 15 and August 15 | | August 19, 2013 | N/A |
| 1.375% Notes (7) | 600.2 |
| | (11.1 | ) | | — |
| | April 4 | | April 6, 2017 | January 4, 2025 |
| 4.000% Notes | 750.0 |
| | (9.0 | ) | | (10.0 | ) | | June 1 and December 1 | | May 7, 2015 | March 1, 2025 |
| 4.400% Notes | 500.0 |
| | (4.4 | ) | | (4.8 | ) | | February 15 and August 15 | | January 12, 2016 | November 15, 2025 |
| 3.375% Notes | 1,000.0 |
| | (15.2 | ) | | (16.6 | ) | | April 15 and October 15 | | May 13, 2016 | July 15, 2026 |
| 3.125% Notes | 400.0 |
| | (2.9 | ) | | (3.3 | ) | | January 15 and July 15 | | September 30, 2016 | October 15, 2026 |
| 3.55% Notes | 750.0 |
| | (7.2 | ) | | — |
| | January 15 and July 15 | | June 30, 2017 | April 15, 2027 |
| 3.600% Notes | 700.0 |
| | (8.9 | ) | | — |
| | January 15 and July 15 | | December 8, 2017 | October 15, 2027 |
_______________
| |
| (1) | Includes unamortized discounts, premiums and debt issuance costs and fair value adjustments due to interest rate swaps. |
| |
| (2) | Interest payments are due semi-annually for each series of senior notes, except for the 1.375% Notes, for which interest payments are due annually on April 4. |
| |
| (3) | The Company will not be required to pay a make-whole premium if redeemed on or after the par call date. |
| |
| (4) | The original issue date for the 3.40% Notes and the 5.00% Notes was August 19, 2013. The issue date for the reopened 3.40% Notes and the reopened 5.00% Notes was January 10, 2014. |
| |
| (5) | Includes $23.7 million and $22.3 million fair value adjustment due to interest rate swaps in 2017 and 2016, respectively. |
| |
| (6) | Includes $0.8 million fair value adjustment due to interest rate swaps. |
| |
| (7) | Note is denominated in Euro. |
The Company may redeem each series of senior notes at any time, subject to the terms of the applicable supplemental indenture, in whole or in part, at a redemption price equal to 100% of the principal amount of the notes plus a make-whole premium, together with accrued interest to the redemption date. In addition, if the Company undergoes a change of control and corresponding ratings decline, each as defined in the applicable supplemental indenture, it may be required to repurchase all of the applicable notes at a purchase price equal to 101% of the principal amount of such notes, plus accrued and unpaid interest (including additional interest, if any), up to but not including the repurchase date. The notes rank equally with all of the Company’s other senior unsecured debt and are structurally subordinated to all existing and future indebtedness and other obligations of its subsidiaries.
Each applicable supplemental indenture for the notes contains certain covenants that restrict the Company’s ability to merge, consolidate or sell assets and its (together with its subsidiaries’) ability to incur liens. These covenants are subject to a number of exceptions, including that the Company and its subsidiaries may incur certain liens on assets, mortgages or other liens securing indebtedness if the aggregate amount of such liens does not exceed 3.5x Adjusted EBITDA, as defined in the applicable supplemental indenture.
Redemption of Senior Notes— On February 10, 2017, the Company redeemed all of the outstanding 7.25% senior unsecured notes due 2019 (the “7.25% Notes”) at a price equal to 112.0854% of the principal amount, plus accrued and unpaid interest up to, but excluding, February 10, 2017, for an aggregate redemption price of $341.4 million, including $5.1 million in accrued and unpaid interest. The Company recorded a loss on retirement of long-term obligations of $39.2 million, which includes prepayment
AMERICAN TOWER CORPORATION AND SUBSIDIARIES
NOTES TO CONSOLIDATED FINANCIAL STATEMENTS
(Tabular amounts in millions, unless otherwise disclosed)
consideration of $36.3 million and the remaining portion of the unamortized discount and deferred financing costs. Upon completion of the redemption, none of the 7.25% Notes remained outstanding.
On July 31, 2017, the Company redeemed all of the outstanding 4.500% senior unsecured notes due 2018 (the “4.500% Notes”) at a price equal to 101.3510% of the principal amount, plus accrued and unpaid interest up to, but excluding, July 31, 2017, for an aggregate redemption price of $1.0 billion, including $2.0 million in accrued and unpaid interest. The Company recorded a loss on retirement of long-term obligations of $14.1 million which includes prepayment consideration of $13.5 million and the remaining portion of the unamortized discount and deferred financing costs. Upon completion of the redemption, none of the 4.500% Notes remained outstanding.
The redemptions described above were funded with borrowings under the 2013 Credit Facility and cash on hand.
American Tower Subsidiary Debt
Subsidiary Debt
The Company has several securitizations in place. Cash flows generated by the sites that secure the securitized debt are only available for payment of such debt and are not available to pay the Company’s other obligations or the claims of its creditors. However, subject to certain restrictions, the Company holds the right to the excess cash flows not needed to pay the securitized debt and other obligations arising out of the securitizations. The securitized debt is the obligation of the issuers thereof or borrowers thereunder, as applicable, and their subsidiaries, and not of the Company or its other subsidiaries.
Secured Tower Revenue Securities, Series 2013-1A and Series 2013-2A—In March 2013, the Company completed a private issuance (the “2013 Securitization”) of $1.8 billion of Secured Tower Revenue Securities, Series 2013-1A (the “Series 2013-1A Securities”) and Series 2013-2A (the “Series 2013-2A Securities,” and together with the Series 2013-1A Securities, the “2013 Securities”) issued by American Tower Trust I (the “Trust”), a trust established by American Tower Depositor Sub, LLC, a wholly owned special purpose subsidiary of the Company. The net proceeds of the transaction were $1.78 billion. The assets of the Trust consist of a nonrecourse loan (the “Loan”) to American Tower Asset Sub, LLC and American Tower Asset Sub II, LLC (the “AMT Asset Subs”), pursuant to a First Amended and Restated Loan and Security Agreement dated as of March 15, 2013 (the “Loan Agreement”).
The Loan is secured by (i) mortgages, deeds of trust and deeds to secure debt on substantially all of the 5,178 wireless and broadcast communications towers owned by the AMT Asset Subs (the “2013 Secured Towers”), (ii) a pledge of the AMT Asset Subs’ operating cash flows from the 2013 Secured Towers, (iii) a security interest in substantially all of the AMT Asset Subs’ personal property and fixtures and (iv) the AMT Asset Subs’ rights under the tenant leases and the management agreement entered into in connection with the 2013 Securitization. American Tower Holding Sub, LLC, whose only material assets are its equity interests in each of the AMT Asset Subs, and American Tower Guarantor Sub, LLC, whose only material asset are its equity interests in American Tower Holding Sub, LLC, each have guaranteed repayment of the Loan and pledged their equity interests in their respective subsidiary or subsidiaries as security for such payment obligations.
The 2013 Securities were issued in two separate series of the same class pursuant to a First Amended and Restated Trust and Servicing Agreement, with terms identical to the Loan. The effective weighted average life and interest rate of the 2013 Securities was 8.6 years and 2.648%, respectively, as of the date of issuance.
American Tower Secured Revenue Notes, Series 2015-1, Class A and Series 2015-2, Class A—In May 2015, GTP Acquisition Partners I, LLC (“GTP Acquisition Partners”), one of the Company’s wholly owned subsidiaries, refinanced existing debt with cash on hand and proceeds from a private issuance (the “2015 Securitization”) of $350.0 million of American Tower Secured Revenue Notes, Series 2015-1, Class A (the “Series 2015-1 Notes”) and $525.0 million of American Tower Secured Revenue Notes, Series 2015-2, Class A (the “Series 2015-2 Notes,” and together with the Series 2015-1 Notes, the “2015 Notes”).
The 2015 Notes are secured by (i) mortgages, deeds of trust and deeds to secure debt on substantially all of the 3,583 communications sites (the “2015 Secured Sites”) owned by GTP Acquisition Partners and its subsidiaries (the “GTP Entities”) and their operating cash flows, (ii) a security interest in substantially all of the personal property and fixtures of the GTP Entities, including GTP Acquisition Partners’ equity interests in its subsidiaries and (iii) the rights of the GTP Entities under a management agreement. American Tower Holding Sub II, LLC, whose only material assets are its equity interests in GTP Acquisition Partners, has guaranteed repayment of the 2015 Notes and pledged its equity interests in GTP Acquisition Partners as security for such payment obligations.
AMERICAN TOWER CORPORATION AND SUBSIDIARIES
NOTES TO CONSOLIDATED FINANCIAL STATEMENTS
(Tabular amounts in millions, unless otherwise disclosed)
The 2015 Notes were issued by GTP Acquisition Partners pursuant to a Third Amended and Restated Indenture and related series supplements, each dated as of May 29, 2015 (collectively, the “2015 Indenture”), between the GTP Entities and The Bank of New York Mellon, as trustee. The effective weighted average life and interest rate of the 2015 Notes was 8.1 years and 3.029%, respectively, as of the date of issuance.
Under the terms of the Loan Agreement and 2015 Indenture, amounts due will be paid from the cash flows generated by the 2013 Secured Towers or the 2015 Secured Sites, respectively, which must be deposited into certain reserve accounts, and thereafter distributed solely pursuant to the terms of the Loan Agreement or 2015 Indenture, as applicable. On a monthly basis, after payment of all required amounts under the Loan Agreement or 2015 Indenture, as applicable, including interest payments, subject to the conditions described below, the excess cash flows generated from the operation of such assets are released to the AMT Asset Subs or GTP Acquisition Partners, as applicable, which can then be distributed to, and used by, the Company.
In order to distribute any excess cash flow to the Company, the AMT Asset Subs and GTP Acquisition Partners must each maintain a specified debt service coverage ratio (the “DSCR”), which is generally calculated as the ratio of the net cash flow (as defined in the applicable agreement) to the amount of interest, servicing fees and trustee fees required to be paid over the succeeding 12 months on the principal amount of the Loan or the 2015 Notes, as applicable, that will be outstanding on the payment date following such date of determination. If the DSCR were equal to or below 1.30x (the “Cash Trap DSCR”) for any quarter, then all cash flow in excess of amounts required to make debt service payments, fund required reserves, pay management fees and budgeted operating expenses and make other payments required under the applicable transaction documents, referred to as excess cash flow, will be deposited into a reserve account (the “Cash Trap Reserve Account”) instead of being released to the AMT Asset Subs or GTP Acquisition Partners, as applicable. The funds in the Cash Trap Reserve Account will not be released to the AMT Asset Subs or GTP Acquisition Partners, as applicable, unless the DSCR exceeds the Cash Trap DSCR for two consecutive calendar quarters.
Additionally, an “amortization period” commences if, as of the end of any calendar quarter, the DSCR is equal to or below 1.15x (the “Minimum DSCR”) and will continue to exist until the DSCR exceeds the Minimum DSCR for two consecutive calendar quarters. With respect to the 2013 Securities, an “amortization period” also commences if, on the anticipated repayment date the component of the Loan corresponding to the applicable subclass of the 2013 Securities has not been repaid in full, provided that such amortization period shall apply with respect to such component that has not been repaid in full. If either series of the 2015 Notes have not been repaid in full on the applicable anticipated repayment date, additional interest will accrue on the unpaid principal balance of the applicable series of the 2015 Notes, and such series will begin to amortize on a monthly basis from excess cash flow. During an amortization period, all excess cash flow and any amounts then in the applicable Cash Trap Reserve Account would be applied to pay the principal of the Loan or the 2015 Notes, as applicable, on each monthly payment date.
The Loan and the 2015 Notes may be prepaid in whole or in part at any time, provided such payment is accompanied by the applicable prepayment consideration. If the prepayment occurs within 12 months of the anticipated repayment date with respect to the Series 2013-1A Securities or the Series 2015-1 Notes, or 18 months of the anticipated repayment date with respect to the Series 2013-2A Securities or the Series 2015-2 Notes, no prepayment consideration is due. The Loan may be defeased in whole at any time prior to the anticipated repayment date for any component of the Loan then outstanding.
The Loan Agreement and the 2015 Indenture include operating covenants and other restrictions customary for transactions subject to rated securitizations. Among other things, the AMT Asset Subs and the GTP Entities, as applicable, are prohibited from incurring other indebtedness for borrowed money or further encumbering their assets subject to customary carve-outs for ordinary course trade payables and permitted encumbrances (as defined in the Loan Agreement or the 2015 Indenture, as applicable). The organizational documents of the AMT Asset Subs and the GTP Entities contain provisions consistent with rating agency securitization criteria for special purpose entities, including the requirement that they maintain independent directors. The Loan Agreement and the 2015 Indenture also contain certain covenants that require the AMT Asset Subs or GTP Acquisition Partners, as applicable, to provide the respective trustee with regular financial reports and operating budgets, promptly notify such trustee of events of default and material breaches under the Loan Agreement and other agreements related to the 2013 Secured Towers or the 2015 Indenture and other agreements related to the 2015 Secured Sites, as applicable, and allow the applicable trustee reasonable access to the sites, including the right to conduct site investigations.
A failure to comply with the covenants in the Loan Agreement or the 2015 Indenture could prevent the AMT Asset Subs or GTP Acquisition Partners, as applicable, from distributing excess cash flow to the Company. Furthermore, if the AMT Asset Subs or GTP Acquisition Partners were to default on the Loan or a series of the 2015 Notes, the applicable trustee may seek to foreclose upon or otherwise convert the ownership of all or any portion of the 2013 Secured Towers or the 2015 Secured Sites, respectively, in which case the Company could lose the revenue associated with those assets. With respect to the 2015 Notes, upon the
AMERICAN TOWER CORPORATION AND SUBSIDIARIES
NOTES TO CONSOLIDATED FINANCIAL STATEMENTS
(Tabular amounts in millions, unless otherwise disclosed)
occurrence and during an event of default, the applicable trustee may, in its discretion or at the direction of holders of more than 50% of the aggregate outstanding principal of any series of the 2015 Notes, declare such series of 2015 Notes immediately due and payable, in which case any excess cash flow would need to be used to pay holders of such notes.
Further, under the Loan Agreement and the 2015 Indenture, the AMT Asset Subs or GTP Acquisition Partners, respectively, are required to maintain reserve accounts, including for amounts received or due from tenants related to future periods, property taxes, insurance, ground rents, certain expenses and debt service. Based on the terms of the Loan Agreement and the 2015 Indenture, all rental cash receipts received for each month are reserved for the succeeding month and held in an account controlled by the applicable trustee and then released. The $90.4 million held in the reserve accounts with respect to the 2013 Securitization and the $16.9 million held in the reserve accounts with respect to the 2015 Securitization as of December 31, 2017 are classified as Restricted cash on the Company’s accompanying consolidated balance sheets.
Repayment of 2012 GTP Notes and Unison Notes—On February 15, 2017, the Company repaid the $173.5 million remaining principal amount outstanding under the Secured Cellular Site Revenue Notes, Series 2012-2 Class A, Series 2012-2 Class B and Series 2012-2 Class C issued by GTP Cellular Sites, LLC, plus prepayment consideration and accrued and unpaid interest. The Company recorded a loss on retirement of long-term obligations of $1.8 million, which includes prepayment consideration of $7.2 million offset by the remaining portion of the unamortized premium.
On February 15, 2017, the Company repaid the $129.0 million principal amount outstanding under the Secured Cellular Site Revenue Notes, Series 2010-2, Class C and Series 2010-2, Class F issued by Unison Ground Lease Funding, LLC, plus prepayment consideration and accrued and unpaid interest. The Company recorded a loss on retirement of long-term obligations of $14.5 million, which includes prepayment consideration of $18.3 million offset by the remaining portion of the unamortized premium.
The repayments described above were funded with borrowings under the 2013 Credit Facility and cash on hand.
India indebtedness—Amounts outstanding and key terms of the India indebtedness consisted of the following as of December 31, 2017 (in millions, except percentages):
|
| | | | | | | | | | | | | |
| | | | Amount Outstanding (INR) | | Amount Outstanding (USD) | | Interest Rate (Range) | | Maturity Date (Range) |
| Term loans | | 26,740 |
| | $ | 418.7 |
| | 7.90% - 8.65% |
| | January 24, 2018 - November 30, 2024 |
| Debenture | | 6,000 |
| | $ | 93.9 |
| | 9.55 | % | | April 28, 2020 |
| Working capital facilities | | 0 |
| | $ | 0 |
| | 8.05% - 8.75% |
| | March 18, 2018 - October 23, 2018 |
The India indebtedness includes several term loans, ranging from 1 to 10 years, which are generally secured by the borrower’s short-term and long-term assets. Each of the term loans bear interest at the applicable bank’s Marginal Cost of Funds based Lending Rate (as defined in the applicable agreement) or base rate, plus a spread. Interest rates on the term loans are fixed until certain reset dates. Generally, the term loans can be repaid without penalty on the reset dates; repayments at dates other than the reset dates are subject to prepayment penalties, typically of 1% to 2%. Scheduled repayment terms include either ratable or staggered amortization with repayments typically commencing between 6 and 36 months after the initial disbursement of funds.
The debentureis secured by the borrower’s long-term assets, including property and equipment and intangible assets. The debenture bears interest at a base rate plus a spread of 0.6%. The base rate is set in advance for each quarterly coupon period. Should the actual base rate be between 9.75% and 10.25%, the revised base rate is assumed to be 10.00% for purposes of the reset. Additionally, the spread is subject to reset 36 and 48 months from the issuance date of April 27, 2015. The holders of the debenture must reach a consensus on the revised spread and the borrower must redeem all of the debentures held by holders from whom consensus is not achieved. Additionally, the debenture is required to be redeemed by the borrower if it does not maintain a minimum credit rating.
The India indebtedness includes several working capital facilities, most of which are subject to annual renewal, and which are generally secured by the borrower’s short-term and long-term assets. The working capital facilities bear interest at rates that are comprised of the applicable bank’s Marginal Cost of Funds based Lending Rate (as defined in the applicable agreement) or base rate, plus a spread. Generally, the working capital facilities are payable on demand prior to maturity.
Preference shares—On March 2, 2017, ATC TIPL issued 166,666,666 Preference Shares and used the proceeds to redeem the Viom Preference Shares. As of December 31, 2017, ATC TIPL had 166,666,666 Preference Shares outstanding, which are
AMERICAN TOWER CORPORATION AND SUBSIDIARIES
NOTES TO CONSOLIDATED FINANCIAL STATEMENTS
(Tabular amounts in millions, unless otherwise disclosed)
required to be redeemed in cash. Accordingly, the Company recognized debt of 1.67 billion INR ($26.1 million) related to the Preference Shares outstanding on the consolidated balance sheet.
Unless redeemed earlier, the Preference Shares will be redeemed on March 2, 2020 in an amount equal to ten INR per share along with a redemption premium, as defined in the investment agreement, which equates to a compounded return of 10.25% per annum.
Other Subsidiary Debt—The Company’s other subsidiary debt includes (i) publicly issued simple debentures in Brazil (the “BR Towers Debentures”) issued by a subsidiary of BR Towers and assumed by the Company in its acquisition of BR Towers, (ii) a credit facility entered into by one of the Company’s South African subsidiaries in December 2015, as amended (the “South African Credit Facility”), (iii) a long-term credit facility entered into by one of the Company’s Colombian subsidiaries in October 2014 (the “Colombian Credit Facility”) and (iv) a credit facility entered into by one of the Company’s Brazilian subsidiaries in December 2014 (the “Brazil Credit Facility”) with Banco Nacional de Desenvolvimento Econômico e Social.
Amounts outstanding and key terms of other subsidiary debt consisted of the following as of December 31, (in millions, except percentages):
|
| | | | | | | | | | | | | | | | | | | |
| | | Carrying Value (Functional Currency) | | Carrying Value (USD) (1) | | Interest Rate | | Maturity Date |
| | | 2017 | | 2016 | | 2017 | | 2016 | | | | |
| BR Towers Debentures (2) | | 306.8 |
| | 329.3 |
| | $ | 92.7 |
| | $ | 101.0 |
| | 7.400 | % | | October 15, 2023 |
| South African Credit Facility (3) | | 866.0 |
| | 1,157.6 |
| | $ | 69.9 |
| | $ | 84.3 |
| | 9.108 | % | | December 17, 2020 |
| Colombian Credit Facility (4) | | 138,740.3 |
| | 168,286.5 |
| | $ | 46.5 |
| | $ | 56.1 |
| | 8.513 | % | | April 24, 2021 |
| Brazil Credit Facility (5) | | 122.4 |
| | 145.4 |
| | $ | 37.0 |
| | $ | 44.6 |
| | Various |
| | January 15, 2022 |
_______________
| |
| (1) | Includes applicable deferred financing costs. |
| |
| (2) | Denominated in BRL, with an original principal amount of 300.0 million BRL. Debt accrues interest at a variable rate. The aggregate principal amount of the BR Towers Debentures may be adjusted periodically relative to changes in the National Extended Consumer Price Index. |
| |
| (3) | Denominated in ZAR, with an original principal amount of 830.0 million ZAR. On December 23, 2016, the borrower borrowed an additional 500.0 million ZAR. Debt accrues interest at a variable rate. |
| |
| (4) | Denominated in COP, with an original principal amount of 200.0 billion COP. Debt accrues interest at a variable rate. The loan agreement for the Colombian Credit Facility requires that the borrower manage exposure to variability in interest rates on certain of the amounts outstanding under the Colombian Credit Facility. |
| |
| (5) | Denominated in BRL, with an original principal amount of 271.0 million BRL. Debt accrues interest at a variable rate. As of December 30, 2016, the borrower no longer maintains the ability to draw on the Brazil Credit Facility. |
Pursuant to the agreements governing the BR Towers Debentures, the South African Credit Facility and the Colombian Credit Facility, payments of principal and interest are generally payable quarterly in arrears. Outstanding principal and accrued but unpaid interest will be due and payable in full at maturity. The BR Towers Debentures may be redeemed beginning on October 15, 2018 at the then outstanding principal amount plus a surcharge and all accrued and unpaid interest thereon. The South African Credit Facility may be prepaid in whole or in part without prepayment consideration. The Colombian Credit Facility may be prepaid in whole or in part at any time, subject to certain limitations and prepayment consideration.
The South African Credit Facility, the Colombian Credit Facility and the Brazil Credit Facility are secured by, among other things, liens on towers owned by the applicable borrower. The BR Towers Debentures are secured by (i) 100% of the shares of the issuer thereof and (ii) all proceeds and rights from the issuance of the BR Towers Debentures, including amounts in a Resource Account, as defined in the applicable agreement.
Each of the agreements governing the other subsidiary debt contains contractual covenants and other restrictions. Failure to comply with certain of the financial and operating covenants could constitute a default under the applicable debt agreement, which could result in, among other things, the amounts outstanding, including all accrued interest and unpaid fees, becoming immediately due and payable.
Shareholder Loans—In connection with the establishment of certain of the Company’s joint ventures and related acquisitions of communications sites in Ghana and Uganda, the Company’s majority owned subsidiaries entered into shareholder loan agreements, as borrowers, with wholly owned subsidiaries of the Company and of the Company’s joint venture partners, as lenders. The portions of the loans made by the Company’s wholly owned subsidiaries are eliminated in consolidation and the portions of the loans made by each of the Company’s joint venture partner’s wholly owned subsidiaries are reported as
AMERICAN TOWER CORPORATION AND SUBSIDIARIES
NOTES TO CONSOLIDATED FINANCIAL STATEMENTS
(Tabular amounts in millions, unless otherwise disclosed)
outstanding debt of the Company. Outstanding amounts under each of the Company’s shareholder loans consisted of the following as of December 31,:
|
| | | | | | | | | | | | |
| | 2017 | | 2016 | | Contractual Interest Rate | | Maturity Date |
| Ghana loan (1) | $ | 66.5 |
| | $ | 71.0 |
| | 21.87 | % | | December 31, 2019 |
| Uganda loan (2) | 34.1 |
| | 80.1 |
| | 16.80 | % | | December 31, 2023 |
_______________
| |
| (1) | Denominated in GHS. As of December 31, 2017, the aggregate principal amount outstanding under the Ghana loan was 300.9 million GHS. |
| |
| (2) | Denominated in UGX. Effective January 1, 2017, the Uganda loan, which had an outstanding balance of $80.0 million and accrued interest at a variable rate, was converted by the holder to a new shareholder note for 114.5 billion UGX ($31.8 million at the time of conversion), bearing interest at a fixed rate of 16.8% per annum. The remaining balance of the Uganda loan was converted into equity. As of December 31, 2017, the aggregate principal amount outstanding under the Uganda loan was 124.1 billion UGX. |
Capital Lease and Other Obligations—The Company’s capital lease and other obligations approximated $165.5 million and $135.9 million as of December 31, 2017 and 2016, respectively. These obligations are secured by the related assets, bear interest at rates of 3.53% to 9.20%, and mature in periods ranging from less than one year to approximately seventy years.
Maturities—Aggregate principal maturities of long-term debt, including capital leases, for the next five years and thereafter are expected to be:
|
| | | |
| Year Ending December 31, | |
| 2018 | $ | 775.0 |
|
| 2019 | 1,192.6 |
|
| 2020 | 2,034.0 |
|
| 2021 | 4,051.2 |
|
| 2022 | 1,388.7 |
|
| Thereafter | 10,908.1 |
|
| | |
| Total cash obligations | 20,349.6 |
|
| Unamortized discounts, premiums and debt issuance costs and fair value adjustments, net | (144.5 | ) |
| | |
| Balance as of December 31, 2017 | $ | 20,205.1 |
|
| | |
9. OTHER NON-CURRENT LIABILITIES
Other non-current liabilities consisted of the following as of December 31,:
|
| | | | | | | |
| | 2017 | | 2016 |
| Unearned revenue | $ | 509.2 |
| | $ | 457.3 |
|
| Deferred rent liability | 467.0 |
| | 407.2 |
|
| Other miscellaneous liabilities | 268.0 |
| | 278.1 |
|
| Other non-current liabilities | $ | 1,244.2 |
| | $ | 1,142.6 |
|
10. ASSET RETIREMENT OBLIGATIONS
The changes in the carrying amount of the Company’s asset retirement obligations were as follows:
|
| | | | | | | |
| | 2017 | | 2016 |
| Beginning balance as of January 1, | $ | 965.5 |
| | $ | 856.9 |
|
| Additions | 33.4 |
| | 64.1 |
|
| Accretion expense | 94.5 |
| | 67.0 |
|
| Revisions in estimates (1) | 86.6 |
| | (21.1 | ) |
| Settlements | (4.7 | ) | | (1.4 | ) |
| Balance as of December 31, | $ | 1,175.3 |
| | $ | 965.5 |
|
_______________
AMERICAN TOWER CORPORATION AND SUBSIDIARIES
NOTES TO CONSOLIDATED FINANCIAL STATEMENTS
(Tabular amounts in millions, unless otherwise disclosed)
| |
| (1) | Revisions in estimates include an increase to the liability of $13.0 million and $9.6 million related to foreign currency translation for the years ended December 31, 2017 and 2016, respectively. |
As of December 31, 2017, the estimated undiscounted future cash outlay for asset retirement obligations was $3.0 billion.
11. FAIR VALUE MEASUREMENTS
The Company determines the fair value of its financial instruments based on the fair value hierarchy, which requires an entity to maximize the use of observable inputs and minimize the use of unobservable inputs when measuring fair value. Below are the three levels of inputs that may be used to measure fair value:
|
| | |
| Level 1 | Quoted prices in active markets for identical assets or liabilities that the Company has the ability to access at the measurement date. |
| | |
| Level 2 | Observable inputs other than Level 1 prices, such as quoted prices for similar assets or liabilities; quoted prices in markets that are not active; or other inputs that are observable or can be corroborated by observable market data for substantially the full term of the assets or liabilities. |
| | |
| Level 3 | Unobservable inputs that are supported by little or no market activity and that are significant to the fair value of the assets or liabilities. |
Items Measured at Fair Value on a Recurring Basis—The fair value of the Company’s financial assets and liabilities that are required to be measured on a recurring basis at fair value was as follows:
|
| | | | | | | | | | | | | | | | | | | | | | |
| | | December 31, 2017 | | December 31, 2016 |
| | | Fair Value Measurements Using | | Fair Value Measurements Using |
| | | Level 1 | Level 2 | | Level 3 | | Level 1 | Level 2 | | Level 3 |
| Assets: | | | | | | | | | | |
| Short-term investments (1) | | $ | 1.0 |
| — |
| | — |
| | $ | 4.0 |
| — |
| | — |
|
| Interest rate swap agreements | | — |
| — |
| | — |
| | — |
| $ | 0.0 |
| | — |
|
| Embedded derivative in lease agreement | | — |
| — |
| | $ | 12.4 |
| | — |
| — |
| | $ | 13.3 |
|
| Liabilities: | | | | | | | | | | |
| Interest rate swap agreements | | — |
| $ | 29.0 |
| | — |
| | — |
| $ | 24.7 |
| | — |
|
| Acquisition-related contingent consideration | | — |
| — |
| | $ | 10.1 |
| | — |
| — |
| | $ | 15.4 |
|
| Fair value of debt related to interest rate swap agreements | | $ | (24.5 | ) | — |
| | — |
| | $ | (22.3 | ) | — |
| | — |
|
_______________
| |
| (1) | Consists of highly liquid investments with original maturities in excess of three months. |
Interest Rate Swap Agreements
The fair value of the Company’s interest rate swap agreements is determined using pricing models with inputs that are observable in the market or can be derived principally from, or corroborated by, observable market data. For derivative instruments that are designated and qualify as fair value hedges, changes in value of the derivatives are recognized in the consolidated statement of operations in the current period, along with the offsetting gain or loss on the hedged item attributable to the hedged risk. For derivative instruments that are designated and qualify as cash flow hedges, the Company records the change in fair value for the effective portion of the cash flow hedges in AOCL in the consolidated balance sheets and reclassifies a portion of the value from AOCL into Interest expense on a quarterly basis as the cash flows from the hedged item affects earnings. The Company records the settlement of interest rate swap agreements in (Loss) gain on retirement of long-term obligations in the consolidated statements of operations in the period in which the settlement occurs.
AMERICAN TOWER CORPORATION AND SUBSIDIARIES
NOTES TO CONSOLIDATED FINANCIAL STATEMENTS
(Tabular amounts in millions, unless otherwise disclosed)
In December 2017, the Company entered into three interest rate swap agreements with an aggregate notional value of $500.0 million related to the 3.000% Notes. These interest rate swaps, which were designated as fair value hedges at inception, were entered into to hedge against changes in fair value of the 3.000% Notes resulting from changes in interest rates. The interest rate swap agreements require the Company to pay interest at a variable interest rate of one-month LIBOR plus applicable spreads and to receive fixed interest at a rate of 3.000% through June 15, 2023.
The Company entered into three interest rate swap agreements with an aggregate notional value of $600.0 million related to the 2.250% Notes. These interest rate swaps, which were designated as fair value hedges at inception, were entered into to hedge against changes in fair value of the 2.250% Notes resulting from changes in interest rates. The interest rate swap agreements require the Company to pay interest at a variable interest rate of one-month LIBOR plus applicable spreads and to receive fixed interest at a rate of 2.250% through January 15, 2022.
The fair value of the interest rate swap agreements in the U.S. at December 31, 2017 and 2016 is $28.5 million and $24.7 million, respectively, and were included in Other non-current liabilities on the consolidated balance sheet. During the year ended December 31, 2017, the Company recorded a net fair value adjustment of $1.5 million related to interest rate swaps and the change in fair value of debt due to interest rate swaps in Other expense in the consolidated statement of operations.
One of the Company’s Colombian subsidiaries is party to an interest rate swap agreement with an aggregate notional value of 70.0 billion COP ($23.5 million) with certain of the lenders under the Colombian Credit Facility. The interest rate swap agreement, which was designated as a cash flow hedge at inception, was entered into to manage exposure to variability in interest rates on debt. The interest rate swap agreement requires the payment of a fixed interest rate of 5.74% and pays variable interest at the three-month Inter-bank Rate (IBR) through the earlier of termination of the underlying debt or April 24, 2021. The notional value is reduced in accordance with the repayment schedule under the Colombian Credit Facility. The fair value of the interest rate swap agreements in Colombia at December 31, 2017 was $0.5 million and was included in Other non-current liabilities on the consolidated balance sheet.
Embedded Derivative in Lease Agreement
In connection with the acquisition of communications sites in Nigeria, the Company entered into a site lease agreement where a portion of the monthly rent to be received is escalated based on an index outside the lessor’s economic environment. The fair value of the portion of the lease tied to the U.S. CPI was $14.6 million at the date of acquisition and was recorded in Notes receivable and other non-current assets on the consolidated balance sheet. The fair value of the Company’s embedded derivative is determined using a discounted cash flow approach, which takes into consideration Level 3 unobservable inputs, including expected future cash flows over the period in which the associated payment is expected to be received and applies a discount factor that captures uncertainties in the future periods associated with the expected payment. During the year ended December 31, 2017, the Company recorded $0.9 million of a fair value adjustment, which was recorded in Other expense in the consolidated statement of operations.
Acquisition-Related Contingent Consideration
Acquisition-related contingent consideration is initially measured and recorded at fair value as an element of consideration paid in connection with an acquisition with subsequent adjustments recognized in Other operating expenses in the consolidated statements of operations. The fair value of acquisition-related contingent consideration, and any subsequent changes in fair value, is determined by using a discounted probability-weighted approach, which takes into consideration Level 3 unobservable inputs, including assessments of expected future cash flows over the period in which the obligation is expected to be settled, and applies a discount factor that captures the uncertainties associated with the obligation. Changes in the unobservable inputs of Level 3 assets or liabilities could significantly impact the fair value of these assets or liabilities recorded in the accompanying consolidated balance sheets, with the adjustments being recorded in the consolidated statements of operations.
AMERICAN TOWER CORPORATION AND SUBSIDIARIES
NOTES TO CONSOLIDATED FINANCIAL STATEMENTS
(Tabular amounts in millions, unless otherwise disclosed)
As of December 31, 2017, the Company estimates that the value of all potential acquisition-related contingent consideration required payments to be between $9.1 million and $10.1 million. The changes in fair value of the contingent consideration were as follows during the years ended December 31,:
|
| | | | | | | |
| | 2017 | | 2016 |
| Balance as of January 1 | $ | 15.4 |
| | $ | 12.4 |
|
| Additions | — |
| | 8.8 |
|
| Settlements | — |
| | (0.3 | ) |
| Change in fair value | (6.3 | ) | | (6.4 | ) |
| Foreign currency translation adjustment | 1.0 |
| | 0.9 |
|
| Balance as of December 31 | $ | 10.1 |
| | $ | 15.4 |
|
Items Measured at Fair Value on a Nonrecurring Basis
Assets Held and Used—The Company’s long-lived assets are recorded at amortized cost and, if impaired, are adjusted to fair value using Level 3 inputs. During the year ended December 31, 2017, certain long-lived assets held and used with a carrying value of $21.7 billion were written down to their net realizable value as a result of an asset impairment charge of $211.4 million. During the year ended December 31, 2016, certain long-lived assets held and used with a carrying value of $12.7 billion were written down to their net realizable value as a result of an asset impairment charge of $28.5 million. The asset impairment charges are recorded in Other operating expenses in the accompanying consolidated statements of operations. These adjustments were determined by comparing the estimated fair value utilizing projected future discounted cash flows to be provided from the long-lived assets to the asset’s carrying value.
There were no other items measured at fair value on a nonrecurring basis during the year ended December 31, 2017.
Fair Value of Financial Instruments—The Company’s financial instruments for which the carrying value reasonably approximates fair value at December 31, 2017 and 2016 include cash and cash equivalents, restricted cash, accounts receivable and accounts payable. The Company’s estimates of fair value of its long-term obligations, including the current portion, are based primarily upon reported market values. For long-term debt not actively traded, fair value is estimated using either indicative price quotes or a discounted cash flow analysis using rates for debt with similar terms and maturities. As of December 31, 2017, the carrying value and fair value of long-term obligations, including the current portion, were $20.2 billion and $20.6 billion, respectively, of which $13.3 billion was measured using Level 1 inputs and $7.3 billion was measured using Level 2 inputs. As of December 31, 2016, the carrying value and fair value of long-term obligations, including the current portion, were $18.5 billion and $18.8 billion, respectively, of which $11.8 billion was measured using Level 1 inputs and $7.0 billion was measured using Level 2 inputs.
12. INCOME TAXES
The Company has filed, for prior taxable years through its taxable year ended December 31, 2011, consolidated U.S. federal tax returns, which included all of its then wholly owned domestic subsidiaries. For its taxable year commencing January 1, 2012, the Company filed, and intends to continue to file, as a REIT, and its domestic TRSs filed, and intend to continue to file, separate tax returns as required. The Company also files tax returns in various states and countries. The Company’s state tax returns reflect different combinations of the Company’s subsidiaries and are dependent on the connection each subsidiary has with a particular state and form of organization. The following information pertains to the Company’s income taxes on a consolidated basis.
AMERICAN TOWER CORPORATION AND SUBSIDIARIES
NOTES TO CONSOLIDATED FINANCIAL STATEMENTS
(Tabular amounts in millions, unless otherwise disclosed)
The income tax provision from continuing operations consisted of the following for the years ended December 31,:
|
| | | | | | | | | | | |
| | 2017 | | 2016 | | 2015 |
| Current: | | | | | |
| Federal | $ | (0.1 | ) | | $ | (26.5 | ) | | $ | (73.9 | ) |
| State | (3.8 | ) | | (2.0 | ) | | (21.2 | ) |
| Foreign | (113.4 | ) | | (100.1 | ) | | (55.1 | ) |
| Deferred: | | | | | |
| Federal | 0.2 |
| | (0.6 | ) | | 9.1 |
|
| State | 1.0 |
| | (0.3 | ) | | — |
|
| Foreign | 85.4 |
| | (26.0 | ) | | (16.9 | ) |
| Income tax provision | $ | (30.7 | ) | | $ | (155.5 | ) | | $ | (158.0 | ) |
The effective tax rate (“ETR”) on income from continuing operations for the years ended December 31, 2017, 2016 and 2015 differs from the federal statutory rate primarily due to the Company’s qualification for taxation as a REIT, as well as adjustments for foreign items. As a REIT, the Company may deduct earnings distributed to stockholders against the income generated by its REIT operations. In addition, the Company is able to offset certain income by utilizing its NOLs, subject to specified limitations.
The Tax Act significantly changes how the U.S. taxes corporations. The Tax Act contains several key provisions including, among other things, a reduction in the corporate income rate from 35% to 21% for tax years beginning after December 31, 2017. As a result of this change in tax rate, the rate at which the Company’s deferred tax assets of the Company’s taxable REIT subsidiaries decreased, resulting in additional tax expense of $2.4 million, which did not significantly impact the Company's effective tax rate. However, the full impact of this change in tax law is provisional and subject to further analysis.
In 2015, there was an income tax law change in Ghana that disallowed unused capital allowances to be carried into 2016, which resulted in a charge to income tax expense for the year ended December 31, 2015. In 2017, the Ghana Revenue Authority issued Practice Note Number DT/2016/010 (the “Practice Note”), which clarified the Capital Allowance section of the Income Tax Act of 2015. The Practice Note allowed for unused Capital Allowance from 2015 to be treated as a deduction in 2016. As a result, the Company recorded a tax benefit of $17.8 million for the year ended December 31, 2017.
Reconciliation between the U.S. statutory rate and the effective rate from continuing operations is as follows for the years ended December 31:
|
| | | | | | | | |
| | 2017 | | 2016 | | 2015 |
| Statutory tax rate | 35 | % | | 35 | % | | 35 | % |
| Adjustment to reflect REIT status (1) | (35 | ) | | (35 | ) | | (35 | ) |
| Foreign taxes | 1 |
| | 5 |
| | 3 |
|
| Foreign withholding taxes | 3 |
| | 4 |
| | 3 |
|
| Uncertain tax positions | — |
| | 5 |
| | — |
|
| Changes in tax laws | (2 | ) | | — |
| | 2 |
|
| MIPT tax election (2) | — |
| | — |
| | 11 |
|
| Effective tax rate | 2 | % | | 14 | % | | 19 | % |
_______________
(1) As a result of the ability to utilize the dividends paid deduction to offset our REIT income and gains.
(2) Includes federal and state taxes, net of federal benefit.
The domestic and foreign components of income from continuing operations before income taxes are as follows for the years ended December 31,:
AMERICAN TOWER CORPORATION AND SUBSIDIARIES
NOTES TO CONSOLIDATED FINANCIAL STATEMENTS
(Tabular amounts in millions, unless otherwise disclosed)
|
| | | | | | | | | | | |
| | 2017 | | 2016 | | 2015 |
| United States | $ | 971.2 |
| | $ | 882.6 |
| | $ | 785.2 |
|
| Foreign | 284.9 |
| | 243.3 |
| | 44.8 |
|
| Total | $ | 1,256.1 |
| | $ | 1,125.9 |
| | $ | 830.0 |
|
The components of the net deferred tax asset and liability and related valuation allowance were as follows as of December 31,:
|
| | | | | | | |
| | 2017 | | 2016 |
| Assets: | | | |
| Net operating loss carryforwards | $ | 287.0 |
| | $ | 278.7 |
|
| Accrued asset retirement obligations | 157.0 |
| | 130.0 |
|
| Stock-based compensation | 3.9 |
| | 4.3 |
|
| Unearned revenue | 19.3 |
| | 29.0 |
|
| Unrealized loss on foreign currency | 27.4 |
| | 26.9 |
|
| Other accruals and allowances | 50.2 |
| | 45.6 |
|
| Items not currently deductible and other | 28.0 |
| | 26.9 |
|
| Liabilities: | | | |
| Depreciation and amortization | (1,073.9 | ) | | (942.4 | ) |
| Deferred rent | (35.9 | ) | | (27.1 | ) |
| Other | (14.7 | ) | | (9.4 | ) |
| Subtotal | (551.7 | ) | | (437.5 | ) |
| Valuation allowance | (142.0 | ) | | (144.4 | ) |
| Net deferred tax liabilities | $ | (693.7 | ) | | $ | (581.9 | ) |
Effective January 1, 2016, the Company adopted new guidance on the accounting for share-based payment transactions. As part of this new guidance, excess windfall tax benefits and tax deficiencies related to the Company’s stock option exercises and restricted stock unit vestings are recognized as an income tax benefit or expense in the consolidated statement of operations in the period in which the deduction occurs. Excess windfall tax benefits and tax deficiencies are therefore not anticipated when determining the annual ETR and are instead recognized in the interim period in which those items occur.
At December 31, 2017 and 2016, the Company has provided a valuation allowance of $142.0 million and $144.4 million, respectively, which primarily relates to foreign items. During 2017, the Company decreased the amounts recorded as valuation allowances in certain foreign jurisdictions as the Company believes these deferred tax assets are more likely than not to be realized. The decrease in the valuation allowance for the year ending December 31, 2017, is offset by an increase due to uncertainty as to the timing of, and the Company’s ability to recover, net deferred tax assets in certain foreign operations in the foreseeable future as well as fluctuations in foreign currency exchange rates. The amount of deferred tax assets considered realizable, however, could be adjusted if objective evidence in the form of cumulative losses is no longer present and additional weight may be given to subjective evidence such as the Company’s projections for growth.
A summary of the activity in the valuation allowance is as follows:
|
| | | | | | | | | | | | |
| | | 2017 | | 2016 | | 2015 |
| Balance as of January 1, | | $ | 144.4 |
| | $ | 137.0 |
| | $ | 141.2 |
|
| Additions (1) | | 11.6 |
| | 14.1 |
| | 19.5 |
|
| Reversals | | (9.1 | ) | | — |
| | — |
|
| Foreign currency translation | | (4.9 | ) | | (6.7 | ) | | (23.7 | ) |
| Balance as of December 31, | | $ | 142.0 |
| | $ | 144.4 |
| | $ | 137.0 |
|
_______________
(1) Includes net charges to expense and allowances established through goodwill at acquisition.
AMERICAN TOWER CORPORATION AND SUBSIDIARIES
NOTES TO CONSOLIDATED FINANCIAL STATEMENTS
(Tabular amounts in millions, unless otherwise disclosed)
The recoverability of the Company’s deferred tax assets has been assessed utilizing projections based on its current operations. Accordingly, the recoverability of the deferred tax assets is not dependent on material asset sales or other non-routine transactions. Based on its current outlook of future taxable income during the carryforward period, the Company believes that deferred tax assets, other than those for which a valuation allowance has been recorded, will be realized.
The Tax Act requires a mandatory one-time inclusion of accumulated earnings of foreign subsidiaries, and as a result, all previously unremitted earnings for which no U.S. deferred tax liability had been accrued have now been included in the calculation of U.S. taxable income. Notwithstanding the inclusion of these amounts in the determination of U.S. taxable income, the Company intends to continue to invest these foreign earnings indefinitely outside of the U.S. and does not expect to incur any significant, additional taxes, primarily withholding taxes, related to such amounts.
At December 31, 2017, the Company had net federal, state and foreign operating loss carryforwards available to reduce future taxable income. If not utilized, the Company’s NOLs expire as follows:
|
| | | | | | | | | | | |
| Years ended December 31, | Federal | | State | | Foreign |
| 2018 to 2022 | $ | — |
| | $ | 90.7 |
| | $ | 73.2 |
|
| 2023 to 2027 | — |
| | 361.3 |
| | 192.3 |
|
| 2028 to 2032 | 141.6 |
| | 85.9 |
| | — |
|
| 2033 to 2037 | 24.6 |
| | 122.7 |
| | — |
|
| Indefinite carryforward | — |
| | — |
| | 739.7 |
|
| Total | $ | 166.2 |
| | $ | 660.6 |
| | $ | 1,005.2 |
|
As of December 31, 2017 and 2016, the total amount of unrecognized tax benefits that would impact the ETR, if recognized, is $105.8 million and $102.9 million, respectively. The amount of unrecognized tax benefits for the year ended December 31, 2017 includes additions to the Company’s existing tax positions of $7.6 million.
The Company expects the unrecognized tax benefits to change over the next 12 months if certain tax matters ultimately settle with the applicable taxing jurisdiction during this timeframe, or if the applicable statute of limitations lapses. The impact of the amount of such changes to previously recorded uncertain tax positions could range from zero to $11.8 million.
A reconciliation of the beginning and ending amount of unrecognized tax benefits are as follows for the years ended December 31,:
|
| | | | | | | | | | | |
| | 2017 | | 2016 | | 2015 |
| Balance at January 1 | $ | 107.6 |
| | $ | 28.1 |
| | $ | 31.9 |
|
| Additions based on tax positions related to the current year | 7.6 |
| | 82.9 |
| | 5.0 |
|
| Additions for tax positions of prior years | — |
| | — |
| | — |
|
| Foreign currency | 1.9 |
| | (0.2 | ) | | (5.3 | ) |
| Reduction as a result of the lapse of statute of limitations and effective settlements | (0.4 | ) | | (3.2 | ) | | (3.5 | ) |
| Balance at December 31 | $ | 116.7 |
| | $ | 107.6 |
| | $ | 28.1 |
|
During the years ended December 31, 2017, 2016 and 2015, the statute of limitations on certain unrecognized tax benefits lapsed and certain positions were effectively settled, which resulted in a decrease of $0.4 million, $3.2 million and $3.5 million, respectively, in the liability for uncertain tax benefits, all of which reduced the income tax provision.
The Company recorded penalties and tax-related interest expense to the tax provision of $5.0 million, $9.2 million and $3.2 million for the years ended December 31, 2017, 2016 and 2015, respectively. In addition, due to the expiration of the statute of limitations in certain jurisdictions, the Company reduced its liability for penalties and income tax-related interest expense related to uncertain tax positions during the years ended December 31, 2017, 2016 and 2015 by $0.6 million, $3.4 million and $3.1 million, respectively.
AMERICAN TOWER CORPORATION AND SUBSIDIARIES
NOTES TO CONSOLIDATED FINANCIAL STATEMENTS
(Tabular amounts in millions, unless otherwise disclosed)
As of December 31, 2017 and 2016, the total amount of accrued income tax-related interest and penalties included in the consolidated balance sheets were $29.0 million and $24.3 million, respectively.
The Company has filed for prior taxable years, and for its taxable year ended December 31, 2017 will file, numerous consolidated and separate income tax returns, including U.S. federal and state tax returns and foreign tax returns. The Company is subject to examination in the U.S. and various state and foreign jurisdictions for certain tax years. As a result of the Company’s ability to carryforward federal, state and foreign NOLs, the applicable tax years generally remain open to examination several years after the applicable loss carryforwards have been used or have expired. The Company regularly assesses the likelihood of additional assessments in each of the tax jurisdictions resulting from these examinations. The Company believes that adequate provisions have been made for income taxes for all periods through December 31, 2017.
13. STOCK-BASED COMPENSATION
Summary of Stock-Based Compensation Plans—The Company maintains equity incentive plans that provide for the grant of stock-based awards to its directors, officers and employees. The 2007 Equity Incentive Plan, as amended (the “2007 Plan”), provides for the grant of non-qualified and incentive stock options, as well as restricted stock units, restricted stock and other stock-based awards. Exercise prices for non-qualified and incentive stock options are not less than the fair value of the underlying common stock on the date of grant. Equity awards typically vest ratably, generally over four years for RSUs and stock options and three years for PSUs. Stock options generally expire 10 years from the date of grant. As of December 31, 2017, the Company had the ability to grant stock-based awards with respect to an aggregate of 8.5 million shares of common stock under the 2007 Plan. In addition, the Company maintains an employee stock purchase plan (the “ESPP”) pursuant to which eligible employees may purchase shares of the Company’s common stock on the last day of each bi-annual offering period at a 15% discount from the lower of the closing market value on the first or last day of such offering period. The offering periods run from June 1 through November 30 and from December 1 through May 31 of each year.
During the years ended December 31, 2017, 2016 and 2015, the Company recorded and capitalized the following stock-based compensation expenses:
|
| | | | | | | | | | | |
| | 2017 | | 2016 | | 2015 |
| Stock-based compensation expense | $ | 108.5 |
| | $ | 89.9 |
| | $ | 90.5 |
|
| Stock-based compensation expense capitalized as property and equipment | 1.6 |
| | 1.4 |
| | 2.1 |
|
Stock Options—The fair value of each option granted during the period was estimated on the date of grant using the Black-Scholes option pricing model based on the assumptions noted in the table below. The expected life of stock options (estimated period of time outstanding) was estimated using the vesting term and historical exercise behavior of the Company’s employees. The risk-free interest rate was based on the U.S. Treasury yield with a term that approximated the estimated life in effect at the accounting measurement date. The expected volatility of the underlying stock price was based on historical volatility for a period equal to the expected life of the stock options. The expected annual dividend yield was the Company’s best estimate of expected future dividend yield.
Key assumptions used to apply this pricing model were as follows:
|
| | | | | |
| | 2017 | | 2016 | | 2015 |
| Range of risk-free interest rate | 1.88%-1.94% | | 1.00%-1.73% | | 1.32% - 1.62% |
| Weighted average risk-free interest rate | 1.89% | | 1.44% | | 1.61% |
| Range of expected life of stock options | 5.2 years | | 4.5 - 5.2 years | | 4.5 years |
| Range of expected volatility of the underlying stock price | 18.95% - 19.45% | | 20.59% - 21.45% | | 21.09% - 21.24% |
| Weighted average expected volatility of underlying stock price | 19.05% | | 21.43% | | 21.09% |
| Range of expected annual dividend yield | 2.40% | | 1.85% - 2.40% | | 1.50% - 1.85% |
The weighted average grant date fair value per share during the years ended December 31, 2017, 2016 and 2015 was $16.84, $14.60 and $15.06, respectively. The intrinsic value of stock options exercised during the years ended December 31, 2017, 2016
AMERICAN TOWER CORPORATION AND SUBSIDIARIES
NOTES TO CONSOLIDATED FINANCIAL STATEMENTS
(Tabular amounts in millions, unless otherwise disclosed)
and 2015 was $100.3 million, $77.6 million and $32.1 million, respectively. As of December 31, 2017, total unrecognized compensation expense related to unvested stock options was $12.4 million and is expected to be recognized over a weighted average period of approximately two years. The amount of cash received from the exercise of stock options was $110.7 million during the year ended December 31, 2017.
The Company’s option activity for the year ended December 31, 2017 was as follows:
|
| | | | | | | | | | | | | |
| | | Options | | Weighted Average Exercise Price | | Weighted Average Remaining Life (Years) | | Aggregate Intrinsic Value (in millions) |
| Outstanding as of January 1, 2017 | | 7,269,376 |
| |
| $78.00 |
| | | | |
| Granted | | 6,534 |
| | 118.20 |
| | | | |
| Exercised | | (1,663,001 | ) | | 66.57 |
| | | | |
| Forfeited | | (55,348 | ) | | 93.09 |
| | | | |
| Expired | | — |
| | — |
| | | | |
| Outstanding as of December 31, 2017 | | 5,557,561 |
| |
| $81.32 |
| | 6.07 | |
| $341.0 |
|
| Exercisable as of December 31, 2017 | | 3,425,213 |
| |
| $74.47 |
| | 5.24 | |
| $233.6 |
|
| Vested or expected to vest as of December 31, 2017 | | 5,557,561 |
| |
| $81.32 |
| | 6.07 | |
| $341.0 |
|
The following table sets forth information regarding options outstanding at December 31, 2017:
|
| | | | | | | | | | | | | | | | |
| Options Outstanding | | Options Exercisable |
Outstanding Number of Options | | Range of Exercise Price Per Share | | Weighted Average Exercise Price Per Share | | Weighted Average Remaining Life (Years) | | Options Exercisable | | Weighted Average Exercise Price Per Share |
| 593,231 |
| | $28.39 - $50.78 | | $ | 45.76 |
| | 2.59 | | 593,231 |
| | $ | 45.76 |
|
| 552,500 |
| | 52.33 - 74.06 | | 61.97 |
| | 4.17 | | 552,500 |
| | 61.97 |
|
| 641,460 |
| | 76.90 - 79.45 | | 76.92 |
| | 5.15 | | 639,631 |
| | 76.91 |
|
| 1,242,705 |
| | 81.18 - 94.23 | | 81.59 |
| | 6.19 | | 812,744 |
| | 81.42 |
|
| 2,484,098 |
| | 94.57 - 94.71 | | 94.62 |
| | 7.45 | | 820,043 |
| | 94.59 |
|
| 43,567 |
| | 96.46 - 121.15 | | 109.38 |
| | 8.33 | | 7,064 |
| | 103.90 |
|
| 5,557,561 |
| | $28.39 - $121.15 | | $ | 81.32 |
| | 6.07 | | 3,425,213 |
| | $ | 74.47 |
|
Restricted Stock Units and Performance-Based Restricted Stock Units—The Company’s RSU and PSU activity for the year ended December 31, 2017 was as follows:
|
| | | | | | | | | | | | | |
| | RSUs | | Weighted Average Grant Date Fair Value | | PSUs | | Weighted Average Grant Date Fair Value |
| Outstanding as of January 1, 2017 (1) | 1,663,743 |
| | $ | 90.76 |
| | 242,757 |
| | $ | 93.92 |
|
| Granted (2) | 840,467 |
| | 114.22 |
| | 201,274 |
| | 113.52 |
|
| Vested | (680,610 | ) | | 88.12 |
| | — |
| | — |
|
| Forfeited | (80,875 | ) | | 101.51 |
| | — |
| | — |
|
| Outstanding as of December 31, 2017 | 1,742,725 |
| | $ | 102.60 |
| | 444,031 |
| | $ | 102.81 |
|
| Expected to vest as of December 31, 2017 | 1,742,725 |
| | $ | 102.60 |
| | 444,031 |
| | $ | 102.81 |
|
_______________
| |
| (1) | PSUs represent the shares issuable for the 2015 PSUs (as defined below) at the end of the three-year performance cycle based on achievement against the performance metric for the first and second year’s performance periods, or 73,417 shares, and the target number of shares issuable at the end of the three-year performance period for the 2016 PSUs (as defined below), or 169,340 shares. |
| |
| (2) | PSUs represent the shares issuable for the 2015 PSUs at the end of the three-year performance cycle based on exceeding the performance metric for the third year’s performance period, or 46,754 shares, and the target number of shares issuable at the end of the three-year performance cycle for the 2017 PSUs (as defined below), or 154,520 shares. |
Restricted Stock Units—The total fair value of RSUs that vested during the year ended December 31, 2017 was $78.3 million.
AMERICAN TOWER CORPORATION AND SUBSIDIARIES
NOTES TO CONSOLIDATED FINANCIAL STATEMENTS
(Tabular amounts in millions, unless otherwise disclosed)
As of December 31, 2017, total unrecognized compensation expense related to unvested RSUs granted under the 2007 Plan was $101.6 million and is expected to be recognized over a weighted average period of approximately two years.
Performance-Based Restricted Stock Units—During the years ended December 31, 2017 and 2016, the Company’s Compensation Committee granted an aggregate of 154,520 PSUs (the “2017 PSUs”) and 169,340 PSUs (the “2016 PSUs”), respectively, to its executive officers and established the performance metrics for these awards. During the year ended December 31, 2015, the Company’s Compensation Committee granted an aggregate of 70,135 PSUs to its executive officers (the “2015 PSUs”) and established the performance metric for this award. Threshold, target and maximum parameters were established for the metrics for a three-year performance period with respect to the 2017 PSUs and the 2016 PSUs, and for each year in the three-year performance period with respect to the 2015 PSUs, and will be used to calculate the number of shares that will be issuable when the award vests, which may range from 0% to 200% of the target amounts. At the end of the three-year performance period, the number of shares that vest will depend on the degree of achievement against the pre-established performance goals. PSUs will be paid out in common stock at the end of the performance period, subject generally to the executive’s continued employment. In the event of the executive’s death, disability or qualifying retirement, PSUs will be paid out pro rata in accordance with the terms of the applicable award agreement. PSUs will accrue dividend equivalents prior to vesting, which will be paid out only in respect of shares actually vested.
During the year ended December 31, 2017, the Company recorded $23.6 million in stock-based compensation expense for equity awards in which the performance goals have been established and were probable of being achieved. The remaining unrecognized compensation expense related to these awards at December 31, 2017, was $22.1 million based on the Company’s current assessment of the probability of achieving the performance goals. The weighted-average period over which the cost will be recognized is approximately two years.
14. REDEEMABLE NONCONTROLLING INTERESTS
Redeemable Noncontrolling Interests—In connection with the Viom Acquisition, the Company, through one of its subsidiaries, entered into a shareholders agreement (the “Shareholders Agreement”) with Viom and the following remaining Viom shareholders: Tata Sons Limited, Tata Teleservices Limited (“Tata Teleservices”), IDFC Private Equity Fund III, Macquarie SBI Infrastructure Investments Pte Limited and SBI Macquarie Infrastructure Trust (collectively, the “Remaining Shareholders”). The Shareholders Agreement provides for, among other things, put options held by certain of the Remaining Shareholders, which allow the Remaining Shareholders to sell outstanding shares of ATC TIPL, and call options held by the Company, which allow the Company to buy the noncontrolling shares of ATC TIPL. The put options, which are not under the Company’s control, cannot be separated from the noncontrolling interests. As a result, the combination of the noncontrolling interests and the redemption feature require classification as redeemable noncontrolling interests in the consolidated balance sheet, separate from equity.
Given the provisions governing the put rights, the redeemable noncontrolling interests are recorded outside of permanent equity at their redemption value. The noncontrolling interests become redeemable after the passage of time, and therefore, the Company records the carrying amount of the noncontrolling interests at the greater of (i) the initial carrying amount, increased or decreased for the noncontrolling interests’ share of net income or loss and foreign currency translation adjustments, or (ii) the redemption value. If required, the Company will adjust the redeemable noncontrolling interests to redemption value on each balance sheet date with changes in redemption value recognized as an adjustment to Distributions in excess of earnings.
The put options may be exercised, requiring the Company to purchase the Remaining Shareholders’ equity interests, on specified dates beginning April 1, 2018 through March 31, 2021. The price of the put options will be based on the fair market value of the exercising Remaining Shareholder’s interest in the Company’s India operations at the time the option is exercised. Put options held by certain of the Remaining Shareholders are subject to a floor price of 216 INR per share.
The following is a reconciliation of the changes in the Redeemable noncontrolling interests:
|
| | | | |
| Balance as of January 1, 2016 | | $ | — |
|
| Fair value at acquisition | | 1,100.9 |
|
| Net income attributable to noncontrolling interests | | 13.9 |
|
| Foreign currency translation adjustment attributable to noncontrolling interests | | (23.5 | ) |
| Balance as of January 1, 2017 | | $ | 1,091.3 |
|
| Net loss attributable to noncontrolling interests | | (33.4 | ) |
| Foreign currency translation adjustment attributable to noncontrolling interests | | 68.3 |
|
| Balance as of December 31, 2017 | | $ | 1,126.2 |
|
15. EQUITY
Series A Preferred Stock— In May 2014, the Company issued 6,000,000 shares of its 5.25% Mandatory Convertible Preferred Stock, Series A, par value $0.01 per share (the “Series A Preferred Stock”). During the year ended December 31, 2017, all outstanding shares of the Series A Preferred Stock converted at a rate of 0.9337 per share into an aggregate of 5,602,153 shares of the Company’s common stock pursuant to the provisions of the Certificate of Designations governing the Series A Preferred Stock. The Company paid cash in lieu of fractional shares of the Company’s common stock. These payments were recorded as a reduction to Additional paid-in capital.
On May 15, 2017, the Company paid the final dividend of $7.9 million to holders of the Series A Preferred Stock at the close of business on May 1, 2017.
Series B Preferred Stock—In March 2015, the Company issued 1,375,000 shares of its 5.50% Mandatory Convertible Preferred Stock, Series B, par value $0.01 per share (the “Series B Preferred Stock”). As of December 31, 2017, the Company had 13,749,860 depositary shares, each representing a 1/10th interest in a share of its Series B Preferred Stock outstanding, after giving effect to the early conversion of 140 depositary shares at the option of the holder at a conversion rate of 0.8687 per depositary share in May 2017.
On February 15, 2018, the Company paid the final dividend of $18.9 million to holders of the Series B Preferred Stock at the close of business on February 1, 2018. Unless converted or redeemed earlier, each share of the Series B Preferred Stock converted automatically on February 15, 2018 at a rate of 8.7420 per share of Series B Preferred Stock, or 0.8742 per depositary share, each representing a 1/10th interest in a share of Series B Preferred Stock, into shares of the Company’s common stock pursuant to the provisions of the Certificate of Designations governing the Series B Preferred Stock. As a result of the conversions of the Series B Preferred Stock in 2018, the Company issued an aggregate of 12,020,064 shares of its common stock.
The Company paid cash in lieu of fractional shares of the Company’s common stock. These payments were recorded as a reduction to Additional paid-in capital.
Dividends—The Company may pay dividends in cash or, subject to certain limitations, in shares of common stock or any combination of cash and shares of common stock.
Sales of Equity Securities—The Company receives proceeds from sales of its equity securities pursuant to the ESPP and upon exercise of stock options granted under its equity incentive plan. During the year ended December 31, 2017, the Company received an aggregate of $119.7 million in proceeds upon exercises of stock options and sales pursuant to the ESPP.
AMERICAN TOWER CORPORATION AND SUBSIDIARIES
NOTES TO CONSOLIDATED FINANCIAL STATEMENTS
(Tabular amounts in millions, unless otherwise disclosed)
Stock Repurchase Programs—In March 2011, the Company’s Board of Directors approved a stock repurchase program, pursuant to which the Company is authorized to repurchase up to $1.5 billion of its common stock (the “2011 Buyback”). In December 2017, the Board of Directors approved an additional stock repurchase program, pursuant to which the Company is authorized to repurchase up to $2.0 billion of its common stock (the “2017 Buyback”).
During the year ended December 31, 2017, the Company resumed the 2011 Buyback and repurchased 6,099,150 shares of its common stock thereunder for an aggregate of $766.3 million, including commissions and fees. As of December 31, 2017, the Company had repurchased a total of 12,356,054 shares of its common stock under the 2011 Buyback for an aggregate of $1.2 billion, including commissions and fees. There were no repurchases under the 2017 Buyback.
Under each program, the Company is authorized to purchase shares from time to time through open market purchases, in privately negotiated transactions not to exceed market prices, and (with respect to such open market purchases) pursuant to plans adopted in accordance with Rule 10b5-1 under the Securities Exchange Act of 1934 in accordance with securities laws and other legal requirements, and subject to market conditions and other factors.
The Company expects to fund any further repurchases of its common stock through a combination of cash on hand, cash generated by operations and borrowings under its credit facilities. Purchases under the 2011 Buyback and 2017 Buyback are subject to the Company having available cash to fund repurchases.
Distributions—During the years ended December 31, 2017, 2016 and 2015, the Company declared the following cash distributions:
|
| | | | | | | | | | | | | | | | | | | | | | | | |
| | | For the year ended December 31, |
| | | 2017 | | 2016 | | 2015 |
| | | Distribution
per share | | Aggregate
Payment Amount
(in millions) | | Distribution
per share | | Aggregate
Payment Amount
(in millions) | | Distribution
per share | | Aggregate
Payment Amount
(in millions) |
| Common Stock | $ | 2.62 |
| | $ | 1,122.5 |
| | $ | 2.17 |
| | $ | 923.7 |
| | $ | 1.81 |
| | $ | 766.4 |
|
| Series A Preferred Stock | $ | 2.63 |
| | $ | 15.8 |
| | $ | 5.25 |
| | $ | 31.5 |
| | $ | 3.94 |
| | $ | 23.7 |
|
| Series B Preferred Stock | $ | 55.00 |
| | $ | 75.6 |
| | $ | 55.00 |
| | $ | 75.6 |
| | $ | 38.65 |
| | $ | 53.1 |
|
The following table characterizes the tax treatment of distributions declared per share of common stock and Mandatory Convertible Preferred Stock.
|
| | | | | | | | | | | | | | | | | | | | | |
| | | For the year ended December 31, |
| | | 2017 | | 2016 | | 2015 |
| | | Per Share | | % | | Per Share | | % | | Per Share | | % |
| Common Stock | | | | | | | | | | | |
| | Ordinary dividend | $ | 2.6200 |
| (1) | 100.00 | % | | $ | 2.1700 |
| | 100.00 | % | | $ | 1.2694 |
| | 70.13 | % |
| | Capital gains distribution | — |
| | — |
| | — |
| | — |
| | 0.5406 |
| | 29.87 |
|
| | Total | $ | 2.6200 |
| | 100.00 | % | | $ | 2.1700 |
| | 100.00 | % | | $ | 1.8100 |
| | 100.00 | % |
| Series A Preferred Stock | | | | | | | | | | | |
| | Ordinary dividend | $ | 3.3643 |
| (2) | 100.00 | % | | $ | 6.4578 |
| (3) | 100.00 | % | | $ | 3.6818 |
| (4) | 70.13 | % |
| | Capital gains distribution | — |
| | — |
| | — |
| | — |
| | 1.5682 |
| | 29.87 |
|
| | Total | $ | 3.3643 |
| | 100.00 | % | | $ | 6.4578 |
| | 100.00 | % | | $ | 5.2500 |
| | 100.00 | % |
| Series B Preferred Stock (5) | | | | | | | | | | | |
| | Ordinary dividend | $ | 6.5233 |
| (6) | 100.00 | % | | $ | 5.5000 |
| | 100.00 | % | | $ | 2.7107 |
| | 70.13 | % |
| | Capital gains distribution | — |
| | — |
| | — |
| | — |
| | 1.1546 |
| | 29.87 |
|
| | Total | $ | 6.5233 |
| | 100.00 | % | | $ | 5.5000 |
| | 100.00 | % | | $ | 3.8653 |
| | 100.00 | % |
_______________
AMERICAN TOWER CORPORATION AND SUBSIDIARIES
NOTES TO CONSOLIDATED FINANCIAL STATEMENTS
(Tabular amounts in millions, unless otherwise disclosed)
| |
| (1) | Includes dividend declared on December 6, 2017 of $0.70 per share, which was paid on January 16, 2018 to common stockholders of record at the close of business on December 28, 2017. |
| |
| (2) | Includes a deemed distribution as a result of a conversion rate adjustment triggered on April 27, 2017. |
| |
| (3) | Includes a deemed distribution as a result of a conversion rate adjustment triggered on June 17, 2016. |
| |
| (4) | Includes dividend declared on December 2, 2014 of $1.3125 per share, which was paid on February 16, 2015 to preferred stockholders of record at the close of business on February 1, 2015. |
| |
| (5) | Represents the tax treatment on dividends per depositary share, each of which represents a 1/10th interest in a share of Series B Preferred Stock. |
| |
| (6) | Includes a deemed distribution as a result of a conversion rate adjustment triggered on April 12, 2017. |
The Company accrues distributions on unvested restricted stock units, which are payable upon vesting. As of December 31, 2017, the amount accrued for distributions payable related to unvested restricted stock units was $10.1 million. During the year ended December 31, 2017, the Company paid $3.0 million of distributions payable upon the vesting of restricted stock units.
To maintain its qualification for taxation as a REIT, the Company expects to continue paying distributions, the amount, timing and frequency of which will be determined and subject to adjustment by the Company’s Board of Directors.
16. IMPAIRMENTS, NET LOSS ON SALES OF LONG-LIVED ASSETS
During the years ended December 31, 2017, 2016 and 2015, the Company recorded impairment charges and net losses on sales or disposals of long-lived assets of $244.2 million, $53.6 million and $29.8 million, respectively. These charges were primarily related to assets included in the Company’s Asia property segment for the year ended December 31, 2017 and the U.S. property segment for the years ended December 31, 2016 and 2015, and are included in Other operating expenses in the consolidated statements of operations.
Included in these amounts were impairment charges of $211.4 million, $28.5 million and $15.1 million for the years ended December 31, 2017, 2016 and 2015, respectively, to write down certain assets to their net realizable value after an indicator of impairment was identified. These assets consisted primarily of towers, which are assessed on an individual basis, network location intangibles, which relate directly to towers, and tenant-related intangibles. For the year ended December 31, 2017 impairment charges included $81.0 million related to tower and network intangible assets and $100.1 million related to tenant relationships due primarily to carrier consolidation in the Company’s Asia property segment. For the years ended December 31, 2017 and 2016, impairment charges included amounts related to land easements. Also included in these amounts were net losses associated with the sale or disposal of certain non-core towers, other assets and other miscellaneous items of $32.8 million, $25.1 million and $14.7 million for the years ended December 31, 2017, 2016 and 2015, respectively.
In October 2017, one of the Company’s tenants in Asia, Tata Teleservices, informed the Department of Telecommunications in India of its intent to exit the wireless telecommunications business and announced plans to transfer its business to another telecommunications provider. The Company considered the recent developments regarding these events when conducting its annual impairment test for the Tata Teleservices tenant relationship, which did not result in an impairment since the estimated probability-weighted undiscounted cash flows were in excess of the carrying value of this asset. However, the Company will continue to monitor the status of these developments, as it is possible that the estimated future cash flows may differ from current estimates. Changes in estimated cash flows from Tata Teleservices could have an impact on previously recorded tangible and intangible assets, including amounts originally recorded as tenant-related intangibles, which have a current net book value of $436.4 million.
17. EARNINGS PER COMMON SHARE
The following table sets forth basic and diluted net income per common share computational data for the years ended December 31, (shares in thousands, except per share data):
|
| | | | | | | | | | | |
| | 2017 | | 2016 | | 2015 |
| Net income attributable to American Tower Corporation stockholders | $ | 1,238.9 |
| | $ | 956.4 |
| | $ | 685.1 |
|
| Dividends on preferred stock | (87.4 | ) | | (107.1 | ) | | (90.2 | ) |
| Net income attributable to American Tower Corporation common stockholders | 1,151.5 |
| | 849.3 |
| | 594.9 |
|
| | | | | | |
| Basic weighted average common shares outstanding | 428,181 |
| | 425,143 |
| | 418,907 |
|
| Dilutive securities | 3,507 |
| | 4,140 |
| | 4,108 |
|
| Diluted weighted average common shares outstanding | 431,688 |
| | 429,283 |
| | 423,015 |
|
| Basic net income attributable to American Tower Corporation common stockholders per common share | $ | 2.69 |
| | $ | 2.00 |
| | $ | 1.42 |
|
| Diluted net income attributable to American Tower Corporation common stockholders per common share | $ | 2.67 |
| | $ | 1.98 |
| | $ | 1.41 |
|
Shares Excluded From Dilutive Effect
The following shares were not included in the computation of diluted earnings per share because the effect would be anti-dilutive for the years ended December 31, (in thousands, on a weighted average basis):
AMERICAN TOWER CORPORATION AND SUBSIDIARIES
NOTES TO CONSOLIDATED FINANCIAL STATEMENTS
(Tabular amounts in millions, unless otherwise disclosed)
|
| | | | | | | | |
| | 2017 | | 2016 | | 2015 |
| Restricted stock awards | 3 |
| | 6 |
| | — |
|
| Stock options | 4 |
| | 817 |
| | 1,606 |
|
| Preferred stock | 14,040 |
| | 17,509 |
| | 15,408 |
|
18. COMMITMENTS AND CONTINGENCIES
Litigation—The Company periodically becomes involved in various claims, lawsuits and proceedings that are incidental to its business. In the opinion of Company management, after consultation with counsel, there are no matters currently pending that would, in the event of an adverse outcome, materially impact the Company’s consolidated financial position, results of operations or liquidity.
Verizon Transaction—On March 27, 2015, the Company entered into an agreement with various operating entities of Verizon that provides for the lease, sublease or management of approximately 11,300 wireless communications sites from Verizon commencing March 27, 2015. The average term of the lease or sublease for all sites at the inception of the agreement was approximately 28 years, assuming renewals or extensions of the underlying ground leases for the sites. The Company has the option to purchase the leased sites in tranches, subject to the applicable lease, sublease or management right upon its scheduled expiration. Each tower is assigned to an annual tranche, ranging from 2034 to 2047, which represents the outside expiration date for the sublease rights to the towers in each tranche. The purchase price for each tranche is a fixed amount stated in the lease for such tranche plus the fair market value of certain alterations made to the related towers. The aggregate purchase option price for the towers leased and subleased is approximately $5.0 billion. Verizon will occupy the sites as a tenant for an initial term of ten years with eight optional successive five-year terms; each such term shall be governed by standard master lease agreement terms established as a part of the transaction.
AT&T Transaction—The Company has an agreement with SBC Communications Inc., a predecessor entity to AT&T Inc. (“AT&T”), that currently provides for the lease or sublease of approximately 2,350 towers from AT&T with the lease commencing between December 2000 and August 2004. Substantially all of the towers are part of the 2013 Securitization. The average term of the lease or sublease for all sites at the inception of the agreement was approximately 27 years, assuming renewals or extensions of the underlying ground leases for the sites. The Company has the option to purchase the sites subject to the applicable lease or sublease upon its expiration. Each tower is assigned to an annual tranche, ranging from 2013 to 2032, which represents the outside expiration date for the sublease rights to that tower. The purchase price for each site is a fixed amount stated in the lease for that site plus the fair market value of certain alterations made to the related tower by AT&T. As of December 31, 2017, the Company has purchased an aggregate of 88 of the subleased towers upon expiration of the applicable agreement. The aggregate purchase option price for the remaining towers leased and subleased is $831.3 million and will accrete at a rate of 10% per annum through the applicable expiration of the lease or sublease of a site. For all such sites purchased by the Company prior to June 30, 2020, AT&T will continue to lease the reserved space at the then-current monthly fee which shall escalate in accordance with the standard master lease agreement for the remainder of AT&T’s tenancy. Thereafter, AT&T shall have the right to renew such lease for up to four successive five-year terms. For all such sites purchased by the Company subsequent to June 30, 2020, AT&T has the right to continue to lease the reserved space for successive one-year terms at a rent equal to the lesser of the agreed upon market rate and the then-current monthly fee, which is subject to an annual increase based on changes in the U.S. Consumer Price Index.
Alltel Transaction—In December 2000, the Company entered into an agreement with Alltel to acquire towers through a 15-year sublease agreement. Pursuant to the agreement, as amended, with Verizon Wireless, the Company acquired rights to approximately 1,800 towers in tranches between April 2001 and March 2002. The Company has the option to purchase each tower at the expiration of the applicable sublease. The Company exercised the purchase options for 1,523 towers in a single closing which occurred on December 8, 2016. The Company has provided notice to the tower owner of its intent to exercise the purchase options related to the 243 remaining towers. As of December 31, 2017, the purchase price per tower was $42,844 payable in cash or, at the tower owner’s option, with 769 shares of the Company’s common stock per tower. The aggregate cash purchase option price for the remaining subleased towers was $10.4 million as of December 31, 2017.
Other Contingencies—The Company is subject to income tax and other taxes in the geographic areas where it operates, and periodically receives notifications of audits, assessments or other actions by taxing authorities. In certain jurisdictions, taxing authorities may issue preliminary notices or assessments while audits are being conducted. These preliminary notices or assessments do not represent amounts that the Company is obligated to pay and are often not reflective of the actual tax liability for which the Company will ultimately be liable. The Company evaluates the circumstances of each notification or assessment
AMERICAN TOWER CORPORATION AND SUBSIDIARIES
NOTES TO CONSOLIDATED FINANCIAL STATEMENTS
(Tabular amounts in millions, unless otherwise disclosed)
based on the information available and records a liability for any potential outcome that is probable or more likely than not unfavorable if the liability is also reasonably estimable.
On December 5, 2016, the Company received an income tax assessment of Essar Telecom Infrastructure Private Limited (“ETIPL”) from the India Income Tax Department (the “Tax Department”) for the fiscal year ending 2008 in the amount of 4.75 billion INR ($69.8 million on the date of assessment) related to capital contributions. The Company challenged the assessment before the Office of Commissioner of Income Tax - Appeals, which ruled in the Company’s favor in January 2018. However, the Tax Department may appeal this ruling at a higher appellate authority. The Company estimates that there is a more likely than not probability that the Company’s position will be sustained upon appeal. Accordingly, no liability has been recorded. Additionally, the assessment was made with respect to transactions that took place in the tax year commencing in 2007, prior to the Company’s acquisition of ETIPL. Under the Company’s definitive acquisition agreement of ETIPL, the seller is obligated to indemnify and defend the Company with respect to any tax-related liability that may arise from activities prior to March 31, 2010.
Lease Obligations—The Company leases certain land, office and tower space under operating leases that expire over various terms. Many of the leases contain renewal options with specified increases in lease payments upon exercise of the renewal option. Escalation clauses present in operating leases, excluding those tied to CPI or other inflation-based indices, are recognized on a straight-line basis over the non-cancellable term of the leases.
Future minimum rental payments under non-cancellable operating leases include payments for certain renewal periods at the Company’s option because failure to renew could result in a loss of the applicable communications sites and related revenues from tenant leases, thereby making it reasonably assured that the Company will renew the leases. Such payments at December 31, 2017 are as follows:
|
| | | |
| Year Ending December 31, | |
| 2018 | $ | 924 |
|
| 2019 | 887 |
|
| 2020 | 848 |
|
| 2021 | 811 |
|
| 2022 | 768 |
|
| Thereafter | 6,533 |
|
| Total | $ | 10,771 |
|
Aggregate rent expense (including the effect of straight-line rent expense) under operating leases for the years ended December 31, 2017, 2016 and 2015 approximated $1,088.0 million, $986.2 million and $804.8 million, respectively.
Future minimum payments under capital leases in effect at December 31, 2017 were as follows:
|
| | | |
| Year Ending December 31, | |
| 2018 | $ | 34 |
|
| 2019 | 31 |
|
| 2020 | 26 |
|
| 2021 | 21 |
|
| 2022 | 18 |
|
| Thereafter | 166 |
|
| Total minimum lease payments | 296 |
|
| Less amounts representing interest | (130 | ) |
| Present value of capital lease obligations | $ | 166 |
|
Tenant Leases—The Company’s lease agreements with its tenants vary depending upon the region and the industry of the tenant, and generally have initial terms of ten years with multiple renewal terms at the option of the tenant.
Future minimum rental receipts expected from tenants under non-cancellable operating lease agreements in effect at December 31, 2017 were as follows:
AMERICAN TOWER CORPORATION AND SUBSIDIARIES
NOTES TO CONSOLIDATED FINANCIAL STATEMENTS
(Tabular amounts in millions, unless otherwise disclosed)
|
| | | |
| Year Ending December 31, | |
| 2018 | $ | 4,927 |
|
| 2019 | 4,683 |
|
| 2020 | 4,393 |
|
| 2021 | 3,957 |
|
| 2022 | 3,095 |
|
| Thereafter | 11,180 |
|
| Total | $ | 32,235 |
|
Guaranties and Indemnifications—The Company enters into agreements from time to time in the ordinary course of business pursuant to which it agrees to guarantee or indemnify third parties for certain claims. The Company has also entered into purchase and sale agreements relating to the sale or acquisition of assets containing customary indemnification provisions. The Company’s indemnification obligations under these agreements generally are limited solely to damages resulting from breaches of representations and warranties or covenants under the applicable agreements. In addition, payments under such indemnification clauses are generally conditioned on the other party making a claim that is subject to whatever defenses the Company may have and are governed by dispute resolution procedures specified in the particular agreement. Further, the Company’s obligations under these agreements may be limited in duration and amount, and in some instances, the Company may have recourse against third parties for payments made by the Company. The Company has not historically made any material payments under these agreements and, as of December 31, 2017, is not aware of any agreements that could result in a material payment.
19. SUPPLEMENTAL CASH FLOW INFORMATION
Supplemental cash flow information and non-cash investing and financing activities are as follows for the years ended December 31,:
|
| | | | | | | | | | | |
| | 2017 | | 2016 | | 2015 |
| Supplemental cash flow information: | | | | | |
| Cash paid for interest | $ | 712.1 |
| | $ | 645.1 |
| | $ | 578.0 |
|
| Cash paid for income taxes (net of refunds of $20.7, $19.6 and $7.1, respectively) | 136.5 |
| | 96.2 |
| | 157.1 |
|
| Non-cash investing and financing activities: | | | | | |
| Increase (decrease) in accounts payable and accrued expenses for purchases of property and equipment and construction activities | 34.0 |
| | (19.0 | ) | | 2.8 |
|
| Purchases of property and equipment under capital leases | 54.8 |
| | 55.6 |
| | 36.9 |
|
| Fair value of debt assumed through acquisitions | — |
| | 786.9 |
| | — |
|
| Exercise of purchase option for property and equipment for common shares issued | — |
| | 120.8 |
| | — |
|
| Settlement of accounts receivable related to acquisitions | — |
| | — |
| | 0.9 |
|
| Conversion of third-party debt to equity | 48.2 |
| | — |
| | — |
|
20. BUSINESS SEGMENTS
The Company’s primary business is leasing space on multitenant communications sites to wireless service providers, radio and television broadcast companies, wireless data providers, government agencies and municipalities and tenants in a number of other industries. This business is referred to as the Company’s property operations, which as of December 31, 2017, consisted of the following:
U.S.: property operations in the United States;
Asia: property operations in India;
Europe, Middle East and Africa (“EMEA”): property operations in France, Germany, Ghana, Nigeria, South Africa and Uganda; and
Latin America: property operations in Argentina, Brazil, Chile, Colombia, Costa Rica, Mexico, Paraguay and Peru.
The Company has applied the aggregation criteria to operations within the EMEA and Latin America property operating segments on a basis that is consistent with management’s review of information and performance evaluations of these regions.
The Company’s services segment offers tower-related services in the United States, including site acquisition, zoning and permitting and structural analysis, which primarily support its site leasing business, including the addition of new tenants and equipment on its sites. The services segment is a strategic business unit that offers different services from, and requires different resources, skill sets and marketing strategies than, the property operating segments.
The accounting policies applied in compiling segment information below are similar to those described in note 1. Among other factors, in evaluating financial performance in each business segment, management uses segment gross margin and segment operating profit. The Company defines segment gross margin as segment revenue less segment operating expenses excluding
AMERICAN TOWER CORPORATION AND SUBSIDIARIES
NOTES TO CONSOLIDATED FINANCIAL STATEMENTS
(Tabular amounts in millions, unless otherwise disclosed)
stock-based compensation expense recorded in costs of operations; Depreciation, amortization and accretion; Selling, general, administrative and development expense; and Other operating expenses. The Company defines segment operating profit as segment gross margin less Selling, general, administrative and development expense attributable to the segment, excluding stock-based compensation expense and corporate expenses. For reporting purposes, the Latin America property segment gross margin and segment operating profit also include Interest income, TV Azteca, net. These measures of segment gross margin and segment operating profit are also before Interest income, Interest expense, Gain (loss) on retirement of long-term obligations, Other income (expense), Net income (loss) attributable to noncontrolling interests and Income tax benefit (provision). The categories of expenses indicated above, such as depreciation, have been excluded from segment operating performance as they are not considered in the review of information or the evaluation of results by management. There are no significant revenues resulting from transactions between the Company’s operating segments. All intercompany transactions are eliminated to reconcile segment results and assets to the consolidated statements of operations and consolidated balance sheets.
Summarized financial information concerning the Company’s reportable segments for the years ended December 31, 2017, 2016 and 2015 is shown in the following tables. The “Other” column (i) represents amounts excluded from specific segments, such as business development operations, stock-based compensation expense and corporate expenses included in Selling, general, administrative and development expense; Other operating expenses; Interest income; Interest expense; Gain (loss) on retirement of long-term obligations; and Other income (expense), as the amounts are not utilized in assessing each segment’s performance, and (ii) reconciles segment operating profit to Income from continuing operations before income taxes.
|
| | | | | | | | | | | | | | | | | | | | | | | | | | | | | | | | |
| | | Property | Total Property | |
Services | | Other | | Total |
| Year ended December 31, 2017 | | U.S. | | Asia | | EMEA | | Latin America | |
| Segment revenues | | $ | 3,605.7 |
| | $ | 1,164.4 |
| | $ | 626.2 |
| | $ | 1,169.6 |
| | $ | 6,565.9 |
| | $ | 98.0 |
| | | | $ | 6,663.9 |
|
| Segment operating expenses (1) | | 746.5 |
| | 649.0 |
| | 238.3 |
| | 386.1 |
| | 2,019.9 |
| | 33.8 |
| | | | 2,053.7 |
|
| Interest income, TV Azteca, net | | — |
| | — |
| | — |
| | 10.8 |
| | 10.8 |
| | — |
| | | | 10.8 |
|
| Segment gross margin | | 2,859.2 |
| | 515.4 |
| | 387.9 |
| | 794.3 |
| | 4,556.8 |
| | 64.2 |
| | | | 4,621.0 |
|
| Segment selling, general, administrative and development expense (1) | | 151.4 |
| | 82.4 |
| | 67.9 |
| | 77.5 |
| | 379.2 |
| | 13.7 |
| | | | 392.9 |
|
| Segment operating profit | | $ | 2,707.8 |
| | $ | 433.0 |
| | $ | 320.0 |
| | $ | 716.8 |
| | $ | 4,177.6 |
| | $ | 50.5 |
| | | | $ | 4,228.1 |
|
| Stock-based compensation expense | | | | | | | | | | | | | | $ | 108.5 |
| | 108.5 |
|
| Other selling, general, administrative and development expense | | | | | | | | | | | | | | 138.5 |
| | 138.5 |
|
| Depreciation, amortization and accretion | | | | | | | | | | | | | | 1,715.9 |
| | 1,715.9 |
|
| Other expense (2) | | | | | | | | | | | | | | 1,009.1 |
| | 1,009.1 |
|
| Income from continuing operations before income taxes | | | | | | | | | | | | | | | | $ | 1,256.1 |
|
| Capital expenditures (3) | | $ | 360.6 |
| | $ | 118.0 |
| | $ | 141.7 |
| | $ | 197.4 |
| | $ | 817.7 |
| | $ | — |
| | $ | 17.7 |
| | $ | 835.4 |
|
_______________
| |
| (1) | Segment operating expenses and segment selling, general, administrative and development expenses exclude stock-based compensation expense of $2.9 million and $105.6 million, respectively. |
| |
| (2) | Primarily includes interest expense. |
| |
| (3) | Includes $31.8 million of capital lease payments included in Repayments of notes payable, credit facilities, term loan, senior notes and capital leases in the cash flow from financing activities in the Company’s consolidated statement of cash flows. |
AMERICAN TOWER CORPORATION AND SUBSIDIARIES
NOTES TO CONSOLIDATED FINANCIAL STATEMENTS
(Tabular amounts in millions, unless otherwise disclosed)
|
| | | | | | | | | | | | | | | | | | | | | | | | | | | | | | | | |
| | | Property | | Total Property | |
Services | | Other | | Total |
| Year ended December 31, 2016 | | U.S. | | Asia | | EMEA | | Latin America | |
| Segment revenues | | $ | 3,370.1 |
| | $ | 827.6 |
| | $ | 529.5 |
| | $ | 985.9 |
| | $ | 5,713.1 |
| | $ | 72.6 |
| | | | $ | 5,785.7 |
|
| Segment operating expenses (1) | | 733.4 |
| | 465.9 |
| | 223.7 |
| | 338.0 |
| | 1,761.0 |
| | 27.0 |
| | | | 1,788.0 |
|
| Interest income, TV Azteca, net | | — |
| | — |
| | — |
| | 10.9 |
| | 10.9 |
| | — |
| | | | 10.9 |
|
| Segment gross margin | | 2,636.7 |
| | 361.7 |
| | 305.8 |
| | 658.8 |
| | 3,963.0 |
| | 45.6 |
| | | | 4,008.6 |
|
| Segment selling, general, administrative and development expense (1) | | 147.6 |
| | 48.2 |
| | 60.9 |
| | 60.7 |
| | 317.4 |
| | 12.5 |
| | | | 329.9 |
|
| Segment operating profit | | $ | 2,489.1 |
| | $ | 313.5 |
| | $ | 244.9 |
| | $ | 598.1 |
| | $ | 3,645.6 |
| | $ | 33.1 |
| | | | $ | 3,678.7 |
|
| Stock-based compensation expense | | | | | | | | | | | | | | $ | 89.9 |
| | 89.9 |
|
| Other selling, general, administrative and development expense | | | | | | | | | | | | | | 126.0 |
| | 126.0 |
|
| Depreciation, amortization and accretion | | | | | | | | | | | | | | 1,525.6 |
| | 1,525.6 |
|
| Other expense (2) | | | | | | | | | | | | | | 811.3 |
| | 811.3 |
|
| Income from continuing operations before income taxes | | | | | | | | | | | | | | | | $ | 1,125.9 |
|
| Capital expenditures (3) | | $ | 310.7 |
| | $ | 115.5 |
| | $ | 86.1 |
| | $ | 172.6 |
| | $ | 684.9 |
| | $ | — |
| | $ | 16.5 |
| | $ | 701.4 |
|
_______________
| |
| (1) | Segment operating expenses and segment selling, general, administrative and development expenses exclude stock-based compensation expense of $2.4 million and $87.5 million, respectively. |
| |
| (2) | Primarily includes interest expense. |
| |
| (3) | Includes $18.9 million of capital lease payments included in Repayments of notes payable, credit facilities, term loan, senior notes and capital leases in the cash flow from financing activities in the Company’s consolidated statement of cash flows. |
|
| | | | | | | | | | | | | | | | | | | | | | | | | | | | | | | | |
| | | Property | | Total Property | |
Services | | Other | | Total |
| Year ended December 31, 2015 | | U.S. | | Asia | | EMEA | | Latin America | |
| Segment revenues | | $ | 3,157.5 |
| | $ | 242.2 |
| | $ | 395.1 |
| | $ | 885.6 |
| | $ | 4,680.4 |
| | $ | 91.1 |
| | | | $ | 4,771.5 |
|
| Segment operating expenses (1) | | 678.5 |
| | 126.9 |
| | 163.8 |
| | 304.6 |
| | 1,273.8 |
| | 33.0 |
| | | | 1,306.8 |
|
| Interest income, TV Azteca, net | | — |
| | — |
| | — |
| | 11.2 |
| | 11.2 |
| | — |
| | | | 11.2 |
|
| Segment gross margin | | 2,479.0 |
| | 115.3 |
| | 231.3 |
| | 592.2 |
| | 3,417.8 |
| | 58.1 |
| | | | 3,475.9 |
|
| Segment selling, general, administrative and development expense (1) | | 138.6 |
| | 22.7 |
| | 48.7 |
| | 62.2 |
| | 272.2 |
| | 15.7 |
| | | | 287.9 |
|
| Segment operating profit | | $ | 2,340.4 |
| | $ | 92.6 |
| | $ | 182.6 |
| | $ | 530.0 |
| | $ | 3,145.6 |
| | $ | 42.4 |
| | | | $ | 3,188.0 |
|
| Stock-based compensation expense | | | | | | | | | | | | | | $ | 90.5 |
| | 90.5 |
|
| Other selling, general, administrative and development expense | | | | | | | | | | | | | | 121.4 |
| | 121.4 |
|
| Depreciation, amortization and accretion | | | | | | | | | | | | | | 1,285.3 |
| | 1,285.3 |
|
| Other expense (2) | | | | | | | | | | | | | | 860.8 |
| | 860.8 |
|
| Income from continuing operations before income taxes | | | | | | | | | | | | | | | | $ | 830.0 |
|
| Capital expenditures | | $ | 367.7 |
| | $ | 75.4 |
| | $ | 66.6 |
| | $ | 201.8 |
| | $ | 711.5 |
| | $ | — |
| | $ | 17.3 |
| | $ | 728.8 |
|
_______________
| |
| (1) | Segment operating expenses and segment selling, general, administrative and development expenses exclude stock-based compensation expense of $2.0 million and $88.5 million, respectively. |
| |
| (2) | Primarily includes interest expense. |
AMERICAN TOWER CORPORATION AND SUBSIDIARIES
NOTES TO CONSOLIDATED FINANCIAL STATEMENTS
(Tabular amounts in millions, unless otherwise disclosed)
Additional information relating to the total assets of the Company’s operating segments is as follows for the years ended December 31,:
|
| | | | | | | | | | | |
| | 2017 | | 2016 | | 2015 |
| U.S. property | $ | 19,032.6 |
| | $ | 18,846.9 |
| | $ | 19,286.5 |
|
| Asia property (1) | 4,770.8 |
| | 4,535.3 |
| | 736.1 |
|
| EMEA property (1) | 3,213.6 |
| | 2,062.4 |
| | 2,249.6 |
|
| Latin America property (1) | 5,868.4 |
| | 4,938.1 |
| | 4,401.3 |
|
| Services | 42.3 |
| | 48.3 |
| | 68.4 |
|
| Other (2) | 286.6 |
| | 448.2 |
| | 162.4 |
|
| Total assets | $ | 33,214.3 |
| | $ | 30,879.2 |
| | $ | 26,904.3 |
|
_______________
| |
| (1) | Balances are translated at the applicable period end exchange rate, which may impact comparability between periods. |
| |
| (2) | Balances include corporate assets such as cash and cash equivalents, certain tangible and intangible assets and income tax accounts that have not been allocated to specific segments. |
Summarized geographic information related to the Company’s operating revenues for the years ended December 31, 2017, 2016 and 2015 and long-lived assets as of December 31, 2017 and 2016 is as follows:
|
| | | | | | | | | | | |
| | 2017 | | 2016 | | 2015 |
| Operating Revenues: | | | | | |
| United States | $ | 3,703.7 |
| | $ | 3,442.7 |
| | $ | 3,248.6 |
|
| Asia (1): | | | | | |
| India | 1,164.4 |
| | 827.6 |
| | 242.2 |
|
| EMEA (1): | | | | | |
| France | 59.5 |
| | — |
| | — |
|
| Germany | 63.1 |
| | 60.2 |
| | 56.0 |
|
| Ghana | 122.9 |
| | 116.2 |
| | 94.5 |
|
| Nigeria | 213.9 |
| | 215.4 |
| | 109.7 |
|
| South Africa | 106.5 |
| | 80.0 |
| | 80.5 |
|
| Uganda | 60.3 |
| | 57.7 |
| | 54.4 |
|
| Latin America (1): | | | | | |
| Argentina | 15.9 |
| | 1.0 |
| | — |
|
| Brazil | 620.1 |
| | 506.2 |
| | 408.6 |
|
| Chile | 40.4 |
| | 33.8 |
| | 29.7 |
|
| Colombia | 89.3 |
| | 79.7 |
| | 78.4 |
|
| Costa Rica | 19.4 |
| | 19.0 |
| | 17.2 |
|
| Mexico | 364.3 |
| | 331.2 |
| | 340.5 |
|
| Paraguay | 2.7 |
| | — |
| | — |
|
| Peru | 17.5 |
| | 15.0 |
| | 11.2 |
|
| Total International | 2,960.2 |
| | 2,343.0 |
| | 1,522.9 |
|
| Total operating revenues | $ | 6,663.9 |
| | $ | 5,785.7 |
| | $ | 4,771.5 |
|
_______________
| |
| (1) | Balances are translated at the applicable exchange rate, which may impact comparability between periods. |
AMERICAN TOWER CORPORATION AND SUBSIDIARIES
NOTES TO CONSOLIDATED FINANCIAL STATEMENTS
(Tabular amounts in millions, unless otherwise disclosed)
|
| | | | | | | |
| | 2017 | | 2016 |
| Long-Lived Assets (1): | | | |
| United States | $ | 16,930.2 |
| | $ | 16,969.6 |
|
| Asia (2): | | | |
| India | 4,052.6 |
| | 4,094.2 |
|
| EMEA (2): | | | |
| France | 1,009.6 |
| | — |
|
| Germany | 428.0 |
| | 397.3 |
|
| Ghana | 171.4 |
| | 192.2 |
|
| Nigeria | 587.2 |
| | 640.6 |
|
| South Africa | 330.4 |
| | 271.8 |
|
| Uganda | 136.9 |
| | 141.5 |
|
| Latin America (2): | | | |
| Argentina | 117.9 |
| | 137.6 |
|
| Brazil | 2,557.4 |
| | 2,626.4 |
|
| Chile | 151.2 |
| | 137.2 |
|
| Colombia | 369.0 |
| | 272.3 |
|
| Costa Rica | 112.9 |
| | 117.5 |
|
| Mexico | 1,396.8 |
| | 797.8 |
|
| Paraguay | 77.5 |
| | — |
|
| Peru | 93.7 |
| | 66.6 |
|
| Total International | 11,592.5 |
| | 9,893.0 |
|
| Total long-lived assets | $ | 28,522.7 |
| | $ | 26,862.6 |
|
_______________
| |
| (1) | Includes Property and equipment, net, Goodwill and Other intangible assets, net. |
| |
| (2) | Balances are translated at the applicable period end exchange rate, which may impact comparability between periods. |
The following tenants within the property and services segments individually accounted for 10% or more of the Company’s consolidated operating revenues for the years ended December 31, is as follows:
|
| | | | | | | | |
| | 2017 | | 2016 | | 2015 |
| AT&T | 19 | % | | 21 | % | | 24 | % |
| Verizon Wireless | 16 | % | | 15 | % | | 16 | % |
| Sprint | 9 | % | | 11 | % | | 13 | % |
| T-Mobile | 9 | % | | 9 | % | | 10 | % |
21. RELATED PARTY TRANSACTIONS
During the years ended December 31, 2017, 2016 and 2015, the Company had no significant related party transactions.
AMERICAN TOWER CORPORATION AND SUBSIDIARIES
NOTES TO CONSOLIDATED FINANCIAL STATEMENTS
(Tabular amounts in millions, unless otherwise disclosed)
22. SELECTED QUARTERLY FINANCIAL DATA (UNAUDITED)
Selected quarterly financial data for the years ended December 31, 2017 and 2016 is as follows (in millions, except per share data):
|
| | | | | | | | | | | | | | | | | | | |
| | Three Months Ended | | Year Ended December 31, |
| | March 31, | | June 30, | | September 30, | | December 31, | |
| 2017: | | | | | | | | | |
| Operating revenues | $ | 1,616.2 |
| | $ | 1,662.5 |
| | $ | 1,680.7 |
| | $ | 1,704.5 |
| | $ | 6,663.9 |
|
| Costs of operations (1) | 492.7 |
| | 517.2 |
| | 519.8 |
| | 526.9 |
| | 2,056.6 |
|
| Operating income | 531.4 |
| | 576.9 |
| | 561.1 |
| | 329.0 |
| | 1,998.4 |
|
| Net income | 307.4 |
| | 388.5 |
| | 334.7 |
| | 194.8 |
| | 1,225.4 |
|
| Net income attributable to American Tower Corporation stockholders | 316.1 |
| | 367.0 |
| | 317.3 |
| | 238.5 |
| | 1,238.9 |
|
| Dividends on preferred stock | (26.8 | ) | | (22.8 | ) | | (18.9 | ) | | (18.9 | ) | | (87.4 | ) |
| Net income attributable to American Tower Corporation common stockholders | 289.3 |
| | 344.2 |
| | 298.4 |
| | 219.6 |
| | 1,151.5 |
|
| Basic net income per share attributable to American Tower Corporation common stockholders | 0.68 |
| | 0.81 |
| | 0.70 |
| | 0.51 |
| | 2.69 |
|
| Diluted net income per share attributable to American Tower Corporation common stockholders | 0.67 |
| | 0.80 |
| | 0.69 |
| | 0.51 |
| | 2.67 |
|
|
| | | | | | | | | | | | | | | | | | | |
| | Three Months Ended | | Year Ended December 31, (2) |
| | March 31, | | June 30, | | September 30, | | December 31, | |
| 2016: | | | | | | | | | |
| Operating revenues | $ | 1,289.0 |
| | $ | 1,442.2 |
| | $ | 1,514.8 |
| | $ | 1,539.5 |
| | $ | 5,785.7 |
|
| Costs of operations (1) | 351.4 |
| | 459.7 |
| | 491.2 |
| | 488.0 |
| | 1,790.4 |
|
| Operating income | 451.9 |
| | 432.8 |
| | 479.1 |
| | 489.3 |
| | 1,853.0 |
|
| Net income | 281.3 |
| | 192.5 |
| | 263.7 |
| | 232.9 |
| | 970.4 |
|
| Net income attributable to American Tower Corporation stockholders | 275.2 |
| | 187.6 |
| | 264.5 |
| | 229.2 |
| | 956.4 |
|
| Dividends on preferred stock | (26.8 | ) | | (26.8 | ) | | (26.8 | ) | | (26.8 | ) | | (107.1 | ) |
| Net income attributable to American Tower Corporation common stockholders | 248.4 |
| | 160.8 |
| | 237.7 |
| | 202.4 |
| | 849.3 |
|
| Basic net income per share attributable to American Tower Corporation common stockholders | 0.59 |
| | 0.38 |
| | 0.56 |
| | 0.48 |
| | 2.00 |
|
| Diluted net income per share attributable to American Tower Corporation common stockholders | 0.58 |
| | 0.37 |
| | 0.55 |
| | 0.47 |
| | 1.98 |
|
_______________
| |
| (1) | Represents Operating expenses, exclusive of Depreciation, amortization and accretion, Selling, general, administrative and development expense, and Other operating expenses. |
| |
| (2) | The amounts reported for the year ended December 31, 2016 differ slightly from the sum of the quarters due to rounding. |
AMERICAN TOWER CORPORATION AND SUBSIDIARIES
SCHEDULE III—SCHEDULE OF REAL ESTATE
AND ACCUMULATED DEPRECIATION
(dollars in millions)
|
| | | | | | | | | | | | | | | | | | | | | | | | | |
| Description | | Encumbrances | | | Initial cost to company | | Cost capitalized subsequent to acquisition | | Gross amount carried at close of current period | | | Accumulated depreciation at close of current period | | Date of construction | | Date acquired | | Life on which depreciation in latest income statements is computed |
| 149,246 | sites (1) | | $ | 3,435.3 |
| (2) | | (3) | | (3) | | $ | 15,349.0 |
| (4) | | $ | (5,181.2 | ) | | Various | | Various | | Up to 20 years |
(1) No single site exceeds 5% of the total amounts indicated in the table above.
(2) Certain assets secure debt of $3.4 billion.
(3) The Company has omitted this information, as it would be impracticable to compile such information on a site-by-site basis.
(4) Does not include those sites under construction.
|
| | | | | | | | | | | | |
| | 2017 | | 2016 | | 2015 | |
| Gross amount at beginning | $ | 14,277.0 |
| | $ | 13,046.3 |
|
| $ | 10,434.3 |
| (1) |
| Additions during period: | | | | | | |
| Acquisitions | 499.7 |
| | 787.2 |
| | 2,620.8 |
| |
| Discretionary capital projects (2) | 120.7 |
| | 105.3 |
| | 210.4 |
| |
| Discretionary ground lease purchases (3) | 150.4 |
| | 168.1 |
| | 144.7 |
| |
| Redevelopment capital expenditures (4) | 138.8 |
| | 136.8 |
| | 114.1 |
| |
| Capital improvements (5) | 65.6 |
| | 81.8 |
| | 42.4 |
| |
| Start-up capital expenditures (6) | 158.1 |
| | 128.7 |
| | 35.6 |
| |
| Other (7) | 106.4 |
| | 139.4 |
| | 201.1 |
| |
| Total additions | 1,239.7 |
| | 1,547.3 |
| | 3,369.1 |
| |
| Deductions during period: | | | | | | |
| Cost of real estate sold or disposed | (246.5 | ) | �� | (85.8 | ) | | (61.0 | ) | |
| Other (8) | 78.8 |
| | (230.8 | ) | | (696.1 | ) | |
| Total deductions: | (167.7 | ) | | (316.6 | ) | | (757.1 | ) | |
| Balance at end | $ | 15,349.0 |
| | $ | 14,277.0 |
| | $ | 13,046.3 |
| |
|
| | | | | | | | | | | |
| | 2017 | | 2016 | | 2015 |
| Gross amount of accumulated depreciation at beginning | $ | (4,548.1 | ) | | $ | (3,994.9 | ) | | $ | (3,613.1 | ) |
| Additions during period: | | | | | |
| Depreciation | (718.7 | ) | | (647.9 | ) | | (557.1 | ) |
| Other | — |
| | — |
| | — |
|
| Total additions | (718.7 | ) | | (647.9 | ) | | (557.1 | ) |
| Deductions during period: | | | | | |
| Amount of accumulated depreciation for assets sold or disposed | 100.7 |
| | 24.9 |
| | 30.1 |
|
| Other (8) | (15.1 | ) | | 69.8 |
| | 145.2 |
|
| Total deductions | 85.6 |
| | 94.7 |
| | 175.3 |
|
| Balance at end | $ | (5,181.2 | ) | | $ | (4,548.1 | ) | | $ | (3,994.9 | ) |
_______________
| |
| (1) | Beginning balance has been revised to reflect purchase accounting measurement period adjustments. |
| |
| (2) | Includes amounts incurred primarily for the construction of new sites. |
| |
| (3) | Includes amounts incurred to purchase or otherwise secure the land under communications sites. |
| |
| (4) | Includes amounts incurred to increase the capacity of existing sites, which results in new incremental tenant revenue. |
| |
| (5) | Includes amounts incurred to enhance existing sites by adding additional functionality, capacity or general asset improvements. |
| |
| (6) | Includes amounts incurred in connection with acquisitions or new market launches. Start-up capital expenditures includes non-recurring expenditures contemplated in acquisitions or new market launch business cases. |
| |
| (7) | Primarily includes regional improvements and other additions. |
| |
| (8) | Primarily includes foreign currency exchange rate fluctuations and other deductions. |