our ability to successfully integrate operations of our acquisitions and sentencing policies.);realize projected returns resulting therefrom;
Any or all of our forward-looking statements in this Annual Report may turn out to be inaccurate. We have based these forward-looking statements largely on our current expectations and projections about future events and financial trends that we believe may
3
affect our financial condition, results of operations, business strategy, and financial needs. TheyOur statements can be affected by inaccurate assumptions we might make or by known or unknown risks, uncertainties and assumptions, including the risks, uncertainties, and assumptions described in “Risk Factors.”"Risk Factors" included elsewhere in this Annual Report and in other reports, documents, and other information we file with the Securities and Exchange Commission, or the SEC, from time to time.
3
In light of these risks, uncertainties and assumptions, the forward-looking events and circumstances discussed in this Annual Report may not occur and actual results could differ materially from those anticipated or implied in the forward-looking statements. When you consider these forward-looking statements, you should keep in mind the risk factors and other cautionary statements in this Annual Report, including in “Management’s"Management's Discussion and Analysis of Financial Condition and Results of Operations”Operations," "Business" and “Business.”"Risk Factors."
Our forward-looking statements speak only as of the date made. We undertake no obligation to publicly update or revise forward-looking statements, whether as a result of new information, future events or otherwise. All subsequent written and oral forward-looking statements attributable to us or persons acting on our behalf are expressly qualified in their entirety by the cautionary statements contained in this Annual Report.
4
We are a diversified government solutions company with the nation’s largest ownerscale and experience needed to solve tough government challenges in flexible, cost-effective ways. Through three business offerings, CoreCivic Safety, CoreCivic Properties, and CoreCivic Community, we provide a broad range of privatized correctionalsolutions to government partners that serve the public good through corrections and detention management, government real estate solutions, and a growing network of residential reentry centers to help address America's recidivism crisis. We have been a flexible and dependable partner for government for more than 30 years. Our employees are driven by a deep sense of service, high standards of professionalism and a responsibility to help government better the public good.
Structured as a REIT, we are one of the nation's largest owners of partnership correctional, detention, and residential reentry facilities and one of the largest prison operators in the United States. We also believe we are the largest private owner of real estate used by government agencies. As of December 31, 2014,2017, we owned or controlled 52and managed 70 correctional, detention, and detentionresidential reentry facilities, and managed an additional 12seven correctional and detention facilities owned by our government partners, with a total design capacity of approximately 84,50078,000 beds in 19 statesstates. In addition, as of December 31, 2017, we owned 12 properties leased to third parties and the District of Columbia.used by government agencies, totaling 1.1 million square feet in five states.
We are a Real Estate Investment Trust, or REIT, specializing in owning, operating, and managing prisons and other correctional facilities and providing residential, community re-entry, and prisoner transportation services for governmental agencies. In addition to providing fundamental residential services, our correctional, detention, and residential reentry facilities offer a variety of rehabilitation and educational programs, including basic education, faith-based services, life skills and employment training, and substance abuse treatment. These services are intended to help reduce recidivism and to prepare offenders for their successful re-entryreentry into society upon their release. We also provide or make available to offenders certain health care (including medical, dental, and mental health services), food services, and work and recreational programs.
We are a Maryland corporation formed in 1983. Our principal executive offices are located at 10 Burton Hills Boulevard, Nashville, Tennessee, 37215, and our telephone number at that location is (615) 263-3000. Our website address is www.cca.com.www.corecivic.com. We make our Annual Reports on Form 10-K, Quarterly Reports on Form 10-Q, Current Reports on Form 8-K, definitive proxy statements, and amendments to those reports under the Securities Exchange Act of 1934, as amended, (the “Exchange Act”),or the Exchange Act, available on our website, free of charge, as soon as reasonably practicable after these reports are filed with or furnished to the Securities and Exchange Commission, or the SEC. Information contained on our website is not part of this Annual Report.
We began operating as a REIT for federal income tax purposes effective January 1, 2013. Since that date, we have provided correctionalWe provide services and conductedconduct other operationsbusiness activities through taxable REIT subsidiaries, or TRSs. A TRS is a subsidiary of a REIT that is subject to applicable corporate income tax and certain qualification requirements. Our use of TRSs enables us to comply with REIT qualification requirements while providing correctional services at facilities we own and at facilities owned by our government partners and to engage in certain other business operations. A TRS is not subject to the distribution requirements applicable to REITs so it may retain income generated by its operations for reinvestment.
As a REIT, we generally are not subject to federal income taxes on our REIT taxable income and gains that we distribute to our stockholders, including the income derived from providing prison bed capacityour real estate and dividends we earn from our TRSs. However, our TRSs will be required to pay income taxes on their earnings at regular corporate income tax rates.
As a REIT, we generally are required to distribute annually to our stockholders at least 90% of our REIT taxable income (determined without regard to the dividends paid deduction and excluding net capital gains). Our REIT taxable income will not typically include income earned by our TRSs except to the extent our TRSs pay dividends to the REIT. Prior to our REIT reorganization, we operated as a C-corporation for federal income tax purposes. A REIT is not permitted to retain earnings and profits accumulated during the periods it was taxed as a C-corporation, and must make one or more distributions to stockholders that equal or exceed those accumulated amounts. To satisfy this requirement, on April 8, 2013, our
5
Board of Directors declared a special dividend to stockholders of $675.0 million, or $6.66 per share of common stock to distribute our accumulated earnings and profits attributable to tax periods ending prior to January 1, 2013. We paid the special dividend on May 20, 2013 to stockholders of record on April 19, 2013. The special dividend was composed of cash and shares of our common stock, at each stockholder’s election, subject to a cap on the total amount of cash equal to 20% of the aggregate amount of the special dividend, or $135.0 million. The balance of the special dividend was paid in the form of 13.9 million additional shares of our common stock.
Management and Operation of Correctional and Detention Facilities
Our customers primarily consist of federal, state, and local correctional and detention authorities. Federal correctional and detention authorities primarily consist of the Federal Bureau of Prisons, or the BOP, the United
5
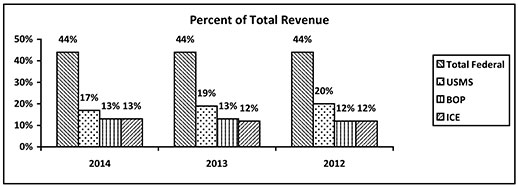
States Marshals Service, or the USMS, and the U.S. Immigration and Customs Enforcement, or ICE. Payments by federal correctional and detention authorities represented 44%48%, 52%, and 51% of our total revenue for each of the years ended December 31, 2014, 2013,2017, 2016, and 2012.2015, respectively.
Our customer contracts typically have terms of three to five years and contain multiple renewal options. Most of our facility contracts also contain clauses that allow the government agency to terminate the contract at any time without cause, and our facility contracts and government lease agreements are generally subject to annual or bi-annual legislative appropriations of funds.
We are compensated for providing prison bed capacity and correctional, detention, and residential reentry services at an inmatea per diem rate based upon actual or minimum guaranteed occupancy levels. Occupancy rates for a particular facility are typically low when first opened or immediately following an expansion. However, beyond the start-up period, which typically ranges from 90 to 180 days, the occupancy rate tends to stabilize. For the years 2014, 2013, and 2012, theThe average compensated occupancy of our facilities, based on rated capacity was 84%as follows for the years 2017, 2016, and 2015:
|
| 2017 |
|
| 2016 |
|
| 2015 |
| |||
Owned and managed facilities |
|
| 77 | % |
|
| 76 | % |
|
| 80 | % |
Managed-only facilities |
|
| 94 | % |
|
| 95 | % |
|
| 94 | % |
Total operating facilities |
|
| 80 | % |
|
| 79 | % |
|
| 83 | % |
The average compensated occupancy of our owned and managed facilities, excluding idled facilities, was 89%, 85%87%, and 88%89% for 2017, 2016, and 2015, respectively.
We also lease facilities to governmental agencies and third-party operators where our occupancy percentage is based on leased square feet rather than bed capacity. These facilities generated 6%, 5%, and 5% of our facility net operating income, which we define as a facility's operating income or loss from operations before interest, taxes, asset impairments, depreciation, and amortization, in 2017, 2016, and 2015, respectively, and the occupancy of these facilities was as follows for allthe years 2017, 2016, and 2015:
|
| 2017 |
|
| 2016 |
|
| 2015 |
| |||
Leased portfolio |
|
| 100 | % |
|
| 100 | % |
|
| 100 | % |
We also provide transportation services to governmental agencies through TransCor America, LLC, or TransCor, a subsidiary of our wholly-owned TRS. During the facilities we ownedyears ended December 31, 2017, 2016, and 2015, TransCor generated total revenue of $2.3 million, $2.6 million, and $4.1 million, respectively, or managed, exclusiveapproximately 0.1%, 0.1%, and 0.2% of facilitiesour total consolidated revenue in 2017, 2016, and 2015, respectively. We believe TransCor provides a complementary service to our core business that have been presented as discontinued operations.enables us to respond quickly to our customers' transportation needs.
Operating Procedures and Offender Services for Correctional, Detention, and Residential Reentry Facilities
Pursuant to the terms of our customer contracts, we are responsible for the overall operations of our facilities, including staff recruitment, general administration of the facilities, facility maintenance, security, and supervision of the offenders. We are required by our customer contracts to maintain certain levels of insurance coverage for general liability, workers’workers' compensation, vehicle liability, and property loss or damage. We also are also required to indemnify our customers for claims and costs arising out of our operations and, in certain cases, to maintain performance bonds and other collateral requirements. Approximately 90% of the eligible facilities we operated at December 31, 2014 were accredited by the American Correctional Association Commission on Accreditation. The American Correctional Association, or ACA, is an independent organization comprised of corrections professionals that establishes accreditation standards for correctional and detention institutions.
We arebelieve a focus on inmate reentry provides great benefits for our communities – more people living healthy and productive lives and contributing to strong families and local economies. We have committed to equipping offendersevolving our model to focus more and more on reentry services, and we are working hard to equip the men and women in our care with the services, support, and resources necessarythey need to return to the community as productive, contributing members of society. be successful.
6
To that end, we provide a wide range of evidence-based re-entryreentry programs and activities atin our facilities. At most of the facilities we manage, offenders have the opportunity to enhance their basic education from literacy through the acquisition of theearning a high school equivalency diploma endorsed by thetheir respective state and, instate. In some cases,
6
we also provide opportunities for postsecondary educational achievements. In aachievements and chances to participate in college correspondence classes. A number of our facilities and in conjunction with the Mexican government, wethat house non-citizens offer an adult education curriculumcurricula recognized by a number ofseveral nations to which these offenders may return.return, including a curriculum offered in conjunction with the Mexican government. We also provide the Adult Education in Spanish program for offenders with that specific language need.
For the offenders who are close to taking their high school equivalency exam (either the GED or the HiSET), we have invested in the equipment needed to use the GED/HiSET Academy software program, which is an offline software program providing over 200 hours of individualized lessons up to the 12th grade. The GED/HiSET Academy incorporates teaching best practices and provides an atmosphere to engage and motivate students to learn everything they need to know to pass the GED/HiSET exam. As an example of the impact we are having, during 2017, the number of offenders in our facilities who passed high school equivalency exams totaled 1,684, an increase of 3% from 2016. In 2017, our Crowley County Correctional Facility and Coffee Correctional Facility led the state systems in Colorado and Georgia, respectively, in GED completions. According to research from the independent RAND Corporation, "Evaluating the Effectiveness of Correctional Education" published in 2013, inmates who obtain GEDs while in prison are 30% less likely to return to prison.
In addition, we offer a broad spectrum of vocational/career/technical education opportunities to equiphelp individuals withlearn marketable job skills. Our trade programs are certified by the National Center for Construction Education and Research, or NCCER. NCCER establishes the curriculum and certification for over 4,000 construction and trade organizations. Graduates of these programs enter the job market with certified skills that significantly enhance employability. During 2017, 4,483 offenders in facilities we manage earned career and technical education certificates. We are proud of the educational programs we offer and intend to maintain and develop such programs. For example, near the end of 2016, in coordination with the Georgia Department of Corrections, we developed programs at two facilities in the state to offer courses in welding and diesel truck maintenance, enabling students to earn trade certificates from nearby community colleges. In 2017, 93 students graduated from these programs.
For those with assessed substance use disorder needs,disorders, we offer cognitive evidence-based treatment programs with proven clinical outcomes, such as the Residential Drug Addictions TreatmentAbuse Program. We offer both Residential Therapeutic Community models and intensive outpatient programs. We also offer drug and alcohol use education/DWI programs at some of our locations. Our goal in providing substance use treatment is to stimulate internal motivation for change and progress through the stages of change so that lasting behavioral alterations can occur. Our drug and alcohol education programs help participants understand their relationships with drugs and the links between drug use and crime, as well as assisting them in making better choices that can lead to healthier relationships in their lives. In 2017, 1,839 offenders completed substance use disorder programming.
Additional program offerings include our Victim Impact Programs, available at a number of our facilities, which seek to educate offenders about the negative effects their criminal conduct can have on others. In 2017, seven facilities received training to offer Victim Impact Programs to offenders in both secure and community sites. In addition, in 2017, 455 offenders successfully completed Victim Impact Programs. All of our facilities offer opportunities for worship and/or study for a wide range of faith traditions represented in our populations. Additionally, in many facilities, we offer faith-based programs, with an emphasis on reentry, character development, and spiritual growth. During 2017, we transitioned to the Threshold Program, or RDAP, with proven clinical outcomes. a multi-faith, evidence-based model, for our faith-based reentry component.
Our life skillsReentry and Life Skills programs prepare individuals for life after incarceration by teaching offendersthem how to successfully conduct a job search, how to manage their budget and financial matters, parenting skills, and relationship and family skills. Equally significant, we offer cognitive behavioral programs aimed at changing anti-social attitudes and behaviors ofin offenders, with a focus on altering the level of criminal thinking. We recently introduced a comprehensive reentry strategy we call "Go Further", a forward thinking, of offenders. Our Victim Impact Programs, available atsystems approach to reentry. "Go Further" embraces all facility reentry programs, adds a numberproprietary cognitive/behavioral curriculum, and encourages staff and offenders to take a collaborative approach to assist in reentry preparation. "Go Further" is currently in place in five of our facilities, seekwith plans to educate offenders on the negative effects upon others resulting from their criminal conduct. At a number of ouradd additional facilities we provide faith-based programs to those seeking spiritual growth and character development. Our facilities offer opportunities for religious worship and study for a variety of faith groups and belief systems. in 2018.
7
Across the country, these programs incorporateour dedicated staff, along with the useassistance of thousands of volunteers, along with our staff, who assist in providingwork to provide guidance, direction, and post-incarceration services to offenders.the men and women in our care. We believe, that together these effortscritical reentry programs help us achieve reductions in recidivism.fight the serious challenge of recidivism facing the United States.
Through our community corrections facilities, we provide an array of services to defendants and offenders who are serving their full sentence, the last portion of their sentence, waiting to be sentenced, or awaiting trial while supervised in a community environment. We also offer services for alternative sentencing options that provide governmental agencies and the courts the ability to place sentenced offenders in a community corrections facility thereby allowing them the opportunity to maintain their employment. We offer housing and programs with a key focus on employment, job readiness, and life skills and various substance abuse treatment programs, in order to help offenders successfully re-enter the communityreenter their communities and reduce the risk of recidivism.
In addition, in some of our community corrections facilities, we offer housing and program services to parolees who have completed their sentence but lack a viable reentry plan. Through a focus on employment and skill development, we provide a means for these parolees to successfully reintegrate into their communities.
Lastly, we provide day-reporting and outpatient substance abuse treatment programs at some of our community corrections facilities. These programs, depending on the needs of the offender, can provide cognitive behavioral-based programs to assist in the offender's successful reentry while holding the individual accountable while living in the community.
Ultimately, the work we do is about giving people the tools to reintegrate with their communities for good. We are proud of the teachers, counselors, case managers, chaplains, and other inmate support service professionals who provided these extensive services to the men and women entrusted in our care.
The American Correctional Association, or ACA, is an independent organization comprised of corrections professionals that establishes accreditation standards for correctional and detention institutions. Outside agency standards, such as those established by the ACA, provide us with the industry’sindustry's most widely accepted operational guidelines. ACA accredited facilities must be audited and re-accredited at least every three years. We have sought and received ACA accreditation for 4735, or approximately 90%, of the eligible facilities we operated as of December 31, 2014.2017, excluding our residential reentry facilities. During 2017, nine of the facilities we manage were re-accredited by the ACA with an average score of 99.4%, making our portfolio average 99.5%.
Beyond the standards provided by the ACA, our facilities are operated in accordance with a variety of company and facility-specific policies and procedures, as well as various contractual requirements. TheseMany of these policies and procedures reflect the high standards generated by a number of sources, including the ACA, The Joint Commission, the National Commission on Correctional Healthcare, the Occupational Safety and Health Administration, as well as federal, state, and local government codes and regulations establishedand longstanding correctional procedures, and company-wide policies and procedures that may exceed these guidelines.procedures.
In addition, our facilities are operated in compliance with the Prison Rape Elimination Act, or PREA, regulations were published in June 2012 andstandards, which became effective in August 2013. All confinement facilities covered under the PREA standards must be audited at least every three years to be considered compliant with the PREA standards, with one-third of each facility type operated by an agency, or private organization on behalf of an agency, audited each year. ThesePREA. Covered facilities include adult prisons and jails, juvenile facilities, lockups (housing detainees overnight), and community confinement facilities, whether operated by the United States Department of Justice, or unit ofDOJ, or by a state, local, corporate, or nonprofit authority.We utilize DOJ-certified PREA auditors to help ensure that all facilities operate in compliance with applicable PREA regulations.
7
Our facilities not only operate under these established standards, policies, and procedures, but theyand also are consistently challengedsubject to annual audits by our management to exceed them. This challenge is presented, in large part, through our extensive Quality Assurance Program. Our Quality Assurance Division, or QAD, independentlywhich operates under the auspices of, and reports directly to, our Office of General Counsel. WeCounsel and independently from our Operations Division. Through the QAD, we have devoted significant resources to meetingensuring that our facilities meet outside agency and accrediting organization standards and guidelines. Our QAD provides governance for all efforts by our facilities to deliver high quality services and operations, with a commitment to continuous quality improvement.
The QAD collects and analyzes performance metrics across multiple databases. Through rigorous reporting and analyses of comprehensive, comparative statistics across disciplines, divisions, business units and our company as a whole, the QAD provides timely, independently generated performance and trend data to senior management.
The QAD also employs a team of full-time auditors, who are subject matter experts from all major disciplines within institutional operations. Annually, without advance notice, theseQAD auditors conduct rigorous, on siteon-site evaluations of each facility we operate. Theoperate using specialized audit tools, typically containing more than 1,000 audit indicators across all major operational areas. In most instances, these audit tools are tailored to facility and partner specific
8
requirements. In addition, audit teams use highly specialized, discipline-specific audit tools, containing over 1,600 audited items across fourteen major operational areas, in this detailed, comprehensive process. The results of these on-site evaluations are used to discern areas of operational strength and areas in need of management attention. The audit findings also comprise a major part of our continuous operational risk assessment and management process. Audit teams are also made available tooften work with facilities into address specific areas of need, such as meeting requirements of new partner contracts or providing detailed training of new departmental managers.
The QAD management team coordinates overall operational auditing and compliance efforts across all CCA facilities.correctional, detention, and residential reentry facilities we manage. In conjunction with subject matter experts and other stakeholders having risk management responsibilities, the QAD management team develops performance measurement tools used in facility audits. The QAD management team also provides governance of the corporatecorrective action plan process for any items of action process which helps to ensure swift resolution of issuesnonconformance identified through internal and external facility reviews. Our QAD also contracts with teams of seasoned, ACA certified correctional auditors to help ensure continuousevaluate compliance with ACA standards at accredited facilities and to help ensure that our facilities are operating at the highest possible levels.facilities. Similarly, the QAD coordinates the workroutinely incorporates a review of certified PREA auditors to help ensure that all facilities operate infacility compliance with these important regulations.key PREA regulations during audits of company facilities.
Prisoner Transportation Services
We currently provide transportation services to governmental agencies through our wholly-owned TRS, TransCor America, LLC, or TransCor. During the years ended December 31, 2014, 2013, and 2012, TransCor generated total revenue of $4.4 million, $2.7 million, and $2.5 million, respectively, or approximately 0.3% of our total consolidated revenue in 2014 and 0.2% in both 2013 and 2012. We believe TransCor provides a complementary service to our core business that enables us to respond quickly to our customers’ transportation needs.
8
We are currently the nation’s largest owner and provider of outsourced correctional facilities and management services. We believe we manage nearly 41% of all beds under contract with private operators of correctional and detention facilities in the United States, most of which are in facilities we own and provide to our governmental customers. We believe we own approximately 61%58% of all privately owned prison beds in the United States.States, manage nearly 39% of all privately managed prison beds in the United States, and are currently the second largest private owner and provider of community corrections services in the nation. We also believe that we are the largest private owner of real estate used by government agencies. Under the direction of our partnership development department, and senior management, we market our facilities and services to government agencies responsible for federal, state, and local correctional, detention, and detentionresidential reentry facilities in the United States. Under the direction of our strategic developmentreal estate department, we pursue asset acquisitionsintend to continue pursuing the acquisition and development of additional correctional, detention, and residential reentry facilities, as well as other government-leased real estate assets with a bias toward those used to provide mission-critical governmental services that we believe have a favorable investment return, diversify our cash flows, and increase value to our stockholders.
We execute cross-departmental efforts to market CoreCivic Safety solutions to government partners that seek corrections and detention management services, CoreCivic Properties solutions to customers that need real estate and maintenance services, and CoreCivic Community solutions to government partners seeking residential reentry services. We also offer government partners a combination of these business combination transactions.offerings, and currently have two government partners utilizing all three.
As indicated by the following chart, business from our federal customers, including primarily the BOP, USMS, and ICE, continues to be a significant component of our business. The BOP, USMS, and ICE were the only federal partners that accounted for 10% or more of our total revenue during the last three years.
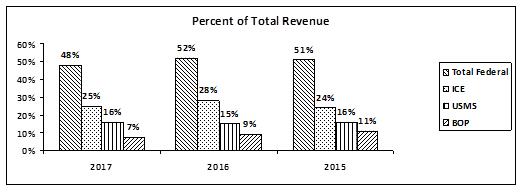
Certain of our contracts with federal partners contain “take-or-pay” clauses that guarantee the federal partner access to a minimum bed capacity in exchange for a fixed monthly payment. However, these contracts also generally provide the government the ability to cancel the contract for non-appropriation of funds or for convenience.
BusinessThe decline in federal revenue from 2016 to 2017 was primarily a result of an amendment to the inter-governmental service agreement, or IGSA, associated with our South Texas Family Residential Center, which became effective in the fourth quarter of 2016. See "Management's Discussion and Analysis of Financial Condition and Results of
9
Operations - Results of Operations" for a further discussion regarding our contract at the South Texas Family Residential Center. In addition, populations in federal facilities, particularly within the BOP system nationwide, have declined over the past three years. Inmate populations in the BOP system declined due, in part, to the retroactive application of changes to sentencing guidelines applicable to certain federal drug trafficking offenses.
Despite this decline, we continue to believe utilization of private sector bed capacity and management services provides our federal partners with flexible and cost-effective solutions essential to their missions. For example, in November 2016, we announced that the BOP exercised a two-year renewal option at our 1,978-bed McRae Correctional Facility. The amended agreement commenced on December 1, 2016, and provides for caring for up to 1,724 federal inmates with a fixed monthly payment for 1,633 beds, compared to our previous contract which contained a fixed payment for 1,780 beds. In addition, in July 2017, the BOP exercised a two-year renewal option at our 2,232-bed Adams County Correctional Center. For the year ended December 31, 2017, we generated 5% of our total revenue through the remaining contracts with the BOP at these two correctional facilities.
Further, we believe our ability to provide flexible solutions and fulfill emergent needs of ICE would be very difficult and costly to replicate in the public sector, demonstrated by the contract with ICE at our 2,400-bed South Texas Family Residential Center, which was amended and extended in October 2016. The October 2016 amendment extended the term of the contract through September 2021 and can be further extended by bi-lateral modification. In addition, in December 2016, we announced a new award to provide detention capacity to ICE at our 2,016-bed Northeast Ohio Correctional Center, and in April 2017, we announced a new contract award to provide up to 996 beds to the state customers, whichof Ohio at this same facility. We previously housed inmates from the BOP at the Northeast Ohio facility under a contract that expired in May 2015. We believe these contracts provide further examples of the marketability of our real estate assets across multiple government customers.
State revenues from contracts at correctional, detention, and residential reentry facilities that we operate constituted 48%41%, 49%38%, and 49%40% of our total revenue during the years 2014, 2013,2017, 2016, and 2012,2015, respectively, decreased 4.2%and increased 2.4% from $826.1$710.4 million during 20132016 to $791.8$727.8 million during 2014. The State2017. Approximately 6%, 6%, and 10% of our total revenue for 2017, 2016, and 2015, respectively, was generated from the California Department of Corrections and Rehabilitation, or CDCR, accounted for 14%, 12%, and 12%in facilities housing inmates outside the state of total revenue for 2014, 2013, and 2012, respectively, including revenue generated under an operating lease that commenced December 1, 2013, at our California City facility.California. The CDCR was our only state partner that accounted for 10% or more of our total revenue during these years.
Several of our state partners are projecting modest increases in tax revenues and improvements in their budgets which has resulted in our ability tohelped us secure recent per diem increases at certain facilities. Further, several of our existing state partners, as well as prospective state partners, are experiencing growth in inmate populations and overcrowded conditions. Although we can provide no assurance that we will enter into any new contracts, we believe we are well positioned to provide them with needed bed capacity, as well as the programming and reentry services they are seeking.
We believe the long-term growth opportunities of our business remain very attractive as certain statesgovernments consider efficiency and savingstheir emergent needs, as well as the efficiency and offender programming opportunities we can provide, as a toolflexible solutions to reduce recidivism.satisfy our partners' needs. Further, we expect our partners to continue to face challenges in maintaining old facilities, and developing new facilities, and expanding current facilities for additional capacity, which could result in future demand for the solutions that we provide.
10
9
We believe that we can further develop our business by, among other things:
Maintaining and expanding our existing customer relationships and continuing to fillfilling existing beds within our facilities, while maintaining an adequate inventory of available beds that we believe provides us with flexibility and a competitive advantage when bidding for new management contracts;
Pursuing mission-critical real estate solutions for government agencies including, but not limited to, corrections and detention real estate assets;
Pursuing other asset acquisitions and business combinations through transactions with non-government third parties;
We generally receive inquiries from or on behalf of government agencies that are considering outsourcing the ownership and/or management of certain facilities or that have already decided to contract with a private enterprise. When we receive such an inquiry, we determine whether there is an existing need for our correctional, detention, and residential reentry facilities and/or services and whether the legal and political climate in which the inquiring party operates is conducive to serious consideration of outsourcing. Based on these findings, an initial cost analysis is conducted to further determine project feasibility.
Frequently, government agencies responsible for correctional, detention, and detentionresidential reentry facilities and services procure space and services through solicitations or competitive procurements. As part of our process of responding to such requests, members of our management team meet with the appropriate personnel from the agency making the request to best determine the agency’sagency's needs. If the project fits within our strategy, we submit a written response. A typical solicitation or competitive procurement requires bidders to provide detailed information, including, but not limited to, the space and services to be provided by the bidder, its experience and qualifications, and the price at which the bidder is willing to provide the facility and services (which services may include the purchase, renovation, improvement or expansion of an existing facility or the planning, design and construction of a new facility). The requesting agency selects a firm believed to be able to provide the requested bed capacity, if needed, and most qualified to provide the requested services and then negotiates the price and terms of the contract with that firm.
11
In 2017, we entered into a number of new contracts, renewed several other significant contracts, and completed numerous other transactions and milestones, including the following:
Completed the acquisition of Arapahoe Community Treatment Center, a 135-bed residential reentry center in Colorado.
Completed the acquisition of the Stockton Female Community Corrections Facility, a 100-bed residential reentry center in California, which is leased to a third-party operator. The lessee separately contracts with the CDCR.
Announced a new contract with the state of Ohio to care for up to an additional 996 offenders at our 2,016-bed Northeast Ohio Correctional Center. The initial term of the contract continues through June 2032 with unlimited renewal options, subject to appropriations and mutual agreement.
Completed the acquisition of the real estate operated by Center Point, Inc., or Center Point, a California-based non-profit organization. We consolidated a portion of Center Point's operations into our preexisting residential reentry center portfolio and assumed ownership and operations of a 200-bed residential reentry center in Oklahoma.
Executed a new three-year contract with the City of Mesa, Arizona to care for up to 200 offenders at our 4,128-bed Central Arizona Florence Correctional Complex.
Completed the acquisition of New Beginnings Treatment Center, Inc., an Arizona-based community corrections company. In connection with the acquisition, we assumed a contract with the BOP to provide reentry services at a 92-bed residential reentry center in Arizona.
Completed the acquisition of a portfolio of four properties, including a 230-bed residential reentry center leased to the state of Georgia and three properties in North Carolina and Georgia leased to the General Services Administration, or GSA, an independent agency of the United States government, two of which are occupied by the Social Security Administration, or SSA, and one of which is occupied by the Internal Revenue Service, or IRS.
Completed the offering of $250.0 million principal amount of unsecured notes with a fixed stated interest rate of 4.75%, due October 15, 2027. We used net proceeds from the offering, after underwriter's fees and offering expenses, to pay down a portion of our revolving credit facility, reducing our exposure to variable rate debt, extending our weighted average maturity, and increasing the availability of borrowings under our revolving credit facility that is used to fund growth opportunities that require capital deployment.
Executed a new contract with the state of Nevada to care for up to 200 offenders at our 1,896-bed Saguaro Correctional Facility in Arizona.
Launched a nationwide initiative to advocate for a range of government policies that will help former inmates successfully reenter society and stay out of prison. We also committed to a series of accountability measures, including publicly reporting related advocacy activities on an annual basis and making support for recidivism-reducing policies one of our criteria for evaluating political contributions.
Completed the acquisition of Time to Change, Inc., a Colorado-based community corrections company. In connection with the acquisition, we assumed contracts to provide residential reentry services in three facilities located in Colorado containing a total of 422 beds.
Announced a new contract with Hamilton County, Tennessee to continue management, operation, and maintenance of the 1,046-bed Silverdale Detention Center. The initial term of the new contract is four years, renewable for four additional four-year periods.
Announced a new contract with the Commonwealth of Kentucky Department of Corrections to house medium and close-security offenders at our previously idled 816-bed Lee Adjustment Center in Kentucky. The contract commenced on November 19, 2017, and has an initial term expiring June 30, 2019, with two additional one-year extension options.
12
General
Our correctional, detention, and residential reentry facilities can generally be classified according to the level(s) of security at such facility. Secure facilities are facilities having cells, rooms, or dormitories, a secure perimeter, and some form of external patrol. Non-secure facilities are facilities having open housing that
10
inhibit movement by their design. Minimum security facilities have open housing within an appropriately designed and patrolled institutional perimeter. Medium security facilities have either cells, rooms or dormitories, a secure perimeter, and some form of external patrol. Maximum security facilities have cells, a secure perimeter, and external patrol. Multi-security facilities have various areas encompassing minimum, medium or maximum security.
Our facilities can also be classified according to their primary function. The primary functional categories are:
Correctional Facilities. Correctional facilities house and provide contractually agreed upon programs and services to sentenced adult prisoners, typically prisoners on whom a sentence in excess of one year has been imposed.
Detention Facilities. Detention facilities house and provide contractually agreed upon programs and services to (i) individuals being detained by ICE, (ii) individuals who are awaiting trial who have been charged with violations of federal criminal law (and are therefore in the custody of the USMS) or state criminal law, and (iii) prisoners who have been convicted of crimes and on whom a sentence of one year or less has been imposed.
Residential Facilities. Residential facilities provide space and residential services in an open and safe environment to adults with children who have been detained by ICE and are awaiting the outcome of immigration hearings or the return to their home countries. As contractually agreed upon, residential facilities offer services including, but not limited to, educational programs, medical care, recreational activities, counseling, and access to religious and legal services.
Community Corrections. Community corrections/residential reentry facilities offer housing and programs to offenders who are serving the last portion of their sentence or who have been assigned to the facility in lieu of a jail or prison sentence, with a key focus on employment, job readiness, and life skills.
Leased Facilities. Leased facilities are properties that are owned and leased to third parties and used by government agencies.
13
Facilities and Facility Management Contracts
As of December 31, 2014,2017, we owned or controlled 52and managed 70 correctional, detention, and residential reentry facilities, and managed an additional seven correctional and detention facilities in 16 states and the Districtowned by our government partners. In addition, as of Columbia, three of whichDecember 31, 2017, we owned 12 properties leased to third-party operators. Additionally, we managed 12 correctionalthird parties and detention facilities ownedused by government agencies. We also owned two corporate office buildings. Owned and managed facilities include facilities placed into service that we own or control via a long-term lease and manage. Managed-only facilities include facilities we manage that are owned by a third party. The segment disclosures are included in Note 16 of the Notes to the Consolidated Financial Statements.government authority. The following table sets forth all of the facilities that, as of December 31, 2014,2017, we (i) owned and managed, (ii) owned, but were leased to another operator,a third party, and (iii) managed but are owned by a government authority. The table includes certain information regarding each facility, including the term of the primary customer contract related to such facility, or, in the case of facilities we owned but leased to a third-party operator, the term of such lease.
11
Facility Name | Primary | Design Capacity (A) | Security Level | Facility Type (B) | Term | Remaining Renewal (C) | ||||||||||||||||||
Owned and Managed Facilities: | ||||||||||||||||||||||||
Central Arizona Florence Correctional Complex | USMS | 4,128 | Multi | Detention | Sep-18 | (2) 5 year | ||||||||||||||||||
Florence, Arizona | ||||||||||||||||||||||||
Eloy Detention Center | ICE | 1,500 | Medium | Detention | Indefinite | — | ||||||||||||||||||
Eloy, Arizona | ||||||||||||||||||||||||
| ||||||||||||||||||||||||
La Palma Correctional Center | State of California | 3,060 | Multi | Correctional | Jun-19 | Indefinite | ||||||||||||||||||
Eloy, Arizona | ||||||||||||||||||||||||
Oracle Transitional Center | BOP | 92 | — | Community | Feb-18 | (1) 1 year | ||||||||||||||||||
Tucson, Arizona | Corrections | |||||||||||||||||||||||
Red Rock Correctional Center (D) | State of Arizona | 2,024 | Medium | Correctional | Jul-26 | (2) 5 year | ||||||||||||||||||
Eloy, Arizona | ||||||||||||||||||||||||
Saguaro Correctional Facility | State of Hawaii | 1,896 | Multi | Correctional | Jun-19 | (2) 1 year | ||||||||||||||||||
Eloy, Arizona | ||||||||||||||||||||||||
CAI Boston Avenue | State of California | 120 | — | Community | Jun-18 | (3) 1 year | ||||||||||||||||||
San Diego, California | Corrections | |||||||||||||||||||||||
CAI Ocean View | BOP | 483 | — | Community | May-18 | (3) 1 year | ||||||||||||||||||
San Diego, California | Corrections | |||||||||||||||||||||||
Leo Chesney Correctional Center | — | 240 | — | — | — | — | ||||||||||||||||||
Live Oak, California | ||||||||||||||||||||||||
Otay Mesa Detention Center | ICE | 1,482 | Minimum/ | Detention | Jun-20 | (1) 3 year | ||||||||||||||||||
San Diego,
| Medium | |||||||||||||||||||||||
Adams Transitional Center | Adams County | 102 | — | Community | Jun-18 | — | ||||||||||||||||||
Denver, Colorado | Corrections | |||||||||||||||||||||||
Arapahoe Community Treatment Center | Arapahoe County | 135 | — | Community Corrections | Jun-18 | — | ||||||||||||||||||
Englewood, Colorado | ||||||||||||||||||||||||
Bent County Correctional Facility | State of Colorado | 1,420 | Medium | Correctional | Jun-18 | — | ||||||||||||||||||
Las Animas, Colorado | ||||||||||||||||||||||||
14
Facility Name | Primary Customer | Design Capacity (A) | Security Level | Facility Type (B) | Term | Remaining Renewal Options (C) | ||||||||||||||||||
Center | Boulder County | 69 | — | Community Corrections | Dec-18 | — | ||||||||||||||||||
Boulder, Colorado | ||||||||||||||||||||||||
Centennial Community Transition Center | Arapahoe County | 107 | — | Community Corrections | Jun-18 | — | ||||||||||||||||||
Englewood, Colorado | ||||||||||||||||||||||||
Columbine Facility | Denver County | 60 | — | Community | Jun-18 | — | ||||||||||||||||||
Denver, Colorado | Corrections | |||||||||||||||||||||||
Commerce Transitional Center | Adams County | 136 | — | Community | Jun-18 | — | ||||||||||||||||||
Commerce City, Colorado | Corrections | |||||||||||||||||||||||
Crowley County Correctional Facility | State of Colorado | 1,794 | Medium | Correctional | Jun-18 | — | ||||||||||||||||||
Olney Springs, Colorado | ||||||||||||||||||||||||
Dahlia Facility | Denver County | 120 | — | Community | Jun-18 | — | ||||||||||||||||||
Denver, Colorado | Corrections | |||||||||||||||||||||||
Fox Facility and Training Center | Denver County | 90 | — | Community | Jun-18 | — | ||||||||||||||||||
Denver, Colorado | Corrections | |||||||||||||||||||||||
Henderson Transitional Center | Adams County | 184 | — | Community | Jun-18 | — | ||||||||||||||||||
Henderson, Colorado | Corrections | |||||||||||||||||||||||
Huerfano County Correctional Center | — | 752 | Medium | Correctional | — | — | ||||||||||||||||||
Walsenburg, Colorado | ||||||||||||||||||||||||
Kit Carson Correctional Center | — | 1,488 | Medium | Correctional | — | — | ||||||||||||||||||
Burlington, Colorado | ||||||||||||||||||||||||
Longmont Community Treatment Center | Boulder County | 69 | — | Community Corrections | Dec-18 | — | ||||||||||||||||||
Longmont, Colorado | ||||||||||||||||||||||||
Ulster Facility | Denver County | 90 | — | Community | Jun-18 | — | ||||||||||||||||||
Denver, Colorado | Corrections | |||||||||||||||||||||||
Coffee Correctional Facility | State of Georgia | 2,312 | Medium | Correctional | Jun-18 | (16) 1 year | ||||||||||||||||||
Nicholls, Georgia | ||||||||||||||||||||||||
Jenkins Correctional Center | State of Georgia | 1,124 | Medium | Correctional | Jun-18 | (17) 1 year | ||||||||||||||||||
Millen, Georgia | ||||||||||||||||||||||||
McRae Correctional Facility | BOP | 1,978 | Medium | Correctional | Nov-18 | (2) 2 year | ||||||||||||||||||
McRae, Georgia | ||||||||||||||||||||||||
Stewart Detention Center | ICE | 1,752 | Medium | Detention | Indefinite | — | ||||||||||||||||||
Lumpkin, Georgia | ||||||||||||||||||||||||
Wheeler Correctional Facility | State of Georgia | 2,312 | Medium | Correctional | Jun-18 | (16) 1 year | ||||||||||||||||||
Alamo, Georgia | ||||||||||||||||||||||||
15
Facility Name | Primary Customer | Design Capacity (A) | Security Level | Facility Type (B) | Term | Remaining Renewal Options (C) | ||||||||||||||||||
Leavenworth Detention Center | USMS | 1,033 | Maximum | Detention | Dec-21 | (1) 5 year | ||||||||||||||||||
Leavenworth, Kansas | ||||||||||||||||||||||||
Lee Adjustment Center | Commonwealth of | 816 | Multi | Correctional | Jun-19 | (2) 1 year | ||||||||||||||||||
Beattyville, Kentucky |
| Kentucky | ||||||||||||||||||||||
12
| |||||||||||||||||||||||||||||||
Marion Adjustment Center | — | 826 | Minimum/ | Correctional | — | — | |||||||||||||||||||||||||
St. Mary, Kentucky | Medium | ||||||||||||||||||||||||||||||
| |||||||||||||||||||||||||||||||
Southeast Kentucky Correctional Facility (F) | — | 656 | Minimum/ Medium | Correctional | — | — | |||||||||||||||||||||||||
Wheelwright, Kentucky |
| ||||||||||||||||||||||||||||||
Prairie Correctional Facility | — | 1,600 | Medium | Correctional | — | — | |||||||||||||||||||||||||
Appleton, Minnesota | |||||||||||||||||||||||||||||||
Adams County Correctional Center | BOP | 2,232 | Medium | Correctional | Jul-19 | — | |||||||||||||||||||||||||
Adams County, Mississippi | |||||||||||||||||||||||||||||||
Tallahatchie County Correctional Facility | State of California | 2,672 | Multi | Correctional | Jun-19 | Indefinite | |||||||||||||||||||||||||
Tutwiler, Mississippi |
| ||||||||||||||||||||||||||||||
Crossroads Correctional Center | State of Montana | 664 | Multi | Correctional | Jun-17 | (1) 2 year | |||||||||||||||||||||||||
Shelby, Montana |
| ||||||||||||||||||||||||||||||
Nevada Southern Detention Center | USMS | 1,072 | Medium | Detention | Sep-20 | (2) 5 year | |||||||||||||||||||||||||
Pahrump, Nevada | |||||||||||||||||||||||||||||||
Elizabeth Detention Center | ICE | 300 | Minimum | Detention | Aug-18 | (3) 1 year | |||||||||||||||||||||||||
Elizabeth, New Jersey | |||||||||||||||||||||||||||||||
Cibola County Corrections Center | ICE | 1,129 | Medium | Detention | Oct-21 | Indefinite | |||||||||||||||||||||||||
Milan, New Mexico | |||||||||||||||||||||||||||||||
Northwest New Mexico Correctional | State of New Mexico | 596 | Multi | Correctional | Jun-20 | — | |||||||||||||||||||||||||
Grants, New Mexico |
| ||||||||||||||||||||||||||||||
Torrance County Detention Facility | — | 910 | Multi | Detention | — | — | |||||||||||||||||||||||||
Estancia, New Mexico | |||||||||||||||||||||||||||||||
Lake Erie Correctional Institution | State of Ohio | 1,798 | Medium | Correctional | Jun-32 | Indefinite | |||||||||||||||||||||||||
Conneaut, Ohio | |||||||||||||||||||||||||||||||
Northeast Ohio Correctional Center | State of Ohio | 2,016 | Medium | Correctional | Jun-32 | Indefinite | |||||||||||||||||||||||||
Youngstown, Ohio | |||||||||||||||||||||||||||||||
| |||||||||||||||||||||||||||||||
Carver Transitional Center | State of Oklahoma | 494 | — | Community | Jun-18 | (4) 1 year | |||||||||||||||||||||||||
Oklahoma City, Oklahoma | Corrections | ||||||||||||||||||||||||||||||
16
Facility Name | Primary Customer | Design Capacity (A) | Security Level | Facility Type (B) | Term | Remaining Renewal Options (C) | ||||||||||||||||||
State of Oklahoma | 1,692 | Multi | Correctional | Jun-18 | (1) 1 year | |||||||||||||||||||
Cushing, Oklahoma | ||||||||||||||||||||||||
Davis Correctional Facility | State of Oklahoma | 1,670 | Multi | Correctional | Jun-18 | (1) 1 year | ||||||||||||||||||
Holdenville, Oklahoma | ||||||||||||||||||||||||
Diamondback Correctional Facility | — | 2,160 | Multi | Correctional | — | — | ||||||||||||||||||
Watonga, Oklahoma | ||||||||||||||||||||||||
| ||||||||||||||||||||||||
Oklahoma City Transitional
| State of Oklahoma | 200 | — | Community Corrections | Jun-18 | |||||||||||||||||||
(4) 1 year | ||||||||||||||||||||||||
| ||||||||||||||||||||||||
Tulsa Transitional Center | State of Oklahoma | 390 | — | Community | Jun-18 | (4) 1 year | ||||||||||||||||||
Tulsa, Oklahoma | Corrections | |||||||||||||||||||||||
Turley Residential Center | State of Oklahoma | 289 | — | Community | Jun-18 | (4) 1 year | ||||||||||||||||||
Tulsa, Oklahoma | Corrections | |||||||||||||||||||||||
Shelby Training Center | — | 200 | — | — | — | — | ||||||||||||||||||
Memphis, Tennessee | ||||||||||||||||||||||||
13
| ||||||||||||||||||||||||
Trousdale Turner Correctional Center | State of Tennessee | 2,552 | Multi | Correctional | Jan-21 | — | ||||||||||||||||||
Hartsville, Tennessee | ||||||||||||||||||||||||
West Tennessee Detention Facility | USMS | 600 | Multi | Detention | Sep-19 | (5) 2 year | ||||||||||||||||||
Mason, Tennessee | ||||||||||||||||||||||||
Whiteville Correctional Facility | State of Tennessee | 1,536 | Medium | Correctional | Jun-21 | — | ||||||||||||||||||
Whiteville, Tennessee | ||||||||||||||||||||||||
Austin Residential Reentry Center | BOP | 116 | — | Community | Feb-18 | — | ||||||||||||||||||
Del Valle, Texas | Corrections | |||||||||||||||||||||||
Austin Transitional Center | State of Texas | 460 | — | Community | Aug-18 | (2) 1 year | ||||||||||||||||||
Del Valle, Texas | Corrections | |||||||||||||||||||||||
Corpus Christi Transitional Center | State of Texas | 160 | — | Community Corrections | Aug-19 | — | ||||||||||||||||||
Corpus Christi, Texas | ||||||||||||||||||||||||
Dallas Transitional Center | State of Texas | 300 | — | Community | Aug-18 | (2) 1 year | ||||||||||||||||||
Hutchins, Texas | Corrections | |||||||||||||||||||||||
Eden Detention Center | — | 1,422 | Medium | Correctional | — | — | ||||||||||||||||||
Eden, Texas | ||||||||||||||||||||||||
El Paso Multi-Use Facility | State of Texas | 360 | — | Community | Aug-18 | (2) 1 year | ||||||||||||||||||
El Paso, Texas | Corrections | |||||||||||||||||||||||
17
Facility Name | Primary Customer | Design Capacity (A) | Security Level | Facility Type (B) | Term | Remaining Renewal Options (C) | |||||||||||||||||||||||||
El Paso, Texas | State of Texas | 224 | — | Community Corrections | Aug-18 | (2) 1 year | |||||||||||||||||||||||||
Fort Worth Transitional Center | State of Texas | 248 | — | Community | Aug-18 | (2) 1 year | |||||||||||||||||||||||||
Fort Worth, Texas | Corrections | ||||||||||||||||||||||||||||||
Houston Processing Center | ICE | 1,000 | Medium | Detention | Apr-18 | (5) 2 month | |||||||||||||||||||||||||
Houston, Texas | |||||||||||||||||||||||||||||||
Laredo Processing Center | ICE | 258 | Minimum/ | Detention | Jun-18 | — | |||||||||||||||||||||||||
Laredo, Texas | Medium | ||||||||||||||||||||||||||||||
| |||||||||||||||||||||||||||||||
South Texas Family Residential Center |
| ICE | 2,400 | — | Residential | Sep-21 | — | ||||||||||||||||||||||||
Dilley, Texas | |||||||||||||||||||||||||||||||
| |||||||||||||||||||||||||||||||
T. Don Hutto Residential Center | ICE | 512 | Medium | Detention | Jan-20 | Indefinite | |||||||||||||||||||||||||
Taylor, Texas | |||||||||||||||||||||||||||||||
| |||||||||||||||||||||||||||||||
Webb County Detention Center |
| USMS | 480 | Medium | Detention | Feb-18 | — | ||||||||||||||||||||||||
Laredo, Texas | |||||||||||||||||||||||||||||||
| |||||||||||||||||||||||||||||||
Cheyenne Transitional Center | State of Wyoming | 116 | — | Community | Jun-18 | Indefinite | |||||||||||||||||||||||||
Cheyenne, Wyoming | Corrections | ||||||||||||||||||||||||||||||
Managed Only Facilities: | |||||||||||||||||||||||||||||||
Citrus County Detention Facility | Citrus County, FL | 760 | Multi | Detention | Sep-20 | Indefinite | |||||||||||||||||||||||||
Lecanto, Florida | |||||||||||||||||||||||||||||||
Lake City Correctional Facility | State of Florida | 893 | Medium | Correctional | Jun-18 | Indefinite | |||||||||||||||||||||||||
Lake City, Florida |
| ||||||||||||||||||||||||||||||
Marion County Jail | Marion County, IN | 1,030 | Multi | Detention | Dec-27 | — | |||||||||||||||||||||||||
Indianapolis, Indiana | |||||||||||||||||||||||||||||||
|
| ||||||||||||||||||||||||||||||
Hardeman County Correctional Facility | State of Tennessee | 2,016 | Medium | Correctional | May-18 | — | |||||||||||||||||||||||||
Whiteville, Tennessee | |||||||||||||||||||||||||||||||
Metro-Davidson County Detention Facility | Davidson County, TN | 1,348 | Multi | Detention | Jan-20 | — | |||||||||||||||||||||||||
Nashville, Tennessee | |||||||||||||||||||||||||||||||
Silverdale Facilities | Hamilton County, | 1,046 | Multi | Detention | Sep-21 | (4) 4 year | |||||||||||||||||||||||||
Chattanooga, Tennessee | TN | ||||||||||||||||||||||||||||||
South Central Correctional Center | State of Tennessee | 1,676 | Medium | Correctional | Jun-18 | — | |||||||||||||||||||||||||
Clifton, Tennessee | |||||||||||||||||||||||||||||||
| |||||||||||||||||||||||||||||||
| |||||||||||||||||||||||||||||||
|
|
| |||||||||||||||||||||||||||||
|
|
| |||||||||||||||||||||||||||||
|
|
| |||||||||||||||||||||||||||||
18
| Primary Customer |
| Design Capacity (A) |
|
| Square Footage |
|
| Property Type (B) |
| Term |
| Remaining Renewal Options (C) | |||
Leased Properties: |
|
|
|
|
|
|
|
|
|
|
|
|
|
|
|
|
|
|
|
|
|
|
|
|
|
|
|
|
|
|
|
|
|
California City Correctional Center |
| State of California |
|
| 2,560 |
|
|
| 522,000 |
|
| Correctional |
| Nov-20 |
| Indefinite |
California City, California |
|
|
|
|
|
|
|
|
|
|
|
|
|
|
|
|
|
|
|
|
|
|
|
|
|
|
|
|
|
|
|
|
|
Long Beach Community Corrections Center |
| The GEO Group, Inc. |
| 112 |
|
|
| 16,000 |
|
| Community Corrections |
| Jun-20 |
| (1) 5 year | |
Long Beach, California |
|
|
|
|
|
|
|
|
|
|
|
|
|
|
|
|
|
|
|
|
|
|
|
|
|
|
|
|
|
|
|
|
|
Stockton Female Community Corrections Facility |
| WestCare California, Inc. |
| 100 |
|
|
| 15,000 |
|
| Community Corrections |
| Apr-21 |
| (1) 5 year | |
Stockton, California |
|
|
|
|
|
|
|
|
|
|
|
|
|
|
|
|
|
|
|
|
|
|
|
|
|
|
|
|
|
|
|
|
|
Augusta Transitional Center |
| Georgia Department |
| 230 |
|
|
| 29,000 |
|
| Community |
| Jun-18 |
| (5) 1 year | |
Augusta, Georgia |
| of Corrections |
|
|
|
|
|
|
|
|
| Corrections |
|
|
|
|
|
|
|
|
|
|
|
|
|
|
|
|
|
|
|
|
|
Milledgeville |
| GSA - Social Security |
| - |
|
|
| 9,000 |
|
| Government- |
| Jan-20 |
| - | |
Milledgeville, Georgia |
| Administration |
|
|
|
|
|
|
|
|
| Leased |
|
|
|
|
|
|
|
|
|
|
|
|
|
|
|
|
|
|
|
|
|
Greenville |
| GSA - Internal |
| - |
|
|
| 13,000 |
|
| Government- |
| Mar-24 |
| - | |
Greenville, North Carolina |
| Revenue Service |
|
|
|
|
|
|
|
|
| Leased |
|
|
|
|
|
|
|
|
|
|
|
|
|
|
|
|
|
|
|
|
|
Rockingham |
| GSA - Social Security |
| - |
|
|
| 8,000 |
|
| Government- |
| Mar-25 |
| - | |
Rockingham, North Carolina |
| Administration |
|
|
|
|
|
|
|
|
| Leased |
|
|
|
|
|
|
|
|
|
|
|
|
|
|
|
|
|
|
|
|
|
North Fork Correctional Facility |
| State of Oklahoma |
|
| 2,400 |
|
|
| 466,000 |
|
| Correctional |
| Jul-21 |
| Indefinite |
Sayre, Oklahoma |
|
|
|
|
|
|
|
|
|
|
|
|
|
|
|
|
|
|
|
|
|
|
|
|
|
|
|
|
|
|
|
|
|
Broad Street Residential Reentry Center |
| The GEO Group, Inc. |
|
| 150 |
|
|
| 18,000 |
|
| Community Corrections |
| Jul-19 |
| (4) 5 year |
Philadelphia, Pennsylvania |
|
|
|
|
|
|
|
|
|
|
|
|
|
|
|
|
|
|
|
|
|
|
|
|
|
|
|
|
|
|
|
|
|
Chester Residential Reentry Center |
| The GEO Group, Inc. |
|
| 135 |
|
|
| 18,000 |
|
| Community |
| Jul-19 |
| (4) 5 year |
Chester, Pennsylvania |
|
|
|
|
|
|
|
|
|
|
| Corrections |
|
|
|
|
|
|
|
|
|
|
|
|
|
|
|
|
|
|
|
|
|
Roth Hall Residential Reentry Center |
| The GEO Group, Inc. |
| 160 |
|
|
| 18,000 |
|
| Community Corrections |
| Jul-19 |
| (4) 5 year | |
Philadelphia, Pennsylvania |
|
|
|
|
|
|
|
|
|
|
|
|
|
|
|
|
|
|
|
|
|
|
|
|
|
|
|
|
|
|
|
|
|
Walker Hall Residential Reentry Center |
| The GEO Group, Inc. |
| 160 |
|
|
| 18,000 |
|
| Community Corrections |
| Jul-19 |
| (4) 5 year | |
Philadelphia, Pennsylvania |
|
|
|
|
|
|
|
|
|
|
|
|
|
|
|
|
14
| (A) | |||||||||||||
|
|
| ||||||||||||
| ||||||||||||||
| ||||||||||||||
| ||||||||||||||
| ||||||||||||||
| Design capacity measures the number of beds, and accordingly, the number of offenders each facility is designed to accommodate. Facilities housing detainees on a |
(B) | We manage numerous facilities that have more than a single function |
(C) | Remaining renewal options represents the number of renewal options, if applicable, and the term of each option renewal. |
(D) | Pursuant to the terms of a contract awarded by the state of Arizona in September 2012, the state of Arizona has an option to purchase the Red Rock facility at any time during the term of the contract, including extension options, based on an amortization schedule starting with the fair market value and decreasing evenly to zero over the |
(E) | These facilities are subject to purchase options held by the Georgia Department of Corrections, or GDOC, which grants the GDOC the right to purchase the facility for the lesser of the |
(F) | The facility is subject to a deed of conveyance with the city of Wheelwright, Kentucky which includes provisions that would allow assumption of ownership by the city of Wheelwright under the following occurrences: (1) we cease to operate the facility for more than two years, (2) our failure to maintain at least one employee for a period of sixty consecutive days, or (3) a conversion to a maximum security facility based upon classification by the Kentucky Corrections Cabinet. |
(G) | The facility is subject to a purchase option held by the Tallahatchie County Correctional Authority which grants Tallahatchie County Correctional Authority the right to purchase the facility at any time during the contract at a price generally equal to the cost of the premises less an allowance for amortization originally over a |
(H) | The state of Montana has an option to purchase the facility generally at any time during the term of the contract with us at fair market value less the sum of a pre-determined portion of |
(I) | The state of Ohio has the irrevocable right to repurchase the facility before we may resell the facility to a third party, or if we become insolvent or are unable to meet our obligations under the management contract with the state of Ohio, at a price generally equal to the fair market |
15
(J) | These facilities are subject to purchase options held by the Oklahoma Department of Corrections, or |
(K) | The state of Tennessee has the option to purchase the facility in the event of our bankruptcy, or upon an operational or financial breach |
Facilities Under Construction or Development
As more fully described hereafter in “Management’s Discussion and Analysis of Financial Condition and Results of Operations, or MD&A, – Liquidity and Capital Resources”, we have three facilities under construction or development. The 1,492-bed Otay Mesa Detention Center is being constructed in San Diego, California, and is expected to be completed in the third quarter of 2015. We plan to offer the Otay Mesa facility to house the existing federal inmate populations at the San Diego Correctional Facility upon expiration of the ground lease at that facility on December 31, 2015. The 2,552-bed Trousdale Turner Correctional Center is being constructed in Trousdale County, Tennessee, and is expected to be completed in the fourth quarter of 2015. Under an agreement with Trousdale County, we expect the intake of inmate populations from the state of Tennessee to begin at this facility in the first quarter of 2016. We lease the South Texas Family Residential Center and the site upon which it is being constructed from a third-party lessor. In addition to the lease payments under the lease agreement, we are investing in certain leasehold improvements and furniture, fixtures, and equipment at the facility. We expect to complete these additions by the end of the second quarter of 2015 when the 2,400-bed South Texas facility is expected to be ready for full occupancy.20
WeUnder our three business offerings, CoreCivic Safety, CoreCivic Community, and CoreCivic Properties, we offer multiple solutions to unique challenges, allowing government organizations to address their various needs while customizing the solution based on their unique circumstances. Accordingly, we believe that we benefit from the following competitive strengths:
The First and Largest Private Prison Operator. Our recognition asOwner. Under our CoreCivic Safety platform, we are the nation’s leadingnation's largest private prison owner and operatorone of the largest prison operators in the United States, which provides us with significant credibility with our current and prospective clients. We believe we manage nearly 41%own approximately 58% of all privately managedowned prison beds in the United States. We believe we own approximately 61%States and manage nearly 39% of all privately ownedmanaged prison beds in the United States. We pioneered modern-day private prisons with a list of notable accomplishments, such as being the first company to design, build, and operate a private prison, the first company to manage a private maximum-security facility under a direct contract with the federal government, and, most recently, the first company to purchase a government-owned correctional facility from a governmental agency in the United States and to manage the facility for the government agency.agency, the first company to lease a private prison to a state government, and with an award from the state of Kansas in January 2018, we will be the first company to develop a privately-owned, build-to-suit correctional facility to be operated by a government agency through a long-term lease agreement. In addition to providing us with extensive experience and institutional knowledge, our size also helps us deliver value to our customers by providing purchasing power and allowing us to achieve certain economies of scale.
Available Beds within Our Existing Facilities.As of December 31, 2014,2017, we had approximately 6,0009,800 beds at five coreeight prison facilities that are vacant and immediately available to use. We consider our core facilities to be those that were designed for adult secure correctional purposes. We have staff throughout the organizationare actively engaged in
16
marketing this available capacity to existing and prospective customers. Historically, we have been successful in substantially filling our inventory of available beds and the beds that we have constructed. Filling these available beds wouldcould provide substantial growth in revenues, cash flow, and earnings per share. We expect the Commonwealth of Kentucky to utilize one of our previously idled prison facilities containing 816 beds beginning in the second quarter of 2018 pursuant to a new management contract we executed in November 2017.
Well-Established Community Corrections Platform. Under our CoreCivic Community and CoreCivic Properties platforms, we have a rapidly growing network of community corrections facilities we own and manage, as well as facilities we own and lease to third-party operators. Community corrections facilities offer housing and programs, with a key focus on employment, job readiness and life skills in order to help offenders successfully re-enter the community and reduce the risk of recidivism.
We are the second largest community corrections owner and operator in the United States, with 33 residential reentry centers containing a total of 6,261 beds. We believe this recognition provides us with a platform for further growth. We acquired eight residential reentry centers during 2017, which added an additional 1,179 beds to our existing residential reentry portfolio. See "2017 Accomplishments" for a summary of certain of our growth transactions completed during the year ended December 31, 2017. We acquired the residential reentry centers as strategic investments that further expand the network of reentry assets we own and the reentry services we provide. Acquisitions of residential reentry centers prior to 2017 include the following:
Acquisition of Correctional Management, Inc., or CMI, in April 2016 (7 facilities with 605 beds);
Acquisition of a residential reentry center in Long Beach, California in June 2016 (112 beds);
Acquisition of Avalon Correctional Services, Inc., or Avalon, in October 2015 (11 facilities with 3,157 beds);
Acquisition of four community corrections facilities in Pennsylvania in August 2015 (605 beds); and
Acquisition of Correctional Alternatives, Inc., or CAI, in July 2013 (2 facilities with 603 beds).
We believe the demand for the housing and programs that community corrections facilities offer will continue to grow as offenders are released from prison and due to an increased awareness of the important role these programs play in an offender's successful transition from prison to society. We expect to continue to pursue opportunities to acquire additional community corrections facilities in order to provide these services to parolees, defendants, and offenders who are serving their full sentence, the last portion of their sentence, waiting to be sentenced, awaiting
21
trial while supervised in a community environment, or as an alternative to incarceration. We also believe we have the opportunity to maximize utilization of available beds within our community corrections portfolio that would further increase the number of individuals benefiting from the services we provide in such facilities.
Attractive REIT Profile.Key characteristics of our business make us a highly attractive REIT. As of December 31, 2014,2017, we owned or controlled 52 correctional and detention82 facilities containing approximately 1414.8 million square feet which, for the year ended December 31, 2014,2017, generated 97%99% of our net operating income, or our operating income before general and administrative expenses, asset impairments, depreciation, and amortization. Land and buildings comprise overapproximately 90% of our gross fixed assets. These valuable assets are located in areas with high barriers to entry, particularly due to the unique permitting and zoning requirements for correctional and detentionthese facilities. Further, thesethe majority of our assets are constructed primarily of concrete and steel, generally requiring lower maintenance capital expenditures than other types of commercial properties.
Since our inception,We believe we have constructed dozensare the largest developer of facilities, manymission-critical, criminal justice center real estate projects over the past 15 years. We also believe we are the largest private owner of which we subsequently expanded.real estate used by government agencies. We provide space and services under contracts with federal, state, and local government agencies that generally have credit ratings of single-A or better. In addition, a majority of our contracts have terms between one and five years, and we have historically experienced customer retention in excess of 90%approximately 91%, which contributes to our relatively predictable and stable revenue base. This stream of revenue combined with our low maintenance capital expenditure requirement translates into steady, predictable cash flow. We believe the REIT structure also provides us with greater access to capital and flexibility to pursue growth opportunities.opportunities, and provides a high dividend yield to our shareholders compared with other investments.
DevelopmentFlexible Real Estate Solutions and Expansion Opportunities.Attractive Real Estate Portfolio. Under our CoreCivic Properties platform, we offer our customers an attractive portfolio of facilities that can be leased for various needs as an alternative to providing "turn-key" correctional, detention, and residential reentry bed space and services to our government partners. In May 2016, we entered into a lease with the ODOC for our previously idled 2,400-bed North Fork Correctional Facility. The demandlease agreement commenced on July 1, 2016, and includes a five-year base term with unlimited two-year renewal options. The lease of the North Fork facility, along with the lease of our California City Correctional Center to the CDCR originating in 2013, exemplify our ability to react quickly to our partners' needs with innovative and flexible solutions that make the best use of taxpayer dollars. We intend to pursue additional opportunities to lease prison facilities to government and other third-party operators in need of correctional capacity.
On January 24, 2018, we entered into a 20-year lease agreement with the Kansas Department of Corrections for prison bed capacitya 2,432-bed correctional facility we will construct in Lansing, Kansas. The new facility will replace the Lansing Correctional Facility, the State's largest correctional complex for adult male inmates, originally constructed in 1863. This transaction represents the first development of a privately owned, build-to-suit correctional facility to be operated by a government agency through a long-term lease agreement. We will be responsible for facility maintenance throughout the 20-year term of the lease, at which time ownership will revert to the State. Construction of the new facility is expected to commence in the short-term has been affected byfirst quarter of 2018 with a timeline for completion of approximately 24 months. With the budget challenges many of our government partners currently face. These challenges impede our customers’ ability to construct new prison beds of their own or update older facilities, whichextensively aged criminal justice infrastructure in the U.S. today, we believe could result in further need for private sector capacitywe can bring our flexible solutions in the long-term. Though we primarily promote utilization of our available bed capacity,like this to other government agencies.
Further, we intend to continue to pursue build-to-suitadditional opportunities like our 2,552-bed Trousdale Turner Correctionalthe 2017 acquisition of the residential reentry center in Stockton, California, the 2016 acquisition of the Long Beach facility in California, and the 2015 acquisition of four community corrections facilities in Pennsylvania, all of which are leased to third-party operators.
In September 2017, we completed the acquisition of a portfolio of four properties, which not only included a 230-bed residential reentry center which is leased to the state of Georgia, but also three properties in North Carolina and Georgia leased to the GSA, two of which are occupied by the SSA and one of which is occupied by the IRS. In January 2018, we completed the acquisition of Capital Commerce Center, under construction in Trousdale County, Tennessee,a 261,000 square foot office building leased primarily to the Florida Department of Business and alternative solutions likeProfessional Regulation, an agency of the recently announced 2,400-bed South Texas Family Residential Center whereby we identified a site and lessor to provide residential housing and administrative buildings for ICE.
Proven Senior Management Team. Our senior management team has applied their prior experience and diverse industry expertise to improve our operations, related financial results, and capital structure. Under our senior management team’s leadership, we have created new business opportunities with customers that have not previously utilized the private corrections sector, expanded relationships with existing customers, including all three federal correctional and detention agencies, converted to a REIT, and successfully completed numerous recapitalization and refinancing transactions, resulting in increases in shareholder value and profitability. Our senior management team has an averagestate of 19 years of experience working in the corrections industry.
Financial Flexibility. As of December 31, 2014, we had cash on hand of $74.4 million and $358.7 million available under our $900.0 million revolving credit facility, with a total weighted average effective interest rate of 3.6% on all outstanding debt, while our total weighted average maturity on all outstanding debt was 5.2 years. For the year ended December 31, 2014, our fixed charge coverage ratio was 9.1x and our debt leverage was 3.1x. During the year ended December 31, 2014, we generated $423.6 million in cash through operating activities, and as of December 31, 2014, we had net working capital of $47.0 million.
17
Our primary business strategy is to provide prison bed capacity and quality corrections services, offer a compelling value, and increase occupancy and revenue, while maintaining our position as the leading owner, operator, and manager of privatized correctional and detention facilities.Florida. We intend to considerpursue additional opportunities for growth, including potential acquisitions of businesses within our line of business andto acquire government-leased assets, with a bias toward those thatused to provide complementarymission-critical governmental services, providedthat we believe such opportunities will broadenhave favorable investment returns, diversify our market and/orcash flows, and increase the services we can providevalue to our government partners.stockholders.
Own and Operate High Quality Correctional and Detention Facilities.22
Offer Compelling Value. We believe that our government partners choose an outsourced correctional service provider based primarily on availability of beds, price, and the quality of services provided. Approximately 90% of the eligible facilities we operated as of December 31, 2014 are accredited by the ACA, an independent organization of corrections industry professionals that establishes standards by which a correctional facility may gain accreditation. We believe that this percentage compares favorably to the percentage of government-operated adult prisons that are accredited by the ACA. We have experienced wardens managing our facilities, with an average of 28 years of corrections experience and an average tenure of 16 years with us.
Offer Compelling Value. We believe that our government partners also seek a compelling value and service offering when selecting an outsourced correctional services provider. We believe that we offer a cost-effective alternative to our government partners by reducing their correctional services costs, while allowing them to avoidincluding the avoidance of long-term pension obligations for their employees and large capital investments in new prison beds. We attemptendeavor to improve operating performance and efficiency through the following key operating initiatives: (1) standardizing supply and service purchasing practices and usage; (2) implementing a standard approach to staffing and business practices in an effort to reduce our fixed expenses;practices; (3) improving offender management, resource consumption, and reporting procedures through the utilization of numerous technological initiatives; (4) reconfiguring facility bed space to optimize capacity utilization; and (5) improving productivity and reducing employee turnover.productivity. Through ongoing company-wide initiatives, we continue to focus on efforts to contain costs and improve operating efficiencies, ensuring continuous delivery over the long-term.efficiencies.
In 2017, we launched a nationwide initiative to advocate for a range of government policies that will help former offenders successfully reenter society and stay out of prison. Through our strong commitment to community corrections and re-entryreentry programs, we offer our government partners additional compelling opportunities.long-term value. Our evidence-based re-entryreentry programs, including academic education, vocational training, substance abuse treatment, life skills training, and faith-based programming, are customizable based on partner needs and are applied utilizing best practices and/or industry standards. Our proprietary reentry process and cognitive/behavioral curriculum, "Go Further", promotes a comprehensive approach to addressing the barriers to a successful return to society. Through our efforts in community corrections and re-entryreentry programs, we can provide consistency and common standards across facilities. We can also serve multiple levels of government on an as-needed basis, all toward reaching the goal we share with our government partners of providing offenders with the opportunity to succeed when they are released, making our communities safer, and, ultimately, reducing recidivism.
We also intend to continue to implementoffer a wide variety of specialized services that address the unique needs of various segments of the offender population. Because the offenders in the facilities we operate differ with respect to security levels, ages, genders, and cultures, we focus on the particular needs of an offender population and tailor our services based on local conditions and our ability to provide services on a cost-effective basis.
We believe our government partners and other agencies in the criminal justice sector also seek a compelling value and service offering when pursuing solutions to their unique real estate needs. We believe our track record of constructing quality assets on time and within budget, our design and construction methods, unique financing alternatives, and our expertise and experience enable us to provide a compelling value proposition for the construction of mission-critical government real estate assets. We also believe our robust preventive maintenance program included in our service offering significantly reduces the risk of real estate neglect. We also offer utility management services using environmentally-friendly, state-of-the-art technology. We believe our strengths in these areas were significant contributing factors in the state of Kansas selecting us to construct a replacement facility for the Lansing Correctional Center, which we will lease to the State under a twenty-year lease agreement.
Acquisitions, Development, and Expansion Opportunities. The demand for prison capacity in the short-term has been affected by the budget challenges many of our government partners currently face. At the same time, these challenges impede our customers' ability to construct new prison beds of their own or update older facilities, which we believe could result in further need for private sector prison capacity solutions in the long-term. Over the long-term, we would like to see meaningful utilization of our available capacity and better visibility from our customers before we develop new prison capacity on a speculative basis. We will, however, respond to customer demand and may develop or expand correctional and detention facilities when we believe potential long-term returns justify the capital deployment. We expect to continue to pursue investment opportunities in residential reentry centers and are in various stages of due diligence to complete additional acquisitions. The transactions that have not yet closed will also be subject to various customary closing conditions, and we can provide no assurance that any such transactions will ultimately be completed. We are also pursuing investment opportunities in other real estate assets with a bias toward those used to provide mission-critical governmental services, as well as other businesses that expand the range of solutions we provide to government partners which will further diversify our cash flows.
18
Increase OccupancyProven Senior Management Team. Our senior management team has applied their prior experience and Revenue. Ourdiverse industry benefits from significant economiesexpertise to improve our operations, related financial results, and capital structure. Under our senior management team's leadership, we have successfully executed strategies to diversify our business and offer a broader range of scale,solutions to government partners over the past several years resulting in lower operating costs per inmatethe Company being
23
renamed and rebranded as occupancy rates increase. We are pursuing a number of initiatives intended to increase our occupancy and revenue. Our competitive cost structure offers prospective government partners a compelling solution to incarceration. The unique budgetary challenges governments are facing may cause them to further rely on us to help reduce their costs, and also cause those statesCoreCivic, created new business opportunities with customers that have not previously utilized the private corrections sector, converted to turna REIT, completed several business combination transactions, and successfully completed numerous recapitalization and refinancing transactions.
Financial Flexibility. As of December 31, 2017, we had cash on hand of $52.2 million and $694.1 million available under our revolving credit facility, with a total weighted average effective interest rate of 4.7% on all outstanding debt, while our total weighted average maturity on all outstanding debt was 4.8 years. For the year ended December 31, 2017, our fixed charge coverage ratio was 5.6x and our debt leverage was 3.6x. During the year ended December 31, 2017, we generated $341.3 million in cash through operating activities, and as of December 31, 2017, we had net working capital of $36.7 million.
Our business development strategy includes marketing our available beds to the private sector to help reduce their overall costs of incarceration. We are actively pursuing these opportunities. We are also focused on renewingexisting and enhancing the terms of our existing contracts and expanding the services we provide under those contracts. We believe the long-term growth opportunities of our business remain very attractive as insufficient bed development by ourpotential government partners should result in future demand for additional bed capacity. Increases in occupancy could result in lower operating costs per inmate, resulting in higher operating margins, cash flow,that seek corrections, detention, and net income.
Own and Lease Correctional Facilities. Asreentry management services. We may also offer government partners the opportunity to lease our idle facilities as an alternative to providing “turn-key” correctional"turn-key" bed space and services to our government partners, wepartners. Successful efforts would generate significant cash flows without the need to incur substantial capital expenditures.
Our business development strategy also offerincludes mergers and acquisitions, or M&A, activities that will enable us to further expand our customers an attractivenetwork of residential reentry centers, grow our portfolio of prison facilitiesgovernment-leased properties, and acquire other businesses that can be leased for various correctional needs. During the fourth quarter of 2013, we entered into an agreementprovide complementary services. We will continue to lease our California City Correctional Center to the CDCR. The lease agreement includes a three-year base term with unlimited two-year renewal options upon mutual agreement. Annual base rent during the three-year base term is fixed at $28.5 million. After the three-year base term, the rent will be increased annually by the lesser of CPI (Consumer Price Index) or 2%. We are responsible for repairs and maintenance, property taxes and property insurance, while all other aspects and costs of facility operations are the responsibility of the CDCR. The lease of this facility provided California an immediate solutionpursue opportunities to help reach its population capacity goals,our government partners meet their infrastructure needs, primarily through the development and exemplifiedredevelopment of criminal justice sector assets, but also by acquiring other real estate assets with a bias toward those used to provide mission-critical governmental services, that we believe have favorable investment returns, diversify our ability to react quicklycash flows, and increase value to our partners’ needsstockholders. These business development activities will require capital. We currently expect to fund these growth opportunities with innovativecash on hand and flexible solutions that make the best use of taxpayer dollars. We intend to pursue additional opportunities like those with the CDCR to lease prison facilities to government and other third-party operators in need of correctional capacity.
availability under our revolving credit facility. As of December 31, 2014,2017, we had cash on hand of $74.4$52.2 million and $358.7$694.1 million available under our $900.0 million revolving credit facility. NoneWe may also seek to issue debt or equity securities from time to time when we determine that market conditions and the opportunity to utilize the proceeds from the issuance of such securities are favorable. We currently anticipate that any proceeds obtained through capital markets transactions would be used to repay borrowings under our outstandingrevolving credit facility. We will also pursue alternative sources of capital that could include secured indebtedness, subject to limitations set forth in our debt requires scheduled principal payments, and we have no debt maturities until December 2017.agreements.
Despite a challenging economic environment over the past several years, we have been able to deploy capital resources to take advantage of targeted growth opportunities, including the acquisition, expansion, and development of new correctional facilities. During 2013,In October 2017, we completed the offering of $250.0 million aggregate principal amount of 4.75% senior notes due October 15, 2027. We used net proceeds from the offering to pay down a portion of our revolving credit facility, thereby increasing the availability of borrowings under the revolving credit facility that is used to fund growth opportunities that require capital deployment.
In January 2018, we obtained a $24.5 million mortgage note with an interest rate of 4.5%, maturing in 2033, to partially finance the $44.7 million acquisition of Correctional Alternatives, Inc., or CAI,Capital Commerce Center, a privately held San Diego, California-based community corrections company that specializes261,000 square-foot property located in residential re-entry, home detention, and work furlough programs for San Diego County, the BOP, and United States Pretrial and Probation.Tallahassee, Florida. We acquired CAI as a strategic investmentmay obtain additional secured indebtedness in a complementary business that broadens the scope of solutions we provide, expanding the range of solutions from incarceration through release, and supporting our belief in helping offenders successfully transition to society. We intend to pursue opportunities similar toconnection with the acquisition of CAI that enable usadditional government-leased properties like Capital Commerce Center, where we believe the terms offer attractive alternatives to provide additional servicesother forms of capital.
On February 26, 2016, we entered into an ATM Equity Offering Sales Agreement, or ATM Agreement, with multiple sales agents. Pursuant to our government partners while resulting in earningsthe ATM Agreement, we may offer and cash flow growth.
We regularly evaluate alternative uses of our cash flow in ordersell to provide valueor through the sales agents from time to our stockholders. From 2008 to 2011, we purchased a total of 28.4 milliontime, shares of our common stock, atpar value $0.01 per share, having an aggregate cost of $508.2 million, at an averagegross sales price of $17.91,
19
representing 22.6%up to $200.0 million. Sales, if any, of our shares of common stock will be made primarily in "at-the-market" offerings, as defined in Rule 415 under the totalSecurities Act of 1933, as amended. The shares of common stock would be offered and sold pursuant to our registration statement on Form S-3 filed with the SEC on May 15, 2015, and a related prospectus supplement dated February 26, 2016. We intend to use the net proceeds from any sale of shares of our common stock outstanding prior to repay borrowings under our revolving credit facility (including the commencementTerm Loan under the "accordion" feature of the initialrevolving credit facility) and for general corporate purposes, including to fund future acquisitions and development projects. We believe the ATM program is a useful tool to match fund proceeds from common stock repurchase program authorized bysales with M&A activities and other capital needs, in order to manage our Board of Directors in 2008. Further, we repurchased this $508.2 millioncapital allocation strategy.
24
There were no shares of our common stock while simultaneously improving our leverage ratios. In February 2012, our Board of Directors terminatedsold under the stock repurchase programATM Agreement during the years ended December 31, 2017 and commenced a quarterly cash dividend beginning in the second quarter of 2012. The quarterly dividends were subsequently increased as a result of our conversion to a REIT effective January 1, 2013, as further described hereafter. We continue to consider stock repurchases as an alternative use of our cash flow. However, under our current REIT structure we retain less cash flow, as a substantial portion of our cash generated from operations must be distributed to shareholders as a dividend.2016.
We reorganized our corporate structure to facilitate our qualification as a REIT for federal income tax purposes effective for our taxable year beginning January 1, 2013. To qualify and be taxed as a REIT, we generally are required to distribute annually to our stockholders at least 90% of our REIT taxable income (determined without regard to the dividends paid deduction and excluding net capital gains), and are subject to regular corporate income taxes to the extent we distribute less than 100% of our REIT taxable income (including capital gains) each year. The amount, timing and frequency of future distributions, however, will be at the sole discretion of our Board of Directors and will be declared based upon various factors, many of which are beyond our control, including our financial condition and operating cash flows, the amount required to maintain qualification and taxation as a REIT and reduce any income and excise taxes that we otherwise would be required to pay, limitations on distributions in our existing and future debt instruments, our ability to utilize net operating losses, or NOLs, to offset, in whole or in part, our REIT distribution requirements, limitations on our ability to fund distributions using cash generated through our TRSs, alternative growth opportunities that require capital deployment, and other factors that our Board of Directors may deem relevant. Because as a REIT we are required to distribute a substantial portion of our cash generated from operations to shareholdersstockholders as a dividend, growth opportunities may require more external capital resources than were required prior to our conversion to a REIT. During 2014,2017, our Board of Directors declared a quarterly dividend of $0.51$0.42 in each quarter, totaling $239.1$199.8 million for the year, compared with a total of $221.2$241.7 million during 20132016 and $60.2$254.8 million during 2012 (the year before our REIT conversion).2015.
In addition to the cash on hand and availability under our revolving credit facility, we currently expect our REIT taxable income to be less than our operating cash flow, primarily due to the deductibility of non-cash expenses such as depreciation on our real estate assets. This liquidity provides us with the flexibility to (i) invest in additional facility acquisitions and developments, which could include acquisitions of facilities from government partners, third parties, or additional business combinations, similar to the acquisition of CAI, (ii) pay down debt, (iii) increase dividends to our shareholders,stockholders, or (iv) or repurchase our common stock. We also have the flexibility to issue debt or equity securities from time to time when we determine that market conditions and the opportunity to utilize the proceeds from the issuance of such securities are favorable. Such opportunities could include, but are not limited to, build-to-suit or additional acquisition opportunities that exceed our undistributed cash flow and that generate favorable investment returns.
The Corrections and Detention Industry
We believe we are well-positioned to capitalize on government outsourcing of correctional management services because of our competitive strengths, business strategy, and financial flexibility. Notwithstanding the effects the current economy could have on our government partners’ demand for prison beds in the short term, we believe the long-term trends favor an increase in the outsourcing of correctional management services. The key reasons for this
20
outsourcing trend include (unless otherwise noted, statistical references were obtained from the “Bureau of Justice Statistics Bulletin” issued by the U.S. Department of Justice in September 2014):
United States Prison Population Trends. The growth of the prison population in the United States over the past decade, combined with a lack of new prison capacity constructed by the public sector, has led to overcrowding in the state and federal prison systems. In 2013, at least 20 states and the federal prison system reported operating at or above their highest capacity measure. The federal prison system was operating at 33% above capacity at December 31, 2013.
At year-end 2013, federal and state correctional authorities had jurisdiction over approximately 1.6 million prisoners. The annual growth rate of the federal and state prison population increased 0.3% for the year ended December 31, 2013. The imprisonment rate – the number of sentenced prisoners per 100,000 residents – decreased slightly from 480 prisoners per 100,000 U.S. residents in 2012 to 478 prisoners per 100,000 U.S. residents in 2013. During 2013, populations in state prisons increased 0.5%. According to a report issued in November 2014 by the Pew Charitable Trusts, the number of state prison inmates is expected to increase 3% by 2018, according to projections collected from 34 states. This translates into an increase in inmate populations of approximately 26,000, according to the report.
The total number of prisoners under federal jurisdiction decreased 0.9% for the year ended December 31, 2013, representing the first decrease in inmates under the jurisdiction of the BOP since 1980. This decrease could indicate a shift in public policy that may reduce the number of people incarcerated in the United States. For example, in July 2014, the U.S. Sentencing Commission voted unanimously to apply a reduction in the sentencing guideline levels applicable to most federal drug trafficking offenders retroactively, meaning that many offenders currently in prison could be eligible for reduced sentences beginning November 2015. Under the guidelines, no offender would be released unless a judge reviews the case to determine whether a reduced sentence poses a risk to public safety and is otherwise appropriate. As of December 31, 2014, the federal prison system was operating at 27.5% above capacity. A reduction in federal prison populations has resulted in an increase in the cost per inmate for the public sector as the fixed cost structure is allocated over a lower population, resulting in an even greater value proposition and opportunity for the private sector.
Lack of New Prison Construction.Capital expenditures for new construction, renovations, and major repairs have decreased at the state level. According to a Bureau of Justice Statistics report issued December 11, 2013, between 1992 and 2001, capital outlays varied between $2.7 billion and $4.0 billion, comprising between 5.0% and 10.3% of total corrections expenditures during those years. Between these same years, 32 states spent at least 20% of their total corrections expenditures on capital outlays. From 2002 to 2010, capital outlays made up $2.3 billion or less each year and less than 5% of state correctional expenditures. Between these same years, only two states spent at least 20% of their total corrections expenditures on capital outlays. Further, according to the “State Expenditure Report” issued in November 2014 by the National Association of State Budget Officers, or NASBO, which analyzed state spending for actual fiscal years 2012 and 2013, and estimated fiscal year 2014, total state spending on corrections, inclusive of capital expenditures, is expected to increase 4.5% from fiscal year 2012 to fiscal year 2014. However, according to the report, 37 states have estimated that, in fiscal year 2014, capital expenditures will make up less than 2% of their total spending on corrections.
21
Aging Public Prison Facilities.According to the Bureau of Justice Statistics “Census of State and Federal Correctional Facilities” published in 2008, there are approximately 290,000 state and federal prison beds in operation in public facilities that are more than 50 years old and almost 100,000 prison beds more than 100 years old. Prison facilities that are older are typically more inefficient to staff and are more expensive to operate, including higher capital expenditures for maintenance. States such as Georgia, Colorado and others have been shuttering old inefficient facilities and replacing capacity with newer more efficient private facilities.
Acceptance of Privatization. The prisoner population, excluding detention and jail populations, housed in privately managed facilities in the United States as of December 31, 2013 was approximately 133,000. At December 31, 2013, 19.1% of federal inmates and 6.8% of state inmates were held in private facilities. Since December 31, 2000, the number of federal inmates held in private facilities has increased approximately 165%, while the number of state inmates held in private facilities has increased approximately 22%. Eighteen states had at least 5% of their prison population held in private facilities at December 31, 2013. Five states housed at least 25% of their prison population in private facilities as of December 31, 2013.
Governmental Budgeting Constraints. We believe the outsourcing of prison management services to private operators allows governments to manage increasing inmate populations while simultaneously controlling correctional costs and improving correctional services. The use of facilities owned and managed by private operators allows governments to expand prison capacity without incurring large capital commitments or debt required to increase correctional capacity. Outsourcing correctional services to private operators also enables government agencies to avoid costly long-term pension obligations. We believe these advantages translate into significant cost savings for government agencies.
Business Regulations
The industry in which we operate is subject to extensive federal, state, and local regulations, including educational, health care, and safety regulations, which are administered by many governmental and regulatory authorities. Some of the regulations are unique to the corrections industry. Facility management contracts typically include specific staffing requirements, reporting requirements, supervision, and on-site monitoring by representatives of the contracting governmental agencies. Corrections officers are customarily required to meet certain training standards and, in some instances, facility personnel are required to be licensed and subject to background investigation. Certain jurisdictions also require us to award subcontracts on a competitive basis or to subcontract with businesses owned by members of minority groups. Our facilities are also subject to operational and financial audits by the governmental agencies with which we have contracts. Failure to comply with these regulations and contract requirements can result in material penalties or non-renewal or termination of facility management contracts.
In addition, private prison managers are subject to government legislation and regulation attempting to restrict the ability of private prison managers to house certain types of inmates. Legislation has been enacted in several states, and has previously been proposed in the United States Congress, containing such restrictions. Although we do not believe that existing legislation will have a material adverse effect on us, there can be no assurance that future legislation would not have such an effect.
22
Environmental Matters
Under various federal, state, and local environmental laws, ordinances and regulations, a current or previous owner or operator of real property may be liable for the costs of removal or remediation of hazardous or toxic substances on, under, or in such property. Such laws often impose liability whether or not the owner or operator knew of, or was responsible for, the presence of such hazardous or toxic substances. As an owner of real estate assets and as the result of our operation and management of correctional, detention, and detentionresidential reentry facilities, we have been subject to these laws, ordinances, and regulations as the result of our operation and management of correctional and detention facilities.regulations. Phase I environmental assessments have been obtained on substantially all of the properties we currently own. We are not aware of any environmental matters that are expected to materially affect our financial condition or results of operations; however, if such matters are detected in the future, the costs of complying with environmental laws may adversely affect our financial condition and results of operations.
25
Health Insurance Portability and Accountability Act of 1996 and Privacy and Security Requirements
In 1996, Congress enacted the Health Insurance Portability and Accountability Act of 1996, or HIPAA. HIPAA was designed to improve the portability and continuity of health insurance coverage, simplify the administration of health insurance, and protect the privacy and security of health-related information.
Privacy regulations promulgated under HIPAA regulate the use and disclosure of individually identifiable health information, whether communicated electronically, on paper, or orally. The regulations also provide patients with significant rights related to understanding and controlling how their health information is used or disclosed. Security regulations promulgated under HIPAA require that covered entities, including most health care providers, health clearinghouses, group health plans, and their business associates, implement administrative, physical, and technical safeguards to protect the security of individually identifiable health information that is maintained or transmitted electronically. These privacy and security regulations require the implementation of compliance training and awareness programs for our health care service providers and selected other employees primarily associated with our employee medical plans. Further, covered entities and their business associates must provide notification to affected individuals without unreasonable delay but not to exceed 60 days of discovery of a breach of unsecured protected health information. Notification must also be made to the U.S. Department of Health and Human Services, or DHHS, and, in certain situations involving large breaches, to the media. In a final rule released in January 2013, DHHS modified the breach notification requirement by creating a presumption that all non-permitted uses or disclosures of unsecured protected health information are breaches unless the covered entity or business associate establishes that there is a low probability the information has been compromised.
Violations of the HIPAA privacy and security regulations could result in significant civil and criminal penalties, and the American RecoveryHealth Information Technology for Economic and ReinvestmentClinical Health Act of 2009, or ARRA, hasHITECH, which was modified by the 2013 final HITECH rule, strengthened the enforcement provisions of HIPAA. ARRAHITECH broadens the applicability of the criminal penalty provisions to employees of covered entities and requires DHHS to impose penalties for violations resulting from willful neglect. ARRAHITECH also increases the amount of the civil penalties, with penalties of up to $50,000 per violation for a maximum civil penalty of $1,500,000 in a calendar year for violations of the same requirement. Further, ARRAHITECH authorizes state attorneys general to bring civil actions for injunctions or damages in response to violations that threaten the privacy of state residents. In addition, under ARRA,HITECH, DHHS is required to perform periodic HIPAA compliance audits of covered entities and their business associates. DHHS conductedThese provisions, as modified by the 2013 final HITECH rule, may be subject to interpretation by various courts and other governmental authorities, thus creating potentially complex compliance audits of 115 covered entities in 2012 and has announced its intent to conduct additional audits.issues.
23
In addition, there are numerous legislative and regulatory initiatives at the federal and state levels addressing the privacy and security of patient health information and other identifying information. For example, federal and various state laws and regulations strictly regulate the disclosure of patient identifiable information related to substance abuse treatment. Further, various state laws and regulations require providers and other entities to notify affected individuals in the event of a data breach involving certain types of individually identifiable health or financial information, and these requirements may be more restrictive than the regulations issued under HIPAA and ARRA.HITECH. Such laws may not be preempted by the HIPAA privacy standards and security standards. These statutes vary and could impose additional penalties and compliance costs.
Healthcare reform could have an impact on our business
The Patient Protection and Affordable Care Act, as amended by the Health Care and Education Reconciliation Act of 2010 (collectively, the “Health Reform Law”) were signed into law in the United States. Certain of the provisions that have increased our healthcare costs since 2010 include the removal of annual plan limits, the expansion of dependent child coverage up to age 26, the mandate that health plans provide 100% coverage on expanded preventive care, and, in 2014, the removal of pre-existing condition exclusions. In addition, effective with the 2014 benefit year, we are subject to the three-year Transitional Reinsurance Fee, imposed in order to finance a temporary reinsurance fund established to stabilize individual premiums purchased through the federal and state insurance exchanges. Our healthcare costs may continue to be significantly affected in the future, depending upon regulatory guidance, elements of the law that are effective as of future dates, the impact the law could have on healthcare rates in general, and our response to these changes. While much of the added cost from the Health Reform Law occurred in 2014, we anticipate added costs in the future due to provisions being phased in over time. Changes to our healthcare cost structure could have an impact on our business and operating costs.
We maintain general liability insurance for all the facilities we operate, as well as insurance in amounts we deem adequate to cover property and casualty risks, workers’workers' compensation, and directors and officers liability. In addition, each of our leases with third parties provides that the lessee will maintain insurance on each leased property under the lessee’slessee's insurance policies providing for the following coverages: (i) fire, vandalism, and malicious mischief, extended coverage perils, and all physical loss perils; (ii) comprehensive general public liability (including personal injury and property damage); and (iii) workers’workers' compensation. Under each of these leases, we have the right to periodically review our lessees’lessees' insurance coverage and provide input with respect thereto.
Each of our management contracts and the statutes of certain states require the maintenance of insurance. We maintain various insurance policies including employee health, workers’workers' compensation, automobile liability, and general liability insurance. Because we are significantly self-insured for employee health, workers’workers' compensation, automobile liability, and general liability insurance, the amount of our insurance expense is dependent on claims experience, and our ability to control our claims experience. Our insurance policies contain various deductibles and stop-loss amounts intended to limit our exposure for individually significant occurrences. However, the nature of
26
our self-insurance policies provides little protection for deterioration in overall claims experience or an increase in medical costs. We are continually developing strategies to improve the management of our future loss claims but can provide no assurance that these strategies will be successful. However, unanticipated
24
additional insurance expenses resulting from adverse claims experience or an increasing cost environment for general liability and other types of insurance could adversely impact our results of operations and cash flows.
As of December 31, 2014,2017, we employed approximately 14,04012,875 full- and part-time employees. Of such employees, approximately 385 were employed at our corporate offices and approximately 13,65512,490 were employed at our facilities and in our inmate transportation business. We employ personnel in the following areas: clerical and administrative, facility administrators/wardens, security, medical, quality assurance, transportation and scheduling, maintenance, teachers, counselors, case managers, chaplains, and other support services.
Each of the facilities we currently operate is managed as a separate operational unit by the facility administrator or warden. All of these facilities follow a standardized code of policies and procedures.
We have not experienced a strike or work stoppage at any of our facilities. Approximately 1,030810 employees at fivethree of our facilities are represented by labor unions. In the opinion of management, overall employee relations are good.
The correctional, detention, and detentionresidential reentry facilities we own, operate, or manage, as well as those facilities we own but are managed by other operators, are subject to competition for inmatesoffenders and residents from other private prison managers.operators. We compete primarily on the basis of bed availability, cost, the quality and range of services offered, our experience in the design, construction, and management of correctional and detention facilities, and our reputation. We compete with government agencies that are responsible for correctional, detention, and residential reentry facilities and a number of privatized correctional service companies, including, but not limited to, The GEO Group, Inc. and Management and Training Corporation. We also compete in some markets with small local companies that may have a better knowledge of the local conditions and may be better able to gain political and public acceptance. Other potential competitors may in the future enter into businesses competitive with us without a substantial capital investment or prior experience. We may also compete in the future for acquisitions and new development projects with companies that have more financial resources than we have.have or those willing to accept lower returns than we are willing to accept. Competition by other companies may adversely affect the number of inmatesoccupancy at our facilities, which could have a material adverse effect on the operating revenue of our facilities. In addition, revenue derived from our facilities will be affected by a number of factors, including the demand for inmate beds, general economic conditions, and the age of the general population.
We compete with numerous developers, real estate companies and other owners of commercial properties for acquisitions of government-leased assets. Other real estate investors, including insurance companies, private equity funds, sovereign wealth funds, pension funds, other REITs, and other well-capitalized investors will compete with us to acquire government-leased properties. In addition, U.S. Government tenants are viewed as desirable tenants by other landlords because of their strong credit profile, and properties leased to U.S. Government tenant agencies often attract many potential buyers. This competition could increase prices for properties of the type we may pursue and impede our ability to grow and diversify.
As the owner and operator of correctional, detention, and detentionresidential reentry facilities, we are subject to certain risks and uncertainties associated with, among other things, the corrections and detention industry and pending or threatened litigation in which we are involved. In addition, we are also currently subject to risks associated with our indebtedness as well as our qualification as a REIT for federal income tax purposes effective for our taxable years beginning January 1, 2013. The risks and uncertainties set forth below could cause our actual results to differ materially from those indicated in the forward-looking statements contained herein and elsewhere. The risks described below are not the only risks we face. Additional risks and uncertainties not currently known to us or those we currently deem to be immaterial may also materially and adversely affect our business operations. Any of the following risks could materially adversely affect our business, financial condition, or results of operations.
27
25
Risks Related to Our Business and Industry
Our results of operations are dependent on revenues generated by our jails, prisons,correctional, detention, and residential reentry facilities, which are subject to the following risks associated with the corrections and detention industry.
We are subject to fluctuations in occupancy levels, and a decrease in occupancy levels could cause a decrease in revenues and profitability. While a substantial portion of our cost structure is fixed, a substantial portion of our revenue is generated under facility ownership and management contracts that specify per diem payments based upon daily occupancy. We are dependent upon the governmental agencies with which we have contracts to provide inmatesoffenders for our managed facilities.facilities we operate. We cannot control occupancy levels at the facilities we operate. Under a per diem rate structure, a decrease in our occupancy rates could cause a decrease in revenue and profitability. AverageFor the years 2017, 2016, and 2015, the average compensated occupancy forof our facilities, in operation for 2014, 2013, and 2012based on rated capacity, was 84%80%, 85%79%, and 88%83%, respectively.respectively, for all of the facilities we operated, exclusive of facilities that are leased to third-party operators where our revenue is generally not based on daily occupancy. Occupancy rates may, however, decrease below these levels in the future. When combined with relatively fixed costs for operating each facility, a decrease in occupancy levels could have a material adverse effect on our profitability.
We are dependent on government appropriations, and our results of operations may be negatively affected by governmental budgetary challenges. Our cash flow is subject to the receipt of sufficient funding of, and timely payment by, contracting governmental entities. If the appropriate governmental agency does not receive sufficient appropriations to cover its contractual obligations, it may terminate our contract or delay or reduce payment to us. Any delays in payment, or the termination of a contract, could have an adverse effect on our cash flow and financial condition. In addition, federal, state and local governments are constantly under pressure to control additional spending or reduce current levels of spending. In prior years, these pressures have been compounded by economic downturns. Accordingly, we have been requested and may be requested in the future to reduce our existing per diem contract rates or forego prospective increases to those rates. Further, our government partners could reduce inmateoffender population levels in facilities we own or manage to contain their correctional costs. In addition, it may become more difficult to renew our existing contracts on favorable terms or otherwise.otherwise.
Competition for inmates may adversely affect the profitability of our business. We compete with government entities and other private operators on the basis of bed availability, cost, quality and range of services offered, experience in designing, constructing, and managing facilities, and reputation of management and personnel. While there are barriers to entering the market for the ownership and management of correctional, detention, and detentionresidential reentry facilities, these barriers may not be sufficient to limit additional competition. In addition, our government customers may assume the management of a facility that they own and we currently manage for them upon the termination of the corresponding management contract or, if such customers have capacity at their facilities, may take inmatesoffenders and residents currently housed in our facilities and transfer them to government-run facilities. Since we are paid on a per diem basis with no minimum guaranteed occupancy under most of our contracts, the loss of such inmatesoffenders and residents, and the resulting decrease in occupancy, would cause a decrease in our revenues and profitability.profitability.
Escapes, inmate disturbances, and public resistance
28
Resistance to privatization of correctional and detention facilities, and negative publicity regarding inmate disturbances or perceived poor operational performance, could result in our inability to obtain new contracts, or the loss of existing contracts. The operation contracts, or other unforeseen consequences. Privatization of correctional and detention facilities by private entities has not achieved complete acceptance by either governments or the public. The movement toward privatizationoperation of correctional and detention facilities by private entities has also encountered resistance from certain groups, such as labor unions and others, that believe that correctional and detention facilities should only be operated by governmental agencies.
26
Moreover, Further, negative publicity aboutregarding an escape, riot or other disturbance or perceived poor operational performance, contract compliance, or other conditions at a privately managed facility may result in adverse publicity to us and the private corrections industry in general. Any of these occurrences or continued trends may make it more difficult for us to renew or maintain existing contracts or to obtain new contracts, which could have a material adverse effect on our business.business.
We are subject to terminations, non-renewals, or competitive re-bids of our government contracts. We typically enter into facility contracts with governmental entities for terms of up to five years, with additional renewal periods at the option of the contracting governmental agency. Notwithstanding any contractual renewal option of a contracting governmental agency, 23as of December 31, 2017, 43 of our facility contracts with the customers listed under “Business"Business – Facility Portfolio – Facilities and Facility Management Contracts”Contracts" are currently scheduled to expire on or before December 31, 20152018 but have renewal options (20)(25), or are currently scheduled to expire on or before December 31, 20152018 and have no renewal options (3)(18). Although we generally expect these customers to exercise renewal options or negotiate new contracts with us, one or more of these contracts may not be renewed by the corresponding governmental agency. In addition, these and any other contracting agencies may determine not to exercise renewal options with respect to any of our contracts in the future. Our government partners can also re-bid contracts in a competitive procurement process upon termination or non-renewal of our contract. Competitive re-bids may result from the expiration of the term of a contract, including the initial term and any renewal periods, or the early termination of a contract. Competitive re-bids are often required by applicable federal or state procurement laws periodically in order to further competitive pricing and other terms for the government agency.
During December 2014, The aggregate revenue earned during the BOP announced that it elected not to renew its contract with us at our owned and operated 2,016-bed Northeast Ohio Correctional Center. The current contract with the BOP at this facility is scheduled to expire on May 31, 2015. We currently expect to continue to house USMS detainees at this facility pursuant to a separate contract that expiresyear ended December 31, 2016, while we continue to market2017 for the space that will become available.43 contracts with scheduled maturity dates, notwithstanding contractual renewal options, on or before December 31, 2018 was $640.4 million, or 36% of total revenue.
Based on information available atas of the date of this filing, notwithstanding the contract at the Northeast Ohio Correctional Center described above, we expect tobelieve we will renew all othermaterial contracts that have expired or are scheduled to expire within the next twelve months. We believe our renewal rate on existing contracts remains high as a result ofdue to a variety of reasons including, but not limited to, the constrained supply of available beds within the U.S. correctional system, our ownership of the majority of the beds we operate, and the qualitycost effectiveness of our operations.the services we provide. However, we cannot assure we will continue to achieve such renewal rates in the future.
Governmental agencies typically may terminate a facility contract at any time without cause or use the possibility of termination to negotiate a lower per diem rate. In the event any of our contracts are terminated or are not renewed on favorable terms or otherwise, we may not be able to obtain additional replacement contracts. The non-renewal, termination, renegotiation or competitive re-bid of any of our contracts with governmental agencies could materially adversely affect our financial condition, results of operations and liquidity, including our ability to secure new facility contracts from others.others.
29
Our ability to secure new contracts to develop and manage correctional, detention, and detentionresidential reentry facilities depends on many factors outside our control.Our growth is generally dependent upon our ability to obtain new contracts to develop and manage correctional, detention, and detentionresidential reentry facilities. This possible growth depends on a number of factors we cannot control, including crime rates and sentencing patterns in various jurisdictions, governmental budgetary
27
constraints, and governmental and public acceptance of privatization. The demand for our facilities and services could be adversely affected by the relaxation of enforcement efforts, the expansion of alternatives to incarceration and detention, leniency in conviction or parole standards and sentencing practices or through the decriminalization of certain activities that are currently proscribed by criminal laws. For instance, any changes with respect to drugs and controlled substances or illegal immigration could affect the number of persons arrested, convicted, and sentenced, thereby potentially reducing demand for correctional or detention facilities to house them. Immigration reform laws are currently a focus for legislators and politicians at the federal, state, and local level. Legislation has also been proposed in numerous jurisdictions that could lower minimum sentences for some non-violent crimes and make more inmates eligible for early release based on good behavior. Also, sentencingthe expansion of alternatives under consideration could put some offenders on probation withto incarceration and detention, such as electronic monitoring, may reduce the number of offenders who would otherwise be incarcerated.incarcerated or detained. Similarly, reductions in crime rates or resources dedicated to prevent and enforce crime could lead to reductions in arrests, convictions and sentences requiring incarceration at correctional facilities. Our company does not, under longstanding policy, prohibits us from engaging in lobbyinglobby for or advocacy effortsagainst policies or legislation that would influence enforcement efforts, parole standards, criminal laws, and sentencing policies.determine the basis for, or duration of, an individual's incarceration or detention.
Moreover, certain jurisdictions recently have required successful bidders to make a significant capital investment in connection with the financing of a particular project, a trend that will require us to have sufficient capital resources to compete effectively. We may compete for such projects with companies that have more financial resources than we have. Further, we may not be able to obtain the capital resources when needed. A prolonged downturn in the financial creditcapital markets or in our stock price could make it more difficult to obtain capital resources at favorable rates of return or obtain capital resources at all.all.
We may face community opposition to facility location, which may adversely affect our ability to obtain new contracts. Our success in obtaining new awards and contracts sometimes depends, in part, upon our ability to locate land that can be leased or acquired, on economically favorable terms, by us or other entities working with us in conjunction with our proposal to construct and/or manage a facility. Some locations may be in or near populous areas and, therefore, may generate legal action or other forms of opposition from residents in areas surrounding a proposed site. When we select the intendedselecting project site,sites, we attempt to conduct business in communities where local leaders and residents generally support the establishment of a privatized correctional, detention, or detentionresidential reentry facility. Future efforts to find suitable host communities may not be successful. We may incur substantial costs in evaluating the feasibility of the development of a correctional or detention facility. As a result, we may report significant charges if we decide to abandon efforts to develop a correctional or detention facility on a particular site. In many cases, the site selection is made by the contracting governmental entity. In such cases, site selection may be made for reasons related to political and/or economic development interests and may lead to the selection of sites that have less favorable environments.environments.
Providing family residential services subjects us toincreases certain unique or increased risks and difficulties compared to operating our other facilities.In September 2014, we signed an amended agreement to provide safe and humane residential housing, as well as educational opportunities, to women and children under the custody of ICE, who are awaiting their due process before immigration courts. ProvidingIn October 2016, we entered into an amended agreement that extended the term of the 2014 agreement through September 2021. This is an important service to our federal government partner. At the same time, providing this type of residential service subjects us to newunique risks such as unanticipated increased costs and uncertaintieslitigation that could materially adversely affect our business, financial condition, or results of operations. For instance,example, the new contract mandates offender to staffresident-to-staff ratios that are higher than our typical contract, requires services unique to this contract (e.g. child care and primary education services), and limits the use of security protocols and techniques typically utilized in correctional and detention settings. These operational risks and others associated with privately managing this type of residential facility could result in higher costs associated with staffing and lead to increased litigation. In addition, in January 2015,litigation.
Numerous lawsuits, to which we are not a class action lawsuit was filed in federal district courtparty, have challenged the government's policy of detaining migrant families, and government policies with respect to family immigration may impact the demand for the District of Columbia against the Secretary of the Department of Homeland Security,South Texas
30
Family Residential Center. Any court decision or DHS, and certain ICE officials. The complaint sought to certify a class of plaintiffs, consisting of Central American mothers and children who (i) have been or will be detained in ICE family detention facilities since June 2014, (ii) have been or will be determined to have a credible fear of persecution in their home country under federal asylum laws and (iii) are eligiblegovernment action that impacts our existing contract for release on bond pursuant to certain federal statutes but have been or will be denied such release after being subject to an ICE custody determination that took deterrence of mass migration into account. In February 2015, the court certified the class and granted the plaintiffs’ motion for a preliminary injunction, enjoining DHS from detaining class members for the purpose of deterring future immigration to the United States and from considering deterrence of such immigration as a factor in such custody determinations until a final determination has been reached on the merits of the action. We have not received any instruction from ICE on what action they intend to take in response to the court order, or how and whether it will affect our contract at the South Texas Family Residential Center. However, it is possible that this or other lawsuits could adversely affect the contract, including changes to the contract that are less beneficial to us or which impose costs (such as to repurpose the facility for other detainees), or an outright termination of the contract. Any adverse decision with regard to this contractCenter could materially affect our cash flows, financial condition, and results of operations.
28
We may incur significant start-up and operating costs on new contracts before receiving related revenues, which may impact our cash flows and not be recouped. When we are awarded a contract to provide or manage a facility, we may incur significant start-up and operating expenses, including the cost of constructing the facility, purchasing equipment and staffing the facility, before we receive any payments under the contract. These expenditures could result in a significant reduction in our cash reserves and may make it more difficult for us to meet other cash obligations. In addition, a contract may be terminated prior to its scheduled expiration and as a result we may not recover these expenditures or realize any return on our investment.investment.
Government agencies may investigate and audit our contracts and operational performance, and if any deficiencies or improprieties are found, we may be required to cure those deficiencies or improprieties, refund revenues we have received, or forego anticipated revenues, and we may be subject to penalties and sanctions, including contract termination and prohibitions on our bidding in response to RFPs. Certain of the governmental agencies with which we contract have the authority to audit and investigate our contracts with them. As part of that process, government agencies may review our performance of the contract, our pricing practices, our cost structure and our compliance with applicable performance requirements, laws, regulations and standards. The regulatory and contractual environment in which we operate is complex and many aspects of our operations remain subject to manual processes and oversight that make compliance monitoring difficult and resource intensive. A governmental agency audit, review or investigation could result in a request to cure a performance or compliance issue, and if we are unable to or otherwise fail to do so, the failure could lead to the imposition of monetary penalties or revenue deductions, or the termination of the contract in question or other contracts that we have with that governmental agency. Similarly, for contracts that actually or effectively provide for certain reimbursement of expenses, if an agency determines that we have improperly allocated costs to a specific contract, we may not be reimbursed for those costs, and we could be required to refund the amount of any such costs that have been reimbursed. If a government audit asserts improper or illegal activities by us, we may be subject to civil and criminal penalties and administrative sanctions, including termination of contracts, forfeitures of profits, suspension of payments, fines and suspension or disqualification from doing business with certain government entities. In addition to the potential civil and criminal penalties and administrative sanctions, any adverse determination with respect to contractual or regulatory violations could negatively impact our ability to bid in response to RFPs in one or more jurisdictions.
Failure to comply with facility contracts or with unique and increased governmental regulation could result in material penalties or non-renewal or termination of noncompliant contracts or our other contracts to provide or manage correctional, detention, and detentionresidential reentry facilities. The industry in which we operate is subject to extensive federal, state, and local regulations, including educational, health care, and safety regulations, which are administered by many regulatory authorities. Some of the regulations are unique to the corrections industry, some are unique to government contractors, and the combination of regulations we face is unique and complex. Facility contracts typically include reporting requirements, supervision, and on-site monitoring by representatives of the contracting governmental agencies. Corrections officers are customarily required to meet certain training standards and, in some instances, facility personnel are required to be licensed and subject to background investigation. Certain jurisdictions also require us to award subcontracts on a competitive basis or to subcontract with certain types of businesses, such as small businesses and businesses owned by members of minority groups. Our facilities are also subject to operational and financial audits by the governmental agencies with which we have contracts. Federal regulations also require federal government contractors like us to self-report evidence of certain forms of misconduct. We may not always successfully comply with these regulations and contract requirements, and failure to comply can result in material penalties, including financial penalties, non-renewal or termination of noncompliant contracts or our other facility contracts, and suspension or debarment from contracting with certain government entities.
In addition, private prison managers are subject to government legislation and regulation attempting to restrict the ability of private prison managers to house certain types of inmates, such as inmates from other jurisdictions or inmates at medium or higher security levels. Legislation has been enacted in several states, and has previously been proposed in the United States Congress, containing such restrictions. Such legislation may have an adverse effect on us.
31
Our inmate transportation subsidiary, TransCor, is subject to regulations promulgated by the Departments of Transportation and Justice. TransCor must also comply with the Interstate Transportation of Dangerous Criminals Act of 2000, which covers operational aspects of transporting prisoners, including, but not limited to, background checks and drug testing of employees; employee training; employee hours; staff-to-inmate ratios; prisoner restraints; communication with local law enforcement; and standards to help ensure the safety of prisoners during transport. We are subject to changes in such regulations, which could result in an increase in the cost of our transportation operations.
On September 26, 2013,June 13, 2017, the US Court of Appeals for the District of Columbia Circuit, or the Court, struck down large portions of a late 2016 Order, or the Order, from the Federal Communications Commission, or FCC, which regulates telecommunications. The Order had set numerous rate caps on interstate communications, released a Report and Order and Further Notice of Proposed Rulemaking on the subject of rate reform for interstate inmateintrastate calling services, or the ICS, Order. The ICS Order was effective on February 11, 2014, subject to a stay on certain portions as a result of a pending legal challenge to the ICS Order. The ICS Order has had a significant impact on the rates that may be charged for interstate inmate calling services, or
29
ICS, which include per-minute charges, per-call charges, and ancillary charges and other fees charged in connection with such service. Primarily as a result of the ICS Order, our telephone commission revenue decreased by $0.9 million from 2013 to 2014.
The Order appliesapplied directly to ICS providers whothat offer their services pursuant to contracts with correctional facilities, including those that we manage. The Court found that the FCC lacked authority to regulate intrastate ICS Order places limits on ratesrates. The Court also found that ICS providers can charge. Even thoughthe FCC had neglected critical factors in calculating interstate rate caps, remanding the interstate rate proceeding back to the FCC for reconsideration. As a portionresult of the Court's decision, an earlier FCC order setting interstate rate caps remains in effect.
Because it is subject to the stay noted above, in anticipation of the ICS Order, our ICS providers have complied by eliminating payments to correctional facilities that would be in violation of the ICS Order.
A number of legal challenges to the ICS Order are pending and additional future challenges are possible,unclear what, if any, of which could alter or delay the FCC’s implementation of the ICS Order. In addition, based on the ICS Order and/or the outcome of its challenges, various state commissions may consider changes to their intrastate rates. Moreover, the ICS Order seeks comment on additional measures forfurther rate reform andcapping action the FCC has indicated that further reform ofmay take with respect to interstate and intrastate ICS rates, is likely forthcoming. On October 22, 2014, the FCC issued a Further Notice of Proposed Rulemaking, or FNPRM, which sought information from the public on various inmate calling-related topics. The FNPRM further re-affirmed the FCC’s intention to establish permanent rate caps for ICS, to consider, and likely impose, a total ban on commission payments to correctional facilities for interstate calling, and to impose rate caps and a commission ban on intrastate calling. Because the FCC revised the original due date for comments in response to the FNPRM, the FCC received comments and replies through late January 2015.financial impact cannot be anticipated at this time. The impact to our revenue is limited asbecause a significant amount of commissions paid by our ICS providers areis passed along to our customers or areis reserved and used for the benefit of inmatesoffenders in our care. Our failurecare.
In previous notices, the FCC sought comment on various topics, including the development of international ICS rate caps; the potential regulation of rates associated with technology based ICS alternatives, such as videoconferencing; and whether additional reforms are necessary for effective regulation of revenue sharing agreements. All of these reforms, if pursued, could impact revenue to comply with, or changes to existing regulations or adoption of new regulations in,correctional facility operators, both public and private, but the areas discussed above could result in further increases to our costs or reductions in our revenue.
Government agencies may investigate and audit our contracts and, if any improprieties are found, we may be required to cure those improprieties, refund revenues we have received, to forego anticipated revenues, and we may be subject to penalties and sanctions, including prohibitions on our bidding in response to RFPs. Certain of the governmental agencies with which we contract have the authority to audit and investigate our contracts with them. As part of that process, government agencies may review our performance of the contract, our pricing practices, our cost structure and our compliance with applicable performance requirements, laws, regulations and standards. The regulatory and contractual environment in which we operate is complex and many aspects of our operations remain subject to manual processes and oversight that make compliance monitoring difficult and resource intensive. A governmental agency review could result in a request to cure a performance or compliance issue, and if we are unable to do so, the failure could lead to termination of the contract in question or other contracts that we have with that governmental agency. Similarly, for contracts that actually or effectively provide for certain reimbursement of expenses, if an agency determines that we have improperly allocated costs to a specific contract, we may not be reimbursed for those costs, and we could be required to refund the amount of any such costs that have been reimbursed. If a government audit asserts improper or illegal activities by us, we may be subject to civil and criminal penalties and administrative sanctions, including termination of contracts, forfeitures of profits, suspension of payments, fines and suspension or disqualification from doing business with certain government entities. In February 2014, we reached an agreement to pay $1.0 million in compensation to the state of Idaho regarding contractual disputes related to staffing at the Idaho Correctional Center stemming in part from an auditmost recent decision by the Idaho DepartmentCourt appears to limit FCC jurisdiction in some of Corrections. In addition tothese areas. For this reason, it remains unclear whether the potential civil and criminal penalties and administrative sanctions noted above, any adverse determination with respect to contractual orFCC will undertake further regulatory violations could negatively impact our ability to bidactivity in response to RFPs in one or more jurisdictions.
30
We depend on a limited number of governmental customers for a significant portion of our revenues.We currently derive, and expect to continue to derive, a significant portion of our revenues from a limited number of governmental agencies. The loss of, or a significant decrease in, business from the BOP, ICE, USMS, or various state agencies could seriously harm our financial condition and results of operations. The three primary federal governmental agencies with correctional and detention responsibilities, the BOP, ICE, and USMS, accounted for 44%48% of our total revenues for the fiscal year ended December 31, 20142017 ($724.2839.1 million). The USMSICE accounted for 17%25% of our total revenues for the fiscal year ended December 31, 20142017 ($285.4444.1 million), BOPUSMS accounted for 13%16% of our total revenues for the fiscal year ended December 31, 20142017 ($217.8277.4 million), and ICEBOP accounted for 13%7% of our total revenues for the fiscal year ended December 31, 20142017 ($221.0117.6 million). Although the revenue generated from each of these agencies is derived from numerous management contracts, the loss or substantial reduction in value of one or more of such contracts could have a material adverse impact on our financial condition, and results of operations. As previously described herein, during December 2014, the BOP notified us that they elected not to renew their contract at our Northeast Ohio Correctional Center upon its expiration in May 2015. We generated $40.2 million in revenue from the BOP during 2014 under this contract.operations, and cash flows. We expect to continue to depend upon these federal agencies and a relatively small group of other governmental customers for a significant percentage of our revenues.revenues.
In a memorandum to the BOP dated August 18, 2016, the DOJ directed that, as each contract with privately operated prisons reaches the end of its term, the BOP should either decline to renew that contract or substantially reduce its scope in a manner consistent with law and the overall decline of the BOP's inmate population. On February 21, 2017, the newly appointed U.S. Attorney General issued a memorandum rescinding the DOJ's prior directive stating the August 18, 2016 memorandum changed long-standing policy and practice and impaired the BOP's ability to meet the future needs of the federal correctional system.
Revenue from our South Texas Family Residential Center was $170.6 million in 2017 and $267.3 million in 2016, reflecting the aforementioned amendment executed in October 2016 as discussed under Item 1, "Business - Business Development". The CDCR accountedloss or further reduction in value of this contract would have a material adverse impact on our financial condition, results of operations, and cash flows. See "Management's Discussion and Analysis of Financial Condition and Results of Operations - Results of Operations" for 14%a further discussion regarding our contract at the
32
South Texas Family Residential Center and the reduction in revenue in 2017 that resulted from the amendment to this contract.
Approximately 6% of our total revenues for the fiscal year ended December 31, 20142017 ($236.9104.1 million) was generated from the CDCR in facilities housing inmates outside the state of California, a decrease from $113.4 million, or 6%, including the revenue we generated atof our California City facility under a lease.total revenues in 2016, and $170.5 million, or 10% of our total revenues in 2015. Our management and lease agreementsagreement with the CDCR, as well as the status of legal and legislative action regardingcontributing to the reduction in the state of California inmate populations, are more fully described hereafter in “MD&A –"Management's Discussion and Analysis of Financial Condition and Results of Operations”Operations - Results of Operations".
During the first quarter of 2015, the adult inmate population held in state of California institutions under custody of the CDCR first met a Federal court order to reduce inmate populations below 137.5% of the State's capacity. Inmate populations in the state continued to decline below the court ordered capacity limit which has resulted in declining inmate populations in the out-of-state program at facilities we own and operate. As of December 31, 2017, the adult inmate population held in state of California institutions remained in compliance with the Federal court order at approximately 134.6% of capacity, or approximately 114,500 inmates, which did not include the California inmates held in our out-of-state facilities, compared with 114,000 inmates at December 31, 2016.
On January 10, 2018, the Governor of California issued a proposed budget for fiscal 2018-2019. The proposed budget contemplates that the continued implementation of initiatives to reduce prison populations will allow the CDCR to eliminate the use of out-of-state contract beds. Current estimates include the removal of all inmates from one of our two out-of-state facilities by the end of fiscal 2017-2018. As the impact of the initiatives grows, the CDCR anticipates the removal of inmates from our other out-of-state facility by fall 2019. Although the proposed budget acknowledges that estimates of population reductions are subject to considerable uncertainty, the complete removal by the CDCR of all inmates from our out-of-state facilities could have a material adverse effect on our financial position, results of operations, and cash flows.
We may not be able to successfully identify, consummate or integrate acquisitions.
We have an active acquisition program, the objective of which is to identify suitable acquisition targets that will enhance our growth and diversify our cash flows. The pursuit of acquisitions may pose certain risks to us. We may not be able to identify acquisition candidates that fit our criteria for growth, profitability and diversification strategy. Even if we are able to identify such candidates, we may not be able to acquire them on terms satisfactory to us. We will incur expenses and dedicate attention and resources associated with the review and pursuit of acquisition opportunities, whether or not we consummate such acquisitions.
Additionally, even if we are able to identify and acquire suitable targets on agreeable terms, we may not be able to successfully integrate their operations with ours. Achieving the anticipated benefits of any acquisition will depend in significant part upon whether we integrate such acquired businesses in an efficient and effective manner. We may not be able to achieve the anticipated operating and cost synergies or long-term strategic benefits of our acquisitions within the anticipated timing, or at all. We may also assume liabilities in connection with acquisitions to which we would otherwise not be exposed. An inability to realize the full extent of, or any of, the anticipated synergies or other benefits of an acquisition, as well as any delays that may be encountered in the integration process, which may delay the timing of such synergies or other benefits, could have an adverse effect on our business and results of operations.
As a result of our acquisitions, we have recorded and will continue to record a significant amount of goodwill and other intangible assets. In the future, our goodwill or other intangible assets may become impaired, which could result in material non-cash charges to our results of operations.
We have a substantial amount of goodwill and other intangible assets resulting from business acquisitions. As of December 31, 2017, we had $40.9 million of goodwill and other intangible assets. At least annually, or whenever events or changes in circumstances indicate a potential impairment in the carrying value as defined by U.S. generally accepted accounting principles, we will evaluate this goodwill for impairment by first assessing qualitative factors to determine whether the existence of events or circumstances leads to a determination that it is more likely than not that the fair value of the reporting unit is less than the carrying amount. Estimated fair values could change
33
if there are changes in our capital structure, cost of debt, interest rates, capital expenditure levels, operating cash flows, or market capitalization. Impairments of goodwill or other intangible assets could require material non-cash charges to our results of operations.
We are dependent upon our senior management and our ability to attract and retain sufficient qualified personnel.
The success of our business depends in large part on the ability and experience of our senior management. The unexpected loss of any of these persons could materially adversely affect our business and operations.
In addition, the services we provide are labor-intensive. The success of our business, and our ability to satisfy the staffing and operational performance requirements of our contracts, require that we attract, hire, develop and retain sufficient qualified personnel. When we are awarded a facility management contract or open a new facility, we must hire operating management, correctional officers, and other personnel. The success of our business requires that we attract, develop, and retain these personnel. Our inability to hire sufficient qualified personnel on a timely basis, or experiencing excessive turnover or the loss of significant numbers of personnel at existing facilities, could adversely affect our business and operations. Under manyMany of our contracts we are subjectinclude specific staffing requirements, and our failure to satisfy such requirements may result in the imposition of financial penalties for insufficient staffing..
AdverseLegal proceedings related to, and adverse developments in our relationship with, our employees could adversely affect our business, financial condition or results of operations.
We and our subsidiaries are party to a variety of claims and legal proceedings in the ordinary course of business, including but not limited to claims and legal proceedings related to employment matters. Because the resolution of claims and legal proceedings is inherently uncertain, there can be no assurance we will be successful in defending against such claims or legal proceedings, or that management's assessment of the materiality of these matters, including the reserves taken in connection therewith, will be consistent with the ultimate outcome of such claims or legal proceedings. In the event management's assessment of materiality of current claims and legal proceedings proves inaccurate or litigation that is material arises in the future, the resolution of such matters may have a material adverse effect on our business, financial condition or results of operations.
As of December 31, 2014,2017, we employed approximately 14,04012,875 full- and part-time employees. Approximately 1,030810 of our employees at fivethree of our facilities, or approximately 7%6% of our workforce, are represented by labor unions. We have not experienced a strike or work stoppage at any of our facilities and, in the opinion of management, overall employee relations are good. New executive orders, administrative rules and changes in National Labor Relations could increase organizationalorganizing activity at locations where employees are currently not represented by a labor organization. Increases in organizational activity or any future work stoppages could have a material adverse effect on our business, financial condition, or results of operations.
31
We are subject to necessary insurance costs.
Workers’Workers' compensation, auto liability, employee health, and general liability insurance represent significant costs to us. Because we are significantly self-insured for workers’workers' compensation, auto liability, employee health, and general liability risks, the amount of our insurance expense is dependent on claims experience, our ability to control our claims experience, and in the case of workers’workers' compensation and employee health, rising health care costs in general. Unanticipated additional insurance costs could adversely impact our results of operations and cash flows, and the failure to obtain or maintain any necessary insurance coverage could have a material adverse effect on us.us.
We may be adversely affected by inflation.
Many of our facility contracts provide for fixed fees or fees that increase by only small amounts during their terms. If, due to inflation or other causes, our operating expenses, such as wages and salaries of our employees, insurance, medical, and food costs, increase at rates faster than increases, if any, in our fees,revenues, then our profitability would be adversely affected.affected. See “MD&A"Management's Discussion and Analysis of Financial Condition and Results of Operations – Inflation.”"
34
We are subject to legal proceedings associated with owning and managing correctional, detention, and detentionresidential reentry facilities.
Our ownership and management of correctional, detention, and detentionresidential reentry facilities, and the provision of inmate transportation services by a subsidiary, expose us to potential third-party claims or litigation by prisoners or other persons relating to personal injury or other damages resulting from contact with a facility, its managers, personnel or other prisoners, including damages arising from a prisoner’sprisoner's escape from, or a disturbance or riot at, a facility we own or manage, or from the misconduct of our employees. To the extent the events serving as a basis for any potential claims are alleged or determined to constitute illegal or criminal activity, we could also be subject to criminal liability. Such liability could result in significant monetary fines and could affect our ability to bid on future contracts and retain our existing contracts. In addition, as an owner of real property, we may be subject to a variety of proceedings relating to personal injuries of persons at such facilities. The claims against our facilities may be significant and may not be covered by insurance. Even in cases covered by insurance, our deductible (or self-insured retention) may be significant.significant.
We are subject to certain stockholder litigation.
In a memorandum to the BOP dated August 18, 2016, the DOJ directed that, as each contract with privately operated prisons reaches the end of its term, the BOP should either decline to renew that contract or substantially reduce its scope in a manner consistent with law and the overall decline of the BOP's inmate population. In addition to the decline in the BOP's inmate population, the DOJ memorandum cites purported operational, programming, and cost efficiency factors as reasons for the DOJ directive. On February 21, 2017, the newly appointed U.S. Attorney General issued a memorandum rescinding the DOJ's prior directive stating the August 18, 2016 memorandum changed long-standing policy and practice and impaired the BOP's ability to meet the future needs of the federal correctional system.
Following the release of the August 18, 2016 DOJ memorandum, a purported securities class action lawsuit was filed against us and certain of our current and former officers in the United States District Court for the Middle District of Tennessee, or the District Court, captioned Grae v. Corrections Corporation of America et al., Case No. 3:16-cv-02267. The lawsuit is brought on behalf of a putative class of shareholders who purchased or acquired our securities between February 27, 2012 and August 17, 2016. In general, the lawsuit alleges that, during this timeframe, our public statements were false and/or misleading regarding the purported operational, programming, and cost efficiency factors cited in the DOJ memorandum and, as a result, our stock price was artificially inflated. The lawsuit alleges that the publication of the DOJ memorandum on August 18, 2016 revealed the alleged fraud, causing the per share price of our stock to decline, thereby causing harm to the putative class of shareholders.
On May 12, 2017, we submitted a motion to dismiss the plaintiff's complaint in its entirety with prejudice. On December 18, 2017, the District Court entered an order denying our motion to dismiss. We believe the lawsuit is entirely without merit, and intend to vigorously defend against it. In addition, we maintain insurance, with certain self-insured retention amounts, to cover the alleged claims which mitigates the risk such litigation would have a material adverse effect on our financial condition, results of operations, or cash flows.
We are subject to risks associated with ownership of real estate.
Our ownership of correctional, detention, and detentionresidential reentry facilities and other government-leased assets subjects us to risks typically associated with investments in real estate. Investments in real estate and, in particular, correctional and detention facilities have limited or no alternative use and thus are relatively illiquid. Therefore, our ability to divest ourselves of one or more of our facilities promptly in response to changedchanging conditions is limited. Investments in correctional and detention facilities, in particular,real estate properties subject us to risks involving potential exposure to environmental liability and uninsured loss. Our operating costs may be affected by the obligation to pay for the cost of complying with existing environmental laws, ordinances and regulations, as well as the cost of complying with future legislation. In addition, although we maintain insurance for many types of losses, there are certain types of losses, such as losses from earthquakes and acts of terrorism, which may be either uninsurable or for which it may not be economically feasible to obtain insurance coverage in light of the substantial costs associated with such insurance. As a result, we could
35
lose both our capital invested in, and anticipated profits from, one or more of the facilitiesproperties we own. Further, it is possible to experience losses that may exceed the limits of insurance coverage.coverage.
32
In addition, our focus on facility development and expansion posesprojects pose additional risks, including cost overruns caused by various factors, many of which are beyond our control, such as weather, labor conditions, and material shortages, resulting in increased construction costs. Further, if we are unable to utilize thisthe new bed capacity, our financial results could deteriorate.deteriorate.
Certain of our facilities are subject to options to purchase and reversions. Eleven Ten of our facilities are subject to an option to purchase by certain governmental agencies. Such options are exercisable by the corresponding contracting governmental entity generally at any time during the term of the respective facility contract. Certain of these purchase options are based on the depreciated book value of the facility, which essentially results in the transfer of ownership of the facility to the governmental agency at the end of the life used for accounting purposes.purposes, while other options to purchase are exercisable at prices below fair market value. See “Business"Business – Facility Portfolio – Facilities and Facility Management Contracts.”" If any of these options are exercised, there exists the risk that we will be unable to invest the proceeds from the sale of the facility in one or more properties that yield as much cash flow as the property acquired by the government entity. In addition, in the event any of these options is exercised, there exists the risk that the contracting governmental agency will terminate the management contract associated with such facility. For the year ended December 31, 2014,2017, the eleventen facilities currently subject to these options generated $344.9$338.9 million in revenue (20.9%(19.2% of total revenue) and incurred $250.6$257.5 million in operating expenses. Certain of the options to purchase are exercisable at prices below fair market value. See “Business – Facility Portfolio – Facilities and Facility Management Contracts.”
In addition, the ownership of two of our facilities (one of which is also subject to an option to purchase) will, upon the expiration of certain ground leases in 2015 and 2017, revert to the respective governmental agency contracting with us. See “Business – Facility Portfolio – Facilities and Facility Management Contracts.” At the time of such reversion, there exists the risk that the contracting governmental agency will terminate the contract associated with such facility. For the year ended December 31, 2014, the facilities subject to reversion generated $71.1 million in revenue (4.3% of total revenue) and incurred $53.6 million in operating expenses.
Risks related to facility construction and development activities may increase our costs related to such activities. When we are engaged to perform construction and design services for a facility, we typically act as the primary contractor and subcontract with other companies whothat act as the general contractors. As primary contractor, we are subject to the various risks associated with construction (including, without limitation, shortages of labor and materials, work stoppages, labor disputes, and weather interference)interference which could cause construction delays.delays). In addition, we are subject to the risk that the general contractor will be unable to complete construction at the budgeted costs or be unable to fund any excess construction costs, even though we require general contractors to post construction bonds and insurance. Under such contracts, we are ultimately liable for all late delivery penalties and cost overruns.
We may be adversely affected by the rising cost and increasedan increase in costs or difficulty of obtaining adequate levels of surety credit on favorable terms.
We are often required to post bid or performance bonds issued by a surety company as a condition to bidding on or being awarded a contract. Availability and pricing of these surety commitments are subject to general market and industry conditions, among other factors. Increases in surety costs could adversely affect our operating results if we are unable to effectively pass along such increases to our customers. We cannot assure you that we will have continued access to surety credit or that we will be able to secure bonds economically, without additional collateral, or at the levels required for any potential facility development
33
or contract bids. If we are unable to obtain adequate levels of surety credit on favorable terms, we would have to rely upon letters of credit under our revolving credit facility which could entail higher costs even if such borrowing capacity was even available when desired at the time, and our ability to bid for or obtain new contracts could be impaired.impaired.
Interruption, delay or failure of the provision of our technology services or information systems, or the compromise of the security thereof, could adversely affect our business, financial condition or results of operations.
Components of our business depend significantly on effective information systems and technologies. As with all companies that utilize information systems, we are vulnerable to negative impacts if the operation of those systems is interrupted, delayed, or certain information contained therein is compromised. As a matter of course, we exchange data with our government partners and other third-party providers. WeThe nature of this business is such that we do not store credit card or other retail transactional data. Additionally, our revenue cycle is such that it provides for a much longer post-breach recovery window without adversely impacting revenue management than is typical. For other personal information we do store, we employ industry-standard methodologies to ensure the availability and security of such systems and information. Additionally, we conduct detailed cyber security and data handling training for all employees with access to that data, and employ independent third parties to assess configuration status, perimeter
36
strength, and social engineering effectiveness. Despite the security measures we have in place, and any additional measures we may implement in the future, our facilities and systems, and those of our third-party service providers, could be vulnerable to security breaches, computer viruses, lost or misplaced data, programming errors, human errors, acts of vandalism, or other events. For example, several well-known companies have recently disclosed high-profile security breaches involving sophisticated and highly targeted attacks on their company’scompany's infrastructure or their customers’customers' data, which were not recognized or detected until after such companies had been affected notwithstanding the preventativepreventive measures they had in place. Any security breach or event resulting in the interruption, delay or failure of our services or information systems, or the misappropriation, loss, or other unauthorized disclosure of customer data or confidential information, including confidential information about our employees, whether by us directly or our third-party service providers, could damage our reputation, expose us to the risks of litigation and liability, disrupt our business, result in lost business, or otherwise adversely affect our results of operations.operations. We did not experience any such incidents in 2017.
Risks Related to Our Indebtedness
Our indebtedness could adversely affect our financial health and prevent us from fulfilling our obligations under our debt securities.
We have a significant amount of indebtedness. As of December 31, 2014,2017, we had total indebtedness of $1,200.0$1,459.0 million. Our indebtedness could have important consequences. For example, it could:
restrict us from pursuing strategic acquisitions or certain other business opportunities;
place us at a competitive disadvantage compared to our competitors that have less debt; and
If we are unable to meet our debt service obligations, we may need to reduce capital expenditures and dividend distributions, restructure or refinance our indebtedness, obtain additional equity financing or sell assets. We may be unable to restructure or refinance our indebtedness, obtain additional equity financing or sell assets on satisfactory terms or at all.
34
Our revolvingsenior bank credit facility, indentures related to our senior notes, and other debt instruments have restrictive covenants that could affectlimit our financial condition.flexibility.
The indentures related to our aggregate original principal amount of $325.0 million 4.125% senior notes due 2020, and $350.0 million 4.625% senior notes due 2023, $250.0 million 5.0% senior notes due 2022, and $250.0 million 4.75% senior notes due 2027, collectively referred to herein as our senior notes, and our revolvingsenior bank credit facility, contain financial and other restrictive covenants that limit our ability to engage in activities that may be in our long-term best interests. Our ability to borrow under our revolvingsenior bank credit facility is subject to compliance with certain financial covenants, including leverage and interest coverage ratios. Our revolvingsenior bank credit facility includes other restrictions that, among other things, limit our ability to incur indebtedness; grant liens; engage in mergers, consolidations and liquidations; make asset dispositions, restricted payments and investments; enter into transactions with affiliates; and amend, modify or prepay certain indebtedness. The indentures related to our senior notes contain limitations on our ability to effect mergers and change of control events, as well as other limitations including limitations on the sale of assets and limitationsour ability to create liens on liens.our assets.
37
Our failure to comply with these covenants could result in an event of default that, if not cured or waived, could result in the acceleration of all or a substantial portion of our debts. We do not have sufficient working capital to satisfy our debt obligations in the event of an acceleration of all or a significant portion of our outstanding indebtedness.
Our indebtedness is secured by a substantial portion of our assets.
Subject to applicable laws and certain agreed-upon exceptions, our $900.0 revolving credit facility and our incremental term loans, available pursuant to an “accordion” feature under our revolving credit facility in an aggregate principal amount of up to an additional $350.0 million, are secured by a pledge of all of the capital stock of CoreCivic’s domestic subsidiaries, 65% of the capital stock of CoreCivic’s foreign subsidiaries, all of CoreCivic’s accounts receivable and all of CoreCivic’s deposit accounts. Subject to compliance with the restrictive covenants under our existing indebtedness, we may incur additional indebtedness secured by existing or future assets of CoreCivic or our subsidiaries. In the event of a default under our credit facility or any other secured indebtedness, or if we experience insolvency, liquidation, dissolution or reorganization, the holders of our secured debt instruments would first be entitled to payment from their collateral security, and only then would holders of our unsecured debt be entitled to payment from our remaining assets. In such an event, there can be no assurance that we would have sufficient assets to pay amounts due to holders of our unsecured debt and such holders may receive less than the full amount to which they are entitled.
Servicing our indebtedness will require a significant amount of cash.cash or may require us to refinance our indebtedness before it matures. Our ability to generate cash depends on many factors beyond our control.control and there is no assurance that we will be able to refinance our debt on acceptable terms.
Currently, our incremental term loan and revolving credit facility both mature in July 2020. We also have outstanding $325.0 million in aggregate principal amount of our 4.125% senior notes due 2020, $350.0 million in aggregate principal amount of our 4.625% senior notes due 2023, $250.0 million in aggregate principal amount of our 5.0% senior notes due 2022 and $250.0 million in aggregate principal amount of our 4.75% senior notes due 2027. Our ability to make payments on our indebtedness, to refinance our indebtedness, and to fund planned capital expenditures will depend on our ability to generate cash in the future. This, to a certain extent, is subject to general economic, financial, competitive, legislative, regulatory, and other factors that are beyond our control.
The risk exists that our business will be unable to generate sufficient cash flow from operations or that future borrowings will not be available to us under our revolving credit facility in an amount sufficient to enable us to pay our indebtedness, including our existing senior notes, or to fund our other liquidity needs. We may need to refinance all or a portion of our indebtedness, including our senior notes, on or before maturity. We may not, however, be ableOur ability to refinance anyall or a portion of our indebtedness on acceptable terms, or at all, will be dependent upon a number of factors, including our revolvingdegree of leverage, the value of our assets, borrowing and other financial restrictions imposed by lenders and conditions in the credit facility and includingmarkets at the time we refinance. If we are unable to refinance our senior notes,indebtedness on commercially reasonableacceptable terms, we may be forced to agree to otherwise unfavorable financing terms or sell one or more properties at all.unattractive prices or on disadvantageous terms. Any one of these options could have a material adverse effect on our business, financial condition, results of operations and our ability to make distributions to our stockholders.
We are required to repurchase all or a portion of our senior notes upon a change of control, and our revolvingsenior bank credit facility is subject to acceleration upon a change inof control.
Upon certain change of control events, as that term is defined in the indentures for our senior notes, including a change of control caused by an unsolicited third party, we are required to make an offer in cash to repurchase all or any part of each holder’sholder's notes at a repurchase price equal to 101% of the principal thereof, plus accrued interest. The source of funds for any such repurchase would be our available cash or cash generated from operations or other sources, including borrowings, sales of equity or funds provided by a new controlling person or entity. Sufficient funds may not be available to us, however, at the time of any change of control event to repurchase all or a portion of the tendered notes pursuant to this requirement. Our failure to offer to repurchase notes, or to repurchase notes tendered, following a change
35
of control will result in a default under the respective indentures, which could lead to a cross-default under our revolvingsenior bank credit facility and under the terms of our other indebtedness. In addition, terms of our revolvingsenior bank credit facility, which isare subject to acceleration upon the occurrence of a change in control (as
38
described therein), may prohibit us from making any such required repurchases. Prior to repurchasing the notes upon a change of control event, we must either repay outstanding indebtedness under our revolvingsenior bank credit facility or obtain the consent of the lenders under our revolvingsenior bank credit facility. If we do not obtain the required consents or repay our outstanding indebtedness under our revolvingsenior bank credit facility, we would remain effectively prohibited from offering to purchaserepurchase the notes.
Despite current indebtedness levels, we may still incur more debt.
The terms of the indentures for our senior notes and our revolvingsenior bank credit facility restrict our ability to incur indebtedness; however, we may nevertheless incur additional indebtedness in the future, and in the future, we may refinance all or a portion of our indebtedness, including our revolvingsenior bank credit facility, and may incur additional indebtedness as a result. As of December 31, 2014,2017, we had $358.7$694.1 million of additional borrowing capacity available under our $900.0 million revolving credit facility. In addition, we may issue an indeterminate amount of debt securities from time to time when we determine that market conditions and the opportunity to utilize the proceeds from the issuance of such debt securities are favorable. If new debt is added to our and our subsidiaries’subsidiaries' current debt levels, the related risks that we and they now face could intensify.
Our access to capital may be affected by general macroeconomic conditions.
During the financial crisis in 2008Credit markets may tighten significantly such that our ability to obtain new capital will be more challenging and 2009, several large financial institutions failed while others became dependent on the assistance of the federal government to continue to operate as going concerns.more expensive. We can provide no assurance that the banks that have made commitments under our revolvingsenior bank credit facility will continue to operate as going concerns in the future.future or will agree to extend commitments beyond the maturity date. If any of the banks in the lending group were to fail, or fail to renew their commitments, it is possible that the capacity under the revolvingour senior bank credit facility would be reduced. In the event that the availability under the revolvingour senior bank credit facility was reduced significantly, we could be required to obtain capital from alternate sources in order to continue with our business and capital strategies. Our options for addressing such capital constraints would include, but not be limited to (i) delaying certain capital expenditure projects, (ii) obtaining commitments from the remaining banks in the lending group or from new banks to fund increased or new amounts under the terms of the revolvingour senior bank credit facility, (iii) accessing the public capital markets, or (iv) reducing our dividend (but not less than amounts required to maintain our status as a REIT)REIT and avoid income and excise taxes). Such alternatives could be on terms less favorable than under existing terms, which could have a material effect on our consolidated financial position, results of operations, or cash flows.
Rising interest rates would increase the cost of our variable rate debt.
We have incurred and expect in the future to incur indebtedness that bears interest at variable rates.rates, including indebtedness under our senior bank credit facility. Accordingly, increases in interest rates would increase our interest costs, which could have a material adverse effect on us and our ability to make distributions to our stockholders and pay amounts due on our debt or cause us to be in default under certain debt instruments. In addition, an increase in market interest rates may lead holders of our common stock to demand a higher yield on their shares from distributions by us, which could adversely affect the market price for our common stock.
36
Risks Related to our REIT Structure
If we fail to remain qualified as a REIT, we would be subject to corporate income taxes and would not be able to deduct distributions to stockholders when computing our taxable income.
We currently operate in a manner that is intended to allow us to qualify as a REIT for federal income tax purposes commencing with our taxable year beginning January 1, 2013. However, we cannot assure you that we have qualified or will remain qualified as a REIT. Qualification as a REIT requires us to satisfy numerous requirements established under highly technical and complex sections of the Internal Revenue Code of 1986, as amended, (the “Code”),or the Code, which may change from time to time and for which there are only limited judicial and administrative interpretations, and involves the determination of various factual matters and circumstances not entirely within our control. For example, in order to qualify as a REIT, the REIT must derive at least 95% of its gross income in any year from qualifying sources. In addition, a REIT is required to distribute annually to its stockholders at least 90% of the
39
its REIT taxable income (determined without regard to the dividends paid deduction and by excluding capital gains) and must satisfy specified asset tests on a quarterly basis.
If we fail to qualify as a REIT in any taxable year, we would be subject to federal income tax (including any applicable alternative minimum tax) on our taxable income computed in the usual manner for corporate taxpayers without deduction for distributions to our stockholders and we may need to borrow additional funds or issue securities to pay such additional tax liability. Any such corporate income tax liability could be substantial and would reduce the amount of cash available for other purposes, including distributions to our stockholders, because, unless we are entitled to relief under certain statutory provisions, we would be taxable as a C-corporation, beginning in the year in which the failure occurs, and we would not be allowed to re-elect to be taxed as a REIT for the following four years.
Even if we remain qualified as a REIT, we may owe penalty taxes under certain circumstances.
Even thoughif we qualify as a REIT, we will be subject to certain U.S. federal, state and local taxes on our income and property, including on taxable income that we do not distribute to our stockholders, and on net income from certain “prohibited transactions”"prohibited transactions". In addition, the REIT provisions of the Code are complex and are not always subject to clear interpretation. For example, a REIT must derive at least 95% of its gross income in any year from qualifying sources, including rents from real property. Rents from real property includesinclude amounts received for the use of limited amounts of personal property and for certain services. Whether amounts constitute rents from real property or other qualifying income may not be entirely clear in all cases. We may fail to qualify as a REIT if we exceed the permissible amounts of non-qualifying income unless such failures qualify for relief under certain statutory relief provisions. Even if we qualify for statutory relief, we may be required to pay an excise or penalty tax (which could be significant in amount) in order to utilize one or more such relief provisions under the Code to maintain our qualification as a REIT. Furthermore, we conduct substantial activities through TRSs, and the income of those subsidiaries will beis subject to U.S. federal income tax at regular corporate rates.rates.
To maintain our REIT status, we may be forced to obtain capital during unfavorable market conditions, which could adversely affect our overall financial performance.
In order to qualify as a REIT, we will be required each year to distribute to our stockholders at least 90% of our REIT taxable income (determined without regard to the dividends paid deduction and by excluding any net capital gain), and we will be subject to tax to the extent
37
our net taxable income (including net capital gain) is not fully distributed. In addition, we will be subject to a 4% nondeductible excise tax on the amount, if any, by which distributions we pay in any calendar year are less than the sum of 85% of our ordinary income, 95% of our net capital gains, and 100% of our undistributed income from prior years. We intend to continue to make distributions to our shareholdersstockholders to comply with the distribution requirements of the Code as well as to reduce our exposure to federal income taxes and the nondeductible excise tax. Differences in timing between the receipt of income and the payment of expenses to arrive at taxable income, along with the effect of required debt amortization payments, could require us to borrow funds on a short-term basis to meet the distribution requirements that are necessary to achieve the tax benefits associated with qualifying as a REIT. We may acquire additional capital through our issuance of securities senior to our common stock, including additional borrowings or other indebtedness or the issuance of additional securities. Issuance of such senior securities creates additional risks because leverage is a speculative technique that may adversely affect common stockholders.stockholders or noteholders. If the return on assets acquired with borrowed funds or other leverage proceeds does not exceed the cost of the leverage, the use of leverage could negatively affect our cash flow.
Additionally, the issuance of senior securities involves offering expenses and other costs, including interest payments, which are borne indirectly by our common stockholders. Fluctuations in interest rates could increase interest payments on our senior securities, and could reduce cash available for distribution on common stock.stock or for payment on our debt securities. Increased operating costs, including the financing cost associated with any leverage, may reduce our total return to common stockholders. Rating agency guidelines applicable to any senior securities may impose asset coverage requirements, dividend limitations, voting right requirements (in the case of the senior equity securities), and other restrictions. Further, the terms of any senior securities or other borrowings may impose additional requirements, restrictions and limitations that are more stringent than those required by a rating agency that rates outstanding senior securities that may have an adverse effect on us and may affect our ability to pay distributions to our stockholders. On the other hand, we may not be able to raise such additional capital in the future
40
on favorable terms or at all. Unfavorable economic conditions could increase our funding costs, limit our access to the capital markets or result in a decision by lenders not to extend credit to us.
Further, in order to maintain our REIT status, we may need to borrow funds to meet the REIT distribution requirements even if the then-prevailing market conditions are not favorable for these borrowings. These borrowing needs could result from differences in timing between the actual receipt of cash and inclusion of income for federal income tax purposes or the effect of non-deductible capital expenditures, the creation of reserves, or required debt or amortization payments. Our ability to access debt and equity capital on favorable terms or at all is dependent upon a number of factors, including general market conditions, the market’smarket's perception of our growth potential, our current and potential future earnings and cash distributions, and the market price of our securities. Issuance of debt or equity securities will expose us to typical risks associated with leverage, including increased risk of loss.
To the extent our ability to issue debt or other senior securities such as preferred stock is constrained, we may depend on issuance of additional shares of common stock to finance new investments. If we raise additional funds by issuing more shares of our common stock or senior securities convertible into, or exchangeable for, shares of our common stock, the percentage ownership of our stockholders at that time would decrease, and you may experience dilution.
38
There are uncertainties relating to our estimate of the E&P Distribution.
To qualify for taxation as a REIT effective for the year ended December 31, 2013, we were required to distribute to our stockholders on or before December 31, 2013, our undistributed accumulated earnings and profits attributable to taxable periods ending prior to January 1, 2013. On May 20, 2013, we distributed $675.0 million to shareholders of record as of April 19, 2013 in satisfaction of this requirement (the “E&P Distribution”). We believe that the total value of the E&P Distribution was sufficient to fully distribute our accumulated earnings and profits and that a portion of the E&P Distribution exceeded our accumulated earnings and profits. However, the amount of our accumulated earnings and profits is a complex factual and legal determination. We may have had less than complete information at the time we estimated our earnings and profits or may have interpreted the applicable law differently from the IRS. Substantial uncertainties exist relating to the computation of our undistributed accumulated earnings and profits, including the possibility that the IRS could, in auditing tax years through 2012, successfully assert that our taxable income should be increased, which could increase our pre-REIT accumulated earnings and profits. Thus, we could fail to satisfy the requirement that we distribute all of our pre-REIT accumulated earnings and profits by the close of our first taxable year as a REIT. Moreover, although there are procedures available to cure a failure to distribute all of our pre-REIT accumulated earnings and profits, we cannot now determine whether we would be able to take advantage of them or the economic impact to us of doing so.
Performing services through our TRSs may increase our overall tax liability relative to other REITs or subject us to certain excise taxes.
A TRS may hold assets and earn income, including income earned from the performance of correctional services, that would not be qualifying assets or income if held or earned directly by a REIT. We conduct a significant portion of our business activities through our TRSs. Our TRSs are subject to federal, foreign, state and local income tax on their taxable income, and their after-tax net income generally is available for distribution to us but is not required to be distributed to us. The TRS rules also impose a 100% excise tax on certain transactions between a TRS and its parent REIT that are not conducted on an arm’s-lengtharm's-length basis. In addition, the TRS rules limit the deductibility of interest paid or accrued by a TRS to its parent REIT to ensure that the TRS is subject to an appropriate level of corporate income taxation. We believe our arrangements with our TRSs are on arm’s-lengtharm's-length terms and intend to continue to operate in a manner that allows us to avoid incurring the 100% excise tax described above. There can be no assurance, however, that we will be able to avoid application of the 100% excise tax or the limitations on interest deductions discussed above.
The value of the securities we own in our TRS is limited under the REIT asset tests.
Under the Code, no more than 25% (20% for tax years beginning on or after January 1, 2018) of the value of the gross assets of a REIT may be represented by securities of one or more TRSs. This limitation may affect our ability to increase the size of our TRSs’TRSs' operations and assets, and there can be no assurance that we will be able to comply with the 25%this limitation. If we are unable to comply with the 25%this limitation, we would fail to qualify as a REIT. Furthermore, our significant use of TRSs may cause the market to value shares of our common stock differently than the stock of other REITs, which may not use TRSs as extensively. Although we intend to monitor the value of our investments in TRSs, there can be no assurance that we will be able to comply with the 25% (20% for tax years beginning on or after January 1, 2018) limitation discussed above.
39
We may be limited in our ability to fund distributions using cash generated through our TRSs.
At least 75% of gross income for each taxable year as a REIT must be derived from passive real estate sources and no more than 25% of gross income may consist of dividends from our TRSs and other non-real estate income. This limitation on our ability to receive dividends from our TRSs may affect our ability to fund cash distributions to our stockholders using cash from our TRSs. Moreover, our TRSs are not required to distribute their net income to us, and any income of our TRSs that is not distributed to us will not be subject to the REIT income distribution requirement.
41
REIT ownership limitations may restrict or prevent you from engaging in certain transfers of our common stock.
In order to satisfy the requirements for REIT qualification, no more than 50% in value of all classes or series of our outstanding shares of stock may be owned, actually or constructively, by five or fewer individuals (as defined in the Code to include certain entities) at any time during the last half of each taxable year beginning with our 2014 taxable year. To assist us in satisfying this share ownership requirement, our charter imposes ownership limits on each class and series of our shares of stock. Under applicable constructive ownership rules, any shares of stock owned by certain affiliated owners generally would be added together for purposes of the common stock ownership limits, and any shares of a given class or series of preferred stock owned by certain affiliated owners generally would be added together for purposes of the ownership limit on such class or series.
If anyone transfers shares of our common stock in a manner that would violate the ownership limits, or prevent us from qualifying as a REIT under the federal income tax laws, those shares of common stock instead would be transferred to a trust for the benefit of a charitable beneficiary and will be either redeemed by us or sold to a person whose ownership of the shares will not violate the ownership limit. If this transfer to a trust fails to prevent such a violation or fails to permit our continued qualification as a REIT, then the initial intended transfer would be null and void from the outset. The intended transferee of those shares will be deemed never to have owned the shares. Anyone who acquires shares in violation of the ownership limit or the other restrictions on transfer bears the risk of suffering a financial loss when the shares of common stock are redeemed or sold if the market price of our shares of common stock falls between the date of purchase and the date of redemption or sale.
Complying with REIT requirements may cause us to forego otherwise attractive opportunities or liquidate otherwise attractive investments.
To qualify as a REIT for federal income tax purposes, we must continually satisfy tests concerning, among other things, the sources of our income, the nature and diversification of our assets, the amounts we distribute to our stockholders and the ownership of our common stock. If we fail to comply with one or more of the asset tests at the end of any calendar quarter, we must correct the failure within 30 days after the end of the calendar quarter or qualify for certain statutory relief provisions to avoid losing our REIT qualification and suffering adverse tax consequences. In order to meet these tests, we may be required to forego investments we might otherwise make or to liquidate otherwise attractive investments. Thus, compliance with the REIT requirements may hinder our performance and reduce amounts available for distribution to our stockholders.
40
The tax imposed on REITs engaging in “prohibited transactions”"prohibited transactions" may limit our ability to engage in transactions which would be treated as sales for federal income tax purposes.
A REIT’sREIT's net income from prohibited transactions is subject to a 100% penalty tax. In general, prohibited transactions are sales or other dispositions of property, other than foreclosure property, held primarily for sale to customers in the ordinary course of business. Although we do not intend to hold any properties that would be characterized as held for sale to customers in the ordinary course of our business, unless a sale or disposition qualifies under certain statutory safe harbors, such characterization is a factual determination and no guarantee can be given that the IRS would agree with our characterization of our properties or that we will always be able to make use of the available safe harbors.
42
We have not established a minimum distribution payment level, and we may be unable to generate sufficient cash flows from our operations to make distributions to our stockholders at any time in the future.
We are generally required to distribute to our stockholders at least 90% of our net taxable income (excluding net capital gains) each year to qualify as a REIT under the Code. To the extent we satisfy the 90% distribution requirement but distribute less than 100% of our net taxable income (including net capital gains), we will be subject to federal corporate income tax on our undistributed net taxable income. We intend to distribute at least 100% of our net taxable income (excluding net capital gains). However, our ability to make distributions to our stockholders may be adversely affected by the issues described in the risk factors set forth in this annual report.Annual Report. Subject to satisfying the requirements for REIT qualification, we intend to continue to make regular quarterly distributions to our stockholders. Our Board of Directors has the sole discretion to determine the timing, form and amount of any distributions to our stockholders. Our Board of Directors makes determinations regarding distributions based upon, among other factors, our historical and projected results of operations, financial condition, cash flows and liquidity, satisfaction of the requirements for REIT qualification and other tax considerations, capital expenditure and other expense obligations, debt covenants, contractual prohibitions or other limitations and applicable law and such other matters as our Board of Directors may deem relevant from time to time. Among the factors that could impair our ability to make distributions to our stockholders are:
As a result, itIt is possible that we will not be able to continue to make distributions to our stockholders or that the level of any distributions we do make to our stockholders will achieve a market yield or increase or even be maintained over time, any of which could materially and adversely affect the market price of our shares of common stock. Distributions could be dilutive to our financial results and may constitute a return of capital to our investors, which would have the effect of reducing each shareholder’sstockholder's basis in its shares of common stock. We also could use borrowed funds or proceeds from the sale of assets to fund distributions.
41
Dividends payable by REITs, including us, generally do not qualify for the reduced tax rates available for some dividends.
“"Qualified dividends”dividends" payable to U.S. stockholders that are individuals, trusts and estates generally are subject to tax at preferential rates. Subject to limited exceptions, dividends payable by REITs are not eligible for these reduced rates and are taxable at ordinary income tax rates. The more favorable rates applicable to regular corporate qualified dividends could cause investors who are individuals, trusts and estates to perceive investments in REITs to be relatively less attractive than investments in the stocks of non-REIT corporations that pay dividends, which could adversely affect the value of the shares of REITs, including the shares of our common stock.
Distributions that we make to our stockholders are treated as dividends to the extent of our earnings and profits as determined for federal income tax purposes and are generally taxable to our stockholders as ordinary income. However, our dividends are eligible for the lower rate applicable to “qualified dividends”"qualified dividends" to the extent they are attributable to income that was previously subject to corporate income tax, such as the dividends we receive from our TRSs.TRSs or attributable to the accumulated earnings and profits in connection with acquisitions of C-corporations. Also, a portion of our distributions may be designated by us as long-term capital gains to the extent that they are attributable to capital gain income recognized by us. Our distributions may constitute a return of capital to the extent that they exceed our earnings and profits as determined for federal income tax purposes. A return of capital generally is not taxable, but has the effect of reducing the basis of a shareholder’sstockholder's investment in our shares of common stock. Any such distributions that exceed a shareholder’sstockholder's tax basis in our shares of common stock generally will be taxable as capital gains.
For tax years beginning after December 31, 2017 (but subject to a sunset expiration at the end of 2025), U.S. stockholders that are individuals, trusts and estates generally are allowed a deduction in computing taxable income equal to 20% of any dividends received from REITs (other than any portion that is a capital gain dividend). Depending on the ordinary income tax rate applicable to investors who are individuals, trust and estates, the 20% deduction for REIT dividends may offset (or eliminate) the relatively more favorable tax treatment applicable to regular corporate qualified dividends.
43
We could have potential deferred and contingent tax liabilities from our REIT conversion that could limit, delay or impede future sales of our properties.
Even though we qualify for taxation as a REIT, if we acquire any asset from a corporation which is or has been a C-CorporationC-corporation in a transaction in which the basis of the asset in our hands is less than the fair market value of the asset (including as a result of the REIT conversion), in each case determined at the time we acquired the asset, and we subsequently recognize a gain on the disposition of the asset during the ten-yearfive-year period beginning on the date on which we acquired the asset, then we will be required to pay tax at the highest regular corporate tax rate on this gain to the extent of the excess of (a) the fair market value of the asset over (b) itsour adjusted basis in the asset, in each case determined as of the date on which we acquired the asset. These requirements could limit, delay or impede future sales of our properties. We currently do not expect to sell any asset if the sale would result in the imposition of a material tax liability. We cannot, however, assure you that we will not change our plans in this regard.
We may inherit tax liabilities and attributes in connection with acquisitions.
From time to time we may acquire other corporations or entities and, in connection with such acquisitions, we may succeed to the historic tax attributes and liabilities of such entities. For example, in order to qualify as a REIT, at the end of any taxable year, we must not have any earnings and profits accumulated in a non-REIT year. As a result, if we acquire a C-corporation in certain transactions, we must distribute the corporation's earnings and profits accumulated prior to the acquisition before the end of the taxable year in which we acquire the C-corporation. We also could be required to pay the acquired entity's unpaid taxes even though such liabilities arose prior to the time we acquired the entity. These issues are applicable to Avalon and CMI which were C-corporations prior to our acquisitions of these companies.
Legislative or regulatory action affecting REITs could adversely affect us or our stockholders.
In recent years, numerous legislative, judicial and administrative changes have been made to the federal income tax laws applicable to investments in REITs and similar entities. At any time, the federal income tax laws governing REITs or the administrative interpretations of those laws may be amended. Changes to the tax laws, regulations and administrative interpretations, which may have retroactive application, could adversely affect us and may impact our taxation or that of our stockholders. Accordingly, we cannot assure you that any such change will not significantly affect our ability to qualify for taxation as a REIT or the federal income tax consequences to us of such qualification.
U.S. federal taxreformlegislation could affect REITs generally, the geographic markets in which we operate, our stock and our results of operations, both positively and negatively in ways that are difficult to anticipate.
The U.S. Congress recently passed tax reformlegislation that made significant changes to corporate and individual tax rates and the calculation of taxes, as well as international tax rules for U.S. domestic corporations. In addition, it is uncertain if and to what extent various states will conform to the newly enacted federal tax law. As a REIT, we are generally not required to pay federal taxes otherwise applicable to regular corporations (except for income generated by our TRSs) if we comply with the various tax regulations governing REITs. Stockholders, however, are generally required to pay taxes on REIT dividends. Taxreformlegislation affects the way in which dividends paid on shares of our common stock are taxed and could impact our stock price or how stockholders and potential investors view an investment in REITs generally. In addition, while certain elements of taxreformlegislation may not impact us directly as a REIT, they could impact the geographic markets in which we operate, particularly affecting tenants of our leased property and their corporate tax obligations, if any.
42
44
Other Risks Related to Our Securities
The market price of our equity securities may vary substantially, which may limit our stockholders’stockholders' ability to liquidate their investment.
The trading prices of equity securities issued by REITs have historically been affected by changes in market interest rates. One of the factors that may influence the price of our common stock in public trading markets is the annual yield from distributions on our common stock as compared to yields on other financial instruments. An increase in market interest rates, or a decrease in our distributions to stockholders, may lead prospective purchasers of our shares to demand a higher annual yield, which could reduce the market price of our equity securities.
Other factors that could affect the market price of our equity securities include the following:
The number of shares of our common stock available for future sale could adversely affect the market price of our common stock.
We cannot predict the effect, if any, of future sales of common stock, or the availability of common stock for future sale, on the market price of our common stock. Sales of substantial amounts of common stock (including stock issued under equity compensation plans)plans or stock issued pursuant to our ATM Agreement), or the perception that these sales could occur, may adversely affect prevailing market prices for our common stock.
Future offerings of debt or equity securities ranking senior to our common stock or incurrence of debt (including under our revolvingsenior bank credit facility) may adversely affect the market price of our common stock.
If we decide to issue debt or equity securities in the future ranking senior to our common stock or otherwise incur indebtedness (including under our revolvingsenior bank credit facility), it is possible that these securities or indebtedness will be governed by an indenture or other instrument containing covenants restricting our operating flexibility and limiting our ability to make distributions to our stockholders. Additionally, any convertible or exchangeable securities that we issue in the future may have rights, preferences and privileges, including with respect to distributions, more favorable than those of our common stock and may result in dilution to owners of our common stock. Because our decision to issue debt or equity securities in any future offering or otherwise incur indebtedness will depend on market conditions and other factors beyond our control, we cannot predict or estimate the amount, timing or nature of our future offerings or financings, any of which could reduce the market price of our common stock and dilute the value of our common stock.
43
Our issuance of preferred stock could adversely affect holders of our common stock and discourage a takeover.
Our Board of Directors has the authority to issue up to 50.0 million shares of preferred stock without any action on the part of our stockholders. Our Board of Directors also has the authority, without stockholder approval, to set the terms of any new series of preferred stock that may be issued, including voting rights, dividend rights, liquidation rights and other preferences superior to our common stock. In the event that we issue shares of preferred stock in the future that have preferences superior to our common stock, the rights of the holders of our common stock or the market price of our common stock could be adversely affected. In addition, the ability of our Board of Directors to issue shares of preferred stock without any action on the part of our stockholders may impede a takeover of us and discourage or prevent a transaction favorable to our stockholders.
45
Our charter and bylaws and Maryland law could make it difficult for a third party to acquire our company.
The Maryland General Corporation Law and our charter and bylaws contain provisions that could delay, deter, or prevent a change in control of our company or our management. These provisions could also discourage proxy contests and make it more difficult for our stockholders to elect directors and take other corporate actions. These provisions:
We are also subject to anti-takeover provisions under Maryland law, which could delay or prevent a change of control. Together, these provisions of our charter and bylaws and Maryland law may discourage transactions that otherwise could provide for the payment of a premium over prevailing market prices for our common stock, and also could limit the price that investors are willing to pay in the future for shares of our common stock.
ITEM 1B.UNRESOLVED STAFF COMMENTS.
None.
The properties we owned at December 31, 20142017 are described under Item 1 and in Note 4 of the Notes to the Consolidated Financial Statements contained in this Annual Report, as well as in Schedule III in Part IV toof this Annual Report.
General
The nature of our business results in claims and litigation alleging that we are liable for damages arising from the conduct of our employees or others. In the opinion of management, other than the litigation matter discussed below, there are no pending legal proceedings that would have a material effect on our financial position, results of operations or cash flows. Claims and legal proceedings are, however, subject to inherent uncertainties, and unfavorable decisions and rulings could occur that could have a material adverse impact on our financial position, results of operations or cash flows for the period in which such decisions and rulings occur, or future periods. See "Risk Factors - Risks Related to our Business and Industry - Legal proceedings related to, and adverse developments in our relationship with, our employees could adversely affect or business, financial condition and results of operations."; "—We are subject to legal proceedings associated with owning and managing correctional, detention, and residential reentry facilities."; and "—We are subject to certain stockholder litigation."
Litigation
In a memorandum to the BOP dated August 18, 2016, the DOJ directed that, as each contract with privately operated prisons reaches the end of its term, the BOP should either decline to renew that contract or substantially reduce its scope in a manner consistent with law and the overall decline of the BOP's inmate population. In addition to the decline in the BOP's inmate population, the DOJ memorandum cites purported operational, programming, and cost efficiency factors as reasons for the DOJ directive. On February 21, 2017, the newly appointed Attorney General issued a memorandum rescinding the DOJ's prior directive stating the memorandum changed long-standing policy and practice and impaired the BOP's ability to meet the future needs of the federal correctional system.
46
Following the release of the August 18, 2016 DOJ memorandum, a purported securities class action lawsuit was filed against us and certain of our current and former officers in the United States District Court for the Middle District of Tennessee, or the District Court, captioned Grae v. Corrections Corporation of America et al., Case No. 3:16-cv-02267. The lawsuit is brought on behalf of a putative class of shareholders who purchased or acquired our securities between February 27, 2012 and August 17, 2016. In general, the lawsuit alleges that, during this timeframe, our public statements were false and/or misleading regarding the purported operational, programming, and cost efficiency factors cited in the DOJ memorandum and, as a result, our stock price was artificially inflated. The lawsuit alleges that the publication of the DOJ memorandum on August 18, 2016 revealed the alleged fraud, causing the per share price of our stock to decline, thereby causing harm to the putative class of shareholders.
On May 12, 2017, we submitted a motion to dismiss the plaintiff's complaint in its entirety with prejudice. On December 18, 2017, the District Court entered an order denying our motion to dismiss. We believe the lawsuit is entirely without merit and intend to vigorously defend against it. In addition, we maintain insurance, with certain self-insured retention amounts, to cover the alleged claims which mitigates the risk such litigation would have a material adverse effect on our financial condition, results of operations, or cash flows.
See additional information required under this section is described in Note 15 of the Notes to the Consolidated Financial Statements contained in this Annual Report.
44
None.
47
ITEM 5. | MARKET FOR |
Market Price of and Distributions on Capital Stock
Our common stock is traded on the New York Stock Exchange, or NYSE, under the symbol “CXW.”"CXW." On February 17, 201515, 2018, the last reported sale price of our common stock was $40.11$21.47 per share and there were approximately 3,5003,000 registered holders and approximately 48,00047,000 beneficial holders, respectively, of our common stock.
The following table sets forth, for the fiscal quarters indicated, the range of high and low sales prices of the common stock.
Common Stock
| SALES PRICE |
| ||||||||||||||
| SALES PRICE |
| HIGH |
|
| LOW |
| ||||||||||
| HIGH | LOW | |||||||||||||||
FISCAL YEAR 2014 | ||||||||||||||||
FISCAL YEAR 2017 |
|
|
|
|
|
|
|
| ||||||||
First Quarter | $ | 34.73 | $ | 30.37 |
| $ | 35.33 |
|
| $ | 23.90 |
| ||||
Second Quarter | $ | 33.79 | $ | 30.77 |
| $ | 35.10 |
|
| $ | 27.03 |
| ||||
Third Quarter | $ | 36.09 | $ | 32.05 |
| $ | 29.23 |
|
| $ | 24.16 |
| ||||
Fourth Quarter | $ | 38.60 | $ | 32.74 |
| $ | 27.50 |
|
| $ | 21.41 |
| ||||
| SALES PRICE | ||||||||||||||||
| HIGH | LOW | |||||||||||||||
FISCAL YEAR 2013 | ||||||||||||||||
First Quarter | $ | 39.31 | $ | 36.11 | ||||||||||||
Second Quarter | $ | 41.40 | $ | 32.25 | ||||||||||||
Third Quarter | $ | 35.75 | $ | 31.10 | ||||||||||||
Fourth Quarter | $ | 38.13 | $ | 31.86 | ||||||||||||
|
| SALES PRICE |
| |||||
|
| HIGH |
|
| LOW |
| ||
FISCAL YEAR 2016 |
|
|
|
|
|
|
|
|
First Quarter |
| $ | 32.94 |
|
| $ | 25.81 |
|
Second Quarter |
| $ | 35.05 |
|
| $ | 30.00 |
|
Third Quarter |
| $ | 34.71 |
|
| $ | 13.04 |
|
Fourth Quarter |
| $ | 26.00 |
|
| $ | 12.99 |
|
During 20132016 and 2014, CCA’s2017, CoreCivic's Board of Directors declared the following quarterly dividends on its common stock:
Declaration Date | Record Date | Payable Date | Per Share | |||||
February 22, 2013 | April 3, 2013 | April 15, 2013 | $ | 0.53 | ||||
May 16, 2013 | July 3, 2013 | July 15, 2013 | $ | 0.48 | ||||
August 16, 2013 | October 2, 2013 | October 15, 2013 | $ | 0.48 | ||||
December 12, 2013 | January 2, 2014 | January 15, 2014 | $ | 0.48 | ||||
February 20, 2014 | April 2, 2014 | April 15, 2014 | $ | 0.51 | ||||
May 15, 2014 | July 2, 2014 | July 15, 2014 | $ | 0.51 | ||||
August 14, 2014 | October 2, 2014 | October 15, 2014 | $ | 0.51 | ||||
December 11, 2014 | January 2, 2015 | January 15, 2015 | $ | 0.51 | ||||
In addition, on April 8, 2013, CCA’s Board of Directors declared a special dividend to shareholders of $675.0 million, or approximately $6.66 per share of common stock, in
Declaration Date |
| Record Date |
| Payable Date |
| Per Share |
| |
February 19, 2016 |
| April 1, 2016 |
| April 15, 2016 |
| $ | 0.54 |
|
May 12, 2016 |
| July 1, 2016 |
| July 15, 2016 |
| $ | 0.54 |
|
August 11, 2016 |
| October 3, 2016 |
| October 17, 2016 |
| $ | 0.54 |
|
December 8, 2016 |
| January 3, 2017 |
| January 13, 2017 |
| $ | 0.42 |
|
February 17, 2017 |
| April 3, 2017 |
| April 17, 2017 |
| $ | 0.42 |
|
May 11, 2017 |
| July 3, 2017 |
| July 17, 2017 |
| $ | 0.42 |
|
August 10, 2017 |
| October 2, 2017 |
| October 16, 2017 |
| $ | 0.42 |
|
December 7, 2017 |
| January 2, 2018 |
| January 15, 2018 |
| $ | 0.42 |
|
45
connection with CCA’s previously announced plan to qualify and convert to a REIT for federal income tax purposes effective as of January 1, 2013. The special dividend was paid in satisfaction of requirements that CCA distribute its previously undistributed accumulated earnings and profits attributable to tax periods ending prior to January 1, 2013. CCA paid the special dividend on May 20, 2013 to shareholders of record as of April 19, 2013.
Each CCA shareholder could elect to receive payment of the special dividend either in all cash, all shares of CCA common stock or a combination of cash and CCA common stock, with the total amount of cash payable to shareholders limited to a maximum of 20% of the total value of the special dividend, or $135.0 million. The total amount of cash elected by shareholders exceeded 20% of the total value of the special dividend. As a result, the cash payment was prorated among those shareholders who elected to receive cash, and the remaining portion of the special dividend was paid in shares of CCA common stock. The total number of shares of CCA common stock distributed pursuant to the special dividend was 13.9 million and was determined based on shareholder elections and the average closing price per share of CCA common stock on the New York Stock Exchange for the three trading days after May 9, 2013, or $38.90 per share.
In order to qualify as a REIT, we are required each year to distribute to our stockholders at least 90% of our REIT taxable income (determined without regard to the dividends paid deduction and excluding net capital gains) and we will be subject to tax to the extent our net taxable income (including net capital gains) is not fully distributed. While we intend to continue paying regular quarterly cash dividends at levels expected to fully distribute our annual REIT taxable income, future dividends will be paid at the discretion of our Board of Directors and will depend on our future earnings, our capital requirements, our financial condition, limitations under debt covenants, alternative uses of capital, the annual distribution requirements under the REIT provisions of the Code, and on such other factors as our Board of Directors may consider relevant.
48
Issuer Purchases of Equity Securities
None.
The following selected financial data for the five years ended December 31, 2014,2017, was derived from our consolidated financial statements and the related notes thereto after any applicable reclassification of discontinued operations. This data should be read in conjunction with our audited consolidated financial statements, including the related notes, and “Management’s"Management's Discussion and Analysis of Financial Condition and Results of Operations.”" Our audited consolidated financial statements, including the related notes, as of December 31, 20142017 and 2013,2016, and for the years ended December 31, 2014, 2013,2017, 2016, and 20122015 are included in this Annual Report.
49
46
CORRECTIONS CORPORATION OF AMERICACORECIVIC, INC. AND SUBSIDIARIES
SELECTED HISTORICAL FINANCIAL INFORMATION
(in thousands, except per share data)
| For the Years Ended December 31, |
| For the Years Ended December 31, |
| |||||||||||||||||||||||||||||||||||||
| 2014 | 2013 | 2012 | 2011 | 2010 |
| 2017 |
|
| 2016 |
|
| 2015 |
|
| 2014 |
|
| 2013 |
| |||||||||||||||||||||
STATEMENT OF OPERATIONS: |
|
|
|
|
|
|
|
|
|
|
|
|
|
|
|
|
|
|
|
| ||||||||||||||||||||
Revenues | $ | 1,646,867 | $ | 1,694,297 | $ | 1,723,657 | $ | 1,688,805 | $ | 1,628,217 |
| $ | 1,765,498 |
|
| $ | 1,849,785 |
|
| $ | 1,793,087 |
|
| $ | 1,646,867 |
|
| $ | 1,694,297 |
| ||||||||||
|
|
|
|
| ||||||||||||||||||||||||||||||||||||
Expenses: |
|
|
|
|
|
|
|
|
|
|
|
|
|
|
|
|
|
|
|
| ||||||||||||||||||||
Operating | 1,156,135 | 1,220,351 | 1,217,051 | 1,158,269 | 1,120,094 |
|
| 1,249,537 |
|
|
| 1,275,586 |
|
|
| 1,256,128 |
|
|
| 1,156,135 |
|
|
| 1,220,351 |
| |||||||||||||||
General and administrative | 106,429 | 103,590 | 88,935 | 91,227 | 84,148 |
|
| 107,822 |
|
|
| 107,027 |
|
|
| 103,936 |
|
|
| 106,429 |
|
|
| 103,590 |
| |||||||||||||||
Depreciation and amortization | 113,925 | 112,692 | 113,063 | 107,568 | 103,073 |
|
| 147,129 |
|
|
| 166,746 |
|
|
| 151,514 |
|
|
| 113,925 |
|
|
| 112,692 |
| |||||||||||||||
Restructuring charges |
|
| — |
|
|
| 4,010 |
|
|
| — |
|
|
| — |
|
|
| — |
| ||||||||||||||||||||
Asset impairments | 30,082 | 6,513 | — | — | — |
|
| 614 |
|
|
| — |
|
|
| 955 |
|
|
| 30,082 |
|
|
| 6,513 |
| |||||||||||||||
|
|
|
|
|
|
| 1,505,102 |
|
|
| 1,553,369 |
|
|
| 1,512,533 |
|
|
| 1,406,571 |
|
|
| 1,443,146 |
| ||||||||||||||||
| 1,406,571 | 1,443,146 | 1,419,049 | 1,357,064 | 1,307,315 | ||||||||||||||||||||||||||||||||||||
|
|
|
|
| ||||||||||||||||||||||||||||||||||||
Operating income | 240,296 | 251,151 | 304,608 | 331,741 | 320,902 |
|
| 260,396 |
|
|
| 296,416 |
|
|
| 280,554 |
|
|
| 240,296 |
|
|
| 251,151 |
| |||||||||||||||
|
|
|
|
| ||||||||||||||||||||||||||||||||||||
Other (income) expense: |
|
|
|
|
|
|
|
|
|
|
|
|
|
|
|
|
|
|
|
| ||||||||||||||||||||
Interest expense, net | 39,535 | 45,126 | 58,363 | 72,940 | 71,127 |
|
| 68,535 |
|
|
| 67,755 |
|
|
| 49,696 |
|
|
| 39,535 |
|
|
| 45,126 |
| |||||||||||||||
Expenses associated with debt refinancing transactions | — | 36,528 | 2,099 | — | — |
|
| — |
|
|
| — |
|
|
| 701 |
|
|
| — |
|
|
| 36,528 |
| |||||||||||||||
Other (income) expense | (1,204 | ) | (100 | ) | (333 | ) | 305 | 42 |
|
| (90 | ) |
|
| 489 |
|
|
| (58 | ) |
|
| (1,204 | ) |
|
| (100 | ) | ||||||||||||
|
|
|
|
|
|
| 68,445 |
|
|
| 68,244 |
|
|
| 50,339 |
|
|
| 38,331 |
|
|
| 81,554 |
| ||||||||||||||||
| 38,331 | 81,554 | 60,129 | 73,245 | 71,169 | ||||||||||||||||||||||||||||||||||||
|
|
|
|
| ||||||||||||||||||||||||||||||||||||
Income from continuing operations before income taxes | 201,965 | 169,597 | 244,479 | 258,496 | 249,733 |
|
| 191,951 |
|
|
| 228,172 |
|
|
| 230,215 |
|
|
| 201,965 |
|
|
| 169,597 |
| |||||||||||||||
Income tax (expense) benefit | (6,943 | ) | 134,995 | (87,513 | ) | (96,166 | ) | (93,495 | ) |
|
| (13,911 | ) |
|
| (8,253 | ) |
|
| (8,361 | ) |
|
| (6,943 | ) |
|
| 134,995 |
| |||||||||||
|
|
|
|
| ||||||||||||||||||||||||||||||||||||
Income from continuing operations | 195,022 | 304,592 | 156,966 | 162,330 | 156,238 |
|
| 178,040 |
|
|
| 219,919 |
|
|
| 221,854 |
|
|
| 195,022 |
|
|
| 304,592 |
| |||||||||||||||
(Loss) income from discontinued operations, net of taxes | — | (3,757 | ) | (205 | ) | 180 | 955 | |||||||||||||||||||||||||||||||||
|
|
|
|
| ||||||||||||||||||||||||||||||||||||
Loss from discontinued operations, net of taxes |
|
| — |
|
|
| — |
|
|
| — |
|
|
| — |
|
|
| (3,757 | ) | ||||||||||||||||||||
Net income | $ | 195,022 | $ | 300,835 | $ | 156,761 | $ | 162,510 | $ | 157,193 |
| $ | 178,040 |
|
| $ | 219,919 |
|
| $ | 221,854 |
|
| $ | 195,022 |
|
| $ | 300,835 |
| ||||||||||
|
|
|
|
| ||||||||||||||||||||||||||||||||||||
Basic earnings per share: |
|
|
|
|
|
|
|
|
|
|
|
|
|
|
|
|
|
|
|
| ||||||||||||||||||||
Income from continuing operations | $ | 1.68 | $ | 2.77 | $ | 1.58 | $ | 1.55 | $ | 1.39 |
| $ | 1.51 |
|
| $ | 1.87 |
|
| $ | 1.90 |
|
| $ | 1.68 |
|
| $ | 2.77 |
| ||||||||||
(Loss) income from discontinued operations, net of taxes | — | (0.03 | ) | — | — | 0.01 | ||||||||||||||||||||||||||||||||||
|
|
|
|
| ||||||||||||||||||||||||||||||||||||
Loss from discontinued operations, net of taxes |
|
| — |
|
|
| — |
|
|
| — |
|
|
| — |
|
|
| (0.03 | ) | ||||||||||||||||||||
Net income | $ | 1.68 | $ | 2.74 | $ | 1.58 | $ | 1.55 | $ | 1.40 |
| $ | 1.51 |
|
| $ | 1.87 |
|
| $ | 1.90 |
|
| $ | 1.68 |
|
| $ | 2.74 |
| ||||||||||
|
|
|
|
| ||||||||||||||||||||||||||||||||||||
Diluted earnings per share: |
|
|
|
|
|
|
|
|
|
|
|
|
|
|
|
|
|
|
|
| ||||||||||||||||||||
Income from continuing operations | $ | 1.66 | $ | 2.73 | $ | 1.56 | $ | 1.54 | $ | 1.38 |
| $ | 1.50 |
|
| $ | 1.87 |
|
| $ | 1.88 |
|
| $ | 1.66 |
|
| $ | 2.73 |
| ||||||||||
(Loss) income from discontinued operations, net of taxes | — | (0.03 | ) | — | — | 0.01 | ||||||||||||||||||||||||||||||||||
|
|
|
|
| ||||||||||||||||||||||||||||||||||||
Loss from discontinued operations, net of taxes |
|
| — |
|
|
| — |
|
|
| — |
|
|
| — |
|
|
| (0.03 | ) | ||||||||||||||||||||
Net income | $ | 1.66 | $ | 2.70 | $ | 1.56 | $ | 1.54 | $ | 1.39 |
| $ | 1.50 |
|
| $ | 1.87 |
|
| $ | 1.88 |
|
| $ | 1.66 |
|
| $ | 2.70 |
| ||||||||||
|
|
|
|
| ||||||||||||||||||||||||||||||||||||
Weighted average common shares outstanding: |
|
|
|
|
|
|
|
|
|
|
|
|
|
|
|
|
|
|
|
| ||||||||||||||||||||
Basic | 116,109 | 109,617 | 99,545 | 104,736 | 112,015 |
|
| 118,084 |
|
|
| 117,384 |
|
|
| 116,949 |
|
|
| 116,109 |
|
|
| 109,617 |
| |||||||||||||||
Diluted | 117,312 | 111,250 | 100,623 | 105,535 | 112,977 |
|
| 118,465 |
|
|
| 117,791 |
|
|
| 117,785 |
|
|
| 117,312 |
|
|
| 111,250 |
| |||||||||||||||
| December 31, | ||||||||||||||||||||||||||||||||||||||||
| 2014 | 2013 | 2012 | 2011 | 2010 | ||||||||||||||||||||||||||||||||||||
BALANCE SHEET DATA: | ||||||||||||||||||||||||||||||||||||||||
Total assets | $ | 3,127,191 | $ | 3,007,425 | $ | 2,974,742 | $ | 3,019,631 | $ | 2,983,228 | ||||||||||||||||||||||||||||||
Total debt | $ | 1,200,000 | $ | 1,205,000 | $ | 1,111,545 | $ | 1,245,014 | $ | 1,156,568 | ||||||||||||||||||||||||||||||
Total liabilities | $ | 1,645,691 | $ | 1,504,918 | $ | 1,453,122 | $ | 1,611,609 | $ | 1,512,357 | ||||||||||||||||||||||||||||||
Stockholders’ equity | $ | 1,481,500 | $ | 1,502,507 | $ | 1,521,620 | $ | 1,408,022 | $ | 1,470,871 | ||||||||||||||||||||||||||||||
|
| December 31, |
| |||||||||||||||||
|
| 2017 |
|
| 2016 |
|
| 2015 |
|
| 2014 |
|
| 2013 |
| |||||
BALANCE SHEET DATA: |
|
|
|
|
|
|
|
|
|
|
|
|
|
|
|
|
|
|
|
|
Total assets |
| $ | 3,272,398 |
|
| $ | 3,271,604 |
|
| $ | 3,356,018 |
|
| $ | 3,117,646 |
|
| $ | 2,996,427 |
|
Total debt |
| $ | 1,447,187 |
|
| $ | 1,445,169 |
|
| $ | 1,452,077 |
|
| $ | 1,190,455 |
|
| $ | 1,194,002 |
|
Total liabilities |
| $ | 1,820,790 |
|
| $ | 1,812,641 |
|
| $ | 1,893,270 |
|
| $ | 1,636,146 |
|
| $ | 1,493,920 |
|
Stockholders' equity |
| $ | 1,451,608 |
|
| $ | 1,458,963 |
|
| $ | 1,462,748 |
|
| $ | 1,481,500 |
|
| $ | 1,502,507 |
|
47
50
ITEM 7. | MANAGEMENT'S DISCUSSION AND ANALYSIS OF FINANCIAL CONDITION AND RESULTS OF OPERATIONS. |
The following discussion should be read in conjunction with the consolidated financial statements and notes thereto appearing elsewhere in this report.Annual Report on Form 10-K. In this report, we use the term, the "Company," "CoreCivic," "we," "us," and "our" to refer to CoreCivic, Inc. and its subsidiaries unless context indicates otherwise. This discussion contains forward-looking statements that involve risks and uncertainties. Our actual results may differ materially from those anticipated in these forward-looking statements as a result of certain factors, including, but not limited to, those described under “Risk Factors”Item 1A, "Risk Factors" and included in other portions of this report.
We are a diversified government solutions company with the scale and experience needed to solve tough government challenges in flexible, cost-effective ways. Through three business offerings, CoreCivic Safety, CoreCivic Properties, and CoreCivic Community, we provide a broad range of solutions to government partners that serve the public good through corrections and detention management, government real estate solutions, and a growing network of residential reentry centers to help address America's recidivism crisis. We have been a flexible and dependable partner for government for more than 30 years. Our employees are driven by a deep sense of service, high standards of professionalism and a responsibility to help government better the public good.
As of December 31, 2014,2017, we owned or controlled 52and managed 70 correctional, detention, and detentionresidential reentry facilities, and managed an additional 12seven correctional and detention facilities owned by our government partners, with a total design capacity of approximately 84,50078,000 beds in 19 statesstates. In addition, as of December 31, 2017, we owned 12 properties leased to third parties and the District of Columbia.used by government agencies, totaling 1.1 million square feet in five states. We are one of the nation’snation's largest ownerowners of privatizedpartnership correctional, detention, and detentionresidential reentry facilities and one of the largest prison operators in the United States. We also believe we are the largest private owner of real estate used by government agencies. Our size and experience provide us with significant credibility with our current and prospective customers, and enable us to generate economies of scale in purchasing power for food services, health care and other supplies and services we offer to our government partners.
We are structured as a Real Estate Investment Trust,real estate investment trust, or REIT. We began operating as a REIT for federal income tax purposes effective January 1, 2013. See “Item 1. BusinessItem 1, "Business – Overview”Overview" for a description of how we are organized and how we provide correctional services and conduct other operations through taxable REIT subsidiaries, or TRSs, in order to comply with REIT qualification requirements. We believe that operating as a REIT maximizes our ability to create stockholder value given the nature of our assets, helps lower our cost of capital, draws a larger base of potential stockholders, provides greater flexibility to pursue growth opportunities, and creates a more efficient operating structure.
Our Business
We are compensated for providing correctional bed space and operating and managing prisonscapacity and correctional, facilitiesdetention, and residential reentry services at an inmatea per diem rate based upon actual or minimum guaranteed occupancy levels. The expansion of the prison population in the United States has led to overcrowding in the federal and state prison systems, providing us with opportunities for growth. Federal, state, and local governments are constantly under budgetary constraints putting pressure on governments to control correctional budgets, including per diem rates our customers pay to us as well as pressure on appropriations for building new prison capacity.
Our federal revenue declined from 2016 to 2017 primarily as a result of an amendment to the inter-governmental service agreement, or IGSA, associated with our South Texas Family Residential Center, which became effective in the fourth quarter of 2016, as further described hereafter. In addition, populations in federal facilities, particularly within the Federal Bureau of Prisons, or the BOP, system nationwide, have declined over the past three years. Inmate populations in the BOP system declined due, in part, to the retroactive application of changes to sentencing guidelines applicable to certain federal drug trafficking offenses.
Despite this decline, we continue to believe utilization of private sector bed capacity and management services provides our federal partners have continuedwith flexible and cost-effective solutions essential to manage their budgetsmissions. For example, in November 2016, we announced that the BOP exercised a two-year renewal option at our 1,978-bed McRae
51
Correctional Facility. The amended agreement commenced on December 1, 2016, and provides for caring for up to 1,724 federal inmates with a fixed monthly payment for 1,633 beds, compared to our previous contract which contained a fixed payment for 1,780 beds. In addition, in July 2017, the BOP exercised a two-year renewal option at our 2,232-bed Adams County Correctional Center. For the year ended December 31, 2017, we generated 5% of our total revenue through the remaining contracts with the BOP at these two correctional facilities.
Further, we believe our ability to provide flexible solutions and fulfill emergent needs of the U.S Immigration and Enforcement, or ICE, would be very difficult and costly to replicate in the public sector, demonstrated by the contract with ICE at our 2,400-bed South Texas Family Residential Center, which was amended and extended in October 2016. The October 2016 amendment extended the term of the contract through September 2021 and can be further extended by bi-lateral modification. In addition, in December 2016, we announced a new award to provide detention capacity to ICE at our 2,016-bed Northeast Ohio Correctional Center, and in April 2017, we announced a new contract award to provide up to 996 beds to the state of Ohio at this same facility. We previously housed inmates from the BOP at the Northeast Ohio facility under Continuing Resolutions which has created short-term challenges and lead to reductionsa contract that expired in inmate populations. May 2015. We believe these contracts provide further examples of the marketability of our real estate assets across multiple government customers.
Several of our state partners are projecting modest increases in tax revenues and improvements in their budgets which has resulted in our ability tohelped us secure recent per diem increases at certain facilities. However, allFurther, several of our existing state partners, have balanced budget requirements, which may force them to further reduce their expenses if their tax revenues, which typically lag the overall economy, do not meet their expectations. Additionally, actions to manage their expenses could include reductionsas well as prospective state partners, are experiencing growth in inmate populations.populations and overcrowded conditions. Although we can provide no assurance that we will enter into any new contracts, we believe we are well positioned to provide them with needed bed capacity, as well as the programming and reentry services they are seeking.
We believe the long-term growth opportunities of our business remain very attractive as certain statesgovernments consider their emergent needs, as well as the efficiency savings, and offender programming opportunities we can provide.provide, as flexible solutions to satisfy our partners' needs. Further, we expect our partners to continue to face challenges in maintaining old facilities, and developing new facilities, and expanding current facilities for additional capacity, which could result in future demand for the solutions we provide.
48
Governments continue to experience many significant spending demands which have constrained correctional budgets limiting their ability to expand existing facilities or construct new facilities. We believe the outsourcing of prisoncorrections and detention management services to private operators allows governments to manage increasing inmate populations while simultaneously controlling correctional costs and improving correctional services.costs. We believe our customers discover that partnering with private operators to provide residential services to their offenders introduces competition to their prisoncorrectional system, resulting in improvements to the quality and cost of corrections services throughout their correctional system. Further, the use of facilities owned and managed by private operators allows governments to expand correctional capacity without incurring large capital commitments and allows them to avoid long-term pension obligations for their employees.
We also believe that having beds immediately available to our partners provides us with a distinct competitive advantage when bidding on new contracts. While we have been successful in winning contract awards to provide management services for facilities we do not own, and will continue to pursue such management contracts selectively, weWe believe the most significant opportunities for growth are in providing our government partners with available beds within facilities we currently own or that we will develop. We also believe that owning the facilities in which we provide management services enables us to more rapidly replace business lost compared with managed-only facilities, since we can offer the same beds to new and existing customers and, with customer consent, may have more flexibility in moving our existing inmate populations to facilities with available capacity. Our management contracts generally provide our customers with the right to terminate our management contracts at any time without cause.
We have staff throughout the organizationare actively engaged in marketing our available capacity to existing and prospective customers. Historically, we have been successful in substantially filling our inventory of available beds and the beds that we have constructed. Filling these available beds wouldcould provide substantial growth in revenues, cash flow, and earnings per share. However, we can provide no assurance that we will be able to fill our available beds. We expect the Commonwealth of Kentucky to utilize a previously idled facility containing 816 beds beginning in the second quarter of 2018 pursuant to a new management contract we executed in November 2017.
52
The demand for prison capacity in the short-term has been affected by the budget challenges many of our government partners currently face. As a result, certain government partners have reduced the number of inmates housed in our facilities by consolidating inmate populations within their jail system, placing inmates on early parole, and/or modifying criminal laws and sentencing practices. At the same time, these challenges impede our customers’customers' ability to construct new prison beds of their own or update older facilities, which we believe could result in further need for private sector prison capacity solutions in the long-term. We intend to continue to pursue build-to-suit opportunities like our 2,552-bed Trousdale Turner Correctional Center under construction in Trousdale County, Tennessee, and alternative solutions likeOver the recently announced 2,400-bed South Texas Family Residential Center whereby we identified a site and lessor to provide residential housing and administrative buildings for the U.S. Immigration and Customs Enforcement, or ICE. In the long-term, however, we would like to see continued and meaningful utilization of our available capacity and better visibility from our customers before we add any additionaldevelop new prison capacity on a speculative basis. We will, however, respond to customer demand and may develop or expand correctional and detention facilities when we believe potential long-term returns justify the capital deployment.We expect to continue to pursue investment opportunities in residential reentry centers and are in various stages of due diligence to complete additional acquisitions. The transactions that have not yet closed will also be subject to various customary closing conditions, and we can provide no assurance that any such transactions will ultimately be completed. We are also pursuing investment opportunities in other real estate assets with a bias toward those used to provide mission-critical governmental services, as well as other businesses that expand the range of solutions we provide to government partners which will further diversify our cash flows.
We also remain steadfast in our efforts to contain costs. Approximately 62%60% of our operating expenses consist of salaries and benefits. The turnover rate for correctional officers for our company, and for the corrections industry in general, remains high.high. We remainare making investments in systems and processes intended to help manage our workforce more efficiently and effectively, especially with respect to overtime and costs of turnover. We are also focused on workers’workers' compensation and medical benefits costs for our employees due to continued rising healthcare costs throughout the country and the uncertainty of the impact of the Patient
49
Protection and Affordable Care Act on future healthcare costs.country. Reducing these staffing costs requires a long-term strategy to control such costs, and we continue to dedicate resources to enhance our benefits, provide specialized training and career development opportunities to our staff and attract and retain quality personnel. Through ongoing company-wide initiatives, we continue to focus on efforts to contain costs and improve operating efficiencies, ensuring continuous delivery of quality services over the long-term.efficiencies.
Through the combination of our initiatives to (i) increase our revenues by taking advantageincreasing the utilization of our available beds, as well as delivering(ii) deliver new bed capacity through new facility construction and expansion opportunities, (iii) invest in real estate-only solutions, (iv) acquire community corrections facilities, and our strategies to(v) contain our operating expenses, we believe we will be able to maintain our competitive advantage and continue to improvediversify the qualityrange of services we provide to our customers at an economicalattractive price, thereby producing value tofor our stockholders.
The consolidated financial statements are prepared in conformity with accounting principles generally accepted in the United States. As such, we are required to make certain estimates, judgments and assumptions that we believe are reasonable based upon the information available. These estimates and assumptions affect the reported amounts of assets and liabilities at the date of the consolidated financial statements and the reported amounts of revenue and expenses during the reporting period. A summary of our significant accounting policies is described in Note 2 of the Notes to our audited financial statements.the Consolidated Financial Statements contained in this Annual Report. The significant accounting policies and estimates which we believe are the most critical to aid in fully understanding and evaluating our reported financial results include the following:
53
Asset impairments. The primary risk we face for asset impairment charges, excluding goodwill, is associated with correctional facilities we own. As of December 31, 2014,2017, we had $2.7$2.8 billion in property and equipment, including $119.3$242.1 million in long-lived assets, excluding equipment, at fiveeight idled core correctional facilities. We consider our core facilities to be those that were designed for adult secure correctional purposes. The impairment analyses we performed for each of these facilities excluded the net book value of equipment, as a substantial portion of the equipment is easily transferrable to other company-owned facilities without significant cost. The carrying values of the fiveeight idled core facilities as of December 31, 20142017 were as follows (in thousands):
Prairie Correctional Facility | $ | 18,748 |
| $ | 16,118 |
| ||
Huerfano County Correctional Center | 19,033 |
|
| 16,980 |
| |||
Diamondback Correctional Facility | 44,480 |
|
| 41,370 |
| |||
Otter Creek Correctional Center | 24,089 | |||||||
Southeast Kentucky Correctional Facility |
|
| 21,864 |
| ||||
Marion Adjustment Center | 12,978 |
|
| 12,058 |
| |||
Kit Carson Correctional Center |
|
| 57,095 |
| ||||
Eden Detention Center |
|
| 39,707 |
| ||||
Torrance County Detention Facility |
|
| 36,882 |
| ||||
|
| $ | 242,074 |
| ||||
| $ | 119,328 | |||||||
| ||||||||
We also have threetwo idled non-core facilities containing 440 beds with carrying values amounting to $1.3an aggregate net book value of $4.0 million. We incurred approximately $10.8 million, as of December 31, 2014. We consider$8.1 million, and $7.2 million in operating expenses at the Shelby Training Center, Queensgate Correctional Facility, and Mineral Wells Pre-Parole Transfer Facility to be non-core because they were designed for uses other than for adult secure correctional purposes. From the date each facility became idle, the eight idled facilities incurred combined operating expenses of approximately $7.9 million, $6.4 million, and $6.0 million for the years ended December 31, 2014, 2013,2017, 2016, and 2012,2015, respectively. The 2014 and 2013 amounts exclude expenses incurred in connection with the activation of the Diamondback Correctional Facility which began in the third quarter of 2013 and continued until near the end of the second quarter of 2014, as further described hereafter.
50
We evaluate the recoverability of the carrying values of our long-lived assets, other than goodwill, when events suggest that an impairment may have occurred. Such events primarily include, but are not limited to, the termination of a management contract or a significant decrease in inmateoffender populations within a correctional facility we own or manage.own. Accordingly, we tested each of the aforementioned eight currently idled facilities for impairment when we were notified by the respective customers that they would no longer be utilizing such facility.
We re-perform the impairment analyses on an annual basis for each of the idle facilities and evaluate on a quarterly basis market developments for the potential utilization of each of these facilities in order to identify events that may cause us to reconsider our most recent assumptions. Such events could include negotiations with a prospective customer for the utilization of an idle facility at terms significantly less favorable than those used in our most recent impairment analysis, or changes in legislation surrounding a particular facility that could impact our ability to housecare for certain types of inmatesoffenders at such facility, or a demolition or substantial renovation of a facility. Further, a substantial increase in the number of available beds at other facilities we own could lead to a deterioration in market conditions and cash flows that we might be able to obtain under a new management contract at our idle facilities. We have historically secured contracts with customers at existing facilities that were already operational, allowing us to move the existing population to other idle facilities. Although they are not frequently received, an unsolicited offer to purchase any of our idle facilities at amounts that are less than the carrying value could also cause us to reconsider the assumptions used in our most recent impairment analysis.
In the fourth quarter of 2014, we made the decision to actively pursue the sale of the Queensgate Correctional Facility, idle since 2009, and the Mineral Wells Pre-Parole Transfer Facility, idle since 2013. We acquired the Queensgate and Mineral Wells facilities in 1998 and 1995, respectively, in connection with separate business combination transactions. We reviewed comparable sales data and concluded that either the exit value in the principle market or comparable sales prices for similar properties in the respective geographical areas represented the fair value of these non-core assets. We determined the principle market for these non-core assets will be buyers who intend to use the assets for purposes other than correctional facilities. The aggregate net book value of these facilities prior to the evaluation for impairment was $28.8 million and, as a result of the impairment indicator resulting from the potential sale of the facilities, we recorded non-cash impairments totaling $27.8 million during the fourth quarter of 2014 to write down the book values of the Queensgate and Mineral Wells facilities to the estimated fair values.
In the third quarter of 2014, we entered into a purchase and sale agreement with a third party to sell our idled Houston Educational Facility in Houston, Texas for $4.5 million. The Houston Educational Facility was another non-core asset that was previously leased to a charter school operator. We closed on the sale during the fourth quarter of 2014. The net book value of this facility prior to the evaluation for impairment was $6.4 million and, as a result of the impairment indicator resulting from the potential sale of the facility, we recorded a non-cash impairment of $2.2 million during the second quarter of 2014 to write-down the book value of the facility to the estimated fair value. The potential sale price was used as a proxy for the fair value of the facility during the second quarter of 2014 to evaluate and record the impairment.
In performing our annual impairment analyses, the estimates of recoverability are initially based on projected undiscounted cash flows that are comparable to historical cash flows from
51
management contracts at similar facilities to the idled facilities and sensitivity analyses that consider reductions to such cash flows. Our sensitivity analyses included reductions in projected cash flows by as much as half of the historical cash flows generated by the respective facility as well as prolonged periods of vacancies. In all cases, the projected undiscounted cash flows in our analyses as of December 31, 2014,2017, exceeded the carrying amounts of each facility by material amounts.facility.
Our impairment evaluations also take into consideration our historical experience in securing new management contracts to utilize facilities that had been previously idled for substantial periods comparable to or in excess of the periods that our currently idle facilities have been idle.time. Such previously idled facilities are currently being operated under contracts that continue to generate cash flows resulting in the recoverability of the net book value of the previously idled facilities by substantialmaterial amounts. Due to a variety of factors, the lead time to negotiate contracts with our federal and state partners to utilize idle bed capacity is generally lengthy and has historically resulted in periods of idleness similar to the ones we are currently experiencing at our idle facilities.lengthy. As a result of our analyses,,and with the exception of the impairment charges taken on our non-core assets, we determined each of these assetsthe idled facilities to have recoverable values in excess of the corresponding carrying values. However, we can provide no assurance that we will be able to secure agreements to utilize our idle facilities, or that we will not incur impairment charges in the future.
54
By their nature, these estimates contain uncertainties with respect to the extent and timing of the respective cash flows due to potential delays or material changes to historical terms and conditions in contracts with prospective customers that could impact the estimate of cash flows. Notwithstanding the effects the recent economic downturn has had on our customers’customers' fluctuating demand for prison beds in the short termbed capacity which has led to our decision to idle certain facilities, we believe the long-term trends favor an increase in the utilization of our correctional facilities and management services. This belief is based on our experience in operating in difficult economic environments and in working with governmental agencies faced with significant budgetary challenges, which is a primary contributing factor to the lack of appropriated funding since 2009 to build new bed capacity by the federal and state governments with which we partner.
On April 30, 2017, the contract with the BOP at our 1,422-bed Eden Detention Center expired and was not renewed. We idled the Eden facility following the transfer of the offender population, and have begun to market the facility. We can provide no assurance that we will be successful in securing a replacement contract. We performed an impairment analysis of the Eden facility, which had a net carrying value of $39.7 million as of December 31, 2017, and concluded that this asset has a recoverable value in excess of the carrying value.
As a result of declines in federal populations at our 910-bed Torrance County Detention Facility and 1,129-bed Cibola County Corrections Center, during the third quarter of 2017, we made the decision to consolidate offender populations into our Cibola facility in order to take advantage of efficiencies gained by consolidating populations into one facility. We idled the Torrance facility in the fourth quarter of 2017 following the transfer of the offender population, and have begun to market the facility to other potential customers. We can provide no assurance that we will be successful in securing a replacement contract. We performed an impairment analysis of the Torrance facility, which had a net carrying value of $36.9 million as of December 31, 2017, and concluded that this asset has a recoverable value in excess of the carrying value.
On November 16, 2017, we announced that we had entered into a new contract with the Commonwealth of Kentucky Department of Corrections to house medium and close-security offenders at our previously idled 816-bed Lee Adjustment Center in Beattyville, Kentucky. The new management contract commenced on November 19, 2017, and has an initial term expiring June 30, 2019, with two additional one-year extension options. We expect to begin receiving offender populations under the new contract at the Lee facility toward the end of the first quarter of 2018, following a 120-day period to staff and prepare the facility to care for the offender population. The Lee facility had a net carrying value of $10.4 million as of December 31, 2017, and had previously been idle since 2015.
Goodwill impairments. As of December 31, 2017, we had $40.9 million of goodwill, established in connection with multiple business combination transactions. We evaluate the recoverability of the carrying value of goodwill annually, in connection with our annual budgeting process, and whenever circumstances indicate the carrying value of goodwill may not be recoverable. Under the provisions of Accounting Standards Codification 350, "Intangibles-Goodwill and Other," or ASC 350, we perform a qualitative assessment that may allow us to skip the annual two-step impairment test. Under ASC 350, we have the option to first assess qualitative factors to determine whether the existence of events or circumstances leads to a determination that it is more likely than not that the fair value of a reporting unit is less than its carrying amount. If, after assessing the totality of events or circumstances, an entity determines it is not more likely than not that the fair value of a reporting unit is less than its carrying amount, then performing the two-step impairment test is unnecessary. If the two-step impairment test is required, we determine the fair value of a reporting unit using a combination of various common valuation techniques, including market multiples and discounted cash flows. By their nature, valuation techniques are subject to considerable judgment and require estimates of future cash flows as well as other factors, which are often difficult to predict. Estimated fair values could change if there are changes in our capital structure, cost of debt, interest rates, capital expenditure levels, operating cash flows, or market capitalization. Accordingly, we may incur goodwill impairment charges in the future.
Revenue Recognition – Multiple-Element Arrangement.In September 2014, we agreed under an expansion of an existing inter-governmental service agreement, or IGSA between the city of Eloy, Arizona and ICE to provide residential space and services at our newly activated South Texas Family Residential Center. The amended IGSA qualifies as a multiple-element arrangement under the guidance in Accounting Standards Codification 605, "Revenue Recognition," or ASC 605, “Revenue Recognition”.605. We evaluate each deliverable in an arrangement to determine whether it represents a separate unit of accounting. A deliverable constitutes a separate unit of accounting when it has standalone value to the customer. ASC 605 requires revenue to be allocated to each unit of accounting based on a selling price hierarchy. The selling price for a deliverable is based on its vendor specific objective evidence, or VSOE, of selling price, if available, third party evidence, or TPE, if VSOE of selling price is not available, or estimated selling price, or ESP, if neither VSOE of selling price nor TPE is available. We establish VSOE of selling price using the price charged for a deliverable when sold separately. We establish TPE of selling price by evaluating similar products or services in standalone sales to similarly situated customers. We establish ESP based on management judgment considering internal factors such as margin objectives, pricing practices and controls, and market conditions. In arrangements with multiple elements, we allocate the transaction price to the individual units of accounting at inception of the arrangement based on their relative selling price. The allocation of revenue to each element requires considerable judgment and estimations which could change in the future. However, whileIn October 2016, we entered into an amended IGSA that extended the term of the contract through September 2021.
55
As a change inresult of this amendment, the deferred revenue allocation could lead to timing differences inassociated with the period in which revenue is recognized, total revenuemultiple elements will be recognized over future periods based on the lifedelivery of future services. If the IGSA were to be further amended or terminated before the expiration of the IGSA will not change.
52
Self-funded insurance reserves.reserves. As of December 31, 20142017 and 2013,2016, we had $32.0$32.8 million and $33.8$29.8 million, respectively, in accrued liabilities for employee health, workers’workers' compensation, and automobile insurance claims. We are significantly self-insured for employee health, workers’workers' compensation, and automobile liability insurance claims. As such, our insurance expense is largely dependent on claims experience and our ability to control our claims. We have consistently accrued the estimated liability for employee health insurance claims based on our history of claims experience and the estimated time lag between the incident date and the date we pay the claims. We have accrued the estimated liability for workers’workers' compensation claims based on an actuarial valuation of the outstanding liabilities, discounted to the net present value of the outstanding liabilities, using a combination of actuarial methods used to project ultimate losses, and our automobile insurance claims based on estimated development factors on claims incurred. The liability for employee health, workers’workers' compensation, and automobile insurance includes estimates for both claims incurred and for claims incurred but not reported. These estimates could change in the future. It is possible that future cash flows and results of operations could be materially affected by changes in our assumptions, new developments, or by the effectiveness of our strategies.
Legal reserves. As of December 31, 20142017 and 2013,2016, we had $4.3$7.8 million and $6.2$9.3 million, respectively, in accrued liabilities under the provisions of Accounting Standards Codification Subtopic 450-20, "Loss Contingencies," or ASC 450, related to certain claims and legal proceedings in which we are involved. We have accrued our best estimate of the probable costs for the resolution of these claims based on a range of potential outcomes.and legal proceedings. In addition, we are subject to current and potential future claims and legal proceedings for which little or no accrual has been reflected because our current assessment of the potential exposure is nominal. These estimates have been developed in consultation with our General Counsel’sCounsel's office and, as appropriate, outside counsel handling these matters, and are based upon an analysis of potential results, assuming a combination of litigation and settlement strategies. It is possible that future cash flows and results of operations could be materially affected by changes in our assumptions, new developments, or by the effectiveness of our litigation and settlement strategies.
56
53
Our results of operations are impacted by the number of facilities we owned and managed, the number of facilities we managed but did not own, the number of facilities we leased to other operators, and the facilities we owned that were not in operation. The following table sets forth the changes in the number of facilities operated for the years ended December 31, 2014, 2013,2017, 2016, and 2012.2015.
Effective Date | Owned and Managed | Managed Only | Leased | Total | ||||||||||||||
Facilities as of December 31, 2011 | 46 | 21 | 2 | 69 | ||||||||||||||
Termination of the management contract for the Delta Correctional Facility | January 2012 | — | (1 | ) | — | (1 | ) | |||||||||||
Activation of the Jenkins Correctional Center | March 2012 | 1 | — | — | 1 | |||||||||||||
|
|
|
|
|
|
|
| |||||||||||
Facilities as of December 31, 2012 | 47 | 20 | 2 | 69 | ||||||||||||||
|
|
|
|
|
|
|
| |||||||||||
Reclassification of Elizabeth Detention Center as owned and managed from managed only | January 2013 | 1 | (1 | ) | — | — | ||||||||||||
Reclassification of North Georgia Detention Center as owned and managed from managed only | January 2013 | 1 | (1 | ) | — | — | ||||||||||||
Termination of the management contract for the Wilkinson County Correctional Facility | June 2013 | — | (1 | ) | — | (1 | ) | |||||||||||
Acquisition of CAI | July 2013 | 2 | — | — | 2 | |||||||||||||
Termination of the management contract for the Dawson State Jail | August 2013 | — | (1 | ) | — | (1 | ) | |||||||||||
Assignment of the contract at the Bridgeport Pre-Parole Transfer Facility | September 2013 | (1 | ) | — | 1 | — | ||||||||||||
Lease of the California City Correctional Center | December 2013 | (1 | ) | — | 1 | — | ||||||||||||
|
|
|
|
|
|
|
| |||||||||||
Facilities as of December 31, 2013 | 49 | 16 | 4 | 69 | ||||||||||||||
|
|
|
|
|
|
|
| |||||||||||
Termination of the management contracts for the Bay, Graceville and | January 2014 | — | (3 | ) | — | (3 | ) | |||||||||||
Termination of the contract at the North Georgia Detention Center | February 2014 | (1 | ) | — | — | (1 | ) | |||||||||||
Termination of the management contract for the Idaho Correctional Center | July 2014 | — | (1 | ) | — | (1 | ) | |||||||||||
Sale of the Houston Educational Facility | November 2014 | — | — | (1 | ) | (1 | ) | |||||||||||
Activation of the South Texas Family Residential Center | October 2014 | 1 | — | — | 1 | |||||||||||||
|
|
|
|
|
|
|
| |||||||||||
Facilities as of December 31, 2014 | 49 | 12 | 3 | 64 | ||||||||||||||
|
|
|
|
|
|
|
| |||||||||||
54
|
| Effective Date |
| Owned and Managed |
|
| Managed Only |
|
| Leased |
|
| Total |
| ||||
Facilities as of December 31, 2014 |
|
|
|
| 49 |
|
|
| 12 |
|
|
| 3 |
|
|
| 64 |
|
Impairment of non-core assets |
| January 2015 |
|
| (2 | ) |
|
| — |
|
|
| — |
|
|
| (2 | ) |
Acquisition of four community corrections facilities in Pennsylvania |
| August 2015 |
|
| — |
|
|
| — |
|
|
| 4 |
|
|
| 4 |
|
Termination of the management contract for the Winn Correctional Center |
| September 2015 |
|
| — |
|
|
| (1 | ) |
|
| — |
|
|
| (1 | ) |
Termination of the contract at the Leo Chesney Correctional Center |
| October 2015 |
|
| 1 |
|
|
| — |
|
|
| (1 | ) |
|
| — |
|
Acquisition of eleven community corrections facilities in Oklahoma (3), Texas (7), and Wyoming (1) |
| October 2015 |
|
| 11 |
|
|
| — |
|
|
| — |
|
|
| 11 |
|
Activation of the Trousdale Turner Correctional Center |
| December 2015 |
|
| 1 |
|
|
| — |
|
|
| — |
|
|
| 1 |
|
Facilities as of December 31, 2015 |
|
|
|
| 60 |
|
|
| 11 |
|
|
| 6 |
|
|
| 77 |
|
Acquisition of seven community corrections facilities in Colorado |
| April 2016 |
|
| 7 |
|
|
| — |
|
|
| — |
|
|
| 7 |
|
Lease of the North Fork Correctional Facility |
| May 2016 |
|
| (1 | ) |
|
| — |
|
|
| 1 |
|
|
| — |
|
Acquisition of the Long Beach Community Corrections Center in California |
| June 2016 |
|
| — |
|
|
| — |
|
|
| 1 |
|
|
| 1 |
|
Facilities as of December 31, 2016 |
|
|
|
| 66 |
|
|
| 11 |
|
|
| 8 |
|
|
| 85 |
|
Acquisition of the Arapahoe Community Treatment Center in Colorado |
| January 2017 |
|
| 1 |
|
|
| — |
|
|
| — |
|
|
| 1 |
|
Expiration of the contract at the D.C. Correctional Treatment Facility in the District of Columbia |
| January 2017 |
|
| (1 | ) |
|
| — |
|
|
| — |
|
|
| (1 | ) |
Acquisition of the Stockton Female Community Corrections Facility in California |
| February 2017 |
|
| — |
|
|
| — |
|
|
| 1 |
|
|
| 1 |
|
Acquisition of the Oklahoma City Transitional Center in Oklahoma |
| June 2017 |
|
| 1 |
|
|
| — |
|
|
| — |
|
|
| 1 |
|
Combination of two existing facilities in Arizona into one complex |
| June 2017 |
|
| (1 | ) |
|
| — |
|
|
| — |
|
|
| (1 | ) |
Expiration of the contract at the Bartlett State Jail |
| June 2017 |
|
| — |
|
|
| (1 | ) |
|
| — |
|
|
| (1 | ) |
Termination of the lease at the Bridgeport Pre-Parole Transfer Facility |
| June 2017 |
|
| — |
|
|
| — |
|
|
| (1 | ) |
|
| (1 | ) |
Acquisition of the Oracle Transitional Center in Arizona |
| August 2017 |
|
| 1 |
|
|
| — |
|
|
| — |
|
|
| 1 |
|
Expiration of the contracts at three managed-only facilities in Texas |
| August 2017 |
|
| — |
|
|
| (3 | ) |
|
| — |
|
|
| (3 | ) |
Acquisition of a portfolio of leased properties |
| September 2017 |
|
| — |
|
|
| — |
|
|
| 4 |
|
|
| 4 |
|
Acquisition of three community corrections facilities in Colorado |
| November 2017 |
|
| 3 |
|
|
| — |
|
|
| — |
|
|
| 3 |
|
Facilities as of December 31, 2017 |
|
|
|
| 70 |
|
|
| 7 |
|
|
| 12 |
|
|
| 89 |
|
Year Ended December 31, 20142017 Compared to the Year Ended December 31, 20132016
During the year ended December 31, 2014,2017, we generated net income of $195.0$178.0 million, or $1.66$1.50 per diluted share, compared with net income of $300.8$219.9 million, or $2.70$1.87 per diluted share, for the previous year. Net income was negativelyOur financial results were impacted during 2014 by several non-routine transactions, including the aforementioned $30.0 millionrenegotiation of asset impairments, net of taxes, or $0.26 per diluted share,a contract at the Houston Educational Facility, Queensgate Correctional Facility, and Mineral Wells Pre-Parole Transfer Facility. When compared to 2013, per share results during 2014 were also negatively impacted bySouth Texas Family Residential Center in the issuance of 13.9 million shares of common stock in connection with the payment of a special dividend on May 20, 2013.
Net income was favorably impacted during 2013 by the income tax benefit of $137.7 million recorded during the firstfourth quarter of 2013, or $1.24 per diluted share, due to the revaluation of certain deferred tax assets and liabilities and other income taxes associated with the REIT conversion effective January 1, 2013. In addition, results for 2013 were favorably impacted by a tax benefit of $4.9 million, or $0.04 per share, due to certain tax strategies implemented during the second quarter of 20132016 that resulted in a further reductiondecrease in income taxes. Theserevenue of $96.7 million at this facility in 2017 compared with 2016, income tax benefits during 2013 were offset by our decision to provide bonuses totaling $5.0charges of $4.5 million resulting from the Tax Cuts and Jobs Act, or $0.04 per share, to non-management staffthe TCJA, enacted in lieuthe fourth quarter of merit increases in 2013. Net income for 2013 was negatively impacted due to several non-routine items including $43.52017, and restructuring charges of $4.0 million net of taxes, or $0.39 per diluted share for expenses associated with debt refinancing transactions, the REIT conversion, and with the acquisition of Correctional Alternatives, Inc., or CAI, in the third quarter of 2013, as further2016. Each of these factors is described more fully hereafter. Net income was also negatively impacted during 2013 by asset impairments associated with contract terminations of $6.7 million, net of taxes, or $0.06 per diluted share.
Facility Operations
A key performance indicator we use to measure the revenue and expenses associated with the operation of the facilities we own or manage is expressed in terms of a compensated man-day, which represents the revenue we generate and expenses we incur for one offender for one calendar day. Revenue and expenses per compensated man-day are computed by dividing facility revenue and expenses by the total number of compensated man-days during the period. A compensated man-day represents a calendar day for which we are paid for the occupancy of an offender. We believe the measurement is useful because we are compensated for operating and managing facilities at an offender per-diem rate based upon actual or minimum guaranteed occupancy levels. We also measure our ability to contain costs on a per-compensated man-day basis, which is largely dependent upon the number of offenders we accommodate. Further, per compensated man-day measurements are also used to estimate our potential profitability based on certain occupancy levels relative to design capacity. Revenue and expenses per compensated man-day for all of the operating facilities placed into
55
service that we owned or managed, exclusive of those discontinued (see further discussion below regarding discontinued operations) or held for lease by third parties, were as follows for the years ended December 31, 20142017 and 2013:2016:
| For the Years Ended December 31, |
| For the Years Ended December 31, |
| |||||||||||||
| 2014 | 2013 |
| 2017 |
|
| 2016 |
| |||||||||
Revenue per compensated man-day | $ | 63.54 | $ | 60.57 |
| $ | 73.14 |
|
| $ | 74.77 |
| ||||
Operating expenses per compensated man-day: |
|
|
|
|
|
|
|
| ||||||||
Fixed expense | 33.06 | 32.48 |
|
| 38.20 |
|
|
| 38.53 |
| ||||||
Variable expense | 11.60 | 10.26 |
|
| 14.71 |
|
|
| 15.21 |
| ||||||
|
| |||||||||||||||
Total | 44.66 | 42.74 |
|
| 52.91 |
|
|
| 53.74 |
| ||||||
|
| |||||||||||||||
Operating income per compensated man-day | $ | 18.88 | $ | 17.83 |
| $ | 20.23 |
|
| $ | 21.03 |
| ||||
|
| |||||||||||||||
Operating margin | 29.7 | % | 29.4 | % |
|
| 27.7 | % |
|
| 28.1 | % | ||||
|
| |||||||||||||||
Average compensated occupancy | 83.8 | % | 85.2 | % |
|
| 79.6 | % |
|
| 78.8 | % | ||||
|
| |||||||||||||||
Average available beds | 82,942 | 88,894 |
|
| 80,903 |
|
|
| 83,882 |
| ||||||
|
| |||||||||||||||
Average compensated population | 69,536 | 75,698 |
|
| 64,439 |
|
|
| 66,112 |
| ||||||
|
| |||||||||||||||
The calculations of
Fixed expenses per compensated man-day for 2014the year ended December 31, 2017 include depreciation expense of $16.5 million and 2013 exclude expenses incurred duringinterest expense of $6.4 million in order to more properly reflect the fourth quarter of 2013 and the first six months of 2014 for start-up effortscash flows associated with the Diamondback facility because oflease at the distorted impact they have on the statistics. The Diamondback expenses were incurred in connection with the activation of the facility in anticipation of a new contract. As further described hereafter, in April 2014, we made the decision to once again idle the facility in the absence of a definitive contract. The de-activation was completed near the end of the second quarter of 2014. In addition, the calculations of revenue andSouth Texas Family Residential Center. Fixed expenses per compensated man-day for 2013 exclude revenues (and compensated man-days) earnedthe year ended December 31, 2016 include depreciation expense of $38.7 million and expenses incurred duringinterest expense of $10.0 million associated with the fourth quarter of 2013 forlease at the Red Rock facility because of the distorted impact they have on the statistics due to the transition to a new contract, as further described hereafter.South Texas Family Residential Center.
58
Total revenue consists of revenue we generate in the operation and management of correctional, detention, and detentionresidential reentry facilities, as well as rental revenue generated from facilities we lease to third-party operators,third parties, and from our inmate transportation subsidiary.subsidiary, TransCor America, LLC, or TransCor. The following table reflects the components of revenue for the years ended December 31, 20142017 and 20132016 (in millions):
| For the Years Ended December 31, | ||||||||||||||||
| 2014 | 2013 | $ Change | % Change | |||||||||||||
Management revenue: | ||||||||||||||||
Federal | $ | 728.3 | $ | 740.0 | $ | (11.7 | ) | (1.6 | %) | |||||||
State | 759.3 | 823.6 | (64.3 | ) | (7.8 | %) | ||||||||||
Local | 68.6 | 66.9 | 1.7 | 2.5 | % | |||||||||||
Other | 56.5 | 57.3 | (0.8 | ) | (1.4 | %) | ||||||||||
|
|
|
|
|
|
|
| |||||||||
Total management revenue | 1,612.7 | 1,687.8 | (75.1 | ) | (4.4 | %) | ||||||||||
Rental and other revenue | 34.2 | 6.5 | 27.7 | 426.2 | % | |||||||||||
|
|
|
|
|
|
|
| |||||||||
Total revenue | $ | 1,646.9 | $ | 1,694.3 | $ | (47.4 | ) | (2.8 | %) | |||||||
|
|
|
|
|
|
|
| |||||||||
|
| For the Years Ended December 31, |
|
|
|
|
|
|
|
|
| |||||
|
| 2017 |
|
| 2016 |
|
| $ Change |
|
| % Change |
| ||||
Management revenue: |
|
|
|
|
|
|
|
|
|
|
|
|
|
|
|
|
Federal |
| $ | 839.9 |
|
| $ | 954.8 |
|
| $ | (114.9 | ) |
|
| (12.0 | %) |
State |
|
| 727.8 |
|
|
| 710.4 |
|
|
| 17.4 |
|
|
| 2.4 | % |
Local |
|
| 89.1 |
|
|
| 78.1 |
|
|
| 11.0 |
|
|
| 14.1 | % |
Other |
|
| 63.4 |
|
|
| 65.8 |
|
|
| (2.4 | ) |
|
| (3.6 | %) |
Total management revenue |
|
| 1,720.2 |
|
|
| 1,809.1 |
|
|
| (88.9 | ) |
|
| (4.9 | %) |
Rental and other revenue |
|
| 45.3 |
|
|
| 40.7 |
|
|
| 4.6 |
|
|
| 11.3 | % |
Total revenue |
| $ | 1,765.5 |
|
| $ | 1,849.8 |
|
| $ | (84.3 | ) |
|
| (4.6 | %) |
56
The $75.1$88.9 million, or 4.4%4.9%, reductiondecrease in total management revenue associated with the operation and management of correctional and detention facilities consistedwas a result of a decrease in revenue of approximately $136.2$38.3 million driven by a decrease of 2.2% in average revenue per compensated man-day. The decrease in management revenue was also a result of a decrease in revenue of approximately $50.6 million caused by a decrease in the average daily compensated population, during 2014, partially offsetas well as the revenue generated by an increaseone fewer day of 4.9%operations due to leap year in 2016. The decrease in average revenue per compensated man-day. The reduction in revenueman-day from 2016 to 2017 was alsoprimarily a result of a contract adjustment by one of our federal partners, as previously disclosedthe amended IGSA associated with the South Texas Family Residential Center, which became effective in the fourth quarter of 2013 and2016, as further described hereafter. The reductiondecrease in average revenue from the operation and management of correctional and detention facilitiesper compensated man-day was partially offset by an increase in lease revenuethe effect of per diem increases at several of our California City facility, as further described hereafter under “Other Facility Related Activity”.other facilities.
Average daily compensated population decreased 6,162,1,673, or 8.1%2.5%, to 64,439 in 2017 compared to 66,112 in 2016. There were several notable factors that affected the average daily compensated population when comparing 2017 to 2016. Average daily compensated population during 2017 increased due to the activation in the third quarter of 2016 of the new contract to care for up to an additional 1,000 inmates at our newly expanded Red Rock Correctional Center, and the full activation of the newly constructed Trousdale Turner Correctional Center during 2016, both as further described hereafter. Average daily compensated population in 2017 also increased due to two new contracts at our Northeast Ohio Correctional Center. In December 2016, we announced a new contract award from 2013ICE at the Northeast Ohio facility in order to 2014. Theassist ICE with their detention needs and, in the third quarter of 2017, we began receiving offender populations at the Northeast Ohio facility under a new contract with the state of Ohio, as further described hereafter. Such average daily compensated population increases were offset by the decline in average compensated population primarily resulted from the expiration ofCalifornia inmates held in our contracts at the Bay Correctional Facility, Graceville Correctional Facility, and Moore Haven Correctional Facility, collectively referred to herein as the “Three Florida Facilities”, after the Florida Department of Management Services, or DMS, awarded the management of these contracts to another operator effective January 31, 2014. The decline in average compensated population also resulted fromout-of-state facilities, the expiration of our contract with the District of Columbia, or the District, at the IdahoD.C. Correctional Center after the state of Idaho assumed management of the facility effective July 1, 2014, and from our decision to terminate a contract at the North Georgia Detention Center effectiveTreatment Facility in the first quarter of 2014. Combined, these five2017, the expiration of our contract with the BOP at our Eden Detention Center on April 30, 2017, and the expirations in the second and third quarters of 2017 of our contracts at four facilities contributed tothat we managed for the state of Texas, all as further described hereafter. The expiration of our contract with the BOP at our Cibola County Corrections Center in October 2016 also resulted in a decrease in revenueaverage daily compensated population in 2017. While we signed a new contract in October 2016 to provide detention space and services at our Cibola facility to ICE for up to 1,116 detainees, the transition period from the BOP contract to the ICE contract and lower utilization by ICE resulted in a reduction in average daily compensated population at our Cibola facility in 2017 when compared to 2016. Lower utilization by the United States Marshals Service, or USMS, and ICE at our Torrance County Detention Facility also contributed to the reduction in average daily compensated population and led to our idling the facility in the fourth quarter of $76.9 million and generated net operating losses, or the operating losses from operations before interest, taxes, asset impairments, and depreciation and amortization, of $2.4 million during the time they were active in 2014, and net operating income of $0.6 million during the year ended December 31, 2013.2017, as further described hereafter.
Business from our federal customers, including primarily the Federal Bureau of Prisons, or BOP, the United States Marshals Service, or USMS, and ICE, continues to be a significant component of our business. Our federal customers generated approximately 44%48% and 52% of our total revenue for both of the years ended December 31, 20142017 and 2013, but decreased $11.72016, respectively, decreasing $114.9 million, from 2013 to 2014.or 12.0%. The reductiondecrease in federal revenues primarily resulted from the transition of our California City facility, which housed USMS and ICE offenders during the majority of 2013, to a leaseamended IGSA associated with the state of California, as further described under “Other Facility Related Activity” hereafter. Partially offsetting the reduction in federal revenues was an increase in revenues that resulted from our acquisition of CAI in the third quarter of 2013 and the activation of the South Texas Family Residential Center, which became effective in the fourth quarter of 2014, as further described hereafter.2016, the expiration of our contract with the BOP at our
59
Eden Detention Center on April 30, 2017, and the expiration of our contract with the BOP at our Cibola County Corrections Center in October 2016, net of revenue from the new contract with ICE at this facility. The reductiondecrease in federal revenues also resulted from a contract adjustmentwas partially offset by onethe combined effect of per diem increases for several of our federal partners previously disclosedcontracts and a net increase in the fourth quarter of 2013. The contract adjustment resulted in an accrual of $13.0 million of revenue and an equal accrual of operating expenses during the fourth quarter of 2013, both of which were revised to $9.0 million during the first quarter of 2014. Because of the distorted impact these amounts would have on the per compensated man-day statistics presented in the previous table, the revenue and expenses related to these adjustments were not included in the calculations of the per compensated man-day statistics.federal populations at certain other facilities.
State revenues from contracts at correctional, detention, and residential reentry facilities that we manage decreased 7.8%operate increased 2.4% from 20132016 to 20142017. The increase in state revenues was primarily as a result of the expirationfull activation of our contracts at the Idahonewly constructed Trousdale Turner Correctional Center effective July 1, 2014 andduring 2016, the activation of the expansion at the Three Florida Facilities effective January 31, 2014, and due to the idling of our Mineral Wells and Marion AdjustmentRed Rock Correctional Center facilities in the third quarter of 2013.2016, and the new contract with the state of Ohio at our Northeast Ohio Correctional Center. Per diem increases and a net increase in state populations at certain other facilities also contributed to the increase in state revenues. The increase in state revenues was partially offset by a decline in California inmates held in our out-of-state facilities, the expiration of our contract with the District at the D.C. Correctional Treatment Facility in the first quarter of 2017, and the expirations in the second and third quarters of 2017 of our contracts at four facilities that we managed for the state of Texas.
The $11.0 million, or 14.1%, increase in revenue from local authorities from 2016 to 2017 was primarily a result of acquisitions during 2016 and 2017 of multiple residential reentry centers, some of which partner with local agencies, as further described hereafter. Also contributing to the increase in revenue from local authorities from 2016 to 2017 was the execution in July 2017 of a new three-year contract with the City of Mesa, Arizona to care for up to 200 offenders at our 4,128-bed Central Arizona Florence Correctional Complex.
Operating Expenses
Operating expenses totaled $1,156.1$1,249.5 million and $1,220.4$1,275.6 million for the years ended December 31, 20142017 and 2013,2016, respectively. Operating expenses consist of those expenses incurred in the operation and management of correctional, detention, and detentionresidential reentry facilities, as well as at facilities we lease to third-party operators, and for our inmate transportation subsidiary.TransCor.
57
Expenses incurred in connection with the operation and management of correctional, detention, and detentionresidential reentry facilities decreased $67.3$30.2 million, or 5.6%,2.4% during 20142017 compared with 2013. Similar to our reduction in revenues,2016. There were several notable factors that affected operating expenses decreased most notably as a resultwhen comparing 2017 with 2016. The amended IGSA associated with the South Texas Family Residential Center, which lowered the cost structure effective in the fourth quarter of 2016, the expiration of our contract with the District at the D.C. Correctional Treatment Facility in the first quarter of 2017, the expiration of our contract with the BOP at our Eden Detention Center in the second quarter of 2017, the expirations in the second and third quarters of 2017 of our contracts at four facilities that we managed for the Idaho Correctional Center effective July 1, 2014state of Texas, and at the Three Florida Facilities effective January 31, 2014, and due to the idling of our Mineral Wells and Marion AdjustmentTorrance County Detention facility in the fourth quarter of 2017 all contributed to a decrease in operating expenses. The decrease in operating expenses was partially offset primarily by the activation of the expansion at our Red Rock Correctional Center facilities in the third quarter of 2013.The reduction in2016 and the additional expenses resulting from the new contracts with ICE and the state of Ohio at our Northeast Ohio Correctional Center. Additional factors affecting operating expenses was also a resultincluded the one fewer day of operations due to leap year in 2016, the additional expenses resulting from the full activation of the aforementioned contract adjustment by onenewly constructed Trousdale Turner Correctional Center during 2016, and the additional expenses resulting from acquisitions of our federal partners, also as previously disclosed in the fourth quarter of 2013. These reductions in operating expenses were partially offset by an increase in expenses related to the activation of our South Texas Family Residential Center in the fourth quarter of 2014, as further described hereafter.multiple residential reentry centers during 2016 and 2017.
FixedTotal expenses per compensated man-day increaseddecreased to $33.06$52.91 during the year ended December 31, 20142017 from $32.48$53.74 during the year ended December 31, 20132016. Fixed expenses per compensated man-day for 2017 and 2016 include depreciation expense of $16.5 million and $38.7 million, respectively, and interest expense of $6.4 million and $10.0 million, respectively, in order to more properly reflect the cash flows associated with the lease at the South Texas Family Residential Center. Fixed expenses and variable expenses per compensated man-day decreased from 2016 to 2017 primarily as a result of an increase in salaries and benefits per compensated man-day of $0.46. The increase in salaries and benefits per compensated man-day resulted primarily from wage adjustments implemented during 2014 and a higher average rate at our newly activatedthe amended IGSA which lowered the cost structure associated with the South Texas Family Residential Center effective in the fourth quarter of 2016, as wellfurther described hereafter.
As the economy has improved and the nation's unemployment rate has declined, we have experienced wage pressures in certain markets across the country, and have provided wage increases to remain competitive. These wage pressures (among other factors) contributed to the decline in operating margins during 2017 compared to 2016, as more unfavorable claims experience insalaries expense per compensated man-day increased 4.5%, excluding the impact of the aforementioned contract modification at the South Texas Family Residential Center. We continually monitor compensation levels very
60
closely along with overall economic conditions and will set wage levels necessary to help ensure the long-term success of our self-insured employee health plans in 2014 compared with the prior year.business. Salaries and benefits represent the most significant component of fixedour operating expenses, representing approximately 62%60% and 65%59% of our total operating expenses during 20142017 and 2013,2016, respectively.
Variable expenses per compensated man-day increased $1.34 during the year ended December 31, 2014 from the year ended December 31, 2013. The increase was primarily a result of increases in inmate medical costs and contractual inflationary increases in food service, and due to expenses associated with our newly activated South Texas Family Residential Center. The increase in variable expenses per compensated man-day was also due to an increase in travel and other variable expenses, largely attributable to the aforementioned transition of several contracts to new operators. In addition, 2013 was favorably impacted by the implementation of certain sales tax strategies which reduced variable expenses per compensated man-day by $0.15 in 2013.
Facility Management Contracts
We typically enter into facility contracts to provide prison bed capacity and management services to governmental entities for terms typically ranging from three to five years, with additional renewal periods at the option of the contracting governmental agency. Accordingly, a substantial portion of our facility contracts are scheduled to expire each year, notwithstanding contractual renewal options that a government agency may exercise. Although we generally expect these customers to exercise renewal options or negotiate new contracts with us, one or more of these contracts may not be renewed by the corresponding governmental agency.
During December 2014, the BOP announced that it elected not to renew its contract with us at our owned and operated 2,016-bed Northeast Ohio Correctional Center. The current contract with the BOP at this facility is scheduled to expire on May 31, 2015. We currently expect to continue to house USMS detainees at this facility pursuant to a separate contract that expires December 31, 2016, while we continue to market the space that will become available.
Based on information available atas of the date of this filing, notwithstanding the contract at the Northeast Ohio Correctional Center described above, we believe we will renew all othermaterial contracts that
58
have expired or are scheduled to expire within the next twelve months. We believe our renewal rate on existing contracts remains high as a result ofdue to a variety of reasons including, but not limited to, the constrained supply of available beds within the U.S. correctional system, our ownership of the majority of the beds we operate, and the qualitycost effectiveness of our operations.the services we provide. However, we cannot assure we will continue to achieve such renewal rates in the future.
The operation of the facilities we own carries a higher degree of risk associated with a facility contract than the operation of the facilities we manage but do not own because we incur significant capital expenditures to construct, renovate or acquire facilities we own. Additionally, correctional and detention facilities have limited or no alternative use. Therefore, if a contract is terminated onat a facility we own, we continue to incur certain operating expenses, such as real estate taxes, utilities, and insurance, which we would not incur if a management contract were terminated for a managed-only facility. As a result, revenue per compensated man-day is typically higher for facilities we own and manage than for managed-only facilities. Because we incur higher expenses, such as repairs and maintenance, real estate taxes, and insurance, on the facilities we own and manage, our cost structure for facilities we own and manage is also higher than the cost structure for the managed-only facilities. Accordingly, theThe following tables display the revenue and expenses per compensated man-day for the facilities placed into service that we own and manage and for the facilities we manage but do not own, which we believe is useful toinformation for our financial statement users:
| For the Years Ended December 31, | ||||||||
| 2014 | 2013 | |||||||
Owned and Managed Facilities: | ||||||||
Revenue per compensated man-day | $ | 70.55 | $ | 68.19 | ||||
Operating expenses per compensated man-day: | ||||||||
Fixed expense | 35.25 | 35.02 | ||||||
Variable expense | 12.09 | 10.66 | ||||||
|
|
|
| |||||
Total | 47.34 | 45.68 | ||||||
|
|
|
| |||||
Operating income per compensated man-day | $ | 23.21 | $ | 22.51 | ||||
|
|
|
| |||||
Operating margin | 32.9 | % | 33.0 | % | ||||
|
|
|
| |||||
Average compensated occupancy | 81.0 | % | 81.6 | % | ||||
|
|
|
| |||||
Average available beds | 66,179 | 67,588 | ||||||
|
|
|
| |||||
Average compensated population | 53,592 | 55,123 | ||||||
|
|
|
| |||||
Managed Only Facilities: | ||||||||
Revenue per compensated man-day | $ | 39.98 | $ | 40.14 | ||||
Operating expenses per compensated man-day: | ||||||||
Fixed expense | 25.68 | 25.68 | ||||||
Variable expense | 9.95 | 9.20 | ||||||
|
|
|
| |||||
Total | 35.63 | 34.88 | ||||||
|
|
|
| |||||
Operating income per compensated man-day | $ | 4.35 | $ | 5.26 | ||||
|
|
|
| |||||
Operating margin | 10.9 | % | 13.1 | % | ||||
|
|
|
| |||||
Average compensated occupancy | 95.1 | % | 96.6 | % | ||||
|
|
|
| |||||
Average available beds | 16,763 | 21,306 | ||||||
|
|
|
| |||||
Average compensated population | 15,944 | 20,575 | ||||||
|
|
|
| |||||
|
| For the Years Ended December 31, |
| |||||
|
| 2017 |
|
| 2016 |
| ||
Owned and Managed Facilities: |
|
|
|
|
|
|
|
|
Revenue per compensated man-day |
| $ | 78.87 |
|
| $ | 82.76 |
|
Operating expenses per compensated man-day: |
|
|
|
|
|
|
|
|
Fixed expense |
|
| 40.02 |
|
|
| 41.44 |
|
Variable expense |
|
| 15.20 |
|
|
| 16.19 |
|
Total |
|
| 55.22 |
|
|
| 57.63 |
|
Operating income per compensated man-day |
| $ | 23.65 |
|
| $ | 25.13 |
|
Operating margin |
|
| 30.0 | % |
|
| 30.4 | % |
Average compensated occupancy |
|
| 77.1 | % |
|
| 75.6 | % |
Average available beds |
|
| 68,918 |
|
|
| 69,984 |
|
Average compensated population |
|
| 53,148 |
|
|
| 52,942 |
|
|
| For the Years Ended December 31, |
| |||||
|
| 2017 |
|
| 2016 |
| ||
Managed Only Facilities: |
|
|
|
|
|
|
|
|
Revenue per compensated man-day |
| $ | 46.16 |
|
| $ | 42.62 |
|
Operating expenses per compensated man-day: |
|
|
|
|
|
|
|
|
Fixed expense |
|
| 29.65 |
|
|
| 26.81 |
|
Variable expense |
|
| 12.38 |
|
|
| 11.29 |
|
Total |
|
| 42.03 |
|
|
| 38.10 |
|
Operating income per compensated man-day |
| $ | 4.13 |
|
| $ | 4.52 |
|
Operating margin |
|
| 8.9 | % |
|
| 10.6 | % |
Average compensated occupancy |
|
| 94.2 | % |
|
| 94.8 | % |
Average available beds |
|
| 11,985 |
|
|
| 13,898 |
|
Average compensated population |
|
| 11,291 |
|
|
| 13,170 |
|
59
Owned and Managed Facilities
Total revenue from our owned and managed facilities decreased $73.7 million, or 4.6%, from $1,603.7 million in 2016 to $1,530.0 million in 2017. Facility net operating income, or the operating income or loss from operations before interest, taxes, asset impairments, depreciation and amortization, at our owned and managed facilities increaseddecreased by $6.4$53.8 million, from $444.7$535.6 million in 20132016 to $451.1$481.8 million in 2014.2017, a decrease of 10.0%. Facility net operating income at our owned and managed facilities during 2014in 2017 was favorablyunfavorably impacted by the activationamended IGSA associated with the South Texas Family Residential Center, which became effective in the fourth quarter of 2016, as further described hereafter. The aggregate depreciation and interest expense associated with the lease at the South Texas Family Residential Center in the fourth quarter of 2014, as further described hereafter, and the CAI acquisition in the third quarter of 2013.
In July 2013, we extended our agreement with the California Department of Corrections and Rehabilitation, or CDCR, to continue to house inmates at the four facilities we operate for them in Arizona, Oklahoma, and Mississippi. The extension, which runs through June 30, 2016, also allowed CDCR to transition California inmates previously housed at our Red Rock Correctional Center to our other facilities. Accordingly, all of the California inmates were relocated from our Red Rock Correctional Center in the fourth quarter of 2013 in order to prepare for the receipt of inmates under our new contract with the state of Arizona, which commenced January 1, 2014, as further described hereafter. While the transition resulted in the loss of some of the inmates housed at the Red Rock facility, the transition plan included retention and transfer of certain inmates to our other facilities. The calculations of revenue and expenses per compensated man-day in the preceding table exclude revenues (and compensated man-days) earned and expenses incurred during the fourth quarter of 2013 for the Red Rock facility because of the distorted impact they have on the statistics due to the transition to a new contract.
In May 2011, in response to a lawsuit brought by inmates against the state of California, the U.S. Supreme Court upheld a lower court ruling issued by a three judge panel requiring California to reduce its inmate population to 137.5% of its capacity. In an effort to meet the Federal court ruling, the state of California enacted legislation that shifted the responsibilities for housing certain lower level inmates from state government to local jurisdictions. This realignment plan commenced on October 1, 2011 and has resulted in a reduction in state inmate populations of approximately 29,000 as of December 31, 2014. As of December 31, 2014, the adult inmate population held in state of California institutions totaled approximately 139% of capacity, or approximately 115,000 inmates, which did not include the California inmates held in our out-of-state facilities.
In September 2013, the State asked the court to amend its order and provide an extension on the date of compliance in return for adding additional resources toward community-based offender programs that reduce recidivism. On February 10, 2014, a federal court extended to February 28, 2016 the date by which the state of California must comply with the maximum in-state population capacity rate of 137.5%, originally imposed by the federal court in 2009. The federal court also prohibited the State from increasing the out-of-state capacity beyond our contract of approximately 9,000 beds. We believe the state of California will continue to work to resolve the overcrowded conditions in-state through utilizing public and/or private in-state facilities and sentencing measures to reduce prison populations over the long term. As of both December 31, 2014 and 2013, we housed approximately 8,900 inmates from the state of California as a solution to overcrowding. Approximately 14% and 12% of our total revenue for the years ended December 31, 20142017 and 2013,2016, totaling $22.9 million and $48.7 million, respectively, was generated from the CDCR, including revenue generated at the California Cityare not included in these facility under a lease agreement that commenced December 1, 2013, as further described hereafter. The reduction or elimination of the use of our out-of-state solutions by the state of California would have a significant adverse impact on our financial position, results of operations, and cash flows.
60
During the second quarter of 2013, we announced that the Texas Department of Criminal Justice, or TDCJ, elected not to renew its contract for our owned and managed 2,103-bed Mineral Wells Pre-Parole Transfer Facility due to a legislative budget reduction. As a result, upon expiration of the contract in August 2013, we ceased operations and idled the Mineral Wells facility. Further, the Kentucky Department of Corrections, or KDOC, provided us notice during the second quarter of 2013 that it was not going to award a contract under the RFP that would have allowed for the KDOC’s continued use of our owned and managed 826-bed Marion Adjustment Center. We also idled the Marion Adjustment Center following the transfer of the populations during September 2013. These two facilities generated a combined net operating loss, excluding depreciation and amortization, of $1.6 million for the year ended December 31, 2014, compared with a combined net operating loss of $1.1 million for the year ended December 31, 2013. In addition, as previously described, we recorded a non-cash asset impairment of $17.2 million for the Mineral Wells facilityincome amounts, but are included in the fourth quarter of 2014.
During the third quarter of 2013, we began hiring staff at the Diamondback Correctional Facility in order to reactivate the facility for future operations. Our decision to activate the facility was made as a result of potential need for additional beds by certain state customers. In January 2014, the state of Oklahoma issued a Request For Proposal, or RFP, for bed capacity in the state of Oklahoma and anticipated that an award announcement would be made in the second quarter of 2014. When it became evident the contract would not be awarded and commence in the near-term, we made the decision to re-idle the facility. The de-activation was completed near the end of the second quarter of 2014. In the preceding table, the calculations of expenses per compensated man-day exclude expenses incurred during the fourth quarter of 2013 and the first six months of 2014 for the Diamondback facility because of the distorted impact they have on the statistics.
In September 2014, we announced that we agreed underto an expansion of an existing inter-governmental service agreement, or IGSA between the Citycity of Eloy, Arizona and ICE to housecare for up to 2,400 individuals at the South Texas Family Residential Center, a facility we lease in Dilley, Texas. The expanded agreement gives ICE additional capacity to accommodate the influx of Central American female adults with children arriving illegally on the Southwest border while they await the outcome of immigration hearings or return to their home countries. As part of the agreement, we are responsible for providing space and residential services in an open and safe environment which offers residents indoor and outdoor recreational activities, life skills, study period, counseling, group interaction, and access to religious and legal services. In addition, we provide educational programs through a third party and food services through the lessor. Medical services are provided to residents by ICE Health Care Services, a division of ICE. The new services provided under the original amended IGSA commenced in the fourth quarter of 2014 have aand had an original term of up to four years,years. In October 2016, we entered into an amended IGSA that provides for a new, lower fixed monthly payment that commenced in November 2016, and extended the term of the contract through September 2021. The agreement can be further extended by bi-lateral modifications. During 2014,modification. However, ICE can also terminate the agreement for convenience or non-appropriation of funds, without penalty, by providing us with at least a 60-day notice. Concurrent with the amendment to the IGSA entered into in October 2016, we recognized $21.0 millionmodified our lease agreement with the third-party lessor of the facility to reflect a reduced monthly lease expense effective in revenue associatedNovember 2016, with a new term concurrent with the amended IGSA. In the event we cancel the lease with the third-party lessor prior to its expiration as a result of the termination of the IGSA by ICE for convenience, and if we are unable to reach an agreement for the continued use of the facility within 90 days from the termination date, we are required to pay a termination fee based on the termination date, currently equal to $10.0 million and declining to zero by October 2020.
We leaseDuring the years ended December 31, 2017 and 2016, we recognized $170.6 million and $267.3 million, respectively, in total revenue associated with the South Texas Family Residential Center and the site upon which it is being constructed from a third-party lessor. Our lease agreement with the lessor is over a period co-terminus with the aforementioned amendedCenter. The original IGSA with ICE. ICE began housing the first residents at the facility in the fourth quarter of 2014, and the site is expected to be ready for full capacity during the second quarter of 2015. The agreement provides for a fixed monthly payment in accordance with a graduated schedule. Certain lease and service revenue was recognized in the fourth quarter of 2014 and will continue to increase as additional beds are brought on line, up to the point the facility is ready for full occupancy at 2,400 beds. The expanded agreement with ICE had a favorable impact on the revenue and net operating income of our Ownedowned and Managedmanaged facilities during 20142016, with more favorable operating margin percentages than those of our average owned and is also expected to continue to have a favorable impact on our financial results.
61
In January 2015, a class action lawsuit was filed in federal district court for the District of Columbia against the Secretarymanaged facilities. Under terms of the Departmentamended IGSA entered into in October 2016, the revenues generated at the South Texas Family Residential Center declined and operating margin percentages at the facility became more comparable to those of Homeland Security, or DHS,our average owned and certain ICE officials. The complaint soughtmanaged facilities, resulting in a material reduction to certifyour facility net operating income in 2017.
62
Numerous lawsuits, to which we are not a classparty, have challenged the government's policy of plaintiffs, consisting of Central American mothersdetaining migrant families, and children who (i) have been or will be detained in ICEgovernment policies with respect to family detention facilities since June 2014, (ii) have been or will be determined to have a credible fear of persecution in their home country under federal asylum laws and (iii) are eligibleimmigration may impact the demand for release on bond pursuant to certain federal statutes but have been or will be denied such release after being subject to an ICE custody determination that took deterrence of mass migration into account. In February 2015, the court certified the class and granted the plaintiffs’ motion for a preliminary injunction, enjoining DHS from detaining class members for the purpose of deterring future immigration to the United States and from considering deterrence of such immigration as a factor in such custody determinations until a final determination has been reached on the merits of the action. We have not received any instruction from ICE on what action they intend to take in response to the court order, or how and whether it will affect our contract at the South Texas Family Residential Center. Any adversecourt decision with regard to thisor government action that impacts our existing contract for the South Texas Family Residential Center could materially affect our cash flows, financial condition, and results of operations.
In September 2012,December 2015, we announced that we were awarded a new management contract from the Arizona Department of Corrections, or ADOC, to housecare for up to an additional 1,000 medium-security inmates at our 1,596-bed Red Rock Correctional Center in Arizona.facility, bringing the contracted bed capacity to 2,000 inmates. The new management contract which commenced in January 2014, contains an initial term of ten years, with two five-year renewal options upon mutual agreement and provides for an occupancy guarantee of 90% of the contracted beds, which is expected to be implemented in two phases.beds. The government partner included the occupancy guarantee in its RFPrequest for proposal in order to guarantee its access to the beds. In connection with the new award, we expanded our Red Rock facility to a design capacity of 2,024 beds. and added additional space for inmate reentry programming. We receivedbegan receiving inmates under the new contract during the third quarter of 2016. The new contract generated $18.7 million of incremental revenue during 2017 when compared to 2016.
During the first quarter of 2015, the adult inmate population held in state of California institutions first met a Federal court order to reduce inmate populations below 137.5% of its capacity. Inmate populations in the state continued to decline below the court ordered capacity limit which has resulted in declining inmate populations in the out-of-state program at facilities we own and operate. As of December 31, 2017, the adult inmate population held in state of California institutions remained in compliance with the Federal court order at approximately 500134.6% of capacity, or approximately 114,500 inmates, which did not include the California inmates held in our out-of-state facilities, compared with 114,000 inmates at December 31, 2016. During the years ended December 31, 2017 and 2016, we cared for an average daily population of approximately 4,400 and 4,900 California inmates, respectively, in facilities outside the state as a partial solution to the State's overcrowding. This decline in population, along with the revenue impact of one fewer day of operations due to leap year in 2016, resulted in a decrease in revenue of $9.3 million from the year ended December 31, 2016 to the year ended December 31, 2017.
Approximately 6% of our total revenue for both the years ended December 31, 2017 and 2016 was generated from the California Department of Corrections and Rehabilitation, or CDCR, in facilities housing inmates outside the state of California.
On January 10, 2018, the Governor of California issued a proposed budget for fiscal 2018-2019. The proposed budget contemplates that the continued implementation of initiatives to reduce prison populations will allow the CDCR to eliminate the use of out-of-state contract beds. Current estimates include the removal of all inmates from Arizonaone of our two out-of-state facilities by the end of fiscal 2017-2018. As the impact of the initiatives grows, the CDCR anticipates the removal of inmates from our other out-of-state facility by fall 2019. Although the proposed budget acknowledges that estimates of population reductions are subject to considerable uncertainty, the complete removal by the CDCR of all inmates from our out-of-state facilities could have a material adverse effect on our financial position, results of operations, and cash flows.
During the fourth quarter of 2015, we completed construction of our 2,552-bed Trousdale Turner Correctional Center. While we began housing state of Tennessee inmates at the facility in January 2016, occupancy at the facility increased throughout the year, leading to an increase in revenue of $18.4 million from the year ended December 31, 2016 to the year ended December 31, 2017. However, we have not yet stabilized the financial operations of this facility due to a competitive job market in the surrounding area. We have incurred incremental expenses for wage increases, various incentive plans, recruiting efforts, and other costs which has had an impact on the facility operating margin. Until operations are stabilized, we may continue to incur these incremental expenses.
On April 11, 2017, we announced that we contracted with the state of Ohio to care for up to an additional 996 offenders at our 2,016-bed Northeast Ohio Correctional Center. The initial term of the contract continues through June 2032 with unlimited renewal options, subject to appropriations and mutual agreement. We began receiving offender populations at the Northeast Ohio facility from the state of Ohio in the third quarter of 2017, with full contract utilization expected by the end of the first quarter of 2018. On December 31, 2017, we cared for approximately 680 offenders from the state of Ohio, 650 detainees from the USMS, and approximately 270
63
detainees from ICE at our Northeast Ohio facility. Total revenue at the Northeast Ohio facility increased by $10.7 million from the year ended December 31, 2016 to the year ended December 31, 2017.
Our contract with the District at the D.C. Correctional Treatment Facility expired in the first quarter of 2017. The District assumed operation of the facility in January 2017. Total revenue decreased $17.6 million at this facility from 2016 to 2017. We incurred a facility net operating loss of $0.5 million during the first quarter of 2014. During January 2015, we began receiving additional inmates under this contract, and we expect2017. We incurred a facility net operating loss of $0.1 million during the population to reach approximately 1,000 inmates atfull year ended December 31, 2016. Our investment in the Red Rock facility duringdirect financing lease with the District also expired in the first quarter of 2015.2017. Upon expiration of the lease, ownership of the facility automatically reverted to the District.
On April 30, 2017, our contract with the BOP at our Eden Detention Center expired and was not renewed. Total revenue decreased $23.7 million at this facility from 2016 to 2017. During the time the facility was active in 2017, we generated facility net operating income of $1.9 million and we generated facility net operating income of $9.1 million for the full year ended December 31, 2016.
As a result of declines in federal populations at our 910-bed Torrance County Detention Facility and 1,129-bed Cibola County Corrections Center, during the third quarter of 2017, we made the decision to consolidate offender populations into our Cibola facility in order to take advantage of efficiencies gained by consolidating populations into one facility. We idled the Torrance facility in the fourth quarter of 2017 following the transfer of the offender population, and have begun to market the facility to other potential customers. During the years ended December 31, 2017 and 2016, we incurred facility net operating losses of $2.3 million and $4.0 million, respectively, at the Torrance facility.
The following acquisitions in 2016 and 2017 have positively impacted our current facility operating income and our diversification strategy:
On April 8, 2016, we closed on the acquisition of 100% of the stock of CMI along with the real estate used in the operation of CMI's business from two entities affiliated with CMI. CMI, a privately held community corrections company that operates seven community corrections facilities, including six owned and one leased, with approximately 600 beds in Colorado, specializes in community correctional services, drug and alcohol treatment services, and residential reentry services;
On January 1, 2017, we acquired Arapahoe Community Treatment Center, or ACTC, a 135-bed residential reentry center in Englewood, Colorado, which we integrated with the operations of our existing Colorado residential reentry centers;
On June 1, 2017, we acquired the real estate operated by Center Point, Inc., or Center Point, a California-based non-profit organization. We consolidated a portion of Center Point's operations into our preexisting residential reentry portfolio and assumed ownership and operations of the Oklahoma City Transitional Center, a 200-bed residential reentry center in Oklahoma City, Oklahoma;
On August 1, 2017, we acquired New Beginnings Treatment Center, Inc., or NBTC, an Arizona-based community corrections company, along with the real estate used in the operation of NBTC's business from an affiliate of NBTC. In connection with the NBTC acquisition, we assumed a contract with the BOP to provide reentry services to male and female adults at the 92-bed Oracle Transitional Center located in Tucson, Arizona; and
On November 1, 2017, we acquired Time to Change, Inc., or TTC, a Colorado-based community corrections company. In connection with the acquisition, we assumed contracts with Adams County, Colorado to provide reentry services to male and female adults in three facilities located in Colorado containing a total of 422 beds.
We acquired these 13 facilities as strategic investments that further expand the network of reentry assets we own and the services we provide. Total revenue generated from the 13 facilities during the year ended December 31, 2017 totaled $19.5 million compared with $9.7 million of revenue generated during the year ended December 31, 2016, an increase of $9.8 million from the continued expansion of our residential reentry services.
64
Total revenue at our managed-only facilities decreased $68.8$15.2 million, from $301.5$205.4 million in 20132016 to $232.7$190.2 million in 2014. The decrease in revenues during 2014 at our managed-only facilities was largely the result of the aforementioned expiration of our contracts at the Idaho Correctional Center effective July 1, 2014 and at the Three Florida Facilities effective January 31, 2014.2017. Revenue per compensated man-day decreased slightlyincreased 8.3%, to $39.98$46.16 in 20142017 from $40.14$42.62 in 2013, or 0.4%.2016. Operating expenses per compensated man-day increased to $42.03 in 2017 from $38.10 in 2016. Facility net operating income at our managed-only facilities decreased $14.2$4.8 million, from $39.6$21.8 million during the year ended December 31 2013in 2016 to $25.3$17.0 million during year ended December 31, 2014.
Operating expenses per compensated man-day atin 2017. During 2017 and 2016, managed-only facilities increased to $35.63 during the year ended December 31, 2014 from $34.88 during the year ended December 31, 2013 largely due to increases in inmate litigation costs, inmate medical costs, travel,generated 3.4% and other variable expenses, most notably at our Idaho facility.
During the third quarter of 2013, the state of Idaho reported that they expected to solicit bids for the management of the Idaho Correctional Center upon the expiration3.9% respectively, of our contract in June 2014. During the third quarter of 2013, we decided not to submit a bid for the continued management of this facility. The state announced in early 2014 that it would assume management of thetotal facility effective July 1, 2014. The transition of our operations to the state of Idaho was completed successfully on July 1, 2014. We generated annet operating loss, net of depreciation and amortization, of $2.8 million at this facility during the time it was active in 2014, and an operating loss of $0.3 million at this facility for the year ended December 31, 2013. In addition, we reported a non-cash goodwill impairment charge of $1.0 million for the Idaho facility in the third quarter of 2013.
During the fourth quarter of 2013, the Florida DMS awarded to another operator contracts to manage the Three Florida Facilities which are owned by the state of Florida. We previously managed these facilities under contracts that expired on January 31, 2014. Accordingly, we transferred operations of these facilities to the new operator upon expiration of the contracts. These three facilities operated at breakeven during the time they were active in 2014 and generated combined facility operating income, net of depreciation and amortization, of $1.5 million for the year ended December 31, 2013. In addition, we reported a non-cash goodwill impairment charge of $1.1 million for one of the Three Florida Facilities in the fourth quarter of 2013.
income. We expect the managed-only business to remain competitive and we will only pursue opportunities for managed-only business where we are sufficiently compensated for the risk associated with this competitive business. Further, we may terminate existing contracts from time to time when we are unable to achieve per diem increases that offset increasing
62
expenses and enable us to maintain safe, effective operations.
During 2014the third quarter of 2016, the Texas Department of Criminal Justice, or TDCJ, solicited proposals for the rebid of four facilities we managed for the state of Texas. The managed-only contracts for these four facilities were scheduled to expire in August 2017. On March 31, 2017, the TDCJ notified us that, in light of the current economic climate as well as the fiscal constraints and 2013,budget outlook for the TDCJ for the next biennium, the TDCJ would not be awarding the contract for the Bartlett State Jail, one of the facilities included in the rebid process. During the first quarter of 2017, we wrote-off $0.3 million of goodwill associated with this managed-only facility. In collaboration with the TDCJ, the decision was made to close the Bartlett facility on June 24, 2017. During the third quarter of 2017, the TDCJ notified us that it selected other operators for the management of the three remaining managed-only facilities that were subject to the rebid. We successfully transferred operations of these facilities to the other operators upon expiration of the contracts. The four facilities we managed for the state of Texas had a total capacity of 5,129 beds and generated 5.3%total revenue and 8.2%, respectively, of our totala facility net operating income.loss of $30.4 million and $0.2 million, respectively, during the time they were active in 2017, and total revenue and net operating income of $49.9 million and $2.3 million, respectively, for the year ended December 31, 2016. The termination of the contracts with the TDCJ contributed to the increase in revenue and expenses per compensated man-day, as the per diem and operating expense structure associated with these contracts were substantially lower than our remaining managed-only portfolio.
Other Facility RelatedPortfolio-Related Activity
In October 2013,May 2016, we entered into a lease with the Oklahoma Department of Corrections, or ODOC, for our California Citypreviously idled 2,400-bed North Fork Correctional Center with the CDCR.Facility. The lease agreement commenced on July 1, 2016, and includes a three-yearfive-year base term that commenced December 1, 2013, with unlimited two-year renewal optionsoptions. However, the lease agreement permitted the ODOC to utilize the facility for certain activation activities and, therefore, revenue recognition began upon mutual agreement. Annual baseexecution of the lease. The average annual rent to be recognized during the three-yearfive-year base term is fixed at $28.5$7.3 million, including annual rent in the fifth year of $12.0 million. After the three-yearfive-year base term, the annual rent will be increased annually byequal to the lesser of CPI (Consumerrent due during the prior lease year, adjusted for increases in the Consumer Price Index) or 2%.Index. We are responsible for repairs and maintenance, property taxes and property insurance, while all other aspects and costs of facility operations are the responsibility of the CDCR. We also provided $10.0 millionODOC.
On June 10, 2016, we acquired a residential reentry center in tenant allowancesLong Beach, California from a privately held owner. The 112-bed facility is leased to a third-party operator under a triple net lease agreement that extends through June 2020 and improvements. Profitability increased at thisincludes one five-year lease extension option. In addition, on February 10, 2017, we acquired the Stockton Female Community Corrections Facility, a 100-bed residential reentry center in Stockton, California. The 100-bed facility comparedis leased to a third-party operator under a triple net lease agreement that extends through April 2021 and includes one five-year lease extension option. Both third-party operators separately contract with the prior year, whenCDCR to provide rehabilitative and reentry services to residents at the facility was leased facilities. We acquired the facilities in the real estate–only partiallytransactions as strategic investments that further expand our network of residential reentry centers. During the third quarter of 2017, we acquired a portfolio of four properties, including a 230-bed residential reentry center leased to the state of Georgia and three properties in North Carolina and Georgia leased to the General Services Administration, or GSA, an independent agency of the United States government, two of which are occupied by USMSthe Social Security Administration, or SSA, and ICE populations.one of which is occupied by the Internal Revenue Service, or IRS. We currently expect these six properties to generate total annual revenue of approximately $2.0 million.
65
General and administrative expense
For the years ended December 31, 20142017 and 2013,2016, general and administrative expenses totaled $106.4$107.8 million and $103.6$107.0 million, respectively. General and administrative expenses consist primarily of corporate management salaries and benefits, professional fees, including those associated with mergers and acquisitions, or M&A, and other administrative expenses. GeneralAn increase in incentive compensation and M&A expenses during 2017 compared to 2016, was largely offset by a reduction in general and administrative expenses increased in 2014 when compared to 2013 primarily asresulting from a result of increased professional fees of $4.2 million for assistance with several corporate initiatives and legal matters, and increased incentive compensation of $6.0 million. General and administrative expenses in 2014 also included $1.5 million of expenses associated with the write-off of costs in the first quarter of 2014 related to a parcel of land we previously optioned in connection with the construction of the Otay Mesa Detention Center; however, we were able to design a more efficient structure that no longer required this parcel as part of the footprint. General and administrative expenses during 2013 included professional fees and expenses of $10.3 million associated with the conversionrestructuring of our corporate structure to a REIT effective January 1, 2013. Duringoperations announced during the yearthird quarter of 2016.
Depreciation and Amortization
For the years ended December 31, 2013, we also incurred $0.8 million in connection with our acquisition of CAI.
Depreciation2017 and Amortization
Depreciation2016, depreciation and amortization expense totaled $113.9$147.1 million and $112.7$166.7 million, respectively. Our lease agreement with the third-party lessor associated with the 2,400-bed South Texas Family Residential Center resulted in our being deemed the owner of the constructed assets for accounting purposes, in accordance with ASC 840-40-55, formerly Emerging Issues Task Force No. 97-10, "The Effect of Lessee Involvement in Asset Construction". Accordingly, our balance sheet reflects the costs attributable to the building assets constructed by the third-party lessor, which, beginning in the second quarter of 2015, began depreciating over the remainder of the four-year term of the original lease. Depreciation expense for the constructed assets at this facility was $16.5 million and $38.7 million during the years ended December 31, 20142017 and 2013,2016, respectively. The increase in depreciation and amortization expense primarily occurred atAs previously described herein, we modified our Red Rock facility as a result of our new management contractlease agreement with the Arizona Departmentthird-party lessor of Corrections which was effective January 1, 2014. Our depreciation rate for the facility was adjusted to reflectin October 2016, which resulted in a reduced monthly lease rate effective in November 2016 and extended the terms of the contract which provides the state of Arizona an option to purchase the facility at any time during the twenty-year term of the contract based on an amortization schedule startingresulting in a reduction in depreciation expense during 2017 compared to prior periods.
Restructuring charges
During the third quarter of 2016, we announced a restructuring of our corporate operations and implementation of a cost reduction plan, resulting in the elimination of approximately 12% of the corporate workforce at our headquarters. The restructuring realigned the corporate structure to more effectively serve facility operations and support the progression of our business diversification strategy. We reported a charge in the third quarter of 2016 of $4.0 million associated with this restructuring. This charge primarily consisted of cash payments for severance and related benefits to terminated employees and a non-cash charge associated with the fair market value and decreasing evenly to zero over the twenty-year term.voluntary forfeiture by our chief executive officer of a restricted stock unit award.
Interest expense, net
Interest expense was reported net of interest income and capitalized interest for the years ended December 31, 20142017 and 2013.2016. Gross interest expense, net of capitalized interest, was $43.1$69.5 million and $47.1$68.9 million for 20142017 and 2013,2016, respectively. Gross interest expense is based on outstanding borrowings under our $900.0 million revolving credit facility, or revolving credit facility, our outstanding Incremental Term Loan, or Term Loan, and our outstanding senior notes, as well as the amortization of loan costs and unused facility fees. We also incur interest expense associated with the lease of the South Texas Family Residential Center, in accordance with ASC 840-40-55. Interest expense associated with the lease of this facility was $6.4 million and $10.0 million during the years ended December 31, 2017 and 2016, respectively. As previously described herein, we modified our lease agreement with the third-party lessor of the facility in October 2016, which resulted in a reduced monthly lease rate effective in November 2016 and extended the term of the contract. The decrease in interest expense that primarily resulted from the reduction in expense associated with the lease of the South Texas Family Residential Center was partially offset by an increase in the London Interbank Offered Rate, or LIBOR, and the higher interest expense associated with the new senior notes offering issued in October 2017, as further described hereafter.
We have benefited from relatively low interest rates on our revolving credit facility, which is largely based on
63
the London Interbank Offered Rate (LIBOR). It is possible that LIBOR could increase in the future. The interest rate LIBOR. Based on our total leverage ratio, loans under our revolving credit facility which was amendedduring 2016 and extended in March 2013, was2017 were at the base rate plus a margin of 0.50% or at LIBOR plus a margin of 1.50% throughout 2013. The rate increased, and a commitment fee equal to LIBOR plus a margin of 1.75% during the first quarter of 2014 pursuant to the terms0.35% of the revolving credit facility based on an increase in our leverage ratio. Ourunfunded balance. Interest rates under the Term Loan are the same as the interest expense was lower in 2014 compared to 2013 as we completed several refinancing transactions in the second quarter of 2013 which reduced our weighted average interest rate contributing to the reduction in interest expense.
We currently expect the outstanding balance onrates under our revolving credit facility to increase during 2015 asfacility.
66
On October 13, 2017, we utilize additional borrowing capacity under it to completecompleted the constructionoffering of two correctional facilities, further described under “Liquidity and Capital Resources” hereafter.$250.0 million aggregate principal amount of 4.75% senior notes due October 15, 2027. We may issue additional debt securities in the future when we determine that market conditions and the opportunity to utilize theused net proceeds from the issuance of such securities are favorable. Our interest expense would increase in the future if we decideoffering to pay down a portion of theour revolving credit facility with proceeds fromwhich had a long-termvariable weighted average interest rate of 3.1% at December 31, 2017. While our interest expense is expected to increase in the future as a result of this refinancing, we reduced our exposure to variable rate debt, offering.extended our weighted average maturity, and increased the availability of borrowings under our revolving credit facility.
Gross interest income was $3.6$1.0 million and $2.0$1.1 million respectively, for the years ended December 31, 20142017 and 2013.2016, respectively. Gross interest income is earned on a direct financing lease, notes receivable, investments, and cash and cash equivalents. Interest income generated on investments we hold in a rabbi trust were higherThere was no interest capitalized during the year ended December 31, 2014 compared to the same period in 2013.2017. Capitalized interest was $2.5 million and $0.8 million during 2014 and 2013, respectively, and was associated with various construction and expansion projects as further described under “Liquidity and Capital Resources” hereafter.
Expenses associated with debt refinancing transactions
During the year ended December 31, 2013, we reported charges of $36.5 million, for the write-off of loan costs and the unamortized discount, redemption premium, and third-party fees and expenses associated with the tender offer for our then outstanding 7.75% senior unsecured notes.
Income tax expense
During the years ended December 31, 2014 and 2013, our financial statements reflected an income tax expense of $6.9 million and an income tax benefit of $135.0 million, respectively. The income tax benefit in 2013 was due primarily to a net tax benefit of $137.7 million resulting from the revaluation of certain deferred tax assets and liabilities associated with the REIT conversion effective January 1, 2013. Our effective tax rate was 3.4%$0.6 during the year ended December 31, 2014, and2016. Capitalized interest in 2016 was approximately 6.2% duringprimarily associated with the same period in 2013, excluding the aforementioned netexpansion project at our Red Rock Correctional Center.
Income tax benefit and the income tax benefit of certain other items. expense
As a REIT, we are entitled to a deduction for dividends paid, resulting in a substantial reduction in the amount of federal income tax expense we recognize. Substantially all of our income tax expense is incurred based on the earnings generated by our TRSs. Our overall effective tax rate is estimated based on the current projection of taxable income primarily generated inby our TRSs. Our consolidated effective tax rate could fluctuate in the future based on changes in estimates of taxable income, the relative amounts of taxable income generated by the TRSs and the REIT, the implementation of additional tax planning strategies, changes in federal or state tax rates or laws affecting tax credits available to us, changes in other tax laws, changes in estimates related to uncertain tax positions, or changes in state apportionment factors, as well as changes in the valuation allowance applied to our deferred tax assets that are based primarily on the amount of state net operating losses and tax credits that could expire unused.
64
Discontinued operations
During the second quarteryears ended December 31, 2017 and 2016, our financial statements reflected an income tax expense of 2013,$13.9 million and $8.3 million, respectively. Our effective tax rate was 7.2% and 3.6% during the years ended December 31, 2017 and 2016, respectively. The TCJA, enacted December 22, 2017, reduces the U.S. federal corporate tax rate from 35% to 21%, requires companies to pay a one-time transition tax on earnings of certain foreign subsidiaries that were previously tax deferred, and creates new taxes on certain foreign-sourced earnings. However, the TCJA does not change the dividends paid deduction applicable to REITs and, therefore, we announcedgenerally will not be subject to federal income taxes on our REIT taxable income and gains that the TDCJ elected notwe distribute to renew its contract for the 2,216-bed managed-only Dawson State Jail in Dallas, Texas due to a legislative budget reduction.our stockholders. As a result upon expiration of changes in the contract in August 2013, we ceased operations ofU.S. federal corporate tax rates resulting from the Dawson State Jail. DuringTCJA, during the secondfourth quarter of 2013,2017, we also received notification that we were not selected for the continued management of the 1,000-bed managed-only Wilkinson County Correctional Facility in Woodville, Mississippi at the end of the contract on June 30, 2013. Accordingly, the results of operations, net of taxes, and there-measured certain deferred tax assets and liabilities based on the rates at which they are expected to reverse in the future, which is generally 21%. We recognized $4.5 million, which is included as a component of the Dawson and Wilkinson facilities have been reported as discontinued operations for all periods presented. The Dawson and Wilkinson facilities operated at a combined loss of $3.8 million, net of taxes,income tax expense, for the year ended December 31, 2013,revaluation of deferred tax assets and had no operations during 2014.
In April 2014,liabilities and other taxes associated with the FASB issued ASU 2014-08, “Presentation of Financial Statements (Topic 205) and Property, Plant, and Equipment (Topic 360): Reporting Discontinued Operations and Disclosures of Disposals of Components of an Entity”, which changed the criteria for reporting a discontinued operation. Specifically, ASU 2014-08 changed the current definition of “discontinued operations” so that only disposals of components that represent a strategic shift that has (or will have) a major effect on an entity’s operations and financial results qualify for discontinued operations reporting. We elected to early adopt ASU 2014-08 in the first quarter of 2014. Accordingly, under the guidelines of the new ASU 2014-08, the operations of the Three Florida Facilities were not reported as discontinued operations upon expiration of the contracts effective January 31, 2014. In addition, the operation of the Idaho Correctional Center was not reported as a discontinued operation upon expiration of the contract effective July 1, 2014, as we concluded that the four facilities do not meet the new definition of a discontinued operation and that they were not individually significant components of an entity. Under ASU 2014-08, previously reported discontinued operations are not reclassified as continuing operations even though such operations do not meet the new definition of a discontinued operation.TCJA.
Year Ended December 31, 20132016 Compared to the Year Ended December 31, 20122015
During the year ended December 31, 2013,2016, we generated net income of $300.8$219.9 million, or $2.70$1.87 per diluted share, compared with net income of $156.8$221.9 million, or $1.56$1.88 per diluted share, for the previous year. Net income was favorably impacted during 2013 by the income tax benefit of $137.7 million recorded during the first quarter of 2013, or $1.24 per diluted share, due to the revaluation of certain deferred tax assets and liabilities and other income taxes associated with the REIT conversion effective January 1, 2013. In addition,Financial results for 2013 were favorably impacted by a tax benefit of $4.9 million, or $0.04 per share, due to certain tax strategies implemented during the second quarter of 2013 that resulted in a further reduction in income taxes. The income tax benefit during the second quarter of 2013 was offset by our decision to provide bonuses totaling $5.0 million, or $0.04 per share, to non-management staff in lieu of merit increases in 2013. We have monitored our compensation levels very closely and believe these adjustments to our compensation strategy were necessary to help ensure the long-term success of our business.
Net income for 2013 was negatively impacted due to several other non-routine items including $43.5 million, net of taxes, or $0.39 per diluted share for expenses associated with debt refinancing transactions, the REIT conversion, and with the acquisition of CAI, as further described hereafter. Net income was also negatively impacted during 2013 by asset impairments associated with contract terminations of $6.7 million, net of taxes, or $0.06 per diluted share. Earnings per share during the year ended December 31, 2013 was also negatively impacted by2016, include $4.0 million of restructuring charges resulting from the additional 13.9 million shares issued as a result of the payment of a special dividend on May 20, 2013.
65
Net income for 2012 was also impacted by several non-routine items. As a result of the internal reorganizationrealignment of our corporate structure completedto more effectively serve facility operations and support the progression of our business diversification strategy via the acquisitions of residential reentry facilities and a focus on December 31, 2012 to facilitate our qualification as a REIT effectivereal estate-only solutions for our taxable year beginning January 1, 2013, we were required to revalue certain deferred tax assets and liabilities which resulted in a net tax benefit of $2.9 million, or $0.03 per diluted share, favorably impacting our net income during 2012. Net income was negatively impacted during 2012 by charges totaling $4.0 million, net of taxes, or $0.04 per diluted share, associated with debt refinancing transactions and the charges associated with the REIT conversion.government partners.
67
Revenue and expenses per compensated man-day for all of the facilities placed into service that we owned or managed, exclusive of those discontinued (see further discussion below regarding discontinued operations) or held for lease, were as follows for the years ended December 31, 20132016 and 2012:2015:
| For the Years Ended December 31, |
| For the Years Ended December 31, |
| |||||||||||||
| 2013 | 2012 |
| 2016 |
|
| 2015 |
| |||||||||
Revenue per compensated man-day | $ | 60.57 | $ | 60.22 |
| $ | 74.77 |
|
| $ | 72.76 |
| ||||
Operating expenses per compensated man-day: |
|
|
|
|
|
|
|
| ||||||||
Fixed expense | 32.48 | 31.91 |
|
| 38.53 |
|
|
| 37.53 |
| ||||||
Variable expense | 10.26 | 10.13 |
|
| 15.21 |
|
|
| 14.96 |
| ||||||
|
| |||||||||||||||
Total | 42.74 | 42.04 |
|
| 53.74 |
|
|
| 52.49 |
| ||||||
|
| |||||||||||||||
Operating income per compensated man-day | $ | 17.83 | $ | 18.18 |
| $ | 21.03 |
|
| $ | 20.27 |
| ||||
|
| |||||||||||||||
Operating margin | 29.4 | % | 30.2 | % |
|
| 28.1 | % |
|
| 27.9 | % | ||||
|
| |||||||||||||||
Average compensated occupancy | 85.2 | % | 87.9 | % |
|
| 78.8 | % |
|
| 82.5 | % | ||||
|
| |||||||||||||||
Average available beds | 88,894 | 88,646 |
|
| 83,882 |
|
|
| 80,121 |
| ||||||
|
| |||||||||||||||
Average compensated population | 75,698 | 77,961 |
|
| 66,112 |
|
|
| 66,111 |
| ||||||
|
| |||||||||||||||
The calculations of revenue and
Fixed expenses per compensated man-day exclude revenues (and compensated man-days) earned and expenses incurred during the fourth quarter of 2013 for the Red Rockyear ended December 31, 2016 include depreciation expense of $38.7 million and Diamondback facilities becauseinterest expense of $10.0 million in order to more properly reflect the distorted impact they have oncash flows associated with the statistics due to the transition to a new contractlease at the Red Rock facilitySouth Texas Family Residential Center. Fixed expenses per compensated man-day for the year ended December 31, 2015 include depreciation expense of $29.9 million and activation in anticipationinterest expense of a new contract$8.5 million associated with the lease at the Diamondback facility during the quarter.
66
Revenue
Total revenue consists of revenue we generate in the operation and management of correctional, detention, and detentionresidential reentry facilities, as well as rental revenue generated from facilities we lease to third-party operators,third parties, and from our inmate transportation subsidiarysubsidiary. The following table reflects the components of revenue for the years ended December 31, 20132016 and 20122015 (in millions):
| For the Years Ended December 31, |
| For the Years Ended December 31, |
|
|
|
|
|
|
|
|
| |||||||||||||||||||||
| 2013 | 2012 | $ Change | % Change |
| 2016 |
|
| 2015 |
|
| $ Change |
|
| % Change |
| |||||||||||||||||
Management revenue: |
|
|
|
|
|
|
|
|
|
|
|
|
|
|
|
| ||||||||||||||||
Federal | $ | 740.0 | $ | 752.2 | $ | (12.2 | ) | (1.6 | %) |
| $ | 954.8 |
|
| $ | 912.1 |
|
| $ | 42.7 |
|
|
| 4.7 | % | |||||||
State | 823.6 | 848.4 | (24.8 | ) | (2.9 | %) |
|
| 710.4 |
|
|
| 725.1 |
|
|
| (14.7 | ) |
|
| (2.0 | %) | ||||||||||
Local | 66.9 | 60.7 | 6.2 | 10.2 | % |
|
| 78.1 |
|
|
| 65.7 |
|
|
| 12.4 |
|
|
| 18.9 | % | |||||||||||
Other | 57.3 | 57.1 | 0.2 | 0.4 | % |
|
| 65.8 |
|
|
| 52.9 |
|
|
| 12.9 |
|
|
| 24.4 | % | |||||||||||
|
|
|
| |||||||||||||||||||||||||||||
Total management revenue | 1,687.8 | 1,718.4 | (30.6 | ) | (1.8 | %) |
|
| 1,809.1 |
|
|
| 1,755.8 |
|
|
| 53.3 |
|
|
| 3.0 | % | ||||||||||
Rental and other revenue | 6.5 | 5.3 | 1.2 | 22.6 | % |
|
| 40.7 |
|
|
| 37.3 |
|
|
| 3.4 |
|
|
| 9.1 | % | |||||||||||
|
|
|
| |||||||||||||||||||||||||||||
Total revenue | $ | 1,694.3 | $ | 1,723.7 | $ | (29.4 | ) | (1.7 | %) |
| $ | 1,849.8 |
|
| $ | 1,793.1 |
|
| $ | 56.7 |
|
|
| 3.2 | % | |||||||
|
|
|
| |||||||||||||||||||||||||||||
The $30.6$53.3 million, or 1.8%3.0%, reductionincrease in revenue associated with the operation and management of correctional, detention, and detentionresidential reentry facilities consisted of a decreasean increase in revenue of approximately $54.4$48.5 million causedresulting from an increase of 2.8% in average revenue per compensated man-day and an increase in revenue of approximately $4.8 million generated primarily by one additional day of operations due to leap year in 2016. The increase in average revenue per compensated man-day from 2015 to 2016 was primarily a decreaseresult of the full activation of the South Texas Family Residential Center in the second quarter of 2015, as further described hereafter, and per diem increases at several of our other facilities.
68
Average daily compensated population was consistent from 2015 to 2016. However, there were several notable offsetting factors that affected the average daily compensated population during 2013 (including duewhen comparing 2015 to one fewer day of operations, for the leap year in 2012), partially offset by an increase of 0.6% in average revenue per compensated man-day. The reduction in revenue from 2012 to 2013 was also partially offset by an increase of $14.3 million of revenue resulting from Other Facility Related Activity, as further described hereafter.
2016. Average daily compensated population decreased 2,263, or 2.9%, from 2012 to 2013. We experienced declines in populations from the USMS across several of our facilities primarily in the southwest region of the United States resulting in the decline in average compensated population. During 2013, we housed an average daily population of approximately 9,300 USMS offenders compared with approximately 10,600 USMS offenders during 2012. A substantial portion of the reduction in USMS populations occurred at our California City Correctional Center. During the fourth quarter of 2013, we entered into an agreement to lease this facility to the CDCR, resulting in the removal of the federal inmate populations from this facility.
Additionally, the decline in average compensated population resulted from idling our 2,103-bed Mineral Wells facility in the third quarter of 2013 after the TDCJ elected not to renew its contract with us. The decline in average compensated population also resulted from the transition of California inmates out of our Red Rock facility during the fourth quarter of 2013 in order to prepare for the receipt of inmates under our new contract with the state of Arizona, as further described herein. These declines in average compensated population were partially offset2016 was positively affected by the activationacquisition of our 1,124-bed JenkinsAvalon Correctional Center in March 2012, as well as the activation of a 454-bed expansion at our McRae Correctional FacilityServices, Inc., or Avalon, in the fourth quarter of 2012.2015, the acquisition of CMI in the second quarter of 2016, and the activation of the Trousdale Turner Correctional Center in the fourth quarter of 2015. We began housing state of Tennessee inmates at the Trousdale facility in January 2016. Average compensated population was also positively affected by the full activation of the South Texas Family Residential Center in the second quarter of 2015. Average compensated population in 2016 was negatively affected by the expiration of our contract with the BOP at our Northeast Ohio Correctional Center effective May 31, 2015, and the decline in California inmates held in our out-of-state facilities, both as further described hereafter. Average compensated population was also negatively affected by the decline in offender populations within the state of Colorado and the expiration of our managed-only contract at the Winn Correctional Facility effective September 30, 2015, both as further described hereafter.
Our federal customers generated approximately 44%52% and 51% of our total revenue for both of the years ended December 31, 20132016 and 2012, but decreased $12.22015, respectively, increasing $42.7 million, or 4.7%. The increase in federal revenues primarily resulted from 2012the full activation of the South Texas Family Residential Center in the second quarter of 2015, partially offset by a decline in federal populations at our Northeast Ohio Correctional Center. The combined effect of per diem increases for several of our federal contracts and a net increase in federal populations at certain other facilities, primarily from ICE, also contributed to 2013. Our partners at the BOP, USMS, and ICE were impacted by the Budget Control Act of 2011, which mandated across the board spending cuts through a process called “sequestration”increase in order to meet overall discretionary spending limits in fiscal year 2013 and beyond.federal revenues.
67
State revenues from contracts at correctional, detention, and residential reentry facilities that we operate decreased 2.9%2.0% from 20122015 to 20132016 primarily as a result of idlinga decline in California inmates held in our Otter Creek facility during the third quarter of 2012 and our Mineral Wells facility in the third quarter of 2013.out-of-state facilities. In addition, the decrease in state revenues was a result of transitioning California inmates outthe expiration of our Red Rock facility during the fourth quarter of 2013 to prepare the facility for the commencement of a newmanaged-only contract with the state of Arizona on January 1, 2014. These declines wereLouisiana at the state-owned Winn Correctional Facility effective September 30, 2015. The decline in offender populations within the state of Colorado also contributed to the decrease in state revenues. The decrease in state revenues was partially offset by the activations ofrevenue generated at our Jenkinsnewly activated Trousdale Turner Correctional Center, and McRae facilities during 2012. Local revenues increased primarily as a result of new management contractsthe acquisitions of Avalon's eleven community corrections facilities in the fourth quarter of 2015 and CMI's seven community corrections facilities in the second quarter of 2016, each as further described hereafter. The acquisition of CAI.CMI also contributed to the $12.4 million, or 18.9%, increase in the revenue from local authorities from 2015 to 2016.
Operating Expenses
Operating expenses totaled $1,220.4$1,275.6 million and $1,217.1$1,256.1 million for the years ended December 31, 20132016 and 2012,2015, respectively. Operating expenses consist of those expenses incurred in the operation and management of correctional, detention, and detentionresidential reentry facilities, as well as at facilities we lease to third-party operators, and for our inmate transportation subsidiary.
Expenses incurred in connection with the operation and management of correctional, detention, and detentionresidential reentry facilities increased $4.2$23.6 million, or 0.3%,1.9% during 20132016 compared with 2012.2015. The increase in operating expenses was primarily a result of $16.9 millionthe activation of operating expenses resulting from Other Facility Related Activity, as further described hereafter. In addition, we experienced increases in salaries and benefits, inmate medical and food services, partially offset by decreases in operating expenses at certain facilities that experienced operational transitions. Most notably, operating expenses decreased as a result of idling the Otter CreekTrousdale Turner Correctional Center during the third quarter of 2012 and idling the Mineral Wells Pre-Parole Transfer Facility during the third quarter of 2013. Further, operating expenses at our Red Rock facility decreased as a result of transitioning California inmates out of the facility duringin the fourth quarter of 20132015, and the acquisitions of Avalon and CMI. The one additional day of operations due to prepareleap year in 2016 also contributed to the facility forincrease in operating expenses. The increase in operating expenses was partially offset by a reduction in expenses resulting from the commencementexpiration of a newour BOP contract at our Northeast Ohio Correctional Center effective May 31, 2015 and the expiration of our managed-only contract with the state of ArizonaLouisiana at the state-owned Winn Correctional Facility effective September 30, 2015. In addition, the increase in operating expenses was partially offset by a reduction in expenses that resulted from idling our Kit Carson Correctional Center in the third quarter of 2016, as further described hereafter, and from idling our North Fork Correctional Facility in the fourth quarter of 2015. We idled the North Fork facility as a result of a decline in California inmates held in our out-of-state program. In May 2016, we announced that we leased the North Fork Correctional Facility to the ODOC. The lease agreement commenced on JanuaryJuly 1, 2014. Operating expenses decreased $21.5 million at these three facilities during the year ended December 31, 2013.2016.
Fixed expenses per compensated man-day increased to $32.48$38.53 during the year ended December 31, 20132016 from $31.91$37.53 during the year ended December 31, 20122015. Fixed expenses per compensated man-day increased primarily as a result of an increase in salaries and benefits per compensated man-day of $0.20. We provided wage increases in the third quarters of 2011 and 2012 to the majority of our employees, which resulted in anman-day. The increase in operating expensessalaries and benefits per compensated man-day particularly aswas partially a result of these fixed expenses werebeing leveraged over lower inmate populations. We did not providesmaller offender populations at
69
certain facilities and due to wage increasesadjustments implemented during 2015. The increase in salaries and benefits per compensated man-day was also due to more favorable claims experience in our employee self-insured medical plan in the majority of our employees in 2013. However, in lieu of a wage increase, we elected to pay approximately $5.0 million in bonuses to non-management level staff.prior year. Salaries and benefits represent the most significant component of fixedour operating expenses, representing approximately 65%59% of our total operating expenses during both 20132016 and 2012.2015.
Variable expenses increased $0.13 per compensated man-day during the year ended December 31, 2013 from the year ended December 31, 2012. Increases in inmate medical and contractual inflationary increases in food service were partially offset by the implementation of certain sales tax strategies which reduced variable expenses per compensated man-day by $0.15 in 2013.
68
The following tables display the revenue and expenses per compensated man-day for the facilities placed into service that we own and manage and for the facilities we manage but do not own:own, which we believe is useful to our financial statement users:
| For the Years Ended December 31, |
| For the Years Ended December 31, |
| |||||||||||||
| 2013 | 2012 |
| 2016 |
|
| 2015 |
| |||||||||
Owned and Managed Facilities: |
|
|
|
|
|
|
|
| ||||||||
Revenue per compensated man-day | $ | 68.19 | $ | 67.61 |
| $ | 82.76 |
|
| $ | 81.32 |
| ||||
Operating expenses per compensated man-day: |
|
|
|
|
|
|
|
| ||||||||
Fixed expense | 35.02 | 34.13 |
|
| 41.44 |
|
|
| 40.55 |
| ||||||
Variable expense | 10.66 | 10.46 |
|
| 16.19 |
|
|
| 16.16 |
| ||||||
|
| |||||||||||||||
Total | 45.68 | 44.59 |
|
| 57.63 |
|
|
| 56.71 |
| ||||||
|
| |||||||||||||||
Operating income per compensated man-day | $ | 22.51 | $ | 23.02 |
| $ | 25.13 |
|
| $ | 24.61 |
| ||||
|
| |||||||||||||||
Operating margin | 33.0 | % | 34.0 | % |
|
| 30.4 | % |
|
| 30.3 | % | ||||
|
| |||||||||||||||
Average compensated occupancy | 81.6 | % | 85.1 | % |
|
| 75.6 | % |
|
| 79.9 | % | ||||
|
| |||||||||||||||
Average available beds | 67,588 | 67,340 |
|
| 69,984 |
|
|
| 65,073 |
| ||||||
|
| |||||||||||||||
Average compensated population | 55,123 | 57,337 |
|
| 52,942 |
|
|
| 52,007 |
| ||||||
|
| |||||||||||||||
Managed Only Facilities: | ||||||||||||||||
Revenue per compensated man-day | $ | 40.14 | $ | 39.69 | ||||||||||||
Operating expenses per compensated man-day: | ||||||||||||||||
Fixed expense | 25.68 | 25.72 | ||||||||||||||
Variable expense | 9.20 | 9.21 | ||||||||||||||
|
| |||||||||||||||
Total | 34.88 | 34.93 | ||||||||||||||
|
| |||||||||||||||
Operating income per compensated man-day | $ | 5.26 | $ | 4.76 | ||||||||||||
|
| |||||||||||||||
Operating margin | 13.1 | % | 12.0 | % | ||||||||||||
|
| |||||||||||||||
Average compensated occupancy | 96.6 | % | 96.8 | % | ||||||||||||
|
| |||||||||||||||
Average available beds | 21,306 | 21,306 | ||||||||||||||
|
| |||||||||||||||
Average compensated population | 20,575 | 20,624 | ||||||||||||||
|
| |||||||||||||||
|
| For the Years Ended December 31, |
| |||||
|
| 2016 |
|
| 2015 |
| ||
Managed Only Facilities: |
|
|
|
|
|
|
|
|
Revenue per compensated man-day |
| $ | 42.62 |
|
| $ | 41.18 |
|
Operating expenses per compensated man-day: |
|
|
|
|
|
|
|
|
Fixed expense |
|
| 26.81 |
|
|
| 26.38 |
|
Variable expense |
|
| 11.29 |
|
|
| 10.53 |
|
Total |
|
| 38.10 |
|
|
| 36.91 |
|
Operating income per compensated man-day |
| $ | 4.52 |
|
| $ | 4.27 |
|
Operating margin |
|
| 10.6 | % |
|
| 10.4 | % |
Average compensated occupancy |
|
| 94.8 | % |
|
| 93.7 | % |
Average available beds |
|
| 13,898 |
|
|
| 15,048 |
|
Average compensated population |
|
| 13,170 |
|
|
| 14,104 |
|
Owned and Managed Facilities
Facility net operating income or the operating income or loss from operations before interest, taxes, asset impairments, depreciation and amortization, at our owned and managed facilities decreasedincreased by $38.4$29.9 million, from $483.1$505.7 million during the year ended December 31, 2012in 2015 to $444.7$535.6 million during the year ended December 31, 2013, a decreasein 2016, an increase of 7.9%5.9%. The decrease in facilityFacility net operating income at our owned and managed facilities during 2013 is largelyin 2016 was favorably impacted by the resultfull activation of reductions in marginsthe South Texas Family Residential Center. The aforementioned $48.7 million and $38.4 million aggregate depreciation and interest expense associated with declines in USMS populations at certain facilities, the termination of the contract at our Mineral Wells Pre-Parole Transfer Facility, a decrease in ICE populationslease at the StewartSouth Texas Family Residential Center in the years ended December 31, 2016 and North Georgia facilities, and a decrease2015, respectively, are not included in inmate populations from the CDCR. Additionally, the aforementioned wage increases provided to the majority of our employees in July 2011 and 2012 and the bonuses in lieu of raises for non-management level employees during 2013 also contributed to the decline in facility net operating income.
In July 2013, we extended our agreement with the CDCR to continue to house inmates at the four facilities we currently operate for them in Arizona, Oklahoma, and Mississippi. The
69
extension, which runs through June 30, 2016, also allowed CDCR to transition California inmates previously housed at our Red Rock Correctional Center to our other facilities. Accordingly, as of December 31, 2013, all of the California inmates were removed from our Red Rock Correctional Center in order to prepare for the receipt of inmates under our new contract with the state of Arizona, which commenced January 1, 2014. While the transition resultedincome amounts reported above, but are included in the loss of some of the inmates housed at the Red Rock facility, the transition plan included retention and transfer of certain inmates to our other facilities. The calculations of revenue and expenses per compensated man-day statistics.
In September 2014, we announced that we agreed to an expansion of an existing IGSA between the city of Eloy, Arizona and ICE to house up to 2,400 individuals at the South Texas Family Residential Center, a facility we lease in Dilley, Texas. The services provided under the preceding table exclude revenues (and compensated man-days) earned and expenses incurred duringoriginal amended IGSA commenced in the fourth quarter of 2013 for the Red Rock facility because of the distorted impact they have on the statistics due to the transition to a new contract.
In October 2011, we announced that, pursuant to a competitive re-bid, we received a new contract from the BOP for the expansion2014 and continued management of our McRae Correctional Facility in Georgia. We experienced a reduction in operating margin at this facility effective with the commencement of the new contract in December 2012. We accepted this contract even though it provides us with a lower margin because it also provides for a longhad an original term contract of up to ten years, including extension options,four years. In October 2016, we entered into an amended IGSA that provided for a
70
new, lower fixed monthly payment that commenced in November 2016, and allows us to protect our market share. Further,extended the term of the contract guarantees a BOP population equal to 90%through September 2021.
ICE began housing the first residents at the facility in the fourth quarter of 2014, and the expanded rated capacity and a per diem payment for each additional inmate thereafter.
Duringsite was completed during the second quarter of 2013,2015. In accordance with the multiple-element arrangement guidance, a portion of the fixed monthly payments to us pursuant to the IGSA is recognized as lease and service revenue. During the years ended December 31, 2016 and 2015, we recognized $267.3 million and $244.7 million, respectively, in total revenue associated with the facility. The original IGSA with ICE had a favorable impact on the revenue and net operating income of our owned and managed facilities during the years ended December 31, 2016 and 2015. Operating margin percentages at this facility were comparable to those of our average owned and managed facilities during 2015, but increased during 2016 as expenses normalized for stabilized operations.
During the first quarter of 2015, the adult inmate population held in state of California institutions first met a Federal court order to reduce inmate populations below 137.5% of its capacity. Inmate populations in the state continued to decline below the court ordered capacity limit which resulted in declining inmate populations in the out-of-state program at facilities we own and operate. As of December 31, 2016, the adult inmate population held in state of California institutions remained in compliance with the Federal court order at approximately 134.0% of capacity, or approximately 114,000 inmates, which did not include the California inmates held in our out-of-state facilities. During the years ended December 31, 2016 and 2015, we housed an average daily population of approximately 4,900 and 7,300 California inmates, respectively, in facilities outside the state as a partial solution to the State's overcrowding. This decline in population, net of the revenue generated by one additional day of operations due to leap year in 2016, resulted in a decrease in revenue of $57.1 million from the year ended December 31, 2015 to the year ended December 31, 2016.
Approximately 6% and 10% of our total revenue for the years ended December 31, 2016 and 2015, respectively, was generated from the CDCR in facilities housing inmates outside the state of California.
During December 2014, the BOP announced that the TDCJit elected not to renew its contract forwith us at our owned and managed 2,103-bed Mineral Wells Pre-Parole Transfer2,016-bed Northeast Ohio Correctional Center. The contract with the BOP at this facility expired on May 31, 2015. Facility due to a legislative budget reduction. As a result, upon expiration of the contract in August 2013, we ceased operations and idled the Mineral Wells facility. Further, the KDOC provided us notice during the second quarter of 2013 that it was not going to award a contract under the RFP that would have allowed for the KDOC’s continued use of our owned and managed 826-bed Marion Adjustment Center. We also idled the Marion Adjustment Center following the transfer of the populations during September 2013. These two facilities generated combined facility net operating losses of $1.1income decreased by $9.8 million forfrom the year ended December 31, 2013, compared with facility net operating income of $6.6 million for2015 to the year ended December 31, 2012.2016 as a result of this reduction in inmate population. In December 2016, we announced a new contract award from ICE at the Northeast Ohio facility in order to assist ICE with their current detention needs. The new contract contained an initial term expiring March 31, 2017, with three six-month renewal periods at the option of ICE.
DuringBased on a decline in offender populations within the state of Colorado and available capacity at other facilities we own in Colorado, we idled our 1,488-bed Kit Carson Correctional Center during the third quarter of 2013,2016. Inmate populations from the Kit Carson Correctional Center were transferred to the remaining two company-owned facilities that we began hiring staff atcontinue to operate for the DiamondbackColorado Department of Corrections, the Bent County Correctional Facility in order to reactivateand the facility for future operations. Our decision to activate the facility was made as a result of potential need for additional beds by certain state customers. While we began to incur expenditures associated with the activation of these beds, we did not have a customer contract and, as previously described herein, we subsequently made the decision to re-idle the facility. The de-activation was completed near the end of the second quarter of 2014. The calculations of expenses per man-day in the preceding table exclude expenses incurred duringCrowley County Correctional Facility.
During the fourth quarter of 2013 for2015, we closed on the Diamondback facility becauseacquisition of 100% of the distorted impact they havestock of Avalon, along with two additional facilities operated by Avalon. The acquisition included 11 community corrections facilities with approximately 3,000 beds in Oklahoma, Texas, and Wyoming. We acquired Avalon, which specializes in community correctional services, drug and alcohol treatment services, and residential reentry services, as a strategic investment that continues to expand the reentry assets we own and the services we provide.
On April 8, 2016, we closed on the statistics.acquisition of 100% of the stock of CMI along with the real estate used in the operation of CMI's business from two entities affiliated with CMI. CMI, a privately held community corrections company that operates seven community corrections facilities, including six owned and one leased, with approximately 600 beds in Colorado, specializes in community correctional services, drug and alcohol treatment services, and residential reentry services. CMI provides these services through multiple contracts with three counties in Colorado, as well as the Colorado Department of Corrections, a pre-existing partner of ours. We acquired CMI as a strategic investment that continues to expand the reentry assets we own and the services we provide.
71
Total revenue generated from the acquisitions of Avalon and CMI during 2016 totaled $45.1 million.
Managed-Only Facilities
Total revenue at our managed onlymanaged-only facilities increased $1.9decreased $6.6 million, from $299.6$212.0 million in 20122015 to $301.5$205.4 million in 2013. Revenue per compensated man-day increased2016. The decrease in revenues at our managed-only facilities was largely the result of our decision to $40.14 from $39.69, or 1.1%, for 2013 compared withexit the prior year.contract at the Winn Correctional Center effective September 30, 2015. Facility net operating income at our managed-only facilities increased $3.6decreased $0.2 million, from $35.9$22.0 million during the year ended December 31, 20122015 to $39.6$21.8 million during the year ended December 31, 2013.
70
Operating expenses per compensated man-day decreased to $34.88 during the year ended December 31, 2013 from $34.93 during the year ended December 31, 2012 largely due to favorable claims experience associated with our self-insured employee medical expenses.
2016. During 20132016 and 2012,2015, managed-only facilities generated 8.2%3.9% and 6.9%4.2%, respectively, of our total facility net operating income.
Other Facility Related Activity
In October 2013,April 2015, we provided notice to the state of Louisiana that we would cease management of the contract at the 1,538-bed Winn Correctional Center within 180 days, in accordance with the notice provisions of the contract. Management of the facility transitioned to another operator effective September 30, 2015. We incurred a facility net operating loss at the Winn Correctional Center of $3.9 million during the time the facility was active in 2015. In anticipation of terminating the contract at this facility, we also recorded an asset impairment of $1.0 million during the first quarter of 2015 for the write-off of goodwill associated with the Winn facility.
Other Portfolio-Related Activity
On August 27, 2015, we acquired four community corrections facilities from a privately held owner of community corrections facilities and other government leased assets. The four acquired community corrections facilities have a capacity of approximately 600 beds and are leased to The GEO Group, Inc., or GEO, under triple net lease agreements that extend through July 2019 and include multiple five-year lease extension options. GEO separately contracts with the Pennsylvania Department of Corrections and the Philadelphia Prison System to provide rehabilitative and reentry services to residents and inmates at the leased facilities. We acquired the four facilities in the real estate-only transaction as a strategic investment that expands our investment in residential reentry facilities.
In May 2016, we entered into a lease with the ODOC for our 2,304-bed California Citypreviously idled 2,400-bed North Fork Correctional Center with the CDCR.Facility. The lease agreement commenced on July 1, 2016, and includes a three-yearfive-year base term that commenced December 1, 2013, with unlimited two-year renewal optionsoptions. However, the lease agreement permitted the ODOC to utilize the facility for certain activation activities and, therefore, revenue recognition began upon mutual agreement. Annual baseexecution of the lease. The average annual rent to be recognized during the three-yearfive-year base term is fixed at $28.5$7.3 million, including annual rent in the fifth year of $12.0 million. After the three-yearfive-year base term, the annual rent will be increased annually byequal to the lesser of CPI (Consumerrent due during the prior lease year, adjusted for increases in the Consumer Price Index)Index, or 2%.CPI. We will beare responsible for repairs and maintenance, property taxes and property insurance, while all other aspects and costs of facility operations will beare the responsibility of the CDCR.ODOC.
On June 10, 2016, we acquired a residential reentry facility in Long Beach, California from a privately held owner. The 112-bed facility is leased to GEO under a triple net lease agreement that extends through June 2020 and includes one five-year lease extension option. GEO separately contracts with the CDCR to provide rehabilitative and reentry services to residents at the leased facility. We also provided $10.0 million in tenant improvements at no additional cost toacquired the CDCR.
Revenues and operating expenses during the fourth quarter of 2013 were impacted due to a one-time contract adjustment by one of our federal partners. The contract adjustment resulted in a $13.0 million expense accrualfacility in the fourth quarter of 2013real estate–only transaction as well as an offsetting $13.0 million revenue accrual as the federal partner is obligated to reimburse us for the increased costs resulting from the contract adjustment. Both the revenue and expense accruals were revised to $9.0 million during the first quarter of 2014, resultinga strategic investment that further expands our investment in a reduction of both revenue and operating expenses by $4.0 million. Because of the distorted impact these amounts would have on the per compensated man-day statistics presented in the previous table, the revenue and expenses related to this adjustment were not included.residential reentry facilities.
General and administrative expense
For the years ended December 31, 20132016 and 2012,2015, general and administrative expenses totaled $103.6$107.0 million and $88.9$103.9 million, respectively. General and administrative expenses consist primarily of corporate management salaries and benefits, professional fees and other administrative expenses. GeneralWe incurred $1.6 million and administrative$3.6 million of expenses during 2013 included professional fees and expenses of $10.3 million associated within the conversion of our corporate structure to a REIT effective January 1, 2013, compared with $4.2 million during 2012. During the yearyears ended December 31, 2013,2016 and 2015, respectively, associated with mergers and acquisitions.
Depreciation and Amortization
For the years ended December 31, 2016 and 2015, depreciation and amortization expense totaled $166.7 million and $151.5 million, respectively. Our depreciation and amortization expense increased as a result of completion of
72
construction of the 2,400-bed South Texas Family Residential Center in the second quarter of 2015. Prior to the second quarter of 2015, residents had been housed in pre-existing housing units on the property. In accordance with ASC 840-40-55, we incurred depreciation expense for the constructed assets at this facility of $38.7 million and $29.9 million during the years ended December 31, 2016 and 2015, respectively. Depreciation expense also incurred $0.8 millionincreased in connection with our acquisition2016 due to the completion of CAI.the Trousdale Turner Correctional Center construction project in the fourth quarter of 2015.
Interest expense, net
Interest expense was reported net of interest income and capitalized interest for the years ended December 31, 20132016 and 2012.2015. Gross interest expense, net of capitalized interest, was $47.1$68.9 million and $60.5$51.8 million for 20132016 and 2012,2015, respectively. Gross interest expense during these periods was based on outstanding borrowings under our revolving credit facility, our outstanding Term Loan, and our outstanding senior notes, as well as the amortization of loan costs and unused facility fees. We also incur interest expense associated with the lease of the South Texas Family Residential Center, in accordance with ASC 840-40-55. Our interest expense increased in 2016 as a result of completion of construction of the 2,400-bed South Texas Family Residential Center in the second quarter of 2015. Interest expense associated with the lease of this facility was $10.0 million and $8.5 million during the years ended December 31, 2016 and 2015, respectively.
We benefited from relatively low interest rates on our revolving credit facility, which is largely based on the LIBOR. The interest rate on our revolving credit facility was at LIBOR plus a margin of 1.50% throughout 20131.75% during the first six months of 2015. During July 2015, we amended and 2012.
Our interest expense was lower in 2013 comparedrestated the revolving credit facility agreement to, 2012 as we redeemed during 2012 allamong other modifications, reduce by 0.25% the applicable margin of base rate and LIBOR loans. Based on our $375.0 million 6.25% senior unsecured notes and all of our $150.0 million 6.75% senior unsecured notes with the expanded capacityleverage ratio, loans under our revolving credit facility during the last six months of 2015 and cashduring 2016 were at the base rate plus a margin of 0.50% or at LIBOR plus a margin of 1.50%, and a commitment fee equal to 0.35% of the unfunded balance.
In October 2015, we obtained a $100.0 million Term Loan under the "accordion" feature of our revolving credit facility. Interest rates under the Term Loan are the same as the interest rates under our revolving credit facility, except that the interest rate on
the Term Loan was at a base rate plus a margin of 0.50% or at LIBOR plus a margin of 1.75% during the first two fiscal quarters following closing of the Term Loan. We used net proceeds from the Term Loan to pay down a portion of our revolving credit facility. The Term Loan has a maturity of July 2020, with scheduled principal payments in years 2016 through 2020.71
hand. AsOn September 25, 2015, we completed the offering of $250.0 million aggregate principal amount of 5.0% senior notes due October 15, 2022. We used net proceeds from the offering to pay down a portion of our revolving credit facility which had a variable weighted average interest rate of 2.2% at December 31, 2016. While our interest expense increased during the year ended December 31, 2016 compared with the prior year as a result of these redemptions,this refinancing transaction completed in 2015, we reduced our exposure to variable rate debt, extended our weighted average interest rate. Duringmaturity, and increased the second quarter of 2013, we completed several refinancing transactions which resulted in a further reduction toavailability under our interest expense.revolving credit facility.
Gross interest income was $2.0$1.1 million and $2.1 million respectively, for the years ended December 31, 20132016 and 2012.2015, respectively. Gross interest income iswas earned on a direct financing lease, notes receivable, investments, and cash and cash equivalents. Capitalized interest was $0.8$0.6 million and $1.1$5.5 million during 2013 and 2012, respectively, and was associated with various construction and expansion projects.
Expenses associated with debt refinancing transactions
During the yearyears ended December 31, 2013, we reported charges2016 and 2015, respectively. Capitalized interest decreased as a result of $36.5 million for third-party feesthe completion of the Otay Mesa Detention Center and expensesthe Trousdale Turner Correctional Center construction projects in the fourth quarter of 2015. Capitalized interest in 2016 was primarily associated with the tender offer and redemption for all ofexpansion project at our outstanding 7.75% senior unsecured notes, consisting of the write-off of loan costs and the unamortized discount on the 7.75% senior unsecured notes, the tender fees and expenses associated with the purchase, and the redemption premium paid on the 7.75% senior unsecured notes.Red Rock Correctional Center.
During the year ended December 31, 2012, we reported charges of $2.1 million in connection with debt refinancing transactions, consisting of $1.7 million for the write-off of loan costs associated with an amendment to our revolving credit facility, various redemptions of senior unsecured notes during 2012, and $0.4 million of fees paid in connection with the tender offer for our 6.25% senior unsecured notes in the first quarter of 2012.
Income tax expense
During the years ended December 31, 20132016 and 2012,2015, our financial statements reflected an income tax benefitexpense of $135.0$8.3 million and an income tax expense of $87.5$8.4 million, respectively. The income tax benefit during 2013 is due primarily to the $137.7 million net tax benefit recorded in the first quarter resulting from the revaluation of certain deferred tax assets and liabilities associated with the REIT conversion effective January 1, 2013. Our effective tax rate was 3.6% during both the year ended 2013 was approximately 6.2%, excluding the aforementioned net tax benefit and the income tax benefit of certain other items, and was 35.8% during the yearyears ended December 31, 2012. Our effective tax rate is significantly lower in 2013 as a result of our election to be taxed as a REIT effective January 1, 2013.2016 and 2015. As a REIT, we are entitled to a deduction for dividends paid, resulting in a substantial reduction in the amount of federal income tax expense we recognize. Substantially all of our income tax expense is incurred
73
based on the earnings generated by our TRSs. Our overall effective tax rate is estimated based on the current projection of taxable income primarily generated inby our TRSs.
Discontinued operations
In November 2011, we announced a joint decision with the state of Mississippi to cease operations of the 1,172-bed Delta Correctional Facility in Greenwood, Mississippi. We began ramping down the population of approximately 900 inmates from the state-owned facility in December 2011 and completely closed the facility in January 2012. Accordingly, we reclassified the results of operations, net of taxes, and the assets and liabilities of this facility as discontinued operations upon termination of operations in the first quarter of 2012 for all periods presented. The facility operated at a loss of $0.4 million, net of taxes, for the year ended December 31, 2012.
During the second quarter of 2013, we announced that the TDCJ elected not to renew its contract for the 2,216-bed managed-only Dawson State Jail in Dallas, Texas due to a
72
legislative budget reduction. As a result, upon expiration of the contract in August 2013, we ceased operations of the Dawson State Jail. During the second quarter of 2013, we also received notification that we were not selected for the continued management of the 1,000-bed managed-only Wilkinson County Correctional Facility in Woodville, Mississippi at the end of the contract on June 30, 2013. Accordingly, the results of operations, net of taxes, and the assets and liabilities of the Dawson and Wilkinson facilities have been reported as discontinued operations for all periods presented. The Dawson and Wilkinson facilities operated at a combined loss of $3.8 million and a combined profit of $0.2 million, net of taxes, for the years ended December 31, 2013 and 2012, respectively.
LIQUIDITY AND CAPITAL RESOURCES
Our principal capital requirements are for working capital, stockholder distributions, capital expenditures, and debt service payments. Capital requirements may also include cash expenditures associated with our outstanding commitments and contingencies, as further discussed in the notes to our financial statements. Additionally, we may incurour capital expenditures may include M&A activities that will enable us to further expand our network of residential reentry centers, grow our portfolio of government-leased properties, and acquire other businesses that provide complementary services. We will continue to pursue opportunities to help our government partners meet their infrastructure needs, primarily through the design capacitydevelopment and redevelopment of certain of our facilities (in ordercriminal justice sector assets, but also by acquiring other real estate assets with a bias toward those used to retain management contracts) and to increase our inmate bed capacity for anticipated demand from current and future customers. We may acquire additional correctional facilitiesprovide mission-critical governmental services, that we believe have favorable investment returns, diversify our cash flows, and increase value to our stockholders. We will also consider opportunities for growth, including, but not limitedrespond to potential acquisitions of businesses within our line of businesscustomer demand and those that provide complementary services, providedmay develop or expand correctional and detention facilities when we believe such opportunities will broaden our market share and/or increasepotential long-term returns justify the services we can provide to our customers.
On July 31, 2013, we closed on the acquisition of CAI, a privately held community corrections company, for an all cash purchase price of approximately $36.5 million, excluding transaction related expenses. Founded in 1987, CAI provides cost-effective solutions for housing and rehabilitation through community corrections and re-entry services. CAI operates two facilities concentrating on community corrections and specializing in work furloughs, residential re-entry programs and home confinement for San Diego County and BOP residents. Through the CAI acquisition, we acquired a 120-bed facility and control a 483-bed facility through a long-term lease.capital deployment.
To qualify and be taxedmaintain our qualification as a REIT, we generally are required to distribute annually to our stockholders at least 90% of our REIT taxable income (determined without regard to the dividends paid deduction and excluding net capital gains). Our REIT taxable income will not typically include income earned by our TRSs except to the extent our TRSs pay dividends to the REIT. Our Board of Directors declared a quarterly dividend of $0.51$0.42 for each quarter of 20142017 totaling $239.1$199.8 million. The amount, timing and frequency of future distributions will be at the sole discretion of our Board of Directors and will be declared based upon various factors, many of which are beyond our control, including our financial condition and operating cash flows, limitations under our debt covenants, the amount required to maintain qualification and taxation as a REIT and to reduce any income and excise taxes that we otherwise would be required to pay, limitations on distributions in our existing and future debt instruments, our ability to utilize net operating losses, or NOLs, to offset, in whole or in part, our REIT distribution requirements, limitations on our ability to fund distributions using cash generated through our TRSs, alternative growth opportunities that require capital deployment, and other factors that our Board of Directors may deem relevant.
As of December 31, 2014,2017, our liquidity was provided by cash on hand of $74.4$52.2 million, and $358.7$694.1 million available under our $900.0 million revolving credit facility. Our liquidity was further increased by the pay-down of our revolving credit facility with net proceeds from the issuance of $250.0 million, 4.75% unsecured notes on October 13, 2017. During the yearyears ended December 31, 20142017 and 2013,2016, we generated $423.6$341.3 million and $369.5$375.4 million, respectively, in cash through operating activities, and as of December 31, 2014,2017, we had net working capital of $47.0$36.7 million. We currently expect to be able to meet our cash expenditure
73
requirements for the next year utilizing these resources. None of our outstanding debt requires scheduled principal repayments and weWe have no debt maturities until December 2017.April 2020.
Our cash flow is subject to the receipt of sufficient funding of and timely payment by contracting governmental entities. If the appropriate governmental agency does not receive sufficient appropriations to cover its contractual obligations, it may terminate our contract or delay or reduce payment to us. Delays in payment from our major customers or the termination of contracts from our major customers could have an adverse effect on our cash flow, and financial condition. and, consequently, dividend distributions to our shareholders.
Debt and equity
On October 13, 2017, we completed the offering of $250.0 million aggregate principal amount of unsecured notes with a fixed stated interest rate of 4.75%, due October 15, 2027. We used net proceeds from the offering to pay down a portion of our revolving credit facility, for working capital and other general corporate purposes.
As of December 31, 2014,2017, we had $350.0 million principal amount of unsecured notes outstanding with a fixed stated interest rate of 4.625%, $325.0 million principal amount of unsecured notes outstanding with a fixed stated interest rate of 4.125%, $250.0 million principal amount of unsecured notes outstanding with a fixed stated interest rate of 5.0%, and $525.0$250.0 million principal amount of unsecured notes outstanding with a fixed stated interest rate of 4.75%. In addition, we had $85.0 million outstanding under our Term Loan with a variable interest rate of 3.1% and $199.0 million outstanding under our revolving credit facility with a variable weighted average interest rate of 1.9%3.1%. AtAs of December 31, 2014,2017, our total weighted average effective interest rate was 3.6%4.7%, while our total weighted average
74
maturity was 5.24.8 years. We may also have the flexibilityseek to issue debt or equity securities from time to time when we determine that market conditions and the opportunity to utilize the proceeds from the issuance of such securities are favorable.
On March 21, 2013, Standard & Poor’sFebruary 26, 2016, we entered into an ATM Equity Offering Sales Agreement, or ATM Agreement, with multiple sales agents. Pursuant to the ATM Agreement, we may offer and sell to or through the sales agents from time to time, shares of our common stock, par value $0.01 per share, having an aggregate gross sales price of up to $200.0 million. Sales, if any, of our shares of common stock will be made primarily in "at-the-market" offerings, as defined in Rule 415 under the Securities Act of 1933, as amended. The shares of common stock will be offered and sold pursuant to our registration statement on Form S-3 ASR filed with the SEC on May 15, 2015, and a related prospectus supplement dated February 26, 2016. We intend to use the net proceeds from any sale of shares of our common stock to repay borrowings under our revolving credit facility (including the Term Loan under the "accordion" feature of the revolving credit facility) and for general corporate purposes, including to fund future acquisitions and development projects. There were no shares of our common stock sold under the ATM Agreement during the years ended December 31, 2017 and 2016.
On August 19, 2016, Moody's Investors Service, or Moody's, downgraded our senior unsecured debt rating to "Ba1" from "Baa3". Also on August 19, 2016, S&P Global Ratings, Services raisedor S&P, lowered our corporate credit and senior unsecured debt ratings to "BB" from "BB+". Additionally, S&P lowered our revolving credit facility rating to “BB+”"BBB-" from “BB”"BBB". Both Moody's and also assignedS&P lowered our ratings as a “BB+” ratingresult of the Department of Justice, or DOJ, announcing its plans on August 18, 2016 to our unsecured notes. Additionally,reduce the BOP's utilization of privately operated prisons. On February 21, 2017, the U.S. Attorney General rescinded the memorandum issued on April 5, 2013, Standard & Poor’s Ratings Services assigned a ratingAugust 18, 2016 by the Deputy Attorney General of “BBB” to our $900.0 million revolving credit facility.the DOJ. On February 7, 2012, Fitch Ratings assigned a rating of “BBB-”"BBB-" to our revolving credit facility and “BB+”"BB+" ratings to our unsecured debt and corporate credit. On January 31, 2013, Fitch Ratings affirmed these ratings in connection with our intention to convert to a REIT and reaffirmed them on January 26, 2015. On June 3, 2011, Moody’s raised our senior unsecured debt rating to “Ba1” from “Ba2” and revised the outlook on our debt rating from positive to stable. On March 21, 2013, Moody’s revised the rating outlook to positive from stable, and affirmed the senior unsecured rating at “Ba1”.
Facility acquisitions, development, and capital expenditures
In orderWe acquired the following properties in 2017 for a combined total cost of $49.5 million in cash, excluding transaction-related expenses and including contingent consideration that we expect to retain federal inmate populationspay, and funded the transactions utilizing available cash on hand:
On January 1, 2017, we currently manageacquired ACTC, a 135-bed residential reentry center in Englewood, Colorado that we operate;
On February 10, 2017, we acquired, as a real estate-only transaction, the Stockton Female Community Corrections Facility, a 100-bed residential reentry center in Stockton, California, which is leased to a third-party operator that separately contracts with the CDCR;
On June 1, 2017, we acquired the real estate operated by Center Point, a California-based non-profit organization. We consolidated a portion of Center Point's operations into our preexisting residential reentry center portfolio and assumed ownership and operations of the Oklahoma City Transitional Center, a 200-bed residential reentry center in Oklahoma City, Oklahoma;
On August 1, 2017, we acquired NBTC, an Arizona-based community corrections company, along with the real estate used in the 1,154-bed San Diegooperation of NBTC's business from an affiliate of NBTC. In connection with the NBTC acquisition, we assumed a contract with the BOP to provide reentry services to male and female adults at the 92-bed Oracle Transitional Center located in Tucson, Arizona;
On September 15, 2017, we acquired a portfolio of four properties, including a 230-bed residential reentry center leased to the state of Georgia and three properties in North Carolina and Georgia leased to the GSA, two of which are occupied by the SSA and one of which is occupied by the IRS; and
On November 1, 2017, we acquired TTC, a Colorado-based community corrections company. In connection with the acquisition, we assumed contracts with Adams County, Colorado to provide reentry services to male and female adults in three facilities located in Colorado containing a total of 422 beds.
We acquired these properties as strategic investments that further expand our network of residential reentry centers and further diversify our cash flows through government-leased properties.
75
Effective January 1, 2018, we closed on the acquisition of Rocky Mountain Offender Management Systems, LLC, which provides non-residential correctional alternatives, including electronic monitoring and case management services, to municipal, county, and state governments in eight states. The aggregate purchase price was $7.0 million, excluding transaction-related expenses.
On January 19, 2018, we acquired the 261,000 square-foot Capital Commerce Center, located in Tallahassee, Florida for a purchase price of $44.7 million, excluding transaction-related costs and certain closing credits. Capital Commerce Center is 98% leased, and 87% leased to the state of Florida on behalf of the Florida Department of Business and Professional Regulation. The acquisition was financed with a $24.5 million non-recourse mortgage note, which is fully-secured by the Capital Commerce Center property, with an interest rate of 4.5%, maturing in 2033, and cash from our $900.0 Million Revolving Credit Facility.
On January 24, 2018, we entered into a 20-year lease agreement with the Kansas Department of Corrections for a 2,432-bed correctional facility we will construct in Lansing, Kansas, for a total project cost of approximately $155.0 million to $165.0 million. The new facility will replace the Lansing Correctional Facility, we are constructing the 1,492-bed Otay Mesa Detention Center atState's largest correctional complex for adult male inmates, originally constructed in 1863. This transaction represents the first development of a site in San Diego. The existing San Diego Correctional Facility is subjectprivately owned, build-to-suit correctional facility to be operated by a groundgovernment agency through a long-term lease withagreement. We will be responsible for facility maintenance throughout the County of San Diego. Under the provisions20-year term of the lease, the facility is divided into three different properties whereby, pursuant to an amendmentat which time ownership will revert to the ground lease executed in January 2010, ownershipState. Construction of the entire facility reverts to the County upon expiration of the lease on December 31, 2015. As of December 31, 2014, we have invested approximately $121.5 million related to the new facility. We have developed plans to build the Otay Mesa Detention Center within a construction timeline that coincides with the expiration of the ground lease with the County of San Diego. We currently estimate the total construction cost, inclusive of land and site development costs already incurred, will range from approximately $153.0 million to $157.0 million. We plan to offer this new facility to house the existing federal inmate populations at the San Diego Correctional Facility.
In November 2013, we announced our decision to re-commence construction of a correctional facility in Trousdale County, Tennessee. We suspended construction of this facility in 2009 until we had greater clarity around the timing of a new contract. In October 2013, Trousdale County received notice from the Tennessee Department of Corrections of its intent to partner with the County to develop a new correctional facility to house state of
74
Tennessee inmates. In April 2014, we entered into an agreement with Trousdale County whereby we agreed to finance, design, build and operate a 2,552-bed facility to meet the responsibilities of a separate IGSA between Trousdale County and the state of Tennessee regarding correctional services. In July 2014, we received notice that Trousdale County and the state of Tennessee finalized the IGSA. The IGSA with the state of Tennessee includes a minimum monthly payment plus a per diem payment for each inmate housed in the facility in excess of 90% of the design capacity, provided that during a twenty-six week ramp period the minimum payment is based on the greater of the number of inmates actually at the facility or 90% of the beds available pursuant to the ramp schedule. Total cost of the Trousdale Turner Correctional Center is estimated at approximately $140.0 million to $145.0 million, including $60.7 million invested through December 31, 2014. The construction estimate includes capital investment funding to achieve Leadership in Energy and Environmental Design (“LEED”) certification and upgrade fixtures that reduce both water and energy consumption during the life of the facility. These investments support our belief in corporate responsibility to both the global environment and the local community in which facilities are located. Construction is expected to be completed in the fourth quarter of 2015, with the intake of inmate populations expected to begincommence in the first quarter of 2016.
In addition to these two new facility construction projects, we entered into an amended agreement2018 with ICE whereby we agreed to construct additional administrative spacea timeline for ICE at our Stewart Detention Center. We expect to incurcompletion of approximately $6.0 million, including $0.6 million invested through December 31, 2014, in construction costs and expect to complete24 months. With the projectextensively aged criminal justice infrastructure in the second quarter of 2015. In order for ICEU.S. today, we believe we can bring our flexible solutions like this to ensure its access to the beds at the Stewart facility, the amended agreement also includes a fixed monthly payment for 1,600 beds which will take effect once the expansion is completed. Additionally, we expect to incur approximately $24.0 million, including $9.1 million invested through December 31, 2014, in certain leasehold improvements and furniture, fixtures and equipment at the South Texas Family Residential Center, which amount is in addition to the lease payments under the lease agreement. We expect to complete these additions by the end of the second quarter of 2015 when the South Texas facility is expected to be ready for full occupancy.other government agencies.
The demand for prison capacity in the short-term has been affected by the budget challenges many of our government partners currently face. At the same time, these challenges impede our customers’customers' ability to construct new prison beds of their own or update older facilities, which we believe could result in further need for private sector prison capacity solutions in the long-term. We intend to continue to pursue build-to-suit opportunities like our 2,552-bed Trousdale Turner Correctional Center under construction in Trousdale County, Tennessee, and alternative solutions likeOver the recently announced 2,400-bed South Texas Family Residential Center whereby we identified a site and lessor to provide residential housing and administrative buildings for ICE. In the long-term, however, we would like to see continued and meaningful utilization of our available capacity and better visibility from our customers before we add any additionaldevelop new prison capacity on a speculative basis. We will, however, respond to customer demand and may develop or expand correctional and detention facilities when we believe potential long-term returns justify the capital deployment. We expect to continue to pursue investment opportunities in residential reentry centers and are in various stages of due diligence to complete additional acquisitions. The transactions that have not yet closed will also be subject to various customary closing conditions, and we can provide no assurance that any such transactions will ultimately be completed. We are also pursuing additional investment opportunities in other real estate assets with a bias toward those used to provide mission-critical governmental services, as well as other businesses that expand the range of solutions we provide to government partners which will further diversify our cash flows.
Operating Activities
Our net cash provided by operating activities for the year ended December 31, 20142017 was $423.6$341.3 million compared with $369.5$375.4 million in 20132016 and $283.3$399.8 million in 2012.2015. Cash provided by operating activities represents our net income plus depreciation and amortization, changes in various components of working capital, and various non-cash charges, including primarily deferred income taxes.charges. The increasedecrease in cash provided by operating activities during 20142017 was primarily due to the receipt of a $70.0 million payment from our customerreduction in the fourth quarter of 2014 related to the aforementioned South Texas Family Residential Center. The amount, along with portions of other monthly payments
75
under the contract, is included in deferred revenue in the consolidated balance sheet as of December 31, 2014. Slightly offsetting the effect of the $70.0 million payment were negative fluctuations in working capital balances during 2014operating income when compared to the same period in 2013,the prior year.
The decrease in cash provided by operating activities during 2016 was primarily due to negative fluctuations in working capital balances when compared to 2015, including the decrease in deferred revenues associated with the South Texas Family Residential Center and routine timing differences in the collection of accounts receivables and in the payment of accounts payables, accrued salaries and wages, and other liabilities. The increaseliabilities, net of the collection of accounts receivables and higher operating income.
Investing Activities
Our cash flow used in cash provided by operatinginvesting activities during 2013 from 2012was $124.6 million for the year ended December 31, 2017 and was primarily dueattributable to lower income taxes resulting from our conversion to a REIT effective January 1, 2013 contributing to an increasecapital expenditures of $73.7 million, including expenditures for facility development and expansions of $17.6 million and $56.1 million for facility maintenance and information technology capital expenditures. Our cash flow used in net income after adjusting for the non-cash write-off of certain deferred tax assets and liabilities resulting from the REIT conversion and adjusting for certain non-cash charges. The increase in cash provided by operatinginvesting activities also resulted from favorable fluctuationsincluded $48.9 million primarily attributable to the
76
acquisitions of the two residential reentry centers in working capital balances during 2013 when compared to the same periodfirst quarter of 2017, the acquisition of Center Point in 2012.
Investing Activitiesthe second quarter of 2017, the acquisitions of NBTC and a portfolio of four leased properties in the third quarter of 2017, and the acquisition of TTC in the fourth quarter of 2017.
Our cash flow used in investing activities was $196.9$122.2 million for the year ended December 31, 20142016 and was primarily attributable to capital expenditures during the year of $135.1$93.4 million, including expenditures for facility development and expansions of $85.8$41.8 million primarily related to the aforementionedexpansion project at our Red Rock Correctional Center, and $51.6 million for facility maintenance and information technology capital expenditures. Our cash flow used in investing activities also included $43.8 million attributable to the acquisitions of CMI and a residential reentry facility in California during the second quarter of 2016. Partially offsetting these cash outflows, we received proceeds of $8.4 million primarily related to the sale of undeveloped land.
Our cash flow used in investing activities was $409.3 million for the year ended December 31, 2015 and was primarily attributable to capital expenditures of $224.3 million, including expenditures for facility development and expansions of $164.9 million primarily related to facility development projects at our Trousdale and $49.3Otay Mesa facilities, and $59.4 million for facility maintenance and information technology capital expenditures. In addition, cash flow used in investing activities during the year ended December 31, 2015 included $70.8$34.5 million of capitalized lease payments related to the aforementioned South Texas Family Residential Center, reported in accordance with Accounting Standard Codification 840-40-55, formerly Emerging Issues Task Force No. 97-10, “The Effect of Lessee Involvement in Asset Construction.” Cash flow used in investing activities for the year ended December 31, 2014 was partially offset by proceeds from the sale of assets and net decreases in restricted cash and other assets.
Center. Our cash flow used in investing activities was $125.5 million forduring the year ended December 31, 2013 and was primarily attributable to capital expenditures during the year of $89.32015 also included $158.4 million including expenditures for facility development and expansions of $40.7 million primarily related to the facility developmentacquisitions of four community corrections facilities in the third quarter of 2015 and expansion projects previously discussed herein and including renovations pursuant to new customer agreements at our California City and Red Rock facilities, and $48.6 million for facility maintenance and information technology capital expenditures. Our 2013 investing activities also included $36.3 millionAvalon in cash paid, netthe fourth quarter of cash acquired, for the acquisition of CAI. Our cash flow used in investing activities was $79.9 million for the year ended December 31, 2012, and was primarily attributable to capital expenditures during the year of $79.4 million, including $30.4 million for the expansion and development activities previously discussed herein, and $49.0 million for facility maintenance and information technology capital expenditures.2015.
Financing Activities
Cash flow used in financing activities was $230.2$202.3 million for the year ended December 31, 20142017 and was primarily attributable to dividend payments of $234.0 million. Additionally,$200.3 million and $5.8 million for the purchase and retirement of common stock that was issued in connection with equity-based compensation. In addition, cash flow used in financing activities included $10.0 million of scheduled principal repayments under our Term Loan. These payments were partially offset by $14.0 million of net proceeds from the issuance of debt and principal repayments under our revolving credit facility.
Cash flow used in financing activities was $280.8 million for the year ended December 31, 2016 and was primarily attributable to dividend payments of $255.5 million and $4.0 million for the purchase and retirement of common stock that was issued in connection with equity-based compensation and $5.0 million of net payments on our revolving credit facility. These payments were partially offset bycompensation. In addition, cash flows associated with exercising stock options, including the related income tax benefit of equity compensation, totaling $13.1 million.
Cash flow used in financing activities included $11.8 million of cash payments associated with the financing components of the lease related to the South Texas Family Residential Center, $4.0 million of net repayments under our revolving credit facility, and $5.0 million of scheduled principal repayments under our Term Loan.
Cash flow provided by financing activities was $229.0$0.4 million for the year ended December 31, 2013 and was primarily attributable to dividend payments of $299.4 million.2015. Cash flow used in financing activities also included $37.3dividend payments of $250.7 million for the payment of debt issuance and other refinancing costs. Additionally, cash flow used in financing activities included $6.7$9.5 million
76
for the purchase and retirement of common stock that was issued in connection with equity-based compensation. Cash flow used in financing activities for the year ended December 31, 2015 also included $5.7 million for the payment of debt issuance and other refinancing costs associated with refinancing transactions. In addition, cash flow used in financing activities included $6.5 million of cash payments associated with the financing components of the lease related to the South Texas Family Residential Center. These payments were partially offset by $85.0$264.0 million of net proceeds from the issuance of debt and principal repayments under our revolving credit facility, as well as the cash flows associated with exercising stock options, including the related income tax benefit of equity compensation, totaling $30.5$8.2 million.
Cash flow used in financing activities was $196.3 million for the year ended December 31, 2012 and was primarily attributable to $135.0 million of net principal payments of debt and $6.3 million for payments of debt issuance and other refinancing costs associated with refinancing transactions. Additionally, cash flow used in financing activities included $59.8 million of dividends paid during the year ended December 31, 2012 and $2.8 million for the purchase and retirement of common stock that was issued in connection with equity-based compensation. These payments were partially offset by the cash flows associated with exercising stock options, including the related income tax benefit of equity compensation, totaling $7.6 million.
Funds from Operations
Funds From Operations, or FFO, is a widely accepted supplemental non-GAAP measure utilized to evaluate the operating performance of real estate companies. The National Association of Real Estate Investment Trusts, or NAREIT, defines FFO as net income computed in accordance with generally accepted accounting principles, excluding gains or losses from sales of property and extraordinary items, plus depreciation and amortization of real estate and impairment of depreciable real estate and after adjustments for unconsolidated partnerships and joint ventures calculated to reflect funds from operations on the same basis.
We believe FFO is an important
77
supplemental measure of our operating performance and believe it is frequently used by securities analysts, investors and other interested parties in the evaluation of REITs, many of which present FFO when reporting results.
We also present Normalized FFO as an additional supplemental measure as we believe it is more reflective of our core operating performance. We may make adjustments to FFO from time to time for certain other income and expenses that we consider non-recurring, infrequent or unusual, even though such items may require cash settlement, because such items do not reflect a necessary component of our ongoing operations. Even though expenses associated with M&A may be recurring, the magnitude and timing fluctuate based on the timing and scope of M&A activity, and therefore, such expenses, which are not a necessary component of our ongoing operations, may not be comparable from period to period. Normalized FFO excludes the effects of such items.
FFO and Normalized FFO are supplemental non-GAAP financial measures of real estate companies’companies' operating performances, which do not represent cash generated from operating activities in accordance with GAAP and therefore should not be considered an alternative for net income or as a measure of liquidity. Our method of calculating FFO and Normalized FFO may be different from methods used by other REITs and, accordingly, may not be comparable to such other REITs.
77
Our reconciliation of net income to FFO and Normalized FFO for the years ended December 31, 2014, 2013,2017, 2016, and 20122015 is as follows (in thousands):
| For the Years Ended December 31 | ||||||||||||
| 2014 | 2013 | 2012 | ||||||||||
FUNDS FROM OPERATIONS: | ||||||||||||
Net income | $ | 195,022 | $ | 300,835 | $ | 156,761 | ||||||
Depreciation of real estate assets | 85,560 | 81,313 | 79,145 | |||||||||
Impairment of real estate assets, net of taxes | 29,843 | — | — | |||||||||
|
|
|
|
|
| |||||||
Funds From Operations | 310,425 | 382,148 | 235,906 | |||||||||
Expenses associated with debt refinancing transactions, net of taxes | — | 33,299 | 1,316 | |||||||||
Expenses associated with REIT conversion, net of taxes | — | 9,522 | 2,679 | |||||||||
Expenses associated with mergers and acquisitions, net of taxes | — | 713 | — | |||||||||
Goodwill and other impairments, net of taxes | 119 | 6,736 | — | |||||||||
Income tax benefit for reversal of deferred taxes due to REIT conversion | — | (137,686 | ) | (2,891 | ) | |||||||
|
|
|
|
|
| |||||||
Normalized Funds From Operations | $ | 310,544 | $ | 294,732 | $ | 237,010 | ||||||
|
|
|
|
|
| |||||||
|
| For the Years Ended December 31, |
| |||||||||
|
| 2017 |
|
| 2016 |
|
| 2015 |
| |||
FUNDS FROM OPERATIONS: |
|
|
|
|
|
|
|
|
|
|
|
|
Net income |
| $ | 178,040 |
|
| $ | 219,919 |
|
| $ | 221,854 |
|
Depreciation of real estate assets |
|
| 95,902 |
|
|
| 94,346 |
|
|
| 90,219 |
|
Impairment of real estate assets |
|
| 355 |
|
|
| — |
|
|
| — |
|
Funds From Operations |
|
| 274,297 |
|
|
| 314,265 |
|
|
| 312,073 |
|
Expenses associated with debt refinancing transactions |
|
| — |
|
|
| — |
|
|
| 701 |
|
Charges associated with adoption of tax reform |
|
| 4,548 |
|
|
| — |
|
|
| — |
|
Expenses associated with mergers and acquisitions |
|
| 2,530 |
|
|
| 1,586 |
|
|
| 3,643 |
|
Gain on settlement of contingent consideration |
|
| — |
|
|
| (2,000 | ) |
|
| — |
|
Restructuring charges |
|
| — |
|
|
| 4,010 |
|
|
| — |
|
Goodwill and other impairments |
|
| 259 |
|
|
| — |
|
|
| 955 |
|
Income tax benefit for special items |
|
| — |
|
|
| (215 | ) |
|
| (26 | ) |
Normalized Funds From Operations |
| $ | 281,634 |
|
| $ | 317,646 |
|
| $ | 317,346 |
|
Contractual Obligations
The following schedule summarizes our contractual obligations by the indicated period as of December 31, 20142017 (in thousands):
| Payments Due By Year Ended December 31, |
| Payments Due By Year Ended December 31, |
| |||||||||||||||||||||||||||||||||||||||||||||||||||||
| 2015 | 2016 | 2017 | 2018 | 2019 | Thereafter | Total |
| 2018 |
|
| 2019 |
|
| 2020 |
|
| 2021 |
|
| 2022 |
|
| Thereafter |
|
| Total |
| |||||||||||||||||||||||||||||
Long-term debt | $ | — | $ | — | $ | 525,000 | $ | — | $ | — | $ | 675,000 | $ | 1,200,000 |
| $ | 10,000 |
|
| $ | 15,000 |
|
| $ | 584,000 |
|
| $ | — |
|
| $ | 250,000 |
|
| $ | 600,000 |
|
| $ | 1,459,000 |
| ||||||||||||||
Interest on senior notes | 29,594 | 29,594 | 29,594 | 29,594 | 29,594 | 63,358 | 211,328 |
|
| 53,969 |
|
|
| 53,969 |
|
|
| 47,266 |
|
|
| 40,562 |
|
|
| 40,562 |
|
|
| 67,469 |
|
|
| 303,797 |
| |||||||||||||||||||||
Contractual facility developments and other commitments | 86,656 | — | — | — | — | — | 86,656 |
|
| 2,207 |
|
|
| — |
|
|
| — |
|
|
| — |
|
|
| — |
|
|
| — |
|
|
| 2,207 |
| |||||||||||||||||||||
South Texas Family Residential Center | 125,827 | 92,056 | 73,412 | 53,733 | — | — | 345,028 |
|
| 50,808 |
|
|
| 50,808 |
|
|
| 50,947 |
|
|
| 36,888 |
|
|
| — |
|
|
| — |
|
|
| 189,451 |
| |||||||||||||||||||||
Operating leases | 2,748 | — | — | — | — | — | 2,748 |
|
| 744 |
|
|
| 658 |
|
|
| 607 |
|
|
| 620 |
|
|
| 313 |
|
|
| — |
|
|
| 2,942 |
| |||||||||||||||||||||
|
|
|
|
|
|
| ||||||||||||||||||||||||||||||||||||||||||||||||||
Total contractual cash obligations | $ | 244,825 | $ | 121,650 | $ | 628,006 | $ | 83,327 | $ | 29,594 | $ | 738,358 | $ | 1,845,760 |
| $ | 117,728 |
|
| $ | 120,435 |
|
| $ | 682,820 |
|
| $ | 78,070 |
|
| $ | 290,875 |
|
| $ | 667,469 |
|
| $ | 1,957,397 |
| ||||||||||||||
|
|
|
|
|
|
| ||||||||||||||||||||||||||||||||||||||||||||||||||
The cash obligations in the table above do not include future cash obligations for variable interest expense associated with our Term Loan or the balance on our outstanding revolving credit facility as projections would be
78
based on future outstanding balances as well as future variable interest rates, and we are unable to make reliable estimates of either. Further, the cash obligations in the table above also do not include future cash obligations for uncertain tax positions as we are unable to make reliable estimates of the timing of such payments, if any, to the taxing authorities. The contractual facility developments included in the table above represent development projects for which we have already entered into a contract with a customer that obligates us to complete the development project. With respect to the South Texas Family Residential Center, the cash obligations included in the table above reflect the full contractual obligations of various contracts, excluding contingent payments, for periods up to 48 months even though many of these agreements provide us with the ability to terminate if ICE terminates the amended IGSA. Certain of our other ongoing construction projects are not currently under contract and thus are not included as a contractual obligation above as we may generally suspend or terminate such projects without substantial penalty. With respect to the South Texas Family Residential Center, the cash obligations included in the table above reflect the full contractual obligations of the lease of the site, excluding contingent payments, even though the lease agreement provides us with the ability to terminate if ICE terminates the amended IGSA, as previously described herein.
78
We had $16.3$6.9 million of letters of credit outstanding at December 31, 20142017 primarily to support our requirement to repay fees and claims under our workers’self-insured workers' compensation plan in the event we do not repay the fees and claims due in accordance with the terms of the plan. The letters of credit are renewable annually. We did not have any draws under any outstanding letters of credit during 2014, 2013,2017, 2016, or 2012.2015.
Many of our management contracts include provisions for inflationary indexing, which mitigates an adverse impact of inflation on net income. However, a substantial increase in personnel costs, workers’workers' compensation or food and medical expenses could have an adverse impact on our results of operations in the future to the extent that these expenses increase at a faster pace than the per diem or fixed rates we receive for our management services. We outsource our food service operations to a third party. The contract with our outsourced food service vendor contains certain protections against increases in food costs.
SEASONALITY AND QUARTERLY RESULTS
Our business is somewhat subject to seasonal fluctuations. Because we are generally compensated for operating and managing facilities at an inmate per diem rate, our financial results are impacted by the number of calendar days in a fiscal quarter. Our fiscal year follows the calendar year and therefore, our daily profits for the third and fourth quarters include two more days than the first quarter (except in leap years) and one more day than the second quarter. Further, salaries and benefits represent the most significant component of operating expenses. Significant portions of the Company’sCompany's unemployment taxes are recognized during the first quarter, when base wage rates reset for unemployment tax purposes. Finally, quarterly results are affected by government funding initiatives, the timing of the opening of new facilities, or the commencement of new management contracts and related start-up expenses which may mitigate or exacerbate the impact of other seasonal influences. Because of these seasonality factors, results for any quarter are not necessarily indicative of the results that may be achieved for the full fiscal year.
Our primary market risk exposure is to changes in U.S. interest rates. We are exposed to market risk related to our revolving credit facility and Term Loan because the interest raterates on our revolving credit facility isand Term Loan are subject to fluctuations in the market. If the interest rate for our outstanding indebtedness under the revolving credit facility and Term Loan was 100 basis points higher or lower during the years ended December 31, 2014, 2013,2017, 2016, and 2012,2015, our interest expense, net of amounts capitalized, would have been increased or decreased by $5.0 million, $5.7 million, $5.3 million, and $5.7$5.9 million, respectively.
As of December 31, 2014,2017, we had outstanding $325.0 million of senior notes due 2020 with a fixed interest rate of 4.125% and, $350.0 million of senior notes due 2023 with a fixed interest rate of 4.625%, $250.0 million of senior notes due 2022 with a fixed interest rate of 5.0%, and $250.0 million of senior notes due 2027 with a fixed interest rate of 4.75%. Because the interest rates with respect to these instruments are fixed, a hypothetical 100 basis point increase or decrease in market interest rates would not have a material impact on our financial statements.
79
We may, from time to time, invest our cash in a variety of short-term financial instruments. These instruments generally consist of highly liquid investments with original maturities at the date of purchase of three months or less. While these investments are subject to interest rate risk and will decline in value if market interest rates increase, a hypothetical 100 basis point increase or decrease in market interest rates would not materially affect the value of these instruments. See the risk factor discussion captioned "Rising interest rates would increase the cost of our variable rate debt" under Item 1A of this Annual Report on Form 10-K for more discussion on interest rate risks that may affect our financial condition.
79
The financial statements and supplementary data required by Regulation S-X are included in this Annual Report on Form 10-K commencing on Page F-1.
None.
Management’sManagement's Evaluation of Disclosure Controls and Procedures
An evaluation was performed under the supervision and with the participation of our senior management, including our Chief Executive Officer and Chief Financial Officer, of the effectiveness of our disclosure controls and procedures, as defined inRules 13a-15(e) and 15d-15(e) of the Exchange Act as of the end of the period covered by this Annual Report. Based on that evaluation, our officers, including our Chief Executive Officer and Chief Financial Officer, concluded that as of the end of the period covered by this Annual Report our disclosure controls and procedures are effective to ensure that information required to be disclosed in the reports that we file or submit under the Exchange Act is recorded, processed, summarized, and reported within the time periods specified in the Commission’sSEC's rules and forms and information required to be disclosed in the reports we file or submit under the Exchange Act is accumulated and communicated to our management, including our Chief Executive Officer and Chief Financial Officer, to allow timely decisions regarding required disclosure.
Management’sManagement's Report on Internal Control over Financial Reporting
Management of Corrections Corporation of America (the “Company”)the Company is responsible for establishing and maintaining adequate internal control over financial reporting, as defined in Rules 13a-15(f) and 15d-15(f) under the Exchange Act. The Company’sCompany's internal control over financial reporting is designed to provide reasonable assurance regarding the reliability of financial reporting and the preparation of financial statements for external purposes in accordance with generally accepted accounting principles. The Company’sCompany's internal control over financial reporting includes those policies and procedures that:
| |||||||||||||||||||||||||||||||||||||||||||||||||||||||||||||||||||||||||||||||||||||||||||||||||||||||||||||||||||||||||||||||||||||||||||||||||||||||||||||||||||||||||||||||||||||||||||||||||||||||||||||||||||||||||||||||||||||||||||||||||||||||||||||||||||||||||||||||||||||||||||||||||||||||||||||||||||||||||||||||||||||||||||||||||||||||||||||||||||||||||||||||||||||||||||||||||||||||||||||||||||||||||||||||||||||||||||||||||||||||||||||||||||||||||||||||||||||||||||||||||||||||||||||||||||||||||||||||||||||||||||||||||||||||||||||||||||||||||||||||||||||||||||||||||||||||||||||||||||||||||||||||||||||||||||||||||||||||||||||||||||||||||||||||||||||||||||||||||||||||||||||||||||||||||||||||||||||||||||||||||||||||||||||||||||||||||||||||||||||||||||||||||||||||||||||||||||||||||||||||||||||||||||||||||||||||||||||||||||||||||||||||||||||||||||||||||||||||||||||||||||||||||||||||||||||||||||||||||||||||||||||||||||||||||||||||||||||||||||||||||||||||||||||||||||||||||||||||||||||||