
UNITED STATES
SECURITIES AND EXCHANGE COMMISSION
WASHINGTON, D.C. 20549
FORM 10-K
| ANNUAL REPORT PURSUANT TO SECTION 13 OR 15(d) OF THE SECURITIES EXCHANGE ACT OF 1934 |
FOR THE FISCAL YEAR ENDED DECEMBER 31, 20142016
OR
| TRANSITION REPORT PURSUANT TO SECTION 13 OR 15(d) OF THE SECURITIES EXCHANGE ACT OF 1934 |
FOR THE TRANSITION PERIOD FROM TO
COMMISSION FILE NUMBER: 814-00754
SOLAR CAPITAL LTD.
(Exact name of registrant as specified in its charter)
| Maryland | 26-1381340 | |
| (State of Incorporation) | (I.R.S. Employer Identification Number) | |
500 Park Avenue New York, N.Y. | 10022 | |
| (Address of principal executive offices) | (Zip Code) | |
Registrant’s telephone number, including area code: (212) 993-1670
Securities registered pursuant to Section 12(b) of the Act:
| Title of Each Class | Name of Each Exchange on Which Registered | |||
Common Stock, par value 6.75% Senior Notes due 2042 | The NASDAQ Global Select Market; The New York Stock Exchange |
Securities registered pursuant to Section 12(g) of the Act: None
Indicate by check mark if the registrant is a well-known seasoned issuer, as defined in Rule 405 of the Securities Act. Yes ¨☐ No x☒
Indicate by check mark if the registrant is not required to file reports pursuant to Section 13 or Section 15(d) of the Act. Yes ¨☐ No x☒
Indicate by check mark whether the Registrant (1) has filed all reports required to be filed by Section 13 or 15(d) of the Securities Exchange Act of 1934 during the preceding 12 months (or for such shorter period that the Registrant was required to file such reports), and (2) has been subject to such filing requirements for the past 90 days. Yes x☒ No ¨☐
Indicate by check mark whether the registrant has submitted electronically and posted on its corporate Web site, if any, every Interactive Data File required to be submitted and posted pursuant to Rule 405 of Regulation S-T during the preceding 12 months (or for such shorter period that the registrant was required to submit and post such files). Yes ¨☐ No ¨☐
Indicate by check mark if disclosure of delinquent filers pursuant to Item 405 of Regulation S-K is not contained herein, and will not be contained, to the best of Registrant’s knowledge, in definitive proxy or information statements incorporated by reference in Part III of this Form 10-K or any amendment to this Form 10-K. x☒
Indicate by check mark whether the registrant is a large accelerated filer, an accelerated filer, a non-accelerated filer, or a smaller reporting company. See the definitions of “large accelerated filer,” “accelerated filer” and “smaller reporting company” in Rule 12b-2 of the Exchange Act.
| Large accelerated filer | Accelerated filer | |||||
| Non-accelerated filer | Smaller Reporting Company | |||||
Indicate by check mark whether the registrant is a shell company (as defined in Rule 12b-2 of the Act) Yes ¨☐ No x☒
The aggregate market value of common stock held by non-affiliates of the Registrant on June 30, 20142016 based on the closing price on that date of $21.28$19.05 on the NASDAQ Global Select Market was approximately $855.0$757.7 million. For the purposes of calculating this amount only, all directors and executive officers of the Registrant have been treated as affiliates. There were 42,465,16242,248,525 shares of the Registrant’s common stock outstanding as of February 24, 2015.21, 2017.
Portions of the registrant’s Proxy Statement for its 20152017 Annual Meeting of Stockholders to be filed not later than 120 days after the end of the fiscal year covered by this Annual Report on Form 10-K are incorporated by reference into Part III of this Form 10-K.
SOLAR CAPITAL LTD.
FORM 10-K
FOR THE FISCAL YEAR ENDED DECEMBER 31, 20142016
| Page | ||||||
| PART I | ||||||
| Item 1. | 1 | |||||
| Item 1A. | ||||||
| Item 1B. | ||||||
| Item 2. | ||||||
| Item 3. | ||||||
| Item 4. | ||||||
| PART II | ||||||
| Item 5. | ||||||
| Item 6. | ||||||
| Item 7. | Management’s Discussion and Analysis of Financial Condition and Results of Operations | |||||
| Item 7A. | ||||||
| Item 8. | ||||||
| Item 9. | Changes in and Disagreements with Accountants on Accounting and Financial Disclosure | |||||
| Item 9A. | ||||||
| Item 9B. | ||||||
| PART III | ||||||
| Item 10. | ||||||
| Item 11. | ||||||
| Item 12. | Security Ownership of Certain Beneficial Owners and Management and Related Stockholder Matters | |||||
| Item 13. | Certain Relationships and Related Transactions, and Director Independence | |||||
| Item 14. | ||||||
| PART IV | ||||||
| Item 15. | ||||||
Solar Capital Ltd. (“Solar”, “Solar Capital”, the “Company”, “we” or “our”), a Maryland corporation formed in November 2007, is a closed-end, externally managed, non-diversified management investment company that has elected to be treatedregulated as a business development company (or “BDC”(“BDC”) under the Investment Company Act of 1940, as amended (the “1940 Act”). Furthermore, as the Company is an investment company, it continues to apply the guidance in FASB Accounting Standards Codification (“ASC”) Topic 946. In addition, for tax purposes we have elected to be treated as a regulated investment company (“RIC”) under Subchapter M of the Internal Revenue Code of 1986, as amended (the “Code”).
In February 2010, we completed our initial public offering and a concurrent private offering of shares to management. Prior to our initial public offering, Solar Capital LLC merged with and into Solar Capital Ltd. (the “Merger”), leaving Solar Capital Ltd. as the surviving entity. Solar Capital Ltd. issued shares of common stock and $125 million in senior unsecured notes (the “Senior Unsecured Notes”) to the existing Solar Capital LLC unit holders in connection with the Merger. The Senior Unsecured Notes that were issued in connection with the Merger were fully repaid in December 2010. Prior to the Merger, Solar Capital Ltd. had no assets or operations and as a result, the books and records of Solar Capital LLC have become the historical books and records of the Company.management team.
We invest primarily in privately held U.S. middle market companies, where we believe the supply of primary capital is limited and the investment opportunities are most attractive. Our investment objective is to generate both current income and capital appreciation through debt and equity investments. We invest primarily in leveraged middle market companies in the form of senior secured loans, unitranche loans, mezzanine loans and equity securities. We define “middle market” to refer to companies with annual revenues between $50 million and $1 billion. From time to time, we may also invest in public companies that are thinly traded. Our business is focused primarily on the direct origination of investments through portfolio companies or their financial sponsors. Our investments generally range between $5 million and $100 million each, although we expect that this investment size will vary proportionately with the size of our capital base and/or strategic initiatives. In addition, we may invest a portion of our portfolio in other types of investments, which we refer to as opportunistic investments, which are not our primary focus but are intended to enhance our overall returns. These investments may include, but are not limited to, direct investments in public companies that are not thinly traded and securities of leveraged companies located in select countries outside of the United States. WeThe securities that we invest in are typically rated below investment grade. Securities rated below investment grade are often referred to as “leveraged loans,” “high yield” or “junk” securities, and may be considered “high risk” compared to debt instruments that are rated investment grade. In addition, some of our debt investments will not fully amortize during their lifetime, which could result in a loss or a substantial amount of unpaid principal and interest due upon maturity. Our investment activities are managed by Solar Capital Partners, LLC (“Solar Capital Partners” or the “Investment Adviser”). and supervised by our board of directors, a majority of whom are non-interested, as such term is defined in the 1940 Act. Solar Capital Management, LLC (“Solar Capital Management”) provides the administrative services necessary for us to operate.
As of December 31, 2014,2016, our investment portfolio totaled $1.0$1.3 billion and our net asset value was $936.6$918.5 million. Our portfolio was comprised of debt and equity investments in 4363 portfolio companies with our portfolio of income producing investments having a weighted average annualized yield on a fair value and cost basis of approximately 9.9%.10.0% and 10.4%, respectively. Portfolio yield does not represent an actual investment return to stockholders.
During the fiscal year ended December 31, 2014,2016, we originatedinvested approximately $557$428 million of investments in 3035 portfolio companies. Investments sold or prepaid during the fiscal year ended December 31, 20142016 totaled approximately $626$488 million.
Solar Capital Partners
Solar Capital Partners, our investment adviser, is controlled and led by Michael S. Gross, our chairmanChairman and chief executive officer,Chief Executive Officer, and Bruce Spohler, our chief operating officer.Chief Operating Officer. They are supported by a team of dedicated investment professionals that haveprofessionals. Solar Capital Partners’ investment team has extensive experience in leveraged lending and private equity, as well as significant contacts with financial sponsors.
In addition, Solar Capital Partners serves as the investment adviser forto Solar Senior Capital Ltd. (or “Solar Senior”), a publicly traded business development company with approximately $375 million of investable capital
BDC that invests in the senior debt securities of leveraged middle marketmiddle-market companies similar to those we intend to target for investment. Through December 31, 2014,2016, the investment team led by Messrs. Gross and Spohler has invested approximately $4.7$6.0 billion in more than 180265 different portfolio companies for Solar Capital and Solar Senior, involving an aggregate of more than 110165 different financial sponsors. Since Solar Capital’s inception, these investment professionals have used their relationships in the middle-market financial sponsor and financial intermediary community to generate deal flow. As of February 24, 2015,22, 2017, Mr. Gross and Mr. Spohler beneficially owned, either directly or indirectly, approximately 5.2%5.7% and 4.9%5.2%, respectively, of our outstanding common stock.
Solar Capital Management
Pursuant to an administration agreement (the “Administration Agreement”), Solar Capital Management furnishes us with office facilities, equipment and clerical, bookkeeping and record keeping services at such facilities. Under the Administration Agreement, Solar Capital Management also performs, or oversees the performance of, our required administrative services, which include, among other things, being responsible for the financial records which we are required to maintain and preparing reports to our stockholders. In addition, Solar Capital Management assists us in determining and publishing our net asset value, oversees the preparation and filing of our tax returns and the printing and dissemination of reports to our stockholders, and generally oversees the payment of our expenses and the performance of administrative and professional services rendered to us by others. Solar Capital Management also provides managerial assistance, if any, on our behalf to those portfolio companies that request such assistance.
Investments
Solar Capital seeks to create a diverse portfolio that includes senior secured loans, unitranche loans, mezzanine loans and equity securities by investing approximately $5 million to $100 million of capital, on average, in the securities of leveraged companies, including middle-market companies. We expect that this investment size will vary with the size of our capital base and/or for strategic initiatives. Structurally, mezzanine loans usually rank subordinate in priority of payment to senior debt, such as senior bank debt, and are often unsecured. As such, other creditors may rank senior to us in the event of insolvency. However, mezzanine loans rank senior to common and preferred equity in a borrowers’ capital structure. Mezzanine loans may have both elements of debt and equity instruments, offering fixed returns in the form of interest payments associated with senior debt, while providing lenders an opportunity to participate in the capital appreciation of a borrower, if any, through an equity interest. This equity interest may take the form of warrants. Due to its higher risk profile and often less restrictive covenants as compared to senior loans, mezzanine loans generally earn a higher return than senior secured loans. The warrants associated with mezzanine loans are typically detachable, which allows lenders to receive repayment of their principal on an agreed amortization schedule while retaining their equity interest in the borrower. Mezzanine loans also may include a “put” feature, which permits the holder to sell its equity interest back to the borrower at a price determined through an agreed formula. We believe that mezzanine loans can offer an attractive investment opportunity based upon their historic returns and resilience during economic downturns.
In addition to senior secured loans, unitranche loans and mezzanine loans, we may invest a portion of our portfolio in opportunistic investments, which are not our primary focus, but are intended to enhance our returns to our investors. These investments may include direct investments in public companies that are not thinly traded and securities of leveraged companies located in select countries outside of the United States. The securities that we invest in are typically rated below investment grade. Securities rated below investment grade are often referred to as “leveraged loans,” “high yield” or “junk” securities, and may be considered “high risk” compared to debt instruments that are rated investment grade. In addition, some of our debt investments will not fully amortize during their lifetime, which could result in a loss or a substantial amount of unpaid principal and interest due upon maturity. We may invest up to 30% of our total assets in such opportunistic investments, including loans issued by non-U.S. issuers, subject to compliance with our regulatory obligations as a BDC under the 1940 Act.
We have and will continue to borrow funds to make investments. As a result, we will be exposed to the risks of leverage, which may be considered a speculative investment technique. The use of leverage magnifies the potential for loss on amounts invested and therefore increases the risks associated with investing in our securities. In addition, the costs associated with our borrowings, including any increase in management fees payable to our investment adviser, Solar Capital Partners, will be borne by our common stockholders.
Additionally, we may in the future seek to securitize our loans to generate cash for funding new investments. To securitize loans, we may create a wholly-owned subsidiary and contribute a pool of loans to the subsidiary. This could include the sale of interests in the subsidiary on a non-recourse basis to purchasers who we would expect to be willing to accept a lower interest rate to invest in investment grade loan pools, and we would retain a portion of the equity in the securitized pool of loans.
Moreover, we may acquire investments in the secondary market and, in analyzing such investments, we will employ the same analytical process as we use for our primary investments.
We may utilize instruments such as forward contracts, currency options and interest rate swaps, caps, collars and floors to seek to hedge against fluctuations in the relative values of our portfolio positions from changes in currency exchange rates and market interest rates. Hedging against a decline in the values of our portfolio positions does not eliminate the possibility of fluctuations in the values of such positions or prevent losses if the values of such positions decline. However, such hedging can establish other positions designed to gain from those same developments, thereby offsetting the decline in the value of such portfolio positions. Such hedging transactions may also limit the opportunity for gain if the values of the underlying portfolio positions should increase. It may not be possible to hedge against an exchange rate or interest rate fluctuation that is so generally anticipated that we are not able to enter into a hedging transaction at an acceptable price. Moreover, for a variety of reasons, we may not seek to establish a perfect correlation between such hedging instruments and the portfolio holdings being hedged. Any such imperfect correlation may prevent us from achieving the intended hedge and expose us to risk of loss. In addition, it may not be possible to hedge fully or perfectly against currency fluctuations affecting the value of securities denominated in non-U.S. currencies because the value of those securities is likely to fluctuate as a result of factors not related to currency fluctuations.
Our principal focus is to provide senior secured loans, unitranche loans and mezzanine loans to leveraged companies in a variety of industries. We generally seek to target companies that generate positive cash flows. We generally seek to invest in companies from the broad variety of industries in which our investment adviser has direct expertise.
The following is a representative list of the industries in which we may invest:
• Aerospace & Defense • Air Freight & Logistics • Automobiles • Asset Management • Building Products • Chemicals • Commercial Services & Supplies • Communications Equipment • Construction & Engineering • Consumer Finance • Containers & Packaging • Distributors • Diversified Consumer Services • Diversified Financial Services • Diversified Real Estate Activities • Diversified Telecommunications Services • Education Services • Food Products • Footwear • Health Care Equipment & Supplies • Health Care Facilities • Health Care Providers & Services • Health Care Technology | • Hotels, Restaurants & Leisure • Industrial Conglomerates • Insurance • Internet Software & Services • IT Services • Leisure Equipment & Products • Life Sciences Tools & Services • Machinery • Media • Multiline Retail • Multi-Sector Holdings • Paper & Forest Products • Personal Products • Pharmaceuticals • Professional Services • Research & Consulting Services • Software • Specialty Retail • Textiles, Apparel & Luxury Goods • Thrifts & Mortgage Finance • Trading Companies & Distributors • Utilities • Wireless Telecommunications Services |
We may also invest in other industries if we are presented with attractive opportunities.
We may invest, to the extent permitted by law, in the securities and instruments of other investment companies, including private funds. We may also participate in negotiated co-investment transactions with certain affiliates, each of whose investment adviser is Solar Capital Partners, or an investment adviser controlling, controlled by or under common control with Solar Capital Partners, in a manner consistent with our investment objective, positions, policies, strategies and restrictions as well as regulatory requirements and other pertinent factors, and pursuant to the conditions of the exemptive order obtained from the SEC on July 28, 2014.
At December 31, 2016, our portfolio consisted of 63 portfolio companies and was invested 60.4% in senior secured loans, 2.2% in subordinated debt, 1.1% in preferred equity and 36.3% in common equity and warrants (of which 23.4% is Crystal Financial LLC, 7.7% is Senior Secured Unitranche Loan Program LLC and 3.6% is Senior Secured Unitranche Loan Program II LLC), in each case, measured at fair value. We expect that our portfolio will continue to include primarily senior secured, unitranche and mezzanine loans as well as equity-related securities. In addition, we also expect to invest a portion of our portfolio in opportunistic investments, which are not our primary focus, but are intended to enhance our risk-adjusted returns to stockholders. These investments may include, but are not limited to, securities of public companies and debt and equity securities of companies located outside of the United States.
While our primary investment objective is to maximize current income and capital appreciation through investments in U.S. senior and subordinated loans, other debt securities and equity, we may also invest a portion of the portfolio in opportunistic investments, including foreign securities.
Listed below are our top ten portfolio companies and industries based on their fair value and represented as a percentage of total assets as of December 31, 2016 and December 31, 2015:
TOP TEN PORTFOLIO COMPANIES AND INDUSTRIES AS OF DECEMBER 31, 2016
Portfolio Company | % of Total Assets | |||
Crystal Financial LLC | 18.5 | % | ||
Senior Secured Unitranche Loan Program LLC | 6.1 | % | ||
KORE Wireless Group, Inc. | 3.3 | % | ||
DISA Holdings Acquisition Subsidiary Corp. | 3.1 | % | ||
Varilease Finance, Inc. | 2.9 | % | ||
Senior Secured Unitranche Loan Program II LLC | 2.9 | % | ||
TierPoint, LLC | 2.0 | % | ||
PhyMed Management LLC | 1.9 | % | ||
U.S. Anesthesia Partners, Inc. | 1.8 | % | ||
RD Holdco Inc. (Rug Doctor) | 1.7 | % | ||
Industry | % of Total Assets | |||
Diversified Financial Services | 18.5 | % | ||
Asset Management | 9.9 | % | ||
Health Care Providers & Services | 8.3 | % | ||
Wireless Telecommunication Services | 5.0 | % | ||
Pharmaceuticals | 4.8 | % | ||
Health Care Equipment & Supplies | 4.8 | % | ||
Professional Services | 3.7 | % | ||
IT Services | 3.7 | % | ||
Multi-Sector Holdings | 2.9 | % | ||
Health Care Technology | 2.6 | % | ||
TOP TEN PORTFOLIO COMPANIES AND INDUSTRIES AS OF DECEMBER 31, 2015
Portfolio Company | % of Total Assets | |||
Crystal Financial LLC | 17.9 | % | ||
Senior Secured Unitranche Loan Program LLC | 5.0 | % | ||
Kore Wireless Group, Inc. | 3.3 | % | ||
DISA Holdings Acquisition Subsidiary Corp. | 3.0 | % | ||
LegalZoom.com, Inc. | 3.0 | % | ||
Varilease Finance, Inc. | 2.9 | % | ||
WireCo Worldgroup Inc. | 2.5 | % | ||
TierPoint, LLC | 2.1 | % | ||
PhyMed Management LLC | 1.9 | % | ||
U.S. Anesthesia Partners, Inc. | 1.8 | % | ||
Industry | % of Total Assets | |||
Diversified Financial Services | 17.9 | % | ||
Health Care Providers & Services | 9.6 | % | ||
Asset Management | 5.9 | % | ||
Wireless Telecommunications Services | 5.0 | % | ||
IT Services | 3.7 | % | ||
Professional Services | 3.6 | % | ||
Internet Software & Services | 3.0 | % | ||
Multi-Sector Holdings | 2.9 | % | ||
Health Care Equipment & Supplies | 2.9 | % | ||
Health Care Technology | 2.6 | % | ||
Listed below is the geographic breakdown of the portfolio based on fair value as of December 31, 2016, 2015 and 2014:
Geographic Region | % of Portfolio at December 31, 2016 | % of Portfolio at December 31, 2015 | % of Portfolio at December 31, 2014 | |||||||||
United States | 99.4 | % | 99.5 | % | 99.1 | % | ||||||
Canada | 0.6 | % | 0.5 | % | 0.9 | % | ||||||
|
|
|
|
|
| |||||||
| 100.0 | % | 100.0 | % | 100.0 | % | |||||||
|
|
|
|
|
| |||||||
Investment Selection Process
Solar Capital Partners is committed to and utilizes a value-oriented investment philosophy with a focus on the preservation of capital and a commitment to managing downside exposure.
Portfolio Company Characteristics
We have identified several criteria that we believe are important in identifying and investing in prospective portfolio companies. These criteria provide general guidelines for our investment decisions; however, not all of these criteria will be met by each prospective portfolio company in which we choose to invest.
Stable Earnings and Strong Free Cash Flow. We seek to invest in companies who have demonstrated stable earnings through economic cycles. We target companies that can de-lever through consistent generation of cash flows rather than relying solely on growth to service and repay our loans.
Value Orientation. Our investment philosophy places a premium on fundamental analysis from an investor’s perspective and has a distinct value orientation. We focus on companies in which we can invest at relatively low multiples of operating cash flow and that are profitable at the time of investment on an operating cash flow basis.
Value of Assets. The prospective value of the assets, if any, that collateralizes the loans in which we invest, is an important factor in our credit analysis. Our analysis emphasizes both tangible assets, such as accounts receivable, inventory, equipment and real estate, and intangible assets, such as intellectual property, customer lists, networks and databases. In some of our transactions the company’s fundings may be derived from a borrowing base determined by the value of the company’s assets.
Strong Competitive Position in Industry. We seek to invest in target companies that have developed leading market positions within their respective markets and are well positioned to capitalize on growth opportunities. We seek companies that demonstrate significant competitive advantages versus their competitors, which we believe should help to protect their market position and profitability.
Diversified Customer and Supplier Base. We seek to invest in businesses that have a diversified customer and supplier base. We believe that companies with a diversified customer and supplier base are generally better able to endure economic downturns, industry consolidation, changing business preferences and other factors that may negatively impact their customers, suppliers and competitors.
Exit Strategy. We predominantly invest in companies which provide multiple alternatives for an eventual exit. We look for opportunities that provide an exit typically within three years of the initial capital commitment.
We generally seek companies that we believe will provide a steady stream of cash flow to repay our loans and reinvest in their respective businesses. We believe that such internally generated cash flow, leading to the payment of our interest, and the repayment of our principal, represent a key means by which we will be able to exit from our investments over time.
In addition, we also seek to invest in companies whose business models and expected future cash flows offer attractive exit possibilities. These companies include candidates for strategic acquisition by other industry participants and companies that may repay our investments through an initial public offering of common stock or another capital market transaction. We underwrite our investments on a held-to-maturity basis, but expensive capital is often repaid prior to stated maturity.
Experienced and Committed Management. We generally require that portfolio companies have an experienced management team. We also require portfolio companies have in place proper incentives to induce management to succeed and to act in concert with our interests as investors, including having significant equity interests.
Strong Sponsorship. We generally aim to invest alongside other sophisticated investors. We typically seek to partner with successful financial sponsors who have historically generated high returns. We believe that investing in these sponsors’ portfolio companies enables us to benefit from their direct involvement and due diligence.
Solar Capital’s investment team works in concert with sponsors to proactively manage investment opportunities by acting as a partner throughout the investment process. We actively focus on the middle-market financial sponsor community, with a particular focus on the upper-end of the middle-market (sponsors with equity funds of $800 million to $3 billion). We favor such sponsors because they typically:
buy larger companies with strong business franchises;
invest significant amounts of equity in their portfolio companies;
value flexibility and creativity in structuring their transactions;
possess longer track records over multiple investment funds;
have a deeper management bench;
have better ability to withstand downturns; and
possess the ability to support portfolio companies with additional capital.
We divide our coverage of these sponsors among our more senior investment professionals, who are responsible for day-to-day interaction with financial sponsors. Our coverage approach aims to act proactively, consider all investments in the capital structure, provide quick feedback, deliver on commitments, and are constructive throughout the life cycle of an investment.
Due Diligence
Our “private equity” approach to credit investing typically incorporates extensive in-depth due diligence often alongside the private equity sponsor. In conducting due diligence, we will use publicly available
information as well as information from relationships with former and current management teams, consultants, competitors and investment bankers. We believe that our due diligence methodology allows us to screen a high volume of potential investment opportunities on a consistent and thorough basis.
Our due diligence typically includes:
review of historical and prospective financial information;
review and valuation of assets;
research relating to the company’s management, industry, markets, products and services and competitors;
on-site visits;
discussions with management, employees, customers or vendors of the potential portfolio company;
review of senior loan documents; and
background investigations.
We also expect to evaluate the private equity sponsor making the investment. Further, due to Solar Capital Partners’ considerable repeat business with sponsors, we have direct experience with the management teams of many sponsors. A private equity sponsor is typically the controlling shareholder upon completion of an investment and as such is considered critical to the success of the investment. The equity sponsor is evaluated along several key criteria, including:
investment track record;
industry experience;
capacity and willingness to provide additional financial support to the company through additional capital contributions, if necessary; and
reference checks.
Throughout the due diligence process, a deal team is in constant dialogue with the management team of the company in which we are considering to invest to ensure that any concerns are addressed as early as possible through the process and that unsuitable investments are filtered out before considerable time has been invested.
Upon the completion of due diligence and a decision to proceed with an investment in a company, the investment professionals leading the investment present the investment opportunity to Solar Capital Partners’ investment committee, which then determines whether to pursue the potential investment. Additional due diligence with respect to any investment may be conducted on our behalf by attorneys and independent accountants prior to the closing of the investment, as well as other outside advisers, as appropriate.
The Investment Committee
All new investments are required to be approved by a consensus of the investment committee of Solar Capital Partners, which is led by Messrs. Gross and Spohler. The members of Solar Capital Partners’ investment committee receive no compensation from us. Such members may be employees or partners of Solar Capital Partners and may receive compensation or profit distributions from Solar Capital Partners.
Investment Structure
Once we determine that a prospective portfolio company is suitable for investment, we work with the management of that company and its other capital providers, including senior, junior and equity capital providers, to structure an investment. We negotiate among these parties to agree on how our investment is expected to perform relative to the other capital in the portfolio company’s capital structure.
We invest in portfolio companies primarily in the form of senior secured loans, unitranche loans and to a lesser extent mezzanine investments. With respect to our senior secured loans, we seek to obtain security interests in the assets of our portfolio companies that serve as collateral in support of the repayment of these loans. This collateral may take the form of first or second priority liens on the assets of a portfolio company.
We structure our mezzanine investments primarily as unsecured, subordinated loans that provide for relatively high, fixed or floating interest rates that provide us with significant current interest income. These loans typically have interest-only payments in the early years, with amortization of principal, if any, deferred to the later years of the mezzanine loans. In some cases, we may enter into loans that, by their terms, convert into equity or additional debt securities or defer payments of interest for the first few years after our investment. Also, in some cases our mezzanine loans may be collateralized by a subordinated lien on some or all of the assets of the borrower.
Typically, our senior secured, unitranche and mezzanine loans have final maturities of five to ten years. However, we expect that our portfolio companies often may repay these loans early, generally within three to four years from the date of initial investment. To preserve an acceptable return on investment, we seek to structure these loans with prepayment premiums.
In the case of our senior secured, unitranche and mezzanine loan investments, we tailor the terms of the investment to the facts and circumstances of the transaction and the prospective portfolio company, negotiating a structure that protects our rights and manages our risk while creating incentives for the portfolio company to achieve its business plan and improve its profitability. For example, in addition to seeking a senior or fulcrum position in the capital structure of our portfolio companies, we will seek to limit the downside potential of our investments by:
requiring a total return on our investments (including both interest and potential capital appreciation) that compensates us for credit risk;
incorporating “put” rights and call protection into the investment structure; and
negotiating covenants in connection with our investments that afford our portfolio companies as much flexibility in managing their businesses as possible, consistent with preservation of our capital. Such restrictions may include affirmative and negative covenants, default penalties, lien protection, change of control provisions and board rights, including either observation or participation rights.
Our investments may include equity features, such as warrants or options to buy a minority interest in the portfolio company. Any warrants we receive with our debt securities generally require only a nominal cost to exercise, and thus, as a portfolio company appreciates in value, we may achieve additional investment return from this equity interest. We may structure the warrants to provide provisions protecting our rights as a minority interest holder, as well as puts, or rights to sell such securities back to the company, upon the occurrence of specified events. In many cases, we also obtain registration rights in connection with these equity securities, which may include demand and “piggyback” registration rights. In addition, we may from time to time make direct equity investments in portfolio companies.
We generally seek to hold most of our investments to maturity or repayment, but will sell our investments earlier, including if a liquidity event takes place such as the sale or recapitalization of a portfolio company.
Ongoing Relationships with Portfolio Companies
Solar Capital Partners monitors our portfolio companies on an ongoing basis. Solar Capital Partners monitors the financial trends of each portfolio company to determine if it is meeting its business plan and to assess the appropriate course of action for each company.
Solar Capital Partners has several methods of evaluating and monitoring the performance and fair value of our investments, which include the following:
Assessment of success in adhering to each portfolio company’s business plan and compliance with covenants;
Periodic and regular contact with portfolio company management and, if appropriate, the financial or strategic sponsor, to discuss financial position, requirements and accomplishments;
Comparisons to other Solar Capital portfolio companies in the industry, if any;
Attendance at and participation in board meetings; and
Review of monthly and quarterly financial statements and financial projections for portfolio companies.
In addition to various risk management and monitoring tools, Solar Capital Partners also uses an investment rating system to characterize and monitor our expected level of returns on each investment in our portfolio.
We use an investment rating scale of 1 to 4. The following is a description of the conditions associated with each investment rating:
Investment Rating | Summary Description | |
| 1 | Involves the least amount of risk in our portfolio, the portfolio company is performing above expectations, and the trends and risk factors are generally favorable (including a potential exit) | |
| 2 | Risk that is similar to the risk at the time of origination, the portfolio company is performing as expected, and the risk factors are neutral to favorable; all new investments are initially assessed a grade of 2 | |
| 3 | The portfolio company is performing below expectations, may be out of compliance with debt covenants, and requires procedures for closer monitoring | |
| 4 | The investment is performing well below expectations and is not anticipated to be repaid in full | |
Solar Capital Partners monitors and, when appropriate, changes the investment ratings assigned to each investment in our portfolio. As of December 31, 2016, 2015 and 2014, the weighted average investment rating on the fair market value of our portfolio was a 2. In connection with our valuation process, Solar Capital Partners reviews these investment ratings on a quarterly basis.
Valuation Procedures
We conduct the valuation of our assets, pursuant to which our net asset value shall be determined, at all times consistent with U.S. generally accepted accounting principles (“GAAP”) and the 1940 Act and generally value our assets on a quarterly basis, or more frequently if required. Our valuation procedures are set forth in more detail below:
Under procedures established by our board of directors (the “Board”), we value investments, including certain senior secured debt, subordinated debt and other debt securities with maturities greater than 60 days, for which market quotations are readily available, at such market quotations (unless they are deemed not to represent fair value). We attempt to obtain market quotations from at least two brokers or dealers (if available, otherwise from a principal market maker or a primary market dealer or other independent pricing service). We utilize mid-market pricing as a practical expedient for fair value unless a different point within the range is more representative. If and when market quotations are deemed not to represent fair value, we typically utilize independent third-party valuation firms to assist us in determining fair value. Accordingly, such investments go through our multi-step valuation process as described below. In each case, independent valuation firms consider observable market inputs together with significant unobservable inputs in arriving at their valuation recommendations. Debt investments with maturities of 60 days or less shall each be valued at cost plus accreted
discount, or minus amortized premium, which is expected to approximate fair value, unless such valuation, in the judgment of the Investment Adviser, does not represent fair value, in which case such investments shall be valued at fair value as determined in good faith by or under the direction of our Board. Investments that are not publicly traded or whose market quotations are not readily available are valued at fair value as determined in good faith by or under the direction of our Board. Such determination of fair values involves subjective judgments and estimates.
With respect to investments for which market quotations are not readily available or when such market quotations are deemed not to represent fair value, our Board has approved a multi-step valuation process each quarter, as described below:
| (1) | our quarterly valuation process begins with each portfolio company or investment being initially valued by the investment professionals of the Investment Adviser responsible for the portfolio investment; |
| (2) | preliminary valuation conclusions are then documented and discussed with senior management of the Investment Adviser; |
| (3) | independent valuation firms engaged by our Board conduct independent appraisals and review the Investment Adviser’s preliminary valuations and make their own independent assessment for all material assets; |
| (4) | the audit committee of the Board reviews the preliminary valuation of the Investment Adviser and that of the independent valuation firm and responds to the valuation recommendation of the independent valuation firm to reflect any comments; and |
| (5) | the Board discusses valuations and determines the fair value of each investment in our portfolio in good faith based on the input of the Investment Adviser, the respective independent valuation firm and the audit committee. |
Investments in all asset classes are valued utilizing a market approach, an income approach, or both approaches, as appropriate. However, in accordance with ASC 820-10, certain investments that qualify as investment companies in accordance with ASC 946, may be valued using net asset value as a practical expedient for fair value. The market approach uses prices and other relevant information generated by market transactions involving identical or comparable assets or liabilities (including a business). The income approach uses valuation techniques to convert future amounts (for example, cash flows or earnings) to a single present amount (discounted). The measurement is based on the value indicated by current market expectations about those future amounts. In following these approaches, the types of factors that we may take into account in fair value pricing our investments include, as relevant: available current market data, including relevant and applicable market trading and transaction comparables, applicable market yields and multiples, security covenants, call protection provisions, the nature and realizable value of any collateral, the portfolio company’s ability to make payments, its earnings and discounted cash flows, the markets in which the portfolio company does business, comparisons of financial ratios of peer companies that are public, M&A comparables, our principal market (as the reporting entity) and enterprise values, among other factors. When available, broker quotations and/or quotations provided by pricing services are considered as an input in the valuation process. Escrow receivables, if any, included in the receivables for investments sold in the Consolidated Statements of Assets and Liabilities are reviewed quarterly and the value of the receivable is adjusted as necessary. For the fiscal year ended December 31, 2016, there has been no change to the Company’s valuation techniques and the nature of the related inputs considered in the valuation process.
Accounting Standards Codification (“ASC”) Topic 820 classifies the inputs used to measure these fair values into the following hierarchy:
Level 1: Quoted prices in active markets for identical assets or liabilities, accessible by the Company at the measurement date.
Level 2: Quoted prices for similar assets or liabilities in active markets, or quoted prices for identical or similar assets or liabilities in markets that are not active, or other observable inputs other than quoted prices.
Level 3: Unobservable inputs for the asset or liability.
In all cases, the level in the fair value hierarchy within which the fair value measurement in its entirety falls is determined based on the lowest level of input that is significant to the fair value measurement. Our assessment of the significance of a particular input to the fair value measurement in its entirety requires judgment and considers factors specific to each investment. The exercise of judgment is based in part on our knowledge of the asset class and our prior experience.
Determination of fair value involves subjective judgments and estimates. Accordingly, the notes to our consolidated financial statements express the uncertainty with respect to the possible effect of such valuations, and any change in such valuations, on our consolidated financial statements.
Competition
Our primary competitors provide financing to middle-market companies and include other business development companies, commercial and investment banks, commercial financing companies and, to the extent they provide an alternative form of financing, private equity funds. Additionally, alternative investment vehicles, such as hedge funds, frequently invest in middle-market companies. As a result, competition for investment opportunities at middle-market companies can be intense. However, we continue to believe that there has been a reduction in the amount of debt capital available since the downturn in the credit markets, which began in mid-2007, and that this has resulted in a less competitive environment for making new investments. While many middle-market companies were previously able to raise senior debt financing through traditional large financial institutions, we believe this approach to financing will become more difficult as implementation of U.S. and international financial reforms, such as Basel 3, limits the capacity of large financial institutions to hold non-investment grade leveraged loans on their balance sheets. We believe that many of these financial institutions have de-emphasized their service and product offerings to middle-market companies in particular.
Many of our competitors are substantially larger and have considerably greater financial, technical and marketing resources than we do. For example, some competitors may have a lower cost of funds and access to funding sources that are not available to us. In addition, some of our competitors may have higher risk tolerances or different risk assessments, which could allow them to consider a wider variety of investments and establish more relationships than us. Furthermore, many of our competitors are not subject to the regulatory restrictions that the 1940 Act imposes on us as a BDC. We use the industry information available to Messrs. Gross and Spohler and the other investment professionals of Solar Capital Partners to assess investment risks and determine appropriate pricing for our investments in portfolio companies. In addition, we believe that the relationships of Messrs. Gross and Spohler and the other investment professionals of our investment adviser enable us to learn about, and compete effectively for, financing opportunities with attractive leveraged companies in the industries in which we seek to invest.
Staffing
We do not currently have any employees. Mr. Gross, our Chairman and Chief Executive Officer, and Mr. Spohler, our Chief Operating Officer and Regulatory Structureboard member, are managing members and senior investment professionals of, and have financial and controlling interests in, Solar Capital Partners. In addition, Mr. Peteka, our Chief Financial Officer, Treasurer and Corporate Secretary serves as the Chief Financial Officer for Solar Capital Partners. Guy Talarico, our Chief Compliance Officer, is the Chief Executive Officer of Alaric
Compliance Services, LLC, and performs his functions as our Chief Compliance Officer under the terms of an agreement between Solar Capital Management and Alaric Compliance Services, LLC. Solar Capital Management has retained Mr. Talarico and Alaric Compliance Services, LLC pursuant to its obligations under our Administration Agreement.
Our day-to-day investment operations are managed by Solar Capital Partners. Based upon its needs, Solar Capital Partners may hire additional investment professionals. In addition, we will reimburse Solar Capital Management for the allocable portion of overhead and other expenses incurred by it in performing its obligations under the Administration Agreement, including rent, and the allocable portion of the cost of the company’s chief compliance officer and chief financial officer and their respective staffs.
Sarbanes-Oxley Act of 2002
The Sarbanes-Oxley Act of 2002 imposes a wide variety of regulatory requirements on publicly-held companies and their insiders. Many of these requirements affect us. For example:
Pursuant to Rule 13a-14 of the Securities Exchange Act of 1934 (the “1934 Act”), our Chief Executive Officer and Chief Financial Officer must certify the accuracy of the consolidated financial statements contained in our periodic reports;
Pursuant to Item 307 of Regulation S-K, our periodic reports must disclose our conclusions about the effectiveness of our disclosure controls and procedures;
Pursuant to Rule 13a-15 of the 1934 Act, our management must prepare a report regarding its assessment of the effectiveness of internal controls over financial reporting and obtain an audit of the effectiveness of internal controls over financial reporting performed by our independent registered public accounting firm; and
Pursuant to Item 308 of Regulation S-K and Rule 13a-15 of the 1934 Act, our periodic reports must disclose whether there were significant changes in our internal controls or in other factors that could significantly affect these controls subsequent to the date of their evaluation, including any corrective actions with regard to significant deficiencies and material weaknesses.
The Sarbanes-Oxley Act of 2002 requires us to review our current policies and procedures to determine whether we comply with the Sarbanes-Oxley Act of 2002 and the regulations promulgated thereunder. We will continue to monitor our compliance with all regulations that are adopted under the Sarbanes-Oxley Act of 2002 and will take actions necessary to ensure that we are in compliance therewith.
Business Development Company Regulations
A BDC is regulated by the 1940 Act. A BDC must be organized in the United States for the purpose of investing in or lending to primarily private companies and making significant managerial assistance available to them. A BDC may use capital provided by public stockholders and from other sources to make long-term, private investments in businesses. A BDC provides stockholders the ability to retain the liquidity of a publicly traded stock while sharing in the possible benefits, if any, of investing in primarily privately owned companies.
We may not change the nature of our business so as to cease to be, or withdraw our election as, a BDC unless authorized by vote of a majority of our outstanding voting securities, as required by the 1940 Act. A majority of the outstanding voting securities of a company is defined under the 1940 Act as the lesser of: (a) 67% or more of such company’s voting securities present at a meeting if more than 50% of the outstanding voting securities of such company are present or represented by proxy, or (b) more than 50% of the outstanding voting securities of such company. We do not anticipate any substantial change in the nature of our business.
As with other companies regulated by the 1940 Act, a BDC must adhere to certain substantive regulatory requirements. A majority of our directors must be persons who are not interested persons, as that term is defined in the 1940 Act. Additionally, we are required to provide and maintain a bond issued by a reputable fidelity insurance company to protect the BDC. Furthermore, as a BDC, we are prohibited from protecting any director or officer against any liability to us or our stockholders arising from willful misfeasance, bad faith, gross negligence or reckless disregard of the duties involved in the conduct of such person’s office.
As a BDC, we are required to meet an asset coverage ratio, reflecting the value of our total assets to our total senior securities, which include all of our borrowings and any preferred stock we may issue in the future, of at least 200%. We may also be prohibited under the 1940 Act from knowingly participating in certain transactions with our affiliates without the prior approval of our directors who are not interested persons and, in some cases, prior approval by the Securities and Exchange Commission (“SEC”).
We are generally not able to issue and sell our common stock at a price below net asset value per share without annual shareholder approval. We may, however, sell our common stock, or warrants, options or rights to acquire our common stock, at a price below the then-current net asset value of our common stock if our board of directors determines that such sale is in our best interests and the best interests of our stockholders, and our
stockholders approve such sale. At our Annual Meeting of Stockholders on June 7, 2016, our stockholders approved a proposal authorizing us to sell up to 25% of our common stock at a price below our then-current asset value per share, subject to the approval by our board of directors for the offering. This authorization expires on the earlier of June 7, 2017 and the date of our 2017 Annual Meeting of Stockholders, which is expected to be held in May 2017. In addition, we may generally issue new shares of our common stock at a price below net asset value in rights offerings to existing stockholders, in payment of dividends and in certain other limited circumstances.
As a BDC, we are generally limited in our ability to invest in any portfolio company in which our investment adviser or any of its affiliates currently have an investment or to make any co-investments with our investment adviser or its affiliates without an exemptive order from the SEC, subject to certain exceptions.
We will be periodically examined by the SEC for compliance with the 1940 Act.
Qualifying Assets
Under the 1940 Act, a BDC may not acquire any asset other than assets of the type listed in Section 55(a) of the 1940 Act, which are referred to as qualifying assets, unless, at the time the acquisition is made, qualifying assets represent at least 70% of the BDC’s total assets. The principal categories of qualifying assets relevant to our business are the following:
| (1) | Securities purchased in transactions not involving any public offering from the issuer of such securities, which issuer (subject to certain limited exceptions) is an eligible portfolio company, or from any person who is, or has been during the preceding 13 months, an affiliated person of an eligible portfolio company, or from any other person, subject to such rules as may be prescribed by the SEC. An eligible portfolio company is defined in the 1940 Act as any issuer which: |
(a) is organized under the laws of, and has its principal place of business in, the United States;
(b) is not an investment company (other than a small business investment company wholly owned by the BDC) or a company that would be an investment company but for certain exclusions under the 1940 Act; and
(c) satisfies any of the following:
i.) does not have any class of securities that is traded on a national securities exchange;
ii.) has a class of securities listed on a national securities exchange, but has an aggregate market value of outstanding voting and non-voting common equity of less than $250 million;
iii.) is controlled by a BDC or a group of companies including a BDC and the BDC has an affiliated person who is a director of the eligible portfolio company; or
iv.) is a small and solvent company having total assets of not more than $4.0 million and capital and surplus of not less than $2.0 million.
| (2) | Securities of any eligible portfolio company which we |
| (3) | Securities purchased in a private transaction from a U.S. issuer that is not an investment company or from an affiliated person of the issuer, or in transactions incident thereto, if the issuer is in bankruptcy and subject to reorganization or if the issuer, immediately prior to the purchase of its securities, was unable to meet its obligations as they came due without material assistance other than conventional lending or financing arrangements. |
| (4) | Securities of an eligible portfolio company purchased from any person in a private transaction if there is no ready market for such securities and we already own 60% of the outstanding equity of the eligible portfolio company. |
| (5) | Securities received in exchange for or distributed on or with respect to securities described in (1) through (4) above, or pursuant to the exercise of warrants or rights relating to such securities. |
| (6) | Cash, cash equivalents, U.S. government securities or high-quality debt securities maturing in one year or less from the time of investment. |
| (7) | Office furniture and equipment, interests in real estate and leasehold improvements and facilities maintained to conduct the business operations of the |
Under Section 55(b) of the 1940 Act, the value of a BDC’s assets shall be determined as of the date of the most recent financial statements filed by such company with the SEC pursuant to Section 13 of the Securities Exchange1934 Act, of 1934 (the “1934 Act”), and shall be determined no less frequently than annually.
Significant Managerial Assistance to Portfolio Companies
As a BDC, we offer, and must provide upon request, significant managerial assistance to our portfolio companies. This assistance could involve, among other things, monitoring the operations of our portfolio companies, participating in board and management meetings, consulting with and advising officers of portfolio companies and providing other organizational and financial guidance. We may also receive fees for these services. Solar Capital Management provides such managerial assistance, if any, on our behalf to portfolio companies that request this assistance.
Temporary Investments
Pending investment in other types of “qualifying assets,” as described above, our investments may consist of cash, cash equivalents, U.S. government securities or high-quality investment grade debt securities maturing in one year or less from the time of investment, which we refer to, collectively, as temporary investments, so that 70% of our assets are qualifying assets. Typically, we will invest in U.S. Treasury bills or in repurchase agreements, provided that such repurchase agreements are fully collateralized by cash or securities issued by the U.S. government or its agencies, or other high-quality, short-term debt securities.agencies. A repurchase agreement involves the purchase by an investor, such as us, of a specified security and the simultaneous agreement by the seller to repurchase it at an agreed-upon future date and at a price which is greater than the purchase price by an amount that reflects an agreed-upon interest rate. There is no percentage restriction on the proportion of our assets that may be invested in such repurchase agreements. However, if more than 25% of our total assets constitute repurchase agreements from a single counterparty, we would not meet the diversification tests in order to qualify as a RIC for U.S. federal income tax purposes. Thus, we do not intend to enter into repurchase agreements with a single counterparty in excess of this limit. Our investment adviser will monitor the creditworthiness of the counterparties with which we enter into repurchase agreement transactions.
Senior Securities
We are permitted, under specified conditions, to issue multiple classes of indebtedness and one class of stock senior to our common stock if our asset coverage, as defined in the 1940 Act, is at least equal to 200% immediately after each such issuance. In addition, while any senior securities remain outstanding, we must make provisions to prohibit any distribution to our stockholders or the repurchase of such securities or shares unless we meet the applicable asset coverage ratios at the time of the distribution or repurchase. We may also borrow amounts up to 5% of the value of our total assets for temporary or emergency purposes without regard to asset coverage. We may borrow money, which would magnify the potential for gain or loss on amounts invested and may increase the risk of investing in us.
Code of Ethics
We and Solar Capital Partners have each adopted a code of ethics pursuant to Rule 17j-1 under the 1940 Act and Rule 204A-1 under the Investment Advisers Act of 1940 (the “Advisers Act”), respectively, that establishes
procedures for personal investments and restricts certain transactions by our personnel. Our codes of ethics generally do not permit investments by our employees in securities that may be purchased or held by us. You may read and copy these codes of ethics at the SEC’s Public Reference Room in Washington, D.C. You may obtain information on the operation of the Public Reference Room by calling the SEC at 1 (800) SEC-0330. In addition, each code of ethics is available on the EDGAR Database on the SEC’s Internet site at http://www.sec.gov. You may also obtain copies of the codes of ethics, after paying a duplicating fee, by electronic request at the following Email address: publicinfo@sec.gov, or by writing the SEC’s Public Reference Section, 100 F Street, N.E., Washington, D.C. 20549.
Compliance Policies and Procedures
We and our investment adviser have adopted and implemented written policies and procedures reasonably designed to detect and prevent violation of the federal securities laws. We are required to review these compliance policies and procedures annually for their adequacy and the effectiveness of their implementation and to designate a chief compliance officer to be responsible for their administration. Guy Talarico currently serves as our chief compliance officer.Chief Compliance Officer.
Proxy Voting Policies and Procedures
We have delegated our proxy voting responsibility to our investment adviser. A summary of the Proxy Voting Policies and Procedures of our adviser are set forth below. The guidelines are reviewed periodically by the adviser and our non-interested directors, and, accordingly, are subject to change.
As an investment adviser registered under the Investment Advisers Act of 1940, Solar Capital Partners has a fiduciary duty to act solely in the best interests of its clients. As part of this duty, it recognizes that it must vote securities held by its clients in a timely manner free of conflicts of interest. These policies and procedures for voting proxies for investment advisory clients are intended to comply with Section 206 of, and Rule 206(4)-6 under, the Advisers Act.
Our investment adviser votes proxies relating to our portfolio securities in the best interest of our stockholders. Solar Capital Partners reviews on a case-by-case basis each proposal submitted for a proxy vote to determine its impact on our investments. Although it generally votes against proposals that may have a negative impact on our investments, it may vote for such a proposal if there exists compelling long-term reasons to do so. The proxy voting decisions of our investment adviser are made by the senior investment professionals who are responsible for monitoring each of our investments. To ensure that our vote is not the product of a conflict of interest, it requires that: (i) anyone involved in the decision making process disclose to a managing member of Solar Capital Partners any potential conflict that he or she is aware of and any contact that he or she has had with
any interested party regarding a proxy vote; and (ii) employees involved in the decision making process or vote administration are prohibited from revealing how we intend to vote on a proposal in order to reduce any attempted influence from interested parties.
You may obtain information about how we voted proxies by making a written request for proxy voting information to: Solar Capital Partners, LLC, 500 Park Avenue, New York, NY 10022.
Privacy Principles
We are committed to maintaining the privacy of our stockholders and to safeguarding their non-public personal information. The following information is provided to help you understand what personal information we collect, how we protect that information and why, in certain cases, we may share information with select other parties.
Generally, we do not receive any non-public personal information relating to our stockholders, although certain non-public personal information of our stockholders may become available to us. We do not disclose any
non-public personal information about our stockholders (or former stockholders) to anyone, except as permitted by law or as is necessary in order to service stockholder accounts (for example, to a transfer agent or third party administrator).
We restrict access to non-public personal information about our stockholders to employees of our investment adviser and its affiliates with a legitimate business need for the information. We maintain physical, electronic and procedural safeguards designed to protect the non-public personal information of our stockholders.
Taxation as a Regulated Investment Company
As a BDC, we elected to be treated, and intend to qualify annually thereafter, as a RIC under Subchapter M of the Code. As a RIC, we generally will not have to pay corporate-level U.S. federal income taxes on any ordinary income or capital gains that we distribute to our stockholders as dividends. To continue to qualify as a RIC, we must, among other things, meet certain source-of-income and asset diversification requirements (as described below). In addition, to qualify for RIC tax treatment we must distribute to our stockholders, for each taxable year, at least 90% of our “investment company taxable income,” which generally is generally our ordinary income plus the excess of our realized net short-term capital gains over our realized net long-term capital losses (the “Annual Distribution Requirement”). If we qualify as a RIC and satisfy the Annual Distribution Requirement, then we will not be subject to U.S. federal income tax on the portion of our investment company taxable income and net capital gain (i.e., realized net long-term capital gains in excess of realized net short-term capital losses) we distribute (or are deemed to distribute) to stockholders. We will be subject to U.S. federal income tax at the regular corporate rates on any income or capital gain not distributed (or deemed not distributed) to our stockholders.
We will be subject to a 4% nondeductible U.S. federal excise tax on certain undistributed income unless we distribute in a timely manner an amount at least equal to the sum of (1) 98% of our ordinary income for each calendar year, (2) 98.2% of our capital gain net income for the one-year period ending October 31 in that calendar year and (3) any income realized, but not distributed, and on which we paid no U.S. federal income tax, in preceding years (the “Excise Tax Avoidance Requirement”).
In order to qualify as a RIC for U.S. federal income tax purposes, we must, among other things:
at all times during each taxable year, have in effect an election to be treated as a BDC under the 1940 Act;
derive in each taxable year at least 90% of our gross income from (a) dividends, interest, payments with respect to certain securities loans, gains from the sale of stock or other securities or currencies, or other income derived with respect to our business of investing in such stock, securities or currencies and (b) net income derived from an interest in a “qualified publicly traded partnership;” and
diversify our holdings so that at the end of each quarter of the taxable year:
at least 50% of the value of our assets consists of cash, cash equivalents, U.S. government securities, securities of other RICs, and other securities if such other securities of any one issuer do not represent more than 5% of the value of our assets or more than 10% of the outstanding voting securities of the issuer; and
no more than 25% of the value of our assets is invested in (i) the securities, other than U.S. government securities or securities of other RICs, of one issuer, (ii) the securities of two or more issuers that are controlled, as determined under applicable tax rules, by us and that are engaged in the same or similar or related trades or businesses or (iii) the securities of one or more “qualified publicly traded partnerships.”
The Regulated Investment Company Modernization Act of 2010, which was generally effective for 2011 and subsequent tax years, provides some relief from RIC disqualification due to failures of the income and asset diversification requirements, although there may be additional taxes due in such cases.
We may be required to recognize taxable income in circumstances in which we do not receive cash. For example, if we hold debt obligations that are treated under applicable tax rules as having original issue discount (such as debt instruments with payment-in-kind (“PIK”) interest or, in certain cases, increasing interest rates or debt instruments issued with warrants), we must include in income each year a portion of the original issue discount that accrues over the life of the obligation, regardless of whether cash representing such income is received by us in the same taxable year. Because any original issue discount accrued will be included in our investment company taxable income for the year of accrual, we may be required to make a distribution to our stockholders in order to satisfy the Annual Distribution Requirement, even though we will not have received any corresponding cash amount.
Because we may use debt financing, we will be subject to certain asset coverage ratio requirements under the 1940 Act and financial covenants under loan and credit agreements that could, under certain circumstances, restrict us from making distributions necessary to satisfy the Annual Distribution Requirement. If we are unable to obtain cash from other sources or are otherwise limited in our ability to make distributions, we could fail to qualify for RIC tax treatment and thus become subject to corporate-level U.S. federal income tax.
Certain of our investment practices may be subject to special and complex U.S. federal income tax provisions that may, among other things: (i) disallow, suspend or otherwise limit the allowance of certain losses or deductions; (ii) convert lower taxed long-term capital gain into higher taxed short-term capital gain or ordinary income; (iii) convert an ordinary loss or a deduction into a capital loss (the deductibility of which is more limited); (iv) cause us to recognize income or gain without a corresponding receipt of cash; (v) adversely affect the time as to when a purchase or sale of securities is deemed to occur; (vi) adversely alter the characterization of certain complex financial transactions; and (vii) produce income that will not be qualifying income for purposes of the 90% gross income test described above. We will monitor our transactions and may make certain tax elections in order to mitigate the potential adverse effect of these provisions.
Gain or loss realized by us from the sale or exchange of warrants acquired by us as well as any loss attributable to the lapse of such warrants generally will be treated as capital gain or loss. The treatment of such gain or loss as long-term or short-term will depend on how long we held a particular warrant. Upon the exercise of a warrant acquired by us, our tax basis in the stock purchased under the warrant will equal the sum of the amount paid for the warrant plus the strike price paid on the exercise of the warrant. Except as set forth in “Failure to Qualify as a Regulated Investment Company,” the remainder of this discussion assumes we will qualify as a RIC for each taxable year.
Failure to Qualify as a Regulated Investment Company
If we were unable to qualify for treatment as a RIC, we would be subject to tax on all of our taxable income at regular corporate rates. We would not be able to deduct distributions to stockholders, nor would they be
required to be made. Such distributions would be taxable to our stockholders as dividends and, provided certain holding period and other requirements were met, could qualify for treatment as “qualified dividend income” in the hands of non-corporate stockholders (and thus eligible for the same lower maximuma reduced tax rate applicable to long-term capital gains)rate) to the extent of our current and accumulated earnings and profits. Subject to certain limitations under the Code, corporate shareholders would be eligible for the dividends received deduction. Distributions in excess of our current and accumulated earnings and profits would be treated first as a return of capital to the extent of the stockholder’s tax basis, and any remaining distributions would be treated as a capital gain. To re-qualify as a RIC in a subsequent taxable year, we would be required to satisfy the RIC qualification requirements for that year and dispose of any earnings and profits from any year in which we failed to qualify as a RIC. Subject to a limited exception applicable to RICs that qualified as such under Subchapter M of the Code for at least one year prior to disqualification and that re-qualify as a RIC no later than the second year following the non-qualifying year, we could be subject to tax on any unrealized net built-in gains in the assets held by us during the period in which we failed to qualify as a RIC that are recognized within the subsequent 105 years, unless we made a special election to pay corporate-level U.S. federal income tax on such built-in gain at the time of our requalification as a RIC.
Investment Advisory Fees
Pursuant to an investment advisory and management agreement (the “Investment Advisory and Management“Advisory Agreement”), we have agreed to pay Solar Capital Partners a fee for investment advisory and management services consisting of two components — a base management fee and an incentive fee.
The base management fee is calculated at an annual rate of 2.00% of our gross assets. For services rendered under the Investment Advisory and Management Agreement, the base management fee is payable quarterly in arrears. The base management fee is calculated based on the average value of our gross assets at the end of the two most recently completed calendar quarters. For purposes of computing the base management fee, gross assets exclude temporary assets acquired at the end of each fiscal quarter for purposes of preserving investment flexibility in the next fiscal quarter. Temporary assets include, but are not limited to, U.S. treasury bills, other short-term U.S. government or government agency securities, repurchase agreements or cash borrowings.
The incentive fee has two parts, as follows: one is calculated and payable quarterly in arrears based on our pre-incentive fee net investment income for the immediately preceding calendar quarter. For this purpose, pre-incentive fee net investment income means interest income, dividend income and any other income (including any other fees (other than fees for providing managerial assistance), such as commitment, origination, structuring, diligence and consulting fees or other fees that we receive from portfolio companies) accrued during the calendar quarter, minus our operating expenses for the quarter (including the base management fee, expenses payable under the Administration Agreement to Solar Capital Management, and any interest expense and dividends paid on any issued and outstanding preferred stock, but excluding the incentive fee). Pre-incentive fee net investment income includes, in the case of investments with a deferred interest feature (such as original issue discount, debt instruments with pay in kind interest and zero coupon securities), accrued income that we have not yet received in cash. Pre-incentive fee net investment income does not include any realized capital gains, computed net of all realized capital losses or unrealized capital appreciation or depreciation. Pre-incentive fee net investment income, expressed as a rate of return on the value of our net assets at the end of the immediately preceding calendar quarter, is compared to a hurdle of 1.75% per quarter (7.00% annualized). Our net investment income used to calculate this part of the incentive fee is also included in the amount of our gross assets used to calculate the 2.00% base management fee. We pay Solar Capital Partners an incentive fee with respect to our pre-incentive fee net investment income in each calendar quarter as follows:
no incentive fee in any calendar quarter in which our pre-incentive fee net investment income does not exceed the hurdle of 1.75%;
100% of our pre-incentive fee net investment income with respect to that portion of such pre-incentive fee net investment income, if any, that exceeds the hurdle but is less than 2.1875% in any calendar quarter (8.75% annualized). We refer to this portion of our pre-incentive fee net investment income (which exceeds the hurdle but is less than 2.1875%) as the “catch-up.” The “catch-up” is meant to provide our investment adviser with 20% of our pre-incentive fee net investment income as if a hurdle did not apply if this net investment income exceeds 2.1875% in any calendar quarter; and
(which exceeds the hurdle but is less than 2.1875%) as the “catch-up.” The “catch-up” is meant to provide our investment adviser with 20% of our pre-incentive fee net investment income as if a hurdle did not apply if this net investment income exceeds 2.1875% in any calendar quarter; and |
20% of the amount of our pre-incentive fee net investment income, if any, that exceeds 2.1875% in any calendar quarter (8.75% annualized) is payable to Solar Capital Partners (once the hurdle is reached and the catch-up is achieved, 20% of all pre-incentive fee investment income thereafter is allocated to Solar Capital Partners).
The following is a graphical representation of the calculation of the income-related portion of the incentive fee:
Quarterly Incentive Fee Based on Net Investment Income
Pre-incentive fee net investment income
(expressed as a percentage of the value of net assets)
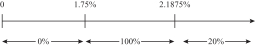
Percentage of pre-incentive fee net investment income
allocated to Solar Capital Partners
These calculations are appropriately pro-rated for any period of less than three months. You should be aware that a rise in the general level of interest rates can be expected to lead to higher interest rates applicable to our debt investments. Accordingly, an increase in interest rates would make it easier for us to meet or exceed the incentive fee hurdle rate and may result in a substantial increase of the amount of incentive fees payable to our investment adviser with respect to pre-incentive fee net investment income.
The second part of the incentive fee is determined and payable in arrears as of the end of each calendar year (or upon termination of the Investment Advisory and Management Agreement, as of the termination date), and equals 20% of our realized capital gains, if any, on a cumulative basis from inception through the end of each calendar year, computed net of all realized capital losses and unrealized capital depreciation on a cumulative basis, less the aggregate amount of any previously paid capital gain incentive fees with respect to each of the investments in our portfolio.
Examples of Quarterly Incentive Fee Calculation
Example 1: Income Related Portion of Incentive Fee (*):
Alternative 1:
Assumptions
Investment income (including interest, dividends, fees, etc.) = 1.25%
Hurdle rate (1) = 1.75%
Management fee (2) = 0.50%
Other expenses (legal, accounting, custodian, transfer agent, etc.) (3) = 0.20%
Pre-incentive fee net investment income
(investment income – (management fee + other expenses)) = 0.55%
Pre-incentive net investment income does not exceed hurdle rate, therefore there is no incentive fee.
Alternative 2:
Assumptions
Investment income (including interest, dividends, fees, etc.) = 2.70%
Hurdle rate (1) = 1.75%
Management fee (2) = 0.50%
Other expenses (legal, accounting, custodian, transfer agent, etc.) (3) = 0.20%
Pre-incentive fee net investment income
(investment income – (management fee + other expenses)) = 2.00%
Incentive fee = 100% × pre-incentive fee net investment income, subject to the “catch-up” (4)
= 100% × (2.00% – 1.75%)
= 0.25%
Alternative 3:
Assumptions
Investment income (including interest, dividends, fees, etc.) = 3.00%
Hurdle rate (1) = 1.75%
Management fee (2) = 0.50%
Other expenses (legal, accounting, custodian, transfer agent, etc.) (3) = 0.20%
Pre-incentive fee net investment income
(investment income – (management fee + other expenses)) = 2.30%
Incentive fee = 20% × pre-incentive fee net investment income, subject to “catch-up” (4)
Incentive fee = 100% × “catch-up” + (20% × (pre-incentive fee net investment income – 2.1875%))
Catch-up = 2.1875% – 1.75%
= 0.4375%
Incentive fee = (100% × 0.4375%) + (20% × (2.3% – 2.1875%))
= 0.4375% + (20% × 0.1125%)
= 0.4375% + 0.0225%
= 0.46%
| (*) | The hypothetical amount of pre-incentive fee net investment income shown is based on a percentage of total net assets. |
| (1) | Represents 7% annualized hurdle rate. |
| (2) | Represents 2% annualized management fee. |
| (3) | Excludes organizational and offering expenses. |
| (4) | The “catch-up” provision is intended to provide our investment adviser with an incentive fee of 20% on all of our pre-incentive fee net investment income as if a hurdle rate did not apply when our net investment income exceeds 2.1875% in any calendar quarter. |
Example 2: Capital Gains Portion of Incentive Fee:
Alternative 1:
Assumptions
Year 1: $20 million investment made in Company A (“Investment A”), and $30 million investment made in Company B (“Investment B”)
Year 2: Investment A sold for $50 million and fair market value (“FMV”) of Investment B determined to be $32 million
Year 3: FMV of Investment B determined to be $25 million
Year 4: Investment B sold for $31 million
The capital gains portion of the incentive fee would be:
Year 1: None
Year 2: Capital gains incentive fee of $6 million ($30 million realized capital gains on sale of Investment A multiplied by 20%)
Year 3: None
$5 million (20% multiplied by ($30 million cumulative capital gains less $5 million cumulative capital depreciation)) less $6 million (previous capital gains fee paid in Year 2)
Year 4: Capital gains incentive fee of $200,000
$6.2 million ($31 million cumulative realized capital gains multiplied by 20%) less $6 million (capital gains fee taken in Year 2)
Alternative 2:
Assumptions
Year 1: $20 million investment made in Company A (“Investment A”), $30 million investment made in Company B (“Investment B”) and $25 million investment made in Company C (“Investment C”)
Year 2: Investment A sold for $50 million, FMV of Investment B determined to be $25 million and FMV of Investment C determined to be $25 million
Year 3: FMV of Investment B determined to be $27 million and Investment C sold for $30 million
Year 4: FMV of Investment B determined to be $24 million
Year 5: Investment B sold for $20 million
The capital gains incentive fee, if any, would be:
Year 1: None
Year 2: $5 million capital gains incentive fee
20% multiplied by $25 million ($30 million realized capital gains on Investment A less unrealized capital depreciation on Investment B)
| • | Year 3: $1.4 million capital gains incentive fee(1) |
$6.4 million (20% multiplied by $32 million ($35 million cumulative realized capital gains less $3 million unrealized capital depreciation)) less $5 million capital gains fee received in Year 2
Year 4: None
Year 5: None
$5 million (20% multiplied by $25 million (cumulative realized capital gains of $35 million less realized capital losses of $10 million)) less $6.4 million cumulative capital gains fee paid in Year 2 and Year 3.
| (1) | As illustrated in Year 3 of Alternative 2 above, if Solar Capital were to be wound up on a date other than December 31 of any year, Solar Capital may have paid aggregate capital gain incentive fees that are more than the amount of such fees that would be payable if Solar Capital had been wound up on December 31 of such year. |
Payment of Our Expenses
All investment professionals of the investment adviser and their respective staffs, when and to the extent engaged in providing investment advisory and management services, and the compensation and routine overhead expenses of such personnel allocable to such services, are provided and paid for by Solar Capital Partners. We bear all other costs and expenses of our operations and transactions, including (without limitation):
the cost of our organization and public offerings;
the cost of calculating our net asset value, including the cost of any third-party valuation services;
the cost of effecting sales and repurchases of our shares and other securities;
interest payable on debt, if any, to finance our investments;
fees payable to third parties relating to, or associated with, making investments, including fees and expenses associated with performing due diligence reviews of prospective investments and advisory fees;
transfer agent and custodial fees;
fees and expenses associated with marketing efforts;
federal and state registration fees, any stock exchange listing fees;
federal, state and local taxes;
independent directors’ fees and expenses;
brokerage commissions;
fidelity bond, directors and officers errors and omissions liability insurance and other insurance premiums;
direct costs and expenses of administration, including printing, mailing, long distance telephone and staff;
fees and expenses associated with independent audits and outside legal costs;
costs associated with our reporting and compliance obligations under the 1940 Act and applicable federal and state securities laws; and
all other expenses incurred by either Solar Capital Management or us in connection with administering our business, including payments under the Administration Agreement that will be based upon our allocable portion of overhead and other expenses incurred by Solar Capital Management in performing its obligations under the Administration Agreement, including rent the fees and expenses associated with performing compliance functions, and ourthe allocable portion of the costs of compensation and related expenses of our chief compliance officer and our chief financial officer and any administrative support staff.
Investments
Solar Capital seeks to create a diverse portfolio that includes senior secured loans, mezzanine loans and equity securities by investing approximately $5 to $100 million of capital, on average, in the securities of leveraged companies, including middle-market companies. We expect that this investment size will vary proportionately with the size of our capital base and/or for strategic initiatives. Structurally, mezzanine loans usually rank subordinate in priority of payment to senior debt, such as senior bank debt, and are often unsecured. As such, other creditors may rank senior to us in the event of insolvency. However, mezzanine loans rank senior to common and preferred equity in a borrowers’ capital structure. Mezzanine loans may have both elements of debt and equity instruments, offering fixed returns in the form of interest payments associated with senior debt, while providing lenders an opportunity to participate in the capital appreciation of a borrower, if any, through an equity interest. This equity interest may take the form of warrants. Due to its higher risk profile and often less
restrictive covenants as compared to senior loans, mezzanine loans generally earn a higher return than senior secured loans. The warrants associated with mezzanine loans, if any, are typically detachable, which may allow for lenders to receive repayment of their principal on an agreed amortization schedule while retaining their equity interest in the borrower. Mezzanine loans also may include a “put” feature, which permits the holder to sell its equity interest back to the borrower at a price determined through an agreed formula. We believe that mezzanine loans have historically offered an attractive investment opportunity based upon their returns and resilience during economic downturns.
In addition to senior secured loans and mezzanine loans, we may invest a portion of our portfolio in opportunistic investments, which are not our primary focus, but are intended to enhance our returns to our investors. These investments may include direct investments in public companies that are not thinly traded and securities of leveraged companies located in select countries outsidecost of the United States. The securities that we invest in are typically rated below investment grade. Securities rated below investment grade are often referred to as “leveraged loans,” “high yield” or “junk” securities, and may be considered “high risk” compared to debt instruments that are rated investment grade. In addition, many of our debt investments will not fully amortize during their lifetime, which could result in a loss or a substantial amount of unpaid principal and interest due upon maturity. We may invest up to 30% of our total assets in such opportunistic investments, including senior loans issued by non-U.S. issuers, subject to compliance with our regulatory obligations as a business development company under the 1940 Act.
We may borrow funds to make investments. As a result, we will be exposed to the risks of leverage, which may be considered a speculative investment technique. The use of leverage magnifies the potential for loss on amounts invested and therefore increases the risks associated with investing in our securities. In addition, the costs associated with our borrowings, including any increase in management fees payable to our investment adviser, Solar Capital Partners, will be borne by our common stockholders.
Additionally, we may in the future seek to securitize our loans to generate cash for funding new investments. To securitize loans, we may create a wholly or partially owned subsidiary and contribute a pool of loans to the subsidiary. This could include the sale of interests in the subsidiary on a non-recourse basis to purchasers who we would expect to be willing to accept a lower interest rate to invest in investment grade loan pools, and we would retain a portion of the equity in the securitized pool of loans.
Moreover, we may acquire investments in the secondary market and, in analyzing such investments, we expect to employ a similar analytical process as we use for our primary investments.
We may utilize instruments such as forward contracts, currency options and interest rate swaps, caps, collars and floors to seek to hedge against fluctuations in the relative values of our portfolio positions from changes in currency exchange rates and market interest rates. Hedging against a decline in the values of our portfolio positions does not eliminate the possibility of fluctuations in the values of such positions or prevent losses if the values of such positions decline. However, such hedging can establish other positions designed to gain from those same developments, thereby offsetting the decline in the value of such portfolio positions. Such hedging transactions may also limit the opportunity for gain if the values of the underlying portfolio positions should increase. It may not be possible to hedge against an exchange rate or interest rate fluctuation that is so generally anticipated that we are not able to enter into a hedging transaction at an acceptable price. Moreover, for a variety of reasons, we may not seek to establish a perfect correlation between such hedging instruments and the portfolio holdings being hedged. Any such imperfect correlation may prevent us from achieving the intended hedge and expose us to risk of loss. In addition, it may not be possible to hedge partially, fully or perfectly against currency fluctuations affecting the value of securities denominated in non-U.S. currencies because the value of those securities is likely to fluctuate as a result of factors not related to currency fluctuations.
Our principal focus is to provide senior secured loans and mezzanine loans to leveraged companies in a variety of industries. We generally seek to target companies that generate positive cash flows. We generally seek to invest in companies from the broad variety of industries in which our investment adviser has direct expertise.
The following is a representative list of the industries in which we may invest:
|
|
We may also invest in other industries if we are presented with attractive opportunities.
We may invest, to the extent permitted by law, in the securities and instruments of other investment companies, including private funds. We may also co-invest on a concurrent basis with affiliates of ours, subject to compliance with applicable regulations, any exemptive order received and our allocation procedures. Certain other types of negotiated co-investments may be made only if we receive an order from the SEC permitting us to do so. There can be no assurance that any other such order will be obtained.
At December 31, 2014, our portfolio consisted of 43 portfolio companies and was invested 58.8% in senior secured loans, 7.4% in subordinated debt, 2.3% in preferred equity and 31.5% in common equity and warrants, in each case, measured at fair value. We expect that our portfolio will continue to include primarily senior secured and mezzanine loans as well as, to a lesser extent, equity-related securities. In addition, we also expect to invest a portion of our portfolio in opportunistic investments, which are not our primary focus, but are intended to enhance our risk-adjusted returns to stockholders. These investments may include, but are not limited to, securities of public companies and debt and equity securities of companies located outside of the United States.
While our primary investment objective is to generate current income and capital appreciation through investments in U.S. senior and subordinated loans, other debt securities and equity, we may also invest a portion of the portfolio in opportunistic investments, including foreign securities.
Listed below are our top ten portfolio companies and industries based on their fair value and represented as a percentage of total assets as of December 31, 2014 and 2013:
TOP TEN PORTFOLIO COMPANIES AND INDUSTRIES AS OF DECEMBER 31, 2014
| ||||
| ||||
| ||||
| ||||
| ||||
| ||||
| ||||
| ||||
| ||||
| ||||
| ||||
| ||||
| ||||
| ||||
| ||||
| ||||
| ||||
| ||||
| ||||
| ||||
| ||||
| ||||
TOP TEN PORTFOLIO COMPANIES AND INDUSTRIES AS OF DECEMBER 31, 2013
| ||||
| ||||
| ||||
| ||||
| ||||
| ||||
| ||||
| ||||
| ||||
| ||||
| ||||
| ||||
| ||||
| ||||
| ||||
| ||||
| ||||
| ||||
| ||||
| ||||
| ||||
| ||||
Listed below is the geographic breakdown of the portfolio based on fair value as of December 31, 2014, 2013 and 2012:
Geographic Region | % of Portfolio at December 31, 2014 | % of Portfolio at December 31, 2013 | % of Portfolio at December 31, 2012 | |||||||||
United States | 99.1 | % | 96.9 | % | 94.9 | % | ||||||
Canada | 0.9 | % | 3.1 | % | 2.5 | % | ||||||
Western Europe | — | — | 2.5 | % | ||||||||
Australia | — | — | 0.1 | % | ||||||||
|
|
|
|
|
| |||||||
| 100.0 | % | 100.0 | % | 100.0 | % | |||||||
|
|
|
|
|
| |||||||
Investment Selection Process
Solar Capital Partners is committed to and utilizes a value-oriented investment philosophy with a focus on the preservation of capital and a commitment to managing downside exposure.
Portfolio Company Characteristics
We have identified several criteria that we believe are important in identifying and investing in prospective portfolio companies. These criteria provide general guidelines for our investment decisions; however, not all of these criteria will be met by each prospective portfolio company in which we choose to invest.
Stable Earnings and Strong Free Cash Flow. We seek to invest in companies who have demonstrated stable earnings through economic cycles. We target companies that can de-lever through consistent generation of cash flows rather than relying solely on growth to service and repay our loans.
Value Orientation. Our investment philosophy places a premium on fundamental analysis from an investor’s perspective and has a distinct value orientation. We focus on companies in which we can invest at relatively low multiples of operating cash flow and that are profitable at the time of investment on an operating cash flow basis.
Value of Assets. The prospective value of the assets, if any, that collateralizes the loans in which we invest, is an important factor in our credit analysis. Our analysis emphasizes both tangible assets, such as accounts receivable, inventory, equipment and real estate, and intangible assets, such as intellectual property, customer lists, networks and databases. In some of our transactions the portfolio company’s fundings may be derived from a borrowing base determined by the value of such company’s assets.
Strong Competitive Position in Industry. We seek to invest in target companies that have developed leading market positions within their respective markets and are well positioned to capitalize on growth opportunities. We seek companies that demonstrate significant competitive advantages versus their competitors, which we believe should help to protect their market position and profitability.
Diversified Customer and Supplier Base. We seek to invest in businesses that have a diversified customer and supplier base. We believe that companies with a diversified customer and supplier base are generally better able to endure economic downturns, industry consolidation, changing business preferences and other factors that may negatively impact their customers, suppliers and competitors.
Exit Strategy. We predominantly invest in companies which provide multiple alternatives for an eventual exit. We look for opportunities that provide an exit typically within three years of the initial capital commitment.
We generally seek companies that we believe will provide a steady stream of cash flow to repay our loans and reinvest in their respective businesses. We believe that such internally generated cash flow, leading to the payment of our interest, and the repayment of our principal, represent a key means by which we will be able to exit from our investments over time.
In addition, we also seek to invest in companies whose business models or expected future cash flows offer attractive exit possibilities. These companies include candidates for strategic acquisition by other industry participants and companies that may repay our investments through an initial public offering of common stock or another capital market transaction. We generally underwrite our investments on a held-to-maturity basis, but expensive capital is often repaid prior to stated maturity.
Experienced and Committed Management. We generally require that portfolio companies have an experienced management team. We also require portfolio companies have in place proper incentives to induce management to succeed and to act in concert with our interests as investors, including having significant equity interests.
Strong Sponsorship. We generally aim to invest alongside other sophisticated investors. We typically seek to partner with successful financial sponsors who have historically generated high returns. We believe that investing in these sponsors’ portfolio companies enables us to benefit from their direct involvement and due diligence.
Solar Capital’s investment team works in concert with sponsors to proactively manage investment opportunities by acting as a partner throughout the investment process. We actively focus on the middle-market financial sponsor community, with a particular focus on the upper-end of the middle-market (sponsors with equity funds of $800 million to $3 billion). We favor such sponsors because they typically:
buy larger companies with strong business franchises;
invest significant amounts of equity in their portfolio companies;
value flexibility and creativity in structuring their transactions;
possess longer track records over multiple investment funds;
have a deeper management bench;
have better ability to withstand downturns; and
possess the ability to support portfolio companies with additional capital.
We divide our coverage of these sponsors among our more senior investment professionals, who are responsible for day-to-day interaction with financial sponsors. Our coverage approach aims to act proactively, consider all investments in the capital structure, provide quick feedback, deliver on commitments, and are constructive throughout the life cycle of an investment.
Due Diligence
Our “private equity” approach to credit investing typically incorporates extensive in-depth due diligence often alongside the private equity sponsor. In conducting due diligence, we will use publicly available information as well as information from relationships with former and current management teams, consultants, competitors and investment bankers. We believe that our due diligence methodology allows us to screen a high volume of potential investment opportunities on a consistent and thorough basis.
Our due diligence typically includes:
review of historical and prospective financial information;
review and valuation of assets;
research relating to the company’s management, industry, markets, products and services and competitors;
on-site visits;
discussions with management, employees, customers or vendors of the potential portfolio company;
review of senior loan documents; and
background investigations.
We also expect to evaluate the private equity sponsor making the investment. Further, due to Solar Capital Partners’ considerable repeat business with sponsors, we have direct experience with the management teams of many sponsors. A private equity sponsor is typically the controlling shareholder upon completion of an investment and as such is considered critical to the success of the investment. The equity sponsor is evaluated along several key criteria, including:
investment track record;
industry experience;
capacity and willingness to provide additional financial support to the company through additional capital contributions, if necessary; and
reference checks.
Throughout the due diligence process, a deal team is in constant dialogue with the management team of the company in which we are considering to invest to ensure that any concerns are addressed as early as possible through the process and that unsuitable investments are filtered out before considerable time has been invested.
Upon the completion of due diligence and a decision to proceed with an investment in a company, the investment professionals leading the investment present the investment opportunity to Solar Capital Partners’ investment committee, which then determine whether to pursue the potential investment. Additional due diligence with respect to any investment may be conducted on our behalf by attorneys and independent accountants prior to the closing of the investment, as well as other outside advisers, as appropriate.
The Investment Committee
All new investments are required to be approved by a consensus of the investment committee of Solar Capital Partners, which is led by Messrs. Gross and Spohler. The members of Solar Capital Partners’ investment committee receive no compensation from us. Such members may be employees or partners of Solar Capital Partners and may receive compensation or profit distributions from Solar Capital Partners.
Investment Structure
Once we determine that a prospective portfolio company is suitable for investment, we work with the management of that company and its other capital providers, including senior, junior and equity capital providers, to structure an investment. We negotiate among these parties to agree on how our investment is expected to perform relative to the other capital in the portfolio company’s capital structure.
We invest in portfolio companies in the form of senior secured loans. We seek to obtain security interests in the assets of our portfolio companies that serve as collateral in support of the repayment of these loans. This collateral may take the form of first or second priority liens on the assets of a portfolio company.
We structure our mezzanine investments primarily as unsecured, subordinated loans that provide for relatively high, fixed or floating interest rates that provide us with significant current interest income. These loans typically have interest-only payments in the early years, with amortization of principal deferred to the later years of the mezzanine loans. In some cases, we may enter into loans that, by their terms, convert into equity or additional debt securities or defer payments of interest for the first few years after our investment. Also, in some cases our mezzanine loans may be collateralized by a subordinated lien on some or all of the assets of the borrower. Typically, our mezzanine loans have maturities of five to ten years.
Typically, our senior secured and mezzanine loans have final maturities of five to ten years. However, we expect that our portfolio companies often may repay these loans early, generally within two to four years from the date of initial investment. To preserve an acceptable return on investment, we seek to structure these loans with prepayment premiums.
In the case of our senior secured and mezzanine loan investments, we tailor the terms of the investment to the facts and circumstances of the transaction and the prospective portfolio company, negotiating a structure that protects our rights and manages our risk while creating incentives for the portfolio company to achieve its business plan and improve its profitability. For example, in addition to seeking a senior or fulcrum position in the capital structure of our portfolio companies, we will seek to limit the downside potential of our investments by:
requiring a total return on our investments (including both interest and potential capital appreciation) that compensates us for credit risk;
incorporating “put” rights and call protection into the investment structure; and
negotiating covenants in connection with our investments that afford our portfolio companies as much flexibility in managing their businesses as possible, consistent with preservation of our capital. Such restrictions may include affirmative and negative covenants, default penalties, lien protection, change of control provisions and board rights, including either observation or participation rights.
Our investments may include equity features, such as warrants or options to buy a minority interest in the portfolio company. Any warrants we receive with our debt securities generally require only a nominal cost to exercise, and thus, as a portfolio company appreciates in value, we may achieve additional investment return from this equity interest. We may structure the warrants to provide provisions protecting our rights as a minority interest holder, as well as puts, or rights to sell such securities back to the company, upon the occurrence of specified events. In many cases, we also obtain registration rights in connection with these equity securities, which may include demand and “piggyback” registration rights. In addition, we may from time to time make direct equity investments in portfolio companies.
We generally seek to hold most of our investments to maturity or repayment, but may attempt to sell our investments earlier, including if a liquidity event takes place such as the sale or recapitalization of a portfolio company.
Managerial Assistance
As a BDC, we offer, and must provide upon request, managerial assistance to our portfolio companies. This assistance could involve, among other things, monitoring the operations of our portfolio companies, participating in board and management meetings, consulting with and advising officers of portfolio companies and providing other organizational and financial guidance. We may receive fees for these services.
Ongoing Relationships with Portfolio Companies
Solar Capital Partners monitors our portfolio companies on an ongoing basis. Solar Capital Partners monitors the financial trends of each portfolio company to determine if it is meeting its business plan and to assess the appropriate course of action for each company.
Solar Capital Partners has several methods of evaluating and monitoring the performance and fair value of our investments, which include the following:
Assessment of success in adhering to each portfolio company’s business plan and compliance with covenants;
Periodic and regular contact with portfolio company management and, if appropriate, the financial or strategic sponsor, to discuss financial position, requirements and accomplishments;
Comparisons to other Solar Capital portfolio companies in the industry, if any;
Attendance at and participation in board meetings; and
Review of monthly and quarterly financial statements and financial projections for portfolio companies.
In addition to various risk management and monitoring tools, Solar Capital Partners also uses an investment rating system to characterize and monitor our expected level of returns on each investment in our portfolio.
We use an investment rating scale of 1 to 4. The following is a description of the conditions associated with each investment rating:
|
| |
Solar Capital Partners monitors and, when appropriate, changes the investment ratings assigned to each investment in our portfolio. As of December 31, 2014, 2013 and 2012, the weighted average investment rating on the fair market value of our portfolio was a 2. In connection with our valuation process, Solar Capital Partners reviews these investment ratings on a quarterly basis.
Valuation Procedures
We conduct the valuation of our assets, pursuant to which our net asset value shall be determined, at all times consistent with U.S. generally accepted accounting principles (“GAAP”) and the 1940 Act and generally value our assets (and certain liabilities) on a quarterly basis, or more frequently if required. Our valuation procedures are summarized in more detail below:
Securities for which market quotations are readily available on an exchange shall be valued at the closing price on the day of valuation. We may also obtain quotes with respect to certain of our investments from pricing services or brokers or dealers in order to value assets. When doing so, we determine whether the quote obtained is sufficient according to GAAP to determine the fair value of the security. If determined adequate, we use the quote obtained. Debt investments with maturities of 60 days or less shall each be valued at cost plus accreted discount, or minus amortized premium, which is expected to approximate fair value, unless such valuation, in the judgment of the investment adviser, does not represent fair value, in which case such investments shall be valued at fair value as determined in good faith by or under the direction of our board.
Securities for which reliable market quotations are not readily available or for which the pricing source does not provide a valuation or methodology or provides a valuation or methodology that, in the judgment of our investment adviser or board of directors, does not represent fair value, shall each be valued as follows: (i) each portfolio company or investment is initially valued by the investment professionals responsible for the portfolio investment; (ii) preliminary valuation conclusions are documented and discussed with our senior management; (iii) independent third-party valuation firms engaged by, or on behalf of, the board of directors will conduct independent appraisals and review management’s preliminary valuations and make their own assessment for all
material assets; (iv) the board of directors will discuss valuations and determine the fair value of each investment in our portfolio in good faith based on the input of the investment adviser and, where appropriate, the respective third-party valuation firms.
The recommendation of fair value will generally consider the following factors among others, as relevant:
the nature and realizable value of any collateral;
the portfolio company’s ability to make payments;
the portfolio company’s earnings and discounted cash flow;
the markets in which the issuer does business; and
comparisons to publicly traded securities.
Securities for which market quotations are not readily available or for which a pricing source is not sufficient may include, but are not limited to, the following:
private placements and restricted securities that do not have an active trading market;
securities whose trading has been suspended or for which market quotes are no longer available;
debt securities that have recently gone into default and for which there is no current market;
securities whose prices are stale;
securities affected by significant events; and
securities that the investment adviser believes were priced incorrectly.
Determination of fair value involves subjective judgments and estimates. Accordingly, the notes to our consolidated financial statements express the uncertainty with respect to the possible effect of such valuations, and any change in such valuations, on our consolidated financial statements.
Competition
Our primary competitors provide financing to middle-market companies and include other business development companies, commercial and investment banks, commercial financing companies and, to the extent they provide an alternative form of financing, private equity funds. Additionally, alternative investment vehicles, such as hedge funds, frequently invest in middle-market companies. As a result, competition for investment opportunities at middle-market companies can be intense. However, we continue to believe that there has been an overall reduction in the amount of debt capital available on average since the downturn in the credit markets, which began in mid-2007, and that this has resulted in a somewhat less competitive environment for making new investments. While many middle-market companies were previously able to raise senior debt financing through traditional large financial institutions, we believe this approach to financing is more difficult as implementation of U.S. and international financial reforms, such as Basel 3, limits the capacity of large financial institutions to hold non-investment grade leveraged loans on their balance sheets. We believe that many of these financial institutions have de-emphasized their service and product offerings to middle-market companies in particular.
Many of our competitors are substantially larger and have considerably greater financial, technical and marketing resources than we do. For example, some competitors may have a lower cost of funds and access to funding sources that are not available to us. In addition, some of our competitors may have higher risk tolerances or different risk assessments, which could allow them to consider a wider variety of investments and establish more relationships than us. Furthermore, many of our competitors are not subject to the regulatory restrictions that the 1940 Act imposes on us as a business development company. We use the industry information available to Messrs. Gross and Spohler and the other investment professionals of Solar Capital Partners to assess investment risks and determine appropriate pricing for our investments in portfolio companies. In addition, we
believe that the relationships of Messrs. Gross and Spohler and the other senior investment professionals of our investment adviser enable us to learn about, and compete effectively for, financing opportunities with attractive leveraged companies in the industries in which we seek to invest.
Staffing
We do not currently have any employees. Mr. Gross, our chairman and chief executive officer, and Mr. Spohler, our chief operating officer, currently serve as the managing member and partner, respectively, of our investment adviser, Solar Capital Partners. Richard Peteka, our chief financial officer and corporate secretary, is an officer and employee of Solar Capital Management, and performs his functions as chief financial officer under the terms of our Administration Agreement. Guy Talarico, our chief compliance officer, is the chief executive officer of Alaric Compliance Services, LLC, and performs his functions as our chief compliance officer under the terms of an agreement between Solar Capital Management and Alaric Compliance Services, LLC. Solar Capital Management has retained Mr. Talarico and Alaric Compliance Services, LLC pursuant to its obligations under our Administration Agreement.
Our day-to-day investment operations are managed by Solar Capital Partners. Solar Capital Management is responsible for all other day-to-day operations. We will reimburse Solar Capital Management for the allocable portion of overhead and other expenses incurred by it in performing its obligations under the Administration Agreement, including rent, the fees and expenses associated with performing compliance functions, and the compensation of ourCompany’s chief compliance officer and chief financial officer and any administrative support staff.
Sarbanes-Oxley Act of 2002
The Sarbanes-Oxley Act of 2002 imposes a wide variety of regulatory requirements on publicly-held companies and their insiders. Many of these requirements affect us. For example:
Pursuant to Rule 13a-14 of the 1934 Act, our Chief Executive Officer and Chief Financial Officer must certify the accuracy of the consolidated financial statements contained in our periodic reports;respective staffs.
Pursuant to Item 307 of Regulation S-K, our periodic reports must disclose our conclusions about the effectiveness of our disclosure controls and procedures;
Pursuant to Rule 13a-15 of the 1934 Act, our management must prepare a report regarding its assessment of the effectiveness of internal controls over financial reporting and obtain an audit of the effectiveness of internal controls over financial reporting performed by our independent registered public accounting firm; and
Pursuant to Item 308 of Regulation S-K and Rule 13a-15 of the 1934 Act, our periodic reports must disclose whether there were significant changes in our internal controls or in other factors that could significantly affect these controls subsequent to the date of their evaluation, including any corrective actions with regard to significant deficiencies and material weaknesses.
The Sarbanes-Oxley Act of 2002 requires us to review our current policies and procedures to determine whether we comply with the Sarbanes-Oxley Act of 2002 and the regulations promulgated thereunder. We will continue to monitor our compliance with all regulations that are adopted under the Sarbanes-Oxley Act of 2002 and will take actions necessary to ensure that we are in compliance therewith.
Available Information
You may read and copy any materials we file with the SEC at the SEC’s Public Reference Room at 100 F Street, NE, Washington, DC 20549, on official business days during the hours of 10:00 am to 3:00 pm. You may obtain information on the operation of the Public Reference Room by calling the SEC at 1-800-SEC-0330. The SEC maintains an Internet site that contains reports, proxy and information statements, and other information regarding issuers that file electronically with the SEC. The address of that site is(http://www.sec.gov).
Our internet address iswww.solarcapltd.com. We make available free of charge on our website our annual report on Form 10-K, quarterly reports on Form 10-Q, current reports on Form 8-K and amendments to those reports as soon as reasonably practicable after we electronically file such material with, or furnish it to, the SEC. Information contained on our website is not incorporated by reference into this annual report on Form 10-K, and you should not consider information contained on our website to be part of this annual report on Form 10-K.
| Item 1A. | Risk Factors |
AnBefore you invest in our securities, you should be aware of various risks, including those described below. You should carefully consider these risk factors, together with all of the other information included in this annual report on Form 10-K, before you decide whether to make an investment in our securities involves certain risks relating to our structure and investment objectives.securities. The risks set forthout below are not the only risks we face, and we face other risks which we have not yet identified, which we do not currently deem material or which are not yet predictable.face. If any of the following events occur, our business, financial condition and results of operations could be materially adversely affected. In such case, our net asset value and the trading price of our common stock could decline or the value of our preferred stock, debt securities, or warrants may decline, and you may lose all or part of your investment.
Risks Related to Our Investments
We operate in a highly competitive market for investment opportunities.
A number of entities compete with us to make the types of investments that we target in leveraged companies. We compete with other BDCs, public and private funds, commercial and investment banks, commercial financing companies and, to the extent they provide an alternative form of financing, private equity funds. Many of our competitors are substantially larger and have considerably greater financial, technical and marketing resources than we do. For example, some competitors may have a lower cost of funds and access to funding sources that are not available to us. In addition, some of our competitors may have higher risk tolerances or different risk assessments than we do,have, which could allow them to consider a wider variety of investments and establish more relationships and offer better pricing and a more flexible structure than us.we are able to do. Furthermore, many of our potential competitors are not subject to the regulatory restrictions that the 1940 Act imposes on us.us as a BDC. If we are unable to source attractive investments, we may hold a greater percentage of our assets in cash and cash equivalents than anticipated, which could impact potential returns on our portfolio. We cannot assure you that the competitive pressures we face will not have a material adverse effect on our business, financial condition and results of operations. Also, as a result of this competition, we may not be able to take advantage of attractive investment opportunities from time to time, and we can offer no assurance that we will be able to identify and make investments that are consistent with our investment objective.
Participants in our industry compete on several factors, including price, flexibility in transaction structure, customer service, reputation, market knowledge and speed in-decision making. We do not seek to compete primarily based on the interest rates we will offer, and we believe that some of our competitors may make loans with interest rates that will be comparable to or lower than the rates we offer. We may lose investment opportunities if we do not match our competitors’ pricing, terms and structure. However, if we match our competitors’ pricing, terms and structure, we may experience decreased net interest income and increased risk of credit loss.
Our investments are very risky and highly speculative.
We invest primarily in senior secured term loans, mezzanine loans and preferred securities, and select equity investments issued by leveraged companies.
Senior Secured Loans. When we make a senior secured term loan investment in a portfolio company, we generally take a security interest in the available assets of the portfolio company, including the equity interests of its subsidiaries, which we expect to help mitigate the risk that we will not be repaid. However, there is a risk that the collateral securing our loans may decrease in value over time, may be difficult to sell in a timely manner, may be difficult to appraise and may fluctuate in value based upon the success of the business and market conditions, including as a result of the inability of the portfolio company to raise additional capital, and, in some circumstances, our lien could be subordinated to claims of other creditors. In addition, deterioration in a portfolio company’s financial condition and prospects, including its inability to raise additional capital, may be
accompanied by deterioration in the value of the collateral for the loan. Consequently, the fact that a loan is secured does not guarantee that we will receive principal and interest payments according to the loan’s terms, or at all, or that we will be able to collect on the loan should we be forced to enforce our remedies.
Mezzanine Loans and Preferred Securities. Our mezzanine and preferred investments are generally subordinated to senior loans and are generally unsecured. As such, other creditors may rank senior to us in the event of an insolvency. This may result in an above average amount of risk and loss of principal.
Equity Investments. When we invest in senior secured loans, mezzanine loans or preferred securities, we may acquire common equity securities as well. In addition, we may invest directly in the equity securities of portfolio companies. Our goal is ultimately to exit such equity interests and realize gains upon our disposition of such interests. However, the equity interests we receive may not appreciate in value and, in fact, may decline in value. Accordingly, we may not be able to realize gains from our equity interests, and any gains that we do realize on the disposition of any equity interests may not be sufficient to offset any other losses we experience.
In addition, investing in middle-market companies involves a number of significant risks, including:
these companies may have limited financial resources and may be unable to meet their obligations under their debt securities that we hold, which may be accompanied by a deterioration in the value of any collateral and a reduction in the likelihood of us realizing any guarantees we may have obtained in connection with our investment;
they typically have shorter operating histories, narrower product lines and smaller market shares than larger businesses, which tend to render them more vulnerable to competitors’ actions and market conditions, as well as general economic downturns;
they are more likely to depend on the management talents and efforts of a small group of persons; therefore, the death, disability, resignation or termination of one or more of these persons could have a material adverse impact on our portfolio company and, in turn, on us;
they generally have less predictable operating results, may from time to time be parties to litigation, may be engaged in rapidly changing businesses with products subject to a substantial risk of obsolescence, and may require substantial additional capital to support their operations, finance expansion or maintain their competitive position. In addition, our executive officers, directors and our investment adviser may, in the ordinary course of business, be named as defendants in litigation arising from our investments in the portfolio companies; and
expansion or maintain their competitive position. In addition, our executive officers, directors and our investment adviser may, in the ordinary course of business, be named as defendants in litigation arising from our investments in the portfolio companies; and |
they may have difficulty accessing the capital markets to meet future capital needs, which may limit their ability to grow or to repay their outstanding indebtedness upon maturity.
The lack of liquidity in our investments may adversely affect our business.ability to meet our investment objectives.
We generally make investments in private companies. We invest and expect to continue investing in companies whose securities have no established trading market and whose securities are and will be subject to legal and other restrictions on resale or whose securities are and will be less liquid than are publicly-traded securities. Investments purchased by us that are liquid at the time of purchase may subsequently become illiquid due to events relating to the issuer of the investments, market events, economic conditions or investor perceptions. The illiquidity of our investments may make it difficult for us to sell such investments if the need arises. In addition, if we are required to liquidate all or a portion of our portfolio quickly, we may realize significantly less than the value at which we have previously recorded our investments. As a result, we do not expect to achieve liquidity in our investments in the near-term. However, to maintain our qualification as a business development companyBDC and as a RIC, we may have to dispose of investments if we do not satisfy one or more of the applicable criteria under the respective regulatory frameworks. Domestic and foreign markets are complex and interrelated, so that events in one sector of the world markets or economy, or in one geographical region, can reverberate and have materially negative consequences for other market, economic or regional sectors in a manner that may not be foreseen and which may negatively impact the liquidity of our investments and materially harm our business. In addition, we may face other restrictions on our ability to liquidate an investment in a portfolio company to the extent that we have material non-public information regarding such portfolio company.
Our portfolio may be concentrated in a limited number of portfolio companies and industries, which will subject us to a risk of significant loss if any of these companies performs poorly or defaults on its obligations under any of its debt instruments or if there is a downturn in a particular industry.
Our portfolio may be concentrated in a limited number of portfolio companies and industries. Beyond the asset diversification requirements associated with our qualification as a RIC under Subchapter M of the Code, we do not have fixed guidelines for diversification, and while we are not targeting any specific industries, our investments may be concentrated in relatively few industries or portfolio companies. As a result, the aggregate returns we realize may be significantly adversely affected if a small number of investments perform poorly or if we need to write down the value of any one investment. Additionally, a downturn in any particular industry in which we are invested could also significantly impact the aggregate returns we realize.
Our investments in securities rated below investment grade are speculative in nature and are subject to additional risk factors such as increased possibility of default, illiquidity of the security, and changes in value based on changes in interest rates.
The securities that we invest in are typically rated below investment grade. Securities rated below investment grade are often referred to as “leveraged loans,” “high yield” or “junk” securities, and may be considered “high risk” compared to debt instruments that are rated investment grade. High yield securities are regarded as having predominantly speculative characteristics with respect to the issuer’s capacity to pay interest and repay principal in accordance with the terms of the obligations and involve major risk exposure to adverse conditions. In addition, high yield securities generally offer a higher current yield than that available from higher grade issues, but typically involve greater risk. These securities are especially sensitive to adverse changes in general economic conditions, to changes in the financial condition of their issuers and to price fluctuation in response to changes in interest rates. During periods of economic downturn or rising interest rates, issuers of below investment grade instruments may experience financial stress that could adversely affect their ability to make payments of principal and interest and increase the possibility of default.
The secondary market for high yield securities may not be as liquid as the secondary market for more highly rated securities. In addition, many of our debt investments will not fully amortize during their lifetime, which could result in a loss or a substantial amount of unpaid principal and interest due upon maturity.
Price declines and illiquidity in the corporate debt markets mayhave adversely affect,affected, and may continue to adversely affect, the fair value of our portfolio investments, reducing our net asset value through increased net unrealized depreciation. Any unrealized depreciation that we experience on our loan portfolio may be an indication of future realized losses, which could reduce our income available for distribution and could adversely affect our ability to service our outstanding borrowings.
As a BDC, we are required to carry our investments at market value or, if no market value is ascertainable, at fair value as determined in good faith by or under the direction of our board of directors. Decreases in the market values or fair values of our investments are recorded as unrealized depreciation. Any unrealized depreciation in our loan portfolio could be an indication of a portfolio company’s inability to meet its repayment obligations to us with respect to the affected loans. This could result in realized losses in the future and ultimately in reductions of our income available for distribution in future periods and could materially adversely affect our ability to service our outstanding borrowings. The unprecedented declines in prices and liquidity in the corporate debt markets from 2008 through mid-2010 resulted in significant net unrealized depreciation in our portfolio, reducing our net asset value. Depending on market conditions, we could incur substantial losses in future periods, which could further reduce our net asset value and have a material adverse impact on our business, financial condition and results of operations.
CapitalGlobal economic, political and market conditions may adversely affect our business, results of operations and financial condition, including our revenue growth and profitability.
The current worldwide financial market situation, as well as various social and political tensions in the United States and around the world, may contribute to increased market volatility, may have long-term effects on the U.S. and worldwide financial markets, have recently beenand may cause economic uncertainties or deterioration in the United States and worldwide. The U.S. and global capital markets experienced extreme volatility and disruption during the economic downturn that began in mid-2007, and the U.S. economy was in a periodrecession for several consecutive calendar quarters during the same period. In 2010, a financial crisis emerged in Europe, triggered by high budget deficits and rising direct and contingent sovereign debt, which created concerns about the ability of disruptioncertain nations to continue to service their sovereign debt obligations. Risks resulting from such debt crisis, including any austerity measures taken in exchange for bailout of certain nations, and instability. These market conditionsany future debt crisis in Europe or any similar crisis elsewhere could have materially and adversely affecteda detrimental impact on the global economic recovery, sovereign and non-sovereign debt in certain countries and equity capitalthe financial condition of financial institutions generally. In June 2016, the United Kingdom held a referendum in which voters approved an exit from the European Union (“Brexit”), and, accordingly, on February 1, 2017, the U.K. Parliament voted in favor of allowing the U.K. government to begin the formal process of Brexit. Brexit created political and economic uncertainty and instability in the global markets (including currency and credit markets), and especially in the United Kingdom and the European Union, and this uncertainty and instability may last indefinitely. There is continued concern about national-level support for the Euro and the accompanying coordination of fiscal and wage policy among European Economic and Monetary Union member countries. In addition, the fiscal and monetary policies of foreign nations, such as Russia and China, may have a severe impact on the worldwide and U.S. financial markets.
As a result of the 2016 U.S. election, the Republican Party currently controls both the executive and legislative branches of government, which had,increases the likelihood that legislation may be adopted that could significantly affect the regulation of U.S. financial markets. Areas subject to potential change, amendment or repeal include the Dodd-Frank Act and the authority of the Federal Reserve and the Financial Stability Oversight Council. The United States may also potentially withdraw from or renegotiate various trade agreements and take other actions that would change current trade policies of the United States. We cannot predict which, if any, of these actions will be taken or, if taken, their effect on the financial stability of the United States. Such actions could have a significant adverse effect on our business, financial condition and results of operations. We cannot
predict the effects of these or similar events in the future have, a negative impacton the U.S. economy and securities markets or on our businessinvestments. We monitor developments and operations.seek to manage our investments in a manner consistent with achieving our investment objective, but there can be no assurance that we will be successful in doing so.
Volatility or a prolonged disruption in the credit markets could materially damage our business.
The globalWe are required to record our assets at fair value, as determined in good faith by our board of directors, in accordance with our valuation policy. As a result, volatility in the capital markets may have recently been in a period of disruption as evidenced by a lack of liquiditymaterial adverse effect on our valuations and our net asset value, even if we hold investments to maturity. Volatility or dislocation in the debt capital markets significant write-offsmay depress our stock price below our net asset value per share and create a challenging environment in the financial services sector, the re-pricing of credit risk in the broadly syndicated credit marketwhich to raise equity and the failure of certain major financial institutions. Despite actions of the United States federal government and foreign governments, these events contributed to worsening general economic conditions that materially and adversely impacted the broader financial and credit markets and reduced the availability of debt and equity capital for the market as a whole and financial services firms in particular.
capital. These conditions could continue for a prolonged period of time or worsen in the future. While these conditions persist, we and other companies in the financial services sector may have to access, if available, alternative markets for debt and equity capital. Equity capital may be difficult to raise because, subject to some limited exceptions which apply to us, as a BDC we are generally not able to issue additional shares of our common stock at a price less than net asset value without first obtaining approval for such issuance from our stockholders and our independent directors. At our 20142016 Annual Stockholders Meeting, our stockholders approved our ability to sell or otherwise issue shares of our common stock, not exceeding 25% of our then outstanding common stock immediately prior to each such offering, at a price or prices below the then current net asset value per share, in each case subject to the approval of our board of directors and compliance with the conditions set forth in the proxy statement pertaining thereto, during a period beginning on May 6, 2014June 7, 2016 and expiring on the earlier of the one-year anniversary of the date of the 20142016 Annual Stockholders Meeting and the date of our 20152017 Annual Stockholders Meeting, which is expected to be held in June 2015.May 2017. However, notwithstanding such stockholder approval, since our initial public offering on February 9, 2010, we have not sold any shares of our common stock at a price belowin an offering that resulted in proceeds to us of less than our then current net asset value per share. Any offering of our common stock that requires stockholder approval must occur, if at all, within one year after receiving such stockholder approval. In addition, our ability to incur indebtedness (including by issuing preferred stock) is limited by applicable regulations such that our asset coverage, as defined in the 1940 Act, must equal at least 200% immediately after each time we incur indebtedness. The debt capital that will be available, if at all, may be at a higher cost and on less favorable terms and conditions in the future. Any inability to raise capital could have a negative effect on our business, financial condition and results of operations. Additionally, our ability to incur indebtedness is limited by the asset coverage ratio for a BDC, as defined under the 1940 Act. Declining portfolio values negatively impact our ability to borrow additional funds because our net asset value is reduced for purposes of the asset coverage ratio. If the fair value of our assets declines substantially, we may fail to maintain the asset coverage ratio stipulated by the 1940 Act, which could, in turn, cause us to lose our status as a BDC and materially impair our business operations. A lengthy disruption in the credit markets could also materially decrease demand for our investments.
The illiquidity of our investments may make it difficult for us to sell such investments if required. As a result, we may realize significantly less than the value at which we have recorded our investments. In addition, significant changesdisruption in the capital markets includingexperienced in the recent extreme volatility and disruption, havepast has had, and may in the future have, a negative effect on the valuations of our investments and on the potential for liquidity events involving our investments. AnThe debt capital that may be available to us in the future may be at a higher cost and have less favorable terms and conditions than those currently in effect. If our financing costs increase and we have no increase in interest income, then our net investment income will decrease. A prolonged inability to raise capital and any required salemay require us to reduce the volume of our investments for liquidity purposes,we originate and could have a material adverse impact on our business, financial condition orand results of operations. This may also increase the probability that other structural risks negatively impact us. These situations may arise due to circumstances that we may be unable to control, such as a lengthy disruption in the credit markets, a severe decline in the value of the U.S. dollar, a sharp economic downturn or recession or an operational problem that affects third parties or us, and could materially damage our business, financial condition and results of operations.
If we cannot obtain additional capital because of either regulatory or market price constraints, we could be forced to curtail or cease our new lending and investment activities, our net asset value could decrease and our level of distributions and liquidity could be affected adversely.
Our ability to secure additional financing and satisfy our financial obligations under indebtedness outstanding from time to time will depend upon our future operating performance, which is subject to the prevailing general economic and credit market conditions, including interest rate levels and the availability of credit generally, and financial, business and other factors, many of which are beyond our control. The prolonged continuation or worsening of current economic and capital market conditions could have a material adverse effect on our ability to secure financing on favorable terms, if at all.
If we are unable to obtain debt capital, then our equity investors will not benefit from the potential for increased returns on equity resulting from leverage to the extent that our investment strategy is successful and we may be limited in our ability to make new commitments or fundings to our portfolio companies.
Uncertainty about the financial stability of the United States and of several countries in the European Union (EU) could have a significant adverse effect on our business, results of operations and financial condition.
Due to federal budget deficit concerns, S&P downgraded the federal government’s credit rating from AAA to AA+ for the first time in history on August 5, 2011. Further, Moody’s and Fitch have warned that they may downgrade the federal government’s credit rating. Further downgrades or warnings by S&P or other rating agencies, and the government’s credit and deficit concerns in general, could cause interest rates and borrowing costs to rise, which may negatively impact both the perception of credit risk associated with our debt portfolio and our ability to access the debt markets on favorable terms. In addition, a decreased credit rating could create broader financial turmoil and uncertainty, which may weigh heavily on our financial performance and the value of our common stock.
In 2010, a financial crisis emerged in Europe, triggered by high budget deficits and rising direct and contingent sovereign debt in Greece, Ireland, Italy, Portugal and Spain, which created concerns about the ability of these nations to continue to service their sovereign debt obligations. Risks and ongoing concerns resulting from the debt crisis in Europe could have a detrimental impact on the global economic recovery, sovereign and non-sovereign debt in these countries and the financial condition of European financial institutions. Market and economic disruptions have affected, and may continue to affect, consumer confidence levels and spending, personal bankruptcy rates, levels of incurrence and default on consumer debt and home prices, among other factors. We cannot assure you that the market disruptions in Europe, including the increased cost of funding for certain governments and financial institutions, will not spread, and we cannot assure you that future assistance packages will be available, or if available, sufficient to stabilize the affected countries and markets in Europe or elsewhere. To the extent uncertainty regarding any economic recovery in Europe continues to negatively impact consumer confidence and consumer credit factors, our business and results of operations could be significantly and adversely affected.
In October 2014, the U.S. Federal Reserve announced that it has terminated its bond-buying program, or quantitative easing, which was designed to stimulate the economy and expand the Federal Reserve’s holdings of long-term securities until key economic indicators, such as the unemployment rate, showed signs of improvement. It is unclear what effect, if any, the Federal Reserve’s termination of quantitative easing will have on the value of our investments. However, it is possible that without quantitative easing by the Federal Reserve, these developments, along with the European sovereign debt crisis, could cause interest rates and borrowing costs to rise, which may negatively impact our ability to access the debt markets on favorable terms.
Uncertainty relating to the LIBOR calculation process may adversely affect the value of our portfolio of the LIBOR-indexed, floating-rate debt securities.
ConcernsIn the recent past, concerns have been publicized that some of the member banks surveyed by the British Bankers’ Association (“BBA”) in connection with the calculation of LIBOR across a range of maturities and currencies may have been under-reporting or otherwise manipulating the inter-bank lending rate applicable to them in order to profit on their derivatives positions or to avoid an appearance of capital insufficiency or adverse reputational or other consequences that may have resulted from reporting inter-bank lending rates higher than those they actually submitted. A number of BBA member banks have entered into settlements with their regulators and law enforcement agencies with respect to alleged manipulation of LIBOR, and investigations by regulators and governmental authorities in various jurisdictions are ongoing.
Actions by the BBA, regulators or law enforcement agencies may result in changes to the manner in which LIBOR is determined. Uncertainty as to the nature of such potential changes may adversely affect the market for LIBOR-based securities, including our portfolio of LIBOR-indexed, floating-rate debt securities. In addition, any further changes or reforms to the determination or supervision of LIBOR may result in a sudden or prolonged increase or decrease in reported LIBOR, which could have an adverse impact on the market for LIBOR-based securities or the value of our portfolio of LIBOR-indexed, floating-rate debt securities.
Economic recessions or downturns could impair the ability of our portfolio companies to repay loans and harm our operating results.
Many of our portfolio companies may be susceptible to economic slowdowns or recessions and may be unable to repay our loans during these periods. Therefore, our non-performing assets may increase and the value of our portfolio may decrease during these periods as we are required to record the values of our investments. Adverse economic conditions also may decrease the value of collateral securing some of our loans and the value of our equity investments at fair value. Economic slowdowns or recessions could lead to financial losses in our portfolio and a decrease in revenues, net income and assets. Unfavorable economic conditions also could increase our funding costs, limit our access to the capital markets or result in a decision by lenders not to extend credit to us. These events could prevent us from increasing investments and harmresult in our operating results.receipt of a reduced level of interest income from our portfolio companies and/or losses or charge offs related to our investments, and, in turn, may adversely affect distributable income and have a material adverse effect on our results of operations.
A portfolio company’s failure to satisfy financial or operating covenants imposed by us or other lenders could lead to defaults and, potentially, acceleration of the time when the loans are due and foreclosure on its secured assets, which could trigger cross-defaults under other agreements and jeopardize the portfolio company’s ability to meet its obligations under the debt that we hold. We may incur additional expenses to the extent
necessary to seek recovery upon default or to negotiate new terms with a defaulting portfolio company. In addition, if one of our portfolio companies were to go bankrupt, depending on the facts and circumstances, including the extent to which we actually provided significant managerial assistance to that portfolio company, a bankruptcy court might re-characterize our debt holdings and subordinate all or a portion of our claim to that of other creditors.
These portfolio companies may face intense competition, including competition from companies with greater financial resources, more extensive research and development, manufacturing, marketing and service capabilities and greater number of qualified and experienced managerial and technical personnel. They may need additional financing which they are unable to secure and which we are unable or unwilling to provide, or they may be subject to adverse developments unrelated to the technologies they acquire.
We may suffer a loss if a portfolio company defaults on a loan and the underlying collateral is not sufficient.
In the event of a default by a portfolio company on a secured loan, we will only have recourse to the assets collateralizing the loan. If the underlying collateral value is less than the loan amount, we will suffer a loss. In addition, we sometimes make loans that are unsecured, which are subject to the risk that other lenders may be directly secured by the assets of the portfolio company. In the event of a default, those collateralized lenders would have priority over us with respect to the proceeds of a sale of the underlying assets. In cases described above, we may lack control over the underlying asset collateralizing our loan or the underlying assets of the portfolio company prior to a default, and as a result the value of the collateral may be reduced by acts or omissions by owners or managers of the assets.
In the event of bankruptcy of a portfolio company, we may not have full recourse to its assets in order to satisfy our loan, or our loan may be subject to equitable subordination. In addition, certain of our loans are subordinate to other debt of the portfolio company. If a portfolio company defaults on our loan or on debt senior to our loan, or in the event of a portfolio company bankruptcy, our loan will be satisfied only after the senior debt receives payment. Where debt senior to our loan exists, the presence of inter-creditor arrangements may limit our ability to amend our loan documents, assign our loans, accept prepayments, exercise our remedies (through “standstill” periods) and control decisions made in bankruptcy proceedings relating to the portfolio company. Bankruptcy and portfolio company litigation can significantly increase collection losses and the time needed for us to acquire the underlying collateral in the event of a default, during which time the collateral may decline in value, causing us to suffer further losses.
If the value of collateral underlying our loan declines or interest rates increase during the term of our loan, a portfolio company may not be able to obtain the necessary funds to repay our loan at maturity through refinancing. Decreasing collateral value and/or increasing interest rates may hinder a portfolio company’s ability
to refinance our loan because the underlying collateral cannot satisfy the debt service coverage requirements necessary to obtain new financing. If a borrower is unable to repay our loan at maturity, we could suffer a loss which may adversely impact our financial performance.
The business, financial condition and results of operations of our portfolio companies could be adversely affected by worldwide economic conditions, as well as political and economic conditions in the countries in which they conduct business.
The business and operating results of our portfolio companies may be impacted by worldwide economic conditions. Although the U.S. economy has in recent quartersyears shown signs of recovery from the 2008–2009 global recession, the strength and duration of any economic recovery will be impacted by worldwide economic growth. For instance, a numberconcerns of recent reports indicate that growtheconomic slowdown in China and other emerging markets may be slowing relativeand signs of deteriorating sovereign debt conditions in Europe could lead to historical growth rates.disruption and instability in the global financial markets. The significant debt in U.S.United States and European countries is expected to hinder growth in those countries for the
foreseeable future. In the future, the U.S. government may not be able to meet its debt payments unless the federal debt ceiling is raised. The federal debt limit has been suspended since November 2, 2015, but the limit is set to be reinstated on March 15, 2017. If legislation increasing the debt ceiling is not enacted, as needed, and the debt ceiling is reached, the U.S. federal government may stop or delay making payments on its obligations, which could negatively impact the U.S. economy and our portfolio companies. Multiple factors relating to the international operations of some of our portfolio companies and to particular countries in which they operate could negatively impact their business, financial condition and results of operations.
Some of the products of our portfolio companies are developed, manufactured, assembled, tested or marketed outside the U.S.United States Any conflict or uncertainty in these countries, including due to natural disasters, public health concerns, political unrest or safety concerns, could harm their business, financial condition and results of operations. In addition, if the government of any country in which their products are developed, manufactured or sold sets technical or regulatory standards for products developed or manufactured in or imported into their country that are not widely shared, it may lead some of their customers to suspend imports of their products into that country, require manufacturers or developers in that country to manufacture or develop products with different technical or regulatory standards and disrupt cross-border manufacturing, marketing or business relationships which, in each case, could harm their businesses.
The effect of global climate change may impact the operations of our portfolio companies.
There may be evidence of global climate change. Climate change creates physical and financial risk and some of our portfolio companies may be adversely affected by climate change. For example, the needs of customers of energy companies vary with weather conditions, primarily temperature and humidity. To the extent weather conditions are affected by climate change, energy use could increase or decrease depending on the duration and magnitude of any changes. Increases in the cost of energy could adversely affect the cost of operations of our portfolio companies if the use of energy products or services is material to their business. A decrease in energy use due to weather changes may affect some of our portfolio companies’ financial condition, through decreased revenues. Extreme weather conditions in general require more system backup, adding to costs, and can contribute to increased system stresses, including service interruptions.
Our failure to make follow-on investments in our portfolio companies could impair the value of our portfolio.
Following an initial investment in a portfolio company, we may make additional investments in that portfolio company as “follow-on” investments, in order to: (i) increase or maintain in whole or in part our equity ownership percentage; (ii) exercise warrants, options or convertible securities that were acquired in the original or subsequent financing; or (iii) attempt to preserve or enhance the value of our investment. We may elect not to make follow-on investments or otherwise lack sufficient funds to make those investments. We will have the discretion to make any follow-on investments, subject to the availability of capital resources. The failure to make follow-on investments may, in some circumstances, jeopardize the continued viability of a portfolio company and our initial investment, or may result in a missed opportunity for us to increase our participation in a successful operation. Even if we have sufficient capital to make a desired follow-on investment, we may elect not to make a follow-on investment because we may not want to increase our concentration of risk, either because we
prefer other opportunities or because we are subject to BDC requirements that would prevent such follow-on investments or the desire to maintain our RIC tax status.
Where we do not hold controlling equity interests in our portfolio companies, we may not be in a position to exercise control over our portfolio companies or to prevent decisions by management of our portfolio companies that could decrease the value of our investments.
Although we hold controlling equity positions in some of our portfolio companies, we do not currently hold controlling equity positions in the majority of our portfolio companies. As a result, we are subject to the risk that a portfolio company in which we do not have a controlling interest may make business decisions with which we disagree, and that the management and/or stockholders of such portfolio company may take risks or otherwise act in ways that are adverse to our interests. Due to the lack of liquidity of the debt and equity investments that we typically hold in our portfolio companies, we may not be able to dispose of our investments in the event we disagree with the actions of a portfolio company and may therefore suffer a decrease in the value of our investments.
Prepayments of our debt investments by our portfolio companies could adversely impact our results of operations and reduce our return on equity.
We are subject to the risk that the investments we make in our portfolio companies may be prepaid prior to maturity. When this occurs, we may reduce our borrowings outstanding or reinvest these proceeds in temporary
investments, pending their future investment in new portfolio companies. These temporary investments, if any, will typically have substantially lower yields than the debt investment being prepaid and we could experience significant delays in reinvesting these amounts. Any future investment in a new portfolio company may also be at lower yields than the debt investment that was prepaid. As a result, our results of operations could be materially adversely affected if one or more of our portfolio companies elect to prepay amounts owed to us. Additionally, prepayments could negatively impact our return on equity, which could result in a decline in the market price of our common stock.
We may choose to waive or defer enforcement of covenants in the debt securities held in our portfolio, which may cause us to lose all or part of our investment in these companies.
We structure the debt investments in our portfolio companies to include business and financial covenants placing affirmative and negative obligations on the operation of the company’s business and its financial condition. However, from time to time we may elect to waive breaches of these covenants, including our right to payment, or waive or defer enforcement of remedies, such as acceleration of obligations or foreclosure on collateral, depending upon the financial condition and prospects of the particular portfolio company. These actions may reduce the likelihood of our receiving the full amount of future payments of interest or principal and be accompanied by a deterioration in the value of the underlying collateral as many of these companies may have limited financial resources, may be unable to meet future obligations and may go bankrupt. This could negatively impact our ability to pay distributions, could adversely affect our results of operation and financial condition and cause the loss of all or part of your investment.
Our loans could be subject to equitable subordination by a court which would increase our risk of loss with respect to such loans.
Courts may apply the doctrine of equitable subordination to subordinate the claim or lien of a lender against a borrower to claims or liens of other creditors of the borrower, when the lender or its affiliates is found to have engaged in unfair, inequitable or fraudulent conduct. The courts have also applied the doctrine of equitable subordination when a lender or its affiliates is found to have exerted inappropriate control over a client, including control resulting from the ownership of equity interests in a client. We have made direct equity investments or received warrants in connection with loans. Payments on one or more of our loans, particularly a loan to a client
in which we may also hold an equity interest, may be subject to claims of equitable subordination. If we were deemed to have the ability to control or otherwise exercise influence over the business and affairs of one or more of our portfolio companies resulting in economic hardship to other creditors of that company, this control or influence may constitute grounds for equitable subordination and a court may treat one or more of our loans as if it were unsecured or common equity in the portfolio company. In that case, if the portfolio company were to liquidate, we would be entitled to repayment of our loan on a pro-rata basis with other unsecured debt or, if the effect of subordination was to place us at the level of common equity, then on an equal basis with other holders of the portfolio company’s common equity only after all of its obligations relating to its debt and preferred securities had been satisfied.
An investment strategy focused primarily on privately held companies presents certain challenges, including the lack of available information about these companies, a dependence on the talents and efforts of only a few key portfolio company personnel and a greater vulnerability to economic downturns.
We invest primarily in privately held companies. Generally, little public information exists about these companies, and we are required to rely on the ability of Solar Capital Partners’ investment professionals to obtain adequate information to evaluate the potential returns from investing in these companies. If we are unable to uncover all material information about these companies, we may not make a fully informed investment decision, and we may lose money on our investments. Also, smaller privately held companies frequently have less diverse product lines and smaller market presence than larger competitors. These factors could adversely affect our investment returns as compared to companies investing primarily in the securities of public companies.
Our portfolio companies may incur debt that ranks equally with, or senior to, our investments in such companies.
We invest primarily in senior secured loans, mezzanine loans, preferred securities, and equity securities issued by our portfolio companies. Our portfolio companies typically have, or may be permitted to incur, other debt that ranks equally with, or senior to, the debt securities in which we invest. By their terms, such debt instruments may provide that the holders are entitled to receive payment of interest or principal on or before the dates on which we are entitled to receive payments in respect of the debt securities in which we invest. Also, in the event of insolvency, liquidation, dissolution, reorganization or bankruptcy of a portfolio company, holders of debt instruments ranking senior to our investment in that portfolio company would typically be entitled to receive payment in full before we receive any distribution in respect of our investment. After repaying such senior creditors, such portfolio company may not have any remaining assets to use for repaying its obligation to us. In the case of debt ranking equally with debt securities in which we invest, we would have to share on an equal basis any distributions with other creditors holding such debt in the event of an insolvency, liquidation, dissolution, reorganization or bankruptcy of the relevant portfolio company. Any such limitations on the ability of our portfolio companies to make principal or interest payments to us, if at all, may reduce our net asset value and have a negative material adverse impact to our business, financial condition and results of operation.
Our investments in foreign securities may involve significant risks in addition to the risks inherent in U.S. investments.
Our investment strategy contemplates potential investments in debt securities of foreign companies. Investing in foreign companies may expose us to additional risks not typically associated with investing in U.S. companies. These risks include changes in exchange control regulations, political and social instability, expropriation, imposition of foreign taxes, less liquid markets and less available information than is generally the case in the United States, higher transaction costs, less government supervision of exchanges, brokers and issuers, less developed bankruptcy laws, difficulty in enforcing contractual obligations, lack of uniform accounting and auditing standards and greater price volatility.
Although most of our investments will be U.S. dollar-denominated, any investments denominated in a foreign currency will be subject to the risk that the value of a particular currency will change in relation to one or
more other currencies. Among the factors that may affect currency values are trade balances, the level of short-term interest rates, differences in relative values of similar assets in different currencies, long-term opportunities for investment and capital appreciation, and political developments. We may employ hedging techniques to minimize these risks, but we can offer no assurance that we will, in fact, hedge currency risk, or that if we do, such strategies will be effective.
We may expose ourselves to risks if we engage in hedging transactions.
If we engage in hedging transactions, we may expose ourselves to risks associated with such transactions. We may utilize instruments such as forward contracts, currency options and interest rate swaps, caps, collars and floors to seek to hedge against fluctuations in the relative values of our portfolio positions from changes in currency exchange rates and market interest rates. Hedging against a decline in the values of our portfolio positions does not eliminate the possibility of fluctuations in the values of such positions or prevent losses if the values of such positions decline. However, such hedging can establish other positions designed to gain from those same developments, thereby offsetting the decline in the value of such portfolio positions. Such hedging transactions may also limit the opportunity for gain if the values of the underlying portfolio positions should increase. It may not be possible to hedge against an exchange rate or interest rate fluctuation that is so generally anticipated that we are not able to enter into a hedging transaction at an acceptable price.
The success of our hedging transactions will depend on our ability to correctly predict movements in currencies and interest rates. Therefore, while we may enter into such transactions to seek to reduce currency
exchange rate and interest rate risks, unanticipated changes in currency exchange rates or interest rates may result in poorer overall investment performance than if we had not engaged in any such hedging transactions. In addition, the degree of correlation between price movements of the instruments used in a hedging strategy and price movements in the portfolio positions being hedged may vary. Moreover, for a variety of reasons, we may not seek to establish a perfect correlation between such hedging instruments and the portfolio holdings being hedged. Any such imperfect correlation may prevent us from achieving the intended hedge and expose us to risk of loss. In addition, it may not be possible to hedge fully or perfectly against currency fluctuations affecting the value of securities denominated in non-U.S. currencies because the value of those securities is likely to fluctuate as a result of factors not related to currency fluctuations. To the extent we engage in hedging transactions, we also face the risk that counterparties to the derivative instruments we hold may default, which may expose us to unexpected losses from positions where we believed that our risk had been appropriately hedged.
Our investment adviser may not be able to achieve the same or similar returns as those achieved by our senior investment professionals while they were employed at prior positions.
Although in the past our senior investment professionals held senior positions at a number of investment firms, their track record and achievements are not necessarily indicative of future results that will be achieved by our investment adviser. In their roles at such other firms, our senior investment professionals were part of investment teams, and they were not solely responsible for generating investment ideas. In addition, such investment teams arrived at investment decisions by consensus.
Risks Relating to an Investment in Our Securities
Our shares may trade at a substantial discount from net asset value and may continue to do so over the long term.
Shares of closed-end investment companies have frequently tradedBDCs may trade at a market price that is less than the net asset value that is attributable to those shares. The possibility that our shares of common stock will trade at a substantial discount from net asset value over the long term is separate and distinct from the risk that our net asset value will decrease. We cannot predict whether shares of our common stock will trade above, at or below our net asset value.value in the future. If our common stock trades below its net asset value, we will generally not be able to issue additional shares or sell our common stock at its market price without first obtaining the approval for such
issuance from our stockholders and our independent directors. At our 20142016 Annual Stockholders Meeting, our stockholders approved our ability to sell or otherwise issue shares of our common stock, not exceeding 25% of our then outstanding common stock immediately prior to each such offering, at a price or prices below the then current net asset value per share, in each case subject to the approval of our board of directors and compliance with the conditions set forth in the proxy statement pertaining thereto, during a period beginning on May 6, 2014June 7, 2016 and expiring on the earlier of the one-year anniversary of the date of the 20142016 Annual Stockholders Meeting and the date of our 20152017 Annual Stockholders Meeting, which is expected to be held in June 2015.May 2017. However, notwithstanding such stockholder approval, since our initial public offering on February 9, 2010, we have not sold any shares of our common stock at a price below our then current net asset value per share. Any offering of our common stock that requires stockholder approval must occur, if at all, within one year after receiving such stockholder approval. If additional funds are not available to us, we could be forced to curtail or cease our new lending and investment activities, and our net asset value could decrease and our level of distributions could be impacted.
Our common stock price may be volatile and may decrease substantially.
The trading price of our common stock may fluctuate substantially. The price of our common stock that will prevail in the market may be higher or lower than the price you pay, depending on many factors, some of which are beyond our control and may not be directly related to our operating performance. These factors include, but are not limited to, the following:
price and volume fluctuations in the overall stock market from time to time;
investor demand for our shares;
significant volatility in the market price and trading volume of securities of BDCs or other companies in our sector, which are not necessarily related to the operating performance of these companies;
exclusion of our common stock from certain market indices, such as the Russell 2000 Financial Services Index, which could reduce the ability of certain investment funds to own our common stock and put short-term selling pressure on our common stock;
changes in regulatory policies or tax guidelines with respect to RICs or BDCs;
failure to qualify as a RIC, or the loss of RIC status;
any shortfall in revenue or net income or any increase in losses from levels expected by investors or securities analysts;
changes, or perceived changes, in the value of our portfolio investments;
departures of Solar Capital Partners’ key personnel;
operating performance of companies comparable to us;
changes in the prevailing interest rates;
loss of a major funding source; or
general economic conditions and trends and other external factors.
Our business and operation could be negatively affected if we become subject to any securities litigation or shareholder activism, which could cause us to incur significant expense, hinder execution of investment strategy and impact our stock price.
In the past, following periods of volatility in the market price of a company’s securities, securities class action litigation has often been brought against that company. DueShareholder activism, which could take many forms or arise in a variety of situations, has been increasing in the BDC space recently. While we are currently not subject to any securities litigation or shareholder activism, due to the potential volatility of our stock price and for a variety of other reasons, we may in the future become the target of securities litigation in the future.or shareholder activism. Securities litigation and shareholder activism, including potential proxy contests, could result in substantial costs and divert management’s and our board of directors’ attention and resources from our business. Additionally, such securities litigation and shareholder activism could give rise to perceived uncertainties as to our future, adversely affect our relationships with service providers and make it more difficult to attract and retain qualified personnel. Also, we may be required to incur significant legal fees and other expenses related to any securities litigation and activist shareholder matters. Further, our stock price could be subject to significant fluctuation or otherwise be adversely affected by the events, risks and uncertainties of any securities litigation and shareholder activism.
There is a risk that our stockholders may not receive distributions or that our distributions may not grow over time.
We intend to make distributions on a quarterly basis to our stockholders out of assets legally available for distribution. We cannot assure you that we will achieve investment results that will allow us to make a specified level of cash distributions or year-to-year increases in cash distributions. In addition, due to the asset coverage
test applicable to us as a BDC, we may be limited in our ability to make distributions. To the extent we make distributions to stockholders which include a return of capital, that portion of the distribution essentially constitutes a return of the stockholders’ investment. Although such return of capital may not be taxable, such distributions may increase an investor’s tax liability for capital gains upon the future sale of our common stock.
As a RIC, if we do not distribute a certain percentage of our income annually, we willmay suffer adverse tax consequences, including failure to obtain, or possible loss of,possibly losing the U.S. federal income tax benefits allowable to RICs. We cannot assure you that you will receive distributions at a particular level or at all.
We may choose to pay distributions in our own common stock, in which case our stockholders may be required to pay U.S. federal income taxes in excess of the cash distributions they receive.
We may distribute taxable distributions that are payable in cash or shares of our common stock at the election of each stockholder. Under certain applicable provisions of the Code and the Treasury regulations, distributions payable in cash or in shares of stock at the election of stockholders are treated as taxable distributions. The Internal Revenue Service has issued private rulings indicating that this rule will apply even where the total amount of cash that may be distributed is limited to no more than 20% of the total distribution. Under these rulings, if too many stockholders elect to receive their distributions in cash, each such stockholder would receive a pro rata share of the total cash to be distributed and would receive the remainder of their distribution in shares of stock. If we decide to make any distributions consistent with these rulings that are payable in part in our stock, taxable stockholders receiving such distributions will be required to include the full amount of the distribution (whether received in cash, our stock, or a combination thereof) as ordinary income (or as long-term capital gain to the extent such distribution is properly reported as a capital gain distribution) to the extent of our current and accumulated earnings and profits for U.S. federal income tax purposes. As a result, a U.S. stockholder may be required to pay tax with respect to such distributions in excess of any cash received. If a U.S. stockholder sells the stock it receives as a distribution in order to pay this tax, the sales proceeds may be less than the amount included in income with respect to the distribution, depending on the market price of our stock at the time of the sale. Furthermore, with respect to non-U.S. stockholders, we may be required to withhold U.S. tax with respect to such distributions, including in respect of all or a portion of such distribution that is payable in stock. In addition, if a significant number of our stockholders determine to sell shares of our stock in order to pay taxes owed on distributions, it may put downward pressure on the trading price of our stock.
Sales of substantial amounts of our common stock in the public market may have an adverse effect on the market price of our common stock.
The shares of our common stock beneficially owned by each of Messrs. Gross and Spohler immediately prior to completion of our initial public offering, including any shares that are attributable to such shares issued pursuant to our dividend reinvestment plan, are no longer subject to lock-up restrictions that each of Messrs. Gross and Spohler agreed to in connection with our initial public offering, and are generally available for resale without restriction, subject to the provisions of Rule 144 promulgated under the Securities Act. In addition, on November 30, 2010, Messrs. Gross and Spohler jointly acquired 115,000 shares of our common stock in a private placement transaction conducted in accordance with Regulation D under the Securities Act. Such shares have been registered with the SEC and are generally available for resale. Sales of substantial amounts of our common stock, or the availability of such common stock for sale, could adversely affect the prevailing market prices for our common stock. If this occurs and continues, it could impair our ability to raise additional capital through the sale of securities should we desire to do so.
We may be unable to invest the net proceeds raised from any offerings on acceptable terms or allocate net proceeds from any offering of our securities in ways with which you may not agree.
We cannot assure you that we will be able to find enough appropriate investments that meet our investment criteria or that any investment we complete using the proceeds from any securities offering will produce a sufficient return. Until we identify new investment opportunities, we intend to either invest the net proceeds of future offerings in cash equivalents, U.S. Government securities and other high-quality debt investments that mature in one year or less or use the net proceeds from such offerings to reduce then-outstanding obligations.
We have significant flexibility in investing the net proceeds of any offering of our securities and may use the net proceeds from an offering in ways with which you may not agree or for purposes other than those contemplated at the time of the offering.
The net asset value per share of our common stock may be diluted if we issue or sell shares of our common stock at prices below the then current net asset value per share of our common stock or securities to subscribe for or convertible into shares of our common stock.
At our 20142016 Annual Stockholders Meeting, our stockholders approved our ability to sell or otherwise issue shares of our common stock, not exceeding 25% of our then outstanding common stock immediately prior to each such offering, at a price or prices below the then current net asset value per share, in each case subject to the approval of our board of directors and compliance with the conditions set forth in the proxy statement pertaining thereto, during a period beginning on May 6, 2014June 7, 2016 and expiring on the earlier of the one-year anniversary of the
date of the 20142016 Annual Stockholders Meeting and the date of our 20152017 Annual Stockholders Meeting, which is expected to be held in June 2015.May 2017. However, notwithstanding such stockholder approval, since our initial public offering on February 9, 2010, we have not sold any shares of our common stock at a price below our then current net asset value per share. Any offering of our common stock that requires stockholder approval must occur, if at all, within one year after receiving such stockholder approval.
In addition, at our 2011 Annual Stockholders Meeting, our stockholders authorized us to sell or otherwise issue warrants or securities to subscribe for or convertible into shares of our common stock subject to certain limitations (including, without limitation, that the number of shares issuable does not exceed 25% of our then outstanding common stock and that the exercise or conversion price thereof is not, at the date of issuance, less than the market value per share of our common stock). Such authorization has no expiration.
We may also use newly issued shares to implement our dividend reinvestment plan, whether our shares are trading at a premium or at a discount to our then current net asset value per share. Any decision to issue or sell shares of our common stock below our then current net asset value per share or securities to subscribe for or convertible into shares of our common stock would be subject to the determination by our board of directors that such issuance or sale is in our and our stockholders’ best interests.
If we were to issue or sell shares of our common stock below our then current net asset value per share, such issuances or sales would result in an immediate dilution to the net asset value per share of our common stock. This dilution would occur as a result of the issuance or sale of shares at a price below the then current net asset value per share of our common stock and a proportionately greater decrease in the stockholders’ interest in our earnings and assets and their voting interest in us than the increase in our assets resulting from such issuance or sale. Because the number of shares of common stock that could be so issued and the timing of any issuance is not currently known, the actual dilutive effect cannot be predicted.
In addition, if we issue warrants or securities to subscribe for or convertible into shares of our common stock, subject to certain limitations, the exercise or conversion price per share could be less than net asset value per share at the time of exercise or conversion (including through the operation of anti-dilution protections). Because we would incur expenses in connection with any issuance of such securities, such issuance could result in a dilution of the net asset value per share at the time of exercise or conversion. This dilution would include reduction in net asset value per share as a result of the proportionately greater decrease in the stockholders’ interest in our earnings and assets and their voting interest than the increase in our assets resulting from such issuance.
Further, if our current stockholders do not purchase any shares to maintain their percentage interest, regardless of whether such offering is above or below the then current net asset value per share, their voting power will be diluted. For example, if we sell an additional 10% of our common shares at a 5% discount from net asset value, a stockholder who does not participate in that offering for its proportionate interest will suffer net asset value dilution of up to 0.5% or $5 per $1000$1,000 of net asset value.
Similarly, all distributions declared in cash payable to stockholders that are participants in our dividend reinvestment plan are generally automatically reinvested in shares of our common stock. As a result, stockholders that do not participate in the dividend reinvestment plan may experience dilution over time. Stockholders who do not elect to receive distributions in shares of common stock may experience accretion to the net asset value of their shares if our shares are trading at a premium and dilution if our shares are trading at a discount. The level of accretion or discount would depend on various factors, including the proportion of our stockholders who participate in the plan, the level of premium or discount at which our shares are trading and the amount of the distribution payable to a stockholder.
If we issue preferred stock, the net asset value and market value of our common stock may become more volatile.
We cannot assure you that the issuance of preferred stock would result in a higher yield or return to the holders of the common stock. The issuance of preferred stock would likely cause the net asset value and market
value of the common stock to become more volatile. If the distribution rate on the preferred stock were to approach the net rate of return on our investment portfolio, the benefit of leverage to the holders of the common stock would be reduced. If the distribution rate on the preferred stock were to exceed the net rate of return on our portfolio, the leverage would result in a lower rate of return to the holders of common stock than if we had not issued preferred stock. Any decline in the net asset value of our investments would be borne entirely by the holders of common stock. Therefore, if the market value of our portfolio were to decline, the leverage would result in a greater decrease in net asset value to the holders of common stock than if we were not leveraged through the issuance of preferred stock. This greater net asset value decrease would also tend to cause a greater decline in the market price for the common stock. We might be in danger of failing to maintain the required asset coverage of the preferred stock or of losing our ratings on the preferred stock or, in an extreme case, our current investment income might not be sufficient to meet the distribution requirements on the preferred stock. In order to counteract such an event, we might need to liquidate investments in order to fund a redemption of some or all of the preferred stock. In addition, we would pay (and the holders of common stock would bear) all costs and expenses relating to the issuance and ongoing maintenance of the preferred stock, including higher advisory fees if our total return exceeds the distribution rate on the preferred stock. Holders of preferred stock may have different interests than holders of common stock and may at times have disproportionate influence over our affairs.
Holders of any preferred stock we might issue would have the right to elect members of the board of directors and class voting rights on certain matters.
Holders of any preferred stock we might issue, voting separately as a single class, would have the right to elect two members of the board of directors at all times and in the event distributions become two full years in arrears would have the right to elect a majority of the directors until such arrearage is completely eliminated. In addition, preferred stockholders have class voting rights on certain matters, including changes in fundamental investment restrictions and conversion to open-end status, and accordingly can veto any such changes. Restrictions imposed on the declarations and payment of distributions to the holders of our common stock and preferred stock, both by the 1940 Act and by requirements imposed by rating agencies or the terms of our credit facilities, might impair our ability to maintain our qualification as a RIC for federal income tax purposes. While we would intend to redeem our preferred stock to the extent necessary to enable us to distribute our income as required to maintain our qualification as a RIC, there can be no assurance that such actions could be effected in time to meet the tax requirements.
To the extent we use debt or preferred stock to finance our investments, changes in interest rates will affect our cost of capital and net investment income.
To the extent we borrow money, or issue preferred stock, to make investments, our net investment income will depend, in part, upon the difference between the rate at which we borrow funds or pay distributions on
preferred stock and the rate at which we invest those funds. As a result, we can offer no assurance that a significant change in market interest rates will not have a material adverse effect on our net investment income in the event we use debt to finance our investments. In periods of rising interest rates, our cost of funds would increase, except to the extent we issue fixed rate debt or preferred stock, which could reduce our net investment income. We expect that our long-term fixed-rate investments will be financed primarily with equity and long-term debt. We may use interest rate risk management techniques in an effort to limit our exposure to interest rate fluctuations. Such techniques may include various interest rate hedging activities to the extent permitted by the 1940 Act.
You should also be aware that a rise in the general level of interest rates can be expected to lead to higher interest rates applicable to our debt investments. Accordingly, an increase in interest rates would make it easier for us to meet or exceed the incentive fee hurdle rate and may result in a substantial increase of the amount of incentive fees payable to our investment adviser with respect to our pre-incentive fee net investment income.
We may in the future determine to fund a portion of our investments with preferred stock, which would magnify the potential for loss and the risks of investing in us in a similar way as our borrowings.
Preferred stock, which is another form of leverage, has the same risks to our common stockholders as borrowings because the distributions on any preferred stock we issue must be cumulative. Payment of such distributions and repayment of the liquidation preference of such preferred stock must take preference over any distributions or other payments to our common stockholders, and preferred stockholders are not subject to any of our expenses or losses and are not entitled to participate in any income or appreciation in excess of their stated preference.
Risks Relating to Our Business and Structure
We are dependent upon Solar Capital Partners’ key personnel for our future success.
We depend on the diligence, skill and network of business contacts of Messrs. Gross and Spohler, who serve as the managing member and partnerpartners of Solar Capital Partners respectively, and who lead Solar Capital Partners’ investment team. Messrs. Gross and Spohler, together with the other dedicated investment professionals available to Solar Capital Partners, evaluate, negotiate, structure, close and monitor our investments. Our future success will depend on the diligence, skill, network of business contacts and continued service of Messrs. Gross and Spohler and the other investment professionals available to Solar Capital Partners. We cannot assure you that unforeseen business, medical, personal or other circumstances would not lead any such individual to terminate his relationship with us. The loss of Mr. Gross or Mr. Spohler, or any of the other senior investment professionals who serve on Solar Capital Partners’ investment team, could have a material adverse effect on our ability to achieve our investment objective as well as on our financial condition and results of operations. In addition, we can offer no assurance that Solar Capital Partners will remain our investment adviser.
The senior investment professionals of Solar Capital Partners are and may in the future become affiliated with entities engaged in business activities similar to those intended to be conducted by us, and may have conflicts of interest in allocating their time. We expect that Messrs. Gross and Spohler will dedicate a significant portion of their time to the activities of Solar Capital; however, they may be engaged in other business activities
which could divert their time and attention in the future. Specifically each of Messrs. Gross and Spohler serve as chief executive officer and chief operating officer, respectively, of Solar Senior Capital Ltd.
Our business model depends to a significant extent upon strong referral relationships with financial sponsors, and the inability of the senior investment professionals of our investment adviser to maintain or develop these relationships, or the failure of these relationships to generate investment opportunities, could adversely affect our business.
We expect that the principals of our investment adviser will maintain and develop their relationships with financial sponsors, and we will rely to a significant extent upon these relationships to provide us with potential
investment opportunities. If the senior investment professionals of our investment adviser fail to maintain their existing relationships or develop new relationships with other sponsors or sources of investment opportunities, we will not be able to grow our investment portfolio. In addition, individuals with whom the senior investment professionals of our investment adviser have relationships are not obligated to provide us with investment opportunities, and, therefore, there is no assurance that such relationships will generate investment opportunities for us. If our investment adviser is unable to source investment opportunities, we may hold a greater percentage of our assets in cash and cash equivalents than anticipated, which could impact potential returns on our portfolio.
A disruption in the capital markets and the credit markets could negatively affect our business.
As a BDC, we must maintain our ability to raise additional capital for investment purposes. Without sufficient access to the capital markets or credit markets, we may be forced to curtail our business operations or we may not be able to pursue new business opportunities. Disruptive conditions in the financial industry and the impact of new legislation in response to those conditions could restrict our business operations and could adversely impact our results of operations and financial condition.
If the fair value of our assets declines substantially, we may fail to maintain the asset coverage ratios imposed upon us by the 1940 Act and our senior secured credit facility (the “Credit Facility”). Any such failure could result in an event of default and all of our debt being declared immediately due and payable and would affect our ability to issue senior securities, including borrowings, and pay distributions, which could materially impair our business operations. Our liquidity could be impaired further by an inability to access the capital markets or to draw on our credit facilities.the Credit Facility. For example, we cannot be certain that we will be able to renew our credit facilitiesthe Credit Facility as they matureit matures or to consummate new borrowing facilities to provide capital for normal operations, including new originations. Reflecting concern about the stability of the financial markets, many lenders and institutional investors have reduced or ceased providing funding to borrowers. This market turmoil and tightening of credit have led to increased market volatility and widespread reduction of business activity generally.
If we are unable to renew or replace such facilitiesthe Credit Facility and consummate new facilities on commercially reasonable terms, our liquidity will be reduced significantly. If we consummate new facilities but are then unable to repay amounts outstanding under such facilities, and are declared in default or are unable to renew or refinance these facilities, we would not be able to initiate significant originations or to operate our business in the normal course. These situations may arise due to circumstances that we may be unable to control, such as inaccessibility to the credit markets, a severe decline in the value of the U.S. dollar, a further economic downturn or an operational problem that affects third parties or us, and could materially damage our business. Moreover, we are unable to predict when economic and market conditions may become more favorable. Even if such conditions improve broadly and significantly over the long term, adverse conditions in particular sectors of the financial markets could adversely impact our business.
Our financial condition and results of operations will depend on ourSolar Capital Partners’ ability to manage our future growth effectively.effectively by identifying, investing in and monitoring companies that meet our investment criteria.
Our ability to achieve our investment objective and to grow depends on Solar Capital Partners’ ability to identify, invest in and monitor companies that meet our investment criteria.
Accomplishing this result on a cost-effective basis is largely a function of Solar Capital Partners’ structuring of the investment process, its ability to provide competent, attentive and efficient services to us and its ability to access financing for us on acceptable terms. The investment team of Solar Capital Partners has substantial responsibilities under the Investment Advisory and Management Agreement, and they may also be called upon to provide managerial assistance to our portfolio companies as the principals of our administrator. Such demands on their time may distract them or slow our rate of investment. In order to grow, we and Solar Capital Partners will need to retain, train, supervise and manage new investment professionals. However, we can offer no assurance that any such investment professionals will contribute
effectively to the work of the investment adviser. Any failure to manage our future growth effectively could have a material adverse effect on our business, financial condition and results of operations.
We may need to raise additional capital to grow because we must distribute most of our income.
We may need additional capital to fund growth in our investments. We expect to issue equity securities and expect to borrow from financial institutions in the future. A reduction in the availability of new capital could limit our ability to grow. We must distribute at least 90% of our investment company taxable income to our stockholders to maintain our regulated investment company status.tax treatment as a RIC. As a result, any such cash earnings may not be available to fund investment originations. We expect to borrow from financial institutions and issue additional debt and equity securities. If we fail to obtain funds from such sources or from other sources to fund our investments, it could limit our ability to grow, which may have an adverse effect on the value of our securities. In addition, as a BDC, our ability to borrow or issue additional preferred stock may be restricted if our total assets are less than 200% of our total borrowings and preferred stock.
Any failure on our part to maintain our status as a BDC would reduce our operating flexibility and we may be limited in our investment choices as a BDC.
The 1940 Act imposes numerous constraints on the operations of BDCs. For example, BDCs are required to invest at least 70% of their total assets in specified types of securities, primarily in private companies or thinly-traded U.S. public companies, cash, cash equivalents, U.S. government securities and other high quality debt investments that mature in one year or less. Furthermore, any failure to comply with the requirements imposed on BDCs by the 1940 Act could cause the SEC to bring an enforcement action against us and/or expose us to claims of private litigants. In addition, upon approval of a majority of our stockholders, we may elect to withdraw our status as a BDC. If we decide to withdraw our election, or if we otherwise fail to qualify, or maintain our qualification, as a BDC, we may be subject to the substantially greater regulation under the 1940 Act as a closed-end investment company. Compliance with such regulations would significantly decrease our operating flexibility, and could significantly increasehave a material adverse effect on our costsbusiness, financial condition and results of doing business.operations.
Regulations governing our operation as a BDC affect our ability to raise, and the way in which we raise additional capital. As a BDC, the necessity of raising additional capital may expose us to risks, including the typical risks associated with leverage.
In order to satisfy the tax requirements applicable to a RIC, to avoid payment of excise taxes and to minimize or avoid payment of income taxes, we intend to distribute to our stockholders substantially all of our ordinary income and realized net capital gains except for certain realized net long-term capital gains, which we may retain, pay applicable income taxes with respect thereto and elect to treat as deemed distributions to our stockholders. We may issue debt securities or preferred stock and/or borrow money from banks or other financial institutions, which we refer to collectively as “senior securities,” up to the maximum amount permitted by the 1940 Act. Under the provisions of the 1940 Act, we will be permitted, as a BDC, to issue senior securities in amounts such that our asset coverage ratio, as defined in the 1940 Act, equals at least 200% of gross assets less all liabilities and indebtedness not represented by senior securities, after each issuance of senior securities. If the value of our assets declines, we may be unable to satisfy this test. If that happens, we may be required to sell a portion of our investments and, depending on the nature of our leverage, repay a portion of our indebtedness at a
time when such sales may be disadvantageous. Also, any amounts that we use to service our indebtedness would not be available for distributions to our common stockholders. Furthermore, as a result of issuing senior securities, we would also be exposed to typical risks associated with leverage, including an increased risk of loss.
As of December 31, 2014,2016, we had $50$165.2 million outstanding under the Credit Facility, composed of $0$115.2 million of revolving credit and $50 million outstanding of term loans. We also had $75 million outstanding of senior secured notes (the “Senior Secured Notes”) and, $100 million outstanding of 6.75% unsecured senior notes
due 2042 (the “Unsecured“2042 Unsecured Notes”), and $50 million outstanding of 4.4% unsecured senior notes due 2022 (the “2022 Unsecured Notes”). If we issue preferred stock, the preferred stock would rank “senior” to common stock in our capital structure, preferred stockholders would generally vote together with common stockholders but would have separate voting rights on certain matters and might have other rights, preferences, or privileges more favorable than those of our common stockholders, and the issuance of preferred stock could have the effect of delaying, deferring or preventing a transaction or a change of control that might involve a premium price for holders of our common stock or otherwise be in your best interest.
We are not generally able to issue and sell our common stock at a price below net asset value per share. We may, however, sell our common stock, or warrants, options or rights to acquire our common stock, at a price below the then-current net asset value per share of our common stock if our board of directors determines that such sale is in the best interests of Solar Capital and its stockholders, and our stockholders approve such sale. In any such case, the price at which our securities are to be issued and sold may not be less than a price that, in the determination of our board of directors, closely approximates the market value of such securities (less any distributing commission or discount). If we raise additional funds by issuing more common stock or senior securities convertible into, or exchangeable for, our common stock, then the percentage ownership of our stockholders at that time will decrease, and you might experience dilution. This dilution would occur as a result of a proportionately greater decrease in a stockholder’s interest in our earnings and assets and voting interest in us than the increase in our assets resulting from such issuance. Because the number of future shares of common stock that may be issued below our net asset value per share and the price and timing of such issuances are not currently known, we cannot predict the actual dilutive effect of any such issuance. We cannot determine the resulting reduction in our net asset value per share of any such issuance. We also cannot predict whether shares of our common stock will trade above, at or below our net asset value.
At our 20142016 Annual Stockholders Meeting, our stockholders approved our ability to sell or otherwise issue shares of our common stock, not exceeding 25% of our then outstanding common stock immediately prior to each such offering, at a price or prices below the then current net asset value per share, in each case subject to the approval of our board of directors and compliance with the conditions set forth in the proxy statement pertaining thereto, during a period beginning on May 6, 2014June 7, 2016 and expiring on the earlier of the one-year anniversary of the date of the 20142016 Annual Stockholders Meeting and the date of our 20152017 Annual Stockholders Meeting, which is expected to be held in June 2015.May 2017. However, notwithstanding such stockholder approval, since our initial public offering on February 9, 2010, we have not sold any shares of our common stock at a price below our then current net asset value per share. Any offering of our common stock that requires stockholder approval must occur, if at all, within one year after receiving such stockholder approval.
The trading market or market value of our publicly issued debt securities may fluctuate.
Our publicly issued debt securities, including the Unsecured Notes, may or may not have an established trading market. We cannot assure you that a trading market for our publicly issued debt securities will be maintained. In addition to our creditworthiness, many factors may materially adversely affect the trading market for, and market value of, our publicly issued debt securities. These factors include, but are not limited to, the following:
the time remaining to the maturity of these debt securities;
the outstanding principal amount of debt securities with terms identical to these debt securities;
the ratings assigned by national statistical ratings agencies;
the general economic environment;
the supply of debt securities trading in the secondary market, if any;
the redemption or repayment features, if any, of these debt securities;
the level, direction and volatility of market interest rates generally; and
market rates of interest higher or lower than rates borne by the debt securities. You should also be aware that there may be a limited number of buyers when you decide to sell your debt securities. This too may materially adversely affect the market value of the debt securities or the trading market for the debt securities.securities
Our credit ratings may not reflect all risks of an investment in our debt securities.
Our credit ratings are an assessment by third parties of our ability to pay our obligations. Consequently, real or anticipated changes in our credit ratings will generally affect the market value of our debt securities. Our credit ratings, however, may not reflect the potential impact of risks related to market conditions generally or other factors discussed above on the market value of or trading market for the publicly issued debt securities.
Our stockholders willmay experience dilution in their ownership percentage if they opt out of our dividend reinvestment plan.
All distributions declared in cash payable to stockholders that are participants in our dividend reinvestment plan are automatically reinvested in shares of our common stock. As a result, our stockholders that opt out ofIn the event we issue new shares in connection with our dividend reinvestment plan, willour stockholders that do not elect to receive distributions in shares of common stock may experience dilution in their ownership percentage over time as a result of our common stock over time.such issuance.
We mayhave and will continue to borrow money, which would magnify the potential for loss on amounts invested and may increase the risk of investing in us.
The useWe borrow money as part of our business plan. Borrowings, also known as leverage, magnifiesmagnify the potential for loss on amounts invested and, therefore, increasesincrease the risks associated with investing in our securities. As of December 31, 2014,2016, we had $50$165.2 million outstanding on the Credit Facility, composed of $0$115.2 million of revolving credit and $50 million of term loans. We also had $75 million outstanding of the Senior Secured Notes, and $100 million outstanding of the 2042 Unsecured Notes, and $50 million outstanding of the 2022 Unsecured Notes. We may borrow from and issue senior debt securities to banks, insurance companies and other lenders in the future. Lenders of these senior securities, including the Credit Facility and Notes, will have fixed dollar claims on our assets that are superior to the claims of our common stockholders, and we would expect such lenders to seek recovery against our assets in the event of a default. If the value of our assets decreases, leveraging would cause net asset value to decline more sharply than it otherwise would have had we not leveraged. Similarly, any decrease in our income would cause net income to decline more sharply than it would have had we not borrowed. Such a decline could also negatively affect our ability to make distribution payments on our common stock. Leverage is generally considered a speculative investment technique. Our ability to service any debt that we incur will depend largely on our financial performance and will be subject to prevailing economic conditions and competitive pressures. Moreover, as the management fee payable to our investment adviser, Solar Capital Partners, will be payable based on our gross assets, including those assets acquired through the use of leverage, Solar Capital Partners will have a financial incentive to incur leverage which may not be consistent with our stockholders’ interests. In addition, our common stockholders will bear the burden of any increase in our expenses as a result of leverage, including any increase in the management fee payable to Solar Capital Partners.
As a BDC, we generally are required to meet a coverage ratio of total assets to total borrowings and other senior securities, which include all of our borrowings and any preferred stock that we may issue in the future, of at least 200%. Additionally, the Credit Facility requires us to comply with certain financial and other restrictionrestrictive covenants including maintaining an asset coverage ratio of not less than 200% at any time. Failure to maintain
compliance with these covenants could result in an event of default and all of our debt being declared immediately due and payable. If this ratio declines below 200%, we may not be able to incur additional debt and could be required by law to sell a portion of our investments to repay some debt when it is disadvantageous to do so, which could have a material adverse effect on our operations, and we may not be able to make distributions.
The amount of leverage that we employ will depend on our investment adviser’s and our board of directors’ assessment of market and other factors at the time of any proposed borrowing. We cannot assure you that we will be able to obtain credit at all or on terms acceptable to us.
In addition, the Credit Facility imposes, and any other debt facility into which we may enter would likely impose, financial and operating covenants that restrict our business activities, including limitations that could hinder our ability to finance additional loans and investments or to make the distributions required to maintain our status as a RIC under Subchapter M of the Code.
Illustration.Illustration. The following table illustrates the effect of leverage on returns from an investment in our common stock assuming various annual returns on the portfolio, net of interest expense. The calculations in the table below are hypothetical and actual returns may be higher or lower than those appearing in the table below.
| Assumed total return (net of interest expense) | ||||||||||||||||||||
| (10)% | (5)% | 0% | 5% | 10% | ||||||||||||||||
Corresponding return to stockholder(1) | (19.3)% | (10.3)% | (1.3)% | 7.7% | 16.7% | |||||||||||||||
| Assumed total return (net of interest expense) | ||||||||||||||||||||
| (10)% | (5)% | 0% | 5% | 10% | ||||||||||||||||
Corresponding return to stockholder(1) | (19.7)% | (10.7)% | (1.7)% | 7.2% | 16.2% | |||||||||||||||
| (1) | Assumes |
In order for us to cover our annual interest payments on our outstanding indebtedness at December 31, 2016, we must achieve annual returns on our December 31, 2016 total assets of at least 1.0%.
It is likely that the terms of any current or future long-term or revolving credit or warehouse facility we may enter into in the future could constrain our ability to grow our business.
Under our borrowings and the Credit Facility,Our current lenders have, and any future lender or lenders may have, fixed dollar claims on our assets that are senior to the claims of our stockholders and, thus, will have a preference over our stockholders with respect to our assets in the collateral pool. Our current Credit Facility and borrowings also subject us to various financial and operating covenants, including, but not limited to, maintaining certain financial ratios and minimum tangible net worth amounts. Future credit facilities and borrowings will likely subject us to similar or additional covenants. In addition, we may grant a securitiessecurity interest in our assets in connection with any such credit facilities and borrowings.
The Credit Facility generally contains customary default provisions such as a minimum net worth amount, a profitability test, and a restriction on changing our business and loan quality standards. In addition, the Credit Facility requires or is expected to require the repayment of all outstanding debt on the maturity which may disrupt our business and potentially the business of our portfolio companies that are financed through the Credit Facility. An event of default under the Credit Facility would likely result, among other things, in termination of the availability of further funds under the Credit Facility and accelerated maturity dates for all amounts outstanding under the facilities,Credit Facility, which would likely disrupt our business and, potentially, the business of the portfolio companies whose loans we finance through the facilities.Credit Facility. This could reduce our revenues and, by delaying any cash payment allowed to us under our facilitiesCredit Facility until the lender has been paid in full, reduce our liquidity and cash flow and impair our ability to grow our business and maintain our status as a RIC.
The terms of future available financing may place limits on our financial and operation flexibility. If we are unable to obtain sufficient capital in the future, we may be forced to reduce or discontinue our operations, not be able to make new investments, or otherwise respond to changing business conditions or competitive pressures.
To the extent we use debt or preferred stock to finance our investments, changes in interest rates will affect our cost of capital and net investment income.
To the extent we borrow money, or issue preferred stock, to make investments, our net investment income will depend, in part, upon the difference between the rate at which we borrow funds or pay distributions on preferred stock and the rate at which we invest those funds. As a result, we can offer no assurance that a significant change in market interest rates will not have a material adverse effect on our net investment income in the event we use debt to finance our investments. In periods of rising interest rates, our cost of funds would increase, except to the extent we issue fixed rate debt or preferred stock, which could reduce our net investment income. We expect that our long-term fixed-rate investments will be financed primarily with equity and long-term debt. We may use interest rate risk management techniques in an effort to limit our exposure to interest rate fluctuations. Such techniques may include various interest rate hedging activities to the extent permitted by the 1940 Act.
You should also be aware that a rise in the general level of interest rates can be expected to lead to higher interest rates applicable to our debt investments. Accordingly, an increase in interest rates would make it easier for us to meet or exceed the incentive fee hurdle rate and may result in a substantial increase of the amount of incentive fees payable to our investment adviser with respect to our pre-incentive fee net investment income.
We may in the future determine to fund a portion of our investments with preferred stock, which would magnify the potential for loss and the risks of investing in us in a similar way as our borrowings.
Preferred stock, which is another form of leverage, has the same risks to our common stockholders as borrowings because the distributions on any preferred stock we issue must be cumulative. Payment of such distributions and repayment of the liquidation preference of such preferred stock must take preference over any distributions or other payments to our common stockholders, and preferred stockholders are not subject to any of our expenses or losses and are not entitled to participate in any income or appreciation in excess of their stated preference.
Pending legislation may allow us to incur additional leverage.
As a business development company,BDC, under the 1940 Act generally we are not permitted to incur indebtedness unless immediately after such borrowing we have an asset coverage for total borrowings of at least 200% (i.e., the amount of debt
may not exceed 50% of the value of our total assets or we may borrow an amount equal to 100% of net assets). Recent legislationLegislation introduced in Congress,the U.S. House of Representatives, if passed, would modify this section of the 1940 Act and increase the amount of debt that business development companiesBDCs may incur by modifying the asset coverage percentage from 200% to 150%. As a result, we may be able to incur additional indebtedness in the future and therefore your risk of an investment in us may increase.
Our quarterly and annual operating results are subject to fluctuation as a result of the nature of our business, and if we fail to achieve our investment objective, the net asset value of our common stock may decline.
We could experience fluctuations in our quarterly and annual operating results due to a number of factors, some of which are beyond our control, including, but not limited to, the interest rate payable on the debt securities that we acquire, the default rate on such securities, the level of our expenses, variations in and the timing of the recognition of realized and unrealized gains or losses, changes in our portfolio composition, the degree to which we encounter competition in our markets, market volatility in our publicly traded securities and the securities of our portfolio companies, and general economic conditions. As a result of these factors, results for any period should not be relied upon as being indicative of performance in future periods. In addition, any of these factors could negatively impact our ability to achieve our investment objectives, which may cause our net asset value of our common stock to decline.
Our investments may be in portfolio companies which may have limited operating histories and financial resources.
We expect that our portfolio will continue to consist of investments that may have relatively limited operating histories. These companies may be particularly vulnerable to U.S. and foreign economic downturns such as the current recession and European financial crisis may have more limited access to capital and higher funding costs, may have a weaker financial position and may need more capital to expand or compete. These businesses also may experience substantial variations in operating results. They may face intense competition, including from companies with greater financial, technical and marketing resources. Furthermore, some of these companies do business in regulated industries and could be affected by changes in government regulation. Accordingly, these factors could impair their cash flow or result in other events, such as bankruptcy, which could limit their ability to repay their obligations to us, and may adversely affect the return on, or the recovery of, our investment in these companies. We cannot assure you that any of our investments in our portfolio companies will be successful. Our portfolio companies compete with larger, more established companies with greater access to, and resources for, further development in these new technologies. WeTherefore, we may lose our entire investment in any or all of our portfolio companies.
There will be uncertainty as to the value of our portfolio investments.investments, which may impact our net asset value.
A large percentage of our portfolio investments are in the form of securities that are not publicly traded. The fair value of securities and other investments that are not publicly traded may not be readily determinable. We value these securities on a quarterly basis in accordance with our valuation policy, which is at all times consistent with GAAP.U.S. generally accepted accounting principles (“GAAP”). Our board of directors utilizes the services of third-party valuation firms to aid it in determining the fair value of thesecertain securities. The board of directors discusses valuations and determines the fair value in good faith based on the input of our investment adviser and the respective third-party valuation firms. The factors that may be considered in fair value pricing our investments include the nature and realizable value of any collateral, the portfolio company’s ability to make payments and its earnings, the markets in which the portfolio company does business, comparisons to publicly traded companies, discounted cash flow and other relevant factors. Because such valuations, and particularly valuations of private securities and private companies, are inherently uncertain, may fluctuate over short periods of time and may be based on estimates, our determinations of fair value may differ materially from the values that would have been used if a ready market for these securities existed. Our net asset value could be adversely affected if our determinations regarding the fair value of our investments were materially higher than the values that we ultimately realize upon the disposal of such securities.
Our equity ownership in a portfolio company may represent a control investment. Our ability to exit an investment in a timely manner because we are in a control position or have access to inside information in the portfolio company could result in a realized loss on the investment.
If we obtain a control investment in a portfolio company our ability to divest ourselves from a debt or equity investment could be restricted due to illiquidity in a private stock, limited trading volume on a public company’s stock, inside information on a company’s performance, insider blackout periods, or other factors that could prohibit us from disposing of the investment as we would if it were not a control investment. Additionally, we may choose not to take certain actions to protect a debt investment in a control investment portfolio company. As a result, we could experience a decrease in the value of our portfolio company holdings and potentially incur a realized loss on the investment.
There are significant potential conflicts of interest, including Solar Capital Partners’ management of Solar Senior Capital Ltd., which could impact our investment returns.returns, and an investment in Solar Capital is not an investment in Solar Senior Capital Ltd.
Our executive officers and directors, as well as the current and future partners of our investment adviser, Solar Capital Partners, may serve as officers, directors or principals of entities that operate in the same or a related line of business as we do. For example, Solar Capital Partners presently serves as investment adviser to
Solar Senior Capital Ltd., a publicly-traded BDC which focuses on investing primarily in senior secured loans, including first lien, unitranche and second lien debt instruments. In addition, Michael S. Gross, our chairmanChairman, Chief Executive Officer and chief executive officer,President, Bruce Spohler, our chief operating officer,Chief Operating Officer and board member, and Richard Peteka, our chief financial officer,Chief Financial Officer, serve in similar capacities for Solar Senior.Senior Capital Ltd. Accordingly, they may have obligations to investors in those entities, the fulfillment of which obligations might not be in the best interests of us or our stockholders. In addition, we note that any affiliated investment vehicle formed in the future and managed by our investment adviser or its affiliates may, notwithstanding different stated investment objectives, have overlapping investment objectives with our own and, accordingly, may invest in asset classes similar to those targeted by us. As a result, Solar Capital Partners may face conflicts in allocating investment opportunities between us and such other entities. Although Solar Capital Partners will endeavor to allocate investment opportunities in a fair and equitable manner, it is possible that, in the future, we may not be given the opportunity to participate in investments made by investment funds managed by our investment adviser or an investment manager affiliated with our investment adviser. In any such case, when Solar Capital Partners identifies an investment, it will be forced to choose which investment fund should make the investment.
We mayAs a BDC, we were substantially limited in our ability to co-invest on a concurrent basisin privately negotiated transactions with Solar Senior, and any other affiliates that our investment adviser has or forms in the future, subject to compliance with applicable regulations, anyaffiliated funds until we obtained an exemptive order received and our allocation procedures. In certain circumstances, negotiated co-investments may be made only if we receive an order from the SEC permittingon July 28, 2014 (the “Exemptive Order”). The Exemptive Order permits us to do so. There can be no assurance that anyparticipate in negotiated co-investment transactions with certain affiliates, each of whose investment adviser is Solar Capital Partners, or an investment adviser controlling, controlled by or under common control with Solar Capital Partners, in a manner consistent with our investment objective, positions, policies, strategies and restrictions as well as regulatory requirements and other pertinent factors, and pursuant to the conditions to the Exemptive Order. If we are unable to rely on the Exemptive Order for a particular opportunity, such orderopportunity will be obtained.allocated first to the entity whose investment strategy is the most consistent with the opportunity being allocated, and second, if the terms of the opportunity are consistent with more than one entity’s investment strategy, on an alternating basis. On January 13, 2017, the Company, Solar Senior Capital Ltd., and Solar Capital Partners filed an exemptive application for a co-investment order that would supersede the Exemptive Order and extend the relief granted in the Exemptive Order such that it no longer applies to certain affiliates only if their respective investment adviser is Solar Capital Partners, but also applies to certain affiliates whose investment adviser is an investment adviser that controls, is controlled by or is under common control with Solar Capital Partners and is registered as an investment adviser under the Investment Advisers Act of 1940, as amended. The Exemptive Order will remain in effect unless and until the revised application is approved by the SEC. The terms and conditions of the revised application are substantially similar to the Exemptive Order. Although our investment professionals will endeavor to allocate investment
opportunities in a fair and equitable manner, we and our common stockholders could be adversely affected to the extent investment opportunities are allocated among us and other investment vehicles managed or sponsored by, or affiliated with, our executive officers, directors and members of our investment adviser.
Solar Capital Partners and certain investment advisory affiliates may determine that an investment is appropriate for us and for one or more of those other funds. In such event, depending on the availability of such investment and other appropriate factors, Solar Capital Partners or its affiliates may determine that we should invest side-by-side with one or more other funds. Any such investments will be made only to the extent permitted by applicable law and interpretive positions of the SEC and its staff, and consistent with Solar Capital Partners’ allocation procedures. Related party transactions may occur between Solar Capital and Crystal Financial LLC, between Solar Capital and Senior Secured Unitranche Loan Program LLC, between Solar Capital and SSLP 2016-1, LLC, between Solar Capital and Senior Secured Unitranche Loan Program II LLC and between Solar Capital and SSLP II 2016-1, LLC. No administrative fees are paid to Solar Capital Partners by Crystal Financial LLC, Senior Secured Unitranche Loan Program LLC or Senior Secured Unitranche Loan Program II LLC.
In the ordinary course of our investing activities, we pay management and incentive fees to Solar Capital Partners and reimburse Solar Capital Partners for certain expenses it incurs. As a result, investors in our common stock will invest on a “gross” basis and receive distributions on a “net” basis after expenses, resulting in a lower rate of return than an investor might achieve through direct investments. Accordingly, there may be times when the management team of Solar Capital Partners has interests that differ from those of our stockholders, giving rise to a conflict.
We have entered into a royalty-free license agreement with our investment adviser, pursuant to which our investment adviser has granted us a non-exclusive license to use the name “Solar Capital.” Under the license agreement, we have the right to use the “Solar Capital” name for so long as Solar Capital Partners or one of its affiliates remains our investment adviser. In addition, we pay Solar Capital Management, an affiliate of Solar Capital Partners, our allocable portion of overhead and other expenses incurred by Solar Capital Management in performing its obligations under the Administration Agreement, including rent, the fees and expenses associated with performing compliance functions, and our allocable portion of the compensation of our chief financial officer and any administrative support staff. These arrangements create conflicts of interest that our board of directors must monitor.
Our ability to enter into transactions involving derivatives and financial commitment transactions may be limited.
The SEC has proposed a new rule under the 1940 Act that would govern the use of derivatives (defined to include any swap, security-based swap, futures contract, forward contract, option or any similar instrument) as well as financial commitment transactions (defined to include reverse repurchase agreements, short sale borrowings and any firm or standby commitment agreement or similar agreement) by BDCs. Under the proposed rule, a BDC would be required to comply with one of two alternative portfolio limitations and manage the risks associated with derivatives transactions and financial commitment transactions by segregating certain assets. Furthermore, a BDC that engages in more than a limited amount of derivatives transactions or that uses complex derivatives would be required to establish a formalized derivatives risk management program. If the SEC adopts this rule in the form proposed, our ability to enter into transactions involving such instruments may be hindered, which could have an adverse effect on our business, financial condition and results of operations.
We may be obligated to pay our investment adviser incentive compensation even if we incur a loss.
Our investment adviser will be entitled to incentive compensation for each fiscal quarter in an amount equal to a percentage of the excess of our pre-incentive fee net investment income for that quarter (before deducting
incentive compensation) above a performance threshold for that quarter. Accordingly, since the performance threshold is based on a percentage of our net asset value, decreases in our net asset value make it easier to achieve the performance threshold. Our pre-incentive fee net investment income for incentive compensation purposes excludes realized and unrealized capital losses or depreciation that we may incur in the fiscal quarter, even if such capital losses or depreciation result in a net loss on our statement of operations for that quarter. Thus, we may be required to pay Solar Capital Partners incentive compensation for a fiscal quarter even if there is a decline in the value of our portfolio or we incur a net loss for that quarter.
Our incentive fee may induce Solar Capital Partners to pursue speculative investments.
The incentive fee payable by us to Solar Capital Partners may create an incentive for Solar Capital Partners to pursue investments on our behalf that are riskier or more speculative than would be the case in the absence of such compensation arrangement. The incentive fee payable to our investment adviser is calculated based on a percentage of our return on invested capital. This may encourage our investment adviser to use leverage to increase the return on our investments. Under certain circumstances, the use of leverage may increase the likelihood of default, which would impair the value of our common stock. In addition, our investment adviser receives the incentive fee based, in part, upon net capital gains realized on our investments. Unlike that portion of the incentive fee based on income, there is no hurdle rate applicable to the portion of the incentive fee based on net capital gains. As a result, our investment adviser may have a tendency to invest more capital in investments that are likely to result in capital gains as compared to income producing securities. Such a practice could result in our investing in more speculative securities than would otherwise be the case, which could result in higher investment losses, particularly during economic downturns.
The incentive fee payable by us to our investment adviser also may induce Solar Capital Partners to invest on our behalf in instruments that have a deferred interest feature, even if such deferred payments would not provide cash necessary to enable us to pay current distributions to our shareholders.stockholders. Under these investments, we would accrue interest over the life of the investment but would not receive the cash income from the investment until the end of the term. Our net investment income used to calculate the income portion of our investment fee, however, includes accrued interest. Thus, a portion of this incentive fee would be based on income that we have not yet received in cash. In addition, the “catch-up” portion of the incentive fee may encourage Solar Capital Partners to accelerate or defer interest payable by portfolio companies from one calendar quarter to another, potentially resulting in fluctuations in timing and distribution amounts.
We may invest, to the extent permitted by law, in the securities and instruments of other investment companies, including private funds, and, to the extent we so invest, will bear our ratable share of any such investment company’s expenses, including management and performance fees. We will also remain obligated to pay management and incentive fees to Solar Capital Partners with respect to the assets invested in the securities and instruments of other investment companies. With respect to each of these investments, each of our stockholders will bear his or her share of the management and incentive fee of Solar Capital Partners as well as indirectly bearing the management and performance fees and other expenses of any investment companies in which we invest.
We may become subject to corporate-level U.S. federal income tax if we are unable to qualify and maintain our qualification as a regulated investment company under Subchapter M of the Code.
Although we have elected to be treated as a RIC under Subchapter M of the Code, no assurance can be given that we will continue to be able to qualify for and maintain RIC status. To maintain RIC tax treatment under the Code, we must meet the following annual distribution, income source and asset diversification requirements.
The annual distribution requirement for a RIC will be satisfied if we distribute to our stockholders on an annual basis at least 90% of our net ordinary income and realized net short-term capital gains in excess of realized net long-term capital losses, if any. Because we may use debt financing, we are subject to certain asset coverage ratio requirements under the 1940 Act and financial covenants under loan and credit agreements that could, under certain circumstances, restrict us from making distributions necessary to satisfy the distribution requirement. If we are unable to obtain cash from other sources, we could fail to qualify for RIC tax treatment and thus become subject to corporate-level U.S federal income tax.
excess of realized net long-term capital losses, if any. Because we may use debt financing, we are subject to certain asset coverage ratio requirements under the 1940 Act and financial covenants under loan and credit agreements that could, under certain circumstances, restrict us from making distributions necessary to satisfy the distribution requirement. If we are unable to obtain cash from other sources, we could fail to qualify for RIC tax treatment and thus become subject to corporate-level U.S. federal income tax. |
The income source requirement will be satisfied if we obtain at least 90% of our income for each year from distributions,certain passive investments, including interest, dividends, gains from the sale of stock or securities or similar sources.
The asset diversification requirement will be satisfied if we meet certain asset diversification requirements at the end of each quarter of our taxable year. Failure to meet those requirements may result in our having to dispose of certain investments quickly in order to prevent the loss of RIC status. Because most of our investments will be in private companies, and therefore will be relatively illiquid, any such dispositions could be made at disadvantageous prices and could result in substantial losses.
|
If we fail to qualify for RIC tax treatment for any reason and become subject to corporate income tax, the resulting corporate taxes could substantially reduce our net assets, the amount of income available for distribution and the amount of our distributions. Such a failure would have a material adverse effect on us, the net asset value of our common stock and the total return, if any, obtainable from your investment in our common stock. Any net operating losses that we incur in periods during which we qualify as a RIC will not offset net capital gains (i.e., net realized long-term capital gains in excess of net realized short-term capital losses) that we are otherwise required to distribute, and we cannot pass such net operating losses through to our stockholders. In addition, net operating losses that we carry over to a taxable year in which we qualify as a RIC normally cannot offset ordinary income or capital gains.
We may have difficulty satisfying the annual distribution requirement in order to qualify and maintain RIC status if we recognize income before or without receiving cash representing such income.
In accordance with generally accepted accounting principlesGAAP and tax requirements, we include in income certain amounts that we have not yet received in cash, such as contractual PIK interest, which represents contractual interest added to a loan balance and due at the end of such loan’s term. In addition to the cash yields received on our loans, in some instances, certain loans may also include any of the following: end-of-term payments, exit fees, balloon payment fees or prepayment fees. The increases in loan balances as a result of contractual PIK arrangements are included in income for the period in which such PIK interest was accrued, which is often in advance of receiving cash payment, and are separately identified on our statements of cash flows. We also may be required to include in income certain other amounts prior to receiving the related cash.
Any warrants that we receive in connection with our debt investments will generally be valued as part of the negotiation process with the particular portfolio company. As a result, a portion of the aggregate purchase price for the debt investments and warrants will be allocated to the warrants that we receive. This will generally result in “original issue discount” for tax purposes, which we must recognize as ordinary income, increasing the amount that we are required to distribute to qualify for the U.S. federal income tax benefits applicable to RICs. Because these warrants generally will not produce distributable cash for us at the same time as we are required to make distributions in respect of the related original issue discount, we would need to obtain cash from other sources or to pay a portion of our distributions using shares of newly issued common stock, consistent with Internal Revenue Service requirements, to satisfy such distribution requirements.
Other features of the debt instruments that we hold may also cause such instruments to generate an original issue discount, resulting in a distribution requirement in excess of current cash interest received. Since in certain cases we may recognize income before or without receiving cash representing such income, we may have difficulty meeting the RIC tax requirement to distribute at least 90% of our net ordinary income and realized net
short-term capital gains in excess of realized net long-term capital losses, if any. Under such circumstances, we may have to sell some of our investments at times we would not consider advantageous, raise additional debt or equity capital or reduce new investment originations to meet these distribution requirements. If we are unable to obtain cash from other sources and are otherwise unable to satisfy such distribution requirements, we may fail to qualify for the U.S. federal income tax benefits allowable to RICs and, thus, become subject to a corporate-level U.S. federal income tax on all our income.
The higher yields and interest rates on PIK securities reflects the payment deferral and increased credit risk associated with such instruments and that such investments may represent a significantly higher credit risk than coupon loans. PIK securities may have unreliable valuations because their continuing accruals require continuing judgments about the collectability of the deferred payments and the value of any associated collateral. PIK
interest has the effect of generating investment income and increasing the incentive fees payable at a compounding rate. In addition, the deferral of PIK interest also increases the loan-to-value ratio at a compounding rate. PIK securities create the risk that incentive fees will be paid to the Adviser based on non-cash accruals that ultimately may not be realized, but the Adviser will be under no obligation to reimburse the Company for these fees.
Our board of directors is authorized to reclassify any unissued shares of common stock into one or more classes of preferred stock, which could convey special rights and privileges to its owners.
Under Maryland General Corporation Law and our charter, our board of directors is authorized to classify and reclassify any authorized but unissued shares of stock into one or more classes of stock, including preferred stock. Prior to issuance of shares of each class or series, the board of directors is required by Maryland law and our charter to set the preferences, conversion or other rights, voting powers, restrictions, limitations as to other distributions, qualifications and terms or conditions of redemption for each class or series. Thus, the board of directors could authorize the issuance of shares of preferred stock with terms and conditions which could have the effect of delaying, deferring or preventing a transaction or a change in control that might involve a premium price for holders of our common stock or otherwise be in their best interest. The cost of any such reclassification would be borne by our existing common stockholders. Certain matters under the 1940 Act require the separate vote of the holders of any issued and outstanding preferred stock. For example, holders of preferred stock would vote separately from the holders of common stock on a proposal to cease operations as a BDC. In addition, the 1940 Act provides that holders of preferred stock are entitled to vote separately from holders of common stock to elect two preferred stock directors. The issuance of shares of preferred stock convertible into shares of common stock might also reduce the net income and net asset value per share of our common stock upon conversion, provided, that we will only be permitted to issue such convertible preferred stock to the extent we comply with the requirements of Section 61 of the 1940 Act, including obtaining common stockholder approval. These effects, among others, could have an adverse effect on your investment in our common stock.
Provisions of the Maryland General Corporation Law and of our charter and bylaws could deter takeover attempts and have an adverse impact on the price of our common stock.
The Maryland General Corporation Law and our charter and bylaws contain provisions that may discourage, delay or make more difficult a change in control of Solar Capital or the removal of our directors. We are subject to the Maryland Business Combination Act, subject to any applicable requirements of the 1940 Act. Our board of directors has adopted a resolution exempting from the Business Combination Act any business combination between us and any other person, subject to prior approval of such business combination by our board, including approval by a majority of our disinterested directors. If the resolution exempting business combinations is repealed or our board of directors does not approve a business combination, the Business Combination Act may discourage third parties from trying to acquire control of us and increase the difficulty of consummating such an offer. Our bylaws exempt from the Maryland Control Share Acquisition Act acquisitions of our stock by any person. If we amend our bylaws to repeal the exemption from the Maryland Control Share Acquisition Act, the Maryland Control Share Acquisition Act also may make it more difficult for a third party to obtain control of us
and increase the difficulty of consummating such a transaction. However, we will amend our bylaws to be subject to the Maryland Control Share Acquisition Act only if our board of directors determines that it would be in our best interests and if the SEC staff does not object to our determination that our being subject to the Maryland Control Share Acquisition Act does not conflict with the 1940 Act. The SEC staff has issued informal guidance setting forth its position that certain provisions of the Maryland Control Share Acquisition Act would, if implemented, violate Section 18(i) of the 1940 Act.
We have also adopted measures that may make it difficult for a third party to obtain control of us, including provisions of our charter classifying our board of directors in three classes serving staggered three-year terms, and authorizing our board of directors to classify or reclassify shares of our stock in one or more classes or series, to cause the issuance of additional shares of our stock and to amend our charter without stockholder approval to increase or decrease the number of shares of stock that we have authority to issue. These provisions, as well as
other provisions of our charter and bylaws, may delay, defer or prevent a transaction or a change in control that might otherwise be in the best interests of our stockholders.
The foregoing provisions are expected to discourage certain coercive takeover practices and inadequate takeover bids and to encourage persons seeking to acquire control of us to negotiate first with our board of directors. However, these provisions may deprive a shareholderstockholder of the opportunity to sell such shareholder’sstockholder’s shares at a premium to a potential acquirer. We believe that the benefits of these provisions outweigh the potential disadvantages of discouraging any such acquisition proposals because, among other things, the negotiation of such proposals may improve their terms. Our board of directors has considered both the positive and negative effects of the foregoing provisions and determined that they are in the best interest of our shareholders.stockholders.
The failure in cyber security systems, as well as the occurrence of events unanticipated in our disaster recovery systems and management continuity planning could impair our ability to conduct business effectively.
The occurrence of a disaster such as a cyber attack, a natural catastrophe, an industrial accident, a terrorist attack or war, events unanticipated in our disaster recovery systems, or a support failure from external providers, could have an adverse effect on our ability to conduct business and on our results of operations and financial condition, particularly if those events affect our computer-based data processing, transmission, storage, and retrieval systems or destroy data. If a significant number of our managers were unavailable in the event of a disaster, our ability to effectively conduct our business could be severely compromised.
Our business relies on secure information technology systems. We depend heavily upon computer systems to perform necessary business functions. These systems are subject to potential attacks, including through adverse events that threaten the confidentiality, integrity or availability of our information resources (i.e. cyber attacks). Despite our implementation of a variety of security measures, our computer systems could be subject to cyber attacks and unauthorized access, such as physical and electronic break-ins or unauthorized tampering. Like other companies, we may experience threats to our data and systems, including malware and computer virus attacks, unauthorized access, system failures and disruptions. If one or more of these events occurs, it could potentially jeopardize the confidential, proprietary and other information processed and stored in, and transmitted through, our computer systems and networks, or otherwise cause interruptions or malfunctions in our operations, which could result in damage to our reputation, financial losses, litigation, increased costs, regulatory penalties and/or customer dissatisfaction or loss.
We can be highly dependent on information systems and systems failures could significantly disrupt our business, which may, in turn, negatively affect the market price of our common stock and our ability to pay distributions.
Our business is highly dependent on our and third parties’ communications and information systems. Any failure or interruption of those systems, including as a result of the termination of an agreement with any third-partythird-
party service providers, could cause delays or other problems in our activities. Our financial, accounting, data processing, backup or other operating systems and facilities may fail to operate properly or become disabled or damaged as a result of a number of factors including events that are wholly or partially beyond our control and adversely affect our business. There could be:
sudden electrical or telecommunications outages;
natural disasters such as earthquakes, tornadoes and hurricanes;
disease pandemics;
events arising from local or larger scale political or social matters, including terrorist acts; and
cyber attacks.
These events, in turn, could have a material adverse effect on our operating results and negatively affect the market price of our common stock and our ability to pay distributions to our stockholders.
Our board of directors may change our investment objective, operating policies and strategies without prior notice or stockholder approval.
Our board of directors has the authority to modify or waive certain of our operating policies and strategies without prior notice (except as required by the 1940 Act) and without stockholder approval. However, absent stockholder approval, we may not change the nature of our business so as to cease to be, or withdraw our election as a BDC. We cannot predict the effect any changes to our current operating policies and strategies would have on our business, operating results and value of our stock. Nevertheless, the effects may adversely affect our business and impact our ability to make distributions.
Our business is subject to increasingly complex corporate governance, public disclosure and accounting requirements that could adversely affect our business and financial results.
We are subject to changing rules and regulations of federal and state government as well as the stock exchange on which our common stock is listed. These entities, including the Public Company Accounting Oversight Board, the SEC and the NASDAQ Stock Market, have issued a significant number of new and increasingly complex requirements and regulations over the course of the last several years and continue to develop additional regulations and requirements in response to laws enacted by Congress. On July 21, 2010, the Dodd-Frank Wall Street Reform and Consumer Protection Act, or the Dodd-Frank Act, was enacted. There are significant corporate governance-related provisions in the Dodd-Frank Act, and the SEC has adopted additional rules and regulations that may impact us. Our efforts to comply with these existing requirements, or any revised or amended requirements, have resulted in, and are likely to continue to result in, an increase in expenses and a diversion of management’s time from other business activities.
Changes in laws or regulations governing our operations may adversely affect our business.
Changes in the laws or regulations, or the interpretations of the laws and regulations, which govern business development companies,BDCs, RICs or non-depository commercial lenders could significantly affect our operations and our cost of doing business. We are subject to federal, state and local laws and regulations and are subject to judicial and administrative decisions that affect our operations, including our loan originations, maximum interest rates, fees and other charges, disclosures to portfolio companies, the terms of secured transactions, collection and foreclosure procedures, and other trade practices. If these laws, regulations or decisions change, or if we expand our business into jurisdictions that have adopted more stringent requirements than those in which we currently conduct business, then we may have to incur significant expenses in order to comply or we may have to restrict our operations. In addition, if we do not comply with applicable laws, regulations and decisions, then we may lose licenses needed for the conduct of our business and be subject to civil fines and criminal penalties, any of which could have a material adverse effect upon our business results of operations or financial condition.
Our investment adviser can resign on 60 days’ notice, and we may not be able to find a suitable replacement within that time, resulting in a disruption in our operations that could adversely affect our financial condition, business and results of operations.
Our investment adviser has the right, under the Investment Advisory and Management Agreement, to resign at any time upon 60 days’ written notice, whether we have found a replacement or not. If our investment adviser resigns, we may not be able to find a new investment adviser or hire internal management with similar expertise and ability to provide the same or equivalent services on acceptable terms within 60 days, or at all. If we are unable to do so quickly, our operations are likely to experience a disruption, our financial condition, business and results of operations as well as our ability to pay distributions are likely to be adversely affected and the market price of our shares may decline. In addition, the coordination of our internal management and investment activities is likely to suffer if we are unable to identify and reach an agreement with a single institution or group of executives having the expertise possessed by our investment adviser and its affiliates. Even if we are able to retain comparable management, whether internal or external, the integration of such management and their lack of familiarity with our investment objective may result in additional costs and time delays that may adversely affect our financial condition, business and results of operations.
| Item 1B. | Unresolved Staff Comments |
None
| Item 2. | Properties |
Our executive offices are located at 500 Park Avenue, New York, New York 10022, and are provided by Solar Capital Management in accordance with the terms of the Administration Agreement. We believe that our office facilities are suitable and adequate for our business as it is presently conducted.
| Item 3. | Legal Proceedings |
We and our subsidiaries are not currently subject to any material legal proceedings, nor, to our knowledge, is any material legal proceeding threatened against us or our subsidiaries. From time to time, we and our subsidiaries may be a party to certain legal proceedings in the ordinary course of business, including proceedings relating to the enforcement of our rights under contracts with our portfolio companies. While the outcome of these legal proceedings cannot be predicted with certainty, we do not expect that these proceedings will have a material effect upon our financial condition or results of operations.
| Item 4. | Mine Safety Disclosures |
Not applicable.
| Item 5. | Market for Registrant’s Common Equity, Related Stockholder Matters and Issuer Purchases of Equity Securities |
Price Range of Common Stock
Our common stock is traded on the NASDAQ Global Select Market under the symbol “SLRC”. The following table sets forth, for each fiscal quarter during the last two fiscal years, the net asset value (“NAV”) per share of our common stock, the high and low closing sale prices for our common stock, such sale prices as a percentage of NAV per share and quarterly distributions per share.
Price Range | Premium or (Discount) of High Closing Sale Price to NAV(2) | Premium or (Discount) of Low Closing Sale Price to NAV(2) | Declared Dividends(3) |
Price Range | Premium or (Discount) of High Closing Price to NAV(2) | Premium or (Discount) of Low Closing Price to NAV(2) | Declared Distributions(3) | |||||||||||||||||||||||||||||||||||||||||
| NAV(1) | High | Low | NAV(1) | High | Low | |||||||||||||||||||||||||||||||||||||||||||
Fiscal 2014 | ||||||||||||||||||||||||||||||||||||||||||||||||
Fiscal 2016 | ||||||||||||||||||||||||||||||||||||||||||||||||
Fourth Quarter | $ | 22.05 | $ | 19.06 | $ | 17.23 | (13.6 | )% | (21.9 | )% | $ | 0.40 | $ | 21.74 | $ | 21.42 | $ | 19.43 | (1.5 | )% | (10.6 | )% | $ | 0.40 | ||||||||||||||||||||||||
Third Quarter | 22.34 | 21.47 | 18.68 | (3.9 | ) | (16.4 | ) | 0.40 | 21.72 | 20.71 | 19.02 | (4.7 | ) | (12.4 | ) | 0.40 | ||||||||||||||||||||||||||||||||
Second Quarter | 22.44 | 22.29 | 20.39 | (0.7 | ) | (9.1 | ) | 0.40 | 21.51 | 19.07 | 16.91 | (11.3 | ) | (21.4 | ) | 0.40 | ||||||||||||||||||||||||||||||||
First Quarter | 22.43 | 23.21 | 21.76 | 3.5 | (3.0 | ) | 0.40 | 21.08 | 17.70 | 15.60 | (16.0 | ) | (26.0 | ) | 0.40 | |||||||||||||||||||||||||||||||||
Fiscal 2013 | ||||||||||||||||||||||||||||||||||||||||||||||||
Fiscal 2015 | ||||||||||||||||||||||||||||||||||||||||||||||||
Fourth Quarter | $ | 22.50 | $ | 23.16 | $ | 21.89 | 2.9 | % | (2.7 | )% | $ | 0.40 | $ | 20.79 | $ | 18.20 | $ | 16.10 | (12.5 | )% | (22.6 | )% | $ | 0.40 | ||||||||||||||||||||||||
Third Quarter | 22.25 | 25.03 | 21.74 | 12.5 | (2.3 | ) | 0.40 | 21.52 | 18.63 | 15.39 | (13.4 | ) | (28.5 | ) | 0.40 | |||||||||||||||||||||||||||||||||
Second Quarter | 22.40 | 24.32 | 22.11 | 8.6 | (1.3 | ) | 0.60 | 21.92 | 20.67 | 18.00 | (5.7 | ) | (17.9 | ) | 0.40 | |||||||||||||||||||||||||||||||||
First Quarter | 23.00 | 25.64 | 23.49 | 11.5 | 2.1 | 0.60 | 21.91 | 20.46 | 18.07 | (6.6 | ) | (17.5 | ) | 0.40 | ||||||||||||||||||||||||||||||||||
| (1) | NAV per share is determined as of the last day in the relevant quarter and therefore may not reflect the NAV per share on the date of the high and low closing sales prices. The net asset values shown are based on outstanding shares at the end of each period. |
| (2) | Calculated as of the respective high or low closing sales price divided by NAV and subtracting 1. |
| (3) | Represents the cash |
Shares of BDCs may trade at a market price that is less than the value of the net assets attributable to those shares. The possibility that our shares of common stock will trade at a discount from net asset value or at premiums that are unsustainable over the long term are separate and distinct from the risk that our net asset value will decrease. Since our initial public offering on February 9, 2010, our shares of common stock have traded at both a discount and a premium to the net assets attributable to those shares.
The last reported closing market price of our common stock on February 20, 201516, 2017 was $19.58$22.00 per share. As of February 20, 2015,16, 2017, we had 20 shareholders of record.
DISTRIBUTIONS
Tax characteristics of all distributions will be reported to shareholders on Form 1099 after the end of the calendar year. Future quarterly distributions, if any, will be determined by our Board. We expect that our distributions to stockholders will generally be from accumulated net investment income, from net realized capital gains or non-taxable return of capital, if any, as applicable.
We have elected to be taxed as a RIC under Subchapter M of the Code. To maintain our RIC status, we must distribute at least 90% of our ordinary income and realized net short-term capital gains in excess of realized net long-term capital losses, if any, out of the assets legally available for distribution. In addition, although we currently intend to distribute realized net capital gains (i.e., net long-term capital gains in excess of short-term capital losses), if any, at least annually, out of the assets legally available for such distributions, we may in the future decide to retain such capital gains for investment.
We maintain an “opt out” dividend reinvestment plan for our common stockholders. As a result, if we declare a distribution, then stockholders’ cash distributions will be automatically reinvested in additional shares of our common stock, unless they specifically “opt out” of the dividend reinvestment plan so as to receive cash distributions.
We may not be able to achieve operating results that will allow us to make distributions at a specific level or to increase the amount of these distributions from time to time. In addition, due to the asset coverage test applicable to us as a business development company, we may in the future be limited in our ability to make distributions. Also, our revolving credit facility may limit our ability to declare distributions if we default under certain provisions. If we do not distribute a certain percentage of our income annually, we will suffer adverse tax consequences, including possible loss of the tax benefits available to us as a regulated investment company. In addition, in accordance with U.S. generally accepted accounting principles and tax regulations, we include in income certain amounts that we have not yet received in cash, such as contractual payment-in-kind interest, which represents contractual interest added to the loan balance that becomes due at the end of the loan term, or the accrual of original issue or market discount. Since we may recognize income before or without receiving cash representing such income, we may have difficulty meeting the requirement to distribute at least 90% of our investment company taxable income to obtain tax benefits as a regulated investment company.
With respect to the distributions to stockholders, income from origination, structuring, closing and certain other upfront fees associated with investments in portfolio companies are treated as taxable income and accordingly, distributed to stockholders.
We cannot assure stockholders that they will receive any distributions at a particular level.
All distributions declared in cash payable to stockholders that are participants in our dividend reinvestment plan are generally automatically reinvested in shares of our common stock. As a result, stockholders that do not participate in the dividend reinvestment plan may experience dilution over time. Stockholders who do not elect to receive distributions in shares of common stock may experience accretion to the net asset value of their shares if our shares are trading at a premium and dilution if our shares are trading at a discount. The level of accretion or discount would depend on various factors, including the proportion of our stockholders who participate in the plan, the level of premium or discount at which our shares are trading and the amount of the distribution payable to a stockholder.
The following table reflects cash distributions per share on our common stock for the two most recent fiscal years and the current fiscal year to date:
Date Declared | Record Date | Payment Date | Amount | |||||
Fiscal 2015 | ||||||||
February 25, 2015 | March 19, 2015 | April 2, 2015 | $ | 0.40 | ||||
|
| |||||||
Fiscal 2014 | ||||||||
November 4, 2014 | December 18, 2014 | January 5, 2015 | $ | 0.40 | ||||
August 4, 2014 | September 18, 2014 | October 1, 2014 | 0.40 | |||||
May 5, 2014 | June 19, 2014 | July 1, 2014 | 0.40 | |||||
February 25, 2014 | March 20, 2014 | April 1, 2014 | 0.40 | |||||
|
| |||||||
Total 2014 | $ | 1.60 | ||||||
|
| |||||||
Fiscal 2013 | ||||||||
October 30, 2013 | December 19, 2013 | January 3, 2014 | $ | 0.40 | ||||
July 24, 2013 | September 19, 2013 | October 2, 2013 | 0.40 | |||||
May 7, 2013 | June 20, 2013 | July 1, 2013 | 0.60 | |||||
February 25, 2013 | March 21, 2013 | April 2, 2013 | 0.60 | |||||
|
| |||||||
Total 2013 | $ | 2.00 | ||||||
|
| |||||||
Date Declared | Record Date | Payment Date | Amount | |||||||||
Fiscal 2017 | ||||||||||||
February 22, 2017 | March 23, 2017 | April 4, 2017 | $ | 0.40 | ||||||||
|
| |||||||||||
Fiscal 2016 | ||||||||||||
November 2, 2016 | December 15, 2016 | January 4, 2017 | $ | 0.40 | ||||||||
August 2, 2016 | September 22, 2016 | October 4, 2016 | 0.40 | |||||||||
May 3, 2016 | June 23, 2016 | July 1, 2016 | 0.40 | |||||||||
February 24, 2016 | March 24, 2016 | April 1, 2016 | 0.40 | |||||||||
|
| |||||||||||
Total 2016 | $ | 1.60 | ||||||||||
|
| |||||||||||
Fiscal 2015 | ||||||||||||
November 3, 2015 | December 17, 2015 | January 6, 2016 | $ | 0.40 | ||||||||
August 4, 2015 | September 24, 2015 | October 2, 2015 | 0.40 | |||||||||
May 5, 2015 | June 25, 2015 | July 1, 2015 | 0.40 | |||||||||
February 25, 2015 | March 19, 2015 | April 2, 2015 | 0.40 | |||||||||
|
| |||||||||||
Total 2015 | $ | 1.60 | ||||||||||
|
| |||||||||||
Recent Sales of Unregistered Securities
On May 10, 2012, the Company closed a private offering of $75 million of Senior Secured Notes with a fixed interest rate of 5.875% and a maturity date of May 10, 2017. Interest on the Senior Secured Notes is due semi-annually on May 10th and November 10th. The Senior Secured Notes were issued in a private placement only to qualified institutional buyers pursuant to Rule 144A under the Securities Act of 1933, as amended. The proceeds from the issuance of the Senior Secured Notes were used to fund new portfolio investments, reduce outstanding borrowings and/or commitments on the Company’s revolving credit facility and for general corporate purposes.None.
Issuer Purchases of Equity Securities
None.
Period | Total Number of Shares Purchased | Average Price Paid per Share | Total Number of Shares Purchased as Part of Publicly Announced Plans or Programs | Approximate Dollar Value of Shares that May Yet Be Purchased Under the Plans or Programs (a) (in thousands) | ||||||||||||
February 3, 2014 to February 28, 2014 | 310,958 | $ | 21.93 | 310,958 | $ | 75,672 | ||||||||||
March 3, 2014 to March 31, 2014 | 578,854 | $ | 22.03 | 578,854 | $ | 62,918 | ||||||||||
April 1, 2014 to April 30, 2014 | 630,202 | $ | 22.02 | 630,202 | $ | 49,038 | ||||||||||
May 1, 2014 to May 7, 2014 | 259,019 | $ | 21.72 | 259,019 | $ | 43,414 | ||||||||||
|
|
|
| |||||||||||||
Total | 1,779,033 | 1,779,033 | ||||||||||||||
STOCK PERFORMANCE GRAPH
This graph compares the cumulative total return on our common stock with that of the S&PStandard & Poor’s BDC Index, the S&PStandard & Poor’s 500 Stock Index and the Russell 2000 Financial Services Index, for the period from February 9, 2010 (the date that shares of our common stock began trading on NASDAQ Global Select Market)December 31, 2011 through December 31, 2014.2016. The graph assumes that on February 9, 2010, a person invested $10,000 in each of the following: our common stock (SLRC), the S&P BDC Index, the S&P 500 Index, and the Russell 2000 Financial Services Index. The graph measures total stockholder return, which takes into account both changes in stock price and dividends. It assumes that dividends paid are invested in like securities.additional shares of the same class of equity securities at the frequency with which dividends are paid of such securities during the applicable fiscal year.
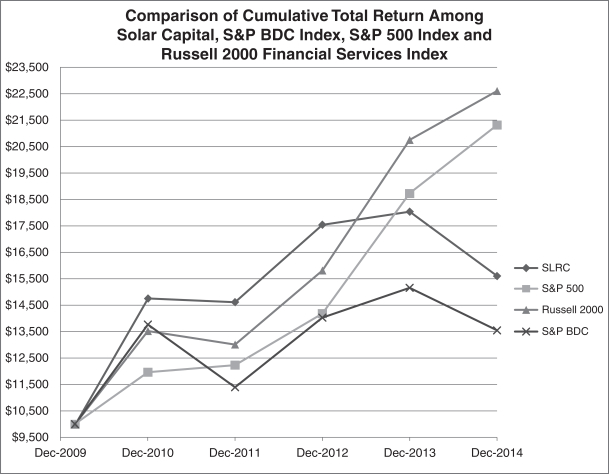
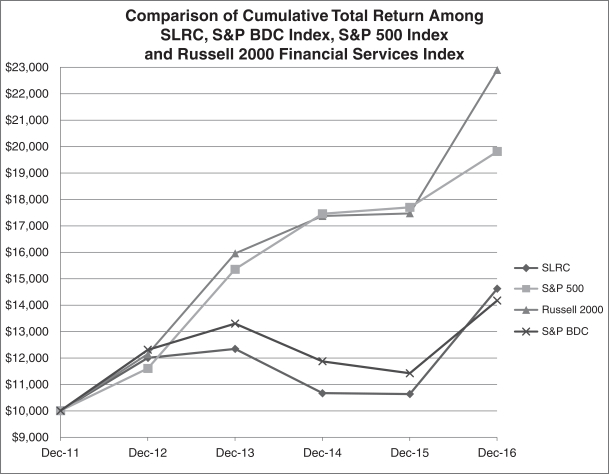
The graph and other information furnished under this Part II Item 5 of this Form 10-K shall not be deemed to be “soliciting material” or to be “filed” with the SEC or subject to Regulation 14A or 14C, or to the liabilities of Section 18 of the 1934 Act. The stock price performance included in the above graph is not necessarily indicative of future stock price performance.
| Item 6. | Selected Financial Data |
The selected financial and other data below should be read in conjunction with our “Management’s Discussion and Analysis of Financial Condition and Results of Operations” and the consolidated financial statements and notes thereto. Financial information is presented for the fiscal years ended December 31, 2016, 2015, 2014, 2013 2012, 2011, and 2010.2012. Financial information for the periods ending December 31, 2016, 2015, 2014, 2013, 2012, 2011, and 20102012 has been derived from our consolidated financial statements that were audited by KPMG LLP (“KPMG”), an independent registered public accounting firm.
($ in thousands, except per share data) | Year ended December 31, 2014 | Year ended December 31, 2013 | Year ended December 31, 2012 | Year ended December 31, 2011 | Year ended December 31, 2010 | Year ended December 31, 2016 | Year ended December 31, 2015 | Year ended December 31, 2014 | Year ended December 31, 2013 | Year ended December 31, 2012 | ||||||||||||||||||||||||||||||
Income statement data: | ||||||||||||||||||||||||||||||||||||||||
Total investment income | $ | 121,937 | $ | 163,593 | $ | 153,253 | $ | 138,900 | $ | 124,641 | $ | 151,839 | $ | 115,560 | $ | 121,937 | $ | 163,593 | $ | 153,253 | ||||||||||||||||||||
Total expenses | $ | 55,230 | $ | 78,658 | $ | 71,326 | $ | 56,996 | $ | 55,429 | ||||||||||||||||||||||||||||||
Net expenses | $ | 80,738 | $ | 51,204 | $ | 55,230 | $ | 78,658 | $ | 71,326 | ||||||||||||||||||||||||||||||
Net investment income | $ | 66,707 | $ | 84,935 | $ | 81,927 | $ | 81,904 | $ | 69,212 | $ | 71,101 | $ | 64,356 | $ | 66,707 | $ | 84,935 | $ | 81,927 | ||||||||||||||||||||
Net realized loss | $ | (36,840 | ) | $ | (44,425 | ) | $ | (32,537 | ) | $ | (2,393 | ) | $ | (38,968 | ) | |||||||||||||||||||||||||
Net realized gain (loss) | $ | 776 | $ | (4,874 | ) | $ | (36,840 | ) | $ | (44,425 | ) | $ | (32,537 | ) | ||||||||||||||||||||||||||
Net change in unrealized gain (loss). | $ | 18,585 | $ | 34,800 | $ | 66,371 | $ | (18,196 | ) | $ | 111,641 | $ | 34,938 | $ | (45,402 | ) | $ | 18,585 | $ | 34,800 | $ | 66,371 | ||||||||||||||||||
Net increase in net assets resulting from operations | $ | 48,452 | $ | 75,310 | $ | 115,761 | $ | 61,315 | $ | 141,885 | $ | 106,815 | $ | 14,080 | $ | 48,452 | �� | $ | 75,310 | $ | 115,761 | |||||||||||||||||||
Per share data: | ||||||||||||||||||||||||||||||||||||||||
Net investment income (3) | $ | 1.56 | $ | 1.91 | $ | 2.20 | $ | 2.25 | $ | 2.08 | $ | 1.68 | $ | 1.52 | $ | 1.56 | $ | 1.91 | $ | 2.20 | ||||||||||||||||||||
Net realized and unrealized gain (loss)(3) | $ | (0.43 | ) | $ | (0.22 | ) | $ | 0.91 | $ | (0.57 | ) | $ | 2.19 | $ | 0.84 | $ | (1.18 | ) | $ | (0.43 | ) | $ | (0.22 | ) | $ | 0.91 | ||||||||||||||
Dividends and distributions declared | $ | 1.60 | $ | 2.00 | $ | 2.40 | $ | 2.40 | $ | 2.14 | $ | 1.60 | $ | 1.60 | $ | 1.60 | $ | 2.00 | $ | 2.40 | ||||||||||||||||||||
| As of December 31, 2014 | As of December 31, 2013 | As of December 31, 2012 | As of December 31, 2011 | As of December 31, 2010 | As of December 31, 2016 | As of December 31, 2015 | As of December 31, 2014 | As of December 31, 2013 | As of December 31, 2012 | |||||||||||||||||||||||||||||||
Balance sheet data: | ||||||||||||||||||||||||||||||||||||||||
Total investment portfolio | $ | 1,020,738 | $ | 1,088,399 | $ | 1,395,522 | $ | 1,045,043 | $ | 976,221 | $ | 1,304,778 | $ | 1,312,591 | $ | 1,020,738 | $ | 1,088,399 | $ | 1,395,522 | ||||||||||||||||||||
Cash and cash equivalents | $ | 635,340 | $ | 586,979 | $ | 15,039 | $ | 11,787 | $ | 288,732 | $ | 312,046 | $ | 277,570 | $ | 635,340 | $ | 586,979 | $ | 15,039 | ||||||||||||||||||||
Total assets | $ | 1,686,334 | $ | 1,708,442 | $ | 1,430,403 | $ | 1,079,431 | $ | 1,291,791 | $ | 1,650,547 | $ | 1,620,300 | $ | 1,686,334 | $ | 1,708,442 | $ | 1,430,403 | ||||||||||||||||||||
Debt | $ | 225,000 | $ | 225,000 | $ | 489,452 | $ | 236,355 | $ | 435,000 | $ | 390,200 | $ | 432,900 | $ | 225,000 | $ | 225,000 | $ | 489,452 | ||||||||||||||||||||
Net assets | $ | 936,568 | $ | 995,637 | $ | 878,273 | $ | 805,941 | $ | 826,994 | $ | 918,507 | $ | 882,698 | $ | 936,568 | $ | 995,637 | $ | 878,273 | ||||||||||||||||||||
Per share data: | ||||||||||||||||||||||||||||||||||||||||
Net asset value per share | $ | 22.05 | $ | 22.50 | $ | 22.70 | $ | 22.02 | $ | 22.73 | $ | 21.74 | $ | 20.79 | $ | 22.05 | $ | 22.50 | $ | 22.70 | ||||||||||||||||||||
Other data (unaudited): | ||||||||||||||||||||||||||||||||||||||||
Weighted average annualized yield on income producing investments: | ||||||||||||||||||||||||||||||||||||||||
Weighted average annualized yield on income producing investments(4): | ||||||||||||||||||||||||||||||||||||||||
On fair value(1) | 9.9 | % | 11.3 | % | 14.2 | % | 14.2 | % | 14.3 | % | 10.0 | % | 10.5 | % | 9.9 | % | 11.3 | % | 14.2 | % | ||||||||||||||||||||
On cost(2) | 10.4 | % | 12.2 | % | 14.2 | % | 13.2 | % | 13.8 | % | 10.4 | % | 10.2 | % | 10.4 | % | 12.2 | % | 14.2 | % | ||||||||||||||||||||
Total return(5) | 37.5 | % | (0.3 | %) | (13.6 | %) | 2.8 | % | 20.0 | % | ||||||||||||||||||||||||||||||
Number of portfolio companies at period end | 43 | 40 | 40 | 40 | 36 | 63 | 54 | 43 | 40 | 40 | ||||||||||||||||||||||||||||||
| (1) | Throughout this document, the weighted average yield on income producing investments is computed as the (a) annual stated interest on accruing loans and debt securities plus the annual amortization of loan origination fees, original issue discount, and market discount on accruing loans and debt securities, plus the effective interest yield on preferred shares divided by (b) total income producing investments at fair value. The weighted average yield is computed as of the balance sheet date and excludes assets on non-accrual status or on a cost recovery basis as of such date. |
| (2) | For this calculation, the weighted average yield on income producing investments is computed as the (a) annual stated interest on accruing loans and debt securities plus the annual amortization of loan origination fees, original issue discount, and market discount on accruing loans and debt securities, plus the effective interest yield on preferred shares divided by (b) total income producing investments at cost. The weighted average yield is computed as of the balance sheet date and excludes assets on non-accrual status or on a cost recovery basis as of such date. |
| (3) |
| (4) | The weighted average annualized yield on income producing investments does not represent a return to stockholders. |
| (5) | Total return is based on the change in market price per share during the year and takes into account dividends, if any, reinvested in accordance with the dividend reinvestment plan. Total return does not include a sales load. |
| Item 7. | Management’s Discussion and Analysis of Financial Condition and Results of Operations |
The information contained in this section should be read in conjunction with the Selected Financial and Other Data and our Consolidated Financial Statements and notes thereto appearing elsewhere in this report.
Some of the statements in this report constitute forward-looking statements, which relate to future events or our future performance or financial condition. The forward-looking statements contained herein involve risks and uncertainties, including statements as to:
our future operating results;
our business prospects and the prospects of our portfolio companies;
the impact of investments that we expect to make;
our contractual arrangements and relationships with third parties;
the dependence of our future success on the general economy and its impact on the industries in which we invest;
the ability of our portfolio companies to achieve their objectives;
our expected financings and investments;
the adequacy of our cash resources and working capital; and
the timing of cash flows, if any, from the operations of our portfolio companies.
We generally use words such as “anticipates,” “believes,” “expects,” “intends” and similar expressions to identify forward-looking statements. Our actual results could differ materially from those projected in the forward-looking statements for any reason, including any factors set forth in “Risk Factors” and elsewhere in this report.
We have based the forward-looking statements included in this report on information available to us on the date of this report, and we assume no obligation to update any such forward-looking statements. Although we undertake no obligation to revise or update any forward-looking statements, whether as a result of new information, future events or otherwise, you are advised to consult any additional disclosures that we may make directly to you or through reports that we in the future may file with the SEC, including any annual reports on Form 10-K, quarterly reports on Form 10-Q and current reports on Form 8-K.
Overview
Solar Capital LLC, a Maryland limited liability company, was formed in February 2007 and commenced operations on March 13, 2007 with initial capital of $1.2 billion of which 47.04% was funded by affiliated parties.
Immediately prior to the initial public offering, through a series of transactions Solar Capital Ltd. merged with Solar Capital LLC, leaving Solar Capital Ltd. as the surviving entity (the “Merger”). Solar Capital Ltd. issued an aggregate of approximately 26.65 million shares of common stock and $125 million in senior unsecured notes (the “Senior Unsecured Notes”) to the existing Solar Capital LLC unit holders in connection with the Merger. Solar Capital Ltd. had no assets or operations prior to completion of the Merger and as a result, the historical books and records of Solar Capital LLC have become the books and records of the surviving entity. The number of shares used to calculate weighted average shares for use in computations on a per share basis have been decreased retroactively by a factor of approximately 0.4022 for all periods prior to February 9, 2010. This factor represents the effective impact of the reduction in shares resulting from the Merger. As of December 17, 2010, the Senior Unsecured Notes have been repaid from proceeds of a private placement transaction that we completed on November 30, 2010 and from borrowings under a credit facility established in December 2010.
Solar Capital Ltd. (“Solar Capital”, the “Company”, “we” or “we”“our”), a Maryland corporation formed in November 2007, is a closed-end, externally managed, non-diversified management investment company that has elected to be treatedregulated as a business development company (“BDC”) under the Investment Company Act of 1940, as amended (the “1940 Act”). Furthermore, as the Company is an investment company, it continues to apply the guidance in FASBthe Financial Accounting Standards Board (“FASB”) Accounting Standards Codification (“ASC”) Topic 946. In addition, for tax purposes, the Company has elected to be treated as a regulated investment company (“RIC”) under Subchapter M of the Internal Revenue Code of 1986, as amended (the “Code”).
On February 9, 2010, we priced our initial public offering, selling 5.68 million shares of our common stock. Concurrent with our initial public offering, Michael S. Gross, our chairmanChairman and chief executive officer,Chief Executive Officer, and Bruce Spohler, our chief operating officer,Chief Operating Officer, collectively purchased an additional 0.6 million shares of our common stock through a private placement transaction exempt from registration under the Securities Act (the “Concurrent Private Placement”).
We invest primarily in privately held U.S. middle-market companies, where we believe the supply of primary capital is limited and the investment opportunities are most attractive. Our investment objective is to generate both current income and capital appreciation through debt and equity investments. We invest primarily in leveraged middle-market companies in the form of senior secured loans, unitranche loans, mezzanine loans and equity securities. From time to time, we may also invest in public companies that are thinly traded. Our business is focused primarily on the direct origination of investments through portfolio companies or their financial sponsors. Our investments generally range between $5 million and $100 million each, although we expect that this investment size will vary proportionately with the size of our capital base and/or with strategic initiatives. WeOur investment activities are managed by Solar Capital Partners, LLC (the “Investment Adviser”). and supervised by our board of directors, a majority of whom are non-interested, as such term is defined in the 1940 Act. Solar Capital Management, LLC (the “Administrator”) provides the administrative services necessary for us to operate.
In addition, we may invest a portion of our portfolio in other types of investments, which we refer to as opportunistic investments, which are not our primary focus but are intended to enhance our overall returns. These investments may include, but are not limited to, direct investments in public companies that are not thinly traded and securities of leveraged companies located in select countries outside of the United States.
As of December 31, 2014,2016, the Investment Adviser has invested approximately $4.7$6.0 billion in more than 180265 different portfolio companies since it was founded in 2006. Over the same period, the Investment Adviser completed transactions with more than 110165 different financial sponsors.
Recent Developments
On February 25, 2015,15, 2017, the Company closed a private offering of $100 million of additional 2022 Unsecured Notes with a fixed interest rate of 4.60% and a maturity date of May 8, 2022. Interest on the 2022 Unsecured Notes is due semi-annually on May 8 and November 8. The 2022 Unsecured Notes were issued in a private placement only to qualified institutional buyers pursuant to Rule 144A under the Securities Act of 1933, as amended.
On February 22, 2017, the Company, through its commitment to Senior Secured Unitranche Loan Program III LLC (“SSLP III”), and Solar Senior formed Solar Life Science Program LLC (“LSJV”) with an affiliate of Deerfield Management. The Company is committing approximately $50 million to LSJV.
On February 22, 2017, our board of directorsBoard declared a quarterly distribution of $0.40 per share payable on April 2, 20154, 2017 to holders of record as of March 19, 2015.23, 2017.
Investments
Our level of investment activity can and does vary substantially from period to period depending on many factors, including the amount of debt and equity capital available to middle market companies, the level of merger and acquisition activity for such companies, the general economic environment and the competitive environment for the types of investments we make. As a BDC, we must not acquire any assets other than “qualifying assets” specified in the 1940 Act unless, at the time the acquisition is made, at least 70% of our total assets are qualifying assets (with certain limited exceptions). Qualifying assets include investments in “eligible portfolio companies.” The definition of “eligible portfolio company” includes certain public companies that do not have any securities listed on a national securities exchange and companies whose securities are listed on a national securities exchange but whose market capitalization is less than $250 million.
Revenue
We generate revenue primarily in the form of interest and dividend income from the securities we hold and capital gains, if any, on investment securities that we may sell. Our debt investments generally have a stated term of three to seven years and typically bear interest at a floating rate usually determined on the basis of a benchmark London interbank offered rate (“LIBOR”), commercial paper rate, or the prime rate. Interest on our debt investments is generally payable quarterly but may be monthly or semi-annually. In addition, our investments may provide payment-in-kind (“PIK”) interest. Such amounts of accrued PIK interest are added to the cost of the investment on the respective capitalization dates and generally become due at maturity of the investment or upon the investment being called by the issuer. We may also generate revenue in the form of commitment, origination, structuring fees, fees for providing managerial assistance and, if applicable, consulting fees, etc.
Expenses
All investment professionals of the Investment Adviserinvestment adviser and its staff,their respective staffs, when and to the extent engaged in providing investment advisory and management services, to us, and the compensation and routine overhead expenses of thatsuch personnel which is allocable to thosesuch services, are provided and paid for by the Investment Adviser.Solar Capital Partners. We bear all other costs and expenses of our operations and transactions, including those relating to:(without limitation):
investment advisorythe cost of our organization and management fees;public offerings;
expenses incurred by the Investment Adviser payable to third parties, including agents, consultants or other advisors, in monitoring our financial and legal affairs and in monitoring our investments and performing due diligence on our prospective portfolio companies;
calculationcost of calculating our net asset value, (includingincluding the cost and expenses of any independentthird-party valuation firm utilized);services;
direct coststhe cost of effecting sales and expensesrepurchases of administration, including independent registered public accountingour shares and legal costs;
costs of preparing and filing reports or other documents with the SEC;securities;
interest payable on debt, if any, incurred to finance our investments;
offerings of our common stock and other securities;
registration and listing fees;
fees payable to third parties including agents, consultants or other advisors, relating to, or associated with, evaluatingmaking investments, including fees and making investments;expenses associated with performing due diligence reviews of prospective investments and advisory fees;
transfer agent and custodial fees;
fees and expenses associated with marketing efforts;
federal and state registration fees, any stock exchange listing fees;
federal, state and local taxes;
independent directors’ fees and expenses;
marketing and distribution-related expenses;brokerage commissions;
the costs of any reports, proxy statements or other notices to stockholders, including printing and postage costs;
our allocable portion of the fidelity bond, directors and officers/officers errors and omissions liability insurance and any other insurance premiums;
organizationaldirect costs and expenses of administration, including printing, mailing, long distance telephone and staff;
fees and expenses associated with independent audits and outside legal costs;
costs associated with our reporting and compliance obligations under the 1940 Act and applicable federal and state securities laws; and
all other expenses incurred by useither Solar Capital Management or the Administratorus in connection with administering our business, such asincluding payments under the Administration Agreement that will be based upon our allocable portion of overhead and other expenses incurred by Solar Capital Management in performing its obligations under the administration agreement,Administration Agreement, including rent, the fees and expenses associated with performing compliance functions, and our allocable portion of the costcosts of compensation and related expenses of our chief compliance officer and our chief financial officer and chief compliance officer and their respective staffs.any administrative support staff.
We expect our general and administrative operating expenses related to our ongoing operations to increase moderately in dollar terms. During periods of asset growth, we generally expect our general and administrative operating expenses to decline as a percentage of our total assets and increase during periods of asset declines. Incentive fees, interest expense and costs relating to future offerings of securities, among others, may also increase or reduce overall operating expenses based on portfolio performance, interest rate benchmarks, and offerings of our securities relative to comparative periods, among other factors.
Portfolio and Investment Activity
During the year ended December 31, 2014,2016, we invested approximately $557$428 million across 3035 portfolio companies. This compares to investing approximately $330$505 million in 1932 portfolio companies for the previous fiscal year ended December 31, 2013.2015. Investments sold, prepaid or prepaidrepaid during the fiscal year ended December 31, 20142016 totaled approximately $626$488 million versus approximately $658$171 million for the fiscal year ended December 31, 2013.2015.
At December 31, 2014,2016, our portfolio consisted of 4363 portfolio companies and was invested 58.8%60.4% in senior secured loans, 7.4%2.2% in subordinated debt, 2.3%1.1% in preferred equity and 31.5%36.3% in common equity and warrants (of which 23.4% is Crystal Financial LLC, 7.7% is Senior Secured Unitranche Loan Program LLC and 3.6% is Senior Secured Unitranche Loan Program II LLC) measured at fair value versus 4054 portfolio companies invested 40.8%63.7% in senior secured loans, 23.4%5.1% in subordinated debt, 2.4%1.4% in preferred equity and 33.4%29.8% in common equity/equity interests and warrants (of which 22.1% is Crystal Financial LLC and 6.1% is Senior Secured Unitranche Loan Program LLC) measured at fair value at December 31, 2013.2015.
The weighted average annualized yields on our portfolio of income producing investments were 9.9%10.0% and 11.3%10.5%, respectively, at December 31, 20142016 and December 31, 2013,2015, measured at fair value.value, and 10.4% and 10.2%, respectively for the same periods, measured at amortized cost. Portfolio yield does not represent an actual investment return to shareholders.
At December 31, 2014, 86.3%2016, 94.9% or $854.1 million$1.22 billion of our income producing investment portfolio* is floating rate and 13.7%5.1% or $135.5$65.7 million is fixed rate, measured at fair value. At December 31, 2013, 64.5%2015, 91.0% or $663.8 million$1.17 billion of our income producing investment portfolio*portfolio* was floating rate and 35.5%9.0% or $366.0$116.6 million was fixed rate, measured at fair value. As of both December 31, 20142016 and 2013,2015, we had two and zero issuersone issuer on non-accrual status, respectively.status.
Since inception through December 31, 2016, Solar Capital and its predecessor companies have invested approximately $3.9$4.8 billion in 123168 portfolio companies. Over the same period, Solar Capital has completed transactions with more than 85125 different financial sponsors.
Crystal Financial LLC
On December 28, 2012, we completed the acquisition of Crystal Capital Financial Holdings LLC (“Crystal Financial”), a commercial finance company focused on providing asset-based and other secured financing solutions from SSP Energy Ltd., Quartz Managers LLC and Quantum Strategic Partners Ltd. (the “Crystal Acquisition”) pursuant to a definitive agreement entered into on December 17, 2012.. We invested $275 million in cash to effect the Crystal Acquisition. Crystal Financial ownsowned approximately 98% of the outstanding ownership interest in Crystal Financial LLC. The remaining financial interest iswas held by various employees of Crystal Financial LLC, through their investment in Crystal Management LP. Crystal Financial LLC had a diversified portfolio of 23 loans having a total par value of approximately $400 million at November 30, 2012 and a $275 million committed revolving credit facility. On January 27, 2014, the revolving credit facility was expanded to $300 million. On March 31, 2014, we exchanged $137.5 million of our equity interest in Crystal Financial in exchange for $137.5 million in floating rate senior secured notes in Crystal Financial bearing interest at LIBOR plus 9.50%, maturing on March 31, 2019. On May 18, 2015, the revolving credit facility was expanded to $350 million. Our financial statements, including our
| * | We have included Crystal Financial LLC, Senior Secured Unitranche Loan Program LLC and Senior Secured Unitranche Loan Program II LLC within our income producing investment portfolio. |
schedule of investments, reflectreflected our investments in Crystal Financial on a consolidated basis. We also have an additional
$50.0 million commitment toOn July 28, 2016, the Company purchased Crystal Management LP’s approximately 2% equity interest in Crystal Financial (which may be structured as debt or equity), conditional upon approvalLLC for approximately $5.7 million. Upon the closing of this transaction, the Company holds 100% of the equity interest in Crystal Financial’s board of managers, among other conditions.Financial LLC. On September 30, 2016, Crystal Capital Financial Holdings LLC was dissolved.
As of December 31, 2014,2016, Crystal Financial LLC had 2926 funded commitments to 2725 different issuers with a total par value of approximately $477.9$368.8 million on total assets of $542.3$459.7 million. As of December 31, 2013,2015, Crystal Financial LLC had 2728 funded commitments to 2326 different issuers with a total par value of approximately $465.5$465.1 million on total assets of $499.1$518.3 million. As of December 31, 20142016 and 2013, all loans were floating rate withDecember 31, 2015, the largest loan outstanding totaling $33.0totaled $36.3 million and $50.0$34.3 million, respectively. For the same periods, the average exposure per issuer was $17.7$14.8 million and $20.2$17.9 million, respectively. Crystal Financial LLC’s credit facility, which is non-recourse to Solar Capital, had approximately $259.7$175.4 million and $200.4$232.9 million of borrowings outstanding at December 31, 20142016 and December 31, 2013,2015, respectively. For the years ended December 31, 20142016, 2015 and December 31, 2013,2014, Crystal Financial LLC had net income of $34.1 million, $27.4 million and $27.2 million, and $28.1 millionrespectively, on gross income of $56.1$69.4 million, $62.5 million and $54.0$56.1 million, respectively. Due to timing and non-cash items, there may be material differences between GAAP net income and cash available for distributions.
Stock Repurchase Program
On July As of December 31, 2013,2016, and based upon our expectations for Crystal Financial LLC’s portfolio performance, we believe that Crystal Financial LLC will be able to maintain its dividend payments to the Company’s board of directors authorized a programCompany. Crystal Financial LLC’s consolidated financial statements for the purpose of repurchasing up to $100 million of the Company’s common stock. Under the repurchase program, the Company could have, but was not obligated to, repurchase its outstanding common stock in the open market from time to time provided that the Company complies with the prohibitions under its Insider Trading Policies and Procedures and the guidelines specified in Rule 10b-18 and 10b-5 of the Securities Exchange Act of 1934, as amended, including certain price, market volume and timing constraints. On December 5, 2013, the Company’s board of directors extended the repurchase program to be in place until the earlier of July 31, 2014 or until $100 million of the Company’s outstanding shares of common stock have been repurchased. On July 31, 2014, the Company’s stock repurchase program expired. For the fiscal yearyears ended December 31, 2014, the Company repurchased 1,779,033 shares at an average price of approximately $21.97 per share, inclusive of commissions. The total dollar amount of shares repurchased was $39.1 million. During the year ended2016 and December 31, 2013, the Company repurchased 796,418 shares at2015 are attached as an average price of approximately $21.98 per share, inclusive of commissions, for a total dollar amount of $17.5 million.exhibit to this annual report on Form 10-K.
Senior Secured Unitranche Loan Program LLC
On September 2, 2014, the Company entered into a limited liability company agreement with an affiliate (the “Investor”) of a fund managed by Pacific Investment Management Company LLC (“PIMCO”) to co-invest in middle market senior secured unitranche loans sourced by the same origination platform used by the Company. Initial funding commitments to the unitranche strategy total $600 million, consisting of direct equity investments and co-investment commitments as described below. The joint venture vehicle known as the Senior Secured Unitranche Loan Program LLC (“SSLP”) is structured as an unconsolidated Delaware limited liability company. The Company and the Investor have initially made equity commitments to the SSLP of $300$300.0 million and $43.25 million, respectively. All portfolio decisions and generally all other decisions in respect of the SSLP must be approved by an investment committee of the SSLP consisting of representatives of the Company and PIMCO (with approval from a representative of each required).
On October 15, 2015, the Company entered into an amended and restated limited liability company agreement for its SSLP to add Voya Investment Management LLC (“Voya”), part of Voya Financial, Inc. (NYSE: VOYA), as a partner in SSLP in place of the investor that was previously the Company’s partner in SSLP, though this investor may still co-invest up to $300 million of equity in unitranche loans alongside SSLP. This joint venture is expected to invest primarily in senior secured unitranche loans to middle market companies predominantly owned by private equity sponsors or entrepreneurs, consistent with the Company’s core origination and underwriting mandate. In addition to the Company’s prior equity commitment of $300.0 million to SSLP, Voya has made an initial equity commitment of $25.0 million to SSLP, with the ability to upsize.
On November 2, 2015, the Company assigned $125.0 million of its $300.0 million commitment to SSLP to Senior Secured Unitranche Loan Program II LLC (“SSLP II”), a Delaware limited liability company.
On November 25, 2015, SSLP commenced operations. On June 30, 2016, SSLP as transferor and SSLP 2016-1, LLC, a newly formed wholly owned subsidiary of SSLP, as borrower entered into a $200 million senior secured revolving credit facility (the “SSLP Facility”) with Wells Fargo Bank, NA acting as administrative agent. Solar Capital Ltd. acts as servicer under the SSLP Facility. The SSLP Facility is scheduled to mature on June 30, 2021. The SSLP Facility generally bears interest at a rate of LIBOR plus 2.50%. SSLP and SSLP 2016-1, LLC, as applicable, have made certain customary representations and warranties, and are required to comply
with various covenants, including leverage restrictions, reporting requirements and other customary requirements for similar credit facilities. The SSLP Facility also includes usual and customary events of default for credit facilities of this nature. There were $67.1 million of borrowings outstanding as of December 31, 2016. During the year ended December 31, 2016, using proceeds from the SSLP Facility, SSLP returned capital totaling $28.9 million and $4.1 million to the Company and Voya, respectively. As of December 31, 2014,2016 and December 31, 2015, the Company and Voya had contributed combined equity capital in the amount of $116.4 million and $92.2 million, respectively. Of the $116.4 million of contributed equity capital at December 31, 2016, the Company contributed $29.9 million in the form of investments and $72.0 million in the form of cash and Voya contributed $14.5 million in the form of cash. As of December 31, 2016, the Company and Voya’s remaining commitments to SSLP totaled $73.1 million and $10.5 million, respectively. The Company, along with Voya, controls the funding of SSLP and SSLP may not call the unfunded commitments without approval of both the Company and Voya.
As of December 31, 2016 and December 31, 2015, SSLP had total assets of $184.8 million and $92.5 million, respectively. For the same periods, SSLP’s portfolio consisted of floating rate senior secured loans to 11 and 4 different borrowers, respectively. For the year ended December 31, 2016, SSLP invested $89.4 million in 8 portfolio companies. Investments prepaid totaled $1.2 million for the year ended December 31, 2016. For the period from November 25, 2015 through December 31, 2015, SSLP invested $91.8 million in 4 portfolio companies. Investments prepaid totaled $0.1 million for the period from November 25, 2015 through December 31, 2015. At December 31, 2016 and December 31, 2015, the weighted average yield of SSLP’s portfolio was 7.4% and 8.5%, respectively, measured at fair value and 7.5% and 8.5%, respectively, measured at cost.
SSLP Portfolio as of December 31, 2016 (in thousands)
Description | Industry | Spread Above Index(1) | LIBOR Floor | Interest Rate(2) | Maturity Date | Par Amount | Cost | Fair Value(3) | ||||||||||||||||||||||
AccentCare, Inc. | Health Care Providers & Services | L+575 | 1.00 | % | 6.75 | % | 9/3/21 | $ | 4,875 | $ | 4,875 | $ | 4,875 | |||||||||||||||||
Alera Group Intermediate Holdings, Inc. | Insurance | L+550 | 1.00 | % | 6.50 | % | 12/30/22 | 13,824 | 13,686 | 13,686 | ||||||||||||||||||||
Associated Pathologists, LLC | Health Care Providers & Services | L+500 | 1.00 | % | 6.00 | % | 8/1/21 | 3,292 | 3,261 | 3,275 | ||||||||||||||||||||
CIBT Holdings, Inc. | Professional Services | L+525 | 1.00 | % | 6.25 | % | 6/28/22 | 13,102 | 12,979 | 12,971 | ||||||||||||||||||||
Empower Payments Acquisition, Inc. (RevSpring) | Professional Services | L+550 | 1.00 | % | 6.50 | % | 11/30/23 | 13,875 | 13,600 | 13,597 | ||||||||||||||||||||
Falmouth Group Holdings Corp. (AMPAC)(4) | Chemicals | L+675 | 1.00 | % | 7.75 | % | 12/14/21 | 34,650 | 34,202 | 34,650 | ||||||||||||||||||||
Pet Holdings ULC & Pet Supermarket, Inc. | Specialty Retail | L+550 | 1.00 | % | 6.50 | % | 7/5/22 | 20,625 | 20,336 | 20,367 | ||||||||||||||||||||
PPT Management Holdings, LLC | Health Care Providers & Services | L+600 | 1.00 | % | 7.00 | % | 12/16/22 | 12,000 | 11,881 | 11,880 | ||||||||||||||||||||
PSKW, LLC & PDR, LLC | Health Care Providers & Services | L+425 | 1.00 | % | 5.25 | % | 11/25/21 | 2,475 | 2,454 | 2,475 | ||||||||||||||||||||
PSKW, LLC & PDR, LLC | Health Care Providers & Services | L+839 | 1.00 | % | 9.39 | % | 11/25/21 | 22,250 | 21,866 | 21,861 | ||||||||||||||||||||
U.S. Anesthesia Partners Inc. | Health Care Providers & Services | L+500 | 1.00 | % | 6.00 | % | 12/31/19 | 19,557 | 19,407 | 19,362 | ||||||||||||||||||||
VetCor Professional Practices LLC | Health Care Facilities | L+625 | 1.00 | % | 7.25 | % | 4/20/21 | 21,818 | 21,686 | 21,491 | ||||||||||||||||||||
|
|
|
| |||||||||||||||||||||||||||
| $ | 180,233 | $ | 180,490 | |||||||||||||||||||||||||||
|
|
|
| |||||||||||||||||||||||||||
| (1) | Floating rate instruments accrue interest at a predetermined spread relative to an index, typically the LIBOR or PRIME rate. These instruments are typically subject to a LIBOR or PRIME rate floor. |
| (2) | Floating rate debt investments typically bear interest at a rate determined by reference to either the London Interbank Offered Rate (“LIBOR” or “L”) index rate or the prime index rate (PRIME or “P”), and which typically reset monthly, quarterly or semi-annually. For each debt investment we have provided the current interest rate in effect as of December 31, 2016. |
| (3) | Represents the fair value in accordance with ASC Topic 820. The determination of such fair value is not included in the Board’s valuation process described elsewhere herein. |
| (4) | The Company also holds this security on its Consolidated Statements of Assets and Liabilities. |
SSLP Portfolio as of December 31, 2015 (in thousands)
Description | Industry | Interest Rate(1) | Maturity Date | Par Amount | Cost | Fair Value(2) | ||||||||||||||||
Falmouth Group Holdings Corp. (AMPAC)(3) | Chemicals | 9.25 | % | 12/14/21 | $ | 35,000 | $ | 34,478 | $ | 34,475 | ||||||||||||
PSKW, LLC & PDR, LLC(3) | Health Care Providers & Services | 5.25 | % | 11/25/21 | 2,750 | 2,723 | 2,723 | |||||||||||||||
PSKW, LLC & PDR, LLC(3) | Health Care Providers & Services | 9.42 | % | 11/25/2 | 122,250 | 21,810 | 21,805 | |||||||||||||||
U.S. Anesthesia Partners Inc. | Health Care Providers & Services | 6.00 | % | 12/31/19 | 19,757 | 19,561 | 19,559 | |||||||||||||||
VetCor Professional Practices LLC | Health Care Facilities | 7.00 | % | 4/20/21 | 13,197 | 13,197 | 13,197 | |||||||||||||||
|
|
|
| |||||||||||||||||||
| $ | 91,769 | $ | 91,759 | |||||||||||||||||||
|
|
|
| |||||||||||||||||||
| (1) | Floating rate debt investments typically bear interest at a rate determined by reference to either the London Interbank Offered Rate (“LIBOR” or “L”) index rate or the prime index rate (PRIME or “P”), and which typically reset monthly, quarterly or semi-annually. For each debt investment we have provided the current interest rate in effect as of December 31, 2015. |
| (2) | Represents the fair value in accordance with ASC Topic 820. The determination of such fair value is not included in the Board’s valuation process described elsewhere herein. |
| (3) | The Company also holds a portion of this position on its Consolidated Statements of Assets and Liabilities. |
Below is certain summarized financial information for SSLP as of December 31, 2016 and December 31, 2015 and for the year ended December 31, 2016 and the period from November 25, 2015 through December 31, 2015:
| Selected Balance Sheet Information for SSLP (in thousands): | December 31, 2016 | December 31, 2015 | ||||||
Investments at fair value (cost $180,233 and $91,769, respectively) | $ | 180,490 | $ | 91,759 | ||||
Cash and other assets | 4,326 | 769 | ||||||
|
|
|
| |||||
Total assets | $ | 184,816 | $ | 92,528 | ||||
|
|
|
| |||||
Debt outstanding | $ | 67,148 | $ | — | ||||
Distributions payable | 1,688 | 253 | ||||||
Interest payable and other credit facility related expenses | 660 | — | ||||||
Accrued expenses and other payables | 287 | 72 | ||||||
|
|
|
| |||||
Total liabilities | $ | 69,783 | $ | 325 | ||||
|
|
|
| |||||
Members’ equity | $ | 115,033 | $ | 92,203 | ||||
|
|
|
| |||||
Total liabilities and members’ equity | $ | 184,816 | $ | 92,528 | ||||
|
|
|
| |||||
Interest income Service fees* Interest and other credit facility expenses** Other general and administrative expenses Total expenses Net investment income Net change in unrealized gain on investments Net income Selected Income Statement Information for SSLP (in thousands): Year ended
December 31,
2016 For the Period
November 25, 2015
(commencement of
operations) through
December 31,
2015 $ 9,187 $ 462 $ 84 $ 4 3,878 — 138 175 $ 4,100 $ 179 $ 5,087 $ 283 267 (10 ) $ 5,354 $ 273
| * | Service fees are included within the Company’s Consolidated Statements of Operations as other income. |
| ** | SSLP made an irrevocable election to apply the fair value option of accounting to the SSLP Facility, in accordance with ASC 825-10. As such, all expenses related to the establishment of the SSLP Facility were expensed during the year ended December 31, 2016. These amounts totaled $2,816. |
Senior Secured Unitranche Loan Program II LLC
On November 2, 2015, the Company assigned $125.0 million of its $300.0 million commitment to SSLP to SSLP II, a Delaware limited liability company. On August 5, 2016, the Company entered into an amended and restated limited liability company agreement with WFI Loanco, LLC (“WFI”) and SSLP II commenced operations. Also on August 5, 2016, the Company assigned approximately $50.0 million of its $125.0 million commitment to SSLP II to Senior Secured Unitranche Loan Program III LLC (“SSLP III”), a newly formed Delaware limited liability company. SSLP III, which has not commenced operations.operations, is currently wholly owned by Solar Capital Ltd. but may bring in unaffiliated investors at a later date. The Company and WFI’s equity commitments to SSLP II now total $75.0 million and $18.0 million, respectively.
On November 15, 2016, SSLP II as transferor and SSLP II 2016-1, LLC, a newly formed wholly owned subsidiary of SSLP II, as borrower entered into a $100 million senior secured revolving credit facility (the “SSLP II Facility”) with Wells Fargo Bank, NA acting as administrative agent. Solar Capital Ltd. acts as servicer under the SSLP II Facility. The SSLP II Facility is scheduled to mature on November 15, 2021. The SSLP II Facility generally bears interest at a rate of LIBOR plus 2.50%. SSLP II and SSLP II 2016-1, LLC, as applicable, have made certain customary representations and warranties, and are required to comply with various covenants, including leverage restrictions, reporting requirements and other customary requirements for similar credit facilities. The SSLP II Facility also includes usual and customary events of default for credit facilities of this nature. There were $33.0 million of borrowings outstanding as of December 31, 2016. During the period August 5, 2016 through December 31, 2016, using proceeds from the SSLP II Facility, SSLP II returned capital totaling $16.1 million and $3.9 million to the Company and WFI, respectively. As of December 31, 2016, the Company and WFI contributed combined equity capital in the amount of $47.0 million and $11.3 million, respectively. Of the $58.2 million of contributed equity capital at December 31, 2016, the Company contributed $43.5 million in the form of investments and $3.5 million in the form of cash and WFI contributed $11.3 million in the form of cash. As of December 31, 2016, the Company and WFI’s remaining commitments to SSLP II totaled $28.1 million and $6.7 million, respectively. The Company, along with WFI, controls the funding of SSLP II and SSLP II may not call the unfunded commitments without approval of both the Company and WFI.
As of December 31, 2016, SSLP II had total assets of $93.5 million. At December 31, 2016, SSLP II’s portfolio consisted of floating rate senior secured loans to 12 different borrowers. For the period August 5, 2016 through December 31, 2016, SSLP II invested $102.2 million in 12 portfolio companies. Investments prepaid totaled $12.1 million for the same period. At December 31, 2016, the weighted average yield of SSLP II’s portfolio was 7.6%, measured at fair value and 7.9%, measured at cost.
SSLP II Portfolio as of December 31, 2016 (in thousands)
Description | Industry | Spread Above Index(1) | LIBOR Floor | Interest Rate(2) | Maturity Date | Par Amount | Cost | Fair Value(3) | ||||||||||||||||||||||
Alera Group Intermediate Holdings, Inc. | Insurance | L+550 | 1.00 | % | 6.50 | % | 12/30/22 | $ | 5,184 | $ | 5,132 | $ | 5,132 | |||||||||||||||||
American Teleconferencing Services, Ltd. (PGI) (4) | Communications Equipment | L+650 | 1.00 | % | 7.50 | % | 12/8/21 | 14,619 | 13,244 | 14,217 | ||||||||||||||||||||
Associated Pathologists, LLC | Health Care Providers & Services | L+500 | 1.00 | % | 6.00 | % | 8/1/21 | 1,646 | 1,631 | 1,638 | ||||||||||||||||||||
CIBT Holdings, Inc. | Professional Services | L+525 | 1.00 | % | 6.25 | % | 6/28/22 | 5,241 | 5,191 | 5,188 | ||||||||||||||||||||
Empower Payments Acquisition, Inc. (RevSpring) | Professional Services | L+550 | 1.00 | % | 6.50 | % | 11/30/23 | 6,938 | 6,800 | 6,799 | ||||||||||||||||||||
Falmouth Group Holdings Corp. (AMPAC) (4) | Chemicals | L+675 | 1.00 | % | 7.75 | % | 12/14/21 | 10,945 | 10,945 | 10,945 | ||||||||||||||||||||
Pet Holdings ULC & Pet Supermarket, Inc. | Specialty Retail | L+550 | 1.00 | % | 6.50 | % | 7/5/22 | 9,075 | 8,947 | 8,962 | ||||||||||||||||||||
Polycom, Inc. | Communications Equipment | L+650 | 1.00 | % | 7.50 | % | 9/27/23 | 11,605 | 11,152 | 11,547 | ||||||||||||||||||||
PPT Management Holdings, LLC | Health Care Providers & Services | L+600 | 1.00 | % | 7.00 | % | 12/16/22 | 10,000 | 9,901 | 9,900 | ||||||||||||||||||||
PSKW, LLC & PDR, LLC | Health Care Providers & Services | L+425 | 1.00 | % | 5.25 | % | 11/25/21 | 990 | 990 | 990 | ||||||||||||||||||||
PSKW, LLC & PDR, LLC | Health Care Providers & Services | L+839 | 1.00 | % | 9.39 | % | 11/25/21 | 8,900 | 8,748 | 8,744 | ||||||||||||||||||||
U.S. Anesthesia Partners Inc. | Health Care Providers & Services | L+500 | 1.00 | % | 6.00 | % | 12/31/19 | 4,988 | 4,938 | 4,938 | ||||||||||||||||||||
VetCor Professional Practices LLC | Health Care Facilities | L+625 | 1.00 | % | 7.25 | % | 4/20/21 | 2,840 | 2,787 | 2,797 | ||||||||||||||||||||
|
|
|
| |||||||||||||||||||||||||||
| $ | 90,406 | $ | 91,797 | |||||||||||||||||||||||||||
|
|
|
| |||||||||||||||||||||||||||
| (1) | Floating rate instruments accrue interest at a predetermined spread relative to an index, typically the LIBOR or PRIME rate. These instruments are typically subject to a LIBOR or PRIME rate floor. |
| (2) | Floating rate debt investments typically bear interest at a rate determined by reference to either the London Interbank Offered Rate (“LIBOR” or “L”) index rate or the prime index rate (PRIME or “P”), and which typically reset monthly, quarterly or semi-annually. For each debt investment we have provided the current interest rate in effect as of December 31, 2016. |
| (3) | Represents the fair value in accordance with ASC Topic 820. The determination of such fair value is not included in the Board’s valuation process described elsewhere herein. |
| (4) | The Company also holds this security on its Consolidated Statements of Assets and Liabilities. |
Below is certain summarized financial information for SSLP II as of December 31, 2016 and for the period August 5, 2016 (commencement of operations) through December 31, 2016:
| Selected Balance Sheet Information for SSLP II (in thousands): | December 31, 2016 | |||
Investments at fair value (cost $90,406) | $ | 91,797 | ||
Cash and other assets | 1,670 | |||
|
| |||
Total assets | $ | 93,467 | ||
|
| |||
Debt outstanding | $ | 32,950 | ||
Distributions payable | 1,460 | |||
Interest payable and other credit facility related expenses | 147 | |||
Accrued expenses and other payables | 183 | |||
|
| |||
Total liabilities | $ | 34,740 | ||
|
| |||
Members’ equity | $ | 58,727 | ||
|
| |||
Total liabilities and members’ equity | $ | 93,467 | ||
|
| |||
| Selected Income Statement Information for SSLP II (in thousands): | For the period August 5, 2016 (commencement of operations) through December 31, 2016 | |||
Interest income | $ | 2,259 | ||
|
| |||
Service fees* | $ | 28 | ||
Interest and other credit facility expenses** | 1,536 | |||
Other general and administrative expenses | 130 | |||
|
| |||
Total expenses | $ | 1,694 | ||
|
| |||
Net investment income | $ | 565 | ||
|
| |||
Net change in unrealized gain on investments | 1,391 | |||
|
| |||
Net income | $ | 1,956 | ||
|
| |||
| * | Service fees are included within the Company’s Consolidated Statements of Operations as other income. |
| ** | SSLP II made an irrevocable election to apply the fair value option of accounting to the SSLP II Facility, in accordance with ASC 825-10. As such, all expenses related to the establishment of the SSLP II Facility were expensed during the year ended December 31, 2016. These amounts totaled $1,389. |
Stock Repurchase Program
On July 31, 2013, the Company’s board of directors authorized a program for the purpose of repurchasing up to $100 million of the Company’s common stock. Under the repurchase program, the Company could have, but was not obligated to, repurchase its outstanding common stock in the open market from time to time provided that the Company complied with the prohibitions under its Insider Trading Policies and Procedures and the guidelines specified in Rules 10b-18 and 10b-5 under the Securities Exchange Act of 1934, as amended, including certain price, market volume and timing constraints. On December 5, 2013, the Company’s board of directors extended the repurchase program to be in place until the earlier of July 31, 2014 or until $100 million of the Company’s outstanding shares of common stock had been repurchased. On July 31, 2014, the Company’s stock repurchase program expired. For the fiscal year ended December 31, 2014, the Company repurchased 1,779,033 shares at an average price of approximately $21.97 per share, inclusive of commissions. The total dollar amount of shares repurchased was $39.1 million. During the year ended December 31, 2013, the Company repurchased 796,418 shares at an average price of approximately $21.98 per share, inclusive of commissions, for a total dollar amount of $17.5 million.
On October 7, 2015, the Company announced a share repurchase program to purchase common stock in the open market in an amount up to $30 million. Under the repurchase program, the Company may, but is not obligated to, repurchase its outstanding common stock in the open market from time to time provided that the Company complies with the prohibitions under its Insider Trading Policies and Procedures and the guidelines specified in Rules 10b-18 and 10b-5 under the Securities Exchange Act of 1934, as amended, including certain price, market volume and timing constraints. On October 7, 2016 the Company’s stock repurchase program expired. For the fiscal year ended December 31, 2016, the Company repurchased 216,237 shares at an average price of $15.76 per share, inclusive of commissions. The total dollar amount of shares repurchased was $3.4 million. During the year ended December 31, 2015, the Company repurchased 400 shares at an average price of $15.98 per share, inclusive of commissions, for a total dollar amount of $6 thousand.
Critical Accounting Policies
The preparation of consolidated financial statements and related disclosures in conformity with GAAP requires management to make estimates and assumptions that affect the reported amounts of assets and liabilities, disclosure of contingent assets and liabilities at the date of the consolidated financial statements, and revenues and expenses during the periods reported. Actual results could materially differ from those estimates. We have identified the following items as critical accounting policies. Within the context of these critical accounting
policies and disclosed subsequent events herein, we are not currently aware of any other reasonably likely events or circumstances that would result in materially different amounts being reported.
Valuation of Portfolio Investments
We conduct the valuation of our assets, pursuant to which our net asset value is determined, at all times consistent with GAAP, and the 1940 Act. Our valuation procedures are set forth in more detail below:
Under procedures established by our board of directors (the “Board”), we value investments, including certain senior secured debt, subordinated debt and other debt securities with maturities greater than 60 days, for which market quotations are readily available, at such market quotations (unless they are deemed not to represent fair value). We attempt to obtain market quotations from at least two brokers or dealers (if available, otherwise from a principal market maker or a primary market dealer or other independent pricing service). We utilize mid-market pricing as a practical expedient for fair value unless a different point within the range is more representative. If and when market quotations are deemed not to represent fair value, we typically utilize independent third-party valuation firms to assist us in determining fair value. Accordingly, such investments go through our multi-step valuation process as described below. In each case, our independent valuation firms consider observable market inputs together with significant unobservable inputs in arriving at their valuation recommendations. Debt investments with maturities of 60 days or less shall each be valued at cost plus accreted discount, or minus amortized premium, which is expected to approximate fair value, unless such valuation, in the judgment of the Investment Adviser, does not represent fair value, in which case such investments shall be valued at fair value as determined in good faith by or under the direction of our Board. Investments that are not publicly traded or whose market quotations are not readily available are valued at fair value as determined in good faith by or under the direction of our Board. Such determination of fair values involves subjective judgments and estimates.
With respect to investments for which market quotations are not readily available or when such market quotations are deemed not to represent fair value, our Board has approved a multi-step valuation process each quarter, as described below:
| (1) | our quarterly valuation process begins with each portfolio company or investment being initially valued by the investment professionals of the Investment Adviser responsible for the portfolio investment; |
| (2) | preliminary valuation conclusions are then documented and discussed with senior management of the Investment Adviser; |
| (3) | independent valuation firms engaged by our Board conduct independent appraisals and review the Investment Adviser’s preliminary valuations and make their own independent |
| (4) | the audit committee of the Board reviews the preliminary valuation of the Investment Adviser and that of the independent valuation firm and responds to the valuation recommendation of the independent valuation firm to reflect any comments; and |
| (5) | the Board discusses valuations and determines the fair value of each investment in our portfolio in good faith based on the input of the Investment Adviser, the respective independent valuation firm and the audit committee. |
Investments in all asset classes are valued utilizing a market approach, an income approach, or both approaches, as appropriate. However, in accordance with ASC 820-10, certain investments that qualify as investment companies in accordance with ASC 946, may be valued using net asset value as a practical expedient for fair value. The market approach uses prices and other relevant information generated by market transactions involving identical or comparable assets or liabilities (including a business). The income approach uses valuation techniques to convert future amounts (for example, cash flows or earnings) to a single present amount (discounted). The measurement is based on the value indicated by current market expectations about those future amounts. In following these approaches, the types of factors that we may take into account in fair value pricing our investments include, as relevant: available current market data, including relevant and
applicable market trading and transaction comparables, applicable market yields and multiples, security covenants, call protection provisions, the nature and realizable value of any collateral, the portfolio company’s ability to make payments, its earnings and discounted cash flows, the markets in which the portfolio company does business, comparisons of financial ratios of peer companies that are public, M&A comparables, our principal market (as the reporting entity) and enterprise values, among other factors. When available, broker quotations and/or quotations provided by pricing services are considered as an input in the valuation process. Escrow receivables, if any, included in the receivables for investments sold in the Consolidated Statements of Assets and Liabilities are reviewed quarterly and the value of the receivable is adjusted as necessary. For the fiscal year ended December 31, 2014,2016, there has been no change to the Company’s valuation techniques and the nature of the related inputs considered in the valuation process.
Accounting Standards Codification (“ASC”) Topic 820 classifies the inputs used to measure these fair values into the following hierarchy:
Level 1: Quoted prices in active markets for identical assets or liabilities, accessible by the Company at the measurement date.
Level 2: Quoted prices for similar assets or liabilities in active markets, or quoted prices for identical or similar assets or liabilities in markets that are not active, or other observable inputs other than quoted prices.
Level 3: Unobservable inputs for the asset or liability.
In all cases, the level in the fair value hierarchy within which the fair value measurement in its entirety falls is determined based on the lowest level of input that is significant to the fair value measurement. Our assessment of the significance of a particular input to the fair value measurement in its entirety requires judgment and considers factors specific to each investment. The exercise of judgment is based in part on our knowledge of the asset class and our prior experience.
Determination of fair value involves subjective judgments and estimates. Accordingly, the notes to our consolidated financial statements express the uncertainty with respect to the possible effect of such valuations, and any change in such valuations, on our consolidated financial statements.
Valuation of Credit Facility, Senior Secured Credit FacilityNotes and Senior Secured2022 Unsecured Notes
The Company has made an irrevocable election to apply the fair value option of accounting to its Credit Facility, and its Senior Secured Notes and 2022 Unsecured Notes, in accordance with ASC 825-10. We believe accounting for the Credit Facility, and Senior Secured Notes and 2022 Unsecured Notes at fair value better aligns the measurement methodologies of assets and liabilities, which may mitigate certain earnings volatility.
Revenue Recognition
The Company records dividend income and interest, adjusted for amortization of premium and accretion of discount, on an accrual basis. Investments that are expected to pay regularly scheduled interest and/or dividends in cash are generally placed on non-accrual status when principal or interest/dividend cash payments are past due 30 days or more and/or when it is no longer probable that principal or interest/dividend cash payments will be collected. Such non-accrual investments are restored to accrual status if past due principal and interest or dividends are paid in cash, and in management’s judgment, are likely to continue timely payment of their remaining interest or dividend obligations. Interest or dividend cash payments received on investments may be recognized as income or applied to principal depending upon management’s judgment. Some of our investments may have contractual PIK interest or dividends. PIK interest and dividends computed at the contractual rate isare accrued into income and reflected as receivable up to the capitalization date. PIK investments offer issuers the option at each payment date of making payments in cash or in additional securities. When additional securities are received, they typically have the same terms, including maturity dates and interest rates as the original securities issued. On these payment dates, the Company capitalizes the accrued interest or dividends receivable (reflecting such amounts as the basis in the additional securities received). PIK generally becomes due at the maturity of the investment or upon the investment being called by the issuer. At the point the Company believes
PIK is not expected to be realized, the PIK investment will be placed on non-accrual status. When a PIK investment is placed on non-accrual status, the accrued, uncapitalized interest or dividends is reversed from the related receivable through interest or dividend income, respectively. The Company does not reverse previously capitalized PIK interest or dividends. Upon capitalization, PIK is subject to the fair value estimates associated with their related investments. PIK investments on non-accrual status are restored to accrual status if the Company again believes that PIK is expected to be realized. Loan origination fees, original issue discount, and market discounts are capitalized and amortized into income using the interest method or straight-line, as applicable. Upon the prepayment of a loan, any unamortized loan origination fees are recorded as interest income. We record prepayment premiums on loans and other investments as interest income when we receive such amounts. Capital structuring fees are recorded as other income when earned.
The typically higher yields and interest rates on PIK securities, to the extent we invested, reflects the payment deferral and increased credit risk associated with such instruments and that such investments may represent a significantly higher credit risk than coupon loans. PIK securities may have unreliable valuations because their continuing accruals require continuing judgments about the collectability of the deferred payments and the value of any associated collateral. PIK interest has the effect of generating investment income and increasing the incentive fees payable at a compounding rate. In addition, the deferral of PIK interest also increases the loan-to-value ratio at a compounding rate. PIK securities create the risk that incentive fees will be paid to the Investment Adviser based on non-cash accruals that ultimately may not be realized, but the Investment Adviser will be under no obligation to reimburse the Company for these fees. For the yearfiscal years ended December 31, 2016, 2015 and 2014, capitalized PIK income totaled $0.0 million, $0.5 million and $3.3 million.million, respectively.
Net Realized Gain or Loss and Net Change in Unrealized Gain or Loss
We generally measure realized gain or loss by the difference between the net proceeds from the repayment or sale and the amortized cost basis of the investment, without regard to unrealized appreciation or depreciation previously recognized, but considering unamortized origination or commitment fees and prepayment penalties.
The net change in unrealized gain or loss reflects the change in portfolio investment values during the reporting period, including the reversal of previously recorded unrealized gain or loss, when gains or losses are realized. Gains or losses on investments are calculated by using the specific identification method.
Income Taxes
Solar Capital, a U.S. corporation, has elected to be treated as a RIC under Subchapter M of the Code, as amended.Code. In order to qualify for taxation as a RIC, among other things, the Company is required, among other things, to timely distribute to its stockholders at least 90% of investment company taxable income, as defined by the Code, for each year. Depending on the level of taxable income earned in a given tax year, we may choose to carry forward taxable income in excess of current year distributions into the next tax year and pay a 4% excise tax on such income, as required. To the extent that the Company determines that its estimated current year annual taxable income will be in excess of estimated current year distributions, the Company accrues an estimated excise tax, if any, on estimated excess taxable income.
Recent Accounting Pronouncements
In February 2015, the FASB issued Accounting Standards Update (“ASU”) 2015-02, Consolidation (Topic 810) – Amendments to the Consolidation Analysis. The update changes the analysis that a reporting entity must perform to determine whether it should consolidate certain types of legal entities. Public companies are required to apply ASU 2015-02 for interim and annual reporting periods beginning after December 15, 2015. Accordingly, the Company has evaluated the impact of ASU 2015-02 on its consolidated financial statements and determined that the adoption of ASU 2015-02 has not had a material impact on our consolidated financial statements.
In April 2015, the FASB issued ASU 2015-03, Interest – Imputation of Interest (Subtopic 835-30) – Simplifying the Presentation of Debt Issuance Costs. The update requires that debt issuance costs related to a recognized debt liability be presented in the balance sheet as a direct deduction from the carrying amount of that debt liability, consistent with debt discounts. Public companies are required to apply ASU 2015-03 retrospectively for interim and annual reporting periods beginning after December 15, 2015. Accordingly, the Company has evaluated the impact of ASU 2015-03 on its consolidated financial statements and determined that the adoption of ASU 2015-03 has not had a material impact on our consolidated financial statements.
In May 2015, the FASB issued ASU 2015-07, Disclosures for Investments in Certain Entities That Calculate Net Asset Value per Share (or Its Equivalent). The update eliminates the requirement to categorize investments in the fair value hierarchy if their fair value is measured at net asset value (NAV) per share (or its equivalent) using the practical expedient in the FASB’s fair value measurement guidance. Public companies are required to apply ASU 2015-07 retrospectively for interim and annual reporting periods beginning after December 15, 2015. Accordingly, the Company has evaluated the impact of ASU 2015-07 on its consolidated financial statements and determined that the adoption of ASU 2015-07 has not had a material impact on our consolidated financial statements.
In November 2016, FASB issued ASU 2016-18, Statement of Cash Flows, which will amend FASB ASC 230. The amendments in this Update require that a statement of cash flows explain the change during the period in the total of cash, cash equivalents, and amounts generally described as restricted cash or restricted cash equivalents. Therefore, amounts generally described as restricted cash and restricted cash equivalents should be included with cash and cash equivalents when reconciling the beginning-of-period and end-of-period total amounts shown on the statement of cash flows. The amendments in this Update apply to all entities that have restricted cash or restricted cash equivalents and are required to present a statement of cash flows under Topic 230. For public business entities, the amendments are effective for fiscal years beginning after December 15, 2017, and interim periods within those fiscal years. Early adoption is permitted, including adoption in an interim period. The Company is evaluating the impact of ASU 2016-18 on its consolidated financial statements and disclosures.
In December 2016, the FASB issued ASU 2016-19, Technical Corrections and Improvements. As part of this guidance, ASU 2016-19 amends FASB ASC 820 to clarify the difference between a valuation approach and a valuation technique. The amendment also requires an entity to disclose when there has been a change in either or both a valuation approach and/or a valuation technique. ASU 2016-19 is effective on a prospective basis for financial statements issued for fiscal years, and interim periods within those fiscal years, beginning after December 31, 2014,15, 2016 on a prospective basis. The Company is evaluating the accrual for excise tax was $0.impact of ASU 2016-19 on its consolidated financial statements and disclosures.
RESULTS OF OPERATIONS
Results comparisons are for the fiscal years ended December 31, 2014,2016, December 31, 20132015 and December 31, 2012.2014.
Investment Income
For the fiscal years ended December 31, 2014, 20132016, 2015 and 2012,2014, gross investment income totaled $151.8 million, $115.6 million and $121.9 million, $163.6 millionrespectively. The increase in gross investment income from 2015 to 2016 was primarily due to a larger average income producing investment portfolio year over year, increased dividend income from the ongoing ramping of investments in SSLP and $153.3 million, respectively.SSLP II as well as an increased volume of repayments. The decrease in gross investment income from 20132014 to 20142015 was primarily due to a smallerreduction in prepayment fee income producing portfolio from the net effecta reduced volume of portfolio repayments, as well as portfolio yield compression. The increase in gross investment income from 2012 to 2013
was primarily due to an increase in income from our investment in Crystal Financial LLC, offset by modest portfolio yield compression and the net effect of portfolio repayments.
Expenses
ExpensesNet expenses totaled $55.2$80.7 million, $78.7$51.2 million and $71.3$55.2 million, respectively, for the fiscal years ended December 31, 2014, 20132016, 2015 and 2012,2014, of which $32.1$45.9 million, $48.0$27.4 million and $44.1$32.1 million, respectively, were base management fees and net performance-based incentive fees and $14.4$24.6 million, $20.1$15.6 million and $19.1$14.4 million, respectively, were interest and other credit facility expenses.expenses (inclusive of $3.1 million of costs related to the 2016 amendment of the Credit Facility and issuance of the 2022 Unsecured Notes in 2016). Over the same periods, $0.0 million, $1.7 million and $0.0 million of performance-based incentive fees were waived. Administrative services and other general and administrative expenses totaled $8.7$10.3 million, $10.2$8.2 million and $7.8$8.7 million, respectively, for the fiscal years ended December 31, 2014, 20132016, 2015 and 2012.2014. Expenses generally consist of management and performance-based incentive fees, administrative services fees, insurance expenses, legal fees, directors’ fees, transfer agency fees, printing and proxy expenses, audit and tax services expenses, and other general and administrative expenses. Interest and other credit facility expenses generally consist of interest, unused fees, agency fees and loan origination fees, if any, among others. The increase in expenses from 2015 to 2016 was primarily due to higher management fees, performance-based incentive fees and interest expense on a larger average income producing investment portfolio. The decrease in expenses from 20132014 to 20142015 was primarily due to a decrease in performance-based incentive fees on lower net investment income, as well as decreases in debt expenses due to lower average borrowings. The increase in expenses from 2012 to 2013 was primarily due to an increase in management and performance-based incentive fees on higher net investment income year over year and portfolio size, increases in debt expenses due to our Unsecured Notes outstanding for the full fiscal year, from the retirement of a revolving credit facility with Wells Fargo and the amendment of our Credit Facility, which lowered our interest rate and extended the maturity two years, as well as additional general and administrative expenses. Accrued excise tax expenses totaled $0.0 million, $0.4 million, and $0.3 million for the fiscal years ended December 31, 2014, 2013 and 2012.income.
Net Investment Income
The Company’s net investment income totaled $71.1 million, $64.4 million and $66.7 million, $84.9 millionor $1.68, $1.52 and $81.9 million, or $1.56, $1.91, and $2.20, per average share, respectively, for the fiscal years ended December 31, 2014, 20132016, 2015 and 2012.2014.
Net Realized LossGain (Loss)
The Company had investment sales and prepayments totaling approximately $626$488 million, $658$171 million and $325$626 million, respectively, for the fiscal years ended December 31, 2014, 20132016, 2015 and 2012.2014. Net realized lossesgains (losses) over the same periods were $36.8$0.8 million, $44.4($4.9) million and $32.5($36.8) million, respectively. Net realized gains for fiscal 2016 were related to the sale of select assets. Net realized losses for fiscal 2015 were primarily related to the realization of previously recognized unrealized losses on our investment in Quantum Foods. Net realized losses for fiscal 2014 were primarily related to the realization of previously recognized unrealized losses on our equity investments in Ark Real Estate, L.P. and Nuveen Investments, Inc. Net realized losses for fiscal 2013 were primarily related to the restructuring of our investment in Rug Doctor and the exit of our investment in DSW Group, Inc. Net realized losses incurred during fiscal year 2012 were primarily related to the restructuring of our investment in DSW Group, Inc. which reversed out previously recognized unrealized depreciation as well as the realization of previously recognized unrealized foreign exchange losses on our GBP denominated investment in Weetabix Group that was repaid in full at par during the fiscal year. As our foreign exchange risk was generally hedged, foreign currency gains were realized in prior periods.
Net Change in Unrealized Gain (Loss)
For the fiscal years ended December 31, 2014, 20132016, 2015 and 2012,2014, net change in unrealized gain (loss) on the Company’s assets and liabilities totaled $34.9 million, ($45.4) million and $18.6 million, $34.8 million,respectively. Net unrealized gain for the fiscal year ended December 31, 2016 was primarily related to appreciation in the value of our investments in Crystal Financial LLC, WireCo Worldgroup Inc., Global Tel*Link Corporation, Asurion LLC and $66.4 million, respectively.DISA Holdings, among others. Partially offsetting the net appreciation was depreciation in the value of our investments in Breathe Technologies, Inc., Senior Secured Unitranche Loan Program LLC and Rug Doctor, among others. Net unrealized loss for the fiscal year ended December 31, 2015 was primarily due to a yield-based mark-to-market technical impact on the fair value of our investments. Net unrealized gain for the fiscal year ended December 31, 2014 was primarily due to the reversal of unrealized depreciation on our investments in Ark Real Estate, L.P. and Nuveen Investments, Inc. Fiscal 2013’s net unrealized appreciation is due primarily to market improvements in our investments in Crystal Financial LLC and Nuveen Investments, Inc., as well as the reversal of unrealized depreciation on our investment in Rug Doctor. Partially offsetting the positive change in unrealized for 2013, was net unrealized depreciation in
our investments in Ark Real Estate. For the fiscal year ended December 31, 2012, net appreciation was driven by general market improvements, modest yield tightening as well as the reversal of unrealized depreciation on our investment in DSW Group, Inc. as the investment restructured during fiscal 2012.
Net Increase in Net Assets From Operations
For the fiscal years ended December 31, 2014, 20132016, 2015 and 2012,2014, the Company had a net increase in net assets resulting from operations of $48.5$106.8 million, $75.3$14.1 million and $115.8$48.5 million, respectively. For the fiscal years ended December 31, 2014, 20132016, 2015 and 2012,2014, earnings per average share were $1.13, $1.69$2.53, $0.33 and $3.11,$1.13, respectively.
LIQUIDITY AND CAPITAL RESOURCES
The Company’s liquidity and capital resources are generated and generally available through its Credit Facility maturing in June 2018,September 2021, through cash flows from operations, investment sales, prepayments of senior and subordinated loans, income earned on investments and cash equivalents, and periodic follow-on equity and/or debt offerings. As of December 31, 2014,2016, we had a total of $490.0$389.8 million of unused borrowing capacity under the Credit Facility, subject to borrowing base limits.
We may from time to time issue equity and/or debt securities in either public or private offerings. The issuance of such securities will depend on future market conditions, funding needs and other factors and there can be no assurance that any such issuance will occur or be successful. The primary uses of existing funds and any funds raised in the future is expected to be for investments in portfolio companies, repayment of indebtedness, cash distributions to our shareholders, or for other general corporate purposes.
On November 8, 2016, the Company closed a private offering of $50 million of the 2022 Unsecured Notes with a fixed interest rate of 4.40% and a maturity date of May 8, 2022. Interest on the 2022 Unsecured Notes is due semi-annually on May 8 and November 8. The 2022 Unsecured Notes were issued in a private placement only to qualified institutional buyers pursuant to Rule 144A under the Securities Act of 1933, as amended.
On January 11, 2013, the Company closed its most recent follow-on public equity offering of 6.3 million shares of common stock at $24.40 per share raising approximately $146.9 million in net proceeds. The primary uses of the funds raised were for investments in portfolio companies, reductions in revolving debt outstanding and for other general corporate purposes.
On November 16, 2012, we issued $100 million in aggregate principal amount of the 2042 Unsecured Notes for net proceeds of $96.9 million. Interest on the 2042 Unsecured Notes is paid quarterly on February 15, May 15, August 15 and November 15, at a rate of 6.75% per year, commencing on February 15, 2013. The 2042 Unsecured Notes mature on November 15, 2042. The Company may redeem the 2042 Unsecured Notes in whole or in part at any time or from time to time on or after November 15, 2017.
On May 10, 2012, the Company closed a private offering of $75 million of Senior Secured Notes with a fixed interest rate of 5.875% and a maturity date of May 10, 2017. Interest on the Senior Secured Notes is due semi-annually on May 10 and November 10. The Senior Secured Notes were issued in a private placement only to qualified institutional buyers pursuant to Rule 144A under the Securities Act of 1933, as amended.
The primary uses of existing funds and any funds raised in the future is expected to be for repayment of indebtedness, investments in portfolio companies, cash distributions to our shareholders or for other general corporate purposes.
Cash Equivalents
We deem certain U.S. Treasury bills, repurchase agreements and other high-quality, short-term debt securities as cash equivalents. The Company makes purchases that are consistent with its purpose of making investments in securities described in paragraphs 1 through 3 of Section 55(a) of the 1940 Act. From time to time, including at or near the end of each fiscal quarter, we consider using various temporary investment strategies for our business. One strategy includes taking proactive steps by utilizing cash equivalents as temporary assets with the objective of enhancing our investment flexibility pursuant to Section 55 of the 1940 Act. More specifically, from time-to-time we may purchase U.S. Treasury bills or other high-quality, short-term debt securities at or near the end of the quarter and typically close out the position on a net cash basis
subsequent to quarter end. We may also utilize repurchase agreements or other balance sheet transactions, including drawing down on our credit facilities, as deemed appropriate. The amount of these transactions or such drawn cash for this purpose is excluded from total assets for purposes of computing the asset base upon which the management fee is determined. We held approximately $490$310 million in cash equivalents as of December 31, 2014.2016.
Debt
Unsecured Notes
On November 8, 2016, the Company closed a private offering of $50 million of the 2022 Unsecured Notes with a fixed interest rate of 4.40% and a maturity date of May 8, 2022. Interest on the 2022 Unsecured Notes is due semi-annually on May 8 and November 8. The 2022 Unsecured Notes were issued in a private placement only to qualified institutional buyers pursuant to Rule 144A under the Securities Act of 1933, as amended.
On November 16, 2012, the Company and U.S. Bank National Association entered into an Indenture and a First Supplemental Indenture relating to the Company’s issuance, offer and sale of $100 million aggregate principal amount of its 2042 Unsecured Notes. The 2042 Unsecured Notes will mature on November 15, 2042 and may be redeemed in whole or in part at the Company’s option at any time or from time to time on or after November 15, 2017 at a redemption price of $25 per security plus accrued and unpaid interest. The 2042 Unsecured Notes bear interest at a rate of 6.75% per year payable quarterly on February 15, May 15, August 15 and November 15 of each year, commencing on February 15, 2013.year. The 2042 Unsecured Notes are direct senior unsecured obligations of the Company.
Revolving & Term Loan Facility
In July 2013,On September 30, 2016, the Company amended itsentered into a second Credit Facility amendment. The Credit Facility is currently composed of $440$505 million of revolving credit (of which $395 million represents extending lenders and $110 million represents non-extending lenders) and $50 million inof term loans. Subsequently, in December 2013, a commitment increase was executed providing an additional $50 million of revolving credit, bringing the total revolving credit capacity to $490 million. Borrowings generally bear interest at a rate per annum equal to the base rate plus 2.25%a range of 2.00-2.25% or the alternate base rate plus 1.25%a range of 1.00%-1.25%. The Credit Facility has no LIBOR floor requirement. The Credit Facility matures in June 2018September 2021 and includes ratable amortization in the final year. Assuming no default or event of default has occurred, the Company may elect by written notice to repay or prepay all of the loans of the non-extending lenders, and in connection therewith to terminate the commitments of the non-extending lenders, at any time on or prior to the original maturity date of the Credit Facility in June 2018. The Credit Facility may be increased up to $800 million with additional new lenders or an increase in commitments from current lenders. The Credit Facility contains certain customary affirmative and negative covenants and events of default. In addition, the Credit Facility contains certain financial covenants that among other things, requires the Company to maintain a minimum shareholder’s equity and a minimum asset coverage ratio. The Company also pays issuers of funded term loans quarterly in arrears a commitment fee at the rate of 0.25% per annum on the average daily outstanding balance. In conjunction with the establishment of the Credit Facility, the predecessor facility and a term loan were retired, resulting in $2.3 million of non-recurring charges to expense unamortized costs in the year ended December 31, 2012. Expenses associated with the July 2013 amendment of the Credit Facility and the retirementissue of our $100the 2022 Unsecured Notes, the Company expensed $2.8 million revolving credit facility with Wells Fargo Securities, LLC as well as the subsequent December 2013 commitment increase totaled $2.5 million.and $0.3 million, respectively. At December 31, 2014,2016, outstanding USD equivalent borrowings under the Credit Facility totaled $50 million in term loans.$165.2 million.
Senior Secured Notes
On May 10, 2012, the Company closed a private offering of $75 million of Senior Secured Notes with a fixed interest rate of 5.875% and a maturity date of May 10, 2017. Interest on the Senior Secured Notes is due semi-annually on May 10 and November 10. The Senior Secured Notes were issued in a private placement only to qualified institutional buyers pursuant to Rule 144A under the Securities Act of 1933, as amended.
Certain covenants on our issued debt may restrict our business activities, including limitations that could hinder our ability to finance additional loans and investments or to make the distributions required to maintain our status as a RIC under Subchapter M of the Code. At December 31, 2014,2016, the Company was in compliance with all financial and operational covenants required by the Credit Facilities.
Contractual Obligations
A summary of our significant contractual payment obligations is as follows as of December 31, 2014:2016:
Payments Due by Period (in millions)
| Total | Less than 1 Year | 1-3 Years | 3-5 Years | More Than 5 Years | Total | Less than 1 Year | 1-3 Years | 3-5 Years | More Than 5 Years | |||||||||||||||||||||||||||||||
Revolving credit facility(1) | $ | — | $ | — | $ | — | $ | — | $ | — | $ | 115.2 | $ | — | $ | — | $ | 115.2 | $ | — | ||||||||||||||||||||
Unsecured senior notes | 100.0 | — | — | — | 100.0 | 150.0 | — | — | — | 150.0 | ||||||||||||||||||||||||||||||
Senior secured notes | 75.0 | — | 75.0 | — | — | 75.0 | 75.0 | — | — | — | ||||||||||||||||||||||||||||||
Term Loans | 50.0 | — | — | 50.0 | — | 50.0 | — | — | 50.0 | — | ||||||||||||||||||||||||||||||
| (1) | As of December 31, |
Information about our senior securities is shown in the following table (in thousands) as of each year ended December 31 since the Company commenced operations, unless otherwise noted. The “—” indicates information which the SEC expressly does not require to be disclosed for certain types of senior securities.
Class and Year | Total Amount Outstanding(1) | Asset Coverage Per Unit(2) | Involuntary Liquidating Preference Per Unit(3) | Average Market Value Per Unit(4) | Total Amount Outstanding(1) | Asset Coverage Per Unit(2) | Involuntary Liquidating Preference Per Unit(3) | Average Market Value Per Unit(4) | ||||||||||||||||||||||||
Revolving Credit Facilities | ||||||||||||||||||||||||||||||||
Fiscal 2016 | $ | 115,200 | $ | 990 | — | N/A | ||||||||||||||||||||||||||
Fiscal 2015 | 207,900 | 1,459 | — | N/A | ||||||||||||||||||||||||||||
Fiscal 2014 | $ | 0 | $ | 0 | — | N/A | — | — | — | N/A | ||||||||||||||||||||||
Fiscal 2013 | 0 | 0 | — | N/A | — | — | — | N/A | ||||||||||||||||||||||||
Fiscal 2012 | 264,452 | 1,510 | — | N/A | 264,452 | 1,510 | — | N/A | ||||||||||||||||||||||||
Fiscal 2011 | 201,355 | 3,757 | — | N/A | 201,355 | 3,757 | — | N/A | ||||||||||||||||||||||||
Fiscal 2010 | 400,000 | 2,668 | — | N/A | 400,000 | 2,668 | — | N/A | ||||||||||||||||||||||||
Fiscal 2009 | 88,114 | 8,920 | — | N/A | 88,114 | 8,920 | — | N/A | ||||||||||||||||||||||||
Unsecured Senior Notes | ||||||||||||||||||||||||||||||||
2022 Unsecured Notes | ||||||||||||||||||||||||||||||||
Fiscal 2016 | $ | 50,000 | $ | 430 | — | N/A | ||||||||||||||||||||||||||
2042 Unsecured Notes | ||||||||||||||||||||||||||||||||
Fiscal 2016 | $ | 100,000 | $ | 859 | — | $ | 1,002 | |||||||||||||||||||||||||
Fiscal 2015 | 100,000 | 702 | — | 982 | ||||||||||||||||||||||||||||
Fiscal 2014 | $ | 100,000 | $ | 2,294 | — | $ | 943 | 100,000 | 2,294 | — | 943 | |||||||||||||||||||||
Fiscal 2013 | 100,000 | 2,411 | — | 934 | 100,000 | 2,411 | — | 934 | ||||||||||||||||||||||||
Fiscal 2012 | 100,000 | 571 | — | 923 | 100,000 | 571 | — | 923 | ||||||||||||||||||||||||
Senior Secured Notes | ||||||||||||||||||||||||||||||||
Fiscal 2016 | $ | 75,000 | $ | 645 | — | N/A | ||||||||||||||||||||||||||
Fiscal 2015 | 75,000 | 527 | — | N/A | ||||||||||||||||||||||||||||
Fiscal 2014 | $ | 75,000 | $ | 1,721 | — | N/A | 75,000 | 1,721 | — | N/A | ||||||||||||||||||||||
Fiscal 2013 | 75,000 | 1,808 | — | N/A | 75,000 | 1,808 | — | N/A | ||||||||||||||||||||||||
Fiscal 2012 | 75,000 | 428 | — | N/A | 75,000 | 428 | — | N/A | ||||||||||||||||||||||||
Term Loans | ||||||||||||||||||||||||||||||||
Fiscal 2016 | $ | 50,000 | $ | 430 | — | N/A | ||||||||||||||||||||||||||
Fiscal 2015 | 50,000 | 351 | — | N/A | ||||||||||||||||||||||||||||
Fiscal 2014 | $ | 50,000 | $ | 1,147 | — | N/A | 50,000 | 1,147 | — | N/A | ||||||||||||||||||||||
Fiscal 2013 | 50,000 | 1,206 | — | N/A | 50,000 | 1,206 | — | N/A | ||||||||||||||||||||||||
Fiscal 2012 | 50,000 | 285 | — | N/A | 50,000 | 285 | — | N/A | ||||||||||||||||||||||||
Fiscal 2011 | 35,000 | 653 | — | N/A | 35,000 | 653 | — | N/A | ||||||||||||||||||||||||
Fiscal 2010 | 35,000 | 233 | — | N/A | 35,000 | 233 | — | N/A | ||||||||||||||||||||||||
Total Senior Securities | ||||||||||||||||||||||||||||||||
Fiscal 2016 | $ | 390,200 | $ | 3,354 | — | N/A | ||||||||||||||||||||||||||
Fiscal 2015 | 432,900 | 3,039 | — | N/A | ||||||||||||||||||||||||||||
Fiscal 2014 | 225,000 | 5,162 | — | N/A | ||||||||||||||||||||||||||||
Fiscal 2013 | 225,000 | 5,425 | — | N/A | ||||||||||||||||||||||||||||
Fiscal 2012 | 489,452 | 2,794 | — | N/A | ||||||||||||||||||||||||||||
Fiscal 2011 | 236,355 | 4,410 | — | N/A | ||||||||||||||||||||||||||||
Fiscal 2010 | 435,000 | 2,901 | — | N/A | ||||||||||||||||||||||||||||
Fiscal 2009 | 88,114 | 8,920 | — | N/A | ||||||||||||||||||||||||||||
| (1) | Total amount of each class of senior securities outstanding at the end of the period presented. |
| (2) | The asset coverage ratio for a class of senior securities representing indebtedness is calculated as our consolidated total assets, less all liabilities and indebtedness not represented by senior securities, divided by |
| all senior securities representing indebtedness. This asset coverage ratio is multiplied by one thousand to determine the Asset Coverage Per Unit. In order to determine the specific Asset Coverage Per Unit for each class of debt, the total Asset Coverage Per Unit is allocated based on the amount outstanding in each class of debt at the end of the period. As of December 31, 2016, asset coverage was 335.4%. |
| (3) | The amount to which such class of senior security would be entitled upon the involuntary liquidation of the issuer in preference to any security junior to it. |
| (4) | Not applicable except for the Unsecured Senior Notes which are publicly traded. The Average Market Value Per Unit is calculated by taking the daily average closing price during the period and dividing it by twenty-five dollars per share and multiplying the result by one thousand to determine a unit price per thousand consistent with Asset Coverage Per Unit. The average market value for the fiscal 2016, 2015, 2014, 2013 and 2012 periods was $100,175, $98,196, $94,301, $93,392, and $92,302, respectively. |
We have also entered into two contracts under which we have future commitments: the Investment Advisory and Management Agreement, pursuant to which Solar Capital Partners, LLC has agreed to serve as our investment adviser, and the Administration Agreement, pursuant to which the Administrator has agreed to furnish us with the facilities and administrative services necessary to conduct our day-to-day operations and provide on our behalf managerial assistance to those portfolio companies to which we are required to provide such assistance. Payments under the Investment Advisory and Management Agreement are equal to (1) a percentage of the value of our average gross assets and (2) a two-part incentive fee. Payments under the Administration Agreement are equal to an amount based upon our allocable portion of the Administrator’s overhead in performing its obligations under the Administration Agreement, including rent, technology systems, insurance and our allocable portion of the costs of our chief financial officer and chief compliance officer and their respective staffs. Either party may terminate each of the investment advisory and management agreementAdvisory Agreement and administration agreement without penalty upon 60 days’ written notice to the other. See note 3 to our Consolidated Financial Statements.
On October 15, 2015, SSLP entered into an amended and restated servicing agreement with the Company. SSLP engaged and retained the Company to provide certain administrative services relating to the facilities, supplies and necessary ongoing overhead support services for the operation of SSLP’s ongoing business affairs in exchange for a fee. Either party may terminate this agreement upon 30 days’ written notice to the other.
On August 5, 2016, SSLP II entered into a servicing agreement with the Company. SSLP II engaged and retained the Company to provide certain administrative services relating to the facilities, supplies and necessary ongoing overhead support services for the operation of SSLP II’s ongoing business affairs in exchange for a fee. Either party may terminate this agreement upon 30 days’ written notice to the other.
Off-Balance Sheet Arrangements
The Company had unfunded equitydebt and debtequity commitments to various revolving and delayed draw loans as well as to Crystal Financial.Financial LLC. The total amount of these unfunded commitments as of December 31, 20142016 and December 31, 20132015 is $103.7$64.0 million and $15.0$65.8 million, respectively.respectively, comprised of the following:
| (in millions) | December 31, 2016 | December 31, 2015 | ||||||
Crystal Financial LLC | $ | 44.3 | $ | 50.0 | ||||
Conventus Orthopaedics, Inc | 2.2 | — | ||||||
Achaogen, Inc. | — | 10.0 | ||||||
AgaMatrix, Inc. | — | 3.3 | ||||||
aTyr Pharma, Inc | 5.0 | — | ||||||
CardioDx, Inc. | — | 2.5 | ||||||
SentreHeart, Inc | 2.5 | — | ||||||
Vapotherm, Inc | 10.0 | — | ||||||
|
|
|
| |||||
Total Commitments* | $ | 64.0 | $ | 65.8 | ||||
|
|
|
| |||||
| * | The Company controls the funding of the Crystal Financial LLC commitment and may cancel it at its discretion (also see Senior Secured Unitranche Loan Program and Senior Secured Unitranche Loan Program II sections in Item 7). |
As of December 31, 2016 and December 31, 2015, the Company had sufficient cash available and/or liquid securities available to fund its commitments as well as the commitments to SSLP and SSLP II disclosed earlier.
In the normal course of its business, we invest or trade in various financial instruments and may enter into various investment activities with off-balance sheet risk, which may include forward foreign currency contracts. Generally, these financial instruments represent future commitments to purchase or sell other financial instruments at specific terms at future dates. These financial instruments contain varying degrees of off-balance sheet risk whereby changes in the market value or our satisfaction of the obligations may exceed the amount recognized in our StatementConsolidated Statements of Assets and Liabilities.
Distributions
The following table reflects the cash distributions per share on our common stock for the two most recent fiscal years and the current fiscal year to date:
Date Declared | Record Date | Payment Date | Amount | |||||
Fiscal 2015 | ||||||||
February 25, 2015 | March 19, 2015 | April 2, 2015 | $ | 0.40 | ||||
|
| |||||||
Fiscal 2014 | ||||||||
November 4, 2014 | December 18, 2014 | January 5, 2015 | $ | 0.40 | ||||
August 4, 2014 | September 18, 2014 | October 1, 2014 | 0.40 | |||||
May 5, 2014 | June 19, 2014 | July 1, 2014 | 0.40 | |||||
February 25, 2014 | March 20, 2014 | April 1, 2014 | 0.40 | |||||
|
| |||||||
Total 2014 | $ | 1.60 | ||||||
|
| |||||||
Fiscal 2013 | ||||||||
October 30, 2013 | December 19, 2013 | January 3, 2014 | $ | 0.40 | ||||
July 24, 2013 | September 19, 2013 | October 2, 2013 | 0.40 | |||||
May 7, 2013 | June 20, 2013 | July 1, 2013 | 0.60 | |||||
February 25, 2013 | March 21, 2013 | April 2, 2013 | 0.60 | |||||
|
| |||||||
Total 2013 | $ | 2.00 | ||||||
|
| |||||||
Date Declared | Record Date | Payment Date | Amount | |||||||||
Fiscal 2017 | ||||||||||||
February 22, 2017 | March 23, 2017 | April 4, 2017 | $ | 0.40 | ||||||||
Fiscal 2016 | ||||||||||||
November 2, 2016 | December 15, 2016 | January 4, 2017 | $ | 0.40 | ||||||||
August 2, 2016 | September 22, 2016 | October 4, 2016 | 0.40 | |||||||||
May 3, 2016 | June 23, 2016 | July 1, 2016 | 0.40 | |||||||||
February 24, 2016 | March 24, 2016 | April 1, 2016 | 0.40 | |||||||||
Total 2016 | $ | 1.60 | ||||||||||
Fiscal 2015 | ||||||||||||
November 3, 2015 | December 17, 2015 | January 6, 2016 | $ | 0.40 | ||||||||
August 4, 2015 | September 24, 2015 | October 2, 2015 | 0.40 | |||||||||
May 5, 2015 | June 25, 2015 | July 1, 2015 | 0.40 | |||||||||
February 25, 2015 | March 19, 2015 | April 2, 2015 | 0.40 | |||||||||
Total 2015 | $ | 1.60 | ||||||||||
Tax characteristics of all distributions will be reported to shareholders on Form 1099 after the end of the calendar year. Future quarterly distributions, if any, will be determined by our Board. We expect that our distributions to stockholders will generally be from accumulated net investment income, from net realized capital gains or non-taxable return of capital, if any, as applicable.
We have elected to be taxed as a RIC under Subchapter M of the Code. To maintain our RIC status, we must distribute at least 90% of our ordinary income and realized net short-term capital gains in excess of realized net long-term capital losses, if any, out of the assets legally available for distribution. In addition, although we currently intend to distribute realized net capital gains (i.e., net long-term capital gains in excess of short-term capital losses), if any, at least annually, out of the assets legally available for such distributions, we may in the future decide to retain such capital gains for investment.
We maintain an “opt out” dividend reinvestment plan for our common stockholders. As a result, if we declare a distribution, then stockholders’ cash distributions will be automatically reinvested in additional shares of our common stock, unless they specifically “opt out” of the dividend reinvestment plan so as to receive cash distributions.
We may not be able to achieve operating results that will allow us to make distributions at a specific level or to increase the amount of these distributions from time to time. In addition, due to the asset coverage test applicable to us as a business development company, we may in the future be limited in our ability to make distributions. Also, our revolving credit facility may limit our ability to declare distributions if we default under certain provisions. If we do not distribute a certain percentage of our income annually, we will suffer adverse tax consequences, including possible loss of the tax benefits available to us as a regulated investment company. In addition, in accordance with GAAP and tax regulations, we include in income certain amounts that we have not yet received in cash, such as contractual payment-in-kind interest, which represents contractual interest added to the loan balance that becomes due at the end of the loan term, or the accrual of original issue or market discount. Since we may recognize income before or without receiving cash representing such income, we may have difficulty meeting the requirement to distribute at least 90% of our investment company taxable income to obtain tax benefits as a regulated investment company.
With respect to the distributions to stockholders, income from origination, structuring, closing and certain other upfront fees associated with investments in portfolio companies are treated as taxable income and accordingly, distributed to stockholders.
Related Parties
We have entered into a number of business relationships with affiliated or related parties, including the following:
We have entered into an Investmentthe Advisory and Management Agreement with the Investment Adviser.Solar Capital Partners. Mr. Gross, our chairmanChairman and chief executive officer, is aChief Executive Officer and Mr. Spohler, our Chief Operating Officer and board member, are managing membermembers and a senior investment professionalprofessionals of, and hashave financial and controlling interests in, the Investment Adviser. In addition, Mr. Spohler,Peteka, our chief operating officer is a partnerChief Financial Officer, Treasurer and a senior investment professional of, and has financial interests in,Corporate Secretary serves as the Investment Adviser.Chief Financial Officer for Solar Capital Partners.
The Administrator provides us with the office facilities and administrative services necessary to conduct day-to-day operations pursuant to our Administration Agreement. We reimburse the Administrator for the allocable portion of overhead and other expenses incurred by it in performing its obligations under the Administration Agreement, including rent, the fees and expenses associated with performing compliance functions, and the compensation of our chief compliance officer, our chief financial officer and any administrative support staff.
We have entered into a license agreement with the Investment Adviser, pursuant to which the Investment Adviser has granted us a non-exclusive, royalty-free license to use the name “Solar Capital.”
The Investment Adviser and its affiliates may also manage other funds in the future that may have investment mandates that are similar, in whole and in part, with ours. For example, the Investment Adviser presently serves as investment adviser to Solar Senior Capital Ltd., a publicly traded BDC, which focuses on investing primarily in senior secured loans, including first lien and second lien debt instruments. In addition, Michael S. Gross, our chairmanChairman and chief executive officer,Chief Executive Officer, Bruce Spohler, our chief operating officer,Chief Operating Officer, and Richard L. Peteka, our chief financial officer,Chief Financial Officer, serve in similar capacities for Solar Senior Capital Ltd. The Investment Adviser and certain investment advisory affiliates may determine that an investment is appropriate for us and for one or more of those other funds. In such event, depending on the availability of such investment and other appropriate factors, the Investment Adviser or its affiliates may determine that we should invest side-by-side with one or more other funds. Any such investments will be made only to the extent permitted by applicable law and interpretive positions of the SEC and its staff, and consistent with the Investment Adviser’s allocation procedures.
Related party transactions may occur between Solar Capital Ltd. and Crystal Financial LLC, between Solar Capital Ltd. and Senior Secured Unitranche Loan Program LLC, between Solar Capital Ltd. and SSLP 2016-1, LLC, between Solar Capital Ltd. and Senior Secured Unitranche Loan Program II LLC and between Solar Capital Ltd. and SSLP II 2016-1, LLC. These transactions may occur in the normal course of business. No administrative fees are paid to Solar Capital Partners by Crystal Financial LLC, Senior Secured Unitranche Loan Program LLC or Senior Secured Unitranche Loan Program II LLC.
In addition, we have adopted a formal code of ethics that governs the conduct of our officers and directors. Our officers and directors also remain subject to the duties imposed by both the 1940 Act and the Maryland General Corporation Law.
| Item 7A. | Quantitative and Qualitative Disclosure About Market Risk |
We are subject to financial market risks, including changes in interest rates. During the fiscal year ended December 31, 2014,2016, certain of the investments in our portfolio had floating interest rates. These floating rate investments were primarily based on floating LIBOR and typically have durations of one to three months after which they reset to current market interest rates. Additionally, some of these investments have LIBOR floors. The Company also has revolving credit facilities that are generally based on floating LIBOR. Assuming no changes to our balance sheet as of December 31, 2014,2016 and no new defaults by portfolio companies, a hypothetical one-quarter of one percent decrease in LIBOR on our floating rate assets and liabilities would approximately have no effect onnot change our net investment income per average share over the next twelve months. Assuming no changes to our balance sheet as of December 31, 2014,2016 and no new defaults by portfolio companies, a hypothetical one percent increase in LIBOR on our floating rate assets and liabilities would increase our net investment income by approximately threenine cents per average share over the next twelve months. However, we may hedge against interest rate fluctuations from time-to-time by using standard hedging instruments such as futures, options, swaps and forward contracts subject to the requirements of the 1940 Act. While hedging activities may insulate us against adverse changes in interest rates, they may also limit our ability to participate in theany benefits of certain changes in interest rates with respect to our portfolio of investments. At December 31, 2014,2016, we have no interest rate hedging instruments outstanding.
Increase (Decrease) in LIBOR | (0.25 | %) | 1.00 | % | (0.25%) | 1.00% | ||||||||||
Increase (Decrease) in Net Investment Income Per Share Per Year | $0.00 | $ | 0.03 | $0.00 | $0.09 |
We may also have exposure to foreign currencies (e.g., Canadian Dollars) through various investments. These investments are converted into U.S. dollars at the balance sheet date, exposing us to movements in foreign exchange rates. In order to reduce our exposure to fluctuations in foreign exchange rates, we may borrow from time-to-time in such currencies (e.g., Canadian Dollars) under our multi-currency revolving credit facility or enter into forward currency contracts.
| Item 8. | Financial Statements and Supplementary Data |
INDEX TO CONSOLIDATED FINANCIAL STATEMENTS
MANAGEMENT’S REPORT ON INTERNAL CONTROL OVER FINANCIAL REPORTING
Management is responsible for establishing and maintaining adequate internal control over financial reporting, and for performing an assessment of the effectiveness of internal control over financial reporting as of December 31, 2014.2016. Internal control over financial reporting is a process designed to provide reasonable assurance regarding the reliability of financial reporting and the preparation of financial statements for external purposes in accordance with generally accepted accounting principles. The Company’s internal control over financial reporting includes those policies and procedures that (i) pertain to assets of the Company; (ii) provide reasonable assurance that transactions are recorded as necessary to permit preparation of consolidated financial statements in accordance with generally accepted accounting principles, and that receipts and expenditures of the Company are being made only in accordance with authorizations of management and directors of the Company; and (iii) provide reasonable assurance regarding prevention or timely detection of unauthorized acquisition, use, or disposition of the Company’s assets that could have a material effect on the consolidated financial statements.
Management performed an assessment of the effectiveness of the Company’s internal control over financial reporting as of December 31, 20142016 based upon criteria inInternal Control – Integrated Framework (2013) issued by the Committee of Sponsoring Organizations of the Treadway Commission (“COSO”). Based on our assessment, management determined that the Company’s internal control over financial reporting was effective as of December 31, 20142016 based on the criteria onInternal Control – Integrated Framework (2013)issued by COSO.
The effectiveness of the Company’s internal control over financial reporting as of December 31, 20142016 has been audited by KPMG LLP, an independent registered public accounting firm, as stated in their report which appears herein.
Report of Independent Registered Public Accounting Firm
The Board of Directors and ShareholdersStockholders
Solar Capital Ltd.:
We have audited the accompanying consolidated statements of assets and liabilities, including the consolidated schedule of investments, of Solar Capital Ltd. (and subsidiaries) (the Company) as of December 31, 20142016 and 2013,2015, and the related consolidated statements of operations, changes in net assets, and cash flows for each of the years in thethree-year period ended December 31, 2014.2016. These consolidated financial statements are the responsibility of the Company’s management. Our responsibility is to express an opinion on these consolidated financial statements based on our audits.
We conducted our audits in accordance with the standards of the Public Company Accounting Oversight Board (United States). Those standards require that we plan and perform the audit to obtain reasonable assurance about whether the financial statements are free of material misstatement. An audit includes examining, on a test basis, evidence supporting the amounts and disclosures in the consolidated financial statements. Our procedures included confirmation of securities owned as of December 31, 2014,2016 and 2015, by correspondence with the custodian, portfolio companies or agents. An audit also includes assessing the accounting principles used and significant estimates made by management, as well as evaluating the overall financial statement presentation. We believe that our audits provide a reasonable basis for our opinion.
In our opinion, the consolidated financial statements referred to above present fairly, in all material respects, the financial position of Solar Capital Ltd. (and subsidiaries) as of December 31, 20142016 and 2013,2015, and the results of their operations, the changes in their net assets and cash flows for each of the years in thethree-year period ended December 31, 2014,2016, in conformity with U.S. generally accepted accounting principles.
We also have audited, in accordance with the standards of the Public Company Accounting Oversight Board (United States), Solar Capital Ltd.’s internal control over financial reporting as of December 31, 2014,2016, based on criteria established inInternal Control – Integrated Framework (1992)(2013) issued by the Committee of Sponsoring Organizations of the Treadway Commission (COSO), and our report dated February 25, 201522, 2017 expressed an unqualified opinion on the effectiveness of the Company’s internal control over financial reporting.
/s/ KPMG LLP
New York, New York
February 25, 201522, 2017
Report of Independent Registered Public Accounting Firm
On Internal Control Over Financial Reporting
The Board of Directors and ShareholdersStockholders
Solar Capital Ltd.:
We have audited Solar Capital Ltd.’s (the Company) internal control over financial reporting as of December 31, 2014,2016, based on criteria established inInternal Control – Integrated Framework (1992)(2013) issued by the Committee of Sponsoring Organizations of the Treadway Commission (COSO). Solar Capital Ltd.’s management is responsible for maintaining effective internal control over financial reporting and for its assessment of the effectiveness of internal control over financial reporting, included in the accompanying management’s annual report on internal control over financial reporting. Our responsibility is to express an opinion on the Company’s internal control over financial reporting based on our audit.
We conducted our audit in accordance with the standards of the Public Company Accounting Oversight Board (United States). Those standards require that we plan and perform the audit to obtain reasonable assurance about whether effective internal control over financial reporting was maintained in all material respects. Our audit included obtaining an understanding of internal control over financial reporting, assessing the risk that a material weakness exists, and testing and evaluating the design and operating effectiveness of internal control based on the assessed risk. Our audit also included performing such other procedures as we considered necessary in the circumstances. We believe that our audit provides a reasonable basis for our opinion.
A company’s internal control over financial reporting is a process designed to provide reasonable assurance regarding the reliability of financial reporting and the preparation of financial statements for external purposes in accordance with generally accepted accounting principles. A company’s internal control over financial reporting includes those policies and procedures that (1) pertain to the maintenance of records that, in reasonable detail, accurately and fairly reflect the transactions and dispositions of the assets of the company; (2) provide reasonable assurance that transactions are recorded as necessary to permit preparation of financial statements in accordance with generally accepted accounting principles, and that receipts and expenditures of the company are being made only in accordance with authorizations of management and directors of the company; and (3) provide reasonable assurance regarding prevention or timely detection of unauthorized acquisition, use, or disposition of the company’s assets that could have a material effect on the financial statements.
Because of its inherent limitations, internal control over financial reporting may not prevent or detect misstatements. Also, projections of any evaluation of effectiveness to future periods are subject to the risk that controls may become inadequate because of changes in conditions, or that the degree of compliance with the policies or procedures may deteriorate.
In our opinion, Solar Capital Ltd. maintained, in all material respects, effective internal control over financial reporting as of December 31, 2014,2016, based on criteria established inInternal Control – Integrated Framework (1992)(2013) issued by the Committee of Sponsoring Organizations of the Treadway Commission.Commission (COSO).
We also have audited, in accordance with the standards of the Public Company Accounting Oversight Board (United States), the consolidated statements of assets and liabilities, including the consolidated schedule of investments of Solar Capital Ltd. (and subsidiaries) as of December 31, 20142016 and 2013,2015, and the related consolidated statements of operations, changes in net assets and cash flows for each of the years in the three-year period ended December 31, 2014,2016 and our report dated February 25, 201522, 2017 expressed an unqualified opinion on those consolidated financial statements.
/s/ KPMG LLP
New York, New York
February 25, 201522, 2017
CONSOLIDATED STATEMENTS OF ASSETS AND LIABILITIES
(in thousands, except share amounts)
| December 31, 2014 | December 31, 2013 | December 31, 2016 | December 31, 2015 | |||||||||||||
Assets | ||||||||||||||||
Investments at fair value: | ||||||||||||||||
Companies less than 5% owned (cost: $659,552 and $688,685, respectively) | $ | 652,288 | $ | 680,720 | ||||||||||||
Companies 5% to 25% owned (cost: $8,511 and $7,789, respectively) | 4,646 | 7,789 | ||||||||||||||
Companies more than 25% owned (cost: $339,380 and $394,285, respectively) | 363,804 | 399,890 | ||||||||||||||
Companies less than 5% owned (cost: $815,955 and $926,055, respectively) | $ | 804,783 | $ | 886,788 | ||||||||||||
Companies 5% to 25% owned (cost: $8,511 and $8,511, respectively) | 777 | 1,233 | ||||||||||||||
Companies more than 25% owned (cost: $477,491 and $410,142, respectively) | 499,218 | 424,570 | ||||||||||||||
|
|
|
| |||||||||||||
Total investments (cost: $1,007,443 and $1,090,759, respectively) | 1,020,738 | 1,088,399 | ||||||||||||||
Cash and cash equivalents | 635,075 | 585,278 | ||||||||||||||
Foreign currency (cost: $275 and $1,702, respectively) | 265 | 1,701 | ||||||||||||||
Total investments (cost: $1,301,957 and $1,344,708, respectively) | 1,304,778 | 1,312,591 | ||||||||||||||
Cash | 2,152 | 2,587 | ||||||||||||||
Cash equivalents (cost: $309,894 and $274,983, respectively) | 309,894 | 274,983 | ||||||||||||||
Receivable for investments sold | 13,602 | 11,374 | ||||||||||||||
Interest receivable | 4,549 | 5,623 | 8,079 | 6,408 | ||||||||||||
Dividends receivable | 8,258 | 8,605 | 10,952 | 8,487 | ||||||||||||
Deferred financing costs | 3,263 | 3,300 | ||||||||||||||
Derivatives (see note 7) | — | — | ||||||||||||||
Receivable for investments sold | 13,138 | 14,870 | ||||||||||||||
Prepaid expenses and other assets | 1,048 | 666 | 1,090 | 874 | ||||||||||||
|
|
|
| |||||||||||||
Total assets | $ | 1,686,334 | $ | 1,708,442 | $ | 1,650,547 | $ | 1,617,304 | ||||||||
|
|
|
| |||||||||||||
Liabilities | ||||||||||||||||
Revolving credit facilities (see note 6 and 8) | $ | — | $ | — | ||||||||||||
Unsecured senior notes (see note 8) | 100,000 | 100,000 | ||||||||||||||
Senior secured notes (see note 6 and 8) | 75,000 | 75,000 | ||||||||||||||
Term loan (see note 6 and 8) | 50,000 | 50,000 | ||||||||||||||
Revolving credit facilities (see notes 6 and 8) | $ | 115,200 | $ | 207,900 | ||||||||||||
Unsecured senior notes due 2042 ($100,000 and $100,000 face amounts, respectively, reported net of unamortized debt issuance costs of $2,886 and $2,996, respectively. See note 8) | 97,114 | 97,004 | ||||||||||||||
Senior secured notes (see notes 6 and 8) | 75,000 | 75,000 | ||||||||||||||
Unsecured senior notes due 2022 (see notes 6 and 8) | 50,000 | — | ||||||||||||||
Term loan (see notes 6 and 8) | 50,000 | 50,000 | ||||||||||||||
Distributions payable | 16,986 | 17,698 | 16,899 | 16,986 | ||||||||||||
Payable for investments and cash equivalents purchased | 492,475 | 454,887 | ||||||||||||||
Payable for cash equivalents purchased | 309,894 | 274,983 | ||||||||||||||
Management fee payable (see note 3) | 6,109 | 5,780 | 6,870 | 6,523 | ||||||||||||
Performance-based incentive fee payable (see note 3) | 4,198 | 4,633 | 4,412 | 1,408 | ||||||||||||
Administrative services expense payable (see note 3) | 2,427 | 2,085 | 3,289 | 2,324 | ||||||||||||
Interest payable (see note 8) | 1,504 | 1,499 | 2,225 | 1,665 | ||||||||||||
Other liabilities and accrued expenses | 1,067 | 1,223 | 1,137 | 813 | ||||||||||||
|
|
|
| |||||||||||||
Total liabilities | $ | 749,766 | $ | 712,805 | $ | 732,040 | $ | 734,606 | ||||||||
|
|
|
| |||||||||||||
Commitments and contingencies (see note 14 and 15) | ||||||||||||||||
Commitments and contingencies (see notes 14, 15 & 16) | ||||||||||||||||
Net Assets | ||||||||||||||||
Common stock, par value $0.01 per share, 200,000,000 and 200,000,000 common shares authorized, respectively, and 42,465,162 and 44,244,195 shares issued and outstanding, respectively | $ | 425 | $ | 442 | ||||||||||||
Common stock, par value $0.01 per share, 200,000,000 and 200,000,000 common shares authorized, respectively, and 42,248,525 and 42,464,762 shares issued and outstanding, respectively | $ | 422 | $ | 425 | ||||||||||||
Paid-in capital in excess of par (see note 2f) | 991,963 | 1,110,545 | 989,732 | 993,991 | ||||||||||||
Distributions in excess of net investment income (see note 2f) | (8,599 | ) | (17,344 | ) | (11,847 | ) | (15,592 | ) | ||||||||
Accumulated net realized loss (see note 2f) | (60,506 | ) | (92,706 | ) | (62,621 | ) | (64,009 | ) | ||||||||
Net unrealized appreciation (depreciation) | 13,285 | (5,300 | ) | 2,821 | (32,117 | ) | ||||||||||
|
|
|
| |||||||||||||
Total net assets | $ | 936,568 | $ | 995,637 | $ | 918,507 | $ | 882,698 | ||||||||
|
|
|
| |||||||||||||
Net Asset Value Per Share | $ | 22.05 | $ | 22.50 | $ | 21.74 | $ | 20.79 | ||||||||
|
|
|
| |||||||||||||
See notes to consolidated financial statements.
CONSOLIDATED STATEMENTS OF OPERATIONS
(in thousands, except share amounts)
| Year ended December 31, | ||||||||||||||||||||||||
| Year ended December 31, 2014 | Year ended December 31, 2013 | Year ended December 31, 2012 | 2016 | 2015 | 2014 | |||||||||||||||||||
INVESTMENT INCOME: | ||||||||||||||||||||||||
Interest: | ||||||||||||||||||||||||
Companies less than 5% owned | $ | 84,791 | $ | 106,523 | $ | 126,903 | $ | 108,386 | $ | 78,498 | $ | 84,532 | ||||||||||||
Companies 5% to 25% owned | 564 | 6,333 | 5,228 | — | — | 564 | ||||||||||||||||||
Companies more than 25% owned | 3,349 | 10,728 | 4,314 | 1,835 | 2,604 | 3,333 | ||||||||||||||||||
Dividends: | ||||||||||||||||||||||||
Companies 5% to 25% owned | — | 5,565 | 14,948 | |||||||||||||||||||||
Companies less than 5% owned | 11 | 12 | — | |||||||||||||||||||||
Companies more than 25% owned | 40,649 | 33,947 | 33,233 | |||||||||||||||||||||
Other income: | ||||||||||||||||||||||||
Companies less than 5% owned | 828 | 477 | 259 | |||||||||||||||||||||
Companies more than 25% owned | 33,233 | 34,444 | 1,860 | 130 | 22 | 16 | ||||||||||||||||||
|
|
|
|
|
| |||||||||||||||||||
Total investment income | 121,937 | 163,593 | 153,253 | 151,839 | 115,560 | 121,937 | ||||||||||||||||||
|
|
|
|
|
| |||||||||||||||||||
EXPENSES: | ||||||||||||||||||||||||
Management fees (see note 3) | 24,651 | 26,794 | 23,647 | 28,115 | 24,678 | 24,651 | ||||||||||||||||||
Performance-based incentive fees (see note 3) | 7,411 | 21,234 | 20,481 | 17,775 | 4,374 | 7,411 | ||||||||||||||||||
Interest and other credit facility expenses (see note 8) | 14,448 | 20,051 | 19,080 | 24,571 | 15,598 | 14,448 | ||||||||||||||||||
Administrative services expense (see note 3) | 5,362 | 4,741 | 3,294 | 5,990 | 5,081 | 5,362 | ||||||||||||||||||
Other general and administrative expenses | 3,358 | 5,428 | 4,535 | 4,287 | 3,167 | 3,358 | ||||||||||||||||||
|
|
|
|
|
| |||||||||||||||||||
Total expenses | 55,230 | 78,248 | 71,037 | 80,738 | 52,898 | 55,230 | ||||||||||||||||||
Performance-based incentive fees waived (see note 3) | — | (1,694 | ) | — | ||||||||||||||||||||
|
|
|
|
|
| |||||||||||||||||||
Net investment income before income tax expense | 66,707 | 85,345 | 82,216 | |||||||||||||||||||||
Income tax expense | — | 410 | 289 | |||||||||||||||||||||
Net expenses | 80,738 | 51,204 | 55,230 | |||||||||||||||||||||
|
|
|
|
|
| |||||||||||||||||||
Net investment income | $ | 66,707 | $ | 84,935 | $ | 81,927 | $ | 71,101 | $ | 64,356 | $ | 66,707 | ||||||||||||
|
|
|
|
|
| |||||||||||||||||||
REALIZED AND UNREALIZED GAIN (LOSS) ON INVESTMENTS, CASH EQUIVALENTS, FOREIGN CURRENCIES AND DERIVATIVES: | ||||||||||||||||||||||||
Net realized gain (loss) on investments and cash equivalents: | ||||||||||||||||||||||||
Companies less than 5% owned | $ | (6,667 | ) | $ | (31,679 | ) | $ | (36,864 | ) | $ | 609 | $ | (3,510 | ) | $ | (6,667 | ) | |||||||
Companies 5% to 25% owned | 1,176 | (14,273 | ) | — | 197 | (1,163 | ) | 1,176 | ||||||||||||||||
Companies more than 25% owned | (25,337 | ) | 472 | 11,299 | (30 | ) | (147 | ) | (25,337 | ) | ||||||||||||||
|
|
|
|
|
| |||||||||||||||||||
Net realized loss on investments and cash equivalents | (30,828 | ) | (45,480 | ) | (25,565 | ) | ||||||||||||||||||
Net realized gain (loss) on investments and cash equivalents | 776 | (4,820 | ) | (30,828 | ) | |||||||||||||||||||
Net realized gain (loss) on foreign currencies and derivatives: | (6,012 | ) | 1,055 | (6,972 | ) | — | (54 | ) | (6,012 | ) | ||||||||||||||
|
|
|
|
|
| |||||||||||||||||||
Net realized loss | (36,840 | ) | (44,425 | ) | (32,537 | ) | ||||||||||||||||||
Net realized gain (loss) | 776 | (4,874 | ) | (36,840 | ) | |||||||||||||||||||
|
|
|
|
|
| |||||||||||||||||||
Net change in unrealized gain (loss) on investments and cash equivalents | 15,655 | 34,189 | 70,981 | 34,938 | (45,411 | ) | 15,655 | |||||||||||||||||
Net change in unrealized gain (loss) on foreign currencies and derivatives | 2,930 | 611 | (4,610 | ) | — | 9 | 2,930 | |||||||||||||||||
|
|
|
|
|
| |||||||||||||||||||
Net change in unrealized gain (loss) | 18,585 | 34,800 | 66,371 | 34,938 | (45,402 | ) | 18,585 | |||||||||||||||||
|
|
|
|
|
| |||||||||||||||||||
Net realized and unrealized gain (loss) on investments, cash equivalents, foreign currencies and derivatives | (18,255 | ) | (9,625 | ) | 33,834 | 35,714 | (50,276 | ) | (18,255 | ) | ||||||||||||||
|
|
|
|
|
| |||||||||||||||||||
NET INCREASE IN NET ASSETS RESULTING FROM OPERATIONS | $ | 48,452 | $ | 75,310 | $ | 115,761 | $ | 106,815 | $ | 14,080 | $ | 48,452 | ||||||||||||
|
|
|
|
|
| |||||||||||||||||||
EARNINGS PER SHARE (see note 5) | $ | 1.13 | $ | 1.69 | $ | 3.11 | $ | 2.53 | $ | 0.33 | $ | 1.13 | ||||||||||||
|
|
|
|
|
| |||||||||||||||||||
See notes to consolidated financial statements.
CONSOLIDATED STATEMENTS OF CHANGES IN NET ASSETS
(in thousands, except shares)share amounts)
| Year ended December 31, | ||||||||||||||||||||||||
| Year ended December 31, 2014 | Year ended December 31, 2013 | Year ended December 31, 2012 | 2016 | 2015 | 2014 | |||||||||||||||||||
Increase in net assets resulting from operations: | ||||||||||||||||||||||||
Net investment income | $ | 66,707 | $ | 84,935 | $ | 81,927 | $ | 71,101 | $ | 64,356 | $ | 66,707 | ||||||||||||
Net realized loss | (36,840 | ) | (44,425 | ) | (32,537 | ) | ||||||||||||||||||
Net realized gain (loss) | 776 | (4,874 | ) | (36,840 | ) | |||||||||||||||||||
Net change in unrealized gain (loss) | 18,585 | 34,800 | 66,371 | 34,938 | (45,402 | ) | 18,585 | |||||||||||||||||
|
|
|
|
|
| |||||||||||||||||||
Net increase in net assets resulting from operations | 48,452 | 75,310 | 115,761 | 106,815 | 14,080 | 48,452 | ||||||||||||||||||
|
|
|
|
|
| |||||||||||||||||||
Distributions to stockholders (see note 9a): | ||||||||||||||||||||||||
From net investment income | (66,383 | ) | (68,796 | ) | (84,596 | ) | (67,598 | ) | (67,944 | ) | (66,383 | ) | ||||||||||||
From net realized gains | — | (20,652 | ) | (5,770 | ) | |||||||||||||||||||
From other sources | (2,060 | ) | — | — | — | — | (2,060 | )† | ||||||||||||||||
|
|
|
|
|
| |||||||||||||||||||
Net distributions to stockholders | (68,443 | ) | (89,448 | ) | (90,366 | ) | (67,598 | ) | (67,944 | ) | (68,443 | ) | ||||||||||||
|
|
|
|
|
| |||||||||||||||||||
Capital transactions: | ||||||||||||||||||||||||
Net proceeds from shares sold | — | 146,857 | 45,020 | |||||||||||||||||||||
Repurchases of common stock | (39,078 | ) | (17,508 | ) | — | (3,408 | ) | (6 | ) | (39,078 | ) | |||||||||||||
Less offering costs | — | (61 | ) | (24 | ) | |||||||||||||||||||
Reinvestment of distributions | — | 2,214 | 1,941 | |||||||||||||||||||||
|
|
|
|
|
| |||||||||||||||||||
Net increase (decrease) in net assets resulting from capital transactions | (39,078 | ) | 131,502 | 46,937 | ||||||||||||||||||||
Net decrease in net assets resulting from capital transactions | (3,408 | ) | (6 | ) | (39,078 | ) | ||||||||||||||||||
|
|
|
|
|
| |||||||||||||||||||
Total increase (decrease) in net assets | (59,069 | ) | 117,364 | 72,332 | 35,809 | (53,870 | ) | (59,069 | ) | |||||||||||||||
Net assets at beginning of year | 995,637 | 878,273 | 805,941 | 882,698 | 936,568 | 995,637 | ||||||||||||||||||
|
|
|
|
|
| |||||||||||||||||||
Net assets at end of year(1) | $ | 936,568 | $ | 995,637 | $ | 878,273 | $ | 918,507 | $ | 882,698 | $ | 936,568 | ||||||||||||
|
|
|
|
|
| |||||||||||||||||||
Capital share activity: | ||||||||||||||||||||||||
Common stock sold | — | 6,253,226 | 2,000,000 | |||||||||||||||||||||
Common stock repurchased | (1,779,033 | ) | (796,418 | ) | — | (216,237 | ) | (400 | ) | (1,779,033 | ) | |||||||||||||
Common stock issued from reinvestment of distributions | — | 93,327 | 86,022 | |||||||||||||||||||||
|
|
|
|
|
| |||||||||||||||||||
Net increase (decrease) from capital share activity | (1,779,033 | ) | 5,550,135 | 2,086,022 | ||||||||||||||||||||
Net decrease from capital share activity | (216,237 | ) | (400 | ) | (1,779,033 | ) | ||||||||||||||||||
|
|
|
|
|
| |||||||||||||||||||
| † | Represents tax return of capital. |
| (1) | Includes undistributed (overdistributed) net investment income of ($ |
See notes to consolidated financial statements.
CONSOLIDATED STATEMENTS OF CASH FLOWS
(in thousands)
| Year ended December 31, | ||||||||||||||||||||||||
| Year ended December 31, 2014 | Year ended December 31, 2013 | Year ended December 31, 2012 | 2016 | 2015 | 2014 | |||||||||||||||||||
Cash Flows from Operating Activities: | ||||||||||||||||||||||||
Net increase in net assets from operations | $ | 48,452 | $ | 75,310 | $ | 115,761 | $ | 106,815 | $ | 14,080 | $ | 48,452 | ||||||||||||
Adjustments to reconcile net increase in net assets from operations: | ||||||||||||||||||||||||
Net realized loss on investments and cash equivalents | 30,828 | 45,480 | 25,565 | |||||||||||||||||||||
Adjustments to reconcile net increase in net assets from operations to net cash provided by (used in) operating activities: | ||||||||||||||||||||||||
Net realized (gain) loss on investments and cash equivalents | (776 | ) | 4,820 | 30,828 | ||||||||||||||||||||
Net realized (gain) loss on foreign currencies and derivatives | 6,012 | (1,055 | ) | 6,972 | — | 54 | 6,012 | |||||||||||||||||
Net change in unrealized gain (loss) on investments and cash equivalents | (15,655 | ) | (34,189 | ) | (70,981 | ) | ||||||||||||||||||
Net change in unrealized (gain) loss on investments and cash equivalents | (34,938 | ) | 45,411 | (15,655 | ) | |||||||||||||||||||
Net change in unrealized (gain) loss on foreign currencies and derivatives | (2,930 | ) | (611 | ) | 4,610 | — | (9 | ) | (2,930 | ) | ||||||||||||||
(Increase) decrease in operating assets: | ||||||||||||||||||||||||
Purchase of investments | (699,808 | ) | (333,867 | ) | (734,351 | ) | (438,030 | ) | (480,704 | ) | (699,808 | ) | ||||||||||||
Proceeds from disposition of investments | 749,074 | 587,386 | 415,771 | 480,975 | 139,044 | 749,074 | ||||||||||||||||||
Capitalization of payment-in-kind interest | (3,303 | ) | (11,863 | ) | (33,159 | ) | — | (469 | ) | (3,303 | ) | |||||||||||||
Collections of payment-in-kind interest | 3,443 | 55,842 | 35,726 | 582 | — | 3,443 | ||||||||||||||||||
Fee revenue receivable | — | — | 4,379 | |||||||||||||||||||||
Deferred offering costs | — | — | 19 | |||||||||||||||||||||
Receivable for investments sold | 1,732 | (14,870 | ) | 3,225 | (2,228 | ) | 1,764 | 1,732 | ||||||||||||||||
Interest receivable | 1,074 | 9,452 | (5,312 | ) | (1,671 | ) | (1,859 | ) | 1,074 | |||||||||||||||
Dividends receivable | 347 | (8,533 | ) | (72 | ) | (2,465 | ) | (229 | ) | 347 | ||||||||||||||
Prepaid expenses and other assets | (382 | ) | (199 | ) | 481 | (216 | ) | 174 | (382 | ) | ||||||||||||||
Increase (decrease) in operating liabilities: | ||||||||||||||||||||||||
Payable for investments and cash equivalents purchased | 37,588 | 433,131 | (687 | ) | 34,911 | (217,492 | ) | 37,588 | ||||||||||||||||
Management fee payable | 329 | (832 | ) | 1,335 | 347 | 414 | 329 | |||||||||||||||||
Performance-based incentive fees payable | (435 | ) | (1,417 | ) | 847 | 3,004 | (2,790 | ) | (435 | ) | ||||||||||||||
Deferred fee revenue | — | — | (318 | ) | ||||||||||||||||||||
Administrative services expense payable | 342 | 1,027 | (11 | ) | 965 | (103 | ) | 342 | ||||||||||||||||
Interest payable | 5 | (907 | ) | 1,343 | 560 | 161 | 5 | |||||||||||||||||
Other liabilities and accrued expenses | (156 | ) | (356 | ) | (183 | ) | 324 | (254 | ) | (156 | ) | |||||||||||||
|
|
|
|
|
| |||||||||||||||||||
Net Cash Provided by (Used In) Operating Activities | 156,557 | 798,929 | (229,040 | ) | ||||||||||||||||||||
Net Cash Provided by (Used in) Operating Activities | 148,159 | (497,987 | ) | 156,557 | ||||||||||||||||||||
|
|
|
|
|
| |||||||||||||||||||
Cash Flows from Financing Activities: | ||||||||||||||||||||||||
Cash distributions paid | (69,155 | ) | (92,753 | ) | (65,208 | ) | (67,685 | ) | (67,944 | ) | (69,155 | ) | ||||||||||||
Common stock offering costs | — | (61 | ) | (24 | ) | |||||||||||||||||||
Proceeds from issuance of unsecured debt | 50,000 | — | — | |||||||||||||||||||||
Deferred financing costs | 37 | 928 | (593 | ) | 110 | 267 | 37 | |||||||||||||||||
Proceeds from issuance of senior secured and unsecured notes | — | — | 175,000 | |||||||||||||||||||||
Net proceeds from common stock sold | — | 146,857 | 45,020 | |||||||||||||||||||||
Repurchase of common stock | (39,078 | ) | (17,508 | ) | — | (3,408 | ) | (6 | ) | (39,078 | ) | |||||||||||||
Proceeds from borrowings | — | 513,592 | 894,321 | |||||||||||||||||||||
Repayments of borrowings | — | (778,044 | ) | (816,224 | ) | |||||||||||||||||||
Proceeds from secured borrowings | 678,500 | 418,800 | — | |||||||||||||||||||||
Repayments of secured borrowings | (771,200 | ) | (210,900 | ) | — | |||||||||||||||||||
|
|
|
|
|
| |||||||||||||||||||
Net Cash Provided by (Used In) Financing Activities | (108,196 | ) | (226,989 | ) | 232,292 | |||||||||||||||||||
Net Cash Provided by (Used in) Financing Activities | (113,683 | ) | 140,217 | (108,196 | ) | |||||||||||||||||||
|
|
|
|
|
| |||||||||||||||||||
NET INCREASE IN CASH AND CASH EQUIVALENTS | 48,361 | 571,940 | 3,252 | |||||||||||||||||||||
NET INCREASE (DECREASE) IN CASH AND CASH EQUIVALENTS | 34,476 | (357,770 | ) | 48,361 | ||||||||||||||||||||
CASH AND CASH EQUIVALENTS AT BEGINNING OF YEAR | 586,979 | 15,039 | 11,787 | 277,570 | 635,340 | 586,979 | ||||||||||||||||||
|
|
|
|
|
| |||||||||||||||||||
CASH AND CASH EQUIVALENTS AT END OF YEAR | $ | 635,340 | $ | 586,979 | $ | 15,039 | $ | 312,046 | $ | 277,570 | $ | 635,340 | ||||||||||||
|
|
|
|
|
| |||||||||||||||||||
Supplemental disclosure of cash flow information: | ||||||||||||||||||||||||
Cash paid for interest | $ | 14,443 | $ | 20,958 | $ | 10,088 | $ | 24,011 | $ | 15,437 | $ | 14,443 | ||||||||||||
Cash paid for income taxes | $ | — | $ | 699 | $ | 938 | ||||||||||||||||||
|
|
| ||||||||||||||||||||||
Non-cash financing activities consist of $43,498 of investments transferred from the reinvestment of dividends of $0, $2,214 and $1,941 forCompany to Senior Secured Unitranche Loan Program II LLC during the fiscal yearsyear ended December 31, 2014, 20132016 and 2012, respectively.$29,884 of investments transferred from the Company to Senior Secured Unitranche Loan Program LLC during the fiscal year ended December 31, 2015 (see notes 15 & 16).
See notes to consolidated financial statements.
CONSOLIDATED SCHEDULE OF INVESTMENTS
December 31, 20142016
(in thousands)thousands, except share/unit amounts)
Description | Industry | Interest(1) | Maturity | Acquisition Date | Par Amount | Cost | Fair Value | |||||||||||||||||||
Bank Debt/Senior Secured | ||||||||||||||||||||||||||
Aegis Toxicology Sciences Corporation | Health Care Providers & Services | 9.50% | 8/24/2021 | 2/20/2014 | $ | 25,000 | $ | 24,710 | $ | 25,000 | ||||||||||||||||
Argo Turboserve Corporation & Argo Tech, LLC | Air Freight & Logistics | 8.49% | 5/2/2018 | 5/2/2014 | 10,450 | 10,450 | 10,319 | |||||||||||||||||||
Asurion, LLC | Insurance | 8.50% | 3/3/2021 | 2/27/2014 | 10,000 | 9,863 | 9,967 | |||||||||||||||||||
AviatorCap SII, LLC I(3) | Aerospace & Defense | 12.00% | 12/31/2016 | 5/31/2011 | 1,421 | 1,421 | 1,421 | |||||||||||||||||||
AviatorCap SII, LLC II(3) | Aerospace & Defense | 11.00% | 12/31/2016 | 8/23/2011 | 1,358 | 1,358 | 1,358 | |||||||||||||||||||
Bishop Lifting Products, Inc.(10) | Trading Companies & Distributors | 9.00% | 3/27/2022 | 3/24/2014 | 25,000 | 24,770 | 23,500 | |||||||||||||||||||
Blue Coat Systems, Inc. | Internet Software & Services | 9.50% | 6/28/2020 | 6/28/2013 | 20,500 | 20,327 | 20,193 | |||||||||||||||||||
Body Central Stores, Inc | Specialty Retail | 8.24% | 2/6/2017 | 2/6/2014 | 1,140 | 1,140 | 1,140 | |||||||||||||||||||
CAMP International Holding Company | Aerospace & Defense | 8.25% | 11/30/2019 | 12/2/2013 | 5,000 | 5,000 | 5,025 | |||||||||||||||||||
Datapipe, Inc | IT Services | 8.50% | 9/15/2019 | 8/14/2014 | 22,000 | 21,584 | 21,450 | |||||||||||||||||||
Direct Buy Inc.(4)** | Multiline Retail | 12.00% PIK | 10/31/2019 | 11/5/2012 | 8,767 | 8,511 | 4,646 | |||||||||||||||||||
DISA Holdings Acquisition Subsidiary Corp | Health Care Providers & Services | 9.50% | 6/9/2021 | 12/9/2014 | 51,476 | 50,709 | 50,704 | |||||||||||||||||||
Easyfinancial Services, Inc.(6)(7). | Consumer Finance | 8.50% | 10/4/2018 | 9/27/2012 | C$ | 10,000 | 9,261 | 8,696 | ||||||||||||||||||
Emerging Markets Communications, LLC | Wireless Telecommunication Services | 9.50% | 11/20/2020 | 5/20/2014 | $ | 27,000 | 26,561 | 26,528 | ||||||||||||||||||
Filtration Group Corp | Industrial Conglomerates | 8.25% | 11/21/2021 | 11/15/2013 | 6,000 | 5,946 | 6,008 | |||||||||||||||||||
Global Tel*Link Corporation | Communications Equipment | 9.00% | 11/23/2020 | 5/21/2013 | 18,500 | 18,174 | 18,161 | |||||||||||||||||||
Greystone Select Holdings LLC & Greystone & Co., Inc | Thrifts & Mortgage Finance | 9.00% | 3/26/2021 | 3/25/2014 | 9,925 | 9,873 | 9,925 | |||||||||||||||||||
Ikaria, Inc | Health Care Technology | 8.75% | 2/12/2022 | 2/4/2014 | 19,000 | 18,869 | 18,762 | |||||||||||||||||||
Infraredx, Inc | Health Care Equipment & Supplies | 9.50% | 10/1/2018 | 11/12/2014 | 10,000 | 9,817 | 9,925 | |||||||||||||||||||
Inmar Acquisition Sub, Inc | Professional Services | 8.00% | 1/27/2022 | 1/27/2014 | 10,000 | 9,908 | 9,900 | |||||||||||||||||||
K2 Pure Solutions NoCal, L.P | Chemicals | 10.00% | 8/19/2019 | 8/19/2013 | 11,356 | 11,169 | 11,356 | |||||||||||||||||||
Kore Wireless Group Inc | Wireless Telecommunication Services | 9.25% | 3/12/2021 | 9/12/2014 | 55,500 | 54,423 | 54,390 | |||||||||||||||||||
Landslide Holdings, Inc | Software | 8.25% | 2/25/2021 | 2/25/2014 | 16,300 | 16,276 | 16,055 | |||||||||||||||||||
Pharmedium Healthcare Corporation | Health Care Providers & Services | 7.75% | 1/28/2022 | 1/28/2014 | 5,000 | 4,978 | 5,000 | |||||||||||||||||||
Pronutria, Inc. | Pharmaceuticals | 9.66% | 5/15/2018 | 5/15/2014 | 7,000 | 6,969 | 6,930 | |||||||||||||||||||
Quantum Foods, LLC** | Food Products | 14.73% | 8/20/2014 | 2/20/2014 | 8,961 | 7,198 | 2,400 | |||||||||||||||||||
Radius Health, Inc.(7) | Pharmaceuticals | 10.01% | 6/01/2018 | 5/30/2014 | 12,500 | 12,368 | 12,500 | |||||||||||||||||||
Rug Doctor, LLC(3) | Diversified Consumer Services | 11.25% | 6/30/2017 | 12/23/2013 | 9,111 | 8,685 | 9,020 | |||||||||||||||||||
SOINT, LLC(3) | Aerospace & Defense | 15.00% | 6/30/2016 | 6/8/2012 | 8,733 | 8,654 | 8,733 | |||||||||||||||||||
Southern Auto Finance Company(7)(8) | Consumer Finance | 11.00% | 12/4/2018 | 10/19/2011 | 25,000 | 24,665 | 24,750 | |||||||||||||||||||
Syndax Pharmaceuticals, Inc | Pharmaceuticals | 8.96% | 6/13/2018 | 9/25/2014 | 9,000 | 8,929 | 8,914 | |||||||||||||||||||
T2 Biosystems, Inc.(7) | Health Care Equipment & Supplies | 7.21% | 7/1/2019 | 7/11/2014 | 16,667 | 16,625 | 16,667 | |||||||||||||||||||
The Robbins Company TLA | Construction & Engineering | 11.74% | 5/31/2017 | 5/31/2013 | 12,234 | 12,973 | 12,973 | |||||||||||||||||||
The Robbins Company TLB | Construction & Engineering | 11.74% | 4/25/2015 | 5/31/2013 | 3,528 | 3,502 | 3,598 | |||||||||||||||||||
TierPoint, LLC | IT Services | 8.75% | 12/2/2022 | 12/2/2014 | 25,000 | 24,751 | 24,750 | |||||||||||||||||||
TMK Hawk Parent, Corp. (TriMark) | Trading Companies and Distributors | 8.50% | 10/1/2022 | 9/26/2014 | 20,000 | 19,804 | 19,800 | |||||||||||||||||||
Trevi Therapeutics, Inc | Pharmaceuticals | 7.91% | 6/29/2018 | 12/292014 | 2,500 | 2,481 | 2,481 | |||||||||||||||||||
U.S. Anesthesia Partners, Inc TL | Health Care Providers & Services | 6.00% | 12/31/2019 | 9/24/2014 | 19,950 | 19,855 | 19,751 | |||||||||||||||||||
U.S. Anesthesia Partners, Inc TLB | Health Care Providers & Services | 9.00% | 9/24/2020 | 9/24/2014 | 30,000 | 29,710 | 29,700 | |||||||||||||||||||
Varilease Finance, Inc | Multi-Sector Holdings | 9.25% | 8/24/2020 | 8/22/2014 | 28,000 | 27,532 | 27,510 | |||||||||||||||||||
|
|
|
| |||||||||||||||||||||||
Total Bank Debt/Senior Secured Loans |
| $ | 609,799 | $ | 599,906 | |||||||||||||||||||||
|
|
|
| |||||||||||||||||||||||
Description | Industry | Spread Above Index(10) | LIBOR Floor | Interest Rate(1) | Acquisition Date | Maturity Date | Par Amount | Cost | Fair Value | |||||||||||||||||||||||||||
Bank Debt/Senior Secured Loans — 85.8% | ||||||||||||||||||||||||||||||||||||
AccentCare, Inc | Health Care Providers & Services | L+950 | 1.00 | % | 10.50 | % | 9/3/2015 | 9/3/2022 | $ | 17,500 | $ | 17,235 | $ | 17,369 | ||||||||||||||||||||||
Achaogen, Inc.(6) | Pharmaceuticals | L+699 | 1.00 | % | 7.99 | % | 8/5/2015 | 8/5/2019 | 25,000 | 25,297 | 25,625 | |||||||||||||||||||||||||
Aegis Toxicology Sciences Corporation | Health Care Providers & Services | L+850 | 1.00 | % | 9.50 | % | 2/20/2014 | 8/24/2021 | 29,000 | 28,731 | 27,115 | |||||||||||||||||||||||||
AgaMatrix, Inc | | Health Care Equipment & Supplies | | L+835 | — | 9.00 | % | 2/6/2015 | 2/1/2019 | 8,667 | 8,708 | 8,753 | ||||||||||||||||||||||||
AirXpanders, Inc. | | Health Care Equipment & Supplies | | — | — | 7.34 | % | 4/22/2016 | 7/14/2017 | 1,000 | 1,015 | 1,025 | ||||||||||||||||||||||||
American Teleconferencing Services, Ltd. (PGI) | Communications Equipment | L+650 | 1.00 | % | 7.50 | % | 5/5/2016 | 12/8/2021 | 5,591 | 5,081 | 5,437 | |||||||||||||||||||||||||
Amerilife Group, LLC | Insurance | L+875 | 1.00 | % | 9.75 | % | 7/9/2015 | 1/10/2023 | 15,000 | 14,742 | 14,700 | |||||||||||||||||||||||||
Argo Turboserve Corporation & Argo Tech, LLC | Air Freight & Logistics | L+1025 | — | 11.19 | % | 5/2/2014 | 5/2/2018 | 12,330 | 12,330 | 12,206 | ||||||||||||||||||||||||||
Asurion, LLC | Insurance | L+750 | 1.00 | % | 8.50 | % | 2/27/2014 | 3/3/2021 | 3,360 | 3,140 | 3,422 | |||||||||||||||||||||||||
aTyr Pharma, Inc | Pharmaceuticals | P+410 | — | 7.60 | % | 11/18/2016 | 11/18/2020 | 5,000 | 4,896 | 4,880 | ||||||||||||||||||||||||||
AviatorCap SII, LLC I(3) | Aerospace & Defense | — | — | 12.00 | % | 5/31/2011 | 1/31/2019 | 497 | 497 | 497 | ||||||||||||||||||||||||||
Axcella Health Inc | Pharmaceuticals | L+880 | — | 9.41 | % | 8/7/2015 | 8/31/2019 | 20,000 | 20,151 | 20,100 | ||||||||||||||||||||||||||
Bishop Lifting Products, Inc.(8) | | Trading Companies & Distributors | | L+800 | 1.00 | % | 9.00 | % | 3/24/2014 | 3/27/2022 | 25,000 | 24,827 | 20,500 | |||||||||||||||||||||||
Breathe Technologies, Inc | | Health Care Equipment & Supplies | | L+830 | — | 8.91 | % | 11/5/2015 | 11/5/2019 | 15,000 | 15,089 | 12,750 | ||||||||||||||||||||||||
CardioDx, Inc | Health Care Providers & Services | P+670 | — | 10.45 | % | 6/18/2015 | 4/1/2019 | 7,000 | 7,205 | 6,860 | ||||||||||||||||||||||||||
Cardiva Medical, Inc | | Health Care Equipment & Supplies | | L+870 | — | 9.31 | % | 8/19/2015 | 8/19/2019 | 8,500 | 8,645 | 8,585 | ||||||||||||||||||||||||
CAS Medical Systems, Inc | | Health Care Equipment & Supplies | | L+875 | — | 9.36 | % | 6/30/2016 | 7/1/2020 | 6,000 | 6,003 | 6,000 | ||||||||||||||||||||||||
Cerapedics, Inc | | Health Care Equipment & Supplies | | — | — | 8.68-8.78 | % | 4/22/2016 | 3/1/2019 | 6,394 | 6,181 | 6,394 | ||||||||||||||||||||||||
Cianna Medical, Inc | | Health Care Equipment & Supplies | | L+900 | — | 9.61 | % | 9/28/2016 | 9/28/2020 | 6,000 | 5,988 | 6,000 | ||||||||||||||||||||||||
Clinical Ink, Inc | Health Care Technology | L+850 | 0.70 | % | 9.20 | % | 3/8/2016 | 3/8/2020 | 6,500 | 6,490 | 6,435 | |||||||||||||||||||||||||
Conventus Orthopaedics, Inc | | Health Care Equipment & Supplies | | L+865 | — | 9.28 | % | 6/15/2016 | 6/1/2020 | 5,250 | 5,182 | 5,198 | ||||||||||||||||||||||||
Datapipe, Inc | IT Services | L+800 | 1.00 | % | 9.00 | % | 8/14/2014 | 9/15/2019 | 27,000 | 26,629 | 26,892 | |||||||||||||||||||||||||
Delphinus Medical Technologies, Inc | | Health Care Equipment & Supplies | | — | — | 9.25-9.30 | % | 4/22/2016 | 2/23/2017 | 400 | 434 | 420 | ||||||||||||||||||||||||
Direct Buy Inc.(4)** | Multiline Retail | — | — | 12.00% PIK | 11/5/2012 | 10/31/2019 | 11,105 | 8,511 | 777 | |||||||||||||||||||||||||||
DISA Holdings Acquisition Subsidiary Corp | Professional Services | L+850 | 1.00 | % | 9.50 | % | 12/9/2014 | 6/9/2021 | 51,476 | 50,898 | 50,704 | |||||||||||||||||||||||||
Easyfinancial Services, Inc.(5)(6) | Consumer Finance | BA+699 | 1.00 | % | 7.99 | % | 9/27/2012 | 10/4/2019 | C$ | 10,000 | 9,261 | 7,410 | ||||||||||||||||||||||||
Emerging Markets Communications, LLC | | Wireless Telecommunication Services | | L+962.5 | 1.00 | % | 10.63 | % | 6/29/2015 | 7/1/2022 | $ | 27,000 | 26,658 | 27,000 | ||||||||||||||||||||||
Entegrion, Inc | | Health Care Equipment & Supplies | | — | — | 10.03 | % | 4/22/2016 | 4/1/2017 | 400 | 414 | 412 | ||||||||||||||||||||||||
Falmouth Group Holdings Corp. (AMPAC) | Chemicals | L+675 | 1.00 | % | 7.75 | % | 12/7/2015 | 12/14/2021 | 10,164 | 10,114 | 10,164 | |||||||||||||||||||||||||
Global Tel*Link Corporation | Communications Equipment | L+375 | 1.25 | % | 5.00 | % | 11/6/2015 | 5/23/2020 | 7,328 | 5,978 | 7,310 | |||||||||||||||||||||||||
Global Tel*Link Corporation | Communications Equipment | L+775 | 1.25 | % | 9.00 | % | 5/21/2013 | 11/23/2020 | 18,500 | 18,265 | 18,012 | |||||||||||||||||||||||||
Greystone Select Holdings LLC & Greystone & Co., Inc | Thrifts & Mortgage Finance | L+800 | 1.00 | % | 9.00 | % | 3/25/2014 | 3/26/2021 | 9,680 | 9,642 | 9,559 | |||||||||||||||||||||||||
Hyland Software, Inc | Software | L+725 | 1.00 | % | 8.25 | % | 6/12/2015 | 6/30/2023 | 5,000 | 4,979 | 5,000 | |||||||||||||||||||||||||
IHS Intermediate, Inc | Health Care Providers & Services | L+825 | 1.00 | % | 9.25 | % | 6/19/2015 | 7/20/2022 | 25,000 | 24,578 | 24,125 | |||||||||||||||||||||||||
Inmar Acquisition Sub, Inc | Professional Services | L+700 | 1.00 | % | 8.00 | % | 1/27/2014 | 1/27/2022 | 10,000 | 9,929 | 9,850 | |||||||||||||||||||||||||
K2 Pure Solutions NoCal, L.P | Chemicals | L+900 | 1.00 | % | 10.00 | % | 8/19/2013 | 2/19/2021 | 7,475 | 7,398 | 7,176 | |||||||||||||||||||||||||
Kore Wireless Group, Inc | | Wireless Telecommunication Services | | L+825 | 1.00 | % | 9.25 | % | 9/12/2014 | 3/12/2021 | 55,500 | 54,704 | 54,945 | |||||||||||||||||||||||
Lumeris Solutions Company, LLC | Health Care Technology | — | — | 9.42 | % | 4/22/2016 | 12/27/2017 | 8,296 | 8,458 | 8,379 | ||||||||||||||||||||||||||
Mitralign, Inc | | Health Care Equipment & Supplies | | — | — | 9.48 | % | 4/22/2016 | 12/1/2018 | 1,667 | 1,604 | 1,658 | ||||||||||||||||||||||||
Nabsys 2.0 LLC | Life Sciences Tools & Services | — | — | 8.90 | % | 4/22/2016 | 10/13/2018 | 5,064 | 4,959 | 5,115 | ||||||||||||||||||||||||||
PhyMed Management LLC | Health Care Providers & Services | L+875 | 1.00 | % | 9.75 | % | 12/18/2015 | 5/18/2021 | 32,321 | 31,222 | 31,190 | |||||||||||||||||||||||||
PQ Bypass, Inc. | | Health Care Equipment & Supplies | | L+885 | — | 9.46 | % | 4/21/2016 | 4/21/2020 | 5,000 | 4,933 | 4,950 | ||||||||||||||||||||||||
Rapid Micro Biosystems, Inc. | Life Sciences Tools & Services | L+880 | — | 9.42 | % | 6/30/2015 | 6/30/2019 | 16,000 | 16,331 | 15,760 | ||||||||||||||||||||||||||
Rug Doctor LLC(3) | Diversified Consumer Services | L+975 | 1.50 | % | 11.25 | % | 12/23/2013 | 12/31/2018 | 9,111 | 8,927 | 9,111 | |||||||||||||||||||||||||
Salient Partners, L.P | Asset Management | L+850 | 1.00 | % | 9.50 | % | 6/10/2015 | 6/9/2021 | 14,993 | 14,757 | 14,619 | |||||||||||||||||||||||||
See notes to consolidated financial statements.
SOLAR CAPITAL LTD.
CONSOLIDATED SCHEDULE OF INVESTMENTS (continued)
December 31, 20142016
(in thousands, except share/unit amounts)
Description | Industry | Spread Above Index(10) | LIBOR Floor | Interest Rate(1) | Acquisition Date | Maturity Date | Par Amount | Cost | Fair Value | |||||||||||||||||||||||||||
Scynexis, Inc | Pharmaceuticals | L+849 | — | 9.12 | % | 9/30/2016 | 9/30/2020 | 15,000 | 14,806 | 14,850 | ||||||||||||||||||||||||||
SentreHeart, Inc | | Health Care Equipment & Supplies | | L+885 | — | 9.46 | % | 11/15/2016 | 11/15/2020 | 7,500 | 7,341 | 7,325 | ||||||||||||||||||||||||
SOINT, LLC(3) | Aerospace & Defense | — | — | 15.00 | % | 6/8/2012 | 11/30/2018 | 2,386 | 2,381 | 2,386 | ||||||||||||||||||||||||||
Southern Auto Finance Company(6) | Consumer Finance | — | — | 11.15 | % | 10/19/2011 | 12/4/2018 | 25,000 | 24,815 | 24,500 | ||||||||||||||||||||||||||
Sunesis Pharmaceuticals, Inc. | Pharmaceuticals | L+854 | — | 9.17 | % | 3/31/2016 | 4/1/2020 | 7,500 | 7,398 | 7,463 | ||||||||||||||||||||||||||
TierPoint, LLC | IT Services | L+875-887.5 | 1.00 | % | 9.75-9.88 | % | 12/2/2014 | 12/2/2022 | 34,000 | 33,656 | 33,439 | |||||||||||||||||||||||||
TMK Hawk Parent, Corp. (TriMark) | | Trading Companies and Distributors | | L+750 | 1.00 | % | 8.50 | % | 9/26/2014 | 10/1/2022 | 20,000 | 19,843 | 20,000 | |||||||||||||||||||||||
TouchTunes Interactive Networks, Inc | Media | L+825 | 1.00 | % | 9.25 | % | 5/28/2015 | 5/27/2022 | 14,000 | 13,826 | 13,825 | |||||||||||||||||||||||||
Trevi Therapeutics, Inc | Pharmaceuticals | L+775 | — | 8.37 | % | 12/29/2014 | 6/29/2018 | 6,531 | 6,720 | 6,597 | ||||||||||||||||||||||||||
U.S. Anesthesia Partners Inc. | Health Care Providers & Services | L+925 | 1.00 | % | 10.25 | % | 9/24/2014 | 9/24/2020 | 30,000 | 29,795 | 29,700 | |||||||||||||||||||||||||
Vapotherm, Inc | | Health Care Equipment & Supplies | | L+899 | — | 9.60 | % | 11/16/2016 | 5/16/2021 | 10,000 | 9,915 | 9,900 | ||||||||||||||||||||||||
Varilease Finance, Inc | Multi-Sector Holdings | L+825 | 1.00 | % | 9.25 | % | 8/22/2014 | 8/24/2020 | 48,000 | 47,405 | 47,880 | |||||||||||||||||||||||||
|
|
|
| |||||||||||||||||||||||||||||||||
Total Bank Debt/Senior Secured Loans |
| $ | 804,917 | $ | 788,254 | |||||||||||||||||||||||||||||||
|
|
|
| |||||||||||||||||||||||||||||||||
Subordinated Debt/Corporate Notes — 3.1% | ||||||||||||||||||||||||||||||||||||
|
|
|
| |||||||||||||||||||||||||||||||||
Alegeus Technologies Holdings Corp | Health Care Technology | L+1200 | 1.00 | % | 13.00 | % | 6/24/2012 | 2/15/2019 | 28,200 | $ | 27,937 | $ | 28,059 | |||||||||||||||||||||||
|
|
|
| |||||||||||||||||||||||||||||||||
| Shares/ Units | ||||||||||||||||||||||||||||||||||||
Preferred Equity — 1.6% | ||||||||||||||||||||||||||||||||||||
SOAGG LLC (3)(6)(7) | Aerospace & Defense | — | — | 8.00 | % | 12/14/2010 | 6/30/2018 | 5,622 | $ | 5,622 | $ | 5,806 | ||||||||||||||||||||||||
SOINT, LLC (3)(6)(7) | Aerospace & Defense | — | — | 15.00 | % | 6/8/2012 | 6/30/2018 | 86,667 | 8,667 | 9,100 | ||||||||||||||||||||||||||
|
|
|
| |||||||||||||||||||||||||||||||||
Total Preferred Equity |
| $ | 14,289 | $ | 14,906 | |||||||||||||||||||||||||||||||
|
|
|
| |||||||||||||||||||||||||||||||||
Description | Industry | Interest(1) | Maturity | Acquisition Date | Par Amount | Cost | Fair Value | |||||||||||||||||||
Subordinated Debt/Corporate |
| |||||||||||||||||||||||||
Alegeus Technologies Holdings Corp. | Health Care Technology | 12.00 | % | 2/15/2019 | 6/24/2012 | $ | 28,200 | $ | 27,744 | $ | 28,200 | |||||||||||||||
WireCo. Worldgroup Inc. | Building Products | 9.00 | % | 5/15/2017 | 6/28/2012 | 48,000 | 47,733 | 47,940 | ||||||||||||||||||
|
|
|
| |||||||||||||||||||||||
Total Subordinated Debt/Corporate Notes |
| $ | 75,477 | $ | 76,140 | |||||||||||||||||||||
|
|
|
| |||||||||||||||||||||||
| Shares/ Units | ||||||||||||||||||||||||||
Preferred Equity—2.5% |
| |||||||||||||||||||||||||
SOAGG LLC(3)(7)(9) | Aerospace & Defense | 8.27 | %(5) | 6/30/2018 | 12/14/2010 | 12,904 | $ | 12,904 | $ | 13,564 | ||||||||||||||||
SOINT, LLC(3)(7)(9) | Aerospace & Defense | 15.00 | % | 6/30/2018 | 6/8/2012 | 86,667 | 8,667 | 9,533 | ||||||||||||||||||
|
|
|
| |||||||||||||||||||||||
Total Preferred Equity |
| $ | 21,571 | $ | 23,097 | |||||||||||||||||||||
|
|
|
| |||||||||||||||||||||||
Common Equity/Partnership Interests/Warrants—34.3% |
| |||||||||||||||||||||||||
Ark Real Estate Partners | Diversified Real Estate Activities | 3/12/2007 | — | $ | 1,389 | $ | 885 | |||||||||||||||||||
Ark Real Estate Partners II | Diversified Real Estate Activities | 10/23/2012 | — | 22 | 21 | |||||||||||||||||||||
B Riley Financial Inc. (fka Great American) | Research & Consulting Services | 3/16/2007 | 38,015 | 2,684 | 376 | |||||||||||||||||||||
Crystal Financial | Diversified Financial Services | 12/28/2012 | 275,000 | 275,000 | 297,500 | |||||||||||||||||||||
Direct Buy Inc.(4)† | Multiline Retail | 11/5/2012 | 76,999 | — | — | |||||||||||||||||||||
Infraredx, Inc. Warrants† | Health Care Equipment & Supplies | 11/12/2014 | 749,925 | 113 | 121 | |||||||||||||||||||||
Radius Health, Inc.(7)† | Pharmaceuticals | 5/30/2014 | 20,435 | 98 | 795 | |||||||||||||||||||||
Radius Health, Inc. | Pharmaceuticals | 7/10/2014 | 4,706 | 10 | 128 | |||||||||||||||||||||
RD Holdco Inc. | Diversified Consumer Services | 12/23/2013 | 231,177 | 15,683 | 16,263 | |||||||||||||||||||||
RD Holdco Inc. (Rug Doctor) Class B(3)† | Diversified Consumer Services | 12/23/2013 | 522 | 5,216 | 5,216 | |||||||||||||||||||||
RD Holdco Inc. (Rug Doctor) Warrants(3)† | Diversified Consumer Services | 12/23/2013 | 30,370 | 381 | 290 | |||||||||||||||||||||
|
|
|
| |||||||||||||||||||||||
Total Common Equity/Partnership Interests/Warrants |
| $ | 300,596 | $ | 321,595 | |||||||||||||||||||||
|
|
|
| |||||||||||||||||||||||
Total Investments (12) – 109.0% |
| $ | 1,007,443 | $ | 1,020,738 | |||||||||||||||||||||
|
|
|
| |||||||||||||||||||||||
| Par Amount | ||||||||||||||||||||||||||
Cash Equivalents – 52.3% |
| |||||||||||||||||||||||||
U.S. Treasury Bill | Government | 0.000 | % | 1/29/2015 | 12/29/2014 | $ | 490,000 | $ | 490,000 | $ | 490,000 | |||||||||||||||
|
|
|
| |||||||||||||||||||||||
Total Investments & Cash Equivalents 161.3% |
| $ | 1,497,443 | $ | 1,510,738 | |||||||||||||||||||||
Liabilities in Excess of Other Assets – (61.3%) |
| (574,170 | ) | |||||||||||||||||||||||
|
| |||||||||||||||||||||||||
Net Assets – 100.0% |
| $ | 936,568 | |||||||||||||||||||||||
|
| |||||||||||||||||||||||||
See notes to consolidated financial statements.
SOLAR CAPITAL LTD.
CONSOLIDATED SCHEDULE OF INVESTMENTS (continued)
December 31, 2016
(in thousands, except share/unit amounts)
Description | Industry | Acquisition Date | Maturity Date | Shares/Units | Cost | Fair Value | ||||||||||||||||||||||
Common Equity/Equity Interests/Warrants—51.6% | ||||||||||||||||||||||||||||
Ark Real Estate Partners LP (2)(3)* | Diversified Real Estate Activities | 3/12/2007 | — | $ | 527 | $ | 336 | |||||||||||||||||||||
Ark Real Estate Partners II LP (2)(3)* | Diversified Real Estate Activities | 10/23/2012 | — | 12 | 8 | |||||||||||||||||||||||
aTyr Pharma, Inc. Warrants* | Pharmaceuticals | 11/18/2016 | 47,771 | 70 | 23 | |||||||||||||||||||||||
B Riley Financial Inc. (6) | Research & Consulting Services | 3/16/2007 | 38,015 | 2,684 | 701 | |||||||||||||||||||||||
CardioDx, Inc. Warrants* | Health Care Providers & Services | 6/18/2015 | 39,863 | 129 | — | |||||||||||||||||||||||
CAS Medical Systems, Inc. Warrants* | Health Care Equipment & Supplies | 6/30/2016 | 48,491 | 38 | 29 | |||||||||||||||||||||||
Cianna Medical, Inc. Warrants* | Health Care Equipment & Supplies | 9/28/2016 | 89,726 | 37 | 52 | |||||||||||||||||||||||
Conventus Orthopaedics, Inc. Warrants* | Health Care Equipment & Supplies | 6/15/2016 | 157,500 | 65 | 67 | |||||||||||||||||||||||
Crystal Financial LLC (3)(6) | Diversified Financial Services | 12/28/2012 | 280,303 | 280,737 | 305,000 | |||||||||||||||||||||||
Direct Buy Inc.(4)* | Multiline Retail | 11/5/2012 | 76,999 | — | — | |||||||||||||||||||||||
PQ Bypass, Inc. Warrants* | Health Care Equipment & Supplies | 4/21/2016 | 176,471 | 70 | 63 | |||||||||||||||||||||||
RD Holdco Inc. (Rug Doctor)(3)* | Diversified Consumer Services | 12/23/2013 | 231,177 | 15,683 | 13,574 | |||||||||||||||||||||||
RD Holdco Inc. (Rug Doctor) Class B (3)* | Diversified Consumer Services | 12/23/2013 | 522 | 5,216 | 5,216 | |||||||||||||||||||||||
RD Holdco Inc. (Rug Doctor) Warrants (3)* | Diversified Consumer Services | 12/23/2013 | 30,370 | 381 | 168 | |||||||||||||||||||||||
Scynexis, Inc. Warrants* | Pharmaceuticals | 9/30/2016 | 122,435 | 105 | 90 | |||||||||||||||||||||||
Senior Secured Unitranche Loan Program LLC (3)(6) | Asset Management | 11/25/2015 | — | 101,878 | 100,653 | |||||||||||||||||||||||
Senior Secured Unitranche Loan Program II LLC (3)(6) | Asset Management | 8/5/2016 | — | 46,963 | 47,363 | |||||||||||||||||||||||
SentreHeart, Inc. Warrants* | Health Care Equipment & Supplies | 11/15/2016 | 196,369 | 101 | 98 | |||||||||||||||||||||||
Sunesis Pharmaceuticals, Inc. Warrants* | Pharmaceuticals | 3/31/2016 | 104,001 | 118 | 118 | |||||||||||||||||||||||
|
|
|
| |||||||||||||||||||||||||
Total Common Equity/Equity Interests/Warrants |
| $ | 454,814 | $ | 473,559 | |||||||||||||||||||||||
|
|
|
| |||||||||||||||||||||||||
Total Investments (9) — 142.1% |
| $ | 1,301,957 | $ | 1,304,778 | |||||||||||||||||||||||
|
|
|
| |||||||||||||||||||||||||
| Par Amount | ||||||||||||||||||||||||||||
Cash Equivalents —33.7% | ||||||||||||||||||||||||||||
U.S. Treasury Bill | Government | 12/29/2016 | 2/2/2017 | $ | 310,000 | $ | 309,894 | $ | 309,894 | |||||||||||||||||||
|
|
|
| |||||||||||||||||||||||||
Total Investments & Cash Equivalents —175.8% |
| $ | 1,611,851 | $ | 1,614,672 | |||||||||||||||||||||||
Liabilities in Excess of Other Assets — (75.8%) |
| (696,165 | ) | |||||||||||||||||||||||||
|
| |||||||||||||||||||||||||||
Net Assets — 100.0% |
| $ | 918,507 | |||||||||||||||||||||||||
|
| |||||||||||||||||||||||||||
| (1) | Floating rate debt investments typically bear interest at a rate determined by reference to the London Interbank Offered Rate (“LIBOR”), and which typically reset monthly, quarterly or semi-annually. For each debt investment we have provided the current interest rate in effect as of December 31, |
| (2) | Ark Real Estate Partners is held through SLRC ADI Corp., a taxable subsidiary. |
See notes to consolidated financial statements.
SOLAR CAPITAL LTD.
CONSOLIDATED SCHEDULE OF INVESTMENTS (continued)
December 31, 20142016
(in thousands)thousands, except share/unit amounts)
| (3) | Denotes investments in which we are deemed to exercise a controlling influence over the management or policies of a company, as defined in the Investment Company Act of 1940 (“1940 Act”), due to beneficially owning, either directly or through one or more controlled companies, more than 25% of the outstanding voting securities of the investment. Transactions during the year ended December 31, |
Name of Issuer | Fair Value at December 31, 2013 | Gross Additions | Gross Reductions | Realized Gain (Loss) | Interest/ Dividend Income | Fair Value at December 31, 2014 | Fair Value at December 31, 2015 | Gross Additions | Gross Reductions | Realized Gain (Loss) | Interest/ Dividend /Other Income | Fair Value at December 31, 2016 | ||||||||||||||||||||||||||||||||||||
ARK Real Estate Partners LP | $ | 19,565 | $ | — | $ | 18,579 | $ | (25,294 | ) | $ | — | $ | 885 | $ | 364 | $ | — | $ | — | $ | (29 | ) | $ | — | $ | 336 | ||||||||||||||||||||||
ARK Real Estate Partners II LP | 456 | — | 433 | (43 | ) | — | 21 | 9 | — | — | (1 | ) | — | 8 | ||||||||||||||||||||||||||||||||||
AviatorCap SII, LLC I | 2,272 | — | 851 | — | 232 | 1,421 | 914 | — | 417 | — | 85 | 497 | ||||||||||||||||||||||||||||||||||||
AviatorCap SII, LLC II | 2,945 | — | 1,587 | — | 252 | 1,358 | 350 | — | 350 | — | 15 | — | ||||||||||||||||||||||||||||||||||||
AviatorCap SII, LLC III | 696 | — | 696 | — | 16 | — | ||||||||||||||||||||||||||||||||||||||||||
Crystal Financial LLC | 305,000 | — | — | — | 30,800 | 297,500 | 290,000 | 5,737 | — | — | 31,600 | 305,000 | ||||||||||||||||||||||||||||||||||||
RD Holdco Inc. (Rug Doctor, common equity) | 15,683 | — | — | — | — | 16,263 | ||||||||||||||||||||||||||||||||||||||||||
RD Holdco Inc. (Rug Doctor, common equity). | 14,335 | — | — | — | — | 13,574 | ||||||||||||||||||||||||||||||||||||||||||
RD Holdco Inc. (Rug Doctor, class B) | 5,216 | — | — | — | — | 5,216 | 5,216 | — | — | — | — | 5,216 | ||||||||||||||||||||||||||||||||||||
RD Holdco Inc. (Rug Doctor, warrants) | 381 | — | — | — | — | 290 | 214 | — | — | — | — | 168 | ||||||||||||||||||||||||||||||||||||
Rug Doctor LLC | 8,747 | — | — | — | 1,198 | 9,020 | 8,838 | — | — | — | 1,151 | 9,111 | ||||||||||||||||||||||||||||||||||||
Senior Secured Unitranche Loan Program LLC | 80,677 | 50,093 | 28,875 | — | 6,084 | 100,653 | ||||||||||||||||||||||||||||||||||||||||||
Senior Secured Unitranche Loan Program II LLC | — | 63,093 | 16,130 | — | 1,228 | 47,363 | ||||||||||||||||||||||||||||||||||||||||||
SOAGG LLC | 16,719 | 517 | 4,272 | — | 1,131 | 13,564 | 8,632 | — | 2,590 | — | 545 | 5,806 | ||||||||||||||||||||||||||||||||||||
SOINT, LLC | 11,592 | — | 2,859 | — | 1,619 | 8,733 | 5,705 | — | 3,318 | — | 602 | 2,386 | ||||||||||||||||||||||||||||||||||||
SOINT, LLC (preferred equity) | 9,533 | — | — | — | 1,301 | 9,533 | 9,316 | — | — | — | 1,304 | 9,100 | ||||||||||||||||||||||||||||||||||||
USAW 767 | 1,085 | — | 1,085 | — | 33 | — | ||||||||||||||||||||||||||||||||||||||||||
|
|
|
|
|
|
|
|
|
|
|
| |||||||||||||||||||||||||||||||||||||
| $ | 399,890 | $ | 517 | $ | 30,362 | $ | (25,337 | ) | $ | 36,582 | $ | 363,804 | $ | 424,570 | $ | 118,923 | $ | 51,680 | $ | (30 | ) | $ | 42,614 | $ | 499,218 | |||||||||||||||||||||||
|
|
|
|
|
|
|
|
|
|
|
| |||||||||||||||||||||||||||||||||||||
| (4) | Denotes investments in which we are an “Affiliated Person” but not exercising a controlling influence, as defined in the 1940 Act, due to beneficially owning, either directly or through one or more controlled companies, more than 5% but less than 25% of the outstanding voting securities of the investment. Transactions during the year ended December 31, |
Name of Issuer | Fair Value at December 31, 2013 | Gross Additions | Gross Reductions | Realized Gain (Loss) | Interest/ Dividend Income | Fair Value at December 31, 2014 | Fair Value at December 31, 2015 | Gross Additions | Gross Reductions | Realized Gain (Loss) | Interest/ Dividend Income | Fair Value at December 31, 2016 | ||||||||||||||||||||||||||||||||||||
Direct Buy Inc. (common equity) | $ | — | $ | — | $ | — | $ | — | $ | — | $ | — | $ | — | $ | — | $ | — | $ | — | $ | — | $ | — | ||||||||||||||||||||||||
Direct Buy Inc. (senior secured loan) | 7,789 | 722 | — | — | 564 | 4,646 | 1,233 | 1,238 | — | — | — | 777 | ||||||||||||||||||||||||||||||||||||
DSW Group Holdings LLC | — | — | — | 928 | — | — | — | — | — | 197 | † | — | — | |||||||||||||||||||||||||||||||||||
National Interest Security Corporation | — | — | — | 248 | — | — | ||||||||||||||||||||||||||||||||||||||||||
|
|
|
|
|
|
|
|
|
|
|
| |||||||||||||||||||||||||||||||||||||
| $ | 7,789 | $ | 722 | $ | — | $ | 1,176 | $ | 564 | $ | 4,646 | $ | 1,233 | $ | 1,238 | $ | — | $ | 197 | $ | — | $ | 777 | |||||||||||||||||||||||||
|
|
|
|
|
|
|
|
|
|
|
| |||||||||||||||||||||||||||||||||||||
| (5) |
| The following entity is domiciled outside the United States and the investments are denominated in Canadian Dollars: Easyfinancial Services, Inc. in Canada. |
| Indicates assets that the Company believes may not represent “qualifying assets” under Section 55(a) of the Investment Company Act of 1940 (“1940 Act”), as amended. If we fail to invest a sufficient portion of our assets in qualifying assets, we could be prevented from making follow-on investments in existing portfolio companies or could be required to dispose of investments at inappropriate times in order to comply with the 1940 Act. As of December 31, 2016, on a fair value basis, non-qualifying assets in the portfolio represented 31.6% of the total assets of the Company. |
| Solar Capital Ltd.’s investments in SOAGG, LLC and SOINT, LLC include a two and one dollar investment in common shares, respectively. |
| Bishop Lifting Products, Inc., SEI Holding I Corporation, Singer Equities, Inc. & Hampton Rubber Company are co-borrowers. |
| Aggregate net unrealized |
| Floating rate instruments accrue interest at a predetermined spread relative to an index, typically the LIBOR or PRIME rate. These instruments are typically subject to a LIBOR or PRIME rate floor. |
| * | Non-income producing security. |
| ** | Investment is on non-accrual status. |
| † | Represents estimated change in receivable balance. |
See notes to consolidated financial statements.
SOLAR CAPITAL LTD.
CONSOLIDATED SCHEDULE OF INVESTMENTS (continued)
December 31, 20142016
(in thousands)
Industry Classification | Percentage of Total Investments (at fair value) as of December 31, | |||
Diversified Financial Services | % | |||
Asset Management | 12.5 | % | ||
Health Care Providers & Services | % | |||
Wireless Telecommunications Services | % | |||
| % | |||
Health Care | 6.1 | % | ||
Professional Services | 4.6 | % | ||
IT Services | % | |||
Multi-Sector Holdings | 3.7 | % | ||
Health Care Technology | 3.3 | % | ||
Trading Companies & Distributors | % | |||
Consumer Finance | 2.4 | % | ||
Communications Equipment | 2.4 | % | ||
Diversified Consumer Services | 2.1 | % | ||
Life Sciences Tools & Services | 1.6 | % | ||
Insurance | 1.4 | % | ||
Aerospace & Defense | ||||
| ||||
| ||||
| ||||
| ||||
| ||||
| ||||
| ||||
| ||||
| % | |||
Chemicals | 1.3 | % | ||
Media | 1.1 | % | ||
Air Freight & Logistics | ||||
| % | |||
Thrifts & Mortgage Finance | % | |||
| ||||
| % | |||
Multiline Retail | % | |||
| ||||
| 0.1 | % | ||
Diversified Real Estate Activities | ||||
| 0.0 | % | ||
|
| |||
Total Investments | 100.0 | % | ||
|
| |||
See notes to consolidated financial statements.
SOLAR CAPITAL LTD.
CONSOLIDATED SCHEDULE OF INVESTMENTS
December 31, 20132015
(in thousands)thousands, except share/unit amounts)
Description(1) | Industry | Interest(2) | Maturity | Acquisition Date | Par Amount | Cost | Fair Value | |||||||||||||||||||
Bank Debt/Senior Secured |
| |||||||||||||||||||||||||
Active Media Services, Inc | Media | 9.74% | 2/1/2018 | 9/6/2013 | $ | 10,000 | $ | 9,741 | $ | 10,000 | ||||||||||||||||
AviatorCap SII, LLC I(4) | Aerospace & Defense | 12.00% | 12/31/2014 | 5/31/2011 | 2,272 | 2,262 | 2,272 | |||||||||||||||||||
AviatorCap SII, LLC II(4) | Aerospace & Defense | 11.00% | 12/31/2014 | 8/23/2011 | 2,945 | 2,929 | 2,945 | |||||||||||||||||||
AviatorCap SII, LLC III(4) | Aerospace & Defense | 13.00% | 12/31/2014 | 7/19/2011 | 696 | 691 | 696 | |||||||||||||||||||
Blue Coat Systems, Inc. | Internet Software & Services | 9.50% | 6/28/2020 | 6/28/2013 | 20,500 | 20,305 | 20,910 | |||||||||||||||||||
CAMP International Holding Company | Aerospace & Defense | 8.25% | 11/30/2019 | 12/2/2013 | 5,000 | 5,000 | 5,109 | |||||||||||||||||||
CT Technologies Intermediate Holdings, Inc | Healthcare Technology | 9.25% | 10/5/2020 | 10/2/2013 | 9,500 | 9,362 | 9,500 | |||||||||||||||||||
Direct Buy Inc.(5) | Multiline Retail | 12.00% PIK | 10/31/2019 | 11/5/2012 | 7,789 | 7,789 | 7,789 | |||||||||||||||||||
Easyfinancial Services, Inc.(7)(8). | Consumer Finance | 9.98% | 10/4/2017 | 9/27/2012 | C$ | 10,000 | 9,737 | 9,415 | ||||||||||||||||||
Filtration Group Corp | Industrial Conglomerates | 8.25% | 11/21/2021 | 11/15/2013 | $ | 6,000 | 5,940 | 6,150 | ||||||||||||||||||
Genex Services, Inc | Insurance | 9.25% | 1/26/2019 | 7/26/2013 | 15,000 | 14,862 | 15,000 | |||||||||||||||||||
Global Tel*Link Corporation | Communications Equipment | 9.00% | 11/23/2020 | 5/21/2013 | 13,500 | 13,245 | 12,926 | |||||||||||||||||||
Grakon, LLC(3) | Machinery | 12.00% | 12/31/2015 | 3/21/2011 | 9,524 | 8,304 | 9,524 | |||||||||||||||||||
Interactive Health Solutions, Inc. | Health Care Services | 11.50% | 10/4/2016 | 10/4/2011 | 17,813 | 17,544 | 17,813 | |||||||||||||||||||
Isotoner Corporation | Specialty Retail | 10.75% | 1/8/2018 | 7/8/2011 | 45,000 | 44,126 | 45,000 | |||||||||||||||||||
K2 Pure Solutions NoCal, L.P | Chemicals | 10.00% | 8/19/2019 | 8/19/2013 | 11,500 | 11,280 | 11,270 | |||||||||||||||||||
MYI Acquiror Corporation(8). | Insurance |
| 13% (12% Cash & 1% PIK) | (6) | 3/13/2017 | 9/13/2011 | 26,035 | 25,702 | 26,296 | |||||||||||||||||
Quantum Foods, LLC | Food Products | 11.74% | 2/6/2018 | 2/1/2013 | 32,813 | 32,813 | 32,813 | |||||||||||||||||||
Renaissance Learning, Inc | Education Services | 8.75% | 5/14/2021 | 10/16/2013 | 8,000 | 7,881 | 8,095 | |||||||||||||||||||
Rug Doctor, LLC(4) | Diversified Consumer Services | 11.25% | 6/30/2017 | 6/7/2012 | 9,111 | 8,551 | 8,747 | |||||||||||||||||||
SMG | Commercial Services & Supplies | 10.75% | 12/7/2018 | 10/19/2011 | 25,000 | 24,618 | 25,000 | |||||||||||||||||||
Southern Auto Finance Company(8)(9) | Consumer Finance | 11.00% | 12/4/2018 | 12/4/2018 | 25,000 | 24,551 | 25,000 | |||||||||||||||||||
SOINT, LLC(4) | Aerospace & Defense | 15.00% | 6/30/2016 | 6/8/2012 | 11,592 | 11,430 | 11,592 | |||||||||||||||||||
Spencer Spirit Holdings, Inc. | Specialty Retail | 11.00% | 5/1/2017 | 4/11/2011 | 10,000 | 10,000 | 10,825 | |||||||||||||||||||
Tecomet, Inc | Health Care Equipment & Supplies | 9.75% | 6/19/2020 | 12/19/2013 | 45,000 | 43,767 | 43,762 | |||||||||||||||||||
The Robbins Company TLA | Construction & Engineering | 11.74% | 5/31/2017 | 5/31/2013 | 15,057 | 14,897 | 15,057 | |||||||||||||||||||
The Robbins Company TLB | Construction & Engineering | 11.74% | 4/25/2015 | 5/31/2013 | 4,561 | 4,429 | 4,561 | |||||||||||||||||||
TravelClick, Inc. | Hotels, Restaurants & Leisure | 9.75% | 3/26/2018 | 3/25/2013 | 20,000 | 19,831 | 20,000 | |||||||||||||||||||
Trinet HR Corporation | Professional Services | 8.75% | 2/20/2021 | 8/14/2013 | 25,000 | 24,514 | 25,250 | |||||||||||||||||||
USAW 767(4) | Aerospace & Defense | 14.50% | 6/30/2014 | 12/14/2010 | 1,085 | 1,083 | 1,085 | |||||||||||||||||||
|
|
|
| |||||||||||||||||||||||
Total Bank Debt/Senior Secured Loans |
| $ | 437,184 | $ | 444,402 | |||||||||||||||||||||
|
|
|
| |||||||||||||||||||||||
Subordinated Debt/Corporate |
| |||||||||||||||||||||||||
Adams Outdoor Advertising | Media | 17.00% | 12/8/2015 | 12/8/2010 | $ | 42,500 | $ | 42,153 | $ | 44,200 | ||||||||||||||||
Alegeus Technologies Holdings Corp. | Health Care Technology | 12.00% | 2/15/2019 | 6/24/2012 | 28,200 | 27,663 | 28,200 | |||||||||||||||||||
Asurion Holdco | Insurance | 11.00% | 3/2/2019 | 2/16/2012 | 12,000 | 11,713 | 12,390 | |||||||||||||||||||
Earthbound Farm | Food Products | 14.25% | 6/21/2017 | 12/21/2010 | 58,947 | 58,137 | 60,127 | |||||||||||||||||||
Grakon Holdings LLC Sr(3) | Machinery | 14.00% PIK | 12/31/2015 | 3/21/2011 | 2,091 | 2,091 | 2,091 | |||||||||||||||||||
Grakon Holdings LLC Jr(3) | Machinery | 12.00% PIK | 12/31/2015 | 3/21/2011 | 13,693 | 12,544 | 11,639 | |||||||||||||||||||
Granite Global Solutions | Insurance | 13.50% | 11/30/2016 | 5/31/2011 | C$ | 25,714 | 25,833 | 24,210 | ||||||||||||||||||
Richelieu Foods, Inc. | Food Products |
| 13.75% (12% Cash & 1.75%PIK)(6) |
| 5/18/2016 | 11/18/2010 | $ | 23,470 | 23,149 | 23,235 | ||||||||||||||||
WireCo. Worldgroup Inc. | Building Products | 11.75% | 5/15/2017 | 6/28/2012 | 48,000 | 47,640 | 48,000 | |||||||||||||||||||
|
|
|
| |||||||||||||||||||||||
Total Subordinated Debt/Corporate Notes |
| $ | 250,923 | $ | 254,092 | |||||||||||||||||||||
|
|
|
| |||||||||||||||||||||||
Description | Industry | Spread Above Index(11) | LIBOR Floor | Interest Rate(1) | Acquisition Date | Maturity Date | Par Amount | Cost | Fair Value | |||||||||||||||||||||||||
Bank Debt/Senior Secured Loans — 94.8% | ||||||||||||||||||||||||||||||||||
AccentCare, Inc | Health Care Providers & Services | L+575 | 1.00 | % | 6.75 | % | 9/3/2015 | 9/3/2021 | $ | 5,000 | $ | 4,952 | $ | 4,925 | ||||||||||||||||||||
AccentCare, Inc | Health Care Providers & Services | L+950 | 1.00 | % | 10.50 | % | 9/3/2015 | 9/3/2022 | 17,500 | 17,203 | 16,975 | |||||||||||||||||||||||
Achaogen, Inc | Pharmaceuticals | L+699 | 1.00 | % | 7.99 | % | 8/5/2015 | 8/5/2019 | 15,000 | 14,964 | 14,700 | |||||||||||||||||||||||
Aegis Toxicology Sciences Corporation | Health Care Providers & Services | L+850 | 1.00 | % | 9.50 | % | 2/20/2014 | 8/24/2021 | 29,000 | 28,688 | 26,100 | |||||||||||||||||||||||
AgaMatrix, Inc | Health Care Equipment & Supplies | L+835 | — | 8.59 | % | 2/6/2015 | 2/1/2019 | 6,667 | 6,611 | 6,544 | ||||||||||||||||||||||||
Amerilife Group, LLC | Insurance | L+875 | 1.00 | % | 9.75 | % | 7/9/2015 | 1/10/2023 | 15,000 | 14,713 | 14,550 | |||||||||||||||||||||||
Argo Turboserve Corporation & Argo Tech, LLC | Air Freight & Logistics | L+825 | — | 8.66 | % | 5/2/2014 | 5/2/2018 | 13,932 | 13,932 | 13,444 | ||||||||||||||||||||||||
Asurion, LLC | Insurance | L+750 | 1.00 | % | 8.50 | % | 2/27/2014 | 3/3/2021 | 13,200 | 12,823 | 11,359 | |||||||||||||||||||||||
AviatorCap SII, LLC I(3) | Aerospace & Defense | — | — | 12.00 | % | 5/31/2011 | 1/31/2019 | 914 | 914 | 914 | ||||||||||||||||||||||||
AviatorCap SII, LLC II(3) | Aerospace & Defense | — | — | 11.00 | % | 8/23/2011 | 1/31/2019 | 350 | 350 | 350 | ||||||||||||||||||||||||
Bishop Lifting Products, Inc.(8) | Trading Companies & Distributors | L+800 | 1.00 | % | 9.00 | % | 3/24/2014 | 3/27/2022 | 25,000 | 24,798 | 20,250 | |||||||||||||||||||||||
Breathe Technologies, Inc | Health Care Technology | L+830 | — | 8.53 | % | 11/5/2015 | 11/5/2019 | 15,000 | 14,863 | 14,550 | ||||||||||||||||||||||||
CAMP International Holding Company | Aerospace & Defense | L+725 | 1.00 | % | 8.25 | % | 12/2/2013 | 11/30/2019 | 5,000 | 5,000 | 4,871 | |||||||||||||||||||||||
CardioDx, Inc | Health Care Equipment & Supplies | P+670 | — | 10.20 | % | 6/18/2015 | 4/1/2019 | 7,500 | 7,413 | 7,050 | ||||||||||||||||||||||||
Cardiva Medical, Inc | Health Care Equipment & Supplies | L+870 | — | 8.93 | % | 8/19/2015 | 8/19/2019 | 8,500 | 8,533 | 8,373 | ||||||||||||||||||||||||
Concentra, Inc | Health Care Facilities | L+800 | 1.00 | % | 9.00 | % | 5/8/2015 | 6/1/2023 | 18,500 | 18,324 | 18,130 | |||||||||||||||||||||||
Datapipe, Inc | IT Services | L+750 | 1.00 | % | 8.50 | % | 8/14/2014 | 9/15/2019 | 27,000 | 26,513 | 26,190 | |||||||||||||||||||||||
Direct Buy Inc.(4)** | Multiline Retail | — | — | 12.00% PIK | 11/5/2012 | 10/31/2019 | 9,867 | 8,511 | 1,233 | |||||||||||||||||||||||||
DISA Holdings Acquisition Subsidiary Corp | Professional Services | L+850 | 1.00 | % | 9.50 | % | 12/9/2014 | 6/9/2021 | 51,476 | 50,799 | 48,902 | |||||||||||||||||||||||
Easyfinancial Services, Inc. (5)(6) | Consumer Finance | BA+699 | 1.00 | % | 7.99 | % | 9/27/2012 | 10/4/2019 | C$ | 10,000 | 9,261 | 7,080 | ||||||||||||||||||||||
Emerging Markets Communications, LLC | Wireless Telecommunication Services | L+962.5 | 1.00 | % | 10.63 | % | 6/29/2015 | 7/1/2022 | $ | 27,000 | 26,614 | 27,000 | ||||||||||||||||||||||
Falmouth Group Holdings Corp. (AMPAC) | Chemicals | L+675 | 1.00 | % | 9.25 | % | 12/7/2015 | 12/14/2021 | 15,000 | 14,776 | 14,775 | |||||||||||||||||||||||
Filtration Group Corp | Industrial Conglomerates | L+725 | 1.00 | % | 8.25 | % | 11/15/2013 | 11/21/2021 | 1,571 | 1,559 | 1,533 | |||||||||||||||||||||||
Genoa, A QoL Healthcare Company, LLC | Health Care Providers & Services | L+775 | 1.00 | % | 8.75 | % | 4/21/2015 | 4/30/2023 | 14,000 | 13,868 | 13,580 | |||||||||||||||||||||||
Global Tel*Link Corporation | Communications Equipment | L+375 | 1.25 | % | 5.00 | % | 11/6/2015 | 5/23/2020 | 6,716 | 5,240 | 4,940 | |||||||||||||||||||||||
Global Tel*Link Corporation | Communications Equipment | L+775 | 1.25 | % | 9.00 | % | 5/21/2013 | 11/23/2020 | 18,500 | 18,217 | 13,042 | |||||||||||||||||||||||
Greystone Select Holdings LLC & Greystone & Co., Inc | Thrifts & Mortgage Finance | L+800 | 1.00 | % | 9.00 | % | 3/25/2014 | 3/26/2021 | 9,826 | 9,781 | 9,532 | |||||||||||||||||||||||
Hyland Software, Inc | Software | L+725 | 1.00 | % | 8.25 | % | 6/12/2015 | 6/30/2023 | 5,000 | 4,976 | 4,750 | |||||||||||||||||||||||
IHS Intermediate, Inc | Health Care Providers & Services | L+825 | 1.00 | % | 9.25 | % | 6/19/2015 | 7/20/2022 | 25,000 | 24,523 | 24,250 | |||||||||||||||||||||||
Inmar Acquisition Sub, Inc | Professional Services | L+700 | 1.00 | % | 8.00 | % | 1/27/2014 | 1/27/2022 | 10,000 | 9,919 | 9,700 | |||||||||||||||||||||||
K2 Pure Solutions NoCal, L.P | Chemicals | L+1000 | 1.00 | % | 11.00 | % | 8/19/2013 | 8/19/2019 | 11,069 | 10,919 | 10,515 | |||||||||||||||||||||||
Kore Wireless Group, Inc | Wireless Telecommunication Services | L+825 | 1.00 | % | 9.25 | % | 9/12/2014 | 3/12/2021 | 55,500 | 54,557 | 53,835 | |||||||||||||||||||||||
Landslide Holdings, Inc | Software | L+725 | 1.00 | % | 8.25 | % | 2/25/2014 | 2/25/2021 | 16,300 | 16,279 | 15,322 | |||||||||||||||||||||||
LegalZoom.com, Inc | Internet Software & Services | L+700 | 1.00 | % | 8.00 | % | 5/13/2015 | 5/13/2020 | 49,625 | 48,625 | 48,384 | |||||||||||||||||||||||
PhyMed Management LLC | Health Care Providers & Services | L+875 | 1.00 | % | 9.75 | % | 12/18/2015 | 5/18/2021 | 32,321 | 31,035 | 31,028 | |||||||||||||||||||||||
Pronutria Biosciences, Inc. | Pharmaceuticals | L+880 | — | 9.03 | % | 8/7/2015 | 8/31/2019 | 20,000 | 19,922 | 19,650 | ||||||||||||||||||||||||
PSKW, LLC & PDR, LLC | Health Care Providers & Services | L+425 | 1.00 | % | 5.25 | % | 11/25/2015 | 11/25/2021 | 1,100 | 1,089 | 1,089 | |||||||||||||||||||||||
PSKW, LLC & PDR, LLC | Health Care Providers & Services | L+842 | 1.00 | % | 9.42 | % | 11/25/2015 | 11/25/2021 | 8,900 | 8,724 | 8,722 | |||||||||||||||||||||||
Rapid Micro Biosystems, Inc. | Life Sciences Tools & Services | L+880 | — | 9.04 | % | 6/30/2015 | 6/30/2019 | 16,000 | 16,019 | 15,520 | ||||||||||||||||||||||||
Rug Doctor LLC (3) | Diversified Consumer Services | L+975 | 1.50 | % | 11.25 | % | 12/23/2013 | 12/31/2018 | 9,111 | 8,836 | 8,838 | |||||||||||||||||||||||
Salient Partners, L.P | Asset Management | L+650 | 1.00 | % | 7.50 | % | 6/10/2015 | 6/9/2021 | 15,760 | 15,467 | 15,208 | |||||||||||||||||||||||
SOINT, LLC (3) | Aerospace & Defense | — | — | 15.00 | % | 6/8/2012 | 11/30/2018 | 5,705 | 5,685 | 5,705 | ||||||||||||||||||||||||
Southern Auto Finance Company (6) | Consumer Finance | — | — | 11.00 | % | 10/19/2011 | 12/4/2018 | 25,000 | 24,735 | 24,375 | ||||||||||||||||||||||||
See notes to consolidated financial statements.
SOLAR CAPITAL LTD.
CONSOLIDATED SCHEDULE OF INVESTMENTS—(Continued)
December 31, 2015
(in thousands, except share/unit amounts)
Description | Industry | Spread Above Index(11) | LIBOR Floor | Interest Rate(1) | Acquisition Date | Maturity Date | Par Amount | Cost | Fair Value | |||||||||||||||||||||||||
T2 Biosystems, Inc.(6) | Health Care Equipment & Supplies | L+705 | — | 7.28 | % | 7/11/2014 | 7/1/2019 | 25,000 | 25,088 | 24,875 | ||||||||||||||||||||||||
The Robbins Company TLA | Construction & Engineering | L+1150 | — | 11.92 | % | 5/31/2013 | 5/31/2017 | 10,352 | 11,961 | 10,779 | ||||||||||||||||||||||||
The Robbins Company TLB | Construction & Engineering | L+1150 | — | 11.92 | % | 5/31/2013 | 4/15/2016 | 2,432 | 2,421 | 2,481 | ||||||||||||||||||||||||
TierPoint, LLC | IT Services | L+875 | 1.00 | % | 9.75 | % | 12/2/2014 | 12/2/2022 | 34,000 | 33,599 | 33,320 | |||||||||||||||||||||||
TMK Hawk Parent, Corp. (TriMark) | Trading Companies and Distributors | L+750 | 1.00 | % | 8.50 | % | 9/26/2014 | 10/1/2022 | 20,000 | 19,823 | 19,600 | |||||||||||||||||||||||
TouchTunes Interactive Networks, Inc | Media | L+825 | 1.00 | % | 9.25 | % | 5/28/2015 | 5/27/2022 | 14,000 | 13,802 | 13,370 | |||||||||||||||||||||||
Trevi Therapeutics, Inc | Pharmaceuticals | L+775 | — | 7.99 | % | 12/29/2014 | 6/29/2018 | 7,500 | 7,516 | 7,388 | ||||||||||||||||||||||||
U.S. Anesthesia Partners Inc. | Health Care Providers & Services | L+925 | 1.00 | % | 10.25 | % | 9/24/2014 | 9/24/2020 | 30,000 | 29,751 | 29,400 | |||||||||||||||||||||||
Varilease Finance, Inc | Multi-Sector Holdings | L+825 | 1.00 | % | 9.25 | % | 8/22/2014 | 8/24/2020 | 48,000 | 47,275 | 47,040 | |||||||||||||||||||||||
|
|
|
| |||||||||||||||||||||||||||||||
Total Bank Debt/Senior Secured Loans |
| $ | 871,766 | $ | 836,036 | |||||||||||||||||||||||||||||
|
|
|
| |||||||||||||||||||||||||||||||
Subordinated Debt/Corporate Notes —7.6% |
| |||||||||||||||||||||||||||||||||
Alegeus Technologies Holdings Corp | Health Care Technology | 12.00 | % | 6/24/2012 | 2/15/2019 | 28,200 | $ | 27,835 | $ | 27,354 | ||||||||||||||||||||||||
WireCo Worldgroup Inc. | Building Products | 9.00 | % | 6/28/2012 | 5/15/2017 | 48,000 | 47,837 | 39,960 | ||||||||||||||||||||||||||
|
|
|
| |||||||||||||||||||||||||||||||
Total Subordinated Debt/Corporate Notes |
| $ | 75,672 | $ | 67,314 | |||||||||||||||||||||||||||||
|
|
|
| |||||||||||||||||||||||||||||||
| Shares/ Units | ||||||||||||||||||||||||||||||||||
Preferred Equity — 2.0% |
| |||||||||||||||||||||||||||||||||
SOAGG LLC (3)(6)(7) | Aerospace & Defense | 8.00 | % | 12/14/2010 | 6/30/2018 | 8,212 | $ | 8,212 | $ | 8,632 | ||||||||||||||||||||||||
SOINT, LLC (3)(6)(7) | Aerospace & Defense | 15.00 | % | 6/8/2012 | 6/30/2018 | 86,667 | 8,667 | 9,316 | ||||||||||||||||||||||||||
|
|
|
| |||||||||||||||||||||||||||||||
Total Preferred Equity |
| $ | 16,879 | $ | 17,948 | |||||||||||||||||||||||||||||
|
|
|
| |||||||||||||||||||||||||||||||
Description | Industry | Acquisition Date | Maturity Date | Shares/ Units | Cost | Fair Value | ||||||||||||||||||||||||||||
Common Equity/Equity Interests/Warrants—44.3% |
| |||||||||||||||||||||||||||||||||
AgaMatrix Inc. Warrants* | Health Care Equipment & Supplies | 2/6/2015 | 83,543 | $ | 100 | $ | 101 | |||||||||||||||||||||||||||
Ark Real Estate Partners LP (2)(3)* | Diversified Real Estate Activities | 3/12/2007 | — | 526 | 364 | |||||||||||||||||||||||||||||
Ark Real Estate Partners II LP (2)(3)* | Diversified Real Estate Activities | 10/23/2012 | — | 12 | 9 | |||||||||||||||||||||||||||||
B Riley Financial Inc. (Great American) | Research & Consulting Services | 3/16/2007 | 38,015 | 2,684 | 377 | |||||||||||||||||||||||||||||
CardioDx, Inc. Warrants* | Health Care Equipment & Supplies | 6/18/2015 | 39,863 | 129 | — | |||||||||||||||||||||||||||||
Crystal Financial LLC (3)(6)(9) | Diversified Financial Services | 12/28/2012 | 275,000 | 275,000 | 290,000 | |||||||||||||||||||||||||||||
Direct Buy Inc.(4)* | Multiline Retail | 11/5/2012 | 76,999 | — | — | |||||||||||||||||||||||||||||
RD Holdco Inc. (Rug Doctor)(3)* | Diversified Consumer Services | 12/23/2013 | 231,177 | 15,683 | 14,335 | |||||||||||||||||||||||||||||
RD Holdco Inc. (Rug Doctor) Class B (3)* | Diversified Consumer Services | 12/23/2013 | 522 | 5,216 | 5,216 | |||||||||||||||||||||||||||||
RD Holdco Inc. (Rug Doctor) Warrants (3)* | Diversified Consumer Services | 12/23/2013 | 30,370 | 381 | 214 | |||||||||||||||||||||||||||||
Senior Secured Unitranche Loan Program LLC (3)(6) | Asset Management | 11/25/2015 | — | 80,660 | 80,677 | |||||||||||||||||||||||||||||
|
|
|
| |||||||||||||||||||||||||||||||
Total Common Equity/Equity Interests/Warrants |
| $ | 380,391 | $ | 391,293 | |||||||||||||||||||||||||||||
|
|
|
| |||||||||||||||||||||||||||||||
Total Investments (10) — 148.7% |
| $ | 1,344,708 | $ | 1,312,591 | |||||||||||||||||||||||||||||
|
|
|
| |||||||||||||||||||||||||||||||
| Par Amount | ||||||||||||||||||||||||||||||||||
Cash Equivalents — 31.2% | ||||||||||||||||||||||||||||||||||
U.S. Treasury Bill | Government | 12/28/2015 | 1/21/2016 | $ | 275,000 | $ | 274,983 | $ | 274,983 | |||||||||||||||||||||||||
|
|
|
| |||||||||||||||||||||||||||||||
Total Investments & Cash Equivalents —179.9% |
| $ | 1,619,691 | $ | 1,587,574 | |||||||||||||||||||||||||||||
Liabilities in Excess of Other Assets — (79.9%) |
| (704,876 | ) | |||||||||||||||||||||||||||||||
|
| |||||||||||||||||||||||||||||||||
Net Assets — 100.0% |
| $ | 882,698 | |||||||||||||||||||||||||||||||
|
| |||||||||||||||||||||||||||||||||
See notes to consolidated financial statements.
SOLAR CAPITAL LTD.
CONSOLIDATED SCHEDULE OF INVESTMENTS (continued)(Continued)
December 31, 20132015
(in thousands, except share/unit amounts)
Description(1) | Industry | Interest(2) | Maturity | Acquisition Date | Shares/Units | Cost | Fair Value | |||||||||||||||||||
Preferred Equity—2.7% | ||||||||||||||||||||||||||
SOAGG LLC(4)(8)(10) | Aerospace & Defense | 8.53% | (6) | 6/30/2018 | 12/14/2010 | 16,659 | $ | 16,659 | $ | 16,719 | ||||||||||||||||
SOINT, LLC(4)(8)(10) | Aerospace & Defense | 15.00% | 6/30/2018 | 6/8/2012 | 86,667 | 8,667 | 9,533 | |||||||||||||||||||
Wyle Laboratories† | Aerospace & Defense | 8.00% | 7/17/2015 | 6/26/2009 | 387 | 39 | 55 | |||||||||||||||||||
|
|
|
| |||||||||||||||||||||||
Total Preferred Equity |
| $ | 25,365 | $ | 26,307 | |||||||||||||||||||||
|
|
|
| |||||||||||||||||||||||
Common Equity/Partnership Interests/Warrants—36.5% | ||||||||||||||||||||||||||
Ark Real Estate Partners | Diversified Real Estate Activities | 3/12/2007 | 45,905,653 | $ | 45,235 | $ | 19,565 | |||||||||||||||||||
Ark Real Estate Partners II | Diversified Real Estate Activities | 10/23/2012 | 1,070,679 | 498 | 456 | |||||||||||||||||||||
Crystal Financial LLC(4)(8)(11) | Diversified Financial Services | 12/28/2012 | 275,000 | 275,000 | 305,000 | |||||||||||||||||||||
Direct Buy Inc.(5)† | Multiline Retail | 11/5/2012 | 76,999 | — | — | |||||||||||||||||||||
Grakon, LLC(3)† | Machinery | 3/21/2011 | 1,714,286 | 1,714 | — | |||||||||||||||||||||
Grakon, LLC Warrants(3)† | Machinery | 3/21/2011 | 3,518,001 | — | — | |||||||||||||||||||||
Great American Group Inc.(8)† | Research & Consulting Services | 3/16/2007 | 572,800 | 2,681 | 160 | |||||||||||||||||||||
Great American Group | Research & Consulting Services | 3/16/2007 | 187,500 | 3 | 53 | |||||||||||||||||||||
Nuveen Investments, Inc (MDCP Co-Investors, L.P.).† | Asset Management & Custody Banks | 11/13/2007 | — | 30,876 | 17,084 | |||||||||||||||||||||
RD Holdco Inc. (Rug Doctor)(4)† | Diversified Consumer Services | 12/23/2013 | 231,177 | 15,683 | 15,683 | |||||||||||||||||||||
RD Holdco Inc. (Rug Doctor) Class B(4)† | Diversified Consumer Services | 12/23/2013 | 522 | 5,216 | 5,216 | |||||||||||||||||||||
RD Holdco Inc. (Rug Doctor) Warrants(4)† | Diversified Consumer Services | 12/23/2013 | 30,370 | 381 | 381 | |||||||||||||||||||||
|
|
|
| |||||||||||||||||||||||
Total Common Equity/Partnership Interests/Warrants |
| $ | 377,287 | $ | 363,598 | |||||||||||||||||||||
|
|
|
| |||||||||||||||||||||||
Total Investments – 109.3% |
| $ | 1,090,759 | $ | 1,088,399 | |||||||||||||||||||||
|
|
|
| |||||||||||||||||||||||
| Par Amount | ||||||||||||||||||||||||||
| Cash Equivalents—45.2% | ||||||||||||||||||||||||||
U.S. Treasury Bill | Government | 0.000% | 1/09/2014 | 12/23/2013 | $ | 200,000 | $ | 200,000 | $ | 200,000 | ||||||||||||||||
U.S. Treasury Bill | Government | 0.005% | 1/23/2014 | 12/23/2013 | 250,000 | 249,999 | 249,999 | |||||||||||||||||||
|
|
|
| |||||||||||||||||||||||
Total Cash Equivalents |
| $ | 449,999 | $ | 449,999 | |||||||||||||||||||||
|
|
|
| |||||||||||||||||||||||
Total Investments & Cash Equivalents—154.5% |
| $ | 1,540,758 | $ | 1,538,398 | |||||||||||||||||||||
Liabilities in Excess of Other Assets—(54.5%) |
| (542,761 | ) | |||||||||||||||||||||||
|
| |||||||||||||||||||||||||
Net Assets—100.0% |
| $ | 995,637 | |||||||||||||||||||||||
|
| |||||||||||||||||||||||||
| (1) |
| Floating rate debt investments typically bear interest at a rate determined by reference to the London Interbank Offered Rate (“LIBOR”), and which typically reset monthly, quarterly or semi-annually. For each debt investment we have provided the current interest rate in effect as of December 31, |
See notes to consolidated financial statements.
SOLAR CAPITAL LTD.
CONSOLIDATED SCHEDULE OF INVESTMENTS (continued)
December 31, 2013
(in thousands)
| Denotes investments in which we are deemed to exercise a controlling influence over the management or policies of a company, as defined in the Investment Company Act of 1940 (“1940 Act”), due to beneficially owning, either directly or through one or more controlled companies, more than 25% of the outstanding voting securities of the investment. Transactions during the year ended December 31, |
Name of Issuer | Fair Value at December 31, 2012 | Gross Additions | Gross Reductions | Realized Gain (Loss) | Interest/ Dividend Income | Fair Value at December 31, 2013 | ||||||||||||||||||
AREP Embassy Row LLC | $ | — | $ | 37,442 | $ | 37,820 | $ | — | $ | 2,045 | $ | — | ||||||||||||
AREP Fifty-Seventh LLC | 24,215 | 3,965 | 29,248 | — | 3,676 | — | ||||||||||||||||||
ARK Real Estate Partners II LP | 7,866 | — | 8,187 | — | 1,366 | — | ||||||||||||||||||
ARK Real Estate Partners LP | 35,095 | — | — | — | — | 19,565 | ||||||||||||||||||
ARK Real Estate Partners II LP (common equity) | 824 | — | — | — | — | 456 | ||||||||||||||||||
AviatorCap SII, LLC I | 3,044 | — | 771 | — | 335 | 2,272 | ||||||||||||||||||
AviatorCap SII, LLC II | 4,390 | — | 1,446 | — | 432 | 2,945 | ||||||||||||||||||
AviatorCap SII, LLC III | 4,006 | — | 3,310 | — | 302 | 696 | ||||||||||||||||||
Crystal Financial LLC | 275,000 | — | — | — | 31,750 | 305,000 | ||||||||||||||||||
National Specialty Alloys, LLC | — | — | — | 472 | — | — | ||||||||||||||||||
RD Holdco Inc. (Rug Doctor , common equity) | — | 15,683 | — | — | — | 15,683 | ||||||||||||||||||
RD Holdco Inc. (Rug Doctor , Class B) | — | 5,216 | — | — | — | 5,216 | ||||||||||||||||||
RD Holdco Inc. (Rug Doctor , warrants) | — | 381 | — | — | — | 381 | ||||||||||||||||||
Rug Doctor LLC | — | 8,548 | — | — | 30 | 8,747 | ||||||||||||||||||
SOAGG LLC | — | 16,659 | — | — | 397 | 16,719 | ||||||||||||||||||
SOCAY Limited | 14,490 | 412 | 14,327 | — | 866 | — | ||||||||||||||||||
SODO Corp | 2,371 | 58 | 2,208 | — | 131 | — | ||||||||||||||||||
SOINT, LLC | 15,766 | — | 4,496 | — | 2,227 | 11,592 | ||||||||||||||||||
SOINT, LLC (preferred equity) | 8,667 | — | — | — | 1,300 | 9,533 | ||||||||||||||||||
USAW 767 | 3,076 | — | 1,991 | — | 315 | 1,085 | ||||||||||||||||||
|
|
|
|
|
|
|
|
|
|
|
| |||||||||||||
| $ | 398,810 | $ | 88,364 | $ | 103,804 | $ | 472 | $ | 45,172 | $ | 399,890 | |||||||||||||
|
|
|
|
|
|
|
|
|
|
|
| |||||||||||||
SOLAR CAPITAL LTD.
CONSOLIDATED SCHEDULE OF INVESTMENTS (continued)
December 31, 2013
(in thousands)
Name of Issuer | Fair Value at December 31, 2014 | Gross Additions | Gross Reductions | Realized Gain (Loss) | Interest/ Dividend /Other Income | Fair Value at December 31, 2015 | ||||||||||||||||||
ARK Real Estate Partners LP | $ | 885 | $ | — | $ | — | $ | (347 | ) | $ | — | $ | 364 | |||||||||||
ARK Real Estate Partners II LP | 21 | — | — | 2 | — | 9 | ||||||||||||||||||
AviatorCap SII, LLC I | 1,421 | — | 507 | — | 142 | 914 | ||||||||||||||||||
AviatorCap SII, LLC II | 1,358 | — | 1,008 | — | 81 | 350 | ||||||||||||||||||
Crystal Financial LLC | 297,500 | — | — | — | 31,600 | 290,000 | ||||||||||||||||||
National Specialty Alloys LLC | — | — | — | 198 | — | — | ||||||||||||||||||
RD Holdco Inc. (Rug Doctor, common equity). | 16,263 | — | — | — | — | 14,335 | ||||||||||||||||||
RD Holdco Inc. (Rug Doctor, class B) | 5,216 | — | — | — | — | 5,216 | ||||||||||||||||||
RD Holdco Inc. (Rug Doctor, warrants) | 290 | — | — | — | — | 214 | ||||||||||||||||||
Rug Doctor LLC | 9,020 | — | — | — | 1,226 | 8,838 | ||||||||||||||||||
Senior Secured Unitranche Loan Program LLC | — | 80,660 | — | — | 229 | 80,677 | ||||||||||||||||||
SOAGG LLC | 13,564 | 469 | 5,161 | — | 823 | 8,632 | ||||||||||||||||||
SOINT, LLC | 8,733 | — | 3,029 | — | 1,173 | 5,705 | ||||||||||||||||||
SOINT, LLC (preferred equity) | 9,533 | — | — | — | 1,299 | 9,316 | ||||||||||||||||||
|
|
|
|
|
|
|
|
|
|
|
| |||||||||||||
| $ | 363,804 | $ | 81,129 | $ | 9,705 | $ | (147 | ) | $ | 36,573 | $ | 424,570 | ||||||||||||
|
|
|
|
|
|
|
|
|
|
|
| |||||||||||||
| Denotes investments in which we are an “Affiliated Person” but not exercising a controlling influence, as defined in the 1940 Act, due to beneficially owning, either directly or through one or more controlled companies, more than 5% but less than 25% of the outstanding voting securities of the investment. Transactions during the year ended December 31, |
Name of Issuer | Fair Value at December 31, 2012 | Gross Additions | Gross Reductions | Realized Gain (Loss) | Interest/ Dividend Income | Fair Value at December 31, 2013 | ||||||||||||||||||
Direct Buy Inc. (common equity) | $ | — | $ | — | $ | — | $ | — | $ | — | $ | — | ||||||||||||
Direct Buy Inc. | 7,700 | 955 | 866 | — | 976 | 7,789 | ||||||||||||||||||
DS Waters of America, Inc. | 32,095 | 737 | 33,016 | (14,273 | ) | 5,357 | — | |||||||||||||||||
Participating Preferred Units of DSW Group Holdings LLC | — | — | — | — | — | — | ||||||||||||||||||
Senior Preferred 15% Units of DSW Group Holdings LLC | 125,611 | 5,628 | 121,149 | — | 5,565 | — | ||||||||||||||||||
|
|
|
|
|
|
|
|
|
|
|
| |||||||||||||
| $ | 165,406 | $ | 7,320 | $ | 155,031 | $ | (14,273 | ) | $ | 11,898 | $ | 7,789 | ||||||||||||
|
|
|
|
|
|
|
|
|
|
|
| |||||||||||||
Name of Issuer | Fair Value at December 31, 2014 | Gross Additions | Gross Reductions | Realized Gain (Loss) | Interest/ Dividend Income | Fair Value at December 31, 2015 | ||||||||||||||||||
Direct Buy Inc. (common equity) | $ | — | $ | — | $ | — | $ | — | $ | — | $ | — | ||||||||||||
Direct Buy Inc. (senior secured loan) | 4,646 | 1,100 | — | — | — | 1,233 | ||||||||||||||||||
DSW Group Holdings LLC | — | — | — | (1,163 | )† | — | — | |||||||||||||||||
|
|
|
|
|
|
|
|
|
|
|
| |||||||||||||
| $ | 4,646 | $ | 1,100 | $ | — | $ | (1,163 | ) | $ | — | $ | 1,233 | ||||||||||||
|
|
|
|
|
|
|
|
|
|
|
| |||||||||||||
| The following |
| Indicates assets that the Company believes may not represent “qualifying assets” under Section 55(a) of the Investment Company Act of 1940 (“1940 Act”), as amended. If we fail to invest a sufficient portion of our assets in qualifying assets, we could be prevented from making follow-on investments in existing portfolio companies or could be required to dispose of investments at inappropriate times in order to comply with the 1940 Act. As of December 31, 2015, on a fair value basis, non-qualifying assets in the portfolio represented 27.2% of the total assets of the Company. |
| Solar Capital Ltd.’s investments in SOAGG, LLC and SOINT, LLC include a two and one dollar investment in common shares, respectively. |
| Bishop Lifting Products, Inc., SEI Holding I Corporation, Singer Equities, Inc. & Hampton Rubber Company are co-borrowers. |
| (9) | Investment represents the operating company after consolidation of the holding company Crystal Capital Financial Holdings LLC. |
See notes to consolidated financial statements.
SOLAR CAPITAL LTD.
CONSOLIDATED SCHEDULE OF INVESTMENTS (continued)(Continued)
December 31, 20132015
(in thousands)
| (11) | Floating rate instruments accrue interest at a predetermined spread relative to an index, typically the LIBOR or PRIME rate. These instruments are typically subject to a LIBOR or PRIME rate floor. |
| * | Non-income producing security. |
| ** | Investment is on non-accrual status. |
| † | Represents estimated change in receivable balance. |
Industry Classification | Percentage of Total Investments (at fair value) as of December 31, | |||
Diversified Financial Services | % | |||
| % | |||
| % | |||
| % | |||
| % | |||
| % | |||
| % | |||
Multi-Sector Holdings | 3.6 | % | ||
Health Care Equipment & Supplies | % | |||
Health Care Technology | % | |||
Pharmaceuticals | 3.2 | % | ||
Building Products | 3.0 | % | ||
Trading Companies & Distributors | 3.0 | % | ||
Consumer Finance | % | |||
Aerospace & Defense | 2.3 | % | ||
Diversified Consumer Services | % | |||
| % | |||
| ||||
| ||||
| 1.9 | % | ||
| % | |||
| % | |||
Communications Equipment | 1.4 | % | ||
Life Sciences Tools & Services | 1.2 | % | ||
Air Freight & Logistics | 1.0 | % | ||
Media | 1.0 | % | ||
Construction & Engineering | ||||
| ||||
| ||||
| ||||
| 1.0 | % | ||
| ||||
| 0.7 | % | ||
Industrial Conglomerates | % | |||
Multiline Retail | 0.1 | % | ||
Research & Consulting Services | 0.0 | % | ||
Diversified Real Estate Activities | 0.0 | % | ||
|
| |||
Total Investments | 100.0 | % | ||
|
| |||
See notes to consolidated financial statements.
NOTES TO CONSOLIDATED FINANCIAL STATEMENTS
December 31, 20142016
(in thousands, except share amounts)
Note 1. Organization
Solar Capital LLC, a Maryland limited liability company, was formed in February 2007 and commenced operations on March 13, 2007 with initial capital of $1,200,000 of which 47.04% was funded by affiliated parties.
Immediately prior to our initial public offering, through a series of transactions, Solar Capital Ltd. merged with Solar Capital LLC, leaving Solar Capital Ltd. as the surviving entity (the “Merger”). Solar Capital Ltd. issued an aggregate of approximately 26.65 million shares of common stock and $125,000 in senior unsecured notes to the existing Solar Capital LLC unit holders in connection with the Merger. Solar Capital Ltd. had no assets or operations prior to completion of the Merger and as a result, the historical books and records of Solar Capital LLC have become the books and records of the surviving entity. The number of shares used to calculate weighted average shares for use in computations on a per share basis have been decreased retroactively by a factor of approximately 0.4022 for all periods prior to February 9, 2010. This factor represents the effective impact of the reduction in shares resulting from the Merger.
Solar Capital Ltd. (“Solar Capital”, the “Company”, “we”, “us” or “we”“our”), a Maryland corporation formed in November 2007, is a closed-end, externally managed, non-diversified management investment company that has elected to be treatedregulated as a business development company (“BDC”) under the Investment Company Act of 1940, as amended (the “1940 Act”). Furthermore, as the Company is an investment company, it continues to apply the guidance in FASB Accounting Standards Codification (“ASC”) Topic 946. In addition, for tax purposes, the Company has elected to be treated as a regulated investment company (“RIC”) under Subchapter M of the Internal Revenue Code of 1986, as amended (the “Code”).
On February 9, 2010, Solar Capital priced its initial public offering, selling 5.68 million shares, including the underwriters’ over-allotment, at a price of $18.50 per share. Concurrent with this offering, the Company’s senior management purchased an additional 600,000 shares through a private placement, also at $18.50 per share.
The Company’s investment objective is to generatemaximize both current income and capital appreciation through debt and equity investments. The Company invests primarily in leveraged middle market companies in the form of senior secured loans, unitranche loans, mezzanine loans and equity securities. From time to time, we may also invest in public companies that are thinly traded.
Note 2. Significant Accounting Policies
The accompanying consolidated financial statements have been prepared on the accrual basis of accounting in conformity with accounting principles generally accepted in the United States of America (“GAAP”), and include the accounts of the Company and its wholly-owned subsidiaries. The consolidated financial statements reflect all adjustments and reclassifications which, in the opinion of management, are necessary for the fair presentation of the results of the operations and financial condition for the periods presented. All significant intercompany balances and transactions have been eliminated. Certain prior period amounts may have been reclassified to conform to the current period presentation.
The preparation of consolidated financial statements in conformity with GAAP and pursuant to the requirements for reporting onForm 10-K and Regulation S-X, as appropriate, also requires management to make estimates and assumptions that affect the reported amount of assets and liabilities at the date of the financial statements and the reported amounts of income and expenses during the reported periods. Changes in the economic environment, financial markets and any other parameters used in determining these estimates could cause actual results to differ materially.
SOLAR CAPITAL LTD.
NOTES TO CONSOLIDATED FINANCIAL STATEMENTS (continued)
December 31, 20142016
(in thousands, except share amounts)
In the opinion of management, all adjustments, which are of a normal recurring nature, considered necessary for the fair presentation of financial statements have been included.
The significant accounting policies consistently followed by the Company are:
| (a) | Investment transactions are accounted for on the trade date; |
| (b) | Under procedures established by our board of directors (the “Board”), we value investments, including certain senior secured debt, subordinated debt and other debt securities with maturities greater than 60 days, for which market quotations are readily available, at such market quotations (unless they are deemed not to represent fair value). We attempt to obtain market quotations from at least two brokers or dealers (if available, otherwise from a principal market maker or a primary market dealer or other independent pricing service). We utilize mid-market pricing as a practical expedient for fair value unless a different point within the range is more representative. If and when market quotations are deemed not to represent fair value, we typically utilize independent third-party valuation firms to assist us in determining fair value. Accordingly, such investments go through our multi-step valuation process as described below. In each case, |
With respect to investments for which market quotations are not readily available or when such market quotations are deemed not to represent fair value, our Board has approved a multi-step valuation process each quarter, as described below:
| (1) | our quarterly valuation process begins with each portfolio company or investment being initially valued by the investment professionals of the Investment Adviser responsible for the portfolio investment; |
| (2) | preliminary valuation conclusions are then documented and discussed with senior management of the Investment Adviser; |
| (3) | independent valuation firms engaged by our Board conduct independent appraisals and review the Investment Adviser’s preliminary valuations and make their own independent |
| (4) | the audit committee of the Board reviews the preliminary valuation of the Investment Adviser and that of the independent valuation firm and responds to the valuation recommendation of the independent valuation firm to reflect any comments; and |
| (5) | the Board discusses valuations and determines the fair value of each investment in our portfolio in good faith based on the input of the Investment Adviser, the respective independent valuation firm and the audit committee. |
SOLAR CAPITAL LTD.
NOTES TO CONSOLIDATED FINANCIAL STATEMENTS (continued)
December 31, 2014
(in thousands, except share amounts)
Investments in all asset classes are valued utilizing a market approach, an income approach, or both approaches, as appropriate. However, in accordance with ASC 820-10, certain investments that qualify as investment companies in accordance with ASC 946, may be valued using net asset value as a
SOLAR CAPITAL LTD.
NOTES TO CONSOLIDATED FINANCIAL STATEMENTS (continued)
December 31, 2016
(in thousands, except share amounts)
practical expedient for fair value. The market approach uses prices and other relevant information generated by market transactions involving identical or comparable assets or liabilities (including a business). The income approach uses valuation techniques to convert future amounts (for example, cash flows or earnings) to a single present amount (discounted). The measurement is based on the value indicated by current market expectations about those future amounts. In following these approaches, the types of factors that we may take into account in fair value pricing our investments include, as relevant: available current market data, including relevant and applicable market trading and transaction comparables, applicable market yields and multiples, security covenants, call protection provisions, the nature and realizable value of any collateral, the portfolio company’s ability to make payments, its earnings and discounted cash flows, the markets in which the portfolio company does business, comparisons of financial ratios of peer companies that are public, M&A comparables, our principal market (as the reporting entity) and enterprise values, among other factors. When available, broker quotations and/or quotations provided by pricing services are considered as an input in the valuation process. Escrow receivables, if any, included in the receivables for investments sold in the Consolidated Statements of Assets and Liabilities are reviewed quarterly and the value of the receivable is adjusted as necessary. For the fiscal year ended December 31, 2014,2016, there has been no change to the Company’s valuation techniques and the nature of the related inputs considered in the valuation process.
ASC Topic 820 classifies the inputs used to measure these fair values into the following hierarchy:
Level 1: Quoted prices in active markets for identical assets or liabilities, accessible by the Company at the measurement date.
Level 2: Quoted prices for similar assets or liabilities in active markets, or quoted prices for identical or similar assets or liabilities in markets that are not active, or other observable inputs other than quoted prices.
Level 3: Unobservable inputs for the asset or liability.
In all cases, the level in the fair value hierarchy within which the fair value measurement in its entirety falls is determined based on the lowest level of input that is significant to the fair value measurement. Our assessment of the significance of a particular input to the fair value measurement in its entirety requires judgment and considers factors specific to each investment. The exercise of judgment is based in part on our knowledge of the asset class and our prior experience.
| (c) | Gains or losses on investments are calculated by using the specific identification method. |
| (d) | The Company records dividend income and interest, adjusted for amortization of premium and accretion of discount, on an accrual basis. Loan origination fees, original issue discount, and market discounts are capitalized and we amortize such amounts into income using the effective interest method or on a straight-line basis, as applicable. Upon the prepayment of a loan, any unamortized loan origination fees are recorded as interest income. We |
| (e) | The Company intends to comply with the applicable provisions of the Internal Revenue Code pertaining to regulated investment companies to make distributions of taxable income sufficient to relieve it of substantially all U.S. federal income taxes. The Company, at its discretion, may carry forward taxable income in excess of calendar year distributions and pay a 4% excise tax on this income. The Company will accrue excise tax on such estimated excess taxable income as appropriate. |
SOLAR CAPITAL LTD.
NOTES TO CONSOLIDATED FINANCIAL STATEMENTS (continued)
December 31, 20142016
(in thousands, except share amounts)
| (f) | Book and tax basis differences relating to stockholder distributions and other permanent book and tax differences are typically reclassified among the Company’s capital accounts. In addition, the character of income and gains to be distributed is determined in accordance with income tax regulations that may differ from GAAP; accordingly at December 31, |
| (g) | Distributions to common stockholders are recorded as of the record date. The amount to be paid out as a distribution is determined by the Board. Net realized capital gains, if any, are generally distributed or deemed distributed at least annually. |
| (h) | In accordance with Regulation S-X and ASC Topic 810—Consolidation, the Company consolidates its interest in investment company subsidiaries, financing subsidiaries and certain wholly-owned holding companies that serve to facilitate investment in portfolio companies. In addition, the Company may also consolidate any controlled operating companies substantially all of whose business consists of providing services to the Company. |
| (i) | The accounting records of the Company are maintained in U.S. dollars. Any assets and liabilities denominated in foreign currencies are translated into U.S. dollars based on the rate of exchange of such currencies against U.S. dollars on the date of valuation. The Company will not isolate that portion of the results of operations resulting from changes in foreign exchange rates on investments from the fluctuations arising from changes in market prices of securities held. Such fluctuations would be included with the net unrealized gain or loss from investments. The Company’s investments in foreign securities, if any, may involve certain risks, including without limitation: foreign exchange restrictions, expropriation, taxation or other political, social or economic risks, all of which could affect the market and/or credit risk of the investment. In addition, changes in the relationship of foreign currencies to the U.S. dollar can significantly affect the value of these investments in terms of U.S. dollars and therefore the earnings of the Company. |
| (j) | The Company has made an irrevocable election to apply the fair value option of accounting to its senior secured credit facility (the “Credit Facility”), its unsecured senior notes due 2022 (the “2022 Unsecured Notes”) and its senior secured notes (the “Senior Secured Notes”) (see note 6 and 8), in accordance with ASC 825-10. The Company uses an independentthird-party valuation firm to assist in measuring their fair value. |
| (k) |
| (l) | The Company may enter into forward exchange contracts in order to hedge against foreign currency risk. These contracts are marked-to-market by recognizing the difference between the contract exchange rate and the current market rate as unrealized appreciation or depreciation. Realized gains or losses are recognized when contracts are settled. |
SOLAR CAPITAL LTD.
NOTES TO CONSOLIDATED FINANCIAL STATEMENTS (continued)
December 31, 20142016
(in thousands, except share amounts)
| (m) | The Company records expenses related to shelf registration statements and applicable equity offering costs as prepaid assets. These expenses are typically charged as a reduction of capital upon utilization, in accordance with ASC 946-20-25. Certain subsequent costs are expensed per the AICPA Audit & Accounting Guide for Investment Companies. |
| (n) | Investments that are expected to pay regularly scheduled interest in cash are generally placed on non-accrual status when principal or interest cash payments are past due 30 days or more and/or when it is no longer probable that principal or interest cash payments will be collected. Such non-accrual investments are restored to accrual status if past due principal and interest are paid in cash, and in management’s judgment, are likely to continue timely payment of their remaining principal and interest obligations. Cash interest payments received on investments may be recognized as income or applied to principal depending on management’s judgment. |
| (o) | The Company defines cash equivalents as securities that are readily convertible into known amounts of cash and so near their maturity that they present insignificant risk of changes in value because of changes in interest rates. Generally, only securities with a maturity of three months or less |
Recent Accounting Pronouncements
In February 2015, the FASB issued Accounting Standards Update (“ASU”) 2015-02, Consolidation (Topic 810)—Amendments to the Consolidation Analysis. The update changes the analysis that a reporting entity must perform to determine whether it should consolidate certain types of legal entities. Public companies are required to apply ASU 2015-02 for interim and annual reporting periods beginning after December 15, 2015. Accordingly, the Company has evaluated the impact of ASU 2015-02 on its consolidated financial statements and determined that the adoption of ASU 2015-02 has not had a material impact on our consolidated financial statements.
In April 2015, the FASB issued ASU 2015-03, Interest—Imputation of Interest (Subtopic 835-30)—Simplifying the Presentation of Debt Issuance Costs. The update requires that debt issuance costs related to a recognized debt liability be presented in the balance sheet as a direct deduction from the carrying amount of that debt liability, consistent with debt discounts. Public companies are required to apply ASU 2015-03 retrospectively for interim and annual reporting periods beginning after December 15, 2015. Accordingly, the Company has evaluated the impact of ASU 2015-03 on its consolidated financial statements and determined that the adoption of ASU 2015-03 has not had a material impact on our consolidated financial statements.
In May 2015, the FASB issued ASU 2015-07, Disclosures for Investments in Certain Entities That Calculate Net Asset Value per Share (or Its Equivalent). The update eliminates the requirement to categorize investments in the fair value hierarchy if their fair value is measured at net asset value (NAV) per share (or its equivalent) using the practical expedient in the FASB’s fair value measurement guidance. Public companies are required to apply ASU 2015-07 retrospectively for interim and annual reporting periods beginning after December 15, 2015. Accordingly, the Company has evaluated the impact of ASU 2015-07 on its consolidated financial statements and determined that the adoption of ASU 2015-07 has not had a material impact on our consolidated financial statements.
In November 2016, FASB issued ASU 2016-18, Statement of Cash Flows, which will amend FASB ASC 230. The amendments in this Update require that a statement of cash flows explain the change during the period in the total of cash, cash equivalents, and amounts generally described as restricted
SOLAR CAPITAL LTD.
NOTES TO CONSOLIDATED FINANCIAL STATEMENTS (continued)
December 31, 2016
(in thousands, except share amounts)
cash or restricted cash equivalents. Therefore, amounts generally described as restricted cash and restricted cash equivalents should be included with cash and cash equivalents when reconciling the beginning-of-period and end-of-period total amounts shown on the statement of cash flows. The amendments in this Update apply to all entities that have restricted cash or restricted cash equivalents and are required to present a statement of cash flows under Topic 230. For public business entities, the amendments are effective for fiscal years beginning after December 15, 2017, and interim periods within those fiscal years. Early adoption is permitted, including adoption in an interim period. The Company is evaluating the impact of ASU 2016-18 on its consolidated financial statements and disclosures.
In December 2016, the FASB issued ASU 2016-19, Technical Corrections and Improvements. As part of this guidance, ASU 2016-19 amends FASB ASC 820 to clarify the difference between a valuation approach and a valuation technique. The amendment also requires an entity to disclose when there has been a change in either or both a valuation approach and/or a valuation technique. ASU 2016-19 is effective on a prospective basis for financial statements issued for fiscal years, and interim periods within those fiscal years, beginning after December 15, 2016 on a prospective basis. The Company is evaluating the impact of ASU 2016-19 on its consolidated financial statements and disclosures.
Note 3. Agreements
Solar Capital has an Investment Advisory and Management Agreement with the Investment Adviser, under which the Investment Adviser will manage the day-to-day operations of, and provide investment advisory services to, Solar Capital. For providing these services, the Investment Adviser receives a fee from Solar Capital, consisting of two components—a base management fee and an incentive fee. The base management fee is determined by taking the average value of Solar Capital’s gross assets at the end of the two most recently completed calendar quarters calculated at an annual rate of 2.00%. From time-to-time we may purchase U.S. Treasury bills or other high-quality, short-term debt securities at or near the end of the quarter and typically close out the position on a net cash basis subsequent to quarter end. We may also utilize repurchase agreements or other balance sheet transactions, including drawing down on our credit facilities, as deemed appropriate. The amount of these transactions or such drawn cash for this purpose is excluded from total assets forFor purposes of computing the asset base upon which the management fee, is determined.gross assets exclude temporary assets acquired at the end of each fiscal quarter for purposes of preserving investment flexibility in the next fiscal quarter. Temporary assets include, but are not limited to, U.S. treasury bills, other short-term U.S. government or government agency securities, repurchase agreements or cash borrowings.
The incentive fee has two parts, as follows: one part is calculated and payable quarterly in arrears based on Solar Capital’s pre-incentive fee net investment income for the immediately preceding calendar quarter. For this purpose, pre-incentive fee net investment income means interest income, dividend income and any other income (including any other fees (other than fees for providing managerial assistance), such as commitment, origination, structuring, diligence and consulting fees or other fees that we receive from portfolio companies) accrued during the calendar quarter, minus Solar Capital’s operating expenses for the quarter (including the base management fee, any expenses payable under the Administration Agreement, and any interest expense and distributions paid on any issued and outstanding preferred stock, but excluding the incentive fee). Pre-incentive fee net investment income does not include any realized capital gains computed net of all realizedor losses, or unrealized capital losses and unrealized capitalappreciation or depreciation. Pre-incentive fee net investment income, expressed as a rate of return on the value of Solar Capital’s net assets at the end of the immediately preceding calendar quarter, is compared to the hurdle rate of 1.75% per quarter (7% annualized). Our net investment income used to calculate this part of the incentive fee is also included in the amount of our gross assets used to calculate the 2% base management fee. Solar Capital pays the Investment Adviser an incentive fee with respect to Solar Capital’s pre-incentive fee net investment income in each calendar quarter as follows: (1) no incentive fee in any calendar quarter in which Solar Capital’s pre-incentive fee net investment income does not exceed the hurdle rate; (2) 100% of Solar Capital’s pre-incentive fee net investment income with respect to that portion of such pre-incentive fee net investment income, if any, that exceeds the hurdle rate but is less than 2.1875% in any calendar quarter; and (3) 20% of the amount of Solar
SOLAR CAPITAL LTD.
NOTES TO CONSOLIDATED FINANCIAL STATEMENTS (continued)
December 31, 2014
(in thousands, except share amounts)
Capital’s pre-incentive fee net investment income, if any, that exceeds 2.1875% in any calendar quarter. These calculations are appropriately pro-rated for any period of less than three months.
SOLAR CAPITAL LTD.
NOTES TO CONSOLIDATED FINANCIAL STATEMENTS (continued)
December 31, 2016
(in thousands, except share amounts)
The second part of the incentive fee is determined and payable in arrears as of the end of each calendar year (or upon termination of the Investment Advisory and Management Agreement, as of the termination date), and will equal 20% of Solar Capital’s cumulative realized capital gains less cumulative realized capital losses, unrealized capital depreciation (unrealized depreciation on a gross investment-by-investment basis at the end of each calendar year) and all net capital gains upon which prior performance-based capital gains incentive fee payments were previously made to the Investment Adviser. For financial statement purposes, the second part of the incentive fee is accrued based upon 20% of cumulative net realized gains and net unrealized capital appreciation. No accrual was required for the fiscal years ended December 31, 2014, 20132016, 2015 and 2012.2014.
For the fiscal years ended December 31, 2014, 20132016, 2015 and 2012,2014, the Company recognized $24,651, $26,794$28,115, $24,678 and $23,647,$24,651, respectively, in base management fees and $7,411, $21,234$17,775, $4,374 and $20,481,$7,411, respectively, in gross performance-based incentive fees. For the fiscal years ended December 31, 2016, 2015 and 2014, $0, $1,694 and $0, respectively, of such performance-based incentive fees were waived. The voluntary fee waiver in 2015 was made at the Investment Adviser’s discretion and is not subject to recapture by the Investment Adviser or reimbursement by the Company.
Solar Capital has also entered into an Administration Agreement with Solar Capital Management, LLC (the “Administrator”) under which the Administrator provides administrative services to Solar Capital. For providing these services, facilities and personnel, Solar Capital reimburses the Administrator for Solar Capital’s allocable portion of overhead and other expenses incurred by the Administrator in performing its obligations under the Administration Agreement, including rent. The Administrator will also provide, on Solar Capital’s behalf, managerial assistance to those portfolio companies to which Solar Capital is required to provide such assistance.
For the fiscal years ended December 31, 2014, 20132016, 2015 and 2012,2014, the Company recognized expenses under the Administration Agreement of $5,362, $4,741$5,990, $5,081 and $3,294,$5,362, respectively. No managerial assistance fees were accrued or collected for the fiscal years ended December 31, 2014, 20132016, 2015 and 2012.2014.
Note 4. Net Asset Value Per Share
At December 31, 2014,2016, the Company’s total net assets and net asset value per share were $936,568$918,507 and $22.05,$21.74, respectively. This compares to total net assets and net asset value per share at December 31, 20132015 of $995,637$882,698 and $22.50,$20.79, respectively.
Note 5. Earnings Per Share
The following table sets forth the computation of basic and diluted net increase in net assets per share resulting from operations, pursuant to ASC 260-10, for the years ended December 31, 2014, 20132016, 2015 and 2012:2014:
| Year ended December 31, 2014 | Year ended December 31, 2013 | Year ended December 31, 2012 | Year ended December 31, 2016 | Year ended December 31, 2015 | Year ended December 31, 2014 | |||||||||||||||||||
Earnings per share (basic & diluted) | ||||||||||||||||||||||||
Numerator—net increase in net assets resulting from operations: | $ | 48,452 | $ | 75,310 | $ | 115,761 | ||||||||||||||||||
Denominator—weighted average shares: | 42,888,232 | 44,571,118 | 37,231,341 | |||||||||||||||||||||
Numerator - net increase in net assets resulting from operations: | $ | 106,815 | $ | 14,080 | $ | 48,452 | ||||||||||||||||||
Denominator - weighted average shares: | 42,258,143 | 42,465,158 | 42,888,232 | |||||||||||||||||||||
Earnings per share: | $ | 1.13 | $ | 1.69 | $ | 3.11 | $ | 2.53 | $ | 0.33 | $ | 1.13 | ||||||||||||
SOLAR CAPITAL LTD.
NOTES TO CONSOLIDATED FINANCIAL STATEMENTS (continued)
December 31, 20142016
(in thousands, except share amounts)
Note 6. Fair Value
Fair value is defined as the price that would be received to sell an asset or paid to transfer a liability in an orderly transaction between market participants at the measurement date. GAAP establishes a framework for measuring fair value that includes a hierarchy used to classify the inputs used in measuring fair value. The hierarchy prioritizes the inputs to valuation techniques used to measure fair value into three levels. The level in the fair value hierarchy within which the fair value measurement falls is determined based on the lowest level input that is significant to the fair value measurement. The levels of the fair value hierarchy are as follows:
Level 1. Financial assets and liabilities whose values are based on unadjusted quoted prices for identical assets or liabilities in an active market that the Company has the ability to access.
Level 2. Financial assets and liabilities whose values are based on quoted prices in markets that are not active or model inputs that are observable either directly or indirectly for substantially the full term of the asset or liability. Level 2 inputs include the following:
| a) | Quoted prices for similar assets or liabilities in active markets; |
| b) | Quoted prices for identical or similar assets or liabilities in non-active markets; |
| c) | Pricing models whose inputs are observable for substantially the full term of the asset or liability; and |
| d) | Pricing models whose inputs are derived principally from or corroborated by observable market data through correlation or other means for substantially the full term of the asset or liability. |
Level 3.Financial assets and liabilities whose values are based on prices or valuation techniques that require inputs that are both unobservable and significant to the overall fair value measurement. These inputs reflect management’s and, if applicable, an independent third-party valuation firm’s own assumptions about the assumptions a market participant would use in pricing the asset or liability.
When the inputs used to measure fair value fall within different levels of the hierarchy, the level within which the fair value measurement is categorized is based on the lowest level input that is significant to the fair value measurement in its entirety. For example, a Level 3 fair value measurement may include inputs that are observable (Levels 1 and 2) and unobservable (Level 3).
Gains and losses for assets and liabilities categorized within the Level 3 table below may include changes in fair value that are attributable to both observable inputs (Levels 1 and 2) and unobservable inputs (Level 3).
A review of fair value hierarchy classifications is conducted on a quarterly basis. Changes in the observability of valuation inputs may result in a reclassification for certain financial assets or liabilities. Such reclassifications are reported as transfers in/out of the appropriate category as of the end of the quarter in which the reclassifications occur.
SOLAR CAPITAL LTD.
NOTES TO CONSOLIDATED FINANCIAL STATEMENTS (continued)
December 31, 20142016
(in thousands, except share amounts)
The following tables present the balances of assets and liabilities measured at fair value on a recurring basis, as of December 31, 20142016 and 2013:2015:
Fair Value Measurements
As of December 31, 20142016
| Level 1 | Level 2 | Level 3 | Total | Level 1 | Level 2 | Level 3 | Measured at Net Asset Value* | Total | ||||||||||||||||||||||||||||
Assets: | ||||||||||||||||||||||||||||||||||||
Bank Debt/Senior Secured Loans | $ | — | $ | 78,115 | $ | 521,791 | $ | 599,906 | $ | — | $ | 28,744 | $ | 759,510 | $ | — | $ | 788,254 | ||||||||||||||||||
Subordinated Debt/Corporate Notes | — | — | 76,140 | 76,140 | — | — | 28,059 | — | 28,059 | |||||||||||||||||||||||||||
Preferred Equity | — | — | 23,097 | 23,097 | — | — | 14,906 | — | 14,906 | |||||||||||||||||||||||||||
Common Equity/Partnership Interests/ | 1,171 | — | 320,424 | 321,595 | ||||||||||||||||||||||||||||||||
Common Equity/Equity Interests/Warrants | 701 | — | 324,842 | 148,016 | 473,559 | |||||||||||||||||||||||||||||||
|
|
|
|
|
|
|
|
| ||||||||||||||||||||||||||||
Total Investments | $ | 1,171 | $ | 78,115 | $ | 941,452 | $ | 1,020,738 | $ | 701 | $ | 28,744 | $ | 1,127,317 | $ | 148,016 | $ | 1,304,778 | ||||||||||||||||||
|
|
|
|
|
|
|
|
| ||||||||||||||||||||||||||||
Liabilities: | ||||||||||||||||||||||||||||||||||||
Credit Facility and Senior Secured Notes | $ | — | $ | — | $ | 125,000 | $ | 125,000 | ||||||||||||||||||||||||||||
Credit Facility, Senior Secured Notes and 2022 Unsecured Notes | $ | — | $ | — | $ | 290,200 | $ | — | $ | 290,200 | ||||||||||||||||||||||||||
|
|
|
|
|
|
|
|
| ||||||||||||||||||||||||||||
| * | In accordance with ASC 820-10, certain investments that are measured using the net asset value per share (or its equivalent) as a practical expedient for fair value have not been classified in the fair value hierarchy. The fair value amounts presented in this table are intended to permit reconciliation of the fair value hierarchy to the amounts presented in the Consolidated Statements of Assets and Liabilities. |
Fair Value Measurements
As of December 31, 20132015
| Level 1 | Level 2 | Level 3 | Total | Level 1 | Level 2 | Level 3 | Measured at Net Asset Value* | Total | ||||||||||||||||||||||||||||
Assets: | ||||||||||||||||||||||||||||||||||||
Bank Debt/Senior Secured Loans | $ | — | $ | 87,940 | $ | 356,462 | $ | 444,402 | $ | — | $ | 35,745 | $ | 800,291 | $ | — | $ | 836,036 | ||||||||||||||||||
Subordinated Debt/Corporate Notes | — | 12,390 | 241,702 | 254,092 | — | — | 67,314 | — | 67,314 | |||||||||||||||||||||||||||
Preferred Equity | — | — | 26,307 | 26,307 | — | — | 17,948 | — | 17,948 | |||||||||||||||||||||||||||
Common Equity/Partnership Interests/ | 213 | — | 363,385 | 363,598 | ||||||||||||||||||||||||||||||||
Common Equity/Equity Interests/Warrants | 377 | — | 310,239 | 80,677 | 391,293 | |||||||||||||||||||||||||||||||
|
|
|
|
|
|
|
|
| ||||||||||||||||||||||||||||
Total Investments | $ | 213 | $ | 100,330 | $ | 987,856 | $ | 1,088,399 | $ | 377 | $ | 35,745 | $ | 1,195,792 | $ | 80,677 | $ | 1,312,591 | ||||||||||||||||||
|
|
|
|
|
|
|
|
| ||||||||||||||||||||||||||||
Derivative assets—interest rate caps and foreign exchange contracts | — | — | — | — | ||||||||||||||||||||||||||||||||
Liabilities: | ||||||||||||||||||||||||||||||||||||
Credit Facility and Senior Secured Notes | $ | — | $ | — | $ | 125,000 | $ | 125,000 | $ | — | $ | — | $ | 332,900 | $ | — | $ | 332,900 | ||||||||||||||||||
|
|
|
|
|
|
|
|
| ||||||||||||||||||||||||||||
| * | In accordance with ASC 820-10, certain investments that are measured using the net asset value per share (or its equivalent) as a practical expedient for fair value have not been classified in the fair value hierarchy. The fair value amounts presented in this table are intended to permit reconciliation of the fair value hierarchy to the amounts presented in the Consolidated Statements of Assets and Liabilities. |
SOLAR CAPITAL LTD.
NOTES TO CONSOLIDATED FINANCIAL STATEMENTS (continued)
December 31, 20142016
(in thousands, except share amounts)
The following tables providesprovide a summary of the changes in fair value of Level 3 assets and liabilities for the year ended December 31, 20142016 and the year ended December 31, 2013,2015 as well as the portion of gains or losses included in income attributable to unrealized gains or losses related to those assets and liabilities still held at December 31, 20142016 and December 31, 2013:2015:
Fair Value Measurements Using Level 3 Inputs
| Bank Debt/ Senior Secured Loans | Subordinated Debt/ Corporate Notes | Preferred Equity | Common Equity/ Partnership Interests/ Warrants | Bank Debt/ Senior Secured Loans | Subordinated Debt/ Corporate Notes | Preferred Equity | Common Equity/ Equity Interests/ Warrants | |||||||||||||||||||||||||
Fair value, December 31, 2013 | $ | 356,462 | $ | 241,702 | $ | 26,307 | $ | 363,385 | ||||||||||||||||||||||||
Fair value, December 31, 2015 | $ | 800,291 | $ | 67,314 | $ | 17,948 | $ | 310,239 | ||||||||||||||||||||||||
Total gains or losses included in earnings: | ||||||||||||||||||||||||||||||||
Net realized gain (loss) | (469 | ) | — | 21 | (32,021 | ) | 702 | 77 | — | (144 | ) | |||||||||||||||||||||
Net change in unrealized gain (loss) | (15,763 | ) | (4,319 | ) | 584 | 33,827 | 10,613 | 8,479 | (452 | ) | 8,360 | |||||||||||||||||||||
Purchase of investment securities | 531,265 | 2,813 | 517 | 132 | 317,268 | 189 | — | 6,387 | ||||||||||||||||||||||||
Proceeds from dispositions of investment securities | (367,364 | ) | (164,056 | ) | (4,332 | ) | (44,899 | ) | (369,364 | ) | (48,000 | ) | (2,590 | ) | — | |||||||||||||||||
Transfers in/out of Level 3 | 17,660 | — | — | — | — | — | — | — | ||||||||||||||||||||||||
|
|
|
|
|
|
|
| |||||||||||||||||||||||||
Fair value, December 31, 2014 | $ | 521,791 | $ | 76,140 | $ | 23,097 | $ | 320,424 | ||||||||||||||||||||||||
Fair value, December 31, 2016 | $ | 759,510 | $ | 28,059 | $ | 14,906 | $ | 324,842 | ||||||||||||||||||||||||
|
|
|
|
|
|
|
| |||||||||||||||||||||||||
Unrealized gains (losses) for the period relating to those Level 3 assets that were still held by the Company at the end of the period: | ||||||||||||||||||||||||||||||||
Net change in unrealized gain (loss): | $ | (10,623 | ) | $ | (234 | ) | $ | 601 | $ | 14,455 | ||||||||||||||||||||||
Net change in unrealized gain (loss) | $ | 6,943 | $ | 602 | $ | (452 | ) | $ | 8,362 | |||||||||||||||||||||||
|
|
|
| |||||||||||||||||||||||||||||
During the fiscal year ended December 31, 2014, investments with a fair value of $17,660 were transferred from Level 2 to Level 3. These transfers were a result of changes in the quantity and quality of information used as valuation inputs by the Investment Adviser. There were no other transfers between levels.
The following table shows a reconciliation of the beginning and ending balances for fair valued liabilities measured using significant unobservable inputs (Level 3) for the year ended December 31, 2014:
Beginning fair value at December 31, 2013 | $ | 125,000 | ||
Net realized (gain) loss | — | |||
Net change in unrealized (gain) loss | — | |||
Borrowings | — | |||
Repayments | — | |||
Transfers in/out of Level 3 | — | |||
|
| |||
Ending fair value at December 31, 2014 | $ | 125,000 | ||
|
|
The Company has made an irrevocable election to apply the fair value option of accounting to the Credit Facility and the Senior Secured Notes, in accordance with ASC 825-10. On December 31, 2014, there were borrowings of $50,000 and $75,000, respectively, on the Credit Facility and the Senior Secured Notes. The Company used an independent third-party valuation firm to measure the fair value of the Credit Facility and Senior Secured Notes.
SOLAR CAPITAL LTD.
NOTES TO CONSOLIDATED FINANCIAL STATEMENTS (continued)
December 31, 2014
(in thousands, except share amounts)
Fair Value Measurements Using Level 3 Inputs
| Bank Debt/ Senior Secured Loans | Subordinated Debt/ Corporate Notes | Preferred Equity | Common Equity/ Partnership Interests/ Warrants | |||||||||||||
Fair value, December 31, 2012 | $ | 444,568 | $ | 413,752 | $ | 151,190 | $ | 321,378 | ||||||||
Total gains or losses included in earnings: | ||||||||||||||||
Net realized gain (loss) | (3,185 | ) | (29,153 | ) | (14,273 | ) | — | |||||||||
Net change in unrealized gain (loss) | (3,605 | ) | 10,654 | 4,318 | 20,727 | |||||||||||
Purchase of investment securities | 232,819 | 4,130 | 22,756 | 21,280 | ||||||||||||
Proceeds from dispositions of investment securities | (314,135 | ) | (157,681 | ) | (137,684 | ) | — | |||||||||
Transfers in/out of Level 3 | — | — | — | — | ||||||||||||
|
|
|
|
|
|
|
| |||||||||
Fair value, December 31, 2013 | $ | 356,462 | $ | 241,702 | $ | 26,307 | $ | 363,385 | ||||||||
|
|
|
|
|
|
|
| |||||||||
Unrealized gains (losses) for the period relating to those Level 3 assets that were still held by the Company at the end of the period: | ||||||||||||||||
Net change in unrealized gain (loss): | $ | (342 | ) | $ | 4,457 | $ | 930 | $ | 20,727 | |||||||
During the fiscal year ended December 31, 2013,2016, there were no transfers in and out of Levels 1 and 2.
The following table shows a reconciliation of the beginning and ending balances for fair valued liabilities measured using significant unobservable inputs (Level 3) for the year ended December 31, 2013:2016:
Credit Facility and Senior Secured Notes | For the year ended December 31, 2013 | |||||||
Credit Facility, Senior Secured Notes and 2022 Unsecured Notes | For the year ended December 31, 2016 | |||||||
Beginning fair value | $ | 389,452 | $ | 332,900 | ||||
Net realized (gain) loss | (517 | ) | — | |||||
Net change in unrealized (gain) loss | 517 | — | ||||||
Borrowings | 513,592 | 728,500 | ||||||
Repayments | (778,044 | ) | (771,200 | ) | ||||
Transfers in/out of Level 3 | — | — | ||||||
|
| |||||||
Ending fair value | $ | 125,000 | $ | 290,200 | ||||
|
| |||||||
The Company has made an irrevocable election to apply the fair value option of accounting to the Credit Facility, the Senior Secured Notes and the 2022 Unsecured Notes, in accordance with ASC 825-10. On December 31, 2016, there were borrowings of $165,200, $75,000 and $50,000, respectively, on the Credit Facility, the Senior Secured Notes and the 2022 Unsecured Notes. The Company used an independent third-party valuation firm to assist in measuring the fair value of the Credit Facility, Senior Secured Notes and 2022 Unsecured Notes.
SOLAR CAPITAL LTD.
NOTES TO CONSOLIDATED FINANCIAL STATEMENTS (continued)
December 31, 2016
(in thousands, except share amounts)
Fair Value Measurements Using Level 3 Inputs
| Bank Debt/ Senior Secured Loans | Subordinated Debt/ Corporate Notes | Preferred Equity | Common Equity/ Equity Interests/ Warrants | |||||||||||||
Fair value, December 31, 2014 | $ | 521,791 | $ | 76,140 | $ | 23,097 | $ | 320,424 | ||||||||
Total gains or losses included in earnings: | ||||||||||||||||
Net realized gain (loss) | (4,823 | ) | — | — | (415 | ) | ||||||||||
Net change in unrealized gain (loss) | (18,805 | ) | (9,021 | ) | (457 | ) | (9,418 | ) | ||||||||
Purchase of investment securities | 418,759 | 195 | 469 | 229 | ||||||||||||
Proceeds from dispositions of investment securities | (116,631 | ) | — | (5,161 | ) | (581 | ) | |||||||||
Transfers in/out of Level 3 | — | — | — | — | ||||||||||||
|
|
|
|
|
|
|
| |||||||||
Fair value, December 31, 2015 | $ | 800,291 | $ | 67,314 | $ | 17,948 | $ | 310,239 | ||||||||
|
|
|
|
|
|
|
| |||||||||
Unrealized gains (losses) for the period relating to those Level 3 assets that were still held by the Company at the end of the period: | ||||||||||||||||
Net change in unrealized gain (loss) | $ | (23,917 | ) | $ | (9,021 | ) | $ | (457 | ) | $ | (9,410 | ) | ||||
|
|
|
|
|
|
|
| |||||||||
During the year ended December 31, 2015, there were no transfers in and out of Levels 1 and 2.
The following table shows a reconciliation of the beginning and ending balances for fair valued liabilities measured using significant unobservable inputs (Level 3) for the year ended December 31, 2015:
Credit Facility and Senior Secured Notes | For the year ended December 31, 2015 | |||
Beginning fair value | $ | 125,000 | ||
Net realized (gain) loss | — | |||
Net change in unrealized (gain) loss | — | |||
Borrowings | 418,800 | |||
Repayments | (210,900 | ) | ||
Transfers in/out of Level 3 | — | |||
|
| |||
Ending fair value | $ | 332,900 | ||
|
| |||
The Company has made an irrevocable election to apply the fair value option of accounting to the Credit Facility and the Senior Secured Notes, in accordance with ASC 825-10. On December 31, 2013,2015, there were borrowings of $50,000$257,900 and $75,000, respectively, on the Credit Facility and the Senior Secured Notes. The Company used an independent third-party valuation firm to measureassist in measuring the fair value of the Credit Facility and Senior Secured Notes.
SOLAR CAPITAL LTD.
NOTES TO CONSOLIDATED FINANCIAL STATEMENTS (continued)
December 31, 2014
(in thousands, except share amounts)
Quantitative Information about Level 3 Fair Value Measurements
The Company typically determines the fair value of its performing debt investments utilizing a yield analysis. In a yield analysis, a price is ascribed for each investment based upon an assessment of current and expected market yields for similar investments and risk profiles. Additional consideration is given to current
SOLAR CAPITAL LTD.
NOTES TO CONSOLIDATED FINANCIAL STATEMENTS (continued)
December 31, 2016
(in thousands, except share amounts)
contractual interest rates, relative maturities and other key terms and risks associated with an investment. Among other factors, a significant determinant of risk is the amount of leverage used by the portfolio company relative to the total enterprise value of the company, and the rights and remedies of our investment within each portfolio company.
Significant unobservable quantitative inputs typically used in the fair value measurement of the Company’s Level 3 assets and liabilities primarily reflect current market yields, including indices, and readily available quotes from brokers, dealers, and pricing services as indicated by comparable assets and liabilities, as well as enterprise values, returns on equity and earnings before income taxes, depreciation and amortization (“EBITDA”) multiples of similar companies, and comparable market transactions for equity securities.
Quantitative information about the Company’s Level 3 asset and liability fair value measurements as of December 31, 20142016 is summarized in the table below:
| Asset or Liability | Fair Value at December 31, 2014 | Principal Valuation Technique/Methodology | Unobservable Input | Range (Weighted Average) | ||||||||
Bank Debt/Senior Secured Loans | Asset | $ $ | 519,391 2,400 |
| Yield Analysis Collateral Analysis | Market Yield Collateral Value | 7.0% – 25.0% (10.3%) NA | |||||
Subordinated Debt/Corporate Note | Asset | $ | 76,140 | Yield Analysis | Market Yield | 9.5% – 12.5% (10.6%) | ||||||
Preferred Equity | Asset | $ | 23,097 | Yield Analysis | Market Yield | 8.0% – 15.0% (11.2%) | ||||||
Common Equity/Partnership Interests/Warrants | Asset | $ $ | 22,924 297,500 |
| Enterprise Value Enterprise Value | EBITDA Multiple Return on Equity | 6.0x – 7.5x (6.1x) 2.4% – 10.8% (11.5%) | |||||
Credit Facility | Liability | $ | 50,000 | Yield Analysis | Market Yield | L+0.5% – L+4.8% (L+2.3%) | ||||||
Senior Secured Notes | Liability | $ | 75,000 | Yield Analysis | Market Yield | 5.8% – 6.0% (5.9%) | ||||||
SOLAR CAPITAL LTD.
NOTES TO CONSOLIDATED FINANCIAL STATEMENTS (continued)
December 31, 2014
(in thousands, except share amounts)
| Asset or Liability | Fair Value at December 31, 2016 | Principal Valuation Technique/Methodology | Unobservable Input | Range (Weighted Average) | ||||||||
Bank Debt/Senior Secured Loans | Asset | $ $ | 758,733 777 |
| Yield Analysis Enterprise Value | Market Yield EBITDA Multiple | 8.2% – 51.6% (11.5%) 4.0x – 5.0x (4.5x) | |||||
Subordinated Debt/Corporate Note | Asset | $ | 28,059 | Yield Analysis | Market Yield | 14.9% – 14.9% (14.9%) | ||||||
Preferred Equity | Asset | $ | 14,906 | Yield Analysis | Market Yield | 8.0% – 11.3% (10.0%) | ||||||
Common Equity/Equity Interests/Warrants | Asset | $ $ | 19,842 305,000 |
| Enterprise Value Enterprise Value | EBITDA Multiple Return on Equity | 5.5x – 6.5x (6.3x) 7.7% – 12.5% (11.9%) | |||||
Credit Facility | Liability | $ | 165,200 | Yield Analysis | Market Yield | L+1.4% – L+4.8% (L+2.0%) | ||||||
Senior Secured Notes | Liability | $ | 75,000 | Yield Analysis | Market Yield | 5.6% – 6.1% (5.9%) | ||||||
2022 Unsecured Notes | Liability | $ | 50,000 | Yield Analysis | Market Yield | 4.4% – 4.7% (4.4%) | ||||||
Quantitative information about the Company’s Level 3 asset and liability fair value measurements as of December 31, 20132015 is summarized in the table below:
| Asset or Liability | Fair Value at December 31, 2013 | Principal Valuation Technique/Methodology | Unobservable Input | Range (Weighted Average) | Asset or Liability | Fair Value at December 31, 2015 | Principal Valuation Technique/Methodology | Unobservable Input | Range (Weighted Average) | |||||||||||||||
Bank Debt/Senior Secured Loans | Asset | $ | 356,462 | Yield Analysis | Market Yield | 9.2% – 16.1% (11.9%) | Asset | $ $ | 799,058 1,233 |
| Yield Analysis Enterprise Value | Market Yield EBITDA Multiple | 5.5% – 19.5% (11.0%) 4.5x – 5.0x (4.5x) | |||||||||||
Subordinated Debt/Corporate Note | Asset | $ | 241,702 | Yield Analysis | Market Yield | 12.0% – 15.4% (13.6%) | Asset | $ | 67,314 | Yield Analysis | Market Yield | 13.2% – 26.1% (20.8%) | ||||||||||||
Preferred Equity | Asset | $ | 26,307 | Yield Analysis | Market Yield | 8.0% – 15.0% (10.9%) | Asset | $ | 17,948 | Yield Analysis | Market Yield | 8.0% – 11.5% (9.8%) | ||||||||||||
Common Equity/Partnership Interests/Warrants | Asset | $ $ | 58,385 305,000 |
| Enterprise Value Enterprise Value | Enterprise Value Return on Equity | 6.8x – 16.8x (9.4x) 5.1% – 10.4% (12.3%) | |||||||||||||||||
Common Equity/Equity Interests/Warrants | Asset | $ $ | 20,239 290,000 |
| Enterprise Value Enterprise Value | EBITDA Multiple Return on Equity | 5.6x – 6.8x (6.1x) 7.0% – 13.8% (11.0%) | |||||||||||||||||
Credit Facility | Liability | $ | 50,000 | Yield Analysis | Market Yield | L+0.5% – L+5.5% (L+2.6%) | Liability | $ | 257,900 | Yield Analysis | Market Yield | L+0.5% – L+4.8% (L+2.3%) | ||||||||||||
Senior Secured Notes | Liability | $ | 75,000 | Yield Analysis | Market Yield | 4.1% – 8.2% (6.2%) | Liability | $ | 75,000 | Yield Analysis | Market Yield | 5.6% – 6.1% (5.9%) | ||||||||||||
SOLAR CAPITAL LTD.
NOTES TO CONSOLIDATED FINANCIAL STATEMENTS (continued)
December 31, 2016
(in thousands, except share amounts)
Significant increases or decreases in any of the above unobservable inputs in isolation, including unobservable inputs used in deriving bid-ask spreads, if applicable, could result in significantly lower or higher fair value measurements for such assets and liabilities.
Note 7. Derivatives
The Company is exposed to interest rate risk both as a lender and a borrower. The Company’s borrowing facilities and term loan bear interest at a floating rate, which means that rising interest rates would increase our cost of borrowing. To partially mitigate this risk, in 2011, the Company purchased two interest rate cap contracts with Wells Fargo as the counterparty, which effectively limited the interest rate payable on $150,000 of LIBOR based borrowings. On January 13, 2014, the $100,000 interest rate cap contract expired. On May 4, 2014, the $50,000 interest rate cap contract expired.
There are no interest rate caps outstanding as of December 31, 2014. The following table highlights the interest rate caps outstanding as of December 31, 2013:
Index Rate | Cap Rate | Notional Amount | Expiration | Cost | Fair Value | Unrealized Depreciation | ||||||||||||||||||
3 Month Libor | 1.0 | % | $ | 100,000 | 1/13/2014 | $ | 1,950 | $ | — | $ | (1,950 | ) | ||||||||||||
3 Month Libor | 1.0 | % | 50,000 | 5/4/2014 | 988 | — | (988 | ) | ||||||||||||||||
|
|
|
|
|
|
|
| |||||||||||||||||
| $ | 150,000 | $ | 2,938 | $ | — | $ | (2,938 | ) | ||||||||||||||||
|
|
|
|
|
|
|
| |||||||||||||||||
The Company is also exposed to foreign exchange risk through its investments denominated in foreign currencies. The Company may mitigate this risk through the use of foreign currency forward contracts, borrowing in local currency under its Credit Facility, or similar. As an investment company, all changes in the fair value of assets, including changes caused by foreign currency fluctuation, flow through current earnings.
SOLAR CAPITAL LTD.
NOTES TO CONSOLIDATED FINANCIAL STATEMENTS (continued)
December 31, 2014
(in thousands, except share amounts)
As of December 31, 20142016 and December 31, 2013,2015, there were no open forward foreign currency contracts outstanding. The Company also had no derivatives designated as hedging instruments at December 31, 20142016 and December 31, 2013.2015.
Note 8. Debt
Unsecured Senior Notes
On November 8, 2016, the Company closed a private offering of $50 million of the 2022 Unsecured Notes with a fixed interest rate of 4.40% and a maturity date of May 8, 2022. Interest on the 2022 Unsecured Notes is due semi-annually on May 8 and November 8. The 2022 Unsecured Notes were issued in a private placement only to qualified institutional buyers pursuant to Rule 144A under the Securities Act of 1933, as amended.
On November 16, 2012, the Company and U.S. Bank National Association entered into an Indenture and a First Supplemental Indenture relating to the Company’s issuance, offer and sale of $100,000 aggregate principal amount of its 6.75% Unsecured Senior Notes due 2042 (the “Unsecured“2042 Unsecured Notes”). The 2042 Unsecured Notes will mature on November 15, 2042 and may be redeemed in whole or in part at the Company’s option at any time or from time to time on or after November 15, 2017 at a redemption price of $25 per security plus accrued and unpaid interest. The 2042 Unsecured Notes bear interest at a rate of 6.75% per year payable quarterly on February 15, May 15, August 15 and November 15 of each year, commencing on February 15, 2013.year. The 2042 Unsecured Notes are direct senior unsecured obligations of the Company.
Revolving and Term Loan Facility
In July 2013,On September 30, 2016, the Company amended itsentered into a second Credit Facility amendment. The Credit Facility is composed of $440,000$505,000 of revolving credit and $50,000 inof term loans. Subsequently, in December 2013, a commitment increase was executed providing an additional $50,000 of revolving credit, bringing the total revolving credit capacity to $490,000. Borrowings generally bear interest at a rate per annum equal to the base rate plus 2.25%a range of 2.00-2.25% or the alternate base rate plus 1.25%1.00%-1.25%. The Credit Facility has no LIBOR floor requirement. The Credit Facility matures in June 2018September 2021 and includes ratable amortization in the final year. The Credit Facility may be increased up to $800,000 with additional new lenders or an increase in commitments from current lenders. The Credit Facility contains certain customary affirmative and negative covenants and events of default. In addition, the Credit Facility contains certain financial covenants that among other things, requires the Company to maintain a minimum shareholder’s equity and a minimum asset coverage ratio. The Company also pays issuers of funded term loans quarterly in arrears a commitment fee at the rate of 0.25% per annum on the average daily outstanding balance. At December 31, 2014,2016, outstanding USD equivalent borrowings under the Credit Facility totaled $50,000 $165,200.
SOLAR CAPITAL LTD.
NOTES TO CONSOLIDATED FINANCIAL STATEMENTS (continued)
December 31, 2016
(in term loans.thousands, except share amounts)
Senior Secured Notes
On May 10, 2012, the Company closed a private offering of $75,000 of Senior Secured Notes with a fixed interest rate of 5.875% and a maturity date of May 10, 2017. Interest on the Senior Secured Notes is due semi-annually on May 10 and November 10. The Senior Secured Notes were issued in a private placement only to qualified institutional buyers pursuant to Rule 144A under the Securities Act of 1933, as amended.
Certain covenants on our issued debt may restrict our business activities, including limitations that could hinder our ability to finance additional loans and investments or to make the distributions required to maintain our status as a RIC under Subchapter M of the Code.
The Company has made an irrevocable election to apply the fair value option of accounting to its Credit Facility, and Senior Secured Notes and 2022 Unsecured Notes, in accordance with ASC 825-10. We believe accounting for the Credit Facility, and Senior Secured Notes and 2022 Unsecured Notes at fair value better aligns the measurement methodologies of assets and liabilities, which may mitigate certain earnings volatility.
SOLAR CAPITAL LTD.
NOTES TO CONSOLIDATED FINANCIAL STATEMENTS (continued)
December 31, 2014
( ASC 825-10 requires entities to display the fair value of the selected assets and liabilities on the face of the Consolidated Statement of Assets and Liabilities and changes in thousands, except share amounts)
fair value of the Credit Facility are reported in the Consolidated Statement of Operations.
The average annualized interest cost for all borrowings for the year ended December 31, 20142016 and the year ended December 31, 20132015 was 5.52%4.11% and 4.83%5.13%, respectively. These costs are exclusive of other credit facility expenses such as unused fees, agency fees and other prepaid expenses related to establishing and/or amending the Credit Facility, the 2022 Unsecured Notes, the 2042 Unsecured Notes, and the Senior Secured Notes (collectively the “Credit Facilities”), if any. During the year ended December 31, 2016, the Company expensed $2,781 in conjunction with the September 2016 amendment to the Credit Facility and $280 in conjunction with the November issue of the 2022 Unsecured Notes. The maximum amounts borrowed on the Credit Facilities during the year ended December 31, 20142016 and the year ended December 31, 20132015 were $225,000$610,900 and $503,888,$434,900, respectively.
Note 9(a). Income Tax Information and Distributions to Stockholders
The tax character of distributions for the fiscal years ended December 31, 2014, 20132016, 2015 and 20122014 were as follows:
| 2014 | 2013 | 2012 | 2016 | 2015 | 2014 | |||||||||||||||||||||||||||||||||||||||||||
Ordinary income | $ | 66,383 | 97.0 | % | $ | 68,796 | 76.9 | % | $ | 84,596 | 93.6 | % | $ | 67,598 | 100.0 | % | $ | 67,944 | 100.0 | % | $ | 66,383 | 97.0 | % | ||||||||||||||||||||||||
Capital gains | — | 0.0 | % | 20,652 | 23.1 | % | 5,770 | 6.4 | % | — | 0.0 | % | — | 0.0 | % | — | 0.0 | % | ||||||||||||||||||||||||||||||
Return of capital | 2,060 | 3.0 | % | — | 0.0 | % | — | 0.0 | % | — | 0.0 | % | — | 0.0 | % | 2,060 | 3.0 | % | ||||||||||||||||||||||||||||||
|
|
|
|
|
|
|
|
|
|
|
| |||||||||||||||||||||||||||||||||||||
Total distributions | $ | 68,443 | 100.0 | % | $ | 89,448 | 100.0 | % | $ | 90,366 | 100.0 | % | $ | 67,598 | 100.0 | % | $ | 67,944 | 100.0 | % | $ | 68,443 | 100.0 | % | ||||||||||||||||||||||||
|
|
|
|
|
|
|
|
|
|
|
| |||||||||||||||||||||||||||||||||||||
SOLAR CAPITAL LTD.
NOTES TO CONSOLIDATED FINANCIAL STATEMENTS (continued)
December 31, 2016
(in thousands, except share amounts)
As of December 31, 2014, 20132016, 2015 and 20122014 the components of accumulated gain and losses on a tax basis were as follows(1)follows (1):
| 2014 | 2013 | 2012 | ||||||||||
Undistributed ordinary income | $ | — | $ | 4,895 | $ | 4,475 | ||||||
Undistributed long-term net capital gains | — | — | 19,800 | |||||||||
|
|
|
|
|
| |||||||
Total undistributed net earnings | — | 4,895 | 24,275 | |||||||||
Post-October capital losses | — | — | — | |||||||||
Capital loss carryforward | (60,463 | ) | (33,387 | ) | — | |||||||
Other book/tax temporary differences | (1,184 | ) | — | — | ||||||||
Net unrealized depreciation | 1,266 | (1,117 | ) | (31,158 | ) | |||||||
|
|
|
|
|
| |||||||
Total taxable income (loss) | $ | (60,381 | ) | $ | (29,609 | ) | $ | (6,883 | ) | |||
|
|
|
|
|
| |||||||
| 2016 | 2015 | 2014 | ||||||||||
Undistributed ordinary income | $ | 7,329 | $ | 1,141 | $ | — | ||||||
Undistributed long-term net capital gains | — | — | — | |||||||||
|
|
|
|
|
| |||||||
Total undistributed net earnings | 7,329 | 1,141 | — | |||||||||
Post-October capital losses | — | — | — | |||||||||
Capital loss carryforward | (31,311 | ) | (31,242 | ) | (60,463 | ) | ||||||
Other book/tax temporary differences | 2,915 | 838 | (1,184 | ) | ||||||||
Net unrealized appreciation (depreciation) | (7,928 | ) | (42,563 | ) | 1,266 | |||||||
|
|
|
|
|
| |||||||
Total taxable income (loss) | $ | (28,995 | ) | $ | (71,826 | ) | $ | (60,381 | ) | |||
|
|
|
|
|
| |||||||
| (1) | Tax information for the fiscal years ended December 31, |
The Company recognizes in its consolidated financial statements the tax effect of a tax position when it is more likely than not, based on the technical merits, that the position will be sustained upon examination. To the best of our knowledge, we did not have any uncertain tax positions that met the recognition or measurement criteria of ASC 740-10-25 nor did we have any unrecognized tax benefits as of the periods presented herein. Although we file federal and state tax returns, our major tax jurisdiction is federal. Our tax returns for each of our federal tax years since 20092013 remain subject to examination by the Internal Revenue Service and the state department of revenue. The capital loss carryforwards shown above do not expire. $0, $2,879 and $0 of the capital loss carryforwards were utilized during the fiscal years ended December 31, 2016, 2015 and 2014, respectively.
Note 9(b). Other Tax Information (unaudited)
For the fiscal yearyears ended December 31, 2016, 2015 and 2014, none of the distributions paid during the year were eligible for qualified dividend income treatment or the dividends received deduction for corporate stockholders. For the fiscal years ended December 31, 2016, 2015, and 2014, 95.23%, 94.05% and 88.49%, respectively, of each of the distributions paid during the year represent interest-related dividends. For the fiscal years ended December 31, 2016, 2015 and 2014, none of the distributions represent short-term capital gains dividends.
SOLAR CAPITAL LTD.
NOTES TO CONSOLIDATED FINANCIAL STATEMENTS (continued)
December 31, 20142016
(in thousands, except share amounts)
fiscal year ended December 31, 2013, 0.04% of the distributions paid during the year were eligible for qualified dividend income treatment as well as the dividends received deduction for corporate stockholders. For the fiscal year ended December 31, 2012, 1.12% of the distributions paid during the year were eligible for qualified dividend income treatment and 1.00% of the distributions were eligible for the dividends received deduction for corporate stockholders.
Note 10. Financial Highlights and Senior Securities Table
The following is a schedule of financial highlights for the respective periods:years:
| Year ended December 31, 2014 | Year ended December 31, 2013 | Year ended December 31, 2012 | Year ended December 31, 2011 | Year ended December 31, 2010 | ||||||||||||||||
Per Share Data: (a) | ||||||||||||||||||||
Net asset value, beginning of year | $ | 22.50 | $ | 22.70 | $ | 22.02 | $ | 22.73 | $ | 21.24 | ||||||||||
|
|
|
|
|
|
|
|
|
| |||||||||||
Net investment income | 1.56 | 1.91 | 2.20 | 2.25 | 2.08 | |||||||||||||||
Net realized and unrealized gain (loss) | (0.43 | ) | (0.22 | ) | 0.91 | (0.57 | ) | 2.19 | ||||||||||||
|
|
|
|
|
|
|
|
|
| |||||||||||
Net increase in net assets resulting from operations | 1.13 | 1.69 | 3.11 | 1.68 | 4.27 | |||||||||||||||
Distributions to stockholders (see note 9a): | ||||||||||||||||||||
From net investment income | (1.55 | ) | (1.55 | ) | (2.27 | ) | (2.02 | ) | (1.93 | ) | ||||||||||
From net realized gains | — | (0.46 | ) | (0.16 | ) | (0.38 | ) | (0.21 | ) | |||||||||||
From other sources | (0.05 | ) | — | — | — | — | ||||||||||||||
Anti-dilution (dilution) | 0.02 | 0.12 | — | 0.01 | (0.33 | ) | ||||||||||||||
Offering costs | — | — | — | — | (0.31 | ) | ||||||||||||||
|
|
|
|
|
|
|
|
|
| |||||||||||
Net asset value, end of period | $ | 22.05 | $ | 22.50 | $ | 22.70 | $ | 22.02 | $ | 22.73 | ||||||||||
|
|
|
|
|
|
|
|
|
| |||||||||||
Per share market value, end of period | $ | 18.01 | $ | 22.55 | $ | 23.91 | $ | 22.09 | $ | 24.78 | ||||||||||
Total Return(b) | (13.58 | )% | 2.82 | % | 20.03 | % | (1.07 | )% | 45.51 | % | ||||||||||
Net assets, end of period | $ | 936,568 | $ | 995,637 | $ | 878,273 | $ | 805,941 | $ | 826,994 | ||||||||||
Shares outstanding, end of period | 42,465,162 | 44,244,195 | 38,694,060 | 36,608,038 | 36,383,158 | |||||||||||||||
Ratios to average net assets: | ||||||||||||||||||||
Net investment income | 6.93 | % | 8.43 | % | 9.79 | % | 9.97 | % | 9.31 | % | ||||||||||
|
|
|
|
|
|
|
|
|
| |||||||||||
Operating expenses | 4.24 | % | 5.82 | % | 6.25 | % | 5.82 | % | 5.54 | % | ||||||||||
Interest and other credit facility expenses | 1.50 | % | 1.99 | % | 2.28 | % | 1.12 | % | 1.92 | % | ||||||||||
|
|
|
|
|
|
|
|
|
| |||||||||||
Total expenses | 5.74 | % | 7.81 | % | 8.53 | % | 6.94 | % | 7.46 | % | ||||||||||
|
|
|
|
|
|
|
|
|
| |||||||||||
Average debt outstanding | $ | 225,000 | $ | 318,186 | $ | 237,859 | $ | 152,047 | $ | 140,301 | ||||||||||
Portfolio turnover ratio | 53.7 | % | 25.6 | % | 54.7 | % | 34.5 | % | 38.9 | % | ||||||||||
| Year ended December 31, 2016 | Year ended December 31, 2015 | Year ended December 31, 2014 | Year ended December 31, 2013 | Year ended December 31, 2012 | ||||||||||||||||
Per Share Data: (a) | ||||||||||||||||||||
Net asset value, beginning of year | $ | 20.79 | $ | 22.05 | $ | 22.50 | $ | 22.70 | $ | 22.02 | ||||||||||
|
|
|
|
|
|
|
|
|
| |||||||||||
Net investment income | 1.68 | 1.52 | 1.56 | 1.91 | 2.20 | |||||||||||||||
Net realized and unrealized gain (loss) | 0.84 | (1.18 | ) | (0.43 | ) | (0.22 | ) | 0.91 | ||||||||||||
|
|
|
|
|
|
|
|
|
| |||||||||||
Net increase in net assets resulting from operations | 2.52 | 0.34 | 1.13 | 1.69 | 3.11 | |||||||||||||||
Distributions to stockholders (see note 9a): | ||||||||||||||||||||
From net investment income | (1.60 | ) | (1.60 | ) | (1.55 | ) | (1.55 | ) | (2.27 | ) | ||||||||||
From net realized gains | — | — | — | (0.46 | ) | (0.16 | ) | |||||||||||||
From other sources | — | — | (0.05 | )(c) | — | — | ||||||||||||||
Anti-dilution | 0.03 | — | 0.02 | 0.12 | — | |||||||||||||||
|
|
|
|
|
|
|
|
|
| |||||||||||
Net asset value, end of year | $ | 21.74 | $ | 20.79 | $ | 22.05 | $ | 22.50 | $ | 22.70 | ||||||||||
|
|
|
|
|
|
|
|
|
| |||||||||||
Per share market value, end of year | $ | 20.82 | $ | 16.43 | $ | 18.01 | $ | 22.55 | $ | 23.91 | ||||||||||
Total Return(b) | 37.49 | % | (0.29 | )% | (13.58 | )% | 2.82 | % | 20.03 | % | ||||||||||
Net assets, end of year | $ | 918,507 | $ | 882,698 | $ | 936,568 | $ | 995,637 | $ | 878,273 | ||||||||||
Shares outstanding, end of year | 42,248,525 | 42,464,762 | 42,465,162 | 44,244,195 | 38,694,060 | |||||||||||||||
Ratios to average net assets: | ||||||||||||||||||||
Net investment income | 7.91 | % | 6.94 | % | 6.93 | % | 8.43 | % | 9.79 | % | ||||||||||
|
|
|
|
|
|
|
|
|
| |||||||||||
Operating expenses | 6.25 | % | 3.84 | %* | 4.24 | % | 5.82 | % | 6.25 | % | ||||||||||
Interest and other credit facility expenses** | 2.73 | % | 1.68 | % | 1.50 | % | 1.99 | % | 2.28 | % | ||||||||||
|
|
|
|
|
|
|
|
|
| |||||||||||
Total expenses | 8.98 | % | 5.52 | %* | 5.74 | % | 7.81 | % | 8.53 | % | ||||||||||
|
|
|
|
|
|
|
|
|
| |||||||||||
Average debt outstanding | $ | 495,795 | $ | 262,341 | $ | 225,000 | $ | 318,186 | $ | 237,859 | ||||||||||
Portfolio turnover ratio | 31.0 | % | 13.0 | % | 53.7 | % | 25.6 | % | 54.7 | % | ||||||||||
| (a) | Calculated using the average shares outstanding method. |
| (b) | Total return is based on the change in market price per share during the |
| (c) | Represents tax return of capital. |
| * | The ratio of operating expenses to average net assets and the ratio of total expenses to average net assets is shown net of a voluntary incentive fee waiver (see note 3). For the year ended December 31, 2015, the ratios of operating expenses to average net assets and total expenses to average net assets would be 4.02% and 5.70%, respectively, without the voluntary incentive fee waiver. |
| ** | Ratios shown without the non-recurring costs associated with the amendments and establishment of the Credit Facility and 2022 Unsecured Notes would be 2.39%, 1.68%, 1.50%, 1.74% and 1.41%, respectively for the years shown. |
SOLAR CAPITAL LTD.
NOTES TO CONSOLIDATED FINANCIAL STATEMENTS (continued)
December 31, 20142016
(in thousands, except share amounts)
Information about our senior securities is shown in the following table as of each year ended December 31 since the Company commenced operations, unless otherwise noted. The “—” indicates information which the SEC expressly does not require to be disclosed for certain types of senior securities.
Class and Year | Total Amount Outstanding(1) | Asset Coverage Per Unit(2) | Involuntary Liquidating Preference Per Unit(3) | Average Market Value Per Unit(4) | Total Amount Outstanding(1) | Asset Coverage Per Unit(2) | Involuntary Liquidating Preference Per Unit(3) | Average Market Value Per Unit(4) | ||||||||||||||||||||||||
Revolving Credit Facilities | ||||||||||||||||||||||||||||||||
Fiscal 2016 | $ | 115,200 | $ | 990 | — | N/A | ||||||||||||||||||||||||||
Fiscal 2015 | 207,900 | 1,459 | — | N/A | ||||||||||||||||||||||||||||
Fiscal 2014 | $ | 0 | $ | 0 | — | N/A | — | — | — | N/A | ||||||||||||||||||||||
Fiscal 2013 | 0 | 0 | — | N/A | — | — | — | N/A | ||||||||||||||||||||||||
Fiscal 2012 | 264,452 | 1,510 | — | N/A | 264,452 | 1,510 | — | N/A | ||||||||||||||||||||||||
Fiscal 2011 | 201,355 | 3,757 | — | N/A | 201,355 | 3,757 | — | N/A | ||||||||||||||||||||||||
Fiscal 2010 | 400,000 | 2,668 | — | N/A | 400,000 | 2,668 | — | N/A | ||||||||||||||||||||||||
Fiscal 2009 | 88,114 | 8,920 | — | N/A | 88,114 | 8,920 | — | N/A | ||||||||||||||||||||||||
Unsecured Senior Notes | ||||||||||||||||||||||||||||||||
2022 Unsecured Notes | ||||||||||||||||||||||||||||||||
Fiscal 2016 | $ | 50,000 | $ | 430 | — | N/A | ||||||||||||||||||||||||||
2042 Unsecured Notes | ||||||||||||||||||||||||||||||||
Fiscal 2016 | $ | 100,000 | $ | 859 | — | $ | 1,002 | |||||||||||||||||||||||||
Fiscal 2015 | 100,000 | 702 | — | 982 | ||||||||||||||||||||||||||||
Fiscal 2014 | $ | 100,000 | $ | 2,294 | — | $ | 943 | 100,000 | 2,294 | — | 943 | |||||||||||||||||||||
Fiscal 2013 | 100,000 | 2,411 | — | 934 | 100,000 | 2,411 | — | 934 | ||||||||||||||||||||||||
Fiscal 2012 | 100,000 | 571 | — | 923 | 100,000 | 571 | — | 923 | ||||||||||||||||||||||||
Senior Secured Notes | ||||||||||||||||||||||||||||||||
Fiscal 2016 | $ | 75,000 | $ | 645 | — | N/A | ||||||||||||||||||||||||||
Fiscal 2015 | 75,000 | 527 | — | N/A | ||||||||||||||||||||||||||||
Fiscal 2014 | $ | 75,000 | $ | 1,721 | — | N/A | 75,000 | 1,721 | — | N/A | ||||||||||||||||||||||
Fiscal 2013 | 75,000 | 1,808 | — | N/A | 75,000 | 1,808 | — | N/A | ||||||||||||||||||||||||
Fiscal 2012 | 75,000 | 428 | — | N/A | 75,000 | 428 | — | N/A | ||||||||||||||||||||||||
Term Loans | ||||||||||||||||||||||||||||||||
Fiscal 2016 | $ | 50,000 | $ | 430 | — | N/A | ||||||||||||||||||||||||||
Fiscal 2015 | 50,000 | 351 | — | N/A | ||||||||||||||||||||||||||||
Fiscal 2014 | $ | 50,000 | $ | 1,147 | — | N/A | 50,000 | 1,147 | — | N/A | ||||||||||||||||||||||
Fiscal 2013 | 50,000 | 1,206 | — | N/A | 50,000 | 1,206 | — | N/A | ||||||||||||||||||||||||
Fiscal 2012 | 50,000 | 285 | — | N/A | 50,000 | 285 | — | N/A | ||||||||||||||||||||||||
Fiscal 2011 | 35,000 | 653 | — | N/A | 35,000 | 653 | — | N/A | ||||||||||||||||||||||||
Fiscal 2010 | 35,000 | 233 | — | N/A | 35,000 | 233 | — | N/A | ||||||||||||||||||||||||
Total Senior Securities | ||||||||||||||||||||||||||||||||
Fiscal 2016 | $ | 390,200 | $ | 3,354 | — | N/A | ||||||||||||||||||||||||||
Fiscal 2015 | 432,900 | 3,039 | — | N/A | ||||||||||||||||||||||||||||
Fiscal 2014 | 225,000 | 5,162 | — | N/A | ||||||||||||||||||||||||||||
Fiscal 2013 | 225,000 | 5,425 | — | N/A | ||||||||||||||||||||||||||||
Fiscal 2012 | 489,452 | 2,794 | — | N/A | ||||||||||||||||||||||||||||
Fiscal 2011 | 236,355 | 4,410 | — | N/A | ||||||||||||||||||||||||||||
Fiscal 2010 | 435,000 | 2,901 | — | N/A | ||||||||||||||||||||||||||||
Fiscal 2009 | 88,114 | 8,920 | — | N/A | ||||||||||||||||||||||||||||
SOLAR CAPITAL LTD.
NOTES TO CONSOLIDATED FINANCIAL STATEMENTS (continued)
December 31, 2016
(in thousands, except share amounts)
| (1) | Total amount of each class of senior securities outstanding at the end of the period presented. |
| (2) | The asset coverage ratio for a class of senior securities representing indebtedness is calculated as our consolidated total assets, less all liabilities and indebtedness not represented by senior securities, divided by all senior securities representing indebtedness. This asset coverage ratio is multiplied by one thousand to determine the Asset Coverage Per Unit. In order to determine the specific Asset Coverage Per Unit for each class of debt, the total Asset Coverage Per Unit is allocated based on the amount outstanding in each class of debt at the end of the period. As of December 31, 2016, asset coverage was 335.4%. |
| (3) | The amount to which such class of senior security would be entitled upon the involuntary liquidation of the issuer in preference to any security junior to it. |
| (4) | Not applicable except for the Unsecured Senior Notes which are publicly traded. The Average Market Value Per Unit is calculated by taking the daily average closing price during the period and dividing it by twenty-five dollars per share and multiplying the result by one thousand to determine a unit price per thousand consistent with Asset Coverage Per Unit. The average market value for the fiscal 2016, 2015, 2014, 2013 and 2012 periods was $100,175, $98,196, $94,301, $93,392, and $92,302, respectively. |
Note 11. Crystal Financial LLC
On December 28, 2012, we completed the acquisition of Crystal Capital Financial Holdings LLC (“Crystal Financial”), a commercial finance company focused on providing asset-based and other secured financing
SOLAR CAPITAL LTD.
NOTES TO CONSOLIDATED FINANCIAL STATEMENTS (continued)
December 31, 2014
(in thousands, except share amounts)
solutions from SSP Energy Ltd., Quartz Managers LLC and Quantum Strategic Partners Ltd. (the “Crystal Acquisition”) pursuant to a definitive agreement entered into on December 17, 2012.. We invested $275,000 in cash to effect the Crystal Acquisition. Crystal Financial ownsowned approximately 98% of the outstanding ownership interest in Crystal Financial LLC. The remaining financial interest iswas held by various employees of Crystal Financial LLC, through their investment in Crystal Management LP. Crystal Financial LLC had a diversified portfolio of 23 loans having a total par value of approximately $400,000 at November 30, 2012 and a $275,000 committed revolving credit facility. On January 27, 2014, the revolving credit facility was expanded to $300,000. On March 31, 2014, we exchanged $137,500 of our equity interest in Crystal Financial in exchange for $137,500 in floating rate senior secured notes in Crystal Financial bearing interest at LIBOR plus 9.50%, maturing on March 31, 2019. On May 18, 2015, the revolving credit facility was expanded to $350,000. Our financial statements, including our schedule of investments, reflectreflected our investments in Crystal Financial on a consolidated basis. We also have an additional $50,000 commitment toOn July 28, 2016, the Company purchased Crystal Management LP’s approximately 2% equity interest in Crystal Financial LLC (which may be structured as debt or equity), conditional upon approvalfor approximately $5,737. Upon the closing of this transaction, the Company holds 100% of the equity interest in Crystal Financial LLC’s board of managers, among other conditions.LLC. On September 30, 2016, Crystal Capital Financial Holdings LLC was dissolved.
As of December 31, 2014,2016 Crystal Financial LLC had 2926 funded commitments to 2725 different issuers with a total par value of approximately $477,945$368,784 on total assets of $542,252.$459,732. As of December 31, 2013,2015, Crystal Financial LLC had 2728 funded commitments to 2326 different issuers with a total par value of approximately $465,496$465,128 on total assets of $499,054.$518,288. As of December 31, 20142016 and 2013, all loans were floating rate withDecember 31, 2015, the largest loan outstanding totaling $33,000totaled $36,255 and $50,000,$34,250, respectively. For the same periods, the average exposure per issuer was $17,702$14,751 and $20,239,$17,890, respectively. Crystal Financial LLC’s credit facility, which is non-recourse to Solar Capital, had approximately $259,698$175,422 and $200,400$232,922 of borrowings outstanding at December 31, 20142016 and December 31, 2013,2015, respectively. For the years ended December 31, 20142016, 2015 and December 31, 2013,2014, Crystal Financial LLC had net income of $34,099, $27,362 and $27,197, and $28,054respectively, on gross income of $56,127$69,442, $62,542 and $54,047,$56,127, respectively. Due to timing and non-cash items, there may be material differences between GAAP net income and cash available for distributions.
SOLAR CAPITAL LTD.
NOTES TO CONSOLIDATED FINANCIAL STATEMENTS (continued)
December 31, 2016
(in thousands, except share amounts)
Note 12. Stock Repurchase Program
On July 31, 2013, the Company’s board of directorsBoard authorized a program for the purpose of repurchasing up to $100,000 of the Company’s common stock. Under the repurchase program, the Company could have, but was not obligated to, repurchase its outstanding common stock in the open market from time to time provided that the Company compliescomplied with the prohibitions under its Insider Trading Policies and Procedures and the guidelines specified in RuleRules 10b-18 and 10b-5 ofunder the Securities Exchange Act of 1934, as amended, including certain price, market volume and timing constraints. On December 5, 2013, the Company’s board of directorsBoard extended the repurchase program to be in place until the earlier of July 31, 2014 or until $100,000 of the Company’s outstanding shares of common stock havehad been repurchased. On July 31, 2014, the Company’s stock repurchase program expired. ForDuring the fiscal year ended December 31, 2014, the Company repurchased 1,779,033 shares at an average price of approximately $21.97 per share, inclusive of commissions. The total dollar amount of shares repurchased in that period was $39,078. During the year ended December 31, 2013, the Company repurchased 796,418 shares at an average price of approximately $21.98 per share, inclusive of commissions, for a total dollar amount of $17,508.
On October 7, 2015, the Board authorized a new share repurchase program to purchase common stock in the open market in an amount up to $30,000. Under the repurchase program, the Company may, but is not obligated to, repurchase its outstanding common stock in the open market from time to time provided that the Company complies with the prohibitions under its Insider Trading Policies and Procedures and the guidelines specified in Rules 10b-18 and 10b-5 under the Securities Exchange Act of 1934, as amended, including certain price, market volume and timing constraints. On October 7, 2016, the Company’s stock repurchase program expired. During the year ended December 31, 2016, the Company repurchased 216,237 shares at an average price of $15.76 per share, inclusive of commissions. The total dollar amount of shares repurchased in that period was $3,408. During the year ended December 31, 2015, the Company repurchased 400 shares at an average price of $15.98 per share, inclusive of commissions, for a total dollar amount of $6.
Note 13. Selected Quarterly Financial Data (unaudited)
Quarter Ended | Investment Income | Net Investment Income | Net Realized And Unrealized Gain (Loss) on Assets | Net Increase (Decrease) In Net Assets From Operations | ||||||||||||||||||||||||||||
| Total | Per Share | Total | Per Share | Total | Per Share | Total | Per Share | |||||||||||||||||||||||||
December 31, 2016 | $ | 36,638 | 0.87 | $ | 17,648 | 0.42 | $ | 195 | 0.00 | $ | 17,843 | 0.42 | ||||||||||||||||||||
September 30, 2016 | 39,798 | 0.94 | 17,004 | 0.40 | 8,615 | 0.21 | 25,619 | 0.61 | ||||||||||||||||||||||||
June 30, 2016 | 41,369 | 0.98 | 19,533 | 0.46 | 15,642 | 0.37 | 35,175 | 0.83 | ||||||||||||||||||||||||
March 31, 2016 | 34,033 | 0.80 | 16,915 | 0.40 | 11,262 | 0.27 | 28,177 | 0.67 | ||||||||||||||||||||||||
December 31, 2015 | $ | 31,507 | 0.74 | $ | 16,987 | 0.40 | $ | (31,167 | ) | (0.73 | ) | $ | (14,180 | ) | (0.33 | ) | ||||||||||||||||
September 30, 2015 | 30,445 | 0.72 | 16,989 | 0.40 | (16,903 | ) | (0.40 | ) | 86 | 0.00 | ||||||||||||||||||||||
June 30, 2015 | 27,978 | 0.66 | 15,991 | 0.38 | 1,285 | 0.03 | 17,276 | 0.41 | ||||||||||||||||||||||||
March 31, 2015 | 25,630 | 0.60 | 14,390 | 0.34 | (3,491 | ) | (0.08 | ) | 10,899 | 0.26 | ||||||||||||||||||||||
SOLAR CAPITAL LTD.
NOTES TO CONSOLIDATED FINANCIAL STATEMENTS (continued)
December 31, 20142016
(in thousands, except share amounts)
Note 13. Selected Quarterly Financial Data (unaudited)
Quarter Ended | Investment Income | Net Investment Income | Net Realized And Unrealized Gain (Loss) on Assets | Increase (Decrease) In Net Assets From Operations | ||||||||||||||||||||||||||||
| Total | Per Share | Total | Per Share | Total | Per Share | Total | Per Share | |||||||||||||||||||||||||
December 31, 2014 | $ | 32,945 | 0.78 | $ | 16,792 | 0.40 | $ | (11,942 | ) | (0.28 | ) | $ | 4,850 | 0.11 | ||||||||||||||||||
September 30, 2014 | 28,358 | 0.67 | 16,360 | 0.39 | (3,592 | ) | (0.08 | ) | 12,768 | 0.30 | ||||||||||||||||||||||
June 30, 2014 | 28,004 | 0.66 | 16,132 | 0.38 | 952 | 0.02 | 17,084 | 0.40 | ||||||||||||||||||||||||
March 31, 2014 | 32,630 | 0.74 | 17,424 | 0.40 | (3,674 | ) | (0.08 | ) | 13,750 | 0.31 | ||||||||||||||||||||||
December 31, 2013 | $ | 35,364 | 0.80 | $ | 18,532 | 0.42 | $ | 10,415 | 0.23 | $ | 28,947 | 0.65 | ||||||||||||||||||||
September 30, 2013 | 42,986 | 0.96 | 21,628 | 0.48 | (11,058 | ) | (0.24 | ) | 10,570 | 0.24 | ||||||||||||||||||||||
June 30, 2013 | 39,145 | 0.87 | 19,256 | 0.43 | (19,269 | ) | (0.43 | ) | (13 | ) | (0.00 | ) | ||||||||||||||||||||
March 31, 2013 | 46,097 | 1.04 | 25,519 | 0.58 | 10,287 | 0.23 | 35,806 | 0.81 | ||||||||||||||||||||||||
Note 14. Commitments and Contingencies
The Company had unfunded equitydebt and debtequity commitments to various revolving and delayed draw loans as well as to Crystal Financial LLC. The total amount of these unfunded commitments as of December 31, 20142016 and December 31, 20132015 is $103,693$64,013 and $15,000, respectively.$65,833, respectively, comprised of the following:
| December 31, 2016 | December 31, 2015 | |||||||
Crystal Financial LLC | $ | 44,263 | $ | 50,000 | ||||
Vapotherm, Inc | 10,000 | — | ||||||
aTyr Pharma, Inc | 5,000 | — | ||||||
SentreHeart, Inc | 2,500 | — | ||||||
Conventus Orthopaedics, Inc | 2,250 | — | ||||||
Achaogen, Inc. | — | 10,000 | ||||||
AgaMatrix, Inc. | — | 3,333 | ||||||
CardioDx, Inc. | — | 2,500 | ||||||
|
|
|
| |||||
Total Commitments* | $ | 64,013 | $ | 65,833 | ||||
|
|
|
| |||||
| * | The Company controls the funding of the Crystal Financial LLC commitment and may cancel it at its discretion. |
As of December 31, 2016 and December 31, 2015, the Company had sufficient cash available and/or liquid securities available to fund its commitments as well as the commitments to SSLP disclosed in Note 15 and SSLP II disclosed in Note 16.
Note 15. Senior Secured Unitranche Loan Program LLC
On September 2, 2014, the Company entered into a limited liability company agreement with an affiliate (the “Investor”) of a fund managed by Pacific Investment Management Company LLC (“PIMCO”) to co-invest in middle market senior secured unitranche loans sourced by the same origination platform used by the Company. Initial funding commitments to the unitranche strategy total $600,000, consisting of direct equity investments and co-investment commitments as described below. The joint venture vehicle known as the Senior Secured Unitranche Loan Program LLC (“SSLP”) is structured as an unconsolidated Delaware limited liability company. The Company and the Investor have initially made equity commitments to the SSLP of $300,000 and $43,250, respectively. All portfolio decisions and generally all other decisions in respect of the SSLP must be approved by an investment committee of the SSLP consisting of representatives of the Company and PIMCO (with approval from a representative of each required).
On October 15, 2015, the Company entered into an amended and restated limited liability company agreement for its SSLP to add Voya Investment Management LLC (“Voya”), part of Voya Financial, Inc. (NYSE: VOYA), as a partner in SSLP in place of the investor that was previously the Company’s partner in SSLP, though this investor may still co-invest up to $300,000 of equity in unitranche loans alongside SSLP. This joint venture is expected to invest primarily in senior secured unitranche loans to middle market companies predominantly owned by private equity sponsors or entrepreneurs, consistent with the Company’s core origination and underwriting mandate. In addition to the Company’s prior equity commitment of $300,000 to SSLP, Voya has made an initial equity commitment of $25,000 to SSLP, with the ability to upsize.
SOLAR CAPITAL LTD.
NOTES TO CONSOLIDATED FINANCIAL STATEMENTS (continued)
December 31, 2016
(in thousands, except share amounts)
On November 2, 2015, the Company assigned $125,000 of its $300,000 commitment to SSLP to Senior Secured Unitranche Loan Program II LLC (“SSLP II”), a Delaware limited liability company.
On November 25, 2015, SSLP commenced operations. On June 30, 2016, SSLP as transferor and SSLP 2016-1, LLC, a newly formed wholly owned subsidiary of SSLP, as borrower entered into a $200,000 senior secured revolving credit facility (the “SSLP Facility”) with Wells Fargo Bank, NA acting as administrative agent. Solar Capital Ltd. acts as servicer under the SSLP Facility. The SSLP Facility is scheduled to mature on June 30, 2021. The SSLP Facility generally bears interest at a rate of LIBOR plus 2.50%. SSLP and SSLP2016-1, LLC, as applicable, have made certain customary representations and warranties, and are required to comply with various covenants, including leverage restrictions, reporting requirements and other customary requirements for similar credit facilities. The SSLP Facility also includes usual and customary events of default for credit facilities of this nature. There were $67,148 of borrowings outstanding as of December 31, 2016. During the year ended December 31, 2016, using proceeds from the SSLP Facility, SSLP returned capital totaling $28,875 and $4,125 to the Company and Voya, respectively. As of December 31, 2014,2016 and December 31, 2015, the Company and Voya had contributed combined equity capital in the amount of $116,433 and $92,183, respectively. Of the $116,433 of contributed equity capital at December 31, 2016, the Company contributed $29,884 in the form of investments and $71,995 in the form of cash and Voya contributed $14,554 in the form of cash. As of December 31, 2016, the Company and Voya’s remaining commitments to SSLP totaled $73,121 and $10,446, respectively. The Company, along with Voya, controls the funding of SSLP and SSLP may not call the unfunded commitments without approval of both the Company and Voya.
As of December 31, 2016 and December 31, 2015, SSLP had total assets of $184,816 and $92,528, respectively. For the same periods, SSLP’s portfolio consisted of floating rate senior secured loans to 11 and 4 different borrowers, respectively. For the year ended December 31, 2016, SSLP invested $89,421 in 8 portfolio companies. Investments prepaid totaled $1,183 for the year ended December 31, 2016. For the period from November 25, 2015 through December 31, 2015, SSLP invested $91,833 in 4 portfolio companies. Investments prepaid totaled $75 for the period from November 25, 2015 through December 31, 2015. At December 31, 2016 and December 31, 2015, the weighted average yield of SSLP’s portfolio was 7.4% and 8.5%, respectively, measured at fair value and 7.5% and 8.5%, respectively, measured at cost.
SOLAR CAPITAL LTD.
NOTES TO CONSOLIDATED FINANCIAL STATEMENTS (continued)
December 31, 2016
(in thousands, except share amounts)
SSLP Portfolio as of December 31, 2016
Description | Industry | Spread Above Index(1) | LIBOR Floor | Interest Rate(2) | Maturity Date | Par Amount | Cost | Fair Value(3) | ||||||||||||||||||||||
AccentCare, Inc. | Health Care Providers & Services | L+575 | 1.00 | % | 6.75 | % | 9/3/21 | $ | 4,875 | $ | 4,875 | $ | 4,875 | |||||||||||||||||
Alera Group Intermediate Holdings, Inc. | Insurance | L+550 | 1.00 | % | 6.50 | % | 12/30/22 | 13,824 | 13,686 | 13,686 | ||||||||||||||||||||
Associated Pathologists, LLC | Health Care Providers & Services | L+500 | 1.00 | % | 6.00 | % | 8/1/21 | 3,292 | 3,261 | 3,275 | ||||||||||||||||||||
CIBT Holdings, Inc. | Professional Services | L+525 | 1.00 | % | 6.25 | % | 6/28/22 | 13,102 | 12,979 | 12,971 | ||||||||||||||||||||
Empower Payments Acquisition, Inc. (RevSpring) | Professional Services | L+550 | 1.00 | % | 6.50 | % | 11/30/23 | 13,875 | 13,600 | 13,597 | ||||||||||||||||||||
Falmouth Group Holdings Corp. (AMPAC) (4) | Chemicals | L+675 | 1.00 | % | 7.75 | % | 12/14/21 | 34,650 | 34,202 | 34,650 | ||||||||||||||||||||
Pet Holdings ULC & Pet Supermarket, Inc. | Specialty Retail | L+550 | 1.00 | % | 6.50 | % | 7/5/22 | 20,625 | 20,336 | 20,367 | ||||||||||||||||||||
PPT Management Holdings, LLC | Health Care Providers & Services | L+600 | 1.00 | % | 7.00 | % | 12/16/22 | 12,000 | 11,881 | 11,880 | ||||||||||||||||||||
PSKW, LLC & PDR, LLC | Health Care Providers & Services | L+425 | 1.00 | % | 5.25 | % | 11/25/21 | 2,475 | 2,454 | 2,475 | ||||||||||||||||||||
PSKW, LLC & PDR, LLC | Health Care Providers & Services | L+839 | 1.00 | % | 9.39 | % | 11/25/21 | 22,250 | 21,866 | 21,861 | ||||||||||||||||||||
U.S. Anesthesia Partners Inc. | Health Care Providers & Services | L+500 | 1.00 | % | 6.00 | % | 12/31/19 | 19,557 | 19,407 | 19,362 | ||||||||||||||||||||
VetCor Professional Practices LLC | Health Care Facilities | L+625 | 1.00 | % | 7.25 | % | 4/20/21 | 21,818 | 21,686 | 21,491 | ||||||||||||||||||||
|
|
|
| |||||||||||||||||||||||||||
| $ | 180,233 | $ | 180,490 | |||||||||||||||||||||||||||
|
|
|
| |||||||||||||||||||||||||||
| (1) | Floating rate instruments accrue interest at a predetermined spread relative to an index, typically the LIBOR or PRIME rate. These instruments are typically subject to a LIBOR or PRIME rate floor. |
| (2) | Floating rate debt investments typically bear interest at a rate determined by reference to either the London Interbank Offered Rate (“LIBOR” or “L”) index rate or the prime index rate (PRIME or “P”), and which typically reset monthly, quarterly or semi-annually. For each debt investment we have provided the current interest rate in effect as of December 31, 2016. |
| (3) | Represents the fair value in accordance with ASC Topic 820. The determination of such fair value is not included in the Board’s valuation process described elsewhere herein. |
| (4) | The Company also holds this security on its Consolidated Statements of Assets and Liabilities. |
SOLAR CAPITAL LTD.
NOTES TO CONSOLIDATED FINANCIAL STATEMENTS (continued)
December 31, 2016
(in thousands, except share amounts)
SSLP Portfolio as of December 31, 2015
Description | Industry | Interest Rate(1) | Maturity Date | Par Amount | Cost | Fair Value(2) | ||||||||||||||||
Falmouth Group Holdings Corp. (AMPAC) (3) | Chemicals | 9.25 | % | 12/14/21 | $ | 35,000 | $ | 34,478 | $ | 34,475 | ||||||||||||
PSKW, LLC & PDR, LLC(3) | Health Care Providers & Services | 5.25 | % | 11/25/21 | 2,750 | 2,723 | 2,723 | |||||||||||||||
PSKW, LLC & PDR, LLC(3) | Health Care Providers & Services | 9.42 | % | 11/25/21 | 22,250 | 21,810 | 21,805 | |||||||||||||||
U.S. Anesthesia Partners Inc. | Health Care Providers & Services | 6.00 | % | 12/31/19 | 19,757 | 19,561 | 19,559 | |||||||||||||||
VetCor Professional Practices LLC | Health Care Facilities | 7.00 | % | 4/20/21 | 13,197 | 13,197 | 13,197 | |||||||||||||||
|
|
|
| |||||||||||||||||||
| $ | 91,769 | $ | 91,759 | |||||||||||||||||||
|
|
|
| |||||||||||||||||||
| (1) | Floating rate debt investments typically bear interest at a rate determined by reference to either the London Interbank Offered Rate (“LIBOR” or “L”) index rate or the prime index rate (PRIME or “P”), and which typically reset monthly, quarterly or semi-annually. For each debt investment we have provided the current interest rate in effect as of December 31, 2015. |
| (2) | Represents the fair value in accordance with ASC Topic 820. The determination of such fair value is not included in the Board’s valuation process described elsewhere herein. |
| (3) | The Company also holds a portion of this position on its Consolidated Statements of Assets and Liabilities. |
Below is certain summarized financial information for SSLP as of December 31, 2016 and December 31, 2015 and for the year ended December 31, 2016 and the period from November 25, 2015 through December 31, 2015:
| December 31, 2016 | December 31, 2015 | |||||||
Selected Balance Sheet Information for SSLP: | ||||||||
Investments at fair value (cost $180,233 and $91,769, respectively) | $ | 180,490 | $ | 91,759 | ||||
Cash and other assets | 4,326 | 769 | ||||||
|
|
|
| |||||
Total assets | $ | 184,816 | $ | 92,528 | ||||
|
|
|
| |||||
Debt outstanding | $ | 67,148 | $ | — | ||||
Distributions payable | 1,688 | 253 | ||||||
Interest payable and other credit facility related expenses | 660 | — | ||||||
Accrued expenses and other payables | 287 | 72 | ||||||
|
|
|
| |||||
Total liabilities | $ | 69,783 | $ | 325 | ||||
|
|
|
| |||||
Members’ equity | $ | 115,033 | $ | 92,203 | ||||
|
|
|
| |||||
Total liabilities and members’ equity | $ | 184,816 | $ | 92,528 | ||||
|
|
|
| |||||
SOLAR CAPITAL LTD.
NOTES TO CONSOLIDATED FINANCIAL STATEMENTS (continued)
December 31, 2016
(in thousands, except share amounts)
| Year ended December 31, 2016 | For the Period November 25, 2015 (commencement of operations) through December 31, 2015 | |||||||
Selected Income Statement Information for SSLP: | ||||||||
Interest income | $ | 9,187 | $ | 462 | ||||
|
|
|
| |||||
Service fees* | $ | 84 | $ | 4 | ||||
Interest and other credit facility expenses** | 3,878 | — | ||||||
Other general and administrative expenses | 138 | 175 | ||||||
|
|
|
| |||||
Total expenses | $ | 4,100 | $ | 179 | ||||
|
|
|
| |||||
Net investment income | $ | 5,087 | $ | 283 | ||||
|
|
|
| |||||
Net change in unrealized gain on investments | 267 | (10 | ) | |||||
|
|
|
| |||||
Net income | $ | 5,354 | $ | 273 | ||||
|
|
|
| |||||
| * | Service fees are included within the Company’s Consolidated Statements of Operations as other income. |
| ** | SSLP made an irrevocable election to apply the fair value option of accounting to the SSLP Facility, in accordance with ASC 825-10. As such, all expenses related to the establishment of the SSLP Facility were expensed during the year ended December 31, 2016. These amounts totaled $2,816. |
Note 16. Senior Secured Unitranche Loan Program II LLC
On November 2, 2015, the Company assigned $125,000 of its $300,000 commitment to SSLP to SSLP II, a Delaware limited liability company. On August 5, 2016, the Company entered into an amended and restated limited liability company agreement with WFI Loanco, LLC (“WFI”) and SSLP II commenced operations. Also on August 5, 2016, the Company assigned $49,977 of its $125,000 commitment to SSLP II to Senior Secured Unitranche Loan Program III LLC (“SSLP III”), a newly formed Delaware limited liability company. SSLP III, which has not commenced operations.operations, is currently wholly owned by Solar Capital Ltd. but may bring in unaffiliated investors at a later date. The Company and WFI’s equity commitments to SSLP II now total $75,023 and $18,000, respectively.
On November 15, 2016, SSLP II as transferor and SSLP II 2016-1, LLC, a newly formed wholly owned subsidiary of SSLP II, as borrower entered into a $100,000 senior secured revolving credit facility (the “SSLP II Facility”) with Wells Fargo Bank, NA acting as administrative agent. Solar Capital Ltd. acts as servicer under the SSLP II Facility. The SSLP II Facility is scheduled to mature on November 15, 2021. The SSLP II Facility generally bears interest at a rate of LIBOR plus 2.50%. SSLP II and SSLP II 2016-1, LLC, as applicable, have made certain customary representations and warranties, and are required to comply with various covenants, including leverage restrictions, reporting requirements and other customary requirements for similar credit facilities. The SSLP II Facility also includes usual and customary events of default for credit facilities of this nature. There were $32,950 of borrowings outstanding as of December 31, 2016. During the period August 5, 2016 through December 31, 2016, using proceeds from the SSLP II Facility, SSLP II returned capital totaling $16,130 and $3,870 to the Company and WFI, respectively. As of December 31, 2016, the Company and WFI contributed combined equity capital in the amount of $46,963 and $11,268, respectively. Of the $58,231 of contributed equity capital at December 31, 2016, the Company contributed $43,498 in the form of investments and $3,465 in the form of cash and WFI contributed $11,268 in the form of cash. As of December 31, 2016, the
SOLAR CAPITAL LTD.
NOTES TO CONSOLIDATED FINANCIAL STATEMENTS (continued)
December 31, 2016
(in thousands, except share amounts)
Company and WFI’s remaining commitments to SSLP II totaled $28,060 and $6,732, respectively. The Company, along with WFI, controls the funding of SSLP II and SSLP II may not call the unfunded commitments without approval of both the Company and WFI.
As of December 31, 2016, SSLP II had total assets of $93,467. At December 31, 2016, SSLP II’s portfolio consisted of floating rate senior secured loans to 12 different borrowers. For the period August 5, 2016 through December 31, 2016, SSLP II invested $102,173 in 13 portfolio companies. Investments prepaid totaled $12,052 for the same period. At December 31, 2016, the weighted average yield of SSLP II’s portfolio was 7.6%, measured at fair value and 7.9%, measured at cost.
SSLP II Portfolio as of December 31, 2016
Description | Industry | Spread Above Index(1) | LIBOR Floor | Interest Rate(2) | Maturity Date | Par Amount | Cost | Fair Value(3) | ||||||||||||||||||||||
Alera Group Intermediate Holdings, Inc. | Insurance | L+550 | 1.00 | % | 6.50 | % | 12/30/22 | $ | 5,184 | $ | 5,132 | $ | 5,132 | |||||||||||||||||
American Teleconferencing Services, Ltd. (PGI) (4) | Communications Equipment | L+650 | 1.00 | % | 7.50 | % | 12/8/21 | 14,619 | 13,244 | 14,217 | ||||||||||||||||||||
Associated Pathologists, LLC | Health Care Providers & Services | L+500 | 1.00 | % | 6.00 | % | 8/1/21 | 1,646 | 1,631 | 1,638 | ||||||||||||||||||||
CIBT Holdings, Inc. | Professional Services | L+525 | 1.00 | % | 6.25 | % | 6/28/22 | 5,241 | 5,191 | 5,188 | ||||||||||||||||||||
Empower Payments Acquisition, Inc. (RevSpring) | Professional Services | L+550 | 1.00 | % | 6.50 | % | 11/30/23 | 6,938 | 6,800 | 6,799 | ||||||||||||||||||||
Falmouth Group Holdings Corp. (AMPAC) (4) | Chemicals | L+675 | 1.00 | % | 7.75 | % | 12/14/21 | 10,945 | 10,945 | 10,945 | ||||||||||||||||||||
Pet Holdings ULC & Pet Supermarket, Inc. | Specialty Retail | L+550 | 1.00 | % | 6.50 | % | 7/5/22 | 9,075 | 8,947 | 8,962 | ||||||||||||||||||||
Polycom, Inc. | Communications Equipment | L+650 | 1.00 | % | 7.50 | % | 9/27/23 | 11,605 | 11,152 | 11,547 | ||||||||||||||||||||
PPT Management Holdings, LLC | Health Care Providers & Services | L+600 | 1.00 | % | 7.00 | % | 12/16/22 | 10,000 | 9,901 | 9,900 | ||||||||||||||||||||
PSKW, LLC & PDR, LLC | Health Care Providers & Services | L+425 | 1.00 | % | 5.25 | % | 11/25/21 | 990 | 990 | 990 | ||||||||||||||||||||
PSKW, LLC & PDR, LLC | Health Care Providers & Services | L+839 | 1.00 | % | 9.39 | % | 11/25/21 | 8,900 | 8,748 | 8,744 | ||||||||||||||||||||
U.S. Anesthesia Partners Inc. | Health Care Providers & Services | L+500 | 1.00 | % | 6.00 | % | 12/31/19 | 4,988 | 4,938 | 4,938 | ||||||||||||||||||||
VetCor Professional Practices LLC | Health Care Facilities | L+625 | 1.00 | % | 7.25 | % | 4/20/21 | 2,840 | 2,787 | 2,797 | ||||||||||||||||||||
|
|
|
| |||||||||||||||||||||||||||
| $ | 90,406 | $ | 91,797 | |||||||||||||||||||||||||||
|
|
|
| |||||||||||||||||||||||||||
SOLAR CAPITAL LTD.
NOTES TO CONSOLIDATED FINANCIAL STATEMENTS (continued)
December 31, 2016
(in thousands, except share amounts)
| (1) | Floating rate instruments accrue interest at a predetermined spread relative to an index, typically the LIBOR or PRIME rate. These instruments are typically subject to a LIBOR or PRIME rate floor. |
| (2) | Floating rate debt investments typically bear interest at a rate determined by reference to either the London Interbank Offered Rate (“LIBOR” or “L”) index rate or the prime index rate (PRIME or “P”), and which typically reset monthly, quarterly or semi-annually. For each debt investment we have provided the current interest rate in effect as of December 31, 2016. |
| (3) | Represents the fair value in accordance with ASC Topic 820. The determination of such fair value is not included in the Board’s valuation process described elsewhere herein. |
| (4) | The Company also holds this security on its Consolidated Statements of Assets and Liabilities. |
Below is certain summarized financial information for SSLP II as of December 31, 2016 and for the period August 5, 2016 (commencement of operations) through December 31, 2016:
| December 31, 2016 | ||||
Selected Balance Sheet Information for SSLP II: | ||||
Investments at fair value (cost $90,406) | $ | 91,797 | ||
Cash and other assets | 1,670 | |||
|
| |||
Total assets | $ | 93,467 | ||
|
| |||
Debt outstanding | $ | 32,950 | ||
Distributions payable | 1,460 | |||
Interest payable and other credit facility related expenses | 147 | |||
Accrued expenses and other payables | 183 | |||
|
| |||
Total liabilities | $ | 34,740 | ||
|
| |||
Members’ equity | $ | 58,727 | ||
|
| |||
Total liabilities and members’ equity | $ | 93,467 | ||
|
| |||
| For the period August 5, 2016 (commencement of operations) through December 31, 2016 | ||||
Selected Income Statement Information for SSLP II: | ||||
Interest income | $ | 2,259 | ||
|
| |||
Service fees* | $ | 28 | ||
Interest and other credit facility expenses** | 1,536 | |||
Other general and administrative expenses | 130 | |||
|
| |||
Total expenses | $ | 1,694 | ||
|
| |||
Net investment income | $ | 565 | ||
|
| |||
Net change in unrealized gain on investments | 1,391 | |||
|
| |||
Net income | $ | 1,956 | ||
|
| |||
| * | Service fees are included within the Company’s Consolidated Statements of Operations as other income. |
SOLAR CAPITAL LTD.
NOTES TO CONSOLIDATED FINANCIAL STATEMENTS (continued)
December 31, 2016
(in thousands, except share amounts)
| ** | SSLP II made an irrevocable election to apply the fair value option of accounting to the SSLP II Facility, in accordance with ASC 825-10. As such, all expenses related to the establishment of the SSLP II Facility were expensed during the year ended December 31, 2016. These amounts totaled $1,389. |
Note 16.17. Subsequent Events
The Company has evaluated the need for disclosures and/or adjustments resulting from subsequent events through the date the consolidated financial statements were issued.
On February 25, 2015,15, 2017, the Company closed a private offering of $100,000 of additional 2022 Unsecured Notes with a fixed interest rate of 4.60% and a maturity date of May 8, 2022. Interest on the 2022 Unsecured Notes is due semi-annually on May 8 and November 8. The 2022 Unsecured Notes were issued in a private placement only to qualified institutional buyers pursuant to Rule 144A under the Securities Act of 1933, as amended.
On February 22, 2017, the Company, through its commitment to SSLP III, and Solar Senior formed Solar Life Science Program LLC (“LSJV”) with an affiliate of Deerfield Management. The Company is committing approximately $49,977 to LSJV.
On February 22, 2017, our Board declared a quarterly dividend of $0.40 per share payable on April 2, 20154, 2017 to holders of record as of March 19, 2015.23, 2017.
| Item 9. | Changes in and Disagreements with Accountants on Accounting and Financial Disclosure |
None.
| Item 9A. | Controls and Procedures |
(a) Evaluation of Disclosure Controls and Procedures
As of December 31, 20142016 (the end of the period covered by this report), we, including our Chief Executive Officer and Chief Financial Officer, evaluated the effectiveness of the design and operation of our disclosure controls and procedures (as defined in Rule 13a-15(e) of the 1934 Act). Based on that evaluation, our management, including the Chief Executive Officer and Chief Financial Officer, concluded that our disclosure controls and procedures were effective and provided reasonable assurance that information required to be disclosed in our periodic SEC filings is recorded, processed, summarized and reported within the time periods specified in the SEC’s rules and forms, and that such information is accumulated and communicated to our management, including our Chief Executive Officer and Chief Financial Officer, as appropriate, to allow timely decisions regarding required disclosure. However, in evaluating the disclosure controls and procedures, management recognized that any controls and procedures, no matter how well designed and operated can provide only reasonable assurance of achieving the desired control objectives, and management necessarily was required to apply its judgment in evaluating the cost-benefit relationship of such possible controls and procedures.
(b) Management’s Report on Internal Control Over Financial Reporting
Management’s Report on Internal Control Over Financial Reporting, which appears on page 72in Item 8 of this Form 10-K, is incorporated by reference herein.
(c) Attestation Report of the Independent Registered Public Accounting Firm
Our independent registered public accounting firm, KPMG LLP, has issued an attestation report on the Company’s internal control over financial reporting, which is set forth above under the heading “Report of Independent Registered Public Accounting Firm On Internal Control Over Financial Reporting” in Item 8.
(d) Changes in Internal Controls Over Financial Reporting
Management has not identified any change in the Company’s internal control over financial reporting that occurred during the fourth fiscal quarter of 20142016 that has materially affected, or is reasonably likely to materially affect, the Company’s internal control over financial reporting.
| Item 9B. | Other Information |
None.
We will file a definitive Proxy Statement for our 20152017 Annual Meeting of Stockholders with the SEC, pursuant to Regulation 14A, not later than 120 days after the end of our fiscal year. Accordingly, certain information required by Part III has been omitted under General Instruction G(3) to Form 10-K. Only those sections of our definitive Proxy Statement that specifically address the items set forth herein are incorporated by reference.
| Item 10. | Directors, Executive Officers and Corporate Governance |
The information required by Item 10 is hereby incorporated by reference from our definitive Proxy Statement relating to our 20152017 Annual Meeting of Stockholders, to be filed with the Securities and Exchange Commission within 120 days following the end of our fiscal year.
| Item 11. | Executive Compensation |
The information required by Item 11 is hereby incorporated by reference from our definitive Proxy Statement relating to our 20152017 Annual Meeting of Stockholders, to be filed with the Securities and Exchange Commission within 120 days following the end of our fiscal year.
| Item 12. | Security Ownership of Certain Beneficial Owners and Management and Related Stockholder Matters |
The information required by Item 12 is hereby incorporated by reference from our definitive Proxy Statement relating to our 20152017 Annual Meeting of Stockholders, to be filed with the Securities and Exchange Commission within 120 days following the end of our fiscal year.
| Item 13. | Certain Relationships and Related Transactions, and Director Independence |
The information required by Item 13 is hereby incorporated by reference from our definitive Proxy Statement relating to our 20152017 Annual Meeting of Stockholders, to be filed with the Securities and Exchange Commission within 120 days following the end of our fiscal year.
| Item 14. | Principal Accounting Fees and Services |
The information required by Item 14 is hereby incorporated by reference from our definitive Proxy Statement relating to our 20152017 Annual Meeting of Stockholders, to be filed with the Securities and Exchange Commission within 120 days following the end of our fiscal year.
| Item 15. | Exhibits, Financial Statement Schedules |
a. Documents Filed as Part of this Report
The following reports and consolidated financial statements are set forth in Item 8:
b. Exhibits
The following exhibits are filed as part of this report or hereby incorporated by reference to exhibits previously filed with the SEC:
Exhibit Number | Description | |
| 3.1 | Articles of Amendment and Restatement(1) | |
| 3.2 | Amended and Restated Bylaws(1) | |
| 4.1 | Form of Common Stock Certificate(2) | |
| 4.2 | Indenture, dated as of November 16, 2012, between the Registrant and U.S. Bank National Association as trustee(3) | |
| 4.3 | First Supplemental Indenture, dated November 16, 2012, relating to the 6.75% Senior Notes due 2042, between the Registrant and U.S. Bank National Association as trustee(3) | |
| 4.4 | In accordance with Item 601(b)(4)(iii)(A) of Regulation S-K, certain instruments respecting long-term debt of the Registrant have been omitted but will be furnished to the SEC upon request | |
| 10.1 | Dividend Reinvestment Plan(1) | |
| 10.2 | Form of | |
| 10.3 | Form of Amendment No. 1 to the Senior Secured Credit Agreement by and between the Registrant, the Lenders and Citibank, N.A., as administrative | |
| Form of Amendment No. | ||
| First Amended and Restated Investment Advisory and Management Agreement by and between the Registrant and Solar Capital Partners, | ||
| 10.6 | ||
| Form of | ||
Exhibit Number | Description | |
| 10.8 | Form of Indemnification Agreement by and | |
| 10.9 | ||
| Trademark License Agreement by and between Registrant and Solar Capital Partners, LLC(1) | ||
| Form of Share Purchase Agreement by and between Registrant and Solar Capital Investors II, LLC(2) | ||
| Form of Registration Rights | ||
| 10.12 | Form of Subscription Agreement(4) | |
| 10.13 | Form of Amended and Restated Limited Liability Company Agreement, dated as of October 15, 2015, between Solar Capital Ltd., Voya Retirement Insurance and Annuity Company, ReliaStar Life Insurance Company, and Voya Insurance and Annuity Company, by and through Voya Investment Management LLC, as agent and investment manager(8) | |
| 10.14 | Form of | |
| 11.1 | Computation of Per Share Earnings* | |
| 14.1 | Code of | |
| 14.2 | Code of Business | |
| 21.1 | ||
| 31.1 | Certification of Chief Executive Officer pursuant to Rule 13a-14 of the Securities Exchange Act of 1934, as amended.* | |
| 31.2 | Certification of Chief Financial Officer pursuant to Rule 13a-14 of the Securities Exchange Act of 1934, as amended.* | |
| 32.1 | Certification of Chief Executive Officer pursuant to Section 906 of The Sarbanes-Oxley Act of 2002.* | |
| 32.2 | Certification of Chief Financial Officer pursuant to Section 906 of The Sarbanes-Oxley Act of 2002.* | |
| 99.1 | Crystal Financial LLC (A Delaware Limited Liability Company) Consolidated Financial Statements for the years ended December 31, | |
| (1) | Previously filed in connection with Solar Capital Ltd.’s registration statement on Form N-2 Pre-Effective Amendment No. 7 (File No. 333-148734) filed on January 7, 2010. |
| (2) | Previously filed in connection with Solar Capital Ltd.’s registration statement on Form N-2 (File No 333-148734) filed on February 9, 2010. |
| (3) | Previously filed in connection with Solar Capital Ltd.’s registration statement on Form N-2 Post-Effective Amendment No. 6 (File No. 333-172968) filed on November 16, 2012. |
| (4) | Previously filed in connection with Solar Capital Ltd.’s |
| Previously filed in connection with Solar Capital Ltd.’s report on Form 10-Q filed on July 31, 2013. |
| Previously filed in connection with Solar Capital Ltd.’s registration statement on Form N-2 Post-Effective Amendment No. 10 (File No. 333-172968) filed on November 12, 2013. |
| Previously filed in connection with Solar Capital Ltd.’s report on Form 10-K filed on February 25, 2014. |
| Previously filed in connection with Solar Capital Ltd.’s report on Form 10-Q filed on November |
| (9) | Previously filed in connection with Solar Capital Ltd.’s report on Form 8-K filed on July 6, 2012. |
| (10) | Previously filed in connection with Solar Capital Ltd.’s report on Form 10-Q filed on November 2, 2016. |
| (11) | Previously filed in connection with Solar Capital Ltd.’s report on Form 10-Q filed on August 2, 2016. |
| (12) | Previously filed in connection with Solar Capital Ltd.’s report on Form 8-K filed on August 11, 2016. |
| * | Filed herewith. |
c. Consolidated Financial Statement Schedules
Separate Financial Statements of Subsidiaries Not Consolidated:
Consolidated Financial Statements for Crystal Financial LLC’s (A Delaware Limited Liability Company) years ended December 31, 20142016 and December 31, 20132015 are attached as Exhibit 99.1 to our Form 10-K. Consolidated Financial Statements for Crystal Capital Financial Holdings LLC (A Delaware Limited Liability Company) for the year ended December 31, 2013 is attached as Exhibit 99.2 to our Form 10-K.hereto.
Pursuant to the requirements of Section 13 or 15(d) of the Securities Act of 1934, the Registrant has duly caused this report to be signed on its behalf by the undersigned, thereunto duly authorized.
| SOLAR CAPITAL LTD. | ||
| By: | /S/ MICHAEL S. GROSS | |
Michael S. Gross Chief Executive Officer, President, Chairman of the Board and Director | ||
Date: February | ||
Pursuant to the requirements of the Securities Exchange Act of 1934, this report has been signed below by the following persons on behalf of the registrant and in the capacity and on the dates indicated.
Date | Signature | Title | ||
February | /s/ MICHAEL S. GROSS Michael S. Gross | Chief Executive Officer, President, Chairman of the Board and Director (Principal Executive Officer) | ||
February | /s/ STEVEN HOCHBERG Steven Hochberg | Director | ||
February | /s/ DAVID S. WACHTER David S. Wachter | Director | ||
February | /s/ LEONARD A. POTTER Leonard A. Potter | Director | ||
February | /s/ BRUCE SPOHLER Bruce Spohler | Chief Operating Officer and Director | ||
February | /s/ RICHARD L. PETEKA Richard L. Peteka | Chief Financial Officer (Principal Financial Officer) and Secretary | ||
111131