SECURITIES AND EXCHANGE COMMISSION
Washington, D.C. 20549
FORM 10-K
|
| |
| x | ANNUAL REPORT PURSUANT TO SECTION 13 OR 15(d) OF THE SECURITIES EXCHANGE ACT OF 1934 |
For the fiscal year ended December 31,
20142016
Commission File Number: 001-36771LendingClub Corporation
(Exact name of registrant as specified in its charter)
|
|
LendingClub Corporation (Exact name of registrant as specified in its charter) |
|
| | |
| Delaware | | 51-0605731 |
(State or other jurisdiction of incorporation or organization) | | Identification No.) |
| | |
| 71 Stevenson Street, Suite 300 | | |
| San Francisco, California | | 94105 |
| (Address of principal executive offices) | | (Zip Code) |
(Registrant’s telephone number, including area code)
Securities registered pursuant to Section 12(b) of the Act:
|
| | |
Title of each class: | | Name of each exchange on which registered: |
| Common Stock, par value $0.01 per share | | New York Stock Exchange |
Securities registered pursuant to Section 12(g) of the Act: None
Indicate by check mark if the registrant is a well-known seasoned issuer, as defined in Rule 405 of the Securities Act. Yes xý No ¨ Indicate by check mark if the registrant is not required to file reports pursuant to Section 13 or Section 15(d) of the Act. Yes ¨ No xý Indicate by check mark whether the registrant (1) has filed all reports required to be filed by Section 13 or 15(d) of the Securities Exchange Act of 1934 during the preceding 12 months (or for such shorter period that the registrant was required to file such reports), and (2) has been subject to such filing requirements for the past 90 days. Yes xý No ¨ Indicate by check mark whether the registrant has submitted electronically and posted on its corporate Web site, if any, every Interactive Data File required to be submitted and posted pursuant to Rule 405 of Regulation S-T (§ 232.405 of this chapter) during the preceding 12 months (or for such shorter period that the registrant was required to submit and post such files). Yes xý No ¨ Indicate by check mark if disclosure of delinquent filers pursuant to Item 405 of Regulation S-K (§ 229.405 of this chapter) is not contained herein, and will not be contained, to the best of registrant’s knowledge, in definitive proxy or information statements incorporated by reference in Part III of this Form 10-K or any amendment to this Form 10-K. x¨ Indicate by check mark whether the registrant is a large accelerated filer, an accelerated filer, a non-accelerated filer, or a smaller reporting company. See the definitions of “large accelerated filer,” “accelerated filer” and “smaller reporting company” in Rule 12b-2 of the Exchange Act. (Check one):
|
| | | | | |
| Large accelerated filer | | ¨ý | | Accelerated filer | | ¨ |
| | | |
| Non-accelerated filer | | x¨ (Do not check if a smaller reporting company)
| | Smaller reporting company | | ¨ |
Indicate by check mark whether the registrant is a shell company (as defined in Rule 12b-2 of the Exchange Act). Yes ¨ No xý The aggregate market value of the voting and non-voting common equity held by non-affiliates of the registrant
as of June 30, 2016, the last business day of the registrant’s most recently completed second fiscal quarter, was $1,315,348,311 based on the closing price
of a share of the registrant’s common stock on December 11, 2014 as reported
by the New York Stock Exchange onfor such
date was approximately $4,873.9 million. The registrant has elected to use December 11, 2014, which was the initial trading date on the New York Stock
Exchange, as the calculation date because on June 30, 2014 (the last business day of the registrant’s mostly recently completed second fiscal quarter), the registrant was a privately-held company.Exchange. Shares of the registrant’s common stock held by each executive officer, director and holder of 10% or more of the outstanding common stock have been excluded in that such persons may be deemed to be affiliates. This calculation does not reflect a determination that certain persons are affiliates of the registrant for any other purpose.
As of February
25, 2015,23, 2017, there were
371,991,134400,157,603 shares of the registrant’s common stock outstanding.
Documents Incorporated by Reference
Portions of the registrant’s Definitive Proxy Statement for the Registrant’s
20152017 Annual Meeting of Stockholders are incorporated by reference into Part III of this Annual Report on Form 10-K to the extent stated herein. Such Definitive Proxy Statement will be filed with the Securities and Exchange Commission within 120 days after the end of the registrant’s fiscal year ended December 31,
2014.2016.
Annual Report On Form 10-K
For Fiscal Year Ended December 31, 20142016
Except as the context requires otherwise,
including in the financial statements of Springstone Financial, LLC, as used herein, “Lending Club,”
“company”,“Company,” “we,” “us,” and “our,” refer to LendingClub Corporation, a Delaware corporation, and, where appropriate, its
wholly owned subsidiaries, which include:three subsidiaries:
LC Advisors, LLC (LCA), a wholly-owned, registered investment advisor with the Securities and Exchange Commission (SEC) that acts as the general partner for certain private funds and as advisor to separately managed accounts.
Springstone Financial, LLC (Springstone), a wholly-owned company we acquired in April 2014 that facilitates education and patient finance loans.
RV MP Fund GP, LLC, a wholly-owned subsidiary of LCA that acts as the general partner for a private fund, while LCA acts as the investment manager of this private fund.
LC Trust I (the Trust) is an independent Delaware business trust that acquires loans from the Company and holds them for the sole benefit of certain investors that have purchased a trust certificate (Certificate) issued by the Trust and that are related to specific underlying loans for the benefit of the investor.
Forward-Looking Statements
This report contains forward-looking statements within the meaning of Section 29A27A of the Securities Act of 1933 and Section 21E of the Securities Exchange Act of 1934. All statements, other than statements of historical facts, included in this Annual Report on Form 10-K (Report) regarding borrowers, credit scoring, Fair Isaac Corporation (“FICO”) or other credit scores, our strategy, future operations, expected losses, future financial position, future revenue, projected costs, prospects, plans, objectives of management and expected market growth are forward-looking statements. TheYou can identify these forward-looking statements by words such as “anticipate,” “appear,” “believe,” “continue,” “could,” “estimate,” “expect,” “intend,” “may,” “plan,” “predict,” “project,” “target,” “will,” or similar expressions are intended to identify forward-looking statements, although not all forward-looking statements contain these identifying words. expressions.
These forward-looking statements include, among other things, statements about:
the status of borrowers, the ability of borrowers to repay loans and the plans of borrowers;
interest ratesour ability to maintain investor confidence in the operation of our platform;
the likelihood of investors to continue to, directly or indirectly, invest through our platform;
our ability to secure additional sources of investor commitments for our platform and origination feesthe continued deployment of those investor commitments on loans charged by issuing banks;
the available functionality of a secondary market trading program for notes;platform;
ability to secure additional investors without incentives to participate on the platform;
expected rates of return providedfor investors;
the effectiveness of our platform’s credit scoring models;
the use or potential use of our own capital to investors;purchase loans;
our abilitycommitments or investments in loans to successfully integrate our acquisition of Springstone Financial, LLC (Springstone), including our ability to expand the number of providers that use the products provided through Springstone;
the likelihood of us having to fund contingent commitments, including commitments madesupport: contractual obligations, such as to Springstone’s issuing bank for loans that Springstone facilitates and athat are originated by the issuing bank partner but do not meet the credit support agreementcriteria for purchase by the issuing bank partner (Pool B loans) or repurchase obligations, regulatory commitments, such as direct mail, short-term marketplace equilibrium, the testing or initial launch of alternative loan terms, programs or channels that we do not have entered into with a certificate investor;sufficient performance data on, or customer accommodations;
the potential impact of having to fund any such contingent commitments;
transaction fee or other revenue we expect to recognize whenafter loans are originatedissued by our banking partner;issuing bank partners;
our financial condition and performance, including our ability to remain cash flow positive and the impact that management’s estimates have on our financial performance;performance and the relationship between the interim period and full year results;
capital expenditures;
the impact of new accounting standards;
investor, borrower, platform and loan performance-related factors that may affect our abilityrevenue;
the potential adoption rates and returns related to retainnew products and hire employees and appropriately staff our operations;services;
our ability to prevent security breaches, disruptions in service or comparable eventsthe potential impact of macro-economic developments that could compromiseimpact the personally identifiable or confidential information held incredit performance of our data systems, reduce the attractiveness of the marketplace or adversely impact our ability to service loans;
our ability to preventloans, notes and detect identity theft;certificates, and influence borrower and investor behavior;
our ability to develop and maintain effective internal controls, and our remediation of a material weakness in our internal controls;
our ability to recruit and retain quality employees to support future growth;
our compliance with applicable local, state and federal laws, including the Investment Advisors Act of 1940, the Investment Company Act of 1940 and otherFederal laws;
our compliance with applicable regulations and regulatory developments or court decisions affecting our marketplace;business; and
our estimateother risk factors listed from time to time in reports we file with the SEC.
We caution you that the foregoing list may not contain all of future consumer credit that would meet our standard or custom program credit terms.
the forward-looking statements in this Report. We may not actually achieve the plans, intentions or expectations disclosed in forward-looking statements, and you should not place undue reliance on forward-looking statements. We have included important factors in the cautionary statements included in this Report, particularly in the “Risk Factors” section, that could, among other things, cause actual results or events to differ materially from forward-looking statements contained in this Report. Forward-looking statements do not reflect the potential impact of any future acquisitions, mergers, dispositions, joint ventures or investments we may make.
You should read this Report carefully and completely and with the understanding that actual future results may be materially different from what we expect. We do not assume any obligation to update or revise any forward-looking statements, whether as a result of new information, future events or otherwise, other than as required by law.
PART I
Transforming the banking system to make credit more affordable and investing more rewarding.
Lending Club is the world’s largest online marketplace for connecting borrowers and investors. As of December 31, 2014, our marketplace facilitated over $7.6 billion in loan originations since it first launched in 2007, of which approximately $2.0 billion were invested in through notes issued pursuant to a shelf registration statement (the Note Registration Statement), $2.9 billion were invested in through certificates issued by an independent trust (Trust) and $2.7 billion were invested in through whole loan sales. In the fourth quarter of 2014, our marketplace facilitated over $1.4 billion of loan originations, of which approximately $0.2 billion were invested in through notes, $0.4 billion were invested in through certificates and $0.8 billion were invested in through whole loan sales. We believe aour technology-powered online marketplace is athe best way to make capital more efficient mechanismaccessible to allocate capital between borrowers and investors thaninvestors. Our marketplace increases efficiency and improves the borrower and investor experience with ease of use and accessibility by substantially reducing the need for physical infrastructure and manual processes that exist in the traditional banking system. Consumers
Qualified consumers and small business owners borrow through Lending Club to lower the cost of their credit and enjoy a bettermore seamless and transparent experience than that provided by traditional bank lending. banks. We believe the range of loan products we facilitate is simple, fair and responsible, making it easier for consumers to budget for monthly repayment and meet their financial goals.
Investors use Lending Club to earn attractive risk-adjusted returns from an asset class that has generally been closed to many investors and only available on a limited basis to
large institutional investors.
Our Through our marketplace, is where borrowerswe are able to make more assets available to more investors, including retail investors, high-net-worth individuals and investors engage in transactions relating to standard or custom program loans. Standard Program Loans which are part of the Standard Loan Program, are three- or five-year unsecured personal loans which are offered to borrowers with a FICO score of at least 660family offices, banks and that meet other strict credit criteria. These loans can be invested in through the purchase of notes issued pursuant to a Note Registration Statement,finance companies, insurance companies, hedge funds, foundations, pension plans and are only available through our website. Separately, qualified investors may also invest in Standard Program Loans in private transactions not facilitated through our website. Custom Program Loans are only invested in through private transactions with qualified investors and cannot be invested in through notes and are not visible through our public website. Custom Program Loans include small business loans, super prime consumer loans, education and patient finance loans and personal loans that do not meet the requirements of Standard Program Loans.
university endowments.
We have developed our proprietary technology platform to support our marketplace and
make availableoffer a variety of
our issuing banks’ loan products to interested
investor channels.investors. Our proprietary technology automates key aspects of our operations, including the borrower application process, data gathering, credit decisioning and scoring, loan funding, investing and servicing, regulatory compliance and fraud detection. Our platform offers sophisticated analytical tools and data to enable investors to make informed decisions and assess their portfolios. Our extensible technology platform has allowed us to expand our offerings from personal loans to include small business loans, and to expand investor classes from individuals to institutions and create various investment vehicles.
We generate revenue from transaction fees from our marketplace’s role in matching borrowers with investorsaccepting and decisioning applications for our bank partners to enable loan originations, servicing fees from investors for matching available loan assets with capital, and management fees from investment funds and other managed accounts. We doWhile our business model is not assumedependent on using our balance sheet and assuming credit risk for loans facilitated by our marketplace, we may use a greater amount of our own capital, compared to past experience, to fulfill regulatory or contractual purchase obligations, or support short-term marketplace equilibrium. We may also use our own capital to invest in loans facilitated byassociated with the testing or initial launch of new or alternative loan terms, programs or channels to establish a track record of performance prior to facilitating third-party investments in these loans, or to support alternative loan purchase programs.
As of December 31, 2016, our marketplace
exceptfacilitated approximately $24.6 billion in
limited circumstancesloans since it first launched in 2007, of which approximately $4.6 billion were invested in through notes issued pursuant to a shelf registration statement (the Note Registration Statement), $6.9 billion were invested in through Certificates issued by the Trust, and
$13.1 billion were invested in
amounts that are not material. The capital to invest in the loans facilitated through
our marketplace comes directly from a wide range of investors, including retail investors, high-net-worth individuals and family offices, banks and finance companies, insurance companies, hedge funds, foundations, pension plans and university endowments, and through a variety of channels, such as borrower payment dependent investment securities and whole loan
purchases.sales.
Industry Background and Trends
There is an opportunity for the online marketplace model to transform the traditional banking system.
We believe a transparent and open marketplace where borrowers and investors have access to information, complemented by technology and tools, can make credit more affordable, redirect existing pools of capital trapped inside the banking system, and attract new sources of capital to a new asset class. We believe that online marketplaces have the power to
transform the traditional banking system, facilitate more efficient deployment of capital, and improve the global economy.
Personal and Small Business Lending Is Essential to the Economy
We believe the ability of individuals and small businesses to access affordable credit is essential to stimulating and sustaining a healthy, diverse and innovative economy. Lending to consumers provides financial flexibility and gives households better control over when and how to purchase goods and services. While borrower appetite for consumer and small business credit has typically remained strong in most economic environments, general economic factors and conditions, including the general interest rate environment and unemployment rates, may affect borrower willingness to seek loans and investor ability
andor desire to invest in loans.
Borrowers Are Inadequately Served by the Current Banking System
We believe the traditional banking system generally is burdened by its high fixed cost of underwriting and services, in part due to its physical infrastructure and labor- and paper-intensive business processes, compounded by an increasingly complex regulatory environment. As a result, we believe the traditional banking system is ill-suited to meet personal and small business demand
in a fair and affordable way for borrowers. Instead, banks have managed the demand for small balance loans
and has instead relied heavily onby issuing credit cards, which require less personalized underwriting and have higher interest rates. While credit cards are convenient as a payment mechanism, they are an expensive long-term financing solution. Borrowers who carry a balance on their cards are often subject to high, variable interest rates and the possibility of incurring additional fees and penalties. Additionally, many borrowers are charged the same high interest rates on their balances, regardless of an individual’s specific risk profile, so
low risklow-risk borrowers often subsidize
high riskhigh-risk borrowers. In the limited instances when traditional banks make personal loans available, the loan application process is often opaque, frustrating and time consuming.
Investors Have
Had Limited Options to Participate in Personal and Small Business Credit
Historically, access to most personal and small business loans as an investment product was limited to the banks that hold loans on their balance sheet or to structured securitized products that were syndicated to large institutional investors. Depositors effectively fund the loans made by the banking system, but they share little in the direct returns of these loans as evidenced by the low yields on various fixed income investment or deposit products offered by banks. We believe many investors
generally lack the size andshould have access to invest in structured products directly and
are unablebe able to invest in personal and small business credit in a meaningful way. While institutional investors have had some access to this market, most have lacked the tools to customize portfolios to their specific risk
tolerance, which is a feature of ourtolerance. Our marketplace and
products. As a result, weproducts address both of these needs. We believe
the additional capital that could be invested in personal and small business loans,
and has largely been locked out of the
market.market, may be available for use on our marketplace as an alternative to other similarly performing fixed asset investments.
Online Marketplaces Have Proliferated Throughout the Economy
Online marketplaces have emerged to connect buyers and sellers across many industries to increase choice, improve quality, accelerate the speed of decision making and lower costs. We believe a successful online marketplace must act as a trusted intermediary providing transparency, security, supply and demand balance, and ease of use to give marketplace participants an incentive to interact and the confidence to do business together. Initial online marketplaces connected buyers and sellers of goods and services—services – primarily moving demand from offline to online and making the transaction process more efficient. Online marketplaces have more recently evolved to unlock supply and demand that could not previously be matched in an efficient manner offline. The “sharing economy,” a
term that describes this
new marketplace trend, enables a better use of resources by allowing owners of underutilized assets to offer them to people who want them while capturing an economic benefit.
Our
Marketplace Solution
We are the world’s largest online marketplace connecting borrowers and investors. Our technology platform supports this innovative marketplace model to efficiently connect the supply and demand of capital. Our marketplace also substantially reduces the need for physical infrastructure and improves convenience and automation, increasing efficiency, reducing manual processes and improving the overall borrower and investor experience.
We believe that our marketplace provides the following benefits to borrowers:
| • | | Access to Affordable Credit. Our innovative marketplace model, online delivery and process automation enable us to offer borrowers interest rates that are generally lower on average than the rates charged by traditional banks, credit cards or installment loans. |
| • | | Superior Borrower Experience. We offer a fast and easy-to-use online application process and provide borrowers with access to live support and online tools throughout the process and over the life of the loan. |
| • | | Transparency and Fairness. All of the installment loans offered through our marketplace feature a fixed rate that is clearly disclosed to the borrower during the application process, with fixed monthly payments, no hidden fees and the ability to prepay the balance at any time without penalty. Our platform utilizes a computerized, rules-based engine for credit decisioning, which removes the human bias associated with reviewing applications. |
| • | | Fast and Efficient Decisioning. We leverage online data and technology to quickly assess risk, determine a credit rating and assign appropriate interest rates quickly. |
Access to Affordable Credit. Our innovative marketplace model, online delivery and process automation enable us to offer borrowers interest rates that are generally lower on average than the rates charged by traditional banks, credit cards or installment loans.
Superior Borrower Experience. We offer a fast and easy-to-use online application process and provide borrowers with access to live support and online tools throughout the process and over the life of the loan.
Transparency and Fairness. The installment loans offered through our marketplace feature a fixed rate that is clearly disclosed to the borrower during the application process, with fixed monthly payments, no hidden fees and the ability to prepay the balance at any time without penalty. Small business lines of credit have rates based upon the prime rate and allow borrowers to draw in increments, reducing their interest cost. Our platform utilizes an automated, rules-based engine for credit decisioning, which removes the human bias associated with reviewing applications.
Fast and Efficient Decisioning. We leverage online data and technology to quickly assess risk, detect fraud, determine a credit rating and assign appropriate interest rates quickly.
We believe that our marketplace provides the following benefits to investors:
| • | | Access to a New Asset Class. All investors can invest in personal loans facilitated through our Standard Loan Program. Additionally, qualified investors can invest in loans facilitated through our Custom Loan Program in private transactions. These asset classes have historically been entirely funded and held by financial institutions or large institutional investors on a limited basis. |
| • | | Attractive Risk-Adjusted Returns. We have historically offered investors attractive risk-adjusted returns across loans offered through our marketplace. |
| • | | Transparency. We provide investors with transparency and choice in building their loan portfolios. |
| • | | Easy-to-Use Tools. We provide investors with tools to easily build and modify customized and diversified portfolios by selecting loans tailored to their investment objectives and assess the returns on their portfolios or investors may enroll in automated investing, a free service that automatically invests any available cash in loans according to investor-specified criteria. |
Access to a New Asset Class. All investors can invest in personal loans facilitated through our standard loan program. Additionally, qualified investors can invest in loans facilitated through our custom program loan program in private transactions. These asset classes have historically been funded and held by financial institutions or large institutional investors on a limited basis.
Attractive Risk-Adjusted Returns. We offer investors attractive risk-adjusted returns on loans offered through our marketplace.
Transparency. We provide investors with transparency and choice in building their loan portfolios.
Easy-to-Use Tools. We provide investors with tools to easily build and modify customized and diversified portfolios by selecting loans tailored to their investment objectives and to assess the returns on their portfolios. Investors can also enroll in automated investing, a free service that automatically invests any available cash in loans according to investor-specified criteria.
Our Competitive Strengths
We believe the following strengths differentiate us from our competitors and provide us with competitive advantages in realizing the potential of our market opportunity:
| • | | Leading Online Marketplace. We are the world’s largest online marketplace connecting borrowers and investors, based on over $7.6 billion in loan originations through December 31, 2014, of which approximately $2.0 billion were invested in through notes issued pursuant to the Note Registration Statement, $2.9 billion were invested in through certificates issued by the Trust and $2.7 billion were invested in through whole loan sales. |
| • | | Robust Network Effects. Our online marketplace exhibits network effects that are driven by the number of participants and investments enabled through our marketplace. More participation leads to greater potential to match borrowers with investors. Additionally, increased participation also results in the generation of substantial data that is used to improve the effectiveness of our credit decisioning and scoring models, enhancing our performance record and generating increasing trust in our marketplace. As trust increases, we believe investors will continue to demonstrate a willingness to accept lower risk premiums which will allow us to offer lower interest rates and attract additional high-quality borrowers, thereby reinforcing our track record and fueling a virtuous cycle for our business. We believe that these network effects reinforce our market leadership position. |
| • | | High Borrower and Investor Satisfaction. Borrowers have validated our approach with an aggregate Net Promoter Score in the 70s since we began surveying borrowers in January 2013, which places us at the upper end of customer satisfaction ratings for traditional financial service companies. Additionally, investors are confident transacting on our marketplace, as evidenced by high reinvestment rates. |
| • | | Technology Platform. Our technology platform powers our online marketplace and enables us to deliver innovative solutions to borrowers and investors. Our technology platform automates our operations and, we believe, provides a significant time and cost advantage over traditional banks that run on legacy systems that are inflexible and slow to evolve. |
| • | | Sophisticated Risk Assessment. We use proprietary algorithms that leverage behavioral data, transactional data and employment information to supplement traditional risk assessment tools, such as FICO scores. We have built our technology platform to automate the application of these proprietary algorithms to each individual borrower’s application profile at scale. This approach allows us to evaluate and segment each potential borrower’s risk profile and price it accordingly. In contrast, traditional lenders aggregate borrowers into large pools of risk profiles, which for some borrowers results in higher interest rates despite a more favorable credit profile. |
| • | | Efficient and Attractive Financial Model. Our trusted brand, scale and network effect drives significant borrowing and investing activity on our marketplace. We generate revenue from transaction fees from our marketplace’s role in matching borrowers with investors to enable loan originations, servicing fees from investors and management fees from investment funds and other managed accounts. We do not assume credit risk or use our own capital to invest in loans facilitated by our marketplace, except in limited circumstances and in amounts that are not material. Our technology platform significantly reduces the need for physical infrastructure and lowers our costs, which provides us with significant operating leverage. |
Leading Online Marketplace. We are the world’s largest online marketplace connecting borrowers and investors, based on approximately $8.7 billion in loan originations during the year ended December 31, 2016, of which approximately $1.3 billion were invested in through notes issued pursuant to the Note Registration Statement, $1.4 billion were invested in through certificates issued by the Trust and $6.0 billion were invested in through whole loan sales.
Robust Network Effects. Our online marketplace exhibits network effects that are driven by the number of participants and investments enabled through our marketplace. More participation leads to greater potential to match borrowers with investors. Additionally, increased participation also results in the generation of substantial data that is used to improve the effectiveness of our credit decisioning and scoring models, enhancing our performance record and generating increasing trust in our marketplace. As trust increases, we believe investors will continue to demonstrate a willingness to accept lower risk premiums (all else being equal), which will allow us to offer lower interest rates and attract additional high-quality borrowers, thereby reinforcing our track record and fueling a virtuous cycle for our business. We believe that these network effects reinforce our market leadership position.
Technology Platform. Our technology platform powers our online marketplace and enables us to deliver innovative solutions to borrowers and investors. Our technology platform automates our operations and, we believe, provides a significant time and cost advantage over many traditional banks.
Sophisticated Risk Assessment. We use proprietary algorithms that leverage behavioral data, transactional data and employment information to supplement traditional risk assessment tools, such as Fair Isaac Corporation (FICO) scores. We have built our technology platform to automate the application of these proprietary algorithms to each individual borrower’s application profile at scale. This approach allows us to evaluate and segment each potential borrower’s risk profile and price the loan accordingly. In contrast, traditional lenders aggregate borrowers into large pools of risk profiles, which for some borrowers results in higher interest rates despite a more favorable credit profile.
Our marketplace facilitates several types of loan products for consumers and small businesses.
Personal Loans. Our marketplace facilitates unsecured personal loans through our Standard Loan Program that can be used to make major purchases, refinance credit card balances or for other purposes, at generally lower rates than other alternatives. Standard Loan Program personalPersonal loans are offered through both our standard and custom loan termsprograms. Personal loans approved through our standard loan program include amounts from $1,000 to $35,000, terms$40,000, maturities of three or five years, fixed interest rates, and no prepayment penalties or fees. We believe that these loans are simple, fair and responsible credit products that make it easier for consumers to budget for monthly repayment and meet their financial goals. Personal loans that are approved through the Standard Loan Program are offered to all investors on our marketplace. These loans must meet certain minimum credit requirements, including a FICO score of at least 660, satisfactory debt-to-income ratios, 36 months of credit history and a limited number of credit inquiries in the lastprevious six months. LoansPersonal loans that do not meetare approved through the requirements in terms of credit criteria, maturity or longevity of track record might qualify as a Custom Program Loan. Custom Program Loansstandard loan program are offered to private investors only and are not made available to all investors on theour marketplace. Custom Program Loans include new offerings, including small business, super prime, education and patient finance andPersonal loans that fall outside of the credit criteria offor the standard program.Super Prime Consumer Loans. In December 2014, we began facilitating unsecured Super Prime Consumer Loans throughprogram might qualify under our marketplace in private transactions with certain qualified investors. These loans address the market’s demand for a shorter, smaller size term loan. Super Prime Consumer Loan termscustom program and include amounts from $1,000 to $50,000, termsmaturities of two, three, five or seven years, fixed interest rates from 3.99% to 9.34% and no prepayment penalties or fees.
Education and Patient Finance Loans. In April 2014, we acquired Springstone, which facilitates We facilitate unsecured education and patient finance loans. Installmentinstallment loans and true no-interest loans through Springstone are inand its issuing bank partners. Installment loan terms include amounts ranging from $2,000 to $40,000, have terms$50,000, maturities from 24 to 84 months, fixed interest rates from 3.99% to 17.99%, fixed monthly payments and no prepayment penalties. The true no interestno-interest loan option is interms include amounts ranging from $499 to $32,000 and provides for no required interest payment if the balance is paid in full during the promotional period, which can be six, 12, 18 or 24 months. There is no prepayment penalty and borrowers have the flexibility to pay as much or as little, subject to applicable minimums, of the outstanding balance during the promotional period as they choose. Education and Patient Finance loans are offered to private investors only and are not made publicly available on the marketplace.
Auto Refinancing Loans. Commencing in the fourth quarter, we facilitate secured auto refinance loans that can be used to help eligible consumers save money by refinancing into more affordable loans with better rates, clear terms, and no hidden fees. Loans terms include amounts ranging from $5,000 to $50,000, with maturities ranging from 24 to 72 months. Borrowers are required to make monthly amortizing payments, and there are no prepayment penalties.
We currently facilitate loans in 26 states, with plans to expand nationally in 2017. Auto Refinance Loans are currently offered to private investors only and are not made publicly available on the marketplace.
Small Business Loans.Loans and Lines of Credit. In March 2014, we began facilitating unsecured small business loans, and in October 2015 we began facilitating small business lines of credit. Both of these loan products are offered through our marketplace in private transactions with qualified investors. These loansloan products enable small business owners to expand their business, purchase equipment or inventory, or meet other obligations at an affordable rate. Small business loans generallyand lines of credit are fixed ratefixed- or variable-rate loans in amounts ranging from $15,000$5,000 to $300,000, with maturities of one3 months to five years.5 years, and contain no prepayment penalties or fees. The small business lines of credit allow borrowers to draw funds in amounts they need, thus reducing their interest cost. Small Business loans are offered to private investors only and are not made publicly available on the marketplace.
Investors
Through our marketplace, investors
Investors have the opportunity to invest in a wide range of loans based on term and credit characteristics.
Personal loans that are approved through the standard loan program are offered to all investors on our marketplace, while custom program loans, which include small business, education and patient finance, auto refinance, new offerings, and loans that fall outside of the credit criteria of the standard program, are offered to private investors only and are not made publicly available on the marketplace. Investors receive monthly cash flow and attractive risk-adjusted returns.
InvestorsAll investors are provided with a
borrower’s proprietary credit grade and access to credit profile data on each approved loan as well as access to data on each listed loan and all of the historical performance data for nearly every loan ever invested in through our marketplace. The marketplace enables broad diversification by allowing distribution of investments in loans in increments as small as $25.
We attract a wide range of investors, including retail investors, high-net-worth individuals and family offices, banks and finance companies, insurance companies, hedge funds, foundations, pension plans and university endowments. We provide these investors with access to a variety of tools and products that seek to address their level of sophistication and desired level of interaction, which can range from low-touch self-directed accounts to high-touch funds and managed accounts. Investors can invest in loans through one or all of the following channels:
Notes:We believeissue notes pursuant to an effective Note Registration Statement. Investors who meet the applicable financial suitability requirements and have completed our strategyinvestor account opening process may purchase unsecured, borrower payment dependent notes that correspond to payments received on an underlying standard program loan selected by the investor. When an investor registers with us, the investor enters into an investor agreement with us that governs the investor’s purchases of pursuingnotes. Our note channel is supported by our website and our investor services group, which provides basic customer support to these investors.
Certificates and Investment Funds: Accredited investors and qualified purchasers may establish a diverserelationship with LCA or another third-party advisor in order to indirectly invest in certificates, or they may directly purchase a certificate or a limited partnership interest in one of eight private funds that purchase certificates. The certificates are issued by the Trust and are unsecured and settled with cash flows from underlying loans selected by the investor. Neither certificates nor limited partnership interests can be purchased through our website. Certificate investors typically seek to invest larger amounts as compared to the average note investors and often desire a more “hands off” approach to investing. Investors in certificates generally pay an asset-based management fee instead of cash flow-based servicing fee paid by note investors.
Whole Loan Purchases: Certain institutional investors, such as banks, seek to hold the actual loan on their balance sheet. To meet this need, we sell entire standard or custom program loans to these investors through purchase agreements. Upon the sale of the loan, the investor base will continue to strengthen our marketplaceowns all right, title and improve our ability to facilitate a wide varietyinterest in the loan. We establish the investors’ accounts and the procedures for the purchase of loans, through a range of business and economic conditions.including any purchase amount limitations, which we control in our discretion. We and our issuing banksthe investor also sell loans in their entiretymake limited representations and warranties and agree to certain investors in private transactions. Afterindemnify each other for breaches of the sale, wepurchase agreement. The investor also agrees to simultaneously enter into
a servicing agreement with us which designates us as the loan servicer for the sold loan. We continue to service
these loans after they are sold and can be removed as the
loan.servicer in limited circumstances. For certain whole loans, under our contractual relationships we are not the servicer. For regulatory purposes, the investor also has access to the underlying borrower information, but is prohibited from contacting or marketing to the borrower in any manner and agrees to hold such borrower information in compliance with all applicable privacy laws. Whole loan purchases are attractive for some investors as it enables them to account for the loan as an asset, which can offer favorable financial reporting and capital reserve treatment.
Key elements of our technology include:
| • | | Highly Automated.
Highly Automated. Our borrower and investor acquisition process, registration, credit decisioning and scoring, servicing and payment systems are highly automated using our internally developed software. We developed our own cash management software to process electronic cash movements, record book entries and calculate cash balances in our borrower and investor fund accounts. In nearly all payment transactions, an Automated Clearing House electronic payment network, referred to as ACH, is used to disburse loan proceeds, pull borrower payments on outstanding loans, receive funds from investors and disburse payments to investors. |
| • | | Scalable Platform. Our scalable infrastructure utilizes standard techniques, such as virtualization, load-balancing and high-availability platforms. Our application and database tiers are designed to be scaled horizontally by adding additional servers as needed. |
| • | | Proprietary Fraud Detection. We use a combination of third-party data, sophisticated analytical tools and current and historical data obtained during the application process to help determine an application’s fraud risk. High-risk applications are subject to further investigation. In cases where we confirm fraud, the application is cancelled, and we identify and flag characteristics of the loan to help refine our fraud detection efforts. |
| • | | Data Integrity and Security. We maintain an effective information security program based on well-established security standards and best practices, such as ISO2700x and NIST 800 series. The program establishes policies and procedures to safeguard the confidentiality, integrity and availability of borrower and investor information. The program also addresses risk assessment, training, access control, encryption, service provider oversight, an incident response program and continuous monitoring and review. |
| • | | Application Programming Interface. Our application programming interface, referred to as our API, provides investors and partners access to publicly available loan attributes and allows them to analyze the data and place orders meeting their criteria without visiting our website. Investors and partners may create their own software that uses the API or they may use a variety of third-party services that invest via our API on behalf of their members. |
Our engineering and product development expense was $34.7 million, $13.9 million and $4.0 million for the years ended December 31, 2014 and 2013 and the nine months ended December 31, 2012, respectively.
Credit Decisioning and Scoring Process
Our marketplace provides an integrated and automated application and credit decisioning and scoring, servicing and payment systems are highly automated using our internally developed software. We developed our own cash management software to process electronic cash movements, record book entries and calculate cash balances in our borrower and investor fund accounts. In nearly all payment transactions, an Automated Clearing House (ACH) electronic payment network is used to disburse loan proceeds, collect borrower loan payments on outstanding loans, receive funds from investors and disburse payments to investors.
Scalable Platform. Our scalable infrastructure utilizes standard techniques, such as virtualization, load-balancing and high-availability platforms. Our application and database tiers are designed to be scaled horizontally by adding additional servers as needed.
Proprietary Fraud Detection. We use a combination of third-party data, sophisticated analytical tools and current and historical data obtained during the loan application process to help determine fraud risk. We have taken measures to detect and reduce the risk of fraud, but these measures need to be continually improved and may not be effective against new and continually evolving forms of fraud or in connection with new product offerings. High-risk loan applications are subject to further investigation. In cases of confirmed fraud, the application is cancelled, and we identify and flag characteristics of the loan application to help refine our fraud detection efforts.
Data Integrity and Security. We maintain an effective information security program based on well-established security standards and best practices, including ISO2700x and NIST 800 series. The program establishes policies and procedures to safeguard the confidentiality, integrity and availability of borrower and investor information. The program also addresses risk assessment, training, access control, encryption, service provider oversight, an incident response program and continuous monitoring and review.
Application Programming Interface. Our application programming interface, referred to as our API, provides investors and partners access to publicly available loan attributes and allows them to analyze the data and place orders meeting their criteria without visiting our website. Investors and partners may create their own software that is extensible touses our API or they may use a variety of loan products. Borrowers comethird-party services that invest via our API.
Lending Club Open Integration. In August 2015, we launched Lending Club Open Integration (LCOI). LCOI allows online advisors and broker-dealers to our marketplaceoffer Lending Club investments quickly and easily to apply online fortheir client bases, using a loan. Duringsuite of API services that integrate directly into their websites. This allows these advisors and broker-dealers to provide the simple application process, our marketplace uses proprietary risk algorithmssame functionality that leverage behavioral data, transactional data and employment information to supplement traditional risk assessment tools, such as FICO scores, to assess the borrower’s risk profile. The marketplace then presents an approved borrower with various loan options, including term, rate and amount, for which they qualify. After the borrower selects their desired loan terms and the rest of the application is completed, our verification processes and teams verify an applicant’s identity, income or employment by connecting to various data sources, directly or through third-party service providers, or by contacting the human resources department of the borrower’s stated employer to ultimately approve the loan request.Regulatory and Compliance Framework
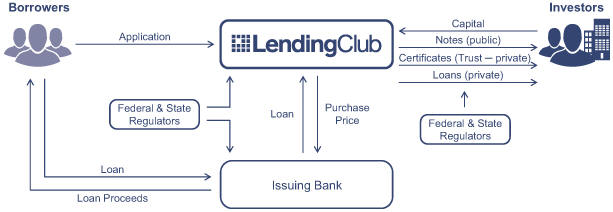
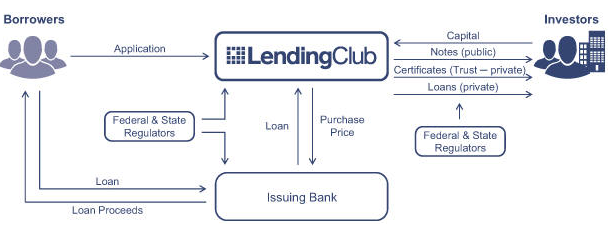
Our marketplace provides a compliance framework that allows investors to participate in consumer and commercial credit as an asset class. We believe that our relationship with issuing banks is a key component of our compliance framework. The banks originate loans to borrowers that applycurrently exists on our website, including money movement, investing, reinvesting, real-time reporting of cash and we subsequently purchase a majority of these loansholdings, and tax reporting.
Relationships with funds providedIssuing Bank Partners
Loans facilitated through our marketplace are originated by
investors through a variety of investment channels, thereby enabling investors to capture the interest rate return on each loan.our issuing bank partners. Our primary issuing bank is WebBank, a Utah-chartered industrial bank that handles a variety of consumer and commercial financing programs.
Additionally, we rely on NBT Bank and Comenity Capital Bank as issuing banks for our education and patient finance loans. We also
executedhave an agreement with Cross River Bank, a New Jersey chartered bank, to operate as our back-up issuing bank in the event WebBank can no longer be an issuing bank.
We have entered into a loan account program agreement with WebBank that governs the terms and conditions between us and WebBank with respect to loans facilitated through our marketplace and originated by WebBank, including our obligations for servicing the loans during the period of time that the loans are owned by WebBank. Under the terms of the loan account program agreement, we pay WebBank a monthly serviceprogram fee based on the amount of loans issued by WebBank and purchased by us or our partners in eacha given month, subject to a minimum monthly fee. Effective in October 2014 WebBank also retains ownership of all loans for two business days and earns any interest receivedAn additional program fee component is dependent on the amount and timing of principal and interest payments made by borrowers of the underlying loans. Under this program structure, the majority of the bank's revenue related to the loans during that time. facilitated on our platform is therefore tied to the terms and performance of the loans. The bank also maintains an ongoing contractual relationship with borrowers, who may seek additional credit through the Lending Club program in the future.
WebBank pays us a transaction fee for our
marketplace’s role in processing loan applications
through our marketplace on WebBank’s behalf. Under a loan sale agreement,
that we entered into with WebBank
may sell us the loan without recourse two business days after
a loan is closed, WebBank
sellsoriginates the loan
to us, including all rights related toand earns interest on the
loan, without recourse.loans during that time. The loan sale agreement prohibits us from securitizing the loans without prior written consent of WebBank. The
initial terms of the loan account program agreement and the loan sale agreement
endterminate in
November 2018,January 2020, with
the possibility of two
automatic, one-year renewal terms, subject to certain early termination provisions as set forth in the agreements.
As part of our ongoing compliance program, we also have customer identification processes in place to enable us to identify user identification fraud and compare user identity against applicable governmental lists, such as the Office of Foreign Assets Control (OFAC) and the Financial Crimes Enforcement Network. We compare all users’ identities against these lists at least twice a month for continued compliance and oversight. If a user were to appear on a list, we would take appropriate action to resolve the issue. In addition to our continued identification compliance program, we use our robust technology to assist us in complying with applicable federal anti-money laundering laws. See “Item 1 – Business -Regulations and Licensing” for more information regarding our regulatory framework.
Loan Issuance Mechanism
We have developed an extensible, automated platform that allows us to work with
Our issuing banks tofor education and patient finance loans originate and issueservice each education and patient finance loan issued. Our issuing bank retains some of these loans while others are offered to private investors. For our role in loan facilitation, we earn transaction fees paid by the issuing bank and education and patient service providers at the time of origination by the issuing bank.
Credit Decisioning and Scoring Process
Our marketplace provides an integrated and automated loan application and credit decisioning and scoring process that is extensible to a variety of loan products to an array of applicants. Our service is provided in a seamless fashion to the applicant. A borrower comesproducts. Borrowers come to our website and completesplatform to apply online for a loan. During the simple application for a loan product. We then useprocess, our platform uses proprietary risk algorithms that leverage behavioral data, transactional data and employment information to analyze an applicant’ssupplement traditional risk assessment tools, such as FICO scores, to assess a borrower’s risk profile. Our verification processes and teams then verify the borrower’s identity, income or employment by connecting to various data sources, directly or through third-party service providers, or by contacting the human resources department of the borrower’s stated employer to determine whether to approve the loan request. Borrowers are then assigned one of 35 loan grades, from A1 through G5 based on this risk profile, based uponloan term and loan amount. The platform then presents an approved borrower with various loan options, including term, rate and amount, for which they qualify. Once the issuing bank’s underwriting guidelines. Once anborrower selects the desired loan terms, the rest of the application is completed.
Our marketplace's credit decisioning and scoring models are evaluated on a regular basis and the additional data on loan history experience, borrower behavior, economic factors and prepayment trends that we accumulate are leveraged to continually improve the models. If the platform is unable to effectively evaluate borrowers’ credit worthiness and likelihood of default, borrowers and investors may lose confidence in our marketplace. Additionally, our ability to effectively segment borrowers into relative risk profiles impacts our ability to offer attractive interest rates for borrowers as well as our ability to offer investors solid risk-adjusted returns, both of which directly relate to our users’ confidence in our marketplace. Our marketplace’s credit decisioning and scoring models assign each loan offered on our marketplace a corresponding interest rate and origination fee. Our investors’ returns are a
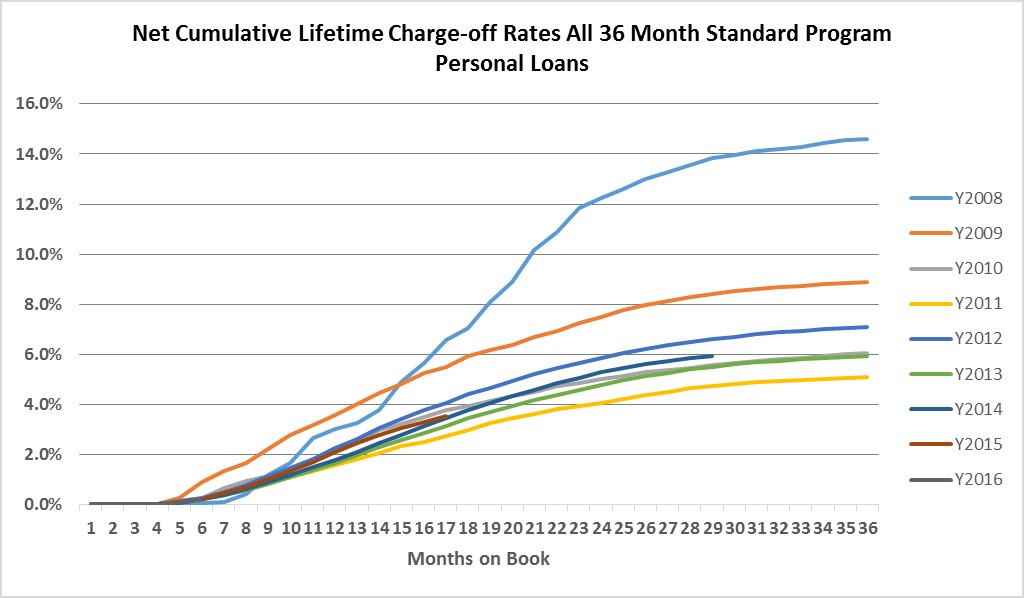
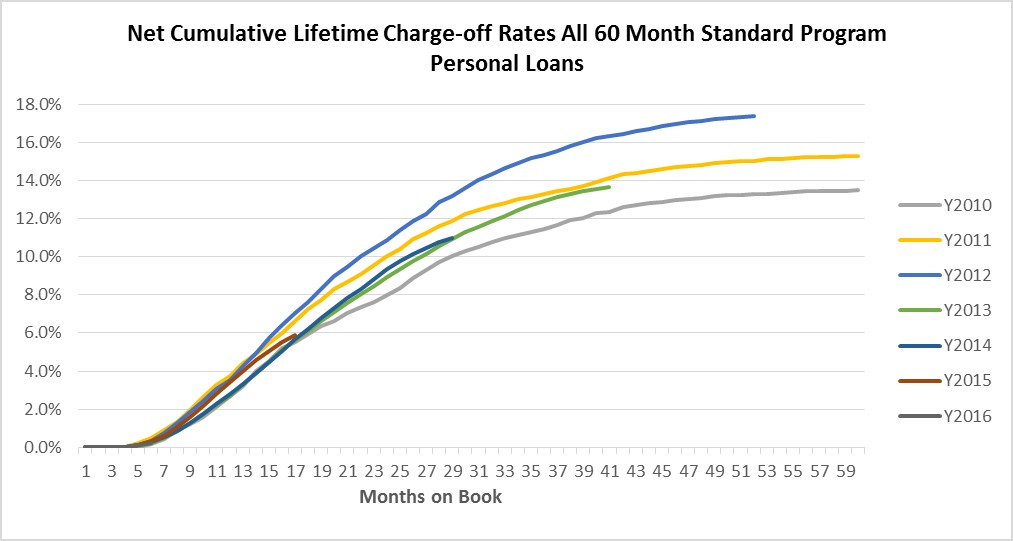
function of the assigned interest rates for each particular loan invested in less any defaults over the term of the applicable loan. We believe we have a history of effectively evaluating borrower’s credit worthiness and likelihood of defaults, as evidenced by the performance of various loan vintages facilitated through our marketplace. If our marketplace's credit decisioning and scoring models ultimately prove to be ineffective, or fail to appropriately account for a decline in the macroeconomic environment, investors may experience higher than expected losses and lose confidence in our business.
Loan Issuance Mechanism
Once a loan application is approved
using the credit decisioning and scoring process described above, we present the borrower with various loan options. After the applicant selects their personalized financing option and completes the application process,
the loan is listed on our marketplace to attract investor commitments, while we
simultaneously perform additional verifications on the borrower. Once the verifications are completed,
the loan will be listed for at least 14 days and
up to 30 days on our marketplace to attract investor commitments. Once sufficient investor commitments are received, the issuing bank originates and issues the loan to the borrower, net of the origination
fee.fee charged and retained by the issuing bank. After the loan is issued, we use the proceeds from these investors to purchase the loan. Investor cash balances (excluding payments in process) are held in a segregated bank or custodial accounts and are not commingled with our monies. We receive a transaction fee from the issuing bank for our marketplace’s role in originating the loan. We also earn a recurring servicing fee from investors and management fees from investment funds and other managed accounts.
We service all
personal and small business loans facilitated through our marketplace, except for
patient and education finance loans
facilitated through Springstone’s platform.and auto refinance loans. Servicing is comprised of account maintenance, collections, processing payments from borrowers and distributions to investors.
We have made arrangements for limited backup servicing with Portfolio Financial Servicing Company.
For
the month of December
2014,2016, approximately
99%98% of loan payments
for loans that we service were made through an ACH withdrawal from the borrower’s bank account.
Loan repaymentsPrincipal and interest payments on loans are remitted utilizing
ACH to segregated bank accounts maintained for the benefit of investors, custodial or other accounts designated by our investors.ACH. This automated process allows us to avoid the time and expense of processing a significant volume of mailed payments and provides a higher degree of certainty for timely payments. This process also provides us with prompt notice in the event of a missed payment, which allows us to respond quickly to resolve the
issuedelinquency with the borrower. Generally, in the first 30 days that a loan is delinquent, our in-house
collectioncollections team works to bring the account current. Once the loan becomes more than 30 days delinquent, we will typically outsource subsequent servicing efforts to third-party collection agencies.
The servicing fee paid by investors is designed to cover the day-to-day processing costs of loans. If a loan needs more intensive collection focus, whether internal or external, we may charge investors a collection fee to compensate us for the costs of this collection activity. This fee varies, with a maximum of up to 35% of the amount recovered. There is no fee charged if there
isare no
recovery, and the fee cannot exceed the proceeds collected.loan payments recovered. We
may sell loans that have been charged-off to
acertain third
party.parties. All proceeds received on these sales are subject to a
standard servicingcollection fee, and the net proceeds are distributed to investors.
In April 2014, we acquired all of the outstanding limited liability company interests of Springstone, which offers education and patient finance loans.
Springstone utilizesWe utilize two issuing banks and a network of
providers. Springstone facilitates two loan products:Anproviders to facilitate the issuance of education and patient finance installment loan with amounts ranging from $2,000 to $40,000, terms from 24 to 84 months, fixed rates from 3.99% to 17.99%, fixed monthly paymentsloans and no prepayment penalties.
A true no interest loan with amounts ranging from $499 to $32,000 that provides for no interest financing if the balance is paid in full during the promotional period, which can be six, 12, 18 or 24 months. There is no prepayment penalty and borrowers have the flexibility to payno-interest loans, as much or as little, subject to applicable minimums, of the outstanding balance during the promotional period as they choose.described above.
Currently, each of Springstone’s issuing banks originate, retain and service each issued loan. For its role in loan facilitation, Springstone earns transaction fees paid by the issuing bank and service provider at the time of origination, which averaged approximately 5% of the initial loan balance as of December 31, 2014. Currently, Springstone does not earn any servicing fees, as loans are originated, retained and serviced by the issuing bank. We currently intend to continue to have these loans funded and serviced through existing issuing banks while we develop plans to integrate these loans into our Standard Loan Program over time.
We compete with financial products and companies that attract borrowers, investors or both. With respect to borrowers, we primarily compete with traditional financial institutions, such as banks, credit unions, credit card issuers and other consumer finance companies. We believe our innovative marketplace model, online delivery and process automation enable us to operate more efficiently and with more competitive rates and higher borrower satisfaction than these competitors.
With respect to investors, we primarily compete with other investment vehicles and asset classes, such as equities, bonds and short-term fixed income securities. We believe that our diverse and customizable investment options give us the flexibility to offer attractive risk-adjusted returns that are
generally uncorrelated with other asset classes.
We compete with other online credit marketplaces, such as Prosper Marketplace, Inc.
and Funding Circle Limited., as well as with other online lenders. We are the world’s largest online marketplace connecting borrowers to investors, which we believe provides us with a major competitive advantage. We believe that our network effects and marketplace dynamics at play make us more attractive and efficient to both borrowers and investors. We anticipate that more established internet, technology and financial services companies that possess large, existing customer bases, substantial financial resources and established distribution channels may enter the market in the future. We believe that our brand, scale, network effect, historical data and performance record provide us with significant competitive advantages over current and future competitors.
Our marketing efforts are designed to attract and retain borrowers and investors and build brand awareness and reputation. We dedicate significant resources to our marketing and brand advertising efforts and strategic relationships. Our marketing efforts are designed to build awareness of Lending Club and attract borrowers and investors to our marketplace. We use a diverse array of marketing channels and are constantly seeking to improve and optimize our experience both on- and offline to achieve efficiency and a high level of borrower and investor satisfaction. Currently, we believe reputation, word of mouth and our direct marketing via mail drives continued organic growth in our investor and borrower base.
We believe mostalso continue to invest in our strategic relationships to raise awareness of our platform and attract borrowers and investors to our marketplace. For example, we have a strategic partnership relationship with a consortium of community banks for our marketplace to offer co-branded personal loans to the participating banks’ customers. As part of this relationship, each community bank is provided initial access to invest in loans sought by their own customers, which may include standard program loans. The customer loans that do not meet the community bank’s investment criteria are then made available for investment through the marketplace. All other loans will continue to be available on our marketplace and accessible on an equal basis and are originated by our issuing banks.
Regulatory and Compliance Framework
The regulatory environment for credit and online marketplaces such as ours is complex, evolving and uncertain, creating both challenges and opportunities that could affect our financial performance. We, and the loans facilitated through our marketplace, are subject to extensive and complex rules and regulations, licensing and examination by various federal, state and local government authorities designed to, among other things, protect borrowers (such as truth in lending, equal credit opportunity, fair credit reporting and fair debt collection practices) and investors. Our primary issuing bank, WebBank, is subject to oversight by the FDIC and the State of Utah. The other two issuing banks are NBT Bank and Comenity Capital Bank. NBT Bank is subject to oversight by the OCC and the New York Department of Financial Services, and Comenity Capital Bank is subject to oversight by the FDIC and the Utah Department of Financial Institutions. These authorities impose obligations and restrictions on our activities and the loans facilitated through our marketplace. For example, these rules limit the fees that may be assessed on the loans, require extensive disclosure to, and consents from, the borrowers and lenders, prohibit discrimination and unfair, deceptive, or abusive acts or practices and may impose multiple qualification and licensing obligations on our activities.
Our compliance framework is a cornerstone of the marketplace that allows investors are satisfiedto participate in consumer and commercial credit as an asset class. Our relationship with their experience, often adding fundsissuing banks is a key component of our compliance framework, as described below.
As part of our ongoing compliance program, we have customer identification processes in place to
their accountenable us to detect and
referring their friendsprevent fraud and
colleaguesidentify customers who may be on government watchlists, such as those from the Office of Foreign Assets Control (OFAC) and the Financial Crimes Enforcement Network. We compare users’ identities against these lists at least twice a month for continued compliance and oversight. If a user were to
us.appear on a list, we would take appropriate action to resolve the issue in accordance with company policies and anti-money laundering obligations. In addition to our continued identification compliance program, we use our proprietary technology to assist us in complying with applicable federal anti-money laundering laws.
Regulations and Licensing
The lending and securities industries are highly regulated.
However, weWe are regulated
very differently than a
bank. Whilebank because, unlike a bank,
haswe are not exposed to capital risk from
both credit and interest rate
risks,risks. Rather, for loans issued through our marketplace loan balances, interest rates and maturities are matched and offset by an equal balance of notes and certificates. Additionally, we do not take deposits and are therefore not regulated by the FDIC in that respect. Our current issuing banks originate all of the loans offered through our marketplace and are subject to regulation by the FDIC
and/or other relevant federal and state regulators.
However, we
The Company and the loans made through our marketplace are subject to extensivehighly regulated. State and complex rules and regulations, licensing and examination by various federal state and local government authorities. For example, our primary issuing bank, WebBank, is subject to oversight by the FDIC and the State of Utah. These authorities impose obligations and restrictions on our activities and the loans facilitated through our marketplace. For example, these ruleslaws limit the fees that may be assessed on the loans, require extensive disclosure to, and consents from, the borrowers and lenders, prohibit discrimination and unfair, and deceptive, or abusive acts or practices and may impose multiple qualification and licensing obligations on our activities. Failure to comply with any of these requirements may result in, among other things, revocation of required licenses or registration, loss of approved status, voiding of the loan contracts, class action lawsuits, administrative enforcement actions and civil and criminal liability.
Further, federal, state and local governmental authorities impose additional obligations and restrictions on our activities and the loans facilitated through our marketplace. For example, our primary issuing bank, WebBank, is subject to oversight by the FDIC and the State of Utah. These and other governmental authorities impose obligations and restrictions on our activities and the loans facilitated through our marketplace. While compliance with such requirements is at times complicated by our novel business model, we believe we are in substantial compliance with these rules and regulations.
Current Regulatory Environment
In May 2015, the U.S. Court of Appeals for the Second Circuit issued its decision in Madden v. Midland Funding, LLC that interpreted the scope of federal preemption under the National Bank Act (NBA) and held that a nonbank assignee of a loan originated by a national bank was not entitled to the benefits of federal preemption of claims of usury. The Second Circuit’s decision is binding on federal courts located in Connecticut, New York, and Vermont, but the decision could also be adopted by other courts. The defendant petitioned the U.S. Supreme Court to review the decision and in March 2016, the Court invited the Solicitor General to file a brief expressing the views of the U.S. on the petition. The Solicitor General filed an amicus brief that stated the Second Circuit decision was incorrect, but that the case was not yet ready to be heard by the Supreme Court. In June 2016, the Supreme Court declined to hear the case. The Federal District Court is now hearing the case in regards to Midland’s alternative claim under a choice of law analysis, and application of state law. The outcome could create potential liability under state statues such as usury and consumer protection statutes.
While we believe that our program is factually distinguishable from the case, we revised our agreement with our primary issuing bank to further distinguish the operation of the program from the court’s analysis of the facts in Madden. Under the revised program structure, an additional component of the program fee arrangement was created. This additional program fee component is dependent on the amount and timing of principal and interest payments made by borrowers of the underlying loans. Under this revised program structure the majority of the bank's revenue related to the loans facilitated on our platform is therefore tied to the terms and performance of the loans. The bank also maintains an ongoing contractual relationship with borrowers, who may seek additional credit through the Lending Club program in the future.
In August 2016, a federal district court in the Central District of California considered a case brought by the Consumer Finance Protection Bureau (CFPB) against CashCall, Inc. In that case, CashCall had an arrangement with a lender owned by a member of the Cheyenne River Sioux Tribe in which loans were offered to borrowers at APR’s that could exceed 300 percent. The district court ruled that, under the facts presented in the case, CashCall should be deemed the “true lender” and could not charge interest rates in excess of state usury laws. In January 2017, the court issued an order staying the decision for interlocutory appeal to the United States Court of Appeals for the Ninth Circuit, over the CFPB's objections. The defendants then filed a petition for appeal with the Ninth Circuit, which is currently pending.
Separately, in September 2016 in Beechum v. Navient Solutions, Inc., also in the federal district court in the Central District of California, the court considered a program in which a national bank had a bank partnership with a nonbank, the Student Loan Marketing Association (SLMA), in which borrowers could receive loans originated by the bank through the SLMA. The court in Beechum rejected the argument that the SLMA was the “true lender,” holding that the face of the borrower transactions showed that the bank had originated the loans and any further analysis to look behind the face of the transaction was inappropriate. We believe that our program is factually distinguishable from the CashCall situation.
Recognizing the growth in online marketplaces such as ours, in July 2015 the U.S. Treasury Department issued a request for information (RFI) to study the various business models and products offered by online marketplace lenders, the potential for online marketplace lending to expand access to credit to historically underserved borrowers and how the financial regulatory framework should evolve to support the safe growth of the industry. We, along with many other interested groups, submitted responses to the Treasury’s RFI by the September 30, 2015 deadline.
On May 10, 2016, the U.S. Treasury Department released a white paper on the online marketplace lending industry to continue the work initiated by the RFI. The white paper includes several recommendations to the federal government and private sector participants to encourage safe growth and access to credit. We cannot predict whether any legislation or proposed rulemaking will actually be introduced or how any legislation or rulemaking will impact our business and results of operations going forward. In December 2016, the Office of the Comptroller of the Currency (the OCC) released a white paper and sought public comment on whether to charter a new type of special
purpose national bank to facilitate the provision of core banking activities through financial technology. We, along with other interested parties, submitted responses to the OCC's proposed special purpose charter (Fintech Charter) in January 2017.
In December 2015, the California Department of Business Oversight (DBO) sent an online survey to fourteen marketplace lenders, including us, requesting information about the business model, online platform, loan performance and investor funding process. In May 2016, the DBO requested additional information from us and other survey participants. We submitted our response to this additional information in June 2016 and continue to cooperate with the DBO's inquiry.
While we are subject to the regulatory and enforcement authority of the Consumer Financial Protection Bureau (CFPB), as a facilitator, servicer or acquirer of consumer credit, the CFPB has recently announced that it intends to expand its supervisory authority, through the use of “larger participant rules,” to cover larger marketplace lenders, non-bank installment lenders and auto lenders. The CFPB has announced larger participant rules for auto lenders but has not yet announced specifics regarding its proposed rulemaking for installment loan lenders and, consequently, there continues to be uncertainty as to how the CFPB’s strategies and priorities, including any final rules, will impact our unsecured installment loan business and our results of operations going forward.
State Licensing Requirements
In most states we believe that the applicable issuing bank, as originator of loans
madefacilitated through our marketplace, satisfies any relevant licensing requirements with respect to the origination of loans applicable to our operations. As needed, we
will seek
the appropriate authorizations to conduct activities
on a uniform basis in
all other states and the
District of Columbia, with the exceptions of Idaho, Iowa, Maine, Nebraska and North Dakota.respective state. State licensing statutes impose a variety of requirements and restrictions on us, including:
record-keeping requirements;
restrictions on servicing practices, including limits on finance charges and fees;
disclosure requirements;
examination requirements;
surety bond and minimum net worth requirements;
financial reporting requirements;
notification requirements for changes in principal officers, stock ownership or corporate control;
restrictions on advertising; and
review requirements for loan forms.
The
These statutes also subject us to the supervisory and examination authority of state regulators in certain cases.
State Usury Limitations. Section 521 of the Depository Institution Deregulation and Monetary Control Act of 1980 (DIDA) and Section 85 of the National Bank Act (NBA), federal case law interpreting the NBA such as Tiffany v. National Bank of Missouri and Marquette National Bank of Minneapolis v. First Omaha Service Corporation and FDIC advisory opinion 92-47Limitations. The following authorities permit FDIC-insured depository institutions, such as WebBank, to “export” the interest rate permitted underby the laws of the state or U.S. territory where the bank is located, regardless of the usury limitations imposed by the state law of the borrower’sborrower's residence unless the state has chosen to opt out of the exportation regime. regime: Section 521 of the Depository Institution Deregulation and Monetary Control Act of 1980 (DIDA); Section 85 of the National Bank Act (NBA); federal case law interpreting the NBA such as Tiffany v. National Bank of Missouri, 85 U.S. 409 (1874), and Marquette National Bank of Minneapolis v. First Omaha Service Corporation, 439 U.S. 299 (1978); and FDIC advisory opinion 92-47.
WebBank is located in Utah, and Title 70C of the Utah Code does not limit the amount of fees or interest that may be charged by WebBank on loans of the type offered through our marketplace. Only Iowa and Puerto Rico have opted out of the exportation regime under Section 525 of DIDA and we do not operate in either jurisdiction.DIDA. We believe, however, if a state or U.S. territory in which we operate opted out of rate exportation, judicial interpretations support the view that such opt outs would apply only to loans “made” in those states. We believe that the “opt-out” of any state would not affect the ability of our marketplace to benefit from the exportation of rates. If a loan made through our marketplace were deemed to be
subject to the usury laws of a state or U.S. territory that had opted-out of the exportation regime, we could become subject to fines, penalties and possible forfeiture of amounts charged to borrowers, and we could decide not to
originatefacilitate loans in that jurisdiction, which could adversely impact our growth.
State Disclosure Requirements and Other Substantive Lending Regulations. We are subject to state laws and regulations that impose requirements related to loan disclosures and terms, credit discrimination, credit reporting, debt collection and unfair, deceptive, or deceptive businessabusive acts or practices. Our ongoing compliance program seeks to comply with these requirements.
Truth in Lending Act. The Truth in Lending Act (TILA), and Regulation Z, which implements it, require lenders to provide consumers with uniform, understandable information concerning certain terms and conditions of their loan and credit transactions. These rules apply to WebBankour issuing banks as the creditorcreditors for loans facilitated through our marketplace, but because the transactions are carried out on our hosted website, we facilitate compliance. For closed-end credit transactions of the type provided through our marketplace, these disclosures include, among others, providing the annual percentage rate, the finance charge, the amount financed, the number of payments and the amount of the monthly payment. The creditor must provide thethese disclosures before thea loan is closed.consummated. TILA also regulates the advertising of credit and gives borrowers, among other things, certain rights regarding updated disclosures and the treatment of credit balances. Our marketplace provides borrowers with a TILA disclosure at the time a borrower posts a loan request on the marketplace. If the borrower’s request is not fully funded and the borrower chooses to accept a lesser amount offered, we provide an updated TILA disclosure. We also seek to comply with TILA’s disclosure requirements related to credit advertising.
Equal Credit Opportunity Act. The federal Equal Credit Opportunity Act (ECOA) prohibits creditors from discriminating against credit applicants on the basis of race, color, sex, age, religion, national origin, marital status, the fact that all or part of the applicant’s income derives from any public assistance program or the fact that the applicant has in good faith exercised any right under the federal Consumer Credit Protection Act or any applicable state law. Regulation B, which implements ECOA, restricts creditors from requesting certain types of information from loan applicants and from using advertising or making statements that would discourage on a prohibited basis a reasonable person from making or pursuing an application. These requirements apply both to a lender such as WebBank as the creditor for loans facilitated through our marketplace as well as to a party such as ourselves that regularly participatesin a credit decision. Investors may also be subject to the ECOA in their capacity as purchasers of notes if they are deemed to regularly participate in credit decisions. In the underwriting of loans offered through our marketplace, and in all aspects of operations, both WebBank and we seek to comply with ECOA’s provisions prohibiting discouragement and discrimination. ECOA also requires creditors to provide consumers and certain small businesses with timely notices of adverse action taken on credit applications. WebBank and we provide prospective borrowers who apply for a loan through our marketplace but are denied credit with an adverse action notice in compliance with applicable requirements.
Fair Credit Reporting Act. The federal Fair Credit Reporting Act (FCRA), as amended by the Fair and Accurate Credit Transactions Act (FACTA), administered by the Consumer Financial Protection Bureau (CFPB), promotes the accuracy, fairness and privacy of information in the files of consumer reporting agencies. FCRA requires a permissible purpose to obtain a consumer credit report and requires personsfurnishers to report loan payment information to credit bureaus accurately. FCRA also imposes disclosure requirements on creditors who take adverse action on credit applications based on information contained in a credit report. WebBank and we have a permissible purpose for obtaining credit reports on potential borrowers, and we also obtain explicit consent from borrowers to obtain such reports. As the servicer for the loan, we accurately report loan payment and delinquency information to appropriate consumer reporting agencies. We provide an adverse action notice to a rejected borrower on WebBank’s behalf at the time the borrower is rejected that includes all the required disclosures. We also have processes in place to ensure that consumers are given “opt-out” opportunities, as required by the FCRA, regarding the sharing of their personal information. We have implemented an identity theft prevention program.
Fair Debt Collection Practices Act. The federal Fair Debt Collection Practices Act (FDCPA) provides guidelines and limitations on the conduct of third-party debt collectors in connection with the collection of consumer debts.
The FDCPA limits certain communications with third parties, imposes notice and debt validation requirements, and prohibits threatening, harassing or abusive conduct in the course of debt collection. While the FDCPA applies to third-party debt collectors, debt collection laws of certain states impose similar requirements on creditors who collect their own debts. In addition, the CFPB prohibits unfair, deceptive or abusive acts or practices in debt collection, including first-party debt collection. Our agreement with investors prohibits investors from attempting to collect directly on the loan. Actual collection efforts in violation of this agreement are unlikely given that investors do not learn the identity of borrowers. We use our internal collection team and a professional third-party debt collection agent to collect delinquent accounts. They are required to comply with the FDCPA and all other applicable laws in collecting delinquent accounts of our borrowers.
Privacy and Data Security Laws. The federal Gramm-Leach-Bliley Act (GLBA) includes limitations on financial institutions’ disclosure of nonpublic personal information about a consumer to nonaffiliated third parties, in certain circumstances requires financial institutions to limit the use and further disclosure of nonpublic personal information by nonaffiliated third parties to whom they disclose such information, and requires financial institutions to disclose certain privacy policies and practices with respect to information sharing with affiliated and nonaffiliated entities as well as to safeguard personal customer information. We have a detailed privacy policy, which complies with GLBA and is accessible from every page of our website. We maintain consumers’ personal information securely, and we do not sell, rent oronly share such information with third parties for marketing purposes unless previously agreed to byin accordance with our privacy policy and with the consent of the consumer. In addition, we take measures to safeguard the personal information of our borrowers and investors and protect against unauthorized access to this information.
Servicemembers Civil Relief Act. The federal Servicemembers Civil Relief Act (SCRA) allows military members to suspend or postpone certain civil obligations so that the military member can devote his or her full attention to military duties. The SCRA requires us to adjust the interest rate of borrowers who qualify for and request relief. If a borrower with an outstanding loan qualifies for SCRA protection, we will reduce the interest rate on the loan to 6% for the duration of the borrower’s active duty. During this period, the investors who have invested in such a loan will not receive the difference between 6% and the loan’s original interest rate. For a borrower to obtain an interest rate reduction on a loan due to military service, we require the borrower to send us a written request and a copy of the borrower’s mobilization orders. We do not take military service into account in assigning loan grades to borrower loan requests and we do not disclose the military status of borrowers to investors.
Military Lending Act. The Military Lending Act (MLA) restricts, among other things, the interest rate and other terms that can be offered to active military personnel and their dependents. The MLA caps the interest rate that may be offered to a covered borrower to a 36% military annual percentage rate, or “MAPR,” which includes certain fees such as application fees, participation fees and fees for add-on products. Prior to a recent amendment of the rules under the MLA, the MLA applied only to certain short-term loans. The rules amendment extends the 36% rate cap to most types of consumer credit. The MLA also requires certain disclosures and prohibits certain terms, such as mandatory arbitration if a dispute arises concerning the consumer credit product.
The Dodd-Frank Wall Street Reform and Consumer Protection Act. In July 2010, the Dodd-Frank Act was signed into law. The Dodd-Frank Act is extensive and significant legislation that includes consumer protection provisions. Among other things, the Dodd-Frank Act created the CFPB, which commenced operations in July 2011 and has authority to write regulations under federal consumer financial protection laws, such as the Truth in Lending Act and the Equal Credit Opportunity Act, and to enforce those laws against and examine large financial institutions, such as our issuing banks, for compliance. The CFPB is authorized to prevent “unfair, deceptive or abusive acts or practices” through its regulatory, supervisory and enforcement authority. We are subject to the CFPB’s jurisdiction, including its enforcement authority, as a servicer and acquirer of consumer credit. The CFPB may request reports concerning our organization, business conduct, markets and activities. The CFPB may also conduct on-site examinations of our business on a periodic basis if the CFPB were to determine, through its complaint system, that we were engaging in activities that pose risks to consumers.
Electronic Fund Transfer Act and NACHA Rules. The federal Electronic Fund Transfer Act (EFTA) and Regulation E that implements it provide guidelines and restrictions on the electronic transfer of funds from consumers’ bank accounts. In addition transfers performed by ACH electronic transfers are subject to detailed timing and notification rules and guidelines administered by the National Automated Clearinghouse Association (NACHA). Most transfers of funds in connection with the origination and repayment of loans are performed by ACH. We obtain necessary electronic authorization from borrowers and investors for such transfers in compliance with such rules. We also comply with the requirement that a loan cannot be conditioned on the borrower’s agreement to repay the loan through automatic fund transfers. Transfers of funds through our platform are executed by Wells Fargo and conform to the EFTA, its regulations and NACHA guidelines.
Electronic Signatures in Global and National Commerce Act/Uniform Electronic Transactions Act. The federal Electronic Signatures in Global and National Commerce Act (ESIGN), and similar state laws, particularly the Uniform Electronic Transactions Act (UETA), authorize the creation of legally binding and enforceable agreements utilizing electronic records and signatures. ESIGN and UETA require businesses that want to use electronic records or signatures in consumer transactions and provide disclosures to consumers, to obtain the consumer’s consent to receive information electronically. When a borrower or investor registers on our platform, we obtain his or her consent to transact business electronically, receive electronic disclosures and maintain electronic records in compliance with ESIGN and UETA requirements.
Bank Secrecy Act. In cooperation with WebBank, we have implemented various anti-money laundering policy and procedures to comply with applicable federal law. With respect to new borrowers, we apply the customer identification and verification program rules and screen names against the list of specially designated nationals maintained by the U.S. Department of the Treasury and OFAC pursuant to the USA PATRIOT Act amendments to the Bank Secrecy Act and its implementing regulation.
New Laws and Regulations. From time to time, various types of federal and state legislation are proposed and new regulations are introduced that could result in additional regulation of, and restrictions on, the business of consumer lending. We cannot predict whether any such legislation or regulations will be adopted or how this would affect our business or our important relationships with third parties. In addition, the interpretation of existing legislation may change or may prove different than anticipated when applied to our novel business model. Compliance with such requirements could involve additional costs, which could have a material adverse effect on our business. As a consequence of the extensive regulation of commercial lending in the United States, our business is particularly susceptible to being affected by federal and state legislation and regulations that may increase the cost of doing business.
In addition, see “Item 1A -– Risk Factors—Factors – Risks Related to ComplianceOur Business and Regulation.”
Foreign Laws and Regulations. We do not permit non-U.S. based individuals to register as borrowers on the platform and the lending platform does not operate outside the United States. Therefore, we do not believe that we are subject to foreign laws or regulations for borrowers.
To establish and protect our technology and intellectual property rights, we rely on a combination of copyright, trade secret and other rights, as well as confidentiality procedures, non-disclosure agreements with third parties, employee disclosure and contractual provisions to protect our proprietary technology, processesinvention assignment agreements, and other intellectual property. Although the protection afforded by copyright, trade secret and trademark law, written agreements and common law may provide some advantages, we believe that the following factors help us to maintain a competitive advantage: technological skills and focus on innovation of our software development team and other team members across the organization; frequent enhancements to our platform; and borrower and investor satisfaction. Our competitors may develop products that are similar to our technology. We enter into agreements with our employees, consultants and partners and through these agreements we attempt to control access to and distribution of our other proprietary technology and information.contractual rights. Despite our efforts to protect our proprietary rights, third parties may, in an authorized or unauthorized manner, attempt to use, copy or otherwise obtain and market or distribute our intellectual property rights or technology or otherwise develop a product with the same functionality as our solution. In addition, our competitors may develop products that are similar to our technology. Policing all unauthorized use of our intellectual property rights is nearly impossible. Therefore, impossible, and
we cannot be certain that the steps we have taken or will take in the future will prevent misappropriations of our technology or intellectual property rights.
At December 31,
2014,2016, we had
8431,530 employees and contract employees. None of our employees are represented by a labor union. We have not experienced any work stoppages, and we consider our employee relations to be good.
The address of our principal executive offices is LendingClub Corporation, 71 Stevenson Street, Suite 300, San Francisco, California, 94105. Our website address iswww.lendingclub.com., and our investor relations website is located at ir.lendingclub.com. Our Annual Report on Form 10-K, Quarterly Reports on Form 10-Q, Current Reports on Form 8-K and amendments to these reports filed pursuant to Section 13(a) and 15(d) of the Securities Exchange Act of 1934, as amended (Exchange Act), are filed with the U.S. Securities and Exchange Commission (SEC). We are subject to the informational requirements of the Exchange Act and file or furnish reports, proxy statements and other information with the SEC. Such reports and other information filed by the Company with the SEC are available free of charge on our investor relations website atir.lendingclub.com when such reportsas soon as reasonably practicable after they are available onelectronically filed with, or furnished to, the SEC’s website. We useSEC.
In addition to announcing material financial information through our investor relations website, as a means of disclosingpress releases, SEC filings, and public conference calls and webcasts, we also intend to use other online and social media channels, including our Blog (http://blog.lendingclub.com), Twitter handle (@LendingClub) and Facebook page (https://www.facebook.com/LendingClubTeam) to disclose material non-public information and for complyingto comply with our disclosure obligations under Regulation FD.
The contents of the websites referred to above are not incorporated into this filing or in any other report or document on file with the SEC. Further, our references to the URLs for these websites are intended to be inactive textual references only.
The public may read and copy any materials filed by us with the SEC at the SEC’s Public Reference Room at 100 F Street, NE, Room 1580, Washington, DC 20549. The public may obtain information on the operation of the Public Reference Room by calling the SEC at 1-800-SEC-0330. The SEC maintains an Internet site that contains reports, proxy and information statements, and other information regarding issuers that file electronically with the SEC atwww.sec.gov.The contents of the websites referred to above are not incorporated into this filing. Further, our references to the URLs for these websites are intended to be inactive textual references only.
www.sec.gov.
You should carefully consider the risks and uncertainties described below, together with all of the other information in this Annual Report on Form 10-K, including the section titled “Item 7
-– Management’s Discussion and Analysis of Financial Condition and Results of Operations” and the consolidated financial statements and related notes. While we believe the risks and uncertainties described below include all material risks currently known by us, it is possible that these may not be the only ones we face. If any of the risks actually occur, our business, financial condition, operating results and prospects could be materially and adversely affected.
RISKS RELATED TO OUR BUSINESS AND
INDUSTRYAs a rapidly growing company with a relatively limited operating history at our current scale, we face increased risks, uncertainties, expenses and difficulties.
We have a limited operating history at our current scale, and we have encountered and will continue to encounter risks, uncertainties, expenses and difficulties, including:
REGULATIONnavigating complex and evolving regulatory and competitive environments;
increasing the number of borrowers and investors utilizing our marketplace;
increasing the volume of loans facilitated through our marketplace and transaction fees received for matching borrowers and investors through our marketplace;
entering into new markets and introducing new loan products;
continuing to revise our marketplace’s proprietary credit decisioning and scoring models;
continuing to develop, maintain and scale our platform;
effectively using limited personnel and technology resources;
effectively maintaining and scaling our financial and risk management controls and procedures;
maintaining the security of our platform and the confidentiality of the information provided and utilized across our platform; and
attracting, integrating and retaining an appropriate number of qualified employees.
We have incurred net losses in the past and may incur net losses in the future.
As of December 31, 2014, our accumulated deficit was $83.2 million. We anticipate that our operating expenses will increase in the foreseeable future as we seek to continue to grow our business, attract borrowers, investors and partners and further enhance and develop our loan products, marketplace and platform. These efforts may prove more expensive than we currently anticipate, and we may not succeed in increasing our revenue sufficiently to offset these higher expenses. We may incur additional net losses in the future and may not maintain profitability on a quarterly or annual basis.
If we are unable to maintain or increase loan originations facilitated through our marketplace or if existing borrowers or investors do not continue to participate on our marketplace, our business and results of operations will be adversely affected.
We have experienced rapid revenue and origination growth through our marketplace in recent periods with originations totaling $4.4 billion and $2.1 billion for the years ended December 31, 2014 and 2013, respectively. To continue to grow our business, we must continue to increase loan originations through our marketplace by attracting a large number of new borrowers who meet our platform’s lending standards and new and existing investors interested in investing in these loans. The number of unique borrowers on our marketplace increased over the prior year by 116%, 151% and 125% for the years ending December 31, 2014 and 2013 and nine months ended December 31, 2012, respectively. The number of unique investors on our marketplace increased over the prior year by 28%, 44% and 37% for the years ending December 31, 2014 and 2013 and the nine months ended December 31, 2012, respectively. There can be no assurance that this increase in the number of unique borrowers and investors will continue to increase. Furthermore, we have experienced a high number of inquiries from potential borrowers who do not meet the criteria for loan application approval. If there are not sufficient qualified loan requests, investors may be unable to deploy their capital in a timely or efficient manner and may seek other investment opportunities. If there are insufficient investor commitments, borrowers may be unable to obtain investment capital for their loans and may stop using our marketplace for their borrowing needs.
A relatively small number of investors account for a large dollar amount of investment in loans funded through our marketplace.
A relatively small number of investors account for a large dollar amount of investment in loans funded through our marketplace. Although we believe there is substantial excess investor demand to replace any investors who may choose not to continue to invest through our marketplace, if we are unable to attract sufficient investor commitments or investors do not continue to participate in our marketplace at the current rates, we may be unable to increase our loan originations and our revenue may grow more slowly than expected or decline over the short term. In addition, if a large number of our existing investors ceased utilizing our marketplace over a short period of time, our business could be temporarily interrupted as new investors complete the administrative and diligence updating processes necessary to enable their investments.
If we are unable to maintain our relationships with issuing banks, our business will suffer.
We rely on issuing banks to originate all loans and to comply with various federal, state and other laws. Our primary issuing bank is WebBank, a Utah-chartered industrial bank that handles a variety of consumer and commercial financing programs. Springstone Financial, LLC (Springstone),
which we acquired in April 2014,our wholly-owned subsidiary, relies on NBT Bank and Comenity
Capital Bank as issuing banks for its education and patient finance loans.
Our agreements with WebBank are non-exclusive and do not prohibit WebBank from working with our competitors or from offering competing services. Our current agreements with WebBank have initial terms ending in
November 2018,January 2020, with
the possibility of two
automatic, one-year renewal terms, subject to certain early termination provisions as set forth in the agreements.
These agreements provide WebBank with a right to originate a certain percentage of the loans facilitated through our platform. WebBank currently offers loan programs through
anotherother online
marketplace.marketplaces and other alternative lenders. WebBank could decide that working with us is not in its interest, could make working with it cost prohibitive or could decide to enter into exclusive or more favorable relationships with our competitors. In addition, WebBank may not perform as expected under our agreements including potentially being unable to accommodate our projected growth in loan volume. We could in the future have disagreements or disputes with WebBank
or other issuing banks, which could negatively impact or threaten our relationship.
WebBank is subject to oversight by the FDIC and the State of Utah and must comply with complex rules and regulations, licensing and examination requirements, including requirements to maintain a certain amount of regulatory capital relative to its outstanding loans. We are a service provider to WebBank, and as such, we are subject to audit by WebBank in accordance with FDIC guidance related to management of third-party vendors. We
mayare also
be subject to the examination and enforcement authority of the FDIC as a bank service company covered by the Bank Service Company Act. If WebBank were to suspend, limit or cease its operations or our relationship with WebBank were to otherwise terminate, we would need to implement a substantially similar arrangement with another issuing bank, obtain additional state licenses or curtail our operations. Although we currently have a non-exclusive arrangement with Cross River Bank, another issuing bank, to date Cross River Bank has not originated any loans through our platform. If we need to enter into alternative arrangements with a different issuing bank to replace our existing arrangements, we may not be able to negotiate a comparable alternative arrangement. Transitioning loan originations to a new issuing bank is untested and may result in delays in the issuance of loans or, if our platform becomes inoperable, may result in our inability to facilitate loans through our platform. If we were unable to enter in an alternative arrangement with a different issuing bank, we would need to obtain a state license in each state in which we operate to enable us to originate loans, as well as comply with other state and federal laws, which would be costly and time-consuming. If we are unsuccessful in maintaining our relationships with WebBank or other issuing banks, our ability to provide loan products could be materially impaired and our operating results would suffer.
Our quarterly results may fluctuate significantly
The regulatory framework for our business is evolving and
may not fully reflectuncertain as federal and state governments consider new laws to regulate online marketplaces such as ours. New laws and regulations, including uncertainty as to how the
underlying performanceactions of the CFPB or any other federal or state regulator could impact our business or that of our
business.Our quarterlyissuing banks.
The regulatory framework for online marketplaces such as ours is evolving and uncertain. It is possible that new laws and regulations will be adopted in the United States and internationally, or existing laws and regulations may be interpreted in new ways, that would affect the operation of our marketplace and the way in which we interact with borrowers and investors. For a discussion of how government regulation impacts key aspects of our business, see “Part II – Item 7 – Management’s Discussion and Analysis of Financial Condition and Results of Operations –Regulatory Environment.”
Evolving Regulatory Framework
In July 2015 the U.S. Treasury Department (Treasury Department) issued a request for information (RFI) to study the various business models and products offered by online marketplace lenders, the potential for online marketplace lending to expand access to credit to historically underserved borrowers and how the financial regulatory framework should evolve to support the safe growth of the industry. We, along with many other interested groups, submitted responses to the Treasury Department's RFI by the September 2015 deadline.
On May 10, 2016, the Treasury Department released a white paper on the online marketplace lending industry to continue the work initiated by the RFI. The white paper includes several recommendations to the federal government and private sector participants to encourage safe growth and access to credit. We cannot predict whether any legislation or proposed rulemaking will actually be introduced or how any legislation or rulemaking will impact our business and results of operations going forward.
In December 2015, the California Department of Business Oversight (DBO) sent an online survey to fourteen marketplace lenders, including us, requesting information about our business model, online platform, loan performance and investor funding process, including information regarding referral programs. In May 2016, the levels of our operating revenue and expenses, contribution marginDBO requested additional information from us and other key metrics, may vary significantlysurvey participants, including information regarding referral programs. We submitted our response to this additional information in June 2016 and continue to cooperate with the futureDBO's inquiry.
In December 2016, the Officer of the Comptroller of Currency (OCC) released a whitepaper and period-to-period comparisonssought public comment on whether to charter a type of special purpose national bank to facilitate the provision of core banking activities through financial technology. We, along with other interested parties, submitted responses to the OCC’s proposed special purpose charter (Fintech Charter) in January 2017. We cannot predict whether or when the OCC will begin accepting applications for Fintech Charters, if we will pursue a Fintech Charter, or how this new Fintech Charter could impact our operatingindustry, business and results may not be meaningful. Accordingly,of operations going forward.
Consumer Financial Protection Bureau
The CFPB, which commenced operations in July 2011, has broad authority over the
results for any one quarter are not necessarily an indication of future performance. Our quarterlybusinesses in which we engage. This includes authority to write regulations under federal consumer financial
results may fluctuate due to a variety of factors, some of which are outside of our control and,protection laws, such as
a result, may not fully reflect the
underlying performance of our business. FluctuationTruth in
quarterly results may adversely affect the price of our common stock. Factors that may cause fluctuations in our quarterly financial results include:our ability to attract new investors or borrowers and maintain relationships with existing borrowers and investors;
loan volumes, loan grades, loan mixLending Act and the channels through which the loansEqual Credit Opportunity Act, and corresponding investors are sourced;
the amountto enforce those laws against and timing of operating expenses related to acquiring borrowers and investors and the maintenance and expansion of our business, operations and infrastructure;
network outages or security breaches;
general economic, industry and market conditions;
our emphasis on borrower and investor experience instead of near-term growth; and
the timing of expenses related to the development or acquisition of technologies or businesses and potential future charges for impairment of goodwill from acquired technologies or businesses.
In addition, we experience some seasonality in demand for personal loans, which is generally lower in the first and fourth quarters. While our growth has somewhat masked this seasonality, our operating results could be affected by such seasonality in the future.
If we do not compete effectively in our target markets, our operating results could be harmed.
The personal and small business lending market is competitive and evolving. We compete with financial products and companies that attract borrowers, investors or both. With respect to borrowers, we primarily compete with traditionalexamine large financial institutions, such as our issuing banks, for compliance. The CFPB is authorized to prevent “unfair, deceptive or abusive acts or practices” through its regulatory, supervisory and enforcement authority. While we are subject to the regulatory and enforcement authority of the CFPB, as a facilitator, servicer or acquirer of consumer credit, unions, credit card issuersthe CFPB has recently announced that it intends to expand its supervisory authority, through the use of “larger participant rules,” to cover the markets for consumer installment loans and auto title loans. The CFPB is also considering whether rules to require registration of these or other non-depository lenders would facilitate supervision. The CFPB has not announced specifics regarding its proposed rulemaking and, consequently, there
continues to be uncertainty as to how the CFPB’s strategies and priorities, including any final rules, will impact our businesses and results of operations going forward.
The announcement of our internal board review and resignation of our former Chief Executive Officer (CEO) has resulted in government inquiries, books and records demands and private litigation and could result in government enforcement actions and private litigation that could have a material adverse impact on our results of operations, result in substantial costs and divert management’s attention.
We are regularly subject to claims, lawsuits (including class actions and individual lawsuits), government investigations, and other
consumer finance companies. With respect to investors, we primarily compete with other investment vehiclesproceedings in the ordinary course of business. The number and
asset classes, suchsignificance of these disputes and inquiries have increased as
equities, bonds and short-term fixed income securities. We also compete with other online credit marketplaces.Manya result of our competitors operate with different business models,internal board review and resignation of our former CEO. Accordingly, we are and will continue to be subject to significant litigation in the near future.
As previously disclosed, we have different cost structures or participate selectively in different market segments. They may ultimately prove more successful or more adaptable to new regulatory, technologicalreceived a grand jury subpoena from the U.S. Department of Justice (DOJ) and have been contacted by the SEC, Federal Trade Commission (FTC) and other developments. Somegovernmental entities. We continue to cooperate with the DOJ, SEC, FTC and any other governmental or regulatory authorities or agencies. In the first and second quarter of our2016, several putative class action lawsuits and shareholder derivative actions were filed against the Company, including certain of its current and former directors and officers. No assurance can be given as to the timing or potential competitors have significantly more financial, technical, marketingoutcome of these, or other matters. Any regulatory investigation could result in significant fines or penalties and could result in consent decrees or other resources thanregulatory directives limiting the way we do business or requiring a third-party monitor to assist in overseeing compliance. This would limit our flexibility and may be ablecould have a material adverse impact on our business, financial condition, and results of operation. Any litigation to devote greater resources to the development, promotion, sale and support of their platforms and distribution channels. Our potential competitors may also have longer operating histories, more extensive customer bases, greater brand recognition and brand loyalty and broader customer and partner relationships than we have. For example, more established Internet companies that possess large, existing customer bases, substantial financial resources and established distribution channels could enter the market. Additionally, a current or potential competitor may acquire one of our existing competitors or form a strategic alliance with one of our competitors. Our competitors may be better at developing new products, responding quickly to new technologies and undertaking more extensive marketing campaigns. Ifwhich we are unablea party may result in onerous or unfavorable judgments that may not be reversed upon appeal or in payments of substantial monetary damages or fines, or we may decide to compete with such companies and meet the need for innovation in our industry, the demand for our marketplace could stagnate or substantially decline, we could experience reduced revenue or our marketplace could fail to achieve or maintain more widespread market acceptance, any ofsettle lawsuits on similarly unfavorable terms, which could harm our business.Negative publicity could adversely affect our business, financial conditions, and operating results.
results of operations. In addition, responding to inquiries and lawsuits of this nature is costly and time-consuming to management, can generate negative publicity, and could have a material adverse impact on our results of operation. See
“Part II – Item 8 – Financial Statements and Supplementary Data – Note 17. Commitments and Contingencies – Legal” for additional information regarding these matters.
Negative publicity and unfavorable media coverage could negatively affect our business.
Negative publicity about our industry or our company, including the quality and reliability of our marketplace, effectiveness of the credit decisioning
andor scoring models used in the marketplace,
the effectiveness of our collection efforts, statements regarding investment returns, changes to our marketplace, our ability to effectively manage and resolve borrower and investor complaints, privacy and security practices,
use of loan proceeds by certain borrowers of ours or other companies in our industry for illegal purposes, litigation, regulatory activity and the experience of borrowers and investors with our marketplace or services, even if inaccurate, could adversely affect our reputation and the confidence in, and the use of, our marketplace, which could harm our business and operating results. Harm to our reputation can arise from many sources, including employee misconduct, misconduct by our partners
or partners of partners, other online credit marketplaces, outsourced service providers or other counterparties, failure by us or our partners to meet minimum standards of service and quality, inadequate protection of borrower and investor information and compliance failures and claims.
We have also received a high degree of media coverage related to the results of our review and resignation of our former CEO. Unfavorable publicity regarding these events resulted in some investors pausing their investments through the platform, resulting in a slowdown in investor demand on our platform. If this negatively publicity were to persist or recur, it could further harm our reputation, and materially and adversely affect our business, financial conditions, and results of operations.
A decline in social and economic conditions may adversely affect our customers, which may negatively impact our business and results of operations.
As a credit marketplace, we believe our customers are more highly susceptible to uncertainties and negative trends in the markets driven by, among other factors, general social and economic conditions in the United States and abroad. Economic factors include interest rates, unemployment levels, gasoline prices, adjustments in monthly payments, adjustable-rate mortgages and other debt payments, the rate of inflation and consumer perceptions of economic conditions. Social factors include changes in consumer confidence levels and changes in attitudes with respect to incurring debt and the stigma of personal bankruptcy.
These social and economic factors may affect the ability or willingness of borrowers to make payments on their loans. Because we make payments to investors ratably only to the extent we receive the borrower’s payments on the corresponding loan, if we do not receive payments on the corresponding loan, the investor will not be entitled to any payments under the terms of the investment or whole loan purchase agreement. Accordingly, the return for the investor or whole loan purchaser would decline. Personal loans facilitated through our marketplace are not secured by any collateral, not guaranteed or insured by any third- party and not backed by any governmental authority in any way. We are therefore limited in our ability to collect on the loans if a borrower is unwilling or unable to repay.
We strive to establish a marketplace in which annual percentage rates are attractive to borrowers and returns, including the impact of credit losses, are attractive to investors. These external economic and social conditions and resulting trends or uncertainties could adversely impact our customers' ability or desire to participate on our marketplace as borrowers or investors thus adversely impacting the credit performance of the loans, notes and certificates, which could negatively affect our business and results of operations. See “Part II – Item 7 – Management’s Discussion and Analysis of Financial Condition and Results of Operations – Current Economic and Business Environment.”
If our collection efforts on delinquent loans are ineffective or unsuccessful, the return on investment for investors in those loans would be adversely affected and investors may not find investing through our marketplace desirable.
Loans are unsecured obligations of borrowers, and they are not secured by any collateral, not guaranteed or insured by any third party and not backed by any governmental authority in any way. We are the loan servicer for all loans supporting notes and certificates, and we are the loan servicer for most, though not all, loans sold as whole loans. Our ability to collect on the loans is dependent on the borrower's continuing financial stability, and consequently, collections can be adversely affected by job loss, divorce, death, illness or personal bankruptcy. Furthermore, the application of various federal and state laws, including federal and state bankruptcy and insolvency laws, may limit the amount that can be recovered on these loans. Accordingly, we and our designated third-party collection agencies may be limited in our ability to collect loans.
In addition, most investors must depend on Lending Club or our third-party collection agents to pursue collection on delinquent member loans. We generally use our in-house collections department as a first step when a borrower member misses a payment. Because we make payments ratably on an investor’s investment (or whole loan buyer's loans) only if we receive the borrower’s payments on the corresponding loan, if we cannot adequately perform collection services, the investor or whole loan buyer will not be entitled to any payments under the terms of the investment. In the event that our initial in-house attempts to contact a borrower member are unsuccessful, we generally refer the delinquent account to the outside collection agent. Further, if collection action must be taken in respect of a loan, we or the collection agency may charge a collection fee up to 35% of any amounts that are obtained (excluding litigation). These fees will correspondingly reduce the amounts of any payments received by an investor.
Similarly, the returns to investors may be impacted by declines in market rates for sales of charged-off loans to third party purchasers. In addition, because our servicing fees depend on the collectability of the loans, if we experience an unexpected significant increase in the number of borrowers who fail to promote and maintainrepay their loans or an increase in the
principal amount of the loans that are not repaid, we will be unable to collect our brand in a cost-effective manner, we may lose market shareentire servicing fee for such loans and our revenue could be adversely affected.
A relatively small number of investors account for a large dollar amount of investment in loans funded through our marketplace and may
decrease.We believe that developing and maintaining awarenessexert influence over us if we experience a slowdown in a significant amount of investment capital on our platform.
Following the announcement of our brand in a cost-effective manner is critical to attracting newboard review and retaining existing borrowers and investors to our marketplace. Successful promotionresignation of our brand will depend largelyformer CEO, a number of investors that, in the aggregate, contributed a significant amount of funding on the effectivenessplatform, paused their investments in loans through the platform as they performed audit and validation tests on their portfolios, or were otherwise reluctant to invest. While many of these investors have returned, if we experience a similar slowdown of investment on our platform we may need to grant investors significant inducements to attract capital or use our own capital. In addition, because a small number of loan investors account for a large dollar amount of capital on our platform, these loan investors may exert significant influence over us, our management and operations.
If investors pause their investment activity again, we may need to provide further incentives, and enter into different additional incentive structures or terms to attract investor capital to the platform. These arrangements may have a number of different structures and terms, including equity or debt transactions, alternative fee arrangements or other inducements such as the use of our marketing efforts and the experience of borrowers and investors in our marketplace. Our effortsequity. Failure to build our brand have involved significant expense, and it is likely that our future marketing efforts will require us to incur significant additional expense. These brand promotion activitiesattract investor capital on reasonable terms may not result in increased revenueus having to use additional capital to invest in loans or reduce origination volume. Such actions may have a material impact on our business and evenresults of operations and may be costly or dilutive to existing stockholders. There is no assurance that we will be able to enter into any of these transactions if they do, any increases may not offset the expenses incurred. If we fail to successfully promote and maintain our brandnecessary, or if we incur substantial expensesdo, what the final terms will be. These actions would likely have material adverse impacts on our business, financial condition (including liquidity), results of operations and ability to sustain and grow loan volume.
If these inducements or investment structures are not favorable to us, or are unsuccessful in an unsuccessful attemptattracting sufficient investment capital to promote and maintain our brand,platform, we may loseuse a greater amount of our existingown capital, compared to past experience, to fulfill regulatory or contractual purchase obligations or support short-term marketplace equilibrium as new investors complete the administrative and diligence updating processes necessary to enable their investments. Separately, we may also use our capital to invest in loans associated with the testing or initial launch of alternative loan terms, programs or channels to establish a track record of performance prior to facilitating third-party investments in these loans.
If the loans originated through our marketplace were found to violate a state’s usury laws, and/or we were found to be the true lender (as opposed to our issuing bank(s)), we may have to alter our business model and our business could be harmed.
The interest rates that are charged to borrowers and that form the basis of payments to investors through our marketplace are enabled by legal principles including (i) the application of federal law to enable an issuing bank that originates the loan to export the interest rates of the jurisdiction where it is located, (ii) the application of common law “choice of law” principles based upon factors such as the loan document’s terms and where the loan transaction is completed to provide uniform rates to borrowers, or (iii) the application of principles that allow the transferee of a loan to continue to collect interest as provided in the loan document. WebBank, the primary issuing bank of the loans originated through our competitorsmarketplace, is chartered in, and operates out of, Utah, which allows parties to generally agree by contract to any interest rate. Certain states, including Utah, have no statutory interest rate limitations on personal loans, while other jurisdictions have a maximum rate. In some jurisdictions, the maximum rate is less than the current maximum rate offered by WebBank through our platform. If the laws of such jurisdictions were found to govern the loans originated through our marketplace (in conflict with the principles described above), those loans could be in violation of such laws.
In May 2015, the U.S. Court of Appeals for the Second Circuit issued its decision in Madden v. Midland Funding, LLC that interpreted the scope of federal preemption under the National Bank Act and held that a nonbank assignee of a loan originated by a national bank was not entitled to the benefits of federal preemption of claims of usury. The
Second Circuit denied the defendant’s (Midland Funding) motion to reconsider the decision and remanded the case to address choice of law matters. The Second Circuit’s decision is binding on federal courts located in Connecticut, New York, and Vermont, but the decision could also be adopted by other courts. The defendant petitioned the U.S. Supreme Court to review the decision and in March 2016, the Court invited the Solicitor General to file a brief expressing the views of the U.S. on the petition. The Solicitor General filed an amicus brief that stated the Second Circuit decision was incorrect, but that the case was not yet ready to be heard by the Supreme Court. In June 2016, the Supreme Court declined to hear the case. The Federal District Court is now hearing the case in regards to Midland’s alternative claim under a choice of law analysis, and application of state law. The outcome could create potential liability under state statutes such as usury and consumer protection statutes.
In April 2016, a putative class action lawsuit was filed against the Company, and certain of its current and former officers and directors in federal court in New York, alleging that persons received loans, through our platform, that exceeded states' usury limits in violation of state usury and consumer protection laws, and the federal RICO statute. The Company's motion to compel arbitration on an individual basis was granted in February 2017. There can be no assurance as to the timing or outcome of these matters.
If a borrower were to successfully bring claims against us for state usury law violations, and the rate on that borrower’s personal loan was greater than that allowed under applicable state law, we could be
subject to fines and penalties, including the voiding of loans and repayment of principal and interest to borrowers and investors. We might decide to limit the maximum interest rate on certain loans originated through our marketplace, and we might decide to originate loans under state-specific licenses, where such a ruling is applicable. These actions could adversely impact our business. Further, if we were unable to
attract new borrowerspartner with another issuing bank, we would have to substantially modify our business operations from the manner currently contemplated and
investors.Our successwould be required to maintain state-specific licenses and future growth depend significantly ononly provide a limited range of interest rates for personal loans, all of which would substantially reduce our successful marketing efforts,operating efficiency and attractiveness to investors and possibly result in a decline in our operating results.
There has been (and may continue to be) other litigation challenging lending arrangements where a bank or other third party has made a loan and then sells and assigns it to an entity that is engaged in assisting with the origination and servicing of a loan. For example, in a lawsuit filed in December 2013, the CFPB alleged that the defendants in Consumer Financial Protection Bureau v. CashCall, Inc., et al (C.D. Cal August 31, 2016) had engaged in deceptive acts and practices by servicing and collecting loans that state licensing and state usury laws had rendered partially or wholly uncollectible. The court in that case held that, to identify the true lender of a loan, the totality of the circumstances and a “predominant economic interest” test should be considered. Although the decision in that case is being appealed, if a similar test were applied in a case regarding our platform, there is no assurance the court would determine that our issuing bank partners have the predominant economic interest in loans facilitated through our platform. Additional state consumer protection laws would be applicable to the loans facilitated through our marketplace if we are unablewere re-characterized as a lender, and the loans could be voidable or unenforceable. In addition, we could be subject to attractclaims by borrowers, and investorsas well as enforcement actions by regulators.
If we do not compete effectively in our target markets, increase the loan originations facilitated through our marketplace, or expand our marketplace to our marketplace,new markets, we may not succeed in growing our business and our business and results of operations could be adversely affected.
The consumer and small business lending market is competitive and evolving. We compete with financial
results may be harmed.products and companies that attract borrowers, investors or both. With respect to borrowers, we primarily compete with traditional financial institutions, such as banks, credit unions, credit card issuers and other consumer and specialty finance companies. With respect to investors, we primarily compete with other investment vehicles and asset classes, such as equities, bonds and short-term fixed income securities. We intend to continue to dedicate significantalso compete with other online credit marketplaces. Many of our competitors have significantly greater resources to our marketing efforts, particularly asthan we have, operate with different business models, have different cost structures or participate selectively in different market segments.
To continue to grow our
business, we must continue to increase loan originations through our marketplace
introduceby attracting a large number of new
loan productsborrowers who meet our platform’s lending standards and
expand into new
states.and existing investors to invest in these loans. Our ability to attract qualified borrowers and sufficient investors depends in large part on the success of
theseour marketing efforts,
particularly as we continue to grow our marketplace and
the success of the marketing channels we use to promote our marketplace. Our marketing channels include social media and the press, online partnerships, search engine optimization, search engine marketing,offline partnerships, mail-to-web and radio and television advertising.introduce new loan products. If any of our current marketing channels become less effective, if we are unable to continue to use any of these channels, ifor the cost of using these channels were to significantly increase, or if we are not successful in generating new channels, we may not be able to attract new borrowers and investors in a cost-effective manner or convert potential borrowers and investors into active borrowers and investors in our marketplace. AsIf there are not sufficient qualified loan requests, investors may be unable to deploy their capital in a result,timely or efficient manner and may seek other investment opportunities. If there are insufficient investor commitments or participation, borrowers may be unable to obtain investment capital for their loans and may stop using our revenuemarketplace for their borrowing needs, which will impact our business results.
Although we have historically focused on the personal loan market, our marketplace has expanded to include small business borrowers, education and
results of operations would be adversely affected, which may impair our ability to grow our business.If new loan productspatient finance loans and enhancements do not achieve sufficient market acceptance, our financial results and competitive position will be harmed.
auto refinance loans. We incur expenses and expend resources upfront to develop, acquire and market new loan products and platform enhancements to incorporate additional features, improve functionality or otherwise make our marketplace more desirable to borrowers and investors. New loan products or marketplace or platform enhancements must achieve high levels of market acceptance in order for us to recoup our investment in developing and bringing them to market.
Any new loan products and changes to our marketplace or platform could fail to attain sufficient market acceptance for many reasons, including:
our failure to predict market demand accurately and supply loan products that meet this demand in a timely fashion;
borrowers and investors using our marketplace may not like, find useful or agree with any changes;
defects, errors or failures in our platform;
negative publicity about our loan products or our marketplace or platform’s performance or effectiveness;
competition with established financial institutions;
delays in releasing to the market new loan products or marketplace or platform enhancements; and
the introduction or anticipated introduction of competing products by our competitors.
If our new
Any failure to successfully address additional markets and loan products or
marketplacedevelop a broader base of borrowers and investors could result in loss of market share or
platform enhancements do not achieve adequate acceptance in the market,slower growth, which would harm our
competitive position, revenuebusiness, financial condition and
operating results
could be harmed.of operations. The adverse effect on our financial results may be particularly acute because of the significant development, marketing, sales and other expenses we will have incurred in connection with the new loan products or enhancements.
If we are unable to successfully expand our marketplace to new markets, we may not succeed in growing our business.
Although historically we have focused on the personal loan market, we recently expanded our marketplace to include small business borrowers and have also introduced education and patient finance loans through our acquisition of Springstone. We plan to address additional markets and loan products and expand the types of borrowers and investors to further grow our business. Any failure to successfully address additional market segments and loan products or develop a broader base of borrowers and investors could result in loss of market share or slower growth, which would harm our business, financial condition and results of operations.
Successful strategic relationships with ecosystem partners are important for our future success.
We anticipate that we will continue to depend on relationships with ecosystem partners to grow our business. Ecosystem partners can transact directly with our marketplace as investors or serve as a source of referrals for investors and borrowers. We continue to pursue additional relationships with ecosystem partners, such as banks, asset managers and insurance companies. For example, we intend to enter into strategic relationships with community banks and other financial partners to facilitate co-branded loan offerings to their borrower customers through our marketplace. Identifying, negotiating and documenting relationships with ecosystem partners require significant time and resources as does integrating third-party data and services. Our current agreements with ecosystem partners often do not prohibit them from working with our competitors or from offering competing services. Our competitors may be effective in providing incentives to ecosystem partners to favor their products or services or in reducing the volume of loans facilitated through our marketplace. In addition, these ecosystem partners may not perform as expected under our agreements with them, and we may have disagreements or disputes with such partners, which could adversely affect our brand and reputation. If we cannot successfully enter into and maintain effective strategic relationships with ecosystem partners, our business will be harmed.
If the credit decisioning and scoring models we use contain errors or are otherwise ineffective, our reputation and relationships with borrowers and investors could be harmed and our market share could decline.
Our ability to attract borrowers and investors to, and build trust in, our marketplace is significantly dependent on our ability to effectively evaluate a borrower’s credit profile and likelihood of default. To conduct this evaluation, we utilize credit decisioning and scoring models that assign each loan offered on our marketplace a grade and a corresponding interest rate. Our marketplace’s credit decisioning and scoring models are based on algorithms that evaluate a number of factors, including behavioral data, transactional data and employment information, which may not effectively predict future loan losses. If we are unable to effectively segment borrowers into relative risk profiles, we may be unable to offer attractive interests rates for borrowers and returns for investors. We refine these algorithms based on new data and changing macro and economic conditions. If any of these credit decisioning and scoring models contain programming or other errors, are ineffective or the data provided by borrowers or third parties is incorrect or stale, our loan pricing and approval process could be negatively affected, resulting in mispriced or misclassified loans or incorrect approvals or denials of loans. While we have not incurred any material liabilities to date, if these errors were to occur in the future, investors may try to rescind their affected investments or decide not to invest in loans or borrowers may seek to revise the terms of their loans or reduce the use of our marketplace for loans.
Credit and other information that we receive from
borrowers or third parties about a borrower may be inaccurate or may not accurately reflect the borrower’s creditworthiness, which may cause us to inaccurately price loans facilitated through our marketplace.
We obtain
Our ability to review and select qualified borrowers depends on obtaining borrower credit information from consumer reporting agencies, such as TransUnion, Experian or Equifax, and
we assign loan grades to loan requests based on our marketplace’s credit decisioning and scoring models that take into account reported credit score, other information reported by the consumer reporting agencies and the requested loan amount, in addition to a variety of other factors. A credit score or loan grade assigned to a borrower may not reflect that borrower’s actual creditworthiness because the credit score may be based on outdated, incomplete or inaccurate consumer reporting data, and we do not verify the information obtained from the borrower’s credit report. Additionally, there is a risk that, following the date of the credit report that we obtain and review, a borrower may have:
become delinquent in the payment of an outstanding obligation;
defaulted on a pre-existing debt obligation;
taken on additional debt; or
sustained other adverse financial events.
If
In addition, borrowers
default on loans that are not priced correctly, investors may try to rescind their affected investments in these loans and our reputation may be harmed.Our reputation may be harmed if information supplied by borrowers is inaccurate, misleading or incomplete.
Borrowers supply a variety of information that is included in the loan listings on our marketplace. Other than as described below, we do not verify this information,marketplace, and it may be inaccurate or incomplete. To verify a borrower’s identity, income or employment, our verification process and teams connect to various data sources, directly or through third-party service providers, contact the human resources department of the borrower’s stated employer, or request pay stubs. For example, we often do not verify a borrower’s stated tenure, job title, home ownership status or intention for the use of loan proceeds. Moreover, investors do
If borrowers default on loans that are not
and will not, have access to financial statements ofpriced correctly because the information provided by the borrowers or
to other detailed financial information about borrowers. If investors invest in loans through our marketplace based on information supplied by borrowers thatthird parties is inaccurate,
misleading or incomplete, those investors may
try to rescind their affected investments in these loans or the loans may not
receive theirperform as expected
returns and our reputation may be harmed.
Fraudulent activity associated with
If the credit decisioning and scoring models we use contain errors, do not adequately assess risk, or are otherwise ineffective, our
marketplace could negatively impact our operating results, brand and reputation and
cause the use of our loan productsrelationships with borrowers and
services to decreaseinvestors could be harmed and our
fraud losses to increase.We are subject to the risk of fraudulent activity associated with our marketplace, issuing banks, borrowers, investors and third parties handling borrower and investor information. Our resources, technologies and fraud prevention tools may be insufficient to accurately detect and prevent fraud. Under our agreements with investors, we are obligated to repurchase loans in cases of confirmed identity theft. The level of our fraud charge-offs and results of operationsmarket share could be materially adversely affected if fraudulent activity were to significantly increase. High profile fraudulent activity or significant increases in fraudulent activity could lead to regulatory intervention, negatively impact our operating results, brand and reputation and lead us to take steps to reduce fraud risk, which could increase our costs.
We rely on data from third parties for the successful operation of our platform.
decline.
Our ability to
review and select qualifiedattract borrowers and
sufficient investors
dependsto, and build trust in, our marketplace is significantly dependent on
credit, identification, employment and other relevant information that we receive from third parties, including credit bureaus. If this information becomes unavailable or becomes more expensive to access, it could increase our costs as we seek alternative sources of information. If this third-party data is incorrect, our ability to
identify qualified borrowerseffectively evaluate a borrower’s credit profile and
investors or approvelikelihood of default. To conduct this evaluation, we utilize credit decisioning and
price loans may suffer and our business may be harmed.Fluctuations in interest rates could negatively affect transaction volume.
All personal and nearly all small business loans facilitated throughscoring models that assign each loan offered on our marketplace a grade and a corresponding interest rate. Our marketplace’s credit decisioning and scoring models are issued with fixed interest rates,based on algorithms that evaluate a number of factors, including behavioral data, transactional data and education and patient finance loans facilitated by Springstone are issued with fixed or variable rates, depending on the type of loan. If interest rates rise, investors who have already committed capitalemployment information, which may lose the opportunity to take advantage of the higher rates. Additionally, potential borrowers could seek to defer loans as they wait for interest rates to settle, and borrowers of variable rate loans through Springstone’s platform may be subject to increased interest rates. If interest rates decrease after a loan is made, borrowers through our marketplace may prepay their loans to take advantage of the lower rates. Investors through our marketplace would lose the opportunity to collect the above-market interest rate payable on the corresponding loan and may delay or reducenot effectively predict future loan investments. As a result, fluctuations in the interest rate environment may discourage investors andlosses. If we are unable to effectively segment borrowers from participating in our marketplace and may reduce our loan originations, which may adversely affect our business.
If loan default rates are in excess of the expected default rates,into relative risk profiles, we may be unable to collect our entire servicing fee.
Personal loans facilitated through our marketplace are not secured by any collateral, not guaranteed or insured by any third partyoffer attractive interest rates for borrowers and not backed by any governmental authority in any way. We are therefore limited in our abilityrisk-adjusted returns for investors. Additionally, if these models fail to collect onadequately assess the loans if a borrower is unwilling or unable to repay. A borrower’s ability to repay us can be negatively impacted by increases in their payment obligations to other lenders under mortgage, credit card and other loans, including student loans and home equity lines of credit. These changes can result from increases in base lending rates or structured increases in payment obligations and could reduce the abilitycreditworthiness of our borrowers, to meet their payment obligations to other lenderswe may experience higher than forecasted losses. We continually refine these algorithms based on new data and to us. If a borrower defaults on a loan,changing macro economic conditions. However, there is no guarantee that the credit decisioning and scoring models that we typically outsource subsequent servicing efforts to third-party collection agencies, which mayuse have accurately assessed the creditworthiness of our borrowers, or will be unsuccessfuleffective in their efforts to collect the amount of the loan. Because our servicing fees depend on the collectability of the loans, if we experience an unexpected significant increaseassessing creditworthiness in the numberfuture.
Similarly, if any of
these credit decisioning and scoring models contain programming or other errors, are ineffective or the data provided by borrowers
who failor third parties is incorrect or stale, our loan pricing and approval process could be negatively affected, resulting in mispriced or misclassified loans or incorrect approvals or denials of loans. While we have not incurred any material liabilities to
repaydate, if these errors were to occur in the future, investors may try to rescind their affected investments or decide not to invest in loans in the future or borrowers may seek to revise the terms of their loans or
an increase inreduce the
principal amountuse of
the loans that are not repaid, we will be unable to collect our entire servicing fee for such loans and our revenue could be adversely affected.If we experience an increase in defaults on loans facilitated through our marketplace the return on investment for investors in those loans would be adversely affected and investors may not find investing through our marketplace desirable.
We make payments ratably on an investor’s investment only if we receive the borrower’s payments on the corresponding loan. If we do not receive payments on the corresponding loan related to an investment, the investor will not be entitled to any payments under the terms of the investment. Further, investors may have to pay us an additional servicing fee of up to 35% of any amount recovered by our third-party collection agencies assigned to collect on the loan. An investor may become dissatisfied with our marketplace if a loan underlying its investment is not repaid and it does not receive full payment. As a result, our reputation may suffer and we may lose investor confidence, which could adversely affect investor participation on our marketplace.
Limited liquidity for investments facilitated through our marketplace may make these investments less attractive to investors.
No trading market currently exists for the certificates issued by the Trust or for the investment funds, each of which are privately placed. Note investors can only sell their notes through the resale trading platform operated by FOLIOfn Investments, Inc. (FOLIOfn), an unaffiliated registered broker-dealer. During 2014, it took an average of approximately four days to sell a note on FOLIOfn with an offer price at or below par. We cannot assure you that FOLIOfn will continue to maintain a market for the trading of notes or that another market may arise. Given the lack of liquidity for certificates and the limited liquidity for notes, investors and potential investors may consider these investments to be less appealing and demand for these investments may decrease, which may adversely affect our business.
Borrowers may prepay a loan at any time without penalty and investors may stop investing in loans, which could reduce our servicing or management fee revenues.
A borrower may decide to prepay all or a portion of the remaining principal amount on a loan at any time without penalty. If the entire remaining unpaid principal amount of a loan is prepaid, we will not receive a servicing fee on the anticipated future loan payments and investors will not receive related payments. If a significant volume of prepayments occur, investors may stop investing in loans and the amount of our servicing or management fee revenues would decline, either of which could harm our business.
loans.
Our ability to protect the confidential information of our borrowers and investors may be adversely affected by cyber-attacks,
internal employee or other insider misconduct, computer viruses, physical or electronic break-ins or similar disruptions.
Our business involves the collection, storage, processing and transmission of customers' personal data, including financial information. The highly automated nature of our marketplace may make it an attractive target and potentially vulnerable to cyber attacks, computer viruses, physical or electronic break-ins or similar disruptions.
Our marketplace processes certain sensitive data from our borrowers and investors. While we have taken steps to protect confidential information that we have access to, our security measures could be breached. Any accidental or willful security breaches or other unauthorized access to our marketplace could cause confidential
borrower and investor information to be stolen and used for criminal purposes. Security breaches or unauthorized access to confidential information could also expose us to liability related to the loss of the information, time-consuming and expensive litigation and negative publicity. If security measures are breached because of third-party action, employee error, malfeasance or otherwise, or if design flaws in our software are exposed and exploited, our relationships with borrowers and investors could be severely damaged, and we could incur significant liability.
Because
The techniques used to sabotage or obtain unauthorized, improper or illegal access to our systems, change frequentlyour data or customers' data, disable or degrade service, or sabotage systems are constantly evolving, may be difficult to detect quickly, and generally often
are not recognized until after they arehave been launched against a target, we andtarget. Unauthorized parties may attempt to gain access to our third-party hostingsystems or facilities through various means, including, among others, hacking into the systems or facilities of us or our partners or customers, or attempting to fraudulently induce our employees, partners, customers or others into disclosing user names, passwords, or other sensitive information, which may in turn be used to access our information technology systems. Certain efforts may be unablestate-sponsored and supported by significant financial and technological resources, making them even more difficult to anticipate these techniques or to implement adequate preventative measures. In addition, federaldetect.
Federal regulators and many federal and state
laws and regulations require
companies to notify individuals ofnotice if data security breaches
involving theirinvolve certain personal data. These mandatory disclosures regarding a security breach are costly to implement and often lead to widespread negative publicity, which may cause borrowers and investors to lose confidence in the effectiveness of our data security measures. Any security breach, whether actual or perceived, would harm our reputation, we could lose borrowers, investors and ecosystem partners and our business and operations could be adversely affected.
Additionally, our insurance policies carry a self-insured retention and coverage limits, which may not be adequate to reimburse us for losses caused by security breaches, and we may not be able to collect fully, if at all, under these insurance policies.
Any delay in the implementation of our technology systems could disrupt our operations and cause unanticipated increases in our costs.
We believe the technology platform that powers our online marketplace enables us to deliver innovative solutions to borrowers and investors and provides a significant time and cost advantage over traditional banks that run on legacy systems. The satisfactory performance, reliability and availability of our technology and our underlying network infrastructure are critical to our operations, customer service, reputation and our ability to attract new and retain existing borrowers and investors. In addition, our future growth prospects are highly dependent on our ability to implement changes to our technology platform to support the future demands of our customers and industry. Our failure to implement changes to our technology platform and adapt to our customers’ changing technological needs and requirements or to hire and retain qualified personnel and maintain our engineering and technological expertise could have a material adverse effect on our operations.
Any significant disruption in service on our platform or in our computer systems, including events beyond our control, could prevent us from processing or posting payments on loans, reduce the attractiveness of our marketplace and result in a loss of borrowers or investors.
In the event of a platform outage and physical data loss, our ability to perform our servicing obligations, process applications or make loans available on our marketplace would be materially and adversely affected. The satisfactory performance, reliability and availability of our technology and our underlying network infrastructure are critical to our operations, customer service, reputation and our ability to attract new and retain existing borrowers and investors. Our platform systems are mirrored between two third-party owned and operated facilities. Our primary location is in Las Vegas, Nevada and is operated by Switch, Inc. Our secondary location is located in Santa Clara, California and is operated by CenturyLink. Our operations depend on both provider’s ability to protect its and our systems in their facilities against damage or interruption from natural disasters, power or telecommunications failures, air quality issues, environmental conditions, computer viruses or attempts to harm our systems, criminal acts and similar events. If our arrangement with either provider is terminated or if there is a lapse of service or damage to their facilities, we could experience interruptions in our service as well as delays and additional expense in arranging new facilities.
Any interruptions or delays in our service, whether as a result of third-party error, our error, natural disasters, terrorism, other man-made problems, or security breaches, whether accidental or willful, could harm our relationships with our borrowers and investors and our reputation. Additionally, in the event of damage or interruption, our insurance policies may not adequately compensate us for any losses that we may incur. Our disaster recovery plan has not been tested under actual disaster conditions, and we may not have sufficient capacity to recover all data and services in the event of an outage. These factors could prevent us from processing or posting payments on the loans, damage our brand and reputation, divert our employees’ attention, reduce our revenue,
subject us to liability and cause borrowers and investors to abandon our marketplace, any of which could adversely affect our business, financial condition and results of operations.
Our
Some aspects of our platform include open source software, and any failure to comply with the terms of one or more of these open source licenses could negatively affect our business.
Aspects of our platform include software covered by open source licenses, which may include, by way of example, GNU General Public License and the Apache License. Open source license terms are often ambiguous, and there is little or no legal precedent governing the interpretation of many of the terms of certain of these licenses. Therefore, the potential impact of such terms on our business is
somewhat unknown. If portions of our proprietary software are determined to be subject to
an open source license, we could be required to publicly release the
risksaffected portions of
earthquakes, fire, power outages, floodsour source code, re-engineer all or a portion of our technologies or otherwise be limited in the licensing of our technologies, each of which could reduce or eliminate the value of our technologies and
other catastrophic events,loan products. There can be no assurance that efforts we take to monitor the use of open source software to avoid uses in a manner that would require us to disclose or grant licenses under our proprietary source code will be successful, and
to interruption by man-made problems such
as strikesuse could inadvertently occur. This could harm our intellectual property position and
terrorism.A significant natural disaster, such as an earthquake, fire, power outage, flood or other catastrophic event, or interruptions by strikes, terrorism or other made-made problems, could have a material adverse effect on our business, operating results of operations, cash flow, and financial condition. In addition to risks related to license requirements, usage of open source software can lead to greater risks than use of third-party commercial software, as open source licensors generally do not provide warranties or controls on the origin of the software. Many of the risks associated with use of open source software cannot be eliminated, and could adversely affect our business.
Any failure to protect our own intellectual property rights could impair our brand, or subject us to claims for alleged infringement by third parties, which could harm our business.
We rely on a combination of copyright, trade secret, trademark and other rights, as well as confidentiality procedures and contractual provisions to protect our proprietary technology, underwriting and credit decisioning credit data, processes and other intellectual property. However, the steps we take to protect our intellectual property rights may be inadequate. Third parties may seek to challenge, invalidate or circumvent our copyright, trade secret, trademark and other rights or applications for any of the foregoing. Our headquarterscompetitors, as well as a number of other entities and individuals, may own or claim to own intellectual property relating to our real-time disaster recovery data centerindustry. From time to time, third parties may claim that we are located in the San Francisco Bay Area, a region known for seismic activity. Despite any precautionsinfringing on their intellectual property rights, and we may take,be found to be infringing on such rights. We may, however, be unaware of the occurrenceintellectual property rights that others may claim cover some or all of a natural disasterour technology or other unanticipated problems atservices.
In order to protect our
data centersintellectual property rights, we may be required to spend significant resources. Litigation brought to protect and enforce our intellectual property rights could be costly, time-consuming and distracting to management and could result in
lengthy interruptions in our services. In addition, acts of strikes, terrorism and other geo-political unrest could cause disruptions in our business and lead to interruptions, delaysthe impairment or loss of
critical data. Allportions of
the aforementioned risks may be further increased if our
disaster recovery plans prove to be inadequate. We have implemented a disaster recovery program that allowsintellectual property. In addition, any claims or litigation could cause us to
move production to a back-up data center in the event of a catastrophe. Although this program is functional,incur significant expenses and, if successfully asserted against us, could require that we
do not currently serve network traffic equallypay substantial damages or ongoing royalty payments, prevent us from
each data center. If our primary data center shuts down, there will be a period of time thatoffering our loan products or
services,operating our platform or
certain ofrequire that we comply with other unfavorable terms. Our failure to secure, protect and enforce our
loan products or services, will remain inaccessible tointellectual property rights could seriously adversely affect our
users orbrand and adversely impact our
users may experience severe issues accessing our loan products and services.We do not currently maintain business interruption insurance to compensate us for potentially significant losses, including potential harm to our business that may result from interruptions in our ability to provide our loan products and services.
business.
Our platform and internal systems rely on software that is highly technical, and if it contains undetected errors, our business could be adversely affected.
Our platform and internal systems rely on software that is highly technical and complex. In addition, our platform and internal systems depend on the ability of such software to store, retrieve, process and manage immense amounts of data. The software on which we rely has contained, and may now or in the future contain, undetected errors or bugs. Some errors may only be discovered after the code has been released for external or internal use. Errors or other design defects within the software on which we rely may result in a
negative experience for borrowers and investors, delay introductions of new features or enhancements, result in errors or compromise our ability to protect borrower or investor data or our intellectual property. Any errors, bugs or defects discovered in the software on
which we rely could result in harm to our reputation, loss of borrowers or investors, loss of revenue or liability for damages, any of which could adversely affect our business and financial results.
Because some investors may come to our website via hyperlinks from websites of referral partners, it is possible that an unsatisfied investor could make a claim against us based on the content of these third-party websites that could result in claims that are costly to defend and distracting to management.
Some investors in notes may come to our website after reviewing the website of a referral partner via a hyperlink from this third-party website to a landing page on our website. We compensate referral partners based on whether a person “clicks through” to our web page, and do not pay any compensation based on whether or how much an investor may invest. While all investors are provided with access to a note prospectus on the landing page and during the account opening process, it is possible that an investor could have reviewed additional content on the referral partner’s website. We do not review, approve or adopt any content on a referral partner’s website and, while we do not believe we would have liability for content on a partner website, it is possible that an unsatisfied investor could bring claims against us based on such content. Such claims could be costly and time consuming to defend and would distract management’s attention from the operation of the business.
Misconduct and errors by our employees and third-party service providers could harm our business and reputation.
We are exposed to many types of operational risk, including the risk of misconduct and errors by our employees and other third-party service providers. Our business depends on our employees and third-party service providers to process a large number of increasingly complex transactions, including treasury transactions that involve significant dollar amounts and loan transactions that involve the use and disclosure of personal and business information. We could be materially adversely affected if treasury transactions were redirected, misappropriated or otherwise improperly executed, personal and business information was disclosed to unintended recipients or an operational breakdown or failure in the processing of other transactions occurred, whether as a result of human error, a purposeful sabotage or a fraudulent manipulation of our operations or systems. In addition, the manner in which we store and use certain personal information and interact with borrowers and investors is governed by various federal and state laws. If any of our employees or third-party service providers take, convert or misuse funds, documents or data or fail to follow protocol when interacting with borrowers and investors, we could be liable for damages and subject to regulatory actions and penalties. We could also be perceived to have facilitated or participated in the illegal misappropriation of funds, documents or data, or the failure to follow protocol, and therefore be subject to civil or criminal liability. It is not always possible to identify and deter misconduct or errors by employees or third-party service providers, and the precautions we take to detect and prevent this activity may not be effective in controlling unknown or unmanaged risks or losses. Any of these occurrences could result in our diminished ability to operate our business, potential liability to borrowers and investors, inability to attract future borrowers and investors, reputational damage, regulatory intervention and financial harm, which could negatively impact our business, financial condition and results of operations.
We may be sued by third parties for alleged infringement of their proprietary rights, which could harm our business.
Our success depends on not infringing on the intellectual property rights of others. Our competitors, as well as a number of other entities and individuals, may own or claim to own intellectual property relating to our industry. From time to time, third parties may claim that we are infringing on their intellectual property rights, and we may be found to be infringing on such rights. In the future, others may claim that our applications and underlying technology infringe or violate their intellectual property rights. We may, however, be unaware of the intellectual property rights that others may claim cover some or all of our technology or services. Any claims or litigation could cause us to incur significant expenses and, if successfully asserted against us, could require that we pay substantial damages or ongoing royalty payments, prevent us from offering our loan products or operating our platform or require that we comply with other unfavorable terms. We may also be obligated to indemnify parties or pay substantial settlement costs, including royalty payments, in connection with any such claim or litigation and to obtain licenses, modify applications or refund fees, which could be costly. Even if we were to prevail in such a dispute, any litigation regarding our intellectual property could be costly and time-consuming and divert the attention of our management and key personnel from our business operations.
Any failure to protect our own intellectual property rights could impair our brand, negatively impact our business or both.
Our success and ability to compete also depend in part on protecting our own intellectual property. We rely on a combination of copyright, trade secret, trademark and other rights, as well as confidentiality procedures and contractual provisions to protect our proprietary technology, processes and other intellectual property. However, the steps we take to protect our intellectual property rights may be inadequate. Third parties may seek to challenge, invalidate or circumvent our copyright, trade secret, trademark and other rights or applications for any of the foregoing. In order to protect our intellectual property rights, we may be required to spend significant resources. Litigation brought to protect and enforce our intellectual property rights could be costly, time-consuming and distracting to management and could result in the impairment or loss of portions of our intellectual property. Our failure to secure, protect and enforce our intellectual property rights could seriously adversely affect our brand and adversely impact our business.
Some aspects of our platform include open source software, and any failure to comply with the terms of one or more of these open source licenses could negatively affect our business.
Aspects of our platform include software covered by open source licenses, which may include, by way of example, GNU General Public License and the Apache License. The terms of various open source licenses have not been interpreted by U.S. courts, and there is a risk that such licenses could be construed in a manner that imposes unanticipated conditions or restrictions on our platform. If portions of our proprietary software are determined to be subject to an open source license, we could be required to publicly release the affected portions of our source code, re-engineer all or a portion of our technologies or otherwise be limited in the licensing of our technologies, each of which could reduce or eliminate the value of our technologies and loan products. In addition to risks related to license requirements, usage of open source software can lead to greater risks than use of third-party commercial software, as open source licensors generally do not provide warranties or controls on the origin of the software. Many of the risks associated with use of open source software cannot be eliminated, and could adversely affect our business.
If we fail to manage the integration of Springstone effectively, our results of operations and business could be harmed.
We are in the process of integrating Springstone into our business. Risks associated with any such integration include:
our inability to integrate smoothly Springstone’s technologies and loan products with our current technologies and products;
possible changes to Springstone’s loan products and sales and operational processes; and
our inability to assimilate and retain the management and other personnel, culture and operations of Springstone, including back-office functions and systems, such as accounting, human resources, internal controls and others.
This integration may be difficult and unpredictable. We may invest resources in the acquisition and integration efforts would have been better utilized developing technology and loan products for our marketplace or on other strategic development initiatives.
Further, this acquisition may disrupt our ongoing operations, divert management’s attention from their primary responsibilities and our other strategic initiatives, subject us to additional liabilities, increase our expenses and otherwise adversely affect our business, financial condition, operating results and cash flows.
From time to time we may evaluate and potentially consummate acquisitions, which could require significant management attention, disrupt our business and adversely affect our financial results.
We may evaluate and consider strategic transactions, combinations, acquisitions or alliances to enhance our existing business or develop new loan products and services. These transactions could be material to our financial condition and results of operations if consummated. If we are able to identify an appropriate business opportunity, we may not be able to successfully consummate the transaction and, even if we do consummate such a transaction, we may be unable to obtain the benefits or avoid the difficulties and risks of such transaction.
Any acquisition will involve risks commonly encountered in business relationships, including:
difficulties in assimilating and integrating the operations, personnel, systems, data, technologies, products and services of the acquired business;
inability of the acquired technologies, products or businesses to achieve expected levels of revenue, profitability, productivity or other benefits;
difficulties in retaining, training, motivating and integrating key personnel;
diversion of management’s time and resources from our normal daily operations;
difficulties in successfully incorporating licensed or acquired technology and rights into our platform;
difficulties in maintaining uniform standards, controls, procedures and policies within the combined organizations;
difficulties in retaining relationships with customers, employees and suppliers of the acquired business;
risks of entering markets in which we have no or limited direct prior experience;
regulatory risks, including remaining in good standing with existing regulatory bodies or receiving any necessary pre-closing or post-closing approvals, as well as being subject to new regulators with oversight over an acquired business;
assumption of contractual obligations that contain terms that are not beneficial to us, require us to license or waive intellectual property rights or increase our risk for liability;
failure to successfully further develop the acquired technology;
liability for activities of the acquired business before the acquisition, including patent and trademark infringement claims, violations of laws, commercial disputes, tax liabilities and other known and unknown liabilities;
potential disruptions to our ongoing businesses; and
unexpected costs and unknown risks and liabilities associated with the acquisition.
We may not make any acquisitions, or any future acquisitions may not be successful, may not benefit our business strategy, may not generate sufficient revenue to offset the associated acquisition costs or may not otherwise result in the intended benefits. In addition, we cannot assure you that any future acquisition of new businesses or technology will lead to the successful development of new or enhanced loan products and services or that any new or enhanced loan products and services, if developed, will achieve market acceptance or prove to be profitable.
Expanding our operations internationally could subject us to new challenges and risks.
Although we currently only operate in the United States, we may seek to expand our business internationally. Managing any international expansion will require additional resources and controls. Any expansion internationally could subject our business to risks associated with international operations, including:
adjusting the proprietary risk algorithms that we use to account for the differences in information available on borrowers;
conformity with applicable business customs, including translation into foreign languages and associated expenses;
potential changes to our established business model;
the need to support and integrate with local third-party service providers;
competition with service providers that have greater experience in the local markets than we do or that have pre-existing relationships with potential borrowers and investors in those markets;
difficulties in staffing and managing foreign operations in an environment of diverse culture, laws and customers, and the increased travel, infrastructure and legal and compliance costs associated with international operations;
compliance with multiple, potentially conflicting and changing governmental laws and regulations, including banking, securities, employment, tax, privacy and data protection laws and regulations, such as the EU Data Privacy Directive;
compliance with U.S. and foreign anti-bribery laws, including the Foreign Corrupt Practices Act and the U.K. Anti-Bribery Act;
difficulties in collecting payments in foreign currencies and associated foreign currency exposure;
restrictions on repatriation of earnings;
compliance with potentially conflicting and changing laws of taxing jurisdictions where we conduct business and applicable U.S. tax laws as they relate to international operations, the complexity and adverse consequences of such tax laws and potentially adverse tax consequences due to changes in such tax laws; and
regional economic and political conditions.
As a result of these risks, any potential future international expansion efforts that we may undertake may not be successful.
We have in the past incurred substantial debt and may issue debt securities or otherwise incur substantial debt in the future, which may adversely affect our financial condition and negatively impact our operations.
We have in the past incurred, and may in the future incur, substantial debt. The incurrence of debt could have a variety of negative effects, including:
default and foreclosure on our assets if our operating revenue is insufficient to repay debt obligations;
acceleration of obligations to repay the indebtedness (or other outstanding indebtedness), even if we make all principal and interest payments when due, if we breach any covenants that require the maintenance of certain financial ratios or reserves without a waiver or renegotiation of that covenant;
our inability to obtain necessary additional financing if the debt security contains covenants restricting our ability to obtain such financing while the debt security is outstanding;
diverting a substantial portion of cash flow to pay principal and interest on such debt, which would reduce the funds available for expenses, capital expenditures, acquisitions and other general corporate purposes; and
creating potential limitations on our flexibility in planning for and reacting to changes in our business and in the industry in which we operate.
The occurrence of any of these risks could adversely affect our operations or financial condition.
Competition for our employees is intense, and we may not be able to attract and retain the highly skilled employees needed to support our business.
We believe our success depends on the efforts and talents of our employees, including software engineers, financial personnel and marketing professionals. Our future success depends on our continued ability to attract, develop, motivate and retain highly qualified and skilled employees. Competition for highly skilled technical and financial personnel, particularly in the San Francisco Bay Area, is extremely intense. We may not be able to hire and retain these personnel at compensation levels consistent with our existing compensation and salary structure. Many of the companies with which we compete for experienced employees have greater resources than we have and may be able to offer more attractive terms of employment.
In addition, we invest significant time and expense in training our employees, which increases their value to competitors who may seek to recruit them. If we fail to retain our employees, we could incur significant expenses in hiring and training their replacements, and the quality of our services and our ability to serve borrowers and investors could diminish, resulting in a material adverse effect on our business.
If we fail to retain our key personnel, we may not be able to achieve our anticipated level of growth and our business could suffer.
In addition to attracting and retaining highly skilled employees in general, our future performance depends, in part, on our ability to attract and retain key personnel, including our executive officers, senior management team and other key personnel, all of whom would be difficult to replace. In particular, Mr. Laplanche, our founder and Chief Executive Officer, is critical to the management of our business and operations and the development of our strategic direction. The loss of the services of Mr. Laplanche, our other executive officers or members of our senior management team, and the process to replace any of them, would involve significant time and expense and may significantly delay or prevent the achievement of our business objectives.
If we cannot maintain our corporate culture as we grow, we could lose the innovation, collaboration and focus that contribute to our business.
We believe that a critical component of our success is our corporate culture, which we believe fosters innovation, encourages teamwork and cultivates creativity. As we develop the infrastructure of a public company and continue to grow, we may find it difficult to maintain these valuable aspects of our corporate culture. Any failure to preserve our culture could negatively impact our future success, including our ability to attract and retain employees, encourage innovation and teamwork and effectively focus on and pursue our corporate objectives.
If we discover a material weakness in our internal control over financial reporting that we are unable to remedy or otherwise fail to maintain effective internal control over financial reporting or disclosure controls and procedures, our ability to report our financial results on a timely and accurate basis and the market price of our common stock may be adversely affected.
The Sarbanes-Oxley Act of 2002 (Sarbanes-Oxley Act) requires, among other things, that we maintain effective internal control over financial reporting and disclosure controls and procedures. Although we did not discover any material weaknesses in internal control over financial reporting at December 31, 2014, subsequent testing by us or our independent registered public accounting firm, which has not performed an audit of our internal control over financial reporting, may reveal deficiencies in our internal control over financial reporting that are deemed to be material weaknesses. To comply with Section 404A and 404B, we may incur substantial cost, expend significant management time on compliance-related issues and hire additional accounting, financial and internal audit staff with appropriate public company experience and technical accounting knowledge. Moreover, if we are not able to comply with the requirements of Section 404A and 404B in a timely manner or if we or our independent registered public accounting firm identify deficiencies in our internal control over financial reporting that are deemed to be material weaknesses, we could be subject to sanctions or investigations by the Securities and Exchange Commission (“SEC”) or other regulatory authorities, which would require additional financial and management resources. Any failure to maintain effective disclosure controls and procedures or internal control over financial reporting could have a material adverse effect on our business and operating results, and cause a decline in the price of our common stock.
Our ability to use our deferred tax assets to offset future taxable income may be subject to certain limitations that could subject our business to higher tax liabilities.
We may be limited in the portion of net operating loss carryforwards that we can use in the future to offset taxable income for U.S. federal and state income tax purposes. At December 31, 2014, we had federal and state net operating loss carry-forwards (“NOLs”) of approximately $68.7 million and $61.5 million, respectively, to offset future taxable income. These federal and state net operating loss carry-forwards will begin expiring in 2027 and 2016, respectively. A lack of future taxable income would adversely affect our ability to utilize these NOLs. In addition, under Section 382 of the Internal Revenue Code of 1986, as amended (“Code”), a corporation that undergoes an “ownership change” is subject to limitations on its ability to utilize its NOLs to offset future taxable income. Future changes in our stock ownership as well as other changes that may be outside of our control, could result in additional ownership changes under Section 382 of the Code. Our NOLs may also be impaired under similar provisions of state law. Additionally, at December 31, 2014, we had federal and state research and development tax credit carry-forwards of approximately $0.3 million and $0.2 million, respectively. We assess the available positive and negative evidence to estimate if sufficient future taxable income will be generated to utilize the existing deferred tax assets. On the basis of this evaluation, a full valuation allowance has historically been recorded to recognize only deferred tax assets that are more likely than not to be realized. Our deferred tax assets may expire unutilized or underutilized, which could prevent us from offsetting future taxable income.
RISKS RELATING TO COMPLIANCE AND REGULATION
We and our issuing bank partners are subject to borrower protection laws and federal and state consumer protection laws.
We and our issuing bank partners must comply with regulatory regimes, including those applicable to consumer credit transactions, various aspects of which are untested as applied to our marketplace. Certain state laws generally regulate interest rates and other charges and require certain disclosures. In addition, other federal and state laws may apply to the origination and servicing of loans facilitated through our marketplace. In particular, through our marketplace, we may be subject to laws, such as:
state laws and regulations that impose requirements related to loan disclosures and terms, credit discrimination, credit reporting, debt servicing and collection and unfair or deceptive business practices;
the Truth-in-Lending Act and Regulation Z promulgated thereunder, and similar state laws, which require certain disclosures to borrowers regarding the terms and conditions of their loans and credit transactions;
Section 5 of the Federal Trade Commission Act, which prohibits unfair and deceptive acts or practices in or affecting commerce, and Section 1031 of the Dodd-Frank Wall Street Reform and Consumer Protection Act, which prohibits unfair, deceptive or abusive acts or practices in connection with any consumer financial product or service;
the Equal Credit Opportunity Act and Regulation B promulgated thereunder, which prohibit creditors from discriminating against credit applicants on the basis of race, color, sex, age, religion, national origin, marital status, the fact that all or part of the applicant’s income derives from any public assistance program or the fact that the applicant has in good faith exercised any right under the federal Consumer Credit Protection Act or any applicable state law;
the Fair Credit Reporting Act, as amended by the Fair and Accurate Credit Transactions Act, which promotes the accuracy, fairness and privacy of information in the files of consumer reporting agencies;
the Fair Debt Collection Practices Act and similar state debt collection laws, which provide guidelines and limitations on the conduct of third-party debt collectors in connection with the collection of consumer debts;
the Gramm-Leach-Bliley Act, which includes limitations on financial institutions’ disclosure of nonpublic personal information about a consumer to nonaffiliated third parties, in certain circumstances requires financial institutions to limit the use and further disclosure of nonpublic personal information by nonaffiliated third parties to whom they disclose such information and requires financial institutions to disclose certain privacy policies and practices with respect to information sharing with affiliated and nonaffiliated entities as well as to safeguard personal customer information, and other privacy laws and regulations;
the Bankruptcy Code, which limits the extent to which creditors may seek to enforce debts against parties who have filed for bankruptcy protection;
the Servicemembers Civil Relief Act, which allows military members to suspend or postpone certain civil obligations so that the military member can devote his or her full attention to military duties;
the Electronic Fund Transfer Act and Regulation E promulgated thereunder, which provide disclosure requirements, guidelines and restrictions on the electronic transfer of funds from consumers’ bank accounts;
the Electronic Signatures in Global and National Commerce Act and similar state laws, particularly the Uniform Electronic Transactions Act, which authorize the creation of legally binding and enforceable agreements utilizing electronic records and signatures; and
the Bank Secrecy Act, which relates to compliance with anti-money laundering, customer due diligence and record-keeping policies and procedures.
We may not always have been, and may not always be, in compliance with these laws. Compliance with these laws is also costly, time-consuming and limits our operational flexibility.
Failure to comply with these laws and regulatory requirements applicable to our business may, among other things, limit our or a collection agency’s ability to collect all or part of the principal of or interest on loans. As a result, we may not be able to collect our servicing fee with respect to the uncollected principal or interest, and investors may be discouraged from investing in loans. In addition, non-compliance could subject us to damages, revocation of required licenses, class action lawsuits, administrative enforcement actions, rescission rights held by investors in securities offerings and civil and criminal liability, which may harm our business and our ability to maintain our marketplace and may result in borrowers rescinding their loans.
Where applicable, we will seek to comply with state small loan, loan broker, servicing and similar statutes. Currently, we do not facilitate loans to borrowers in Idaho, Iowa, Maine, Nebraska and North Dakota. In all other U.S. jurisdictions with licensing or other requirements that we believe may be applicable to us, we comply with the relevant requirements through the operation of our marketplace with issuing banks or we will be seeking to obtain required licenses. Nevertheless, if we are found to not have complied with applicable laws, we could lose one or more of our licenses or authorizations or face other sanctions or penalties or be required to obtain a license in such jurisdiction, which may have an adverse effect on our ability to continue to facilitate loans through our marketplace, perform our servicing obligations or make our marketplace available to borrowers in particular states, which may harm our business.
If our marketplace was found to violate a state’s usury laws, we may have to alter our business model and our business could be harmed.
The interest rates that are charged to borrowers and that form the basis of payments to investors through our marketplace are based upon the ability under federal law of the issuing bank that originates the loan to export the interest rates of its jurisdiction of incorporation to provide uniform rates to all borrowers in all states that have not opted out. WebBank, our primary issuing bank, exports the interest rates of Utah, which allows parties to generally agree by contract to any interest rate. The annual percentage rates offered by WebBank through our marketplace for personal loans as of December 31, 2014 range from 6.78% to 29.99%, which equate to interest rates for investors that range from 6.03% to 26.06%. Of the forty-six jurisdictions whose residents may obtain loans (including the District of Columbia), certain states, including Utah, have no statutory interest rate limitations on personal loans, while other jurisdictions have a maximum rate less than the current maximum rate offered by WebBank through our platform. If a borrower were to successfully bring claims against us for state usury law violations, and the rate on that borrower’s personal loan was greater than that allowed under applicable state law, we could be subject to fines and penalties. Further, if we were unable to partner with another issuing bank, we would have to substantially modify our business operations from the manner currently contemplated and would be required to maintain state-specific licenses and only provide a limited range of interest rates for personal loans, all of which would substantially reduce our operating efficiency and attractiveness to investors and possibly result in a decline in our operating results.
Several lawsuits have sought to re-characterize certain loan marketers and other originators as lenders. If litigation on similar theories were successful against us, loans facilitated through our marketplace could be subject to state consumer protection laws in a greater number of states.
Several lawsuits have brought under scrutiny the association between high-interest “payday loan” marketers and out-of-state banks. These lawsuits assert that payday loan marketers use out-of-state lenders in order to evade the consumer protection laws imposed by the states where they do business. Such litigation has sought to re-characterize the loan marketer as the lender for purposes of state consumer protection law and usury restrictions. Similar civil actions have been brought in the context of gift cards and retail purchase finance. Although we believe that our activities are generally distinguishable from the activities involved in these cases, a court or regulatory authority could disagree.
Additional state consumer protection laws would be applicable to the loans facilitated through our marketplace if we were re-characterized as a lender, and the loans could be voidable or unenforceable. In addition, we could be subject to claims by borrowers, as well as enforcement actions by regulators. Even if we were not required to cease doing business with residents of certain states or to change our business practices to comply with applicable laws and regulations, we could be required to register or obtain licenses or regulatory approvals that could impose a substantial cost on us.
The increased scrutiny of third-party medical financing by governmental agencies may lead to increased regulatory burdens on Springstone and adversely affect our consolidated revenue or results of operations.
Springstone, through its issuing bank partners, provides education and patient finance loans, including loans for elective medical procedures. Recently, regulators increased scrutiny of third-party providers of financing for medical procedures that are generally not covered by health insurance. For example, in December 2013, the CFPB fined GE Capital Retail Bank $34.1 million for insufficient training, disclosures and practices related to their medical financing services. In addition, attorneys general in New York and Minnesota have conducted investigations on alleged abusive lending practices or exploitation regarding third-party medical financing services.
In June 2014, Springstone received a civil investigative demand from the CFPB for documents and other tangible items related to its programs that provide healthcare financing. If Springstone’s practices are ultimately found to be deficient, resulting in fines, penalties or increased burdens on Springstone’s activities, our consolidated operating costs could increase. Additionally, such regulatory inquiries or actions could damage Springstone’s and our reputations and limit Springstone’s ability to conduct operations, which could adversely affect our consolidated financial statements.
The adoption of any law, rule or regulation affecting this industry may also increase Springstone’s administrative costs, modify its practices to comply with applicable requirements and reduce its ability to participate competitively, which could have a material adverse effect on our consolidated revenue or results of operations.
The CFPB is a new agency, and there continues to be uncertainty as to how the agency’s actions or the actions of any other new agency could impact our business or that of our issuing banks.
The CFPB, which commenced operations in July 2011, has broad authority over the businesses in which we engage. This includes authority to write regulations under federal consumer financial protection laws, such as the Truth in Lending Act and the Equal Credit Opportunity Act, and to enforce those laws against and examine large financial institutions, such as our issuing banks, for compliance. The CFPB is authorized to prevent “unfair, deceptive or abusive acts or practices” through its regulatory, supervisory and enforcement authority. To assist in its enforcement, the CFPB maintains an online complaint system that allows consumers to log complaints with respect to various consumer finance products, including the loan products we facilitate. This system could inform future CFPB decisions with respect to its regulatory, enforcement or examination focus.
We are subject to the CFPB’s jurisdiction, including its enforcement authority, as a servicer and acquirer of consumer credit. The CFPB may request reports concerning our organization, business conduct, markets and activities. The CFPB may also conduct on-site examinations of our business on a periodic basis if the CFPB were to determine, through its complaint system, that we were engaging in activities that pose risks to consumers.
There continues to be uncertainty as to how the CFPB’s strategies and priorities, including in both its examination and enforcement processes, will impact our businesses and our results of operations going forward. Actions by the CFPB could result in requirements to alter or cease offering affected loan products and services, making them less attractive and restricting our ability to offer them.
Although we have committed resources to enhancing our compliance programs, actions by the CFPB or other regulators against us, our issuing banks or our competitors that discourage the use of the marketplace model or suggest to consumers the desirability of other loan products or services could result in reputational harm and a loss of borrowers or investors. Our compliance costs and litigation exposure could increase materially if the CFPB or other regulators enact new regulations, change regulations that were previously adopted, modify, through supervision or enforcement, past regulatory guidance, or interpret existing regulations in a manner different or stricter than have been previously interpreted.
The collection, processing, storage, use and disclosure of personal data could give rise to liabilities as a result of governmental regulation, conflicting legal requirements or differing views of personal privacy rights.
We receive, transmit and store a large volume of personally identifiable information and other user data. There are federal, state and foreign laws regarding privacy and the storing, sharing, use, disclosure and protection of personally identifiable information and user data. Specifically, personally identifiable information is increasingly subject to legislation and regulations in numerous U.S. and international jurisdictions, the intent of which is to protect the privacy of personal information that is collected, processed and transmitted in or from the governing jurisdiction. This regulatory framework for privacy issues worldwide is currently evolving and is likely to remain uncertain for the foreseeable future. We could be adversely affected if legislation or regulations are expanded to require changes in business practices or privacy policies, or if governing jurisdictions interpret or implement their legislation or regulations in ways that negatively affect our business, financial condition and results of operations.
Our failure to comply with applicable privacy policies or federal, state or foreign laws and regulations or any compromise of security that results in the unauthorized release of personally identifiable information or other user data could damage our reputation, discourage potential borrowers or investors from using our marketplace or result in fines or proceedings brought against us, our issuing banks or other third parties by governmental agencies, borrowers, investors or other third parties, one or all of which could adversely affect our business, financial condition and results of operations. In addition to laws, regulations and other applicable common law rules regarding privacy and privacy advocacy, industry groups or other private parties may propose new and different privacy standards. We could also be subject to liability for the inappropriate use of information made available by us. Because the interpretation and application of privacy and data protection laws and privacy standards are still uncertain, it is possible that these laws or privacy standards may be interpreted and applied in a manner that is inconsistent with our practices. Any inability to adequately address privacy concerns, even if unfounded, or to comply with applicable privacy or data protection laws, regulations and privacy standards, could result in additional cost and liability for us, damage our reputation, inhibit use of our marketplace and harm our business.
Fluctuations in interest rates could negatively affect transaction volume.
All personal and auto loans and nearly all small business loans facilitated through our marketplace are issued with fixed interest rates, and education and patient finance loans are issued with fixed or variable rates, depending on the type of loan. If interest rates continue to rise, investors who have already committed capital may lose the opportunity to take advantage of the higher rates, or may seek to invest capital in alternative investments. Additionally, potential borrowers could seek to defer loans as they wait for interest rates to settle, and borrowers of variable rate loans may be subject to increased interest rates. If interest rates decrease after a loan is made, borrowers through our marketplace may prepay their loans to take advantage of the lower rates. Investors through our marketplace would lose the opportunity to collect the above-market interest rate payable on the corresponding loan and may delay or reduce future loan investments. As a result, fluctuations in the interest rate environment may discourage investors and borrowers from participating in our marketplace and may reduce our loan originations, which may adversely affect our business.
From time to time we may evaluate and potentially consummate acquisitions, which could require significant management attention, disrupt our business and adversely affect our financial results.
We may evaluate and consider strategic transactions, combinations, acquisitions or alliances to enhance our existing business or develop new loan products and services. These transactions could be material to our financial condition and results of operations if consummated. If we are able to identify an appropriate business opportunity, we may not be able to successfully consummate the transaction and, even if we do consummate such a transaction, we may be unable to obtain the benefits or avoid the difficulties and risks of such transaction.
Any acquisition will incur significantly increasedinvolve risks commonly encountered in business relationships, including:
difficulties in assimilating and integrating the operations, personnel, systems, data, technologies, products and services of the acquired business;
inability of the acquired technologies, products or businesses to achieve expected levels of revenue, profitability, productivity or other benefits;
difficulties in retaining, training, motivating and integrating key personnel;
diversion of management’s time and resources from our normal daily operations;
difficulties in successfully incorporating licensed or acquired technology and rights into our platform;
difficulties in maintaining uniform standards, controls, procedures and policies within the combined organizations;
difficulties in retaining relationships with customers, employees and suppliers of the acquired business;
risks of entering markets in which we have no or limited direct prior experience;
regulatory risks, including remaining in good standing with existing regulatory bodies or receiving any necessary pre-closing or post-closing approvals, as well as being subject to new regulators with oversight over an acquired business;
assumption of contractual obligations that contain terms that are not beneficial to us, require us to license or waive intellectual property rights or increase our risk for liability;
failure to successfully further develop the acquired technology;
liability for activities of the acquired business before the acquisition, including patent and trademark infringement claims, violations of laws, regulatory actions, commercial disputes, tax liabilities and other known and unknown liabilities;
assumption of exposure to performance of any acquired loan portfolios;
potential disruptions to our ongoing businesses; and
unexpected costs and devoteunknown risks and liabilities associated with the acquisition.
We may not make any acquisitions, or any future acquisitions may not be successful, may not benefit our business strategy, may not generate sufficient revenue to offset the associated acquisition costs or may not otherwise result in the intended benefits. In addition, we cannot assure you that any future acquisition of new businesses or technology will lead to the successful development of new or enhanced loan products and services or that any new or enhanced loan products and services, if developed, will achieve market acceptance or prove to be profitable.
Fraudulent activity associated with our marketplace could negatively impact our operating results, brand and reputation and cause the use of our loan products and services to decrease and our fraud losses to increase.
We are subject to the risk of fraudulent activity associated with our marketplace, issuing banks, borrowers, investors and third parties handling borrower and investor information. We have taken measures to detect and reduce the risk of fraud, but these measures need to be continually improved and may not be effective against new and continually evolving forms of fraud or in connection with new product offerings. Under our agreements with investors, we are obligated to repurchase loans in cases of confirmed identity theft. The level of our fraud charge-offs and results of operations could be materially adversely affected if fraudulent activity were to significantly increase. High profile fraudulent activity or significant increases in fraudulent activity could lead to regulatory intervention, negatively impact our operating results, brand and reputation and lead us to take steps to reduce fraud risk, which could increase our costs.
Misconduct and errors by our employees and third-party service providers could harm our business and reputation.
We are exposed to many types of operational risk, including the risk of misconduct and errors by our employees, such as the change to application dates for $3.0 million in loans as described in “Part II – Item 7 – Management’s Discussion and Analysis of Financial Condition and Results of Operations –Board Review,” and other third-party service providers. Our business depends on our employees and third-party service providers to process a large number of increasingly complex transactions, and if any of our employees or third-party service providers take,
convert or misuse funds, documents or data or fail to follow protocol when interacting with borrowers and investors, we could be liable for damages, be subject to repurchase obligations and subject to regulatory actions and penalties.
We could also be perceived to have facilitated or participated in the illegal misappropriation of funds, documents or data, or the failure to follow protocol, and therefore be subject to civil or criminal liability. Because our subsidiary, LCA, is the general partner or investment manager for a series of private funds, we could be perceived as having a conflict of interest regarding access to loans versus other platform investors. We believe that we have controls and processes in place to mitigate any potential conflicts of interest.
Any of these occurrences could result in our diminished ability to operate our business, potential liability to borrowers and investors, inability to attract future borrowers and investors, reputational damage, regulatory intervention and financial harm, which could negatively impact our business, financial condition and results of operations.
If we fail to attract and retain our highly skilled employees needed to support our business, we may not be able to achieve our anticipated level of growth and our business could suffer.
We believe our success depends on the efforts and talents of our employees, including software engineers, financial personnel and marketing professionals. Our future success depends on our continued ability to attract, develop, motivate and retain highly qualified and skilled employees. Competition for highly skilled technical and financial personnel, particularly in the San Francisco Bay Area, is extremely intense. We may not be able to hire and retain these personnel at compensation levels consistent with our existing compensation and salary structure. Many of the companies with which we compete for experienced employees have greater resources than we have and may be able to offer more attractive terms of employment.
We experienced a number of changes in senior management during 2016, including the resignation of our former CEO and termination of certain senior managers. Further, in June 2016 we implemented a reduction in workforce and we experienced higher than usual attrition in the months since the reduction in workforce.
With any change in leadership and reduction in workforce, there is a risk to retention of employees, including other members of senior management, as well as the potential for disruption to business operations, initiatives, plans and strategies. In light of the circumstances surrounding these employee actions, we offered significant additional compensation to retain certain employees. The general structure of the special retention awards provided for compensation awards to be paid or vested no later than the first half of 2017. Following the final payments on these awards, we cannot predict whether we ultimately will be able to retain these or other employees in the future, or whether we will have to incur substantial additional cost to do so.
In addition to attracting and retaining highly skilled employees in general, our future performance depends, in part, on our ability to attract and retain key personnel, including our executive officers, senior management team and other key personnel, all of whom would be difficult to replace. The loss of the services of our executive officers or members of our senior management team, and the process to replace any of them, would involve significant time and expense and distraction that may significantly delay or prevent the achievement of our business objectives or impair our operations or results.
In addition, in light of these recent events and their potential overall effect on our business and stock price, key executive officers or senior management may opt to depart the company to pursue other opportunities, which could significantly delay or prevent the achievement of our business objectives or impair our operations or results.
Our credit facility provides our lenders with a first-priority lien against substantially all of our assets and contains certain affirmative and negative covenants and other restrictions on our actions, and it could therefore limit our operational flexibility or otherwise adversely affect our financial condition.
We have a senior secured revolving credit facility of $120.0 million, which the Company may draw upon from time to time. As of December 31, 2016, we had not drawn on the credit facility. The loan agreements for our credit facility contain restrictions on our ability to, among other things, pay dividends, incur indebtedness, place liens on assets, merge or consolidate, make investments, and enter into certain affiliate transactions. In addition, we are required to maintain a maximum total net leverage ratio (as defined in the credit agreement) of 4.00:1.00 initially, and decreasing over the term of the credit facility to 3.00:1.00 on and after June 30, 2018.
In addition, any debt financing we secure in the future, in addition to or in lieu of our credit facility, could involve restrictive covenants relating to our capital raising activities and other financial and operational matters, which may make it more difficult for us to obtain additional capital and to pursue business opportunities, including potential acquisitions. If we are unable to obtain adequate financing or financing on terms satisfactory to us when we require it, our ability to continue to support our business growth and to respond to business challenges could be impaired, and our business may be harmed.
If we fail to perform under the loan agreement by, for example, failing to make timely payments or failing to comply with the required total leverage ratio, our operations and financial condition could be adversely affected. For more information regarding the covenants and requirements, see “Item 8 – Financial Statements and Supplementary Data – Notes to Consolidated Financial Statements – 12. Debt”included in this Annual Report on Form 10-K.
We previously identified a material weakness in our internal control over financial reporting, which has now been remediated. Any future failure to establish and maintain effective internal control over financial reporting could result in material misstatements in our financial statements.
During the second quarter of 2016, we identified a material weakness in our internal control over financial reporting. A material weakness is a deficiency, or a combination of deficiencies, in internal control over financial reporting such that there is a reasonable possibility that a material misstatement of the Company’s annual or interim consolidated financial statements will not be prevented or detected on a timely basis. The material weakness related to the aggregation of control deficiencies in the Company's “tone at the top” and manifested in three primary areas: (i) appropriate system controls, or review and oversight by other personnel, to detect and prevent sales of loans in direct contravention of a loan agreement, (ii) failure to identify related party transactions so as to ensure proper review and approval or disapproval by the Audit Committee or the board, and (iii) failure to appropriately document, authorize, communicate and monitor amendments to investor contracts.
While this material weakness has been remediated, we cannot assure you that we have identified all of our existing material weaknesses, or that we will not in the future have additional material weaknesses.
More generally, if we are unable to meet the demands that have been placed upon us as a public company, including the requirements of the Sarbanes-Oxley Act, we may be unable to accurately report our financial results in future periods, or report them within the timeframes required by law or stock exchange regulations. Failure to comply with the Sarbanes-Oxley Act, when and as applicable, could also potentially subject us to sanctions or investigations by the SEC or other regulatory authorities. Under such circumstances, we may be unable to implement the necessary internal controls in a timely manner, or at all, and future material weaknesses may exist or may be discovered. If we fail to implement the necessary improvements, or if material weaknesses or other deficiencies occur, our ability to accurately and timely report our financial position could be impaired, which could result in late filings of our annual and quarterly reports under the Exchange Act, restatements of our consolidated financial statements, a decline in our stock price, suspension or delisting of our common stock from the NYSE and could have a material adverse effect on our business, results of operations or financial condition. Even if we are able to report our financial statements accurately and in a timely manner, any failure in our efforts to implement the improvements or disclosure of
material weaknesses in our future filings with the SEC could cause our reputation to be harmed and our stock price to decline significantly.
Our quarterly results may fluctuate significantly and may not fully reflect the underlying performance of our business.
Our operating and financial results have varied on a quarterly basis during our operating history and may continue to fluctuate significantly as a result of a variety of factors, including as a result of the
listingrisks set forth in this “Risk Factors” section. It is difficult for us to forecast the level or source of our revenues or earnings (loss) accurately. Accordingly, our quarterly results of operations, including the levels of our operating revenue and expenses, contribution margin and other key metrics, may vary significantly in the future and period-to-period comparisons of our operating results may not be meaningful. Fluctuation in quarterly results may adversely affect the price of our common stock.
Although
Our ability to use our deferred tax assets to offset future taxable income may be subject to certain limitations that could subject our business to higher tax liabilities.
We may be limited in the portion of net operating loss carryforwards that we
have been a reporting companycan use in the future to offset taxable income for U.S. federal and state income tax purposes. At December 31, 2016, we had federal and state net operating loss carryforwards (NOLs) of approximately $260.3 million and $178.0 million, respectively, to offset future taxable income. These federal and state net operating loss carryforwards will begin expiring in 2025 and 2028, respectively. A lack of future taxable income would adversely affect our ability to utilize these NOLs. In addition, under
Section 382 of the
Securities Exchange ActInternal Revenue Code of
1934,1986, as amended
(“Exchange Act”)(Code),
since 2008, we will incur additional legal, accounting and other expensesa corporation that
we did not incur as a private reporting company. For example, we are required to comply with additional requirements of the rules and regulations of the SEC and requirements of the New York Stock Exchange, including applicable corporate governance practices. We expect that compliance with these requirements will increase our legal and financial compliance costs and will make some activities more time consuming and costly. In addition, we expect that our management and other personnel will need to divert attention from operational and other business matters to devote substantial time to these public company requirements. We cannot predict or estimate the amount of additional costs we may incur as a result of becoming a public company or the timing of such costs.In addition, changing laws, regulations and standards relating to corporate governance and public disclosure are creating uncertainty for public companies, increasing legal and financial compliance costs and making some activities more time-consuming. These laws, regulations and standards areundergoes an “ownership change” is subject to varying interpretations,limitations on its ability to utilize its NOLs to offset future taxable income. Future changes in many cases due to their lackour stock ownership as well as other changes that may be outside of specificity, and, as a result, their application in practice may evolve over time as new guidance is provided by regulatory and governing bodies. Thisour control, could result in continuing uncertainty regarding compliance mattersadditional ownership changes under Section 382 of the Code. Our NOLs may also be impaired under similar provisions of state law. Additionally, at December 31, 2016, we had federal and higher costs necessitated by ongoing revisionsstate research and development tax credit carryforwards of $1.1 million and $3.0 million, respectively. We assess the available positive and negative evidence to disclosure and governance practices. We intendestimate if sufficient future taxable income will be generated to invest resourcesutilize the existing deferred tax assets. On the basis of this evaluation, a full valuation allowance has historically been recorded to comply with evolving laws, regulations and standards, and this investment may result in increased general and administrative expenses and a diversion of management’s time and attention from revenue-generating activitiesrecognize only deferred tax assets that are more likely than not to compliance activities. If our effortsbe realized. Finally, changes to comply with new laws, regulations and standards differ from the activities intended by regulatory or governing bodies due to ambiguities related to their application and practice, regulatory authorities may initiate legal proceedings against us and our business may be adversely affected.
Our ability to offer our notes depends upon our compliance with requirements under federal or state securities laws.
All notes publicly offered throughtax laws that would reduce the corporate tax rate could operate to effectively reduce or eliminate the value of any deferred tax asset. Our deferred tax assets may expire unutilized or underutilized, which could prevent us from offsetting future taxable income.
We have incurred net losses in the past and may incur net losses in the future.
As of December 31, 2016, our
accumulated deficit was $234.2 million. We anticipate that our operating expenses will continue to be elevated for the foreseeable future as we continue to enhance our compliance systems, reestablish the growth of our business, attract borrowers, investors and partners and further enhance and develop our loan products, marketplace
are offered and
sold pursuantplatform. These efforts may prove more expensive than we currently anticipate, and we may not succeed in increasing our revenue sufficiently to
a registration statement filed with the SEC. We also qualify as a “well-known seasoned issuer,” which allows us to file automatically effective registration statements with the SEC. Under SEC rules, for certain material updates, we must file post-effective amendments, which, if we do not qualify as a “well-known seasoned issuer,” do not become effective until declared effective by the SEC.offset these higher expenses. We may
fail toincur additional net losses in the future and may not maintain
our “well-known seasoned issuer” status if we do not file SEC reportsprofitability on a
timely mannerquarterly or
for other reasons. In addition, if we fail to file our Annual Reports on Form 10-K or quarterly reports on Form 10-Q on a timely basis or are otherwise required to suspend use of a registration statement for the notes, we could be required to suspend offering of our notes until the deficiency is resolved. Because we offer notes on a continuous basis, securities law restrictions may also limit our ability to market or advertise to potential investors.We are also currently required to register or qualify for an exemption in every state in which we offer securities. Qualification in a state can be a time-consuming process, often requiring periodic renewals. Failure to timely renew these registrations may require us to pay penalties, suspend further offerings until we regain compliance and make rescission offers in connection with previously completed investments.
Certain states in which we offer notes also impose special suitability standards and other conditions for operation in their states, restricting the persons and conditions under which we may make offerings in these states. We do not offer our notes in all states due to the restrictions of certain states. While we believe that following the completion of our initial public offering (IPO) we may now rely on federal preemption of state registration and qualification requirements, states may interpret federal law as applied to our notes differently, possibly requiring us to continue to make filings in or limit operations in those states. Regardless of any such registration, qualification or preemption, we are subject to both state and federal antifraud rules of each state in which we operate.
As a result of these requirements, actual or alleged non-compliance with federal or state laws or changes in federal or state law or regulatory policy or could limit our ability to offer notes in certain states, require us to pay fines or penalties, or curtail our operations.
annual basis.
We may have to constrain our business activities to avoid being deemed an investment company under the Investment Company Act of 1940.
In general, a company that is or holds itself out as being engaged primarily in the business of investing, reinvesting or trading in securities may be deemed to be an investment company under the Investment Company Act of 1940, as amended (“Investment(Investment Company Act”)Act). The Investment Company Act contains substantive legal requirements that regulate the manner in which “investment companies” are permitted to conduct their business activities. We believe we have conducted, and we intend to continue to conduct, our business in a manner that does not result in our company being characterized as an investment company. To avoid being deemed an investment company, we may
decide not
be able to broaden our offerings, which could require us to forego attractive opportunities. We may also apply for formal exemptive relief to provide additional clarity on our status under the Investment Company Act. We may not receive such relief on a timely basis, if at all, and such relief may require us to modify or curtail our operations. If we are deemed to be an investment company under the Investment Company Act, we may be required to institute burdensome compliance requirements and our activities may be restricted, which would materially adversely affect our business, financial condition and results of operations.
If our registered investment advisor, LC Advisors, LLC
(LCA), were found to have violated the Investment Advisers Act, our ability to raise sufficient investor commitments to meet borrower demand could be impaired.
Our subsidiary, LCA, acts as an advisor to certain private funds and accredited investors, including those that invest in managed accounts that rely on a third-party adviser or manager to manage their investment through our marketplace. Registered investment advisers are subject to a number of regulatory and legal requirements, including fiduciary duties, conflicts of interest, advertising restrictions and custody requirements.
As described in “Part II – Item 7 – Management’s Discussion and Analysis of Financial Condition and Results of Operations – Board Review,” and previously disclosed, the board review discovered that the investment parameters of one of the funds advised by LCA, specifically with respect to the allocation of 60-month loans held by the fund, was out of tolerance. Further, we reviewed the methodologies used to determine the net asset values and monthly return figures reported for six private investment funds managed by LCA and determined that adjustments were made to the valuation of the Fund’s assets that were not consistent with generally accepted accounting principles (GAAP). These adjustments affected the direction and the specific returns reported in monthly statements sent to limited partners. We are reimbursing limited partners who, during the life of any fund, entered or exited the funds and were adversely impacted by these adjustments. As previously disclosed, these matters were included in the board review of 2016, and such matters are being reviewed by the SEC and other state and federal regulatory agencies.
We believe we have conducted, and we intend to continue to conduct, the business of LCA in substantial compliance with the Investment Advisers Act of 1940, as amended
(“Investment(Investment Advisers
Act”)Act) and applicable fiduciary duties. If, however, we are deemed to have breached any of our obligations under the Investment Advisers Act, the activities of LCA could be restricted, suspended or even terminated. If this were to occur, our ability to provide investors with the opportunity to invest through
private funds and managed accounts could be severely curtailed, and we may not be able to sufficiently meet borrower and investor demand for loans, which could harm our business.
If we were required to register as a broker-dealer under federal or state law, our costs could significantly increase or our operations could be impaired.
The securities offered to investors are offered directly by us. We do not operate as a registered broker-dealer in any jurisdiction. Although we do not believe we are obligated to do so, if a regulatory body were to find that our activities require us to register as a broker-dealer or to sell the investment securities only through a registered broker-dealer, we could be subject to fines, rescission offers or other penalties, and our compliance costs and other costs of operation could increase significantly. Further, our ability to issue and distribute the securities could be significantly impaired or curtailed.
Because we may have issued stock options and underlying shares of common stock in violation of federal and state securities laws, we may be required to offer to repurchase those securities and incur other costs.
We have been a reporting company under the Exchange Act since October 2008. As a result, subsequent to that time, we were no longer entitled to rely on the exemption provided under Rule 701 under the Securities Act of 1933, as amended (Securities Act), and other exemptions from state securities laws for grants of certain equity awards to, and exercises of such awards by, some of our employees, directors and consultants. Therefore, it is possible that some current or former employees, directors and consultants could assert that the options and issuance of shares prior to filing our Form S-8 in July 2014 may have violated U.S. federal and state securities laws, and that such persons could have the right to require us to repurchase those securities.
In connection with such issuances of options and shares, we were recently required by the California Department of Business Oversight (“Department”) to undertake a rescission offer in accordance with applicable California securities laws to (i) grantees of options to purchase shares of common stock and (ii) to stockholders who acquired their shares of common stock upon exercise of stock options, each during the past two years. We will register this rescission offer on a separate registration statement on Form S-1. Eligible participants in this rescission offer might not accept our offer. The weighted average option exercise price for eligible option grants in respect of 39,480,568 shares was $3.68 per share, and the weighted average purchase price for sales of 3,593,295 shares was $0.79 per share. As it is unclear if a rescission offer under federal securities laws will terminate a purchaser’s right to rescind a transaction that was not registered or exempt from such registration requirements, we may be required to honor such rescission rights in future periods. Our aggregate liability may be up to $31.9 million. We believe that any remedies a person might have after the rescission offer expires would not be greater than the amount that person would have received in the rescission offer.
We have not reviewed our compliance with foreign laws regarding the participation of non-U.S. residents on our marketplace.
From time to time, non-U.S. residents invest in loans directly through our marketplace. Through December 31,
2014,2016, the percentage of notes purchased (based upon dollar amounts) by such persons since inception was less than
2%1% of all loans issued. We are not experts with respect to all applicable laws in the various foreign jurisdictions
from which an investor may be located, and we cannot be sure that we are complying with applicable foreign laws. Failure to comply with such laws could result in fines and penalties payable by us, which could reduce our profitability or cause us to modify or delay planned expansions and expenditures, including investments in our growth. In addition, any such fines and penalties could create negative publicity, result in additional regulatory oversight that could limit our operations and ability to succeed, or otherwise hinder our plans to expand our business internationally.
Recent legislative
If we were required to register as a broker-dealer under federal or state law, our costs could significantly increase or our operations could be impaired.
The securities offered to investors are offered directly by us. We do not operate as a registered broker-dealer in any jurisdiction. Although we do not believe we are obligated to do so, if a regulatory body were to find that our
activities require us to register as a broker-dealer or to sell the investment securities only through a registered broker-dealer, we could be subject to fines, rescission offers or other penalties, and our compliance costs and other costs of operation could increase significantly. Further, our ability to issue and distribute the securities could be significantly impaired or curtailed.
We and our issuing bank partners are subject to borrower protection laws and federal and state consumer protection laws.
We and our issuing bank partners must comply with regulatory regimes, including those applicable to consumer credit transactions, various aspects of which are untested as applied to our marketplace. Certain state laws generally regulate interest rates and other charges and require certain disclosures. In addition, other federal and state laws may apply to the origination and servicing of loans facilitated through our marketplace. In particular, through our marketplace, we may be subject to laws, such as:
state laws and regulations that impose requirements related to loan disclosures and terms, credit discrimination, credit reporting, debt servicing and collection and unfair or deceptive business practices;
the Truth-in-Lending Act and Regulation Z promulgated thereunder, and similar state laws, which require certain disclosures to borrowers regarding the terms and conditions of their loans and credit transactions;
Section 5 of the Federal Trade Commission Act, which prohibits unfair and deceptive acts or practices in or affecting commerce, and Section 1031 of the Dodd-Frank Wall Street Reform and Consumer Protection Act, which prohibits unfair, deceptive or abusive acts or practices in connection with any consumer financial product or service;
the Equal Credit Opportunity Act and Regulation B promulgated thereunder, which prohibit creditors from discriminating against credit applicants on the basis of race, color, sex, age, religion, national origin, marital status, the fact that all or part of the applicant’s income derives from any public assistance program or the fact that the applicant has in good faith exercised any right under the federal Consumer Credit Protection Act or any applicable state law;
the Fair Credit Reporting Act, as amended by the Fair and Accurate Credit Transactions Act, which promotes the accuracy, fairness and privacy of information in the files of consumer reporting agencies;
the Fair Debt Collection Practices Act and similar state debt collection laws, which provide guidelines and limitations on the conduct of third-party debt collectors in connection with the collection of consumer debts;
the Gramm-Leach-Bliley Act, which includes limitations on financial institutions’ disclosure of nonpublic personal information about a consumer to nonaffiliated third parties, in certain circumstances requires financial institutions to limit the use and further disclosure of nonpublic personal information by nonaffiliated third parties to whom they disclose such information and requires financial institutions to disclose certain privacy policies and practices with respect to information sharing with affiliated and nonaffiliated entities as well as to safeguard personal customer information, and other privacy laws and regulations;
the Bankruptcy Code, which limits the extent to which creditors may seek to enforce debts against parties who have filed for bankruptcy protection;
the Servicemembers Civil Relief Act, which allows military members to suspend or postpone certain civil obligations so that the military member can devote his or her full attention to military duties;
the Electronic Fund Transfer Act and Regulation E promulgated thereunder, which provide disclosure requirements, guidelines and restrictions on the electronic transfer of funds from consumers’ bank accounts;
the Electronic Signatures in Global and National Commerce Act and similar state laws, particularly the Uniform Electronic Transactions Act, which authorize the creation of legally binding and enforceable agreements utilizing electronic records and signatures; and
the Bank Secrecy Act, which relates to compliance with anti-money laundering, customer due diligence and record-keeping policies and procedures.
While we have developed policies and procedures designed to assist in compliance with these laws and regulations, no assurance can be given that these policies and procedures will be effective in preventing violations of these laws and regulations.
In particular, the USA PATRIOT and Bank Secrecy Acts require financial institutions to develop programs to prevent financial institutions from being used for money laundering and terrorist activities. If such activities are detected, financial institutions are obligated to file suspicious activity reports with FinCEN. These rules require financial institutions to establish procedures for identifying and verifying the identity of customers seeking to open new financial accounts. Failure to comply with these regulations could result in fines or sanctions and limit our ability to get regulatory approval of acquisitions. Recently several banking institutions have received large fines for non-compliance with these laws and regulations.
Failure to comply with these laws and regulatory initiativesrequirements applicable to our business may, among other things, limit our or a collection agency’s ability to collect all or part of the principal of or interest on loans. As a result, we may not be able to collect our servicing fee with respect to the uncollected principal or interest, and investors may be discouraged from investing in loans. In addition, non-compliance could subject us to damages, revocation of required licenses, class action lawsuits, administrative enforcement actions, rescission rights held by investors in securities offerings and civil and criminal liability, which may harm our business and our ability to maintain our marketplace and may result in borrowers rescinding their loans.
Where applicable, we will seek to comply with state small loan, loan broker, servicing and similar statutes. In U.S. jurisdictions with licensing or other requirements that we believe may be applicable to us, we comply with the relevant requirements through the operation of our marketplace with issuing banks or we will be seeking to obtain required licenses. Nevertheless, if we are found to not have
imposed restrictions and requirements on financial institutions thatcomplied with applicable laws, we could
lose one or more of our licenses or authorizations or face other sanctions or penalties or be required to obtain a license in such jurisdiction, which may have an adverse effect on our
business.The Dodd-Frank Act and other legislation and regulations relatingability to financial institutions and markets, including alternative asset management funds, has resulted in increased oversight and taxation. There has been, and may continue to be, a related increasefacilitate loans through our marketplace, perform our servicing obligations or make our marketplace available to borrowers in regulatory investigations of the trading and other investment activities of alternative investment funds. Such investigations may impose additional expenses by us, may require the attention of senior management and may result in fines if any of our funds are deemed to have violated any regulations.
The Dodd-Frank Act is extensive and significant legislation enacting changes that broadly affect most aspects of the financial services industry. The Dodd-Frank Act, among other things:
created a liquidation framework under which the FDIC may be appointed as receiver following a “systemic risk determination” by the Secretary of Treasury (in consultation with the President) for the resolution of certain nonbank financial companies and other entities, defined as “covered financial companies,” and commonly referred to as “systemically important entities,” in the event such a company is in default or in danger of default and the resolution of such a company under other applicable law would have serious adverse effects on financial stability in the United States, and also for the resolution of certain of their subsidiaries;
strengthened the regulatory oversight of securities and capital markets activities by the SEC; and
increased regulation of the securitization markets through, among other things, a mandated risk retention requirement for securitizers, which, if applied to our business, would change our business model, and a direction to the SEC to regulate credit rating agencies and adopt regulations governing these organizations and their activities.
With respect to the new liquidation framework for systemically important entities, we cannot assure you that such framework would not apply to us. Guidance from the FDIC indicates that such new framework will largely be exercised in a manner consistent with the existing bankruptcy laws, which is the insolvency regime that would otherwise apply to us. The SEC has proposed significant changes to the rules applicable to issuers and sponsors of asset-backed securities under the Securities Act and the Exchange Act. With the proposed changes, our access to the asset-backed securities capital markets could be affected and our financing programs could be less effective. Compliance with such legislation or regulation may significantly increase our costs, limit our product offerings and operating flexibility, require significant adjustments in our internal business processes and potentially require us to maintain our regulatory capital at levels above historical practices.
As the regulatory framework for our business evolves, federal and state governments may draft and propose new laws to regulate online marketplaces such as ours,particular states, which may negatively affectharm our business.
The regulatory framework for Internet commerce, including online marketplaces such as ours, is evolving, and it is possible that new laws and regulations will be adopted in the United States and internationally, or existing laws and regulations may be interpreted in new ways, that would affect the operation of our marketplace and the way in which we interact with borrowers and investors. The cost to comply with such laws or regulations could be significant and would increase our operating expenses, and we may be unable to pass those costs on to our borrowers and investors in the form of increased fees. In addition, federal and state governmental or regulatory agencies may decide to impose taxes on services provided over the Internet or by online marketplaces. These taxes could discourage the use of our marketplace, which would adversely affect the viability of our business.
Investors in the limited partnership interests offered by LCA or certificates offered by the Trust may be deemed to have been solicited by general solicitation or general advertising, and such investors could seek to rescind their purchase.
We offer notes through a public offering. In addition, the Trust
investinvests in loans through our marketplace. The Trust and LCA offer certificates and limited partnership interests, respectively, to raise capital for their investments. The offerings by the Trust and LCA are made privately with potential investors with whom they have, or have established through a review and diligence process and cooling-off period which, in our opinion, constitutes a substantive, pre-existing relationship outside of the public offering for the notes prior to an investment in the certificates or limited partnership interests and separate from the public offering of the notes. Because of
the fact-specific nature of what constitutes a substantive, pre-existing relationship and the means by which it is created, as well as what types of activities might constitute a general solicitation or general advertising with regard to the private offerings of the certificates and limited partnership interests, it is possible that some of these investors could assert that they became interested in an investment in these private offerings by LCA or the Trust through a general solicitation or general advertising with regard to those offerings or the public offering of notes. If it was determined that an investor’s interest in the certificates or limited partnership interests was the result of a general solicitation or general advertisement, all investors could claim that the sale of certificates or limited partnership interests violated Section 5 of the Securities Act and could seek to rescind their purchase or seek other remedies, subject to any applicable statute of limitations. We would contest vigorously any claim that a violation of the Securities Act occurred, however, litigation is inherently uncertain and can be expensive and time consuming.
Our ability to offer our notes depends upon our compliance with requirements under federal or state securities laws.
All notes publicly offered through our marketplace are offered and sold pursuant to a registration statement filed with the SEC. We also qualify as a “well-known seasoned issuer,” which allows us to file automatically effective registration statements with the SEC. Under SEC rules, for certain material updates, we must file post-effective
amendments, which, if we do not qualify as a “well-known seasoned issuer,” do not become effective until declared effective by the SEC. We may fail to maintain our “well-known seasoned issuer” status if we do not file SEC reports on a timely manner or for other reasons. In addition, if we fail to file our Annual Reports on Form 10-K or quarterly reports on Form 10-Q on a timely basis or are otherwise required to suspend use of a registration statement for the notes, we could be required to suspend offering of our notes until the deficiency is resolved. Because we offer notes on a continuous basis, securities law restrictions may also limit our ability to market or advertise to potential investors.
We are also currently required to register or qualify for an exemption in every state in which we offer securities. Qualification in a state can be a time-consuming process, often requiring periodic renewals. Failure to timely renew these registrations may require us to pay penalties, suspend further offerings until we regain compliance and make rescission offers in connection with previously completed investments.
Certain states in which we offer notes also impose special suitability standards and other conditions for operation in their states, restricting the persons and conditions under which we may make offerings in these states. We do not offer our notes in all states due to the restrictions of certain states. While we believe that we may now rely on federal preemption of state registration and qualification requirements, states may interpret federal law as applied to our notes differently, possibly requiring us to continue to make filings in or limit operations in those states. Regardless of any such registration, qualification or preemption, we are subject to both state and federal antifraud rules of each state in which we operate.
As a result of these requirements, actual or alleged non-compliance with federal or state laws or changes in federal or state law or regulatory policy or could limit our ability to offer notes in certain states, require us to pay fines or penalties, or curtail our operations.
Recent legislative and regulatory initiatives have imposed restrictions and requirements on financial institutions that could have an adverse effect on our business.
The Dodd-Frank Act and other legislation and regulations relating to financial institutions and markets, including alternative asset management funds, has resulted in increased oversight and taxation. However, the recent presidential and congressional elections in the United States could result in significant changes in, and uncertainty with respect to, legislation, regulation and government policy.
There has been, and may continue to be, a related increase in regulatory investigations of the trading and other investment activities of alternative investment funds. Such investigations may impose additional expenses on us, may require the attention of senior management and may result in fines if any of our funds are deemed to have violated any regulations. The Dodd-Frank Act is extensive and significant legislation enacting changes that broadly affect most aspects of the financial services industry. The Dodd-Frank Act, among other things, contains a risk retention requirement for all asset-backed securities, which, if applied to our business, would change our business model.
Under these risk retention rules, sponsors of both public and private issuances of asset-backed securities are generally (subject to certain exceptions) required to retain, in one or more prescribed forms, at least 5% of the credit risk of the assets collateralizing such asset-backed securities. In some cases, this risk retention requirement may be retained by a majority-owned affiliate (as determined by GAAP) of the sponsor. These regulations generally prohibit the sponsor or its affiliate from directly or indirectly hedging or otherwise selling or transferring the retained interest for a specified period of time, depending on the type of asset that is securitized. All sponsors of issuances of asset-backed securities are required to comply with such rules beginning in December 2015, with respect to asset-backed securities collateralized by residential mortgages, and December 2016 with regard to all other classes of asset-backed securities.
These changes could impact our access to the asset-backed securities capital markets and, to the extent we issue, or act as the sponsor for issuances of, asset-backed securities ourselves, our financing programs could be less effective
and we could be required to comply with these risk retention requirements. Compliance with such legislation or regulation may significantly increase our costs, limit our product offerings and operating flexibility, require significant adjustments in our internal business processes and potentially require us to maintain our regulatory capital at levels above historical practices.
RISKS RELATED TO OWNERSHIP OF OUR COMMON STOCK
The
Our stock price has been and will likely continue to be volatile.
As a result of the events surrounding the resignation of our former-CEO, our stock price has declined significantly since the end of the first quarter of 2016 and has exhibited substantial volatility. Recent developments notwithstanding, our stock price may fluctuate in response to a number of events and factors, such as quarterly operating results; changes in our financial projections provided to the public or our failure to meet those projections; changes in the credit performance on our platform; the public's reaction to our press releases, other public announcements and filings with the SEC; significant transactions, or new features, products or services by us or our competitors; changes in financial estimates and recommendations by securities analysts; media coverage of our business and financial performance; the operating and stock price performance of, or other developments involving, other companies that investors may deem comparable to us; trends in our industry; any significant change in our management; and general economic conditions.
In addition, the stock market in general, and the market prices for companies in our industry, have experienced volatility that often has been unrelated to operating performance. These broad market and industry fluctuations may adversely affect the price of our stock, regardless of our operating performance. Price volatility over a given period may cause the average price at which we repurchase our own stock to exceed the stock’s price at a given point in time. Volatility in our stock price also impacts the value of our equity compensation, which affects our ability to recruit and retain employees. In addition, some companies that have experienced volatility in the market price of our commontheir stock hashave been subject to securities class action litigation. We have been the target of this type of litigation and may continue to be volatilea target in the future. Securities litigation against us could result in substantial costs and divert our management’s attention from other business concerns, which could harm our business.
If we fail to meet expectations related to future growth, profitability, or
other market expectations, our stock price may decline
regardless of our operating performance.The market price of our common stock may fluctuate significantly, in response to numerous factors, many of which are beyond our control. In addition to the factors discussed inItem 1A – Risk Factors and elsewhere in the Report, factors that could cause fluctuations in the market price of our common stock include the following:
overall performance of the equity markets;
our operating performance and the performance of other similar companies;
changes in the estimates of our operating results that we provide to the public, our failure to meet these projections or changes in recommendations by securities analysts that elect to follow our common stock;
regulatory developments;
announcements of innovations, new loan products or acquisitions, strategic alliances or significant agreements by our competitors;
disruptions in our platform due to computer hardware, software or network problems;
recruitment or departure of key personnel;
the economy as a whole or market conditions in our industry;
trading activity by stockholders who beneficially own large amounts of our outstanding common stock;
the expiration of market standoff or contractual lock-up agreements; and
the size of our market float.
In the past, stockholders have filed securities class action litigation following periods of market volatility. If we were to become involved in securities litigation, it could subject us to substantial costs, divert resources and the attention of management from our business and adversely affect our business.
Substantial blocks of our total outstanding shares may be sold into the market when “lock-up” or “market standoff” periods end. If there are substantial sales of shares of our common stock, the price of our common stock could decline.
The price of our common stock could decline if there are substantial sales of our common stock, particularly sales by our directors, executive officers and significant stockholders, or if there is a large number of shares of our common stock available for sale. In connection with our initial public offering, all of our security holders entered into market standoff agreements with us restricting the sale of any shares of our common stock or entered into lock-up agreements with the underwriters under which they have agreed, subject to certain exceptions, not to sell any shares of our common stock until June 10, 2015. Beginning on that date, subject to extension under certain circumstances, approximately 303 million shares of our common stock will become eligible for sale in the public market pursuant to Rule 144 or as a registered security, of which approximately 193 million shares will be held by affiliates and subject to the volume and other restrictions of Rule 144.
Shares held by directors, executive officers and other affiliates are subject to volume limitations under Rule 144 under the Securities Act. Our underwriter, Morgan Stanley & Co. LLC may, in its discretion, permit our stockholders to sell shares prior to the expiration of the restrictive provisions contained in these lock-up agreements.
Certain of our stockholders have rights, subject to some conditions, to require us to file registration statements covering their shares that we may file for ourselves or our stockholders. All of these shares are subject to market standoff or lock-up agreements restricting their sale until June 10, 2015. In addition, shares issued or issuable upon exercise of options or warrants vested as of the expiration of the lock-up agreements will be eligible for sale at that time.
The price of our common stock could decline as a result of sales of common stock in the public market at the termination of market standoff or lock-up agreements, or the perception in the market that the holders of a large number of shares intend to sell their shares.
We may invest or spend the net proceeds to us from our initial public offering in ways with which you may not agree or in ways which may not yield a return or increase the price of our common stock.
We intend to use the net proceeds to us from our initial public offering for general corporate purposes, including working capital, operating expenses and capital expenditures. We have used a portion of the net proceeds to us to repay indebtedness outstanding under our term loan. Additionally, we may use a portion of the net proceeds to us to acquire businesses, products, services or assets. We do not, however, have agreements or commitments for any acquisitions at this time. Our management will have discretion in the application of the net proceeds to us from our initial public offering. Until the net proceeds to us are used, they may be placed in investments that do not yield a favorable return.
Our directors, executive officers and principal stockholders have substantial control over us and could delay or prevent a change in corporate control.
As of December 31, 2014, our directors, executive officers and holders of more than 5% of our common stock, together with their affiliates, beneficially own, in the aggregate, 52.9% of our outstanding common stock. These stockholders, acting together, have the ability to control the outcome of matters submitted to our stockholders for approval, including the election of directors and any merger, consolidation or sale of all or substantially all of our assets. In addition, these stockholders, acting together, have the ability to control the management and affairs of our company.
We may require additional capital to support business growth, and this capital might not be available on acceptable terms, if at all.
We intend to continue to make investments to support our business growth and may require additional funds to respond to business challenges, including the need to develop new loan products or enhance our marketplace, improve our operating infrastructure or acquire complementary businesses and technologies. Accordingly, we may need to engage in equity or debt financings to secure additional funds. If we raise additional funds through future issuances of equity or convertible debt securities, our existing stockholders could suffer significant dilution, and any new equity securities we issue could have rights, preferencesa material adverse impact on investor confidence and privileges superior to those of our common stock. Any debt financing we secureemployee retention. A sustained decline in the future could involve restrictive covenants relating to our capital raising activities and other financial and operational matters, which may make it more difficult for us to obtain additional capital and to pursue business opportunities, including potential acquisitions. If we are unable to obtain adequate financing or financing on terms satisfactory to us when we require it, our ability to continue to support our business growth and to respond to business challenges could be impaired and our business may be harmed.
We do not intend to pay dividends for the foreseeable future.
We have never declared or paid cash or other dividends on our capital stock. We currently intend to retain any future earnings to finance the operation and expansion of our business, and we do not expect to declare or pay any dividends for the foreseeable future.
Anti-takeover provisions in our charter documents and Delaware law may delay or prevent an acquisition of our company.
Our restated certificate of incorporation and restated bylaws, contain provisions that may have the effect of delaying or preventing a change in control of us or changes in our management. The provisions, among other things:
establish a classified board of directors so that not all members of our board of directors are elected at one time;
permit only our board of directors to establish the number of directors and fill vacancies on the board;
provide that directors may only be removed “for cause” and only with the approval of two-thirds of our stockholders;
require two-thirds vote to amend some provisions in our restated certificate of incorporation and restated bylaws;
authorize the issuance of “blank check” preferred stock that our board of directors could use to implement a stockholder rights plan (also known as a “poison pill”);
eliminate the ability of our stockholders to call special meetings of stockholders;
prohibit stockholder action by written consent, which will require that all stockholder actions must be taken at a stockholder meeting;
do not provide for cumulative voting; and
establish advance notice requirements for nominations for election to our board of directors or for proposing matters that can be acted upon by stockholders at annual stockholder meetings.
These provisions, alone or together, could delay or prevent hostile takeovers and changes in control or changes in our management.
In addition, because we are incorporated in Delaware, we are governed by the provisions of Section 203 of the Delaware General Corporation Law, which limits the ability of stockholders owning in excess of 15% of our outstanding voting stock to merge or combine with us in certain circumstances.
Any provision of our restated certificate of incorporation or restated bylaws, as we expect they will be in effect upon the completion of this offering, or Delaware law that has the effect of delaying or deterring a change in control could limit the opportunity for our stockholders to receive a premium for their shares of our common stock, and could also affect the price that some investors are willing to pay for our common stock.
If securities or industry analysts publish negative reports about our business, our share price and trading volume could decline, or if they change their recommendations regarding our stock adversely, our stock price and trading volumemarket capitalization could decline.
The trading market for our common stock depends,lead to some extent, on the research and reports that securities or industry analysts publish about us or our business. We do not have any control over these analysts. If one or more of the analysts who may in the future cover us downgrade our shares or change their opinion of our shares, our share price would likely decline. If one or more of these analysts cease coverage of us or fail to regularly publish reports on us, we could lose visibility in the financial markets, which could cause our share price or trading volume to decline.
impairment charges.
If we were to become subject to a bankruptcy or similar proceeding, the right of payment of investors in our notes may be senior to the right of payment of our stockholders and there may not be value recoverable by our stockholders.
Under the terms of the notes offered through our marketplace, we are obligated to pay principal and interest on each note on a non-recourse basis only if and to the extent that we receive principal, interest or late fee payments from the borrower on the corresponding loan, but the notes become fully recourse to us if we fail to pay such obligation, which would include being prohibited from making such payments as a result of a bankruptcy or similar proceeding, or if we breach a covenant under the indenture governing the notes. In a bankruptcy or similar proceeding due to a default under current or future indebtedness, an action for repurchase or rescission of securities or other event, there is uncertainty regarding whether a holder of a note has any right of payment from our assets other than the corresponding loan. It is possible that a note holder could be deemed to have a right of payment from both the corresponding loan and from some or all of our other assets, in which case the note holder would have a claim to the proceeds of our assets that is senior to any right of payment of the holders of our common stock, regardless of whether we have received any payments from the underlying borrower, making it highly unlikely that there would be any value recoverable by our stockholders.
Anti-takeover provisions in our charter documents and Delaware law may delay or prevent an acquisition of our company.
Our restated certificate of incorporation and restated bylaws, contain provisions that can have the effect of delaying or preventing a change in control of us or changes in our management. The provisions, among other things:
establish a classified board of directors so that not all members of our board of directors are elected at one time;
permit only our board of directors to establish the number of directors and fill vacancies on the board;
provide that directors may only be removed “for cause” and only with the approval of two-thirds of our stockholders;
require two-thirds vote to amend some provisions in our restated certificate of incorporation and restated bylaws;
authorize the issuance of “blank check” preferred stock that our board of directors could use to implement a stockholder rights plan (also known as a “poison pill”);
eliminate the ability of our stockholders to call special meetings of stockholders;
prohibit stockholder action by written consent, which will require that all stockholder actions must be taken at a stockholder meeting;
do not provide for cumulative voting; and
establish advance notice requirements for nominations for election to our board of directors or for proposing matters that can be acted upon by stockholders at annual stockholder meetings.
These provisions, alone or together, could delay or prevent hostile takeovers and changes in control or changes in our management.
In addition, because we are incorporated in Delaware, we are governed by the provisions of Section 203 of the Delaware General Corporation Law, which limits the ability of stockholders owning in excess of 15% of our outstanding voting stock to merge or combine with us in certain circumstances.
Any provision of our restated certificate of incorporation or restated bylaws, or Delaware law that has the effect of delaying or deterring a change in control could limit the opportunity for our stockholders to receive a premium for their shares of our common stock, and could also affect the price that some investors are willing to pay for our common stock.
Item 1B. Unresolved Staff Comments
None.
The Company’s corporate headquarters isare located in San Francisco, California, and consistsconsist of approximately 141,000169,000 square feet of space under lease agreements, that mostlythe longest of which is expected to expire in June 2022. Under these lease agreements, we havethe Company has an option to extend nearly all of the space under the leases for five years. We have
In April 2015, the Company entered into a lease agreement for approximately 112,000 square feet of additional office space in San Francisco, California. The lease agreement commenced in the second quarter of 2015 with delivery of portions of the leased space to occur in stages through March 2017. The lease agreement expires in March 2026, with the right to renew the lease term for two consecutive renewal terms of five years each.
The Company has additional leased office space of approximately 20,00026,000 square feet in Westborough, Massachusetts, under a lease agreement that expires in January 2020.July 2021.
Item 3. Legal Proceedings
On June 5, 2014, Springstone received a Civil Investigative Demand from the CFPB, for the period from 2009 through May 2014.
The purpose information set forth under “Item 8 – Financial Statements and Supplementary Data – Notes to Consolidated Financial Statements – 17. Commitments and Contingencies” of the investigationthis Form 10-K is to determine whether Springstone engaged in unlawful acts or practices in connection with the marketing, issuance, and servicing of loans for healthcare related financing during the period. As of December 31, 2014, we had provided all of the documents requestedincorporated herein by the CFPB. We are continuing to evaluate this matter.During the second quarter of 2014, we also received notice from the California Employment Development Department, referred to as EDD, that it had commenced an examination of our records concerning the employment relationship of certain individuals who performed services for us from 2011 through 2014. Based on the EDD’s determination, certain of these individuals should have been classified as employees with appropriate tax withholding and employer related taxes incurred and paid. The EDD has completed its examination and issued a Final Notice of Assessment, which serves as the EDD’s official notice of its determination relating to this matter. During the fourth quarter of 2014, we paid the full assessment to the EDD.
In the fourth quarter of 2014, we settled a dispute with a former consultant for cash and shares of our common stock valued at the market price on the date of settlement. The settlement did not have a material effect on our financial condition, results of operations or cash flows.
In addition to the foregoing, we may be subject to legal proceedings and regulatory actions in the ordinary course of business. We do not believe it is probable that the ultimate liability, if any, arising out of any such matter will have a material effect on our financial condition, results of operations or cash flows.
reference.
Item 4. Mine Safety Disclosures
PART II
Item 5. Market for Registrant’s Common Equity, Related Stockholder Matters and Issuer Purchases of Equity Securities
Market Information for Common Stock
Our common
Lending Club’s stock
began tradingis listed on the New York Stock Exchange
(NYSE) under the
ticker symbol
“LC” on December 11, 2014 following the sale of the shares sold in our IPO at par to the public at $15.00 per share. Prior to that date, there was no public trading market for our common stock.“LC.” The following table sets forth the high and low sales price per share of
ourLending Club’s common stock as reported on the
New York Stock ExchangeNYSE for the
period indicated as well as our IPO price: | | | | | | | | | | | | |
Year Ended December 31, 2014 | | High | | | Low | | | Price at IPO | |
Fourth Quarter (from December 11, 2014) | | $ | 27.90 | | | $ | 23.08 | | | $ | 15.00 | |
periods indicated:
|
| | | | | | | | | | | | | | | |
| Year Ended December 31, | 2016 | | 2015 |
| | High | | Low | | High |
| | Low |
| First Quarter | $ | 11.25 |
| | $ | 6.34 |
| | $ | 25.78 |
| | $ | 18.30 |
|
| Second Quarter | $ | 8.41 |
| | $ | 3.44 |
| | $ | 19.85 |
| | $ | 14.36 |
|
| Third Quarter | $ | 6.58 |
| | $ | 4.03 |
| | $ | 15.14 |
| | $ | 10.28 |
|
| Fourth Quarter | $ | 6.56 |
| | $ | 4.64 |
| | $ | 15.00 |
| | $ | 10.77 |
|
As of
DecemberJanuary 31,
2014,2017, there were
approximately 36469 holders of record of
ourLending Club’s common stock.
The closing market price per share on that date was $6.17. Because many of
ourLending Club’s shares of common stock are held by brokers and other institutions on behalf of stockholders,
we arethe Company is unable to estimate the total number of stockholders represented by these record holders.
Lending Club has not paid cash or other dividends since
ourits inception, and
we dodoes not anticipate paying cash or other dividends in the foreseeable future.
Sales of Unregistered Securities
In April 2014, we issued 6,390,556 shares of Series F convertible preferred stock for aggregate cash consideration of approximately $65.0 million to 32 accredited investors and 2,443,930 shares of Series F convertible preferred stock as consideration for the acquisition of Springstone worth approximately $25.0 million to two accredited investors. These securities were issued in reliance on the exemption from the registration requirements set forth in Section 4(a)(2) of the Securities Act.
Use of Proceeds
The Registration Statement on Form S-1 (File No. 333-198393) for our initial public offering of our common stock was declared effective by the SEC on December 10, 2014 pursuant to which we registered an aggregate of 66,700,000 shares of our common stock at a public offering price of $15.00 per share for aggregate offering proceeds of approximately $1.0 billion.
There has been no material change in the planned use of proceeds from our initial public offering as described in our final prospectus filed with the SEC on December 10, 2014 pursuant to Rule 424(b)(4).
None.
Issuer Purchases of Equity Securities
There were no repurchases of equity securities by us during the fourth quarter of 2014.
None.
This performance graph shall not be deemed “soliciting material” or to be “filed” with the SEC for purposes of Section 18 of the Securities Exchange Act of 1934, as amended (Exchange Act), or otherwise subject to the liabilities under that Section, and shall not be deemed to be incorporated by reference into any filing of LendingClub under the Securities Act of 1933, as amended, or the Exchange Act.
The following graph compares the cumulative total return to stockholders
on ourof Lending Club’s common stock relative to the cumulative total returns of the Standard & Poor’s 500 Index
or S(S&P
500,500) and the Dow Jones Internet Composite Index
or DJ(DJ Internet
Composite.Composite). An investment of $100 (with reinvestment of all dividends) is assumed to have been made in
ourLending Club’s common stock and in each index
at market close on December 11, 2014, the date
ourLending Club’s common stock began trading on the NYSE, and its relative performance is tracked through December
31, 2014.30, 2016. The returns shown are based on historical results and are not intended to suggest future performance.

|
| | | | | | | | | | | | | | | |
| | December 11, 2014 | | December 31, 2014 | | December 31, 2015 | | December 30, 2016 |
| LendingClub Corporation | $ | 100 |
| | $ | 107.98 |
| | $ | 47.16 |
| | $ | 22.41 |
|
| Standard & Poor's 500 Index | $ | 100 |
| | $ | 101.16 |
| | $ | 100.42 |
| | $ | 110.00 |
|
| Dow Jones Internet Composite Index | $ | 100 |
| | $ | 101.72 |
| | $ | 124.20 |
| | $ | 133.23 |
|
Item 6. Selected Financial Data
We
The Company changed ourits fiscal year end from March 31 to December 31 effective as of December 31, 2012, and the nine month period ended December 31, 2012 represents thea transition period. The historical information presented below for the yearsyear ended December 31, 2012 2011 and 2010 (i) combines the unaudited interim consolidated financial statements
for the three months ended March 31,
2012 and the nine months ended December 31,
in each year2012 and (ii) is unaudited and has been prepared by management for illustrative purposes only. The unaudited
interim consolidated financial statements and unaudited historical financial information
havehas been prepared on the same basis as the audited consolidated financial statements and reflect, in the opinion of management, all adjustments of a normal, recurring nature that are necessary for a fair statement of the unaudited interim consolidated financial statements.
OurLending Club’s historical results are not necessarily indicative of the results
that may be expected in
the future.any future period.
The following selected consolidated financial data should be read in conjunction with “Item 7 – Management’s Discussion and Analysis of Financial Condition and Results of Operations” and the consolidated financial statements included in this Report (in thousands, except share and per share data). | | | | | | | | | | | | | | | | | | | | |
Years Ended December 31, | | 2014(1) | | | 2013 | | | 2012 | | | 2011 | | | 2010 | |
| | | (audited) | | | (audited) | | | (unaudited) | | | (unaudited) | | | (unaudited) | |
Statement of Operations Data: | | | | | | | | | | | | | | | | | | | | |
Transaction fees(2) | | $ | 197,124 | | | $ | 85,830 | | | $ | 30,576 | | | $ | 10,981 | | | $ | 4,975 | |
Servicing fees | | | 11,534 | | | | 3,951 | | | | 1,929 | | | | 951 | | | | 459 | |
Management fees | | | 5,957 | | | | 3,083 | | | | 824 | | | | 103 | | | | — | |
Other revenue (expense) | | | (1,203 | ) | | | 5,111 | | | | 716 | | | | 495 | | | | 289 | |
| | | | | | | | | | | | | | | | | | | | |
Total operating revenue | | | 213,412 | | | | 97,975 | | | | 34,045 | | | | 12,530 | | | | 5,723 | |
Net interest income (expense) and other adjustments | | | (2,284 | ) | | | 27 | | | | (238 | ) | | | 222 | | | | (708 | ) |
| | | | | | | | | | | | | | | | | | | | |
Total net revenue | | | 211,128 | | | | 98,002 | | | | 33,807 | | | | 12,752 | | | | 5,015 | |
Operating expenses(3): | | | | | | | | | | | | | | | | | | | | |
Sales and marketing | | | 87,278 | | | | 39,037 | | | | 18,201 | | | | 11,402 | | | | 7,751 | |
Origination and servicing | | | 38,286 | | | | 17,217 | | | | 7,589 | | | | 4,758 | | | | 2,790 | |
General and administrative: | | | | | | | | | | | | | | | | | | | | |
Engineering and product development(2) | | | 34,701 | | | | 13,922 | | | | 4,855 | | | | 2,289 | | | | 1,951 | |
Other | | | 82,367 | | | | 20,518 | | | | 10,024 | | | | 6,572 | | | | 3,330 | |
| | | | | | | | | | | | | | | | | | | | |
Total operating expenses | | | 242,632 | | | | 90,694 | | | | 40,669 | | | | 25,021 | | | | 15,822 | |
| | | | | | | | | | | | | | | | | | | | |
Income (loss) before income taxes | | | (31,504 | ) | | | 7,308 | | | | (6,862 | ) | | | (12,269 | ) | | | (10,807 | ) |
Income tax expense | | | 1,390 | | | | — | | | | — | | | | — | | | | — | |
| | | | | | | | | | | | | | | | | | | | |
Net income (loss) | | $ | (32,894 | ) | | $ | 7,308 | | | $ | (6,862 | ) | | $ | (12,269 | ) | | $ | (10,807 | ) |
| | | | | | | | | | | | | | | | | | | | |
Net loss per share - Basic(4)(6) | | $ | (0.44 | ) | | $ | 0.00 | | | $ | (0.17 | ) | | $ | (0.35 | ) | | $ | (0.32 | ) |
| | | | | | | | | | | | | | | | | | | | |
Net loss per share - Diluted(4)(6) | | $ | (0.44 | ) | | $ | 0.00 | | | $ | (0.17 | ) | | $ | (0.35 | ) | | $ | (0.32 | ) |
| | | | | | | | | | | | | | | | | | | | |
Weighted-average common shares - Basic(4)(6) | | | 75,573,742 | | | | 51,557,136 | | | | 39,984,876 | | | | 34,744,860 | | | | 34,200,300 | |
| | | | | | | | | | | | | | | | | | | | |
Weighted-average common shares - Diluted(4)(6) | | | 75,573,742 | | | | 81,426,976 | | | | 39,984,876 | | | | 34,744,860 | | | | 34,200,300 | |
| | | | | | | | | | | | | | | | | | | | |
| | | | | |
December 31, | | 2014(1) | | | 2013 | | | 2012 | | | 2011 | | | 2010 | |
Consolidated Balance Sheet Data: | | | | | | | | | | | | | | | | | | | | |
Cash and cash equivalents(6) | | $ | 869,780 | | | $ | 49,299 | | | $ | 52,551 | | | $ | 24,712 | | | $ | 17,265 | |
Loans(5) | | | 2,798,505 | | | | 1,829,042 | | | | 781,215 | | | | 296,100 | | | | 128,241 | |
Total assets(1)(6) | | | 3,890,054 | | | | 1,943,395 | | | | 850,830 | | | | 326,797 | | | | 146,743 | |
Notes and certificates(5) | | | 2,813,618 | | | | 1,839,990 | | | | 785,316 | | | | 290,768 | | | | 122,532 | |
Total liabilities | | | 2,916,835 | | | | 1,875,301 | | | | 798,620 | | | | 294,262 | | | | 128,221 | |
Total stockholders’ equity(6) | | | 973,219 | | | | 68,094 | | | | 52,210 | | | | 32,535 | | | | 18,522 | |
(footnotes appear on the following page)
|
| | | | | | | | | | | | | | | | | | | |
| Years Ended December 31, | 2016 | | 2015 | | 2014 (1) | | 2013 | | 2012 |
| | (audited) | | (audited) | | (audited) | | (audited) | | (unaudited) |
| Statement of Operations Data: | | | | | | | | | |
| Transaction fees | $ | 423,494 |
| | $ | 373,508 |
| | $ | 197,124 |
| | $ | 85,830 |
| | $ | 30,576 |
|
| Servicing fees | 68,009 |
| | 32,811 |
| | 11,534 |
| | 3,951 |
| | 1,929 |
|
| Management fees | 11,638 |
| | 10,976 |
| | 5,957 |
| | 3,083 |
| | 824 |
|
| Other revenue (expense) | (7,674 | ) | | 9,402 |
| | (1,203 | ) | | 5,111 |
| | 716 |
|
| Total net operating revenue | 495,467 |
| | 426,697 |
| | 213,412 |
| | 97,975 |
| | 34,045 |
|
| Net interest income (expense) and fair value adjustments | 5,345 |
| | 3,246 |
| | (2,284 | ) | | 27 |
| | (238 | ) |
| Total net revenue | 500,812 |
| | 429,943 |
| | 211,128 |
| | 98,002 |
| | 33,807 |
|
Operating expenses: (2) | | | | | | | | | |
| Sales and marketing | 216,670 |
| | 171,526 |
| | 85,652 |
| | 37,431 |
| | 18,201 |
|
| Origination and servicing | 74,760 |
| | 61,335 |
| | 37,326 |
| | 17,978 |
| | 7,589 |
|
| Engineering and product development | 115,357 |
| | 77,062 |
| | 38,518 |
| | 15,528 |
| | 4,855 |
|
| Other general and administrative | 207,172 |
| | 122,182 |
| | 81,136 |
| | 19,757 |
| | 10,024 |
|
| Goodwill impairment | 37,050 |
| | — |
| | — |
| | — |
| | — |
|
| Total operating expenses | 651,009 |
| | 432,105 |
| | 242,632 |
| | 90,694 |
| | 40,669 |
|
| Income (loss) before income tax expense | (150,197 | ) | | (2,162 | ) | | (31,504 | ) | | 7,308 |
| | (6,862 | ) |
| Income tax (benefit) expense | (4,228 | ) | | 2,833 |
| | 1,390 |
| | — |
| | — |
|
| Net income (loss) | $ | (145,969 | ) | | $ | (4,995 | ) | | $ | (32,894 | ) | | $ | 7,308 |
| | $ | (6,862 | ) |
| Net income (loss) per share: | | | | | | | | | |
Basic (3)(4) | $ | (0.38 | ) | | $ | (0.01 | ) | | $ | (0.44 | ) | | $ | 0.00 |
| | $ | (0.17 | ) |
Diluted (3)(4) | $ | (0.38 | ) | | $ | (0.01 | ) | | $ | (0.44 | ) | | $ | 0.00 |
| | $ | (0.17 | ) |
Weighted-average common shares - Basic (3)(4) | 387,762,072 |
| | 374,872,118 |
| | 75,573,742 |
| | 51,557,136 |
| | 39,984,876 |
|
Weighted-average common shares - Diluted (3)(4) | 387,762,072 |
| | 374,872,118 |
| | 75,573,742 |
| | 81,426,976 |
| | 39,984,876 |
|
| | | | | | | | | | |
| December 31, | 2016 | | 2015 | | 2014 (1) | | 2013 | | 2012 |
| | (audited) | | (audited) | | (audited) | | (audited) | | (unaudited) |
| Consolidated Balance Sheet Data: | | | | | | | | | |
Cash and cash equivalents (4) | $ | 515,602 |
| | $ | 623,531 |
| | $ | 869,780 |
| | $ | 49,299 |
| | $ | 52,551 |
|
| Securities available for sale | 287,137 |
| | 297,211 |
| | — |
| | — |
| | — |
|
| Loans at fair value | 4,311,984 |
| | 4,556,081 |
| | 2,798,505 |
| | 1,829,042 |
| | 781,215 |
|
Total assets (1)(4) | 5,562,631 |
| | 5,793,634 |
| | 3,890,054 |
| | 1,943,395 |
| | 850,830 |
|
| Notes and certificates at fair value | 4,320,895 |
| | 4,571,583 |
| | 2,813,618 |
| | 1,839,990 |
| | 785,316 |
|
| Total liabilities | 4,586,861 |
| | 4,751,774 |
| | 2,916,835 |
| | 1,875,301 |
| | 798,620 |
|
Total stockholders’ equity (4) | $ | 975,770 |
| | $ | 1,041,860 |
| | $ | 973,219 |
| | $ | 68,094 |
| | $ | 52,210 |
|
| |
(1) | In April 2014, we acquired all of the outstanding limited liability interests ofCompany completed the Springstone Financial, LLC (“Springstone”). Ouracquisition. The Company’s consolidated financial statements include Springstone’s financial position and results of operations from the acquisition date. |
(2) | Transaction fees were previously referred to as “Origination fees.” “General and Administrative—Engineering and product development” was previously referred to as “General and Administrative—Technology.” |
(3)(2) | Includes stock-based compensation expense as follows: |
| | | | | | | | | | | | | | | | | | | | |
Years Ended December 31, | | 2014 | | | 2013 | | | 2012 | | | 2011 | | | 2010 | |
Sales and marketing | | $ | 6,058 | | | $ | 1,313 | | | $ | 302 | | | $ | 30 | | | $ | 94 | |
Origination and servicing | | | 2,140 | | | | 424 | | | | 75 | | | | 9 | | | | 15 | |
General and administrative: | | | | | | | | | | | | | | | | | | | | |
Engineering and product development | | | 5,311 | | | | 2,171 | | | | 449 | | | | 71 | | | | 60 | |
Other | | | 23,641 | | | | 2,375 | | | | 586 | | | | 181 | | | | 150 | |
| | | | | | | | | | | | | | | | | | | | |
Total stock-based compensation expense | | $ | 37,150 | | | $ | 6,283 | | | $ | 1,412 | | | $ | 291 | | | $ | 319 | |
| | | | | | | | | | | | | | | | | | | | |
|
| | | | | | | | | | | | | | | | | | | |
| Years Ended December 31, | 2016 | | 2015 | | 2014 | | 2013 | | 2012 |
| | (audited) | | (audited) | | (audited) | | (audited) | | (unaudited) |
| Sales and marketing | $ | 7,546 |
| | $ | 7,250 |
| | $ | 5,476 |
| | $ | 1,147 |
| | $ | 302 |
|
| Origination and servicing | 4,159 |
| | 2,735 |
| | 1,653 |
| | 424 |
| | 75 |
|
| Engineering and product development | 19,858 |
| | 11,335 |
| | 6,445 |
| | 2,336 |
| | 449 |
|
| Other general and administrative | 37,638 |
| | 29,902 |
| | 23,576 |
| | 2,376 |
| | 586 |
|
| Total stock-based compensation expense | $ | 69,201 |
| | $ | 51,222 |
| | $ | 37,150 |
| | $ | 6,283 |
| | $ | 1,412 |
|
(4) | |
(3) | In April 2014, ourthe Company’s board of directors approved a two-for-one stock split of ourLending Club’s outstanding capital stock and in August 2014, ourthe Company’s board of directors approved another two-for-one stock split of ourLending Club’s outstanding capital stock, which became effective in September 2014. All share and per share data in this table has been adjusted to reflect these stock splits. |
(5) | Loans represent unsecured obligations of borrowers facilitated through our marketplace. Notes and certificates are issued to investors and represent repayment obligations dependent upon receipt of borrower payments as to a corresponding loan. For more information regarding notes and certificates, see “Item 7 - Management’s Discussion and Analysis of Financial Condition and Results of Operations— Overview.” Period-end differences between the two line items are largely driven by timing of applying and distributing loan payments to investors. |
(6)(4) | In December 2014, weLending Club registered 66,700,000 shares of our common stock in ourits initial public offering at the initial offering price of $15.00 per share. In connection with this stock offering, all outstanding shares of convertible preferred stock were converted into ourLending Club’s common stock. |
LENDINGCLUB CORPORATION
Management's Discussion and Analysis of Financial Condition and Results of Operations
(Tabular Amounts in Thousands, Except Share and Per Share Data and Ratios, or as Noted)
Item 7. Management’s Discussion and Analysis of Financial Condition and Results of Operations
The following discussion and analysis of our financial condition and results of operations should be read in conjunction with the consolidated financial statements and related notes that appear in this Annual Report on Form 10-K (Report). In addition to historical consolidated financial information, the following discussion contains forward-looking statements that reflect our plans, estimates and beliefs. Our actual results could differ materially from those discussed in the forward-looking statements. Factors that could cause or contribute to these differences include those discussed below and in this Report, particularly in Item 1A – Risk Factors.
Lending Club is the world’s largest online marketplace connecting borrowers and investors. We believe a technology-powered marketplace is a more efficient mechanism to allocate capital between borrowers and investors than the traditional banking system. ConsumersQualified consumers and small business owners borrow through Lending Club to lower the cost of their credit and enjoy a better experience than that provided by traditional bank lending. banks.
Investors use Lending Club to earn
attractivesolid risk-adjusted returns from an asset class that has generally been closed to many investors and only available on a limited basis to institutional investors.
Since beginning operations in 2007, our marketplace has facilitated over $7.6 billion in loan originations. These loans were facilitated through the following investment channels: (i) the issuance of notes, (ii) the sale of certificates, or (iii) the sale of whole loans to qualified investors. Approximately $2.0 billion of our loan originations since inception were invested in through notes, $2.9 billion were invested in through certificates and $2.7 billion were invested in through whole loan sales. In the fourth quarter of 2014, our marketplace facilitated over $1.4 billion of loan originations, of which approximately $0.2 billion were invested in through notes, $0.4 billion were invested in through certificates and $0.8 billion were invested in through whole loan sales.
Our trusted brand, scale and network effect drives significant borrowing and investing activity on our marketplace. We generate revenue from transaction fees from our marketplace’s role in matching borrowers with investors to enable loan originations, servicing fees from investors and management fees from investment funds and other managed accounts. We do not assume credit risk or use our own capital to invest in loans facilitated by our marketplace, except in limited circumstances and in amounts that are not material. The capital to invest in the loans enabled through our marketplace comes directly from investors. Our proprietary technology automates key aspectsa wide range of investors, including retail investors, high-net-worth individuals and family offices, banks and finance companies, insurance companies, hedge funds, foundations, pension plans and university endowments, and through a variety of investment channels. While our business model is not dependent on using our balance sheet and assuming credit risk for loans facilitated by our marketplace, we may use a greater amount of our operations, including the borrower application process, data gathering, credit decisioning and scoring, loan funding, investing and servicing,own capital, compared to past experience, to fulfill regulatory compliance and fraud detection.or contractual purchase obligations, or support short-term marketplace equilibrium. We operate with a lower cost structure than traditional banks duemay also use our capital to our innovative model, online delivery and process automation, without the physical branches, legacy technology or high overheadinvest in loans associated with the traditional banking system.
Our marketplace is where borrowerstesting or initial launch of new or alternative loan terms, programs or channels to establish a track record of performance prior to facilitating third-party investments in these loans, or to support alternative loan purchase programs.
We generate revenue from transaction fees from our marketplace’s role in accepting and
decisioning applications for our bank partners to enable loan originations, servicing fees from investors
engage in transactions relating to unsecured Standard or Custom Program Loans including Super Prime Consumer Loans, small business loans,for matching available loan assets with capital, and
educationmanagement fees from investment funds and
patient finance loans. Standard Program Loans are visible through our public website and can be invested in through notes. Separately, qualified investors may also invest in Standard or Customer Program Loans in private transactions not facilitated through our website.Theother managed accounts.
Generally, the transaction fees we receive from issuing banks in connection with our marketplace’s role in facilitating loan originations range from 1% to
6%7% of the initial principal amount of the loan as of December 31,
2014.2016. In addition, for education and patient finance loans,
transaction fees may exceed 6% as they includewe also collect fees earned from issuing banks and service providers. Servicing fees paid to us vary based on investment channel. Note investors
generally pay us a servicing fee equal to 1% of
each payment
amountamounts received from the
borrower; wholeborrower. Whole loan purchasers pay a monthly servicing fee
of up to 1.3% per annum,
which is generally based on the month-end principal balance of loans
serviced and certificateserviced. Certificate holders generally
do not pay a servicing fee, but pay a monthly management fee
typically ranging from 0.7%of up to 1.5% per annum of the month-end balance of assets under management.
Loans
Since beginning operations in 2007, our marketplace has facilitated approximately $24.6 billion in loan originations. These loans were facilitated through the following investment channels: (i) the issuance of member payment dependent notes, (ii) the sale of trust certificates, or (iii) the sale of whole loans to qualified borrowers are originated by issuing banks. Investors can investinvestors. Approximately $4.6 billion of our loan originations since inception were invested in loans that are offered through member payment dependent notes, $6.9 billion were invested in through trust certificates and $13.1 billion were invested in through whole loan sales. In 2016, our marketplace facilitated over $8.7 billion of loan originations, of which approximately $1.3 billion were invested in onethrough member payment dependent notes, $1.4 billion were invested in through trust certificates and $6.0 billion were invested in through whole loan sales. In 2015, our marketplace facilitated over $8.4 billion of loan originations, of which approximately $1.3 billion were invested in through member payment
LENDINGCLUB CORPORATION
Management's Discussion and Analysis of Financial Condition and Results of Operations
(Tabular Amounts in Thousands, Except Share and Per Share Data and Ratios, or allas Noted)
dependent notes, $2.6 billion were invested in through trust certificates and $4.5 billion were invested in through whole loan sales. See “Item 1A – Risk Factors – A decline in economic conditions may adversely affect our customers, which may negatively impact our business and results of the following channels: | • | | Notes. Pursuant to an effective shelf registration statement, investors who meet the applicable financial suitability requirements and have completed our investor account opening process may purchase unsecured, borrower payment dependent notes that correspond to payments received on an underlying Standard Program Loan selected by the investor. When an investor registers with us, the investor enters into an investor agreement with us that governs the investor’s purchases of notes. Our note channel is supported by our website knowledge base and our investor services group who provide basic customer support to these investors. |
| • | | Certificates and Investment Funds. Accredited investors and qualified purchasers may establish a relationship with LCA or another third-party advisor in order to indirectly invest in certificates, or they may directly purchase a certificate or interests in separate limited partnership entities that purchase certificates. The certificates are unsecured and are settled with cash flows from underlying Standard or Custom Program Loans selected by the investor. Neither certificates nor limited partnership interests can be purchased through our website. Certificate investors typically seek to invest larger amounts as compared to the average note investors and often desire a more “hands off” approach to investing. Investors in certificates generally pay an asset-based management fee instead of cash flow-based servicing fee paid by note investors. |
| • | | Whole Loan Purchases. Certain institutional investors, such as banks, seek to hold the actual loan on their balance sheet. To meet this need, we sell entire Standard or Custom Program Loans to these investors. In connection with these sales, the investor owns all right, title and interest in each loan. We establish the investors’ accounts and set out the procedures for the purchase of loans, including any purchase amount limitations, which we control in our discretion. We and the investor also make limited representations and warranties and agree to indemnify each other for breaches of the purchase agreement. The investor also agrees to simultaneously enter into a servicing agreement with us acting as servicer. For regulatory purposes, the investor also has access to the underlying borrower information, but is prohibited from contacting or marketing to the borrower in any manner and agrees to hold such borrower information in compliance with all applicable privacy laws. We continue to service these loans after they are sold and can only be removed as the servicer in limited circumstances. |
For all investment channels, we agree to repurchase loans in cases of confirmed identity theft.
Change in Fiscal Year
In December 2012, we changed our fiscal year end from March 31 to December 31. The change was effective as of December 31, 2012, and the nine months ended December 31, 2012 represent the transition period.
Springstone
operations.
”
In April 2014, we acquired all of the outstanding limited liability company interests of Springstone. For its role in loan facilitation, Springstone earns transaction fees paid by the issuing bank and service provider at the time of origination, which averaged approximately 4.9% of the initial loan balance as of December 31, 2014. Currently, Springstone does not earn any servicing fees, as loans are originated, retained and serviced by the respective issuing banks. We currently intend to continue to have these loans funded and serviced through existing issuing banks while we develop plans to integrate these loans into our Standard Loan Program over time. See “Item 8 – Financial Statements and Supplementary Data -– Note 17 –20. Springstone Acquisition” for more information.
Current Economic and Business Environment
Lending Club monitors a variety of economic, credit and competitive indicators so that borrowers can benefit from meaningful savings compared to alternatives, and investors can continue to find solid risk-adjusted returns compared to other fixed income investments or investment alternatives.
Our approach to risk-management is a data-driven, continuous and proactive process that runs against a constantly shifting set of conditions. Our marketplace has a number of levers at its disposal to adjust to changing market conditions, including the ability to quickly adapt underwriting models and dynamically increase or decrease pricing to provide an appropriate level of loss coverage to investors.
Throughout 2016 and into 2017, we observed trends that suggest a strong U.S. economy which have, unfortunately, been offset by observations of higher delinquencies in populations characterized by high indebtedness, an increased propensity to accumulate debt, and lower credit scores. While these observations were initially limited to pockets of underperformance in the higher risk segments in the first half of 2016, starting in the third quarter of 2016, this trend was observed across all grades, although it is less notable in lower risk grades and more notable in higher risk grades, particularly grades E, F and G.
In response to these observations, we identified additional ways to optimize credit models around specific combinations of risk indicators while maintaining solid investor yields. These changes included implementing changes to tighten credit criteria based on a unique combination of risk factors, such as number of recent installment loans, revolving utilization, and higher risk scores on our proprietary scorecard. The actions taken in April, June and October 2016 eliminated approximately 11% of total loan volume on an annualized basis from specific risk segments that would have otherwise been approved. Additional action taken in January 2017 eliminated approximately 5% of total loan volume on an annualized basis. We have also invested in our multifaceted collections capabilities to further mitigate risk, including adding new recovery strategies, adding a new agency partner and expanding our internal collections team capacity.
During 2016 we made proactive interest rate increases for loans facilitated on our platform (with a weighted-average increase of approximately 118 basis points from November 2015 to October 2016), and we believe the interest rates in our marketplace already reflect the current interest rate environment. In addition to the increased interest rates, the origination fee paid by borrowers was also increased in March and June of 2016 for certain loan grades. These combined rates and fee increases have negatively impacted the volume of loans facilitated through our marketplace and may continue to do so in the future.
In addition, we continue to actively explore ways to diversify our investor base and obtain additional investment capital for the platform loans. For example, on November 7, 2016, we announced a new addition to the Company’s investor capital mix through an arrangement with a subsidiary of the National Bank of Canada, which had approved up to $1.3 billion to be deployed on the Lending Club platform, subject to certain terms and conditions. We plan to continue to drive toward increased investor engagement and diversification on the platform.
LENDINGCLUB CORPORATION
Management's Discussion and Analysis of Financial Condition and Results of Operations
(Tabular Amounts in Thousands, Except Share and Per Share Data and Ratios, or as Noted)
Factors That Can Affect Revenue
As a marketplace, we work toward matching supply and demand while also growing originations and correspondingly revenue at a pace commensurate with proper planning, compliance, risk management, user experience, and operational controls that work to optimize the quality of the customer experience, customer satisfaction and long term growth.
The interplay of the volume, timing and quality of loan applications, investment appetite, investor confidence in our data, controls and processes and available investment capital from investors, platform loan processing and originations, and the subsequent performance of loans, which directly impacts our servicing fees, can affect our revenue in any particular period. These drivers collectively result in transaction, servicing or management fees earned by us related to these transactions and their future performance. As these drivers can be affected by a variety of factors, both in and out of our control, revenues may fluctuate from period to period. Factors that can affect these drivers and ultimately revenue and its timing include:
market confidence in our data, controls, and processes,
announcements of governmental inquiries or private litigation,
the mix of loans,
availability or the timing of the deployment of investment capital by investors,
the availability and amount of new capital from pooled investment vehicles and managed accounts that typically deploy their capital at the start of a period,
the amount of purchase limitations we can impose on larger investors as a way to maintain investor balance and fairness,
the attractiveness of alternative opportunities for borrowers or investors,
the responsiveness of applicants to our marketing efforts,
expenditures on marketing initiatives in a period,
the sufficiency of operational staff to process any manual portion of the loan applications in a timely manner,
the responsiveness of borrowers to satisfy additional income or employment verification requirements related to their application,
borrower withdrawal rates,
the percentage distribution of loans between the whole and fractional loan platforms,
platform system performance,
seasonality in demand for our platform and services, which is generally lower in the first and fourth quarters,
and other factors.
Given these factors, at any point in time we have loan applications in various stages from initial application through issuance. Depending upon the timing and impact of these factors, loans may not be issued by our issuing bank in the same period in which the corresponding application was originally made resulting in a portion of that subsequent period’s revenue being earned from loan applications that were initiated in the immediately prior period. Consistent with our revenue recognition accounting policy under GAAP, we do not recognize the associated transaction fee revenue with a loan until the loan is issued by our issuing banks and the proceeds are delivered to the borrower. Our receipt of a transaction fee is not impacted by who or how a loan is invested in.
LENDINGCLUB CORPORATION
Management's Discussion and Analysis of Financial Condition and Results of Operations
(Tabular Amounts in Thousands, Except Share and Per Share Data and Ratios, or as Noted)
Key Operating and Financial Metrics
We regularly review a number of metrics to evaluate our business, measure our performance, identify trends, formulate financial projections and make strategic decisions. The following presents our key operating and financial
metrics (in thousands, except percentages): | | | | | | | | | | | | |
| | | Year Ended
December 31,
2014 | | | Year Ended
December 31,
2013 | | | 9 Months Ended
December 31,
2012 | |
| | | (unaudited) | |
Loan Originations(1) | | $ | 4,377,503 | | | $ | 2,064,626 | | | $ | 608,348 | |
Contribution(2) | | $ | 96,046 | | | $ | 43,458 | | | $ | 8,346 | |
Contribution margin(2) | | | 45.0 | % | | | 44.4 | % | | | 28.9 | % |
Adjusted EBITDA(2) | | $ | 21,301 | | | $ | 15,227 | | | $ | (2,557 | ) |
Adjusted EBITDA margin(2) | | | 10.0 | % | | | 15.5 | % | | | (8.8 | %) |
|
| | | | | | | | | | | |
| Year Ended December 31, | 2016 | | 2015 | | 2014 |
| Loan originations | $ | 8,664,746 |
| | $ | 8,361,697 |
| | $ | 4,377,503 |
|
Net operating revenue(1)(2) | $ | 495,467 |
| | $ | 426,697 |
| | $ | 213,412 |
|
Net loss(2) | $ | (145,969 | ) | | $ | (4,995 | ) | | $ | (32,894 | ) |
Contribution(3) | $ | 215,742 |
| | $ | 203,821 |
| | $ | 97,563 |
|
Contribution margin(3) | 43.5 | % | | 47.8 | % | | 45.7 | % |
Adjusted EBITDA(3) | $ | (18,235 | ) | | $ | 69,758 |
| | $ | 21,301 |
|
Adjusted EBITDA margin(3) | (3.7 | )% | | 16.3 | % | | 10.0 | % |
(1) | Loan originations include loans facilitated through the platform plus outstanding purchase commitments at period end. |
(1) | See “Factors That Can Affect Revenue” for more information regarding net operating revenue. |
(2) | |
(2) | See “Results of Operations” for more information regarding net operating revenue and net loss. |
| |
(3) | Contribution, Contribution Margin, Adjusted EBITDA and Adjusted EBITDA Margin are non-GAAP financial measures. For more information regarding these measures and a reconciliation of these measures to the most comparable GAAP measure, see “Item 7 – Management’s Discussion and Analysis of Financial Condition and Results of Operations - Reconciliations of Non-GAAP Financial Measures.” |
We believe originations are a key indicator of the adoption rate of our marketplace, growth of our brand, scale of our business, strength of our network effect, economic competitiveness of our products and future growth.
Loan originations have grown significantly over time due to increased awareness of our brand, our high borrower and investor satisfaction rates, the effectiveness of our borrower acquisition channels, a strong track record of loan performance and the expansion of our capital resources. Factors that could affect loan originations include
investor confidence in our platform and internal processes, the
amount of our capital available to invest in loans, interest rate and economic environment, the competitiveness of our products
primarily based on our platform's rates and fees, the success of our operational efforts to balance investor and borrower
demands,demand, any limitations on the ability of our issuing banks to originate loans, our ability to develop new products or enhance existing products for borrowers and investors, the success of our sales and marketing initiatives and the success of borrower and investor acquisition and retention.
Contribution, Contribution Margin, Adjusted EBITDA
The Company's originations and
Adjusted EBITDA MarginContribution isweighted average transaction fees (as a non-GAAP financial measure that we calculatepercent of origination balance), by its major and material loan products, are as net income (loss), excluding net interest income (expense) and other adjustments, general and administrative expense, stock-based compensation expense and income tax expense (benefit). Contribution margin is a non-GAAP financial measure calculated by dividing contribution by total operating revenue. Contribution and contribution margin are measures used by our management and board of directors to understand and evaluate our core operating performance and trends. Contribution and contribution margin have varied from period to period and have generally increased over time. Factors that affect our contribution and contribution margin include revenue mix, variable marketing expenses and origination and servicing expenses.
Adjusted EBITDA is a non-GAAP financial measure that we calculate as net income (loss), excluding net interest income (expense) and other adjustments, acquisition and related expense, depreciation and amortization, amortization of intangible assets, stock-based compensation expense and income tax expense (benefit). Adjusted EBITDA margin is a non-GAAP financial measure calculated as adjusted EBITDA divided by total operating revenue. Adjusted EBITDA is a measure used by our management and board of directors to understand and evaluate our core operating performance and trends. Adjusted EBITDA has generally improved over time due to our increased revenue and efficiencies in the scale of our operations. For more information regarding the limitations of contributions, contribution margins, adjusted EBITDA and adjusted EBITDA margin and a reconciliation of net income (loss) to adjusted EBITDA, see “Item 7 – Management’sfollows:
|
| | | | | | | | | | | | | | | | | |
| | Year Ended |
| | December 31, 2016 | | December 31, 2015 | | December 31, 2014 |
| (in millions, except percentages) | Origination Volume | Weighted Average Transaction Fees | | Origination Volume | Weighted Average Transaction Fees | | Origination Volume | Weighted Average Transaction Fees |
| Personal loans - standard program | $ | 6,400.5 |
| 4.9 | % | | $ | 6,417.6 |
| 4.4 | % | | $ | 3,503.8 |
| 4.4 | % |
| Personal loans - custom program | 1,437.4 |
| 5.3 | % | | 1,243.8 |
| 4.9 | % | | 506.6 |
| 4.9 | % |
| Other loans | 826.8 |
| 4.5 | % | | 700.3 |
| 4.4 | % | | 367.1 |
| 4.8 | % |
| Total | $ | 8,664.7 |
| 4.9 | % | | $ | 8,361.7 |
| 4.5 | % | | $ | 4,377.5 |
| 4.5 | % |
LENDINGCLUB CORPORATION
Management's Discussion and Analysis of Financial Condition and Results of Operations - Reconciliations
(Tabular Amounts in Thousands, Except Share and Per Share Data and Ratios, or as Noted)
Loans Serviced On Our Platform
The following table provides the outstanding principal balance of
Non-GAAP Financial Measures.”Effectiveness of Scoring Models
Our ability to attract borrowersloans serviced at December 31, 2016, 2015 and investors to our marketplace is significantly dependent on our ability to effectively evaluate a borrower’s credit profile and likelihood of default. We evaluate our marketplace’s credit decisioning and scoring models on a regular basis and leverage2014, by the additional data on loan history experience, borrower behavior, economic factors and prepayment trendsmethod that we accumulate to continually improve the models. If we are unable to effectively evaluate borrowers’ credit profiles, borrowers and investors may lose confidence in our marketplace. Additionally, our ability to effectively segment borrowers into relative risk profiles impacts our ability to offer attractive interest rates for borrowers as well as our ability to offer investors attractive returns, both of which directly relate to our users’ confidence in our marketplace. Our credit decisioning and scoring models assign each loan offered on our marketplace a corresponding interest rate and origination fee. Our investors’ returns are a function of the assigned interest rates for each particular loanloans were financed (in millions):
|
| | | | | | | | | | | |
| December 31, | 2016 | | 2015 | | 2014 |
| Notes | $ | 1,795 |
| | $ | 1,573 |
| | $ | 1,055 |
|
| Certificates | 2,752 |
| | 3,105 |
| | 1,797 |
|
| Whole loans sold | 6,542 |
| | 4,289 |
| | 1,874 |
|
Other (1) | 28 |
| | 3 |
| | — |
|
| Total | $ | 11,117 |
| | $ | 8,970 |
| | $ | 4,726 |
|
(1) Includes loans invested in less any defaults over the term of the applicable loan. We believe we have a history of effectively evaluating borrower’s credit profiles and likelihood of defaults, as evidenced by the performance of various loan vintages facilitated through our marketplace. The following charts display the historical lifetime cumulative net charge-off rates through December 31, 2014, by booking year,Company for all grades and 36- and 60-month terms of Standard Program Loans for each of the years shown.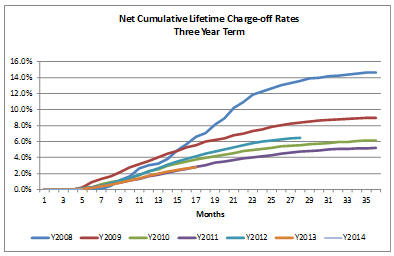
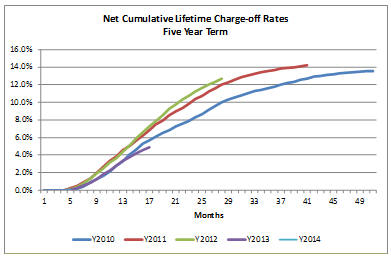
Product Innovation
We have made and intend to continue to make substantial investments and incur expenses to research and developwhich there were no associated notes or otherwise acquire new financial products for borrowers and investors. Our revenue growth to date has been a function of, and our future success will depend in part on, successfully meeting borrower and investor demand with new and innovative loan and investment options. For example, in early 2014, we began offering small business loans to qualified investors, bringing the benefit of our innovative marketplace model, online delivery and process automation to small business owners. In the latter part of 2014 we launched Super Prime Consumer Loans and a true no interest product for the education and patient finance market. For investors, we have introduced automated investing, API, investment funds and separately managed accounts, or SMAs, that make investing in loans easier. Failure to successfully develop and offer innovative products could adversely affect our operating results and we may not recoup the costs of new products.
Marketing Effectiveness and Strategic Relationships
We intend to continue to dedicate significant resources to our marketing and brand advertising efforts and strategic relationships. Our marketing efforts are designed to build awareness of Lending Club and attract borrowers and investors to our marketplace. We use a diverse array of marketing channels and are constantly seeking to improve and optimize our experience both on- and offline to achieve efficiency and a high level of borrower and investor satisfaction. We also continue to invest in our strategic relationships to raise awareness of our platform and attract borrowers and investors to our marketplace. Our operating results and ability to sustain and grow loan volume will depend, in part, on our ability to continue to make effective investments in marketing and the effectiveness of our strategic relationships.
Regulatory Environment
The regulatory environment for credit is complex and evolving, creating both challenges and opportunities that could affect our financial performance. We expect to continue to spend significant resources to comply with various federal and state laws and various licensing requirements designed to, among other things, protect borrowers (such as truth in lending, equal credit opportunity, fair credit reporting and fair debt collections practices) and investors. Our marketplace incorporates a number of automated features to help comply with these laws in an efficient and cost effective manner. While new laws and regulations or changes under existing laws and regulations could make facilitating loans or investment opportunities more difficult to achieve on acceptable terms, or at all, these events could also provide new product and market opportunities. To the extent we seek to grow internationally, we would become subject to additional foreign regulation and related compliance requirements and expense.
certificates.
The following tables set forth the consolidated statement of operations data for each of the periods
presented (in thousands): | | | | | | | | | | | | |
| | | Year Ended
December 31,
2014 | | | Year Ended
December 31,
2013 | | | 9 Months Ended
December 31,
2012 | |
Operating revenues: | | | | | | | | | | | | |
Transaction fees | | $ | 197,124 | | | $ | 85,830 | | | $ | 26,013 | |
Servicing fees | | | 11,534 | | | | 3,951 | | | | 1,474 | |
Management fees | | | 5,957 | | | | 3,083 | | | | 720 | |
Other revenue (expense) | | | (1,203 | ) | | | 5,111 | | | | 720 | |
| | | | | | | | | | | | |
Total operating revenue | | | 213,412 | | | | 97,975 | | | | 28,927 | |
Net interest income (expense) and other adjustments | | | (2,284 | ) | | | 27 | | | | (334 | ) |
| | | | | | | | | | | | |
Total net revenue | | | 211,128 | | | | 98,002 | | | | 28,593 | |
Operating expenses(1): | | | | | | | | | | | | |
Sales and marketing | | | 87,278 | | | | 39,037 | | | | 14,723 | |
Origination and servicing | | | 38,286 | | | | 17,217 | | | | 6,134 | |
General and administrative: | | | | | | | | | | | | |
Engineering and product development | | | 34,701 | | | | 13,922 | | | | 3,994 | |
Other | | | 82,367 | | | | 20,518 | | | | 7,980 | |
| | | | | | | | | | | | |
Total operating expenses | | | 242,632 | | | | 90,694 | | | | 32,831 | |
| | | | | | | | | | | | |
Income (loss) before income taxes | | | (31,504 | ) | | | 7,308 | | | | (4,238 | ) |
Income tax expense | | | 1,390 | | | | — | | | | — | |
| | | | | | | | | | | | |
Net income (loss) | | $ | (32,894 | ) | | $ | 7,308 | | | $ | (4,238 | ) |
| | | | | | | | | | | | |
|
| | | | | | | | | | | |
| Year Ended December 31, | 2016 | | 2015 | | 2014 |
| Net operating revenue: | | | | | |
| Transaction fees | $ | 423,494 |
| | $ | 373,508 |
| | $ | 197,124 |
|
| Servicing fees | 68,009 |
| | 32,811 |
| | 11,534 |
|
| Management fees | 11,638 |
| | 10,976 |
| | 5,957 |
|
| Other revenue (expense) | (7,674 | ) | | 9,402 |
| | (1,203 | ) |
| Total net operating revenue | 495,467 |
| | 426,697 |
| | 213,412 |
|
| Net interest income (expense) and fair value adjustments | 5,345 |
| | 3,246 |
| | (2,284 | ) |
| Total net revenue | 500,812 |
| | 429,943 |
| | 211,128 |
|
Operating expenses: (1) | | | | | |
| Sales and marketing | 216,670 |
| | 171,526 |
| | 85,652 |
|
| Origination and servicing | 74,760 |
| | 61,335 |
| | 37,326 |
|
| Engineering and product development | 115,357 |
| | 77,062 |
| | 38,518 |
|
| Other general and administrative | 207,172 |
| | 122,182 |
| | 81,136 |
|
| Goodwill impairment | 37,050 |
| | — |
| | — |
|
| Total operating expenses | 651,009 |
| | 432,105 |
| | 242,632 |
|
| Loss before income tax expense | (150,197 | ) | | (2,162 | ) | | (31,504 | ) |
| Income tax (benefit) expense | (4,228 | ) | | 2,833 |
| | 1,390 |
|
| Net loss | $ | (145,969 | ) | | $ | (4,995 | ) | | $ | (32,894 | ) |
| |
(1) | Includes stock-based compensation expense as follows: |
| | | | | | | | | | | | |
| | | Year Ended
December 31,
2014 | | | Year Ended
December 31,
2013 | | | 9 Months Ended
December 31,
2012 | |
Sales and marketing | | $ | 6,058 | | | $ | 1,313 | | | $ | 216 | |
Origination and servicing | | | 2,140 | | | | 424 | | | | 60 | |
General and administrative: | | | | | | | | | | | | |
Engineering and product development | | | 5,311 | | | | 2,171 | | | | 406 | |
Other | | | 23,641 | | | | 2,375 | | | | 428 | |
| | | | | | | | | | | | |
Total stock-based compensation expense | | $ | 37,150 | | | $ | 6,283 | | | $ | 1,110 | |
| | | | | | | | | | | | |
|
| | | | | | | | | | | |
| Year Ended December 31, | 2016 | | 2015 | | 2014 |
| Sales and marketing | $ | 7,546 |
| | $ | 7,250 |
| | $ | 5,476 |
|
| Origination and servicing | 4,159 |
| | 2,735 |
| | 1,653 |
|
| Engineering and product development | 19,858 |
| | 11,335 |
| | 6,445 |
|
| Other general and administrative | 37,638 |
| | 29,902 |
| | 23,576 |
|
| Total stock-based compensation expense | $ | 69,201 |
| | $ | 51,222 |
| | $ | 37,150 |
|
LENDINGCLUB CORPORATION
Management's Discussion and Analysis of Financial Condition and Results of Operations
(Tabular Amounts in Thousands, Except Share and Per Share Data and Ratios, or as Noted)
Total Net Revenue
(in thousands, except percentages) | | | | | | | | | | | | | | | | |
| | | Year Ended
December 31,
2014 | | | Year Ended
December 31,
2013 | | | Change ($) | | | Change (%) | |
Transaction fees | | $ | 197,124 | | | $ | 85,830 | | | $ | 111,294 | | | | 130 | % |
Servicing fees | | | 11,534 | | | | 3,951 | | | | 7,583 | | | | 192 | % |
Management fees | | | 5,957 | | | | 3,083 | | | | 2,874 | | | | 93 | % |
Other revenue (expense) | | | (1,203 | ) | | | 5,111 | | | | (6,314 | ) | | | (124 | %) |
| | | | | | | | | | | | | | | | |
Total operating revenue | | | 213,412 | | | | 97,975 | | | | 115,437 | | | | 118 | % |
Net interest income (expense) and other adjustments | | | (2,284 | ) | | | 27 | | | | (2,311 | ) | | | N/M | |
| | | | | | | | | | | | | | | | |
Total net revenue | | $ | 211,128 | | | $ | 98,002 | | | $ | 113,126 | | | | 115 | % |
| | | | | | | | | | | | | | | | |
| | | | |
| | | Year Ended
December 31,
2013 | | | 9 Months Ended
December 31,
2012 | | | Change ($) | | | Change (%) | |
Transaction fees | | $ | 85,830 | | | $ | 26,013 | | | $ | 59,817 | | | | 230 | % |
Servicing fees | | | 3,951 | | | | 1,474 | | | | 2,477 | | | | 168 | % |
Management fees | | | 3,083 | | | | 720 | | | | 2,363 | | | | 328 | % |
Other revenue | | | 5,111 | | | | 720 | | | | 4,391 | | | | N/M | |
| | | | | | | | | | | | | | | | |
Total operating revenue | | | 97,975 | | | | 28,927 | | | | 69,048 | | | | 239 | % |
Net interest income (expense) and other adjustments | | | 27 | | | | (334 | ) | | | 361 | | | | 108 | % |
| | | | | | | | | | | | | | | | |
Total net revenue | | $ | 98,002 | | | $ | 28,593 | | | $ | 69,409 | | | | 243 | % |
| | | | | | | | | | | | | | | | |
|
| | | | | | | | | | | | | | |
| Year Ended December 31, | 2016 | | 2015 | | Change ($) | | Change (%) |
| Transaction fees | $ | 423,494 |
| | $ | 373,508 |
| | $ | 49,986 |
| | 13 | % |
| Servicing fees | 68,009 |
| | 32,811 |
| | 35,198 |
| | 107 | % |
| Management fees | 11,638 |
| | 10,976 |
| | 662 |
| | 6 | % |
| Other revenue (expense) | (7,674 | ) | | 9,402 |
| | (17,076 | ) | | (182 | )% |
| Total net operating revenue | 495,467 |
| | 426,697 |
| | 68,770 |
| | 16 | % |
| Net interest income and fair value adjustments | 5,345 |
| | 3,246 |
| | 2,099 |
| | 65 | % |
| Total net revenue | $ | 500,812 |
| | $ | 429,943 |
| | $ | 70,869 |
| | 16 | % |
| | | | | | | | |
| Year Ended December 31, | 2015 | | 2014 | | Change ($) | | Change (%) |
| Transaction fees | $ | 373,508 |
| | $ | 197,124 |
| | $ | 176,384 |
| | 89 | % |
| Servicing fees | 32,811 |
| | 11,534 |
| | 21,277 |
| | 184 | % |
| Management fees | 10,976 |
| | 5,957 |
| | 5,019 |
| | 84 | % |
| Other revenue (expense) | 9,402 |
| | (1,203 | ) | | 10,605 |
| | N/M |
|
| Total net operating revenue | 426,697 |
| | 213,412 |
| | 213,285 |
| | 100 | % |
| Net interest income (expense) and fair value adjustments | 3,246 |
| | (2,284 | ) | | 5,530 |
| | N/M |
|
| Total net revenue | $ | 429,943 |
| | $ | 211,128 |
| | $ | 218,815 |
| | 104 | % |
Our primary sources of
net revenue
consistconsists of fees
chargedreceived for transactions through or related to our
marketplace. Our feesmarketplace and include transaction, servicing and management fees.
Transaction fees are fees paid by issuing banks or education and patient service providers to us for the work we perform through our platform and Springstone’s platform.marketplace’s role in facilitating loans for our issuing bank partners. The amount of these fees is based upon the terms of the loan, including grade, rate, term and other factors. As of December 31, 2014,2016, these fees ranged from 1% to 6%7% of the initial principal amount of a loan. In addition, for education and patient finance loans, transaction fees may exceed 6% as they includewe also collect fees earned from issuing banks and service providers. TheseWe record transaction fee revenue net of program fees are recognizedpaid to WebBank, our issuing bank partner.
In March 2016, we increased the transaction fee that we earn from our primary issuing bank partner for certain prime and near-prime C through G graded personal loans from 5% to 6%, B graded personal loans from 4% to 5%, and A graded personal loans by approximately 1% at each subgrade level for grades A2 to A5. Depending upon the borrower impact of these fee changes, these fees may be modified in order to maintain overall platform balance between borrowers and investors. Additional transaction fee increases were made for A graded personal loans by approximately 1% at each subgrade level for grades A2 to A5 in June 2016.
Transaction fees increased $50.0 million, or 13%, in 2016 from 2015, primarily due to a higher average transaction fee paid during 2016. The average transaction fee as a
component of operating revenue at the time of loan issuance.Effective July 1, 2013, we elected to account for loans we intend to sell to whole loan purchasers at fair value. Under this election, the purchase of such loans is recorded at fair value and all related transactions fees and costs are recorded when earned or incurred, respectively. Prior to this change, from December 1, 2012 through June 30, 2013, transaction fees and costs were included in the computationpercentage of the gain or loss on the saleinitial principal balance of the loan which was recorded4.9% in other revenue2016, compared to 4.5% in the consolidated statement of operations. As such, transaction fees are now reflected in transaction fees and not in other revenue on the statement of operations. In accordance with GAAP, for this type of accounting change, we are not permitted to reclassify the prior period amounts to conform to this current presentation.
Transaction fees were $197.1 million and $85.8 million2015. Additionally, loans facilitated through our marketplace increased from $8.4 billion for the fiscal yearsyear ended December 31, 2014 and 2013, respectively,2015 to $8.7 billion for the year ended December 31, 2016, an increase of 130%3.6%.
LENDINGCLUB CORPORATION
Management's Discussion and Analysis of Financial Condition and Results of Operations
(Tabular Amounts in Thousands, Except Share and Per Share Data and Ratios, or as Noted)
Transaction fees increased $176.4 million, or 89%, in 2015 from 2014. The increase was primarily due to an increase in loans facilitated through our marketplace from
$2,064.6 million$4.4 billion for the year ended December 31,
20132014 to
$4,377.5 million for the fiscal year ended December 31, 2014, an increase of 112%. In addition,$8.4 billion for the year ended December 31,
2013, $4.9 million in transaction fees were included in the gain on sale2015, an increase of
whole loans, which was included in other revenue prior to accounting for whole loans at fair value in the third quarter of 2013.91%. The average transaction
feesfee as a percentage of the initial principal balance of the loan
includingwas 4.5% for both the
$4.9 million in other revenue, were 4.5% and 4.4% for the fiscal years ended December 31,
20142015 and
2013, respectively. The increase was primarily due to higher percentages of 60-month loans and loans with higher risk grades, each of which have higher corresponding transaction fees.Transaction fees were $85.8 million and $26.0 million for the fiscal year ended December 31, 2013 and the nine months ended December 31, 2012, respectively, an increase of 230%. The increase in these fees was primarily due to an increase in loans originated through our marketplace from $608.3 million for the nine months ended December 31, 2012 to $2,064.6 million for the fiscal year ended December 31, 2013, an increase of 239%. 2014.
In
addition, for the year ended December 31, 2013, $4.9January 2017, we recognized approximately $6.1 million in transaction
fees were includedfee revenue associated with the issuance of loans in
which the
gain on sale of whole loans, which was included in other revenueloan application process had commenced prior to
accounting for wholethe end of 2016. In January 2016, we recognized approximately $2.7 million in transaction fee revenue associated with the issuance of loans
at fair value in
the third quarter of 2013. The average transaction fees as a percentage of the initial principal balance ofwhich the loan
includingapplication process had commenced prior to the $4.9end of 2015. In January 2015, we recognized approximately $8.7 million in othertransaction fee revenue were 4.4% and 4.3% forassociated with the fiscal year ended December 31, 2013 andissuance of loans in which the nine months ended December 31, 2012, respectively. The increase was primarily dueloan application process had commenced prior to higher percentagesthe end of 60-month loans and loans with higher risk grades, each of which have higher corresponding transaction fees.
2014.
Servicing fees paid to us vary based on investment channel.
Note investors pay us a servicing fee equal to 1% of each payment amount received from the borrower and whole loan purchasers pay a monthly servicing fee up to 1.3% per annum on the outstanding month-end principal balance of loans serviced. The servicing fee compensatesServicing fees compensate us for the costs we incur in servicing the related loan, including managing payments from borrowers,
collections, payments to investors and maintaining investors’ account portfolios.
We record The amount of servicing assetsrevenue earned is predominantly affected by the various servicing rates paid by note and liabilities at their estimated fair values when we sell whole loans to unrelated third parties or when the servicing contract commences. Over the life of the loan changesinvestors in the estimated fair value of servicing assets and liabilities are included in servicing fees in the period in which the changes occur.
The following table providesapplicable investment channels, the outstanding principal balance of whole loans serviced, and the amount of principal and interest collected from borrowers and remitted to note and certain certificate investors. Additionally, servicing fee revenue includes the change in fair value of our servicing assets and liabilities associated with loans that we serviced atsell.
Servicing rights are recorded as either an asset or liability depending on the
enddegree to which the contractual loan servicing fee is above or below, respectively, an estimated market rate loan servicing fee. During the second quarter of 2016, we increased our assumption of the
periods indicated,market rate of loan servicing from 57 basis points per annum to 63 basis points per annum, based on review of estimated third-party servicing rates and market servicing benchmarking analyses provided by
the method that the loans were financed (in millions): | | | | | | | | | | | | |
December 31, | | 2014 | | | 2013 | | | 2012 | |
| | | (unaudited) | |
Notes | | $ | 1,055.2 | | | $ | 688.3 | | | $ | 397.1 | |
Certificates | | | 1,796.6 | | | | 1,171.7 | | | | 398.7 | |
Whole loans sold | | | 1,873.7 | | | | 406.9 | | | | 10.1 | |
| | | | | | | | | | | | |
Total | | $ | 4,725.5 | | | $ | 2,266.9 | | | $ | 805.9 | |
| | | | | | | | | | | | |
Servicing fees were $11.5 million and $4.0 million for the years ended December 31, 2014 and 2013, respectively, an increase of 192%. Servicing fees earned from whole loan sales were $4.2 million and $0.3 million for the years ended December 31, 2014 and 2013, respectively. Servicing fees earned from retail investors were $5.9 million and $3.5 million for the years ended December 31, 2014 and 2013, respectively, an increase of 69%.two third-party valuation firms. The increase in the assumption of a market rate of loan servicing fees wascaused the value of our servicing rights to decrease. The recording of the change in fair value of servicing rights does not affect the contractual servicing rates that we collect from the whole loan investors on a monthly basis.
Servicing fee revenue has increased during each of the last three years due to
increasedincreases in both the balances of
whole loans sold and the loan balances that underlie the notes and
certificates and sold loans outstanding serviced by us for the year ended December 31, 2014 as compared to the year ended December 31, 2013. Servicing fees were $4.0 million and $1.5 million for the fiscal year ended December 31, 2013 and the nine months ended December 31, 2012, respectively, an increase of 168%. Servicing fees earned from retail investors were $3.5 million and $1.5 million for the year ended December 31, 2013 and nine months ended December 31, 2012, respectively, an increase of 133%. There were no servicing fees earned from whole loan sales during the nine months ended December 31, 2012. The increase in servicing fees was primarily due to increased balances of notes and certificates and sold loans outstanding serviced by us for the fiscal year ended December 31, 2013 as compared to the nine months ended December 31, 2012.certificates. The table below illustrates the composition of servicing fees by source for each period presented (in thousands):
| | | | | | | | | | | | |
December 31, | | Year Ended
December 31,
2014 | | | Year Ended
December 31,
2013 | | | 9 Months Ended
December 31,
2012 | |
Note and certificate servicing fees | | $ | 5,952 | | | $ | 3,533 | | | $ | 1,474 | |
Servicing fees related to whole loans sold | | | 4,162 | | | | 303 | | | | — | |
| | | | | | | | | | | | |
Total servicing fees before change in fair value of servicing assets and liabilities | | | 10,114 | | | | 3,836 | | | | 1,474 | |
| | | | | | | | | | | | |
Change in fair value of servicing assets and liabilities, net | | | 1,420 | | | | 115 | | | | — | |
| | | | | | | | | | | | |
Total servicing fees | | $ | 11,534 | | | $ | 3,951 | | | $ | 1,474 | |
| | | | | | | | | | | | |
presented:
|
| | | | | | | | | | |
| Year Ended December 31, | 2016 | | 2015 | | Change (%) |
| Servicing fees related to whole loans sold | $ | 48,058 |
| | $ | 17,846 |
| | 169 | % |
| Note and certificate servicing fees | 20,856 |
| | 13,573 |
| | 54 | % |
| Servicing fees before change in fair value of servicing assets and liabilities | 68,914 |
| | 31,419 |
| | 119 | % |
| Change in fair value of servicing assets and liabilities, net | (905 | ) | | 1,392 |
| | (165 | )% |
| Total servicing fees | $ | 68,009 |
| | $ | 32,811 |
| | 107 | % |
LENDINGCLUB CORPORATION
Management's Discussion and Analysis of Financial Condition and Results of Operations
(Tabular Amounts in Thousands, Except Share and Per Share Data and Ratios, or as Noted)
|
| | | | | | | | | | |
| Year Ended December 31, | 2015 | | 2014 | | Change (%) |
| Servicing fees related to whole loans sold | $ | 17,846 |
| | $ | 4,162 |
| | N/M |
|
| Note and certificate servicing fees | 13,573 |
| | 5,952 |
| | 128 | % |
| Servicing fees before change in fair value of servicing assets and liabilities | 31,419 |
| | 10,114 |
| | N/M |
|
| Change in fair value of servicing assets and liabilities, net | 1,392 |
| | 1,420 |
| | (2 | )% |
| Total servicing fees | $ | 32,811 |
| | $ | 11,534 |
| | 184 | % |
N/M – Not meaningful
Management Fees
Certain investors can invest
Investors in
investment funds managed by
LCA. LCA,
typically charges these investorspay a monthly management fee based on the month-end balance of their assets under management,
ranging from 0.7%up to 1.5% per annum.
This fee may be waived or reduced for individual limited partners at the discretion of the general partner. LCA does not earn any carried interest from the investment funds. For managed account certificate holders, LCA earns a management fee
typically ranging from 0.85%of up to 1.2% per annum of the month-end balance of their assets under management.
This feeAny of these fees may be waived or reduced at the discretion of LCA.
A significant portion of the management fees are earned from the funds that are managed by LCA. We currently anticipate that the assets under management associated with these funds will decrease as a result of a significant amount of redemption requests received, however, some redeeming investors may move their investment to other LCA funds. This potential reduction will negatively affect management fee revenue. At December 31, 2016, the aggregate assets of these funds were $767.3 million and outstanding aggregate redemption requests totaled $468.1 million. These redemption requests are currently being limited pursuant to the terms of the respective limited partnership agreements.
Management fees were $6.0$11.6 million and $3.1$11.0 million for the years ended December 31, 20142016 and 2013,2015, respectively, an increase of 93%6%. The increase in management fee revenue was due to a higher average management fee rate for the period, while the overall total assets under management decreased.
Management fees were $11.0 million and $6.0 million for the years ended December 31, 2015 and 2014, respectively, an increase of 84%. The increase in management fees was due primarily to an increase in the total assets under management and outstanding certificate balances.
Management fees were $3.1 million and $0.7 million for the fiscal year ended December 31, 2013 and the nine months ended December 31, 2012, respectively, an increase of 328%. The increase in management fees was due primarily to an increase in the total assets under management and outstanding certificate balances.
Other revenue (expense) primarily consists of gains and losses on sales of whole loans, incentives offered to purchasers of whole loans in the second and third quarters of 2016, and referral revenue. Certain investors investing through our marketplace acquire Standard or Custom Program Loans in their entirety.revenue earned from partner companies when customers referred by Lending Club complete specified actions with them. In connection with these whole loan sales, in addition to the transaction feeand servicing fees earned inwith respect ofto the corresponding loan, we recognize a gain or loss on the sale of that loan based on the degree to which the contractual loan servicing fee is above or below an estimated market rate loan servicing fee (loans are typically sold at par). From December 1, 2012 through June 30, 2013, we included in the gain calculation on whole loan sales the amount of the transaction fees earned in respect of those loans, resulting in higher gains on sale and lower transaction fees.fee. Referral revenue consists of fees earned from partnerthird-party companies when customers referred by us complete specified actions with a partner company. such third-party companies.
The
specified action may range from clicking on a link to visit a partner company’s website to obtaining a loan fromtable below illustrates the
partner company.composition of other revenue for each period presented:
|
| | | | | | | | | | | |
| Year Ended December 31, | 2016 | | 2015 | | 2014 |
| Gain (loss) on sales of loans | $ | (17,152 | ) | | $ | 4,885 |
| | $ | (3,569 | ) |
| Referral revenue | 5,934 |
| | 4,332 |
| | 2,298 |
|
| Other | 3,544 |
| | 185 |
| | 68 |
|
| Other revenue (expense) | $ | (7,674 | ) | | $ | 9,402 |
| | $ | (1,203 | ) |
LENDINGCLUB CORPORATION
Management's Discussion and Analysis of Financial Condition and Results of Operations
(Tabular Amounts in Thousands, Except Share and Per Share Data and Ratios, or as Noted)
Other revenue (expense) was $(1.2)$(7.7) million and $5.1$9.4 million for the years ended December 31, 20142016 and 2013, respectively, a2015, respectively. This decrease of 124%. This was primarily attributable to a change in the investor base that we sold whole loans to and the effect of the change in accounting for transaction fees. Other revenue was $5.1 million and $0.7 million for the year ended December 31, 2013 and2016 compared to the nine months ended December 31, 2012, respectively. The increasesame period in other revenue 2015
was primarily due to a $3.5the sale of loans that resulted in approximately $14.0 million and $10.7 million of incentives provided to investors in the second and third quarters of 2016, respectively. Prior to the second quarter of 2016, we had not historically provided such incentives and the Company does not currently intend to provide incentives going forward.
Other revenue (expense) was $9.4 million and $(1.2) million for the years ended December 31, 2015 and 2014, respectively. This increase
for the year ended December 31, 2015 compared to the same period in
gain2014 was primarily due to gains on
salesales of whole loans
to unrelated purchasers. The $3.5 million increase included $4.9 million in
transaction fees, which are included2015 and increases in
the gain on sale of whole loans from January 1, 2013 to June 30, 2013.The table below illustrates the composition of Other revenue (expense) for each period presented (in thousands):
| | | | | | | | | | | | |
December 31, | | Year Ended
December 31,
2014 | | | Year Ended
December 31,
2013 | | | 9 Months Ended
December 31,
2012 | |
Referral revenue | | $ | 2,298 | | | $ | 1,170 | | | $ | 259 | |
Gain (loss) on sold loans | | | (3,569 | ) | | | 3,862 | | | | 329 | |
Other | | | 68 | | | | 79 | | | | 132 | |
| | | | | | | | | | | | |
Other revenue (expense) | | $ | (1,203 | ) | | $ | 5,111 | | | $ | 720 | |
| | | | | | | | | | | | |
referral revenue.
Net Interest Income (Expense) and OtherFair Value AdjustmentsWe
|
| | | | | | | | | | | |
| Year Ended December 31, | 2016 | | 2015 | | 2014 |
| Net interest income (expense) | $ | 8,294 |
| | $ | 3,232 |
| | $ | (2,162 | ) |
| Net fair value adjustments | (2,949 | ) | | 14 |
| | (122 | ) |
| Net interest income (expense) and fair value adjustments | $ | 5,345 |
| | $ | 3,246 |
| | $ | (2,284 | ) |
Except as set forth below, we generally do not assume principal or interest risk on loans facilitated through our marketplace because loan balances, interest rates and maturities are matched and offset by an equal balance of notes and certificates with the exact same interest rates and maturities. We only make principal and interest payments on notes and certificates to the extent that we receive borrower payments on
corresponding loans. As a servicer, we are only required to deliver borrower payments to the extent that we actually receive
them .them. As a result, on our statement of operations for any period and balance sheet as of any date, (i) interest income on loans corresponds to the interest expense on notes and certificates and (ii) loan balances correspond to note and certificate balances with variations resulting from timing differences between the crediting of principal and interest payments on loans and the disbursement of those payments to
investors.We may make limited loan investments without issuing a corresponding note orand certificate to investors, resultingholders. Interest income on loans the Company purchased is recorded in differences between interest income from loans and interest expense from notes and certificates on ourthe consolidated statement of operations without corresponding interest expense.
LENDINGCLUB CORPORATION
Management's Discussion and total loansAnalysis of Financial Condition and notesResults of Operations
(Tabular Amounts in Thousands, Except Share and
certificates balances on our balance sheets. These loan investments have been related primarily to customer accommodationsPer Share Data and
have not been material. We do not anticipate that such investments will be material in the foreseeable future.Ratios, or as Noted)
Additionally, interest income (expense) includes interest income earned on cash and cash equivalents and
interest expense incurredthe securities available for sale portfolio. Our investment policy and strategy is focused first on
the preservation of capital and supporting our
term loan.liquidity requirements, and then maximizing returns. The following tables provide additional detail related to
net interest
generating assets and liabilitiesincome (expense) and fair value
adjustments (in thousands): | | | | | | | | | | | | | | | | |
| | | Year Ended
December 31,
2014 | | | Year Ended
December 31,
2013 | | | Change ($) | | | Change (%) | |
Interest income: | | | | | | | | | | | | | | | | |
Loans | | $ | 354,424 | | | $ | 187,495 | | | $ | 166,929 | | | | 89 | % |
Cash and cash equivalents | | | 29 | | | | 12 | | | | 17 | | | | 142 | % |
| | | | | | | | | | | | | | | | |
Total interest income | | | 354,453 | | | | 187,507 | | | | 166,946 | | | | 89 | % |
| | | | | | | | | | | | | | | | |
Interest expense: | | | | | | | | | | | | | | | | |
Notes and certificates | | | (354,334 | ) | | | (187,447 | ) | | | (166,887 | ) | | | (89 | %) |
Term loan | | | (2,281 | ) | | | — | | | | (2,281 | ) | | | (100 | %) |
| | | | | | | | | | | | | | | | |
Total interest expense | | | (356,615 | ) | | | (187,447 | ) | | | (169,168 | ) | | | (90 | %) |
| | | | | | | | | | | | | | | | |
Net interest income (expense) | | | (2,162 | ) | | | 60 | | | | (2,222 | ) | | | N/M | |
Fair value adjustments on loans, notes and certificates, net | | | (122 | ) | | | (33 | ) | | | (89 | ) | | | (270 | %) |
| | | | | | | | | | | | | | | | |
Net interest income (expense) and other adjustments | | $ | (2,284 | ) | | $ | 27 | | | $ | (2,311 | ) | | | N/M | |
| | | | | | | | | | | | | | | | |
Average outstanding balances: | | | | | | | | | | | | | | | | |
Loans | | $ | 2,377,526 | | | $ | 1,278,631 | | | $ | 1,098,895 | | | | 86 | % |
Notes and certificates | | $ | 2,389,747 | | | $ | 1,285,764 | | | $ | 1,103,983 | | | | 86 | % |
adjustments:
|
| | | | | | | | | | | | | | |
| Year Ended December 31, | 2016 | | 2015 | | Change ($) | | Change (%) |
| Interest income: | | | | | | | |
| Loans and loans held for sale | $ | 691,590 |
| | $ | 549,782 |
| | $ | 141,808 |
| | 26 | % |
| Securities available for sale | 3,244 |
| | 2,143 |
| | 1,101 |
| | 51 | % |
| Cash and cash equivalents | 1,828 |
| | 1,047 |
| | 781 |
| | 75 | % |
| Total interest income | 696,662 |
| | 552,972 |
| | 143,690 |
| | 26 | % |
| Interest expense: | | | | | | | |
| Notes and certificates | (688,368 | ) | | (549,740 | ) | | (138,628 | ) | | 25 | % |
| Total interest expense | (688,368 | ) | | (549,740 | ) | | (138,628 | ) | | 25 | % |
| Net interest income | $ | 8,294 |
| | $ | 3,232 |
| | $ | 5,062 |
| | 157 | % |
| Average outstanding balances: | | | | | | | |
| Loans | $ | 4,740,954 |
| | $ | 3,821,448 |
| | $ | 919,506 |
| | 24 | % |
| Loans held for sale | $ | 10,393 |
| | $ | — |
| | $ | 10,393 |
| | N/M |
|
| Notes and certificates | $ | 4,753,757 |
| | $ | 3,840,241 |
| | $ | 913,516 |
| | 24 | % |
| | | | | | | | | | | | | | | | |
| | | Year Ended
December 31,
2013 | | | 9 Months Ended
December 31,
2012 | | | Change ($) | | | Change (%) | |
Interest income: | | | | | | | | | | | | | | | | |
Loans | | $ | 187,495 | | | $ | 56,829 | | | $ | 130,666 | | | | 230 | % |
Cash and cash equivalents | | | 12 | | | | 32 | | | | (20 | ) | | | (63 | %) |
| | | | | | | | | | | | | | | | |
Total interest income | | | 187,507 | | | | 56,861 | | | | 130,646 | | | | 230 | % |
| | | | | | | | | | | | | | | | |
Interest expense: | | | | | | | | | | | | | | | | |
Notes and certificates | | | (187,447 | ) | | | (56,631 | ) | | | (130,816 | ) | | | (231 | %) |
Loans payable | | | — | | | | (11 | ) | | | 11 | | | | 100 | % |
| | | | | | | | | | | | | | | | |
Total interest expense | | | (187,447 | ) | | | (56,642 | ) | | | (130,805 | ) | | | (231 | %) |
| | | | | | | | | | | | | | | | |
Net interest income | | | 60 | | | | 219 | | | | (159 | ) | | | (73 | %) |
Fair value adjustments on loans, notes and certificates, net | | | (33 | ) | | | (595 | ) | | | 562 | | | | 94 | % |
Benefit from loss reversal on loans at amortized cost | | | — | | | | 42 | | | | (42 | ) | | | (100 | %) |
| | | | | | | | | | | | | | | | |
Net interest income (expense) and other adjustments | | $ | 27 | | | $ | (334 | ) | | $ | 361 | | | | 108 | % |
| | | | | | | | | | | | | | | | |
Average outstanding balances: | | | | | | | | | | | | | | | | |
Loans | | $ | 1,278,631 | | | $ | 551,923 | | | $ | 726,708 | | | | 132 | % |
Notes and certificates | | $ | 1,285,764 | | | $ | 552,523 | | | $ | 733,241 | | | | 133 | % |
For
|
| | | | | | | | | | | | | | |
| Year Ended December 31, | 2015 | | 2014 | | Change ($) | | Change (%) |
| Interest income: | | | | | | | |
| Loans | $ | 549,782 |
| | $ | 354,424 |
| | $ | 195,358 |
| | 55 | % |
| Securities available for sale | 2,143 |
| | — |
| | 2,143 |
| | N/M |
|
| Cash and cash equivalents | 1,047 |
| | 29 |
| | 1,018 |
| | N/M |
|
| Total interest income | 552,972 |
| | 354,453 |
| | 198,519 |
| | 56 | % |
| Interest expense: | | | | | | | |
| Notes and certificates | (549,740 | ) | | (354,334 | ) | | (195,406 | ) | | 55 | % |
| Term loan | — |
| | (2,281 | ) | | 2,281 |
| | N/M |
|
| Total interest expense | (549,740 | ) | | (356,615 | ) | | (193,125 | ) | | 54 | % |
| Net interest income (expense) | $ | 3,232 |
| | $ | (2,162 | ) | | $ | 5,394 |
| | N/M |
|
| Average outstanding balances: | | | | | | | |
| Loans | $ | 3,821,448 |
| | $ | 2,377,526 |
| | $ | 1,443,922 |
| | 61 | % |
| Notes and certificates | $ | 3,840,241 |
| | $ | 2,389,747 |
| | $ | 1,450,494 |
| | 61 | % |
N/M - Not meaningful
Interest income from loans was $691.6 million, $549.8 million and $354.4 million for the years ended December 31, 20142016, 2015 and 2013, interest income from loans was $354.4 million and $187.5 million,2014, respectively. The increase in interest income was primarily due to the increase in the average outstanding balances of loans. Forloans and loans held for sale, including the fiscal year ended December 31, 2013outstanding principal balance of loans invested in by the Company for which there was no offsetting interest expense.
Interest expense for notes and the nine months ended December 31, 2012, interest income from loanscertificates was $187.5$688.4 million, $549.7 million and $56.8$354.3 million respectively. The increase in interest income was primarily due to the increase in the outstanding balances of loans.Forfor the years ended December 31, 20142016, 2015 and 2013, we recorded interest expense for notes and certificates of $354.3 million and $187.4 million,2014, respectively. The increase in interest expense was primarily due to the increase in the average outstanding balances of notes and certificates. For the fiscal year ended December 31, 2013 and the nine months ended December 31, 2012, we recorded interestInterest expense for notes and certificates of $187.4 million and $56.6 million, respectively. The increase in interest expense was primarily due to the increase in the outstanding balances of notes and certificates.
For the year ended December 31, 2014 we incurred debt issuance costs of $1.2 million primarily related to underwriting fees, debt discount costs of $0.2 million andalso included interest expense of $0.9$2.3 million related to ourassociated with a term loan whichthat was paid offoutstanding for approximately 8 months in December 2014. We did not incur any interest expense for thehave a term loan during the year ended December 31, 2013in 2016
or the nine months ended December 31, 2012.
2015.
LENDINGCLUB CORPORATION
Management's Discussion and Analysis of Financial Condition and Results of Operations
(Tabular Amounts in Thousands, Except Share and Per Share Data and Ratios, or as Noted)
Fair Value Adjustments on Loans, Notes and CertificatesCertificates:
The changes in fair value of loans, notes and certificates are shown on our consolidated statement of operations on a net basis. Due to the payment dependent feature of the notes and certificates, fair value adjustments on loans that are invested in by third-parties through the marketplace are offset by the fair value adjustments on the notes and certificates, resulting in no net effect on our earnings. Fair value adjustments on loans we purchased have an effect on earnings. We estimate the fair value of loans and their related notes and certificates using a discounted cash flow valuation methodology that is described in “Part II – Item 8 – Financial Statements and Supplementary Data – Note 2-2. Summary of Significant Accounting PoliciesPolicies.”. The changes in
Net fair value
of loans, notes and certificates are shownadjustments were $(2.9) million for the year ended December 31, 2016, primarily due to losses on
our consolidated statement of operations on a gross basis. Due to the payment dependent feature of the notes and certificates, fair value adjustments on
the loans
are offsetpurchased by the
Company in 2016 for which there were no offsetting gains from fair value adjustments. Net fair value adjustments
onwere immaterial for the
notes and certificates, resulting in no net effect on our earnings. From time to time, however, we may make limited loan investments without us issuing a corresponding note or certificate to investors, resulting in differences between total interest income and expense amounts on our statement of operations and total loans and notes and certificates balances on our balance sheets. These loan investments have been related primarily to customer accommodations and have been insignificant. We do not anticipate that such investments will be material in the foreseeable future.Prior to September 2011, we accounted for certain loans at amortized cost, reduced by a valuation allowance for loan losses incurred as of the balance sheet date. We recorded benefits for losses on loans at amortized cost of $42,000 during the nine monthsyears ended December 31, 2012. No benefit related to such loans was recorded in 2013 or2015 and 2014. The balance of loans at amortized cost declined to zero as of December 31, 2012.
TheDuring 2015 and 2014, the losses from fair value adjustments on loans were largely offset by the gains from fair value adjustments on notes and certificates due to the borrower payment dependent design of the notes and certificates and due to the principal balances of the loans being similar to the combined principal balances of the notes and certificates. Accordingly, the net fair value adjustments were $0.1 million, $33,000 and $0.6 million for the years ended December 31, 2014 and 2013 and the nine months ended December 31, 2012, respectively.
Operating Expenses
(in thousands, except percentages) | | | | | | | | | | | | | | | | |
| | | Year Ended
December 31,
2014 | | | Year Ended
December 31,
2013 | | | Change ($) | | | Change (%) | |
Sales and marketing | | $ | 87,278 | | | $ | 39,037 | | | $ | 48,241 | | | | 124 | % |
Origination and servicing | | | 38,286 | | | | 17,217 | | | | 21,069 | | | | 122 | % |
General and administrative: | | | | | | | | | | | | | | | | |
Engineering and product development | | | 34,701 | | | | 13,922 | | | | 20,779 | | | | 149 | % |
Other | | | 82,367 | | | | 20,518 | | | | 61,849 | | | | 301 | % |
| | | | | | | | | | | | | | | | |
Total operating expenses | | $ | 242,632 | | | $ | 90,694 | | | $ | 151,938 | | | | 168 | % |
| | | | | | | | | | | | | | | | |
| | | | |
| | | Year Ended
December 31,
2013 | | | 9 Months Ended
December 31,
2012 | | | Change ($) | | | Change (%) | |
Sales and marketing | | $ | 39,037 | | | $ | 14,723 | | | $ | 24,314 | | | | 165 | % |
Origination and servicing | | | 17,217 | | | | 6,134 | | | | 11,083 | | | | 181 | % |
General and administrative: | | | | | | | | | | | | | | | | |
Engineering and product development | | | 13,922 | | | | 3,994 | | | | 9,928 | | | | 249 | % |
Other | | | 20,518 | | | | 7,980 | | | | 12,538 | | | | 157 | % |
| | | | | | | | | | | | | | | | |
Total operating expenses | | $ | 90,694 | | | $ | 32,831 | | | $ | 57,863 | | | | 176 | % |
| | | | | | | | | | | | | | | | |
Our operating expenses consist of sales and marketing, origination and servicing,
and general and administrative expenses, which includes engineering and product development and other general and administrative
expenses.expenses as described below.
Sales and MarketingMarketing:
Sales and marketing expense consists primarily of those related to borrower and investor acquisition. In addition, these include retentionacquisition efforts including costs attributable to marketing and selling our products. This includes costs of building general brand and awareness, building, and salaries, benefits and stock-based compensation expense related to our sales and marketing team.Sales and marketing expense was $87.3 million and $39.0 million for the years ended December 31, 2014 and 2013, respectively, an increase of 124%. The increase was primarily due to a $41.6 million increase in variable marketing expenses driven by higher loan originations and a $6.6 million increase in personnel-related expenses associated with higher headcount levels and acceleration of vesting of stock options for a terminated employee. Sales and marketing expense was $39.0 million and $14.7 million for the fiscal year ended December 31, 2013 and nine months ended December 31, 2012, respectively, an increase of 165%. The increase was primarily due to an $18.7 million increase in variable marketing expenses driven by higher loan originations and a $5.1 million increase in personnel-related expenses.
Origination and ServicingServicing:
Origination and servicing expense consists primarily of salaries, benefits and stock-based compensation expense relatedand vendor costs attributable to ouractivities that most directly relate to originating and servicing loans for borrowers and investors. These costs relate to the credit, collections, customer support and payment processing teams and vendor costs associated with facilitatingrelated vendors.
Engineering and servicing loans.Origination and servicing expense was $38.3 million and $17.2 million for the years ended December 31, 2014 and 2013, respectively, an increase of 122%. The increase was primarily due to a $14.3 million increase in personnel-related expenses and a $6.7 million increase in consumer reporting agency and loan processing costs, both driven by higher loan originations and higher outstanding balance of loans serviced. Origination and servicing expense was $17.2 million and $6.1 million for the fiscal year ended December 31, 2013 and nine months ended December 31, 2012, respectively, an increase of 181%. The increase was primarily due to a $7.3 million increase in personnel-related expenses associated with higher headcount levels and a $3.9 million increase in consumer reporting agency and loan processing costs, both driven by higher loan volumes.
General and Administrative
Product Development:
Engineering and product development expense consists primarily of salaries, benefits and stock-based compensation expense for our engineering and product development teammanagement teams, and the costscost of contractors who work on the development and maintenance of our platform. Engineering and product development expense also includes non-capitalized hardware and software costs and depreciation and amortization of technology assets.
Other General and Administrative: Other general and administrative expense consists primarily of salaries, benefits and stock-based compensation expense for our accounting, and finance, business development, legal, risk, compliance, human resources and facilities teams, professional services fees related to legal and accounting, and facilities expenseexpense.
After announcing the findings of our board review, and the significant decrease in the trading price of our common stock in May 2016, we began offering incentive retention awards to members of the executive management team and other key personnel that totaled $34.9 million and will be recognized as compensation expense relatedratably through May 2017. In addition, we have incurred and expect to continue to incur significant legal, professional service, and other expenses in connection with the acquisitioninquiries and private litigation that have arisen and may continue to arise from the internal board review, and our response to ongoing governmental requests for information.
LENDINGCLUB CORPORATION
Management's Discussion and Analysis of
Springstone.EngineeringFinancial Condition and product developmentResults of Operations
(Tabular Amounts in Thousands, Except Share and Per Share Data and Ratios, or as Noted)
|
| | | | | | | | | | | | | | |
| Year Ended December 31, | 2016 | | 2015 | | Change ($) | | Change (%) |
| Sales and marketing | $ | 216,670 |
| | $ | 171,526 |
| | $ | 45,144 |
| | 26 | % |
| Origination and servicing | 74,760 |
| | 61,335 |
| | 13,425 |
| | 22 | % |
| Engineering and product development | 115,357 |
| | 77,062 |
| | 38,295 |
| | 50 | % |
| Other general and administrative | 207,172 |
| | 122,182 |
| | 84,990 |
| | 70 | % |
| Goodwill impairment | 37,050 |
| | — |
| | — |
| | N/M |
|
| Total operating expenses | $ | 651,009 |
| | $ | 432,105 |
| | $ | 218,904 |
| | 51 | % |
| | | | | | | | |
| | | | | | | | |
| Year Ended December 31, | 2015 | | 2014 | | Change ($) | | Change (%) |
| Sales and marketing | $ | 171,526 |
| | $ | 85,652 |
| | $ | 85,874 |
| | 100 | % |
| Origination and servicing | 61,335 |
| | 37,326 |
| | 24,009 |
| | 64 | % |
| Engineering and product development | 77,062 |
| | 38,518 |
| | 38,544 |
| | 100 | % |
| Other general and administrative | 122,182 |
| | 81,136 |
| | 41,046 |
| | 51 | % |
| Total operating expenses | $ | 432,105 |
| | $ | 242,632 |
| | $ | 189,473 |
| | 78 | % |
Sales and marketing expense was $34.7$216.7 million and $13.9$171.5 million for the years ended December 31, 20142016 and 2013,2015, respectively, an increase of 149%26%. The increase was primarily due to a $34.9 million increase in variable marketing expenses and a $6.5 million increase in personnel-related expenses associated with higher headcount levels as well as retention and severance costs. Sales and marketing expense as a percent of loan originations was 2.5% in 2016 compared to 2.0% in 2015. A portion of this increase may be attributable to the fact that credit policies were tightened resulting in an increase of applications that were declined, thus increasing the cost per acquisition of a new borrower. We expect sales and marketing expense as a percent of loan originations in 2017 to remain at levels generally similar to fiscal year 2016.
Sales and marketing expense was $171.5 million and $85.7 million for the years ended December 31, 2015 and 2014, respectively, an increase of 100%. The increase was primarily due to a $59.9 million increase in variable marketing expenses that drove higher loan originations and a $19.0 million increase in personnel-related expenses associated with higher headcount levels.
Origination and servicing expense was $74.8 million and $61.3 million for the years ended December 31, 2016 and 2015, respectively, an increase of 22%. The increase was primarily due to a $8.1 million increase in personnel-related expenses and a $4.4 million increase in loan processing costs driven by higher loan originations and increased collection efforts.
Origination and servicing expense was $61.3 million and $37.3 million for the years ended December 31, 2015 and 2014, respectively, an increase of 64%. The increase was primarily due to a $12.7 million increase in personnel-related expenses and an $8.9 million increase in consumer reporting agency and loan processing costs, both driven by higher loan originations and a higher outstanding balance of loans serviced.
Engineering and product development expense was $115.4 million and $77.1 million for the years ended December 31, 2016 and 2015, respectively, an increase of 50%. The increase was primarily driven by continued investment in our platform and product development, which included a $14.3$23.8 millionincrease in personnel-related expenses resulting from increased headcount, salaries and retention costs, and a $12.6 million increase in equipment, software and depreciation expense.
Engineering and product development expense was $77.1 million and $38.5 million for the years ended December 31, 2015 and 2014, respectively, an increase of 100%. The increase was primarily driven by investment
LENDINGCLUB CORPORATION
Management's Discussion and Analysis of Financial Condition and Results of Operations
(Tabular Amounts in Thousands, Except Share and Per Share Data and Ratios, or as Noted)
in our platform and product development, which included a $24.0 million increase in personnel-related expenses resulting from increased headcount, and contract labor expense and a $6.3$11.8 million increase in expensed equipment, and software and depreciation expense. Engineering and product development expense was $13.9
We capitalized $41.6 million, $25.4 million and
$4.0 million for the fiscal year ended December 31, 2013 and the nine months ended December 31, 2012, respectively, an increase of 249%. The increase was primarily driven by continued investment in technology infrastructure, which included a $7.1 million increase in personnel-related expenses resulting from increased headcount and contract labor expense and a $2.1 million increase in expensed equipment and software and depreciation expense. We capitalized $12.2
million, $3.8 million and $0.4 million in software development costs for the years ended December 31,
2016, 2015 and 2014,
and 2013 and nine months ended December 31, 2012 respectively.
Other general and administrative expense was $82.4$207.2 million and $20.5$122.2 million for the years ended December 31, 20142016 and 2013,2015, respectively, an increase of 301%70%. The increase was primarily due to a $38.6$39.3 million increase in personnel-related expenses fromlegal, audit, communications, and advisory fees primarily associated with the board review (including investigating the matters identified in the board review), government inquiries, supporting investor due diligence activities, remediation efforts and pending and potential future litigation matters. The increase was also due to a $30.9 millionincrease in salaries and stock-based compensation expense related to increased headcount and salaries of newly hired executives, as we continued to investinvested in back officeinfrastructure and support teams, retention costs, and compensationa $8.6 million increase in facilities expense. Additionally, other general and administrative expense increased by $1.0 million during the year ended December 31, 2016 for stock consideration issued relatedthe LCA reimbursement to the Springstone acquisition. Additionally,Funds' limited partners, as discussed in the increase was due“Board Review” section below.
Although the board review is complete, we expect elevated spending on legal, audit, and advisory fees to $7.9 millioncontinue in 2017 as we remain subject to ongoing litigation and governmental inquiries. The Company has insurance policies that we believe would reimburse the Company for certain covered expenses. The timing and amount of amortization and depreciation expense primarily related to amortization on assets recognized in conjunction with the Springstone acquisition. any such insurance reimbursement is uncertain.
Other general and administrative expense was
$20.5$122.2 million and
$8.0$81.1 million for the
fiscal yearyears ended December 31,
20132015 and
the nine months ended December 31, 2012,2014, respectively, an increase of
157%51%. The increase was primarily due to a
$7.3$51.4 million increase in
personnel-related expenses fromsalaries and stock-based compensation expense related to increased headcount
as we continue to invest in infrastructure and
a $2.3 million increase in rent and facilities expenses.Income Taxes
Provision for income taxessupport teams.
Goodwill Impairment
Goodwill impairment consists of federal and state income taxes ina charge for the United States and deferred income taxes and changes inexcess of the related valuation allowance reflecting the net tax effectsfair value of temporary difference betweengoodwill over the carrying amountsvalue of assetsthe education and liabilitiespatient finance reporting unit.
We recorded a goodwill impairment charge of $37.1 million for financialthe year ended December 31, 2016 related to the education and patient finance reporting purposesunit. There were no goodwill charges recorded for the years ended December 31, 2015 or 2014. See “Item 8 – Financial Statements and Supplementary Data – Note 9. Intangible Assets and Goodwill” for a further description of this impairment charge. If the amounts usedperformance of the education and patient finance reporting unit fails to meet current expectations, it is possible that the carrying value of this reporting unit, even after this impairment charge, will exceed its fair value, which could result in further recognition of a noncash impairment of goodwill that could be material.
Income Taxes
Income tax (benefit) expense was $(4.2) million, $2.8 million, and $1.4 million for
income tax purposes.the years ended December 31, 2016, 2015 and 2014, respectively. For the year ended December 31, 2014, we recorded $1.4 million2016, the income tax benefit was primarily attributable to the tax effects of the impairment of tax-deductible goodwill from the acquisition of Springstone, which previously gave rise to an indefinite-lived deferred tax liability, and the tax effects of unrealized gains credited to other comprehensive income associated with the Company's available for sale portfolio. For the year ended December 31, 2015, income tax expense relatedwas primarily attributable to the amortization of tax deductible goodwill from the acquisition of Springstone, which givesgave rise to an indefinite-lived deferred tax liability.liability, and the realization of excess tax benefits related to stock-based compensation. For the year ended December 31, 2013, we recorded no 2014,
LENDINGCLUB CORPORATION
Management's Discussion and Analysis of Financial Condition and Results of Operations
(Tabular Amounts in Thousands, Except Share and Per Share Data and Ratios, or as Noted)
income tax expense was primarily related to the pre-tax income dueamortization of tax deductible goodwill from the acquisition of Springstone.
As of December 31, 2016 and December 31, 2015, we continued to record a valuation allowance against the availability ofnet deferred tax assets, subjectexcluding the deferred tax liability for indefinite-lived intangibles as of December 31, 2015. As of December 31, 2016 and December 31, 2015, the valuation allowance was $75.3 million and $25.3 million, respectively. We intend to continue maintaining a full valuation allowance on our deferred tax assets until there is sufficient evidence to offset current year income. Forsupport the nine months ended December 31, 2012, we recorded no tax benefit related to our pre-tax losses because the tax benefit on such losses was offset by increases in the valuation allowance.Quarterly Resultsreversal of Operations
The following table sets forth our unaudited consolidated statementall or some portion of operations data for each of the eight quarters ended December 31, 2014. The unaudited quarterly statement of operations data set forth below have been prepared on the same basis as our audited consolidated financial statements and reflect, in the opinion of management, all adjustments of a normal, recurring nature that are necessary for a fair statement of the unaudited quarterly statement of operations data. Our historical results are not necessarily indicative of the results that may be expected in the future. The following quarterly consolidated financial data should be read in conjunction with the consolidated financial statements and the related notes included elsewhere in this Report (in thousands, except percentages) prospectus.
| | | | | | | | | | | | | | | | |
Quarters Ended | | December 31,
2014 | | | September 30,
2014 | | | June 30,
2014 | | | March 31,
2014 | |
| | | (unaudited) | |
Operating revenue: | | | | | | | | | | | | | | | | |
Transaction fees | | $ | 63,289 | | | $ | 52,622 | | | $ | 45,801 | | | $ | 35,412 | |
Servicing fees | | | 5,233 | | | | 3,053 | | | | 1,468 | | | | 1,780 | |
Management fees | | | 1,794 | | | | 1,608 | | | | 1,461 | | | | 1,094 | |
Other revenue (expense) | | | (765 | ) | | | (745 | ) | | | (109 | ) | | | 416 | |
| | | | | | | | | | | | | | | | |
Total operating revenue | | | 69,551 | | | | 56,538 | | | | 48,621 | | | | 38,702 | |
Net interest income (expense) and other adjustments | | | (1,430 | ) | | | (474 | ) | | | (396 | ) | | | 16 | |
| | | | | | | | | | | | | | | | |
Total net revenue | | | 68,121 | | | | 56,064 | | | | 48,225 | | | | 38,718 | |
| | | | | | | | | | | | | | | | |
Operating expenses(1): | | | | | | | | | | | | | | | | |
Sales and marketing | | | 26,470 | | | | 21,001 | | | | 19,225 | | | | 20,582 | |
Origination and servicing | | | 12,151 | | | | 10,167 | | | | 8,566 | | | | 7,402 | |
General and administrative: | | | | | | | | | | | | | | | | |
Engineering and product development | | | 11,714 | | | | 9,235 | | | | 8,030 | | | | 5,722 | |
Other | | | 26,492 | | | | 22,613 | | | | 20,951 | | | | 12,311 | |
| | | | | | | | | | | | | | | | |
Total operating expenses | | | 76,827 | | | | 63,016 | | | | 56,772 | | | | 46,017 | |
| | | | | | | | | | | | | | | | |
Loss before income taxes | | | (8,706 | ) | | | (6,952 | ) | | | (8,547 | ) | | | (7,299 | ) |
Income tax expense | | | 331 | | | | 419 | | | | 640 | | | | — | |
| | | | | | | | | | | | | | | | |
Net loss | | $ | (9,037 | ) | | $ | (7,371 | ) | | $ | (9,187 | ) | | $ | (7,299 | ) |
| | | | | | | | | | | | | | | | |
Other Data(2): | | | | | | | | | | | | | | | | |
Loan originations(3) | | $ | 1,414,983 | | | $ | 1,165,226 | | | $ | 1,005,946 | | | $ | 791,348 | |
Contribution(4) | | $ | 32,672 | | | $ | 26,881 | | | $ | 21,915 | | | $ | 14,578 | |
Contribution margin(4) | | | 47.0 | % | | | 47.5 | % | | | 45.1 | % | | | 37.7 | % |
Adjusted EBITDA (4) | | $ | 7,916 | | | $ | 7,517 | | | $ | 4,002 | | | $ | 1,866 | |
Adjusted EBITDA margin(4) | | | 11.4 | % | | | 13.3 | % | | | 8.2 | % | | | 4.8 | % |
(1) | Includes stock-based compensation expense as follows: |
| | | | | | | | | | | | | | | | |
Quarters Ended | | December 31,
2014 | | | September 30,
2014 | | | June 30,
2014 | | | March 31,
2014 | |
Sales and marketing | | $ | 1,029 | | | $ | 912 | | | $ | 615 | | | $ | 3,502 | |
Origination and servicing | | | 713 | | | | 599 | | | | 470 | | | | 358 | |
General and administrative: | | | | | | | | | | | | | | | | |
Engineering and product development | | | 1,824 | | | | 1,492 | | | | 1,258 | | | | 737 | |
Other | | | 7,695 | | | | 7,534 | | | | 5,976 | | | | 2,436 | |
| | | | | | | | | | | | | | | | |
Total stock-based compensation expense | | $ | 11,261 | | | $ | 10,537 | | | $ | 8,319 | | | $ | 7,033 | |
| | | | | | | | | | | | | | | | |
(2) | For more information about loan originations, contribution margin, adjusted EBITDA and adjusted EBITDA margin, see“Item 7 – Management’s Discussion and Analysis of Financial Condition and Results of Operations – Key Operating and Financial Metrics.” |
(3) | Loan originations include loans facilitated through the platform plus outstanding purchase commitments at period end. |
(4) | Contribution, contribution margin, adjusted EBITDA and adjusted EBITDA margin are non-GAAP financial measures. For more information regarding these measures and a reconciliation of these measures to the most comparable GAAP measure, see “Item 7 – Management’s Discussion and Analysis of Financial Condition and Results of Operations – Reconciliations of Non-GAAP Financial Measures.” |
| | | | | | | | | | | | | | | | |
Quarters Ended | | December 31,
2013 | | | September 30,
2013 | | | June 30,
2013 | | | March 31,
2013 | |
| | | (unaudited) | |
Operating revenue: | | | | | | | | | | | | | | | | |
Transaction fees | | $ | 30,616 | | | $ | 25,239 | | | $ | 16,393 | | | $ | 13,582 | |
Servicing fees | | | 1,466 | | | | 888 | | | | 882 | | | | 715 | |
Management fees | | | 1,000 | | | | 869 | | | | 720 | | | | 494 | |
Other revenue | | | 403 | | | | 409 | | | | 2,847 | | | | 1,452 | |
| | | | | | | | | | | | | | | | |
Total operating revenue | | | 33,485 | | | | 27,405 | | | | 20,842 | | | | 16,243 | |
Net interest income (expense) and other adjustments | | | 12 | | | | 10 | | | | (3 | ) | | | 8 | |
| | | | | | | | | | | | | | | | |
Total net revenue | | | 33,497 | | | | 27,415 | | | | 20,839 | | | | 16,251 | |
| | | | | | | | | | | | | | | | |
Operating expenses(5): | | | | | | | | | | | | | | | | |
Sales and marketing | | | 12,460 | | | | 10,460 | | | | 8,410 | | | | 7,707 | |
Origination and servicing | | | 6,173 | | | | 4,996 | | | | 3,414 | | | | 2,634 | |
General and administrative: | | | | | | | | | | | | | | | | |
Engineering and product development | | | 4,782 | | | | 3,849 | | | | 3,043 | | | | 2,248 | |
Other | | | 7,224 | | | | 5,482 | | | | 4,190 | | | | 3,622 | |
| | | | | | | | | | | | | | | | |
Total operating expenses | | | 30,639 | | | | 24,787 | | | | 19,057 | | | | 16,211 | |
| | | | | | | | | | | | | | | | |
Income before income taxes | | | 2,858 | | | | 2,628 | | | | 1,782 | | | | 40 | |
Income tax expense (benefit) | | | — | | | | (85 | ) | | | 85 | | | | — | |
| | | | | | | | | | | | | | | | |
Net income | | $ | 2,858 | | | $ | 2,713 | | | $ | 1,697 | | | $ | 40 | |
| | | | | | | | | | | | | | | | |
Other Data(6): | | | | | | | | | | | | | | | | |
Loan originations(7) | | $ | 698,373 | | | $ | 567,142 | | | $ | 446,225 | | | $ | 352,885 | |
Contribution(8) | | $ | 15,654 | | | $ | 12,560 | | | $ | 9,231 | | | $ | 6,015 | |
Contribution margin(8) | | | 46.7 | % | | | 45.8 | % | | | 44.3 | % | | | 37.0 | % |
Adjusted EBITDA (8) | | $ | 6,514 | | | $ | 4,927 | | | $ | 3,054 | | | $ | 732 | |
Adjusted EBITDA margin(8) | | | 19.5 | % | | | 18.0 | % | | | 14.7 | % | | | 4.5 | % |
(5) | Includes stock-based compensation expense as follows: |
| | | | | | | | | | | | | | | | |
Quarters Ended | | December 31,
2013 | | | September 30,
2013 | | | June 30,
2013 | | | March 31,
2013 | |
Sales and marketing | | $ | 547 | | | $ | 506 | | | $ | 174 | | | $ | 87 | |
Origination and servicing | | | 255 | | | | 105 | | | | 39 | | | | 26 | |
General and administrative: | | | | | | | | | | | | | | | | |
Engineering and product development | | | 1,151 | | | | 519 | | | | 326 | | | | 174 | |
Other | | | 983 | | | | 741 | | | | 410 | | | | 239 | |
| | | | | | | | | | | | | | | | |
Total stock-based compensation expense | | $ | 2,936 | | | $ | 1,871 | | | $ | 949 | | | $ | 526 | |
| | | | | | | | | | | | | | | | |
(6) | For more information about loan originations, contribution margin, adjusted EBITDA and adjusted EBITDA margin, see“Item 7 – Management’s Discussion and Analysis of Financial Condition and Results of Operations – Key Operating and Financial Metrics.” |
(7) | Loan originations include loans facilitated through the platform plus outstanding purchase commitments at period end. |
(8) | Contribution, contribution margin, adjusted EBITDA and adjusted EBITDA margin are non-GAAP financial measures. For more information regarding these measures and a reconciliation of these measures to the most comparable GAAP measure, see “Item 7 – Management’s Discussion and Analysis of Financial Condition and Results of Operations – Reconciliations of Non-GAAP Financial Measures.” |
Reconciliations of these allowances.
Non-GAAP Financial Measures
Our
We use certain non-GAAP financial measures includingin evaluating our operating results. We believe that contribution, contribution margin, adjusted EBITDA, and adjusted EBITDA margin, and servicing fees before changes in fair value of assets and liabilities help identify trends in our core business results and allow for greater transparency with respect to key metrics used by our management in its decision making.
Our non-GAAP measures of contribution, contribution margin, adjusted EBITDA, adjusted EBITDA margin, and servicing fees before changes in fair value of assets and liabilities have limitations as analytical tools and you should not consider them in isolation or as a substitute for an analysis of our results under GAAP. There are a number of limitations related to the use of these non-GAAP financial measures versus their nearest GAAP equivalents.isolation. These non-GAAP measures should not be viewed as substitutes for, or superior to, net income (loss) as prepared in accordance with GAAP. In evaluating these non-GAAP measures, you should be aware that in the future we will incur expenses similar to the adjustments in this presentation. There are a number of limitations related to the use of these non-GAAP financial measures versus their most directly comparable GAAP measures, which include the following:
Other companies, including companies in our industry, may calculate these measures differently, which may reduce their usefulness as a comparative measure.
These measures do not consider the potentially dilutive impact of stock-based compensation.
Although depreciation and amortization are non-cash charges, the assets being depreciated and amortized may have to be replaced in the future and adjusted EBITDA and adjusted EBITDA margin do not reflect cash capital expenditure requirements for such replacements or for new capital expenditure requirements.
Adjusted EBITDA and adjusted EBITDA margin do not reflect tax payments that may represent a reduction in cash available to us.
In evaluating
Contribution and Contribution Margin
Contribution is a non-GAAP financial measure that is calculated as net operating revenue less “sales and marketing” and “origination and servicing” expenses on the Company’s Statement of Operations, adjusted to exclude non-cash stock-based compensation expense within these captions. These costs represent the costs that are most directly related to generating such net operating revenue. Contribution Margin is a non-GAAP financial measure calculated by dividing Contribution by total net operating revenue.
Contribution and Contribution Margin are measures youof overall direct product profitability that our management and board of directors find useful, and believe investors may find useful, in understanding the relationship between costs most directly associated with revenue generating activities and the related revenue, and remaining amount available to support our costs of engineering and product development and other general and administrative expense to evaluate our operating performance and trends. While we believe Contribution and Contribution Margin are useful for the reasons above, they should not be awareused as an overall measure of our profitability, as they exclude engineering and product development and other general and administrative expenses that are required to run our business. Factors that affect our Contribution and Contribution Margin include revenue mix, variable marketing expenses and origination and servicing expenses.
LENDINGCLUB CORPORATION
Management's Discussion and Analysis of Financial Condition and Results of Operations
(Tabular Amounts in the future we will incur expenses similar to the adjustments in this presentation. Thousands, Except Share and Per Share Data and Ratios, or as Noted)
The following tables presenttable shows the calculation of contribution and contribution margin:
|
| | | | | | | | | | | |
| | Year Ended December 31, |
| | 2016 | | 2015 | | 2014 |
| Net operating revenue | $ | 495,467 |
| | $ | 426,697 |
| | $ | 213,412 |
|
| Less: Sales and marketing expense | 216,670 |
| | 171,526 |
| | 85,652 |
|
| Less: Origination and servicing expense | 74,760 |
| | 61,335 |
| | 37,326 |
|
| Total direct expenses | $ | 291,430 |
| | $ | 232,861 |
| | $ | 122,978 |
|
Add: Stock-based compensation (1) | $ | 11,705 |
| | $ | 9,985 |
| | $ | 7,129 |
|
| Contribution | $ | 215,742 |
| | $ | 203,821 |
| | $ | 97,563 |
|
| Contribution margin | 43.5 | % | | 47.8 | % | | 45.7 | % |
| |
(1) | Contribution also excludes stock-based compensation expense included in the sales and marketing and origination and servicing expense categories. |
The following table presents a reconciliation of net
income (loss)loss to
contributionscontribution for each of the periods
indicated (in thousands, except percentages):Reconciliation of Net Income (Loss) to Contribution:
| | | | | | | | | | | | | | | | | | | | |
Years Ended December 31, | | 2014 | | | 2013 | | | 2012 | | | 2011 | | | 2010 | |
| | | (unaudited) | |
Net income (loss) | | $ | (32,894 | ) | | $ | 7,308 | | | $ | (6,862 | ) | | $ | (12,269 | ) | | $ | (10,807 | ) |
Net interest expense (income) and other adjustments | | | 2,284 | | | | (27 | ) | | | 238 | | | | (222 | ) | | | 708 | |
General and administrative expense: | | | | | | | | | | | | | | | | | | | | |
Engineering and product development | | | 34,701 | | | | 13,922 | | | | 4,855 | | | | 2,289 | | | | 1,951 | |
Other | | | 82,367 | | | | 20,518 | | | | 10,024 | | | | 6,572 | | | | 3,330 | |
Stock-based compensation expense(1) | | | 8,198 | | | | 1,737 | | | | 377 | | | | 39 | | | | 109 | |
Income tax expense | | | 1,390 | | | | — | | | | — | | | | — | | | | — | |
| | | | | | | | | | | | | | | | | | | | |
Contribution | | $ | 96,046 | | | $ | 43,458 | | | $ | 8,632 | | | $ | (3,591 | ) | | $ | (4,709 | ) |
| | | | | | | | | | | | | | | | | | | | |
Total operating revenue | | $ | 213,412 | | | $ | 97,975 | | | $ | 34,045 | | | $ | 12,530 | | | $ | 5,723 | |
Contribution margin | | | 45.0 | % | | | 44.4 | % | | | 25.4 | % | | | (28.7 | %) | | | (82.3 | %) |
|
| | | | | | | | | | | |
| | Year Ended December 31, |
| | 2016 | | 2015 | | 2014 |
| Net loss | $ | (145,969 | ) | | $ | (4,995 | ) | | $ | (32,894 | ) |
| Net interest income and fair value adjustments | (5,345 | ) | | (3,246 | ) | | 2,284 |
|
| Engineering and product development expense | 115,357 |
| | 77,062 |
| | 38,518 |
|
| Other general and administrative expense | 207,172 |
| | 122,182 |
| | 81,136 |
|
| Goodwill impairment | 37,050 |
| | — |
| | — |
|
Stock-based compensation expense(1) | 11,705 |
| | 9,985 |
| | 7,129 |
|
| Income tax (benefit) expense | (4,228 | ) | | 2,833 |
| | 1,390 |
|
| Contribution | $ | 215,742 |
| | $ | 203,821 |
| | $ | 97,563 |
|
| Total net operating revenue | $ | 495,467 |
| | $ | 426,697 |
| | $ | 213,412 |
|
| Contribution margin | 43.5 | % | | 47.8 | % | | 45.7 | % |
(1) | Consists of |
(1) | Contribution also excludes stock-based compensation expense not included in generalthe sales and administrativemarketing and origination and servicing expense as follows:categories. |
Stock-Based Compensation Expense:
| | | | | | | | | | | | | | | | | | | | |
Years Ended December 31, | | 2014 | | | 2013 | | | 2012 | | | 2011 | | | 2010 | |
Sales and marketing | | $ | 6,058 | | | $ | 1,313 | | | $ | 302 | | | $ | 30 | | | $ | 94 | |
Origination and servicing | | | 2,140 | | | | 424 | | | | 75 | | | | 9 | | | | 15 | |
| | | | | | | | | | | | | | | | | | | | |
Total | | $ | 8,198 | | | $ | 1,737 | | | $ | 377 | | | $ | 39 | | | $ | 109 | |
| | | | | | | | | | | | | | | | | | | | |
Reconciliation
Adjusted EBITDA and Adjusted EBITDA Margin
Adjusted EBITDA is a non-GAAP financial measure that includes net operating revenue less certain non-recurring expenses including interest, and certain non-cash expenses including amortization and depreciation, and stock-based compensation expense. Adjusted EBITDA margin is a non-GAAP financial measure calculated by dividing adjusted EBITDA by total net operating revenue.
We believe that adjusted EBITDA is an important measure of
Net Income (Loss)operating performance because it allows management, investors and our board to
Contribution: | | | | | | | | | | | | |
| | | Year Ended
December 31,
2014 | | | Year Ended
December 31,
2013 | | | 9 Months Ended
December 31,
2012 | |
| | | (unaudited) | |
Net income (loss) | | $ | (32,894 | ) | | $ | 7,308 | | | $ | (4,238 | ) |
Net interest expense (income) and other adjustments | | | 2,284 | | | | (27 | ) | | | 334 | |
General and administrative expense: | | | | | | | | | | | | |
Engineering and product development | | | 34,701 | | | | 13,922 | | | | 3,994 | |
Other | | | 82,367 | | | | 20,518 | | | | 7,980 | |
Stock-based compensation expense(1) | | | 8,198 | | | | 1,737 | | | | 276 | |
Income tax expense | | | 1,390 | | | | — | | | | — | |
| | | | | | | | | | | | |
Contribution | | $ | 96,046 | | | $ | 43,458 | | | $ | 8,346 | |
| | | | | | | | | | | | |
Total operating revenue | | $ | 213,412 | | | $ | 97,975 | | | $ | 28,927 | |
Contribution margin | | | 45.0 | % | | | 44.4 | % | | | 28.9 | % |
(1) | Consists of stock-based compensation expense not included in general and administrative expense as follows: |
Stock-Based Compensation Expense:
| | | | | | | | | | | | |
| | | Year Ended
December 31,
2014 | | | Year Ended
December 31,
2013 | | | 9 Months Ended
December 31,
2012 | |
Sales and marketing | | $ | 6,058 | | | $ | 1,313 | | | $ | 216 | |
Origination and servicing | | | 2,140 | | | | 424 | | | | 60 | |
| | | | | | | | | | | | |
Total | | $ | 8,198 | | | $ | 1,737 | | | $ | 276 | |
| | | | | | | | | | | | |
evaluate and compare our core operating results, including our return on capital and operating efficiencies, from period to period by removing the impact of asset base (depreciation and amortization), other non-operating, and share-based compensation, tax consequences, and our capital structure (interest expense from any outstanding debt). Additionally, we utilize Adjusted EBITDA as an operating performance measure as an input into the Company’s calculation of the annual bonus plan. In addition to its use by management, Adjusted EBITDA is a measure widely used by securities analysts, investors and others to evaluate the financial performance
LENDINGCLUB CORPORATION
Management's Discussion and Analysis of Financial Condition and Results of Operations
(Tabular Amounts in Thousands, Except Share and Per Share Data and Ratios, or as Noted)
of our company and other companies in our industry as well as in the broader financial services and technology industries.
The following tables presenttable presents a reconciliation of net income (loss)loss to Adjusted EBITDA for each of the periods indicated (in thousands, except percentages):Reconciliationindicated:
|
| | | | | | | | | | | |
| | Year Ended |
| | 2016 | | 2015 | | 2014 |
| Net loss | $ | (145,969 | ) | | $ | (4,995 | ) | | $ | (32,894 | ) |
| Net interest income and fair value adjustments | (5,345 | ) | | (3,246 | ) | | 2,284 |
|
| Acquisition and related expense | 1,174 |
| | 2,367 |
| | 3,113 |
|
| Depreciation expense: | | | | | |
| Engineering and product development | 20,906 |
| | 13,820 |
| | 5,194 |
|
| Other general and administrative | 4,216 |
| | 2,426 |
| | 1,166 |
|
| Amortization of intangible assets | 4,760 |
| | 5,331 |
| | 3,898 |
|
| Goodwill impairment | 37,050 |
| | — |
| | — |
|
| Stock-based compensation expense | 69,201 |
| | 51,222 |
| | 37,150 |
|
| Income tax (benefit) expense | (4,228 | ) | | 2,833 |
| | 1,390 |
|
| Adjusted EBITDA | $ | (18,235 | ) | | $ | 69,758 |
| | $ | 21,301 |
|
| Total net operating revenue | $ | 495,467 |
| | $ | 426,697 |
| | $ | 213,412 |
|
| Adjusted EBITDA margin | (3.7 | )% | | 16.3 | % | | 10.0 | % |
Operating expenses include the following amounts of stock based compensation for the periods presented: |
| | | | | | | | | | | |
| | Year Ended |
| | 2016 | | 2015 | | 2014 |
| Sales and marketing | $ | 7,546 |
| | $ | 7,250 |
| | $ | 5,476 |
|
| Origination and servicing | 4,159 |
| | 2,735 |
| | 1,653 |
|
| Engineering and product development | 19,858 |
| | 11,335 |
| | 6,445 |
|
| Other general and administrative | 37,638 |
| | 29,902 |
| | 23,576 |
|
| Total stock-based compensation expense | $ | 69,201 |
| | $ | 51,222 |
| | $ | 37,150 |
|
Servicing Fees Before Changes in Fair Value of Assets and Liabilities
Servicing and management fee revenue associated with the servicing portfolio, excluding fair market value accounting adjustments, is a non-GAAP financial measure that is calculated as servicing fees less the fair market value accounting adjustment. The Company has elected to account for servicing assets and liabilities at fair value with changes in fair value recorded through earnings in the period of change. The Company believes this is a useful non-GAAP financial measure because it reflects the amount of fees actually collected and represents the true economic benefit of our servicing arrangements. We believe that the fair value adjustments to the servicing assets and liabilities is less useful in particular because the Company does not trade or transfer such servicing assets or liabilities.
LENDINGCLUB CORPORATION
Management's Discussion and Analysis of Financial Condition and Results of Operations
(Tabular Amounts in Thousands, Except Share and Per Share Data and Ratios, or as Noted)
The following table presents a reconciliation of servicing fees to servicing fees before change in fair value of servicing assets and liabilities:
|
| | | | | | | | | | | |
| | Year Ended |
| | 2016 | | 2015 | | 2014 |
| Servicing fees | $ | 68,009 |
| | $ | 32,811 |
| | $ | 11,534 |
|
| Change in fair value of servicing assets and liabilities, net | 905 |
| | (1,392 | ) | | (1,420 | ) |
| Servicing fees before change in fair value of servicing assets and liabilities | $ | 68,914 |
| | $ | 31,419 |
| | $ | 10,114 |
|
Investments by Investment Channel and Investor Concentration
The following table shows the percentage of loan originations funded by investment channel for the periods presented:
|
| | | | | | | | | | | | | | | |
| | | December 31, 2016 | | September 30, 2016 | | June 30, 2016 | | March 31, 2016 | | December 31, 2015 |
| Originations by Investor Type: | | | | | | | | | | |
| Managed accounts | | 43 | % | | 55 | % | | 35 | % | | 30 | % | | 38 | % |
| Self-directed | | 13 | % | | 14 | % | | 17 | % | | 15 | % | | 13 | % |
| Banks | | 31 | % | | 13 | % | | 28 | % | | 34 | % | | 23 | % |
| Other institutional investors | | 13 | % | | 18 | % | | 20 | % | | 21 | % | | 26 | % |
| Total | | 100 | % | | 100 | % | | 100 | % | | 100 | % | | 100 | % |
Managed accounts include the private funds managed by LCA, dedicated third-party funds and separately management accounts. Self-directed investors include our self-directed retail investor base. Banks are deposit taking institutions, while other institutional investors include asset managers, insurance companies, hedge funds and other large non-bank investors.
The following table provides the percentage of loans invested in by the ten largest investors during each of the previous five quarters (by dollars invested):
|
| | | | | | | | | | | | | | | |
| | | December 31, 2016 | | September 30, 2016 | | June 30, 2016 | | March 31, 2016 | | December 31, 2015 |
| Percentage of Loans Invested In by Ten Largest Investors (by $ invested) | | 68 | % | | 72 | % | | 62 | % | | 51 | % | | 58 | % |
For the year ended December 31, 2016, no single investor accounted for more than 12% of the loans invested in through our marketplace. The composition of the top ten investors may vary from period to period. In addition to these investors, private funds associated with LCA and publicly issued member payment dependent notes accounted for approximately 3% and 16%, respectively, of investment capital provided through our marketplace during the period.
Effectiveness of Scoring Models
Our ability to attract borrowers and investors to our marketplace is significantly dependent on our platform’s ability to effectively evaluate a borrower’s credit profile and likelihood of default.
Our marketplace’s credit decisioning and scoring models are evaluated on a regular basis and the additional data on loan history experience, borrower behavior, economic factors and prepayment trends that we accumulate are
LENDINGCLUB CORPORATION
Management's Discussion and Analysis of Financial Condition and Results of Operations
(Tabular Amounts in Thousands, Except Share and Per Share Data and Ratios, or as Noted)
leveraged to continually improve the models. We believe we have a history of effectively evaluating borrower’s credit worthiness and likelihood of defaults, as evidenced by the performance of various loan vintages facilitated through our marketplace. If our marketplace's credit decisioning and scoring models ultimately prove to be ineffective, or fail to appropriately account for a decline in the macroeconomic environment, investors may experience higher than expected losses and lose confidence in our business. The following charts display the historical lifetime cumulative net charge-off rates (expressed as a percent of original loan balances) through December 31, 2016, by booking year, for all grades and 36 or 60 month terms of standard program loans for each of the years shown.
LENDINGCLUB CORPORATION
Management's Discussion and Analysis of Financial Condition and Results of Operations
(Tabular Amounts in Thousands, Except Share and Per Share Data and Ratios, or as Noted)
LENDINGCLUB CORPORATION
Management's Discussion and Analysis of Financial Condition and Results of Operations
(Tabular Amounts in Thousands, Except Share and Per Share Data and Ratios, or as Noted)
Loan Portfolio Information and Credit Metrics
The Company classifies the loans held on its balance sheet into three major loan products: standard program personal loans, custom program personal loans and other loans. The majority of the loans facilitated on our platform and retained on the balance sheet are standard program personal loans which represent loans made to prime borrowers that are publicly available to note investors and through certificates to private investors. Custom program personal loans include all other personal loans that are not eligible for our standard program and are available only to private investors. Other loans is comprised of education and patient finance loans, small business loans, small business lines of credit, and auto refinance loans. The loans on the balance sheet are financed by notes issued by the Company, certificates issued by the Trust or invested in directly by the Company.
Fair Value and Delinquencies
The outstanding principal balance, fair value and percentage of these loans that are delinquent, by loan product are as follows: |
| | | | | | | | | | | | | | | |
| | December 31, 2016 | | December 31, 2015 |
| (in millions, except percentages) | Outstanding Principal Balance | Fair Value (2) | Delinquent Loans (2) | | Outstanding Principal Balance | Fair Value (2) | Delinquent Loans (2) |
| Personal loans - standard program | $ | 4,290.4 |
| 94.6 | % | 3.2 | % | | $ | 4,376.7 |
| 97.4 | % | 2.2 | % |
| Personal loans - custom program | 267.4 |
| 91.4 |
| 5.6 |
| | 271.2 |
| 95.8 |
| 2.4 |
|
Other loans (1) | 17.2 |
| 96.8 |
| 2.8 |
| | 33.8 |
| 98.2 |
| 2.4 |
|
Total | $ | 4,575.0 |
| 94.5 | % | 3.3 | % | | $ | 4,681.7 |
| 97.3 | % | 2.2 | % |
| |
(1) | Components of other loans are less than 10% of the outstanding principal balance presented individually. |
| |
(2) | Expressed as a percent of outstanding principal balance. |
Declines in the fair value of loans from December 31, 2015 to December 31, 2016 were primarily due to increases in the yields required by investors to purchase the Company’s loans, notes and certificates, and an increase in expected credit losses.
Net Income (Loss)Annualized Charge-Off Rates
The following tables show annualized net charge-off rates, which is an alternative measure of the performance of the loans held by the Company in its portfolio from the graphs above. Net cumulative lifetime charge-off rates used above show total charge-offs as a function of original principal balance, while these tables show the annualized net charge-off rates that reflect the charged-off balance of loans in a specific period as a percentage of the average outstanding balance of the loans during the periods presented.
Net annualized charge-off rates are affected by the average age of the loans in the portfolio for a given quarter and the credit performance of the loans. We generally expected charge-off rates to
Adjusted EBITDA: | | | | | | | | | | | | | | | | | | | | |
Years Ended December 31, | | 2014 | | | 2013 | | | 2012 | | | 2011 | | | 2010 | |
| | | (unaudited) | |
Net income (loss) | | $ | (32,894 | ) | | $ | 7,308 | | | $ | (6,862 | ) | | $ | (12,269 | ) | | $ | (10,807 | ) |
Net interest expense (income) and other adjustments | | | 2,284 | | | | (27 | ) | | | 238 | | | | (222 | ) | | | 708 | |
Acquisition and related expense | | | 3,113 | | | | — | | | | — | | | | — | | | | — | |
Depreciation and amortization: | | | | | | | | | | | | | | | | | | | | |
Engineering and product development | | | 5,194 | | | | 1,336 | | | | 260 | | | | 47 | | | | — | |
Other | | | 1,166 | | | | 327 | | | | 28 | | | | 86 | | | | 87 | |
Amortization of intangible assets | | | 3,898 | | | | — | | | | — | | | | — | | | | — | |
Stock-based compensation expense | | | 37,150 | | | | 6,283 | | | | 1,412 | | | | 291 | | | | 319 | |
Income tax expense | | | 1,390 | | | | — | | | | — | | | | — | | | | — | |
| | | | | | | | | | | | | | | | | | | | |
Adjusted EBITDA | | $ | 21,301 | | | $ | 15,227 | | | $ | (4,924 | ) | | $ | (12,067 | ) | | $ | (9,693 | ) |
| | | | | | | | | | | | | | | | | | | | |
Total operating revenue | | $ | 213,412 | | | $ | 97,975 | | | $ | 34,045 | | | $ | 12,530 | | | $ | 5,723 | |
Adjusted EBITDA margin | | | 10.0 | % | | | 15.5 | % | | | (14.5 | %) | | | (96.3 | %) | | | (169.4 | %) |
Reconciliationincrease with loan age, as new loans generally have fewer credit losses than seasoned loans. Annualized charge-off rates can also be affected by changes in the credit performance of Net Income (Loss)loans that are outstanding for a given quarter. Additionally, in any particular quarter the portfolios include loans from past vintages that were originated under prior credit underwriting parameters, and thus do not reflect the current credit underwriting models used to Adjusted EBITDA:
| | | | | | | | | | | | |
| | | Year Ended
December 31,
2014 | | | Year Ended
December 31,
2013 | | | 9 Months Ended
December 31,
2012 | |
| | | (unaudited) | |
Net income (loss) | | $ | (32,894 | ) | | $ | 7,308 | | | $ | (4,238 | ) |
Net interest expense (income) and other adjustments | | | 2,284 | | | | (27 | ) | | | 334 | |
Acquisition and related expense | | | 3,113 | | | | — | | | | — | |
Depreciation and amortization: | | | | | | | | | | | | |
Engineering and product development | | | 5,194 | | | | 1,336 | | | | 219 | |
Other | | | 1,166 | | | | 327 | | | | 18 | |
Amortization of intangible assets | | | 3,898 | | | | — | | | | — | |
Stock-based compensation expense | | | 37,150 | | | | 6,283 | | | | 1,110 | |
Income tax expense | | | 1,390 | | | | — | | | | — | |
| | | | | | | | | | | | |
Adjusted EBITDA | | $ | 21,301 | | | $ | 15,227 | | | $ | (2,557 | ) |
| | | | | | | | | | | | |
Total operating revenue | | $ | 213,412 | | | $ | 97,975 | | | $ | 28,927 | |
Adjusted EBITDA margin | | | 10.0 | % | | | 15.5 | % | | | (8.8 | %) |
originate new loans.
LENDINGCLUB CORPORATION
Management's Discussion and Analysis of Financial Condition and Results of Operations
(Tabular Amounts in Thousands, Except Share and Per Share Data and Ratios, or as Noted)
The annualized net charge-off rates for personal loans for both standard and custom programs in total for the last five quarters are as follows:
|
| | | | | | | | | | |
Total Platform (1) | December 31, 2016 | September 30, 2016 | June 30, 2016 | March 31, 2016 | December 31, 2015 |
| Personal Loans-Standard Program: | | | | | |
| Annualized net charge-off rate | 8.0 | % | 6.1 | % | 4.9 | % | 5.0 | % | 4.7 | % |
| Weighted average age in months | 12.0 |
| 11.3 |
| 10.3 |
| 9.5 |
| 9.3 |
|
| | | | | | |
| Personal Loans-Custom Program: | | | | | |
| Annualized net charge-off rate | 14.6 | % | 11.0 | % | 8.6 | % | 8.2 | % | 7.0 | % |
| Weighted average age in months | 9.8 |
| 9.1 |
| 8.4 |
| 7.3 |
| 6.9 |
|
|
| | | | | | | | | | |
| Loans retained on balance sheet | December 31, 2016 | September 30, 2016 | June 30, 2016 | March 31, 2016 | December 31, 2015 |
| Personal Loans-Standard Program: | | | | | |
| Annualized net charge-off rate | 10.4 | % | 8.2 | % | 6.5 | % | 6.2 | % | 5.4 | % |
| Weighted average age in months | 13.5 |
| 12.9 |
| 12.1 |
| 10.9 |
| 10.3 |
|
| | | | | | |
| Personal Loans-Custom Program: | | | | | |
| Annualized net charge-off rate | 19.1 | % | 14.0 | % | 8.2 | % | 5.6 | % | 4.4 | % |
| Weighted average age in months | 12.4 |
| 10.9 |
| 8.4 |
| 5.8 |
| 5.1 |
|
| |
(1) | Total platform comprises all loans facilitated through the marketplace, including whole loans sold and loans financed by notes and certificates. |
The increase in the annualized net charge-off rates are due to an increase in the average age of the loans in conjunction with higher observed actual charge-offs. In 2016 we observed higher delinquencies and charge-offs in populations characterized by high indebtedness, an increased propensity to accumulate debt, and lower credit scores.
An increase in the average age of the loans has also contributed to the increasing charge-off rates. Prior to 2016, the loan portfolios grew significantly as the volume of loans facilitated increased. As a result, the average age of the portfolio, and with it the average charge-off rate, stayed low during this prior period. In 2016, loan originations grew at a slower rate, causing the average loan age to increase resulting in an increase in the aggregate annualized charge-off rate. See “Current Economic and Business Environment” for further discussion regarding how we responded to these observations and credit performance by implementing changes to the credit model, increasing interest rates and supplementing collections efforts.
The annualized net charge-off rates for standard program loans are higher for loans retained on our balance sheet compared to loans reflected at the total platform level for each quarter because of a difference in grade distribution for the two portfolios. The proportion of grade A and B loans is approximately 30% of the retained loan portfolio compared to approximately 41% for the total platform level as of December 31, 2016. This difference in loan grade distribution results in higher net charge-off rates for the loans on the balance sheet, as grade A and B loans have lower expected and actual credits losses.
Regulatory Environment
As a result of our internal board review and resignation of our former CEO, we have received inquiries from governmental entities, and we continue to cooperate fully. Responding to inquiries of this nature are costly and time
LENDINGCLUB CORPORATION
Management's Discussion and Analysis of Financial Condition and Results of Operations
(Tabular Amounts in Thousands, Except Share and Per Share Data and Ratios, or as Noted)
consuming, can generate negative publicity, and could have a material and adverse effect on our business. See “Item 8 – Financial Statements and Supplementary Data – Notes to Consolidated Financial Statements – 17. Commitments and Contingencies” for further discussion regarding these inquiries.
Liquidity and Capital Resources
At December 31, 2014, we had $869.8 million in available cash and cash equivalents. We primarily hold our excess unrestricted cash in institutional money market funds and interest-bearing deposits at investment grade financial institutions. We believe that our current cash position is sufficient to meet our current liquidity needs for at least the next 12 months.
At December 31, 2014, we had $46.8 million in restricted cash that consisted primarily of $38.4 million of cash received from investors and not yet applied to their accounts, $3.4 million for an investor as part of a credit support agreement and pledged cash of $3.0 million as security for our primary issuing bank.
Liquidity
The following table sets forth certain cash flow information for the periods presented (in thousands): | | | | | | | | | | | | |
| | | Year Ended
December 31,
2014 | | | Year Ended
December 31,
2013 | | | 9 Months Ended
December 31,
2012 | |
| | | (audited) | |
Cash provided by (used in): | | | | | | | | | | | | |
Operating activities | | $ | 49,920 | | | $ | 1,139 | | | $ | (393 | ) |
Investing activities(1) | | | (1,257,075 | ) | | | (1,120,615 | ) | | | (441,145 | ) |
Financing activities(1) | | | 2,027,636 | | | | 1,116,224 | | | | 462,845 | |
| | | | | | | | | | | | |
Net increase (decrease) in cash | | $ | 820,481 | | | $ | (3,252 | ) | | $ | 21,307 | |
| | | | | | | | | | | | |
|
| | | | | | | | | | | |
| Year Ended December 31, | 2016 | | 2015 | | 2014 |
| Net cash provided by operating activities | $ | 545 |
| | $ | 74,741 |
| | $ | 49,920 |
|
| | | | | | |
Cash flow used for loan investing activities(1) | (275,213 | ) | | (2,034,590 | ) | | (1,094,065 | ) |
| Cash flow used for all other investing activities | (147,744 | ) | | (372,110 | ) | | (163,010 | ) |
| Net cash used for investing activities | (422,957 | ) | | (2,406,700 | ) | | (1,257,075 | ) |
| | | | | | |
Cash flow provided by note/certificate, and secured borrowings financing(1) | 262,952 |
| | 2,034,993 |
| | 1,098,108 |
|
| Cash flow provided by all other financing activities | 51,531 |
| | 50,717 |
| | 929,528 |
|
| Net cash provided by financing activities | 314,483 |
| | 2,085,710 |
| | 2,027,636 |
|
| Net (decrease) increase in cash and cash equivalents | $ | (107,929 | ) | | $ | (246,249 | ) | | $ | 820,481 |
|
| |
(1) | Cash flow used infor loan investing activities includes the purchase of loans and repayment of loans facilitated through our marketplace. Cash flow provided by note/certificate and secured borrowings financing activities includes ourthe issuance of notes and the Trust’s issuance of certificates to investors and the repayment of those notes and certificates. These amounts generally correspond and offset each other. |
Net Cash Provided by Operating Activities
Net
Our short-term liquidity needs generally relate to our working capital requirements. These liquidity needs are generally met through cash provided bygenerated from the operations of facilitating loan originations. If we experience a pause in investor capital on our platform, cash generated from facilitating loan originations could decline, in which case we may need to use our cash and cash equivalents on hand, which was $515.6 million at December 31, 2016, to meet our working capital needs. We additionally had $287.1 million of available for sale securities at December 31, 2016. The net loss during the year ended December 31, 2016, including cash expenses for legal, audit, communications, and advisory fees associated with the board review (including investigating the matters identified in the board review), government inquiries, supporting investor due diligence activities, remediation efforts and pending and potential future litigation matters, along with the purchases of loans we intend to sell, contributed to lower operating activitiescash flow for the year ended December 31, 2014 was $49.9 million. Cash flow provided by operating activities was primarily driven by changes in certain components2016. Generally, there has been no material impact on our liquidity position as of our working capital, including a decrease in other assets of $13.3 million that was primarilyDecember 31, 2016, related to paymentsthe purchase of receivables due from investors and an increase in accrued expenses and other liabilities of $16.7 million and increase in accounts payable of $2.4 million. Additionally, $14.5 million of net cash provided by operating activities was generated by the net loss forloans during the year ended December 31, 20142016; as such, loans generally were invested in by proceeds from the issuance of $32.9corresponding notes and certificates, or such loans have been sold on the same day to whole loan investors.
Additionally, given the payment dependent structure of the notes and certificates, principal and interest payments on notes and certificates are paid only when received from borrowers on the corresponding retained loans, resulting in no material impact to our liquidity. During 2016, the Company purchased a total of $138.2 million
adjusted for non-cash stock-based compensation and warrant expense of $37.2 million and depreciation and amortization expense of $10.3 million.Net cash provided by operating activities for the year ended December 31, 2013 was $1.1 million. Cash flow from operating activities was generated primarily by net income for the year ended December 31, 2013 of $7.3 million, adjusted for non-cash stock-based compensation and warrant expense of $6.5 million, depreciation and amortization expense of $1.7 million and net non-cash changes in the fair values of servicing assets and liabilities of $0.4 million. Additionally, operating cash flows were generated due to changes in certain components of our working capital, including increases in accrued expenses and other liabilities of $4.1 million and accounts payable of $1.8 million. These cash inflows were largely offset by increases in other assets of $21.1 million that were related to increases in receivables due from investors.
Net cash used in operating activities for the nine months ended December 31, 2012 was $0.4 million. The cash used in operating activities primarily related to the net loss for the nine months ended December 31, 2012 of $4.2 million, adjusted for non-cash stock-based compensation and warrant expense of $1.1 million, depreciation and amortization expense of $0.2 million and net non-cash changes in the fair values of loans note and certificates of $0.6 million,through the platform to fulfill regulatory or contractual purchase obligations (such as direct mail offers) or support short-term marketplace equilibrium. The Company was able to find additional investors in these loans, as well as an increaseloans the Company repurchased from investors that did not meet the investor's investment criteria at the time of issuance, and resold $144.7 million of loans purchased by the Company in other assets2016. The majority of $0.6these loans were purchased
LENDINGCLUB CORPORATION
Management's Discussion and Analysis of Financial Condition and Results of Operations
(Tabular Amounts in Thousands, Except Share and Per Share Data and Ratios, or as Noted)
and resold in the first half of 2016. The outstanding principal balance of loans for which the Company remained invested in as of December 31, 2016, was $27.9 million. This
Cash and cash outflow was partially offset by net operatingequivalents are primarily held in institutional money market funds and interest-bearing deposit accounts at investment grade financial institutions. Cash and cash inflows fromequivalents were $515.6 million and $623.5 million at December 31, 2016, and 2015, respectively. Changes in the balance of cash and cash equivalents are generally a result of timing related to working capital requirements or investments in or out of our securities available for sale portfolio and changes in certain components of our working capital, including an increase in accrued expensesrestricted cash and other liabilitiesinvestments.
Restricted cash consists primarily of
$1.6checking, money market and certificate of deposit accounts that are: (i) pledged to or held in escrow by the Company’s correspondent banks as security for transactions processed on or related to our platform or activities by certain investors; (ii) pledged through a credit support agreement with a certificate holder; (iii) held in a Rabbi Trust through a grantor trust agreement to satisfy obligations to partnerships under the Company's 2016 Cash Retention Bonus Plan, or (iv) received from investors but not yet been applied to their accounts on the platform and transferred to segregated bank accounts that hold investors’ funds. Restricted cash was $177.8 million and
a net increase in accrued interest receivable and accrued interest payable of $0.9 million.Net Cash Used in Investing Activities
Net cash used in investing activities for the year ended$80.7 million at December 31, 2014 was $1,257.1 million. Cash used in investing activities includes $2,156.4 million of cash used to purchase loans at fair value, $20.6 million of purchases of property, equipment2016 and software and a $33.0 million2015, respectively. The increase in restricted cash partially offsetis primarily attributable to an increase in cash received from investors that has not yet been applied to their accounts, additional cash pledged to or held in escrow by $1,054.4the Company's correspondent banks as security for transactions related to our platform or with certain investors, and cash held in a Rabbi Trust to satisfy obligations under the Cash Retention Bonus Plan.
In April 2015, we invested in securities classified as available for sale. The fair value of securities available for sale as of December 31, 2016 and 2015 was $287.1 millionand $297.2 million, respectively. These securities include corporate debt securities, certificates of deposit, asset-backed securities, commercial paper, U.S. agency securities, U.S. Treasury securities and other securities. All securities were rated investment grade (defined as a rating equivalent to a Moody’s rating of “Baa3” or higher, or a Standard & Poor’s rating of “BBB-” or higher) and there were no significant unrealized losses. These securities provided $3.6 million and $2.8 million of principal payments received on loans at fair value.Net cash usedinterest income in investing activities for the year ended December 31, 2013 was $1,120.6 million, which primarily resulted from $1,618.4 million of cash used2016 and 2015, respectively. These securities continue to purchase loans at fair value, $10.4 million of purchases of property, equipment and software and a $4.7 million increase in restricted cash, partially offset by $511.2 million of principal payments received on loans at fair value.
Net cash used in investing activities for the nine months ended December 31, 2012 was $441.1 million, which primarily resulted from $598.6 million of cash usedbe available to purchase loans at fair value, a $2.6 million increase in restricted cash and $1.3 million of purchases of property, equipment and software, partially offset by $160.8 million of principal payments received on loans at fair value.
Net Cash Provided by Financing Activities
Net cashmeet liquidity needs.
Our available liquidity resources may also be provided by
financing activities for the year endedexternal sources. On December
31, 2014 was $2,027.6 million. In December 2014, we raised $827.7 million of net proceeds from our IPO. Cash provided by financing also includes $2,156.0 million of proceeds from our issuance of notes and sale of loans to the Trust in connection with its issuance of certificates, $64.8 million net proceeds from our sale of Series F convertible preferred stock in connection with the Springstone acquisition and an $34.3 million increase in the amount payable to investors, partially offset by $1,050.0 million in principal payments made on notes and certificates.Net cash provided by financing activities for the year ended December 31, 2013 was $1,116.2 million, which primarily resulted from $1,618.3 million of proceeds from our issuance of notes and sale of loans to the Trust in connection with its issuance of certificates, which was partially offset by $504.3 million of principal payments made on notes and certificates.
Net cash provided by financing activities for the nine months ended December 31, 2012 was $462.8 million, which primarily resulted from $606.9 million of proceeds from our issuance of notes and sale of loans to the Trust in connection with its issuance of certificates and $17.3 million net proceeds from our sale of Series E convertible preferred stock, partially offset by $163.9 million of principal payments made on notes and certificates.
Springstone Acquisition
In April 2014, we made payments of $109.5 million, net of cash acquired for the Springstone acquisition, which is included in cash flows from investing activities. In connection with the acquisition,17, 2015, we entered into a credit and guaranty agreement with several lenders in April 2014, under which the lenders made a $50.0for an aggregate $120.0 million term loan to us, referred to as Term Loan.secured revolving credit facility (Credit Facility). In connection with our entry into the credit agreement, we entered into a pledge and security agreement with Morgan Stanley Senior Funding, Inc., as collateral agent. Proceeds of loans made under the Credit Facility may be borrowed, repaid and reborrowed until December 17, 2020. Repayment of any outstanding proceeds are payable on December 17, 2020, but may be prepaid without penalty. We did not have any loans outstanding under the Credit Facility during the year ended December 31, 2016.
Borrowings under the Credit Facility bear interest, at the Company's option, at an annual rate based on LIBOR rate plus a spread of 1.75% to 2.00%, which is fixed for a Company-selected interest period of one, two, three, six or 12 months, or at an alternative base rate (which is tied to either the prime rate, federal funds effective rate, or the adjusted eurocurrency rate, as defined in the credit agreement). Base rate borrowings may be prepaid at any time without penalty, however pre-payment of LIBOR-based borrowings before the end of the selected interest period may result in the Company incurring expense to compensate the lenders for their funding costs through the end of the interest period. Interest is payable quarterly. Additionally, the Company is required to pay a quarterly commitment fee to the lenders of between 0.25% and 0.375% per annum, depending on the Company’s total net leverage ratio, on the average undrawn portion available under the revolving loan facility.
The Credit Facility and pledge and security agreement contain certain covenants applicable to us, including restrictions on the Company’s ability to pay dividends, incur indebtedness, pledge our assets, merge or consolidate, make investments, and enter into certain affiliate transactions. The Credit Facility also requires us to maintain a
LENDINGCLUB CORPORATION
Management's Discussion and Analysis of Financial Condition and Results of Operations
(Tabular Amounts in Thousands, Except Share and Per Share Data and Ratios, or as Noted)
maximum total net leverage ratio (defined as the ratio of net debt to Adjusted EBITDA, on a consolidated basis for the four most recent Fiscal Quarter periods) of 4.00:1.00 initially, and which decreases over the term of the Credit Facility to 3.00:1.00 on and after June 30, 2018 (on a consolidated basis). As of December 31, 2016, the total net leverage ratio, calculated as defined in the Credit Facility, was 0%.
On December 11, 2014, we received $827.7 million in net proceeds from our IPO for use in funding our liquidity needs. A portion of these proceeds were invested in securities held in our securities available for sale portfolio.
In April 2014, we made payments of $109.5 million, net of cash acquired to acquire Springstone. In connection with the acquisition, in April 2014, the Company issued approximately $65.0 million of Series F convertible preferred stock, and borrowed $50.0 million under a credit and guaranty agreement entered into with several lenders referred to as the Term Loan. The Series F convertible preferred stock was converted on a one-for-one basis to common stock in conjunction with the Company’s initial public offering. On December 17, 2014, we fully repaid the $49.4 million of principal outstanding of our Term Loan using a portion of the net proceeds from our IPO. Consequently, the Term Loan was extinguished and removed from the balance sheet as of December 31, 2014, and the credit and guaranty agreement was terminated. Cash flows related toDuring the term it was outstanding, the Term Loan are included paid interest at a weighted-average interest rate of 2.59%.
On February 9, 2016, our board of directors approved a share repurchase program under which we may repurchase up to $150.0 million of our common shares in cash flows from financing activities. Foropen market or privately negotiated transactions in compliance with Securities and Exchange Act Rule 10b-18. This repurchase program was valid for one year and did not obligate the Company to acquire any particular amount of common stock. During the year ended December 31, 2014, interest expense on2016, we repurchased 2,282,700 shares of our common stock for an aggregate purchase price of $19.5 million. See “Part II – Item 8 – Financial Statements and Supplementary Data – Note 15. Employee Incentive and Retirement Plans” for additional information.
During the Term Loansecond and the third quarters of 2016, the Company offered incentives to investors in exchange for investment activity. The Company has not offered incentives to investors for investments in loans since September 2016. Although our use of the balance sheet as a source of initial funding was $0.9 million. In addition, we expensed the debt issuance cost of $1.2 million and debt discount of $0.2 million as interest expensesignificantly reduced in the consolidated statementsecond half of operations. We2016 compared to the first half of 2016, and we did not have interest expenseto use a material amount of our own capital to purchase loans in the second half of 2016, our failure to attract investor capital may result in us using a greater amount of our own capital to purchase loans on the Term Loanplatform compared to prior periods, or reduce origination volume. These actions may have material adverse impacts on our business, financial condition (including its liquidity), results of operations or ability to sustain and grow loan volume.
Historically, our overall business model has not been premised on using our balance sheet and assuming credit risk for loans facilitated by our marketplace by holding loans to maturity. In order to support contractual obligations (Pool B loans and repurchase obligations), regulatory commitments (direct mail), short-term marketplace equilibrium, alternative financing structures, customer accommodations or other needs, we may use our capital on the platform from time to time on terms that are substantially similar to other investors. Additionally, we may use our capital to invest in loans associated with the testing or initial launch of new or alternative loan terms, programs or channels to establish a track record of performance prior to facilitating third-party investments in these loans. We also plan to use our capital in securitization programs. For a description of recent developments and their potential impact to our liquidity and capital resources, see “Current Economic and Business Environment” above.
We believe based on our projections and ability to reduce loan volume if needed, that our cash on hand, funds available from our line of credit, and our cash flow from operations is expected to be sufficient to meet our liquidity needs for the next twelve months.
LENDINGCLUB CORPORATION
Management's Discussion and Analysis of Financial Condition and Results of Operations
(Tabular Amounts in Thousands, Except Share and Per Share Data and Ratios, or as Noted)
Capital Resources
Capital expenditures were $51.8 million, or 10% of total net revenue, $39.4 million, or 9% of total net revenue, and $20.6 million, or 10% of total net revenue, for the years ended December 31, 2016, 2015 and 2014, respectively. Capital expenditures primarily consist of internally developed software and leasehold improvements. Capital expenditures in 2017 are expected to be approximately $60 million, primarily related to costs associated with the continued development and support of our lending platform. In the future, we expect our capital expenditures to increase as we continue to enhance our platform to support the growth in our business.
Off-Balance Sheet Arrangements
At both December 31, 2016 and December 31, 2015, a total of $4.7 million in standby letters of credit were outstanding related to certain financial covenants required for our leased facilities. To date, no amounts have been drawn against the letters of credit, which renew annually and expire at various dates through July 2026. There were no off-balance sheet arrangements for the year ended December 31,
2013 or the nine months ended December 31, 2012.Off-Balance Sheet Arrangements
We did not have any off-balance sheet arrangements in the years ended December 31, 20142014.
Contingencies
Legal
For a comprehensive discussion of legal proceedings, see “Item 8 – Financial Statements and 2013 or the nine months ended December 31, 2012.Contingencies
Credit Support Agreement
We are subjectSupplementary Data – Notes to a credit support agreement with a certificate investor. The credit support agreement requires us to pledgeConsolidated Financial Statements – 17. Commitments and restrict cash in support of our contingent obligation to reimburse the investor for credit losses on loans underlying the investor’s certificate that are in excess of a specified aggregate loss threshold. We are obligated to pledge cash, not to exceed $5.0 million, to support this contingent obligation, which cash balance is determined based on the investor’s certificate outstanding balance. As of December 31, 2014, approximately $3.4 million was pledged and restricted to support this contingent obligation.
As of December 31, 2014, the credit losses pertaining to the investor’s certificate have not exceeded the specified threshold, and future credit losses are not expected to exceed the specified threshold, and thus no expense or liability has been recorded. We currently do not anticipate recording losses resulting from our contingent obligation under this credit support agreement. If losses related to the credit support agreement are later determined to be likely to occur and are estimable, our results of operations could be affected in the period in which such losses are recorded.
Contingencies.”
Our principal commitments consist of obligations under our loan funding operation with WebBank and in connection with direct marketing efforts, operating leases for office space and contractual commitments for other support services. The following table summarizes our contractual obligations as of December 31,
2014 (in thousands): | | | | | | | | | | | | | | | | | | | | |
| | | Payments Due by Period | |
| | | Less than 1 Year | | | 1 to 3 Years | | | 3 to 5 Years | | | More than 5 Years | | | Total | |
Purchase obligations | | $ | 4,508 | | | $ | 6,473 | | | $ | 875 | | | $ | — | | | $ | 11,856 | |
Loan funding obligations | | | 10,337 | | | | — | | | | — | | | | — | | | | 10,337 | |
Operating lease obligations | | | 5,448 | | | | 13,664 | | | | 13,867 | | | | 15,864 | | | | 48,843 | |
WebBank purchase obligations | | | 4,086 | | | | — | | | | — | | | | — | | | | 4,086 | |
| | | | | | | | | | | | | | | | | | | | |
Total contractual obligations(1) | | $ | 24,379 | | | $ | 20,137 | | | $ | 14,742 | | | $ | 15,864 | | | $ | 75,122 | |
| | | | | | | | | | | | | | | | | | | | |
|
| | | | | | | | | | | | | | | | | | | |
| | Payments Due by Period |
| | Less than 1 Year | | 1 to 3 Years | | 3 to 5 Years | | More than 5 Years | | Total |
| Purchase obligations | $ | 5,960 |
| | $ | 4,051 |
| | $ | — |
| | $ | — |
| | $ | 10,011 |
|
| Loan funding obligations | 15,719 |
| | — |
| | — |
| | — |
| | 15,719 |
|
| Operating lease obligations | 15,092 |
| | 31,674 |
| | 33,301 |
| | 40,423 |
| | 120,490 |
|
| WebBank purchase obligations | 32,248 |
| | — |
| | — |
| | — |
| | 32,248 |
|
Total contractual obligations(1) | $ | 69,019 |
| | $ | 35,725 |
| | $ | 33,301 |
| | $ | 40,423 |
| | $ | 178,468 |
|
| |
(1) | The notes and certificates issued by Lending Club and the Trust, respectively, have been excluded from the table above because payments on those liabilities are only required to be made by us if and when we receive the related loan payments from borrowers. Our own liquidity resources are not required to make any contractual payments on the notes or certificates, except in limited instances of proven identity fraud on a related loan. |
WebBank
Loan Purchase Obligation
During the fourth quarter of 2014,
Under our loan account program with WebBank, was modified sucha Utah-charted industrial bank that serves as our primary issuing bank, WebBank retains ownership of loans facilitated through our marketplaceplatform for two business days after origination. As part of this change,arrangement, we have committed to purchase the loans at par, plus accrued interest, at the conclusion of the two business days. As of December 31, 20142016 and December 31, 2015, we were committed to purchase loans with an outstanding principal balance of $4.1$32.2 million and $77.6 million at par, plus accrued interest. There was no such commitmentrespectively.
LENDINGCLUB CORPORATION
Management's Discussion and Analysis of Financial Condition and Results of Operations
(Tabular Amounts in Thousands, Except Share and Per Share Data and Ratios, or as Noted)
Loan Repurchase Obligations
We have historically limited our loan or note repurchase obligations to events of
December 31, 2013.Loan Funding Commitments
Forverified identity theft or in connection with certain customer accommodations. As institutional investors seek to securitize loans listedpurchased through the marketplace, we have increased the circumstances and the required burden of proof of economic harm under which we are obligated to repurchase loans from these investors. We believe these repurchase obligations are customary and consistent with institutional loan and securitization market standards.
In addition to and distinct from the repurchase obligations described in the marketplacepreceding paragraph, we perform certain administrative functions for a variety of retail and institutional investors, including executing, without discretion, loan investments as directed by the investor. To the extent loans do not meet the investor's investment criteria at the time of issuance, or are transferred to the investor as a result of a system error by us, we generally repurchase such loans at par. As a result of these obligations, we repurchased $46.7 million in loans during 2016.
Loan Funding and Purchase Commitments
During 2016, we purchased a total of $138.2 million in loans to fulfill regulatory requirements and to support short-term marketplace equilibrium, as discussed below.
As required by applicable regulations, we are required to purchase loans resulting from direct marketing efforts we have committed to invest inif such loans ifare not otherwise invested in by investors do not provide funding for all or a portionon our platform. During 2016, the Company purchased $35.5 million of such loans. AtAdditionally, following the events of May 9, 2016, we opted to use our own capital to support short-term marketplace equilibrium and purchased $102.7 million in loans during 2016.
Loans in the process of being facilitated and originated by our issuing bank partner at December 31,
2014, there2016, were
1,061 suchfunded in January 2017. No loans
in the marketplace with an unfunded balance of $10.3 million. All of these loans were fully funded by investors by January 7, 2015.In connection with transitional activities related to the acquisition of Springstone, in June 2014,remained without investor commitments and we entered into a contingent loan purchase agreement through December 31, 2014 with an issuing bank that originates loans facilitated by Springstone and a third-party investor that has agreed to purchase certain of these loans from such bank. In January 2015, this purchase agreement was extended to April 2, 2015. The contingent loan purchase commitment provides that we will purchase such loans from the bank if the third-party investor defaults on its loan purchase obligations to the bank through April 2, 2015. The contingent loan purchase commitment limits the aggregate amount of covered loan originations to a maximum of $16.0 million. As of December 31, 2014, the amount remaining under the overall limit on the cumulative amount of such loan originations was $10.6 million. We were not required to purchase any suchof these loans.
As of December 31, 2016, we held $27.9 million of loans pursuanton our balance sheet.
In addition, if neither Springstone nor the Company can arrange for other investors to invest in or purchase loans that Springstone facilitates and that are originated by an issuing bank partner but do not meet the contingent loancredit criteria for purchase commitment forby the issuing bank partner (Pool B loans), Springstone and the Company are contractually committed to purchase these loans.
The Company and the issuing bank have entered into purchase agreements with three investors to purchase Pool B loans or participation interests in Pool B loans. In connection with these purchase agreements, we deposited $9.0 million into an account at the bank to secure potential, future purchases of these loans, if any. As of January 5, 2016, any contractual minimum purchase requirements by these three investors had expired. During the year ended December 31,
2014.2016, the Company was required to purchase approximately $1.0 million of Pool B loans under these agreements. These loans are held on the Company's balance sheet and have a remaining principal balance of $0.9 million as of December 31, 2016.
Critical Accounting Policies
and Estimates
The Company’s significant accounting policies which are more fully described in “Item 8 – Financial Statements and Supplementary Data – Notes to Consolidated Financial Statements – Note 2 – Summary of Significant Accounting Policies” of the consolidated financial statements reflect our moststatements. The Company considers certain of these policies to be critical accounting policies as they require significant judgments, assumptions and estimates which we believe are critical in understanding and evaluating our reported financial results, includingresults. These critical accounting policies include (i) fair value estimates for loans,
LENDINGCLUB CORPORATION
Management's Discussion and Analysis of Financial Condition and Results of Operations
(Tabular Amounts in Thousands, Except Share and Per Share Data and Ratios, or as Noted)
loans held for sale, notes and certificates; (ii)
stock-based compensation expense;fair value estimates for servicing assets and liabilities; (iii)
the estimated loan trailing fee liability; (iv) accounting for goodwill and intangible assets;
(iv)(v) provision for income taxes, net of valuation allowance for deferred tax assets;
(v)(vi) consolidation of variable interest entities; and
(vi) fair value estimates for servicing assets and liabilities.(vii) stock-based compensation expense. These judgments, estimates and assumptions are inherently subjective
in nature and actual results may differ from these estimates and assumptions, and the differences could be material.
Fair Value of Loans,
Loans Held for Sale, Notes and Certificates
We have elected fair value accounting for loans,
loans held for sale, and related notes and the Trust’s certificates. The fair value election for
these loans
and notes and certificates
allowsresults in symmetrical accounting
forin that changes in the
timing and amounts recognized for both expected unrealized losses and charge-off losses onfair values of loans are generally offset by equal changes in the
loans and the relatedfair values of notes and certificates,
consistent withgiven the
borrower payment dependent
design.structure of the notes and certificates.
We estimate the fair values of loans, loans held for sale, and their related notes and certificates using a discounted cash flow valuation methodology. The fair valuation methodology considers projected prepayments, and uses the historical actual defaults, losses and recoveries on our loans to project future lossesnet cash flows.
Significant assumptions used in valuing the Company’s loans, loans held for sale, and notes and certificates were as follows:
Discount rates – The discount rates for loans and loans held for sale reflect the Company’s estimates of the rates of return that investors in unsecured consumer credit obligations would require when investing in the various credit grades of loans. The discount rates for the projected net cash flows of the notes and certificates reflect the Company’s estimates of the rates of return, including risk premiums that investors in unsecured consumer credit obligations would require when investing in notes issued by us and certificates issued by the Trust with cash flows dependent on specific grades of loans. Discount rates for existing loans, loans held for sale, and notes and certificates are adjusted to reflect the time value of money and are based on a risk premium that reflects the return market participants require on currently offered loans due to the credit and liquidity related uncertainty inherent in the instruments’ cash flows.
Net cumulative expected losses – Net cumulative expected losses are estimates of the net cumulative principal payments that will not be repaid over the entire life of a loan, loan held for sale, and note or certificate, expressed as a percentage of the original principal amount of the loan, loan held for sale, and note or certificate. The estimated net cumulative loss is the sum of the net losses estimated to occur each month of the life of a loan, loan held for sale, and note or certificate. Therefore, the total net losses estimated to occur over the remaining maturity of existing loans, loans held for sale, and notes and certificates are less than the estimated net cumulative losses of comparable new loans, notes and certificates.
Cumulative prepayments – Cumulative prepayments are estimates of the cumulative amount of principal prepayments that will occur over the entire life of a loan, loan held for sale, and note or certificate expressed as a percentage of the original principal amount of the loan, loan held for sale, and note or certificate. The total prepayments estimated to occur over the remaining maturity of existing loans, loans held for sale, and notes and certificates are less than the estimated cumulative prepayments of comparable new loans, loans held for sale, and notes and certificates. The assumption regarding cumulative prepayments reduces the projected principal balances and expected terms of the loan and loan held for sale. Beginning in the third quarter of 2015, the Company incorporates expected prepayments into the valuation of loans, loans held for sale, and notes and certificates to better reflect a market participant’s view of valuation assumptions underlying unsecured consumer credit obligations. Prior to the third quarter of 2015, the effect of prepayments was reflected through an effective adjustment to the discount rates used in the fair value methodology.
LENDINGCLUB CORPORATION
Management's Discussion and Analysis of Financial Condition and Results of Operations
(Tabular Amounts in Thousands, Except Share and Per Share Data and Ratios, or as Noted)
We include in earnings the estimated unrealized fair value gains or losses during the period of loans and loans held for sale, and the offsetting estimated fair value losses or gains attributable to the expected changes in future payments on notes and certificates (See Note 4 – Loans, notescertificates.
Fair Value of Servicing Assets and certificatesLiabilities
We record servicing assets and
Loanliabilities at their estimated fair values when we sell whole loans to unrelated third-party whole loan buyers or when the servicing contract commences. The gain or loss on a loan sale is recorded in other revenue (expense) in the consolidated statements of operations while the component of the gain or loss that is based on the degree to which the loan servicing fee is above or below an estimated market rate loan servicing fee is recorded as an offset in servicing assets or liabilities. Servicing
Rights to ourassets and liabilities are recorded in “Other assets” and “Accrued expenses and other liabilities,” respectively, on the consolidated
financial statements includedbalance sheets. Changes in
this Report).Stock-based Compensation
Stock-based compensation includes expense associated with stock option grants and our 2014 employee stock purchase plan (ESPP), as well as expense associated with stock issued related to our acquisition of Springstone. Stock-based compensation for stock options is measured at the grant date based on the fair value of servicing assets and liabilities are reported in “Servicing fees” in the awardconsolidated statements of operations in the period in which the changes occur.
The Company uses the fair value measurement method to account for changes in servicing assets and
isrecognized as expense, netliabilities. The Company uses a discounted cash flow model to estimate the fair values of loan servicing assets and liabilities. The cash flows in the valuation model represent the difference between the servicing fees charged to whole loan buyers and an estimated forfeitures, overmarket servicing fee. Since servicing fees are generally based on the requisite service period, which is generally the vesting periodmonthly unpaid principal balance of the respective award. Asunderlying loans, the expected cash flows in the model incorporate estimated net expected losses and expected prepayments. The significant assumptions used in valuing the Company’s servicing assets and liabilities were as follows:
Market servicing rates – The Company considers market servicing rates as those rates which a result, we estimatemarket participant would require to service the loans that Lending Club sells. The Company estimated these market servicing rates based on review of available observable market servicing rates. The Company also supplements this analysis with market servicing benchmarking analyses performed periodically by third-party valuation firms.
Discount rates – The discount rates for loan servicing rights reflect the Company’s estimates of the rates of return that investors in servicing rights for unsecured consumer credit obligations would require when investing in similar servicing rights. Discount rates for servicing rights on existing loans reflect a risk premium intended to reflect the amount of stock-based compensation we expectmarket participants would require due to the credit and liquidity uncertainty inherent in the instruments’ cash flows.
Net cumulative expected losses – Net cumulative expected losses are an estimate of the net cumulative principal payments that will not be forfeitedrepaid over the entire life of a loan expressed as a percentage of the original principal amount of the loan. The net cumulative expected losses are estimated based on analysis of historical credit losses at the loan type, grade and maturity levels.
Cumulative prepayments – Cumulative prepayments are estimates of the cumulative amount of principal prepayments that will occur over the entire life of a loan expressed as a percentage of the original principal amount of the loan. The cumulative prepayments are estimated based on analysis of historical prepayment rates at the loan type, grade and maturity levels.
Loan Trailing Fee Liability
In February 2016, we revised the agreement with our historical experience. If actual forfeitures differ significantly fromprimary issuing bank partner to include an additional program fee (Loan Trailing Fee). The Loan Trailing Fee is dependent on the amount and timing of principal and interest payments made by borrowers of the underlying loans, and gives the issuing bank an ongoing financial interest in the performance of the loans it originates. This fee is paid by us to the issuing bank partner over the term of the
LENDINGCLUB CORPORATION
Management's Discussion and Analysis of Financial Condition and Results of Operations
(Tabular Amounts in Thousands, Except Share and Per Share Data and Ratios, or as Noted)
respective loans and is a function of the principal and interest payments. In the event that principal and interest payments are not made, we are not required to make this Loan Trailing Fee payment. The Loan Trailing Fee is recorded at fair value with the initial establishment, and any changes, of this liability are netted against transaction fees on our
estimates, stock-based compensation expenseconsolidated statement of operations. The fair value of the Loan Trailing Fee represents the present value of the expected monthly Loan Trailing Fee, which considers assumptions of expected prepayment rates and
our results of operations could be materially impacted.Determiningfuture credit losses.
Goodwill and Intangible Assets
Goodwill represents the fair value of
stock-based awards atacquired businesses in excess of the
grant date requires judgment. We use the Black-Scholes option-pricing model to determine theaggregate fair value of
stock options. The determination of the
grant date fair value of options using an option-pricing modelidentified net assets acquired. Goodwill is
affected by our assumptions regarding a number of variables including the fair value of our common stock (prior to our IPO), our expected common stock price volatility over the expected life of the options, expected term of the stock option, risk-free interest rates and expected dividends. After our IPO, the fair value of our common stocknot amortized but is
the closing stock price as listed on the NYSE on the date of grant.The fair value of stock purchase rights granted to employees under the ESPP is measured on the grant date using the Black-Scholes option pricing model. The compensation expense related to ESPP purchase rights is recognized on a straight-line basis over the requisite service period.
SeeNote 12 – Employee Incentive and Retirement Plans to our consolidated financial statements included in this Report for more information.
Goodwill and Intangible Assets
We test goodwilltested for impairment annually or whenever indications of impairment exist. Our annual impairment testing date is April 1. Impairment exists whenever the carrying value of goodwill exceeds its implied fair value. Adverse changes in impairment indicators such as loss of key personnel, increaseincreased regulatory oversight, or unplanned changes in our operations could result in impairment.
We didcan elect to qualitatively assess goodwill for impairment if it is more likely than not recognizethat the fair value of a reporting unit (generally defined as a component of a business for which financial information is available and reviewed regularly by management) exceeds its carrying value. A qualitative assessment may consider macroeconomic and other industry-specific factors, such as trends in short-term and long-term interest rates and the ability to access capital or company-specific factors, such as market capitalization in excess of net assets, trends in revenue generating activities and merger or acquisition activity.
If we do not qualitatively assess goodwill we compare a reporting unit’s estimated fair value to its carrying value. We estimate the fair value of a reporting unit using both an income approach and a market approach. When applying the income approach, we use a discounted cash flow model, which requires the estimation of cash flows and an appropriate discount rate. We project cash flows expected to be generated by the reporting unit inclusive of an estimated terminal value. The discount rate assumption contemplates a weighted-average cost of capital based on both market observable and company-specific factors. The discount rate is risk-adjusted to include any premiums related to equity price volatility, size, and projected capital structure of publicly traded companies in similar lines of business. The market approach estimates the fair value of a reporting unit based on certain market value multiples of publicly traded companies in similar lines of business, such as total enterprise value to revenue, or to EBITDA. Under the market approach, we also consider fair value implied from any relevant and comparable market transactions. Both approaches include reliance on long-term growth rates, and revenue and earnings projections.
We recorded a goodwill impairment for the year ended December 31, 2014. We did not have any goodwill during the year ended December 31, 2013 orsecond and third quarters of 2016 after completing the nine months ended December 31, 2012.annual impairment test. See “
Part II – Item 8 – Financial Statements and Supplementary Data – Note 9. Intangible Assets and Goodwill” for additional information.
Intangible assets are amortized over their useful lives in a manner that best reflects their economic
benefit.benefit, which may include straight-line or accelerated methods of amortization. Intangible assets are reviewed for impairment
quarterly and whenever events or changes in circumstances indicate that the carrying amount of such assets may not be recoverable. We do not have any indefinite-lived intangible assets.
We account for income taxes using the asset and liability method. Under this method, deferred tax assets and liabilities are recognized for the future tax consequences attributable to differences between the financial statement carrying amount of existing assets and liabilities and their respective tax bases and net operating loss and tax credit carry-forwards. A valuation allowance is recorded to reduce deferred tax assets to the amount that is more likely than not to be realized.
LENDINGCLUB CORPORATION
Management's Discussion and Analysis of Financial Condition and Results of Operations
(Tabular Amounts in Thousands, Except Share and Per Share Data and Ratios, or as Noted)
Given our history of operating losses, it is difficult to accurately forecast when and in what amounts future results will be affected by the realization, if any, of the tax benefits
ofresulting from future deductions for our net operating loss
carry-forwards.carryforwards. Based on the weight of available evidence, which includes our historical operating performance and the reported cumulative net losses in
all prior years, we have provided a full valuation allowance against our net deferred tax assets.
At December 31,
2014,2016, we had federal and state net operating loss
carry-forwardscarryforwards of approximately
$68.7$260.3 million and
$61.5$178.0 million, respectively,
that can be used to offset future taxable income. These federal and state net operating loss
carry-forwardscarryforwards will begin expiring in
20272025 and
2016,2028, respectively.
Additionally, at December 31, 2014, we had federal and state research and development tax credit carry-forwards of approximately $0.3 million and $0.2 million, respectively. The federal credit carry-forwards will begin expiring in 2017 and the state credits may be carried forward indefinitely. We assess the available positive and negative evidence to estimate if sufficient future taxable income will be generated to utilize the existing deferred tax assets. On the basis of this evaluation, a full valuation allowance has historically been recorded to recognize only deferred tax assets that are more likely than not to be realized.
Consolidation of Variable Interest Entities
A variable interest entity (VIE) is a legal entity that does not have sufficient equity at risk to finance its own operations, whose equity holders do not have the power to direct the activities most significantly affecting the economic outcome of those activities, or whose equity holders do not share proportionately in the losses or receive the residual returns of the entity. The determination of whether to consolidatean entity is a variable interest entity or VIE in which we have a variable interest requires a significant amount of analysis and judgment whetherjudgment. When we are the primary beneficiary of a VIE viahave a controlling financial interest in a VIE, it must consolidate the VIE.results of the VIE’s operations into its consolidated financial statements. A controlling financial interest in a VIE exists if we have both the power to direct the VIE’s activities that most significantly affect the VIE’s economic performance (power) and a potentially significant economic interest in the VIE. The determination of whether an entity is a VIE considers factors, such as (i) whether the entity’s equity investment at risk is insufficient to allow the entity to finance its activities without additional subordinated financial support or (ii) when a holder’s equity investment at risk lacks any of the following characteristics of a controlling financial interest: the direct or indirect ability through voting rights or similar rights to make decisions about a legal entity’s activities that have a significant effect on the entity’s success, the obligation to absorb losses or receive benefits that could be potentially significant to the expected losses ofVIE (economics).
LC Trust I
We have determined that LC Trust I (the Trust) is a VIE and that we have a controlling financial interest in the
entity orTrust and therefore we must consolidate the
right to receive the expected residual returns of the legal entity.Trust in its consolidated financial statements. We established the Trust in February 2011 and funded it with a nominal residual investment. We are the only residual investor in the Trust. The purpose of the Trust is to acquire and hold loans for the benefit of investors who have invested in certificates issued by the Trust. The Trust conducts no other business other than purchasing and retaining loans or portions thereof for the benefit of the investment funds and their underlying limited partners. The Trust holds loans, thenone of which are financed by us. The cash flows of whichfrom the loans held by the Trust are used to repay obligations under the certificates investedcertificates. The Trust's assets and liabilities were reflected in by the investment funds, but does not hold any portions of loans that are financed by us directly or through the purchaseconsolidated financial statements at December 31, 2016 and sale of notes.
2015.
In
the event of our insolvency, it is anticipated that the assets of the Trust would not become part of the bankruptcy estate, but that outcome is uncertain. As a result of this risk and uncertainty and in connection with the formation of the investment funds, it was determined that in order to achieve success in raising investment capital, the assets to be invested in by the investment funds must be held by an entity that was separate and distinct from us (i.e. bankruptcy remote) in order to reduce this risk and uncertainty.
In the event of our insolvency, it is anticipated that the assets of the Trust would not become part of the bankruptcy estate, but that outcome is uncertain.
Our capital contributions, have beenwhich are the only equity investments in the Trust, are insufficient to allow the Trust to finance itsthe purchase of anya significant amount of loans without the issuance of certificates to investors. TheTherefore, the Trust’s capitalization levels and structure, wherein investors’ have beneficial interests in loans via the certificates,level qualifies the Trust as a VIE because the Trust’s equity investment at risk is not sufficient.VIE. We believe we are the primary beneficiary ofhave a financial interest in the Trust because of our controlling financial interest in the Trust. Further the Trust is designedright to pass along interest rate risk and credit riskreturns related to investors in the certificates. Our exposure to the Trust includes our servicing fee revenue from the Trust, our right to reimbursement for expenses, and our obligation to repurchase loans from the Trust in certain instances. WeAdditionally, we perform or direct activities that significantly affect the Trust’s economic performance through (i) operation of the platform that enables borrowers to apply for loans purchased by the Trust; (ii) credit underwriting and servicing of loans purchased by the Trust;
LENDINGCLUB CORPORATION
Management's Discussion and Analysis of Financial Condition and Results of Operations
(Tabular Amounts in Thousands, Except Share and Per Share Data and Ratios, or as Noted)
(iii) LCA's selection of the loans that are purchased by the Trust on behalf of advised Certificate holders; and (iv) LCA’s role to source investors that ultimately purchase certificates thatlimited partnership interests in a fund or Certificates, both of which supply the funds for the Trust to purchase loans. Collectively, the activities described above allow us to fund more loans andthan would be the case without the existence of the Trust, to collect the related loan transaction fees, and for LCA to collect the management fees on the investors’ capital used to purchase certificates, than would be the case without the existence of the Trust. Therefore,certificates. Accordingly, we receiveare deemed to have power to direct activities most significant economic benefits from the existence and activities conducted by the Trust. Accordingly, because we have concluded that capital contributions to the Trust qualify as equity investmentsand economic interest in a VIE in whichthe activities because of loan funding and transaction and management fees. Therefore, we concluded that we are the primary beneficiary we haveof the Trust and consolidated the Trust’s operations in our consolidated financial statements.
Investment In Cirrix Capital
On April 1, 2016, we closed our $10.0 million investment, for an approximate ownership interest of 15% in Cirrix Capital (Investment Fund), a holding company to a family of funds that purchases loans and all intercompany accountsinterests in loans from us. Per the partnership agreement, the family of funds can invest up to 20% of their assets outside of whole loans and interests in whole loans facilitated by us. At December 31, 2016, 100% of the family of funds' assets were comprised of whole loans and interests in loans facilitated by Lending Club's platform. At the time we made our investment, our former CEO and a board member (together, the Related Party Investors) also had limited partnership interests in the Investment Fund. As of June 30, 2016, the end of the period in which our former CEO resigned, the Related Party Investors and the Company had an aggregate ownership of approximately 29% in the Investment Fund. As of December 31, 2016, we and a board member had an aggregate ownership interest of approximately 27% in the Investment Fund.
Our investment is deemed to be a variable interest in the Investment Fund because the limited partnership interest shares in the expected returns and losses of the Investment Fund. The expected returns and losses of the Investment Fund result from the net returns of the family of funds owned by the Investment Fund, which are derived from interest income earned from loans and interests in whole loans that are purchased by the Investment Fund. Such loans and interests in loans were facilitated by us. Additionally, the Investment Fund is considered a VIE. We are not the primary beneficiary of the Investment Fund because we do not have the power to direct the activities that most significantly affect the Investment Fund’s economic performance. As a result, we do not consolidate the operations of the Investment Fund in our financial statements. We account for this investment under the equity method of accounting, which approximates its maximum exposure to loss as a result of its involvement in the Investment Fund. At December 31, 2016, our investment was $10.1 million, which was recorded in other assets in the consolidated balance sheet.
Separately, we are subject to a credit support agreement that requires us to pledge and restrict cash in support of our contingent obligation to reimburse the Investment Fund for net credit losses on loans underlying the interests in whole loans that are in excess of a specified, aggregate net loss threshold. The Related Party Investors and us are excluded from receiving any benefits, if provided, from this credit support agreement. As of December 31, 2016, we have not been
eliminated.required to nor do we anticipate recording losses under this agreement. The Company's maximum exposure to loss under this credit support agreement was limited to $6.0 million and $34.4 million at December 31, 2016 and 2015, respectively.
The Investment Fund passes along credit risk to the limited partners. We did not design the Investment Fund’s investment strategy and cannot require the Investment Fund to purchase loans. Additionally, we reviewed whether we collectively, with the board member's investment, had power to control the Investment Fund and concluded that we did not based on the unilateral ability of the general partner to exercise power over the limited partnership and the inability of the limited partners to remove the general partner. See “Part II – Item 8 – Financial Statements and Supplementary Data – Note 19. Related Party Transactions” for additional information.
LENDINGCLUB CORPORATION
Management's Discussion and Analysis of Financial Condition and Results of Operations
(Tabular Amounts in Thousands, Except Share and Per Share Data and Ratios, or as Noted)
LCA Managed or Advised Private Funds
In conjunction with the adoption of a new accounting standard that amends accounting for consolidations effective January 1, 2016, we reviewed our relationship with the investmentprivate funds in whichmanaged or advised by LCA is the general partner but in which neither we nor LCA has contributed capital. Weand concluded that LCA’s contractual relationship to the investment funds doeswe do not meet the requirements for consolidation of the funds into the consolidated financial statements. Further we determined that our interest as general partner does not representhave a variable interest in the private funds. As of December 31, 2014,2016, we diddo not hold any investments in the private funds. Certain of our related parties have investments in the private funds, as discussed in “Part II – Item 8 – Financial Statements and Supplementary Data – Note 19.Related Party Transactions.” We charge the limited partners in the private funds a management fee based on their account balance at month end for services performed as the general manager, including fund administration, and audit, accounting and tax preparation services. Accordingly, our fee arrangements contain only terms, conditions, or amounts that are customarily present in arrangements for similar services negotiated at arm’s length. These fees are solely compensation for services provided and are commensurate with the level of effort required to provide those services. We do not have any controllingother interests in investmentthe private funds other than ourand therefore we do not have a variable interest in the Trust discussed above, that would require inclusion in the consolidated financial statements. private funds.
Management regularly reviews and reconsiders its previous conclusion regarding
whether it holds variable interest in potential VIEs, the status of an entity as a VIE, and whether we are required to consolidate such
VIEVIEs in the consolidated financial statements.
Loan Servicing
Assets and LiabilitiesWe recordRights
As a result of the nature of servicing assets and liabilities at their estimated fair values whenrights on the sale of loans, we sell whole loansare a variable interest holder in certain entities that purchase these loans. For all of these entities we either do not have the power to unrelated third-party whole loan buyersdirect the activities that most significantly affect the VIE's economic performance or when the servicing contract commences. The gain or loss onwe do not have a loan sale is recorded in “Other revenue (expense)”potentially significant economic interest in the VIE. In no case are we the primary beneficiary and as a result none of these entities are consolidated statementon our consolidated financial statements.
Stock-based Compensation
Stock-based compensation includes expense associated with restricted stock units, stock option grants, and our employee stock purchase plan (ESPP), as well as expense associated with stock issued related to our acquisition of operations upon sale ofSpringstone. Stock-based compensation expense is based on the whole loan, while the change ingrant date fair value of the servicing assetaward, net of expected forfeitures, which are based on our historical experience. If actual forfeitures differ significantly from our estimates, stock-based compensation expense and liability is included in “Servicing fees” in the consolidated statementour results of operations incould be materially impacted.
The fair value of restricted stock units is based on the
period in whichclosing price of our common stock on the
changes occur. Servicing assetsdate of grant. To determine the fair value of stock options and
liabilities are recorded in “Other assets”ESPP purchase rights, we use the Black-Scholes option-pricing model, with inputs for the fair value of our common stock, expected common stock price volatility over the expected life of the stock options or ESPP purchase rights, expected term of the stock option or ESPP purchase right, risk-free interest rates and
“Accrued expensesexpected dividends. Prior to the Company’s IPO, the fair value of its shares of common stock was established by the board of directors. The Company’s board of directors relied upon valuations provided by third-party valuation firms and other
liabilities,” respectively, onfactors, including, but not limited to, the
consolidated balance sheets.We use a discounted cash flow modelcurrent status of the technical and commercial success of the Company’s operations, the Company’s financial condition, the stage of the Company’s product design and development, and competition to estimateestablish the fair value of the loan servicing assetCompany’s common stock at the time of grant of the option.
As we do not have a significant trading history for our common stock, the expected stock price volatility for our common stock is estimated by reference to the average historical stock price volatility for our industry peers. The industry peer group used to estimate our volatility includes small, mid and large capitalization companies in the consumer finance, investment management and technology industries taking into account the similarity in size, stage of life cycle and financial leverage. The expected term represents the period of time that stock options are
LENDINGCLUB CORPORATION
Management's Discussion and Analysis of Financial Condition and Results of Operations
(Tabular Amounts in Thousands, Except Share and Per Share Data and Ratios, or liability, which considersas Noted)
estimated to be outstanding, giving consideration to the contractual servicing fee revenue we earnterms of the options, vesting schedules, and expectations of future exercise patterns and post-vesting employee termination behavior. Given our limited operating history, the simplified method is applied to calculate the expected term. We use a risk-free interest rate based on the U.S. Treasury yield for a term consistent with the expected life of the awards in effect at the time of grant. We have never declared or paid any cash or other dividends and do not anticipate paying cash or other dividends in the foreseeable future. Consequently, we use an expected dividend yield of 0.0% in our option-pricing model.
Stock-based compensation expense related to stock options and restricted stock units that are expected to vest is recognized over the vesting period of the award, which is generally four years, on a straight-line basis. The compensation expense related to ESPP purchase rights is recognized on a straight-line basis over the requisite service period, which is generally six months.
Board Review
As previously disclosed in the Company’s Quarterly Report on Form 10-Q for the quarters ended March 31, 2016, June 30, 2016, and September 30, 2016, we conducted a review, the findings of which are described in detail below, under the supervision of an independent sub-committee of the board of directors and with the assistance of independent outside counsel and other advisors. This review is complete, although it is possible that additional issues may arise as part of our response to ongoing government requests for information.
As described below, the review related primarily to (i) $22.3 million of near-prime loan sales in private transactions with a single institutional investor and associated control issues; (ii) the methodologies used to determine the net asset values and monthly return figures reported for six private investment funds (the Funds) managed by the Company's subsidiary, LC Advisors, LLC (LCA); (iii) the investment parameters of one of the LCA Funds; and (iv) other matters associated with our former CEO and former Chief Financial Officer (CFO).
Sale of Near-Prime Loans
After the end of the first quarter of 2016, we became aware that approximately $15.1 million and $7.2 million in near-prime loans
estimated market rate servicing feeswere sold to
service sucha single institutional investor in March and April 2016, respectively. The loans
in question failed to conform to the
current principal balancesinvestor's express instructions as to a non-credit, non-pricing element. Certain personnel apparently were aware that the sale did not meet the investor's criteria. In one case, involving $3.0 million in loans, an application date was changed in a live Company database in an attempt to appear to meet the investor's requirement, and the balance of the loans
expected loan losses and prepayments and projected servicing revenues over the remaining termswere sold in direct contravention of the
loans.investor's direction. The fair value of servicing assets and liabilities is sensitive to changeschange in certain assumptions used in our discounted cash flow model but only changes in expected cumulative losses and cumulative expected prepayments affect actual cash flows. Generally, changes in the net cumulative expected loss rates and discount rates have an immaterialapplication date was promptly remediated. The financial impact on the fair value of loan servicing rights while changes in our selection of a market servicing rate and our expected prepayments impact our fair value of loan servicing rights. Our selection of the most representative prepayment rates and market servicing rates for our products is inherently judgmental. We reviewed servicing rates for other assets with detachable servicing rightssales of these $22.3 million in near-prime loans would have been to estimate a market servicing rateincrease reported gains on our products. Expected prepayments are based on analysis of actual prepayments experiencesales of loans considering their various types, termsby approximately $150,000, and credit grades.
Subsequent Events
to derecognize the loans from the consolidated balance sheet. In April 2016, we repurchased these loans at par and resold the loans at par to a different investor who was aware of the reason for the original repurchase.
As a further part of this review, an additional independent advisor was retained. The Company has evaluatedadvisor analyzed certain loan data elements from whole loans issued and sold during the impactsecond quarter of events that have occurred subsequent to December 31, 2014 through the first quarter of 2016. Excluding the $3.0 million of loans noted above, the advisor observed that 99.99% of the remaining loans display either no changes or changes explained by the normal course of business. We took various control remediation steps, including termination or resignation of senior managers in May 2016 involved in these non-compliant loan sales, and subsequently took additional control and other remediation steps.
Resignation of Former CEO
Subsequent to this review, on May 6, 2016, the board of directors accepted the resignation of Renaud Laplanche, our then Chairman and CEO (former CEO). The Company initially appointed Scott Sanborn, its President, as acting CEO and John C. (Hans) Morris, a director, as Executive Chairman. On June 28, 2016, the Company announced
LENDINGCLUB CORPORATION
Management's Discussion and Analysis of Financial Condition and Results of Operations
(Tabular Amounts in Thousands, Except Share and Per Share Data and Ratios, or as Noted)
that the board of directors appointed Scott Sanborn as the Company's Chief Executive Officer and President, effective June 27, 2016, and that Hans Morris would step down from his temporary role as Executive Chairman. On that date the Company also announced that Mr. Morris had been appointed the independent Chairman of the Board.
LCA Funds
We also identified two items related to the LCA Funds for inclusion in our review. The first item was a review of methodologies used to determine the net asset values and monthly return figures reported for the Funds. The investment assets held by the Funds are essentially loans facilitated through the Company’s platform and are “level 3 assets,” for which no quoted market price is available and whose fair value is therefore subjective and is determined by LCA estimates and calculations.
We determined that adjustments were made to the valuation of the Funds' assets that were not consistent with GAAP. These adjustments affected the direction and the specific returns reported in monthly statements sent to limited partners. LCA subsequently provided each Fund’s respective limited partners revised return figures that exclude prior adjustments. As of the filing of this Form 10-K, the Company is finalizing reimbursements to limited partners who, during the life of any Fund, entered or exited the Funds and who were adversely impacted by these adjustments. This reimbursement was approximately $1.0 million in total, covering the period from inception of the Funds (the earliest of which was March 2011) through May 31, 2016.
The board’s review also discovered that the investment parameters of one of the Funds, specifically with respect to the allocation of 60-month loans held by the Fund, was out of tolerance. The review found that this was due to non-adherence to the Fund's investment strategy, including in part due to the purchase of loans in the first quarter of 2016 that were about to expire on the Lending Club platform. Although the portfolio composition of the Fund was disclosed monthly to the investors of the Fund, it was not disclosed to our board.
The Company and LCA have made several changes to improve the governance and the operations of the Funds as a result of this additional review. In June 2016, LCA established a majority independent Governing Board (the LCA Board) for the Funds. The LCA Board will provide fiduciary oversight and make binding determinations for certain actions and activities of the Funds including approval of valuation policies and procedures, and review and adherence to respective investment strategies. Further, we realigned responsibilities for accounting and financial statementsreporting for the Funds within the Company. Further, in August 2016, the Company and LCA engaged an independent valuation firm, with specific expertise in the valuation of marketplace assets, to provide valuation services to the Funds.
Other Matters
The board review also noted that our former CEO and our former CFO had pledged some of their Company shares to secure personal loans from a third-party financial institution, which was not disclosed to the board during subsequent deliberations, prior to the discussion referred to below. In January 2016, the reduction in the Company’s share price forced them to refinance. In order to avoid selling shares, the former CEO requested temporary financing, secured by real estate, from an entity related to a director of the Company. Separately, the former CEO then offered to lend an amount to the former CFO to also permit her to refinance her loan. These temporary financing arrangements were fileddiscussed with the SEC.members of the Audit Committee. The officers obtained new financing from unrelated third parties within three weeks to pay off their temporary financing arrangements. In the opinion of the Company these lending arrangements were executed on normal market terms and, because the Company had no financial involvement in them, did not require approval under the Company’s policy on related party transactions.
In addition, the Company identified 32 loans made in the second half of December 2009 through the Lending Club platform, totaling approximately $722,800 in originations and $25,000 in revenue, to the Company’s former CEO, Renaud Laplanche, and three of his family members. All but three of these loans were repaid in full in January and
LENDINGCLUB CORPORATION
Management's Discussion and Analysis of Financial Condition and Results of Operations
(Tabular Amounts in Thousands, Except Share and Per Share Data and Ratios, or as Noted)
February of 2010, with the remaining three loans held to maturity and paid in full. The Company’s review has found that these loans were issued in order to help increase reported platform loan volume for December 2009. Based on the review, the Company is confident that there are no other situations in which Mr. Laplanche inappropriately originated loans in his or his family’s name during periods after December 2009.
In connection with this evaluation, other thanreview, the Company concluded that its internal control over financial reporting was ineffective as recorded orof December 31, 2015 due to a material weakness and, therefore, the Company’s disclosure controls and procedures also were ineffective as disclosed in “Item 9A - Controls and Procedures” of our Annual Report on Form 10-K, as amended, for the year ended December 31, 2015. The Company made a similar conclusion with respect to its internal control over financial statementsreporting and related notes, we have determined no such eventsits disclosure controls and procedures as of March 31, 2016, June 30, 2016, and September 30, 2016, as disclosed in Item 4 of our Quarterly Report on Form 10-Q for the quarters ended March 31, 2016, June 30, 2016, and September 30, 2016, respectively. We implemented a remediation plan, and as of December 31, 2016, management concluded that its internal control over financial reporting, as remediated, and its disclosure controls and procedures, were required to be recognized or disclosed.effective, as described in “Item 9A – Controls and Procedures.”
Item 7A. Quantitative and Qualitative Disclosures About Market Risk
Market risk represents the risk of loss that may impact our financial position due to adverse changes in financial market prices and interest rates. We
Except for the loans invested in by the Company, we generally do not
have a material exposure to marketassume principal or interest rate risk
with respect to the fair value of these financial instruments.Becauseon loans funded through our marketplace because loan balances, interest rates and maturities of loans are matched and offset by an equal balance of notes and certificates with the exact same interest rates and maturities,maturities. Accordingly, we believe that we do not have any material exposure to changes in the net fair value of thethese combined loan, note and certificate portfolios as a result of changes in interest rates. For loans that are invested in by the Company, the Company has exposure to interest rate risk.
During 2016, the Company purchased a total of $138.2 million of loans through the platform to fulfill regulatory or contractual purchase obligations (such as direct mail offers) or support short-term marketplace equilibrium. The Company was able to find additional investors in these loans, as well as loans the Company repurchased from investors that did not meet the investor's investment criteria at the time of issuance, and resold $144.7 million of loans purchased by the Company in 2016. The majority of these loans were purchased and resold in the first half of 2016. The outstanding principal balance of loans for which the Company remained invested in as of December 31, 2016, was $27.9 million. See “Part II – Item 8 – Financial Statements and Supplementary Data – Note 13. Secured Borrowings” for additional information on loans purchased by the Company during 2016. We do not believe the interest rate risk associated with the remaining loans held by the Company as of December 31, 2016, is material. We will experience increased exposure to interest rate risk if we increase the amount of our capital used to invest in loans. See “Part II – Item 7 – Management’s Discussion and Analysis of Financial Condition and Results of Operations – Current Economic and Business Environment” and “Item 7 – Management's Discussion and Analysis of Financial Condition and Results of Operations – Liquidity and Capital Resources – Liquidity” for additional discussion. We do not hold or issue financial instruments for trading purposes.
The fair values of loans and the related notes and certificates are determined using a discounted cash flow methodology. The fair value adjustments for loans are largely offset by the fair value adjustments of the notes and certificates due to the borrower payment dependent design of the notes and certificates and due to the total principal balances of the loans being very close to the combined principal balances of the notes and certificates.
The Company recorded a negative fair value adjustment related to the loans the Company invested in as of December 31, 2016, of approximately $2.9 million during the year ended December 31, 2016.
We had cash and cash equivalents of $869.8$515.6 million as of December 31, 2014.2016. These amounts were held primarily in interest-bearing deposits at investment grade financial institutions and institutional money market funds, which are short-term. Cash and cash equivalents are held for working capital purposes. Due to their short-term nature, we believe that we do not have any material exposure to changes in the fair value of these liquid investments as a result of changes in interest rates. Decreases in short-term interest rates will not materially reduce interest income on these cash and cash equivalents because of the current low rate environment. Increases in short-term interest rates will modestly increase the interest income earned on these cash balances.
Interest Rate Sensitivity
The Company holds securities available for sale. At December 31, 2016, the fair value of our securities available for sale portfolio was $287.1 million, consisting of corporate debt securities, certificates of deposit, asset-backed securities, commercial paper, U.S. agency securities, U.S. Treasury securities and other securities. To mitigate the risk of loss, our investment policy and strategy is focused first on the preservation of capital and supporting our liquidity requirements, and then maximizing returns. To manage this risk, the Company limits and monitors maturities, credit ratings, and concentrations within the investment portfolio. Changes in U.S. interest rates affect the interest earned on our securities available for sale and the market value of those securities. A hypothetical 100 basis point increase in interest rates would result in a decrease of approximately $1.2 million in the fair value of our securities available for sale as of December 31, 2016. A hypothetical 100 basis point decrease in interest rates would result in an increase of approximately $1.2 million in the fair value of our securities available for sale as of December 31, 2016. Any realized gains or losses resulting from such interest rate changes would only be recorded if we sold the securities prior to maturity and the securities were not considered other-than-temporarily impaired.
Item 8. Financial Statements and Supplementary Data
REPORT OF INDEPENDENT REGISTERED PUBLIC ACCOUNTING FIRM
To the Board of Directors and Stockholders of
San Francisco, California
We have audited the accompanying consolidated balance sheets of LendingClub Corporation and subsidiaries (the “Company”) as of December 31,
20142016 and
2013,2015, and the related consolidated statements of operations,
comprehensive income (loss), changes in stockholders’ equity, and cash flows for each of the
twothree years in the period ended December 31,
2014.2016. Our audits also included the financial statement schedule
oflisted in the
Company includedIndex at Item 15.
The Company’s management is responsible for theseThese financial statements and financial statement
schedule.schedule are the responsibility of the Company’s management. Our responsibility is to express an opinion on
thesethe financial statements and financial statement schedule based on our
audit.audits.
We conducted our
auditaudits in accordance with the standards of the Public Company Accounting Oversight Board (United States). Those standards require that we plan and perform the audit to obtain reasonable assurance about whether the financial statements are free of material misstatement.
The Company is not required to have, nor were we engaged to perform, an audit of its internal control over financial reporting. Our audit included consideration of internal control over financial reporting as a basis for designing audit procedures that are appropriate in the circumstances, but not for the purpose of expressing an opinion on the effectiveness of the Company’s internal control over financial reporting. Accordingly, we express no such opinion.An audit
also includes examining, on a test basis, evidence supporting the amounts and disclosures in the financial
statements,statements. An audit also includes assessing the accounting principles used and significant estimates made by management, as well as evaluating the overall financial statement presentation. We believe that our
audit providesaudits provide a reasonable basis for our opinion.
In our opinion,
thesuch consolidated financial statements
referred to above present fairly, in all material respects, the financial position of LendingClub Corporation and subsidiaries as of December 31,
20142016 and
2013,2015, and the results of their operations and their cash flows for each of the
twothree years in the period ended December 31,
2014,2016, in conformity with accounting principles generally accepted in the United States of America. Also, in our opinion, such financial statement schedule, when considered in relation to the basic consolidated financial statements taken as a whole, presents fairly, in all material respects, the information set forth therein.
DELOITTE & TOUCHE LLP
San Francisco, CA
February 27, 2015
REPORT OF INDEPENDENT REGISTERED PUBLIC ACCOUNTING FIRM
The Board of Directors and Stockholders
LendingClub Corporation
We have also audited, the accompanying consolidated balance sheet of LendingClub Corporation (a Delaware corporation) and subsidiaries (the “Company”) as of December 31, 2012 (not presented herein) and the related consolidated statements of operations, stockholders’ equity and cash flows for the nine months ended December 31, 2012. These financial statements are the responsibility of the Company’s management. Our responsibility is to express an opinion on these consolidated financial statements based on our audit.We conducted our audit in accordance with the standards of the Public Company Accounting Oversight Board (United States). Those standards require that we plan and perform, the audit to obtain reasonable assurance about whether the consolidated financial statements are free of material misstatement. The Company is not required to have, nor were we engaged to perform, an audit of its internal control over financial reporting. Our audit included consideration ofCompany’s internal control over financial reporting as a basis for designing audit procedures that are appropriate in the circumstances, but not for the purpose of expressing an opinionDecember 31, 2016, based on the effectivenesscriteria established in
Internal Control - Integrated Framework (2013) issued by the Committee of Sponsoring Organizations of the Treadway Commission and our report dated February 28, 2017, expressed an unqualified opinion on the Company’s internal control over financial reporting. Accordingly, we express no such opinion. An audit also includes examining, on
DELOITTE & TOUCHE LLP
San Francisco, California
February 28, 2017
LENDINGCLUB CORPORATION
Consolidated Balance Sheets
(In Thousands, Except Share and Per Share Amounts)
|
| | | | | | | |
| December 31, | 2016 | | 2015 |
| Assets | | | |
| Cash and cash equivalents | $ | 515,602 |
| | $ | 623,531 |
|
| Restricted cash | 177,810 |
| | 80,733 |
|
| Securities available for sale | 287,137 |
| | 297,211 |
|
| Loans at fair value (includes $2,600,422 and $3,022,001 from consolidated trust, respectively) | 4,311,984 |
| | 4,556,081 |
|
| Loans held for sale | 9,048 |
| | — |
|
| Accrued interest receivable (includes $24,037 and $24,477 from consolidated trust, respectively) | 40,299 |
| | 38,081 |
|
| Property, equipment and software, net | 89,263 |
| | 55,930 |
|
| Intangible assets, net | 26,211 |
| | 30,971 |
|
| Goodwill | 35,633 |
| | 72,683 |
|
| Other assets | 69,644 |
| | 38,413 |
|
| Total assets | $ | 5,562,631 |
| | $ | 5,793,634 |
|
| Liabilities and Stockholders’ Equity | | | |
| Accounts payable | $ | 10,889 |
| | $ | 5,542 |
|
| Accrued interest payable (includes $26,839 and $26,719 from consolidated trust, respectively) | 43,574 |
| | 40,244 |
|
| Accrued expenses and other liabilities | 85,619 |
| | 61,243 |
|
| Payable to investors | 125,884 |
| | 73,162 |
|
| Notes and certificates at fair value (includes $2,616,023 and $3,034,586 from consolidated trust, respectively) | 4,320,895 |
| | 4,571,583 |
|
| Total liabilities | 4,586,861 |
| | 4,751,774 |
|
| Stockholders’ Equity | | | |
| Common stock, $0.01 par value; 900,000,000 shares authorized; 400,262,472 and 379,716,630 shares issued, respectively; 397,979,772 and 379,716,630 shares outstanding, respectively | 4,003 |
| | 3,797 |
|
| Additional paid-in capital | 1,226,206 |
| | 1,127,952 |
|
| Accumulated deficit | (234,187 | ) | | (88,218 | ) |
| Treasury stock, at cost; 2,282,700 and 0 shares, respectively | (19,485 | ) | | — |
|
| Accumulated other comprehensive loss | (767 | ) | | (1,671 | ) |
| Total stockholders’ equity | 975,770 |
| | 1,041,860 |
|
| Total liabilities and stockholders’ equity | $ | 5,562,631 |
| | $ | 5,793,634 |
|
See Notes to Consolidated Financial Statements.
LENDINGCLUB CORPORATION
Consolidated Statements of Operations
(In Thousands, Except Share and Per Share Amounts)
|
| | | | | | | | | | | |
| Year Ended December 31, | 2016 | | 2015 | | 2014 |
| Net operating revenue: | | | | | |
| Transaction fees | $ | 423,494 |
| | $ | 373,508 |
| | $ | 197,124 |
|
| Servicing fees | 68,009 |
| | 32,811 |
| | 11,534 |
|
| Management fees | 11,638 |
| | 10,976 |
| | 5,957 |
|
| Other revenue (expense) | (7,674 | ) | | 9,402 |
| | (1,203 | ) |
| Total net operating revenue | 495,467 |
| | 426,697 |
| | 213,412 |
|
| Net interest income (expense): | | | | | |
| Total interest income | 696,662 |
| | 552,972 |
| | 354,453 |
|
| Total interest expense | (688,368 | ) | | (549,740 | ) | | (356,615 | ) |
| Net interest income (expense) | 8,294 |
| | 3,232 |
| | (2,162 | ) |
| Fair value adjustments - loans, loans held for sale, notes and certificates | (2,949 | ) | | 14 |
| | (122 | ) |
| Net interest income (expense) and fair value adjustments | 5,345 |
| | 3,246 |
| | (2,284 | ) |
| Total net revenue | 500,812 |
| | 429,943 |
| | 211,128 |
|
| Operating expenses: | | | | | |
| Sales and marketing | 216,670 |
| | 171,526 |
| | 85,652 |
|
| Origination and servicing | 74,760 |
| | 61,335 |
| | 37,326 |
|
| Engineering and product development | 115,357 |
| | 77,062 |
| | 38,518 |
|
| Other general and administrative | 207,172 |
| | 122,182 |
| | 81,136 |
|
| Goodwill impairment | 37,050 |
| | — |
| | — |
|
| Total operating expenses | 651,009 |
| | 432,105 |
| | 242,632 |
|
| Loss before income tax expense | (150,197 | ) | | (2,162 | ) | | (31,504 | ) |
| Income tax (benefit) expense | (4,228 | ) | | 2,833 |
| | 1,390 |
|
| Net loss | $ | (145,969 | ) | | $ | (4,995 | ) | | $ | (32,894 | ) |
| Net loss per share: | | | | | |
| Basic | $ | (0.38 | ) | | $ | (0.01 | ) | | $ | (0.44 | ) |
| Diluted | $ | (0.38 | ) | | $ | (0.01 | ) | | $ | (0.44 | ) |
| Weighted-average common shares - Basic | 387,762,072 |
| | 374,872,118 |
| | 75,573,742 |
|
| Weighted-average common shares - Diluted | 387,762,072 |
| | 374,872,118 |
| | 75,573,742 |
|
See Notes to Consolidated Financial Statements.
LENDINGCLUB CORPORATION
Consolidated Statements of Comprehensive Income (Loss)
(In Thousands)
|
| | | | | | | | | | | |
| Year Ended December 31, | 2016 | | 2015 | | 2014 |
| Net loss | $ | (145,969 | ) | | $ | (4,995 | ) | | $ | (32,894 | ) |
| Other comprehensive income (loss), before tax: | | | | | |
| Change in net unrealized loss on securities available for sale | 1,515 |
| | (1,671 | ) | | — |
|
| Other comprehensive income (loss), before tax | 1,515 |
| | (1,671 | ) | | — |
|
| Income tax effect | 611 |
| | — |
| | — |
|
| Other comprehensive income (loss), net of tax | 904 |
| | (1,671 | ) | | — |
|
| Comprehensive loss | $ | (145,065 | ) | | $ | (6,666 | ) | | $ | (32,894 | ) |
See Notes to Consolidated Financial Statements.
LENDINGCLUB CORPORATION
Consolidated Statements of Changes in Stockholders' Equity
(In Thousands, Except Share Data)
|
| | | | | | | | | | | | | | | | | | | | | | | | | | | | | | | | | | | | |
| | Convertible Preferred Stock | | Common Stock | | Additional Paid-in Capital | | Treasury Stock | | Accumulated Other Comprehensive Income | | Accumulated Deficit | | Total Stockholders’ Equity |
| | Shares | | Amount | | Shares | | Amount | | Shares | | Amount | | |
Balance at December 31, 2013 | 240,194,788 |
| | $ | 103,244 |
| | 54,986,640 |
| | $ | 138 |
| | $ | 15,041 |
| | — |
| | $ | — |
| | $ | — |
| | $ | (50,329 | ) | | $ | 68,094 |
|
| Exercise of warrants to purchase Series A convertible preferred stock | 572,161 |
| | 66 |
| | — |
| | — |
| | — |
| | — |
| | — |
| | — |
| | — |
| | 66 |
|
| Exercise of warrants to purchase common stock | — |
| | — |
| | 1,818,174 |
| | 18 |
| | 494 |
| | — |
| | — |
| | — |
| | — |
| | 512 |
|
| Stock-based compensation and warrant expense | — |
| | 9,176 |
| | — |
| | — |
| | 29,848 |
| | — |
| | — |
| | — |
| | — |
| | 39,024 |
|
| Issuance of Series F convertible preferred stock for cash, net of issuance costs | 6,390,556 |
| | 64,803 |
| | — |
| | — |
| | — |
| | — |
| | — |
| | — |
| | — |
| | 64,803 |
|
| Issuance of Series F convertible preferred stock for the acquisition of Springstone | 2,443,930 |
| | 2,762 |
| | — |
| | — |
| | — |
| | — |
| | — |
| | — |
| | — |
| | 2,762 |
|
| Issuance of common stock upon exercise of options | — |
| | — |
| | 6,037,667 |
| | 60 |
| | 3,504 |
| | — |
| | — |
| | — |
| | — |
| | 3,564 |
|
| Issuance of common stock upon initial public offering, net of offering costs | — |
| | — |
| | 59,000,000 |
| | 590 |
| | 827,090 |
| | — |
| | — |
| | — |
| | — |
| | 827,680 |
|
| Conversion of preferred stock to common stock upon initial public offering | (249,601,435 | ) | | (180,051 | ) | | 249,601,435 |
| | 2,496 |
| | 177,555 |
| | — |
| | — |
| | — |
| | — |
| | — |
|
| Early exercise liability related to unvested stock options | — |
| | — |
| | — |
| | — |
| | (392 | ) | | — |
| | — |
| | — |
| | — |
| | (392 | ) |
| Par value adjustment for stock splits | — |
| | — |
| | — |
| | 412 |
| | (412 | ) | | — |
| | — |
| | — |
| | — |
| | — |
|
| Net loss | — |
| | — |
| | — |
| | — |
| | — |
| | — |
| | — |
| | — |
| | (32,894 | ) | | (32,894 | ) |
Balance at December 31, 2014 | — |
| | $ | — |
| | 371,443,916 |
| | $ | 3,714 |
| | $ | 1,052,728 |
| | — |
| | $ | — |
| | $ | — |
| | $ | (83,223 | ) | | $ | 973,219 |
|
| Stock-based compensation and related tax effects | — |
| | — |
| | — |
| | — |
| | 56,005 |
| | — |
| | — |
| | — |
| | — |
| | 56,005 |
|
| Stock option exercises and other | — |
| | — |
| | 7,862,705 |
| | 79 |
| | 13,394 |
| | — |
| | — |
| | — |
| | — |
| | 13,473 |
|
| ESPP purchase shares | — |
| | — |
| | 410,009 |
| | 4 |
| | 5,087 |
| | — |
| | — |
| | — |
| | — |
| | 5,091 |
|
| Net unrealized loss on available for sale securities, net of tax | — |
| | — |
| | — |
| | — |
| | — |
| | — |
| | — |
| | (1,671 | ) | | — |
| | (1,671 | ) |
| Excess tax benefit from share-based award activity | — |
| | — |
| | — |
| | — |
| | 738 |
| | — |
| | — |
| | — |
| | — |
| | 738 |
|
| Net loss | — |
| | — |
| | — |
| | — |
| | — |
| | — |
| | — |
| | — |
| | (4,995 | ) | | (4,995 | ) |
Balance at December 31, 2015 | — |
| | $ | — |
| | 379,716,630 |
| | $ | 3,797 |
| | $ | 1,127,952 |
| | — |
| | $ | — |
| | $ | (1,671 | ) | | $ | (88,218 | ) | | $ | 1,041,860 |
|
| Stock-based compensation and related tax effects | — |
| | — |
| | — |
| | — |
| | 79,803 |
| | — |
| | — |
| | — |
| | — |
| | 79,803 |
|
| Stock option exercises and other | — |
| | — |
| | 19,037,329 |
| | 191 |
| | 13,398 |
| | — |
| | — |
| | — |
| | — |
| | 13,589 |
|
| Treasury stock | — |
| | — |
| | (2,282,700 | ) | | — |
| | — |
| | 2,282,700 |
| | (19,485 | ) | | — |
| | — |
| | (19,485 | ) |
| ESPP purchase shares | — |
| | — |
| | 1,508,513 |
| | 15 |
| | 5,229 |
| | — |
| | — |
| | — |
| | — |
| | 5,244 |
|
| Net unrealized gain on available for sale securities, net of tax | — |
| | — |
| | — |
| | — |
| | — |
| | — |
| | — |
| | 904 |
| | — |
| | 904 |
|
| Excess tax benefit from share-based award activity | — |
| | — |
| | — |
| | — |
| | (176 | ) | | — |
| | — |
| | — |
| | — |
| | (176 | ) |
| Net loss | — |
| | — |
| | — |
| | — |
| | — |
| | — |
| | — |
| | — |
| | (145,969 | ) | | (145,969 | ) |
Balance at December 31, 2016 | — |
| | $ | — |
| | 397,979,772 |
| | $ | 4,003 |
| | $ | 1,226,206 |
| | 2,282,700 |
| | $ | (19,485 | ) | | $ | (767 | ) | | $ | (234,187 | ) | | $ | 975,770 |
|
See Notes to Consolidated Financial Statements.
LENDINGCLUB CORPORATION
Consolidated Statements of Cash Flows
(in Thousands)
|
| | | | | | | | | | | |
| Year Ended December 31, | 2016 | | 2015 | | 2014 |
| Cash Flows from Operating Activities: | | | | | |
| Net loss | $ | (145,969 | ) | | $ | (4,995 | ) | | $ | (32,894 | ) |
| Adjustments to reconcile net loss to net cash provided by operating activities: | | | | | |
| Net fair value adjustments of loans, loans held for sale, notes and certificates | 2,949 |
| | (14 | ) | | 122 |
|
| Change in fair value of loan servicing liabilities | (4,498 | ) | | (5,194 | ) | | 3,037 |
|
| Change in fair value of loan servicing assets | 5,403 |
| | 3,803 |
| | (1,647 | ) |
| Stock-based compensation, net | 69,244 |
| | 51,222 |
| | 37,150 |
|
| Excess tax benefit from share-based awards | 176 |
| | (738 | ) | | — |
|
| Goodwill impairment charge | 37,050 |
| | — |
| | — |
|
| Depreciation and amortization | 29,882 |
| | 21,578 |
| | 10,258 |
|
| (Gain) Loss on sales of loans | (13,175 | ) | | (4,885 | ) | | 3,569 |
|
| Other, net | 537 |
| | (129 | ) | | 198 |
|
| Loss on disposal of property, equipment and software | 1,254 |
| | 790 |
| | 553 |
|
| Purchase of loans held for sale | (4,742,538 | ) | | (3,358,611 | ) | | (1,733,614 | ) |
| Principal payments received on loans held for sale | 4,380 |
| | — |
| | — |
|
| Proceeds from sales of whole loans | 4,731,831 |
| | 3,358,611 |
| | 1,730,045 |
|
| Net change in operating assets and liabilities: | | | | | |
| Accrued interest receivable | (2,218 | ) | | (13,819 | ) | | (8,287 | ) |
| Other assets | (10,140 | ) | | (15,857 | ) | | 13,270 |
|
| Due from related parties | 179 |
| | (188 | ) | | (112 | ) |
| Accounts payable | 5,582 |
| | (598 | ) | | 2,357 |
|
| Accrued interest payable | 3,330 |
| | 13,280 |
| | 9,223 |
|
| Accrued expenses and other liabilities | 27,286 |
| | 30,485 |
| | 16,692 |
|
| Net cash provided by operating activities | 545 |
| | 74,741 |
| | 49,920 |
|
| Cash Flows from Investing Activities: | | | | | |
| Purchase of loans | (2,732,669 | ) | | (3,865,565 | ) | | (2,156,382 | ) |
| Principal payments received on loans | 2,393,354 |
| | 1,804,719 |
| | 1,054,357 |
|
| Proceeds from recoveries and sales of charged-off loans | 37,277 |
| | 26,256 |
| | 7,960 |
|
| Proceeds from sales of whole loans | 26,825 |
| | — |
| | — |
|
| Purchases of securities available for sale | (75,983 | ) | | (419,173 | ) | | — |
|
| Proceeds from sales, maturities, redemptions and paydowns of securities available for sale | 87,158 |
| | 120,420 |
| | — |
|
| Payments for business acquisition, net of cash acquired | — |
| | — |
| | (109,464 | ) |
| Investment in Cirrix Capital | (10,000 | ) | | — |
| | — |
|
| Net change in restricted cash | (97,077 | ) | | (33,970 | ) | | (32,974 | ) |
| Purchases of property, equipment and software, net | (51,842 | ) | | (39,387 | ) | | (20,572 | ) |
| Net cash used for investing activities | (422,957 | ) | | (2,406,700 | ) | | (1,257,075 | ) |
| Cash Flows from Financing Activities: | | | | | |
| Change in payable to investors | 52,722 |
| | 34,421 |
| | 34,308 |
|
| Proceeds from issuance of notes and certificates | 2,681,109 |
| | 3,861,995 |
| | 2,156,019 |
|
| Proceeds from secured borrowings | 22,274 |
| | — |
| | — |
|
| Repayments of secured borrowings | (22,274 | ) | | — |
| | — |
|
| Principal payments on and retirements of notes and certificates | (2,381,372 | ) | | (1,800,859 | ) | | (1,049,982 | ) |
LENDINGCLUB CORPORATION
Consolidated Statements of Cash Flows
(in Thousands)
|
| | | | | | | | | | | |
| Year Ended December 31, | 2016 | | 2015 | | 2014 |
| Payments on notes and certificates from recoveries/sales of related charged-off loans | (36,785 | ) | | (26,143 | ) | | (7,929 | ) |
| Proceeds from term loan, net of debt discount | — |
| | — |
| | 49,813 |
|
| Payment for debt issuance costs | — |
| | (1,296 | ) | | (1,218 | ) |
| Principal payment on term loan | — |
| | — |
| | (50,000 | ) |
| Repurchases of common stock | (19,485 | ) | | — |
| | — |
|
| Proceeds from initial public offering, net of offering costs | — |
| | — |
| | 827,680 |
|
| Proceeds from issuance of Series F convertible preferred stock, net of issuance costs | — |
| | — |
| | 64,803 |
|
| Proceeds from exercise of warrants to acquire Series A and Series B convertible preferred stock | — |
| | — |
| | 66 |
|
| Proceeds from exercise of warrants to acquire common stock | 17 |
| | 3 |
| | 512 |
|
| Proceeds from stock option exercises and other | 13,209 |
| | 11,670 |
| | 3,564 |
|
| Excess tax benefit from share-based awards | (176 | ) | | 738 |
| | — |
|
| Proceeds from issuance of common stock for ESPP | 5,244 |
| | 5,091 |
| | — |
|
| Other financing activities | — |
| | 90 |
| | — |
|
| Net cash provided by financing activities | 314,483 |
| | 2,085,710 |
| | 2,027,636 |
|
| Net (Decrease) Increase in Cash and Cash Equivalents | (107,929 | ) | | (246,249 | ) | | 820,481 |
|
| Cash and Cash Equivalents, Beginning of Period | 623,531 |
| | 869,780 |
| | 49,299 |
|
| Cash and Cash Equivalents, End of Period | $ | 515,602 |
| | $ | 623,531 |
| | $ | 869,780 |
|
| Supplemental Cash Flow Information: | | | | | |
| Cash paid for interest | $ | 684,775 |
| | $ | 536,448 |
| | $ | 345,919 |
|
| Non-cash investing activity: | | | | | |
| Accruals for property, equipment and software | $ | 1,089 |
| | $ | 2,975 |
| | $ | 832 |
|
| Non-cash investing and financing activity: | | | | | |
| Transfer of whole loans to redeem certificates | $ | 3,862 |
| | $ | — |
| | $ | — |
|
| Issuance of Series F convertible preferred stock | $ | — |
| | $ | — |
| | $ | 2,762 |
|
| Non-cash financing activity: | | | | | |
| Conversion of preferred stock to common stock | $ | — |
| | $ | — |
| | $ | 180,051 |
|
| Accrual of prepaid offering costs | $ | — |
| | $ | — |
| | $ | 2,688 |
|
See Notes to Consolidated Financial Statements.
LENDINGCLUB CORPORATION
Notes to Consolidated Financial Statements
(Tabular Amounts in Thousands, Except Share and Per Share Amounts, Ratios, or as Noted)
1. Basis of Presentation
LendingClub Corporation (Lending Club) is an online marketplace connecting borrowers and investors. LC Advisors, LLC (LCA), is a test basis, evidence supportingregistered investment advisor with the amountsSecurities and disclosures inExchange Commission (SEC) and wholly-owned subsidiary of Lending Club that acts as the general partner for certain private funds and advisor to separately managed accounts (SMAs) and a fund of which its wholly-owned subsidiary RV MP Fund GP, LLC, is the general partner. Springstone Financial, LLC (Springstone), is a wholly-owned subsidiary of Lending Club that facilitates education and patient finance loans. LC Trust I (the Trust) is an independent Delaware business trust that acquires loans from Lending Club and holds them for the sole benefit of certain investors that have purchased a trust certificate (Certificate) issued by the Trust and that are related to specific underlying loans for the benefit of the investor.
The accompanying consolidated financial statements
assessinginclude Lending Club, its subsidiaries (collectively referred to as the
accounting principles usedCompany, we, or us) and
significant estimates made by management as well,the Trust. All intercompany balances and
evaluating the overall financial statement presentation. We believe that our audit provides a reasonable basis for our opinion.In our opinion, thetransactions have been eliminated. These consolidated financial statements referred to above present fairly, in all material respects, the financial position of LendingClub Corporation and subsidiaries as of December 31, 2012 and the results of their operations and their cash flows for the nine months ended December 31, 2012,have been prepared in conformity with accounting principles generally accepted in the United States of America.
GRANT THORNTON LLP
San Francisco, California
April 1, 2013 (except asAmerica (GAAP) for financial information necessary for the fair statement of the results and financial position for the periods presented. These accounting principles require management to Note 1 as it relates to stock splits, which is as of October 17, 2014)
LendingClub Corporation
Consolidated Balance Sheets
(make certain estimates and assumptions that affect the amounts in thousands, except share and per share data)
| | | | | | | | |
December 31, | | 2014 | | | 2013 | |
Assets | | | | | |
Cash and cash equivalents | | $ | 869,780 | | | $ | 49,299 | |
Restricted cash | | | 46,763 | | | | 12,208 | |
Loans at fair value (includes $1,772,407 and $1,158,302 from consolidated Trust, respectively) | | | 2,798,505 | | | | 1,829,042 | |
Accrued interest receivable (includes $15,209 and $10,061 from consolidated Trust, respectively) | | | 24,262 | | | | 15,975 | |
Property, equipment and software, net | | | 27,051 | | | | 12,595 | |
Intangible assets, net | | | 36,302 | | | | — | |
Goodwill | | | 72,592 | | | | — | |
Other assets | | | 14,332 | | | | 23,921 | |
Due from related parties | | | 467 | | | | 355 | |
| | | | | | | | |
Total assets | | $ | 3,890,054 | | | $ | 1,943,395 | |
| | | | | | | | |
Liabilities | | | | | | | | |
Accounts payable | | $ | 5,892 | | | $ | 4,524 | |
Accrued interest payable (includes $16,989 and $11,176 from consolidated Trust, respectively) | | | 26,964 | | | | 17,741 | |
Accrued expenses and other liabilities | | | 31,620 | | | | 9,128 | |
Payable to investors | | | 38,741 | | | | 3,918 | |
Notes and certificates, at fair value (includes $1,772,407 and $1,158,302 from consolidated Trust, respectively) | | | 2,813,618 | | | | 1,839,990 | |
| | | | | | | | |
Total liabilities | | | 2,916,835 | | | | 1,875,301 | |
| | | | | | | | |
Commitments and contingencies (seeNote 14 – Commitments and Contingencies) | | | | | | | | |
Stockholders’ Equity | | | | | | | | |
Preferred stock | | $ | — | | | $ | 103,244 | |
Common stock, $0.01 par value; 900,000,000 and 360,000,000 shares authorized at December 31, 2014 and December 31, 2013, respectively; 371,443,916 and 54,986,640 shares issued and outstanding at December 31, 2014 and December 31, 2013, respectively | | | 3,714 | | | | 138 | |
Additional paid-in capital | | | 1,052,728 | | | | 15,041 | |
Accumulated deficit | | | (83,223 | ) | | | (50,329 | ) |
| | | | | | | | |
Total stockholders’ equity | | | 973,219 | | | | 68,094 | |
| | | | | | | | |
Total liabilities and stockholders’ equity | | $ | 3,890,054 | | | $ | 1,943,395 | |
| | | | | | | | |
Thethe accompanying notes are an integral part of these financial statements.
LendingClub Corporation
Consolidated Statements Actual results may differ from those estimates.
Although the Company's overall business model remains premised on the Company not using its balance sheet and not assuming credit risk for loans facilitated through our marketplace, the Company may use its capital to support contractual obligations, such as purchasing loans that Springstone facilitates and that are originated by an issuing bank partner but do not meet the credit criteria for purchase by the issuing bank partner (Pool B loans) and repurchase obligations, regulatory commitments (direct mail), short-term marketplace equilibrium, customer accommodations, or other needs. The Company's use of
Operations(its capital on the platform from time to time has been, and will be, on terms that are substantially similar to other investors. Additionally, the Company may use its capital to invest in thousands, except shareloans associated with the testing or initial launch of new or alternative loan terms, programs or channels to establish a track record of performance prior to facilitating third-party investments in these loans.
With the announcement of the initial results of the internal board review on May 9, 2016 and
per share data) | | | | | | | | | | | | |
| | | Year Ended
December 31,
2014 | | | Year Ended
December 31,
2013 | | | 9 Months Ended
December 31,
2012 | |
Operating revenue | | | | | | | | | | | | |
Transaction fees | | $ | 197,124 | | | $ | 85,830 | | | $ | 26,013 | |
Servicing fees | | | 11,534 | | | | 3,951 | | | | 1,474 | |
Management fees | | | 5,957 | | | | 3,083 | | | | 720 | |
Other revenue (expense) | | | (1,203 | ) | | | 5,111 | | | | 720 | |
| | | | | | | | | | | | |
Total operating revenue | | | 213,412 | | | | 97,975 | | | | 28,927 | |
| | | | | | | | | | | | |
Net interest income (expense): | | | | | | | | | | | | |
Total interest income | | | 354,453 | | | | 187,507 | | | | 56,861 | |
Total interest expense | | | (356,615 | ) | | | (187,447 | ) | | | (56,642 | ) |
| | | | | | | | | | | | |
Net interest income (expense) | | | (2,162 | ) | | | 60 | | | | 219 | |
| | | | | | | | | | | | |
Benefit for losses on loans at amortized cost | | | — | | | | — | | | | 42 | |
Fair value adjustments, loans | | | (124,602 | ) | | | (57,629 | ) | | | (18,775 | ) |
Fair value adjustments, notes and certificates | | | 124,480 | | | | 57,596 | | | | 18,180 | |
| | | | | | | | | | | | |
Net interest income (expense) after loss provision and fair value adjustments | | | (2,284 | ) | | | 27 | | | | (334 | ) |
| | | | | | | | | | | | |
Total net revenue | | | 211,128 | | | | 98,002 | | | | 28,593 | |
| | | | | | | | | | | | |
Operating expenses: | | | | | | | | | | | | |
Sales and marketing | | | 87,278 | | | | 39,037 | | | | 14,723 | |
Origination and servicing | | | 38,286 | | | | 17,217 | | | | 6,134 | |
General and administrative | | | 117,068 | | | | 34,440 | | | | 11,974 | |
| | | | | | | | | | | | |
Total operating expenses | | | 242,632 | | | | 90,694 | | | | 32,831 | |
| | | | | | | | | | | | |
Income (loss) before income taxes | | | (31,504 | ) | | | 7,308 | | | | (4,238 | ) |
Income tax expense | | | 1,390 | | | | — | | | | — | |
| | | | | | | | | | | | |
Net income (loss) | | $ | (32,894 | ) | | $ | 7,308 | | | $ | (4,238 | ) |
| | | | | | | | | | | | |
Basic net loss per share attributable to common stockholders | | $ | (0.44 | ) | | $ | 0.00 | | | $ | (0.10 | ) |
Diluted net loss per share attributable to common stockholders | | $ | (0.44 | ) | | $ | 0.00 | | | $ | (0.10 | ) |
Weighted-average common shares - Basic | | | 75,573,742 | | | | 51,557,136 | | | | 41,359,676 | |
Weighted-average common shares - Diluted | | | 75,573,742 | | | | 81,426,976 | | | | 41,359,676 | |
additional findings disclosed on June 28, 2016, many investors paused or reduced their investment activity. The accompanying notesCompany has been focused on working with these investors to resume their investment activity and on bringing new investors to the platform. During the second and third quarters of 2016, the Company offered incentives to investors in exchange for investment activity. The Company has not offered incentives to investors for investments in loans since September 2016. The Company may enter into strategic arrangements, for example, agreements that involve larger or more long-term forms of committed capital.
The Company believes, based on its projections and ability to reduce loan volume if needed, that its cash on hand, funds available from its line of credit, and its cash flow from operations are an integral partsufficient to meet its liquidity needs for the next twelve months.
On April 17, 2014, Lending Club acquired all the outstanding limited liability company interests of these consolidated financial statements.LendingClub Corporation
Consolidated Statements of Changes in Stockholders’ Equity
(in thousands, except share data)
| | | | | | | | | | | | | | | | | | | | | | | | | | | | | | | | | | | | |
| | | Convertible Preferred Stock | | | Common Stock | | | Additional
Paid-in
Capital | | | Treasury Stock | | | Accumulated
Deficit | | | Total
Stockholders’
Equity | |
| | | Shares | | | Amount | | | Shares | | | Amount | | | | Shares | | | Amount | | | |
Balance at March 31, 2012 | | | 225,661,228 | | | $ | 84,806 | | | | 36,444,984 | | | $ | 91 | | | $ | 4,839 | | | | — | | | $ | — | | | $ | (53,399 | ) | | $ | 36,337 | |
Exercise of warrants to purchase Series A convertible preferred stock | | | 2,272,292 | | | | 606 | | | | — | | | | — | | | | — | | | | — | | | | — | | | | — | | | | 606 | |
Exercise of warrants to purchase Series B convertible preferred stock | | | 1,431,912 | | | | 267 | | | | — | | | | — | | | | (102 | ) | | | — | | | | — | | | | — | | | | 165 | |
Exercise of warrants to purchase common stock | | | — | | | | — | | | | 86,752 | | | | 10 | | | | 24 | | | | — | | | | — | | | | — | | | | 34 | |
Issuance of Series E convertible preferred stock for cash, net of issuance costs | | | 10,000,000 | | | | 17,344 | | | | — | | | | — | | | | — | | | | — | | | | — | | | | — | | | | 17,344 | |
Stock-based compensation | | | — | | | | — | | | | — | | | | — | | | | 1,110 | | | | — | | | | — | | | | — | | | | 1,110 | |
Issuance of common stock upon exercise of options | | | — | | | | — | | | | 8,635,712 | | | | 22 | | | | 842 | | | | — | | | | — | | | | — | | | | 864 | |
Other | | | — | | | | — | | | | — | | | | — | | | | — | | | | (70,560 | ) | | | (12 | ) | | | — | | | | (12 | ) |
Net loss | | | — | | | | — | | | | — | | | | — | | | | — | | | | — | | | | — | | | | (4,238 | ) | | | (4,238 | ) |
| | | | | | | | | | | | | | | | | | | | | | | | | | | | | | | | | | | | |
Balance at December 31, 2012 | | | 239,365,432 | | | $ | 103,023 | | | | 45,167,448 | | | $ | 123 | | | $ | 6,713 | | | | (70,560 | ) | | $ | (12 | ) | | $ | (57,637 | ) | | $ | 52,210 | |
| | | | | | | | | | | | | | | | | | | | | | | | | | | | | | | | | | | | |
Exercise of warrants to purchase Series A convertible preferred stock | | | 829,356 | | | | 221 | | | | — | | | | — | | | | — | | | | — | | | | — | | | | — | | | | 221 | |
Exercise of warrants to purchase common stock | | | — | | | | — | | | | 957,876 | | | | 2 | | | | 148 | | | | — | | | | — | | | | — | | | | 150 | |
Stock-based compensation and warrant expense | | | — | | | | — | | | | — | | | | — | | | | 6,490 | | | | — | | | | — | | | | — | | | | 6,490 | |
Issuance of common stock upon exercise of options | | | — | | | | — | | | | 8,931,876 | | | | 23 | | | | 1,692 | | | | — | | | | — | | | | — | | | | 1,715 | |
Other | | | — | | | | — | | | | (70,560 | ) | | | (10 | ) | | | (2 | ) | | | 70,560 | | | | 12 | | | | — | | | | — | |
Net income | | | — | | | | — | | | | — | | | | — | | | | — | | | | — | | | | — | | | | 7,308 | | | | 7,308 | |
| | | | | | | | | | | | | | | | | | | | | | | | | | | | | | | | | | | | |
Balance at December 31, 2013 | | | 240,194,788 | | | $ | 103,244 | | | | 54,986,640 | | | $ | 138 | | | $ | 15,041 | | | | — | | | $ | — | | | $ | (50,329 | ) | | $ | 68,094 | |
| | | | | | | | | | | | | | | | | | | | | | | | | | | | | | | | | | | | |
Exercise of warrants to purchase Series A convertible preferred stock | | | 572,161 | | | | 66 | | | | — | | | | — | | | | — | | | | — | | | | — | | | | — | | | | 66 | |
Exercise of warrants to purchase common stock | | | — | | | | — | | | | 1,818,174 | | | | 18 | | | | 494 | | | | — | | | | — | | | | — | | | | 512 | |
Stock-based compensation and warrant expense | | | — | | | | 9,176 | | | | — | | | | — | | | | 29,848 | | | | — | | | | — | | | | — | | | | 39,024 | |
Issuance of Series F convertible preferred stock for cash, net of issuance costs | | | 6,390,556 | | | | 64,803 | | | | — | | | | — | | | | — | | | | — | | | | — | | | | — | | | | 64,803 | |
Issuance of Series F convertible preferred stock for the acquisition of Springstone | | | 2,443,930 | | | | 2,762 | | | | — | | | | — | | | | — | | | | — | | | | — | | | | — | | | | 2,762 | |
Issuance of common stock upon exercise of options | | | — | | | | — | | | | 6,037,667 | | | | 60 | | | | 3,504 | | | | — | | | | — | | | | — | | | | 3,564 | |
Issuance of common stock upon initial public offering, net of offering costs | | | — | | | | — | | | | 59,000,000 | | | | 590 | | | | 827,090 | | | | — | | | | — | | | | — | | | | 827,680 | |
Conversion of preferred stock to common stock upon initial public offering | | | (249,601,435 | ) | | | (180,051 | ) | | | 249,601,435 | | | | 2,496 | | | | 177,555 | | | | — | | | | — | | | | — | | | | — | |
Early exercise liability related to unvested stock options | | | — | | | | — | | | | — | | | | — | | | | (392 | ) | | | — | | | | — | | | | — | | | | (392 | ) |
Par value adjustment for stock splits | | | — | | | | — | | | | — | | | | 412 | | | | (412 | ) | | | — | | | | — | | | | — | | | | — | |
Net loss | | | — | | | | — | | | | — | | | | — | | | | — | | | | — | | | | — | | | | (32,894 | ) | | | (32,894 | ) |
| | | | | | | | | | | | | | | | | | | | | | | | | | | | | | | | | | | | |
Balance at December 31, 2014 | | | — | | | $ | — | | | | 371,443,916 | | | $ | 3,714 | | | $ | 1,052,728 | | | | — | | | $ | — | | | $ | (83,223 | ) | | $ | 973,219 | |
| | | | | | | | | | | | | | | | | | | | | | | | | | | | | | | | | | | | |
Springstone. The accompanying notes are an integral part of these consolidated financial statements.
LendingClub Corporation
Consolidated Statements of Cash Flows
(in thousands)
| | | | | | | | | | | | |
| | | Year Ended
December 31,
2014 | | | Year Ended
December 31,
2013 | | | 9 Months Ended
December 31,
2012 | |
Cash flows from operating activities: | | | | | | | | | | | | |
Net (loss) income | | $ | (32,894 | ) | | $ | 7,308 | | | $ | (4,238 | ) |
Adjustments to reconcile net (loss) income to net cash provided by operating activities: | | | | | | | | | | | | |
Benefit for loan losses | | | — | | | | — | | | | (42 | ) |
Fair value adjustments of loans, notes and certificates, net | | | 122 | | | | 33 | | | | 595 | |
Change in loan servicing liability carried at fair value | | | 3,037 | | | | 936 | | | | — | |
Change in loan servicing asset carried at fair value | | | (1,647 | ) | | | (534 | ) | | | — | |
Stock-based compensation and warrant expense, net | | | 37,150 | | | | 6,490 | | | | 1,110 | |
Depreciation and amortization | | | 10,258 | | | | 1,663 | | | | 236 | |
Loss (gain) on sales of loans at fair value | | | 3,569 | | | | (3,862 | ) | | | (329 | ) |
Other, net | | | 198 | | | | — | | | | (118 | ) |
Loss on disposal of property, equipment and software | | | 553 | | | | 30 | | | | — | |
Purchase of whole loans sold at fair value | | | (1,733,614 | ) | | | (442,362 | ) | | | (9,290 | ) |
Proceeds from sales of whole loans at fair value | | | 1,730,045 | | | | 446,224 | | | | 9,619 | |
Net change in operating assets and liabilities excluding the effects of the acquisition: | | | | | | | | | | | | |
Accrued interest receivable | | | (8,287 | ) | | | (10,454 | ) | | | (3,170 | ) |
Other assets | | | 13,270 | | | | (21,021 | ) | | | (649 | ) |
Due from related parties | | | (112 | ) | | | (240 | ) | | | (75 | ) |
Accounts payable | | | 2,357 | | | | 1,788 | | | | 330 | |
Accrued interest payable | | | 9,223 | | | | 11,063 | | | | 4,070 | |
Accrued expenses and other liabilities | | | 16,692 | | | | 4,077 | | | | 1,558 | |
| | | | | | | | | | | | |
Net cash provided by (used in) operating activities | | | 49,920 | | | | 1,139 | | | | (393 | ) |
| | | | | | | | | | | | |
Cash flows from investing activities: | | | | | | | | | | | | |
Purchase of loans at fair value | | | (2,156,382 | ) | | | (1,618,404 | ) | | | (598,622 | ) |
Principal payments of loans at fair value | | | 1,054,357 | | | | 511,232 | | | | 160,787 | |
Principal payments of loans at amortized cost | | | — | | | | — | | | | 345 | |
Proceeds from recoveries and sales of charged-off loans at fair value | | | 7,960 | | | | 1,716 | | | | 247 | |
Proceeds from recoveries and sales of charged-off loans at amortized cost | | | — | | | | — | | | | 22 | |
Payments for business acquisition, net of cash acquired | | | (109,464 | ) | | | — | | | | — | |
Net change in restricted cash | | | (32,974 | ) | | | (4,724 | ) | | | (2,622 | ) |
Purchase of property, equipment and software | | | (20,572 | ) | | | (10,435 | ) | | | (1,302 | ) |
| | | | | | | | | | | | |
Net cash used in investing activities | | | (1,257,075 | ) | | | (1,120,615 | ) | | | (441,145 | ) |
| | | | | | | | | | | | |
Cash flows from financing activities: | | | | | | | | | | | | |
Change in payable to investors | | | 34,308 | | | | 1,868 | | | | 1,517 | |
Proceeds from issuance of notes and certificates | | | 2,156,019 | | | | 1,618,269 | | | | 606,862 | |
Payments on notes and certificates | | | (1,049,982 | ) | | | (504,330 | ) | | | (163,946 | ) |
Payments on charged-off notes and certificates from recoveries/sales of related charged-off loans at fair value | | | (7,929 | ) | | | (1,669 | ) | | | (219 | ) |
Proceeds from term loan, net of debt discount | | | 49,813 | | | | — | | | | — | |
Payment for debt issuance cost | | | (1,218 | ) | | | — | | | | — | |
Principal payments on term loan | | | (50,000 | ) | | | — | | | | — | |
Payments on loans payable | | | — | | | | — | | | | (370 | ) |
Proceeds from initial public offering, net of offering costs | | | 827,680 | | | | — | | | | — | |
Proceeds from issuance of Series E convertible preferred stock, net of issuance costs | | | — | | | | — | | | | 17,344 | |
Proceeds from issuance of Series F convertible preferred stock, net of issuance costs | | | 64,803 | | | | — | | | | — | |
Proceeds from exercise of warrants to acquire Series A and Series B convertible preferred stock | | | 66 | | | | 221 | | | | 771 | |
Proceeds from exercise of warrants to acquire common stock | | | 512 | | | | 150 | | | | 34 | |
Proceeds from stock options exercised | | | 3,564 | | | | 1,715 | | | | 864 | |
Repurchase of common stock | | | — | | | | — | | | | (12 | ) |
| | | | | | | | | | | | |
Net cash provided by financing activities | | | 2,027,636 | | | | 1,116,224 | | | | 462,845 | |
| | | | | | | | | | | | |
Net increase (decrease) in cash and cash equivalents | | | 820,481 | | | | (3,252 | ) | | | 21,307 | |
Cash and cash equivalents, beginning of period | | | 49,299 | | | | 52,551 | | | | 31,244 | |
| | | | | | | | | | | | |
Cash and cash equivalents, end of period | | $ | 869,780 | | | $ | 49,299 | | | $ | 52,551 | |
| | | | | | | | | | | | |
Supplemental disclosure of cash flow information: | | | | | | | | | | | | |
Cash paid for interest | | $ | 345,919 | | | $ | 176,195 | | | $ | 52,511 | |
Non-cash investing activity - Reclassification of loans at amortized cost to loans held at fair value | | $ | — | | | $ | — | | | $ | 2,109 | |
Non-cash investing activity - Accrual of property, equipment and software, net | | $ | 832 | | | $ | 2,275 | | | $ | — | |
Non-cash investing and financing activity - Issuance of Series F convertible preferred stock for business acquisition | | $ | 2,762 | | | $ | — | | | $ | — | |
Non-cash financing activity - Conversion of preferred stock to common stock | | $ | 180,051 | | | $ | — | | | $ | — | |
Non-cash financing activity - Exercise of warrants to purchase common stock | | $ | 147 | | | $ | 137 | | | $ | — | |
Non-cash financing activity - Exercise of warrants to purchase Series B convertible preferred stock | | $ | — | | | $ | — | | | $ | 102 | |
Non-cash financing activity - Accrual of prepaid offering costs | | $ | 2,688 | | | $ | — | | | $ | — | |
The accompanying notes are an integral part of these consolidated financial statements.
LendingClub Corporation
Notes to Consolidated Financial Statements
1. Basis of Presentation
OurCompany’s consolidated financial statements include LendingClub Corporation and its wholly owned subsidiaries. Intercompany balances and transactions have been eliminated. The accompanying consolidated financial statements have been prepared by Lending Club in conformity with U.S. generally accepted accounting principles (“GAAP”) for financial information.
We did not have any items of other comprehensive income (loss) during any of the periods presented in the consolidated financial statements and therefore, we are not required to report comprehensive income (loss).
The following changes in application of accounting principles, methodologies or business practices affect our financial statements as of December 31, 2014, 2013 or 2012.
On December 19, 2012, our board of directors approved a change in our fiscal year-end from March 31 to December 31. The change was effective as of December 31, 2012.
Subsequent to the issuance of our December 31, 2012 consolidated financial statements, we corrected the classification of our preferred stock from temporary equity to permanent stockholders’ equity in accordance with GAAP requirements. This revision resulted in a change to stockholders’ deficit from $50.8 million to stockholders’ equity of $52.2 million as of December 31, 2012 and had no effect on our consolidated statementsSpringstone’s results of operations, reported assetsstatement of financial position, and liabilities on the consolidated balance sheet, or the consolidated statementsstatement of cash flows.
During the year ended December 31, 2013, we changed our definitions used to classify operating expensesflows from sales, marketing and customer service, engineering, and general and administrative to sales and marketing, origination and servicing, and general and administrative. As a result of the new classification, loan origination and servicing costs which were previously included in sales, marketing and customer service are now included as a separate financial statement line and engineering costs which represent engineering and product development related expenses are categorized within general and administrative expenses. The changes had no impact on the total operating expenses or net income. Prior period amounts have been reclassified to conform to the current presentation.this date (see “Note 20. Springstone Acquisition”).
On April 15, 2014, a 2-for-1 equity stock split approved by our board of directors became effective, in which each outstanding share of each series or class of equity capital stock was split into two outstanding shares of such series or class of equity capital stock. Additionally, another 2-for-1 equity stock split approved by our board of directors became effective on September 5, 2014, in which each outstanding share of each series or class of equity capital stock was split into two outstanding shares of such series or class of equity capital stock. All share and per share data has been adjusted to reflect these stock splits. The par value of each of the outstanding shares remains the same at $0.01.
| • | | On April 17, 2014, we acquired all the outstanding limited liability company interests of Springstone Financial, LLC (Springstone). Our consolidated financial statements include Springstone’s results of operations, statement of financial position, and statement of cash flows from this date (seeNote 17 – Springstone Acquisition). |
On December 11, 2014, wethe Company completed ourits initial public offering (IPO) and registered 66,700,000 shares of our common stock at $15.00 per share for an aggregate offering price of approximately $1.0 billion.billion.
LENDINGCLUB CORPORATION
Notes to Consolidated Financial Statements
(Tabular Amounts in Thousands, Except Share and Per Share Amounts, Ratios, or as Noted)
2. Summary of Significant Accounting Policies
Transaction Fee Revenue:Fees:Transaction fees are paid by issuing banks or patient service providers to usLending Club for the work we performLending Club performs through ourits platform and Springstone’s platform. Theplatform in facilitating loans for its issuing bank partners. These fees are recognized as a component of net operating revenue at the time of loan issuance. Factors affecting the amount of these fees is based uponpaid to the terms ofissuing bank by the borrower and from the bank to the Company include initial loan including grade, rate,amount, term, credit quality, and other factors. Where applicable,The Company records transaction fee revenue net of program fees paid to WebBank. See “Loan Trailing Fee Liability” below for further discussion.
Commencing with the
transaction fees are includedorigination fee increase announced in March 2016, in the
annual percentage rate calculation providedevent a borrower prepays a loan in full before maturity, the Company assumes the issuing bank partner's obligation under Utah law to
refund the pro-rated amount of the fee received by the bank in excess of 5%. Additionally, the Company may provide refunds to patient finance borrowers when the borrower
and are subtracted fromcancels the
gross loan
proceeds distributed to the borrower.under certain conditions. Since
weLending Club can estimate refunds based on
our refundloan cancellation or prepayment experience,
we recordthe Company also records transaction fee revenue net of estimated refunds at the
originationtime of
a loan
by an issuing bank.issuance.
Servicing Fees: Note investors, certain certificate holders and whole loan purchasers typically pay usLending Club a servicing fee on each payment received from a borrower or on the investors’ month-end principal balance of loans serviced. The servicing fee compensates usthe Company for services rendered related to managing payments from borrowers and payments to investors and maintaining investors’ account portfolios. We recordThe Company records servicing fees as a component of net operating revenue when received. Servicing fees can be, and have been, modified or waived at management’s discretion. Servicing fees also include the change in fair value of loan servicing assets and liabilities.
Management Fees: Qualified investors can invest in investment funds managed by LC Advisors, LLC (LCA), a registered investment advisor that acts as the general partner for certain private funds and advisor to separately managed accounts.LCA. LCA charges limited partners in the investment funds a management fee payable monthly in arrears, based on a limited partner’s capital account balance at month end. LCA also earns management fees on SMAs, payable monthly in arrears, based on the month-end balances in the SMA accounts. Management fees are a component of net operating revenue in the consolidated statements of operations and are recorded as earned. Management fees can be, and have been, modified or waived at the discretion of LCA.
Other Revenue (Expense):Other revenue (expense) consists primarily of gains and losses on sales of whole loans, incentives that were offered to purchasers of whole loans in the second and third quarters of 2016, and referral revenue earned from partner companies when customers referred by usLending Club complete specified actions with them.
Under loan sale agreements,
we sellthe Company sells all of
ourits right, title and interest
in certain loans. At the time of such sales,
wethe Company simultaneously
enterenters into loan
serviceservicing agreements under which
we acquireit acquires the right to service the loans.
We calculateThe Company calculates a gain or loss on the whole loan sale, including the acquisition of
loan servicing rights, based on the net proceeds from the whole loan sale, minus the net investment in the loans being sold.
The net investment in the loans sold has been reduced or increased by applicable servicing asset or liability respectively. Gains and losses on whole loan sales previously reported in “Gain from sales of member loans” were reclassified to “Other revenue (expense)” in the consolidated statements of operations.
Additionally, as needed,
wethe Company will record a liability for significant estimated post-sale obligations or contingent obligations to the purchasers of the
loans.From January 1, 2013 through June 30, 2013, transaction feeswhole loans in “Accrued expenses and direct loan origination and acquisition costs for loans that were sold to independent third-party purchasers and met the accounting requirements for a sale were deferred and includedother liabilities” in the overall net investment in the loans purchased. Accordingly, the transaction fees for such loans were not included in transaction fee revenue and the direct loan origination costs for such loans were not included in operating expenses. A gain or loss on the whole loan sales was recorded on the sale date in “Gain from sales of member loans”.
Effective July 1, 2013, weconsolidated balance sheets.
The Company elected the fair value option for whole loans acquired and subsequently soldthat are designated to independent third-party purchasers. Under this election, allbe sold. All transaction fees and all direct costs incurred in the origination process are recognized in earnings as earned or incurred and are
LENDINGCLUB CORPORATION
Notes to Consolidated Financial Statements
(Tabular Amounts in Thousands, Except Share and Per Share Amounts, Ratios, or as Noted)
not deferred.
As such, beginning July 1, 2013, transactionTransaction fees for whole loans sold
to independent third-party purchasers are included in “Transaction fees” and direct loan origination costs are included in “Origination and servicing” operating expense in the consolidated
statementstatements of operations. Gains and losses from whole loan sales are recorded in “Other revenue (expense)” in the consolidated statements of operations.
Net Income (Loss) Per Share
Earnings (loss) per share (EPS) is the amount of net income (loss) available to each share of common stock outstanding during the reporting period. Diluted EPS is the amount of net income (loss) available to each share of common stock outstanding during the reporting period, adjusted to include the effect of potentially dilutive common shares. Potentially dilutive common shares are excluded from the computation of diluted EPS in periods in which the effect would be antidilutive. Potentially dilutive common shares include incremental shares issued for stock options and warrants to purchase common stock. The Company calculates diluted EPS using the treasury stock method. Under the treasury stock method, options and warrants are assumed to be exercised at the beginning of the period (or at the time of issuance, if later), and as if funds obtained thereby were used to purchase common stock at the average market price during the period.
Cash and Cash Equivalents
Cash and cash equivalents include
the Company’s unrestricted deposits with financial institutions in checking, money market and short-term certificate of deposit accounts.
We considerThe Company considers all highly liquid investments with stated maturity dates of three months or less from the date of purchase to be cash equivalents.
Restricted cash consists primarily of certain checking, money market and certificate of deposit accounts that are: (i) pledged to or held in escrow by ourthe Company’s correspondent banks as security for transactions processed on or related to our platform;Lending Club’s platform or activities by certain investors; (ii) pledged through a credit support agreement with a certificate holderholder; (iii) held in a Rabbi Trust through a grantor trust agreement to satisfy obligations to participants under the Company's 2016 Cash Retention Bonus Plan (Cash Retention Plan). See “Note 15. Employee Incentive and Retirement Plans” for additional information; or (iii)(iv) received from investors but not yet applied to their accounts on the platform and transferred to segregated bank accounts that hold investors’ funds.
Investor cash balances (excluding transactions-in-process) are held in segregated bank or custodial accounts and are not commingled with the Company’s monies or held on the Company’s consolidated balance sheet.
Securities Available for Sale
Securities available for sale are recorded at fair value and unrealized gains and losses are reported, net of taxes, in accumulated other comprehensive income (loss) included in stockholders’ equity unless management determines that a security is other-than-temporarily impaired (OTTI). Realized gains and losses from sales of securities available for sale are determined on a specific identification basis and are included in other revenue (expense). Purchases and sales of securities available for sale are recorded on the trade date.
Management evaluates whether securities available for sale are OTTI on a quarterly basis. Debt securities with unrealized losses are considered OTTI if the Company intends to sell the security or if it is more likely than not that it will be required to sell such security before any anticipated recovery. If management determines that a security is OTTI under these circumstances, the impairment recognized in earnings is measured as the entire difference between the amortized cost and then-current fair value.
LENDINGCLUB CORPORATION
Notes to Consolidated Financial Statements
(Tabular Amounts in Thousands, Except Share and Per Share Amounts, Ratios, or as Noted)
A security is also OTTI if management does not expect to recover all of the amortized cost of the security. In this circumstance, the impairment recognized in earnings represents estimated credit loss, and is measured by the difference between the present value of expected cash flows and the amortized cost of the security. Management utilizes cash flow models to estimate the expected future cash flow from the securities to estimate the credit loss when necessary. Expected cash flows are discounted using the security’s effective interest rate.
The evaluation of whether the Company expects to recover the amortized cost of a security is inherently judgmental. The evaluation includes the assessment of several security performance indicators, including the magnitude and duration of the unrealized loss and whether the Company has received all scheduled principal and interest payments. There were no impairment charges recognized during 2016 or 2015.
Loans, Notes and Certificates at Fair Value
The Company has elected fair value accounting for loans and related notes and the Certificates. The fair value election for these loans, notes and certificates results in symmetrical accounting in that changes in the fair value of loans are generally offset by equal changes in the fair values of notes and certificates, given the payment dependent structure of the notes and certificates. Changes in the fair value of loans, notes and certificates are recorded in fair value adjustments in the statement of operations in the period of the fair value changes. The Company places loans on non-accrual status at 120 days past due. The Company charges off loans no later than 150 days past due, or earlier in the event of notification of borrower bankruptcy.
Loans Held for Sale at Fair Value
Loans held by the Company with the intent to sell are recognized on the balance sheet as loans held for sale. Loans held for sale are measured at fair value. The fair value methodology for the measurement of loans held for sale is consistent with that of loans not classified as held for sale. The fair value adjustments related to loans held for sale are recorded in the period of the fair value changes.
Servicing Assets and Liabilities at Fair Value
The Company records servicing assets and liabilities at their estimated fair values when it sells whole loans to unrelated third-party whole loan buyers or when the servicing contract commences. The gain or loss on a loan sale is recorded in other revenue (expense) in the consolidated statements of operations while the component of the gain or loss that is based on the degree to which the loan servicing fee is above or below an estimated market rate loan servicing fee is recorded as an offset in servicing assets or liabilities. Servicing assets and liabilities are recorded in “Other assets” and “Accrued expenses and other liabilities,” respectively, on the consolidated balance sheets. The Company uses the fair value measurement method to account for changes in servicing assets and liabilities. As such, changes in the fair value of servicing assets and liabilities are reported in “Servicing fees” in the consolidated statements of operations in the period in which the changes occur.
Loan Trailing Fee Liability
In February 2016, the Company revised the agreement with its primary issuing bank partner to include an additional program fee (Loan Trailing Fee). The Loan Trailing Fee is dependent on the amount and timing of principal and interest payments made by borrowers of the underlying loans, and gives the issuing bank an ongoing financial interest in the performance of the loans it originates. This fee is paid by the Company to the issuing bank partner over the term of the respective loans and is a function of the principal and interest payments. In the event that principal and interest payments are not made, the Company is not required to make this Loan Trailing Fee payment. The Loan Trailing Fee is recorded initially at fair value with subsequent changes to this liability netted against transaction fees on the Company's consolidated statement of operations. The fair value of the Loan Trailing Fee
LENDINGCLUB CORPORATION
Notes to Consolidated Financial Statements
(Tabular Amounts in Thousands, Except Share and Per Share Amounts, Ratios, or as Noted)
represents the present value of the expected monthly Loan Trailing Fee, which considers assumptions of expected prepayment rates and future credit losses.
Fair Value of Assets and Liabilities
We
The Company uses fair value measurement to record loans, notes,
and certificates and servicing assets and liabilities at fair value on a recurring basis. Fair value is defined as the exchange price that would be received for an asset or paid to transfer a liability (an exit price) in the principal or most advantageous market for the asset or liability in an orderly transaction between market participants on the measurement date.
The fair value hierarchy requires that an entity maximize the use of observable inputs when estimating fair value.
The fair value hierarchy includes the following three-level classification, which is based on the market observability of the inputs used for estimating the fair value of the assets or liabilities being measured:
| |
| | |
| Level 1 | | — | | Quoted market prices in active markets for identical assets or liabilities. |
| | |
| Level 2 | | — | | Significant other observable inputs (e.g., quoted prices for similar items in active markets, quoted prices for identical or similar items in markets that are not active, inputs other than quoted prices that are observable such as interest rate and yield curves, and market-corroborated inputs). |
| | | | |
| Level 3 | | — | | Inputs that are unobservable in the market but reflective of the types of assumptions that market participants would use in pricing the asset or liability. Valuation techniques include use of option pricing models, discounted cash flow methodologies or similar techniques. We utilizeThe Company utilizes discounted cash flow valuation techniques based on ourits estimate of future cash flows that are expected to occur over the life of a financial instrument. |
In accordance with applicable accounting guidance, we disclose significant unobservable
Unobservable inputs
used in estimating fair value of the Level 3 assets and liabilities. We consider unobservable inputs to beare considered significant if, by their exclusion, the
estimateestimated fair value of a Level 3 asset or liability would be impacted by a significant percentage change, or based on qualitative factors such as the nature of the instrument and significance of the unobservable inputs relative to other inputs used within the valuation.
Loans
Notes and
Certificates at Fair ValueThe fair value election for loans, notes and certificates allows for symmetrical accounting of the timing and amounts recognized for both expected unrealized losses and charge-offs on the loans and the related notes and certificates, consistent with the member payment dependent design of the notes and certificates. Changes in theloans held for sale are measured at estimated fair value of loans, notesusing a discounted cash flow valuation methodology. The fair valuation methodology considers projected prepayments and certificates are recorded in fair value adjustments inuses the period of the fair value changes.
Significant assumptions used in valuinghistorical actual defaults, losses and recoveries on our loans notesto project future losses and certificates are as follows:
Discount rates – The discount rates reflect our estimates of the rates of return that investors in unsecured consumer credit obligations would require when investing in the various credit grades of loans. The discount rates for the projected net cash flows of the notes and certificates reflects our estimates of the rates of return, including risk premiums that investors in unsecured consumer credit obligations would require when investing in notes issued by us and certificates issued by the Trust, an independent Delaware business trust that acquires and holds loans for the sole benefit of certificate investors, with cash flows dependent on specific grades of loans. Discount rates for existing loans, notes and certificates are adjusted to reflect the time value of money and a risk premium to reflect the amount of compensation market participants require due to the credit and liquidity related uncertainty inherent in the instruments’ cash flows.
Net cumulative expected losses – Net cumulative expected losses are an estimate of the net cumulative principal payments that will not be repaid over the entire life of a loan, note or certificate, expressed as a percentage of the original principal amount of the loan, note or certificate. The estimated net cumulative loss is the sum of the net losses estimated to occur each month of the life of a new loan, note or certificate. Therefore, the total net losses estimated to occur over the remaining maturity of existing loans, notes and certificates are less than the estimated net cumulative losses of comparable new loans, notes and certificates. A given month’s estimated net losses are a function of two variables:
| (i) | estimated default rate, which is an estimate of the probability of not collecting the remaining contractual principal amounts owed and, |
| (ii) | estimated net loss severity, which is the percentage of contractual principal cash flows lost in the event of a default, net of the average net recovery, expected to be received on a defaulted loan, note or certificate. |
Our and the Trust’s obligation to pay principal and interest on any note or certificate, as applicable, is equal to the pro-rata portion of the payments, if any, received on the related loan subject to applicable fees. The gross effective interest rate associated with notes or certificates is the same as the interest rate earned on the underlying loan. Payments to holders of notes and certificates depends on the payments received on loans, a reduction or increase of the expected future payments on loans will decrease or increase the estimated fair values of the related notes and certificates. Expected losses and actual charge-offs on loans are offset to the extent that the loans are financed by notes and certificates that effectively absorb the related loan losses.
Servicing Assets and Liabilities at Fair Value
We record servicing assets and liabilities at their estimated fair values when we sell whole loans to independent third-parties or whole loan buyers or when the servicing contract commences. The gain or loss on a loan sale is recorded in other revenue (expense) in the consolidated statements of operations while the component of the gain or loss that is based on the degree to which the contractual loan servicing fee is above or below an estimated market rate loan servicing fee is recorded as an offset in servicing assets or liabilities. Servicing assets and liabilities are recorded in “Other Assets” and “Accrued Expenses and Other Liabilities,” respectively, on the consolidated balance sheets. Over the life of the loan, changes in the estimated fair value of
Loan servicing assets and liabilities are
reported in “Servicing Fees” in the consolidated statement of operations in the period in which the changes occur.We usemeasured at estimated fair value using a discounted cash flow valuation methodology. The cash flows in the valuation model represent the difference between the contractual servicing fees charged to estimatewhole loan buyers and an estimated market servicing fee. Since contractual servicing fees are generally based on the monthly unpaid principal balance of the underlying loans, the expected cash flows in the model incorporate estimates of net losses and prepayments.
Securities Available for Sale
The Company uses quoted prices in active markets to measure the fair value of
securities available for sale, when available. When utilizing market data and bid-ask spreads, the
loan servicing asset or liability which considersCompany uses the
contractual servicing fee revenue we earn onprice within the
loans, estimated market rate servicing feebid-ask spread that best represents fair value. When quoted prices do not exist, the Company uses prices obtained from independent third-party pricing services to
service such loans, the current principal balances of the loans and projected servicing revenues over the remaining terms of the loans.Significant assumptions used in valuing our servicing assets and liabilities are as follows:
Market servicing rates – We estimate adequate servicing compensation rates as those which a market participant would require to service the loans that we sell to, or that are acquired, by third parties. We estimated these market servicing rates based on observable market servicing rates for other loan types in the industry, adjusted for the unique loan attributes of the loans we sell and service (i.e. unsecured fixed rate fully amortizing loans, ACH loan payments, intermediate terms, prime credit grades and sizes) and with a market servicing benchmarking analysis performed by a third-party valuation firm.
Discount rates – The discount rates for loan servicing rights reflect our estimates of the rates of return that investors in servicing rights for unsecured consumer credit obligations would require when investing in similar servicing rights. Discount rates for servicing rights on existing loans are adjusted to reflect the time value of money and a risk premium intended to reflect the amount of compensation market participants would require due to the credit and liquidity uncertainty inherent in the instruments’ cash flows.
Net cumulative expected losses – Net cumulative expected losses are an estimate of the net cumulative principal payments that will not be repaid over the entire life of a loan expressed as a percentage of the original principal amount of the loan. The assumption regarding net cumulative losses reduces the projected balances and expected terms of the loans, which are used to project future servicing revenues. The estimated net cumulative loss is the sum of the net losses estimated to occur each month of the life of a new loan. A given month’s estimated net losses are a function of two variables:
| (i) | estimated default rate, which is an estimate of the probability of not collecting the remaining contractual principal amounts owed and, |
| (ii) | estimated net loss severity, which is the percentage of contractual principal cash flows lost in the event of a default, net of the average net recovery, expected to be received on a defaulted loan. |
Cumulative prepayments – Cumulative prepayments are estimates of the cumulative amount of principal prepayments that will occur over the entire life of a loan expressed as a percentage of the original principal amount of the loan. The assumption regarding cumulative prepayments reduces the projected balances and expected terms of the loans, which are used to project future servicing revenues. Assumptions regarding cumulative prepayments are incorporated into the valuation process to estimatemeasure the fair value of loan servicing assetssecurities available for sale. The Company’s primary independent pricing service provides prices based on observable trades and liabilitiesdiscounted cash flows that incorporate observable information, such as theyyields for similar types of securities (a benchmark interest rate plus observable spreads) and weighted-average maturity for the same or similar securities. The Company compares the prices obtained from its primary independent pricing service to the prices obtained from the additional independent pricing services to determine if the price obtained from the primary independent pricing service is reasonable. The Company does not adjust the prices received from independent third-party pricing services unless such prices are key valuation assumptions used by investorsinconsistent with the definition of fair value and result in servicing rights for unsecured consumer credit obligations.
a material difference in the recorded amounts.
LENDINGCLUB CORPORATION
Notes to Consolidated Financial Statements
(Tabular Amounts in Thousands, Except Share and Per Share Amounts, Ratios, or as Noted)
Financial Instruments Not Recorded at Fair Value
Following are descriptions of the valuation methodologies used for estimating the fair values of financial
Financial instruments not recorded at fair value on a recurring basis
in the consolidated balance sheets; these financial instruments are carried at historical cost or amortized cost in the consolidated balance sheets.Short-term financial assets: Short-term financial assets include cash and cash equivalents, restricted cash, and accrued interest. These assets are carried at historical cost.
Short-term financial liabilities: Short-term financial liabilities include accounts payable, accrued interest receivable, deposits, accrued interest payable, accounts payable and payables to investors. These assets and liabilities are carriedrecorded at historical cost. Given the short-term nature of these instruments, the Company considers the amortized cost to approximate their fair values.
Accrued Interest
and Other ReceivablesInterest
Accrued interest income on loans is calculated based on the contractual interest rate of the loan and recorded as interest income as earned. Loans are placed on non-accrual status upon reaching 120 days past due. When a loan is placed on non-accrual status,
we stopthe Company stops accruing interest and
reversereverses all accrued but unpaid interest as of such date.
Accrued interest payable on notes and certificates is also reduced when the corresponding loan is placed on non-accrual status, due to the payment dependent structure of the notes and certificates.
Property, Equipment and Software, net
Property, equipment and software consists of internally developed and purchased software, computer equipment, leasehold improvements, furniture and fixtures and construction in process, which are recorded at cost, less accumulated depreciation and amortization.
Computer equipment, purchased software and furniture and fixtures are depreciated or amortized on a straight line basis over
twothree to five years. Leasehold improvements are amortized over the shorter of the lease term excluding renewal periods or the estimated useful life. Internally developed software is amortized on a straight line basis over the project’s estimated useful life, generally three years.
Internally developed software is capitalized when preliminary development efforts are successfully completed and it is probable that the project will be completed and the software will be used as intended. Capitalized costs consist of salaries and payroll related costs for employees and fees paid to third-party consultants who are directly involved in development efforts. Costs related to preliminary project activities and post implementation activities including training and maintenance are expensed as incurred. Costs incurred for upgrades and enhancements that are considered to be probable to result in additional functionality are capitalized.
We evaluate
The Company evaluates potential impairments of
our long-lived assetsits property, equipment and software whenever events or changes in circumstances indicate that the carrying amount of the assets may not be recoverable. Events or changes in circumstances that could result in impairment include, but are not limited to, underperformance relative to historical or projected future operating results, significant changes in the manner of use of the assets or the strategy for
ourthe Company’s overall business and significant negative industry or economic trends. The determination of recoverability of
long-livedthese assets is based on whether an estimate of undiscounted future cash flows resulting from the use of the asset and its eventual disposition exceed the net book value of the asset. If the
long-lived asset is not recoverable, measurement of an impairment loss is based on the fair value of the asset. When an impairment loss is recognized, the carrying amount of the asset is reduced to its estimated fair value.
Consolidation
PoliciesOur policyof Variable Interest Entities
A variable interest entity (VIE) is
a legal entity that does not have sufficient equity at risk to
consolidatefinance its own operations, whose equity holders do not have the
financial statementspower to direct the activities most significantly affecting the economic outcome of
entitiesthose activities, or whose equity holders do not share proportionately in
which we have a controlling financial interest. We determinethe losses or receive the residual returns of the entity. The determination of whether
we have a controlling financial interest in an
entity by evaluating whether the entity is a
voting interest entity or variable interest entity (“VIE”) and ifVIE requires a significant amount of judgment. When the
accounting guidance requires consolidation.Our determination of whether we have a controlling financial interest in a voting interest entity is based on whether we have ownership of a majority of the entities’ voting equity interest directly or through control of management of the entities.
We determine whether we haveCompany has a controlling financial interest in a VIE, it must consolidate the results of the
LENDINGCLUB CORPORATION
Notes to Consolidated Financial Statements
(Tabular Amounts in Thousands, Except Share and Per Share Amounts, Ratios, or as Noted)
VIE’s operations into its consolidated financial statements. A controlling financial interest exists if the Company has both the power to direct the VIE’s activities that most significantly affect the VIE’s economic performance (power) and the obligation to absorb losses or receive benefits that could be potentially significant to the VIE (economics).
LC Trust I
The Company has determined that the Trust is a VIE and that the Company has a controlling financial interest in the Trust and therefore must consolidate the Trust in its consolidated financial statements. The Company established the Trust in February 2011 and funded it with a nominal residual investment. The Company is the only residual investor in the Trust. The purpose of the Trust is to acquire and hold loans for the benefit of investors who have invested in certificates issued by considering whether our involvementthe Trust. The Trust conducts no other business other than purchasing and retaining loans or portions thereof for the benefit of the investment funds and their underlying limited partners. The Trust holds loans, none of which are financed by the Company. The cash flows from the loans held by the Trust are used to repay obligations under the certificates. The Trust’s assets and liabilities were reflected in the Company's consolidated financial statements at December 31, 2016 and 2015.
In connection with the VIEformation of the investment funds, it was determined that in order to achieve success in raising investment capital, the assets to be invested in by the investment funds must be held by an entity that was separate and distinct from the Company (i.e. bankruptcy remote) in order to reduce this risk and uncertainty. In the event of the Company's insolvency, it is anticipated that the assets of the Trust would not become part of the bankruptcy estate, but that outcome is uncertain.
The Company's capital contributions, which are the only equity investments in the Trust, are insufficient to allow the Trust to finance the purchase of a significant amount of loans without the issuance of certificates to investors. Therefore, the Trust’s capitalization level qualifies the Trust as a VIE. The Company has a financial interest in the Trust because of its right to returns related to servicing fee revenue from the Trust, its right to reimbursement for expenses, and whether weits obligation to repurchase loans from the Trust in certain instances. Additionally, the Company performs or directs activities that significantly affect the Trust’s economic performance through or by (i) operation of the platform that enables borrowers to apply for loans purchased by the Trust; (ii) credit underwriting and servicing of loans purchased by the Trust; (iii) LCA's selection of the loans that are purchased by the Trust on behalf of advised Certificate holders; and (iv) LCA’s role to source investors that ultimately purchase limited partnership interests in a fund or Certificates, both of which supply the funds for the Trust to purchase loans. Collectively, the activities described above allow the Company to fund more loans than would be the case without the existence of the Trust, to collect the related loan transaction fees and for LCA to collect the management fees on the investors’ capital used to purchase certificates. Accordingly, the Company is deemed to have power to direct activities most significant to the Trust and economic interest in the activities because of loan funding and transaction and management fees. Therefore, the Company concluded that it is the primary beneficiary of the VIETrust and consolidated the Trust’s operations in its consolidated financial statements.
Investment In Cirrix Capital
On April 1, 2016, the Company closed its $10.0 million investment, for an approximate ownership interest of 15% in Cirrix Capital (Investment Fund), a holding company to a family of funds that purchases loans and interests in loans from the Company. Per the partnership agreement, the family of funds can invest up to 20% of their assets outside of whole loans and interests in whole loans facilitated by the Company. At December 31, 2016, 100% of the family of funds' assets were comprised of whole loans and interests in loans facilitated by Lending Club's platform. At the time the Company made its investment, the Company's then Chief Executive Officer (former CEO) and a board member (together, the Related Party Investors) also had limited partnership interests in the Investment Fund. As of June 30, 2016, the end of the period in which the Company's former CEO resigned, the Related Party Investors and the Company had an aggregate ownership of approximately 29% in the Investment Fund. As of
LENDINGCLUB CORPORATION
Notes to Consolidated Financial Statements
(Tabular Amounts in Thousands, Except Share and Per Share Amounts, Ratios, or as Noted)
December 31, 2016, the Company and a board member had an aggregate ownership interest of approximately 27% in the Investment Fund.
The Company's investment is deemed to be a variable interest in the Investment Fund because of the limited partnership interest shares in the expected returns and losses of the Investment Fund. The expected returns and losses of the Investment Fund result from the net returns of the family of funds owned by the Investment Fund, which are derived from interest income earned from loans and interests in whole loans that are purchased by the family of funds, which are owned by the Investment Fund. Such loans and interests in loans were facilitated by the Company. Additionally, the Investment Fund is considered a VIE.
The Investment Fund passes the credit risk to the limited partners. The Company did not design the Investment Fund’s investment strategy and cannot require the Investment Fund to purchase loans. Additionally, the Company reviewed whether it collectively, with the board member's investment, had power to control the Investment Fund and concluded that it did not based on the following:weunilateral ability of the general partner to exercise power over the limited partnership and the inability of the limited partners to remove the general partner. The Company is not the primary beneficiary of the Investment Fund because the Company does not have the power to direct the activities of the VIE that most significantly impactaffect the entity’sInvestment Fund’s economic performance;
performance. As a result, the aggregate indirectCompany does not consolidate the operations of the Investment Fund in the financial statements of the Company. The Company accounts for this investment under the equity method of accounting, which approximates its maximum exposure to loss as a result of its involvement in the Investment Fund. At December 31, 2016, the Company's investment was $10.1 million, which is recognized in other assets on the consolidated balance sheet. See “Note 19. Related Party Transactions” for additional information.
Separately, the Company is subject to a credit support agreement that requires it to pledge and direct variable interests held by us have therestrict cash in support of its contingent obligation to absorbreimburse the Investment Fund for net credit losses oron loans underlying the right to receive benefits from the entityinterests in whole loans that could be significant to the VIE; and
qualitative and quantitative factors regarding the nature, size, and form of our involvement with the VIE.
We believe our beneficial ownershipare in excess of a controlling financialspecified, aggregate net loss threshold. As of December 31, 2016, $3.4 million
was pledged and restricted to support this contingent obligation. This credit support agreement is deemed to be a variable interest in the Trust qualifies as an equity investmentInvestment Fund because it exposes the Company to potential credit losses on the underlying interests in loans purchased by the Investment Fund. The board member and the Company are excluded from receiving any benefits, if provided, from this credit support agreement. As of December 31, 2016, the Company has not been required to nor does it anticipate recording losses under this agreement. The Company's maximum exposure to loss under this credit support agreement was limited to $6.0 million and $34.4 million at December 31, 2016 and 2015, respectively.
LCA Managed or Advised Private Funds
In conjunction with the adoption of a VIEnew accounting standard that resultsamends accounting for consolidations effective January 1, 2016, the Company reviewed its relationship with the private funds managed or advised by LCA and concluded that it does not have a variable interest in consolidationthe private funds. As of December 31, 2016, the Company does not hold any investments in the private funds. Certain of the TrustCompany's related parties have investments in the private funds, as discussed in “Note 19. Related Party Transactions.” The Company charges the limited partners in the private funds a management fee based on their account balance at month end for financialservices performed as the general manager, including fund administration, and audit, accounting and reporting purposes. We perform on-going reassessments ontax preparation services. Accordingly, the Company's fee arrangements contain only terms, conditions, or amounts that are customarily present in arrangements for similar services negotiated at arm’s length. These fees are solely compensation for services provided and are commensurate with the level of effort required to provide those services. The Company does not have other interests in the private funds and therefore does not have a variable interest in the private funds.
Management regularly reviews and reconsiders its previous conclusions regarding whether it holds a variable interest in potential VIEs, the status of the entitiesan entity as a VIE, and whether factsthe Company is required to consolidate such VIEs in the consolidated financial statements.
LENDINGCLUB CORPORATION
Notes to Consolidated Financial Statements
(Tabular Amounts in Thousands, Except Share and Per Share Amounts, Ratios, or circumstances have changedas Noted)
Loan Servicing Rights
As a result of the nature of servicing rights on the sale of loans, the Company is a variable interest holder in
relation to our involvement in VIEs which could cause our conclusion to change.All intercompany transactions and balances have been eliminated.
Business Combination
We use our best estimates and assumptions to assign fair value to the tangible and intangible assets acquired and liabilities assumed at the acquisition date. Because our estimates are inherently uncertain and subject to refinement, we may record adjustments to the fair valuecertain entities that purchase these loans. For all of these tangibleentities, the Company either does not have the power to direct the activities that most significantly affect the VIE's economic performance or does not have a potentially significant economic interest in the VIE. In no case is the Company the primary beneficiary, and intangible assets acquired and liabilities assumed, withas a result, these entities are not consolidated in the corresponding offset to goodwill during the one-year measurement period if information exists to indicate an estimate may change. In addition, uncertain tax positions and tax-related valuation allowances, if any, are initially established in connection with a business combination as of the acquisition date. We continue to collect information and reevaluate these estimates and assumptions quarterly and record any adjustments to our preliminary estimates to goodwill provided that we are within the measurement period. Upon the conclusion of the measurement period or final determination of the fair value of assets acquired or liabilities assumed, whichever comes first, any subsequent adjustments are recorded to ourCompany's consolidated statements of operations.
financial statements.
Goodwill and Intangible Assets
Goodwill represents the fair value of acquired businesses in excess of the aggregate fair value of the identified net assets acquired. Goodwill is not amortized but is tested for impairment annually or whenever indications of impairment exist. Our annual impairment testing date is April 1. WeImpairment exists whenever the carrying value of goodwill exceeds its implied fair value. Adverse changes in impairment indicators such as loss of key personnel, increase regulatory oversight, or unplanned changes in our operations could result in impairment.
The Company recorded a goodwill impairment charge of $37.1 million for the year ended December 31, 2016 related to the education and patient finance reporting unit. See “Note 9. Intangible Assets and Goodwill”for a further description of this impairment. If the performance of the education and patient finance reporting unit fails to meet current expectations, it is possible that the carrying value of this reporting unit, even after the current impairment charge, will exceed its fair value, which could result in further recognition of a noncash impairment of goodwill that could be material. There were no goodwill impairment charges for the years ended December 31, 2015 or 2014.
The Company can elect to qualitatively assess goodwill for impairment if it is more likely than not that the fair value of a reporting unit (generally defined as a component of a business for which financial information is available and reviewed regularly by management) exceeds its carrying value. A qualitative assessment may consider macroeconomic and other industry-specific factors, such as trends in short-term and long-term interest rates and the ability to access capital or company-specific factors, such as market capitalization in excess of net assets, trends in revenue generating activities and merger or acquisition activity.
If
we elect to bypassthe Company does not qualitatively
assessingassess goodwill
or it
is not more likely than not that thecompares a reporting unit’s estimated fair value
of a reporting unit exceedsto its carrying
value, we must estimate the fair values of our reporting units and compare them to their carrying values.value. Estimated fair value of a reporting unit is generally established using an income approach based on a discounted cash flow model or a market approach, which compares each reporting unit to comparable companies in their respective industries.
Intangible assets are amortized over their useful lives in a manner that best reflects their economic benefit.benefit, which may include straight-line or accelerated methods of amortization. Intangible assets are reviewed for impairment quarterly and whenever events or changes in circumstances indicate that the carrying amount of such assets may not be recoverable. WeThe Company does not have indefinite-lived intangible assets.
Debt
The Company has elected to record certain costs directly related to its secured revolving credit facility as an asset included in other assets on the Company’s consolidated balance sheets. These costs are amortized as interest expense over the contractual term of the secured revolving credit facility. Additionally, in instances where the Company transfers loans to investors that do not
have any indefinite-lived intangible assets.meet sale criteria for accounting purposes, such loan sales are accounted for as secured borrowings.
LENDINGCLUB CORPORATION
Notes to Consolidated Financial Statements
(Tabular Amounts in Thousands, Except Share and Per Share Amounts, Ratios, or as Noted)
Loss Contingencies
Loss contingencies, including claims and legal actions arising in the ordinary course of business, are recorded as liabilities when the likelihood of loss is probable and an amount or range of loss can be reasonably estimated. Such estimates are based on management's judgment. Actual amounts paid may differ from amounts estimated, and such differences will be charged to operations in the period in which the final determination of the liability is made. Legal fees associated with such contingencies are recognized as incurred.
Stock-based compensation includes the expense associated with restricted stock units (RSUs), stock options, granted to employees and with the company’sour employee stock purchase plan (ESPP), as well as expense associated with stock issued related to our acquisition of Springstone. All stock-based awards made to employees are recognized in the consolidated financial statementsStock-based compensation expense is based on their respectivethe grant date fair values. Any benefitsvalue of tax deductions in excessthe award, net of recognized compensation costexpected forfeitures, which are reported as a financing cash inflow and cash outflowbased on our historical experience. If actual forfeitures differ significantly from operating activities. Theour estimates, stock-based compensation expense and our results of operations could be materially impacted.
The fair value of restricted stock units is based on the closing price of our common stock on the date of grant. To determine the fair value of stock options and ESPP purchase rights, we use the Black-Scholes option-pricing model, with inputs for the fair value of our common stock, expected common stock price volatility over the expected life of the stock options or ESPP purchase rights, expected term of the stock option or ESPP purchase right, risk-free interest rates and expected dividends. Prior to the Company’s IPO, the fair value of its shares of common stock was established by the Board. The Company’s Board relied upon valuations provided by third-party valuation firms and other factors, including, but not limited to, the current status of the technical and commercial success of the Company’s operations, the Company’s financial condition, the stage of the Company’s product design and development, and competition to establish the fair value of the Company’s common stock at the time of grant of the option.
As we do not have a significant trading history for our common stock, the expected stock price volatility for our common stock is estimated by reference to the average historical stock price volatility for our industry peers. The industry peer group used to estimate our volatility includes small, mid and large capitalization companies in the consumer finance, investment management and technology industries taking into account the similarity in size, stage of life cycle and financial leverage. The expected term represents the period of time that stock options are estimated to be outstanding, giving consideration to the contractual terms of the options, vesting schedules, and expectations of future exercise patterns and post-vesting employee termination behavior. Given our limited operating history, the simplified method is applied to calculate the expected term. We use a risk-free interest rate based on the U.S. Treasury yield for a term consistent with the expected life of the awards in effect at the time of grant. We have never declared or paid any cash or other dividends and do not anticipate paying cash or other dividends in the foreseeable future. Consequently, we use an expected dividend yield of 0.0% in our option-pricing model.
Stock-based compensation expense related to
awardsstock options and RSUs that are expected to vest is
amortized using the straight-line methodrecognized over the
award’s vesting
term,period of the award, which is generally four
years.The fair value of share option awards is estimatedyears, on the date of grant using the Black-Scholes option pricing model. The Black-Scholes option pricing model considers, among other factors, the underlying fair value of common stock, the expected term of the option award, expected volatility of our common stock and expected future dividends, if any.
Stock-based compensation expense for stock options is recorded net of estimated forfeitures, such that expense is recorded only for those stock-based awards that are expected to vest. Forfeitures of awards are estimated at the time of grant and revised in subsequent periods if actual forfeitures differ from initial estimates or if future forfeitures are expected to differ from recent actual or previously expected forfeitures.
Share option awards issued to non-employees are recorded at their fair value on the awards’ vesting date. We use the Black-Scholes option pricing model to estimate the fair value of share options granted to non-employees at each vesting date to determine the amount of stock-based compensation.
The fair value of stock purchase rights granted to employees under the ESPP is measured on the grant date using the Black-Scholes option pricing model.a straight-line basis. The compensation expense related to ESPP purchase rights is recognized on a straight-line basis over the requisite service period.
period, which is generally six months.
The Company accounts for income taxes under the asset and liability method, which requires the recognition of deferred tax assets and liabilities for the expected future tax consequences of events that have been included in the financial statements. Under this method, deferred tax assets and liabilities are determined on the basis of the differences between the financial statement and tax bases of assets and liabilities using enacted tax rates in effect for
LENDINGCLUB CORPORATION
Notes to Consolidated Financial Statements
(Tabular Amounts in Thousands, Except Share and Per Share Amounts, Ratios, or as Noted)
the year in which the differences are expected to reverse. The effect of a change in tax rates on deferred tax assets and liabilities is recognized in income in the period that includes the enactment date.
We recognize
The Company recognizes deferred tax assets to the extent that
we believeit believes these assets are more likely than not to be realized. In making such a determination,
we consider allthe Company considers the available positive and negative evidence, including future reversals of existing taxable temporary differences, projected future taxable income, tax-planning strategies, and results of recent operations. If
we determinethe Company determines that
we would beit is able to realize
ourits deferred tax assets in the future in excess of
theirthe net recorded amount,
we would make an adjustment tothe Company adjusts the deferred tax asset valuation allowance, which
would reducereduces the provision for income taxes.
We account
The Company accounts for the realization of excess tax benefits for stock-based compensation based on the “with-and-without” approach, excluding the measurement of any indirect effects. Equity will be increased if and when such deferred tax assets are ultimately realized.
The Company accounts for uncertain tax positions using a two-step process whereby (i)
we determineit determines whether it is more likely than not that the tax positions will be sustained on the basis of the technical merits of the position (“more-likely-than-not recognition threshold”) and (ii) for those tax positions that meet the more-likely-than-not recognition threshold,
we recognizeit recognizes the largest amount of tax benefit that is more than 50 percent likely to be realized upon ultimate settlement with the related tax authority.
We recognize
The Company recognizes interest and penalties accrued on any unrecognized tax benefits as a component of provision for income tax in the consolidated
statementstatements of operations.
The preparation of
ourthe Company’s consolidated financial statements and related disclosures
in conformity with GAAP requires management to make judgments, assumptions and estimates that affect the amounts reported in
ourits consolidated financial statements and accompanying notes.
We base ourThe Company bases its estimates on historical experience and on various other factors
we believeit believes to be reasonable under the circumstances, the results of which form the basis for making judgments about the carrying values of certain assets and liabilities. These judgments, assumptions and estimates include but are not limited to the following: (i) fair value determinations for
servicing assets and liabilities; (ii) fair value determinations for loans,
loans held for sale, notes and certificates;
(ii)(iii) fair value determinations for securities available for sale; (iv) stock-based compensation expense;
(iii)(v) provision for income taxes, net of valuation allowance for deferred tax assets;
(iv)(vi) recoverability of property, equipment and software; (vii) carrying values of goodwill and intangible assets; (viii) consolidation of variable interest entities;
(v) fair value determinations for servicing assets and
liabilities; and (vi)(ix) reserves for contingencies. These judgments, estimates and assumptions are inherently subjective in nature and actual results may differ from these estimates and assumptions, and the differences could be material.
Impact
Adoption of New Accounting Standards
In JuneNovember 2015, the FASB issued ASU 2015-17, Balance Sheet Classification of Deferred Taxes, that amended the presentation of deferred income taxes in the statement of financial position. This ASU was effective January 1, 2017. ASU 2015-17 simplifies the presentation to require that deferred income taxes be presented as noncurrent in a classified statement of financial position. The Company does not present a classified statement of financial position and accordingly ASU 2015-17 does not have an impact on its presentation of deferred tax assets and liabilities.
In August 2014, the FASB issued ASU 2014-15 Presentation of Financial Statements – Going Concern (Subtopic 205-40), Disclosure of Uncertainties about an Entity’s Ability to Continue as a Going Concern, which requires management to assess a company’s ability to continue as a going concern for each annual and interim reporting period, and disclose in its financial statements whether there is substantial doubt about the company’s ability to continue as a going concern within one year after the date that the financial statements are issued. The standard is
LENDINGCLUB CORPORATION
Notes to Consolidated Financial Statements
(Tabular Amounts in Thousands, Except Share and Per Share Amounts, Ratios, or as Noted)
effective for annual reporting periods, and interim periods therein, ending after December 15, 2016. The Company has adopted ASU 2014-15 and evaluated the Company’s ability to continue as a going concern as well as the need for related disclosure and has concluded no disclosure is necessary regarding the Company’s ability to continue as a going concern.
New Accounting Standards Not Yet Adopted
In January 2017, the FASB issued ASU 2017-04, Intangibles-Goodwill and Other (Topic 350) – Simplifying the Test for Goodwill Impairment. ASU 2017-04 will simplify the subsequent measurement of goodwill by eliminating Step 2 from the goodwill impairment test. Current guidance requires that companies compute the implied fair value of goodwill under Step 2 by performing procedures to determine the fair value at the impairment testing date of its assets and liabilities following the procedure that would be required in determining the fair value of assets acquired and liabilities assumed in a business combination. ASU 2017-04 will require companies to perform annual or interim goodwill impairment tests by comparing the fair value of a reporting unit with its carrying amount, and recognize an impairment charge for the amount by which the carrying amount exceeds the reporting unit’s fair value. However, the loss recognized should not exceed the total amount of goodwill allocated to that reporting unit. ASU 2017-04 will be effective for annual periods beginning after December 15, 2019, including interim periods within that reporting period, and will be applied prospectively. Early adoption of this standard is permitted. The Company currently is evaluating the impact this guidance may have on its financial position, results of operations, and cash flows.
In August 2016, the FASB issued ASU 2016-15, Statement of Cash Flows – Classification of Certain Cash Receipts and Cash Payments and in November 2016 issued ASU 2016-18, Statement of Cash Flows (Topic 230): Restricted Cash. The new standard will be effective January 1, 2018, and amends the existing accounting standards for the statement of cash flows. The amendments provide guidance on the following nine cash flow issues: debt prepayment or debt extinguishment costs; settlement of zero-coupon or other debt instruments with coupon interest rates that are insignificant in relation to the effective interest rate of the borrowing; contingent consideration payments made after a business combination; proceeds from the settlement of insurance claims; proceeds from the settlement of corporate-owned life insurance policies; distributions received from equity method investees; beneficial interests in securitization transactions; separately identifiable cash flows and application of the predominance principle; and restricted cash. Early adoption is permitted, including adoption in an interim period. The Company is evaluating the impact that these standards will have on the consolidated statement of cash flows. However, the impact will depend on the facts and circumstances at the time of adoption of the new standards.
In June 2016, the FASB amended guidance related to impairment of financial instruments as part of ASU 2016-13 Financial Instruments – Credit Losses (Topic 326): Measurement of Credit Losses on Financial Instruments, which will be effective January 1, 2020. The guidance replaces the incurred loss impairment methodology with an expected credit loss model for which a company recognizes an allowance based on the estimate of expected credit loss. The Company accounts for its loans at fair value through net income, which is outside the scope of Topic 326 and does not expect this guidance to clarifyhave a material impact on the Company's financial position, results of operations, or cash flows.
In March 2016, the FASB issued ASU 2016-09 Compensation – Stock Compensation (Topic 718): Improvements to Employee Share-Based Payment Accounting. This ASU simplifies several aspects of the accounting for stock-based compensation awardsemployee share-based payment transactions, including the accounting for income taxes, forfeitures, and statutory tax withholding requirements, as well as classification in the statement of cash flows. This new standard is effective for annual periods beginning after December 15, 2016, and interim periods within that providereporting period. The Company will adopt this standard in the first quarter of 2017, under the modified retrospective method, with the cumulative effect of adoption recorded as an adjustment to 2017 beginning retained earnings. The new standard will result in excess tax benefits and deficiencies on share-based transactions being recorded as income tax expense or benefit rather than in additional-paid-in-capital. The Company also will classify excess tax benefits on share-based
LENDINGCLUB CORPORATION
Notes to Consolidated Financial Statements
(Tabular Amounts in Thousands, Except Share and Per Share Amounts, Ratios, or as Noted)
payments in the operating section of the consolidated statement of cash flows. The Company has not concluded whether to account for share-based award forfeitures as they occur, rather than, making estimates of future forfeitures. The Company’s previously unrecognized excess tax benefits were recorded as a deferred tax asset, which was fully reduced by a valuation allowance. Therefore, the requirement to recognize these excess tax benefits in the income tax provision is not expected to have a material adoption impact.
In February 2016, the FASB issued ASU 2016-02, Leases (Topic 842) that a performance target could be achieved afteramended the requisite service period, whichaccounting guidance related to lease accounting. The new standard is effective January 1, 2016.2019, with modified retrospective transition upon adoption. The guidance requires thatlessees, at lease inception, to record on their balance sheets a performance target that affects vesting,lease liability for the obligation to make lease payments and a right-of-use (ROU) asset for the right to use the underlying asset for the lease term. Lessees may elect to not recognize lease liabilities and ROU assets for leases with terms of 12 months or less. The lease liability is achievable aftermeasured at the requisite service period,present value of the lease payments over the lease term. The ROU asset will be treated asbased on the liability, adjusted for lease prepayments, lease incentives, and the lessee's initial direct costs. For operating leases, lease expense will generally be recognized on a performance condition. We are currentlystraight-line basis over the lease term. The amended lessor accounting model is similar to the current model, updated to align with certain changes to the lessee model and the new revenue standard. The Company is evaluating the impact that ASU 2016-02 will have on its financial position, results of this guidanceoperations or cash flows.
In January 2016, the FASB issued ASU 2016-01 Financial Instruments - Overall (Subtopic: 825-10): Recognition and Measurement of Financial Assets and Financial Liabilities, which will be effective January 1, 2018. The amendment changes the accounting for equity investments, changes disclosure requirements related to instruments at amortized cost and fair value, and clarifies how entities should evaluate deferred tax assets for securities classified as available for sale. Affected entities should apply the amendments by means of a cumulative-effect adjustment to the balance sheet as of the beginning of the fiscal year of adoption. The Company is evaluating the impact that ASU 2016-01 will have on our consolidatedits financial statements, basic net income (loss) per share referred to as EPS, and related disclosures.position, results of operations or cash flows.
In May 2014, the FASB issued new guidance on revenue recognition,ASU 2014-09 Revenue from Contracts with Customers (Topic 606), which iswill be effective January 1, 2017.2018. The guidance clarifies that revenue from contracts with customers should be recognized in a manner that depicts both the likelihood of payment and the timing of the related transfer of goods or performance of services. WeIn March 2016, the FASB issued an amendment (ASU 2016-08) to the new revenue recognition guidance clarifying how to determine if an entity is a principal or agent in a transaction. In April (ASU 2016-10) and May (ASU 2016-12) of 2016, the FASB further amended the guidance to include performance obligation identification, licensing implementation, collectability assessment and other presentation and transition clarifications. The effective date and transition requirements for the amendments is the same as for ASU 2014-09.
The Company is in its preliminary scoping phase to determine the revenue streams that are in the scope of these updates. Preliminary results indicate that transactions fees and management fees contain revenue streams that are in scope of these updates, while servicing fees and gain or loss on sale of loans remain within the scope of ASC Topic 860, Transfers and Servicing. The Company plans to adopt the standards beginning January 1, 2018 and currently evaluatinganticipates using the modified retrospective method of adoption. However, the adoption method to be used is subject to completion of the Company’s impact of this new guidance on our consolidated financial statements, EPSassessment.
LENDINGCLUB CORPORATION
Notes to Consolidated Financial Statements
(Tabular Amounts in Thousands, Except Share and
related disclosures.Per Share Amounts, Ratios, or as Noted)
3. Net
Income (Loss)Loss Per Share
and Net Income (Loss) Attributable to Common StockholdersEPS is the amount of net income (loss) available to each share of common stock outstanding during the reporting period. Diluted EPS is the amount of net income (loss) available to each share of common stock outstanding during the reporting period adjusted to include the effect of potentially dilutive common shares. Potentially dilutive common shares include incremental shares issued for stock options, convertible preferred stock (through December 11, 2014) and warrants to purchase common stock. Potentially dilutive common shares are excluded from the computation of dilutive EPS in periods in which the effect would be antidilutive.
We calculate EPS using the two-class method when applicable. The two-class method allocates net income that otherwise would have been available to common shareholders to holders of participating securities. All participating securities are excluded from basic weighted-average common shares outstanding. Prior to our IPO, we considered all series of our convertible preferred stock to be participating securities due to their non-cumulative dividend rights. As such, net income or loss allocated to these participating securities, which included participation rights in undistributed earnings (seeNote 11 – Stockholders Equity), was subtracted from net income or loss to determine total undistributed net income or loss to be allocated to common stockholders. In conjunction with our IPO, all of our convertible preferred stock converted to common stock and all warrants to purchase convertible preferred stock were converted to warrants to purchase common stock. As such, we had no participating securities as of December 31, 2014.
The following table details the computation of the Company’s basic and diluted net income (loss)loss per share (in thousands, except shareshare:
|
| | | | | | | | | | | |
| Year Ended December 31, | 2016 | | 2015 | | 2014 |
| Net loss | $ | (145,969 | ) | | $ | (4,995 | ) | | $ | (32,894 | ) |
| Weighted average common shares – Basic | 387,762,072 |
| | 374,872,118 |
| | 75,573,742 |
|
| Weighted average common shares – Diluted | 387,762,072 |
| | 374,872,118 |
| | 75,573,742 |
|
| Net loss per share: | | | | | |
| Basic | $ | (0.38 | ) | | $ | (0.01 | ) | | $ | (0.44 | ) |
| Diluted | $ | (0.38 | ) | | $ | (0.01 | ) | | $ | (0.44 | ) |
4. Securities Available for Sale
The Company began purchasing securities available for sale during the second quarter of 2015. The amortized cost, gross unrealized gains and
per share data): | | | | | | | | | | | | |
| | | Year Ended
December 31,
2014 | | | Year Ended
December 31,
2013 | | | 9 Months Ended
December 31,
2012 | |
Net income (loss) | | $ | (32,894 | ) | | $ | 7,308 | | | $ | (4,238 | ) |
Less: Net income allocated to participating securities (1) | | | — | | | | (7,117 | ) | | | — | |
| | | | | | | | | | | | |
Net income (loss) available to common stockholders | | $ | (32,894 | ) | | $ | 191 | | | $ | (4,238 | ) |
| | | | | | | | | | | | |
Weighted average common shares - Basic | | | 75,573,742 | | | | 51,557,136 | | | | 41,359,676 | |
Weighted average effect of dilutive securities: | | | | | | | | | | | | |
Stock Options | | | — | | | | 28,542,404 | | | | — | |
Warrants | | | | | | | 1,327,436 | | | | — | |
| | | | | | | | | | | | |
Weighted average common shares - Diluted | | | 75,573,742 | | | | 81,426,976 | | | | 41,359,676 | |
| | | | | | | | | | | | |
Basic net loss per share attributable to common stockholders | | $ | (0.44 | ) | | $ | 0.00 | | | $ | (0.10 | ) |
Diluted net loss per share attributable to common stockholders | | $ | (0.44 | ) | | $ | 0.00 | | | $ | (0.10 | ) |
|
| | | | | | | | | | | | | | | |
| December 31, 2016 | Amortized Cost | | Gross Unrealized Gains | | Gross Unrealized Losses | | Fair Value |
| Corporate debt securities | $ | 181,359 |
| | $ | 63 |
| | $ | (199 | ) | | $ | 181,223 |
|
| Certificates of deposit | 27,501 |
| | — |
| | — |
| | 27,501 |
|
| Asset-backed securities | 25,369 |
| | 4 |
| | (9 | ) | | 25,364 |
|
| Commercial paper | 20,164 |
| | — |
| | — |
| | 20,164 |
|
| U.S. agency securities | 19,602 |
| | 21 |
| | — |
| | 19,623 |
|
| U.S. Treasury securities | 2,493 |
| | 3 |
| | — |
| | 2,496 |
|
| Other securities | 10,805 |
| | — |
| | (39 | ) | | 10,766 |
|
| Total securities available for sale | $ | 287,293 |
| | $ | 91 |
| | $ | (247 | ) | | $ | 287,137 |
|
| December 31, 2015 | Amortized Cost | | Gross Unrealized Gains | | Gross Unrealized Losses | | Fair Value |
| Corporate debt securities | $ | 217,243 |
| | $ | 2 |
| | $ | (1,494 | ) | | $ | 215,751 |
|
| Asset-backed securities | 54,543 |
| | — |
| | (134 | ) | | 54,409 |
|
| U.S. agency securities | 16,602 |
| | 1 |
| | (25 | ) | | 16,578 |
|
| U.S. Treasury securities | 3,489 |
| | — |
| | (4 | ) | | 3,485 |
|
| Other securities | 7,005 |
| | — |
| | (17 | ) | | 6,988 |
|
| Total securities available for sale | $ | 298,882 |
| | $ | 3 |
| | $ | (1,674 | ) | | $ | 297,211 |
|
LENDINGCLUB CORPORATION
Notes to Consolidated Financial Statements
(Tabular Amounts in Thousands, Except Share and Per Share Amounts, Ratios, or as Noted)
A summary of securities available for sale with unrealized losses as of December 31, 2016 and 2015, aggregated by period of continuous unrealized loss, is as follows:
|
| | | | | | | | | | | | | | | | | | | | | | | |
| | Less than 12 months | | 12 months or longer | | Total |
| December 31, 2016 | Fair Value | | Unrealized Losses | | Fair Value | | Unrealized Losses | | Fair Value | | Unrealized Losses |
| Corporate debt securities | $ | 107,862 |
| | $ | (185 | ) | | $ | 11,682 |
| | $ | (14 | ) | | $ | 119,544 |
| | $ | (199 | ) |
| Asset-backed securities | 6,628 |
| | (8 | ) | | 1,870 |
| | (1 | ) | | 8,498 |
| | (9 | ) |
| Other securities | 6,800 |
| | (3 | ) | | 3,966 |
| | (36 | ) | | 10,766 |
| | (39 | ) |
Total securities with unrealized losses(1) | $ | 121,290 |
| | $ | (196 | ) | | $ | 17,518 |
| | $ | (51 | ) | | $ | 138,808 |
| | $ | (247 | ) |
| | Less than
12 months | | 12 months
or longer | | Total |
| December 31, 2015 | Fair
Value | | Unrealized
Losses | | Fair
Value | | Unrealized
Losses | | Fair
Value | | Unrealized
Losses |
| Corporate debt securities | $ | 212,018 |
| | $ | (1,494 | ) | | $ | — |
| | $ | — |
| | $ | 212,018 |
| | $ | (1,494 | ) |
| Asset-backed securities | 54,409 |
| | (134 | ) | | — |
| | — |
| | 54,409 |
| | (134 | ) |
| U.S. agency securities | 14,578 |
| | (25 | ) | | — |
| | — |
| | 14,578 |
| | (25 | ) |
| U.S. Treasury securities | 3,485 |
| | (4 | ) | | — |
| | — |
| | 3,485 |
| | (4 | ) |
| Other securities | 6,988 |
| | (17 | ) | | — |
| | — |
| | 6,988 |
| | (17 | ) |
Total securities with unrealized losses(1) | $ | 291,478 |
| | $ | (1,674 | ) | | $ | — |
| | $ | — |
| | $ | 291,478 |
| | $ | (1,674 | ) |
(1) | In a period |
(1) | The number of investment positions with net income, both earningsunrealized losses at December 31, 2016 and dividends (if any) are allocated to participating securities. In a period with a net loss, only dividends (if any) are allocated to participating securities.2015 totaled 72 and 141, respectively. |
4.
There were no impairment charges recognized during 2016 or 2015.
The contractual maturities of securities available for sale at December 31, 2016, were as follows:
|
| | | | | | | | | | | | | | | | | | | |
| | Within 1 year | | After 1 year through 5 years | | After 5 years through 10 years | | After 10 years | | Total |
| Corporate debt securities | $ | 90,096 |
| | $ | 91,127 |
| | $ | — |
| | $ | — |
| | $ | 181,223 |
|
| Certificates of deposit | 27,501 |
| | — |
| | — |
| | — |
| | 27,501 |
|
| Asset-backed securities | 8,370 |
| | 16,994 |
| | — |
| | — |
| | 25,364 |
|
| Commercial paper | 20,164 |
| | — |
| | — |
| | — |
| | 20,164 |
|
| U.S. agency securities | 19,623 |
| | — |
| | — |
| | — |
| | 19,623 |
|
| U.S. Treasury securities | — |
| | 2,496 |
| | — |
| | — |
| | 2,496 |
|
| Other securities | 6,800 |
| | 3,966 |
| | — |
| | — |
| | 10,766 |
|
| Total fair value | $ | 172,554 |
| | $ | 114,583 |
| | $ | — |
| | $ | — |
| | $ | 287,137 |
|
| Total amortized cost | $ | 172,602 |
| | $ | 114,691 |
| | $ | — |
| | $ | — |
| | $ | 287,293 |
|
LENDINGCLUB CORPORATION
Notes to Consolidated Financial Statements
(Tabular Amounts in Thousands, Except Share and Per Share Amounts, Ratios, or as Noted)
Proceeds and gross realized gains and losses from sales of securities available for sale were as follows:
|
| | | | | | |
| Year Ended December 31, | 2016 | 2015 |
| Proceeds | $ | 2,494 |
| $ | 120,420 |
|
| Gross realized gains | $ | 2 |
| $ | 133 |
|
| Gross realized losses | $ | — |
| $ | 4 |
|
5. Loans,
Loans Held For Sale, Notes and Certificates and Loan Servicing Rights
Loans,
Loans Held For Sale, Notes and Certificates
Our marketplace is where borrowers
The Company sells loans and
investors engage in transactions relating to standard or custom program loans. We issueissues notes and the Trust issues certificates as a means to allow investors to invest in the associated loans.
At December 31, 20142016 and December 31, 2013,2015, loans, loans held for sale, notes and certificates measured at fair value on a recurring basis were as follows (in thousands):
| | | | | | | | | | | | | | | | |
| | | Loans | | | Notes and Certificates | |
December 31, | | 2014 | | | 2013 | | | 2014 | | | 2013 | |
Aggregate principal balance outstanding | | $ | 2,836,729 | | | $ | 1,849,042 | | | $ | 2,851,837 | | | $ | 1,859,982 | |
Net fair value adjustments | | | (38,224 | ) | | | (20,000 | ) | | | (38,219 | ) | | | (19,992 | ) |
| | | | | | | | | | | | | | | | |
Fair value | | $ | 2,798,505 | | | $ | 1,829,042 | | | $ | 2,813,618 | | | $ | 1,839,990 | |
| | | | | | | | | | | | | | | | |
follows:
|
| | | | | | | | | | | | | | | | | | | | | | | |
| | Loans | | Loans Held For Sale | | Notes and Certificates |
| December 31, | 2016 | | 2015 | | 2016 | | 2015 | | 2016 | | 2015 |
| Aggregate principal balance outstanding | $ | 4,565,653 |
| | $ | 4,681,671 |
| | $ | 9,345 |
| | $ | — |
| | $ | 4,572,912 |
| | $ | 4,697,169 |
|
| Net fair value adjustments | (253,669 | ) | | (125,590 | ) | | (297 | ) | | — |
| | (252,017 | ) | | (125,586 | ) |
| Fair value | $ | 4,311,984 |
| | $ | 4,556,081 |
| | $ | 9,048 |
| | $ | — |
| | $ | 4,320,895 |
| | $ | 4,571,583 |
|
Loans invested in by the Company for which there was no associated note or certificate, had an aggregate principal balance outstanding of $27.9 million and a fair value of $25.9 million at December 31, 2016. Loans invested in by the Company for which there was no associated note or certificate were immaterial at December 31, 2015.
The Company places all loans for all loan products that are contractually past due by 120 days or more on non-accrual status. At December 31,
2014, loans underlying notes2016 and
certificates had original terms between 12 and 60 months, had monthly payments with fixed interest rates ranging from 5.79% to 29.90% and had maturity dates through December 2019. At December 31, 2013, outstanding loans underlying notes and certificates had original terms of 36 months or 60 months, had monthly payments with fixed interest rates ranging from 5.42% to 26.06% and had maturity dates through December 2018.At December 31, 2014, we had 1,7972015, loans that were 90 days or more past due (which includes(including non-accrual loans discussed below) or the borrower has filed for bankruptcy or is deceased; these loans had a total outstanding principal balance of $19.8 million, aggregate adverse fair value adjustments totaling $18.8 million and an aggregate fair value of $1.0 million. loans) were as follows:
|
| | | | | | | | | | | | | | | | |
| | | December 31, 2016 | | December 31, 2015 |
| | | > 90 days past due | | Non-accrual loans | | > 90 days past due | | Non-accrual loans |
| Outstanding principal balance | | $ | 45,718 |
| | $ | 5,055 |
| | $ | 30,094 |
| | $ | 4,513 |
|
| Net fair value adjustments | | (40,183 | ) | | (4,392 | ) | | (25,312 | ) | | (3,722 | ) |
| Fair value | | $ | 5,535 |
| | $ | 663 |
| | $ | 4,782 |
| | $ | 791 |
|
| # of loans (not in thousands) | | 4,041 |
| | 483 |
| | 2,606 |
| | 382 |
|
Loan Servicing Rights
At December 31,
2013, we had 989 loans that were 90 days or more past due (which includes non-accrual loans discussed below) or the borrower has filed for bankruptcy or is deceased; these loans had a total outstanding principal balance of $10.2 million, aggregate adverse fair value adjustments totaling $9.1 million and an aggregate fair value of $1.1 million.We place loans on non-accrual status once they are 120 days past due. At December 31, 2014, we had 125 loans that were over 120 days past due and classified as non-accrual loans, with an aggregate outstanding principal balance of $1.4 million, aggregate adverse fair value adjustments totaling $1.3 million and an aggregate fair value of $0.1 million. At December 31, 2013, we had 111 loans that were over 120 days past due and classified as non-accrual loans, with an aggregate outstanding principal balance of $1.1 million, aggregate adverse fair value adjustments totaling $0.9 million and an aggregate fair value of $0.2 million.
Loan Servicing Rights
Servicing assets and liabilities related to retained servicing rights are recorded at fair value, when loans are sold, in “Other assets” and “Accrued expenses and other liabilities”, respectively. At December 31, 2014, loans that were facilitated and subsequently sold but for which we retained servicing rights had a total outstanding principal balance of $1,872.4 million, original terms between 12 and 60 months and had monthly payments with fixed interest rates ranging from 5.90% to 33.15% and maturity dates through December 2019. At December 31, 2013,2016, loans underlying loan servicing rights had a total outstanding principal balance of $406.5 million, original terms between 36 months$6.54 billion. At December 31, 2015, loans underlying loan servicing rights had a total outstanding principal balance of $4.29 billion.
LENDINGCLUB CORPORATION
Notes to Consolidated Financial Statements
(Tabular Amounts in Thousands, Except Share and
60 months and had monthly payments with fixed interest rates ranging from 6.00% to 26.06% and maturity dates through December 2018.5.Per Share Amounts, Ratios, or as Noted)
6. Fair Value of
Financial InstrumentsFinancial Instruments Recorded at Fair Value
Assets and Liabilities
For a description of the fair value hierarchy and ourthe Company’s fair value methodology,methodologies, see“Note 2 –2. Summary of Significant Accounting Policies”. All of our financial instrumentsPolicies.” The Company records certain assets and liabilities at fair value as listed in the following tables.
Financial Instruments Recorded at Fair Value
The following tables present the fair value hierarchy for assets and liabilities measured at fair value were classifiedvalue:
|
| | | | | | | | | | | | | | | | |
| December 31, 2016 | | Level 1 Inputs | | Level 2 Inputs | | Level 3 Inputs | | Balance at Fair Value |
| Assets: | | | | | | | | |
| Loans | | $ | — |
| | $ | — |
| | $ | 4,311,984 |
| | $ | 4,311,984 |
|
| Loans held for sale | | — |
| | — |
| | 9,048 |
| | 9,048 |
|
| Securities available for sale: | | | | | | | | |
| Corporate debt securities | | — |
| | 181,223 |
| | — |
| | 181,223 |
|
| Certificates of deposit | | — |
| | 27,501 |
| | — |
| | 27,501 |
|
| Asset-backed securities | | — |
| | 25,364 |
| | — |
| | 25,364 |
|
| Commercial paper | | — |
| | 20,164 |
| | — |
| | 20,164 |
|
| U.S. agency securities | | — |
| | 19,623 |
| | — |
| | 19,623 |
|
| U.S. Treasury securities | | — |
| | 2,496 |
| | — |
| | 2,496 |
|
| Other securities | | — |
| | 10,766 |
| | — |
| | 10,766 |
|
| Total securities available for sale | | — |
| | 287,137 |
| | — |
| | 287,137 |
|
| Servicing assets | | — |
| | — |
| | 21,398 |
| | 21,398 |
|
| Total assets | | $ | — |
| | $ | 287,137 |
| | $ | 4,342,430 |
| | $ | 4,629,567 |
|
| | | | | | | | | |
| Liabilities: | | | | | | | | |
| Notes and certificates | | $ | — |
| | $ | — |
| | $ | 4,320,895 |
| | $ | 4,320,895 |
|
| Loan Trailing Fee liability | | — |
| | — |
| | 4,913 |
| | 4,913 |
|
| Servicing liabilities | | — |
| | — |
| | 2,846 |
| | 2,846 |
|
| Total liabilities | | $ | — |
| | $ | — |
| | $ | 4,328,654 |
| | $ | 4,328,654 |
|
LENDINGCLUB CORPORATION
Notes to Consolidated Financial Statements
(Tabular Amounts in Thousands, Except Share and Per Share Amounts, Ratios, or as Level 3 forNoted)
|
| | | | | | | | | | | | | | | | |
| December 31, 2015 | | Level 1 Inputs | | Level 2 Inputs | | Level 3 Inputs | | Balance at Fair Value |
| Assets: | | | | | | | | |
| Loans | | $ | — |
| | $ | — |
| | $ | 4,556,081 |
| | $ | 4,556,081 |
|
| Securities available for sale: | | | | | | | | |
| Corporate debt securities | | — |
| | 215,751 |
| | — |
| | 215,751 |
|
| Asset-backed securities | | — |
| | 54,409 |
| | — |
| | 54,409 |
|
| U.S. agency securities | | — |
| | 16,578 |
| | — |
| | 16,578 |
|
| U.S. Treasury securities | | — |
| | 3,485 |
| | — |
| | 3,485 |
|
| Other securities | | — |
| | 6,988 |
| | — |
| | 6,988 |
|
| Total securities available for sale | | — |
| | 297,211 |
| | — |
| | 297,211 |
|
| Servicing assets | | — |
| | — |
| | 10,250 |
| | 10,250 |
|
| Total assets | | $ | — |
| | $ | 297,211 |
| | $ | 4,566,331 |
| | $ | 4,863,542 |
|
| | | | | | | | | |
| Liabilities: | | | | | | | | |
| Notes and certificates | | $ | — |
| | $ | — |
| | $ | 4,571,583 |
| | $ | 4,571,583 |
|
| Servicing liabilities | | — |
| | — |
| | 3,973 |
| | 3,973 |
|
| Total liabilities | | $ | — |
| | $ | — |
| | $ | 4,575,556 |
| | $ | 4,575,556 |
|
As the
years ended December 31, 2014 and 2013. We did not transfer any assets or liabilities in or out of Level 3 during the years ended 2014 or 2013.As ourCompany’s loans and related notes and certificates, andloans held for sale, loan servicing rights, and Loan Trailing Fee liability do not trade in an active market with readily observable prices, we usethe Company uses significant unobservable inputs to measure the fair value of these assets and liabilities. Accordingly, we classify them as Level 3 as follows (in thousands):
| | | | | | | | | | | | | | | | |
| | | Level 1 Inputs | | | Level 2 Inputs | | | Level 3 Inputs | | | Fair Value | |
December 31, 2014 | | | | | | | | | | | | | | | | |
Assets: | | | | | | | | | | | | | | | | |
Loans | | $ | — | | | $ | — | | | $ | 2,798,505 | | | $ | 2,798,505 | |
Servicing assets | | | — | | | | — | | | | 2,181 | | | | 2,181 | |
| | | | | | | | | | | | | | | | |
Total assets | | $ | — | | | $ | — | | | $ | 2,800,686 | | | $ | 2,800,686 | |
| | | | | | | | | | | | | | | | |
Liabilities: | | | | | | | | | | | | | | | | |
Notes and certificates | | $ | — | | | $ | — | | | $ | 2,813,618 | | | $ | 2,813,618 | |
Servicing liabilities | | | — | | | | — | | | | 3,973 | | | | 3,973 | |
| | | | | | | | | | | | | | | | |
Total liabilities | | $ | — | | | $ | — | | | $ | 2,817,591 | | | $ | 2,817,591 | |
| | | | | | | | | | | | | | | | |
December 31, 2013 | | | | | | | | | | | | | | | | |
Assets: | | | | | | | | | | | | | | | | |
Loans | | $ | — | | | $ | — | | | $ | 1,829,042 | | | $ | 1,829,042 | |
Servicing assets | | | — | | | | — | | | | 534 | | | | 534 | |
| | | | | | | | | | | | | | | | |
Total assets | | $ | — | | | $ | — | | | $ | 1,829,576 | | | $ | 1,829,576 | |
| | | | | | | | | | | | | | | | |
Liabilities: | | | | | | | | | | | | | | | | |
Notes and certificates | | $ | — | | | $ | — | | | $ | 1,839,990 | | | $ | 1,839,990 | |
Servicing liabilities | | | — | | | | — | | | | 936 | | | | 936 | |
| | | | | | | | | | | | | | | | |
Total liabilities | | $ | — | | | $ | — | | | $ | 1,840,926 | | | $ | 1,840,926 | |
| | | | | | | | | | | | | | | | |
Financial instruments are categorized in the Level 3 valuation hierarchy based on the significance of unobservable factors in the overall fair value measurement. These fair value estimates may also include observable, actively quoted components derived from external sources. As a result, the realized and unrealized gains and losseschanges in fair value for assets and liabilities within the Level 2 or Level 3 categorycategories may include changes in fair value that were attributable to both observable and unobservable inputs.
The Company did not transfer any assets or liabilities in or out of Level 3 during the years ended December 31, 2016 or 2015.
LENDINGCLUB CORPORATION
Notes to Consolidated Financial Statements
(Tabular Amounts in Thousands, Except Share and Per Share Amounts, Ratios, or as Noted)
Significant Unobservable Inputs
The following
table presentstables present quantitative information about the significant unobservable inputs used for
certain of ourthe Company’s Level 3 fair value measurements at December 31,
20142016 and
December 31, 2013 (in thousands): | | | | | | | | | | | | | | |
| | | | | Range of Inputs | |
Year Ended December 31, 2014 | | Unobservable Input | | Minimum | | | Maximum | | | Weighted
Average | |
Loans, notes & certificates | | Discount rates | | | 5.2 | % | | | 17.4 | % | | | 10.1 | % |
| | Net cumulative expected losses | | | 0.3 | % | | | 22.0 | % | | | 10.0 | % |
| | | | |
Servicing asset/liability | | Discount rates | | | 5.3 | % | | | 23.7 | % | | | 10.7 | % |
| | Net cumulative expected losses | | | 0.3 | % | | | 22.0 | % | | | 10.2 | % |
| | Cumulative prepayments | | | 16.5 | % | | | 26.7 | % | | | 20.0 | % |
| | Market servicing rates (% per annum on unpaid principal balance) | | | 0.5 | % | | | 0.7 | % | | | 0.5 | % |
| | |
| | | | | Range of Inputs | |
Year Ended December 31, 2013 | | Unobservable Input | | Minimum | | | Maximum | | | Weighted
Average | |
Loans, notes & certificates | | Discount rates | | | 5.9 | % | | | 15.9 | % | | | 10.2 | % |
| | Net cumulative expected losses | | | 2.1 | % | | | 23.7 | % | | | 10.1 | % |
| | | | |
Servicing asset/liability | | Discount rates | | | 6.1 | % | | | 15.9 | % | | | 10.0 | % |
| | Net cumulative expected losses | | | 2.1 | % | | | 23.7 | % | | | 9.6 | % |
| | Market servicing rates (% per annum on unpaid principal balance) | | | 0.4 | % | | | 0.4 | % | | | 0.4 | % |
2015:
|
| | | | | | | | | | | | | | | | | | | | | | | | | | | |
| | | December 31, 2016 |
| | | Loans, Notes and Certificates | | Servicing Asset/Liability | | Loan Trailing Fee Liability |
| | | Minimum | | Maximum | | Weighted Average | | Minimum | | Maximum | | Weighted Average | | Minimum | | Maximum | | Weighted Average |
| Discount rates | | 1.2 | % | | 16.6 | % | | 7.2 | % | | 3.4 | % | | 15.1 | % | | 7.8 | % | | 3.4 | % | | 15.0 | % | | 7.7 | % |
Net cumulative expected loss rates (1) | | 0.3 | % | | 33.9 | % | | 14.6 | % | | 0.3 | % | | 33.9 | % | | 12.8 | % | | 0.3 | % | | 33.9 | % | | 13.5 | % |
Cumulative expected prepayment rates (1) | | 8.0 | % | | 42.7 | % | | 30.7 | % | | 8.0 | % | | 42.7 | % | | 29.3 | % | | 8.0 | % | | 42.7 | % | | 28.3 | % |
Total market servicing rates (% per annum on outstanding principal balance) (2) | | N/A |
| | N/A |
| | N/A |
| | 0.63 | % | | 0.90 | % | | 0.63 | % | | N/A |
| | N/A |
| | N/A |
|
| | | | | | | | | | | | | | | | | | | |
| | | December 31, 2015 |
| | | Loans, Notes and Certificates | | Servicing Asset/Liability | | Loan Trailing Fee Liability |
| | | Minimum | | Maximum | | Weighted Average | | Minimum | | Maximum | | Weighted Average | | Minimum | | Maximum | | Weighted Average |
| Discount rates | | 2.9 | % | | 17.5 | % | | 9.0 | % | | 3.5 | % | | 16.3 | % | | 9.4 | % | | N/A |
| | N/A |
| | N/A |
|
Net cumulative expected loss rates (1) | | 0.3 | % | | 22.0 | % | | 9.9 | % | | 0.3 | % | | 22.0 | % | | 8.8 | % | | N/A |
| | N/A |
| | N/A |
|
Cumulative expected prepayment rates (1) | | 23.4 | % | | 36.4 | % | | 30.8 | % | | 8.0 | % | | 36.4 | % | | 30.5 | % | | N/A |
| | N/A |
| | N/A |
|
Total market servicing rates (% per annum on outstanding principal balance) (2) | | N/A |
| | N/A |
| | N/A |
| | 0.57 | % | | 0.75 | % | | 0.57 | % | | N/A |
| | N/A |
| | N/A |
|
N/A Not applicable
| |
(1) | Expressed as a percentage of the original principal balance of the loan, note or certificate. |
| |
(2) | Includes collection fees estimated to be paid to a hypothetical third-party servicer. |
At December 31,
2014,2016 and 2015, the discounted cash flow methodology used to estimate the note and
certificatescertificates' fair values
usesused the same projected net cash flows as their related loans. As demonstrated by the
tablefollowing tables below, the fair value adjustments for loans were largely offset by the fair value adjustments of the notes and certificates due to the
member payment dependent design of the notes and certificates and because the principal balances of the loans were very close to the combined principal balances of the notes and certificates.
LENDINGCLUB CORPORATION
Notes to Consolidated Financial Statements
(Tabular Amounts in Thousands, Except Share and Per Share Amounts, Ratios, or as Noted)
The following table presents additional information about Level 3 loans,
loans held for sale, notes and certificates measured at fair value on a recurring basis for the years ended December 31,
20142016 and
December 31, 2013 (in thousands): | | | | | | | | |
| | | Loans | | | Notes and
Certificates | |
Fair value at December 31, 2012 | | $ | 781,215 | | | $ | 785,316 | |
Purchases of loans | | | 2,064,628 | | | | — | |
Issuances of notes and certificates | | | — | | | | 1,618,269 | |
Whole loan sales | | | (446,224 | ) | | | — | |
Principal payments | | | (511,232 | ) | | | (504,330 | ) |
Recoveries from sale and collection of charged-off loans | | | (1,716 | ) | | | (1,669 | ) |
| | | | | | | | |
Carrying value before fair value adjustments | | | 1,886,671 | | | | 1,897,586 | |
Fair value adjustments, included in net income (loss) | | | (57,629 | ) | | | (57,596 | ) |
| | | | | | | | |
Fair value at December 31, 2013 | | $ | 1,829,042 | | | $ | 1,839,990 | |
Purchases of loans | | | 3,886,427 | | | | — | |
Issuances of notes and certificates | | | — | | | | 2,156,019 | |
Whole loan sales | | | (1,730,045 | ) | | | — | |
Principal payments | | | (1,054,357 | ) | | | (1,049,982 | ) |
Recoveries from sale and collection of charged-off loans | | | (7,960 | ) | | | (7,929 | ) |
| | | | | | | | |
Carrying value before fair value adjustments | | | 2,923,107 | | | | 2,938,098 | |
Fair value adjustments, included in net income (loss) | | | (124,602 | ) | | | (124,480 | ) |
| | | | | | | | |
Fair value at December 31, 2014 | | $ | 2,798,505 | | | $ | 2,813,618 | |
| | | | | | | | |
2015:
|
| | | | | | | | | | | | | | | | | | | | | | | | | | | | | | | | | | | | |
| | | Loans | | Loans Held For Sale | | Notes and Certificates |
| | | Outstanding Principal Balance | | Valuation Adjustment | | Fair Value | | Outstanding Principal Balance | | Valuation Adjustment | | Fair Value | | Outstanding Principal Balance | | Valuation Adjustment | | Fair Value |
| Balance at December 31, 2014 | | $ | 2,836,729 |
| | $ | (38,224 | ) | | $ | 2,798,505 |
| | $ | — |
| | $ | — |
| | $ | — |
| | $ | 2,851,837 |
| | $ | (38,219 | ) | | $ | 2,813,618 |
|
| Purchases of loans | | 3,865,565 |
| | — |
| | 3,865,565 |
| | 3,358,611 |
| | — |
| | 3,358,611 |
| | — |
| | — |
| | — |
|
| Issuances of notes and certificates | | — |
| | — |
| | — |
| | — |
| | — |
| | — |
| | 3,861,995 |
| | — |
| | 3,861,995 |
|
| Whole loan sales | |
|
| | — |
| | — |
| | (3,358,611 | ) | | — |
| | (3,358,611 | ) | | — |
| | — |
| | — |
|
| Principal payments | | (1,804,719 | ) | | — |
| | (1,804,719 | ) | | — |
| | — |
| | — |
| | (1,800,859 | ) | | — |
| | (1,800,859 | ) |
| Charge-offs | | (215,904 | ) | | 215,904 |
| | — |
| | — |
| | — |
| | — |
| | (215,804 | ) | | 215,804 |
| | — |
|
| Recoveries | | — |
| | (26,256 | ) | | (26,256 | ) | | — |
| | — |
| | — |
| | — |
| | (26,143 | ) | | (26,143 | ) |
| Change in fair value recorded in earnings | | — |
| | (277,014 | ) | | (277,014 | ) | | — |
| | — |
| | — |
| | — |
| | (277,028 | ) | | (277,028 | ) |
| Balance at December 31, 2015 | | $ | 4,681,671 |
| | $ | (125,590 | ) | | $ | 4,556,081 |
| | $ | — |
| | $ | — |
| | $ | — |
| | $ | 4,697,169 |
| | $ | (125,586 | ) | | $ | 4,571,583 |
|
| Purchases of loans | | 2,733,325 |
| | (656 | ) | | 2,732,669 |
| | 4,742,538 |
| | — |
| | 4,742,538 |
| | — |
| | — |
| | — |
|
| Transfers from loans to loans held for sale | | (35,411 | ) | | — |
| | (35,411 | ) | | 35,411 |
| | — |
| | 35,411 |
| | | | | | |
| Issuances of notes and certificates | | — |
| | — |
| | — |
| | — |
| | — |
| | — |
| | 2,681,109 |
| | — |
| | 2,681,109 |
|
| Whole loan sales | | — |
| | — |
| | — |
| | (4,762,518 | ) | | — |
| | (4,762,518 | ) | | — |
| | — |
| | — |
|
| Principal payments | | (2,391,807 | ) | | — |
| | (2,391,807 | ) | | (5,927 | ) | | — |
| | (5,927 | ) | | (2,385,234 | ) | | — |
| | (2,385,234 | ) |
| Charge-offs | | (422,125 | ) | | 422,125 |
| | — |
| | (159 | ) | | 159 |
| | — |
| | (420,132 | ) | | 420,132 |
| | — |
|
| Recoveries | | — |
| | (37,277 | ) | | (37,277 | ) | | — |
| | — |
| | — |
| | — |
| | (36,785 | ) | | (36,785 | ) |
| Change in fair value recorded in earnings | | — |
| | (512,271 | ) | | (512,271 | ) | | — |
| | (456 | ) | | (456 | ) | | — |
| | (509,778 | ) | | (509,778 | ) |
| Balance at December 31, 2016 | | $ | 4,565,653 |
| | $ | (253,669 | ) | | $ | 4,311,984 |
| | $ | 9,345 |
| | $ | (297 | ) | | $ | 9,048 |
| | $ | 4,572,912 |
| | $ | (252,017 | ) | | $ | 4,320,895 |
|
LENDINGCLUB CORPORATION
Notes to Consolidated Financial Statements
(Tabular Amounts in Thousands, Except Share and Per Share Amounts, Ratios, or as Noted)
The following tables presenttable presents additional information about Level 3 servicing assets and liabilities measured at fair value on a recurring basis for the years ended December 31, 20142016 and 2015:
|
| | | | | | | | |
| | | Servicing Assets | | Servicing Liabilities |
| Fair value at December 31, 2014 | | $ | 2,181 |
| | $ | 3,973 |
|
Issuances (1) | | 10,079 |
| | 5,194 |
|
| Changes in fair value, included in servicing fees | | (3,803 | ) | | (5,194 | ) |
| Additions, included in deferred revenue | | 1,793 |
| | — |
|
| Fair value at December 31, 2015 | | $ | 10,250 |
| | $ | 3,973 |
|
Issuances (1) | | 16,546 |
| | 3,371 |
|
| Changes in fair value, included in servicing fees | | (5,403 | ) | | (4,498 | ) |
| Additions, included in deferred revenue | | 5 |
| | — |
|
| Fair value at December 31, 2016 | | $ | 21,398 |
| | $ | 2,846 |
|
| |
(1) | Represents the offsets to the gains or losses on sales of the related loans, recorded in other revenue. |
The following table presents additional information about the Level 3 Loan Trailing Fee liability measured at fair value on a recurring basis for the year ended December 31,
2013 (in thousands): | | | | | | | | |
| | | Servicing
Assets | | | Servicing
Liabilities | |
Fair value at December 31, 2012 | | $ | — | | | $ | — | |
Additions, included in Other revenue (expense) | | | 587 | | | | 1,273 | |
Changes in fair value, included in Servicing fees | | | (53 | ) | | | (337 | ) |
| | | | | | | | |
Fair value at December 31, 2013 | | $ | 534 | | | $ | 936 | |
| | | | | | | | |
Additions, included in Other revenue (expense) | | | 2,152 | | | | 5,721 | |
Changes in fair value, included in Servicing fees | | | (1,264 | ) | | | (2,684 | ) |
| | | | | | | | |
Total adjustments included in Net revenue | | | 888 | | | | 3,037 | |
Additions, included in Deferred revenue | | | 759 | | | | — | |
| | | | | | | | |
Fair value at December 31, 2014 | | $ | 2,181 | | | $ | 3,973 | |
| | | | | | | | |
2016:
|
| | | |
| Year Ended December 31, | 2016 |
| Fair value at beginning of period | $ | — |
|
| Issuances | 5,843 |
|
| Cash payment of Loan Trailing Fee | (1,174 | ) |
| Change in fair value, included in origination and servicing | 244 |
|
| Fair value at end of period | $ | 4,913 |
|
There was no Loan Trailing Fee liability at December 31, 2015.
Significant Recurring Level 3 Fair Value Asset and Liability Input Sensitivity
The majority of fair value adjustments included in net income (loss) are attributable to changes in estimated instrument-specific future credit losses. All
Certain fair valuation adjustments wererecorded through earnings related to Level 3 instruments for the years ended December 31, 20142016, 2015 and 2013. 2014. Generally, changes in the net cumulative expected loss rates, cumulative prepayment rates, and discount rates will have an immaterial net impact on the fair value of loans, notes and certificates, servicing assets and liabilities, and Loan Trailing Fees.
Certain of these unobservable inputs may (in isolation) have either a directionally consistent or opposite impact on the fair value of the financial instrument for a given change in that input. When multiple inputs are used within the valuation techniques for loans, notes and certificates, servicing assets and liabilities, and Loan Trailing Fees, a change in one input in a certain direction may be offset by an opposite change from another input.
A specific loan that is projected to have
higherlarger future default losses than previously estimated has lower expected future cash flows over its remaining life, which reduces its estimated fair value. Conversely, a specific loan that is projected to have
lowersmaller future default losses than previously estimated has increased expected future cash flows over its remaining life, which increases its
estimated fair value.
Changes
LENDINGCLUB CORPORATION
Notes to Consolidated Financial Statements
(Tabular Amounts in
the unobservable inputs discussed above may have a significant impact on the fair value of the loan, noteThousands, Except Share and Per Share Amounts, Ratios, or
certificate or servicing asset or liability. Certain of these unobservable inputs will (in isolation) have a directionally consistent impact on the fair value of the instrument for a given change in that input. Alternatively, the fair value of the instrument may move in an opposite direction for a given change in another input. When multiple inputs are used within the valuation techniques for loans, notes, certificates or servicing assets or liabilities, a change in one input in a certain direction may be offset by an opposite change from another input.Generally, changes in the net cumulative expected loss rates, prepayment rates and discount rates will have an immaterial impact on the fair value of loans, notes and certificates. Generally, changes in the net cumulative expected loss rates and discount rates have an immaterial impact on the fair value of loan servicing rights. Ouras Noted)
The Company’s selection of the most representative
prepayment rates andbase market servicing rates for
our productsservicing assets and servicing liabilities is inherently judgmental.
WeThe Company reviewed
estimated third-party servicing rates for
other assetsits loans and
liabilities with detachable servicing rights and determined thatloans in similar credit sectors, as well as market servicing
rates on our products of 0.40% to 0.70% of outstanding principal is not inappropriate. Expected prepayments are based on analysis of actual prepayments experience of loans considering their various types, terms and credit grades.benchmarking analyses provided by third-party valuation firms. The table below shows the
estimated impact on
ourthe estimated fair value of servicing assets and liabilities, calculated using different market servicing
rates and different prepayment ratesrate assumptions as of December 31,
2014 (in thousands, except percentages). The sensitivities related to market servicing rates2016 and
prepayment rates were not significant as of December 31, 2013. | | | | | | | | |
December 31, | | 2014 | |
| | | Servicing
Assets | | | Servicing
Liabilities | |
Weighted average market servicing rate assumptions | | | 0.50 | % | | | 0.50 | % |
Increase (decrease) in fair value from: | | | | | | | | |
Servicing rate increase to 0.60% | | ($ | 915 | ) | | $ | 1,416 | |
Servicing rate decrease to 0.40% | | $ | 965 | | | ($ | 1,366 | ) |
Weighted average cumulative prepayment assumptions | | | 20.0 | % | | | 20.0 | % |
Increase (decrease) in fair value from: | | | | | | | | |
25% increase in cumulative prepayments | | ($ | 65 | ) | | ($ | 228 | ) |
25% decrease in cumulative prepayments | | $ | 67 | | | $ | 231 | |
2015:
|
| | | | | | | | | | | | | | | |
| | December 31, 2016 | | December 31, 2015 |
| | Servicing Assets | | Servicing Liabilities | | Servicing Assets | | Servicing Liabilities |
Weighted-average market servicing rate assumptions(1) | 0.63 | % | | 0.63 | % | | 0.57 | % | | 0.57 | % |
| Change in fair value from: | | | | | | | |
| Servicing rate increase by 0.10% | $ | (5,673 | ) | | $ | 964 |
| | $ | (3,504 | ) | | $ | 1,589 |
|
| Servicing rate decrease by 0.10% | $ | 5,812 |
| | $ | (825 | ) | | $ | 3,610 |
| | $ | (1,483 | ) |
| |
(1) | Represents total market servicing rates, which include collection fees. |
Financial Instruments,
Assets, and Liabilities Not Recorded at Fair Value
At December 31, 2014 and 2013,
The following tables present the carrying amount of allfair value hierarchy for financial instruments, assets, and liabilities not recorded at fair value approximates fair value duevalue: |
| | | | | | | | | | | | | | | | | | | |
| December 31, 2016 | Carrying Amount | | Level 1 Inputs | | Level 2 Inputs | | Level 3 Inputs | | Balance at Fair Value |
| Assets: | | | | | | | | | |
| Cash and cash equivalents | $ | 515,602 |
| | $ | — |
| | $ | 515,602 |
| | $ | — |
| | $ | 515,602 |
|
| Restricted cash | 177,810 |
| | — |
| | 177,810 |
| | — |
| | 177,810 |
|
| Servicer reserve receivable | 4,938 |
| | — |
| | 4,938 |
| | — |
| | 4,938 |
|
| Deposits | 855 |
| | — |
| | 855 |
| | — |
| | 855 |
|
| Goodwill | 35,633 |
| | — |
| | — |
| | 35,633 |
| | 35,633 |
|
| Total assets | $ | 734,838 |
| | $ | — |
| | $ | 699,205 |
| | $ | 35,633 |
| | $ | 734,838 |
|
| Liabilities: | | | | | | | | | |
| Accrued expenses and other liabilities | $ | 10,981 |
| | $ | — |
| | $ | — |
| | $ | 10,981 |
| | $ | 10,981 |
|
| Accounts payable | 10,889 |
| | — |
| | 10,889 |
| | — |
| | 10,889 |
|
| Payables to investors | 125,884 |
| | — |
| | 125,884 |
| | — |
| | 125,884 |
|
| Total liabilities | $ | 147,754 |
| | $ | — |
| | $ | 136,773 |
| | $ | 10,981 |
| | $ | 147,754 |
|
|
| | | | | | | | | | | | | | | | | | | |
| December 31, 2015 | Carrying Amount | | Level 1 Inputs | | Level 2 Inputs | | Level 3 Inputs | | Balance at Fair Value |
| Assets: | | | | | | | | | |
| Cash and cash equivalents | $ | 623,531 |
| | $ | — |
| | $ | 623,531 |
| | $ | — |
| | $ | 623,531 |
|
| Restricted cash | 80,733 |
| | — |
| | 80,733 |
| | — |
| | 80,733 |
|
| Deposits | 871 |
| | — |
| | 871 |
| | — |
| | 871 |
|
| Total assets | $ | 705,135 |
| | $ | — |
| | $ | 705,135 |
| | $ | — |
| | $ | 705,135 |
|
| Liabilities: | | | | | | | | | |
| Accounts payable | $ | 5,542 |
| | $ | — |
| | $ | 5,542 |
| | $ | — |
| | $ | 5,542 |
|
| Payables to investors | 73,162 |
| | — |
| | 73,162 |
| | — |
| | 73,162 |
|
| Total liabilities | $ | 78,704 |
| | $ | — |
| | $ | 78,704 |
| | $ | — |
| | $ | 78,704 |
|
LENDINGCLUB CORPORATION
Notes to the short term nature of these assetsConsolidated Financial Statements
(Tabular Amounts in Thousands, Except Share and
liabilities. Instruments to which this applies include: cash and cash equivalents, restricted cash, accrued interest receivable and payable, accounts payable, and payables to investors.6.Per Share Amounts, Ratios, or as Noted)
7. Property, Equipment and Software,
netNet
Property, equipment and software,
net, consist of the
following (in thousands): | | | | | | | | |
December 31, | | 2014 | | | 2013 | |
Internally developed software | | $ | 16,023 | | | $ | 4,188 | |
Computer equipment | | | 7,929 | | | | 4,019 | |
Leasehold improvements | | | 4,802 | | | | 2,700 | |
Purchased software | | | 3,326 | | | | 913 | |
Furniture and fixtures | | | 2,405 | | | | 836 | |
Construction in progress | | | 549 | | | | 1,978 | |
Other | | | — | | | | 26 | |
| | | | | | | | |
Total property, equipment and software | | | 35,034 | | | | 14,660 | |
Accumulated depreciation and amortization | | | (7,983 | ) | | | (2,065 | ) |
| | | | | | | | |
Property, equipment and software, net | | $ | 27,051 | | | $ | 12,595 | |
| | | | | | | | |
following:
|
| | | | | | | |
| December 31, | 2016 | | 2015 |
Internally developed software (1) | $ | 75,202 |
| | $ | 40,709 |
|
| Leasehold improvements | 22,637 |
| | 11,559 |
|
| Computer equipment | 18,080 |
| | 14,076 |
|
| Purchased software | 7,598 |
| | 5,336 |
|
| Furniture and fixtures | 6,827 |
| | 5,086 |
|
| Construction in progress | 707 |
| | 2,870 |
|
| Total property, equipment and software | 131,051 |
| | 79,636 |
|
| Accumulated depreciation and amortization | (41,788 | ) | | (23,706 | ) |
| Total property, equipment and software, net | $ | 89,263 |
| | $ | 55,930 |
|
| |
(1) | Includes $7.4 million and $459 thousand in construction in progress as of December 31, 2016 and 2015, respectively. |
Depreciation and amortization expense on property, equipment and software
was $25.1 million, $16.2 million and $6.4 million for the years ended December 31,
2016, 2015 and 2014,
and 2013 and nine months ended December 31, 2012 was $6.4 million, $1.7 million and $0.2 million, respectively.
For the year ended December 31, 2014 weThe Company recorded impairment expense of
$1.1 million, $0.6 million and $0.5 million, included in
other general and administrative expense in the consolidated statements of operations,
due to property, equipment and software no longer in use. Impairment expense for the
yearyears ended December 31,
20132016, 2015 and
the nine months ended December 31, 2012 was immaterial.7.2014, respectively.
Other assets consist of the
following (in thousands): | | | | | | | | |
December 31, | | 2014 | | | 2013 | |
Prepaid expenses | | $ | 6,807 | | | $ | 3,546 | |
Deferred acquisition compensation | | | 2,695 | | | | — | |
Loan servicing assets at fair value | | | 2,181 | | | | 534 | |
Accounts receivable | | | 1,744 | | | | 439 | |
Deposits | | | 657 | | | | 193 | |
Receivable from investors | | | 155 | | | | 18,116 | |
Tenant improvement receivable | | | — | | | | 504 | |
Other | | | 93 | | | | 589 | |
| | | | | | | | |
Total other assets | | $ | 14,332 | | | $ | 23,921 | |
| | | | | | | | |
8. Goodwillfollowing:
|
| | | | | | | |
| December 31, | 2016 | | 2015 |
| Loan servicing assets, at fair value | $ | 21,398 |
| | $ | 10,250 |
|
| Prepaid expenses | 16,960 |
| | 16,283 |
|
| Other investments | 10,372 |
| | 250 |
|
| Accounts receivable | 7,572 |
| | 4,976 |
|
| Servicer reserve receivable | 4,938 |
| | — |
|
| Tenant improvement receivable | 3,290 |
| | 778 |
|
| Receivable from investors | 1,566 |
| | 1,117 |
|
| Deferred financing costs | 1,032 |
| | 1,296 |
|
| Deposits | 855 |
| | 871 |
|
Due from related parties (1) | 476 |
| | 655 |
|
| Deferred acquisition compensation | 349 |
| | 1,521 |
|
| Other | 836 |
| | 416 |
|
| Total other assets | $ | 69,644 |
| | $ | 38,413 |
|
| |
(1) | Represents management fees due to LCA from certain private funds for which LCA acts as the general partner. |
LENDINGCLUB CORPORATION
Notes to Consolidated Financial Statements
(Tabular Amounts in Thousands, Except Share and Per Share Amounts, Ratios, or as Noted)
9. Intangible Assets
and Goodwill
Goodwill consists
Intangible Assets
Intangible assets consist of the
following (in thousands): | | | | |
Balance at December 31, 2013 | | $ | — | |
Acquisition of Springstone | | | 72,592 | |
| | | | |
Balance at December 31, 2014 | | $ | 72,592 | |
| | | | |
We did not record any goodwill in the year ended December 31, 2013 or the nine months ended December 31, 2012. During the year ended December 31, 2014, we recorded goodwill in conjunction with the acquisition of Springstone. We did not record any goodwill impairment expense for the year ended December 31, 2014.
Intangible Assets
Intangible assets as of December 31, 2014 are as follows (in thousands, except years):
| | | | | | | | | | | | |
| | | Gross
Carrying
Value | | | Accumulated
Amortization | | | Net
Carrying
Value | |
Customer relationships | | $ | 39,500 | | | $ | (3,700 | ) | | $ | 35,800 | |
Technology | | | 400 | | | | (93 | ) | | | 307 | |
Brand name | | | 300 | | | | (105 | ) | | | 195 | |
| | | | | | | | | | | | |
Total intangible assets subject to amortization | | $ | 40,200 | | | $ | (3,898 | ) | | $ | 36,302 | |
| | | | | | | | | | | | |
We did not record any intangible assets for the year ended December 31, 2013 or the nine months ended December 31, 2012.
following:
|
| | | | | | | | | | | |
| December 31, 2016 | Gross Carrying Value | | Accumulated Amortization | | Net Carrying Value |
| Customer relationships | $ | 39,500 |
| | $ | (13,329 | ) | | $ | 26,171 |
|
| Technology | 400 |
| | (360 | ) | | 40 |
|
| Brand name | 300 |
| | (300 | ) | | — |
|
| Total intangible assets | $ | 40,200 |
| | $ | (13,989 | ) | | $ | 26,211 |
|
|
| | | | | | | | | | | |
| December 31, 2015 | Gross Carrying Value | | Accumulated Amortization | | Net Carrying Value |
| Customer relationships | $ | 39,500 |
| | $ | (8,702 | ) | | $ | 30,798 |
|
| Technology | 400 |
| | (227 | ) | | 173 |
|
| Brand name | 300 |
| | (300 | ) | | — |
|
| Total intangible assets | $ | 40,200 |
| | $ | (9,229 | ) | | $ | 30,971 |
|
The customer relationship intangible assets are being amortized on an accelerated basis over a 14 year period. The technology and brand name intangible assets are being amortized on a straight line basis over three years and two years,one year, respectively. The weighted-average amortization period for total intangibles is 13.8 years. Amortization expense associated with intangible assets for the yearyears ended December 31, 2016, 2015 and 2014 was $4.8 million, $5.3 million and $3.9 million. There was no amortization expense for the year ended December 31, 2013 or the nine months ended December 31, 2012.million, respectively.
The expected future amortization expense for intangible assets as of December 31,
20142016, is as
follows (in thousands): | | | | |
2015 | | $ | 5,286 | |
2016 | | | 4,801 | |
2017 | | | 4,286 | |
2018 | | | 3,871 | |
2019 | | | 3,499 | |
Thereafter | | | 14,559 | |
| | | | |
Total | | $ | 36,302 | |
| | | | |
9.follows:
|
| | | |
| 2017 | $ | 4,287 |
|
| 2018 | 3,872 |
|
| 2019 | 3,498 |
|
| 2020 | 3,122 |
|
| 2021 | 2,746 |
|
| Thereafter | 8,686 |
|
| Total | $ | 26,211 |
|
Goodwill
Goodwill consists of the following:
|
| | | |
| Balance at December 31, 2014 | $ | 72,592 |
|
| Other changes in goodwill | 91 |
|
| Balance at December 31, 2015 | 72,683 |
|
| Goodwill impairment | (37,050 | ) |
| Balance at December 31, 2016 | $ | 35,633 |
|
LENDINGCLUB CORPORATION
Notes to Consolidated Financial Statements
(Tabular Amounts in Thousands, Except Share and Per Share Amounts, Ratios, or as Noted)
The Company's annual goodwill impairment testing date is April 1. In testing for potential impairment of goodwill, management performed an assessment of each of the Company's reporting units (generally defined as the Company's businesses for which financial information is available and reviewed regularly by management). Only the education and patient finance reporting unit contains goodwill. The Company's annual goodwill impairment analysis resulted in an impairment charge of $37.1 million for the year ended December 31, 2016.
The first step of the analysis is to compare the reporting unit’s estimated fair value to its carrying value. Estimating the fair value of the education and patient finance reporting unit was a subjective process involving the use of estimates and judgments, particularly related to future cash flows, discount rates (including market risk premiums) and market valuation multiples. The fair value of the reporting unit was determined using the income approach and the market approach, each a commonly used valuation technique. The Company gave consideration to each valuation technique, as either technique can be an indicator of fair value. For the income approach, the Company estimated future cash flows and used such cash flows in a discounted cash flow model (DCF model). A DCF model was selected to be comparable to what would be used by market participants to estimate fair value. The DCF model incorporated expected future growth rates, terminal value amounts, and the applicable weighted-average cost of capital to discount estimated cash flows. The projections used in the estimate of fair value are consistent with the Company’s current forecast and long-range plans for this reporting unit. For the market approach, the valuation of the reporting unit was based on an analysis of enterprise value to revenue and enterprise value to EBITDA valuation multiples. The peer group valuation multiples used in the analysis were selected based on management’s judgment.
The second step of the analysis includes allocating the estimated fair value (determined in the first step) of the reporting unit to its assets and liabilities to determine an implied fair value of goodwill. The implied fair value of goodwill was determined in the same manner as the amount of goodwill recognized in an acquisition. That is, the estimated fair value of the reporting unit was allocated to all of the assets and liabilities of the unit (including unrecognized intangibles such as provider relationships) as if the reporting unit had been acquired and the estimated fair value was the purchase price paid.
The Company did not record any goodwill impairment expense for the years ended December 31, 2015 or 2014.
LENDINGCLUB CORPORATION
Notes to Consolidated Financial Statements
(Tabular Amounts in Thousands, Except Share and Per Share Amounts, Ratios, or as Noted)
10. Accrued Expenses and Other Liabilities
Accrued expenses and other liabilities consist of the
following (in thousands): | | | | | | | | |
December 31, | | 2014 | | | 2013 | |
Accrued compensation | | $ | 13,659 | | | $ | 5,243 | |
Accrued service fees | | | 6,220 | | | | 2,057 | |
Loan servicing liability at fair value | | | 3,973 | | | | 936 | |
Contingent liabilities | | | 1,995 | | | | — | |
Deferred rent | | | 1,377 | | | | 653 | |
Deferred tax liability | | | 1,332 | | | | — | |
Transaction fee refund reserve | | | 828 | | | | — | |
Deferred revenue | | | 759 | | | | — | |
Early stock option exercise | | | 392 | | | | — | |
Other | | | 1,085 | | | | 239 | |
| | | | | | | | |
Total accrued expenses and other liabilities | | $ | 31,620 | | | $ | 9,128 | |
| | | | | | | | |
10. Long-termfollowing:
|
| | | | | | | |
| December 31, | 2016 | | 2015 |
Accrued compensation (1) | $ | 27,009 |
| | $ | 28,780 |
|
| Accrued expenses | 19,734 |
| | 14,054 |
|
| Deferred rent | 11,638 |
| | 4,615 |
|
| Transaction fee refund reserve | 9,098 |
| | 578 |
|
| Loan Trailing Fee liability, at fair value | 4,913 |
| | — |
|
| Loan servicing liabilities, at fair value | 2,846 |
| | 3,973 |
|
| Deferred revenue | 2,556 |
| | 2,551 |
|
| Credit loss coverage reserve | 2,529 |
| | — |
|
| Reimbursement payable to limited partners of LCA private funds | 2,313 |
| | — |
|
| Payable to issuing bank | 1,658 |
| | 955 |
|
| Deferred tax liability | — |
| | 3,446 |
|
| Contingent liabilities | — |
| | 700 |
|
| Other | 1,325 |
| | 1,591 |
|
| Total accrued expenses and other liabilities | $ | 85,619 |
| | $ | 61,243 |
|
| |
(1) | Includes accrued cash retention awards of $3.0 million as of December 31, 2016. See “Note 15. Employee Incentive and Retirement Plans” for additional information on the Company's Cash Retention Plan. |
11. Accumulated Other Comprehensive Loss
Accumulated other comprehensive loss represents other cumulative gains and losses that are not reflected in earnings. The components of other comprehensive income (loss) were as follows:
|
| | | | | | | | | | | |
| Year Ended December 31, | 2016 |
| | Before Tax | | Tax Effect | | Net of Tax |
| Change in net unrealized losses on securities available for sale | $ | 1,515 |
| | $ | 611 |
| | $ | 904 |
|
| Other comprehensive income | $ | 1,515 |
| | $ | 611 |
| | $ | 904 |
|
|
| | | | | | | | | | | |
| Year Ended December 31, | 2015 |
| | Before Tax | | Tax Effect | | Net of Tax |
| Change in net unrealized losses on securities available for sale | $ | (1,671 | ) | | $ | — |
| | $ | (1,671 | ) |
| Other comprehensive loss | $ | (1,671 | ) | | $ | — |
| | $ | (1,671 | ) |
LENDINGCLUB CORPORATION
Notes to Consolidated Financial Statements
(Tabular Amounts in Thousands, Except Share and Per Share Amounts, Ratios, or as Noted)
Accumulated other comprehensive loss balances were as follows:
|
| | | |
| | Total Accumulated Other Comprehensive Loss |
| Balance at December 31, 2014 | $ | — |
|
| Change in net unrealized losses on securities available for sale | (1,671 | ) |
| Balance at December 31, 2015 | $ | (1,671 | ) |
| Change in net unrealized losses on securities available for sale | 904 |
|
| Balance at December 31, 2016 | $ | (767 | ) |
The Company did not have any items of other comprehensive income (loss) during the year ended December 31, 2014.
Revolving Credit Facility
On April 16, 2014, weDecember 17, 2015, the Company entered into a credit and guaranty agreement under whichwith several lenders madefor an aggregate $50.0$120.0 million Term Loan to us.unsecured revolving credit facility (Credit Facility). In connection with our entry into the credit agreement, wethe Company entered into a pledge and security agreement with Morgan Stanley Senior Funding, Inc., as collateral agent.
Proceeds of loans made under the Credit Facility may be borrowed, repaid and reborrowed until December 17, 2020. Repayment of any outstanding proceeds are payable on December 17, 2020, but may be prepaid without penalty.
Borrowings under the Credit Facility bear interest, at the Company’s option, at an annual rate based on LIBOR rate plus a spread of 1.75% to 2.00%, which is fixed for a Company-selected interest period of one, two, three, six or 12 months, or at an alternative base rate (which is tied to either the prime rate, federal funds effective rate, or the adjusted eurocurrency rate, as defined in the credit agreement). Base rate borrowings may be prepaid at any time without penalty, however pre-payment of LIBOR-based borrowings before the end of the selected interest period may result in the Company incurring expense to compensate the lenders for their funding costs through the end of the interest period. Interest is payable quarterly. Additionally, the Company is required to pay a quarterly commitment fee to the lenders of between 0.25% and 0.375% per annum, depending on the Company’s total net leverage ratio, on the average undrawn portion available under the revolving loan facility.
The Credit Facility and pledge and security agreement contain certain covenants applicable to the Company, including restrictions on the Company’s ability to pay dividends, incur indebtedness, pledge our assets, merge or consolidate, make investments, and enter into certain affiliate transactions. The Credit Facility also requires the Company to maintain a maximum total net leverage ratio (defined as the ratio of net debt to Adjusted EBITDA, on a consolidated basis for the four most recent Fiscal Quarter periods) of 4.00:1.00 initially, and which decreases over the term of the Credit Facility to 3.00:1.00 on and after June 30, 2018 (on a consolidated basis). As of December 31, 2016 and 2015, the total net leverage ratio, calculated as defined in the Credit Facility, was 0%.
The Company did not have any loans outstanding under the Credit Facility during the years ended December 31, 2016 and 2015. The Company incurred $1.3 million of capitalized debt issuance costs, which will be recognized as interest expense through December 17, 2020.
LENDINGCLUB CORPORATION
Notes to Consolidated Financial Statements
(Tabular Amounts in Thousands, Except Share and Per Share Amounts, Ratios, or as Noted)
Term Loan
On April 16, 2014, the Company entered into a credit and guaranty agreement with several lenders for an aggregate $50.0 million Term Loan. In connection with the credit agreement, the Company entered into a pledge and security agreement with Morgan Stanley Senior Funding, Inc., as collateral agent. The Term Loan was outstanding for 245 days in 2014
becauseand was fully repaid and extinguished on December 17,
2014, we fully repaid the Term Loan. Consequently, our Term Loan was extinguished and removed from the balance sheet as of December 31, 2014. For the year ended December 31, 2014,
wethe Company incurred interest expense on the Term Loan of $2.3 million, which included
expense related to writing off capitalized debt issuance
costs of $1.2 million, debt discount costs of $0.2 million and interest expense of $0.9 million. This interest expense is included in “total interest expense” in the consolidated statements of operations.costs. The weighted-average interest rate on the Term Loan was 2.59% for the
period the loan
was outstanding
period in 2014.
11.
13. Secured Borrowings
During the second quarter of 2016, the Company repurchased $22.3 million of near-prime loans from a single institutional investor that did not meet a non-credit, non-pricing requirement of the investor, of which $15.1 million were originally sold to the investor prior to March 31, 2016. As a result, these loans were accounted for as secured borrowings at March 31, 2016. During the second quarter of 2016, the Company resold the loans to a different investor at par. This subsequent transfer qualified for sale accounting treatment, and the loans were removed from the Company's consolidated balance sheet and the secured borrowings liability was reduced to zero in the second quarter of 2016. There were no secured borrowing liabilities as of December 31, 2016.
Initial Public Offering
(in thousands, except share and per share amounts)
In December 2014,
wethe Company closed
our initial public offering, referred to as ourits IPO of 66,700,000 shares of
its common stock,
includingwhich included shares registered to cover an option to purchase additional shares that
weit granted to the underwriters of
our initial public offeringthe IPO and selling
shareholders.stockholders. The public offering price of the shares sold in the offering was $15.00 per share.
WeThe Company did not receive any proceeds from the sales of shares by the selling stockholders. The total gross proceeds from the offering
waswere $1.0 billion. After deducting underwriting discounts and commissions, offering expenses and proceeds to the selling
shareholders,stockholders, the aggregate net proceeds
received by the Company totaled approximately $827.7 million.
Convertible Preferred Stock
As of December 31, 2013, weJanuary 1, 2014, the Company had the following shares of preferred stock authorized and outstanding as follows (in thousands, except share and per share amounts):outstanding:
|
| | | | | | | | | | | | | |
| | Designated Shares | | Issued and Outstanding Shares | | Aggregate Liquidation Preference | | Amount |
| Series A | 68,025,100 |
| | 66,100,340 |
| | $ | 17,599 |
| | $ | 17,402 |
|
| Series B | 65,642,104 |
| | 65,577,300 |
| | 12,268 |
| | 12,164 |
|
| Series C | 62,486,436 |
| | 62,486,436 |
| | 24,490 |
| | 24,388 |
|
| Series D | 36,030,712 |
| | 36,030,712 |
| | 32,044 |
| | 31,943 |
|
| Series E | 14,285,712 |
| | 10,000,000 |
| | 17,500 |
| | 17,347 |
|
| Total convertible preferred stock | 246,470,064 |
| | 240,194,788 |
| | $ | 103,901 |
| | $ | 103,244 |
|
In connection with the Springstone acquisition in April, 2014, wethe Company sold an aggregate of 6,390,556 shares of ourits Series F convertible preferred stock, par value $0.01 per share (“Financing Shares”)(Financing Shares) for aggregate gross proceeds of approximately $65.0 million, pursuant to a Series F Preferred Stock Purchase Agreement. WeThe Company sold the Financing Shares pursuant to an exemption from registration under Section 4(a)(2) of the Securities Act of 1933, as amended; all investors in the financing were accredited investors and wethe Company made
LENDINGCLUB CORPORATION
Notes to Consolidated Financial Statements
(Tabular Amounts in Thousands, Except Share and Per Share Amounts, Ratios, or as Noted)
no general solicitation for the sale of the Financing Shares. The Financing Shares
arewere convertible into shares of common stock, par value $0.01 per share, on a one-for-one basis, as adjusted from time to time pursuant to the anti-dilution provisions of
ourthe Company’s Restated Certificate of Incorporation.
In connection with the sale of Series F convertible preferred stock in April 2014,
wethe Company filed a Restated Certificate of Incorporation with the State of Delaware, which increased the total number of shares that
we wereit was authorized to issue from 606,470,064 shares to 622,614,174.
Out ofOf the 622,614,174 shares authorized, 372,000,000 shares were designated as common stock and 250,614,174 shares were designated as preferred stock.
Immediately prior to the completion of
ourthe Company’s IPO, all shares of
its outstanding convertible preferred stock automatically converted, on a one-for-one basis, into 249,601,435 shares of
ourthe Company’s common stock. All shares of authorized convertible preferred stock also automatically converted, on a one-for-one basis, into 250,614,174 authorized shares of
ourthe Company’s common stock.
On December 16, 2014,
wethe Company filed a Restated Certificate of Incorporation with the State of Delaware, which increased the total number of shares that
we wereit was authorized to issue from 622,614,174 shares to 910,000,000.
Out ofOf the 910,000,000 shares authorized, 900,000,000 shares were designated as common stock and 10,000,000 shares were designated as preferred stock.
Share Repurchases
On February 9, 2016, the board of directors approved a share repurchase program under which Lending Club may repurchase up to $150.0 million of the Company’s common shares in open market or privately negotiated transactions in compliance with Securities and Exchange Act Rule 10b-18. This repurchase plan was valid for one year and did not obligate the Company to acquire any particular amount of common stock. In the first quarter of 2016, the Company repurchased 2,282,700 shares of its common stock at a weighted average purchase price of $8.52 per share for an aggregate purchase price of $19.5 million. There were no shares repurchased during the second, third or fourth quarters of 2016.
Common Stock Reserved for Future Issuance
We have
As of December 31, 2016 and 2015, the Company had shares of common stock reserved for future issuance
at December 31, 2014 as follows:
| | | | |
Options outstanding
| | | 57,386,829 | |
Available for future stock option grants
| | | 36,561,469 | |
Available for ESPP
| | | 3,000,000 | |
| | | | |
Total reserved for future issuance
| | | 96,948,298 | |
| | | | |
12.
|
| | | | | |
| December 31, | 2016 | | 2015 |
| Options and unvested RSUs outstanding | 62,082,821 |
| | 52,652,310 |
|
| Available for future stock option and RSU grants | 28,449,336 |
| | 33,560,939 |
|
| Available for ESPP | 5,408,441 |
| | 2,589,991 |
|
| Total reserved for future issuance | 95,940,598 |
| | 88,803,240 |
|
15. Employee Incentive and Retirement Plans
The Company’s equity incentive plans provide for granting
stock options and
sharesRSUs to employees,
consultants, officers and directors. In addition, the Company offers a retirement plan and an ESPP to eligible employees.
LENDINGCLUB CORPORATION
Notes to Consolidated Financial Statements
(Tabular Amounts in Thousands, Except Share and Per Share Amounts, Ratios, or as Noted)
Stock-based compensation expense was as follows for the periods
presented (in thousands): | | | | | | | | | | | | |
| | | Year Ended
December 31,
2014 | | | Year Ended
December 31,
2013 | | | 9 Months Ended
December 31,
2012 | |
Stock options | | $ | 27,100 | | | $ | 6,283 | | | $ | 1,110 | |
ESPP | | | 104 | | | | — | | | | — | |
Stock issued related to acquisition | | | 9,946 | | | | — | | | | — | |
| | | | | | | | | | | | |
Total stock-based compensation expense | | $ | 37,150 | | | $ | 6,283 | | | $ | 1,110 | |
| | | | | | | | | | | | |
Thispresented:
|
| | | | | | | | | | | |
| Year Ended December 31, | 2016 | | 2015 | | 2014 |
| Stock options | $ | 23,203 |
| | $ | 30,717 |
| | $ | 27,100 |
|
| RSUs | 41,737 |
| | 9,185 |
| | — |
|
| ESPP | 1,686 |
| | 1,904 |
| | 104 |
|
| Stock issued related to acquisition | 2,575 |
| | 9,416 |
| | 9,946 |
|
| Total stock-based compensation expense | $ | 69,201 |
| | $ | 51,222 |
| | $ | 37,150 |
|
The following table presents the Company’s stock-based compensation expense was recorded in the consolidated statementstatements of operationsoperations:
|
| | | | | | | | | | | |
| Year Ended December 31, | 2016 | | 2015 | | 2014 |
| Sales and marketing | $ | 7,546 |
| | $ | 7,250 |
| | $ | 5,476 |
|
| Origination and servicing | 4,159 |
| | 2,735 |
| | 1,653 |
|
| Engineering and product development | 19,858 |
| | 11,335 |
| | 6,445 |
|
| Other general and administrative | 37,638 |
| | 29,902 |
| | 23,576 |
|
| Total stock-based compensation expense | $ | 69,201 |
| | $ | 51,222 |
| | $ | 37,150 |
|
The Company capitalized $9.8 million, $4.4 million and $1.9 million of stock-based compensation expense associated with developing software for internal use during the years ended December 31, 2016, 2015, and 2014, respectively.
In addition, the Company recognized $0.2 million in tax deficits and $0.7 million in tax benefits from exercised stock options and RSUs in 2016 and 2015, respectively. There was no net income tax benefit recognized relating to stock-based compensation expense and no tax benefits have been realized from exercised stock options and RSUs due to the full valuation allowance during 2014.
Stock-based compensation expense included $0.1 million, $0.3 million and $3.0 million for the accelerated vesting of stock options that were accounted for as
follows (in thousands): | | | | | | | | | | | | |
| | | Year Ended
December 31,
2014 | | | Year Ended
December 31,
2013 | | | 9 Months Ended
December 31,
2012 | |
Sales and marketing | | $ | 6,058 | | | $ | 1,313 | | | $ | 216 | |
Origination and servicing | | | 2,140 | | | | 424 | | | | 60 | |
General and administrative: | | | | | | | | | | | | |
Engineering and product development | | | 5,311 | | | | 2,171 | | | | 406 | |
Other | | | 23,641 | | | | 2,375 | | | | 428 | |
| | | | | | | | | | | | |
Total stock-based compensation expense | | $ | 37,150 | | | $ | 6,283 | | | $ | 1,110 | |
| | | | | | | | | | | | |
stock option modifications for the years ended December 31, 2016, 2015, and 2014, respectively.
In the second quarter of 2016, the board of directors or the compensation committee of the board of directors, as appropriate, approved incentive retention awards to certain members of the executive management team and other key personnel. These incentive awards consisted of an aggregate of $16.3 million of RSUs and $18.6 million of cash. These incentive retention awards will be recognized as compensation expense ratably through May 2017.
The cash retention awards were granted under the Cash Retention Plan. Under the terms of the Cash Retention Plan, employees who received an award will be eligible to earn a cash retention bonus on the terms and in the amounts specified in their respective cash retention bonus award agreement, subject to continued services and other vesting requirements set forth in such agreement. Funds associated with the remaining retention liability as of December 31, 2016, are held in a Rabbi Trust established under the Cash Retention Plan and recorded as restricted cash on the Company's consolidated balance sheets.
Equity Incentive Plans
We have
The Company has two equity incentive plans: the 2007 Stock Incentive Plan (the “2007 Plan”)(2007 Plan) and the 2014 Equity Incentive Plan (the “2014 Plan”)(2014 Plan). Upon ourthe Company’s IPO in 2014, the 2007 Plan was terminated and all shares that remained available for future issuance under the 2007 Plan at thethat time of termination were transferred to the 2014 Plan. As of December 31, 2014, 1,561,4692016, 24,672,201 options to purchase common stock granted under the 2007 Plan remain
LENDINGCLUB CORPORATION
Notes to Consolidated Financial Statements
(Tabular Amounts in Thousands, Except Share and Per Share Amounts, Ratios, or as Noted)
outstanding. As of December 31,
2014,2016, the total number of shares
availablereserved for future grants under the 2014 Plan
is 36,561,469was 28,449,336 shares, including shares transferred from the 2007 Plan.
The following table summarizes the activities for the Company’s stock options during 2016:
|
| | | | | | | | | | | | |
| | Number of Options | | Weighted- Average Exercise Price Per Share | | Weighted-Average Remaining Contractual Life (in years) | | Aggregate Intrinsic Value (1) |
| Outstanding at December 31, 2015 | 48,208,911 |
| | $ | 3.60 |
| | | | |
| Granted | 7,482,011 |
| | $ | 7.22 |
| | | | |
| Exercised | (15,102,640 | ) | | $ | 0.90 |
| | | | |
| Forfeited/Expired | (9,919,105 | ) | | $ | 6.78 |
| | | | |
| Outstanding at December 31, 2016 | 30,669,177 |
| | $ | 4.79 |
| | 6.6 | | $ | 56,379 |
|
| Vested and expected to vest at December 31, 2016 | 30,580,231 |
| | $ | 4.78 |
| | 6.6 | | $ | 56,385 |
|
| Exercisable at December 31, 2016 | 20,105,340 |
| | $ | 3.59 |
| | 5.8 | | $ | 52,886 |
|
| |
(1) | The aggregate intrinsic value is calculated as the difference between the exercise price of the underlying awards and the Company’s closing stock price of $5.25 as reported on the New York Stock Exchange on December 31, 2016. |
For the year ended December 31, 2016, the Company granted
with an exercise price per share not less than the fair value at date of grant. Options generally vest over a four year period with 25% vesting at the end of one year and the remainder vesting quarterly thereafter. Options granted are exercisable upservice-based stock options to
ten years.Until our IPO, the fair value of thepurchase 7,482,011 shares of common stock underlying stock options was established by the boardwith a weighted average exercise price of directors. Our board of directors relied upon valuations provided by third party valuation firms and other factors, including, but not limited to, the current status of the technical and commercial success of our operations, our financial condition, the stage of our product design and development, and competition to establish the$7.22 per share, a weighted average grant date fair value of our common stock at the time of grant of the option. Commencing on December 11, 2014, we use the closing stock price as listed on the NYSE on the grant date.
We use the Black-Scholes$3.61 per option pricing model to estimate theshare and an aggregate estimated fair value of $27.0 million. Stock options granted during the year ended December 31, 2016 included 265,987 shares of fully vested stock options granted within lieu of cash bonuses to be paid to certain employees for the following assumptions:
| | | | | | | | | | | | |
| | | Year Ended
December 31,
2014 | | | Year Ended
December 31,
2013 | | | 9 Months Ended
December 31,
2012 | |
Expected dividend yield | | | — | | | | — | | | | — | |
Weighted-average assumed stock price volatility | | | 53.5 | % | | | 59.1 | % | | | 63.5 | % |
Weighted-average risk-free rate | | | 1.88 | % | | | 1.46 | % | | | 1.01 | % |
Weighted-average expected life (years) | | | 6.35 | | | | 6.30 | | | | 6.28 | |
We have paid no2015 performance period. In the third quarter of 2016, a portion of these options were modified and the cash or other dividends and do not anticipate paying any cash or other dividends inbonuses were paid.
For the
foreseeable future and therefore used an expected dividend yieldyear ended December 31, 2015, the Company granted service-based stock options to purchase 1,164,929 shares of
0.0% in our option-pricing model. The stock price volatility assumption is derived using a set of peer group public companies. Since we do not have significant trading history for our common stock
the expected stockwith a weighted average exercise price
volatility for our common stock isof $20.00 per option share, a weighted average grant date fair value of $9.80 per option share and an aggregate estimated
by reference to the average historical stock price volatility for industry peers. During the second quarterfair value of
2014, the industry peer group was expanded to include small, mid and large capitalization companies in the consumer finance, investment management and technology industries taking into account the similarity in size, stage of life cycle and financial leverage. This peer group was similar to the comparable companies used in our pre-IPO common stock valuation analysis. The risk-free interest rate is based on the U.S. Treasury yield for a term consistent with the expected life of the awards in effect at the time of grant. The expected life represents the period of time that stock options are estimated to be outstanding, giving consideration to the contractual terms of the awards, vesting schedules, and expectations of future exercise patterns and post-vesting employee termination behavior. Given our limited operating history, the simplified method was applied to calculate the expected term.Options activity is summarized as follows:
| | | | | | | | | | | | | | | | |
| | | Options Outstanding | |
| | | Number of
Shares | | | Weighted-
Average
Exercise Price
Per Share | | | Weighted-Average
Remaining
Contractual Life
(in years) | | | Aggregate
Intrinsic Value
(in thousands) | |
Outstanding at December 31, 2013 | | | 43,314,728 | | | $ | 0.94 | | | | | | | | | |
Options Granted | | | 22,081,243 | | | $ | 6.74 | | | | | | | | | |
Options Exercised | | | (6,037,666 | ) | | $ | 0.59 | | | | | | | | | |
Options Forfeited/Expired | | | (1,971,476 | ) | | $ | 2.80 | | | | | | | | | |
| | | | | | | | | | | | | | | | |
Outstanding at December 31, 2014 | | | 57,386,829 | | | $ | 3.15 | | | | 8.04 | | | $ | 1,271,399 | |
| | | | | | | | | | | | | | | | |
Vested and expected to vest at December 31, 2014 | | | 54,738,680 | | | $ | 3.03 | | | | 7.98 | | | $ | 1,224,605 | |
| | | | | | | | | | | | | | | | |
Exercisable at December 31, 2014 | | | 22,355,772 | | | $ | 0.73 | | | | 6.77 | | | $ | 549,281 | |
| | | | | | | | | | | | | | | | |
$11.4 million.
For the year ended December 31, 2014,
wethe Company granted service-based stock options to purchase 22,081,243 shares of common stock with a weighted average exercise price of $6.74 per
option share, a weighted average grant date fair value of $4.62 per
option share and an aggregate estimated fair value of
approximately $102.1 million.
For the year ended December 31, 2013, we granted service-based stock options to purchase 12,707,000 shares of common stock with a weighted average exercise price of $2.44 per share, a weighted average grant date fair value of $2.71 per share and a total estimated fair value of approximately $34.4 million.
For the nine months ended December 31, 2012, we granted service-based stock options to purchase 15,244,944 shares of common stock with a weighted average exercise price of $0.60 per share, a weighted average grant date fair value of $0.35 per share and a total estimated fair value of approximately $10.6 million.
Options to purchase 6,037,666 shares with a total
The aggregate intrinsic value of
options exercised was $74.4 million, $103.5 million and $48.6 million
were exercised during the year ended December 31, 2014. Options to purchase 8,931,876 shares with a total intrinsic value of $26.2 million were exercised during the year ended December 31, 2013. Options to purchase 8,635,712 shares with a total intrinsic value of $3.8 million were exercised during the nine months ended December 31, 2012. We capitalized $1.9 million and $0.2 million of stock-based compensation expense associated with the cost of developing software for
internal use during the years ended December 31,
2016, 2015, and 2014,
and 2013, respectively.
We did not capitalize stock-based compensation expense during the nine months ended December 31, 2012. The total fair value of stock options vested
duringfor the years ended December 31,
2016, 2015, and 2014
was $32.9 million, $36.8 million and
2013 and the nine months ended December 31, 2012 was $19.6 million,
$4.5 million and $7.1 million, respectively.
For the year ended December 31, 2014, stock-based compensation expense included $3.0 million of expense for the accelerated vesting of stock options for a terminated employee that was accounted for as a stock option modification.
As of December 31,
20142016, the total unrecognized compensation cost,
net of forfeitures, related to outstanding stock options was
$114.2$40.0 million,
and these costs arewhich is expected to be recognized over the next
3.42.4 years.
No net income tax benefit has been recognized relating
LENDINGCLUB CORPORATION
Notes to stock-based compensation expenseConsolidated Financial Statements
(Tabular Amounts in Thousands, Except Share and no tax benefits have been realized from exercisedPer Share Amounts, Ratios, or as Noted)
The Company uses the Black-Scholes option pricing model to estimate the fair value of stock options duegranted with the following assumptions:
|
| | | | | | | | |
| Year Ended December 31, | 2016 | | 2015 | | 2014 |
| Expected dividend yield | — |
| | — |
| | — |
|
| Weighted-average assumed stock price volatility | 51.6 | % | | 49.4 | % | | 53.5 | % |
| Weighted-average risk-free interest rate | 1.34 | % | | 1.61 | % | | 1.88 | % |
| Weighted-average expected life (in years) | 6.15 |
| | 6.25 |
| | 6.35 |
|
Restricted Stock Units
The following table summarizes the activities for the Company’s RSUs during the year ending December 31, 2016:
|
| | | | | | |
| | Number of Units | | Weighted- Average Grant Date Fair Value |
| Unvested at December 31, 2015 | 4,443,399 |
| | $ | 15.23 |
|
| Granted | 36,539,761 |
| | $ | 6.12 |
|
| Vested | (3,891,315 | ) | | $ | 9.57 |
|
| Forfeited/expired | (5,678,201 | ) | | $ | 8.16 |
|
| Unvested at December 31, 2016 | 31,413,644 |
| | $ | 6.61 |
|
| Expected to vest after December 31, 2016 | 30,796,185 |
| | $ | 6.62 |
|
As of December 31, 2016, the Company granted 36,539,761 RSUs with an aggregate fair value of $223.5 million.
As of December 31, 2016, there was $187.2 million of unrecognized compensation cost, net of forfeitures, related to
unvested RSUs, which is expected to be recognized over the
full valuation allowance.next 3.1 years.
Employee Stock Purchase Plan
On
The Company’s ESPP became effective on December 11,
2014, our ESPP became effective.2014. The
Company's ESPP allows eligible employees to purchase shares of
ourthe Company’s common stock at a discount through payroll deductions,
of up to 15% of their eligible compensation, subject to plan limitations.
The ESPP providesPayroll deductions are accumulated during six-month offering
periods, and at the endperiods. The purchase price for each share of
each offering period, employees are able to purchase shares atcommon stock is 85% of the lower of the fair market value of
ourthe common stock on the first
tradingbusiness day of the offering period or on the last
business day of the offering period.
As of December 31, 2014, a total of 3 million
The Company's employees purchased 1,508,513 and 410,009 shares of common stock were reserved for the issuance of equity awards under the ESPP. As ofESPP during the years ended December 31, 2014, employees had2016 and 2015, respectively. The Company did not purchasedpurchase any shares under the ESPP during the year ended December 31, 2014. As of December 31, 2016, 2015, and all 3 million2014, a total of 5,408,441, 2,589,991 and 3,000,000 shares remain availablereserved for future issuance.issuance, respectively.
LENDINGCLUB CORPORATION
Notes to Consolidated Financial Statements
(Tabular Amounts in Thousands, Except Share and Per Share Amounts, Ratios, or as Noted)
The fair value of stock purchase rights granted to employees under the ESPP is measured on the grant date using the Black-Scholes option pricing model. The compensation expense related to ESPP purchase rights is recognized on a straight-line basis, net of estimated forfeitures, over the
6-month requisite service period. We
useused the following assumptions in estimating the fair value of
the grants under the ESPP which are derived using the same methodology applied to stock option assumptions:
| | | | |
Year Ended December 31,
| | 2014 | |
Expected dividend yield
| | | — | |
Weighted-average assumed stock price volatility
| | | 48.2 | % |
Weighted-average risk-free rate
| | | 0.09 | % |
Weighted-average expected life (years)
| | | 0.50 | |
The fair value
|
| | | | | | | | |
| Year Ended December 31, | 2016 | | 2015 | | 2014 |
| Expected dividend yield | — |
| | — |
| | — |
|
| Weighted-average assumed stock price volatility | 50.1 | % | | 43.7 | % | | 48.2 | % |
| Weighted-average risk-free interest rate | 0.51 | % | | 0.23 | % | | 0.09 | % |
| Weighted-average expected life (in years) | 0.50 |
| | 0.46 |
| | 0.50 |
|
For the years ended December 31, 2016, 2015, and 2014, the dates of
stock purchase rights granted to employees under the
ESPP is measured on the grant date using the Black-Scholes option pricing model. The compensation expense related to ESPP purchase rights is recognized on a straight-line basis over the requisite service period.assumptions were May 11, 2016 and November 11, 2016, June 11, 2015 and November 11, 2015, and December 11, 2014 (initial offering period), respectively.
Stock Issued Related to Acquisition
As part of the Springstone acquisition, the sellers received shares of
ourthe Company’s Series F convertible preferred stock having an aggregate value of $25.0 million
(“Share Consideration”)(Share Consideration). $22.1 million of the Share Consideration is subject to certain vesting and forfeiture conditions over a three-year period for key continuing employees. This is accounted for as a compensation agreement and expensed over the three-year vesting period. In conjunction with the conversion of preferred stock upon
the IPO, these
unvested preferred shares were
also converted into
unvested common
shares as the unvested common shares vest over time, stock-based compensation expense and accretion to additional paid-in capital are recorded.shares.
Upon completing 90 days of service, employees may participate in ourthe Company’s qualified retirement plan that is governed by section 401(k) of the IRS Code. Participants may elect to contribute a portion of their annual compensation up to the maximum limit allowed by federal tax law. In the secondfirst quarter of 2014, we2016, the Company approved an employer match of up to 4% of an employee’s eligible compensation with a maximum annual match of $5,000 per employee. Prior to 2016, the Company approved an employer match of up to 3% of an employee’s eligible compensation with a maximum annual match of $5,000 per employee. The total expense for the employer match for the yearyears ended December 31, 2016, 2015, and 2014 was $3.9 million, $2.1 million and $0.9 million.13. Income Taxes
Formillion, respectively.
LENDINGCLUB CORPORATION
Notes to Consolidated Financial Statements
(Tabular Amounts in Thousands, Except Share and Per Share Amounts, Ratios, or as Noted)
One-Time Severance Costs
On June 22, 2016, the Board of the Company approved a plan to reduce the number of employees, which includes payment of severance benefits to certain employees whose positions were affected. The plan authorized the reduction of up to 179 positions, or approximately 12% of the Company's workforce. The purpose of the action was to reduce costs, streamline operations and more closely align staffing with anticipated loan volumes. As a result, the Company recorded and paid $2.7 million in severance costs during 2016 related to this reduction in employees, which were predominately comprised of cash severance. No such reduction plans were implemented during the years ended December 31, 2015 or 2014. The following table presents this severance expense recorded in the consolidated statements of operations for the year ended December 31, 2014, we recorded $1.4 million of income tax expense. The $1.4 million of2016:
|
| | | | |
| | | Year Ended December 31, 2016 |
| Sales and marketing | | $ | 772 |
|
| Origination and servicing | | 1,174 |
|
| Engineering and product development | | 134 |
|
| Other general and administrative | | 650 |
|
| Total severance expense | | $ | 2,730 |
|
16. Income Taxes
Loss before income tax expense relateswas $(150.2) million, $(2.2) million and $(31.5) million for the years ended December 31, 2016, 2015 and 2014, respectively. Income tax (benefit) expense consisted of the following for the periods shown below:
|
| | | | | | | | | | | |
| Year Ended December 31, | 2016 | | 2015 | | 2014 |
| Current: | | | | | |
| Federal | $ | (515 | ) | | $ | — |
| | $ | — |
|
| State | (267 | ) | | 720 |
| | 56 |
|
| Total current tax (benefit) expense | $ | (782 | ) | | $ | 720 |
| | $ | 56 |
|
| | | | | | |
| Deferred: | | | | | |
| Federal | $ | (2,589 | ) | | $ | 1,405 |
| | $ | 1,185 |
|
| State | (857 | ) | | 708 |
| | 149 |
|
| Total deferred tax (benefit) expense | $ | (3,446 | ) | | $ | 2,113 |
| | $ | 1,334 |
|
| Income tax (benefit) expense | $ | (4,228 | ) | | $ | 2,833 |
| | $ | 1,390 |
|
Income tax benefit for the year ended December 31, 2016 was primarily attributable to the tax effects of the impairment of tax-deductible goodwill from the acquisition of Springstone, which previously gave rise to an indefinite-lived deferred tax liability, and the tax effects of unrealized gains credited to other comprehensive income associated with the Company's available for sale portfolio. Income tax expense for the year ended December 31, 2015, was primarily attributable to the amortization of tax deductible goodwill from the acquisition of Springstone, which
givesgave rise to an indefinite-lived deferred tax
liability. There was no incomeliability, and the realization of excess tax
benefit recorded on the pre-tax loss duebenefits related to
an increase in deferred tax asset valuation allowance.stock-based compensation. For the year ended December 31, 2013, we recorded no2014, income tax expense was primarily related to the amortization of tax deductible goodwill from the acquisition of Springstone.
LENDINGCLUB CORPORATION
Notes to Consolidated Financial Statements
(Tabular Amounts in Thousands, Except Share and Per Share Amounts, Ratios, or as Noted)
A reconciliation of the income taxes
related to pre-tax income due to the availability of deferred tax assets subject to a full valuation allowance to offset current year income. For the nine months ended December 31, 2012, we recorded no benefit for income taxes on the taxable losses due to the full valuation allowance.Our effective tax rate differs fromexpected at the statutory federal income tax rate and the income tax (benefit) expense for the years ended December 31, 2016, 2015 and 2014, and 2013 and the nine months ended December 31, 2012,is as follows (in thousands):
| | | | | | | | | | | | | | | | | | | | | | | | |
| | | Year Ended
December 31,
2014 | | | Year Ended
December 31,
2013 | | | 9 Months Ended
December 31,
2012 | |
Income (loss) before income taxes | | $ | (31,504 | ) | | | | | | $ | 7,308 | | | | | | | $ | (4,238 | ) | | | | |
Tax at federal statutory rate | | $ | (10,711 | ) | | | 34.00 | % | | $ | 2,485 | | | | 34.00 | % | | $ | (1,441 | ) | | | 34.00 | % |
State tax, net of federal tax benefit | | | 98 | | | | (0.31 | %) | | | 563 | | | | 7.70 | % | | | (151 | ) | | | 3.56 | % |
Stock-based compensation expense | | | 5,040 | | | | (16.00 | %) | | | (593 | ) | | | (8.11 | %) | | | (314 | ) | | | 7.41 | % |
Tax credits | | | — | | | | 0.00 | % | | | (459 | ) | | | (6.28 | %) | | | — | | | | 0.00 | % |
Change in valuation allowance | | | 6,858 | | | | (21.77 | %) | | | (2,534 | ) | | | (34.67 | %) | | | 1,934 | | | | (45.63 | %) |
Change in unrecognized tax benefit | | | — | | | | 0.00 | % | | | 518 | | | | 7.09 | % | | | 150 | | | | (3.54 | %) |
Other | | | 105 | | | | (0.33 | %) | | | 20 | | | | 0.27 | % | | | (178 | ) | | | 4.20 | % |
| | | | | | | | | | | | | | | | | | | | | | | | |
Income tax expense | | $ | 1,390 | | | | (4.41 | %) | | $ | — | | | | 0.00 | % | | $ | — | | | | 0.00 | % |
| | | | | | | | | | | | | | | | | | | | | | | | |
follows:
|
| | | | | | | | | | | |
| Year Ended December 31, | 2016 | | 2015 | | 2014 |
| Tax at federal statutory rate | $ | (51,072 | ) | | $ | (738 | ) | | $ | (10,711 | ) |
| State tax, net of federal tax benefit | (1,028 | ) | | 1,277 |
| | 98 |
|
| Stock-based compensation expense | 3,509 |
| | 549 |
| | 5,040 |
|
| Research and development tax credits | (688 | ) | | (1,068 | ) | | — |
|
| Change in valuation allowance | 42,714 |
| | 2,686 |
| | 6,858 |
|
| Change in unrecognized tax benefit | 2,817 |
| | (62 | ) | | — |
|
| Other | (480 | ) | | 189 |
| | 105 |
|
| Income tax (benefit) expense | $ | (4,228 | ) | | $ | 2,833 |
| | $ | 1,390 |
|
The significant components of ourthe Company’s deferred tax assets and liabilities atas of December 31, 20142016 and 20132015 were:
|
| | | | | | | |
| December 31, | 2016 | | 2015 |
| Deferred tax assets: | | | |
| Net operating loss carryforwards | $ | 47,451 |
| | $ | 5,621 |
|
| Stock-based compensation | 26,838 |
| | 19,696 |
|
| Reserves and accruals | 18,409 |
| | 11,506 |
|
| Goodwill | 9,855 |
| | — |
|
| Intangible assets | 3,978 |
| | 2,693 |
|
| Tax credit carryforwards | 2,483 |
| | 1,810 |
|
| Other | 82 |
| | 697 |
|
| Total deferred tax assets | 109,096 |
| | 42,023 |
|
| Valuation allowance | (75,308 | ) | | (25,348 | ) |
| Deferred tax assets – net of valuation allowance | $ | 33,788 |
| | $ | 16,675 |
|
| | | | |
| Deferred tax liabilities: | | | |
| Internally developed software | $ | (21,436 | ) | | $ | (11,353 | ) |
| Servicing fees | (6,445 | ) | | (1,516 | ) |
| Depreciation and amortization | (5,907 | ) | | (4,089 | ) |
| Goodwill | — |
| | (3,163 | ) |
| Total deferred tax liabilities | $ | (33,788 | ) | | $ | (20,121 | ) |
| Deferred tax (liability) asset – net | $ | — |
| | $ | (3,446 | ) |
The table of deferred tax assets and liabilities does not include certain deferred tax assets as of December 31, 2016 and 2015, related to tax deductions for equity-based compensation greater than the compensation recognized for financial reporting excess tax benefits. Stockholders’ equity is estimated to increase by approximately $58.5 million, if and when such deferred tax assets are
as follows (in thousands): | | | | | | | | |
December 31, | | 2014 | | | 2013 | |
Deferred tax assets | | | | | | | | |
Net operating loss carry-forwards | | $ | 27,550 | | | $ | 18,818 | |
Stock-based compensation | | | 8,491 | | | | 890 | |
Reserves and accruals | | | 6,249 | | | | 1,914 | |
Servicing fees | | | 1,428 | | | | — | |
Intangibles | | | 1,161 | | | | — | |
State credits | | | 552 | | | | 216 | |
Organizational and start-up costs | | | 10 | | | | 516 | |
| | | | | | | | |
Total deferred tax assets | | | 45,441 | | | | 22,354 | |
Valuation Allowance | | | (40,828 | ) | | | (22,338 | ) |
| | | | | | | | |
Deferred tax assets - net of valuation allowance | | | 4,613 | | | | 16 | |
| | | | | | | | |
Deferred tax liability | | | | | | | | |
Depreciation and amortization | | | (4,765 | ) | | | (16 | ) |
Goodwill | | | (1,180 | ) | | | — | |
| | | | | | | | |
Total deferred tax liabilities | | | (5,945 | ) | | | (16 | ) |
| | | | | | | | |
Deferred tax liability - net | | $ | (1,332 | ) | | $ | — | |
| | | | | | | | |
Our management assessesultimately realized. The “with-and-without” approach, excluding the measurement of any indirect effects, is used when determining when excess tax benefits have been realized.
The Company continues to recognize a full valuation allowance against net deferred tax assets, excluding the deferred tax liability for indefinite-lived intangibles. This determination was based on the assessment of the available positive and negative evidence to estimate if sufficient future taxable income will be generated to utilize
LENDINGCLUB CORPORATION
Notes to Consolidated Financial Statements
(Tabular Amounts in Thousands, Except Share and Per Share Amounts, Ratios, or as Noted)
the existing deferred tax assets.
On the basis of this evaluation, asAs of December 31,
2014, a full2016 and 2015, the valuation allowance
of $40.8was $75.3 million
has been recorded to recognize only deferred tax assets that are more likely than not to be realized.Atand $25.3 million, respectively.
As of December 31,
2014, we2016, the Company had federal and state net operating loss
(“NOL”) carry forwards(NOL) carryforwards of approximately
$68.7$260.3 million and
$61.5$178.0 million, respectively, to offset future taxable income.
OurThe federal and state
net operating loss carry-forwardsNOL carryforwards will
begin expiringexpire beginning in
20272025 and
2016,2028, respectively. Additionally,
atas of December 31,
2014, we2016, the Company had federal and state
research and development (“R&D”) tax credit
carry forwardscarryforwards of
approximately $0.3$1.1 million and
$0.2$3.0 million, respectively. The federal
tax credit
carry forwardscarryforwards will
begin expiringexpire beginning in
20172025 and the state
tax credits
may be carried forward indefinitely.will expire beginning in 2020.
In general, a corporation’s ability to utilize its NOL and
R&D carry-forwardsresearch and development carryforwards may be substantially limited due to
the ownership
changes that may have occurred or that could occur in the future,change limitations as required by Section 382
and 383 of the Internal Revenue Code of 1986, as amended
(“Code”)(Code), as well as similar state provisions.
These ownership changesThe federal and state Section 382 and 383 limitations may limit the
amountuse of
a portion of the Company’s domestic NOL and
R&Dtax credit
carry-forwards that can be utilized annuallycarryforwards. Further, a portion of the carryforwards may expire before being applied to
offsetreduce future
taxable income
and tax
respectively.The following is aliabilities.
A reconciliation of
ourthe beginning and ending balance of total unrecognized tax benefits
(in thousands): | | | | | | | | | | | | |
| | | Year Ended
December 31,
2014 | | | Year Ended
December 31,
2013 | | | 9 Months Ended
December 31,
2012 | |
Balance at the beginning of the period | | $ | 1,080 | | | $ | 367 | | | $ | 240 | |
Additions (reductions) for tax positions related to the prior year | | | (589 | ) | | | 523 | | | | — | |
Additions for tax positions related to the current year | | | — | | | | 190 | | | | 127 | |
| | | | | | | | | | | | |
Balance at the end of the period | | $ | 491 | | | $ | 1,080 | | | $ | 367 | |
| | | | | | | | | | | | |
for the years ended December 31, 2016, 2015 and 2014, is as follows:
|
| | | | | | | | | | | |
| Year Ended December 31, | 2016 | | 2015 | | 2014 |
| Beginning balance | $ | 429 |
| | $ | 491 |
| | $ | 1,080 |
|
| Gross increase (decrease) for tax positions related to prior years | 677 |
| | (310 | ) | | (589 | ) |
| Gross increase for tax positions related to the current year | 2,140 |
| | 248 |
| | — |
|
| Ending balance | $ | 3,246 |
| | $ | 429 |
| | $ | 491 |
|
If the
cumulative unrecognized tax benefit
as of December 31, 2016 is recognized, there will be no effect on
ourthe Company’s effective tax rate
due toas the
tax benefit would increase a deferred tax asset, which is currently offset with a full valuation allowance.
DueThe Company recognizes interest and penalties related to
the nature of the unrecognized tax benefits
and the existence ofwithin income tax
attributes, we have not accrued any interest or penalties associated with unrecognized tax benefits in the consolidated statement of operations nor have we recognized a liability in the consolidated balance sheet. We do not believe the total amount of unrecognized benefit asexpense. As of December 31,
2014, will increase2016, the Company had no accrued interest and penalties related to unrecognized tax benefits. The Company does not expect any significant increases or
decrease significantly indecreases to its unrecognized benefits within the next twelve months.
We file
The Company files income tax returns in the United States and various state jurisdictions. As of December 31,
2014, our2016, the Company’s federal tax returns for
20102012 and earlier, and
ourthe state tax returns for
20092011 and earlier were no longer subject to examination by the taxing authorities. However,
our tax
attribute carry-forwards fromperiods closed
tax yearsin a prior period may be subject to
examination to the extentaudit and re-examination by tax authorities for which tax carryforwards are utilized in
an open tax year.14.subsequent years.
17. Commitments and Contingencies
Operating Lease Commitments
Our
The Company’s corporate headquarters isare located in San Francisco, California, and consistsconsist of approximately 141,000169,000 square feet of space under lease agreements, that mostlythe longest of which is expected to expire in June 2022. Under these lease agreements, we havethe Company has an option to extend nearly all of the space under the leases for five years. We have
In April 2015, the Company entered into a lease agreement for approximately 112,000 square feet of additional office space in San Francisco, California. The lease agreement commenced in the second quarter of 2015 with delivery of portions of the leased space to occur in stages through March 2017. The lease agreement expires in March 2026, with the right to renew the lease term for two consecutive renewal terms of five years each.
LENDINGCLUB CORPORATION
Notes to Consolidated Financial Statements
(Tabular Amounts in Thousands, Except Share and Per Share Amounts, Ratios, or as Noted)
The Company has additional leased office space of approximately
20,00026,000 square feet in Westborough, Massachusetts, under a lease agreement that expires in
January 2020.July 2021.
Total facilities rental expense for the years ended December 31, 2016, 2015 and 2014 was $14.2 million, $7.4 million and 2013 and the nine month period ended December 31, 2012 was $3.7 million, $1.9 million and $0.6 million, respectively. SubleaseThe Company had no sublease rental expenseincome for the years ended December 31, 2013 and the nine month period ended December 31, 2012 was $0.6 million and $0.5 million, respectively. We did not have sublease rental expense for the year ended December 31,2016, 2015, or 2014. Minimum rental expenselease payments for the years ended December 31, 2016, 2015 and 2014 were $11.9 million, $6.0 million and 2013 and the nine month period ended$3.3 million, respectively.
As of December 31, 2012 was $3.32016, the Company pledged $0.8 million $1.3of cash and $4.7 million and $0.1 million, respectively. As partin letters of thesecredit as security deposits in connection with its lease agreements,agreements.
The Company’s future minimum payments under non-cancelable operating leases in excess of one year as of December 31, 2014 we have pledged $0.62016 were as follows:
|
| | | |
| Years Ended December 31, | |
| 2017 | $ | 15,092 |
|
| 2018 | 16,053 |
|
| 2019 | 15,621 |
|
| 2020 | 16,523 |
|
| 2021 | 16,778 |
|
| Thereafter | 40,423 |
|
| Total | $ | 120,490 |
|
Loan Purchase Obligation
Under the Company’s loan account program with WebBank, a Utah-chartered industrial bank that serves as the Company’s primary issuing bank, WebBank retains ownership of the loans facilitated through Lending Club’s marketplace for two business days after origination. As part of this arrangement, the Company has committed to purchase the loans at par plus accrued interest, at the conclusion of the two business days. As of December 31, 2016 and 2015, the Company was committed to purchase loans with an outstanding principal balance of $32.2 million and $77.6 million, respectively, at par plus accrued interest.
Loan Repurchase Obligations
The Company has historically limited its loan or note repurchase obligations to events of cashverified identity theft or in connection with certain customer accommodations. As institutional investors seek to securitize loans purchased through the marketplace, the Company has increased the circumstances and arrangedthe required burden of proof of economic harm under which the Company is obligated to repurchase loans from these investors. The Company believes these repurchase obligations are customary and consistent with institutional loan and securitization market standards.
In addition to and distinct from the repurchase obligations described in the preceding paragraph, the Company performs certain administrative functions for a
$0.2 million lettervariety of
creditretail and institutional investors, including executing, without discretion, loan investments as
security deposits.At December 31, 2014,directed by the future minimum lease payments payable underinvestor. To the contracts for leased premises is as follows:
| | | | |
Years Ended December 31, | | | |
2015 | | $ | 5,277 | |
2016 | | | 6,679 | |
2017 | | | 6,985 | |
2018 | | | 7,282 | |
2019 | | | 6,585 | |
Thereafter | | | 15,864 | |
| | | | |
Total | | $ | 48,672 | |
| | | | |
Loan Funding Commitments
Forextent loans listed ondo not meet the platforminvestor's investment criteria at the time of issuance, or are transferred to the investor as a result of a system error by the Company, the Company is obligated to repurchase such loans at par. As a result of these obligations, the Company repurchased $46.7 million and $37.0 million in loans during 2016 and 2015, respectively.
LENDINGCLUB CORPORATION
Notes to Consolidated Financial Statements
(Tabular Amounts in Thousands, Except Share and Per Share Amounts, Ratios, or as Noted)
Loan Funding and Purchase Commitments
During 2016, the Company purchased a total of $138.2 million in loans to fulfill regulatory requirements and to support short-term marketplace equilibrium as discussed below.
As required by applicable regulations, the Company is required to purchase loans resulting from direct marketing efforts
we have committed to invest inif such loans
ifare not otherwise invested in by investors
do not provide funding for all or a portionon the platform. During 2016, the Company purchased $35.5 million of such loans.
AtAdditionally, loans in the process of being facilitated and originated by the Company’s issuing bank partner at December 31,
2014, there2016, were
1,061 suchfunded in January 2017. No loans
onremained without investor commitments and the
platform with an unfunded balance of $10.3 million. All of these loans were fully funded by investors by January 7, 2015.In connection with transitional activities related to the acquisition of Springstone, in June 2014, we entered into a contingent loan purchase agreement through December 31, 2014 with an issuing bank that originates loans facilitated by Springstone and a third-party investor that has agreed to purchase certain of these loans from such bank. In January 2015, this purchase agreementCompany was extended to April 2, 2015. The contingent loan purchase commitment provides that we will purchase such loans from the bank if the third-party investor defaults on its loan purchase obligations to the bank through April 2, 2015. The contingent loan purchase commitment limits the aggregate amount of covered loan originations to a maximum of $16.0 million. As of December 31, 2014, the amount remaining under the overall limit on the cumulative amount of such loan originations was $10.6 million. We were not required to purchase any suchof these loans.
Following the events of May 9, 2016, the Company opted to use its own capital to support short-term marketplace equilibrium and purchased $102.7 million in loans pursuant to the contingent loan purchase commitment for the year endedduring 2016.
As of December 31,
2014.2016, the Company held $27.9 million of loans on its balance sheet, of which $9.0 million were classified as loans held for sale.
In addition, if neither Springstone nor the Company can arrange for other investors to invest in or purchase loans that Springstone facilitates and that are originated by an issuing bank partner but do not meet the credit criteria for purchase by the issuing bank partner (Pool B loans), Springstone and the Company are contractually committed to purchase these loans. The Company has deposited $9.0 million into an account at the bank to secure potential, future purchases of these loans, if any, which is recorded as restricted cash on the Company's consolidated balance sheets.
To mitigate this commitment, the Company and the issuing bank have entered into purchase agreements with three investors to purchase Pool B loans or participation interests in Pool B loans. The Company was required to purchase approximately $1.0 million of Pool B loans under these agreements. These loans are held on the Company's balance sheet and have a remaining principal balance of $0.9 million as of December 31, 2016.
Credit Support
AgreementWe areAgreements
In connection with a significant platform purchase agreement, the Company is subject to a credit support agreement with a certificatethird-party whole loan investor that requires the Company to reimburse the investor for credit losses in excess of a specified percentage of the original principal balance of whole loans acquired by the investor during a 12-month period. As of December 31, 2016, the Company has accrued approximately $2.5 million for reimbursement to the investor.
The Company is also subject to a credit support agreement with Cirrix Capital (Investment Fund). The credit support agreement requires usthe Company to pledge and restrict cash in support of its contingent obligation to reimburse the investorInvestment Fund for net credit losses on loans underlying the investor’s certificateInvestment Fund's certificates that are in excess of a specified, aggregate net loss threshold. We are contingently obligated to pledge cash, not to exceed $5.0 million, to support this contingent obligation. As of December 31, 2014 and 2013, approximately2016, $3.4 millionwas pledged and restricted to support this contingent obligation. The Company's maximum exposure to loss under this credit support agreement was limited to $6.0 million and $34.4 million at December 31, 2016 and 2015, respectively.
As of December 31,
20142016 and
2013,2015, the
net credit losses pertaining to the
investor’s certificateInvestment Fund's certificates have not exceeded the specified threshold, nor are future
net credit losses expected to exceed the specified threshold, and thus no
expense or liability has been recorded.
WeThe Company currently
dodoes not anticipate recording losses
resulting from our contingent obligation under this credit support agreement. If losses related to the credit support agreement are later determined to be likely to occur and are estimable, results of operations could be affected in the period in which such losses are recorded.
Loan Purchase Obligation
LENDINGCLUB CORPORATION
Notes to Consolidated Financial Statements
(Tabular Amounts in Thousands, Except Share and Per Share Amounts, Ratios, or as Noted)
Legal
Securities Class Actions.During the year ended December 31, 2016, five putative class action lawsuits alleging violations of federal securities laws were filed in California Superior Court, naming as defendants the Company, current and former directors, certain officers, and the underwriters in the December 2014 initial public offering (the IPO). All of these actions were consolidated into a single action (Consolidated State Court Action), entitled In re LendingClub Corporation Shareholder Litigation, No. CIV537300. In August 2016, plaintiffs filed an amended complaint alleging violations of Sections 11, 12(a)(2) and 15 of the Securities Act of 1933 (Securities Act) based on allegedly false and misleading statements in the IPO registration statement and prospectus. The Company filed a demurrer requesting the Court dismiss certain of the claims alleged in the amended complaint, which was granted in part in the fourth quarter of 2014, our loan account program agreement with our primary issuing bank, WebBank,2016. The plaintiffs thereafter filed a Utah-chartered industrial bankSecond Amended Consolidated Complaint which the Company thereafter filed a new demurrer seeking to dismiss certain claims. The hearing on this demurrer will be in the first quarter of 2017. In the interim the parties have begun discovery. The Company believes that handles a varietythe plaintiffs’ allegations are without merit, and intends to vigorously defend against the claims.
In May 2016, two related putative securities class actions (entitled Evellard v. LendingClub Corporation, et al., No. 16-CV-2627-WHA, and Wertz v. LendingClub Corporation, et al., No. 16-CV-2670-WHA) were filed in the United States District Court for the Northern District of consumerCalifornia, naming as defendants the Company and commercial financing programs, was modified such that WebBank retains ownershipcertain of the loans facilitated through our marketplace for two business days before selling the loans to us. WebBank earns interest related to such loans duringits officers and directors. In mid-August 2016, the two business days it ownsactions were consolidated into a single action. The Company moved to dismiss the loans. As part of this agreement, we have committed to purchase these loans that are originated by WebBank and facilitated through our marketplace. As of December 31, 2014 we were committed to purchase loans with an outstanding principal balance of $4.1 million at par plus accrued interest. There was no such commitment as of December 31, 2013.Legal
On June 5, 2014, Springstone received a Civil Investigative Demand from the Consumer Financial Protection Bureau, referred to as CFPB, related to the period from 2009 through May 2014. The purpose of the investigation is to determine whether Springstone engagedamended complaint filed in unlawful acts or practices in connection with the marketing, issuance, and servicing of loans for healthcare related financing during the period. As of December 31, 2014, we had provided all of the documents requested by the CFPB. We are continuing to evaluate this matter.
During the second quarter of 2014, we also received notice from the California Employment Development Department, referred to as EDD, that it had commenced an examination of our records concerning the employment relationship of certain individuals who performed services for us from 2011 through 2014. Based on the EDD’s determination, certain of these individuals should have been classified as employees with appropriate tax withholding and employer related taxes incurred and paid. The EDD has completed its examination and issued a Final Notice of Assessment, which serves as the EDD’s official notice of its determination relating to this matter. During the fourth quarter of 2014, we paid2016. The Court is expected to hear this motion in the full assessmentfirst quarter of 2017. The Company believes that the plaintiffs’ allegations are without merit, and intends to vigorously defend against the claims.
Derivative Lawsuits. In May 2016 and August 2016, respectively, two putative shareholder derivative actions were filed (Avila v. Laplanche, et al., No. CIV538758 and Dua v. Laplanche, et al., CGC-16-553731) against certain of the Company’s current and former officers and directors and naming the Company as a nominal defendant. Both actions were voluntarily dismissed without prejudice. On December 14, 2016, a new putative shareholder derivative action was filed in the Delaware Court of Chancery (Steinberg, et al. v. Morris, et al., C.A. No. 12984-CB), against certain of the Company's current and former officers and directors and naming the Company as a nominal defendant. The action is based on allegations similar to those in the securities class action litigation described above.
Federal Consumer Class Action. In April 2016, a putative class action lawsuit was filed in federal court in New York, alleging that persons received loans, through the Company's platform, that exceeded states' usury limits in violation of state usury and consumer protection laws, and the federal RICO statute. The Company has filed a motion to compel arbitration on an individual basis, which was granted in February 2017. The Company believes that the plaintiff's allegations are without merit, and intends to defend this matter vigorously.
On February 23, 2016, Phoenix Licensing, L.L.C. and LPL Licensing, L.L.C. filed a complaint for patent infringement against the Company in the U.S. District Court for the Eastern District of Texas. The complaint alleges infringement of U.S. Patent Nos. 8,234,184, 6,999,938, 5,987,434, 8,352,317, and 7,860,744 by generating customized marketing materials, replies, and offers to client responses. Although the Company is confident in its position, and is prepared to continue to defend this matter vigorously, the parties have reached a tentative settlement through mediation in the first quarter of 2017.
On May 9, 2016, following the announcement of the board review described elsewhere in this filing, the Company received a grand jury subpoena from the U.S. Department of Justice (DOJ). The Company was also contacted by the SEC and Federal Trade Commission (FTC).The Company continues cooperating with the DOJ, SEC, FTC and any other governmental or regulatory authorities or agencies. No assurance can be given as to the EDD.In the fourth quartertiming or outcome of 2014, we settled a dispute with a former consultant for cashthese matters.
LENDINGCLUB CORPORATION
Notes to Consolidated Financial Statements
(Tabular Amounts in Thousands, Except Share and
shares of our common stock valued at market price on date of settlement.Per Share Amounts, Ratios, or as Noted)
In addition to the foregoing,
wethe Company is subject to, and may
continue to be subject to legal proceedings and regulatory actions in the ordinary course of
business. We do not believe it is probable thatbusiness, including inquiries by state regulatory bodies related to the
ultimate liability, if any, arising outCompany's marketplace lending model. These include inquiries from the California Department of
any such matter will have a material effect on our financial condition, resultsBusiness Oversight, Massachusetts Securities Division, New York Department of
operationsFinancial Services, and West Virginia Attorney General's office. No assurance can be given as to the timing or
cash flows.15.outcome of these matters.
18. Segment Reporting
We report segment information using the “management approach.” Under this approach,
The Company defines operating segments are identified in substantiallyto be components of the same manner as they are reported internally and usedCompany for which discrete financial information is evaluated regularly by us forthe Company’s chief operating decision maker (CODM). For purposes of allocating resources and evaluating financial performance, the Company’s CODM reviews financial information by the product types of personal loans, education and allocating resources. Based on this approach, we havepatient finance loans. These product types are aggregated and viewed as one operating segment, and therefore, one reportable segment. Our management reportingsegment due to their similar economic characteristics, product economics, production process, and regulatory environment.
Substantially all of the Company’s revenue is based on our internal operating structure, which isgenerated in the United States. No individual borrower or investor accounted for 10% or more of consolidated net revenue for any of the periods presented.
19. Related Party Transactions
Related party transactions must be reviewed and approved by the Audit Committee of the Company’s Board when not conducted in the ordinary course of business subject to
changethe standard terms of the Company’s online marketplace or certificate investment program. Related party transactions may include any transaction between entities under common control or with a related person occurring since the beginning of the Company’s latest fiscal year, or any currently proposed transaction. This review also includes any material amendment or modification to an existing related party transaction. The Company has defined related persons as members of the Board, executive officers, principal owners of the Company’s outstanding stock and
is not necessarily similar to thatany immediate family members of
each such related persons, as well as any other
comparable companies.16. Related Party Transactions
person or entity with significant influence over the Company’s management or operations.
Several of ourthe Company’s executive officers and directors (including immediate family members) have opened investor accounts with LC, made deposits and withdrawals to their investor accounts and purchased loans, notes and certificates. All note and certificate purchases madecertificates or have investments in private funds managed by LCA. The Company believes all such transactions by related partiespersons were made in the ordinary course of business and were transacted on terms and conditions that were not more favorable than those obtained by similarly situated third-party investors.
At December 31, 2015, Mr. Laplanche, the Company's former CEO and Chairman, and a board member owned approximately 2.0% and 10%, respectively, of limited partnership interests in the Investment Fund, a holding company that participates in a family of funds with other
investors.The deposits made by relatedunrelated third parties whose transactions totaled $120,000 or more wereand purchases whole loans and interests in loans from the Company.
During 2016, this family of funds purchased $256.7 million of whole loans and interests in whole loans. During 2016, the Company earned $1.7 million $2.3in servicing fees and $81 thousand in management fees from this family of funds, and paid interest received from the borrowers of the underlying loans of $8.6 million to the family of funds. The Company believes that the sales of whole loans and $1.2interests in whole loans, and the servicing and management fees charged were on terms and conditions that were not more favorable than those obtained by other third-party investors.
On April 1, 2016, the Company closed its $10.0 million investment, for an approximate ownership interest of 15% in the years endedInvestment Fund. At the time the Company made its investment, the Company's Related Party Investors also had limited partnership interests in the Investment Fund. As of June 30, 2016, the end of the period in which the
LENDINGCLUB CORPORATION
Notes to Consolidated Financial Statements
(Tabular Amounts in Thousands, Except Share and Per Share Amounts, Ratios, or as Noted)
Company's former CEO resigned, the Related Party Investors and the Company had an aggregate ownership of approximately 29% in the Investment Fund. As of December 31,
20142016, the Company and
December 31, 2013 anda board member had an aggregate ownership interest of approximately 27% in the
nine months ended December 31, 2012, respectively. The withdrawals made by related parties whose transactions totaled $120,000 or more were $0.1 million, $1.2 million, and $0.6 million for the years ended December 31, 2014 and December 31, 2013 and the nine months ended December 31, 2012, respectively.17.Investment Fund.
20. Springstone Acquisition
On April 17, 2014,
weLending Club acquired all of the outstanding limited liability company interests of Springstone (Acquisition) for $111.8 million, which was comprised of $109.0 million in cash and shares of Series F convertible preferred stock with an aggregate value of $2.8 million. Upon closing of the Acquisition, Springstone became
ourLending Club’s wholly owned subsidiary.
We haveThe Company has included the financial results of Springstone in the consolidated financial statements from the date of acquisition.
To secure the retention of certain key employees,
The purchase agreement included a total of $25.6 million comprised of $22.1 million of shares of Series F convertible preferred stock
(“Escrow Shares”)(Escrow Shares) and $3.5 million of cash
that were placed in a third-party escrow, and are subject to certain vesting and forfeiture conditions applicable to these employees continuing employment over a three-year period from the closing. These amounts are accounted for as a compensation arrangement and expensed over the three-year vesting period and are included under
“General“Other general and
administrativeadministrative” operating
expenses”expenses in the Consolidated
StatementStatements of Operations. Additionally, $19.0 million of the cash consideration and certain Escrow Shares were placed in a third-party escrow for 15 months from the closing date to secure, in part, the indemnification obligations of the sellers under the purchase agreement. In connection with the Acquisition,
wethe Company also paid $2.4 million for transactions costs incurred by Springstone.
The cash portion of the consideration was funded by a combination of cash from us, Series F convertible preferred stock financing, and proceeds from the Term Loan.
We have completed the
The allocation of
the purchase price
to acquired assets and liabilities with the exception of finalizing the determination of certain contingent liabilities and the finalization of any deferred tax asset or liability as of the acquisition date. The preliminary purchase price allocation as of the acquisition date is as
follows (in thousands):follows:
|
| | | |
| | Fair Value |
| Assets: | |
| Cash | $ | 2,256 |
|
| Restricted cash | 1,581 |
|
| Property, equipment and software | 366 |
|
| Other assets | 599 |
|
| Identified intangible assets | 40,200 |
|
| Goodwill | 72,592 |
|
| Liabilities: | |
| Accounts payable | 239 |
|
| Accrued expenses and other liabilities | 5,536 |
|
| Total purchase consideration | $ | 111,819 |
|
The goodwill balance is primarily attributed to expected operational synergies, the combined workforce, and the future development initiatives of the combined workforce. Goodwill is expected to be deductible for U.S. income tax purposes.
The amounts of net revenue of Springstone included in ourthe Company’s consolidated statementstatements of operations from the acquisition date of April 17, 2014 to December 31, 2014 was $15.3 million. We haveThe Company recognized acquisition-related expenses of $2.3 million for the year ended December 31, 2014, which is included in other general and administrative expense. We did not recognize acquisition-related costs for the year ended December 31, 2013
LENDINGCLUB CORPORATION
Notes to Consolidated Financial Statements
(Tabular Amounts in Thousands, Except Share and Per Share Amounts, Ratios, or
the nine months ended December 31, 2012.as Noted)
The following pro forma financial information summarizes the combined results of operations for
usLending Club and Springstone, as though the companies were combined as of January 1, 2013. These pro forma results have been prepared for comparative purposes only and do not purport to be indicative of the results of operations which would have resulted had the acquisition occurred as of January 1, 2013, nor is it indicative of future operating results. The pro forma results presented below include interest expense on the debt financing, amortization of acquired intangible assets, compensation expense related to the post-acquisition compensation arrangements entered into with the continuing employees and tax
expense (in thousands, except per share data): | | | | | | | | |
Years Ended December 31, | | 2014 | | | 2013 | |
Total net revenue | | $ | 219,174 | | | $ | 113,040 | |
Net loss(1) | | $ | (33,796 | ) | | $ | (17,592 | ) |
Basic net loss per share attributable to common stockholders | | $ | (0.45 | ) | | $ | (0.34 | ) |
Diluted net loss per share attributable to common stockholders | | $ | (0.45 | ) | | $ | (0.34 | ) |
|
| | | | | | | |
| Years Ended December 31, | 2014 | | 2013 |
| Total net revenue | $ | 219,174 |
| | $ | 113,040 |
|
Net loss (1) | $ | (33,796 | ) | | $ | (17,592 | ) |
| Basic net loss per share attributable to common stockholders | $ | (0.45 | ) | | $ | (0.34 | ) |
| Diluted net loss per share attributable to common stockholders | $ | (0.45 | ) | | $ | (0.34 | ) |
| |
(1) | Net loss for the year ended December 31, 2013 includes $8.6 million of one-time acquisition-related costs and compensation expenses. |
INDEPENDENT AUDITOR’S REPORTTo
21. Subsequent Events
The Company has evaluated the
MembersSpringstone Financial, LLC
Westborough, MA 01581
Weimpact of events that have auditedoccurred subsequent to December 31, 2016, through the accompanyingdate the consolidated financial statements were filed with the SEC. Based on this evaluation, other than as recorded or disclosed within these consolidated financial statements, related notes or below, the Company has determined none of Springstonethese events were required to be recognized or disclosed.
LENDINGCLUB CORPORATION
Management's Discussion and Analysis of Financial LLC which compriseCondition and Results of Operations
(Tabular Amounts in Thousands, Except Share and Per Share Data and Ratios, or as Noted)
22. Quarterly Results of Operations (Unaudited)
The following table sets forth our unaudited consolidated statement of operations data for each of the
balance sheets as ofeight quarters ended December 31,
2013 and 2012, and the related statements2016. The unaudited quarterly statement of operations
changesdata set forth below have been prepared on the same basis as our audited consolidated financial statements and reflect, in
members’ equity, and cash flowsthe opinion of management, all adjustments of a normal, recurring nature that are necessary for
a fair statement of the
years then ended,unaudited quarterly statement of operations data. Our historical results are not necessarily indicative of our future operating results. The following quarterly consolidated financial data should be read in conjunction with the consolidated financial statements and the related notes
to the financial statements.Management’s Responsibility for the Financial Statements
Management is responsible for the preparation and fair presentation of these financial statements in accordance with accounting principles generally accepted in the United States of America; this includes the design, implementation, and maintenance of internal control relevant to the preparation and fair presentation of financial statements that are free from material misstatement, whether due to fraud or error.
Auditor’s Responsibility
Our responsibility is to express an opinion on these financial statements based on our audits. We conducted our audits in accordance with auditing standards generally accepted in the United States of America. Those standards require that we plan and perform the audit to obtain reasonable assurance about whether the financial statements are free from material misstatement.
An audit involves performing procedures to obtain audit evidence about the amounts and disclosures in the financial statements. The procedures selected depend on the auditor’s judgment, including the assessment of the risks of material misstatement of the financial statements, whether due to fraud or error. In making those risk assessments, the auditor considers internal control relevant to the entity’s preparation and fair presentation of the financial statements in order to design audit procedures that are appropriate in the circumstances, but not for the purpose of expressing an opinion on the effectiveness of the entity’s internal control. Accordingly, we express no such opinion. An audit also includes evaluating the appropriateness of accounting policies used and the reasonableness of significant accounting estimates made by management, as well as evaluating the overall presentation of the financial statements.
We believe that the audit evidence we have obtained is sufficient and appropriate to provide a basis for our audit opinion.
Opinion
In our opinion, the financial statements referred to above present fairly, in all material respects, the financial position of Springstone Financial, LLC as of December 31, 2013 and 2012, and the results of its operations and its cash flows for the years then ended in accordance with accounting principles generally accepted in the United States of America.
Emphasis of Matter
As discussed in Note 2 to the financial statements, the 2012 financial statements have been restated to correct misstatements. Our opinion is not modified with respect to this matter.
/s/ Auerr, Zajac & Associates, LLP
Certified Public Accountants
March 28, 2014
SPRINGSTONE FINANCIAL, LLC
BALANCE SHEETS
(See Notes to Financial Statements)
| | | | | | | | |
| | | December 31,
2012 | | | December 31,
2013 | |
ASSETS | | | | | | | | |
Current Assets | | | | | | | | |
Cash and Cash Equivalents | | $ | 7,385,889 | | | $ | 7,804,060 | |
Loan Origination Fees Receivable | | | 590,843 | | | | 414,121 | |
Prepaid Expenses | | | 62,135 | | | | 105,977 | |
Due From Officers | | | 85,930 | | | | 171,860 | |
Other Receivables | | | 149,391 | | | | 625 | |
| | | | | | | | |
Total Current Assets | | | 8,274,188 | | | | 8,496,643 | |
| | | | | | | | |
Property and Equipment | | | | | | | | |
Property and Equipment—Cost | | | 597,910 | | | | 953,225 | |
Less Accumulated Depreciation | | | 445,950 | | | | 550,473 | |
| | | | | | | | |
Net Property and Equipment | | | 151,960 | | | | 402,752 | |
| | | | | | | | |
Other Assets | | | | | | | | |
Intangible Assets | | | 6,731 | | | | 6,731 | |
Less Accumulated Amortization | | | 3,142 | | | | 3,590 | |
| | | | | | | | |
Net Intangibles | | | 3,589 | | | | 3,141 | |
| | | | | | | | |
Restricted Cash—See Note 5 | | | 1,312,358 | | | | 1,399,732 | |
Security Deposits | | | 27,378 | | | | 57,378 | |
| | | | | | | | |
Total Other Assets | | | 1,343,325 | | | | 1,460,251 | |
| | | | | | | | |
Total Assets | | $ | 9,769,473 | | | $ | 10,359,646 | |
| | | | | | | | |
LIABILITIES AND MEMBERS’ EQUITY | | | | | | | | |
Current Liabilities | | | | | | | | |
Accounts Payable | | $ | 149,072 | | | $ | 345,138 | |
Alliance Rebate Payable | | | 221,829 | | | | 494,416 | |
Accrued Expenses | | | 107,929 | | | | 106,063 | |
Accrued Salaries and Payroll Taxes | | | 415,021 | | | | 551,098 | |
Loan Funding Payables | | | 178,399 | | | | 323,299 | |
Current Portion of Deferred Rent | | | — | | | | 4,725 | |
| | | | | | | | |
Total Current Liabilities | | | 1,072,250 | | | | 1,824,739 | |
| | | | | | | | |
Long Term Liabilities | | | | | | | | |
Loan Loss Contingency—See Note 6 | | | 1,189,681 | | | | 1,189,681 | |
Deferred Rent | | | — | | | | 22,839 | |
| | | | | | | | |
Total Long Term Liabilities | | | 1,189,681 | | | | 1,212,520 | |
| | | | | | | | |
Total Liabilities | | | 2,261,931 | | | | 3,037,259 | |
Members’ Equity | | | 7,507,542 | | | | 7,322,387 | |
| | | | | | | | |
Total Liabilities and Members’ Equity | | $ | 9,769,473 | | | $ | 10,359,646 | |
| | | | | | | | |
SPRINGSTONE FINANCIAL, LLC
STATEMENTS OF OPERATIONS
(See Notes to Financial Statements)
| | | | | | | | |
| | | For Years Ended December 31, | |
| | | 2012 | | | 2013 | |
Fee Income | | $ | 14,840,780 | | | $ | 19,401,918 | |
Fee Refunds | | | 428,658 | | | | 916,198 | |
| | | | | | | | |
Net Fee Income | | | 14,412,122 | | | | 18,485,720 | |
Operating Expenses | | | 7,380,232 | | | | 9,861,710 | |
| | | | | | | | |
Income From Operations | | | 7,031,890 | | | | 8,624,010 | |
Other Income | | | | | | | | |
Interest Income | | | 3,077 | | | | 2,543 | |
| | | | | | | | |
Net Income | | $ | 7,034,967 | | | $ | 8,626,553 | |
| | | | | | | | |
SPRINGSTONE FINANCIAL, LLC
STATEMENTS OF CHANGES IN MEMBERS’ EQUITY
FOR THE YEARS ENDED DECEMBER 31, 2013 AND 2012
(See Notes to Financial Statements)
| | | | | | | | | | | | |
| | | NBT Capital
Corp | | | Premier Payment
Solutions | | | Total | |
Balance Beginning of the Period | | $ | 3,056,958 | | | $ | 302,509 | | | $ | 3,359,467 | |
Net Income | | | 1,406,993 | | | | 5,627,974 | | | | 7,034,967 | |
Distributions To Members | | | (577,378 | ) | | | (2,309,514 | ) | | | (2,886,892 | ) |
| | | | | | | | | | | | |
Members Equity December 31, 2012 | | $ | 3,886,573 | | | $ | 3,620,969 | | | $ | 7,507,542 | |
| | | | | | | | | | | | |
Net Income | | | 1,725,311 | | | | 6,901,242 | | | | 8,626,553 | |
Distributions To Members | | | (1,762,342 | ) | | | (7,049,366 | ) | | | (8,811,708 | ) |
| | | | | | | | | | | | |
Members Equity December 31, 2013 | | $ | 3,849,542 | | | $ | 3,472,845 | | | $ | 7,322,387 | |
| | | | | | | | | | | | |
SPRINGSTONE FINANCIAL, LLC
STATEMENTS OF CASH FLOWS
(See Notes to Financial Statements)
| | | | | | | | |
| | | Years Ended December 31, | |
| | | 2012 | | | 2013 | |
Cash Provided By (Used In) | | | | | | | | |
Operating Activities | | | | | | | | |
Net Income | | $ | 7,034,967 | | | $ | 8,626,553 | |
Adjustments to Reconcile Net Income to Cash Provided by Operating Activities | | | | | | | | |
Depreciation and Amortization | | | 102,864 | | | | 123,421 | |
Assets Abandoned In Office Relocation | | | — | | | | 26,246 | |
Security Deposits | | | — | | | | (30,000 | ) |
(Increase) Decrease In | | | | | | | | |
Loan Origination Fees Receivable | | | (402,337 | ) | | | 176,722 | |
Prepaid Expenses | | | 17,662 | | | | (43,842 | ) |
Due From Officers | | | (85,930 | ) | | | (85,930 | ) |
Other Receivables | | | (143,852 | ) | | | 148,766 | |
(Decrease) Increase In | | | | | | | | |
Accounts Payable | | | 22,519 | | | | 196,066 | |
Alliance Rebate Payable | | | 221,829 | | | | 272,587 | |
Accrued Expenses | | | 12,498 | | | | (1,866 | ) |
Accrued Salaries and Payroll Taxes | | | 197,159 | | | | 136,077 | |
Loan Funding Payables | | | 58,111 | | | | 144,900 | |
Loan Loss Contingency | | | (33,253 | ) | | | — | |
Deferred Rent | | | — | | | | 27,564 | |
| | | | | | | | |
Total Adjustments | | | (32,730 | ) | | | 1,090,711 | |
| | | | | | | | |
Net Cash Provided by Operating Activities | | | 7,002,237 | | | | 9,717,264 | |
| | | | | | | | |
Investing Activities | | | | | | | | |
Restricted Cash | | | (89,424 | ) | | | (87,374 | ) |
Purchase of Equipment and Software | | | (81,383 | ) | | | (400,011 | ) |
| | | | | | | | |
Net Cash Used In Investing Activities | | | (170,807 | ) | | | (487,385 | ) |
| | | | | | | | |
Financing Activities | | | | | | | | |
Distributions to Members | | | (2,886,892 | ) | | | (8,811,708 | ) |
| | | | | | | | |
Net Cash Used In Investing Activities | | | (2,886,892 | ) | | | (8,811,708 | ) |
| | | | | | | | |
Net Increase in Cash | | | 3,944,538 | | | | 418,171 | |
Cash—Beginning of the Period | | | 3,441,351 | | | | 7,385,889 | |
| | | | | | | | |
Cash—End of the Period | | $ | 7,385,889 | | | $ | 7,804,060 | |
| | | | | | | | |
See Note 7 for supplemental disclosures of noncash transactions.
SPRINGSTONE FINANCIAL, LLC
NOTES TO FINANCIAL STATEMENTS
DECEMBER 31, 2013 AND 2012
Note 1—Summary of Significant Accounting Policies
Nature of Operations
The Company provides services related to the origination and processing of personal loans. The loans are used to fund elective medical, fertility and dental procedures, as well as tuition at private educational institutions and tutoring at learning centers for pre-post secondary age students.
Revenues and Expenses
The Company earns revenue by originating and placing personal loans with funding institutions. Revenue consists of fees from service providers and loan origination fees from the funding institutions. Revenue is recognized when the loans are funded.
Use of Estimates
The preparation of financial statements in conformity with generally accepted accounting principles requires management to make estimates and assumptions that affect the reported amounts of certain assets and liabilities and disclosures. Accordingly, the actual results could differ from those estimates.
Property and Equipment
Property and equipment additions are recorded at cost. Maintenance, repairs, and renewals are expensed, and additions and improvements are capitalized. Depreciation is computed using both straight-line and accelerated methods over useful lives of 5—7 years.
Depreciation expense for the years ended December 31, 2013 and 2012 was $122,973 and $102,416, respectively.
The Components of Property and Equipment are as follows:
| | | | | | | | |
| | | December 31,
2013 | | | December 31,
2012 | |
Computers and office equipment | | $ | 148,696 | | | $ | 118,465 | |
Furniture and fixtures | | | 237,540 | | | | 56,543 | |
Leasehold improvements | | | 110,259 | | | | 24,775 | |
| | | | | | | | |
| | | 496,495 | | | | 199,783 | |
Less accumulated depreciation | | | 179,354 | | | | 146,496 | |
| | | | | | | | |
| | $ | 317,141 | | | $ | 53,287 | |
| | | | | | | | |
Software and Website Costs
Computer software and web site development costs include packaged software, customized software for website operations, and costs related to major website enhancements. These costs are amortized using the straight-line method over three year lives. Operating expenses related to web site hosting and routine maintenance are expensed as incurred.
The components of capitalized software and website costs are as follows:
| | | | | | | | |
| | | December 31,
2013 | | | December 31,
2012 | |
Software | | $ | 136,865 | | | $ | 131,095 | |
Website Costs | | | 319,865 | | | | 267,032 | |
| | | | | | | | |
| | | 456,730 | | | | 398,127 | |
Less Accumulated Depreciation | | | 371,119 | | | | 299,454 | |
| | | | | | | | |
| | $ | 85,611 | | | $ | 98,673 | |
| | | | | | | | |
Marketing and Advertising
The Company currently markets loans to the following demographic markets: (1) high quality medical and dental professional service providers for funding of elective medical, fertility and dental procedures, and (2) private educational institutions and learning centers for funding of private K-12 school tuition and tutoring.
The Company expenses advertising as incurred. Advertising expense for the years ended December 31, 2013 and 2012 was $190,112 and $109,141, respectively.
Concentrations of Credit Risk
The Company maintains demand deposits with several high quality financial institutions. Periodically, cash balances exceed the federally insured bank deposit limits. The Company had approximately $9,068,000 and $9,818,000 in uninsured cash, as of December 31, 2013 and 2012, respectively.
Credit Policies
The Company follows practices standard in the consumer lending/loan servicing industries. Loan applications are processed through various fraud shield databases and credit checks are run for all loan applicants. Loan proceeds are sent directly to the medical or dental service provider or educational institution, and not to the borrower.
Limited Liability Company/Income Taxes
As a limited liability company, each member’s liability is limited to amounts reflected in their respective member accounts.
The Company files its income tax returns as a partnership for federal and state income tax purposes. As such, the Company will not pay any federal or state income taxes, because any income or loss will be passed through to the federal and state tax returns of the members of the Company. Accordingly, no provision is made for federal or state income taxes in the financial statements.
Following are the differences between the financial statements and how the Company reports in its income tax returns: The financial statements include a provision for loss reserves based on management’s estimate of its exposure to potential loan defaults whereas the tax reporting allows deductions only when losses are realized. Organizational expenses were expensed in full on the financial statements, whereas for income tax reporting organizational costs are amortized over five years. Meals and entertainment are expensed in full on the financial statements, whereas for income tax reporting these costs are only 50% deductible.
The Company files income tax returns in the U.S. federal jurisdiction and the states of Massachusetts, Pennsylvania, New Jersey and Ohio. Management believes that all positions taken in its tax returns would be sustained in the event of review. The Company’s tax returns are no longer subject to review for years before 2010.
Note 2—Correction of Error
The Company has restated the 2012 financial statements in order to reflect the following corrections:
In 2009, the Company entered into an agreement with World Financial Capital Bank (now known as Comenity Bank) under which it would refund excess margin earned from provider fees, as calculated in accordance with the terms of the agreement. In 2012, the margin specified in the agreement was exceeded which resulted in the accrual of a rebate in the amount of $221,829 and referred to in the financial statements as “Alliance Rebate”.
The Company has been providing supplemental life insurance and disability benefits to its officers. It was subsequently determined that the cost of the benefits should be reimbursed by the officers. As a result, the Company has accrued a receivable from the officers in the amount of $85,930.
Note 3—Lease Commitments
Operating Lease
In 2013, the Company entered into a lease for new office space. The lease is for a period of 73 months beginning February, 2014, with an option to renew for an additional five years.
The Company occupied the new space on October 1, 2013, and paid rent of $1,848 for the months of October through December under the early occupancy provision in the lease. The difference between the rent paid for these months and the fair value of the rent as determined from the lease terms has been recorded as rent expense and a liability for deferred rent, which will be amortized over the term of the lease. Rent expense for office space for the years ended December 31, 2013 and 2012 was $172,532 and $134,085, respectively.
Future minimum annual payments under the lease are as follows:
| | | | |
2014 | | $ | 154,057 | |
2015 | | | 213,463 | |
2016 | | | 221,780 | |
2017 | | | 230,097 | |
2018 | | | 238,413 | |
Thereafter | | | 266,598 | |
| | | | |
| | $ | 1,324,408 | |
| | | | |
Note 4—Related-Party Transactions
One of the Company’s funding sources, NBT Bank, N.A. (an FDIC insured banking institution) is a subsidiary of a member of the Company, NBT Capital Corp. NBT Bank, N.A. (NBT) takes the risk of loss on default for a large majority of the loans that it funds.
In addition, the Company also has several bank accounts on deposit with NBT.
Three of the Company’s senior managers are stockholders of Premier Payment Solutions, Inc., the other member of the Company.
Note 5—Restricted Cash
Restricted cash represents reserves set aside by NBT to cover potential defaults on selected loan portfolios. No withdrawals may be made from these accounts without written approval from NBT.
Note 6—Loan Loss Contingency
Loan loss contingency represents management’s estimate of the potential contingent liability to cover losses on the following loan portfolios:
“Pool B”—This portfolio consists of loans, funded by the primary banking partner, offered to Borrowers with credit scores lower than normally required by the bank, but high enough to satisfy the Company’s credit worthiness requirements, based on senior management’s previous experience in the consumer loan market.
The total amount of loans outstandingincluded elsewhere in this portfolioReport.
|
| | | | | | | | | | | | | | | |
| Quarters Ended | December 31, 2016 | | September 30, 2016 | | June 30, 2016 | | March 31, 2016 |
| Net operating revenue: | | | | | | | |
| Transaction fees | $ | 101,568 |
| | $ | 100,813 |
| | $ | 96,605 |
| | $ | 124,508 |
|
| Servicing fees | 22,951 |
| | 16,513 |
| | 11,603 |
| | 16,942 |
|
| Management fees | 3,076 |
| | 1,964 |
| | 3,053 |
| | 3,545 |
|
| Other revenue (expense) | 1,607 |
| | (6,681 | ) | | (8,870 | ) | | 6,270 |
|
| Total net operating revenue | $ | 129,202 |
| | $ | 112,609 |
| | $ | 102,391 |
| | $ | 151,265 |
|
| Net interest income and other adjustments | 1,320 |
| | 1,947 |
| | 1,049 |
| | 1,029 |
|
| Total net revenue | $ | 130,522 |
| | $ | 114,556 |
| | $ | 103,440 |
| | $ | 152,294 |
|
| Operating expenses: | | | | | | | |
| Sales and marketing | 55,457 |
| | 44,901 |
| | 49,737 |
| | 66,575 |
|
| Origination and servicing | 18,296 |
| | 16,332 |
| | 20,934 |
| | 19,198 |
|
| Engineering and product development | 32,522 |
| | 29,428 |
| | 29,209 |
| | 24,198 |
|
| Other general and administrative | 56,740 |
| | 58,940 |
| | 53,457 |
| | 38,035 |
|
| Goodwill impairment | — |
| | 1,650 |
| | 35,400 |
| | — |
|
| Total operating expenses | $ | 163,015 |
| | $ | 151,251 |
| | $ | 188,737 |
| | $ | 148,006 |
|
| Income (loss) before income tax expense | (32,493 | ) | | (36,695 | ) | | (85,297 | ) | | 4,288 |
|
| Income tax (benefit) expense | (224 | ) | | (209 | ) | | (3,946 | ) | | 151 |
|
| Net income (loss) | $ | (32,269 | ) | | $ | (36,486 | ) | | $ | (81,351 | ) | | $ | 4,137 |
|
Other data(1): | | | | | | | |
Loan originations(2) | $ | 1,987,278 |
| | $ | 1,972,034 |
| | $ | 1,955,401 |
| | $ | 2,750,033 |
|
| Weighted-average common shares - Basic | 395,877,053 |
| | 391,453,316 |
| | 382,893,402 |
| | 380,266,636 |
|
| Weighted-average common shares - Diluted | 395,877,053 |
| | 391,453,316 |
| | 382,893,402 |
| | 392,397,825 |
|
| Net income (loss) per share: | | | | | | | |
| Basic | $ | (0.08 | ) | | $ | (0.09 | ) | | $ | (0.21 | ) | | $ | 0.01 |
|
| Diluted | $ | (0.08 | ) | | $ | (0.09 | ) | | $ | (0.21 | ) | | $ | 0.01 |
|
| |
(1) | For more information about loan originations, see “Item 7 – Management's Discussion and Analysis – Key Operating and Financial Metrics.” |
| |
(2) | Loan originations include loans facilitated through the platform plus outstanding purchase commitments at period end. |
LENDINGCLUB CORPORATION
Management's Discussion and Analysis of Financial Condition and Results of Operations
(Tabular Amounts in Thousands, Except Share and Per Share Data and Ratios, or as
of December 31, 2013 and 2012 was approximately $6,240,000 and $5,624,000, respectively. For the years ended December 31, 2013 and 2012, the total amount of loan defaults realized from this portfolio was $468,358 and $356,595, respectively.“Over $25K”—The 2nd portfolio consists of loans over $25,000, made to individuals with higher than normal credit scores. The Company bears the burden of risk of loss on such loans that were made before September 1, 2012. The Company’s potential liability is based on the ratio of the amount of the original loan balance over $35,000 to the total original loan amount. At December 31, 2013 and 2012, the Company’s exposure on this portfolio was approximately $2,986,000 and $5,402,000, respectively. For the years ended December 31, 2013 and 2012, actual defaults realized from this portfolio were $44,008 and $31,602, respectively.
“ClearChoice Reserve Program”—Loans in this portfolio commenced in July, 2012 and are used to pay for the cost of dental and orthodontic procedures. The Company bears the risk of loss at 1.54% of the outstanding loan balance. At December 31, 2013 and 2012, the Company’s exposure on this portfolio was approximately $62,000 and $32,000, respectively. For the years ended December 31, 2013 and 2012, actual defaults realized from this portfolio were $29 and none, respectively.
Management believes that the loan loss contingency balance is sufficient to cover any future loan defaults on these portfolios.
Note 7—Statement of Cash Flows—Summary of Non-Cash and Other Items
The Company considers all highly liquid investments with a maturity of three months or less when purchased to be cash equivalents.
There were no income taxes paid for the years ended December 31, 2013 and December 31, 2012.
There were no payments of interest for the years ended December 31, 2013 and December 31, 2012.
In the year ended December 31, 2013 fully depreciated property and equipment in the amount $18,465 of was written off.
Note 8—Retirement Plan
The Company has a 401(k) profit sharing plan which covers substantially all employees. Participating employees may contribute, on a tax-deferred basis, a portion of their compensation in accordance with section 401(k) of the Internal Revenue Code. The plan provides for a safe harbor matching contribution by the Company. For the years ended December 31, 2013 and 2012, the Company’s matching contributions were $95,086 and $80,727, respectively.
Note 9—Compensated Absences
Employees of the Company are entitled to paid time off (PTO) which accrues up to a maximum of 160 hours. Paid time off can be used as vacation time, sick time, or personal time. Employees cannot carry over more than 40 hours of PTO into the next calendar year. As of December 31, 2013 and 2012, there were no accrued compensated absences.
Note 10—Significant Concentrations
The Company is fully dependent on third party funding sources such as banks or private placement financing organizations. As of December 31, 2013, there were two banks with which the Company has an arrangement to fund the loans it originates. Until those loan portfolios grow significantly, the Company is unlikely to pursue other major lending sources, and therefore has a concentration in terms of readily available lenders.
The loan origination industry is subject to certain economic factors such as interest rates, and the overall health of the economy.
Note 11—Regulatory Matters
The Company is subject to various regulations common in the financing industry and continually monitors its responsibilities with regard to regulatory and licensing requirements. The Company is satisfied that it is fully compliant with all requirements
Additionally, each of the Company’s banking partners has a contractual right to review its policies and procedures related to regulatory matters to insure that the Company is in compliance.
Note 12—Subsequent Events
In late 2013 the Company entered into negotiations with LendingClub Corporation (LendingClub) to be acquired. The discussions have continued into 2014, with no definitive terms yet set. Management expects that the Company and LendingClub will agree to terms and that the acquisition will be completed early in the second quarter of 2014.
The Company has evaluated all subsequent events through March 28, 2014, the date the financial statements were available to be issued.
Note 13—Subsequent Events
Certain amounts in the 2012 financial statements and schedules have been reclassified to conform to the 2013 statement presentation.
Noted)
|
| | | | | | | | | | | | | | | |
| Quarters Ended | December 31,
2015 | | September 30,
2015 | | June 30,
2015 | | March 31,
2015 |
| Net operating revenue: | | | | | | | |
| Transaction fees | $ | 114,955 |
| | $ | 100,420 |
| | $ | 85,651 |
| | $ | 72,482 |
|
| Servicing fees | 11,941 |
| | 8,999 |
| | 6,479 |
| | 5,392 |
|
| Management fees | 3,313 |
| | 2,900 |
| | 2,548 |
| | 2,215 |
|
| Other revenue (expense) | 4,262 |
| | 2,743 |
| | 1,441 |
| | 956 |
|
| Total net operating revenue | $ | 134,471 |
| | $ | 115,062 |
| | $ | 96,119 |
| | $ | 81,045 |
|
| Net interest income and other adjustments | 1,047 |
| | 1,214 |
| | 798 |
| | 187 |
|
| Total net revenue | $ | 135,518 |
| | $ | 116,276 |
| | $ | 96,917 |
| | $ | 81,232 |
|
| Operating expenses: | | | | | | | |
| Sales and marketing | $ | 53,537 |
| | $ | 44,018 |
| | $ | 39,501 |
| | $ | 34,470 |
|
| Origination and servicing | 17,696 |
| | 16,732 |
| | 14,706 |
| | 12,201 |
|
| Engineering and product development | 23,887 |
| | 21,063 |
| | 18,214 |
| | 13,898 |
|
| Other general and administrative | 35,245 |
| | 32,280 |
| | 28,247 |
| | 26,410 |
|
| Total operating expenses | $ | 130,365 |
| | $ | 114,093 |
| | $ | 100,668 |
| | $ | 86,979 |
|
| Income (loss) before income tax expense | 5,153 |
| | 2,183 |
| | (3,751 | ) | | (5,747 | ) |
| Income tax expense | 584 |
| | 1,233 |
| | 389 |
| | 627 |
|
| Net income (loss) | $ | 4,569 |
| | $ | 950 |
| | $ | (4,140 | ) | | $ | (6,374 | ) |
Other data(1): | | | | | | | |
Loan originations(2) | $ | 2,579,201 |
| | $ | 2,235,647 |
| | $ | 1,911,759 |
| | $ | 1,635,090 |
|
| Weighted-average common shares - Basic | 378,631,340 |
| | 375,982,120 |
| | 372,841,945 |
| | 371,959,312 |
|
| Weighted-average common shares - Diluted | 402,634,010 |
| | 401,934,880 |
| | 372,841,945 |
| | 371,959,312 |
|
| Net income (loss) per share: | | | | | | | |
| Basic | $ | 0.01 |
| | $ | 0.00 |
| | $ | (0.01 | ) | | $ | (0.02 | ) |
| Diluted | $ | 0.01 |
| | $ | 0.00 |
| | $ | (0.01 | ) | | $ | (0.02 | ) |
| |
(1) | For more information about loan originations, see “Item 7 – Management's Discussion and Analysis – Key Operating and Financial Metrics.” |
| |
(2) | Loan originations include loans facilitated through the platform plus outstanding purchase commitments at period end. |
INDEPENDENT AUDITOR’S REPORT ON SUPPLEMENTARY INFORMATIONTo the Members
Springstone Financial, LLC
Westborough, MA 01581
We have audited the financial statements of Springstone Financial, LLC as of and for the years ended December 31, 2013 and 2012, and our report thereon dated March 28, 2014, which expressed an unqualified opinion on those financial statements, appears on page three. Our audit was conducted for the purpose of forming an opinion on the financial statements as a whole. The schedule of operating expenses is presented for purposes of additional analysis and is not a required part of the financial statements. Such information is the responsibility of management and was derived from and relates directly to the underlying accounting and other records used to prepare the financial statements. The information has been subjected to the auditing procedures applied in the audit of the financial statements and certain additional procedures, including comparing and reconciling such information directly to the underlying accounting and other records used to prepare the financial statements or to the financial statements themselves, and other additional procedures in accordance with auditing standards generally accepted in the United States of America. In our opinion, the information is fairly stated in all material respects in relation to the financial statements as a whole.
/s/ Auerr, Zajac & Associates, LLP
Certified Public Accountants
March 28, 2014
SPRINGSTONE FINANCIAL, LLC
SCHEDULE OF OPERATING EXPENSES
(See auditor’s report on supplemental information and Notes to financial statements)
| | | | | | | | |
| | | Years Ended December 31, | |
| | | 2013 | | | 2012 | |
Salaries and Payroll Taxes | | $ | 4,524,719 | | | $ | 3,602,641 | |
Advertising and Marketing Expense | | | 799,862 | | | | 499,375 | |
Consultants | | | 297,784 | | | | 347,254 | |
Printing and Reproduction | | | 115,204 | | | | 223,984 | |
Information Technology and Website Hosting | | | 272,064 | | | | 202,584 | |
Rent Expense | | | 172,532 | | | | 134,085 | |
Professional Fees | | | 441,534 | | | | 150,484 | |
Travel and Entertainment | | | 39,661 | | | | 14,004 | |
Depreciation and Amortization | | | 123,421 | | | | 102,864 | |
Postage and Delivery | | | 142,294 | | | | 129,061 | |
Insurance | | | 148,137 | | | | 86,671 | |
Office Supplies and Expense | | | 27,243 | | | | 34,745 | |
Telephone and Utilities | | | 96,001 | | | | 80,924 | |
Training and Education | | | 67,252 | | | | 50,332 | |
Charitable Contributions | | | 2,139 | | | | 4,470 | |
Employee Retirement Benefits | | | 95,086 | | | | 80,727 | |
Credit Reports | | | 270,047 | | | | 194,735 | |
Alliance Rebate | | | 272,587 | | | | 221,829 | |
Provider Rebates and Chargebacks | | | 1,187,734 | | | | 716,660 | |
Provision for Loss Contingency | | | 525,605 | | | | 388,197 | |
Fraud Losses | | | 121,243 | | | | 93,109 | |
Bank Service Charges | | | 18,727 | | | | 11,947 | |
Office Relocation Expense | | | 78,184 | | | | — | |
Miscellaneous | | | 22,650 | | | | 9,550 | |
| | | | | | | | |
Total Operating Expenses | | $ | 9,861,710 | | | $ | 7,380,232 | |
| | | | | | | | |
Item 9. Changes in and Disagreements with Accountants on Accounting and Financial Disclosure
On September 5, 2013, Grant Thornton L.L.P. (“Grant Thornton”), the independent registered public accounting firm of LC Corporation, was dismissed by us. We engaged Deloitte & Touche L.L.P. (“Deloitte”) as our independent registered public accounting firm for our third quarter ended September 30, 2013 and thereafter. Our decision to dismiss Grant Thornton and to engage Deloitte was approved by our Audit Committee on September 5, 2013. Such change was reported by us in a Current Report on Form 8-K dated September 5, 2013, which was filed with the SEC on September 11, 2013.
None.
Item 9A. Controls and Procedures
Evaluation of Disclosure Controls and Procedures
We have adopted
The Company's management evaluated, with the participation of the Company’s Chief Executive Officer (CEO) and
maintainChief Financial Officer (CFO), the effectiveness of the Company’s disclosure controls and procedures
that are designed to ensure that information required to be disclosed(as defined in
our reportsRule 13a-15(e) under the
Securities Exchange Act of 1934,
Act is recorded, processed, summarized and reported within the time periods specified in the SEC’s rules and forms and that the information is accumulated and communicated to our management, including our Chief Executive Officer and Chief Financial Officer, as
appropriate, to allow for timely decisions regarding required disclosure.amended) as of December 31, 2016. In designing and evaluating
ourits disclosure controls and procedures,
the Company's management recognizes that any controls and procedures, no matter how well designed and operated, can provide only reasonable assurance,
not absolute assurance of achieving the desired control objectives, and
we areis required to apply
ourits judgment in evaluating the cost-benefit relationship of possible controls and procedures.
As required by Rule 13a-15(b) of
Based on the 1934 Act, we carried out an evaluation, under the supervisionCompany’s CEO and withCFO concluded that the participation of management, including our Chief Executive Officer and Chief Financial Officer, of the effectiveness of the design and operation of ourCompany’s disclosure controls and procedures as of December 31, 2014. Based2016 were designed and functioned effectively to provide reasonable assurance that the information required to be disclosed by the Company in reports filed under the Securities and Exchange Act of 1934, as amended, is (i) recorded, processed, summarized, and reported within the time periods specified in the SEC’s rules and forms, and (ii) accumulated and communicated to management, including the principal executive and principal financial officers, as appropriate, to allow timely decisions regarding required disclosure.
Management’s Annual Report on Internal Control over Financial Reporting
The Company’s management is responsible for maintaining effective internal control over financial reporting and for assessing the foregoing, oureffectiveness of internal control over financial reporting, as defined in Rule 13a-15(f) of the 1934 Act. Under the supervision and with the participation of the Company’s Chief Executive Officer and Chief Financial Officer, have concluded that our disclosure controls and procedures were effective at a reasonable assurance level.Management’s Report on Internal Control over Financial Reporting
Our management is responsible for establishing and maintaining adequateconducted an evaluation of the effectiveness of its internal control over financial reporting as such termof December 31, 2016, based on the criteria established in
Internal Control – Integrated Framework (2013) issued by the Committee of Sponsoring Organizations of the Treadway Commission. As a result of this assessment, management concluded that, as of December 31, 2016, our internal control over financial reporting was effective in providing reasonable assurance regarding the reliability of financial reporting and the preparation of financial statements for external purposes in accordance with generally accepted accounting principles. Deloitte & Touche LLP, has independently audited the effectiveness of our internal control over financial reporting and its report is defined in Rule 13a-15(f) under the 1934 Act.included below.
All internal control systems, no matter how well designed, have inherent limitations including the possibility of human error and the circumvention or overriding of controls. Further, because of changes in conditions, the effectiveness of internal controls may vary over time. Projections of any evaluation of effectiveness to future periods are subject to the risk that controls may become inadequate because of changes in conditions, or that the degree of compliance with the policies or procedures may deteriorate. Accordingly, even those systems determined to be effective can provide
us only
with reasonable assurance with respect to financial statement preparation and presentation.
Our
Changes in Internal Control Over Financial Reporting
As previously disclosed in Item 9A of our Annual Report on Form 10-K/A, Amendment No. 1, for the year ended December 31, 2015, management identified a material weakness during the second fiscal quarter of 2016 relating to the aggregation of control deficiencies in the Company’s “tone at the top” and concluded that its internal control over financial reporting was ineffective as of December 31, 2015. The Company made a similar conclusion with respect to its internal control over financial reporting as of March 31, 2016, June 30, 2016, and September 30, 2016, as disclosed in Item 4 of our Quarterly Report on Form 10-Q for the quarters ended March 31, 2016, June 30, 2016, and September 30, 2016, respectively. The contributing factor to the deficiencies aggregating to the material weakness was the Company's lack of an appropriate “tone at the top” set by certain former members of senior management. The following steps have been implemented by the Company in 2016 to remediate the material weakness:
Replacement of certain senior managers and executives, including the Chief Executive OfficerCompany’s former CEO.
The Company separated the positions of CEO and Chief Financial Officer,Chair of the Board, appointing an independent board member, Hans Morris, as Chair.
Development and implementation of trainings, led by the CEO and reinforced by executives throughout the organization, on the Company's Code of Conduct and Ethics Policy, which included raising awareness and understanding of the importance of financial reporting integrity.
Realignment of the annual employee performance process to include consideration of employees’ demonstration of the Company’s values.
Comprehensive review and validation of historical data changes on our platform, and the creation of a data change classification matrix and change approval process over live database changes.
Further training of executives and directors on ways to identify and report conflicts of interests and related party transactions.
Improvement of and training on the Company’s policy and procedures on related party transactions.
The Company and LC Advisors, LLC (LCA) have established a majority independent governing board of the partnerships and separately managed accounts of LCA (the Governing Board) for the Funds to provide fiduciary oversight and make binding determinations for certain actions and activities of the Funds including, but not limited to, approval of valuation policies and procedures, and review adherence to the investment restrictions and guidelines of the Funds. Further, we have realigned responsibilities for accounting and financial reporting for the Funds within the Company.
New processes and controls designed to ensure that our investor contracts, including contract amendments, adhere to enhanced requirements established by the Risk Committee of the Board for the governance and review of contract provisions and amendments.
As of December 31, 2016, management completed its assessment of the design and operating effectiveness of the internal controls over financial reporting. Based on this assessment, management concluded that the material weakness was remediated as of December 31, 2016.
Except as noted in the preceding paragraphs, no other change in the Company's internal control over financial reporting (as defined in Rule 13a-15(f) under the Securities Exchange Act of 1934) occurred during the fiscal quarter ended December 31, 2016, that has assessedmaterially affected, or is reasonably likely to materially affect, the Company's internal control over financial reporting.
REPORT OF INDEPENDENT REGISTERED PUBLIC ACCOUNTING FIRM
To the Board of Directors and Stockholders of
LendingClub Corporation
San Francisco, California
We have audited the internal control over financial reporting of LendingClub Corporation and subsidiaries (the “Company”) as of December 31, 2016, based on criteria established in Internal Control - Integrated Framework (2013) issued by the Committee of Sponsoring Organizations of the Treadway Commission. The Company’s management is responsible for maintaining effective internal control over financial reporting and for its assessment of the effectiveness of internal control over financial reporting, included in the accompanying Management’s Annual Report on Internal Control over Financial Reporting. Our responsibility is to express an opinion on the Company’s internal control over financial reporting based on our audit.
We conducted our audit in accordance with the standards of the Public Company Accounting Oversight Board (United States). Those standards require that we plan and perform the audit to obtain reasonable assurance about whether effective internal control over financial reporting was maintained in all material respects. Our audit included obtaining an understanding of internal control over financial reporting, assessing the risk that a material weakness exists, testing and evaluating the design and operating effectiveness of internal control based on the assessed risk, and performing such other procedures as we considered necessary in the circumstances. We believe that our audit provides a reasonable basis for our opinion.
A company’s internal control over financial reporting is a process designed by, or under the supervision of, the company’s principal executive and principal financial officers, or persons performing similar functions, and effected by the company’s board of directors, management, and other personnel to provide reasonable assurance regarding the reliability of financial reporting and the preparation of financial statements for external purposes in accordance with generally accepted accounting principles. A company’s internal control over financial reporting includes those policies and procedures that (1) pertain to the maintenance of records that, in reasonable detail, accurately and fairly reflect the transactions and dispositions of the assets of the company; (2) provide reasonable assurance that transactions are recorded as necessary to permit preparation of financial statements in accordance with generally accepted accounting principles, and that receipts and expenditures of the company are being made only in accordance with authorizations of management and directors of the company; and (3) provide reasonable assurance regarding prevention or timely detection of unauthorized acquisition, use, or disposition of the company’s assets that could have a material effect on the financial statements.
Because of the inherent limitations of internal control over financial reporting, including the possibility of collusion or improper management override of controls, material misstatements due to error or fraud may not be prevented or detected on a timely basis. Also, projections of any evaluation of the effectiveness of the internal control over financial reporting to future periods are subject to the risk that the controls may become inadequate because of changes in conditions, or that the degree of compliance with the policies or procedures may deteriorate.
In our opinion, the Company maintained, in all material respects, effective internal control over financial reporting as of December 31, 2014, following2016, based on the criteria set forthestablished in Internal Control — Integrated Framework (2013) issued by the Committee of Sponsoring Organizations of the Treadway Commission (“COSO”)Commission.
We have also audited, in
accordance with the
1992 Internal Control—Integrated Framework. We plan to adoptstandards of the
2013 COSO frameworkPublic Company Accounting Oversight Board (United States), the consolidated financial statements and financial statement schedule as of and for the year
endingended December 31,
2015.This annual report does not include an attestation report2016, of the Company’s registered public accounting firm due to a transition period established by rules of the SecuritiesCompany and Exchange Commission for newly public companies.
our report dated February 28, 2017, expressed an unqualified opinion on those financial statements and financial statement schedule.
DELOITTE & TOUCHE LLP
San Francisco, California
February 28, 2017
Item 9B. Other Information
Not
Applicable.Applicable.
PART III
Item 10. Directors, Executive Officers and Corporate Governance
The information required by Item 10 will be included in our Proxy Statement under the headings “Corporate Governance at LendingClub” and “Section 16(a) Beneficial Ownership Reporting Compliance,” and is incorporated herein by reference. The Proxy Statement will be filed with the Securities and Exchange Commission pursuant to Regulation 14A within 120 days of the end of our 2014the 2016 fiscal year.
Item 11. Executive Compensation
The information required by Item 11 will be included in the Proxy Statement under the headings “Director Compensation,” “Compensation Discussion and Analysis,” “Named Executive Officer Compensation,” “Compensation Committee Interlocks and Insider Participation” and “Compensation Committee Report,” and is incorporated herein by reference.
Item 12. Security Ownership of Certain Beneficial Owners and Management and Related Stockholder Matters
The information required by Item 12 will be included in the Proxy Statement under the headings “Security Ownership” and “Equity Compensation Plans,” and is incorporated herein by reference.
Item 13. Certain Relationships and Related Transactions, and Director Independence
The information required by Item 13 will be included in the Proxy Statement under the headings “Related Person Transactions” and “Director Independence,” and is incorporated herein by reference.
Item 14. Principal Accountant Fees and Services
The information required by Item 14 will be included in the Proxy Statement under the heading “Ratification of Selection of Independent Auditors,” and is incorporated herein by reference.
PART IV
Item 15. Exhibits and Financial Statement
SchedulesSchedule
(a) We have filed the following documents as part of this Annual Report on Form 10-K:
1. Consolidated Financial Statements
| 1. | Consolidated Financial Statements |
| |
| 2. | Financial Statement SchedulesSchedule |
Schedule II – Valuation and Qualifying Accounts (in thousands)
| | | | | | | | | | | | | | | | | | | | |
| | | | | | Additions | | | | | | | |
| | | Balance at
Beginning of
Period | | | Charged to
Expenses | | | Charged
to Other
Accounts | | | Deductions | | | Balance at
End of Period | |
Allowance for Deferred Tax Assets: | | | | | | | | | | | | | | | | | | | | |
Year ended December 31, 2014 | | $ | 22,338 | | | $ | 6,857 | | | $ | 11,633 | | | $ | — | | | $ | 40,828 | |
Year ended December 31, 2013 | | $ | 23,939 | | | $ | — | | | $ | 933 | | | $ | 2,534 | | | $ | 22,338 | |
Nine months ended December 31, 2012 | | $ | 22,036 | | | $ | 1,934 | | | $ | — | | | $ | 31 | | | $ | 23,939 | |
|
| | | | | | | | | | | | | | | | | | | |
| | | | Additions | | | | |
| | Balance at Beginning of Period | | Charged to Expenses | | Charged to Other Accounts | | Deductions | | Balance at
End of
Period |
| Allowance for Deferred Tax Assets: | | | | | | | | | |
| Year ended December 31, 2016 | $ | 25,348 |
| | $ | 50,577 |
| | $ | — |
| | $ | 617 |
| | $ | 75,308 |
|
| Year ended December 31, 2015 | $ | 26,788 |
| | $ | — |
| | $ | 680 |
| | $ | 2,120 |
| | $ | 25,348 |
|
| Year ended December 31, 2014 | $ | 19,931 |
| | $ | 6,857 |
| | $ | — |
| | $ | — |
| | $ | 26,788 |
|
3. Exhibits
The documents listed in the Exhibit index of this Annual Report on Form 10-K are incorporated by reference or are filed with this Annual Report on Form 10-K, in each case as indicated therein on the Exhibit Index.
Pursuant to the requirements of Section 13 or 15(d) of the Securities Exchange Act of 1934, the registrant has duly caused this report to be signed on its behalf by the undersigned, thereunto duly authorized.
Date: February
27, 201528, 2017 |
| | | |
LENDINGCLUB CORPORATION | LENDINGCLUB CORPORATION |
| | |
| By: | | /s/ RENAUD LAPLANCHE Scott Sanborn |
Renaud Laplanche | Scott Sanborn |
| Chief Executive Officer and President |
POWER OF ATTORNEY
KNOW ALL PERSONS BY THESE PRESENTS, that each person whose signature appears below constitutes and appoints Scott Sanborn and Thomas Casey, jointly and severally, his or her attorney-in-fact, with the power of substitution, for him or her in any and all capacities, to sign any amendments to this Annual Report on Form 10-K and to file the same, with exhibits thereto and other documents in connection therewith, with the Securities and Exchange Commission, hereby ratifying and confirming all that each of said attorneys-in-fact, or his or her substitute or substitutes, may do or cause to be done by virtue hereof.
Pursuant to the requirements of the Securities Exchange Act of 1934, this Annual Report on Form 10-K has been signed below by the following persons on behalf of the Registrant and in the capacities and on the dates indicated.
Pursuant to the requirements of the Securities Exchange Act of 1934, this report has been signed below by the following persons on behalf of the registrant and in the capacities and on the dates indicated.
|
| | | | |
Signature
| | Title
| | Date
|
| Signature | | Title | | Date |
| | | | |
/s/ Renaud LaplancheRenaud Laplanche
Scott Sanborn | | Chief Executive Officer and Director (Principal Executive Officer)President | | February 27, 201528, 2017 |
| Scott Sanborn | | | | |
| | | | |
/s/ Carrie L. DolanCarrie L. Dolan
Thomas W. Casey | | Chief Financial Officer (Principal Financial Officer and Principal Accounting Officer) | | February 27, 201528, 2017 |
| Thomas W. Casey | | | | |
| | | | |
| /s/ Bradley Coleman | | Principal Accounting Officer | | February 28, 2017 |
| Bradley Coleman | | | | |
| | | | |
| /s/ Jeffrey M. Crowe Jeffrey M. Crowe
| | Director | | February 27, 201528, 2017 |
| Jeffrey M. Crowe | | | | |
| | | | |
| /s/ Daniel T. Ciporin Daniel Ciporin
| | Director | | February 27, 201528, 2017 |
| Daniel T. Ciporin | | | | |
| | | | |
/s/ Rebecca LynnRebecca Lynn
John J. Mack | | Director | | February 27, 201528, 2017 |
| | |
/s/ John J. Mack
John J. Mack
| | | | |
| | | | |
| /s/ Mary Meeker | | Director | | February 27, 201528, 2017 |
| Mary Meeker | | | | |
| | | | |
/s/ Mary MeekerMary Meeker
John C. Morris | | Director | | February 27, 201528, 2017 |
| | |
/s/ John C. Morris
John C. Morris
| | | | |
| | | | |
| /s/ Lawrence Summers | | Director | | February 27, 201528, 2017 |
| Lawrence Summers | | | | |
| | | | |
/s/ Lawrence SummersLawrence Summers
Simon Williams | | Director | | February 27, 201528, 2017 |
| Simon Williams | | | | |
| | | | |
/s/ Simon WilliamsSimon Williams
Timothy J. Mayopoulos | | Director | | February 27, 201528, 2017 |
| Timothy J. Mayopoulos | | | | |
Exhibit Index
| | | | | | | | | | | | |
| | | | | Incorporated by Reference | | |
Exhibit Number | | Exhibit Description | | Form | | File No. | | Exhibit | | Filing
Date | | Filed
Herewith |
| | | | | | |
| 2.1 | | Interest Purchase Agreement, dated as of April 17, 2014, by and among LendingClub Corporation, Springstone Financial, LLC, Premier Payment Solutions, Inc., NBT Capital Corp. and James P. Donovan | | 8-K | | 000-54752 | | 2.1 | | April 17, 2014 | | |
| | | | | | |
| 3.1 | | Restated Certificate of Incorporation of LendingClub Corporation | | 8-K | | 000-54752 | | 3.1 | | December 16, 2014 | | |
| | | | | | |
| 3.3 | | Restated Bylaws of LendingClub Corporation | | 8-K | | 333-151827 | | 3.2 | | December 16, 2014 | | |
| | | | | | |
| 4.1 | | Form of Three-Year Member Payment Dependent Note (included as Exhibit A to Exhibit 4.6) | | S-1,
Amendment No. 1 | | 333-198393 | | 4.1 | | October 20, 2014 | | |
| | | | | | |
| 4.2 | | Form of Five-Year Member Payment Dependent Note (included as Exhibit B to Exhibit 4.6) | | S-1,
Amendment No. 1 | | 333-198393 | | 4.2 | | October 20, 2014 | | |
| | | | | | |
| 4.3 | | Form of Indenture by and between LendingClub Corporation and Wells Fargo Bank, National Association | | S-1,
Amendment No. 3 | | 333-151827 | | 4.2 | | October 9, 2008 | | |
| | | | | | |
| 4.4 | | First Supplemental Indenture, dated as of July 10, 2009, by and between LendingClub Corporation and Wells Fargo Bank, National Association | | S-1, Post-
Effective Amendment No. 3 | | 333-151827 | | 4.3 | | July 23, 2009 | | |
| | | | | | |
| 4.5 | | Second Supplemental Indenture, dated as of May 5, 2010, by and between LendingClub Corporation and Wells Fargo Bank, National Association | | S-1, Post-
Effective Amendment No. 5 | | 333-151827 | | 4.5 | | May 6, 2010 | | |
| | | | | | |
| 4.6 | | Third Supplemental Indenture, dated as of October 3, 2014, by and between LendingClub Corporation and Wells Fargo Bank, National Association. | | S-1,
Amendment No. 1 | | 333-198393 | | 4.6 | | October 20, 2014 | | |
| | | | | | |
| 4.7 | | Amended and Restated Investor Rights Agreement, dated as of April 16, 2014, by and among LendingClub Corporation and the Investors named therein | | 8-K | | 000-54752 | | 4.1 | | April 17, 2014 | | |
| | | | | | |
| 4.8 | | Form of Common Stock Certificate of LendingClub Corporation | | S-1,
Amendment No. 2 | | 333-198393 | | 4.8 | | November 17, 2014 | | |
| | | | | | |
| 4.9 | | Forms of Warrants to Purchase Common Stock | | S-1,
Amendment No. 3 | | 333-198393 | | 4.9 | | December 1, 2014 | | |
| | | | | | |
| 4.10 | | Forms of Warrants to Purchase Series A Convertible Preferred Stock | | S-1,
Amendment No. 3 | | 333-198393 | | 4.9 | | December 1, 2014 | | |
| | | | | | |
| 10.1 | | Form of Indemnity Agreement | | S-1,
Amendment No. 3 | | 333-198393 | | 4.9 | | December 1,2014 | | |
| | | | | | |
| 10.2 | | Form of Loan Agreement | | S-1 | | 333-177230 | | 10.1 | | October 7, 2011 | | |
| | | | | | |
| 10.3 | | Form of Borrower Membership Agreement | | S-1 | | 333-177230 | | 10.2 | | October 7, 2011 | | |
| | | | | | |
| 10.4 | | LendingClub Corporation 2007 Stock Incentive Plan, as amended, and form of award agreement thereunder | | S-1,
Amendment No. 3 | | 333-198393 | | 10.4 | | December 1, 2014 | | |
| | | | | | | | | | | | |
| | | | | Incorporated by Reference | | |
Exhibit Number | | Exhibit Description | | Form | | File No. | | Exhibit | | Filing
Date | | Filed
Herewith |
| | | | | | |
| 10.6 | | 2014 Equity Incentive Plan, and forms of award agreements thereunder | | S-1,
Amendment No. 3 | | 333-198393 | | 10.4 | | December 1, 2014 | | |
| | | | | | |
| 10.7 | | 2014 Employee Stock Purchase Plan, and forms of enrollment agreements thereunder | | S-1,
Amendment No. 3 | | 333-198393 | | 10.4 | | December 1, 2014 | | |
| | | | | | |
| 10.8+ | | Second Amended and Restated Loan Sale Agreement, dated as of February 28, 2014, by and between LendingClub Corporation and WebBank | | 10-K | | 000-54752 | | 10.6 | | March 31, 2014 | | |
| | | | | | |
| 10.9+ | | Second Amended and Restated Loan Account Program Agreement, dated as of February 28, 2014, by and between LendingClub Corporation and WebBank | | 10-K | | 000-54752 | | 10.7 | | March 31, 2014 | | |
| | | | | | |
| 10.10 | | Hosting Services Agreement, dated as of October 6, 2008, by and between LendingClub Corporation and FOLIOfn Investments, Inc. | | 10-K | | 333-151827 | | 10.15 | | June 17, 2009 | | |
| | | | | | |
| 10.11 | | Services Agreement, dated as of October 6, 2008, by and between LendingClub Corporation and FOLIOfn Investments, Inc. | | S-1,
Amendment No. 1 | | 333-198393 | | 10.11 | | October 20, 2014 | | |
| | | | | | |
| 10.12 | | License Agreement, dated as of October 6, 2008, by and between LendingClub Corporation and FOLIOfn Investments, Inc. | | 10-K | | 333-151827 | | 10.17 | | June 17, 2009 | | |
| | | | | | |
| 10.13 | | Backup and Successor Servicing Agreement, dated as of September 15, 2011, by and between Portfolio Financial Servicing Company and LendingClub Corporation | | S-1,
Amendment No. 1 | | 333-198393 | | 10.13 | | October 20, 2014 | | |
| | | | | | |
| 10.14 | | Form of Partner Agreement | | S-1/A | | 333-177230 | | 10.28 | | March 19, 2012 | | |
| | | | | | |
| 10.15 | | Form of Employment Agreement for Chief Executive Officer | | S-1,
Amendment No. 3 | | 333-198393 | | 10.4 | | December 1, 2014 | | |
| | | | | | |
| 10.16 | | Form of Employment Agreement for Executive Officers other than Chief Executive Officer | | S-1,
Amendment No. 3 | | 333-198393 | | 10.4 | | December 1, 2014 | | |
| | | | | | |
| 10.20 | | Credit and Guaranty Agreement, dated as of April 16, 2014, among LendingClub Corporation, the guarantors party thereto, the lenders party thereto and Morgan Stanley Senior Funding, Inc. | | S-1, Post-
Effective Amendment No. 4 | | 333-177230 | | 10.23 | | April 29, 2014 | | |
| | | | | | |
| 10.21 | | Pledge and Security Agreement, dated April 16, 2014, by and among LendingClub Corporation, the guarantors referred to therein and Morgan Stanley Senior Funding, Inc. | | S-1, Post-
Effective Amendment No. 4 | | 333-177230 | | 10.24 | | April 29, 2014 | | |
| | | | | | |
| 10.22 | | Lease Agreement, dated as of May 17, 2013, by and between LendingClub Corporation and Forward One, LLC, as amended | | S-1,
Amendment No. 2 | | 333-198393 | | 10.22 | | November 17, 2014 | | |
| | | | | | |
| 10.23 | | Assignment and Assumption of Lease, dated as of October 17, 2014, by and between LendingClub Corporation and Teachscape, Inc. | | S-1,
Amendment No. 2 | | 333-198393 | | 10.23 | | November 17, 2014 | | |
| | | | | | | | | | | | | | |
| | | | | Incorporated by Reference | | | |
Exhibit Number | | Exhibit Description | | Form | | File No. | | Exhibit | | Filing
Date | | Filed
Herewith | |
| | | | | | |
| 10.24 | | Form of Fund Subscription Agreement | | S-1,
Amendment No. 1 | | 333-198393 | | 10.24 | | October 20, 2014 | | | | |
| | | | | | |
| 10.25 | | Form of Investment Advisory Agreement | | S-1,
Amendment No. 1 | | 333-198393 | | 10.25 | | October 20, 2014 | | | | |
| | | | | | |
| 10.26 | | Form of Loan Purchase Agreement | | S-1,
Amendment No. 1 | | 333-198393 | | 10.26 | | October 20, 2014 | | | | |
| | | | | | |
| 10.27 | | Form of Loan Servicing Agreement | | S-1,
Amendment No. 1 | | 333-198393 | | 10.27 | | October 20, 2014 | | | | |
| | | | | | |
| 10.28 | | Form of Investor Agreement | | S-1,
Amendment No. 1 | | 333-198393 | | 10.28 | | October 20, 2014 | | | | |
| | | | | | |
| 10.29 | | Form of LCA Investment Advisory Agreement | | S-1,
Amendment
No. 4 | | 333-198393 | | 10.29 | | December 8, 2014 | | | | |
| | | | | | |
| 10.30 | | Form of Certificate Account Opening and Maintenance Agreement | | S-1,
Amendment
No. 4 | | 333-198393 | | 10.29 | | December 8, 2014 | | | | |
| | | | | | |
| 21.1 | | List of Subsidiaries | | | | | | | | | | | X | |
| | | | | | |
| 23.1 | | Consent of Deloitte & Touche LLP | | | | | | | | | | | X | |
| | | | | | |
| 23.2 | | Consent of Grant Thornton LLP | | | | | | | | | | | X | |
| | | | | | |
| 23.3 | | Consent of Auerr, Zajac & Associates, LLP | | | | | | | | | | | X | |
| | | | | | |
| 31.1 | | Certification of Chief Executive Officer Pursuant to Section 302 of the Sarbanes-Oxley Act of 2002 | | | | | | | | | | | X | |
| | | | | | |
| 31.2 | | Certification of Chief Financial Officer Pursuant to Section 302 of the Sarbanes-Oxley Act of 2002 | | | | | | | | | | | X | |
| | | | | | |
| 32.1 | | Certification of Chief Executive Officer and Chief Financial Officer Pursuant to Section 906 of the Sarbanes-Oxley Act of 2002 | | | | | | | | | | | X | |
| | | | | | |
| 101.INS | | XBRL Instance Document | | | | | | | | | | | X | |
| | | | | | |
| 101.SCH | | XBRL Taxonomy Extension Schema Document | | | | | | | | | | | X | |
| | | | | | |
| 101.CAL | | XBRL Taxonomy Extension Calculation Linkbase | | | | | | | | | | | X | |
| | | | | | |
| 101.DEF | | XBRL Taxonomy Extension Definition Linkbase | | | | | | | | | | | X | |
| | | | | | |
| 101.LAB | | XBRL Taxonomy Extension Label Linkbase | | | | | | | | | | | X | |
| | | | | | |
| 101.PRE | | XBRL Taxonomy Extension Presentation Linkbase | | | | | | | | | | | X | |
+ | Confidential treatment requested |
107
|
| | | | | | | | | | | | |
| | | | | Incorporated by Reference | | |
Exhibit Number | | Exhibit Description | | Form | | File No. | | Exhibit | | Filing Date | | Filed Herewith |
| 3.1 | | Restated Certificate of Incorporation of LendingClub Corporation | | 8-K | | 000-54752 | | 3.1 | | December 16, 2014 | | |
| 3.2 | | Restated Bylaws of LendingClub Corporation | | 8-K | | 333-151827 | | 3.2 | | December 16, 2014 | | |
| 4.1 | | Form of Three-Year Member Payment Dependent Note (included as Exhibit A to Exhibit 4.6) | | S-1, Amendment No. 1 | | 333-198393 | | 4.6 | | October 20, 2014 | | |
| 4.2 | | Form of Five-Year Member Payment Dependent Note (included as Exhibit B to Exhibit 4.6) | | S-1, Amendment No. 1 | | 333-198393 | | 4.6 | | October 20, 2014 | | |
| 4.3 | | Form of Indenture by and between LendingClub Corporation and Wells Fargo Bank, National Association | | S-1, Amendment No. 3 | | 333-151827 | | 4.2 | | October 9, 2008 | | |
| 4.4 | | First Supplemental Indenture, dated as of July 10, 2009, by and between LendingClub Corporation and Wells Fargo Bank, National Association | | S-1, Post- Effective Amendment No. 3 | | 333-151827 | | 4.3 | | July 23, 2009 | | |
| 4.5 | | Second Supplemental Indenture, dated as of May 5, 2010, by and between LendingClub Corporation and Wells Fargo Bank, National Association | | S-1, Post- Effective Amendment No. 5 | | 333-151827 | | 4.5 | | May 6, 2010 | | |
| 4.6 | | Third Supplemental Indenture, dated as of October 3, 2014, by and between LendingClub Corporation and Wells Fargo Bank, National Association. | | S-1, Amendment No. 1 | | 333-198393 | | 4.6 | | October 20, 2014 | | |
| 4.7 | | Amended and Restated Investor Rights Agreement, dated as of April 16, 2014, by and among LendingClub Corporation and the Investors named therein | | 8-K | | 000-54752 | | 4.1 | | April 17, 2014 | | |
| 4.8 | | Form of Common Stock Certificate of LendingClub Corporation | | S-1, Amendment No. 2 | | 333-198393 | | 4.8 | | November 17, 2014 | | |
| 10.1 | | Form of Indemnity Agreement | | S-1, Amendment No. 3 | | 333-198393 | | 10.1 | | December 1,2014 | | |
| 10.2 | | Form of Borrower Agreement | | | | | | | | | | X |
| 10.3 | | LendingClub Corporation 2007 Stock Incentive Plan, as amended, and form of award agreement thereunder | | S-1, Amendment No. 3 | | 333-198393 | | 10.4 | | December 1, 2014 | | |
| 10.4 | | 2014 Equity Incentive Plan, and forms of award agreements thereunder | | S-1,
Amendment
No. 3 | | 333-198393 | | 10.6 | | December 1, 2014 | | |
| 10.5 | | 2014 Employee Stock Purchase Plan, and forms of enrollment agreements thereunder | | S-1,
Amendment
No. 3 | | 333-198393 | | 10.7 | | December 1, 2014 | | |
| 10.6 | | 2016 Cash Retention Bonus Plan | | 10-Q | | 011-36771 | | 10.1 | | August 9, 2016 | | |
|
| | | | | | | | | | | | |
| | | | | Incorporated by Reference | | |
Exhibit Number | | Exhibit Description | | Form | | File No. | | Exhibit | | Filing Date | | Filed Herewith |
| 10.7 | | Hosting Services Agreement, dated as of October 6, 2008, by and between LendingClub Corporation and FOLIOfn Investments, Inc. | | 10-K | | 333-151827 | | 10.15 | | June 17, 2009 | | |
| 10.8 | | Services Agreement, dated as of October 6, 2008, by and between LendingClub Corporation and
FOLIOfn Investments, Inc. | | S-1,
Amendment
No. 1 | | 333-198393 | | 10.11 | | October 20, 2014 | | |
| 10.9 | | License Agreement, dated as of October 6, 2008, by and between LendingClub Corporation and FOLIOfn Investments, Inc. | | 10-K | | 333-151827 | | 10.17 | | June 17, 2009 | | |
| 10.10 | | Backup and Successor Servicing Agreement, dated as of
September 15, 2011, by and between Portfolio Financial Servicing Company and LendingClub Corporation | | S-1,
Amendment
No. 1 | | 333-198393 | | 10.13 | | October 20, 2014 | | |
| 10.11 | | Form of Employment Agreement for Chief Executive Officer | | S-1,
Amendment
No. 3 | | 333-198393 | | 10.15 | | December 1, 2014 | | |
| 10.12 | | Form of Employment Agreement for Executive Officers other than Chief Executive Officer | | S-1,
Amendment
No. 3 | | 333-198393 | | 10.16 | | December 1, 2014 | | |
| 10.13 | | Credit and Guaranty Agreement, dated as of December 17, 2015, among LendingClub Corporation, the guarantors party thereto, Morgan Stanley Senior Funding, Inc. and the lenders party thereto | | 8-K | | 011-36771 | | 10.1 | | December 22, 2015 | | |
| 10.14 | | Pledge and Security Agreement, dated December 17, 2015, by and among LendingClub Corporation, the grantors referred to therein and Morgan Stanley Senior Funding, Inc. | | 8-K | | 011-36771 | | 10.2 | | December 22, 2015 | | |
| 10.15 | | Lease Agreement, dated as of May 17, 2013, by and between LendingClub Corporation and Forward One, LLC, as amended | | S-1,
Amendment
No. 2 | | 333-198393 | | 10.22 | | November 17, 2014 | | |
| 10.16 | | Assignment and Assumption of Lease, dated as of October 17, 2014, by and between LendingClub Corporation and Teachscape, Inc. | | S-1,
Amendment
No. 2 | | 333-198393 | | 10.23 | | November 17, 2014 | | |
| 10.17 | | Lease Agreement, dated as of April 16, 2015, by and between LendingClub Corporation and 595 Market Street, Inc. | | 10-Q | | 011-36771 | | 10.31 | | May 5, 2015 | | |
| 10.18 | | Form of Fund Subscription Agreement | | S-1,
Amendment
No. 1 | | 333-198393 | | 10.24 | | October 20, 2014 | | |
| 10.19 | | Form of Investment Advisory Agreement | | S-1,
Amendment
No. 1 | | 333-198393 | | 10.25 | | October 20, 2014 | | |
| 10.20 | | Form of Master Loan Purchase Agreement | | 10-Q | | 011-36771 | | 10.1 | | November 9, 2016 | | |
| 10.21 | | Form of Master Loan Servicing Agreement | | 10-Q | | 011-36771 | | 10.2 | | November 9, 2016 | | |
| 10.22 | | Form of Investor Agreement | | 10-Q | | 011-36771 | | 10.5 | | August 5, 2015 | | |
|
| | | | | | | | | | | | |
| | | | | Incorporated by Reference | | |
Exhibit Number | | Exhibit Description | | Form | | File No. | | Exhibit | | Filing Date | | Filed Herewith |
| 10.23 | | Form of LCA Investment Advisory Agreement | | S-1,
Amendment
No. 4 | | 333-198393 | | 10.29 | | December 8, 2014 | | |
| 10.24 | | Form of Certificate Account Opening and Maintenance Agreement | | S-1,
Amendment
No. 4 | | 333-198393 | | 10.30 | | December 8, 2014 | | |
| 21.1 | | List of Subsidiaries | | | | | | | | | | X |
| 23.1 | | Consent of Deloitte & Touche LLP | | | | | | | | | | X |
| 31.1 | | Certification of Chief Executive Officer Pursuant to Section 302 of the Sarbanes-Oxley Act of 2002 | | | | | | | | | | X |
| 31.2 | | Certification of Chief Financial Officer Pursuant to Section 302 of the Sarbanes-Oxley Act of 2002 | | | | | | | | | | X |
| 32.1 | | Certification of Chief Executive Officer and Chief Financial Officer Pursuant to Section 906 of the Sarbanes-Oxley Act of 2002 | | | | | | | | | | X |
| 101.INS | | XBRL Instance Document | | | | | | | | | | X |
| 101.SCH | | XBRL Taxonomy Extension Schema Document | | | | | | | | | | X |
| 101.CAL | | XBRL Taxonomy Extension Calculation Linkbase | | | | | | | | | | X |
| 101.DEF | | XBRL Taxonomy Extension Definition Linkbase | | | | | | | | | | X |
| 101.LAB | | XBRL Taxonomy Extension Label Linkbase | | | | | | | | | | X |
| 101.PRE | | XBRL Taxonomy Extension Presentation Linkbase | | | | | | | | | | X |
+ Confidential treatment requested