UNITED STATES
SECURITIES AND EXCHANGE COMMISSION
Washington, D.C. 20549
FORM 10-K
| x | ANNUAL REPORT PURSUANT TO SECTION 13 OR 15(d) OF THE SECURITIES EXCHANGE ACT OF 1934 |
For the Fiscal Year Ended December 31, 20142015
OR
| ¨ | TRANSITION REPORT PURSUANT TO SECTION 13 OR 15(d) OF THE SECURITIES EXCHANGE ACT OF 1934 |
For the Transition Period From to
Commission File Number 001-35004
FLEETCOR TECHNOLOGIES, INC.
| DELAWARE | 72-1074903 | |
| (STATE OF INCORPORATION) | (I.R.S. ID) |
5445 Triangle Parkway, Suite 400, Norcross, Georgia 30092-2575
(770) 449-0479
Securities registered pursuant to Section 12(b) of the Act:
| COMMON STOCK, $0.001 PAR VALUE PER SHARE | NEW YORK STOCK EXCHANGE |
Securities registered pursuant to Section 12(g) of the Act:
NONE
Indicate by check mark if the registrant is a well-known seasoned issuer, as defined in Rule 405 of the Securities Act. Yes x No ¨
Indicate by check mark if the registrant is not required to file reports pursuant to Section 13 or Section 15(d) of the Exchange Act. Yes ¨ No x
Indicate by check mark whether the registrant (1) has filed all reports required to be filed by Section 13 or 15(d) of the Securities Exchange Act of 1934 during the preceding 12 months (or for such shorter period that the registrant was required to file such reports), and (2) has been subject to such filing requirements for the past 90 days. Yes x No ¨
Indicate by check mark whether the registrant has submitted electronically and posted on its corporate Web site, if any, every Interactive Data File required to be submitted and posted pursuant to Rule 405 of Regulation S-T (§232.405 of this chapter) during the preceding 12 months (or for such shorter period that the registrant was required to submit and post such files). Yes x No ¨
Indicate by check mark if disclosure of delinquent filers pursuant to Item 405 of Regulation S-K (§229.405 of this chapter) is not contained herein, and will not be contained, to the best of registrant’s knowledge, in definitive proxy or information statements incorporated by reference in Part III of this Form 10-K or any amendment to thisForm 10-K. ¨
Indicate by check mark whether the registrant is a large accelerated filer, an accelerated filer, a non-accelerated filer, or a smaller reporting company. See the definitions of “large accelerated filer,” “accelerated filer” and “smaller reporting company” in Rule 12b-2 of the Exchange Act.
| Large accelerated filer | x | Accelerated filer | ¨ | |||
| Non-accelerated filer | ¨ (Do not check if a smaller reporting company) | Smaller reporting company | ¨ | |||
Indicate by check mark whether the registrant is a shell company (as defined in Rule 12b-2 of the Exchange Act). Yes ¨ No x
The aggregate market value of the registrant’s common stock held by non-affiliates of the registrant was approximately $10,086,100,000$13,498,625,921 as of June 30, 2014,2015, the last business day of the registrant’s most recently completed second fiscal quarter, based on the closing sale price as reported on the New York Stock Exchange.
As of February 6, 2015,15, 2016, there were 91,677,37692,616,940 shares of common stock outstanding.
DOCUMENTS INCORPORATED BY REFERENCE
Portions of the registrant’s definitive Proxy Statement to be delivered to shareholders in connection with the Annual Meeting of Shareholders to be held on June 10, 20158, 2016 are incorporated by reference into Part III of this report.
FLEETCOR TECHNOLOGIES, INC.
FORM 10-K
For The Year Ended December 31, 20142015
| Page | |||||||||||||
PART I | |||||||||||||
Item 1. | 4 | ||||||||||||
Item X. | |||||||||||||
Item 1A. | |||||||||||||
Item 1B. | |||||||||||||
| 40 | |||||||||||||
Item | |||||||||||||
| 41 | |||||||||||||
| Legal Proceedings | 42 | |||||||||||
Item 4. | Mine Safety Disclosures | 42 | |||||||||||
PART II | |||||||||||||
Item 5. | |||||||||||||
Item 6. | 45 | ||||||||||||
Item 7. | Management’s Discussion and Analysis of Financial Condition and Results of Operations | ||||||||||||
Item 7A. | |||||||||||||
Item 8. | |||||||||||||
Item 9. | Changes in and Disagreements with Accountants on Accounting and Financial Disclosure | ||||||||||||
Item 9A. | 120 | ||||||||||||
Item 9B. | Other Information | 121 | |||||||||||
PART III | |||||||||||||
Item 10. | |||||||||||||
Item 11. | |||||||||||||
Item 12. | Security Ownership of Certain Beneficial Owners and Management and Related Stockholder Matters | ||||||||||||
Item 13. | Certain Relationships and Related Transactions, and Director Independence | ||||||||||||
Item 14. | |||||||||||||
PART IV | |||||||||||||
Item 15. | |||||||||||||
| Signatures |
| 127 | |||||||||||
Note About Forward-Looking Statements
This report contains forward-looking statements within the meaning of the federal securities laws. Statements that are not historical facts, including statements about FleetCor’s beliefs, expectations and future performance, are forward-looking statements. Forward-looking statements can be identified by the use of words such as “anticipate,” “intend,” “believe,” “estimate,” “plan,” “seek,” “project” or “expect,” “may,” “will,” “would,” “could” or “should,” the negative of these terms or other comparable terminology.
These forward-looking statements are not a guarantee of performance, and you should not place undue reliance on such statements. We have based these forward-looking statements largely on our current expectations and projections about future events. Forward-looking statements are subject to many uncertainties and other variable circumstances, including those discussed in this report in Item 1A, “Risk factors,” and Item 7, “Management’s Discussion and Analysis of Financial Condition and Results of Operations,” many of which are outside of our control, that could cause our actual results and experience to differ materially from any forward-looking statement. Given these risks and uncertainties, you are cautioned not to place undue reliance on these forward-looking statements. The forward-looking statements included in this report are made only as of the date hereof. We do not undertake, and specifically disclaim, any obligation to update any such statements or to publicly announce the results of any revisions to any of such statements to reflect future events or developments.
PART I
General
FleetCor is a leading independent global provider of fuel cards, commercial payment and data solutions, lodging and transportation management services, stored value solutions, and workforce payment products and services to businesses, retailers, commercial fleets, major oil companies, petroleum marketers and government entities in countries throughout North America, Latin America, Europe, Australia and New Zealand. Our payment programs enable our customers to better manage and control their commercial payments, card programs, and employee spending and provide card-accepting merchants with a high volume customer base that can increase their sales and customer loyalty. We also provide a suite of fleet related and workforce payment solution products, including mobile telematics services, fleet maintenance management and employee benefit and transportation related payments. In 2014,2015, we processed approximately 652 million1.9 billion transactions on our proprietary networks and third-party networks (which includes approximately 270 million1.3 billion transactions related to our SVS product, acquired with Comdata)Comdata, Inc. (“Comdata”)). We believe that our size and scale, geographic reach, advanced technology and our expansive suite of products, services, brands and proprietary networks contribute to our leading industry position.
We provide our payment products and services in a variety of combinations to create customized payment solutions for our customers and partners. In order to deliver our payment programs and services and process transactions, we own and operate proprietary “closed-loop” networks through which we electronically connect to merchants and capture, analyze and report customized information. We also use third-party networks to deliver our payment programs and services in order to broaden our card acceptance and use. To support our payment products, we also provide a range of services, such as issuing and processing, as well as specialized information services that provide our customers with value-added functionality and data. Our customers can use this data to track important business productivity metrics, combat fraud and employee misuse, streamline expense administration and lower overall workforce and fleet operating costs.
We market our fleet payment products directly to a broad range of commercial fleet customers, oil companies, petroleum marketers and government entities. Among these customers, we provide our products and services to commercial fleets of all sizes. These fleets include small and medium commercial fleets, which we believe represent an attractive segment of the global commercial fleet market given their relatively high use of less efficient payment products, such as cash and general purpose credit cards. We also manage commercial fleet card programs for major oil companies, such as British Petroleum (BP) (including its subsidiary Arco), Chevron and Shell, and over 1,100900 petroleum marketers.
We distribute our commercial payment solutions through direct and indirect channels to businesses of all sizes and types across a broad number of industry verticals, including retail, healthcare, construction and hospitality. Our indirect channel includes a broad range of value-added resellers (VARs) and other referral partners.
We refer to these major oil companies, leasing companies, petroleum marketers, VARs and other referral partners with whom we have strategic relationships as our “partners.” These partners collectively maintain hundreds of thousands of end-customer relationships with commercial fleets, commercial payment solutions customers and other businesses.
FleetCor’s predecessor company was organized in the United States in 1986.
Our products and services
We collectively refer to our suite of product offerings as workforce productivity enhancement products for commercial businesses. We sell a range of customized fleet and lodging payment programs directly and
indirectly to our customers through partners, such as major oil companies, leasing companies and petroleum
marketers. We provide our customers with various card products that typically function like a charge card to purchase fuel, lodging, food, toll, transportation and related products and services at participating locations. We support these cards with specialized issuing, processing and information services that enable us to manage card accounts, facilitate the routing, authorization, clearing and settlement of transactions, and provide value-added functionality and data, including customizable card-level controls and productivity analysis tools. Depending on our customers and partners needs, we provide these services in a variety of outsourced solutions ranging from a comprehensive “end-to-end” solution (encompassing issuing, processing and network services) to limited back office processing services.
Our broad suite of commercial payment solutions with vertical-specific applications enable our corporate customers to manage and control electronic payments across their enterprise, optimize corporate spending and offer innovative services that increase employee efficiency and customer loyalty. Our commercial payment solutions offer integrated components that create a powerful combination of robust payment functionality, deep business insights and comprehensive technical capabilities and support services.
In addition, we offer a telematics solution that combines global positioning, satellite tracking and other wireless technology to allow fleet operators to monitor the capacity utilization and movement of their vehicles and drivers. We also provide a vehicle maintenance service offering that helps fleet customers to better manage their vehicle maintenance, service, and repair needs in the U.K. In Mexico, we offer primarily prepaid fuel and food vouchers and cards that may be used as a form of payment in restaurants, grocery stores and gas stations. We market these payment products to small, medium and large businesses, which provide these cards and vouchers to their employees as benefits, as well as a tool to manage fuel expenses. We offer a similar workforce payment product in Brazil related to public transportation and toll vouchers. Additionally in Brazil, we have designed proprietary equipment which, when installed at the fueling site and on the vehicle and combined with our processing system, significantly reduces the likelihood of unauthorized and fraudulent transactions. We offer this product to over-the-road trucking fleets, shipping fleets and other operators of heavily industrialized equipment, including sea-going vessels, mining equipment, agricultural equipment, and locomotives. Other than our fuel card products and services, no other products or services accounted for 10% or more of consolidated revenues in any of the last three fiscal years.
Networks
In order to deliver our payment programs and services, we own and operate proprietary closed-loop networks in North America and internationally. In other cases weWe also utilize the networks of our major oil and petroleum marketer partners.partners in certain markets. Our networks have well-established brands in local markets and proprietary technology that enable us to capture, transact, analyze and report value-added information pertinent to managing and controlling employee spending. Examples of our networks include:
North America proprietary closed-loop networks
| • | Fuelman network—our primary proprietary fleet card network in the United States. We have negotiated card acceptance and settlement terms with over 11,000 individual merchants, providing the Fuelman network with approximately |
| • | Comdata Network—our network of truck stops and fuel merchants for the over-the-road trucking industry. We have negotiated card acceptance and settlement terms at over |
| • | Corporate Lodging Consultants network (CLC)—our proprietary lodging network in the United States and Canada. The CLC Lodging network includes approximately |
| • | Commercial Fueling Network (CFN)—our “members only” |
member, and the majority of which are unattended cardlock facilities. The CFN network provides fuel card authorization, transaction processing and cardlock site branding for over |
| • | Marcus—our proprietary fleet management telematics solution serving customers primarily in the United States and Canada. The Marcus solution provides fleet management services to more than 100,000 devices across North America. |
| • | Pacific Pride Fueling Network (PacPride)—our branded fueling network in the United States |
International proprietary closed-loop networks
| • | Allstar network—our proprietary fleet card network in the United Kingdom. We have negotiated card acceptance and settlement terms with approximately |
| • | Keyfuels network—our proprietary fleet card network in the United Kingdom. We have negotiated card acceptance and settlement terms with more than 480 individual merchants, providing the Keyfuels network with over |
| • | CCS network—our primary proprietary fleet card network in the Czech Republic and Slovakia. We have negotiated card acceptance and settlement terms with several major oil companies on a brand-wide basis, including Agip, Benzina, OMV and Shell, and with approximately |
| • | Petrol Plus Region (PPR) network—our primary proprietary fleet card network in Russia, Poland, Ukraine, Belarus, Kazakhstan and |
| • | Efectivale network—our proprietary fuel and food card and voucher networks in Mexico. We have negotiated acceptance and settlement terms with over |
| • | CTF network—our proprietary fuel controls network in Brazil. We have partnerships with BR Distribuidora (Petrobas) and Ipiranga Distribuidora, retail oil distributors, as well as other fuel providers, in Brazil. CTF’s processing system works at over |
| • | 1link service network—our proprietary maintenance and repair network in the United Kingdom. The 1link network processes transactions for fleet customers through more than 9,000 service centres across the United Kingdom. |
| • | RODOCRED network—our proprietary toll network in Brazil. The RODOCRED network processes toll transactions for more than |
| • | VB Distribution system—our proprietary distribution network in Brazil for transportation cards, meal/grocery cards, and fuel cards. The VB distribution network distributes cards for more than |
Third-Party networks
In addition to our proprietary “closed-loop” networks, we also utilize various third-party networks to deliver our payment programs and services. Examples of these networks include:
| • | MasterCard network—In the United States and Canada, we issue corporate cards that utilize the MasterCard payment network, which includes over |
| • | Major oil and fuel marketer networks—The proprietary networks of branded locations owned by our major oil and petroleum marketer partners in both North America and internationally are generally utilized to support the proprietary, branded card programs of these partners. |
| • | UTA network—UNION TANK Eckstein GmbH & Co. KG (UTA) operates a network of over |
| • | DKV network—DKV operates a network of over |
| • | Carnet networks—In Mexico, we issue fuel cards and food cards that utilize the Carnet payment network, which includes over |
Customers and distribution channels
We provide our fleet products and services primarily to trucking companies, commercial fleet customers and our major oil company and petroleum marketer partners. Our commercial fleet customers are businesses that operate fleets comprised of one or more vehicles, including small fleets (1-10 vehicles), medium fleets (11-150 vehicles), large fleets (over 150 vehicles), and government fleets (which are owned and operated by governments). We also provide services through strategic relationships with our partners, ranging in size from major oil companies, such as British Petroleum (BP) (including its subsidiary, Arco), Chevron and Shell, to smaller petroleum marketers with as little as a single fueling location. While we refer to companies with whom we have strategic relationships as “partners,” our legal relationships with these companies are contractual, and do not constitute legal partnerships.
We distribute our fleet products and services directly to trucking companies and commercial fleet customers as well as through our major oil company and petroleum marketer partners. We provide comprehensive “end-to-end” support for our direct card programs that include issuing, processing and network services. We manage and market the fleet card programs of our partners under our partners’ own brands. We support these programs with a variety of business models ranging from fully outsourced card programs, which include issuing, processing and network services, to card programs where we may only provide limited back office processing services. These supporting services vary based on our partners’ needs and their own card program capabilities.
We primarily provide issuing, processing and information services to our major oil company partners, as these partners utilize their proprietary networks of branded locations to support their card programs. In addition, we provide network services to those major oil company partners who choose to offer a co-branded MasterCard as
part of their card program. Our agreements with our major oil company partners typically have initial terms of
five to ten years with current remaining terms ranging from two to seven years. Our top three strategic relationships with major oil companies represented in the aggregate approximately 9%, 13%, and 16% of our consolidated revenue for the years ended December 31, 2014, 2013 and 2012, respectively. No single partner represented more than 10% of our consolidated revenue in 2015, 2014 2013 or 2012.2013.
We provide similar fleet products and services to government fleet customers as we provide to other commercial fleet customers. Our government fleet customers generally constitute local, state or federal government-affiliated departments and agencies with vehicle fleets, such as police vehicle fleets and school bus fleets. We provide food, fuel, toll and transportation cards and vouchers to commercial businesses, fleets and governmental agencies.
We distribute our commercial payment solutions through direct and indirect channels to businesses of all sizes and types across a broad number of industry verticals. We serve customers across numerous industry verticals, such as retail, healthcare, construction and hospitality as well as general commercial payment services in energy, entertainment, insurance and trade finance. We provide our commercial payment solutions under contracts with our customers. Terms such as exclusivity, mandatory minimum contract payments and pricing terms vary based on scope of use, usage volumes, incentives and contract duration. When our commercial payment solutions include short term credit, our contracts for those solutions contain credit and collection terms. Contracts for our commercial stored value solutions include a description and pricing for our services and deliverables associated with those solutions.
For a description of our financial information by our North America and International segments and geographical areas, see “Note 15—Segments.”
Sales and marketing
We market our products and services to fleet operators and businesses in North America and internationally through multiple channels including field sales, telesales, direct marketing, point-of-sale marketing and the internet. We also leverage the sales and marketing capabilities of our strategic relationships with over 1,100900 oil companies, petroleum marketers, card marketers, leasing companies, VARs and other referral partners. We employ sales and marketing employees worldwide that are focused on acquiring new customers for all of our direct business card programs, select card programs for oil companies, petroleum marketers and other services to fleets. We also utilize tradeshows, advertising and other awareness campaigns to market our products and services.
In marketing our products and services, we emphasize the size and reach of our acceptance networks, the benefits of our purchasing controls and reporting functionality and a commitment to high standards of customer service.
We utilize proprietary and third-party databases to develop our prospect universe, and segment those prospects by various characteristics, including industry, geography, fleet size and credit score, to identify potential customers. We develop customized offers for different types of potential customers and work to deliver those offers through the most effective marketing channel. We actively manage prospects across our various marketing channels to optimize our results and avoid marketing channel conflicts.
Our primary means of acquiring new customers include:
| • | Field sales—Our direct sales team includes field sales representatives, who conduct face-to-face sales presentations and product demonstrations with prospects, assist with post-sale program implementation and training and provide in-person account management. Field sales representatives also attend and manage our marketing at tradeshows. Our field sales force is dedicated to fleet products and other services and generally targets fleets with more than 15 vehicles or cards. Our field sales force for corporate payment solutions targets large and mid-sized businesses primarily in the United States. We |
also have small field sales teams targeting large and medium sized retailers as prospective customers of our stored value products in the Americas, Asia-Pacific and Europe. |
| • | Telesales—We have telesales representatives handling inbound and outbound sales calls. |
| • | Direct marketing—We market directly to potential fleet customers via mail and email. We test various program offers and promotions, and adopt the most successful features into subsequent direct marketing initiatives. We seek to enhance the sales conversion rates of our direct marketing efforts by coordinating timely follow-up calls by our telesales teams. |
| • | Point-of-sale marketing—We provide marketing literature at the point-of-sale within our proprietary networks and those of major oil companies and petroleum marketers. Literature may include “take-one” applications, pump-top advertising and in-store advertising. Our point-of-sale marketing leverages the branding and distribution reach of the physical merchant locations. |
| • | Internet marketing—We manage numerous marketing websites around the world and purchase both banner and pay-per-click advertisements. Our marketing websites tend to fall into two categories: product-specific websites and marketing portals. Our Web advertisements focus on key words and sites frequently used by our target customers. |
| • | Product-specific websites—Our product-specific websites, including fuelman.com, cfnnet.com, checkinncard.com and keyfuels.co.uk, focus on one or more specific products, provide the most in-depth information available online regarding those particular products, allow prospects to apply for cards online (where appropriate) and allow customers to access and manage their accounts online. We manage product-specific websites for our own proprietary card programs as well as card programs of select oil companies and petroleum marketers. |
| • | Marketing portals—Our marketing portals, including fleetcardsUSA.com and fuelcards.co.uk, serve as information sources for fleet operators interested in fleet card products. In addition to providing helpful information on fleet management, including maintenance, tax reporting and fuel efficiency, these websites allow fleet operators to research card products, compare the features and benefits of multiple products, and identify the card product which best meets the fleet manager’s needs. Our exclusive FleetMatch™ technology matches an operator’s information, including fleet size, geographic span of operations and fuel type usage, to the benefits and features of our various fleet card products and provides a customized product recommendation to the fleet manager. |
As part of our internet marketing strategy, we monitor and modify our marketing websites to improve our search engine rankings and test our advertising keywords to optimize our pay-per-click advertising spend among the major internet search firms such as Google and Yahoo.
| • | Strategic relationships—We have developed and currently manage relationships with over |
may or may not be accepted in one of our merchant networks. We benefit from the marketing efforts of major oil companies and petroleum marketers with whom we have strategic relationships to attract customers to their fueling locations. We manage the fleet card sales and marketing efforts for several major oil companies across the full spectrum of channels, including field sales, telesales, direct marketing, point-of-sale marketing and internet marketing. In these cases, we establish dedicated sales |
and marketing teams to focus exclusively on marketing the products of major oil companies and petroleum marketers. Our major oil company relationships include some of the world’s largest oil companies such as BP, Chevron and Shell. Through our leasing company relationships, we offer our payment processing, vehicle maintenance and information management services to their fleet customers as part of the leasing company’s broader package of fleet services. Our leasing company relationships all reside outside of North America, and we view these relationships as an important strategic growth area. |
Our indirect channel includes a broad range of VARs and other referral partners that expand our reach into smaller businesses, new industry verticals and new geographies faster and at a significantly lower cost. We provide our commercial payment solutions, third-party processing services and other fleet services to these partners who offer our services under our brands or their own brands on a “white-label” basis. For example, we provide healthcare payment solutions through healthcare networks, corporate payment solutions through software and services providers and payroll card solutions through payroll service providers.
Account management
| • | Customer service, account activation, account retention. We provide account management and customer service to our customers. Based in dedicated call centers across our key markets, these professionals handle transaction authorizations, billing questions and account changes. Customers also have the opportunity to self-service their accounts through interactive voice response and online tools. We monitor the quality of the service we provide to our customers by adhering to industry standard service levels with respect to abandon rates and answer times and through regular agent call monitoring. We also conduct regular customer surveys to ensure customers are satisfied with our products and services. In addition to our base customer service support, we provide the following specialized services: |
| • | Implementation and activation—We have dedicated implementation teams that are responsible for establishing the system set-up for each customer account. These teams focus on successful activation and utilization of our new customers and provide training and education on the use of our products and services. Technical support resources are provided to support the accurate and timely set-up of technical integrations between our proprietary processing systems and customer systems (e.g., payroll, enterprise resource planning and point-of-sale). Larger accounts are provided dedicated program managers who are responsible for managing and coordinating customer activities for the duration of the implementation. These program managers are responsible for the successful set-up of accounts to meet stated customer objectives. |
| • | Strategic account management—We assign designated account managers who serve as the single point of contact for our large accounts. Our account managers have in-depth knowledge of our programs and our customers’ operations and objectives. Our account managers train customer administrators and support them on the operation and optimal use of our programs, oversee account setup and activation, review online billing and create customized reports. Our account managers also prepare periodic account reviews, provide specific information on trends in their accounts and work together to identify and discuss major issues and emerging needs. |
| • | Account retention—We have proprietary, proactive strategies to contact customers who may be at risk of terminating their relationship with us. Through these strategies we seek to address service concerns, enhance product structures and provide customized solutions to address customer issues. |
| • | Customer service—Day-to-day servicing representatives are designated for customer accounts. These designated representatives are responsible for the daily service items and issue resolution of customers. These servicing representatives are familiar with the nuanced requirements and specifics of a customer’s program. Service representatives are responsible for customer training, fraud disputes, card orders, card maintenance, billing, etc. |
| • | Merchant network services—Our representatives work with merchants such as fuel and vehicle maintenance providers to enroll them in one of our proprietary networks, install and test all network and terminal software and hardware and train them on the sale and transaction authorization process. In addition, our representatives provide transaction analysis and site reporting and address settlement issues. |
| • | Call center program administrator—Off-hour call center support is provided to customers to handle time-sensitive requests and issues outside of normal business hours. |
| • | Management tools—We offer a variety of online servicing tools that enable companies to identify and provide authority to program administrators to self-service their accounts. |
Additionally, we provide cardholder support for individuals utilizing our payment tools, such as fleet, T&E, gift cards, and stored value payroll cards. This support enables cardholders the ability to activate cards, check balances, and resolve issues in a timely and effective fashion. Cardholder support is conducted 24-hours a day, seven-days per week in multiple languages utilizing telephony, web and call center technologies to deliver comprehensive and cost effective servicing. We have rigorous operational metrics in place to increase cardholder responsiveness to corporate and customer objectives.
| • | Credit underwriting and collections. We follow detailed application credit review, account management, and collections procedures for all customers of our payment solutions. We use multiple levers including billing frequency, payment terms, spending limits and security to manage risk in our portfolio. For the years ended December 31, |
| • | New account underwriting. We use a combination of quantitative, third-party credit scoring models and judgmental underwriting to screen potential customers and establish appropriate credit terms and spend limits. Our underwriting process provides additional scrutiny for large credit amounts and we utilize tiered credit approval authority among our management. |
| • | Prepaid and secured accounts. We also offer products and services on a prepaid or fully-secured basis. Prepaid customer accounts are funded with an initial deposit and subsequently debited for each purchase transacted on the cards issued to the customer. Fully-secured customer accounts are secured with cash deposits, letters of credit and/or insurance bonds. The security is held until such time as the customer either fails to pay the account or closes its account after paying outstanding amounts. Under either approach, our prepaid and fully-secured offerings allow us to market to a broader universe of prospects, including customers who might otherwise not meet our credit standards. |
| • | Monitoring and account management. We use fraud detection programs, including both proprietary and third party solutions, to monitor transactions and prevent misuse of our products. We monitor the credit quality of our portfolio periodically utilizing external credit scores and internal behavior data to identify high risk or deteriorating credit quality accounts. We conduct targeted strategies to minimize exposure to high risk accounts, including reducing spending limits and payment terms or requiring additional security. |
| • | Collections. As accounts become delinquent, we may suspend future transactions based on our risk assessment of the account. Our collections strategy includes a combination of internal and outsourced resources which use both manual and dialer-based calling strategies. We use a segmented collection strategy which prioritizes higher risk and higher balance accounts. For severely delinquent, high balance accounts we may pursue legal remedies. |
Competition
We face considerable competition in our business. The most significant competitive factors in our business are the breadth of product and service features, network acceptance size, customer service and account management
and price. We believe that we generally compete favorably with respect to each of these factors. However, we may experience competitive disadvantages with respect to each of these factors from time to time as potential customers prioritize or value these competitive factors differently. As a result, a specific offering of our products and service features, networks and pricing may serve as a competitive advantage with respect to one customer and a disadvantage for another based on the customers’ preferences.
We compete with independent fleet card providers, providers of card and employee benefit outsourcing services and major financial services companies as well as major oil companies and petroleum marketers that issue their own fleet cards. We also compete with providers of alternative payment mechanisms, such as financial institutions that issue corporate and consumer credit cards, and merchants offering house accounts as well as other forms of credit. Our largest independent fleet card and workforce productivity solutions competitors include WEX Inc., U.S. Bank Voyager Fleet Systems Inc., Electronic Funds Source LLC, World Fuel Services Corporation, Embratec, Edenred, Sodexo, Inc., Alelo, Ebbon-Dacs, Fleet on Demand, Radius, STP and GoodCard.
Our corporate payments business competes with large financial institutions and American Express. Such entities will often offer extended payment terms as well as more broadly packaged treasury management services. In highly competitive situations, we differentiate our business primarily based upon the utilization of both open and proprietary payment networks, integrated process flows and aggressive vendor enrollment programs which all in turn allow for faster and deeper accounts payable penetration and greater savings on accounts payable spend. Our business competes on ease of program integration, reporting and data, customer rebates, cardholder features, payment terms and network acceptance.
The competitive landscape for open-loop stored value cards is fragmented with entities playing different roles and going to market with different distribution strategies. Program managers include companies such as First Data Corporation, Fidelity National Information Services, Inc., Global Cash Card, Unirush and Skylight Financial, which is owned by Total System Services, Inc. Payroll companies offering stored value solutions include companies such as Automatic Data Processing, Inc., Paychex, Inc. and Heartland Payment Systems, Inc. Additionally, financial institutions offer stored value products as part of a broader suite of treasury management services or as direct-to-consumer replacements for traditional credit or debit cards (referred to as general purpose reloadable products). Such institutions include Bank of America, Citibank, J.P. Morgan Chase, PNC Bank, U.S. Bank and Wells Fargo Bank. We do not offer a consumer funded general purpose reloadable card, but rather focus on corporate customers utilizing payroll cards to ease their administration and provide a value-added benefit to their employees.
We primarily compete with a number of national companies in providing closed-loop gift cards, the largest of which include First Data Corporation and Vantiv, Inc. We also compete with businesses that rely on in-house solutions. We compete for stored value solutions business on the basis of breadth of services, systems, technology, customer service and price.
We also compete with a number of companies in the telematics space, the largest of which include Fleetmatics, Omnitracs, Trimble, Danaher, Zonar, Verizon, TomTom, Digicore, Transics and Fleetlogic.
Technology
Our technology provides continuous authorization of transactions, processing of critical account and client information and settlement between merchants, issuing companies and individual commercial entities. We recognize the importance of state-of-the-art, secure, efficient and reliable technology in our business and have
made significant investments in our applications and infrastructure. In 2014,2015, we spent more than $59$100 million in capital and operating expenses to operate, protect and enhance our technology and that amount is expectedexpect to increase to more than $113 million in 2015 due tocontinue the continued build out of our proprietary processing platform in Europe and Asia, as well as the integration of our recently acquired businesses.
Our technology function is based in the United States, Europe and Brazil and has expertise in the management of applications, transaction networks and infrastructure. We operate application development centers in the United States, United Kingdom, Netherlands, Russia, Czech Republic, Brazil and New Zealand. Our distributed application architecture allows us to maintain, administer and upgrade our systems in a cost-effective and flexible manner. We integrate our systems with third-party vendor applications for certain products, sales and customer relationship management and back-office support. Our technology organization has undertaken and successfully executed large scale projects to develop or consolidate new systems, convert oil company and petroleum marketer systems and integrate acquisitions while continuing to operate and enhance existing systems.
Our technology infrastructure is supported by best-in-class, highly-secure data centers, with redundant locations. We operate foursix primary data centers, located in Atlanta, Georgia, Brentwood, Tennessee, Prague, Czech Republic, Las Vegas, Nevada, Louisville, Kentucky and Moscow, Russia. We use only proven technology and have no foreseeable capacity limitations. Our systems meet the highestalign with industry standards for security with multiple industry certifications. Our network is configured with multiple layers of security to isolate our databases from unauthorized access. We use sophisticated security protocols for communication among applications, and our employees access critical components on a need-only basis. As of December 31, 2014,2015, we have not experienced any breaches in network, application or data security.security breaches.
We maintain up-to-date disaster recovery and business continuity plans. Our telecommunications and internet systems have multiple levels of redundancy to ensure reliability of network service. In 2014,2015, we experienced 99.99% up-time for authorizations.
Proprietary processing systems
We operate several proprietary processing systems that provide the features and functionality to run our card programs and product offerings, including our card issuing, processing and information services. Our processing systems also integrate with our proprietary networks, which provide brand awareness and connectivity to our acceptance locations that enables the “end-to-end” card acceptance, data capture and transaction authorization capabilities of our card programs. Our proprietary processing systems and aggregation software are tailored to meet the unique needs of the individual markets they serve and enable us to create and deliver commercial payment solutions and stored value programs that serve each of our industry verticals and geographies. Our technology platforms are primarily comprised of four key components, which were primarily developed and are maintained in-house: (1) a core processing platform; (2) specialized software; (3) integrated network capabilities; and (4) a cloud based architecture with proprietary APIs.
Intellectual property
Our intellectual property is an important element of our business. We rely on trademark, copyright, trade secret, patent and other intellectual property laws, confidentiality agreements, contractual provisions and similar measures to protect our intellectual property. Our employees involved in technology development in some of the countries in which we operate, including the United States, are required to sign agreements acknowledging that all intellectual property created by them on our behalf is owned by us. We also have internal policies regarding the protection, disclosure and use of our confidential information. Confidentiality, license or similar agreements or clauses are generally used with our business partners and vendors to control access, use and distribution of our intellectual property. Unauthorized persons may attempt to obtain our intellectual property despite our efforts and others may develop similar intellectual property independently. We own trade names, service marks, trademarks and registered trademarks supporting a number of our brands, such as FleetCor, Fuelman, FleetNet, Global FleetNet, FleetCards USA, Comdata, Comchek , SVS, CFN, NexTraq, CrewView, and Mannatec in the United
States. We also own trademarks and registered trademarks in various foreign jurisdictions for a number of our brands, such as Keyfuels, The Fuelcard Company, CCS, iMonitor, Transit Card, Allstar, Epyx, 1link, PPR, NKT, CTF, CardLink, and Efectivale. We hold a number of patents and pending applications relating to payment card, packaging, fuel tax returns and telematics inventions.
Acquisitions
Since 2002, we have completed over 65 acquisitions of companies and commercial account portfolios. Acquisitions have been an important part of our growth strategy, and it is our intention to continue to seek opportunities to increase our customer base and diversify our service offering through further strategic acquisitions. For a discussion of recent acquisitions, see “Management’s Discussion and Analysis of Financial Conditions and Results of Operations—Acquisitions”.
Regulatory
A substantial number of laws and regulations, both in the United States and in other jurisdictions, apply to businesses offering payment cards to customers or processing or servicing for payment cards and related accounts. These laws and regulations are often evolving and sometimes ambiguous or inconsistent, and the extent to which they apply to us and our subsidiaries is at times unclear. Failure to comply with regulations may result in the suspension or revocation of licenses or registrations, the limitation, suspension, or termination of services, and/or the imposition of civil and criminal penalties, including fines. Certain of our services are also subject to rules set by various payment networks, such as MasterCard, as more fully described below.
The following, while not exhaustive, is a description of several federal and state laws and regulations in the United States that are applicable to our business. The laws and regulations of other jurisdictions also affect us, and they may be more or less restrictive than those in the United States and may also impact different parts of our operations. In addition, the legal and regulatory framework governing our business is subject to ongoing revision, and changes in that framework could have a significant effect on us.
Money Transmission and Payment Instrument Licensing Regulations
We are subject to various U.S. laws and regulations governing money transmission and the issuance and sale of payment instruments relating to certain aspects of our business. In the United States, most states license money transmitters and issuers of payment instruments. Through our subsidiaries, we are licensed in 4546 states. Many states exercise authority over the operations of our services related to money transmission and payment instruments and, as part of this authority, subject us to periodic examinations, which may include a review of our compliance practices, policies and procedures, financial position and related records, privacy and data security policies and procedures, and other matters related to our business. Some state agencies conduct periodic examinations and issue findings and recommendations as a result of which we make changes to our operations, such as improving our reporting processes, detailing our intercompany arrangements, and implementing new or revising existing policies and procedures such as our anti-money laundering and OFAC compliance program and complaints management process, and improvements to our documentation processes.
As a licensee, we are subject to certain restrictions and requirements, including net worth and surety bond requirements, record keeping and reporting requirements, requirements for regulatory approval of controlling stockholders, and requirements to maintain certain levels of permissible investments in an amount equal to our outstanding payment obligations. Many states also require money transmitters and issuers of payment instruments to comply with federal and/or state anti-money laundering laws and regulations. Many states require prior approval for an indirect change of control of the licensee and certain other corporate events.
Government agencies may impose new or additional requirements on money transmission and sales of payment instruments, and we expect that compliance costs will increase in the future for our regulated subsidiaries.
Privacy and Information Security Regulations
We provide services that may be subject to privacy laws and regulations of a variety of jurisdictions. Relevant federal privacy laws include the Gramm-Leach-Bliley Act of 1999, which applies directly to a broad range of financial institutions and indirectly, or in some instances directly, to companies that provide services to financial institutions. These laws and regulations restrict the collection, processing, storage, use and disclosure of personal
information, require notice to individuals of privacy practices and provide individuals with certain rights to prevent the use and disclosure of protected information. These laws also impose requirements for safeguarding and proper destruction of personal information through the issuance of data security standards or guidelines. In addition, there are state laws restricting the ability to collect and utilize certain types of information such as Social Security and driver’s license numbers. Certain state laws impose similar privacy obligations as well as obligations to provide notification of security breaches of computer databases that contain personal information to affected individuals, state officers and consumer reporting agencies and businesses and governmental agencies that own data. To the extent that we offer our services outside the United States, we are also required to comply with various foreign laws and regulations relating to privacy and information security, some of which are more stringent than the laws in the United States.
Certain of our products that access payment networks require compliance with PCIPayment Card Industry (“PCI”) standards. Our subsidiary, Comdata Inc., is PCI 2.0 compliant and its Attestation of Compliance is listed on MasterCard’s compliant service provider listing. Failure to maintain compliance with updates to PCI data security standards including having effective technical and administrative safeguards and policies and procedures could result in fines and assessments from payment networks and regulatory authorities, andas well as litigation.
Federal Trade Commission Act
All persons engaged in commerce, including, but not limited to, us and our bank sponsors and customers are subject to Section 5 of the Federal Trade Commission Act prohibiting unfair or deceptive acts or practices, (UDAAP)and certain products are subject to the jurisdiction of the CFPB regarding the prohibition of unfair, deceptive, or abusive acts and practices (both, collectively, UDAAP). Various federal and state regulatory enforcement agencies including the FTC, CFPBFederal Trade Commission (“FTC”), Consumer Financial Protection Bureau (“CFPB”) and the state attorneys general have authority to take action against businesses, merchants and financial institutions that engage in UDAAP or violate other laws, rules and regulations. If we violate such laws, rules and regulations, we may be subject to enforcement actions and as a result, may incur losses and liabilities that may impact our business. A number of state laws and regulations also prohibit unfair and deceptive business practices.
Truth in Lending Act
The Truth in Lending Act, or TILA, was enacted to increase consumer awareness of the cost of credit and is implemented by Regulation Z. Most provisions of TILA and Regulation Z apply only to the extension of consumer credit, but a limited number apply to commercial cards as well. One example where TILA and Regulation Z are generally applicable is a limitation on liability for unauthorized use, although a business that acquires 10 or more credit cards for its personnel can agree to more expansive liability. Our cardholder agreements generally provide for these business customers to waive, to the fullest extent possible, all limitations on liability for unauthorized card use.
Credit Card Accountability, Responsibility, and Disclosure Act of 2009
The Credit Card Accountability, Responsibility, and Disclosure Act of 2009 amended provisions of TILA that affect consumer credit and also directed the Federal Reserve Board to study the use of credit cards by small businesses and to make legislative recommendations. The report concluded that it is not clear whether the potential benefits outweigh the increased cost and reduced credit availability if the disclosure and substantive restrictions applicable to consumer cards were to be applied to small business cards. Legislation has been introduced, from time to time, to increase the protections afforded to small businesses that use payment cards. If legislation of this kind were enacted, our products and services for small businesses could be adversely impacted.
Equal Credit Opportunity Act
The Equal Credit Opportunity Act, or ECOA, together with Regulation B prohibit creditors from discriminating on certain prohibited bases, such as an applicant’s sex, race, nationality, age and marital status, and further requires that creditors disclose the reasons for taking any adverse action against an applicant or a customer seeking credit.
The Fair Credit Reporting Act
The Fair Credit Reporting Act, or FCRA, regulates consumer reporting agencies and the disclosure and use of consumer reports. We may obtain consumer reports with respect to an individual who guarantees or otherwise is obligated on a commercial card.
FACT Act
The Fair and Accurate Credit Transactions Act of 2003 amended FCRA and requires creditors to adopt identity theft prevention programs to detect, prevent and mitigate identity theft in connection with covered accounts, which can include business accounts for which there is a reasonably foreseeable risk of identity theft.
Anti-Money Laundering and Counter Terrorist Regulations
The Currency and Foreign Transactions Reporting Act (the BSA), which is also known as the Bank Secrecy Act and which has been amended by the USA PATRIOT Act of 2001, contains a variety of provisions aimed at fighting terrorism and money laundering. Our business in Canada is also subject to Proceeds of Crime (Money Laundering) and Terrorist Financing Act, or the PCTFA, which is a corollary to the BSA. Among other things, the Bank Secrecy Act and implementing regulations issued by the U.S. Treasury Department require financial-services providers to establish anti-money laundering programs, to not engage in terrorist financing, to report suspicious activity, and to maintain a number of related records.
Through certain subsidiaries, we are registered money services businesses. As a result, we have established anti-money laundering compliance programs that include: (i) internal policies and controls; (ii) designation of a compliance officer; (iii) ongoing employee training; and (iv) an independent review function. We have developed and implemented compliance programs comprised of policies, procedures, systems and internal controls to monitor and address various legal requirements and developments.
In addition, provisions of the BSA known as the Prepaid Access Rule issued by the Financial Crimes Enforcement Network of the U.S. Department of the Treasury (FinCEN) impose certain obligations, such as registration and collection of consumer information, on “providers” of certain prepaid access programs, including the stored value products issued by our sponsor banks for which we serve as program manager. FinCEN has taken the position that, where the issuing bank has principal oversight and control of such prepaid access programs, no other participant in the distribution chain would be required to register as a provider under the Prepaid Access Rule. Despite this position, we have opted to register as a provider of prepaid access through our subsidiary, Comdata Inc. We are also subject to certain economic and trade sanctions programs that are administered by the Treasury Department’s Office of Foreign Assets Control, or OFAC, that prohibit or restrict transactions to or from or dealings with specified countries, their governments and, in certain circumstances, their nationals, narcotics traffickers, and terrorists or terrorist organizations.
Dodd-Frank Wall Street Reform and Consumer Protection Act
The Dodd-Frank Wall Street Reform and Consumer Protection Act of 2010, or the Dodd-Frank Act, effected comprehensive revisions to a wide array of federal laws governing financial institutions, financial services, and financial markets. Among its most notable provisions is the creation of the Consumer Financial Protection
Bureau or CFPB, which is charged with regulating consumer financial products or services and which is assuming much of the rulemaking authority under TILA, ECOA, FCRA, and other federal laws affecting the extension of credit. In addition to rulemaking authority over several enumerated federal consumer financial protection laws, the CFPB is authorized to issue rules prohibiting UDAAP by persons offering consumer financial products or services and their service providers, and has authority to enforce these consumer financial protection laws and CFPB rules. The CFPB has not defined what is a consumer financial product or service but has indicated informally that, in some instances, small businesses may be covered under consumer protection.
As a service provider to certain of our bank sponsors, we are subject to direct supervision and examination by the CFPB, in connection with certain of our products and services. CFPB rules, examinations and enforcement actions may require us to adjust our activities and may increase our compliance costs.
In addition, the Durbin Amendment to the Dodd-Frank Act provided that interchange fees that a card issuer or payment network receives or charges for debit transactions will now be regulated by the Federal Reserve and must be “reasonable and proportional” to the cost incurred by the card issuer in authorizing, clearing and settling the transaction. Payment network fees may not be used directly or indirectly to compensate card issuers in circumvention of the interchange transaction fee restrictions. In July 2011, the Federal Reserve published the final rules governing debit interchange fees. Effective in October 2011, with certain exemptions debit interchange rates are capped at $0.21 per transaction with an additional component of five basis points of the transaction’s value to reflect a portion of the issuer’s fraud losses plus, for qualifying issuing financial institutions, an additional $0.01 per transaction in debit interchange for fraud prevention costs. In March 2014, the U.S. Court of Appeals for the District of Columbia overturned the U.S. District Court for the District of Columbia’s July 2013 ruling that held the Federal Reserve’s regulations implementing the Durbin Amendment invalid. While the Court of Appeals upheld most of the Federal Reserve’s implementing regulations, the Court has remanded to the Federal Reserve for further explanation of its regulations regarding transactions-monitoring costs. Regardless of the outcome of the litigation, the cap on interchange fees is not expected to have a material direct impact on our results of operations because we qualify for an exemption for the majority of our debit transactions.
The implementation of the Dodd-Frank Act is ongoing, and as a result, its overall impact remains unclear. Its provisions, however, are sufficiently far reaching that it is possible that we could be further directly or indirectly impacted.
Anti-Bribery Regulations
The FCPA prohibits the payment of bribes to foreign government officials and political figures and includes anti-bribery provisions enforced by the Department of Justice and accounting provisions enforced by the SEC. The statute has a broad reach, covering all U.S. companies and citizens doing business abroad, among others, and defining a foreign official to include not only those holding public office but also local citizens affiliated with foreign government-run or -owned organizations. The statute also requires maintenance of appropriate books and records and maintenance of adequate internal controls to prevent and detect possible FCPA violations.
Payment card industry rules
Partner banks issuing payment cards bearing the MasterCard brand, and FleetCor to the extent that we provide certain services in connection with those cards and fleet customers acting as merchants accepting those cards, must comply with the bylaws, regulations and requirements that are promulgated by MasterCard and other applicable payment-card organizations, including the Payment Card Industry Data Security Standard developed by MasterCard and VISA, the MasterCard Site Data Protection Program and other applicable data-security program requirements. A breach of such payment card network rules could subject us to a variety of fines or penalties that may be levied by the payment networks for certain acts or omissions. The payment networks routinely update and modify their requirements. Our failure to comply with the networks’ requirements or to pay the fines they impose could cause the termination of our registration and require us to stop processing transactions on their networks.
We are also subject to network operating rules promulgated by the National Automated Clearing House Association relating to payment transactions processed by us using the Automated Clearing House Network.
Escheat Regulations
Certain of our subsidiaries are subject to unclaimed or abandoned property (escheat) laws in the United States that require them to turn over to certain government authorities the property of others they hold that has been unclaimed for a specified period of time such as payment instruments that have not been presented for payment and account balances that are due to a customer following discontinuation of its relationship with such subsidiaries. Certain of our subsidiaries are subject to audit by individual U.S. states with regard to their escheatment practices.
Prepaid Card Regulations
Prepaid card programs managed by us are subject to various federal and state laws and regulations, in addition to those identified above, including the Credit Card Accountability Responsibility and Disclosure Act of 2009 and the Federal Reserve’s Regulation E, which impose requirements on general-use prepaid cards, store gift cards and electronic gift certificates. These laws and regulations are evolving, unclear and sometimes inconsistent and subject to judicial and regulatory challenge and interpretation, and therefore the extent to which these laws and rules have application to, and their impact on us, is in flux. At this time we are unable to determine the impact that the clarification of these laws and their potential application and future interpretations, as well as new laws, may have on us in a number of jurisdictions. The CFPB is expected to promulgate additional regulations regarding general-purpose prepaid cards. The substance and implementation dates of such additional rulemaking may result in additional compliance obligations and expense for our business.
State usury laws
Extensions of credit under many of our card products may be treated as commercial loans. In some states, usury laws limit the interest rates that can be charged not only on consumer loans but on commercial loans as well. To the extent that these usury laws apply, we are limited in the amount of interest that we can charge and collect from our customers. Because we have substantial operations in multiple jurisdictions, we utilize choice of law provisions in our cardholder agreements as to the laws of which jurisdiction to apply. In addition, the interest rates on certain of our card products are set based upon the usury limit of the cardholder’s state. With respect to card products where we work with a partner or issuing bank, the partner bank may utilize the law of the jurisdiction applicable to the bank and “exports” the usury limit of that state in connection with cards issued to residents of other states or we may use our choice of law provisions.
Other
We are subject to examination by our sponsor banks’ regulators, and must comply with certain regulations to which our sponsor banks are subject, as applicable. We are subject to audit by certain sponsor banks.
The Housing Assistance Tax Act of 2008 requires information returns to be made for each calendar year by merchants acquiring entities and third-party settlement organizations with respect to payments made in settlement of electronic payment transactions and third-party payment network transactions occurring in that calendar year. Reportable transactions are also subject to backup withholding requirements. We are required to comply with these requirements for the merchants in our Comdata network. We could be liable for penalties if our information return is not in compliance with these regulations.
Employees and labor relations
As of December 31, 2014,2015, we employed approximately 4,7805,330 employees, approximately 2,1802,660 of whom were located in the United States. We consider our employee relations to be good and have never experienced a work stoppage.
Additional Information
Our website address iswww.fleetcor.com. You may obtain free electronic copies of our annual report on Form 10-K, quarterly reports on Form 10-Q, current reports on Form 8-K and all amendments to such reports required to be filed or furnished pursuant to Section 13 or 15(d) of the Securities Exchange Act of 1934, as amended, at our website under the headings “Investor Relations—SEC Filings.”
ITEM X. EXECUTIVE OFFICERS OF THE REGISTRANT
The following table sets forth certain information regarding our executive officers, with their respective ages as of December 31, 2014.2015. Our officers serve at the discretion of our board of directors. There are no family relationships between any of our directors or executive officers.
Name | Age | Position(s) | ||||
Ronald F. Clarke | Chief Executive Officer and Chairman of the Board of Directors | |||||
Eric R. Dey | Chief Financial Officer | |||||
| President— | |||||
Andrew R. Blazye | President—International | |||||
John S. Coughlin | Executive Vice President—Global Corporate Development | |||||
Timothy J. Downs | President—Corporate Lodging Consultants | |||||
Charles Freund | ||||||
| 43 | Executive Vice President— | ||||
| ||||||
| President—North America Direct Issuing, U.S. Telematics and Efectivale | |||||
| David D. Maxsimic | 56 | President—North America Partners | ||||
| Armando Netto | 47 | President—Brazil | ||||
John A. Reed | Global Chief Information Officer | |||||
| President— | |||||
Ronald F. Clarke has been our Chief Executive Officer since August 2000 and was appointed Chairman of our board of directors in March 2003. From 1999 to 2000, Mr. Clarke served as President and Chief Operating Officer of AHL Services, Inc., a staffing firm. From 1990 to 1998, Mr. Clarke served as chief marketing officer and later as a division president with Automatic Data Processing, Inc., a computer services company. From 1987 to 1990, Mr. Clarke was a principal with Booz Allen Hamilton, a global management consulting firm. Earlier in his career, Mr. Clarke was a marketing manager for General Electric Company, a diversified technology, media, and financial services corporation.
Eric R. Dey has been our Chief Financial Officer since November 2002. From October 2000 to October 2002, Mr. Dey served as Chief Financial Officer of NCI Corporation, a call center company. From July 1999 to October 2000, Mr. Dey served as Chief Financial Officer of Leisure Time Technology, a software development/manufacturing company. From 1994 to 1999, Mr. Dey served as Corporate Controller with Excel Communications, a telecommunications service provider. From 1984 to 1994, Mr. Dey held a variety of financial and accounting positions with PepsiCo, Inc., a global beverage, snack and food company.
Alisher AshurovKurt Adams was namedjoined us in September 2015 as our President—Czech and Russia in December 2014 and continues to serve as Executive Vice President, InternationalComdata Corporate Development since July 2011. Prior to this, Mr. Ashurov served as our Interim Managing Director—Central and Eastern Europe since April 2013. From July 2008 to July 2011, Mr. Ashurov served as President of our Russian business, PPR. From August 2005 to July 2008, Mr. Ashurov served as Director and then Vice President of Business Development.Payments. Prior to joining FleetCor,us, Mr. AshurovAdams was Assistant Vicemost recently President, at Legacy Securities LLC,Corporate Payments Solutions for U.S. Bancorp. Prior to that, Mr. Adams led strategy and planning for NOVA Information Systems (now Elavon – a middle-marketU.S. Bancorp subsidiary) in Europe. Prior to his career in payments, Mr. Adams enjoyed a successful investment banking firm.career with Piper Jaffray.
Andrew R. Blazye serveshas served as our President—International PartnersCorporate Development since 2012. From July 2007 to May 2012, Mr. Blazye served as our Chief Executive Officer—FleetCor Europe and continues to perform the duties
associated with this role until a replacement is identified.Europe. From April 2006 to June 2007, Mr. Blazye was a Group Director for Dunnhumby Ltd., a research firm. From September 1980, to March 2006, Mr. Blazye held various positions with Shell International Ltd., a subsidiary of Royal Dutch Shell plc, a global energy company, including Global Payments General Manager.
John S. Coughlin has served as our Executive Vice President—Global Corporate Development since September 2010. From 2007 to 2010, Mr. Coughlin served as a Managing Director at PCG Capital Partners, a private equity firm. From 2005 to 2006, Mr. Coughlin served as Chief Executive Officer of NCDR LLC, (dba Kool Smiles), a private equity owned national dental practice management company. From 1994 to 2005, Mr. Coughlin was with The Parthenon
Group, a strategic advisory and principal investment firm, where he was a Senior Partner and the founder and head of the firm’s San Francisco office. From 1990 to 1992, Mr. Coughlin was an investment banker with Credit Suisse First Boston.
Timothy J. Downs joined us as President—Corporate Lodging Consultants in connection with our acquisition of CLC Group, Inc. in April 2009. Prior to joining us, Mr. Downs held various positions with Corporate Lodging Consultants, including Vice President Technology from May 1999 to September 2004 and as Executive Vice President Operations from September 2004 to April 2009.
Charles Freundwas named our Executive Vice President—CorporateGlobal Sales in January 2016 and has been with us since 2000. Prior to his current role, Mr. Freund was serving as our Executive Vice President —Corporate Strategy insince December 2014. PriorFrom December 2010 to this,December 2014, Mr. Freund served as our President—Emerging Markets since December 2010 and has been with us since 2000.Markets. From January 2009 to December 2010, Mr. Freund served as our Senior Vice President—Corporate Strategy. From June 2006 to December 2008, Mr. Freund served as our Managing Director—The Fuelcard Company UK Limited from June 2006 to December 2008.Limited. Prior to June 2006, Mr. Freund served as our Vice President of Business Development.
Alexey Gavrilenya was named President—Continental Europe in February 2016, adding to his responsibilities as President—Central/Eastern Europe announced in January 2016. Mr. Gavrilenya has been President, Eastern Europe since May 2011, where he has been responsible for PPR and NKT. From March 2009 to April 2011, Mr. Gavrilenya served as our Executive Vice President Strategy and Finance, Eastern Europe. Prior to joining us, Mr. Gavrilenya was CFO of Matarex, Ltd.
Todd W. House has been our President—North America Fuel CardsDirect Issuing, U.S. Telematics and Efectivale since November 2013.2015. Prior to this, Mr. House was President—U.S. Direct Business since December 2010served as the president for several of our businesses throughout North America and Mexico, after joining us in April 2009 as our Chief Operating Officer since April 2009.Officer. From July 2007 to April 2009, Mr. House held various positions, including Chief Financial Officer with Axiant, LLC, a provider of financial services and recovery management solutions. On November 20, 2009, Axiant, LLC filed a petition for bankruptcy under the federal bankruptcy laws. From April 2005 to July 2007, Mr. House was Vice President and Chief Credit Officer with Carmax, Inc., an automobile retailer. From August 1993 to April 2005, Mr. House was Vice President—at Capital One from 1993-2004 in a variety of leadership roles, most recently VP Credit Risk Management with Capital One Financial Corp., a financial services company.Management.
David D. Maxsimic was named President—North America Partners in November 2015. Mr. Maxsimic joined us in January 2015 as our Group CEO—UK and Australasia. Prior to joining us, Mr. Maxsimic held various positions at WEX (also known as Wright Express) from 1997 to 2014, including President International, executive vice president of sales and marketing, senior vice president of sales, and vice president and general manager for Wright Express Direct Card. Prior to WEX, Mr. Maxsimic served as senior sales executive for several major fleet service companies, including U.S. Fleet Leasing, GE Capital Fleet Services, and PHH Fleet America. Mr. Maxsimic has over 25 years of experience in sales, marketing and managing customer relationships, in addition to managing and executing sales of complex financial services.
Armando Netto joined us in June 2014 as our President—Brazil. Prior to joining us, Mr. Netto led IT Services for TIVIT, an IT and BPO services company, from 2006 to 2014, where he led the integration of functional areas into the business unit, focused on onboarding new clients and ensured service quality. Prior to TIVIT, Mr. Netto held various leadership roles with Unisys and McKinsey, where he gained international experience in Europe supporting clients in the UK, France, Austria, Portugal and the Netherlands.
John A. Reed has been our Global Chief Information Officer over product development and IT operations since 2013. From 2000 to 2009, Mr. Reed served various technology leadership roles at MBNA/Bank of America, Zurich Insurance and Unisys. From 1997 to 2000, Mr. Reed was the President and Managing Director for Business Innovations Inc,Inc., a financial services technology consulting company.
Michael ScarbroughGregory Secordjoined us in July 2015 as President—Telematics in connection with our acquisition of NexTraq in October 2013 and has since taken on responsibility for our full telematics product line in the U.S.President—Comdata North America Trucking. Prior to joining us, Mr. ScarbroughSecord worked with ADP, where he was President—ADP Canada operations. Prior to his 20 year career with ADP, Mr. Secord held various positionssales and marketing management roles with NexTraq, including Chief Operating OfficerCanon and Chief Financial Officer from 2005 to 2009 and President since 2009.Xerox.
You should carefully consider the following risks applicable to us. If any of the following risks actually occur, our business, operating results, financial condition and the trading price of our common stock could be materially adversely affected. The risks discussed below also include forward-looking statements, and our actual results may differ substantially from those discussed in these forward-looking statements. See “Note Regarding Forward-Looking Statements” in this report.
Risks related to our business
A decline in retail fuel prices could adversely affect our revenue and operating results.
Our fleet customers use our products and services primarily in connection with the purchase of fuel. Accordingly, our revenue is affected by fuel prices, which are subject to significant volatility. A decline in retail fuel prices could cause a decrease in our revenue from fees paid to us by merchants based on a percentage of each transaction purchase amount. We believe that in 2014,2015, approximately 17%15% of our consolidated revenue was directly influenced by the absolute price of fuel. Changes in the absolute price of fuel may also impact unpaid account balances and the late fees and charges based on these amounts. A decline in retail fuel prices could adversely affect our revenue and operating results.
Fuel prices are dependent on several factors, all of which are beyond our control. These factors include, among others:
A portion of our revenue is derived from fuel-price spreads. As a result, a contraction in fuel-price spreads could adversely affect our operating results.
Approximately 17%12% of our consolidated revenue in 20142015 was derived from transactions where our revenue is tied to fuel-price spreads. Fuel-price spreads equal the difference between the fuel price we charge to the fleet customer and the fuel price paid to the fuel merchant. In transactions where we derive revenue from fuel-price spreads, the fuel price paid to the fuel merchant is calculated as the merchant’s wholesale cost of fuel plus a commission. The merchant’s wholesale cost of fuel is dependent on several factors including, among others, the factors described above affecting fuel prices. The fuel price that we charge to our fleet customer is dependent on several factors including, among others, the fuel price paid to the fuel merchant, posted retail fuel prices and competitive fuel prices. We experience fuel-price spread contraction when the merchant’s wholesale cost of fuel increases at a faster rate than the fuel price we charge to our fleet customers, or the fuel price we charge to our fleet customers decreases at a faster rate than the merchant’s wholesale cost of fuel. Accordingly, when fuel-price spreads contract, we generate less revenue, which could adversely affect our operating results.
If we fail to adequately assess and monitor credit risks of our customers, we could experience an increase in credit loss.
We are subject to the credit risk of our customers, which range in size from small, sole proprietorships to large, publicly traded companies. We use various methods to screen potential customers and establish appropriate credit limits, but these methods cannot eliminate all potential credit risks and may not always prevent us from approving customer applications that are not credit worthy or are fraudulently completed. Changes in our industry, customer demand, and, in relation to our fleet customers, movement in fuel prices may result in periodic increases to customer credit limits and spending and, as a result, could lead to increased credit losses. We may also fail to detect changes to the credit risk of customers over time. Further, during a declining economic environment, we experience increased customer defaults and preference claims by bankrupt customers. If we fail to adequately manage our credit risks, our bad debt expense could be significantly higher than historic levels and adversely affect our business, operating results and financial condition.
We derive a significant portion of our revenue from program fees and charges paid by the users of our cards. Any decrease in our receipt of such fees and charges, or limitations on our fees and charges, could adversely affect our business, results of operations and financial condition.
Our card programs include a variety of fees and charges associated with transactions, cards, reports, optional services and late payments. We derived approximately 66%72% of our consolidated revenues from these fees and charges during the year ended December 31, 2014.2015. If the users of our cards decrease their transaction activity, or the extent to which theirthey use of optional services or pay invoices late, our revenue could be materially adversely affected. In addition, several market factors can affect the amount of our fees and charges, including the market for similar charges for competitive card products and the availability of alternative payment methods such as cash or house accounts. Furthermore, regulators and Congress have scrutinized the electronic payments industry’s pricing, charges and other practices related to its customers. Any legislative or regulatory restrictions on our ability to price our products and services could materially and adversely affect our revenue. Any decrease in our revenue derived from these fees and charges could materially and adversely affect our business, operating results and financial condition.
We operate in a competitive business environment, and if we are unable to compete effectively, our business, operating results and financial condition would be adversely affected.
The market for our products and services is highly competitive, and competition could intensify in the future. Our competitors vary in size and in the scope and breadth of the products and services they offer. In the fleet card business, our primary competitors in North America are small, regional and large independent fleet card providers, major oil companies and petroleum marketers that issue their own fleet cards and major financial services companies that provide card services to major oil companies and petroleum marketers. In the commercial payments business, we face a variety of competitors, some of which have greater financial resources, name recognition and scope and breadth of products and services. Competitors in the hotel card business include travel agencies, online lodging discounters, internal corporate procurement and travel resources, and independent services companies, among others. Competitors in the mobile telematics business include the major car companies, wireless phone service providers and independent services companies, among others. We also compete for customers with providers of alternative payment mechanisms, such as merchants offering house cash accounts or other forms of credit. Our primary competitors in Europe, Australia and New Zealand are independent fleet card providers, major oil companies and petroleum marketers that issue branded fleet cards, and providers of card outsourcing services to major oil companies and petroleum marketers. Our primary competitors in Latin America are independent providers of food, fuel, toll, transportation and fleet cards and vouchers, commercial fleet cards offered by the major oil companies and providers of card outsourcing services to major oil companies and petroleum marketers.
The most significant competitive factors in our business are the breadth of product and service features, network acceptance size, customer service, account management, and price. We may experience competitive
disadvantages with respect to any of these factors from time to time as potential customers prioritize or value
these competitive factors differently. As a result, a specific offering of our products and service features, networks and pricing may serve as a competitive advantage with respect to one customer and a disadvantage for another based on the customers’ preferences.
Some of our existing and potential competitors have longer operating histories, greater brand name recognition, larger customer bases, more extensive customer relationships or greater financial and technical resources. In addition, our larger competitors may also have greater resources than we do to devote to the promotion and sale of their products and services and to pursue acquisitions. Many of our competitors provide additional and unrelated products and services to customers, such as treasury management, commercial lending and credit card processing. By providing these other services that we do not provide, these competitors have an advantage of being able to bundle their products and services together and present them to existing customers with whom they have established relationships, sometimes at a discount. For example, in the commercial payments business, we compete with full service banks that are able to offer treasury management and commercial lending in addition to commercial payment solutions. If price competition continues to intensify, we may have to increase the incentives that we offer to our customers, decrease the prices of our products and services or lose customers, each of which could adversely affect our operating results. In the fleet card business, major oil companies and petroleum marketers and large financial institutions may choose to integrate fuel-card services as a complement to their existing card products and services, as well as offer add on complementary services. As a result, they may be able to adapt more quickly to new or emerging technologies and changing opportunities, standards or customer requirements. To the extent that our competitors are regarded as leaders in specific categories, they may have an advantage over us as we attempt to further penetrate these categories.
Future mergers or consolidations among competitors, or acquisitions of our competitors by large companies may present competitive challenges to our business. Resulting combined entities could be at a competitive advantage if their fuel-card products and services are effectively integrated and bundled into sales packages with their widely utilized non-fuel-card-related products and services. Further, competitors may reduce the fees for their services, which could increase pricing pressure within our markets.
Overall, increased competition in our markets could result in intensified pricing pressure, reduced profit margins, increased sales and marketing expenses and a failure to increase, or a loss of, market share. We may not be able to maintain or improve our competitive position against our current or future competitors, which could adversely affect our business, operating results and financial condition.
Our fleet card business is dependent on several key strategic relationships, the loss of which could adversely affect our operating results.
We intend to seek to expand our strategic relationships with major oil companies. We refer to the major oil companies and petroleum marketers with whom we have strategic relationships as our “partners.” During 2014,2015, our top three strategic relationships with major oil companies accounted for approximately 9%less than 7% of our consolidated revenue. Our agreements with our major oil company partners typically have initial terms of five to ten years with current remaining terms ranging from about onetwo to sixseven years.
The success of our business is in part dependent on our ability to maintain these strategic relationships and enter into additional strategic relationships with major oil companies. In our relationships with these major oil companies, our services are marketed under our partners’ brands. If these partners fail to maintain their brands, or decrease the size of their branded networks, our ability to grow our business may be adversely affected. Also, our inability to maintain or further develop these relationships or add additional strategic relationships could materially and adversely affect our business and operating results.
To enter into a new strategic relationship or renew an existing strategic relationship with a major oil company, we often must participate in a competitive bidding process, which may focus on a limited number of factors, including pricing. The bidding and negotiating processes generally occur over a protracted time period. The use
of these processes may affect our ability to effectively compete for these relationships. Our competitors may be
willing to bid for these contracts on pricing or other terms that we consider uneconomical in order to win this business. The loss of our existing major oil company partners or the failure to contract or delays in contracting with additional partners could materially and adversely affect our business, operating results and financial condition.
We depend, in part, on our merchant relationships to grow our business. To grow our customer base in the closed loop fleet card and lodging card businesses, we must retain and add relationships with merchants who are located in areas where our customers purchase fuel, maintenance services and lodging. If we are unable to maintain and expand these relationships, our closed loop fleet card and lodging card businesses may be adversely affected.
With respect to the closed-loop networks we utilize, a portion of our growth is derived from acquiring new merchant relationships to serve our customers, as well as from our new and enhanced product and service offerings and cross-selling our products and services through existing merchant relationships. We rely on the continuing growth of our merchant relationships and our distribution channels in order to expand our customer base. There can be no guarantee that this growth will continue. Similarly, our growth also will depend on our ability to retain and maintain existing merchant relationships that accept our proprietary closed-loop networks in areas where our customers purchase fuel and lodging. Our contractual agreements with fuel merchants and service garages typically have initial terms of one yearor two years and automatically renew on a year-to-yearthe same basis unless either party gives notice of termination. Our agreements with lodging providers typically have initial terms of one year and automatically renew on a month-to-month basis unless either party gives notice of termination. Furthermore, merchants with which we have relationships may experience bankruptcy, financial distress, or otherwise be forced to contract their operations. The loss of existing merchant relationships, failure to continue such relationships on similarly attractive economic terms, the contraction of our existing merchants’ operations or the inability to acquire new merchant relationships could adversely affect our ability to serve our customers and our business and operating results.
We depend on our relationships with major truck stop merchants to serve our over-the-road fuel card customers. We must maintain these relationships to effectively serve our customers that use these merchants. If we are unable to maintain these relationships, our over-the-road card businesses may be adversely affected.
We have long standing relationships with major truck stop merchants to accept our over-the-road fuel cards. Over-the-road customers purchase a significant proportion of their fuel at major truck stop merchants. The loss of existing major truck stop merchant relationships or failure to continue such relationships on similar terms could adversely affect our ability to serve our over-the-road fuel card customers and our business and operating results.
A decline in general economic conditions, and in particular, a decline in demand for fuel and other business related products and services would adversely affect our business, operating results and financial condition.
Our operating results are materially affected by conditions in the economy generally, both in the United States and internationally. We generate revenue based in part on the volume of purchase transactions we process. Our transaction volume is correlated with general economic conditions, particularly in the United States, Europe, Russia, Latin America, Australia and New Zealand, and the amount of business activity in economies in which we operate. Downturns in these economies are generally characterized by reduced commercial activity and, consequently, reduced purchasing of fuel and other business related products and services by our customers. The commercial payments industry in general, and our commercial payment solutions business specifically, depends heavily upon the overall level of spending. Unfavorable changes in economic conditions, including declining consumer confidence, inflation, recession, or other changes, may lead our corporate customers to reduce their spending, resulting in reduced demand for, or use of, our products and services. In addition, unfavorable changes in economic conditions, may lead our fleet card customers to demand less fuel, or lead our partners to reduce their use of our products and services. As a result, a sustained deterioration in general economic conditions in the United States or abroad, could have a material adverse effect on our revenue and profitability.
Further, economic conditions also may impact the ability of our customers or partners to pay for fuel or other services they have purchased and, as a result, our reserve for credit losses and write-offs of accounts receivable could increase. A weakening economy could also force some retailers and merchants to close, resulting in exposure to potential credit losses and transaction declines. In addition, demand for fuel and other business related products and services may be reduced by other factors that are beyond our control, such as the development and use of vehicles with greater fuel efficiency and alternative fuel sources.
We are unable to predict the likely duration of the ongoing sluggish economic conditions in the United States, Europe, Russia, Latin America, Australia and New Zealand. As a result, continued weakness in general economic conditions or increases in interest rates in key countries in which we operate, could adversely affect our business and operating results.
We have expanded into new lines of business in the past and may do so in the future. If we are unable to successfully integrate these new businesses, our results of operations and financial condition may be adversely affected.
We have expanded our business to encompass new lines of business in the past. For example, within the past five years we have entered into the corporate payments, stored value card, vehicle maintenance management and telematics business in the United States and Europe, and transaction processing, fuel, food, toll and transportation card and voucher businesses in Brazil and Mexico. We may continue to enter new lines of business and offer new products and services in the future. There is no guarantee that we will be successful in integrating these new lines of business into our operations. If we are unable to do so, our operating results and financial condition may be adversely affected.
If we fail to develop and implement new technology, products and services, adapt our products and services to changes in technology, the marketplace requirements, or if our ongoing efforts to upgrade our technology, products and services are not successful, we could lose customers and partners.
The markets for our products and services are highly competitive, and characterized by technological change, frequent introduction of new products and services and evolving industry standards. We must respond to the technological advances offered by our competitors and the requirements of our customers and partners, in order to maintain and improve upon our competitive position and fulfill contractual obligations. We may be unsuccessful in expanding our technological capabilities and developing, marketing or selling new products and services that meet these changing demands, which could jeopardize our competitive position. In addition, we engage in significant efforts to upgrade our products and services and the technology that supports these activities on a regular basis.
The products we deliver are designed to process complex transactions and provide reports and other information on those transactions, all at high volumes and processing speeds. Any failure to deliver an effective and secure product or service or any performance issue that arises with a new product or service could result in significant processing or reporting errors or other losses. We may rely on third parties to develop or co-develop our solutions, or to incorporate our solutions into broader platforms for the commercial payments industry. We may not be able to enter into such relationships on attractive terms, or at all, and these relationships may not be successful. In addition, partners, some of whom may be our competitors or potential competitors, may choose to develop competing solutions on their own or with third parties. Even if we are successful in developing new services and technologies, these new services and technologies may not achieve broad acceptance due to a variety of factors, including a lack of industry-wide standards, competing products and services, or resistance to these changes from our customers. In addition, we may not be able to derive revenue from these efforts.
If we are unsuccessful in completing the migration of material technology, otherwise upgrading our products and services and supporting technology or completing or gaining market acceptance of new technology, products and services, it would have a material adverse effect on our ability to retain existing customers and attract new ones in the impacted business line.
Our debt obligations, or our incurrence of additional debt obligations, could limit our flexibility in managing our business and could materially and adversely affect our financial performance.
At December 31, 2014,2015, we had approximately $3.59$2.94 billion of debt outstanding under our Credit Facility and Securitization Facility. In addition, we are permitted under our credit agreement to incur additional indebtedness, subject to specified limitations. Our substantial indebtedness currently outstanding, or as may be outstanding if we incur additional indebtedness, could have important consequences, including the following:
The occurrence of one or more of these potential consequences could have a material adverse effect on our business, financial condition, operating results, and ability to satisfy our obligations under our indebtedness.
In addition, we and our subsidiaries may be able to incur substantial additional indebtedness in the future. Although our credit agreements contain restrictions on the incurrence of additional indebtedness, these restrictions are subject to a number of significant qualifications and exceptions, and under certain circumstances, the amount of additional indebtedness that could be incurred in compliance with these restrictions could be substantial. If new debt is added to our existing debt levels, the related risks that we will face would increase.
We meet a significant portion of our working capital needs through a securitization facility, which we must renew every three years.
We meet a significant portion of our working capital needs through a securitization facility, pursuant to which we sell accounts receivable to a special-purpose entity that in turn sells undivided participation interests in the accounts receivable to certain purchasers, who finance their purchases through the issuance of short-term commercial paper. The securitization facility has a three year term. Although we have been able to renew our securitization facility annually in the past, there can be no assurance that we will continue to be able to renew this facility in the future on terms acceptable to us. For example, the market for commercial paper experienced significant volatility during the financial crisis that began in 2008.
Also, a significant rise in fuel prices could cause our accounts receivable to increase beyond the capacity of the securitization facility. There can be no assurance that the size of the facility can be expanded to meet these increased working capital needs. Further, we may not be able to fund such increases in accounts receivable with our available cash resources. Our inability to meet working capital needs could adversely affect our financial condition and business, including our relationships with merchants, customers and partners. Further, we are exposed to the risk of increased interest rates because our borrowings under the securitization facility are subject to variable rates of interest.
We are subject to risks related to volatility in foreign currency exchange rates, and restrictions on our ability to utilize revenue generated in foreign currencies.
As a result of our foreign operations, we are subject to risks related to changes in currency rates for revenue generated in currencies other than the U.S. dollar. For the year ended December 31, 2014,2015, approximately 44%28% of our revenue was denominated in currencies other than the U.S. dollar (primarily, Czech koruna, Russian ruble, British pound, Brazilian real, Russian ruble, Mexican peso, Czech koruna, Euro, Australian dollar and New Zealand dollar). Revenue and profit generated by international operations may increase or decrease compared to prior periods as a result of changes in foreign currency exchange rates. Resulting exchange gains and losses are included in our net income. Volatility in foreign currency exchange rates may materially adversely affect our operating results and financial condition.
Furthermore, we are subject to exchange control regulations that restrict or prohibit the conversion of more than a specified amount of our foreign currencies into U.S. dollars, and, as we continue to expand, we may become subject to further exchange control regulations that limit our ability to freely utilize and transfer currency in and out of particular jurisdictions. These restrictions may make it more difficult to effectively utilize the cash generated by our operations and may adversely affect our financial condition.
We expect to continue our expansion through acquisitions, which may divert our management’s attention and result in unexpected operating difficulties, increased costs and dilution to our stockholders. We also may never realize the anticipated benefits of the acquisitions.
We have been an active business acquirer in the United States and internationally, and, as part of our growth strategy, we expect to seek to acquire businesses, commercial account portfolios, technologies, services and products in the future. We have substantially expanded our overall business, customer base, headcount and operations through acquisitions. The acquisition and integration of each business involves a number of risks and may result in unforeseen operating difficulties and expenditures in assimilating or integrating the businesses, technologies, products, personnel or operations of the acquired business. Furthermore, acquisitions may:
In addition, international acquisitions often involve additional or increased risks including, for example:
To complete future acquisitions, we may determine that it is necessary to use a substantial amount of our cash or engage in equity or debt financing. If we raise additional funds through further issuances of equity or convertible
debt securities, our existing stockholders could suffer significant dilution, and any new equity securities we issue could have rights, preferences and privileges senior to those of holders of our common stock. Any debt financing obtained by us in the future could involve restrictive covenants relating to our capital-raising activities and other financial and operational matters that make it more difficult for us to obtain additional capital in the future and to pursue other business opportunities, including potential acquisitions. In addition, we may not be able to obtain additional financing on terms favorable to us, if at all, which could limit our ability to engage in acquisitions. Moreover, we can make no assurances that the anticipated benefits of any acquisition, such as operating improvements or anticipated cost savings, would be realized or that we would not be exposed to unexpected liabilities in connection with any acquisition.
Further, an acquisition may negatively affect our operating results because it may require us to incur charges and substantial debt or other liabilities, may cause adverse tax consequences, substantial depreciation and amortization or deferred compensation charges, may require the amortization, write-down or impairment of amounts related to deferred compensation, goodwill and other intangible assets, may include substantial contingent consideration payments or other compensation that reduce our earnings during the quarter in which incurred, or may not generate sufficient financial return to offset acquisition costs.
We conduct a significant portion of our business in foreign countries and we expect to expand our operations into additional foreign countries where we may be adversely affected by operational and political risks that are greater than in the United States.
We have foreign operations in, or provide services for commercial card accounts in Australia, Austria, Azerbaijan, Belarus, Belgium, Botswana, Brazil, Bulgaria, Canada, Croatia, the Czech Republic, Denmark, Estonia, Finland, France, Georgia, Germany, Greece, Hong Kong, Hungary, Ireland, Italy, Kazakhstan, Latvia, Lithuania, Luxembourg, Macau, Malaysia, Mexico, Moldova, Mongolia, Morocco, the Netherlands, New Zealand, Norway, Papua New Guinea, Philippines, Poland, Portugal, Romania, Russia, Singapore, Slovakia, Spain,Slovenia, South Africa, Spain, Sweden, Switzerland, Turkey, United Arab Emirates, the United Kingdom, and Ukraine. We also expect to seek to expand our operations into various countries in Asia, Europe and Latin America as part of our growth strategy.
Some of the countries where we operate, and other countries where we will seek to operate, specifically Russia, Brazil and Mexico, have undergone significant political, economic and social change in recent years, and the risk of unforeseen changes in these countries may be greater than in the United States. For example, Russia and the Ukraine are experiencing significant unrest, which could escalate into broader armed conflict and additional economic sanctions by the U.S., United Nations or other countries against Russia. In addition, changes in laws or regulations, including with respect to payment service providers, taxation, information technology, data transmission and the Internet, or in the interpretation of existing laws or regulations, whether caused by a change in government or otherwise, could materially adversely affect our business, operating results and financial condition. In addition, conducting and expanding our international operations subjects us to other risks that we do not generally face in the United States. These include:
The occurrence of one or more of these events could negatively affect our international operations and, consequently, our operating results. Further, operating in international markets requires significant management attention and financial resources. Due to the additional uncertainties and risks of doing business in foreign jurisdictions, international acquisitions tend to entail risks and require additional oversight and management attention that are typically not attendant to acquisitions made within the United States. We cannot be certain that the investment and additional resources required to establish, acquire or integrate operations in other countries will produce desired levels of revenue or profitability.
We are dependent on the efficient and uninterrupted operation of interconnected computer systems, telecommunications, data centers and call centers, including technology and network systems managed by multiple third parties, which could result in our inability to prevent disruptions in our services.
Our ability to provide reliable service to customers, cardholders and other network participants depends upon uninterrupted operation of our data centercenters and call centers as well as third party labor and services providers. Our business involves processing large numbers of transactions, the movement of large sums of money and management of large amounts of data. We rely on the ability of our employees, contractors, suppliers, systems and processes to complete these transactions in a secure, uninterrupted and error-free manner.
Our subsidiaries operate in various countries and country specific factors, such as power availability, telecommunications carrier redundancy, embargos and regulation can adversely impact our information processing by or for our local subsidiaries.
We engage backup facilities for each of our processing centers for key systems and data. However, there could be material delays in fully activating backup facilities depending on the nature of the breakdown, security breach or catastrophic event (such as fire, explosion, flood, pandemic, natural disaster, power loss, telecommunications failure or physical break-in). We have controls and documented measures to mitigate these risks but in any event these mitigating controls might not reduce the duration, scope or severity of an outage in time to avoid adverse effects.
We may experience software defects, system errors, computer viruses and development delays, which could damage customer relationships, decrease our profitability and expose us to liability.
Our products and services are based on proprietary and third-party network technology and processing systems that may encounter development delays and could be susceptible to undetected errors, viruses or defects. Development delays, system errors, viruses or defects that result in service interruption or data loss could have a material adverse effect on our business, damage our reputation and subject us to third-party liability. In addition, errors, viruses and defects in our network technology and processing systems could result in additional development costs and the diversion of our technical and other resources from other development efforts or operations. Further, our attempts to limit our potential liability, through disclaimers and limitation-of-liability provisions in our agreements, may not be successful.
We may incur substantial losses due to fraudulent use of our payment cards or vouchers.
Under certain circumstances, when we fund customer transactions, we may bear the risk of substantial losses due to fraudulent use of our payment cards or vouchers. We do not maintain any insurance to protect us against anysuch losses. We bear similar risk relating to fraudulent acts of employees or contractors, for which we maintain insurance. However, the conditions or limits of coverage may be insufficient to protect us against such losses.
Criminals are using increasingly sophisticated methods to engage in illegal activities involving financial products, such as skimming and counterfeiting payment cards and identity theft. A single significant incident of fraud, or increases in the overall level of fraud, involving our cards and other products and services, could result in reputational damage to us, which could reduce the use and acceptance of our cards and other products and services or lead to greater regulation that would increase our compliance costs. Fraudulent activity could also result in the imposition of regulatory sanctions, including significant monetary fines, which could have a material adverse effect on our business, financial condition and results of operations.
We may not be able to adequately protect the data we collect, which could subject us to liability and damage our reputation.
We electronically receive, process, store and transmit data and sensitive information about our customers and merchants, including bank account information, social security numbers, expense data, and credit card, debit card and checking account numbers. We keep this information confidential; however, our websites, networks, information systems, services and technologies may be targeted for sabotage, disruption or misappropriation. The uninterrupted operation of our information systems and our ability to maintain the confidentiality of the customer and consumer information that resides on our systems are critical to the successful operation of our business. Unauthorized access to our networks and computer systems could result in the theft or publication of confidential information or the deletion or modification of records or could otherwise cause interruptions in our service and operations.
Because techniques used to obtain unauthorized access or to sabotage systems change frequently and may not be recognized until launched against a target, we may be unable to anticipate these techniques or to implement adequate preventative measures. Although we believe we have sufficient controls in place to prevent disruption and misappropriation and to respond to such attacks, any inability to prevent security breaches could have a negative impact on our reputation, expose us to liability, decrease market acceptance of electronic transactions and cause our present and potential clients to choose another service provider. Any of these developments could have a material adverse effect on our business, operating results and financial condition.
In addition, under payment network rules, regulatory requirements, and related obligations, we may be responsible for the acts or failures to act of certain third parties, such as third party service providers, vendors, partners and others, which we refer to collectively as associated participants. The failure of our associated participants to safeguard cardholder data and other information in accordance with such rules, requirements and obligations could result in significant fines and sanctions. We cannot assure you that there are written agreements in place with every associated participant or that such written agreements will ensure the adequate safeguarding
of such data or information or allow us to seek reimbursement from associated participants. Any such unauthorized use or disclosure of data or information also could result in litigation that could result in a material adverse effect on our business, financial condition and results of operations.
The market for our commercial payment, fleet and stored value card services is evolving and may not continue to develop or grow.
A substantial portion of our revenue is based on the volume of payment card transactions by our customers. If businesses do not continue to use, or increase their use of, credit, debit or stored value cards as a payment mechanism for their transactions, it could have a material adverse effect on our business, financial condition and results of operations. We believe that future growth in the use of credit, debit and stored value cards and other electronic payments will be driven by the cost, ease-of-use, and quality of services offered. In order for us to
consistently increase and maintain profitability, businesses must continue to use and increase the use of electronic payment methods, including credit, debit and stored value cards. Moreover, if there is an adverse development in the payments industry in general, such as new legislation or regulation that makes it more difficult for customers to do business, or a well-publicized data security breach that undermines the confidence of the public in electronic payment systems, it could have a material adverse effect on our business, financial condition and results of operations.
Our fleet card businesses rely on the acceptance and use of payment cards by businesses to purchase fuel for their vehicle fleets. If the use of fleet cards by businesses does not continue to grow, it could have a material adverse effect on our business, operating results and financial condition. In order to consistently increase and maintain our profitability, businesses and partners must continue to adopt our services. Similarly, growth in the acceptance and use of fleet cards will be impacted by the acceptance and use of electronic payment transactions generally.
Furthermore, new technologies may displace credit, debit and/or stored value cards as payment mechanisms for purchase transactions by businesses. A decline in the acceptance and use of credit, debit and/or stored value cards, and electronic payment transactions generally, by businesses and merchants could have a material adverse effect on our business, operating results and financial condition. The market for our lodging cards, food vouchers and cards, transportation and toll road payments, telematics solutions and fleet maintenance management services is also evolving and those portions of our business are subject to similar risks.
If we fail to retain any of our stored value gift card customers, it will be difficult to find a replacement customer on a timely basis or at all, which will reduce our revenue.
Most of our stored value gift card customers in the United States are national retailers. During 2014,2015, a majority of our gift card revenue was derived from the design and purchase of gift card inventory, with the remaining portion of our 20142015 gift card revenue derived primarily from processing fees. If we fail to retain any of these customers, it will be difficult to find a replacement customer on a timely basis or at all because there is a limited number of national retailers in the United States and nearly all of those other national retailers already have a gift card solution in place, either in-house or with one of our competitors. As such, any loss of a stored value gift card customer would reduce our revenue.
Adverse weather conditions across a geographic region can cause a decline in the number and amount of payment transactions we process, which could have a material adverse effect on our business, financial condition and results of operations.
When travel is severely curtailed across a geographic region during adverse weather conditions, the number and amount of transactions we process can be significantly diminished, particularly in our fleet business, and revenue can materially decline. For example, during parts of January 2014, severe winter weather shut down a large portion of the eastern United States. Prolonged adverse weather events, especially those that impact regions in which we process a large number and amount of payment transactions, could have a material adverse effect on our business, financial condition and results of operations.
Our fuel card, workforce payment solutions and gift card businessbusinesses’ results are subject to seasonality, which could result in fluctuations in our quarterly net income.
Our fuel card and workforce payment solutions businesses have experienced in the past, and expect to continue to experience, seasonal fluctuations in revenues and profit, which are impacted during the first and fourth quarter each year by the weather, holidays in the U.S., Christmas being celebrated in Russia in January, and lower business levels in Brazil due to summer break and the Carnival celebration. Our gift card business has experienced in the past, and expects to continue to experience, seasonal fluctuations in revenues as a result of consumer spending patterns. Historically gift card business revenues have been strongest in the third and fourth quarters and weakest in the first and second quarters, as the retail industry has its highest level of activity during and leading up to the Christmas holiday season.season.
Our balance sheet includes significant amounts of goodwill and intangible assets. The impairment of a significant portion of these assets would negatively affect our financial results.
Our balance sheet includes goodwill and intangible assets that represent approximately 72%73% of our total assets at December 31, 2014.2015. These assets consist primarily of goodwill and identified intangible assets associated with our acquisitions. We also expect to engage in additional acquisitions, which may result in our recognition of additional goodwill and intangible assets. Under current accounting standards, we are required to amortize certain intangible assets over the useful life of the asset, while goodwill and indefinite lived intangible assets are not amortized. On at least an annual basis, we assess whether there have been impairments in the carrying value of goodwill and indefinite lived intangible assets. If the carrying value of the asset is determined to be impaired, it is written down to fair value by a charge to operating earnings. An impairment of a significant portion of goodwill or intangible assets could materially negatively affect our operating results and financial condition.
If we are unable to protect our intellectual property rights and confidential information, our competitive position could be harmed and we could be required to incur significant expenses in order to enforce our rights.
To protect our proprietary technology, we rely on copyright, trade secret, patent and other intellectual property laws and confidentiality agreements with employees and third parties, all of which offer only limited protection. Despite our precautions, it may be possible for third parties to obtain and use without consent confidential information or infringe on our intellectual property rights, and our ability to police that misappropriation or infringement is uncertain, particularly in countries outside of the United States. In addition, our confidentiality agreements with employees, vendors, customers and other third parties may not effectively prevent disclosure or use of proprietary technology or confidential information and may not provide an adequate remedy in the event of such unauthorized use or disclosure.
Protecting against the unauthorized use of our intellectual property and confidential information is expensive, difficult and not always possible. Litigation may be necessary in the future to enforce or defend our intellectual property rights, to protect our confidential information, including trade secrets, or to determine the validity and scope of the proprietary rights of others. This litigation could be costly and divert management resources, either of which could harm our business, operating results and financial condition. Accordingly, despite our efforts, we may not be able to prevent third parties from infringing upon or misappropriating our intellectual property and proprietary information.
We cannot be certain that the steps we have taken will prevent the unauthorized use or the reverse engineering of our proprietary technology. Moreover, others may independently develop technologies that are competitive to ours or infringe our intellectual property. The enforcement of our intellectual property rights also depends on our legal actions against these infringers being successful, and we cannot be sure these actions will be successful, even when our rights have been infringed. Furthermore, effective patent, trademark, service mark, copyright and trade secret protection may not be available in every country in which we may offer our products and services.
Claims by others that we or our customers infringe their intellectual property rights could harm our business.
Third parties have in the past, and could in the future claim that our technologies and processes underlying our products and services infringe their intellectual property. In addition, to the extent that we gain greater visibility, market exposure, and add new products and services, we may face a higher risk of being the target of intellectual property infringement claims asserted by third parties. We may, in the future, receive notices alleging that we have misappropriated or infringed a third party’s intellectual property rights. There may be third-party intellectual property rights, including patents and pending patent applications that cover significant aspects of our technologies, processes or business methods. Any claims of infringement or misappropriation by a third party, even those without merit, could cause us to incur substantial defense costs and could distract our management from our business, and there can be no assurance that we will be able to prevail against such claims. Some of our competitors may have the capability to dedicate substantially greater resources to enforcing their intellectual
property rights and to defending claims that may be brought against them than we do. Furthermore, a party making such a claim, if successful, could secure a judgment that requires us to pay substantial damages, potentially including treble damages if we are found to have willfully infringed a patent. A judgment could also include an injunction or other court order that could prevent us from offering our products and services. In addition, we might be required to seek a license for the use of a third party’s intellectual property, which may not be available on commercially reasonable terms or at all. Alternatively, we might be required to develop non-infringing technology, which could require significant effort and expense and might ultimately not be successful.
Third parties may also assert infringement claims against our customers relating to their use of our technologies or processes. Any of these claims might require us to defend potentially protracted and costly litigation on their behalf, regardless of the merits of these claims, because under certain conditions we agree to indemnify our customers from third-party claims of intellectual property infringement. If any of these claims succeed, we might be forced to pay damages on behalf of our customers, which could adversely affect our business, operating results and financial condition.
Finally, we use open source software in connection with our technology and services. Companies that incorporate open source software into their products have, from time to time, faced claims challenging the ownership of open source software. As a result, we could be subject to suits by parties claiming ownership of what we believe to be open source software. Open source software is also provided without warranty, and may therefore include bugs, security vulnerabilities or other defects. Some open source software licenses require users of such software to publicly disclose all or part of the source code to their software and/or make available any derivative works of the open source code on unfavorable terms or at no cost. While we monitor the use of open source software in our technology and services and try to ensure that none is used in a manner that would require us to disclose the source code to the related technology or service, such use could inadvertently occur and any requirement to disclose our proprietary source code could be harmful to our business, financial condition and results of operations.
Our success is dependent, in part, upon our executive officers and other key personnel, and the loss of key personnel could materially adversely affect our business.
Our success depends, in part, on our executive officers and other key personnel. Our senior management team has significant industry experience and would be difficult to replace. The market for qualified individuals is competitive, and we may not be able to attract and retain qualified personnel or candidates to replace or succeed members of our senior management team or other key personnel. The loss of key personnel could materially adversely affect our business.
Changes in laws, regulations and enforcement activities may adversely affect our products and services and the markets in which we operate.
The electronic payments industry is subject to increasing regulation in the United States and internationally. Domestic and foreign government regulations impose compliance obligations on us and restrictions on our operating activities, which can be difficult to administer because of their scope, mandates and varied
requirements. We are subject to a number of government regulations, including, among others: interest rate and fee restrictions; credit access and disclosure requirements; collection and pricing regulations; compliance obligations; security and data breach requirements; identity theft avoidance programs; and anti-money laundering compliance programs. Government regulations can also include licensing or registration requirements. While a large portion of these regulations focuses on individual consumer protection, legislatures continue to consider whether to include business customers within the scope of these regulations. As a result, new or expanded regulation focusing on business customers or changes in interpretation or enforcement of regulations may have an adverse effect on our business and operating results, due to increased compliance costs and new restrictions affecting the terms under which we offer our products and services.
For example, certain of our subsidiaries are currently licensed as money transmitters on the state level by the banking departments or other state agencies of numerous states. Continued licensing by these states is subject to periodic examinations and ongoing satisfaction of compliance requirements regarding safety and soundness, including maintenance of certain levels of net worth, surety bonding, permissible investments in amounts sufficient to cover our outstanding payment obligations with respect to certain of our products subject to licensure, and record keeping and reporting. If our subsidiaries are unable to obtain, maintain or renew necessary licenses or comply with other relevant state regulations, they will not be able to operate as a money transmitter in those states or provide certain other services and products, which could have a material adverse effect on our business, financial condition and results of operations.
In addition, certain of our subsidiaries are subject to regulation by the Financial Crimes Enforcement Network, or FinCEN, and must comply with applicable anti-money laundering requirements, including implementation of an effective antimony laundering program. Changes in this regulatory environment, including changing interpretations and the implementation of new or varying regulatory requirements by the government, may significantly affect or change the manner in which we currently conduct some aspects of our business.
Regulatory changes may also restrict or eliminate present and future business opportunities available to certain of our subsidiaries. For example, the Durbin Amendment to the Dodd-Frank Wall Street Reform and Consumer Protection Act of 2010, which serves to limit interchange fees may restrict or otherwise impact the way our subsidiaries do business or limit their ability to charge certain fees to customers. The CFPB is also engaged in rule making and regulation of the payments industry, in particular with respect to prepaid cards. The CFPB’s focus on the protection of consumers might also extend to many of our small business customers. As a service provider to certain of our bank sponsors, we are subject to direct supervision and examination by the CFPB, in connection with certain of our products and services. CFPB rules, examinations and enforcement actions may require us to adjust our activities and may increase our compliance costs. Changing regulations or standards in the area of privacy and data protection could also adversely impact us. In addition, certain of our bank partners are subject to regulation by federal and state authority and, as a result, could pass through some of those compliance obligations to us.
Our business is subject to U.S. federal anti-money laundering laws and regulations, including the Bank Secrecy Act, as amended by the USA PATRIOT Act of 2001, which we refer to collectively as the BSA. Our business in Canada is also subject to Proceeds of Crime (Money Laundering) and Terrorist Financing Act, or the PCTFA, which is a corollary to the BSA. The BSA, among other things, requires money services businesses (such as money transmitters, issuers of money orders and official checks and providers of prepaid access) to develop and implement risk-based anti-money laundering programs, report large cash transactions and suspicious activity and maintain transaction records. The PCTFA imposes similar requirements.
Many of these laws and regulations are evolving, unclear and inconsistent across various jurisdictions, and ensuring compliance with them is difficult and costly. With increasing frequency, federal and state regulators are holding businesses like ours to higher standards of training, monitoring and compliance, including monitoring for possible violations of laws by our customers and people who do business with our customers while using our products. If we fail or are unable to comply with existing or changed government regulations in a timely and
appropriate manner, we may be subject to injunctions, other sanctions and the payment of fines and penalties, and our reputation may be harmed, which could have a material adverse effect on our business, financial condition and results of operations.
Our partner banks also operate in a highly regulated industry, which recently has been the subject of extensive structural reforms that are expected to negatively affect the conduct and scope of their businesses, their ability to maintain or expand offerings of products and services, and the costs of their operations. These legislative and regulatory changes could prompt our partner banks to alter the extent or the terms of their dealings with us in ways that may have adverse consequences for our business.
In addition, we have endeavored to structure our businesses in accordance with existing tax laws and interpretations, including those related to state occupancy taxes, value added taxes in foreign jurisdictions, payroll taxes and restrictions on repatriation of funds or transfers of revenue between jurisdictions. Changes in tax laws, their interpretations or their enforcement could increase our tax liability, further limit our utilization of funds located in foreign jurisdictions and have a material adverse effect on our business and financial condition.
Governmental regulations designed to protect or limit access to consumerpersonal information could adversely affect our ability to effectively provide our services.
Governmental bodies in the United States and abroad have adopted, or are considering the adoption of, laws and regulations restricting the transfer of, and requiring safeguarding of, non-public personal information. For example, in the United States, all financial institutions must undertake certain steps to ensure the privacy and security of consumer financial information. In connection with providing services to our clients, we are required by regulations and arrangements with payment networks, our sponsor bank and certain clients to provide assurances regarding the confidentiality and security of non-public consumer information. These arrangements require periodic audits by independent companies regarding our compliance with industry standards such as payment card industry, or PCI, standards and also allow for similar audits regarding best practices established by regulatory guidelines. The compliance standards relate to our infrastructure, components, and operational procedures designed to safeguard the confidentiality and security of non-public consumer personal information received from our customers. Our ability to maintain compliance with these standards and satisfy these audits will affect our ability to attract and maintain business in the future. If we fail to comply with these regulations, we could be exposed to suits for breach of contract or to governmental proceedings. In addition, our client relationships and reputation could be harmed, and we could be inhibited in our ability to obtain new clients. If more restrictive privacy laws or rules are adopted by authorities in the future on the federal or state level, our compliance costs may increase, our opportunities for growth may be curtailed by our compliance capabilities or reputational harm and our potential liability for security breaches may increase, all of which could have a material adverse effect on our business, financial condition and results of operations.
Unfavorable resolution of tax contingencies or changes to enacted tax rates could adversely affect our tax expense and results of operations.
Our tax returns and positions are subject to review and audit by federal, state, local, and international taxing authorities. An unfavorable outcome to a tax audit could result in higher tax expense, thereby negatively impacting our results of operations. We have established contingent liabilities for material known tax exposures relating to deductions, transactions and other matters involving some uncertainty as to the proper tax treatment of the item. These liabilities reflect what we believe to be reasonable assumptions as to the likely final resolution of each issue if raised by a taxing authority. There can be no assurance that, in all instances, an issue raised by a tax authority will be finally resolved at a financial cost less than any related liability. An unfavorable resolution, therefore, could negatively impact our financial position, operating results and cash flows in the current and/or future periods.
Our acquisition documents include warranties, covenants and conditions regarding various tax matters that occurred prior to the acquisition, supported by indemnification and, in some cases, holdbacks or escrows from
the sellers. The obligations of the sellers are also generally subject to various limitations. In the event of a tax claim related to a pre-acquisition tax year, we would seek to recover costs and losses from the sellers under the acquisition agreement. However, there is no assurance that any indemnification, holdback or escrow would be sufficient or that we would recover such costs or losses, which could negatively impact our financial position, operating results and cash flows in the current and/or future periods.
We record deferred income taxes to reflect the impact of temporary differences between the amounts of assets and liabilities for financial accounting and income tax purposes. Deferred income taxes are determined using enacted tax rates. Changes in enacted tax rates may negatively impact our operating results.
We generate a portion of our revenue from our lodging card business, which is affected by conditions in the hotel industry generally and has a concentration of customers in the railroad and trucking industries.
Our lodging card business earns revenue from customers purchasing lodging from the hotel industry and derives a significant portion of this revenue from end users in the railroad and trucking industries. Therefore, we are exposed to risks affecting each of these industries. For example, unfavorable economic conditions adversely impacting the hotel, railroad and trucking industries generally could cause a decrease in demand for our products and services in our lodging card business, resulting in decreased revenue, or increased credit risk and related losses, resulting in increased expenses. In addition, mergers or consolidations in these industries could reduce our customer and partnership base, resulting in a smaller market for our products and services.
We contract with government entities and are subject to risks related to our governmental contracts.
In the course of our business we contract with domestic and foreign government entities, including state and local government customers, as well as federal government agencies. As a result, we are subject to various laws and regulations that apply to companies doing business with federal, state and local governments. The laws relating to government contracts differ from other commercial contracting laws and our government contracts may contain pricing terms and conditions that are not common among commercial contracts. In addition, we may be subject to investigation from time to time concerning our compliance with the laws and regulations relating to our government contracts. Our failure to comply with these laws and regulations may result in suspension of these contracts or administrative or other penalties.
Litigation and regulatory actions could subject us to significant fines, penalties or requirements resulting in increased expenses.
We are subject to claims and a number of judicial and administrative proceedings considered normal in the course of our current and past operations, including employment-related disputes, contract disputes, intellectual property disputes, government audits and proceedings, customer disputes and tort claims. Responding to such claims may be difficult and expensive, and we may not prevail. In some proceedings, the claimant seeks damages as well as other relief, which, if granted, would require expenditures on our part or changes in how we conduct business. There can be no certainty that we will not ultimately incur charges in excess of presently established or future financial accruals or insurance coverage, or that we will prevail with respect to such proceedings. Regardless of whether we prevail or not, such litigation could have a material adverse effect on our business, financial condition and results of operations. From time to time, we have had inquiries from regulatory bodies and administrative agencies relating to the operation of our business. Such inquiries may result in various audits, reviews and investigations, which can be time consuming and expensive. An adverse outcome of any investigation by, or other inquiries from, such bodies or agencies could have a material adverse effect on us and result in the institution of administrative or civil proceedings, sanctions and the payment of fines and penalties, changes in personnel, and increased review and scrutiny by customers, regulatory authorities, the media and others, which could have a material adverse effect on our business, financial condition and results of operations. For more information about our judicial and other proceedings, see “Business—Legal Proceedings.”
Our revenues from MasterCard cards are dependent upon our continued MasterCard registration and financial institution sponsorship. If we fail to comply with the applicable requirements of MasterCard, it could seek to fine us, suspend us or terminate our registrations through our financial institution sponsors.
A significant source of our revenue comes from processing transactions through the MasterCard networks. In order to offer MasterCard programs to our customers, one of our subsidiaries is registered as a member service provider with MasterCard through sponsorship by MasterCard member banks in both the United States and Canada. Registration as a service provider is dependent upon our being sponsored by member banks. If our sponsor banks should stop providing sponsorship for us or determine to provide sponsorship on materially less favorable terms, we would need to find other financial institutions to provide those services or we would need to become a MasterCard member, bank, either of which could prove to be difficult and expensive. Even if we pursue
sponsorship by alternative member banks, similar requirements and dependencies would likely still exist.In addition, MasterCard routinely updates and modifies its requirements. Changes in the requirements may make it significantly more expensive for us to provide these services. If we do not comply with MasterCard requirements, it could seek to fine us, suspend us or terminate our registration, which allows us to process transactions on its networks. The termination of our registration, or any changes in the payment network rules that would impair our registration, could require us to stop providing MasterCard payment processing services. If we are unable to find a replacement financial institution to provide sponsorship or become a member, we may no longer be able to provide such services to the affected customers, which would have a material adverse effect our business, financial condition and results of operations.
Changes in MasterCard interchange fees could decrease our revenue.
A portion of our revenue is generated by network processing fees charged to merchants, known as interchange fees, associated with transactions processed using our MasterCard-branded cards. Interchange fee amounts associated with our MasterCard network cards are affected by a number of factors, including regulatory limits in the United States and Europe and fee changes imposed by MasterCard. In addition, interchange fees are the subject of intense legal and regulatory scrutiny and competitive pressures in the electronic payments industry, which could result in lower interchange fees generally in the future. Temporary or permanent decreases in the interchange fees associated with our MasterCard network card transactions, could adversely affect our business and operating results.
If we are not able to maintain and enhance our brands, it could adversely affect our business, operating results and financial condition.
We believe that maintaining and enhancing our brands is critical to our customer relationships, and our ability to obtain partners and retain employees. The successful promotion of our brands will depend upon our marketing and public relations efforts, our ability to continue to offer high-quality products and services and our ability to successfully differentiate our services from those of our competitors. In addition, future extension of our brands to add new products or services different from our current offerings may dilute our brands, particularly if we fail to maintain our quality standards in these new areas. The promotion of our brands will require us to make substantial expenditures, and we anticipate that the expenditures will increase as our markets become more competitive and we expand into new markets. To the extent that these activities yield increased revenues, this revenue may not offset the expenses we incur. There can be no assurance that our brand promotion activities will be successful.
Failure to comply with the United States Foreign Corrupt Practices Act, and similar laws associated with our international activities, could subject us to penalties and other adverse consequences.
As we continue to expand our business internationally, we may continue to expand into certain foreign countries, particularly those with developing economies, where companies often engage in business practices that are prohibited by U.S., U.K. and other foreign regulations, including the United States Foreign Corrupt Practices Act, or the FCPA, and the U.K. Bribery Act. The FCPA prohibits improper payments or offers of payments to
foreign governments and their officials and political parties by U.S. and other business entities for the purpose of obtaining or retaining business. We have implemented policies to discourage such practices; however, there can be no assurances that all of our employees, consultants and agents, including those that may be based in or from countries where practices that violate U.S. laws may be customary, will not take actions in violation of our policies, for which we may be ultimately responsible. Violations of the FCPA or similar laws may result in severe criminal or civil sanctions and, in the U.S., suspension or debarment from U.S. government contracting, which could negatively affect our business, operating results and financial condition.
Risks related to ownership of our common stock
Our stock price could be volatile and our stock could decline in value.
The market price of our common stock may fluctuate substantially as a result of many factors, some of which are beyond our control. Factors that could cause fluctuations in the market price of our common stock include the following:
In addition, the stock market in general has experienced significant price and volume fluctuations that have often been unrelated or disproportionate to operating performance of individual companies. These broad market factors may seriously harm the market price of our common stock, regardless of our operating performance. In the past, following periods of volatility in the market price of a company’s securities, securities class action litigation has often been instituted. A securities class action suit against us could result in significant liabilities and, regardless of the outcome, could result in substantial costs and the diversion of our management’s attention and resources.
Our disclosure controls and procedures may not prevent or detect all errors or acts of fraud.
We are subject to the periodic reporting requirements of the Securities Exchange Act of 1934, as amended, or the Exchange Act. Our disclosure controls and procedures are designed to reasonably ensure that information required to be disclosed by us in reports we file or submit under the Exchange Act is accumulated and communicated to management and recorded, processed, summarized and reported within the time periods specified in the rules and forms of the Securities and Exchange Commission. We believe that any disclosure controls and procedures or internal controls and procedures, no matter how well conceived and operated, can provide only reasonable, not absolute, assurance that the objectives of the control system are and will be met. These inherent limitations include the realities that judgments in decision-making can be faulty and that breakdowns can occur because of simple error or mistake. Additionally, controls can be circumvented by the individual acts of some persons, by collusion of two or more people or by an unauthorized override of the controls. Accordingly, because of the inherent limitations in our control system, misstatements due to error or fraud may occur and not be detected.
Anti-takeover provisions in our charter documents could discourage, delay or prevent a change in control of our company and may affect the trading price of our common stock.
Our corporate documents and the Delaware General Corporation Law contain provisions that may enable our board of directors to resist a change in control of FleetCor even if a change in control were to be considered favorable by you and other stockholders. These provisions:
In addition, Delaware law imposes some restrictions on mergers and other business combinations between any holder of 15% or more of our outstanding voting stock and us. These provisions could discourage, delay or prevent a transaction involving a change in control of FleetCor. These provisions could also discourage proxy contests and make it more difficult for you and other stockholders to elect directors of your choosing and cause us to take other corporate actions you desire.
We do not expect to pay any dividends on our common stock for the foreseeable future.
We currently expect to retain all future earnings, if any, for future operation, expansion and debt repayment and have no current plans to pay any cash dividends to holders of our common stock for the foreseeable future. Any decision to declare and pay dividends in the future will be made at the discretion of our board of directors and will depend on, among other things, our operating results, financial condition, cash requirements, contractual restrictions and other factors that our board of directors may deem relevant. In addition, we must comply with the covenants in our credit agreements in order to be able to pay cash dividends, and our ability to pay dividends generally may be further limited by covenants of any existing and future outstanding indebtedness we or our subsidiaries incur.
ITEM 1B. UNRESOLVED STAFF COMMENTS
We have received no unresolved written comments regarding our periodic or current reports from the staff of the SEC.
We lease all of the real property used in our business, except as noted below. The following table lists each of our material facilities and its location, use and approximate square footage, at December 31, 2014.2015.
Facility | Use | Approximate size | ||||
United States | Square Feet | |||||
Norcross, Georgia | Corporate headquarters and operations | 81,000 | ||||
Covington, Louisiana | Corporate accounting, treasury and merchant authorization | 13,600 | ||||
Houston, Texas | Credit and collections | 6,300 | ||||
Concord, California | Customer support | 7,100 | ||||
Wichita, Kansas | CLC operations and customer support | 31,100 | ||||
Atlanta, Georgia | NexTraq sales, operations and customer support | 36,800 | ||||
Tampa, Florida | NexTraq sales | 8,300 | ||||
Sunnyvale, California | Telenav sales, operations and customer support | 15,100 | ||||
Salem, Oregon | Pacific Pride sales, operations and customer support | 10,000 | ||||
Brentwood, Tennessee | Comdata sales, operations and customer support | 228,000 | ||||
Nashville, Tennessee | Comdata operations | 38,300 | ||||
Franklin, Tennessee | Comdata warehouse facility | 20,100 | ||||
Louisville, Kentucky | SVS sales, operations and customer support | 66,000 | ||||
Austin, Texas | Comdata operations | 4,300 | ||||
International | ||||||
Prague, Czech Republic | CCS headquarters | |||||
Mexico City, Mexico(1) | FleetCor Mexico headquarters and operations | |||||
Moscow, Russia | PPR and NKT headquarters, sales, customer support, operations, credit and collections | |||||
Bryansk, Russia | ||||||
Ipswich, United Kingdom(1) | Operations, sales and customer support | 17,900 | ||||
Knaresborough, United Kingdom | Operations, sales and customer support | 5,100 | ||||
London, United Kingdom | Europe headquarters | 2,800 | ||||
Swindon, United Kingdom | Allstar and Shell Europe (Belgium, Netherlands and France) operations, sales and customer support | |||||
Walsall, United Kingdom | Operations, sales and customer support | 9,500 | ||||
Birmingham, United Kingdom | EPYX headquarters, sales, operations and customer support | |||||
Sao Paulo, Brazil | CTF and VB Servicios headquarters, sales, customer support and operations | 32,300 | ||||
Osasco, Brazil | CTF and VB Servicios operations | 7,100 | ||||
Rio de Janeiro, Brazil | DB Trans and AExpresso headquarters, sales, operations and customer support | |||||
Auckland, New Zealand | CardLink headquarters, sales, operations and customer support | 12,100 | ||||
Nurnberg, Germany | Shell Europe sales | 3,800 | ||||
| (1) | We own these facilities. |
We also lease a number of minor additional facilities, including local sales and operations offices less than 2,5002,550 square feet, small storage facilities and a small number of service stations in the United Kingdom.Kingdom; which are not included in the above list. We believe our facilities are adequate for our needs for at least the next 12 months. We anticipate that suitable additional or alternative facilities will be available to accommodate foreseeable expansion of our operations.
As of the date of this filing, we are not currently party to any legal proceedings or governmental inquiries or investigations that we consider to be material and we were not involved in any material legal proceedings that terminated during the fourth quarter. We are and may become, however, subject to lawsuits from time to time in the ordinary course of our business.
ITEM 4. MINE SAFETY DISCLOSURES
Not applicable.
PART II
ITEM 5. MARKET FOR REGISTRANT’S COMMON EQUITY, RELATED STOCKHOLDER
MATTERS, AND ISSUER PURCHASES OF EQUITY SECURITIES
Our common stock is traded on the New York Stock Exchange (NYSE) under the symbol “FLT”. As of December 31, 2014,2015, there were 4245 holders of record of our common stock. The table set forth below provides the intraday high and low sales prices per share of our common stock for the four quarters during 20142015 and 2013.2014.
| High | Low | High | Low | |||||||||||||
2015: | ||||||||||||||||
First Quarter | $ | 158.45 | $ | 135.73 | ||||||||||||
Second Quarter | 165.67 | 149.75 | ||||||||||||||
Third Quarter | 164.61 | 135.16 | ||||||||||||||
Fourth Quarter | 157.97 | 134.55 | ||||||||||||||
2014: | ||||||||||||||||
First Quarter | $ | 130.57 | $ | 101.69 | $ | 130.57 | $ | 101.69 | ||||||||
Second Quarter | 133.73 | 108.75 | 133.73 | 108.75 | ||||||||||||
Third Quarter | 148.60 | 128.64 | 148.60 | 128.64 | ||||||||||||
Fourth Quarter | 156.05 | 123.44 | 156.05 | 123.44 | ||||||||||||
2013: | ||||||||||||||||
First Quarter | $ | 77.46 | $ | 54.10 | ||||||||||||
Second Quarter | 89.75 | 78.88 | ||||||||||||||
Third Quarter | 112.50 | 81.10 | ||||||||||||||
Fourth Quarter | 123.96 | 98.41 | ||||||||||||||
DIVIDENDS AND SHARE REPURCHASES
We currently expect to retain all future earnings, if any, for use in the operation and expansion of our business. We have never declared or paid any dividends on our common stock and do not anticipate paying cash dividends to holders of our common stock in the foreseeable future. In addition, our credit agreements restrict our ability to pay dividends. Any determination to pay dividends in the future will be at the discretion of our board of directors and will depend upon, among other factors, our results of operations, financial condition, capital requirements and covenants in our existing financing arrangements and any future financing arrangements.
On February 4, 2016, our Board of Directors approved a stock repurchase program under which we may begin purchasing up to $500 million of its common stock over the next 18 months. Any stock repurchases may be made at times and in such amounts as we deem appropriate. The timing and amount of stock repurchase, if any, will depend on a variety of factors including the stock price, market conditions, corporate and regulatory requirements, and any additional constraints related to material inside information we may possess. The repurchases are expected to be funded by available cash flow from the business and working capital.
PERFORMANCE GRAPH
The following graph assumes $100 invested on December 15, 2010 (the date our shares first commenced trading), at the closing price ($27.25) of our common stock on that day, and compares (a) the percentage change of our cumulative total stockholder return on the common stock (as measured by dividing (i) the difference between our share price at the end and the beginning of the period presented by (ii) the share price at the beginning of the periods presented) with (b) (i) the Russell 2000 Index and (ii) the S&P 500® Data Processing & Outsourced Services.
Period Ending | FleetCor Technologies, Inc. | Russell 2000 | S&P Data Processing and Outsourced Services | |||||||||
12/15/2010 | $ | 100.00 | $ | 100.00 | $ | 100.00 | ||||||
12/31/2010 | $ | 113.47 | $ | 101.99 | $ | 95.81 | ||||||
3/31/2011 | $ | 119.85 | $ | 109.79 | $ | 103.76 | ||||||
6/30/2011 | $ | 108.77 | $ | 107.69 | $ | 109.64 | ||||||
9/30/2011 | $ | 96.37 | $ | 83.84 | $ | 101.69 | ||||||
12/31/2011 | $ | 109.61 | $ | 96.43 | $ | 117.84 | ||||||
3/31/2012 | $ | 142.28 | $ | 108.06 | $ | 131.45 | ||||||
6/30/2012 | $ | 128.59 | $ | 103.92 | $ | 134.18 | ||||||
9/30/2012 | $ | 164.40 | $ | 108.99 | $ | 142.48 | ||||||
12/31/2012 | $ | 196.88 | $ | 110.54 | $ | 150.84 | ||||||
3/31/2013 | $ | 281.36 | $ | 123.84 | $ | 169.26 | ||||||
6/30/2013 | $ | 298.35 | $ | 127.22 | $ | 179.29 | ||||||
9/30/2013 | $ | 404.26 | $ | 139.75 | $ | 196.49 | ||||||
12/31/2013 | $ | 429.98 | $ | 151.44 | $ | 228.94 | ||||||
3/31/2014 | $ | 422.39 | $ | 152.67 | $ | 217.93 | ||||||
6/30/2014 | $ | 483.67 | $ | 155.26 | $ | 218.52 | ||||||
9/30/2014 | $ | 521.54 | $ | 143.38 | $ | 221.34 | ||||||
12/31/2014 | $ | 545.72 | $ | 156.79 | $ | 256.74 | ||||||
Period Ending | FleetCor Technologies, Inc. | Russell 2000 | S&P Data Processing and Outsourced Services | |||||||||
12/15/2010 | $ | 100.00 | $ | 100.00 | $ | 100.00 | ||||||
12/31/2010 | $ | 113.47 | $ | 101.99 | $ | 95.81 | ||||||
Period Ending 3/31/2011 6/30/2011 9/30/2011 12/31/2011 3/31/2012 6/30/2012 9/30/2012 12/31/2012 3/31/2013 6/30/2013 9/30/2013 12/31/2013 3/31/2014 6/30/2014 9/30/2014 12/31/2014 3/31/2015 6/30/2015 9/30/2015 12/31/2015 FleetCor
Technologies, Inc. Russell 2000 S&P Data
Processing and
Outsourced
Services $ 119.85 $ 109.79 $ 103.76 $ 108.77 $ 107.69 $ 109.64 $ 96.37 $ 83.84 $ 101.69 $ 109.61 $ 96.43 $ 117.84 $ 142.28 $ 108.06 $ 131.45 $ 128.59 $ 103.92 $ 134.18 $ 164.40 $ 108.99 $ 142.48 $ 196.88 $ 110.54 $ 150.84 $ 281.36 $ 123.84 $ 169.26 $ 298.35 $ 127.22 $ 179.29 $ 404.26 $ 139.75 $ 196.49 $ 429.98 $ 151.44 $ 228.94 $ 422.39 $ 152.67 $ 217.93 $ 483.67 $ 155.26 $ 218.52 $ 521.54 $ 143.38 $ 221.34 $ 545.72 $ 156.79 $ 256.74 $ 553.83 $ 163.04 $ 262.43 $ 572.70 $ 163.20 $ 265.08 $ 505.03 $ 143.25 $ 260.96 $ 524.51 $ 147.83 $ 283.80
RECENT SALES OF UNREGISTERED SECURITIES AND USE OF PROCEEDS
Except as previously disclosed on Form 8-K dated August 12, 2014 and Form 8-K dated November 17, 2014, there were no unregistered sales of equity securities during 2014.Not Applicable.
ITEM 6. SELECTED FINANCIAL DATA
We derived the consolidated statement of income and other financial data for the years ended December 31, 2015, 2014 2013 and 20122013 and the selected consolidated balance sheet data as of December 31, 20142015 and 20132014 from the audited consolidated financial statements included elsewhere in this report. We derived the selected historical financial data for the years ended December 31, 20112012 and 20102011 and the selected consolidated balance sheets as of December 31, 2013, 2012 2011 and 20102011 from our audited consolidated financial statements that are not included in this report.
The selected consolidated financial data set forth below should be read in conjunction with “Management’s Discussion and Analysis of Financial Condition and Results of Operations” and our audited consolidated financial statements and notes thereto included elsewhere in this report. Our historical results are not necessarily indicative of the results to be expected in any future period.
(in thousands, except per share data) | 2014 | 2013 | 2012 | 2011 | 2010 | 2015 | 2014 | 2013 | 2012 | 2011 | ||||||||||||||||||||||||||||||
Consolidated statement of income data: | ||||||||||||||||||||||||||||||||||||||||
Revenues, net | $ | 1,199,390 | $ | 895,171 | $ | 707,534 | $ | 519,591 | $ | 433,841 | $ | 1,702,865 | $ | 1,199,390 | $ | 895,171 | $ | 707,534 | $ | 519,591 | ||||||||||||||||||||
Expenses: | ||||||||||||||||||||||||||||||||||||||||
Merchant commissions | 96,254 | 68,143 | 58,573 | 51,199 | 49,050 | 108,257 | 96,254 | 68,143 | 58,573 | 51,199 | ||||||||||||||||||||||||||||||
Processing | 173,337 | 134,030 | 115,446 | 84,516 | 69,687 | 331,073 | 173,337 | 134,030 | 115,446 | 84,516 | ||||||||||||||||||||||||||||||
Selling | 75,527 | 57,346 | 46,429 | 36,606 | 32,731 | 109,075 | 75,527 | 57,346 | 46,429 | 36,606 | ||||||||||||||||||||||||||||||
General and administrative | 205,963 | 142,283 | 110,122 | 84,765 | 78,135 | 297,715 | 205,963 | 142,283 | 110,122 | 84,765 | ||||||||||||||||||||||||||||||
Depreciation and amortization | 112,361 | 72,737 | 52,036 | 36,171 | 33,745 | 193,453 | 112,361 | 72,737 | 52,036 | 36,171 | ||||||||||||||||||||||||||||||
Other operating, net | (29,501 | ) | — | — | — | — | (4,242 | ) | (29,501 | ) | — | — | — | |||||||||||||||||||||||||||
|
|
|
|
|
|
|
|
|
| |||||||||||||||||||||||||||||||
Operating income | 565,449 | 420,632 | 324,928 | 226,334 | 170,493 | 667,534 | 565,449 | 420,632 | 324,928 | 226,334 | ||||||||||||||||||||||||||||||
|
|
|
|
|
|
|
|
|
| |||||||||||||||||||||||||||||||
Equity method investment loss | 57,668 | 8,586 | — | — | — | |||||||||||||||||||||||||||||||||||
Other expense (income), net | (700 | ) | 602 | 1,121 | (589 | ) | (1,319 | ) | 2,523 | (700 | ) | 602 | 1,121 | (589 | ) | |||||||||||||||||||||||||
Equity method investment loss | 8,586 | — | — | — | — | |||||||||||||||||||||||||||||||||||
Interest expense, net | 28,856 | 16,461 | 13,017 | 13,377 | 20,532 | 71,339 | 28,856 | 16,461 | 13,017 | 13,377 | ||||||||||||||||||||||||||||||
Loss on early extinguishment of debt | 15,764 | — | — | 2,669 | — | — | 15,764 | — | — | 2,669 | ||||||||||||||||||||||||||||||
|
|
|
|
|
|
|
|
|
| |||||||||||||||||||||||||||||||
Total other expense | 52,506 | 17,063 | 14,138 | 15,457 | 19,213 | 131,530 | 52,506 | 17,063 | 14,138 | 15,457 | ||||||||||||||||||||||||||||||
|
|
|
|
|
|
|
|
|
| |||||||||||||||||||||||||||||||
Income before income taxes | 512,943 | 403,569 | 310,790 | 210,877 | 151,280 | 536,004 | 512,943 | 403,569 | 310,790 | 210,877 | ||||||||||||||||||||||||||||||
Provision for income taxes | 144,236 | 119,068 | 94,591 | 63,542 | 43,384 | 173,573 | 144,236 | 119,068 | 94,591 | 63,542 | ||||||||||||||||||||||||||||||
|
|
|
|
|
|
|
|
|
| |||||||||||||||||||||||||||||||
Net income | $ | 368,707 | $ | 284,501 | $ | 216,199 | $ | 147,335 | $ | 107,896 | $ | 362,431 | $ | 368,707 | $ | 284,501 | $ | 216,199 | $ | 147,335 | ||||||||||||||||||||
|
|
|
|
|
|
|
|
|
| |||||||||||||||||||||||||||||||
Earnings per share: | ||||||||||||||||||||||||||||||||||||||||
Earnings per share, basic | $ | 4.37 | $ | 3.48 | $ | 2.59 | $ | 1.83 | $ | 3.00 | $ | 3.94 | $ | 4.37 | $ | 3.48 | $ | 2.59 | $ | 1.83 | ||||||||||||||||||||
Earnings per share, diluted | $ | 4.24 | $ | 3.36 | $ | 2.52 | $ | 1.76 | $ | 1.34 | $ | 3.85 | $ | 4.24 | $ | 3.36 | $ | 2.52 | $ | 1.76 | ||||||||||||||||||||
Weighted average shares outstanding, basic | 84,317 | 81,793 | 83,328 | 80,610 | 35,434 | 92,023 | 84,317 | 81,793 | 83,328 | 80,610 | ||||||||||||||||||||||||||||||
Weighted average shares outstanding, diluted | 86,982 | 84,655 | 85,736 | 83,654 | 80,751 | 94,139 | 86,982 | 84,655 | 85,736 | 83,654 | ||||||||||||||||||||||||||||||
| As of December 31, | ||||||||||||||||||||||||||||||||||||||||
(in thousands) | 2015 | 2014 | 2013 | 2012 | 2011 | |||||||||||||||||||||||||||||||||||
Consolidated balance sheet data: | ||||||||||||||||||||||||||||||||||||||||
Cash and cash equivalents | $ | 447,152 | $ | 477,069 | $ | 338,105 | $ | 283,649 | $ | 285,159 | ||||||||||||||||||||||||||||||
Restricted cash(1) | 167,492 | 135,144 | 48,244 | 53,674 | 55,762 | |||||||||||||||||||||||||||||||||||
Total assets(2) | 7,891,868 | 8,524,701 | 3,908,717 | 2,721,870 | 2,349,169 | |||||||||||||||||||||||||||||||||||
Total debt | 2,937,062 | 3,593,717 | 1,486,378 | 925,092 | 704,265 | |||||||||||||||||||||||||||||||||||
Total stockholders’ equity(2) | 2,830,047 | 2,618,562 | 1,223,502 | 913,822 | 811,436 | |||||||||||||||||||||||||||||||||||
| As of December 31, | ||||||||||||||||||||
(in thousands) | 2014 | 2013 | 2012 | 2011 | 2010 | |||||||||||||||
Consolidated balance sheet data: | ||||||||||||||||||||
Cash and cash equivalents | $ | 477,069 | $ | 338,105 | $ | 283,649 | $ | 285,159 | $ | 114,804 | ||||||||||
Restricted cash(1) | 135,144 | 48,244 | 53,674 | 55,762 | 62,341 | |||||||||||||||
Total assets | 8,674,506 | 3,932,235 | 2,721,870 | 2,349,169 | 1,484,118 | |||||||||||||||
Total debt | 3,593,717 | 1,486,378 | 925,092 | 704,265 | 469,413 | |||||||||||||||
Total stockholders’ equity | 2,753,137 | 1,243,893 | 913,822 | 811,436 | 625,945 | |||||||||||||||
| (1) | Restricted cash represents customer deposits repayable on demand. |
| (2) | Revision of Previously Issued Financial Statements— We have revised previously reported balances within our Consolidated Balance Sheets as of December 31, 2014 and 2013, to translate these balances using the correct functional currencies. This revision had no effect on our Consolidated Statements of Income or Consolidated Statements of Cash Flows. We do not believe this revision was material to any prior period financial statement. See Footnote 2 to the Consolidated Financial Statements, Summary of Significant Accounting Policies. |
ITEM 7. MANAGEMENT’S DISCUSSION AND ANALYSIS OF FINANCIAL CONDITION AND
RESULTS OF OPERATIONS
The following discussion and analysis of our financial condition and results of operations should be read in conjunction with the consolidated financial statements and related notes appearing elsewhere in this report. In addition to historical information, this discussion contains forward-looking statements that involve risks, uncertainties and assumptions that could cause actual results to differ materially from management’s expectations. Factors that could cause such differences include, but are not limited to, those identified below and those described in Item 1A “Risk Factors” appearing elsewhere in this report. All foreign currency amounts that have been converted into U.S. dollars in this discussion are based on the exchange rate as reported by Oanda for the applicable periods. In this report, when we refer to consolidated revenue, the provision for bad debts and interest expense on a “managed basis,” such amounts have been adjusted for the impact of the new accounting guidance related to our securitization facility as further discussed below. The term “managed basis” is used throughout “Management’s Discussion and Analysis of Financial Condition and Results of Operations”.
General Business
FleetCor is a leading independent global provider of fuel cards, commercial payment and data solutions, stored value solutions, and workforce payment products and services to businesses, retailers, commercial fleets, major oil companies, petroleum marketers and government entities in countries throughout North America, LatinSouth America, Europe, Australia and New Zealand. Our payment programs enable our customers to better manage and control their commercial payments, card programs, and employee spending and provide card-accepting merchants with a high volume customer base that can increase their sales and customer loyalty. We also provide a suite of fleet related and workforce payment solution products, including a mobile telematics service, fleet maintenance management and employee benefit and transportation related payments. In 2014,2015, we processed approximately 652 million1.9 billion transactions on our proprietary networks and third-party networks (which includes approximately 270 million1.3 billion transactions related to our SVS product, acquired with Comdata). We believe that our size and scale, geographic reach, advanced technology and our expansive suite of products, services, brands and proprietary networks contribute to our leading industry position.
We provide our payment products and services in a variety of combinations to create customized payment solutions for our customers and partners. We collectively refer to our suite of product offerings as workforce productivity enhancement products for commercial businesses. We sell a range of customized fleet and lodging payment programs directly and indirectly to our customers through partners, such as major oil companies, leasing companies and petroleum marketers. We refer to these major oil companies, leasing companies, petroleum marketers, value-added resellers (VARs) and other referral partners with whom we have strategic relationships as our “partners.” We provide our customers with various card products that typically function like a charge card to purchase fuel, lodging, food, toll, transportation and related products and services at participating locations.
We support our products with specialized issuing, processing and information services that enable us to manage card accounts, facilitate the routing, authorization, clearing and settlement of transactions, and provide value-added functionality and data, including customizable card-level controls and productivity analysis tools. In order to deliver our payment programs and services and process transactions, we own and operate proprietary “closed-loop” networks through which we electronically connect to merchants and capture, analyze and report customized information in North America and internationally. We also use third-party networks to deliver our payment programs and services in order to broaden our card acceptance and use. To support our payment products, we also provide a range of services, such as issuing and processing, as well as specialized information services that provide our customers with value-added functionality and data. Our customers can use this data to track important business productivity metrics, combat fraud and employee misuse, streamline expense administration and lower overall workforce and fleet operating costs. Depending on our customer’scustomers’ and partner’spartners’ needs, we provide these services in a variety of outsourced solutions ranging from a comprehensive “end-to-end” solution (encompassing issuing, processing and network services) to limited back office processing services.
FleetCor’s predecessor company was organized in the United States in 1986. In 2000, our current chief executive officer joined us and we changed our name to FleetCor Technologies, Inc. Since 2000, we have grown significantly
through a combination of organic initiatives, product and service innovation and over 65 acquisitions of businesses and commercial account portfolios. Our corporate headquarters are located in Norcross, Georgia. As of December 31, 2014,2015, we employed approximately 4,7805,330 employees, approximately 2,1802,660 of whom are located in the United States.
Executive Overview
Segments
We operate in two segments, which we refer to as our North America and International segments. The results from our Shell Germany business acquired during the third quarter of 2014 are reported in our International segment. The results from our Pacific Pride business acquired in the second quarter of 2014 and Comdata business acquired in the fourth quarter of 2014 are included within our North America segment. See “Results of Operations” for additional segment information.
Our revenue is reported net of the wholesale cost for underlying products and services. In this report, we refer to this net revenue as “revenue.” For the years ended December 31, 2015, 2014 2013 and 2012,2013, our North America and International segments generated the following revenue:
| Year ended December 31, | Year ended December 31, | |||||||||||||||||||||||||||||||||||||||||||||||
| 2014 | 2013 | 2012 | 2015 | 2014 | 2013 | |||||||||||||||||||||||||||||||||||||||||||
(dollars in millions) | Revenues, net | % of total revenues, net | Revenues, net | % of total revenues, net | Revenues, net | % of total revenues, net | Revenues, net | % of total revenues, net | Revenues, net | % of total revenues, net | Revenues, net | % of total revenues, net | ||||||||||||||||||||||||||||||||||||
North America | $ | 668.3 | 55.7 | % | $ | 460.7 | 51.5 | % | $ | 400.1 | 56.6 | % | $ | 1,232.0 | 72.3 | % | $ | 668.3 | 55.7 | % | $ | 460.7 | 51.5 | % | ||||||||||||||||||||||||
International | 531.1 | 44.3 | % | 434.5 | 48.5 | % | 307.4 | 43.4 | % | 470.9 | 27.7 | % | 531.1 | 44.3 | % | 434.5 | 48.5 | % | ||||||||||||||||||||||||||||||
|
|
|
|
|
|
|
|
|
|
|
| |||||||||||||||||||||||||||||||||||||
| $ | 1,199.4 | 100.0 | % | $ | 895.2 | 100.0 | % | $ | 707.5 | 100.0 | % | $ | 1,702.9 | 100.0 | % | $ | 1,199.4 | 100.0 | % | $ | 895.2 | 100.0 | % | |||||||||||||||||||||||||
|
|
|
|
|
|
|
|
|
|
|
| |||||||||||||||||||||||||||||||||||||
Sources of Revenue
Transactions. In both of our segments, we derive revenue from transactions and the related revenue per transaction.transactions. As illustrated in the diagram below, a transaction is defined as a purchase by a customer. Our customers include holders of our card products and those of our partners, for whom we manage card programs, members of our proprietary networks who are provided access to our products and services and commercial businesses to whom we provide workforce payment productivity solutions. Revenue from transactions is derived from our merchant and network relationships, as well as our customers and partners. Through our merchant and network relationships we primarily offer fuel cards, corporate cards, virtual cards, purchasing cards, T&E cards, gift cards, storestored value payroll cards, vehicle maintenance, food, fuel, toll and transportation cards and vouchers or lodging services to our customers.
The following diagram illustrates a typical card transaction flow, but may also be applied to our vehicle maintenance, lodging and food, fuel, toll and transportation card and voucher products, substituting transactions for gallons. This representative model may not include all of our businesses.
Illustrative Transaction Flow
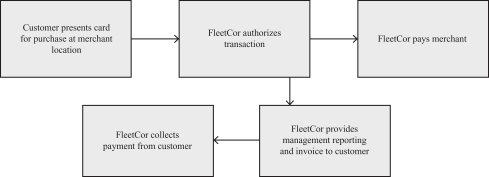

From our customers and partners, we derive revenue from a variety of program fees, including transaction fees, card fees, network fees and charges, which can be fixed fees, cost plus a mark-up or based on a percentage discount from retail prices. Our programs include other fees and charges associated with late payments and based on customer credit risk.
From our merchant and network relationships, we derive revenue mostly from the difference between the price charged to a customer for a transaction and the price paid to the merchant or network for the same transaction, as well as network fees and charges in certain businesses. As illustrated in the table below, the price paid to a merchant or network may be calculated as (i) the merchant’s wholesale cost of the product plus a markup; (ii) the transaction purchase price less a percentage discount; or (iii) the transaction purchase price less a fixed fee per unit.
The following table presents an illustrative revenue model for transactions with the merchant, which is primarily applicable to fuel based product transactions, but may also be applied to our vehicle maintenance, lodging and food, fuel, toll and transportation card and voucher products, substituting transactions for gallons. This representative model may not include all of our businesses.
Illustrative Revenue Model for Fuel Purchases
(unit of one gallon)
Illustrative Revenue | Merchant Payment Methods | |||||||||||||||||||||
Retail Price | $ | 3.00 | i) Cost Plus Mark-up: | ii) Percentage Discount: | iii) Fixed Fee: | |||||||||||||||||
Wholesale Cost | (2.86 | ) | Wholesale Cost | $ | 2.86 | Retail Price | $ | 3.00 | Retail Price | $ | 3.00 | |||||||||||
|
| |||||||||||||||||||||
| Mark-up | 0.05 | Discount (3%) | (0.09 | ) | Fixed Fee | (0.09 | ) | |||||||||||||||
|
|
|
|
|
| |||||||||||||||||
FleetCor Revenue | $ | 0.14 | ||||||||||||||||||||
|
| |||||||||||||||||||||
Merchant Commission | $ | (0.05 | ) | Price Paid to Merchant | $ | 2.91 | Price Paid to Merchant | $ | 2.91 | Price Paid to Merchant | $ | 2.91 | ||||||||||
|
|
|
|
|
|
|
| |||||||||||||||
Price Paid to Merchant | $ | 2.91 | ||||||||||||||||||||
|
| |||||||||||||||||||||
Illustrative Revenue Merchant Payment Methods Retail Price Wholesale Cost FleetCor Revenue Merchant Commission Price Paid to Merchant Price Paid to Merchant Price Paid to Merchant Price Paid to Merchant
Model $ 3.00 i) Cost Plus Mark-up: ii) Percentage Discount: iii) Fixed Fee: (2.86 ) Wholesale Cost $ 2.86 Retail Price $ 3.00 Retail Price $ 3.00 Mark-up 0.05 Discount (3%) (0.09 ) Fixed Fee (0.09 ) $ 0.14 $ (0.05 ) $ 2.91 $ 2.91 $ 2.91 $ 2.91
Set forth below are our sources of revenue for the years ended December 31, 2015, 2014 2013 and 2012,2013, expressed as a percentage of consolidated revenues:
| Year Ended December 31, | ||||||||||||
| 2014 | 2013 | 2012 | ||||||||||
Revenue from customers and partners | 54.9 | % | 53.6 | % | 46.9 | % | ||||||
Revenue from merchants and networks | 45.1 | % | 46.4 | % | 53.1 | % | ||||||
Revenue tied to fuel-price spreads1 | 16.5 | % | 15.7 | % | 17.5 | % | ||||||
Revenue influenced by absolute price of fuel1 | 17.0 | % | 19.6 | % | 20.7 | % | ||||||
Revenue from program fees, transaction fees, late fees and other | 66.5 | % | 64.7 | % | 61.8 | % | ||||||
| Year Ended December 31, | ||||||||||||
| 2015 | 2014 | 2013 | ||||||||||
Revenue from customers and partners | 64.8 | % | 54.9 | % | 53.6 | % | ||||||
Revenue from merchants and networks | 35.2 | % | 45.1 | % | 46.4 | % | ||||||
|
|
|
|
|
| |||||||
| 100.0 | % | 100.0 | % | 100.0 | % | |||||||
|
|
|
|
|
| |||||||
Revenue directly tied to fuel-price spreads1 | 12.4 | % | 16.5 | % | 15.7 | % | ||||||
Revenue directly influenced by the absolute price of fuel1 | 15.1 | % | 17.0 | % | 19.6 | % | ||||||
Revenue from program fees, late fees, interest and other | 72.5 | % | 66.5 | % | 64.7 | % | ||||||
|
|
|
|
|
| |||||||
| 100.0 | % | 100.0 | % | 100.0 | % | |||||||
|
|
|
|
|
| |||||||
| 1 | Although we cannot precisely calculate the absolute impact of fuel price spreads and the absolute price of fuel on our consolidated revenues, we believe these percentages approximate their relative impacts. |
Revenue per transaction. Set forth below is revenue per transaction information for the years ended December 31, 2015, 2014 2013 and 2012:2013:
| Year ended December 31, | Year ended December 31, | |||||||||||||||||||||||
| 2014 | 2013 | 2012 | 2015 | 2014 | 2013 | |||||||||||||||||||
Transactions (in millions)2 | ||||||||||||||||||||||||
North America | 459.9 | 165.0 | 156.9 | 1,667.5 | 459.9 | 165.0 | ||||||||||||||||||
International | 192.5 | 162.5 | 146.9 | 183.9 | 192.5 | 162.5 | ||||||||||||||||||
|
|
|
|
|
| |||||||||||||||||||
Total transactions | 652.4 | 327.5 | 303.8 | 1,851.4 | 652.4 | 327.5 | ||||||||||||||||||
|
|
|
|
|
| |||||||||||||||||||
Revenue per transaction | ||||||||||||||||||||||||
North America | $ | 1.45 | $ | 2.79 | $ | 2.55 | $ | 0.74 | $ | 1.45 | $ | 2.79 | ||||||||||||
International | 2.76 | 2.67 | 2.09 | 2.56 | 2.76 | 2.67 | ||||||||||||||||||
Consolidated revenue per transaction | 1.84 | 2.73 | 2.33 | 0.92 | 1.84 | 2.73 | ||||||||||||||||||
Consolidated adjusted revenue per transaction3 | 1.69 | 2.53 | 2.14 | 0.86 | 1.69 | 2.53 | ||||||||||||||||||
| 2 | Transactions in 2015 and 2014 |
| 3 | Adjusted revenues is a non-GAAP financial measure defined as revenues, net less merchant commissions. We believe this measure is a more effective way to evaluate our revenue performance. We use adjusted revenues as a basis to evaluate our revenues, net of the commissions that are paid to merchants to participate in our card programs. Adjusted revenues is a supplemental non-GAAP financial |
Revenue per transaction is derived from the various revenue types as discussed above and can vary based on geography, the relevant merchant relationship, the payment product utilized and the types of products or services purchased, the mix of which would be influenced by our acquisitions, organic growth in our business, and the overall macroeconomic environment, including fluctuations in foreign currency exchange rates. Revenue per transaction per customer changes as the level of services we provide to a customer increases or decreases, as macroeconomic factors changeschange and as adjustments are made to merchant and customer rates. See “Results of Operations” for further discussion of transaction volumes and revenue per transaction.
From 2014 to 2015, total transactions increased from 652.4 million to 1.9 billion, an increase of 1.2 billion or 183.8%. We experienced an increase in transactions in our North America segment primarily due to our acquisition of Comdata in November 2014, of which 1.3 billion and 270 million transactions are attributable to SVS for 2015 and 2014, respectively, as well as from organic growth in our U.S. businesses. Transaction volumes in our international segment decreased slightly by 4.5% primarily due to market softness in some of our international businesses.
From 2013 to 2014, total transactions increased from 327.5 million to 652.4 million, an increase of 324.9 million or 99.2%. We experienced an increase in transactions in our North America and International segments primarily due to organic growth in certain payment programs, the impact of the acquisitions completed in 2014 and the full year impact of acquisitions completed in 2013. In 2014, transaction volume was primarily affected by the inclusion of approximately 270 million transactions related to our SVS product, which is part of the Comdata business acquired in November 2014.
From 2012 to 2013, total transactions increased from 303.8 million to 327.5 million, an increase of 23.7 million or 7.8%. We experienced an increase in transactions in our North America and International segments primarily due to organic growth in certain payment programs and the impact of the acquisitions completed in 2013 and the full year impact of acquisitions completed in 2012.
Revenue per transaction in our International segment has historically run higher than in our North America segment. Included in revenue per transactions is the impact of recent acquisitions. Revenue per transaction on a consolidated basis has been significantly impacted by acquisitions in our International segment from 2012 through 2014. Furthermore, as previously discussed, revenue per transaction in our North America segment has been significantly impacted by our acquisition the SVS product, which is part of our Comdata business acquired in November 2014.
In 2012, we acquired a Russian fuel card business and CTF Technologies, Inc. (CTF), both in our International segment, which have higher revenue per transaction products in comparison to our other businesses. In 2013, we acquired several businesses in our international segment; FleetCard in Australia, CardLink in New Zealand, VB Servicos (VB) and DB Trans S.A. (DB) in Brazil and Epyx in the U.K. Certain of these international acquisitions have higher revenue per transaction products in comparison to our other international businesses, which when combined with the impact of 2012 acquisitions, contributes to the increase in transaction volumes and revenue per transaction in our International segment in 2013 over 2012.
We also acquired NexTraq in the U.S in 2013 which has a higher revenue per transaction product in comparison to our other North America businesses. This contributed to higher transaction volumes and revenue per transaction in our North America segment in 2013 over 2012, in addition to organic growth.
In 2014, we acquired Comdata in the U.S., which has a higher revenue per transaction product in comparison to our other North American business, when excluding the impact of SVS, a part of the Comdata business. The SVS product carries a very high volume of transactions at a very low revenue per transaction. For discussion of revenue per transactions, we are going to exclude the impact of the SVS product which had approximately 270 million transactions in 2014 at a very low revenue per transaction.
Sources of Expenses
We incur expenses in the following categories:
| • | Merchant commissions—In certain of our card programs, we incur merchant commissions expense when we reimburse merchants with whom we have direct, contractual relationships for specific |
transactions where a customer purchases products or services from the merchant. In the card programs where it is paid, merchant commissions equal the difference between the price paid by us to the merchant and the merchant’s wholesale cost of the underlying products or services. |
| • | Processing—Our processing expense consists of expenses related to processing transactions, servicing our customers and merchants, bad debt expense and cost of goods sold related to our hardware sales in certain businesses. |
| • | Selling—Our selling expenses consist primarily of wages, benefits, sales commissions (other than merchant commissions) and related expenses for our sales, marketing and account management personnel and activities. |
| • | General and administrative—Our general and administrative expenses include compensation and related expenses (including stock-based compensation) for our executive, finance and accounting, information technology, human resources, legal and other administrative personnel. Also included are facilities expenses, third-party professional services fees, travel and entertainment expenses, and other corporate-level expenses. |
| • | Depreciation and amortization—Our depreciation |
| • | Other operating, net—Our other operating, net includes other operating expenses and income items unusual to the period and presented separately. |
| • | Equity method investment loss—Our equity method investment loss relates to our minority interest in Masternaut Group Holdings Limited (“Masternaut”), a provider of telematics solutions to commercial fleets in Europe, which we account for using the equity method. |
| • | Other |
| • | Interest expense, net—Interest expense, net includes interest income on our cash balances and interest expense on our outstanding debt and on our |
| • | Loss on early extinguishment of debt—Loss on early extinguishment of debt relates to our write-off of debt issuance costs associated with the refinancing of our Existing Credit Facility and entry into our New Credit Agreement, along with our recent acquisition of Comdata. |
| • | Provision for income taxes—The provision for income taxes consists primarily of corporate income taxes related to profits resulting from the sale of our products and services in the United States and internationally. Our worldwide effective tax rate is lower than the U.S. statutory rate of 35%, due primarily to lower rates in foreign jurisdictions and foreign-sourced non-taxable income. |
Adjusted Revenues, Adjusted EBITDA, Adjusted Net Income and Adjusted Net Income Per Diluted Share.Set forth below are adjusted revenues, adjusted earnings before interest, taxes, depreciationnet income and amortization, other expense, net, equity method investment loss and loss on extinguishment of debt (Adjusted EBITDA), adjusted net income andper diluted adjusted net income per share for the years ended December 31, 2015, 2014 2013 and 2012.2013.
| Year Ended December 31, | Year Ended December 31, | |||||||||||||||||||||||
| 2014 | 2013 | 2012 | 2015 | 2014 | 2013 | |||||||||||||||||||
| (in thousands except per share amounts) | ||||||||||||||||||||||||
Adjusted revenues | $ | 1,103,136 | $ | 827,028 | $ | 648,961 | $ | 1,594,608 | $ | 1,103,136 | $ | 827,028 | ||||||||||||
Adjusted EBITDA | 677,810 | 493,369 | 376,964 | |||||||||||||||||||||
Adjusted net income | 447,670 | 342,680 | 255,984 | $ | 592,625 | $ | 447,670 | $ | 342,680 | |||||||||||||||
Adjusted net income per diluted share | 5.15 | 4.05 | 2.99 | $ | 6.30 | $ | 5.15 | $ | 4.05 | |||||||||||||||
We use adjusted revenues as a basis to evaluate our revenues, net of the commissions that are paid to merchants that participate in certain of our card programs. The commissions paid to merchants can vary when market spreads fluctuate in much the same way as revenues are impacted when market spreads fluctuate. Thus, we believe this is a more effective way to evaluate our revenue performance on a consistent basis. We use adjusted EBITDA, calculated as earnings before interest, taxes, depreciation and amortization, other expense, net, equity method investment loss and loss on extinguishment of debt to eliminate the impact of certain non-core items during the period. We use adjusted net income and adjusted net income per diluted share to eliminate the effect of items that we do not consider indicative of our core operating performance on a consistent basis. Adjusted revenues, adjusted EBITDA, adjusted net income and adjusted net income per diluted share are supplemental non-GAAP financial measures of operating performance. See the heading entitled “Management’s Use of Non-GAAP Financial Measures.”
Factors and Trends Impacting our Business
We believe that the following factors and trends are important in understanding our financial performance:
| • | Fuel prices—Our fleet customers use our products and services primarily in connection with the purchase of fuel. Accordingly, our revenue is affected by fuel prices, which are subject to significant volatility. A change in retail fuel prices could cause a decrease or increase in our revenue from several sources, including fees paid to us based on a percentage of each customer’s total purchase. Changes in the absolute price of fuel may also impact unpaid account balances and the late fees and charges based on these amounts. See “Sources of Revenue” above for further information related to the absolute price of fuel. |
| • | Fuel-price spread volatility—A portion of our revenue involves transactions where we derive revenue from fuel-price spreads, which is the difference between the price charged to a fleet customer for a transaction and the price paid to the merchant for the same transaction. In these transactions, the price paid to the merchant is based on the wholesale cost of fuel. The merchant’s wholesale cost of fuel is dependent on several factors including, among others, the factors described above affecting fuel prices. The fuel price that we charge to our customer is dependent on several factors including, among others, the fuel price paid to the merchant, posted retail fuel prices and competitive fuel prices. We experience fuel-price spread contraction when the merchant’s wholesale cost of fuel increases at a faster rate than the fuel price we charge to our customers, or the fuel price we charge to our customers decreases at a faster rate than the merchant’s wholesale cost of fuel. See “Sources of Revenue” above for further information related to fuel-price spreads. |
| • | Acquisitions—Since 2002, we have completed over 65 acquisitions of companies and commercial account portfolios. Acquisitions have been an important part of our growth strategy, and it is our intention to continue to seek opportunities to increase our customer base and diversify our service offering through further strategic acquisitions. The impact of acquisitions has, and may continue to have, a significant impact on our results of operations and may make it difficult to compare our results between periods. |
| • | Interest rates—Our results of operations are affected by interest rates. We are exposed to market risk changes in interest rates on our cash investments and debt. |
| • | Global economic |
| • | Foreign currency changes—Our results of operations are significantly impacted by changes in foreign currency rates; namely, by movements of the Australian dollar, Brazilian real, British pound, Canadian dollar, Czech koruna, Euro, Mexican peso, New Zealand dollar and Russian ruble, relative to the U.S. dollar. Approximately |
| • | Expenses— Over the long term, we expect that our general and administrative expense will decrease as a percentage of revenue as our revenue increases. To support our expected revenue growth, we plan to continue to incur additional sales and marketing expense by investing in our direct marketing, third-party agents, internet marketing, telemarketing and field sales force. |
Acquisitions and Investments
During 2015, we completed acquisitions of Shell portfolios related to our fuel card business in Europe, as well as a small acquisition internationally, with an aggregate purchase price of $45.7 million, made additional investments of $8.4 million related to our equity method investment at Masternaut and deferred payments of $3.4 million related to acquisitions occurring in prior years.
During 2014, we completed acquisitions with an aggregate purchase price of $3.67 billion, net of cash acquired of $165.8 million.
The results of operations of the Shell Germany business are included within our International segment, from the date of acquisition. The results of operations from PacPride and Comdata are included within our North America segment, from the date of acquisition.
During 2013, we completed acquisitions with an aggregate purchase price of $839.3 million, net of cash acquired of $35.6 million, including deferred payments of $36.8 million and the estimated fair value of contingent consideration payments of $83.1 million. DuringIn 2014, we recorded adjustments to the estimated fair value of contingent consideration for 2013 acquisitions of $28.1 million, based on actual results of the business, which
included the impact of an unfavorable tax judgment against VB during the fourth quarter of 2014.The2014. In February 2015, the Company paid $39.8 million of contingent consideration. The most significant acquisitions are described below.
The results of operations of the Fleet Card, CardLink, VB, Epyx and DB businesses are included within our International segment, from the date of acquisition. The results from NexTraq are included within our North America segment, from the date of acquisition.
In April 2013, we acquired all of the outstanding stock of CardLink. The consideration for the transaction was paid using the Company’s existing cash and credit facilities. CardLink provides a proprietary fuel card program with acceptance at retail fueling stations across New Zealand. CardLink markets its fuel cards directly to mostly small-to-midsized businesses, and provides processing and outsourcing services to oil companies and other partners. With this transaction, the Company entered
into a $12.0 million New Zealand dollar ($9.4 million) revolving line of credit, which will be used to fund the working capital needs of the CardLink business. The purpose of this acquisition was to enter the Australia and New Zealand regions and followed our recent purchase of GE Capital’s Fleet Card business in Australia.
|
During 2012, we completed several foreign acquisitions with an aggregate purchase price of $207.4 million, net of cash acquired, which included deferred payments of $11.3 million and contingent consideration payments of $4.9 million. The Company estimated the fair value of remaining payments related to this contingent consideration of $0.5 million at December 31, 2014. The most significant acquisitions are described below. The results of our additional Russian fuel card companyoperations of the Fleet Card, CardLink, VB, Epyx and CTFDB businesses are included within our International segment, from the date of acquisition.
acquisition.
Results of operations
Year ended December 31, 2015 compared to the year ended December 31, 2014
The following table sets forth selected consolidated statement of income and selected operational data for the years ended December 31, 2015 and 2014 (in millions, except percentages).
| Year ended December 31, 2015 | % of total revenue | Year ended December 31, 2014 | % of total revenue | Increase (decrease) | % Change | |||||||||||||||||||
Revenues, net: | ||||||||||||||||||||||||
North America | $ | 1,232.0 | 72.3 | % | $ | 668.3 | 55.7 | % | $ | 563.6 | 84.3 | % | ||||||||||||
International | 470.9 | 27.7 | % | 531.1 | 44.3 | % | (60.2 | ) | (11.3 | %) | ||||||||||||||
|
|
|
|
|
|
|
|
|
|
|
| |||||||||||||
Total revenues, net | 1,702.9 | 100.0 | % | 1,199.4 | 100.0 | % | 503.5 | 42.0 | % | |||||||||||||||
Consolidated operating expenses: | ||||||||||||||||||||||||
Merchant commissions | 108.3 | 6.4 | % | 96.3 | 8.0 | % | 12.0 | 12.5 | % | |||||||||||||||
Processing | 331.1 | 19.4 | % | 173.3 | 14.4 | % | 157.7 | 91.0 | % | |||||||||||||||
Selling | 109.1 | 6.4 | % | 75.5 | 6.3 | % | 33.5 | 44.4 | % | |||||||||||||||
General and administrative | 297.7 | 17.5 | % | 206.0 | 17.2 | % | 91.8 | 44.5 | % | |||||||||||||||
Depreciation and amortization | 193.5 | 11.4 | % | 112.4 | 9.4 | % | 81.1 | 72.2 | % | |||||||||||||||
Other operating, net | (4.2 | ) | (0.2 | %) | (29.5 | ) | 2.5 | % | (25.3 | ) | (85.6 | %) | ||||||||||||
|
|
|
|
|
|
|
|
|
|
|
| |||||||||||||
Operating income | 667.5 | 39.2 | % | 565.4 | 47.1 | % | 102.1 | 18.1 | % | |||||||||||||||
|
|
|
|
|
|
|
|
|
|
|
| |||||||||||||
Equity method investment loss | 57.7 | 3.4 | % | 8.6 | 0.7 | % | 49.1 | 571.7 | % | |||||||||||||||
Other expense (income), net | 2.5 | 0.1 | % | (0.7 | ) | NM | 3.2 | NM | ||||||||||||||||
Interest expense, net | 71.3 | 4.2 | % | 28.9 | 2.4 | % | 42.5 | 147.2 | % | |||||||||||||||
Loss on early extinguishment of debt | — | — | 15.8 | 1.3 | % | (15.8 | ) | (100.0 | %) | |||||||||||||||
Provision for income taxes | 173.6 | 10.2 | % | 144.2 | 12.0 | % | 29.3 | 20.3 | % | |||||||||||||||
|
|
|
|
|
|
|
|
|
|
|
| |||||||||||||
Net income | $ | 362.4 | 21.3 | % | $ | 368.7 | 30.7 | % | $ | (6.3 | ) | (1.7 | %) | |||||||||||
|
|
|
|
|
|
|
|
|
|
|
| |||||||||||||
Operating income for segments: | ||||||||||||||||||||||||
North America | $ | 442.0 | $ | 287.3 | $ | 154.7 | 53.9 | % | ||||||||||||||||
International | 225.5 | 278.1 | (52.7 | ) | (18.9 | %) | ||||||||||||||||||
|
|
|
|
|
| |||||||||||||||||||
Operating income | $ | 667.5 | $ | 565.4 | $ | 102.1 | 18.1 | % | ||||||||||||||||
|
|
|
|
|
| |||||||||||||||||||
Operating margin for segments: | ||||||||||||||||||||||||
North America | 35.9 | % | 43.0 | % | (7.1 | )% | ||||||||||||||||||
International | 47.9 | % | 52.4 | % | (4.5 | )% | ||||||||||||||||||
Total | 39.2 | % | 47.1 | % | (7.9 | %) | ||||||||||||||||||
| Year ended December 31, | ||||||||
| 2015 | 2014 | |||||||
Transactions (in millions) 1 | ||||||||
North America | 1,667.5 | 459.9 | ||||||
International | 183.9 | 192.5 | ||||||
|
|
|
| |||||
Total transactions | 1,851.4 | 652.4 | ||||||
|
|
|
| |||||
Revenue per transaction | ||||||||
North America | $ | 0.74 | $ | 1.45 | ||||
International | 2.56 | 2.76 | ||||||
Consolidated revenue per transaction | 0.92 | 1.84 | ||||||
Consolidated adjusted revenue per transaction | 0.86 | 1.69 | ||||||
| 1 | Transactions in 2015 and 2014 include approximately 1.3 billion and 270 million transactions, respectively, related to our SVS product, which is part of the Comdata business acquired in November 2014. Revenue per transaction for the SVS product is lower than that generated by our other products. |
NM = Not Meaningful
The sum of the columns or rows may not equal the totals or differences due to rounding.
Revenues and revenue per transaction
Our consolidated revenue increased from $1,199.4 million in 2014 to $1,702.9 million in 2015, an increase of $503.5 million, or 42.0%. The increase in our consolidated revenue was primarily due to the following:
We use adjusted revenues as a basis to evaluate our revenues, net of the commissions that are paid to merchants that participate in certain of our card programs. The commissions paid to merchants can vary when market spreads fluctuate in much the same way as revenues are impacted when market spreads fluctuate. Thus, we believe this is a more effective way to evaluate our revenue performance on a consistent basis. Although we cannot precisely measure the impact of the macroeconomic environment, in total we believe it negatively impacted our consolidated adjusted revenues for 2015 over the comparable period in 2014 by approximately $179 million. Changes in foreign exchange rates had an unfavorable impact on consolidated adjusted revenues of approximately $90 million, due to unfavorable fluctuations in rates in all geographies, in 2015 over 2014. In addition, we believe the impact of lower fuel prices, partially offset by higher fuel spread margins, had an additional unfavorable impact on consolidated adjusted revenues of approximately $89 million.
Consolidated revenue per transaction decreased from $1.84 in 2014 to $0.92 in 2015, a decrease of $0.92 per transaction or 50.0%. Excluding the impact of the SVS business, which had approximately 1.3 billion and 270 million transactions in 2015 and 2014, respectively, at a lower revenue per transaction, revenue per transaction for 2015 decreased 10.2 % to $2.78 from $3.10 over the comparable period in 2014. Revenue per transaction can vary based on the geography, the relevant merchant and customer relationship, the payment product utilized, and the types of products or services purchased. The revenue mix was influenced by our acquisitions, organic growth in the business, and fluctuations in the macroeconomic environment, primarily fuel prices and foreign exchange rates.
North America segment revenues and revenue per transaction
North America revenue increased from $668.3 million in 2014 to $1,232.0 million in 2015, an increase of $563.6 million, or 84.3%. The increase in our North America revenue was primarily due to:
North America segment revenue per transaction decreased from $1.45 in 2014 to $0.74 in 2015, a decrease of $0.71 or 49.2%. Excluding the impact of the SVS business, which had approximately 1.3 billion and 270 million transactions in 2015 and 2014, respectively, at a lower revenue per transaction, revenue per transaction in our North America segment in 2015 decreased 15.9% to $2.89 from $3.44 over the comparable period in 2014. Revenue per transaction can vary based on the geography, the relevant merchant and customer relationship, the payment product utilized, and the types of products and services purchased. Revenue per transaction decreased primarily due to the impact of lower fuel prices and fuel price spreads during 2015 versus the prior year.
International segment revenue
International segment revenue decreased from $531.1 million in 2014 to $470.9 million in 2015, a decrease of $60.2 million, or 11.3%. The decrease in International segment revenue was due primarily to the following:
As discussed, we use adjusted revenues as a basis to evaluate our revenues, net of the commissions that are paid to merchants that participate in certain of our card programs. Changes in foreign exchange rates had an unfavorable impact on international adjusted revenues of approximately $90.1 million, due to unfavorable fluctuations in rates in all geographies, in 2015 over 2014.
International segment revenue per transaction decreased from $2.76 in 2014 to $2.56 in 2015, a decrease of $0.20 per transaction or 7.2%, due primarily to the unfavorable impact of foreign exchange rates across all of our geographies. This unfavorable impact was partially offset by organic revenue growth in several products.
Consolidated operating expenses
Merchant commission. Merchant commissions increased from $96.3 million in 2014 to $108.3 million in 2015, an increase of $12.0 million, or 12.5%. This increase was due primarily to the fluctuation of the margin between the wholesale cost and retail price of fuel, which impacted merchant commissions in certain card programs, as well as the impact of higher volume in certain revenue streams where merchant commission are paid, partially offset by decreases due to changes in foreign exchange rates.
Processing. Processing expenses increased from $173.3 million in 2014 to $331.1 million in 2015, an increase of $157.7 million, or 91.0%. Our processing expenses primarily increased due to the impact of our acquisition of Comdata completed in the fourth quarter of 2014, partially offset by decreases due to changes in foreign exchange rates.
Selling.Selling expenses increased from $75.5 million in 2014 to $109.1 million in 2015, an increase of $33.5 million, or 44.4%. The increase was primarily due to our acquisition of Comdata completed in the fourth quarter of 2014, as well as additional sales and marketing spending in certain markets, partially offset by decreases due to changes in foreign exchange rates.
General and administrative. General and administrative expense increased from $206.0 million in 2014 to $297.7 million in 2015, an increase of $91.8 million, or 44.5%. The increase was primarily due to the impact of our acquisition of Comdata completed in the fourth quarter of 2014 and incremental stock based compensation of $52.5 million, partially offset by decreases due to changes in foreign exchange rates.
Depreciation and amortization. Depreciation and amortization increased from $112.4 million in 2014 to $193.5 million in 2015, an increase of $81.1 million, or 72.2%. The increase was primarily due to our acquisition of Comdata completed during the fourth quarter of 2014, which resulted in an increase of $91.3 million related to the amortization of acquired intangible assets for customer and vendor relationships, trade names and trademarks, non-compete agreements and software, as well as depreciation of acquired fixed assets, partially offset by decreases due to changes in foreign exchange rates.
Other operating, net. Other operating, net decreased from a $29.5 million favorable impact in 2014 to a $4.2 million favorable impact in 2015, a decrease of $25.3 million, or 85.8%. In 2015, the balance relates primarily to the net favorable impact of the additional reversals of various contingent liabilities for tax indemnifications related to our acquisitions of DB and VB in Brazil. Included in other operating, net in 2014 is $28.1 million of favorable impact related to fair value adjustments recorded for contingent consideration arrangements for our acquisition of VB in Brazil and $1.4 million from the reversal of other various contingent liabilities for tax indemnifications related to our acquisitions of DB and VB in Brazil.
Equity method investment loss
On April 28, 2014, we acquired a minority interest in Masternaut, a provider of telematics solutions to commercial fleets in Europe, which we account for as an equity method investment. The increase in equity method investment loss from $8.6 million in 2014 to $57.7 million in 2015 was primarily due to a non-cash impairment charge of $40 million recorded in the fourth quarter of 2015. We regularly evaluate our investments, which are not carried at fair value, for other than temporary impairment in accordance with U. S. GAAP. During the fourth quarter, we determined that the performance improvement initiatives at Masternaut will take longer to implement than we originally projected. As a result, we have recorded a $40 million non-cash impairment charge in our equity method investment.
Interest expense, net
Interest expense increased from $28.9 million in 2014 to $71.3 million in 2015, an increase of $42.5 million, or 147.2%. The increase is due to an increase in borrowings in 2015 over 2014, primarily due to funding of the purchase price for our acquisition of Comdata. The following table sets forth the average interest rates paid on borrowings under our Credit Facility, excluding the relevant unused credit facility fees.
| 2015 | 2014 | |||||||
Term loan A | 1.94 | % | 1.92 | % | ||||
Term loan B | 3.75 | % | 3.75 | % | ||||
Domestic Revolver A | 1.95 | % | 1.92 | % | ||||
Foreign Revolver A | 2.36 | % | 2.27 | % | ||||
Foreign Revolver B | — | % | 4.43 | % | ||||
Foreign swing line | 2.29 | % | 2.24 | % | ||||
The average unused credit facility fee for Domestic Revolver A was 0.35% and 0.31% in 2015 and 2014, respectively. The average unused credit facility fee for Foreign Revolver B was 0.30% in 2014.
Loss on early extinguishment of debt
Loss on early extinguishment of debt in 2014 relates to our write-off of $15.8 million of debt issuance costs associated with the refinancing of our Existing Credit Facility and entry into our New Credit Agreement, along with our acquisition of Comdata.
Provision for income taxes
The provision for income taxes increased from $144.2 million in 2014 to $173.6 million in 2015, an increase of $29.3 million, or 20.3%. Our effective tax rate increased from 28.1% in 2014 to 32.4% in 2015. We pay taxes in many different taxing jurisdictions, including the U.S., most U.S. states and many non-U.S. jurisdictions. The tax rates in certain non-U.S. taxing jurisdictions are lower than the U.S. tax rate. Consequently, as our earnings fluctuate between taxing jurisdictions, our effective tax rate fluctuates. The increase in the effective tax rate was due primarily to the non-deductible impairment charge of $40 million related to our minority investment in Masternaut, as well as the inclusion of the Comdata business, which operates primarily in the U.S. with a higher overall tax rate. Partially offsetting these negative impacts was the continued decrease in the U.K. statutory tax rates. These initiatives involved amending tax returns for several prior years and produced tax savings of approximately $7.9 million recorded in 2015. We expect that the impact of these planning initiatives will have a favorable impact on tax rates in future years. Included in 2014, was one-time tax favorability due to entity reorganization in Brazil, which allowed the reversal of deferred tax liability of $9.5 million, setup at the time of acquisition in 2013.
Net income
For the reasons discussed above, our net income decreased from $368.7 million in 2014 to $362.4 million in 2015, a decrease of $6.3 million, or 1.7%.
Operating income and operating margin
Consolidated operating income
Operating income increased from $565.4 million in 2014 to $667.5 million in 2015, an increase of $102.1 million, or 18.1%. Consolidated operating margin was 47.1% in 2014 and 39.2% in 2015. The increase in operating income was due primarily to the impact of our acquisition of Comdata completed in November 2014. These increases were partially offset by the negative impact of the macroeconomic environment, primarily due to lower fuel prices in North America and unfavorable changes in foreign exchange rates, as previously discussed. Changes in foreign exchange rates had an unfavorable impact on consolidated operating income of approximately $53 million due to unfavorable fluctuations in rates in all geographies. Results were also negatively impacted by the increase in amortization and depreciation expense related to assets acquired in 2014 and increased stock based compensation expense during 2015. The decrease in operating margin was due primarily to the impact of increased operating expenses associated with Comdata, including increased depreciation and amortization expense.
For the purpose of segment operating results, we calculate segment operating income by subtracting segment operating expenses from segment revenue. Similarly, segment operating margin is calculated by dividing segment operating income by segment revenue.
North America segment operating income
North America operating income increased from $287.3 million in 2014 to $442.0 million in 2015, an increase of $154.7 million, or 53.9%. North America operating margin was 43.0% in 2014 and 35.9% in 2015. The increase in operating income was due primarily to the impact of our acquisition of Comdata in November 2014, as well as organic growth in the business. The decrease in operating margin was due primarily to the impact of increased operating expenses associated with Comdata, including increased depreciation and amortization. In addition, we had increased stock based compensation expense, the majority of which is recorded in our North American segment. Furthermore, operating results were also negatively impacted by the macroeconomic environment, primarily due to lower fuel prices, partially offset by higher fuel spread margins.
International segment operating income
International operating income decreased from $278.1 million in 2014 to $225.5 million in 2015, a decrease of $52.7 million, or 18.9%. International operating margin was 52.4% in 2014 and 47.9% in 2015. The decrease in operating income was due primarily to the unfavorable impact of the macroeconomic environment, specifically unfavorable changes in foreign exchange rates, which we believe negatively impacted operating income by approximately $53 million, as well as the negative impact of fuel prices internationally. The negative impact of the environment was partially offset by the impact of organic growth in the business driven by increases in volume and revenue per transaction, in local currency. The impact of changes in fuel price spreads was negligible.
Year ended December 31, 2014 compared to the year ended December 31, 2013
The following table sets forth selected consolidated statement of income and selected operational data for the years ended December 31, 2014 and 2013 (in millions, except percentages).
| Year ended December 31, 2014 | % of total revenue | Year ended December 31, 2013 | % of total revenue | Increase (decrease) | % Change | Year ended December 31, 2014 | % of total revenue | Year ended December 31, 2013 | % of total revenue | Increase (decrease) | % Change | |||||||||||||||||||||||||||||||||||||
Revenues, net: | ||||||||||||||||||||||||||||||||||||||||||||||||
North America | $ | 668.3 | 55.7 | % | $ | 460.7 | 51.5 | % | $ | 207.6 | 45.1 | % | $ | 668.3 | 55.7 | % | $ | 460.7 | 51.5 | % | $ | 207.6 | 45.1 | % | ||||||||||||||||||||||||
International | 531.1 | 44.3 | % | 434.5 | 48.5 | % | 96.6 | 22.2 | % | 531.1 | 44.3 | % | 434.5 | 48.5 | % | 96.6 | 22.2 | % | ||||||||||||||||||||||||||||||
|
|
|
|
|
|
|
|
|
|
|
| |||||||||||||||||||||||||||||||||||||
Total revenues, net | 1,199.4 | 100.0 | % | 895.2 | 100.0 | % | 304.2 | 34.0 | % | 1,199.4 | 100.0 | % | 895.2 | 100.0 | % | 304.2 | 34.0 | % | ||||||||||||||||||||||||||||||
Consolidated operating expenses: | ||||||||||||||||||||||||||||||||||||||||||||||||
Merchant commissions | 96.3 | 8.0 | % | 68.2 | 7.6 | % | 28.1 | 41.3 | % | 96.3 | 8.0 | % | 68.2 | 7.6 | % | 28.1 | 41.3 | % | ||||||||||||||||||||||||||||||
Processing | 173.3 | 14.4 | % | 134.0 | 15.0 | % | 39.3 | 29.3 | % | 173.3 | 14.4 | % | 134.0 | 15.0 | % | 39.3 | 29.3 | % | ||||||||||||||||||||||||||||||
Selling | 75.5 | 6.3 | % | 57.4 | 6.4 | % | 18.2 | 31.7 | % | 75.5 | 6.3 | % | 57.4 | 6.4 | % | 18.2 | 31.7 | % | ||||||||||||||||||||||||||||||
General and administrative | 206.0 | 17.2 | % | 142.3 | 15.9 | % | 63.7 | 44.8 | % | 206.0 | 17.2 | % | 142.3 | 15.9 | % | 63.7 | 44.8 | % | ||||||||||||||||||||||||||||||
Depreciation and amortization | 112.4 | 9.4 | % | 72.7 | 8.1 | % | 39.6 | 54.5 | % | 112.4 | 9.4 | % | 72.7 | 8.1 | % | 39.6 | 54.5 | % | ||||||||||||||||||||||||||||||
Other operating, net | (29.5 | ) | 2.5 | % | — | — | (29.5 | ) | (100 | %) | (29.5 | ) | 2.5 | % | — | — | (29.5 | ) | (100 | %) | ||||||||||||||||||||||||||||
|
|
|
|
|
|
|
|
|
|
|
| |||||||||||||||||||||||||||||||||||||
Operating income | 565.4 | 47.1 | % | 420.6 | 47.0 | % | 144.8 | 34.4 | % | 565.4 | 47.1 | % | 420.6 | 47.0 | % | 144.8 | 34.4 | % | ||||||||||||||||||||||||||||||
|
|
|
|
|
|
|
|
|
|
|
| |||||||||||||||||||||||||||||||||||||
Equity method investment loss | 8.6 | 0.7 | % | — | — | 8.6 | 100 | % | ||||||||||||||||||||||||||||||||||||||||
Other (income) expense, net | (0.7 | ) | NM | 0.6 | 0.1 | % | (1.3 | ) | NM | (0.7 | ) | NM | 0.6 | 0.1 | % | (1.3 | ) | NM | ||||||||||||||||||||||||||||||
Equity method investment loss | 8.6 | 0.7 | % | — | — | 8.6 | 100 | % | ||||||||||||||||||||||||||||||||||||||||
Interest expense, net | 28.9 | 2.4 | % | 16.4 | 1.8 | % | 12.4 | 75.3 | % | 28.9 | 2.4 | % | 16.4 | 1.8 | % | 12.4 | 75.3 | % | ||||||||||||||||||||||||||||||
Loss on early extinguishment of debt | 15.8 | 1.3 | % | — | — | 15.8 | 100 | % | 15.8 | 1.3 | % | — | — | 15.8 | 100 | % | ||||||||||||||||||||||||||||||||
Provision for income taxes | 144.2 | 12.0 | % | 119.1 | 13.3 | % | 25.2 | 21.1 | % | 144.2 | 12.0 | % | 119.1 | 13.3 | % | 25.2 | 21.1 | % | ||||||||||||||||||||||||||||||
|
|
|
|
|
|
|
|
|
|
|
| |||||||||||||||||||||||||||||||||||||
Net income | $ | 368.7 | 30.7 | % | $ | 284.5 | 31.8 | % | $ | 84.2 | 29.6 | % | $ | 368.7 | 30.7 | % | $ | 284.5 | 31.8 | % | $ | 84.2 | 29.6 | % | ||||||||||||||||||||||||
|
|
|
|
|
|
|
|
|
|
|
| |||||||||||||||||||||||||||||||||||||
Operating income for segments: | ||||||||||||||||||||||||||||||||||||||||||||||||
North America | $ | 287.3 | $ | 220.5 | $ | 66.8 | 30.3 | % | $ | 287.3 | $ | 220.5 | $ | 66.8 | 30.3 | % | ||||||||||||||||||||||||||||||||
International | 278.1 | 200.1 | 78.0 | 39.0 | % | 278.1 | 200.1 | 78.0 | 39.0 | % | ||||||||||||||||||||||||||||||||||||||
|
|
|
|
|
| |||||||||||||||||||||||||||||||||||||||||||
Operating income | $ | 565.4 | $ | 420.6 | $ | 144.8 | 34.4 | % | $ | 565.4 | $ | 420.6 | $ | 144.8 | 34.4 | % | ||||||||||||||||||||||||||||||||
|
|
|
|
|
| |||||||||||||||||||||||||||||||||||||||||||
Operating margin for segments | ||||||||||||||||||||||||||||||||||||||||||||||||
Operating margin for segments: | ||||||||||||||||||||||||||||||||||||||||||||||||
North America | 43.0 | % | 47.9 | % | (4.9 | )% | 43.0 | % | 47.9 | % | (4.9 | )% | ||||||||||||||||||||||||||||||||||||
International | 52.4 | % | 46.1 | % | 6.3 | % | 52.4 | % | 46.1 | % | 6.3 | % | ||||||||||||||||||||||||||||||||||||
Total | 47.1 | % | 47.0 | % | 0.1 | % | 47.1 | % | 47.0 | % | 0.1 | % | ||||||||||||||||||||||||||||||||||||
| Year ended December 31, | Year ended December 31, | |||||||||||||||
| 2014 | 2013 | 2014 | 2013 | |||||||||||||
Transactions (in millions) | ||||||||||||||||
North America1 | 459.9 | 165.0 | ||||||||||||||
Transactions (in millions) 1 | ||||||||||||||||
North America | 459.9 | 165.0 | ||||||||||||||
International | 192.5 | 162.5 | 192.5 | 162.5 | ||||||||||||
|
|
|
| |||||||||||||
Total transactions1 | 652.4 | 327.5 | ||||||||||||||
Total transactions | 652.4 | 327.5 | ||||||||||||||
|
|
|
| |||||||||||||
Revenue per transaction | ||||||||||||||||
North America | $ | 1.45 | $ | 2.79 | $ | 1.45 | $ | 2.79 | ||||||||
International | 2.76 | 2.67 | 2.76 | 2.67 | ||||||||||||
Consolidated revenue per transaction | 1.84 | 2.73 | 1.84 | 2.73 | ||||||||||||
Consolidated adjusted revenue per transaction | 1.69 | 2.53 | 1.69 | 2.53 | ||||||||||||
| 1 | Transactions in 2014 |
NM = Not Meaningful
The sum of the columns or rows may not equal the totals or differences due to rounding.
Revenues and revenue per transaction
Our consolidated revenue increased from $895.2 million in 2013 to $1,199.4 million in 2014, an increase of $304.2 million, or 34.0%. The increase in our consolidated revenue was primarily due to the following:
Consolidated revenue per transaction decreased from $2.73 in 2013 to $1.84 in 2014, a decrease of $0.89 per transaction or 32.7%. Consolidated revenue per transaction includes the impact of the SVS product, which is part of our Comdata business acquired in November 2014. The SVS product had approximately 270 million transactions during 2014 at a very lowlower revenue per transaction. Consolidated revenue per transaction for 2014, excluding the SVS product, increased 13.3% to $3.10 from $2.73 in 2013. This increase is primarily a result of organic growth in certain of our payment programs and the full year impact in 2014 of acquisitions completed in 2013, as noted above, as well as acquisitions completed in 2014, some of which have higher revenue per transaction products in comparison to our other businesses. The increase also was due to the impact of the macroeconomic environment, specifically higher fuel spread margins in 2014 over 2013.
North America segment revenues and revenue per transaction
North America revenue increased from $460.7 million in 2013 to $668.3 million in 2014, an increase of $207.6 million, or 45.1%. The increase in our North America revenue was primarily due to the following:
North America segment revenue per transaction decreased from $2.79 in 2013 to $1.45 in 2014, a decrease of $1.34 per transaction or 48.0%. North American revenue per transaction includes the impact of the SVS product,
which is part of our Comdata business acquired in November 2014. The SVS product had approximately 270 million transactions during 2014 at a very lowlower revenue per transaction. North American revenue per transaction for 2014, excluding the SVS product, increased 23.1% to $3.44 from $2.79 in 2013. This increase is primarily a result of organic growth in certain of our payment programs and the full year impact in 2014 of acquisitions completed in 2013, as noted above, as well as acquisitions completed in 2014, some of which have higher revenue per transaction products in comparison to our other businesses. The increase is also due to the positive impact of the macroeconomic environment; specifically higher fuel spread margins in 2014 compared with 2013.
International segment revenue
International segment revenue increased from $434.5 million in 2013 to $531.1 million in 2014, an increase of $96.6 million, or 22.2%. The increase in International segment revenue was due primarily to the following:
International segment revenue per transaction increased from $2.67 in 2013 to $2.76 in 2014, an increase of $0.09 per transaction or 3.2%. This increase in revenue per transaction, as well as the increase in transaction volume, is primarily due to the full period impact of acquisitions completed in 2013 and 2014, some of which have higher revenue per transaction products in comparison to our other businesses, as well as organic growth in certain of our payment programs. We experienced an increase in transactions in our International segment primarily due to organic growth in certain payment programs and the impact of the acquisitions completed in 2014 and the full year impact of acquisitions completed in 2013.
Consolidated operating expenses
Merchant commissioncommission. Merchant commissions increased from $68.2 million in 2013 to $96.3 million in 2014, an increase of $28.1 million, or 41.3%. This increase was due primarily to additional commissions paid due to higher fuel spread margins, as well as the impact of higher volume in revenue streams where merchant commissions are paid.
ProcessingProcessing. Processing expenses increased from $134.0 million in 2013 to $173.3 million in 2014, an increase of $39.3 million, or 29.3%. Our processing expenses increased primarily due to acquisitions completed in 2013 and 2014 and organic growth in transaction volume, as well as incremental bad debt expense of approximately $3.0 million in our Russia business due to the slowdown in their economy.
SellingSelling.Selling expenses increased from $57.4 million in 2013 to $75.5 million in 2014, an increase of $18.2 million, or 31.7%. The increase was primarily due to acquisitions completed in 2013 and 2014, as well as additional sales and marketing spending in certain markets.
General and administrativeadministrative. General and administrative expense increased from $142.3 million in 2013 to $206.0 million in 2014, an increase of $63.7 million, or 44.8%. Our general and administrative expenses
increased primarily due to the impact of acquisitions completed in 2013 and 2014, as well as approximately $22.6 million of incremental one-time deal related costs related to severance and legal fees, accounting, tax, and various advisory fees, as well as additional stock based compensation expense of $12.8 million.
Depreciation and amortizationamortization. Depreciation and amortization increased from $72.7 million in 2013 to $112.4 million in 2014, an increase of $39.6 million, or 54.5%. The increase in our depreciation and amortization expense is primarily due to acquisitions completed during 2013 and 2014, which resulted in an increase of $38.3 million related to the amortization of acquired intangible assets for customer and vendor relationships, trade names and trademarks, non-compete agreements and software and increased depreciation expense.
Other operating, netnet. Other operating, net of 29.5$29.5 million in 2014, represents the $28.1 million favorable impact of fair value adjustments recorded related to contingent consideration arrangements for our acquisition of VB in Brazil and the net favorable impact of $1.4 million from the reversal of other various contingent liabilities for tax indemnifications related to our acquisitions of DB and VB in Brazil.
Equity method investment loss
On April 28, 2014, we acquired a minority interest in Masternaut, a provider of telematics solutions to commercial fleets in Europe, which we account for as an equity method investment. The loss at Masternaut was driven primarily by amortization of intangible assets at this investment of approximately $8.0 million in 2014.
Interest expense, net
Interest expense increased from $16.4 million in 2013 to $28.9 million in 2014, an increase of $12.4 million, or 75.3%. The increase in interest expense is due to an increase in borrowings in 2014 over 2013, primarily due to funding the purchase price for acquisitions as well as increased interest rates as a result of the uptick in our leverage ratio due to the additional borrowings to fund acquisitions. The following table sets forth the average interest rates paid on borrowings under our Credit Facility, excluding the relevant unused credit facility fees.
| 2014 | 2013 | |||||||
Term loan A | 1.92 | % | 1.75 | % | ||||
Term loan B | 3.75 | % | — | % | ||||
Domestic Revolver A | 1.92 | % | 1.80 | % | ||||
Foreign Revolver A | 2.27 | % | 2.13 | % | ||||
Foreign Revolver B | 4.43 | % | 4.35 | % | ||||
Foreign swing line | 2.24 | % | 1.98 | % | ||||
The average unused credit facility fee for Domestic Revolver A was 0.31% and 0.26% in 2014 and 2013, respectively. The average unused credit facility fee for Foreign Revolver B was 0.30% and 0.27% in 2014 and 2013, respectively.
Loss on early extinguishment of debt
Loss on early extinguishment of debt relates to our write-off of $15.8 million of debt issuance costs associated with the refinancing of our Existing Credit Facility and entry into our New Credit Agreement, along with our recent acquisition of Comdata.
Provision for income taxes
The provision for income taxes increased from $119.1 million in 2013 to $144.2 million in 2014, an increase of $25.2 million, or 21.1%. Our effective tax rate decreased from 29.5% in 2013 to 28.1% in 2014. The effective tax rate in 2014 was favorably impacted by entity reorganization in Brazil, which allowed the reversal of deferred tax liability of $9.5 million, setup at the time of acquisition in 2013.
We pay taxes in many different taxing jurisdictions, including the U.S., most U.S. states and many non-U.S. jurisdictions. The tax rates in certain non-U.S. taxing jurisdictions are lower than the U.S. tax rate. Consequently, as our earnings fluctuate between taxing jurisdictions, our effective tax rate fluctuates. The lower tax rate in 2014 was also driven by a shift in the mix of earnings, largely due to acquisitions, to foreign jurisdictions with lower tax rates.
Net income
For the reasons discussed above, our net income increased from $284.5 million in 2013 to $368.7 million in 2014, an increase of $84.2 million, or 29.6%.
Operating income and operating margin
Consolidated operating income
Operating income increased from $420.6 million in 2013 to $565.4 million in 2014, an increase of $144.8 million, or 34.4%. Consolidated operating margin was 47.0% in 2013 and 47.1% in 2014. The increase in operating income is due primarily to the impact of acquisitions completed during 2013 and 2014, organic growth in the business driven by increases in volume and revenue per transactions. We believe the impact of the macroeconomic environment was positive to consolidated operating results in 2014 over 2013, primarily due to higher fuel spread margins. These positive drivers of consolidated results were partially offset by incremental stock based compensation expense, increased amortization expense related to acquired intangible assets, increased bad debt expense in our Russian business and incremental onetimeone-time costs related to acquisitions of $22.6 million.
For the purpose of segment operating results, we calculate segment operating income by subtracting segment operating expenses from segment revenue. Similarly, segment operating margin is calculated by dividing segment operating income by segment revenue.
North America segment operating income
North America operating income increased from $220.5 million in 2013 to $287.3 million in 2014, an increase of $66.8 million, or 30.3%. North America operating margin was 47.9% in 2013 and 43.0% in 2014. The increase in operating income is due primarily to the impact of acquisitions completed in 2013 and 2014, as well as organic growth in the business driven by increases in volume and revenue per transaction. We believe that the impact of the macroeconomic environment was positive to North American operating results in 2014 over 2013, primarily
due to higher fuel spread margins. The decrease in operating margin is due primarily to the impact of increased stock based compensation expense, the majority of which is recorded in our North America segment, as well as incremental one-time deal related expenses of $26.6 million primarily incurred related to our acquisition of Comdata during 2014.
International segment operating income
International operating income increased from $200.1 million in 2013 to $278.1 million in 2014, an increase of $78.0 million, or 39.0%. International operating margin was 46.1% in 2013 and 52.4% in 2014. The increase in operating income and operating margin is due primarily to the impact of acquisitions completed in 2013 and 2014 and organic growth in the business driven by increases in volume and revenue per transaction. We believe that the impact of the macroeconomic environment was negative to International operating results in 2014 over
2013, due primarily to unfavorable fluctuations in the Brazilian Real, British Pound and Russian Ruble. Included in International operating income was the favorable impact of adjustments recorded related to contingent consideration arrangements for our acquisition of VB in Brazil of $28.1 million, the net favorable impact from reversal of other various contingent liabilities for tax indemnifications related to our acquisitions of DB and VB in Brazil of approximately $1.4 million and incremental savings on deal fees over the comparable period in 2013 of $4.1 million. These favorable items contributed to the increase in operating margin from 2013 to 2014.
Interest expense, net
Interest expense increased from $16.4 million in 2013 to $28.9 million in 2014, an increase of $12.4 million, or 75.3%. The increase in interest expense is due to an increase in borrowings in 2014 over 2013, primarily due to funding the purchase price for acquisitions as well as increased interest rates as a result of the uptick in our leverage ratio due to the additional borrowings to fund acquisitions. The following table sets forth the average interest rates paid on borrowings under our Credit Facility, including the relevant unused credit facility fees.
| 2014 | 2013 | |||||||
Term loan, including unused credit facility fee | 2.35 | % | 2.02 | % | ||||
Domestic Revolver A, including unused credit facility fee | 2.24 | % | 2.07 | % | ||||
Foreign Revolver A | 2.27 | % | 2.13 | % | ||||
Foreign Revolver B, including unused credit facility fee | 4.73 | % | 4.62 | % | ||||
Foreign swing line | 2.28 | % | 1.98 | % | ||||
Equity method investment loss
On April 28, 2014, we acquired a minority interest in Masternaut, a provider of telematics solutions to commercial fleets in Europe, which we account for as an equity method investment. The loss at Masternaut was driven primarily by amortization of intangible assets at this investment of approximately $8.0 million in 2014.
Loss on early extinguishment of debt
Loss on early extinguishment of debt relates to our write-off of $15.8 million of debt issuance costs associated with the refinancing of our Existing Credit Facility and entry into our New Credit Agreement, along with our recent acquisition of Comdata.
Provision for income taxes
The provision for income taxes increased from $119.1 million in 2013 to $144.2 million in 2014, an increase of $25.2 million, or 21.1%. Our effective tax rate decreased from 29.5% in 2013 to 28.1% in 2014. Discrete items and changes in the estimate of the annual tax rate are recorded in the period they occur. The effective tax rate in 2014 was favorably impacted by entity reorganization in Brazil, which allowed the reversal of deferred tax liability of $9.5 million, setup at the time of acquisition in 2013.
We pay taxes in many different taxing jurisdictions, including the U.S., most U.S. states and many non-U.S. jurisdictions. The tax rates in certain non-U.S. taxing jurisdictions are lower than the U.S. tax rate. Consequently, as our earnings fluctuate between taxing jurisdictions, our effective tax rate fluctuates. The lower tax rate in 2014 was also driven by a shift in the mix of earnings, largely due to acquisitions, to foreign jurisdictions with lower tax rates.
Net income
For the reasons discussed above, our net income increased from $284.5 million in 2013 to $368.7 million in 2014, an increase of $84.2 million, or 29.6%.
Results of operations
Year ended December 31, 2013 compared to the year ended December 31, 2012
The following table sets forth selected consolidated statement of income and selected operational data for the years ended December 31, 2013 and 2012 (in millions, except percentages).
| Year ended December 31, 2013 | % of total revenue | Year ended December 31, 2012 | % of total revenue | Increase (decrease) | % Change | |||||||||||||||||||
Revenues, net: | ||||||||||||||||||||||||
North America | $ | 460.7 | 51.5 | % | $ | 400.1 | 56.6 | % | $ | 60.6 | 15.1 | % | ||||||||||||
International | 434.5 | 48.5 | % | 307.4 | 43.4 | % | 127.1 | 41.3 | % | |||||||||||||||
|
|
|
|
|
|
|
|
|
|
|
| |||||||||||||
Total revenues, net | 895.2 | 100.0 | % | 707.5 | 100.0 | % | 187.7 | 26.5 | % | |||||||||||||||
Consolidated operating expenses: | ||||||||||||||||||||||||
Merchant commissions | 68.2 | 7.6 | % | 58.6 | 8.3 | % | 9.6 | 16.3 | % | |||||||||||||||
Processing | 134.0 | 15.0 | % | 115.5 | 16.3 | % | 18.5 | 16.1 | % | |||||||||||||||
Selling | 57.4 | 6.4 | % | 46.4 | 6.6 | % | 11.0 | 23.5 | % | |||||||||||||||
General and administrative | 142.3 | 15.9 | % | 110.1 | 15.6 | % | 32.2 | 29.2 | % | |||||||||||||||
Depreciation and amortization | 72.7 | 8.1 | % | 52.0 | 7.3 | % | 20.7 | 40.0 | % | |||||||||||||||
|
|
|
|
|
|
|
|
|
|
|
| |||||||||||||
Operating income | 420.6 | 47.0 | % | 324.9 | 45.9 | % | 95.7 | 29.5 | % | |||||||||||||||
|
|
|
|
|
|
|
|
|
|
|
| |||||||||||||
Other expense (income), net | 0.6 | 0.1 | % | 1.1 | 0.2 | % | (0.5 | ) | NM | |||||||||||||||
Interest expense, net | 16.4 | 1.8 | % | 13.0 | 1.8 | % | 3.4 | 26.5 | % | |||||||||||||||
Provision for income taxes | 119.1 | 13.3 | % | 94.6 | 13.4 | % | 24.5 | 25.9 | % | |||||||||||||||
|
|
|
|
|
|
|
|
|
|
|
| |||||||||||||
Net income | $ | 284.5 | 31.8 | % | $ | 216.2 | 30.6 | % | $ | 68.3 | 31.6 | % | ||||||||||||
|
|
|
|
|
|
|
|
|
|
|
| |||||||||||||
Operating income for segments: | ||||||||||||||||||||||||
North America | $ | 220.5 | $ | 196.7 | $ | 23.8 | 12.1 | % | ||||||||||||||||
International | 200.1 | 128.2 | 71.9 | 56.0 | % | |||||||||||||||||||
|
|
|
|
|
| |||||||||||||||||||
Operating income | $ | 420.6 | $ | 324.9 | $ | 95.7 | 29.5 | % | ||||||||||||||||
|
|
|
|
|
| |||||||||||||||||||
Operating margin for segments | ||||||||||||||||||||||||
North America | 47.9 | % | 49.1 | % | (1.2 | )% | ||||||||||||||||||
International | 46.1 | % | 41.7 | % | 4.4 | % | ||||||||||||||||||
Total | 47.0 | % | 45.9 | % | 1.1 | % | ||||||||||||||||||
| Year ended December 31, | ||||||||
| 2013 | 2012 | |||||||
Transactions (in millions) | ||||||||
North America | 165.0 | 156.9 | ||||||
International | 162.5 | 146.9 | ||||||
|
|
|
| |||||
Total transactions | 327.5 | 303.8 | ||||||
|
|
|
| |||||
Revenue per transaction | ||||||||
North America | $ | 2.79 | $ | 2.55 | ||||
International | 2.67 | 2.09 | ||||||
Consolidated revenue per transaction | 2.73 | 2.33 | ||||||
Consolidated adjusted revenue per transaction | 2.53 | 2.14 | ||||||
NM = Not Meaningful
The sum of the columns or rows may not equal the totals or differences due to rounding.
Revenues and revenue per transaction
Our consolidated revenue increased from $707.5 million in 2012 to $895.2 million in 2013, an increase of $187.7 million, or 26.5%. The increase in our consolidated revenue was primarily due to the following:
Consolidated revenue per transaction increased from $2.33 in 2012 to $2.73 in 2013, an increase of $0.40 per transaction or 17.3%. This increase is primarily due to organic growth in certain of our payment programs and the full year impact in 2013 of acquisitions completed in 2012, as noted above, as well as acquisitions completed in 2013, some of which have higher revenue per transaction products in comparison to our other businesses. Total transactions increased from 303.8 million to 327.5 million, an increase of 23.7 million or 7.8%.
North America segment revenues and revenue per transaction
North America revenue increased from $400.1 million in 2012 to $460.7 million in 2013, an increase of $60.6 million, or 15.1%. The increase in our North America revenue was primarily due to the following:
North America segment revenue per transaction increased from $2.55 in 2012 to $2.79 in 2013, an increase of $0.24 per transaction or 9.5%. North America segment revenue per transaction was impacted by the reasons discussed above. We experienced an increase in transactions in our North America segment primarily due to organic growth in certain payment programs and the impact of the acquisitions completed in 2013.
International segment revenue
International segment revenue increased from $307.4 million in 2012 to $434.5 million in 2013, an increase of $127.1 million, or 41.3%. The increase in International segment revenue was due primarily to the following:
International segment revenue per transaction increased from $2.09 in 2012 to $2.67 in 2013, an increase of $0.58 per transaction or 27.7%. This increase is primarily due to organic growth in certain of our payment programs and the full period impact of acquisitions completed in 2012 and 2013, some of which have higher revenue per transaction products in comparison to our other businesses. We experienced an increase in transactions in our International segment primarily due to organic growth in certain payment programs and the impact of the acquisitions completed in 2013 and the full year impact of acquisitions completed in 2012.
Consolidated operating expenses
Merchant commission Merchant commissions increased from $58.6 million in 2012 to $68.2 million in 2013, an increase of $9.6 million, or 16.3%. This increase was primarily due to the fluctuation of the margin between the wholesale cost and retail price of fuel, which impacted merchant commissions in certain card programs, as well as the impact of higher volume in revenue streams where merchant commissions are paid, primarily in our North America segment.
Processing Processing expenses increased from $115.5 million in 2012 to $134.0 million in 2013, an increase of $18.5 million, or 16.1%. Our processing expenses primarily increased due to the impact of acquisitions completed in 2012 and 2013, partially offset by efficiencies gained in certain of our more recently acquired businesses.
SellingSelling expenses increased from $46.4 million in 2012 to $57.4 million in 2013, an increase of $11.0 million, or 23.5%. The increase was primarily due to acquisitions completed in 2012 and 2013, as well as additional sales and marketing spending in certain markets.
General and administrative General and administrative expense increased from $110.1 million in 2012 to $142.3 million in 2013, an increase of $32.2 million, or 29.2%. Our general and administrative expenses increased primarily due to the impact of acquisitions completed in 2012 and 2013, as well as approximately $6.0 million of additional one-time deal related costs, and additional stock based compensation expense of $7.4 million.
Depreciation and amortization Depreciation and amortization increased from $52.0 million in 2012 to $72.7 million in 2013, an increase of $20.7 million, or 40.0%. The increase in our depreciation and amortization expense is primarily due to acquisitions completed during 2012 and 2013, which resulted in an increase of $21.5 million related to the amortization of acquired intangible assets for customer and vendor relationships, trade names and trademarks, non-compete agreements and software, as well as acquired fixed assets and development related to our GFN processing application.
Operating income and operating margin
Consolidated operating income
Operating income increased from $324.9 million in 2012 to $420.6 million in 2013, an increase of $95.7 million, or 29.5%. Our operating margin increased from 45.9% in 2012 to 47.0% in 2013. The increase in operating
income and operating margin is due primarily to the impact of acquisitions completed during 2012 and 2013, organic growth in the business driven by increases in volume and revenue per transactions, as well as synergies gained in certain of our acquired businesses. These positive drivers of consolidated results were partially offset by the negative impact of the macroeconomic environment, primarily due to lower fuel prices and unfavorable changes in foreign exchange rates, as well as one-time deal related expenses incurred during the year of approximately $6.0 million.
For the purpose of segment operating results, we calculate segment operating income by subtracting segment operating expenses from segment revenue. Similarly, segment operating margin is calculated by dividing segment operating income by segment revenue.
North America segment operating income
North America operating income increased from $196.7 million in 2012 to $220.5 million in 2013, an increase of $23.8 million, or 12.1%. North America operating margin decreased from 49.1% in 2012 to 47.9% in 2013. The increase in operating income is due primarily to organic growth in the business driven by increases in volume and revenue per transaction and the impact of acquisitions completed in 2013. The decrease in operating margin is due primarily to the impact of increased stock based compensation expense, the majority of which is recorded in our North America segment, as well as one-time deal related expenses incurred during the year of $6.0 million.
International segment operating income
International operating income increased from $128.2 million in 2012 to $200.1 million in 2013, an increase of $71.9 million, or 56.0%. International operating margin increased from 41.7% in 2012 to 46.1% in 2013. The increase in operating income and operating margin is due primarily to the impact of acquisitions completed in 2012 and 2013, organic growth in the business driven by increases in volume and revenue per transaction, as well as synergies gained in certain of our acquired businesses. The macroeconomic environment had a negative effect on International segment operating income, primarily driven by the unfavorable impact of foreign exchange rates and lower fuel prices.
Interest expense, net
Interest expense increased from $13.0 million in 2012 to $16.4 million in 2013, an increase of $3.4 million, or 26.5%. The increase is due to an increase in borrowings in 2013 over 2012, primarily due to funding the purchase price for acquisitions. The following table sets forth the average interest rates paid on borrowings under our Credit Facility, to include our term loan, domestic Revolver A, foreign Revolver B and foreign swing line of credit, as well as the relevant unused credit facility fees in 2013 and 2012. There were no borrowings under our foreign Revolver B in 2012.
| 2013 | 2012 | |||||||
Term loan, including unused credit facility fee | 2.02 | % | 2.00 | % | ||||
Domestic Revolver A, including unused credit facility fee | 2.07 | % | 1.99 | % | ||||
Foreign Revolver A | 2.13 | % | N/A | |||||
Foreign Revolver B, including unused credit facility fee | 4.62 | % | N/A | |||||
Foreign swing line | 1.98 | % | 2.03 | % | ||||
Provision for income taxes
The provision for income taxes increased from $94.6 million in 2012 to $119.1 million in 2013, an increase of $24.5 million, or 25.9%. Our effective tax rate decreased from 30.4% in 2012 to 29.5% in 2013. Discrete items and changes in the estimate of the annual tax rate are recorded in the period they occur. Included in income tax
expense in both 2012 and 2013 is the impact of income tax benefits resulting from the enactment of a U.K. statutory tax rate reduction during the third quarter of each period. This lower statutory rate was applied to deferred tax items, which are primarily payable in future periods, reducing income tax expense in 2012 and 2013 by approximately $3.3 million and $4.0 million, respectively. Furthermore, our effective tax rate in 2012 was negatively impacted by an increase in taxes of $1.9 million during the fourth quarter of 2012 due to the impact of the controlled foreign corporation look-through exclusion expiring for the Company on December 1, 2012. The exclusion was retroactively extended in January 2013 and the $1.9 million was reversed, benefiting income tax expense in 2013.
We pay taxes in many different taxing jurisdictions, including the U.S., most U.S. states and many non-U.S. jurisdictions. The tax rates in certain non-U.S. taxing jurisdictions are lower than the U.S. tax rate. Consequently, as our earnings fluctuate between taxing jurisdictions, our effective tax rate fluctuates. The lower tax rate in 2013 was also driven by a shift in the mix of earnings, largely due to acquisitions, to foreign jurisdictions with lower tax rates.
Net income
For the reasons discussed above, our net income increased from $216.2 million in 2012 to $284.5 million in 2013, an increase of $68.3 million, or 31.6%.
Liquidity and capital resources
Our principal liquidity requirements are to service and repay our indebtedness, complete acquisitions of businesses and commercial account portfolios and meet working capital, tax and capital expenditure needs.
Sources of liquidity
At December 31, 2014,2015, our unrestricted cash and cash equivalents balance totaled $477.1$447.2 million. Our restricted cash balance at December 31, 20142015 totaled $135.1$167.5 million. Restricted cash primarily represents customer deposits in our Comdata product as well as in the Czech Republic and in our Comdata business in the U.S., which we are restricted from using other than to repay customer deposits and for the Czech Republic, which may not be deposited outside of the country.deposits.
At December 31, 2014,2015, cash and cash equivalents held in foreign subsidiaries where we have determined we are permanently reinvested is $290.9$258.7 million. All of the cash and cash equivalents held by our foreign subsidiaries, excluding restricted cash, are available for general corporate purposes. Our current intent is to permanently reinvest these funds outside of the U.S. Our current expectation for funds held in our foreign subsidiaries is to use the funds to finance foreign organic growth, to pay for potential future foreign acquisitions and to repay any foreign borrowings that may arise from time to time. We currently believe that funds generated from our U.S. operations, along with potentialavailable borrowing capabilitiescapacity in the U.S. will be sufficient to fund our U.S. operations for the foreseeable future, and therefore do not foresee a need to repatriate cash held by our foreign subsidiaries in a taxable transaction to fund our U.S. operations. However, if at a future date or time these funds are needed for our operations in the U.S. or we otherwise believe it is in our best interests to repatriate all or a portion of such funds, we may be required to accrue and pay U.S. taxes to repatriate these funds. No assurances can be provided as to the amount or timing thereof, the tax consequences related thereto or the ultimate impact any such action may have on our results of operations or financial condition.
We utilize an accounts receivable Securitization Facility to finance a portionmajority of our domestic fuel card receivables, to lower our cost of fundsborrowing and more efficiently use capital. We generate and record accounts receivable when a customer makes a purchase from a merchant using one of our card products and generally pay merchants within seven days of receiving the merchant billing. As a result, we utilize the Securitization Facility as a source of liquidity to provide the cash flow required to fund merchant payments while we collect customer balances. These balances are primarily composed of charge balances, which are typically billed to the customer
on a weekly, semimonthly or monthly basis, and are generally required to be paid within 14 days of billing. We
also consider the undrawn amounts under our Securitization Facility and Credit Facility as funds available for working capital purposes and acquisitions. At December 31, 2014,2015, we had the ability to generate approximately $29$4 million of additional liquidity under our Securitization Facility. At December 31, 2014,2015, we had approximately $387$875 million available under our Credit Facility.
Based on our current forecasts and anticipated market conditions, we believe that our current cash balances, our available borrowing capacity and our ability to generate cash from operations, will be sufficient to fund our liquidity needs for at least the next twelve months. However, we regularly evaluate our cash requirements for current operations, commitments, capital requirements and acquisitions, and we may elect to raise additional funds for these purposes in the future, either through the issuance of debt or equity securities. We may not be able to obtain additional financing on terms favorable to us, if at all.
Cash flows
The following table summarizes our cash flows for the years ended December 31, 2015, 2014 2013 and 2012.2013.
| Year ended December 31, | Year ended December 31, | |||||||||||||||||||||||
(in millions) | 2014 | 2013 | 2012 | 2015 | 2014 | 2013 | ||||||||||||||||||
Net cash provided by operating activities | $ | 608.3 | $ | 375.7 | $ | 135.5 | $ | 754.6 | $ | 608.3 | $ | 375.7 | ||||||||||||
Net cash used in investing activities | (2,594.1 | ) | (749.1 | ) | (209.6 | ) | (99.4 | ) | (2,594.1 | ) | (749.1 | ) | ||||||||||||
Net cash provided by financing activities | 2,162.3 | 435.7 | 62.0 | |||||||||||||||||||||
Net cash (used in) provided by financing activities | (648.1 | ) | 2,162.3 | 435.7 | ||||||||||||||||||||
Operating activitiesactivities. Net cash provided by operating activities increased from $608.3 million in 2014 to $754.6 million in 2015, despite a slight decrease in net income. The increase is primarily due to changes in working capital and increases in certain non-cash expenses, including amortization of intangible assets of $73.6 million, stock-based compensation of $52.5 million and equity method investment loss of $49.1 million.
Net cash provided by operating activities increased from $375.7 million in 2013 to $608.3 million in 2014. The increase is primarily due to changes in working capital, increases in amortization of acquired intangibles of $36.4 million, as well as additional net income during 2014 over 2013 of $84.2 million, partially offset by fair value adjustments for contingent consideration of $27.5 million.
Investing activities.Net cash provided by operatingused in investing activities increaseddecreased from $135.5$2,594.1 million in 20122014 to $375.7$99.4 million in 2013. The increase2015. This decrease is primarily due to a customer deposit of $46 million and a liability acquired with the Allstar acquisition of $108 million that were each paidreduction in 2012. The remaining fluctuation is due to changes in working capital, as well as additional net income of $68.9 million.cash outlay for acquisitions, including equity method investments, over the comparable period.
Investing activitiesNet cash used in investing activities increased from $749.1 million in 2013 to $2,594.1 million in 2014. The increase is primarily due to the increase in cash paid for acquisitions in 2014, specifically $2.4 billion related to Comdata.
Financing activities.Net cash provided by financing activities was $2,162.3 million in 2014 as compared to net cash used in investingfinancing activities increased from $209.6of $648.1 million in 20122015. The change is primarily due to $749.1increased net borrowings on our Credit Facility and our Securitization Facility in 2014 primarily due to funding the purchase price for Comdata. Additionally, we made payments on contingent consideration arrangements of $42 million in 2013. The increase2015 that were not made in cash used in investing activities is attributable to the increase in cash used for acquisitions in 2013.2014.
Financing activitiesNet cash provided by financing activities increased from $435.7 million in 2013 to $2,162.3 million in 2014. The increase in cash provided by financing activities is primarily due to increased net borrowings on our Credit Facility and Securitization Facility of $1,456.4 million and $275 million, respectively, in 2014 over 2013, primarily due to funding the purchase price for Comdata.
Net cash provided by financing activities increased from $62 million in 2012 to $435.7 million in 2013. The increase in cash provided by financing activities is primarily due to increased net borrowings on our Credit Facility, net of acquired debt payments, and Securitization Facility of $145 million and $33 million, respectively, in 2013 over 2012, primarily due to funding the purchase price for acquisitions, as well as working capital needs.
Capital spending summary
Our capital expenditures increased from $27.1 million in 2014 to $41.9 million 2015, an increase of $14.8 million, or 54.7%. The increase was primarily due to the impact of our acquisition of Comdata in November 2014.
Our capital expenditures increased from $20.8 million in 2013 to $27.1 million in 2014, an increase of $6.3 million, or 30.2%. The increase was primarily related to additional spending related to our businesses acquired in 2013 and 2014.
Our capital expenditures increased from $19.1 million in 2012 to $20.8 million in 2013, an increase of $1.7 million, or 8.9%. The increase was primarily related to additional investments to continue to enhance our existing processing systems and continued development of a new European processing system, GlobalFleetNet (GFN).
Credit Facility
On October 24, 2014, FleetCor Technologies Operating Company, LLC, and certain of our domestic and foreign owned subsidiaries, as designated co-borrowers (the “Borrowers”), entered into a new $3.355 billion Credit Agreement (the New Credit Agreement), with Bank of America, N.A., as administrative agent, swing line lender and local currency issuer, and a syndicate of financial institutions (the “Lenders”). The New Credit Agreement provides for senior secured credit facilities consisting of (a) a revolving A credit facility in the amount of $1.0 billion, with sublimits for letters of credit, swing line loans and multicurrency borrowings, (b) a revolving B facility in the amount of $35 million for loans in Australian Dollars or New Zealand Dollars, (c) a term loan A facility in the amount of $2.02 billion and (d) a term loan B facility in the amount $300 million. The New Credit Agreement also contains an accordion feature for borrowing an additional $500 million in term A or revolver A and term B. Proceeds from the New Credit Facility may be used for working capital purposes, acquisitions, and other general corporate purposes. The proceeds of the New Credit Facility were used to paydown borrowings under the Existing Credit Facility as discussed below. On November 14, 2014 in order to finance a portion of the Comdata Acquisition and to refinance our Existing Credit Agreement, we made initial borrowings under the New Credit Agreement.
The New Credit Agreement replaced the Existing Credit Agreement, which was a five-year, $900 million Credit Agreement (the “Existing Credit Agreement”) with Bank of America, N.A., as administrative agent, swing line lender and L/C issuer, and a syndicate of financial institutions (the “Lenders”) entered into on June 22, 2011. On March 13, 2012, we entered into the first Amendment to the existing Credit Agreement. The Amendment added two U.K. entities as designated borrowers and added a $110 million foreign currency swing line subfacility under the existing revolver, which allows for alternate currency borrowing on the swing line. The Amendment also permitted us to provide a cash deposit of up to $50 million in connection with one of our MasterCard programs. On November 6, 2012, we entered into a second amendment to the Credit Agreement to increase our total borrowing capacity from $900 million to $1.4 billion, comprised of an increase to the term loan from $300 million to $550 million and an increase to the revolving line of credit from $600 million to $850 million. In addition, we increased the accordion feature from $150 million to $250 million. The interest rates on the amended Credit Agreement did not change. On March 20, 2013, we entered into a third amendment to the Credit Agreement to extend the term of the facility for an additional five years from the amendment date, with a new maturity date of March 20, 2018, separated the revolver into two tranches (a $815 million Revolving A facility and a $35 million Revolving B facility), added a designated borrower in Australia and another in New Zealand, with the ability to borrow in local currency and U.S. Dollars under the Revolving B facility and removed a cap to allow for additional investments in certain business relationships. The revolving line of credit contains a $20 million sublimit for letters of credit, a $20 million sublimit for swing line loans and sublimits for multicurrency borrowings in Euros, Sterling, Japanese Yen, Australian Dollars and New Zealand Dollars.
The obligations of the Borrowers under the New Credit Agreement are secured by substantially all of the assets of the Company and its domestic subsidiaries, pursuant to a security agreement and includes a pledge of (i) 100% of the issued and outstanding equity interests owned by us of each Domestic Subsidiary and (2) 66% of the voting shares of the first-tier foreign subsidiaries, but excluding real property, personal property located outside of the United States, accounts receivables and related assets subject to the Securitization Facility and certain
investments required under money transmitter laws to be held free and clear of liens. At December 31, 2014,2015, we
had $2.02 billion in borrowings outstanding on the term loan A, $250$1,919 million in borrowings outstanding on term loan A excluding the related debt discount, $247.5 million in borrowings outstanding on term loan B $595excluding the related debt discount and $160 million in borrowings outstanding on the domestic revolving A credit facility, and $53 million in borrowings outstanding on the foreign revolving A credit facility.
Interest on amounts outstanding under the New Credit Agreement (other than the term loan B facility) accrues based on the British Bankers Association LIBOR Rate (the Eurocurrency Rate), plus a margin based on a leverage ratio, or our option, the Base Rate (defined as the rate equal to the highest of (a) the Federal Funds Rate plus 0.50%, (b) the prime rate announced by Bank of America, N.A., or (c) the Eurocurrency Rate plus 1.00%) plus a margin based on a leverage ratio. Interest is payable quarterly in arrears. Interest on the term loan B facility accrues based on the Eurocurrency Rate or the Base Rate, as described above, except that the applicable margin is fixed at 3% for Eurocurency Loans and at 2% for Base Rate Loans. In addition, we have agreed to pay a quarterly commitment fee at a rate per annum ranging from 0.20% to 0.40% of the daily unused portion of the credit facility. At December 31, 2014,2015, the interest rate on the term loan A andfacility was 1.92%, domestic revolving A facility was 2.16%, the interest rate on the foreign revolving A facility was 2.50%1.83% and the interest rate on the term loan B facility was 3.75%. The rate on the unused credit facility was 0.40%0.30% for all facilities at December 31, 2014.2015. There were no borrowings outstanding at December 31, 20142015 on the foreign revolving A facility, the foreign revolving B facility, the U.S. or the foreign swing line of credit.
The stated maturity dates for our term loan A, revolving loans, and letters of credit under the New Credit Agreement is November 14, 2019 and November 14, 2021 for our term loan B. The term loans are payable in quarterly installments and are due on the last business day of each March, June, September, and December with the final principal payment due on the respective maturity date. Borrowings on the revolving line of credit are repayable at our option of one, two, three or nine months after borrowing, depending on the term of the borrowing on the facility. Borrowings on the foreign swing line of credit are due no later than ten business days after such loan is made.
Our New Credit Agreement contains a number of negative covenants restricting, among other things, limitations on liens (with exceptions for our Securitization Facility) and investments, incurrence or guarantees of indebtedness, mergers, acquisitions, dissolutions, liquidations and consolidations, dispositions, dividends and other restricted payments and prepayments of other indebtedness. In particular, we are not permitted to make any restricted payments (which includes any dividend or other distribution) except that the we may declare and make dividend payments or other distributions to our stockholders so long as (i) on a pro forma basis both before and after the distribution the consolidated leverage ratio is not greater than 3.00:1.00 and we are in compliance with the financial covenants and (ii) no default or event of default shall exist or result therefrom. The New Credit Agreement also contains customary events of default. The New Credit Agreement includes financial covenants where the Company is required to maintain a consolidated leverage ratio to consolidated EBITDA of less than (i) 4.25 to 1.0 as of the end of any fiscal quarter prior to December 31, 2015; (ii) 4.00 to 1.0 as of any fiscal quarter after December 31, 2015 but on or prior to December 31, 2016; (iii) 3.75 to 1.0 as of any fiscal quarter after December 31, 2016 but on or prior to June 30, 2018; 3.50 to 1.0 as of any fiscal quarter after June 30, 2018; and a consolidated interest coverage ratio of no more than 4.00 to 1.0.
During 2014,2015, we made principal payments of $496.9$101 million on the Existing term loan A, loan, $50.0$2.5 million on the new Termterm loan B, Loan $565$435 million on the domestic revolving A facility $218.6and $51.8 million on the foreign revolving A facility and $7.3 million on the foreign revolving B facility. As of December 31, 2014, we were in compliance with each of the covenants under the New Credit Agreement.
New Zealand Facility
On April 29, 2013, we entered into a $12 million New Zealand dollar ($9.4 million) facility with Westpac Bank in New Zealand (“New Zealand Facility”). This facility iswas for purposes of funding the working capital needs of our acquiredCardLink business CardLink, in New Zealand. This facility matureswas terminated on AprilSeptember 30, 2015. A line of credit charge
accrues at a rate of 0.025% times the facility limit each month. Interest accrues on outstanding borrowings at the Bank Bill Mid-Market (BKBM) settlement rate plus a margin of 1.0%. The New Zealand Facility contains representations, warranties and events of default, as well as certain affirmative and negative covenants, customary for financings of this nature. These covenants include compliance with certain financial ratios.
At December 31, 2014, we did not have an outstanding unpaid balance on this facility and we were in compliance with each of the covenants under the New Zealand Facility.
Securitization Facility
We are a party to a receivables purchase agreement among FleetCor Funding LLC, as seller, PNC Bank, National Association as administrator, and various purchaser agents, conduit purchasers and related committed purchasers
parties thereto, which was amended and restated for the Fifth time as of November 14, 2014. We refer to this arrangement as the Securitization Facility in this report.Facility. The current purchase limit under the Securitization Facility is $1.2 billion.$950 million.
On November 14, 2014, in order to finance a portion of the Comdata acquisition, the Company and certain of its subsidiaries entered into a Fifth Amended and Restated Receivables Purchase Agreement (the “New Receivables Purchase Agreement”), which amended and restated the Fourth Amended and Restated Receivables Purchase Agreement dated as of October 29, 2007 (as amended, the “Existing Receivables Purchase Agreement”), which was most recently amended on February 3, 2014, pursuant to the Tenth Amendment to the Fourth Amended and Restated Receivables Purchase Agreement. Under the terms of the New Receivables Purchase agreement, the purchase limit was increased from $500 million to $1.2 billion, the term of the facility was extended to November 14, 2017, financial covenants and additional purchasers were added to the facility. On November 5, 2015, the first amendment to the fifth amended and restated receivables purchase agreement was entered into which allowed the Company to enter into a new contract with BP and modified the eligible receivables definition and on December 1, 2015, the second amendment to the fifth amended and restated receivables purchase agreement was entered into which reduced the commitments from $1.2 billion to $950 million.
The Existing Receivables Purchase agreement was amended for the seventh time on February 6, 2012 to add a new purchaser and extend the facility termination date, for the eighth time on February 4, 2013 to extend the facility termination date, for the ninth time on September 25, 2013 to change a committed purchaser, and for the tenth time on February 3, 2014 to extend the facility termination date, change pricing and to return to prorated funding by participating banks. There is a program fee equal to one month LIBOR and the Commercial Paper Rate of 0.18%0.43% plus 0.90% and 0.17%0.18% plus 0.675%0.90% as of December 31, 20142015 and 2013,2014, respectively. The unused facility fee is payable at a rate of 0.40% and 0.30% per annum as of December 31, 20142015 and 2013,2014, respectively.
Under a related purchase and sale agreement, dated as of December 20, 2004, amended on July 7, 2008 and most recently amended on November 14, 2014 to include Comdata as an originator, between FleetCor Funding LLC, as purchaser, and certain of our subsidiaries, as originators, the receivables generated by the originators are deemed to be sold to FleetCor Funding LLC immediately and without further action upon creation of such receivables. At the request of FleetCor Funding LLC, as seller, undivided percentage ownership interests in the receivables are ratably purchased by the purchasers in amounts not to exceed their respective commitments under the facility. Collections on receivables are required to be made pursuant to a written credit and collection policy and may be reinvested in other receivables, may be held in trust for the purchasers, or may be distributed. Fees are paid to each purchaser agent for the benefit of the purchasers and liquidity providers in the related purchaser group in accordance with the Securitization Facility and certain fee letter agreements.
The Securitization Facility provides for certain termination events, which includes nonpayment, upon the occurrence of which the administrator may declare the facility termination date to have occurred, may exercise certain enforcement rights with respect to the receivables, and may appoint a successor servicer, among other things.
We were in compliance with theall financial and non-financial covenant requirements related to our Securitization Facility as of December 31, 2014.
Assumed Debt
In connection with one of our 2013 acquisitions, we assumed debt of $164.1 million, which we paid off during 2013.2015.
Other Liabilities
In connection with our acquisition of certain businesses, we owe final payments of $11.7$9.2 million, which are payable $6.6$7.5 million in 2015, $3.3 million in 2016the next twelve months and $1.7 million in 2017. Alsoperiods beyond a year.
Stock Repurchase Program
On February 4, 2016, our Board of Directors approved a stock repurchase program under which we may begin purchasing up to $500 million of its common stock over the next 18 months. Any stock repurchases may be made at times and in connection with our acquisitionsuch amounts as we deem appropriate. The timing and amount of certain businesses,stock repurchase, if any, will
depend on a variety of factors including the stock price, market conditions, corporate and regulatory requirements, and any additional constraints related to material inside information we have remaining contingent consideration paymentsmay possess. The repurchase is expected to be funded by available cash flow from the respective sellers with estimated fair values totaling $43.5 million, which are payable $42.9 million in 2015business and $0.5 million in 2016. We made a contingent consideration payment on February 13, 2015, settling all amounts due in 2015 under these arrangements.working capital.
Critical accounting policies and estimates
In applying the accounting policies that we use to prepare our consolidated financial statements, we necessarily make accounting estimates that affect our reported amounts of assets, liabilities, revenue and expenses. Some of these estimates require us to make assumptions about matters that are highly uncertain at the time we make the accounting estimates. We base these assumptions and the resulting estimates on historical information and other factors that we believe to be reasonable under the circumstances, and we evaluate these assumptions and estimates on an ongoing basis. In many instances, however, we reasonably could have used different accounting estimates and, in other instances, changes in our accounting estimates could occur from period to period, with the result in each case being a material change in the financial statement presentation of our financial condition or results of operations. We refer to estimates of this type as critical accounting estimates. Our significant accounting policies are summarized in the consolidated financial statements contained elsewhere in this report. The critical accounting estimates that we discuss below are those that we believe are most important to an understanding of our consolidated financial statements.
See Footnote 2 to the Consolidated Financial Statements, Summary of Significant Accounting Policies.
Revenue recognition and presentation
Revenue is derived from our merchant and network relationships as well as from customers and partners. We recognize revenue on fees generated through services to commercial fleets, commercial businesses, major oil companies, petroleum marketers and leasing companies and record revenue net of the wholesale cost of the underlying products and services based on the following: (i) we are not the primary obligor in the arrangement and we are not responsible for fulfillment and the acceptability of the product; (ii) we have no inventory risk, do not bear the risk of product loss and do not make any changes to the product or have any involvement in the product specifications; (iii) we do not have significant latitude with respect to establishing the price for the product (predominantly fuel) and (iv) the amount we earn for our services is fixed, within a limited range.
Through our merchant and network relationships we provide fuel, prepaid cards, vehicle maintenance, lodging, food, toll, and transportation related services to our customers. We derive revenue from our merchant and network relationships based on the difference between the price charged to a customer for a transaction and the price paid to the merchant or network for the same transaction. Our net revenue consists of margin on sales and fees for technical support, processing, communications and reporting. The price paid to a merchant or network may be calculated as (i) the merchant’s wholesale cost of the product plus a markup; (ii) the transaction purchase price less a percentage discount; or (iii) the transaction purchase price less a fixed fee per unit. The difference between the price we pay to a merchant and the merchant’s wholesale cost for the underlying products and services is considered a merchant commission and is recognized as expense when the fuel purchase transaction is executed. We recognize revenue from merchant and network relationships when persuasive evidence of an
arrangement exists, the services have been provided to the customer, the sales price is fixed or determinable and collectability is reasonably assured. We have entered into agreements with major oil companies, petroleum marketers and leasing companies, among others, that specify that a transaction is deemed to be captured when we have validated that the transaction has no errors and have accepted and posted the data to our records.
We also derive revenue from customers and partners from a variety of program fees including transaction fees, card fees, network fees, report fees and other transaction-based fees which typically are calculated based on measures such as percentage of dollar volume processed, number of transactions processed, or some combination thereof. Such services are provided through proprietary networks or through the use of third-party networks. Transaction fees and other transaction-based fees generated from our proprietary networks and third-party
networks are recognized at the time the transaction is captured. Card fees, network fees and program fees are recognized as we fulfill our contractual service obligations. In addition, we recognize revenue from late fees and finance charges.charges, in jurisdictions where permitted under local regulations, primarily in the U.S. and Canada. Such fees are recognized net of a provision for estimated uncollectible amounts, at the time the fees and finance charges are assessed and serviceservices are provided. The Company ceases billing and accruing for late fees and finance charges approximately 30-40 days after the customer’s balance becomes delinquent.
We also charge our customers transaction fees to load value onto prepaid fuel, food, toll and transportation vouchers and cards. We recognize fee revenue upon providing the activated fuel, food, toll and transportation vouchers and prepaid cards to the customer. Revenue is recognized from the processing arrangements with merchants when persuasive evidence of an arrangement exists, the services have been provided, the sales price is fixed or determinable and collectability is reasonably assured. Revenue is recognized on lodging and transportation management services when the lodging stay or transportation service is completed. Revenue is also derived from the sale of equipment in certain of our businesses, which is recognized at the time the device is sold and the risks and rewards of ownership have passed. This revenue is recognized gross of the cost of sales related to the equipment in revenues, net within the consolidated statements of income. The related cost of sales for the equipment is recorded within processing expenses. We have recorded $15.1$84.1 million of expenses related to sales of equipment within the processing expenses line of the consolidated statements of income in 2014.2015.
Our fiscal year ends on December 31. In certain of our U.K. businesses, we record the operating results using a 4-4-5 week accounting cycle with the fiscal year ending on the Friday on or immediately preceding December 31. Fiscal years 20142015 and 20122014 include 52 weeks for the businesses reporting using a 4-4-5 accounting cycle. Fiscal year 2013 included 53 weeks for business reporting using a 4-4-5 accounting cycle.
We deliver both stored value cards and card-based services primarily in the form of gift cards. For multiple-deliverable customer contracts, stored value cards and card-based services are separated into two units of accounting. StoreStored valued cards are generally recognized upon shipment to the customer. Card-based services are recognized when the card services are rendered.
Accounts receivable
As described above under the heading “Securitization Facility,” we maintain a $1.2 billion revolving trade accounts receivable Securitization Facility. The current purchase limit under the Securitization Facility is $950 million. Accounts receivable collateralized within our Securitization Facility relate to trade receivables resulting from charge card activity. Pursuant to the terms of the Securitization Facility, we transfer certain of our domestic receivables, on a evolving basis, to FleetCor Funding LLC (Funding), a wholly-owned bankruptcy remote subsidiary (Conduit). In turn, Funding sells, without recourse, on a revolving basis, up to $1.2 billion$950 million of undivided ownership interests in this pool of accounts receivable to a multi-seller, asset-backed commercial paper conduit. Funding maintains a subordinated interest, in the form of over collateralization, in a portion of the receivables sold to the conduit. Purchases by the conduit are financed with the sale of highly-rated commercial paper.
We utilize proceeds from the sale of our accounts receivable as an alternative to other forms of debt,financing, effectively reducing our overall borrowing costs. We have agreed to continue servicing the sold receivables for the financial institutions at market rates, which approximates our cost of servicing. We retain a residual interest in the accounts receivable sold as a form of credit enhancement. The residual interest’s fair value approximates carrying value due to its short-term nature. Funding determines the level of funding achieved by the sale of trade accounts receivable, subject to a maximum amount.
On November 14, 2014, in order to finance a portion of the Comdata acquisition, the Company and certain of its subsidiaries entered into a New Receivables Purchase Agreement. Under the terms of the New Receivables Purchase agreement, the purchase limit was increased from $500 million to $1.2 billion, and the term of the facility was extended to November 14, 2017. On November 5, 2015, the first amendment to the fifth amended
and restated receivables purchase agreement was entered into which allowed the Company to enter into a new contract with BP and modified the eligible receivables definition and on December 1, 2015, the second amendment to the fifth amended and restated receivables purchase agreement was entered into which reduced the commitments from $1.2 billion to $950 million.
All foreign receivables are owned receivables and are not included in our receivable securitization program. At December 31, 20142015 and 2013,2014, there was $675$614 million and $349$675 million, respectively, of short-term debt outstanding under our Securitization Facility.
Credit risk and reserve for losses on receivables
We control credit risk by performing periodic credit evaluations of our customers. Payments from customers are generally due within 14 days of billing. We routinely review our accounts receivable balances and make provisions for probable doubtful accounts based primarily on the aging of those balances. Accounts receivable are deemed uncollectible once they age past 90 days and are deemed uncollectible from the customer. We provide an allowance for receivables aged less than 90 days that we expect will be uncollectible based on historical collections experience and would include accounts that have filed for bankruptcy. At December 31, 2015, approximately 98% of outstanding accounts receivable were current. Accounts receivable deemed uncollectible are removed from accounts receivable and the allowance for doubtful accounts when internal collection efforts have been exhausted and accounts have been turned over to a third-party collection agency. Recoveries from the third-party collection agency are not significant.
Impairment of long-lived assets, intangibles and intangiblesequity method investment
We test our other long-lived assets for impairment in accordance with relevant authoritative guidance. We evaluate whether impairment indicators related to our property, plant and equipment and other long-lived assets are present. These impairment indicators may include a significant decrease in the market price of a long-lived asset or asset group, a significant adverse change in the extent or manner in which a long-lived asset or asset group is being used or in its physical condition, or a current-period operating or cash flow loss combined with a history of operating or cash flow losses or a forecast that demonstrates continuing losses associated with the use of a long-lived asset or asset group. If impairment indicators are present, we estimate the future cash flows for the asset or group of assets. The sum of the undiscounted future cash flows attributable to the asset or group of assets is compared to their carrying amount. The cash flows are estimated utilizing various projections of revenues and expenses, working capital and proceeds from asset disposals on a basis consistent with management’s intended actions. If the carrying amount exceeds the sum of the undiscounted future cash flows, we determine the assets’ fair value by discounting the future cash flows using a discount rate required for a similar investment of like risk and records an impairment charge as the difference between the fair value and the carrying value of the asset group. Generally, we perform our testing of the asset group at the business-line level, as this is the lowest level for which identifiable cash flows are available.
We complete an asset impairment test of goodwill at least annually or more frequently if facts or circumstances indicate that goodwill might be impaired. Goodwill is tested for impairment at the reporting unit level, and the impairment test consists of two steps, as well as a qualitative assessment, as appropriate. As deemed appropriate, we have performed a qualitative assessment of certain of our reporting units. In this qualitative assessment we individually considered the following items for each reporting unit where we determined a qualitative analysis to be appropriate: the macroeconomic conditions, including any deterioration of general conditions, limitations on accessing capital, fluctuations in foreign exchange rates and other developments in equity and credit markets; industry and market conditions, including any deterioration in the environment where the reporting unit operates, increased competition, changes in the products/services and regulator and political developments; cost of doing business; overall financial performance, including any declining cash flows and performance in relation to planned revenues and earnings in past periods; other relevant reporting unit specific facts, such as changes in management or key personnel or pending litigation; events affecting the reporting unit, including changes in the
carrying value of net assets, likelihood of disposal and whether there were any other impairment considerations within the business; the overall performance of our share price in relation to the market and our peers; and a quantitative stress test of the previously completed step 1 test from the prior year, updated with current year results, weighted-average cost of capital rates and future projections.
We completed step 1 of the goodwill impairment testing for certain of our reporting units for which the qualitative assessment was not performed. In this first step the reporting unit’s carrying amount, including goodwill is compared to its fair value which is measured based upon, among other factors, a discounted cash flow analysis as well as market multiples for comparable companies. If the carrying amount of the reporting unit is greater than its fair value, goodwill is considered impaired and step two must be performed. Step two measures the impairment loss by comparing the implied fair value of reporting unit goodwill with the carrying amount of that goodwill. The implied fair value of goodwill is determined by allocating the fair value of the reporting unit to all the assets and liabilities of that unit (including unrecognized intangibles) as if the reporting unit had been acquired in a business combination. The excess of fair value over the amounts allocated to the assets and liabilities of the reporting unit is the implied fair value of goodwill. The excess of the carrying amount over the implied fair value is the impairment loss.
We estimate the fair value of our reporting units using a combination of the income approach and the market approach. The income approach utilizes a discounted cash flow model incorporating management’s expectations for future revenue, operating expenses, earnings before interest, taxes, depreciation and amortization, capital expenditures and an anticipated tax rate. We discount the related cash flow forecasts using an estimated weighted-average cost of capital for each reporting unit at the date of valuation. The market approach utilizes comparative market multiples in the valuation estimate. Multiples are derived by relating the value of guideline companies, based on either the market price of publicly traded shares or the prices of companies being acquired in the marketplace, to various measures of their earnings and cash flow. Such multiples are then applied to the historical and projected earnings and cash flow of the reporting unit in developing the valuation estimate.
Preparation of forecasts and the selection of the discount rates involve significant judgments about expected future business performance and general market conditions. Significant changes in forecasts, the discount rates selected or the weighting of the income and market approach could affect the estimated fair value of one or more of our reporting units and could result in a goodwill impairment charge in a future period.
Based on the goodwill asset impairment analysis performed quantitatively and qualitatively on October 1, 2014,2015, we determined that the fair value of each of our reporting units is in excess of the carrying value. No events or changes in circumstances have occurred since the date of our most recent annual impairment test that would more likely than not reduce the fair value of a reporting unit below its carrying amount.
We also evaluate indefinite-lived intangible assets (primarily trademarks and trade names) for impairment annually. We also test for impairment if events and circumstances indicate that it is more likely than not that the fair value of an indefinite-lived intangible asset is below its carrying amount. Estimates critical to our evaluation of indefinite-lived intangible assets for impairment include the discount rate, royalty rates used in our evaluation of trade names, projected average revenue growth and projected long-term growth rates in the determination of terminal values. An impairment charge is recorded if the carrying amount of an indefinite-lived intangible asset exceeds the estimated fair value on the measurement date.
We also regularly evaluate the carrying value of our equity method investment, which is not carried at fair value, for other-than-temporary impairment. We estimate the fair value of our equity method investment using a combination of the income approach and the market approach. The income approach utilizes a discounted cash flow model incorporating management’s expectations for future revenue, operating expenses, earnings before interest, taxes, depreciation and amortization, capital expenditures and an anticipated tax rate. We discount the related cash flow forecasts using an estimated weighted-average cost of capital for each reporting unit at the date of valuation. The market approach utilizes comparative market multiples in the valuation estimate. Multiples are derived by relating the value of guideline companies, based on either the market price of publicly traded shares
or the prices of companies being acquired in the marketplace, to various measures of their earnings and cash flow. Such multiples are then applied to the historical and projected earnings and cash flow of our equity method investment in developing the valuation estimate. During the fourth quarter of 2015, we determined that the performance improvement initiatives in our equity method investment in Masternaut will take longer to implement than we originally projected. As a result, we have recorded a $40 million non-cash impairment charge in our equity method investment.
Income taxes
We account for income taxes under the asset and liability method. Deferred tax assets and liabilities are recognized for the future tax consequences attributable to differences between the financial statement carrying amounts of existing assets and liabilities and their respective tax bases. Deferred tax assets and liabilities are measured using enacted tax rates expected to apply to taxable income in the years in which those temporary differences are expected to be recovered or settled. The effect on deferred tax assets and liabilities of a change in tax rates is recognized in the period that includes the enactment date.
The ultimate realization of deferred tax assets is dependent upon the generation of future taxable income during the periods in which the associated temporary differences became deductible. On a quarterly basis, we evaluate whether it is more likely than not that our deferred tax assets will be realized in the future and conclude whether a valuation allowance must be established.
We do not provide deferred taxes for the undistributed earnings of our foreign subsidiaries that are considered to be indefinitely reinvested outside of the United States in accordance with authoritative literature. We include any estimated interest and penalties on tax related matters in income tax expense.
We do not provide deferred taxes for the undistributed earnings of our foreign subsidiaries that are considered to be indefinitely reinvested outside of the United States in accordance with relevant authoritative literature. If in the future these earnings are repatriated to the United States, or if we determine that the earnings will be remitted in the foreseeable future, additional tax provisions may be required.
Current guidance clarifies the accounting for uncertainty in income taxes recognized in an entity’s financial statements and prescribes threshold and measurement attributes for financial statement disclosure of tax positions taken or expected to be taken on a tax return. Under the relevant authoritative literature, the impact of an uncertain income tax position on the income tax return must be recognized at the largest amount that is more likely than not to be sustained upon audit by the relevant taxing authority. An uncertain income tax position will not be recognized if it has less than a 50 percent likelihood of being sustained.
Business combinations
We have accounted for business combinations under the acquisition method of accounting. The acquisition method requires that the acquired assets and liabilities including contingencies, be recorded at fair value determined on the acquisition date and changes thereafter reflected in income. For significant acquisitions, we obtain independent third party valuation studies for certain of the assets acquired and liabilities assumed to assist in determining fair value. Goodwill represents the excess of the purchase price over the fair value of the tangible and intangible assets acquired and liabilities assumed. The estimation of the fair values of the assets acquired and liabilities assumed involves a number of estimates and assumptions that could differ materially from the actual amounts recorded. The results of the acquired businesses are included in our results of operations beginning from the completion date of the applicable transaction.
Estimates of fair value are revised during an allocation period as necessary when, and if, information becomes available to further define and quantify the fair value of the assets acquired and liabilities assumed. The allocation period does not exceed one year from the date of the acquisition. To the extent additional information to refine the original allocation becomes available during the allocation period, the allocation of the purchase
price is adjusted. Should information become available after the allocation period, those items are adjusted through operating results. The direct costs of the acquisition are recorded as operating expenses. Certain acquisitions include contingent consideration related to the performance of the acquired operations following the acquisition. Contingent consideration is recorded at estimated fair value at the date of the acquisition and is remeasured each reporting period, with any changes in fair value recorded in the consolidated statements of income. We estimate the fair value of the acquisition-related contingent consideration using various valuation approaches, as well as significant unobservable inputs, reflecting our assessment of the assumptions market participants would use to value these liabilities.
Stock-based compensation
We account for employee stock options and restricted stock in accordance with relevant authoritative literature. Stock options are granted with an exercise price estimated to be equal to the fair market value on the date of grant as authorized by our board of directors. Options granted have vesting provisions ranging from one to six years. Stock option grants are generally subject to forfeiture if employment terminates prior to vesting. We have selected the Black-Scholes option pricing model for estimating the grant date fair value of stock option awards granted. We have considered the retirement and forfeiture provisions of the options and utilized our historical experience to estimate the expected life of the options. We base the risk-free interest rate on the yield of a zero coupon U.S. Treasury security with a maturity equal to the expected life of the option from the date of the grant. Stock-based compensation cost is measured at the grant date based on the value of the award and is recognized as expense over the requisite service period based on the number of years for which the requisite service is expected to be rendered.
Awards of restricted stock and restricted stock units are independent of stock option grants and are generally subject to forfeiture if employment terminates prior to vesting. The vesting of shares granted is generally based on the passage of time, performance or market conditions, or a combination of these. Shares vesting based on the passage of time have vesting provisions ranging fromof one to six years.year. The fair value of restricted stock shares where the shares vest based on the passage of time or performance is based on the grant date fair value of our stock. The fair value of restricted stock shares based on market conditions is estimated using the Monte Carlo option pricing model. The risk-free interest rate and volatility assumptions used within the Monte Carlo option pricing model are calculated consistently with those applied in the Black-Scholes options pricing model utilized in determining the fair value of the stock option awards.
For performance-based restricted stock awards and performance based stock option awards, we must also make assumptions regarding the likelihood of achieving performance goals. If actual results differ significantly from these estimates, stock-based compensation expense and our results of operations could be materially affected.
Adoption of New Accounting Standards
Foreign CurrencyDiscontinued Operations Reporting
In March 2013,April 2014, the Financial Accounting Standards Board (the “FASB”)FASB issued Accounting Standards Update (“ASU”) 2013-05 “Parent’s Accountingan ASU 2014-08, “Discounted Operations Reporting” that changes the requirements for reporting discontinued operations. This update will have the Cumulative Translation Adjustment upon Derecognitionimpact of Certain Subsidiaries or Groupsreducing the frequency of Assets withindisposals reported as discontinued operations, by requiring such a Foreign Entity or ofdisposal to represent a strategic shift that has a major effect on an Investment in a Foreign Entity”, which indicates thatentity’s operations and financial results. This update also expands the entire amount of a cumulative translation adjustment (“CTA”)disclosures for discontinued operations, and requires new disclosures related to an entity’s investment in a foreign entity should be released when there has been a sale of a subsidiary or group of net assets within a foreign entity and the sale represents the substantially complete liquidation of the investment in the foreign entity, loss of a controlling financial interest in an investment in a foreign entity (i.e., the foreign entity is deconsolidated) or step acquisition for a foreign entity (i.e., when an entity has changed from applying the equity method for an investment in a foreign entity to consolidating the foreign entity). The ASU doesindividually significant disposals that do not change the requirement to release a pro rata portion of the CTA of the foreign entity into earnings for a partial sale of an equity method investment in a foreign entity. This ASU is effective for us for fiscal years and interim periods within those fiscal years beginningqualify as discontinued operations. We adopted this new guidance on or after December 15, 2013.January 1, 2015. The adoption of this ASU did not have a material impact on the results of operations, financial condition, or cash flows.flows, as we did not have discontinued operations.
Unrecognized Tax Benefit When an NOL ExistsStock-Based Payment Awards with Performance Targets
In July 2013,June 2014, the FASB issued ASU 2013-11 “Presentation of an Unrecognized Tax Benefit When a Net Operating Loss Carryforward, a Similar Tax Loss, or a Tax Credit Carryforward Exists”2014-12, “Share-Based Payment Awards With Performance Targets That Are Attainable After the Requisite Service Period”, for companies that grant their employees share-based
payments in which indicates that to the extent a net operating loss carryforward, a similar tax loss, or a tax credit carryforward is not available at the reporting date under the tax lawterms of the applicable jurisdiction to settle any additional income taxesaward provide that would result froma performance target that affects vesting could be achieved after the disallowance of a tax position or the tax law of the applicable jurisdiction does not require the entity to use, and the entity does not intend to use, the deferred tax asset for such purpose, the unrecognized tax benefit should be presented in the financial statements as a liability and should not be combined with deferred tax assets. This ASU is effective for us for fiscal years and interim periods within those fiscal years beginningrequisite service period. We adopted this new guidance on or after December 15, 2013.January 1, 2015. The adoption of this ASU did not have a material impact on ourthe results of operations, financial condition, or cash flows.
Simplification of Business Combination Measurement-Period Adjustments
In September 2015, the FASB issued ASU 2015-16, “Business Combinations: Simplifying the Accounting for Measurement-Period Adjustments”, which requires that an acquirer recognize adjustments to provisional amounts that are identified during the measurement period in the reporting period in which the adjustment amounts are determined. Prior to the issuance of the standard, entities were required to retrospectively apply adjustments made to provisional amounts recognized in a business combination. We adopted this new guidance during the third quarter of 2015. The adoption of this ASU did not have a material impact on the results of operations, financial condition, or cash flows. Furthermore, measurement period adjustments recorded in the year ended December 31, 2015 did not have a material impact on our consolidated statements of income.
Pending Adoption of Recently Issued Accounting Standards
From time to time, new accounting pronouncements are issued by the FASB or other standards setting bodies that are adopted by us as of the specified effective date. Unless otherwise discussed, we believeour management believes that the impact of recently issued standards that are not yet effective will not have a material impact on our consolidated financial statements upon adoption.
Going Concern
In August 2013, the FASB issued ASU 2014-15 “Disclosure of Uncertainties About an Entity’s Ability to Continue as a Going Concern”, which requires entities to perform interim and annual assessments of the entity’s ability to continue as a going concern within one year of the date of issuance of the entity’s financial statements. This ASU is effective for fiscal years ending after December 15, 2016 and interim periods thereafter, with early adoption permitted. Our adoption of this ASU is not expected to have a material impact on the results of operations, financial condition, or cash flows, as it is disclosure based.
Discontinued Operations Reporting
In April 2014, the FASB issued an ASU 2014-08, “Discounted Operations Reporting” that changes the requirements for reporting discontinued operations. This update will have the impact of reducing the frequency of disposals reported as discontinued operations, by requiring such a disposal to represent a strategic shift that has a major effect on an entity’s operations and financial results. This update also expands the disclosures for discontinued operations, and requires new disclosures related to individually significant disposals that do not qualify as discontinued operations. This new guidance becomes effective for us prospectively in the first quarter of 2015. This amended guidance will only have a potential impact to the extent that we discontinue any operations in future periods.
Revenue Recognition
In May 2014, the FASB issued ASC 606, “Revenue from Contracts with Customers”, which amends the guidance in former ASC 605, Revenue Recognition. This amended guidance requires revenue to be recognized in an amount that reflects the consideration to which the company expects to be entitled for those goods and services when the performance obligation has been satisfied. This amended guidance also requires enhanced disclosures regarding the nature, amount, timing and uncertainty of revenue and related cash flows arising from contracts with customers. In August 2015, the FASB issued ASU 2015-14, “Revenue from Contracts with Customers: Deferral of the Effective Date”, which defers the effective date of the new revenue recognition standard by one year. This ASU is effective for us for reporting periods beginning after December 15, 2017, but permits companies the option to adopt as of the original effective date. We anticipate selecting the modified retrospective method during transition and are currently evaluating the impact on our results of operations, financial condition, or cash flows.
Simplification of Guidance on Debt Issuance Costs
In April 2015, the FASB issued ASU 2015-03, “Interest—Imputation of Interest”, which changes the presentation of debt issuance costs in financial statements as a direct deduction from the related debt liability rather than as an asset. This ASU is effective for us for fiscal years ending after December 15, 20162015 and interim periods, with earlyperiods. Early adoption notis permitted. We are currently evaluating the impact of the provisions of ASC 606.
Stock-Based Payment Awards with Performance Targets
In June 2014,August 2015, the FASB issued ASU 2014-12, “Share-Based Payment Awards With Performance Targets That Are Attainable After the Requisite Service Period”2015-15, “Interest—Imputation of Interest: Presentation and Subsequent Measurement of Debt Issuance Costs Associated with Line-of-Credit
Arrangements”, which is effective immediately. This ASU states that entities may continue presenting unamortized debt issuance costs for companies that grant their employees share-based payments in which the termsline-of-credit arrangements as an asset. The adoption of the award provide that a performance target that affects vesting could be achieved after the requisite service period. This new guidance becomes effective for us beginning in the first quarter of 2015, but early adoption is permitted. This new guidancethis ASU is not expected to have a material impact on our consolidated financial position orthe results of operations.operations, financial condition, or cash flows.
Simplification of Balance Sheet Classification of Deferred Taxes
In November 2015, the FASB issued ASU 2015-17, “Balance Sheet Classification of Deferred Taxes”, which requires entities to present deferred tax assets (DTAs) and deferred tax liabilities (DTLs) as noncurrent in a classified balance sheet. It thus simplifies the current guidance, which requires entities to separately present DTAs and DTLs as current or noncurrent in a classified balance sheet. Netting of DTAs and DTLs by tax jurisdiction is still required under the new guidance. This ASU is effective for the Company for annual reporting periods beginning after December 15, 2016, and interim periods within those annual periods. The Company’s adoption of this ASU is not expected to have a material impact on the results of operations, financial condition, or cash flows.
Contractual obligations
The table below summarizes the estimated dollar amounts of payments under contractual obligations identified below as of December 31, 20142015 for the periods specified:
| Payments due by period(a) | ||||||||||||||||||||
(in millions) | Total | Less than 1 year | 1-3 years | 3-5 years | More than 5 years | |||||||||||||||
Operating leases | $ | 41.6 | $ | 12.4 | $ | 15.4 | $ | 8.4 | $ | 5.4 | ||||||||||
Credit Facility | 2,909.2 | 749.8 | 203.4 | 1,718.9 | 237.1 | |||||||||||||||
Contingent consideration agreements(b) | 43.5 | 42.9 | 0.6 | — | — | |||||||||||||||
Deferred purchase price payments(b) | 11.6 | 6.6 | 5.0 | — | — | |||||||||||||||
Other(b) | 4.0 | — | 3.6 | 0.4 | — | |||||||||||||||
Securitization facility | 675.0 | 675.0 | — | — | — | |||||||||||||||
|
|
|
|
|
|
|
|
|
| |||||||||||
Total | $ | 3,684.9 | $ | 1,486.7 | $ | 228.0 | $ | 1,727.7 | $ | 242.5 | ||||||||||
|
|
|
|
|
|
|
|
|
| |||||||||||
Credit Facility Securitization Facility Estimated interest payments- Credit Facility(c) Estimated interest payments- Securitization Facility(c) Operating leases Deferred purchase price(b) Other(b) Total Payments due by period(a) (in millions) Total Less than
1 year 1-3
years 3-5
years More than
5 years $ 2,319.4 $ 261.6 $ 304.6 $ 1,517.8 $ 235.4 614.0 614.0 — — — 169.0 48.3 89.6 31.1 — 16.4 8.2 8.2 — — 67.6 12.7 20.2 11.4 23.3 9.2 7.5 1.7 — — 1.9 — 1.8 0.1 — $ 3,197.5 $ 952.3 $ 426.1 $ 1,560.4 $ 258.7
| (a) | Deferred income tax liabilities as of December 31, |
| (b) | The long-term portion of contingent consideration agreements and deferred purchase price payments are included with ‘other debt’ in the detail of our debt instruments disclosed in Note 10 to our audited consolidated financial statements. To reconcile the amount of ‘other debt’ as disclosed in the footnote to the contractual obligations table above, the long-term portion of |
| (c) | We draw upon and pay down on the revolver within our Credit Facility and our Securitization Facility borrowings outside of a normal schedule, as excess cash is available. For our variable rate debt, we have assumed the December 31, 2015 interest rates to calculate the estimated interest payments, for all years presented. This analysis also assumes that outstanding principal is held constant at the December 31, 2015 balances for our Credit Facility and Securitization Facility, except for mandatory pay downs on the term loans in accordance with the loan documents. We typically expect to settle such interest payments with cash flows from operating activities and/or other short-term borrowings. |
Management’s Use of Non-GAAP Financial Measures
We have included in the discussion under the caption “Adjusted Revenues, Adjusted EBITDA, Adjusted Net Income and Adjusted Net Income Per Diluted Share” above certain financial measures that were not prepared in accordance with GAAP. We have also included in the discussion under the caption “Transaction volume and revenue per transaction” above a financial measure that was not prepared in accordance with GAAP. Any analysis of non-GAAP financial measures should be used only in conjunction with results presented in accordance with GAAP. Below, we define the non-GAAP financial measures, provide a reconciliation of the non-GAAP financial measure to the most directly comparable financial measure calculated in accordance with GAAP, and discuss the reasons that we believe this information is useful to management and may be useful to investors.
Adjusted revenues
We have defined the non-GAAP measure adjusted revenues as revenues, net less merchant commissions as reflected in our income statement.
We use adjusted revenues as a basis to evaluate our revenues, net of the commissions that are paid to merchants to participate in our card programs. The commissions paid to merchants can vary when market spreads fluctuate in much the same way as revenues are impacted when market spreads fluctuate. We believe that adjusted revenue is an appropriate supplemental measure of financial performance and may be useful to investors to understanding our revenue performance on a consistent basis. Adjusted revenues are not intended to be a substitute for GAAP financial measures and should not be used as such.
Set forth below is a reconciliation of adjusted revenues to the most directly comparable GAAP measure, revenues, net (in thousands):
| Year Ended December 31, | ||||||||||||
| 2014 | 2013 | 2012 | ||||||||||
Revenues, net | $ | 1,199,390 | $ | 895,171 | $ | 707,534 | ||||||
Merchant commissions | 96,254 | 68,143 | 58,573 | |||||||||
|
|
|
|
|
| |||||||
Total adjusted revenues | $ | 1,103,136 | $ | 827,028 | $ | 648,961 | ||||||
|
|
|
|
|
| |||||||
Adjusted EBITDA
We have defined the non-GAAP measure adjusted EBITDA, as net income as reflected in our statement of income, adjusted to eliminate (a) interest expense, (b) tax expense, (c) depreciation of long-lived assets (d) amortization of intangible assets, (e) other expense (income), net (f) equity method investment loss and (g) loss on extinguishment of debt.
We use adjusted EBITDA as a basis to evaluate our operating performance net of the impact of certain non-core items during the period. We believe that adjusted EBITDA may be useful to investors to understanding our operating performance on a consistent basis. Adjusted EBITDA is not intended to be a substitute for GAAP financial measures and should not be used as such.
Set forth below is a reconciliation of adjusted EBITDA to the most directly comparable GAAP measure, net income (in thousands):
| Year Ended December 31, | ||||||||||||
| 2014 | 2013 | 2012 | ||||||||||
Net income | $ | 368,707 | $ | 284,501 | $ | 216,199 | ||||||
Provision for income taxes | 144,236 | 119,068 | 94,591 | |||||||||
Interest expense, net | 28,856 | 16,461 | 13,017 | |||||||||
Depreciation and amortization | 112,361 | 72,737 | 52,036 | |||||||||
Other (income) expense, net | (700 | ) | 602 | 1,121 | ||||||||
Equity method investment loss | 8,586 | — | — | |||||||||
Loss on extinguishment of debt | 15,764 | — | — | |||||||||
|
|
|
|
|
| |||||||
Adjusted EBITDA | $ | 677,810 | $ | 493,369 | $ | 376,964 | ||||||
|
|
|
|
|
| |||||||
| Year Ended December 31, | ||||||||||||
| 2015 | 2014 | 2013 | ||||||||||
Revenues, net | $ | 1,702,865 | $ | 1,199,390 | $ | 895,171 | ||||||
Merchant commissions | 108,257 | 96,254 | 68,143 | |||||||||
|
|
|
|
|
| |||||||
Total adjusted revenues | $ | 1,594,608 | $ | 1,103,136 | $ | 827,028 | ||||||
|
|
|
|
|
| |||||||
Adjusted net income and adjusted net income per diluted share
We have defined the non-GAAP measure adjusted net income as net income as reflected in our statement of income, adjusted to eliminate (a) non-cash stock basedstock-based compensation expense related to share-based compensation awards, (b) amortization of deferred financing costs, discounts and intangible assets, (c) amortization of the premium recognized on the purchase of receivables, (d) loss on the early extinguishment of debt, (e) our proportionate share of amortization of intangiblesintangible assets at our equity method investment, (e) loss on extinguishment(f) impairment of debtequity method investment, and (f)(g) other non-cash adjustments.
We have defined the non-GAAP measure adjusted net income per diluted share as the calculation previously noted divided by the weighted average diluted shares outstanding as reflected in our statement of income.
We use adjusted net income to eliminate the effect of items that we do not consider indicative of our core operating performance. We believe it is useful to exclude non-cash stock based compensation expense from adjusted net income because non-cash equity grants made at a certain price and point in time do not necessarily reflect how our business is performing at any particular time and stock based compensation expense is not a key measure of our core operating performance. We also believe that amortization expense can vary substantially from company to company and from period to period depending upon their financing and accounting methods, the fair value and average expected life of their acquired intangible assets, their capital structures and the method by which their assets were acquired. Therefore, we have excluded amortization expense from adjusted net income. We believe that the effect of fair value adjustments resulting from acquisitions is not a key measure of our core operating performance. We believe that adjusted net income and adjusted net income per diluted share are appropriate supplemental measures of financial performance and may be useful to investors to understanding our operating performance on a consistent basis. Adjusted net income and adjusted net income per diluted share are not intended to be a substitute for GAAP financial measures and should not be used as such.
Set forth below is a reconciliation of adjusted net income and adjusted net income per diluted share to the most directly comparable GAAP measure, net income and net income per diluted share (in thousands, except per share amounts):
| Year Ended December 31, | Year Ended December 31, | |||||||||||||||||||||||
| 2014 | 2013 | 2012 | 2015 | 2014 | 2013 | |||||||||||||||||||
Net income | $ | 368,707 | $ | 284,501 | $ | 216,199 | $ | 362,431 | $ | 368,707 | $ | 284,501 | ||||||||||||
Net income per diluted share | $ | 4.24 | $ | 3.36 | $ | 2.52 | $ | 3.85 | $ | 4.24 | $ | 3.36 | ||||||||||||
Stock based compensation | 37,649 | 26,676 | 19,275 | 90,122 | 37,649 | 26,676 | ||||||||||||||||||
Amortization of intangible assets | 86,149 | 49,313 | 32,376 | 159,740 | 86,149 | 49,313 | ||||||||||||||||||
Amortization of premium on receivables | 3,259 | 3,263 | 3,265 | 3,250 | 3,259 | 3,263 | ||||||||||||||||||
Amortization of deferred financing costs | 2,796 | 3,276 | 2,279 | |||||||||||||||||||||
Amortization of intangibles at equity method investment | 7,982 | — | — | |||||||||||||||||||||
Amortization of deferred financing costs and discounts | 7,049 | 2,796 | 3,276 | |||||||||||||||||||||
Amortization from equity method investment | 10,665 | 7,982 | — | |||||||||||||||||||||
Loss on extinguishment of debt | 15,764 | — | — | — | 15,764 | — | ||||||||||||||||||
Impairment of equity method investment | 40,000 | — | — | |||||||||||||||||||||
Other non-cash adjustments | (28,869 | )2 | — | — | — | (28,869 | )2 | — | ||||||||||||||||
|
|
|
|
|
| |||||||||||||||||||
Total pre-tax adjustments | 124,730 | 82,528 | 57,195 | 310,826 | 124,730 | 82,528 | ||||||||||||||||||
Income tax impact of pre-tax adjustments at the effective tax rate | (45,767 | )1 | (24,349 | ) | (17,410 | ) | (80,632 | )3 | (45,767 | )1 | (24,349 | ) | ||||||||||||
|
|
|
|
|
| |||||||||||||||||||
Adjusted net income | $ | 447,670 | $ | 342,680 | $ | 255,984 | $ | 592,625 | $ | 447,670 | $ | 342,680 | ||||||||||||
|
|
|
|
|
| |||||||||||||||||||
Adjusted net income per diluted share | $ | 5.15 | $ | 4.05 | $ | 2.99 | $ | 6.30 | $ | 5.15 | $ | 4.05 | ||||||||||||
Diluted shares | 86,982 | 84,655 | 85,736 | 94,139 | 86,982 | 84,655 | ||||||||||||||||||
| 1 | The effective tax rate used to calculate the income tax impact of pre-tax adjustments during 2014 excludes the impact of a $9.5 million discrete tax benefit, as well as other non-cash adjustments and their related income tax expense. |
| 2 | Other non-cash adjustments are unusual items reflecting adjustments to purchase accounting entries for contingent consideration and tax indemnifications for our 2013 acquisitions of DB and VB in Brazil. |
| 3 | The effective tax rate utilized excludes the impact of a one-time tax benefit recognized during 2015 of approximately $0.8 million, as well as adjustments related to our equity method investment. |
ITEM 7A. QUANTATIVEQUANTITATIVE AND QUALITATIVE DISCLOSURES ABOUT MARKET RISK
Foreign currency risk
Our International segment exposes us to foreign currency exchange rate changes that can impact translations of foreign-denominated assets and liabilities into U.S. dollars and future earnings and cash flows from transactions denominated in different currencies. Revenue from our International segment was 44.3%27.7%, 48.5%44.3% and 43.4%48.5% of total revenue for the years ended December 31, 2015, 2014, 2013, and 2012,2013, respectively. We measure foreign currency exchange risk based on changes in foreign currency exchange rates using a sensitivity analysis. The sensitivity analysis measures the potential change in earnings based on a hypothetical 10% change in currency exchange rates. Exchange rates and currency positions as of December 31, 20142015 were used to perform the sensitivity analysis. Such analysis indicated that a hypothetical 10% change in foreign currency exchange rates would have increased or decreased consolidated operating income during the year ended December 31, 20142015 by approximately $27.8$22.5 million had the U.S. dollar exchange rate increased or decreased relative to the currencies to which we had exposure. When exchange rates and currency positions as of December 31, 20132014 and 20122013 were used to perform this sensitivity analysis, the analysis indicated that a hypothetical 10% change in currency exchange rates would have increased or decreased consolidated operating income for the years ended December 31, 20132014 and 20122013 by approximately $20.0$27.8 million and $12.8$20.0 million, respectively.
Interest rate risk
We are exposed to changes in interest rates on our cash investments and debt. We invest our excess cash either to pay down our Securitization Facility debt or in securities that we believe are highly liquid and marketable in the short term. These investments are not held for trading or other speculative purposes. Under our $3.355 billion Credit Facility, we have syndicated $2.02 billion and $300 million term loan agreements with a syndicate of term loan A and term loan B investors in the United States, respectively, as well as a revolving A credit facility of $1.0 billion and a revolving B credit facility of $35 million. Interest on amounts outstanding under the Credit Agreement bear interest, at our election, at the British Bankers Association LIBOR Rate (the Eurocurrency Rate), plus a margin based on a leverage ratio, or at our option, the Base Rate (defined as the rate equal to the highest of (a) the Federal Funds Rate plus 0.50%, (b) the prime rate announced by Bank of America, N.A., or (c) the Eurocurrency Rate plus 1.00%) plus a margin based on a leverage ratio.
Prior to entering into our New Credit Agreement, we had borrowings outstanding under the Existing Credit Facility. On November 14, 2014, proceeds from our New Credit Agreement were used to retire our existing indebtedness under the Existing Credit Facility.
Under our previously Existing Credit Facility, we had a syndicated $550 million term loan agreement with a syndicate of term loan B investors in the United States, as well as a $850 million revolving credit facility. Interest on amounts outstanding under the previously Existing Credit Agreement bore interest, at our election, at the British Bankers Association LIBOR Rate (the Eurocurrency Rate), plus a margin based on a leverage ratio, or at our option, the Base Rate (defined as the rate equal to the highest of (a) the Federal Funds Rate plus 0.50%, (b) the prime rate announced by Bank of America, N.A., or (c) the Eurocurrency Rate plus 1.00%) plus a margin based on a leverage ratio.
Based on the amounts and mix of our fixed and floating rate debt (exclusive of our Securitization Facility) at December 31, 2015, 2014 2013 and 2012,2013, if market interest rates had increased or decreased an average of 100 basis points, our interest expense would have changed by $2.9$23.2 million, $1.6$29.2 million and $1.3$11.4 million, respectively. We determined these amounts by considering the impact of the hypothetical interest rates on our borrowing costs and interest rate swap agreement.costs. These analyses do not consider the effects of changes in the level of overall economic activity that could exist in such an environment.
Fuel price risk
Our fleet customers use our products and services primarily in connection with the purchase of fuel. Accordingly, our revenue is affected by fuel prices, which are subject to significant volatility. A decline in retail fuel prices
could cause a change in our revenue from several sources, including fees paid to us based on a percentage of each customer’s total purchase. Changes in the absolute price of fuel may also impact unpaid account balances and the late fees and charges based on these amounts. The impact of changes in fuel price is somewhat mitigated by our agreements with certain merchants, where the price paid to the merchant is equal to the lesser of the merchant’s cost plus a markup or a percentage of the transaction purchase price. We do not enter into any fuel price derivative instruments.
Fuel-price spread risk
From our merchant and network relationships, we derive revenue from the difference between the price charged to a fleet customer for a transaction and the price paid to the merchant or network for the same transaction. The price paid to a merchant or network is calculated as the merchant’s wholesale cost of fuel plus a markup. The merchant’s wholesale cost of fuel is dependent on several factors including, among others, the factors described above affecting fuel prices. The fuel price that we charge to our customer is dependent on several factors including, among others, the fuel price paid to the fuel merchant, posted retail fuel prices and competitive fuel prices. We experience fuel-price spread contraction when the merchant’s wholesale cost of fuel increases at a faster rate than the fuel price we charge to our customers, or the fuel price we charge to our customers decreases at a faster rate than the merchant’s wholesale cost of fuel. Accordingly, if fuel-price spreads contract, we may generate less revenue, which could adversely affect our operating results. The impact of volatility in fuel spreads is somewhat mitigated by our agreements with certain merchants, where the price paid to the merchant is equal to the lesser of the merchant’s cost plus a markup or a percentage of the transaction purchase price.
ITEM 8. FINANCIAL STATEMENTS AND SUPPLEMENTARY DATA
INDEX TO CONSOLIDATED FINANCIAL STATEMENTS
Report of Independent Registered Public Accounting Firm
The Board of Directors and Stockholders of FleetCor Technologies, Inc. and Subsidiaries
We have audited the accompanying consolidated balance sheets of FleetCor Technologies, Inc. and subsidiaries as of December 31, 20142015 and 2013,2014, and the related consolidated statements of income, comprehensive income, stockholders’ equity, and cash flows for each of the three years in the period ended December 31, 2014.2015. These financial statements are the responsibility of the Company’s management. Our responsibility is to express an opinion on these financial statements based on our audits.
We conducted our audits in accordance with the standards of the Public Company Accounting Oversight Board (United States). Those standards require that we plan and perform the audit to obtain reasonable assurance about whether the financial statements are free of material misstatement. An audit includes examining, on a test basis, evidence supporting the amounts and disclosures in the financial statements. An audit also includes assessing the accounting principles used and significant estimates made by management, as well as evaluating the overall financial statement presentation. We believe that our audits provide a reasonable basis for our opinion.
In our opinion, the financial statements referred to above present fairly, in all material respects, the consolidated financial position of FleetCor Technologies, Inc. and subsidiaries at December 31, 20142015 and 2013,2014, and the consolidated results of their operations and their cash flows for each of the three years in the period ended December 31, 2014,2015, in conformity with U.S. generally accepted accounting principles.
We also have audited, in accordance with the standards of the Public Company Accounting Oversight Board (United States), FleetCor Technologies, Inc. and subsidiaries’ internal control over financial reporting as of December 31, 2014,2015, based on criteria established in Internal Control-Integrated Framework issued by the Committee of Sponsoring Organizations of the Treadway Commission (2013 framework) and our report dated March 2, 2015February 29, 2016 expressed an unqualified opinion thereon.
/s/ Ernst & Young LLP
Atlanta, Georgia
March 2, 2015February 29, 2016
Report of Independent Registered Public Accounting Firm
The Board of Directors and Stockholders of FleetCor Technologies, Inc. and Subsidiaries
We have audited FleetCor Technologies, Inc. and subsidiaries’ internal control over financial reporting as of December 31, 2014,2015, based on criteria established in Internal Control—Integrated Framework issued by the Committee of Sponsoring Organizations of the Treadway Commission (2013 framework) (the COSO criteria). FleetCor Technologies, Inc. and subsidiaries’ management is responsible for maintaining effective internal control over financial reporting, and for its assessment of the effectiveness of internal control over financial reporting included in the accompanying Management’s Report on Internal Control Over Financial Reporting. Our responsibility is to express an opinion on the company’s internal control over financial reporting based on our audit.
We conducted our audit in accordance with the standards of the Public Company Accounting Oversight Board (United States). Those standards require that we plan and perform the audit to obtain reasonable assurance about whether effective internal control over financial reporting was maintained in all material respects. Our audit included obtaining an understanding of internal control over financial reporting, assessing the risk that a material weakness exists, testing and evaluating the design and operating effectiveness of internal control based on the assessed risk, and performing such other procedures as we considered necessary in the circumstances. We believe that our audit provides a reasonable basis for our opinion.
A company’s internal control over financial reporting is a process designed to provide reasonable assurance regarding the reliability of financial reporting and the preparation of financial statements for external purposes in accordance with generally accepted accounting principles. A company’s internal control over financial reporting includes those policies and procedures that (1) pertain to the maintenance of records that, in reasonable detail, accurately and fairly reflect the transactions and dispositions of the assets of the company; (2) provide reasonable assurance that transactions are recorded as necessary to permit preparation of financial statements in accordance with generally accepted accounting principles, and that receipts and expenditures of the company are being made only in accordance with authorizations of management and directors of the company; and (3) provide reasonable assurance regarding prevention or timely detection of unauthorized acquisition, use, or disposition of the company’s assets that could have a material effect on the financial statements.
Because of its inherent limitations, internal control over financial reporting may not prevent or detect misstatements. Also, projections of any evaluation of effectiveness to future periods are subject to the risk that controls may become inadequate because of changes in conditions, or that the degree of compliance with the policies or procedures may deteriorate.
As indicated in the accompanying Management’s Report on Internal Control Over Financial Reporting, management’s assessment of and conclusion on the effectiveness of internal control over financial reporting did not include the internal controls of Pacific Pride Services, LLC, FleetCor Deutschland GmbH, and Comdata, Inc., which are included in the 2014 consolidated financial statements of FleetCor Technologies, Inc. and subsidiaries and constituted approximately $4.8 billion of total assets, as of December 31, 2014 and $77 million and $20 million of revenues and net income, respectively, for the year then ended. Our audit of internal control over financial reporting of FleetCor Technologies, Inc. and subsidiaries also did not include an evaluation of the internal control over financial reporting of Pacific Pride Services, LLC, FleetCor Deutschland GmbH, and Comdata, Inc.
In our opinion, FleetCor Technologies, Inc. and subsidiaries maintained, in all material respects, effective internal control over financial reporting as of December 31, 2014,2015, based on the COSO criteria.
We also have audited, in accordance with the standards of the Public Company Accounting Oversight Board (United States), the consolidated balance sheets of FleetCor Technologies, Inc. and subsidiaries as of December 31, 20142015 and 2013,2014, and the related consolidated statements of income, comprehensive income, stockholders’ equity, and cash flows for each of the three years in the period ended December 31, 20142015 of FleetCor Technologies, Inc. and subsidiaries and our report dated March 2, 2015February 29, 2016 expressed an unqualified opinion thereon.
/s/ Ernst & Young LLP
Atlanta, Georgia
March 2, 2015February 29, 2016
FleetCor Technologies, Inc. and Subsidiaries
(In Thousands, Except Share and Par Value Amounts)
| December 31 | December 31, | |||||||||||||||
| 2014 | 2013 | 2015 | 2014 | |||||||||||||
Assets | ||||||||||||||||
Current assets: | ||||||||||||||||
Cash and cash equivalents | $ | 477,069 | $ | 338,105 | $ | 447,152 | $ | 477,069 | ||||||||
Restricted cash | 135,144 | 48,244 | 167,492 | 135,144 | ||||||||||||
Accounts receivable (less allowance for doubtful accounts of $23,842 and $22,416, respectively) | 673,797 | 573,351 | ||||||||||||||
Accounts receivable (less allowance for doubtful accounts of $21,903 and $23,842, respectively) | 638,954 | 673,797 | ||||||||||||||
Securitized accounts receivable—restricted for securitization investors | 675,000 | 349,000 | 614,000 | 675,000 | ||||||||||||
Prepaid expenses and other current assets | 74,889 | 40,062 | 68,661 | 74,889 | ||||||||||||
Deferred income taxes | 101,451 | 4,750 | 8,913 | 101,451 | ||||||||||||
|
|
|
| |||||||||||||
Total current assets | 2,137,350 | 1,353,512 | 1,945,172 | 2,137,350 | ||||||||||||
|
|
|
| |||||||||||||
Property and equipment | 135,062 | 111,100 | 163,569 | 135,062 | ||||||||||||
Less accumulated depreciation and amortization | (61,499 | ) | (57,144 | ) | (82,809 | ) | (61,499 | ) | ||||||||
|
|
|
| |||||||||||||
Net property and equipment | 73,563 | 53,956 | 80,760 | 73,563 | ||||||||||||
Goodwill | 3,811,862 | 1,552,725 | 3,546,034 | 3,713,182 | ||||||||||||
Other intangibles, net | 2,437,367 | 871,263 | 2,183,595 | 2,386,242 | ||||||||||||
Equity method investment | 141,933 | — | 76,568 | 141,933 | ||||||||||||
Other assets | 72,431 | 100,779 | 59,739 | 72,431 | ||||||||||||
|
|
|
| |||||||||||||
Total assets | $ | 8,674,506 | $ | 3,932,235 | $ | 7,891,868 | $ | 8,524,701 | ||||||||
|
|
|
| |||||||||||||
Liabilities and stockholders’ equity | ||||||||||||||||
Current liabilities: | ||||||||||||||||
Accounts payable | $ | 716,676 | $ | 467,202 | $ | 669,528 | $ | 716,676 | ||||||||
Accrued expenses | 178,375 | 114,870 | 150,677 | 178,375 | ||||||||||||
Customer deposits | 492,257 | 182,541 | 507,233 | 492,257 | ||||||||||||
Securitization facility | 675,000 | 349,000 | 614,000 | 675,000 | ||||||||||||
Current portion of notes payable and lines of credit | 749,764 | 662,439 | 261,647 | 749,764 | ||||||||||||
Other current liabilities | 84,546 | 132,846 | 44,936 | 84,546 | ||||||||||||
|
|
|
| |||||||||||||
Total current liabilities | 2,896,618 | 1,908,898 | 2,248,021 | 2,896,618 | ||||||||||||
|
|
|
| |||||||||||||
Notes payable and other obligations, less current portion | 2,168,953 | 474,939 | 2,061,415 | 2,168,953 | ||||||||||||
Deferred income taxes | 815,169 | 249,504 | 713,428 | 799,939 | ||||||||||||
Other noncurrent liabilities | 40,629 | 55,001 | 38,957 | 40,629 | ||||||||||||
|
|
|
| |||||||||||||
Total noncurrent liabilities | 3,024,751 | 779,444 | 2,813,800 | 3,009,521 | ||||||||||||
|
|
|
| |||||||||||||
Commitments and contingencies (Note 13) | ||||||||||||||||
Stockholders’ equity: | ||||||||||||||||
Preferred stock, $0.001 par value; 25,000,000 shares authorized and no shares issued and outstanding at December 31, 2014 and 2013 | — | — | ||||||||||||||
Common stock, $0.001 par value; 475,000,000 shares authorized, 119,771,155 shares issued and 91,662,043 shares outstanding at December 31, 2014; and 118,206,262 shares issued and 82,471,770 shares outstanding at December 31, 2013 | 120 | 117 | ||||||||||||||
Common stock, $0.001 par value; 475,000,000 shares authorized; 120,539,041 shares issued and 92,376,334 shares outstanding at December 31, 2015; and 119,771,155 shares issued and 91,662,043 shares outstanding at December 31, 2014 | 121 | 120 | ||||||||||||||
Additional paid-in capital | 1,852,442 | 631,667 | 1,988,917 | 1,852,442 | ||||||||||||
Retained earnings | 1,403,905 | 1,035,198 | 1,766,336 | 1,403,905 | ||||||||||||
Accumulated other comprehensive loss | (156,933 | ) | (47,426 | ) | (570,811 | ) | (291,508 | ) | ||||||||
Less treasury stock (28,109,112 shares at December 31, 2014 and 35,734,492 shares at December 31, 2013) | (346,397 | ) | (375,663 | ) | ||||||||||||
Less treasury stock (28,162,706 shares at December 31, 2015; and 28,109,112 shares at December 31, 2014) | (354,516 | ) | (346,397 | ) | ||||||||||||
|
|
|
| |||||||||||||
Total stockholders’ equity | 2,753,137 | 1,243,893 | 2,830,047 | 2,618,562 | ||||||||||||
|
|
|
| |||||||||||||
Total liabilities and stockholders’ equity | $ | 8,674,506 | $ | 3,932,235 | $ | 7,891,868 | $ | 8,524,701 | ||||||||
|
|
|
| |||||||||||||
See accompanying notes.
FleetCor Technologies, Inc. and Subsidiaries
Consolidated Statements of Income
(In Thousands, Except Per Share Amounts)
| Year Ended December 31 | Year Ended December 31, | |||||||||||||||||||||||
| 2014 | 2013 | 2012 | 2015 | 2014 | 2013 | |||||||||||||||||||
Revenues, net | $ | 1,199,390 | $ | 895,171 | $ | 707,534 | $ | 1,702,865 | $ | 1,199,390 | $ | 895,171 | ||||||||||||
Expenses: | ||||||||||||||||||||||||
Merchant commissions | 96,254 | 68,143 | 58,573 | 108,257 | 96,254 | 68,143 | ||||||||||||||||||
Processing | 173,337 | 134,030 | 115,446 | 331,073 | 173,337 | 134,030 | ||||||||||||||||||
Selling | 75,527 | 57,346 | 46,429 | 109,075 | 75,527 | 57,346 | ||||||||||||||||||
General and administrative | 205,963 | 142,283 | 110,122 | 297,715 | 205,963 | 142,283 | ||||||||||||||||||
Depreciation and amortization | 112,361 | 72,737 | 52,036 | 193,453 | 112,361 | 72,737 | ||||||||||||||||||
Other operating, net | (29,501 | ) | — | — | (4,242 | ) | (29,501 | ) | — | |||||||||||||||
|
|
|
|
|
| |||||||||||||||||||
Operating income | 565,449 | 420,632 | 324,928 | 667,534 | 565,449 | 420,632 | ||||||||||||||||||
|
|
|
|
|
| |||||||||||||||||||
Other (income) expense, net | (700 | ) | 602 | 1,121 | ||||||||||||||||||||
Equity method investment loss | 8,586 | — | — | 57,668 | 8,586 | — | ||||||||||||||||||
Other expense (income), net | 2,523 | (700 | ) | 602 | ||||||||||||||||||||
Interest expense, net | 28,856 | 16,461 | 13,017 | 71,339 | 28,856 | 16,461 | ||||||||||||||||||
Loss on early extinguishment of debt | 15,764 | — | — | — | 15,764 | — | ||||||||||||||||||
|
|
|
|
|
| |||||||||||||||||||
Total other expense | 52,506 | 17,063 | 14,138 | 131,530 | 52,506 | 17,063 | ||||||||||||||||||
|
|
|
|
|
| |||||||||||||||||||
Income before income taxes | 512,943 | 403,569 | 310,790 | 536,004 | 512,943 | 403,569 | ||||||||||||||||||
Provision for income taxes | 144,236 | 119,068 | 94,591 | 173,573 | 144,236 | 119,068 | ||||||||||||||||||
|
|
|
|
|
| |||||||||||||||||||
Net income | $ | 368,707 | $ | 284,501 | $ | 216,199 | $ | 362,431 | $ | 368,707 | $ | 284,501 | ||||||||||||
|
|
|
|
|
| |||||||||||||||||||
Earnings per share: | ||||||||||||||||||||||||
Basic earnings per share | $ | 4.37 | $ | 3.48 | $ | 2.59 | $ | 3.94 | $ | 4.37 | $ | 3.48 | ||||||||||||
|
|
|
|
|
| |||||||||||||||||||
Diluted earnings per share | $ | 4.24 | $ | 3.36 | $ | 2.52 | $ | 3.85 | $ | 4.24 | $ | 3.36 | ||||||||||||
|
|
|
|
|
| |||||||||||||||||||
Weighted average shares outstanding: | ||||||||||||||||||||||||
Basic weighted average shares outstanding | 84,317 | 81,793 | 83,328 | 92,023 | 84,317 | 81,793 | ||||||||||||||||||
|
|
|
|
|
| |||||||||||||||||||
Diluted weighted average shares outstanding | 86,982 | 84,655 | 85,736 | 94,139 | 86,982 | 84,655 | ||||||||||||||||||
|
|
|
|
|
| |||||||||||||||||||
See accompanying notes.
FleetCor Technologies, Inc. and Subsidiaries
Consolidated Statements of Comprehensive Income
(In Thousands)
| Year Ended December 31 | ||||||||||||
| 2014 | 2013 | 2012 | ||||||||||
Net income | $ | 368,707 | $ | 284,501 | $ | 216,199 | ||||||
Other comprehensive (loss) income: | ||||||||||||
Foreign currency translation adjustment (loss) gain, net of tax | (109,507 | ) | (44,080 | ) | 10,370 | |||||||
|
|
|
|
|
| |||||||
Total other comprehensive (loss) income | (109,507 | ) | (44,080 | ) | 10,370 | |||||||
|
|
|
|
|
| |||||||
Total comprehensive income | $ | 259,200 | $ | 240,421 | $ | 226,569 | ||||||
|
|
|
|
|
| |||||||
| Year Ended December 31, | ||||||||||||
| 2015 | 2014 | 2013 | ||||||||||
Net income | $ | 362,431 | $ | 368,707 | $ | 284,501 | ||||||
Other comprehensive loss: | ||||||||||||
Foreign currency translation loss, net of tax | (279,303 | ) | (223,691 | ) | (64,471 | ) | ||||||
|
|
|
|
|
| |||||||
Total other comprehensive loss | (279,303 | ) | (223,691 | ) | (64,471 | ) | ||||||
|
|
|
|
|
| |||||||
Total comprehensive income | $ | 83,128 | $ | 145,016 | $ | 220,030 | ||||||
|
|
|
|
|
| |||||||
See accompanying notes.
FleetCor Technologies, Inc. and Subsidiaries
Consolidated Statements of Stockholders’ Equity
(In Thousands)
| Common Stock | Additional Paid-In Capital | Retained Earnings | Treasury Stock | Accumulated Other Comprehensive (Loss) Income | Total | |||||||||||||||||||||||||||||||||||||||||||
Balance at December 31, 2011 | $ | 114 | $ | 466,203 | $ | 534,498 | $ | (175,663 | ) | $ | (13,716 | ) | $ | 811,436 | ||||||||||||||||||||||||||||||||||
Net income | — | — | 216,199 | — | — | 216,199 | ||||||||||||||||||||||||||||||||||||||||||
Other comprehensive income from currency exchange, net of tax of $0 | — | — | — | — | 10,370 | 10,370 | ||||||||||||||||||||||||||||||||||||||||||
| ||||||||||||||||||||||||||||||||||||||||||||||||
Total comprehensive income | 226,569 | |||||||||||||||||||||||||||||||||||||||||||||||
Repurchase of common stock | — | — | — | (200,000 | ) | — | (200,000 | ) | ||||||||||||||||||||||||||||||||||||||||
Issuance of common stock | 2 | 75,815 | — | — | — | 75,817 | ||||||||||||||||||||||||||||||||||||||||||
|
|
|
|
|
| Common Stock | Additional Paid-In Capital | Retained Earnings | Accumulated Other Comprehensive Loss | Treasury Stock | Total | |||||||||||||||||||||||||||||||||||||
Balance at December 31, 2012 | 116 | 542,018 | 750,697 | (375,663 | ) | (3,346 | ) | 913,822 | $ | 116 | $ | 542,018 | $ | 750,697 | $ | (3,346 | ) | $ | (375,663 | ) | $ | 913,822 | ||||||||||||||||||||||||||
Net income | — | — | 284,501 | — | — | 284,501 | — | — | 284,501 | — | — | 284,501 | ||||||||||||||||||||||||||||||||||||
Other comprehensive loss from currency exchange, net of tax of $186 | — | — | — | — | (44,080 | ) | (44,080 | ) | ||||||||||||||||||||||||||||||||||||||||
| ||||||||||||||||||||||||||||||||||||||||||||||||
Total comprehensive income | 240,421 | |||||||||||||||||||||||||||||||||||||||||||||||
Other comprehensive loss, net of tax of $186 | — | — | — | (64,471 | ) | — | (64,471 | ) | ||||||||||||||||||||||||||||||||||||||||
Issuance of common stock | 1 | 89,649 | — | — | — | 89,650 | 1 | 89,649 | — | — | — | 89,650 | ||||||||||||||||||||||||||||||||||||
|
|
|
|
|
|
|
|
|
|
|
| |||||||||||||||||||||||||||||||||||||
Balance at December 31, 2013 | 117 | 631,667 | 1,035,198 | (375,663 | ) | (47,426 | ) | 1,243,893 | 117 | 631,667 | 1,035,198 | (67,817 | ) | (375,663 | ) | 1,223,502 | ||||||||||||||||||||||||||||||||
Net income | — | — | 368,707 | — | — | 368,707 | — | — | 368,707 | — | — | 368,707 | ||||||||||||||||||||||||||||||||||||
Other comprehensive loss from currency exchange, net of tax of $4 | — | — | — | — | (109,507 | ) | (109,507 | ) | ||||||||||||||||||||||||||||||||||||||||
| ||||||||||||||||||||||||||||||||||||||||||||||||
Total comprehensive income | 259,200 | |||||||||||||||||||||||||||||||||||||||||||||||
Other comprehensive loss, net of tax of $4 | — | — | — | (223,691 | ) | — | (223,691 | ) | ||||||||||||||||||||||||||||||||||||||||
Issuance of treasury stock | — | 1,096,698 | — | 29,266 | — | 1,125,964 | — | 1,096,698 | — | — | 29,266 | 1,125,964 | ||||||||||||||||||||||||||||||||||||
Issuance of common stock | 3 | 124,077 | — | — | — | 124,080 | 3 | 124,077 | — | — | — | 124,080 | ||||||||||||||||||||||||||||||||||||
|
|
|
|
|
|
|
|
|
|
|
| |||||||||||||||||||||||||||||||||||||
Balance at December 31, 2014 | $ | 120 | $ | 1,852,442 | $ | 1,403,905 | $ | (346,397 | ) | $ | (156,933 | ) | $ | 2,753,137 | 120 | 1,852,442 | 1,403,905 | (291,508 | ) | (346,397 | ) | 2,618,562 | ||||||||||||||||||||||||||
Net income | — | — | 362,431 | — | — | 362,431 | ||||||||||||||||||||||||||||||||||||||||||
Other comprehensive loss, net of tax of $0 | — | — | — | (279,303 | ) | — | (279,303 | ) | ||||||||||||||||||||||||||||||||||||||||
Issuance of treasury stock | — | — | — | — | (8,119 | ) | (8,119 | ) | ||||||||||||||||||||||||||||||||||||||||
Issuance of common stock | 1 | 136,475 | — | — | — | 136,476 | ||||||||||||||||||||||||||||||||||||||||||
|
|
|
|
|
|
|
|
|
|
|
| |||||||||||||||||||||||||||||||||||||
Balance at December 31, 2015 | $ | 121 | $ | 1,988,917 | $ | 1,766,336 | $ | (570,811 | ) | $ | (354,516 | ) | $ | 2,830,047 | ||||||||||||||||||||||||||||||||||
|
|
|
|
|
| |||||||||||||||||||||||||||||||||||||||||||
See accompanying notes.
FleetCor Technologies, Inc. and Subsidiaries
Consolidated Statements of Cash Flows
(In Thousands)
| Year Ended December 31 | Year Ended December 31, | |||||||||||||||||||||||
| 2014 | 2013 | 2012 | 2015 | 2014 | 2013 | |||||||||||||||||||
Operating activities | ||||||||||||||||||||||||
Net income | $ | 368,707 | $ | 284,501 | $ | 216,199 | $ | 362,431 | $ | 368,707 | $ | 284,501 | ||||||||||||
Adjustments to reconcile net income to net cash provided by operating activities: | ||||||||||||||||||||||||
Depreciation | 21,097 | 16,885 | 14,116 | 30,462 | 21,097 | 16,885 | ||||||||||||||||||
Stock-based compensation | 37,649 | 26,676 | 19,275 | 90,122 | 37,649 | 26,676 | ||||||||||||||||||
Provision for losses on accounts receivable | 24,412 | 18,867 | 21,896 | 24,629 | 24,412 | 18,867 | ||||||||||||||||||
Amortization of deferred financing costs | 2,796 | 3,276 | 2,279 | |||||||||||||||||||||
Amortization of deferred financing costs and discounts | 7,049 | 2,796 | 3,276 | |||||||||||||||||||||
Loss on extinguishment of debt | 15,764 | — | — | — | 15,764 | — | ||||||||||||||||||
Amortization of intangible assets | 86,149 | 49,313 | 32,376 | 159,740 | 86,149 | 49,313 | ||||||||||||||||||
Amortization of premium on receivables | 3,259 | 3,263 | 3,265 | 3,250 | 3,259 | 3,263 | ||||||||||||||||||
Deferred income taxes | (41,716 | ) | (5,453 | ) | (3,337 | ) | 30,626 | 41,716 | (5,453 | ) | ||||||||||||||
Equity method investment loss | 8,586 | — | — | 57,668 | 8,586 | — | ||||||||||||||||||
Fair value adjustment for contingent consideration arrangements | (27,501 | ) | — | — | ||||||||||||||||||||
Other non-cash operating expenses | (4,242 | ) | (27,501 | ) | — | |||||||||||||||||||
Changes in operating assets and liabilities (net of acquisitions): | ||||||||||||||||||||||||
Restricted cash | 6,625 | 5,430 | 2,088 | (35,676 | ) | 6,625 | 5,430 | |||||||||||||||||
Accounts receivable | 246,465 | (45,005 | ) | (71,102 | ) | 40,017 | 246,465 | (45,005 | ) | |||||||||||||||
Prepaid expenses and other current assets | 2,820 | (74 | ) | (6,847 | ) | (12,564 | ) | 2,820 | (74 | ) | ||||||||||||||
Other assets | 12,455 | 38,906 | (46,553 | ) | (2,524 | ) | 12,455 | 38,906 | ||||||||||||||||
Excess tax benefits related to stock-based compensation | (56,790 | ) | (32,535 | ) | (29,355 | ) | (26,427 | ) | (56,790 | ) | (32,535 | ) | ||||||||||||
Accounts payable, accrued expenses, and customer deposits | (102,443 | ) | 11,635 | (18,840 | ) | |||||||||||||||||||
Accounts payable, accrued expenses and customer deposits | 30,023 | (185,875 | ) | 11,635 | ||||||||||||||||||||
|
|
|
|
|
| |||||||||||||||||||
Net cash provided by operating activities | 608,334 | 375,685 | 135,460 | 754,584 | 608,334 | 375,685 | ||||||||||||||||||
|
|
|
|
|
| |||||||||||||||||||
Investing activities | ||||||||||||||||||||||||
Acquisitions, net of cash acquired | (2,567,017 | )1 | (728,343 | ) | (190,447 | ) | (57,539 | ) | (2,567,017 | )1 | (728,343 | ) | ||||||||||||
Purchases of property and equipment | (27,070 | ) | (20,785 | ) | (19,111 | ) | (41,875 | ) | (27,070 | ) | (20,785 | ) | ||||||||||||
|
|
|
|
|
| |||||||||||||||||||
Net cash used in investing activities | (2,594,087 | ) | (749,128 | ) | (209,558 | ) | (99,414 | ) | (2,594,087 | ) | (749,128 | ) | ||||||||||||
|
|
|
|
|
| |||||||||||||||||||
Financing activities | ||||||||||||||||||||||||
Excess tax benefits related to stock-based compensation | 56,790 | 32,535 | 29,355 | 26,427 | 56,790 | 32,535 | ||||||||||||||||||
Repurchase of common stock | — | — | (200,000 | ) | ||||||||||||||||||||
Proceeds from issuance of common stock | 29,641 | 30,438 | 27,187 | 19,926 | 29,641 | 30,438 | ||||||||||||||||||
Borrowings on securitization facility, net | 326,000 | 51,000 | 18,000 | (61,000 | ) | 326,000 | 51,000 | |||||||||||||||||
Deferred financing costs paid | (43,943 | ) | (1,970 | ) | (3,776 | ) | — | (43,943 | ) | (1,970 | ) | |||||||||||||
Proceeds from notes payable | 2,320,000 | — | 250,000 | — | 2,320,000 | — | ||||||||||||||||||
Principal payments on notes payable | (546,875 | ) | (28,125 | ) | (30,414 | ) | (103,500 | ) | (546,875 | ) | (28,125 | ) | ||||||||||||
Borrowings from revolver- A Facility | 807,330 | 783,663 | 455,000 | |||||||||||||||||||||
Payments on revolver- A Facility | (783,600 | ) | (261,516 | ) | (480,000 | ) | ||||||||||||||||||
Borrowings from foreign revolver- B Facility | — | 16,715 | — | |||||||||||||||||||||
Payments on foreign revolver- B Facility | (7,337 | ) | (8,552 | ) | — | |||||||||||||||||||
Borrowings from revolver —A Facility | — | 807,330 | 783,663 | |||||||||||||||||||||
Payments on revolver —A Facility | (486,818 | ) | (783,600 | ) | (261,516 | ) | ||||||||||||||||||
Borrowings from foreign revolver —B Facility | — | — | 16,715 | |||||||||||||||||||||
Payments on foreign revolver —B Facility | — | (7,337 | ) | (8,552 | ) | |||||||||||||||||||
Payments on acquired debt | — | (164,083 | ) | — | — | — | (164,083 | ) | ||||||||||||||||
Borrowings from swing line of credit, net | 4,990 | — | (1,874 | ) | (546 | ) | 4,990 | — | ||||||||||||||||
Payment of contingent consideration | (42,177 | ) | — | — | ||||||||||||||||||||
Other | (731 | ) | (14,380 | ) | (1,490 | ) | (377 | ) | (731 | ) | (14,380 | ) | ||||||||||||
|
|
|
|
|
| |||||||||||||||||||
Net cash provided by financing activities | 2,162,265 | 435,725 | 61,988 | |||||||||||||||||||||
Net cash (used in) provided by financing activities | (648,065 | ) | 2,162,265 | 435,725 | ||||||||||||||||||||
|
|
|
|
|
| |||||||||||||||||||
Effect of foreign currency exchange rates on cash | (37,548 | ) | (7,826 | ) | 10,600 | (37,022 | ) | (37,548 | ) | (7,826 | ) | |||||||||||||
|
|
|
|
|
| |||||||||||||||||||
Net increase (decrease) in cash | 138,964 | 54,456 | (1,510 | ) | ||||||||||||||||||||
Cash and cash equivalents at beginning of year | 338,105 | 283,649 | 285,159 | |||||||||||||||||||||
Net (decrease) increase in cash | (29,917 | ) | 138,964 | 54,456 | ||||||||||||||||||||
Cash and cash equivalents, beginning of year | 477,069 | 338,105 | 283,649 | |||||||||||||||||||||
|
|
|
|
|
| |||||||||||||||||||
Cash and cash equivalents at end of year | $ | 477,069 | $ | 338,105 | $ | 283,649 | ||||||||||||||||||
Cash and cash equivalents, end of year | $ | 447,152 | $ | 477,069 | $ | 338,105 | ||||||||||||||||||
|
|
|
|
|
| |||||||||||||||||||
Supplemental cash flow information | ||||||||||||||||||||||||
Cash paid for interest | $ | 29,098 | $ | 25,886 | $ | 14,760 | $ | 72,537 | $ | 29,098 | $ | 25,886 | ||||||||||||
|
|
|
|
|
| |||||||||||||||||||
Cash paid for income taxes | $ | 79,124 | $ | 99,308 | $ | 38,169 | $ | 83,380 | $ | 79,124 | $ | 99,308 | ||||||||||||
|
|
|
|
|
| |||||||||||||||||||
| 1 | Amounts reported in acquisitions and investment, net of cash acquired, includes debt assumed and immediately repaid in acquisitions. |
See accompanying notes.
FleetCor Technologies, Inc. and Subsidiaries
Notes to the Consolidated Financial Statements
December 31, 20142015
1. Description of Business
FleetCor Technologies, Inc. and its subsidiaries (the Company) is a leading independent global provider of fuel cards, commercial payment and data solutions, stored value solutions, and workforce payment products and services to businesses, retailers, commercial fleets, major oil companies, petroleum marketers and government entities in countries throughout North America, Latin America, Europe, Australia and New Zealand. The Company’s payment programs enable its customers to better manage and control their commercial payments, card programs, and employee spending and provide card-accepting merchants with a high volume customer base that can increase their sales and customer loyalty. The Company also provides a suite of fleet related and workforce payment solution products, including a mobile telematics service, fleet maintenance management and employee benefit and transportation related payments.
The Company provides its payment products and services in a variety of combinations to create customized payment solutions for customers and partners. The Company sells a range of customized fleet and lodging payment programs directly and indirectly to our customers through partners, such as major oil companies, leasing companies and petroleum marketers. The Company refers to these major oil companies, leasing companies, petroleum marketers, value-added resellers (VARs) and other referral partners with whom we have strategic relationships as our “partners.” The Company provides customers with various card products that typically function like a charge card to purchase fuel, lodging, food, toll, transportation and related products and services at participating locations.
The Company supports our products with specialized issuing, processing and information services that enables the Company to manage card accounts, facilitate the routing, authorization, clearing and settlement of transactions, and provide value-added functionality and data, including customizable card-level controls and productivity analysis tools. In order to deliver payment programs and services and process transactions, the Company owns and operates proprietary “closed-loop” networks through which the Company electronically connects to merchants and captures, analyzes and reports customized information in North America and internationally. The Company also uses third-party networks to deliver payment programs and services in order to broaden card acceptance and use. To support our payment products, the Company also provides a range of services, such as issuing and processing, as well as specialized information services that provide our customers with value-added functionality and data. Customers can use this data to track important business productivity metrics, combat fraud and employee misuse, streamline expense administration and lower overall workforce and fleet operating costs. Depending on customer’s and partner’s needs, the Company provides these services in a variety of outsourced solutions ranging from a comprehensive “end-to-end” solution (encompassing issuing, processing and network services) to limited back office processing services.
The Company’s reportable segments, North America and International, reflect the Company’s global organization. In North America, the Company sells a fuel card product, commercial payment and data solutions, lodging and transportation management services, gift card and stored value solutions, as well as a fleet telematics offering, which allows customers to track the location of mobile workers in field-based businesses, primarily to small and mid-sized fleets, as well as over-the-road trucking fleets. The Company also provides lodging and transportation management services in North America.offering. In its International segment, the Company provides smallfuel card and mid-sized fleets withrelated fuel cards to controlservices, work force payment and manage spending. Additionally, the Company provides a similar fuel product in its International segment to over-the-road trucking fleets, shipping fleets and other operators of heavily industrialized equipment, that when utilized at the fueling site and by the vehicle, significantly reduces the likelihood of unauthorized and fraudulent transactions and allows fleet owners to monitor and control fuel consumption. The Company also provides a vehicle maintenance service offering in its International segment that helps fleet customers to better manage their vehicle maintenance, service, and
repair needs. Furthermore, the Company also provides prepaid fuel, transportation, toll and food vouchers and cards internationally that may be used as a form of payment in restaurants, grocery stores, gas stations, public transportation and toll roads.
In 2014, the Company processed approximately 652 million transactions on our proprietary networks and third-party networks (which includes approximately 270 million transactions related to our SVS product, acquired with Comdata).management solutions.
2. Summary of Significant Accounting Policies
Revenue Recognition and Presentation
Revenue is derived from the Company’s merchant and network relationships as well as from customers and partners. The Company recognizes revenue on fees generated through services to commercial fleets, commercial
businesses, major oil companies, petroleum marketers and leasing companies and records revenue net of the wholesale cost of the underlying products and services based on the following: (i) the Company is not the primary obligor in the arrangement and is not responsible for fulfillment and the acceptability of the product; (ii) the Company has no inventory risk, does not bear the risk of product loss and does not make any changes to the product or have any involvement in the product specifications; (iii) the Company does not have significant latitude with respect to establishing the price for the product (predominantly fuel); and (iv) the amount the Company earns for services is fixed, within a limited range.
Through the Company’s merchant and network relationships the Company provides fuel, prepaid cards, vehicle maintenance, lodging, food, toll, and transportation related services to our customers. The Company derives revenue from its merchant and network relationships based on the difference between the price charged to a customer for a transaction and the price paid to the merchant or network for the same transaction. The Company’s net revenue consists of margin on sales and fees for technical support, processing, communications and reporting. The price paid to a merchant or network may be calculated as (i) the merchant’s wholesale cost of the product plus a markup; (ii) the transaction purchase price less a percentage discount; or (iii) the transaction purchase price less a fixed fee per unit. The difference between the price the Company pays to a merchant and the merchant’s wholesale cost for the underlying products and services is considered a merchant commission and is recognized as expense when the fuel purchase transaction is executed. The Company recognizes revenue from merchant and network relationships when persuasive evidence of an arrangement exists, the services have been provided to the customer, the sales price is fixed or determinable and collectability is reasonably assured. The Company has entered into agreements with major oil companies, petroleum marketers and leasing companies, among others, that specify that a transaction is deemed to be captured when we have validated that the transaction has no errors and have accepted and posted the data to the Company’s records.
The Company also derives revenue from customers and partners from a variety of program fees including transaction fees, card fees, network fees, report fees and other transaction-based fees, which typically are calculated based on measures such as percentage of dollar volume processed, number of transactions processed, or some combination thereof. Such services are provided through proprietary networks or through the use of third-party networks. Transaction fees and other transaction-based fees generated from the Company’s proprietary networks and third-party networks are recognized at the time the transaction is captured. Card fees, network fees and program fees are recognized as the Company fulfills its contractual service obligations. In addition, the Company recognizes revenue from late fees and finance charges.charges, in jurisdictions where permitted under local regulations, primarily in the U.S. and Canada. Such fees are recognized net of a provision for estimated uncollectible amounts, at the time the fees and finance charges are assessed and services are provided. The Company ceases billing and accruing for late fees and finance charges approximately 30-40 days after the customer’s balance becomes delinquent.
The Company also charges its customers transaction fees to load value onto prepaid fuel, food, toll and transportation vouchers and cards. The Company recognizes fee revenue upon providing the activated fuel, food, toll and transportation vouchers and prepaid cards to the customer. Revenue is recognized from the processing arrangements with merchants when persuasive evidence of an arrangement exists, the services have been
provided, the sales price is fixed or determinable and collectability is reasonably assured. Revenue is recognized on lodging and transportation management services when the lodging stay or transportation service is completed. Revenue is also derived from the sale of equipment in certain of the Company’s businesses, which is recognized at the time the device is sold and the risks and rewards of ownership have passed. This revenue is recognized gross of the cost of sales related to the equipment in revenues, net within the consolidated statements of income. The related cost of sales for the equipment is recorded within processing expenses. The Company has recorded $15.1$84.1 million, $13.2 million and $9.3$7.1 million of expenses related to sales of equipment within the processing expenses line of the consolidated statements of income for the year ended December 31, 2015, 2014 and 2013, respectively.
The Company’s fiscal year ends on December 31. In certain of the Company’s U.K. businesses, the Company records the operating results using a 4-4-5 week accounting cycle with the fiscal year ending on the Friday on or immediately preceding December 31. Fiscal years 2014 and 2012 include 52 weeks for the businesses reporting using a 4-4-5 accounting cycle. Fiscal year 2013 included 53 weeks for business reporting using a 4-4-5 accounting cycle.
The Company delivers both stored value cards and card-based services primarily in the form of gift cards. For multiple-deliverable customer contracts, stored value cards and card-based services are separated into two units of accounting. StoreStored valued cards are generally recognized upon shipment to the customer. Card-based services are recognized when the card services are rendered.
Use of Estimates
The preparation of consolidated financial statements in conformity with accounting principles generally accepted in the United States requires management to make estimates and assumptions that affect the reported amounts of assets and liabilities and disclosure of contingent assets and liabilities at the date of the consolidated financial statements and the reported amounts of revenues and expenses during the reporting period. Actual results could differ from those estimates.
Principles of Consolidation
The accompanying consolidated financial statements include the accounts of FleetCor Technologies, Inc. and all of its wholly owned subsidiaries. All significant intercompany balances and transactions have been eliminated.
The Company’s fiscal year ends on December 31. In certain of the Company’s U.K. businesses, the Company records the operating results using a 4-4-5 week accounting cycle with the fiscal year ending on the Friday on or immediately preceding December 31. Fiscal years 2015 and 2014 include 52 weeks for the businesses reporting using a 4-4-5 accounting cycle. Fiscal year 2013 included 53 weeks for business reporting using a 4-4-5 accounting cycle.
Credit Risk and Reserve for Losses on Receivables
The Company controls credit risk by performing periodic credit evaluations of its customers. Payments from customers are generally due within 14 days of billing. The Company routinely reviews its accounts receivable balances and makes provisions for probable doubtful accounts based primarily on the aging of those balances. Accounts receivable are deemed uncollectible once they age past 90 days and are deemed uncollectible from the customer. The Company also provides an allowance for receivables aged less than 90 days that it expects will be uncollectible based on historical collections experience including accounts that have filed for bankruptcy. At December 31, 2015 and 2014, approximately 98% of outstanding accounts receivable were current. Accounts receivable deemed uncollectible are removed from accounts receivable and the allowance for doubtful accounts when internal collection efforts have been exhausted and accounts have been turned over to a third-party collection agency. Recoveries from the third-party collection agency are not significant.
Business Combinations
Business combinations completed by the Company have been accounted for under the acquisition method of accounting. The acquisition method requires that the acquired assets and liabilities, including contingencies, be recorded at fair value determined on the acquisition date and changes thereafter reflected in income. For significant acquisitions, the Company obtains independent third partythird-party valuation studies for certain of the assets acquired and liabilities assumed to assist the Company in determining fair value. Goodwill represents the excess of the purchase price over the fair values of the tangible and intangible assets acquired and liabilities assumed. The estimation of the fair values of the assets acquired and liabilities assumed involves a number of estimates and assumptions that could differ materially from the actual amounts recorded. The results of the acquired businesses are included in the Company’s results of operations beginning from the completion date of the applicable transaction.
Estimates of fair value are revised during an allocation period as necessary when, and if, information becomes available to further define and quantify the fair value of the assets acquired and liabilities assumed. The
allocation period does not exceed one year from the date of the acquisition. To the extent additional information to refine the original allocation becomes available during the allocation period, the allocation of the purchase price is adjusted. Should information become available after the allocation period, those items are adjusted through operating results. The direct costs of the acquisition are recorded as operating expenses. Certain acquisitions include contingent consideration related to the performance of the acquired operations following the acquisition. Contingent consideration is recorded at estimated fair value at the date of the acquisition, and is remeasured each reporting period, with any changes in fair value recorded in the consolidated statements of income. The Company estimates the fair value of the acquisition-related contingent consideration using various valuation approaches, as well as significant unobservable inputs, reflecting the Company’s assessment of the assumptions market participants would use to value these liabilities.
Impairment of Long-Lived Assets, Goodwill, Intangibles and IntangiblesEquity Method Investment
The Company tests its long-lived assets for impairment in accordance with relevant authoritative guidance. The Company evaluates if impairment indicators related to its property, plant and equipment and other long-lived assets are present. These impairment indicators may include a significant decrease in the market price of a long-lived asset or asset group, a significant adverse change in the extent or manner in which a long-lived asset or asset group is being used or in its physical condition, or a current-period operating or cash flow loss combined with a history of operating or cash flow losses or a forecast that demonstrates continuing losses associated with the use of a long-lived asset or asset group. If impairment indicators are present, the Company estimates the future cash flows for the asset or asset group. The sum of the undiscounted future cash flows attributable to the asset or asset group is compared to its carrying amount. The cash flows are estimated utilizing various projections of revenues and expenses, working capital and proceeds from asset disposals on a basis consistent with management’s intended actions. If the carrying amount exceeds the sum of the undiscounted future cash flows, the Company determines the assets’ fair value by discounting the future cash flows using a discount rate required for a similar investment of like risk and records an impairment charge as the difference between the fair value and the carrying value of the asset group. Generally, the Company performs its testing of the asset group at the business-line level, as this is the lowest level for which identifiable cash flows are available.
The Company completes an asset impairment test of goodwill at least annually or more frequently if facts or circumstances indicate that goodwill might be impaired. Goodwill is tested for impairment at the reporting unit level, and the impairment test consists of two steps, as well as a qualitative assessment, as appropriate. The Company as appropriate, has performed a qualitative assessment of certain of its reporting units. In this qualitative assessment, the Company individually considered the following items for each reporting unit where the Company determined a qualitative analysis to be appropriate: the macroeconomic conditions, including any deterioration of general conditions, limitations on accessing capital, fluctuations in foreign exchange rates and other developments in equity and credit markets; industry and market conditions, including any deterioration in the environment where the reporting unit operates, increased competition, changes in the products/services and regulator and political developments; cost of doing business; overall financial performance, including any declining cash flows and performance in relation to planned revenues and earnings in past periods; other relevant reporting unit specific facts, such as changes in management or key personnel or pending litigation; events affecting the reporting unit, including changes in the carrying value of net assets, likelihood of disposal and whether there were any other impairment considerations within the business; the overall performance of our share price in relation to the market and our peers; and a quantitative stress test of the previously completed step 1 test from the prior year, updated with current year results, weighted-average cost of capital rates and future projections.
The Company completed step 1 of the goodwill impairment testing for certain of our reporting units for which the qualitative assessment was not performed. In this first step, the reporting unit’s carrying amount, including goodwill, is compared to its fair value which is measured based upon, among other factors, a discounted cash
flow analysis, as well as market multiples for comparable companies. If the carrying amount of the reporting unit is greater than its fair value, goodwill is considered impaired and step two must be performed. Step two measures the impairment loss by comparing the implied fair value of reporting unit goodwill with the carrying amount of that
goodwill. The implied fair value of goodwill is determined by allocating the fair value of the reporting unit to all the assets and liabilities of that unit (including unrecognized intangibles) as if the reporting unit had been acquired in a business combination. The excess of fair value over the amounts allocated to the assets and liabilities of the reporting unit is the implied fair value of goodwill. The excess of the carrying amount over the implied fair value is the impairment loss.
The Company estimated the fair value of its reporting units using a combination of the income approach and the market approach. The income approach utilizes a discounted cash flow model incorporating management’s expectations for future revenue, operating expenses, earnings before interest, taxes, depreciation and amortization, capital expenditures and an anticipated tax rate. The Company discounted the related cash flow forecasts using an estimated weighted-average cost of capital for each reporting unit at the date of valuation. The market approach utilizes comparative market multiples in the valuation estimate. Multiples are derived by relating the value of guideline companies, based on either the market price of publicly traded shares or the prices of companies being acquired in the marketplace, to various measures of their earnings and cash flow. Such multiples are then applied to the historical and projected earnings and cash flow of the reporting unit in developing the valuation estimate.
Preparation of forecasts and the selection of the discount rates involve significant judgments about expected future business performance and general market conditions. Significant changes in forecasts, the discount rates selected or the weighting of the income and market approach could affect the estimated fair value of one or more of our reporting units and could result in a goodwill impairment charge in a future period.
Based on the goodwill asset impairment analysis performed quantitatively and qualitatively on October 1, 2014,2015, the Company determined that the fair value of each of our reporting units iswas in excess of the carrying value. No events or changes in circumstances have occurred since the date of this most recent annual impairment test that would more likely than not reduce the fair value of a reporting unit below its carrying amount.
The Company also evaluates indefinite-lived intangible assets (primarily trademarks and trade names) for impairment annually. The Company also tests for impairment if events and circumstances indicate that it is more likely than not that the fair value of an indefinite-lived intangible asset is below its carrying amount. Estimates critical to the Company’s evaluation of indefinite-lived intangible assets for impairment include the discount rate, royalty rates used in its evaluation of trade names, projected average revenue growth and projected long-term growth rates in the determination of terminal values. An impairment charge is recorded if the carrying amount of an indefinite-lived intangible asset exceeds the estimated fair value on the measurement date.
The Company regularly evaluates the carrying value of its equity method investment, which is not carried at fair value, for other-than-temporary impairment. The Company estimates the fair value of its equity method investment using a combination of the income approach and the market approach. The income approach utilizes a discounted cash flow model incorporating management’s expectations for future revenue, operating expenses, earnings before interest, taxes, depreciation and amortization, capital expenditures and an anticipated tax rate. The Company discounts the related cash flow forecasts using an estimated weighted-average cost of capital for each reporting unit at the date of valuation. The market approach utilizes comparative market multiples in the valuation estimate. Multiples are derived by relating the value of guideline companies, based on either the market price of publicly traded shares or the prices of companies being acquired in the marketplace, to various measures of their earnings and cash flow. Such multiples are then applied to the historical and projected earnings and cash flow of our equity method investment in developing the valuation estimate. During the fourth quarter of 2015, the Company determined that the performance improvement initiatives in its equity method investment in Masternaut will take longer to implement than originally projected. As a result, the Company has recorded a $40 million non-cash impairment charge in its equity method investment.
Property, Plant and Equipment and Definite-Lived Intangible Assets
Property, plant and equipment are stated at cost and depreciated on the straight-line basis. Definite-lived intangible assets, consisting primarily of customer relationships, are stated at fair value upon acquisition and are amortized over their estimated useful lives. Customer and merchant relationship useful lives are estimated using historical attrition rates.
The Company develops software that is used in providing processing and information management services to customers. A significant portion of the Company’s capital expenditures are devoted to the development of such internal-use computer software. Software development costs are capitalized once technological feasibility of the software has been established. Costs incurred prior to establishing technological feasibility are expensed as incurred. Technological feasibility is established when the Company has completed all planning, designing, coding and testing activities that are necessary to determine that the software can be produced to meet its design specifications, including functions, features and technical performance requirements. Capitalization of costs ceases when the software is ready for its intended use. Software development costs are amortized using the
straight-line method over the estimated useful life of the software. The Company capitalized software costs of $23.4 million, $17.7 million and $12.8 million in 2015, 2014 and $10.6 million in 2014, 2013, and 2012, respectively. Amortization expense for software totaled $11.6 million, $9.2 million and $7.3 million in 2015, 2014 and $5.7 million in 2014, 2013, and 2012, respectively.
Income Taxes
The Company accounts for income taxes under the asset and liability method. Deferred tax assets and liabilities are recognized for the future tax consequences attributable to differences between the financial statement carrying amounts of existing assets and liabilities and their respective tax bases. Deferred tax assets and liabilities are measured using enacted tax rates expected to apply to taxable income in the years in which those temporary differences are expected to be recovered or settled. The effect on deferred tax assets and liabilities of a change in tax rates is recognized in the period that includes the enactment date.
The ultimate realization of deferred tax assets is dependent upon the generation of future taxable income during the periods in which the associated temporary differences became deductible. The Company evaluates on a quarterly basis whether it is more likely than not that its deferred tax assets will be realized in the future and concludes whether a valuation allowance must be established.
The Company does not provide deferred taxes for the undistributed earnings of the Company’s foreign subsidiaries that are considered to be indefinitely reinvested outside of the United States in accordance with authoritative literature. The Company includes any estimated interest and penalties on tax related matters in income tax expense.
Current accounting guidance clarifies the accounting for uncertainty in income taxes recognized in an entity’s financial statements and prescribes threshold and measurement attributes for financial statement disclosure of tax positions taken or expected to be taken on a tax return. Under the relevant authoritative literature, the impact of an uncertain income tax position on the income tax return must be recognized at the largest amount that is more likely than not to be sustained upon audit by the relevant taxing authority. An uncertain income tax position will not be recognized if it has less than a 50 percent likelihood of being sustained.
Cash Equivalents
Cash equivalents consist of cash on hand and highly liquid investments with original maturities of three months or less. Restricted cash represents customer deposits repayable on demand.
Foreign Currency Translation
Assets and liabilities of foreign subsidiaries are translated into U.S. dollars at the rates of exchange in effect at period-end. The related translation adjustments are made directly to accumulated other comprehensive income.
Income and expenses are translated at the average monthly rates of exchange in effect during the year. Gains and losses from foreign currency transactions of these subsidiaries are included in net income. The Company recognized a foreign exchange loss of $2.4 million and $0.4 million for the years ended December 31, 2015 and 2013, respectively, and a gain of $1.4 million for the year ended December 31, 2014, and a foreign exchange loss for each of the years ended December 31, 2013 and 2012 of $0.4 million, respectively, which are recorded within other income, net in the Consolidated Statements of Income.
Stock-Based Compensation
The Company accounts for employee stock options and restricted stock in accordance with relevant authoritative literature. Stock options are granted with an exercise price estimated to be equal to the fair market value on the date of grant as authorized by the Company’s board of directors. Options granted have vesting provisions ranging from one to six years and vesting of the options is generally based on the passage of time or performance. Stock option grants are generally subject to forfeiture if employment terminates prior to vesting. The Company has
selected the Black-Scholes option pricing model for estimating the grant date fair value of stock option awards granted. The Company has considered the retirement and forfeiture provisions of the options and utilized its historical experience to estimate the expected life of the options. The Company bases the risk-free interest rate on the yield of a zero coupon U.S. Treasury security with a maturity equal to the expected life of the option from the date of the grant. Stock-based compensation cost is measured at the grant date based on the value of the award and is recognized as expense over the requisite service period based on the number of years for which the requisite service is expected to be rendered.
Awards of restricted stock and restricted stock units are independent of stock option grants and are generally subject to forfeiture if employment terminates prior to vesting. The vesting of shares granted is generally based on the passage of time, performance or market conditions, or a combination of these. Shares vesting based on the passage of time have vesting provisions ranging fromof one to six years.year. The fair value of restricted stock where the shares vest based on the passage of time or performance is based on the grant date fair value of the Company’s stock. The fair value of restricted stock shares based on market conditions is estimated using the Monte Carlo option pricing model. The risk-free interest rate and volatility assumptions used within the Monte Carlo option pricing model are calculated consistently with those applied in the Black-Scholes options pricing model utilized in determining the fair value of the stock option awards.
For performance-based restricted stock awards and performance based stock option awards, the Company must also make assumptions regarding the likelihood of achieving performance goals. If actual results differ significantly from these estimates, stock-based compensation expense and the Company’s results of operations could be materially affected.
Deferred Financing Costs/Debt Discounts
Costs incurred to obtain financing, net of accumulated amortization, are amortized over the term of the related debt, using the effective interest method.method and are included within interest expense. In November 2014, the Company expensed $15.8 million and capitalized $9.2 million of debt issuance costs associated with the refinancing of its Credit Facility. At December 31, 20142015 and 2013,2014, the Company had net deferred financing costs of $23.2$18.1 million and $6.8$23.2 million, respectively.
Comprehensive Income (Loss)
Comprehensive income (loss) is defined as the total of net income and all other changes in equity that result from transactions and other economic events of a reporting period other than transactions with owners.
Accounts Receivable
The Company maintains a $1.2 billion$950 million revolving trade accounts receivable Securitization Facility. Accounts receivable collateralized within our Securitization Facility relate to trade receivables resulting from charge card
activity. Pursuant to the terms of the Securitization Facility, the Company transfers certain of its domestic receivables, on a revolving basis, to FleetCor Funding LLC (Funding), a wholly-owned bankruptcy remote subsidiary. In turn, Funding sells, without recourse, on a revolving basis, up to $1.2 billion$950 million of undivided ownership interests in this pool of accounts receivable to a multi-seller, asset-backed commercial paper conduit (Conduit). Funding maintains a subordinated interest, in the form of over collateralization,over-collateralization, in a portion of the receivables sold to the Conduit. Purchases by the Conduit are financed with the sale of highly-rated commercial paper.
The Company utilizes proceeds from the sale of its accounts receivable as an alternative to other forms of debt, effectively reducingfinancing to reduce its overall borrowing costs. The Company has agreed to continue servicing the sold receivables for the financial institution at market rates, which approximates the Company’s cost of servicing. The Company retains a residual interest in the accounts receivable sold as a form of credit enhancement. The residual interest’s fair value approximates carrying value due to its short-term nature. Funding determines the level of funding achieved by the sale of trade accounts receivable, subject to a maximum amount.
The Company’s consolidated balance sheets and statements of income reflect the activity related to securitized accounts receivable and the corresponding securitized debt, including interest income, fees generated from late payments, provision for losses on accounts receivable and interest expense. The cash flows from borrowings and repayments, associated with the securitized debt, are presented as cash flows from financing activities.
On November 14, 2014, the Company extended the term of its asset securitization facilitySecuritization Facility to November 14, 2017. The Company capitalized $3.1 million in deferred financing fees in connection with this extension.
The Company’s accounts receivable and securitized accounts receivable include the following at December 31 (in thousands):
| 2014 | 2013 | 2015 | 2014 | |||||||||||||
Gross domestic accounts receivables | $ | 330,466 | $ | 107,627 | $ | 338,275 | $ | 330,466 | ||||||||
Gross domestic securitized accounts receivable | 675,000 | 349,000 | 614,000 | 675,000 | ||||||||||||
Gross foreign receivables | 367,173 | 488,140 | 322,582 | 367,173 | ||||||||||||
|
|
|
| |||||||||||||
Total gross receivables | 1,372,639 | 944,767 | 1,274,857 | 1,372,639 | ||||||||||||
Less allowance for doubtful accounts | (23,842 | ) | (22,416 | ) | (21,903 | ) | (23,842 | ) | ||||||||
|
|
|
| |||||||||||||
Net accounts and securitized accounts receivable | $ | 1,348,797 | $ | 922,351 | $ | 1,252,954 | $ | 1,348,797 | ||||||||
|
|
|
| |||||||||||||
A rollforward of the Company’s allowance for doubtful accounts related to accounts receivable for the years ended December 31 is as follows (in thousands):
| 2014 | 2013 | 2012 | 2015 | 2014 | 2013 | |||||||||||||||||||
Allowance for doubtful accounts beginning of year | $ | 22,416 | $ | 19,463 | $ | 15,315 | $ | 23,842 | $ | 22,416 | $ | 19,463 | ||||||||||||
Add: | ||||||||||||||||||||||||
Provision for bad debts | 24,412 | 18,867 | 21,896 | 24,629 | 24,412 | 18,867 | ||||||||||||||||||
Less: | ||||||||||||||||||||||||
Write-offs | (22,986 | ) | (15,914 | ) | (17,748 | ) | (26,568 | ) | (22,986 | ) | (15,914 | ) | ||||||||||||
|
|
|
|
|
| |||||||||||||||||||
Allowance for doubtful accounts end of year | $ | 23,842 | $ | 22,416 | $ | 19,463 | $ | 21,903 | $ | 23,842 | $ | 22,416 | ||||||||||||
|
|
|
|
|
| |||||||||||||||||||
All foreignForeign receivables are Company owned receivables and are not included in the Company’s receivable securitization program. At December 31, 20142015 and 2013,2014, there was $675$614 million and $349$675 million, respectively, of short-term debt outstanding under the Company’s accounts receivable Securitization Facility.
Purchase of Receivables
The Company recorded a premium on the purchase of receivables in prior years, which represented the amount paid in excess of the fair value of the receivables at the time of purchase. This premium is included in other long-term assets in the Consolidated Balance Sheets and is being amortized over its remaining useful life. At December 31, 2014 and 2013, the remaining net premium on the purchase of receivables was $13.2 million and $16.4 million, respectively.
Advertising
The Company expenses advertising costs as incurred. Advertising expense werewas $19.9 million, $14.4 million $12.3 million and $11.5$12.3 million for the years ended December 31, 2015, 2014 and 2013, and 2012, respectively.
Earnings Per Share
The Company reports basic and diluted earnings per share. Basic earnings per share is calculated using the weighted average of common stock and non-vested, non-forfeitable restricted shares outstanding, unadjusted for dilution, and net income is adjusted for preferred stock accrued dividends to arrive at income attributable to common shareholders.
Diluted earnings per share is calculated using the weighted average shares outstanding and contingently issuable shares less weighted average shares recognized during the period. The net outstanding shares have been adjusted for the dilutive effect of common stock equivalents, which consist of outstanding stock options and unvested forfeitable restricted stock units.
Adoption of New Accounting Standards
Foreign CurrencyDiscontinued Operations Reporting
In March 2013, the Financial Accounting Standards Board (the “FASB”) issued Accounting Standards Update (“ASU”) 2013-05 “Parent’s Accounting for the Cumulative Translation Adjustment upon Derecognition of Certain Subsidiaries or Groups of Assets within a Foreign Entity or of an Investment in a Foreign Entity”, which indicates that the entire amount of a cumulative translation adjustment (“CTA”) related to an entity’s investment in a foreign entity should be released when there has been a sale of a subsidiary or group of net assets within a foreign entity and the sale represents the substantially complete liquidation of the investment in the foreign entity, loss of a controlling financial interest in an investment in a foreign entity (i.e., the foreign entity is deconsolidated) or step acquisition for a foreign entity (i.e., when an entity has changed from applying the equity method for an investment in a foreign entity to consolidating the foreign entity). The ASU does not change the requirement to release a pro rata portion of the CTA of the foreign entity into earnings for a partial sale of an equity method investment in a foreign entity. This ASU is effective for the Company for fiscal years and interim periods within those fiscal years beginning on or after December 15, 2013. The adoption of this ASU did not have a material impact on results of operations, financial condition, or cash flows.
Unrecognized Tax Benefit When an NOL Exists
In July 2013,April 2014, the FASB issued an ASU 2013-11 “Presentation2014-08, “Discounted Operations Reporting” that changes the requirements for reporting discontinued operations. This update will have the impact of reducing the frequency of disposals reported as discontinued operations, by requiring such a disposal to represent a strategic shift that has a major effect on an Unrecognized Tax Benefit When a Net Operating Loss Carryforward, a Similar Tax Loss, or a Tax Credit Carryforward Exists”, which indicatesentity’s operations and financial results. This update also expands the disclosures for discontinued operations, and requires new disclosures related to individually significant disposals that to the extent a net operating loss carryforward, a similar tax loss, or a tax credit carryforward isdo not available at the reporting date under the tax law of the applicable jurisdiction to settle any additional income taxes that would result from the disallowance of a tax position or the tax law of the applicable jurisdiction does not require the entity to use, and the entity does not intend to use, the deferred tax asset for such purpose, the unrecognized tax benefit should be presented in the financial statementsqualify as a liability and should not be combined with deferred tax assets. This ASU is effective for thediscontinued operations. The Company for fiscal years and interim periods within those fiscal years beginningadopted this new guidance on or after December 15, 2013.January 1, 2015. The adoption of this ASU did not have a material impact on the Company’sresults of operations, financial condition, or cash flows, as the Company did not have discontinued operations.
Stock-Based Payment Awards with Performance Targets
In June 2014, the FASB issued ASU 2014-12, “Share-Based Payment Awards With Performance Targets That Are Attainable After the Requisite Service Period”, for companies that grant their employees share-based payments in which the terms of the award provide that a performance target that affects vesting could be achieved after the requisite service period. The Company adopted this new guidance on January 1, 2015. The adoption of this ASU did not have a material impact on the results of operations, financial condition, or cash flows.
Simplification of Business Combination Measurement-Period Adjustments
In September 2015, the FASB issued ASU 2015-16, “Business Combinations: Simplifying the Accounting for Measurement-Period Adjustments”, which requires that an acquirer recognize adjustments to provisional amounts that are identified during the measurement period in the reporting period in which the adjustment amounts are determined. Prior to the issuance of the standard, entities were required to retrospectively apply adjustments made to provisional amounts recognized in a business combination. The Company adopted this new guidance during the third quarter of 2015. The adoption of this ASU did not have a material impact on the results of operations, financial condition, or cash flows. Furthermore, measurement period adjustments recorded in the year ended December 31, 2015 did not have a material impact on our consolidated statements of income.
Pending Adoption of Recently Issued Accounting Standards
From time to time, new accounting pronouncements are issued by the FASB or other standards setting bodies that are adopted by the Company as of the specified effective date. Unless otherwise discussed, the Company’s management believes that the impact of recently issued standards that are not yet effective will not have a material impact on the Company’s consolidated financial statements upon adoption.
Going Concern
In August 2013, the FASB issued ASU 2014-15 “Disclosure of Uncertainties About an Entity’s Ability to Continue as a Going Concern”, which requires entities to perform interim and annual assessments of the entity’s
ability to continue as a going concern within one year of the date of issuance of the entity’s financial statements. This ASU is effective for fiscal years ending after December 15, 2016 and interim periods thereafter, with early adoption permitted. The Company’s adoption of this ASU is not expected to have a material impact on the results of operations, financial condition, or cash flows, as it is disclosure based.
Discontinued Operations Reporting
In April 2014, the FASB issued an ASU 2014-08, “Discounted Operations Reporting” that changes the requirements for reporting discontinued operations. This update will have the impact of reducing the frequency of disposals reported as discontinued operations, by requiring such a disposal to represent a strategic shift that has a major effect on an entity’s operations and financial results. This update also expands the disclosures for discontinued operations, and requires new disclosures related to individually significant disposals that do not qualify as discontinued operations. This new guidance becomes effective for the Company prospectively in the first quarter of 2015. This amended guidance will only have a potential impact to the extent that the Company discontinues any operations in future periods.
Revenue Recognition
In May 2014, the FASB issued ASC 606, “Revenue from Contracts with Customers”, which amends the guidance in former ASC 605, Revenue Recognition. This amended guidance requires revenue to be recognized in an amount that reflects the consideration to which the company expects to be entitled for those goods and services when the performance obligation has been satisfied. This amended guidance also requires enhanced disclosures regarding the nature, amount, timing and uncertainty of revenue and related cash flows arising from contracts with customers. In August 2015, the FASB issued ASU 2015-14, “Revenue from Contracts with Customers: Deferral of the Effective Date”, which defers the effective date of the new revenue recognition standard by one year. This ASU is effective for the Company for fiscal years endingreporting periods beginning after December 15, 2016 and interim periods, with early adoption not permitted.2017, but permits companies the option to adopt as of the original effective date. The Company is currently evaluating the impact of the provisions of ASC 606. The guidance permits the use of either a retrospective or cumulative effect transition method. The Company anticipates selecting the modified retrospective method during transition and is currently evaluating the impact on the results of operations, financial condition, or cash flows.
Stock-Based Payment Awards with Performance TargetsSimplification of Guidance on Debt Issuance Costs
In June 2014,April 2015, the FASB issued ASU 2014-12, “Share-Based Payment Awards With Performance Targets That Are Attainable After2015-03, “Interest—Imputation of Interest”, which changes the Requisite Service Period”, for companies that grant their employees share-based paymentspresentation of debt issuance costs in whichfinancial statements as a direct deduction from the terms of the award provide that a performance target that affects vesting could be achieved after the requisite service period.related debt liability rather than as an asset. This new guidance becomesASU is effective for the Company beginning in the first quarter ofus for fiscal years ending after December 15, 2015 but earlyand interim periods. Early adoption is permitted. In August 2015, the FASB issued ASU 2015-15, “Interest—Imputation of Interest: Presentation and Subsequent Measurement of Debt Issuance Costs Associated with Line-of-Credit Arrangements”, which is effective immediately. This new guidanceSEC staff clarified that entities may continue presenting unamortized debt issuance costs for line-of-credit arrangements as an asset. The adoption of this ASU is not expected to have a material impact on the Company’s consolidated financial position or results of operations.operations, financial condition, or cash flows.
Simplification of Balance Sheet Classification of Deferred Taxes
In November 2015, the FASB issued ASU 2015-17, “Balance Sheet Classification of Deferred Taxes”, which requires entities to present deferred tax assets (DTAs) and deferred tax liabilities (DTLs) as noncurrent in a classified balance sheet. It thus simplifies the current guidance, which requires entities to separately present DTAs and DTLs as current or noncurrent in a classified balance sheet. Netting of DTAs and DTLs by tax jurisdiction is still required under the new guidance. This ASU is effective for the Company for annual reporting periods beginning after December 15, 2016, and interim periods within those annual periods. Early adoption is permitted. The Company’s adoption of this ASU is not expected to have a material impact on the results of operations, financial condition, or cash flows.
Revision of Previously Issued Financial Statements
During the fourth quarter ended December 31, 2015, the Company identified a misstatement related to the identification of the functional currency and subsequent translation into U.S. dollars of certain of our acquired goodwill, other intangibles, net and related deferred tax liabilities. The Company has revised previously reported balances within our Consolidated Balance Sheets as of December 31, 2014, the Consolidated Statements of Comprehensive Income, and the Consolidated Statements of Stockholders’ Equity for the years ended December 31, 2014 and 2013, for the translation of these balances using the correct functional currencies. This revision had no effect on our Consolidated Statements of Income or Consolidated Statements of Cash Flows. The Company does not believe this revision was material to any prior period financial statement.
The following table presents the impact of the revisions on our previously issued Consolidated Balance Sheet (in thousands):
| As Reported at December 31, 2014 | Adjustment | As Revised at December 31, 2014 | ||||||||||
Goodwill | $ | 3,811,862 | $ | (98,680 | ) | $ | 3,713,182 | |||||
Other intangibles, net | 2,437,367 | (51,125 | ) | 2,386,242 | ||||||||
Deferred income taxes | 815,169 | (15,230 | ) | 799,939 | ||||||||
Accumulated other comprehensive loss | (156,933 | ) | (134,575 | ) | (291,508 | ) | ||||||
The following table presents the impact of the revisions on our previously issued Consolidated Statements of Comprehensive Income and Consolidated Statements of Stockholders’ Equity for the years ended December 31, 2014 and 2013 (in thousands):
| As Reported December 31, 2014 | Adjustment | As Revised December 31, 2014 | As Reported December 31, 2013 | Adjustment | As Revised December 31, 2013 | |||||||||||||||||||
Other comprehensive loss | $ | (109,507 | ) | $ | (114,184 | ) | $ | (223,691 | ) | $ | (44,080 | ) | $ | (20,391 | ) | $ | (64,471 | ) | ||||||
Total comprehensive income (loss) | 259,200 | (114,184 | ) | 145,016 | 240,421 | (20,391 | ) | 220,030 | ||||||||||||||||
During the fourth quarter ended December 31, 2015, we identified a misstatement in the presentation of adjustments to reconcile net income to net cash provided by operating activities related to deferred income taxes and accounts payable, accrued expenses and customer deposits. As such, the Company has revised previously reported balances within our Consolidated Statements of Cash Flows for the year ended December 31, 2014. This revision had no effect on our cash flows from operating activities within the Consolidated Statements of Cash Flows, Consolidated Balance Sheets, Consolidated Statements of Income, Consolidated Statements of Comprehensive Income or Consolidated Statements of Stockholders’ Equity. The Company does not believe this revision was material to any prior period financial statement.
The following table presents the impact of the revisions on our previously issued Consolidated Cash Flows for the year ended December 31, 2014 (in thousands):
| As Reported at December 31, 2014 | Adjustment | As Revised at December 31, 2014 | ||||||||||
Adjustments to reconcile net income to net cash provided by operating activities: | ||||||||||||
Deferred income taxes | $ | (41,716 | ) | $ | 83,432 | $ | 41,716 | |||||
Accounts payable, accrued expenses and customer deposits | (102,443 | ) | (83,432 | ) | (185,875 | ) | ||||||
|
|
|
|
|
| |||||||
Net impact on cash provided by operating activities | $ | (144,159 | ) | $ | — | $ | (144,159 | ) | ||||
|
|
|
|
|
| |||||||
3. Fair Value Measurements
Fair value is a market-based measurement that should be determined based on assumptions that market participants would use in pricing an asset or liability. GAAP discusses valuation techniques, such as the market approach (comparable market prices), the income approach (present value of future income or cash flow), and the cost approach (cost to replace the service capacity of an asset or replacement cost). These valuation techniques are based upon observable and unobservable inputs. Observable inputs reflect market data obtained from independent sources, while unobservable inputs reflect the Company’s market assumptions.
As the basis for evaluating such inputs, a three-tier value hierarchy prioritizes the inputs used in measuring fair value as follows:
The Company estimates the fair value of acquisition-related contingent consideration using various valuation approaches including the Monte Carlo Simulation approach and the probability-weighted discounted cash flow approach. Acquisition related contingent consideration liabilities are classified as Level 3 liabilities because the Company uses unobservable inputs to value them, reflecting the Company’s assessment of the assumptions market participants would use to value these liabilities. A change in the unobservable inputs could result in a significantly higher or lower fair value measurement. Changes in the fair value of acquisition related contingent consideration are recorded as (income) expense in the Consolidated Statements of Income. The acquisition related contingent consideration liabilities are recorded in other current liabilities.
The following table presents the Company’s financial assets and liabilities which are measured at fair values on a recurring basis as of December 31, 20142015 and 2013,2014, (in thousands).:
| Fair Value | Level 1 | Level 2 | Level 3 | |||||||||||||||||||||||||||||
December 31, 2015 | ||||||||||||||||||||||||||||||||
Assets: | ||||||||||||||||||||||||||||||||
Repurchase agreements | $ | 144,082 | $ | — | $ | 144,082 | $ | — | ||||||||||||||||||||||||
Money market | 55,062 | — | 55,062 | — | ||||||||||||||||||||||||||||
Certificates of deposit | 9,373 | — | 9,373 | — | ||||||||||||||||||||||||||||
|
|
|
| |||||||||||||||||||||||||||||
Total cash equivalents | $ | 208,517 | $ | — | $ | 208,517 | $ | — | ||||||||||||||||||||||||
| Fair Value | Level 1 | Level 2 | Level 3 |
|
|
|
| |||||||||||||||||||||||||
December 31, 2014 | ||||||||||||||||||||||||||||||||
Assets: | ||||||||||||||||||||||||||||||||
Repurchase agreements | $ | 196,616 | $ | — | $ | 196,616 | $ | — | $ | 196,616 | $ | — | $ | 196,616 | $ | — | ||||||||||||||||
Money market | 50,000 | — | 50,000 | — | 50,000 | — | 50,000 | — | ||||||||||||||||||||||||
Certificates of deposit | 3,570 | — | 3,570 | — | 3,570 | — | 3,570 | — | ||||||||||||||||||||||||
|
|
|
|
|
|
|
| |||||||||||||||||||||||||
Total cash equivalents | $ | 250,186 | $ | — | $ | 250,186 | $ | — | $ | 250,186 | $ | — | $ | 250,186 | $ | — | ||||||||||||||||
|
|
|
|
|
|
|
| |||||||||||||||||||||||||
Liabilities: | ||||||||||||||||||||||||||||||||
Acquisition related contingent consideration | $ | 43,486 | $ | — | $ | — | $ | 43,486 | $ | 43,486 | $ | — | $ | — | $ | 43,486 | ||||||||||||||||
December 31, 2013 | ||||||||||||||||||||||||||||||||
Assets: | ||||||||||||||||||||||||||||||||
Repurchase agreements | $ | 162,126 | $ | — | $ | 162,126 | $ | — | ||||||||||||||||||||||||
Certificates of deposit | 9,038 | — | 9,038 | — | ||||||||||||||||||||||||||||
|
|
|
| |||||||||||||||||||||||||||||
Total cash equivalents | $ | 171,164 | $ | — | $ | 171,164 | $ | — | ||||||||||||||||||||||||
|
|
|
| |||||||||||||||||||||||||||||
Liabilities: | ||||||||||||||||||||||||||||||||
Acquisition related contingent consideration | $ | 80,476 | $ | — | $ | — | $ | 80,476 | ||||||||||||||||||||||||
The Company has highly liquid investments classified as cash equivalents, with original maturities of 90 days or less, included in our Consolidated Balance Sheets. The Company utilizes Level 2 fair value determinations derived from directly or indirectly observable (market based) information to determine the fair value of these highly liquid investments. The Company has certain cash and cash equivalents that are invested on an overnight basis in repurchase agreements.agreements, money markets and certificates of deposit. The value of overnight repurchase agreements is determined based upon the quoted market prices for the treasury securities associated with the repurchase agreements. Certificates of deposit are valued at cost, plus interest accrued. Given the short term nature of these instruments, the carrying value approximates fair value.
The level within the fair value hierarchy and the measurement technique are reviewed quarterly. Transfers between levels are deemed to have occurred at the end of theeach quarter. There were no transfers between fair value levels during 20142015 and 2013.2014.
The Company’s nonfinancial assets that are measured at fair value on a nonrecurring basis include property, plant and equipment, equity method investment, goodwill and other intangible assets. As necessary, the
Company generally uses projected cash flows, discounted as appropriate, to estimate the fair values of the assets using key inputs such as management’s projections of cash flows on a held-and-used basis (if applicable), management’s projections of cash flows upon disposition and discount rates. Accordingly, these fair value measurements are in Level 3 of the fair value hierarchy. These assets and liabilities are measuredrecognized at fair value on a nonrecurring basis if an impairment is identified.
The Company regularly evaluates the carrying value of its equity method investment and during the fourth quarter of 2015, the Company determined that the fair value of its 44% investment in Masternaut had declined as parta result of the Company’s annualperformance improvement initiatives taking longer than projected to implement. As a result, the Company determined that the carrying value of its investment exceeded its fair value and concluded that this decline in value was other than temporary. The Company recorded a $40 million non-cash impairment assessments and as impairment indicators are identified.charge, which is included in the equity method investment loss in the accompanying Consolidated Statement of Income.
The carryingfair value of the Company’s cash, accounts receivable, securitized accounts receivable and related facility, prepaid expenses and other current assets, accounts payable, accrued expenses, customer deposits and short-term borrowings approximate their respective carrying values due to the short-term maturities of the instruments. The carrying value of the Company’s debt obligations approximates fair value as the interest rates on the debt are variable market based interest rates that reset on a quarterly basis. These are each level 2 fair value measurements, except for cash, which is a level 1 fair value measurement.
4. Stock Transactions
Common Stock
On November 26, 2012, the Company entered into a stock repurchase agreement (the “Repurchase Agreement”) with investment funds associated with Summit Partners and Bain Capital (the “Repurchase Stockholders”), related party affiliates, to repurchase up to $200,000,000 of the Company’s common stock directly from the Repurchase Stockholders (the “Share Repurchase”) in a private transaction at a price per share equal to the price paid by the underwriter in the underwritten secondary offering announced on November 26, 2012 by the Company.
On December 3, 2012, the Company repurchased approximately 3.9 million shares of its common stock from the Repurchase Stockholders at $51.91 per share. The repurchase of shares from the Repurchase Stockholders was approved pursuant to the Company’s policy regarding related party transactions. The Company funded the Share Repurchase with borrowings under its credit facilities. The repurchased shares are included with Treasury Stock within the Consolidated Balance Sheets.
On November 14, 2014, FleetCorthe Company acquired all of Comdata’s outstanding shares for a total payment of $3.42$3.4 billion, net of cash acquired, which included cash consideration of $2.4 billion and the issuance of 7,625,380 shares of FleetCor’sthe Company’s common stock from treasury shares to the former shareholders of Comdata.
On February 4, 2016, the Company’s Board of Directors approved a stock repurchase program under which the Company may begin purchasing up to $500 million of its common stock over the next 18 months. Any stock repurchases may be made at times and in such amounts as management deems appropriate. The timing and amount of stock repurchase, if any, will depend on a variety of factors including the stock price, market conditions, corporate and regulatory requirements, and any additional constraints related to material inside information the Company may possess. The repurchases are expected to be funded by available cash flow from the business and working capital.
5. ShareStock Based Compensation
The Company accounts for stock-based compensation pursuant to relevant authoritative guidance, which requires measurement of compensation cost for all stock awards at fair value on the date of grant and recognition of compensation, net of estimated forfeitures, over the requisite service period for awards expected to vest. The Company has Equity CompensationStock Incentive Plans (the Plans) pursuant to which the Company’s board of directors may grant stock options or restricted stock to employees. The Company is authorized to issue grants of restricted stock and stock options to purchase up to 26,963,150 shares for the years ended December 31, 2015, 2014 2013 and 2012,2013, respectively. On May 13, 2013, the Company’s stockholders authorized an increase of 6,500,000 shares of common stock available for grant pursuant to the 2010 Equity Compensation Plan. Giving effect to this increase, there were 5,180,6974,685,531 additional shares remaining available for grant under the Plans at December 31, 2014.2015.
The table below summarizes the expense recognized related to share-based payments recognized for the years ended December 31 (in thousands):
| 2014 | 2013 | 2012 | 2015 | 2014 | 2013 | |||||||||||||||||||
Stock options | $ | 13,267 | $ | 11,677 | $ | 10,341 | $ | 44,260 | $ | 13,267 | $ | 11,677 | ||||||||||||
Restricted stock | 24,382 | 14,999 | 8,934 | 45,862 | 24,382 | 14,999 | ||||||||||||||||||
|
|
|
|
|
| |||||||||||||||||||
Stock-based compensation | $ | 37,649 | $ | 26,676 | $ | 19,275 | $ | 90,122 | $ | 37,649 | $ | 26,676 | ||||||||||||
|
|
|
|
|
| |||||||||||||||||||
The tax benefits recorded on stock based compensation were $35.7 million, $13.0 million $9.8 million and $6.8$9.8 million for the years ended December 31, 2015, 2014 and 2013, and 2012, respectively.
The following table summarizes the Company’s total unrecognized compensation cost related to stock-based compensation as of December 31, 2014:2015 (cost in thousands):
| Unrecognized Compensation Cost | Weighted Average Period of Expense Recognition (in Years) | Unrecognized Compensation Cost | Weighted Average Period of Expense Recognition (in Years) | |||||||||||||
Stock options | $ | 70,502 | 2.05 | $ | 44,643 | 0.89 | ||||||||||
Restricted stock | 37,692 | 1.56 | 7,213 | 1.24 | ||||||||||||
|
| |||||||||||||||
Total | $ | 108,194 | $ | 51,856 | ||||||||||||
|
| |||||||||||||||
Stock Options
Stock options are granted with an exercise price estimated to be equal to the fair market value on the date of grant, as authorized by the Company’s board of directors. Options granted have vesting provisions ranging from one to six years. Stock option grants are generally subject to forfeiture if employment terminates prior to vesting. The Company issues new shares upon stock option exercises.
The following summarizes the changes in the number of shares of common stock under option for the following periods (shares and aggregate intrinsic value in thousands):
| Shares | Weighted Average Exercise Price | Options Exercisable at End of Year | Weighted Average Exercise Price of Exercisable Options | Weighted Average Fair Value of Options Granted During the Year | Aggregate Intrinsic Value | |||||||||||||||||||||||||||||||||||||||||||
Outstanding at December 31, 2011 | 8,341 | $ | 15.51 | 4,394 | $ | 10.13 | $ | 119,802 | ||||||||||||||||||||||||||||||||||||||||
Granted | 1,223 | 36.94 | $ | 10.82 | ||||||||||||||||||||||||||||||||||||||||||||
Exercised | (2,925 | ) | 9.38 | 129,488 | ||||||||||||||||||||||||||||||||||||||||||||
Forfeited | (74 | ) | 20.43 | |||||||||||||||||||||||||||||||||||||||||||||
|
|
|
|
|
| Shares | Weighted Average Exercise Price | Options Exercisable at End of Year | Weighted Average Exercise Price of Exercisable Options | Weighted Average Fair Value of Options Granted During the Year | Aggregate Intrinsic Value | |||||||||||||||||||||||||||||||||||||
Outstanding at December 31, 2012 | 6,565 | 22.17 | 2,666 | 14.71 | 206,636 | 6,565 | $ | 22.17 | 2,666 | $ | 14.71 | $ | 206,636 | |||||||||||||||||||||||||||||||||||
Granted | 307 | 80.77 | 23.00 | 307 | 80.77 | $ | 23.00 | |||||||||||||||||||||||||||||||||||||||||
Exercised | (1,425 | ) | 21.13 | 136,807 | (1,425 | ) | 21.13 | 136,807 | ||||||||||||||||||||||||||||||||||||||||
Forfeited | (116 | ) | 28.68 | (116 | ) | 28.68 | ||||||||||||||||||||||||||||||||||||||||||
|
|
|
|
|
|
|
|
|
|
|
| |||||||||||||||||||||||||||||||||||||
Outstanding at December 31, 2013 | 5,331 | 25.68 | 2,589 | 16.57 | 487,673 | 5,331 | 25.68 | 2,589 | 16.57 | 487,673 | ||||||||||||||||||||||||||||||||||||||
Granted | 1,544 | 135.16 | $ | 42.77 | 1,544 | 135.16 | 42.77 | |||||||||||||||||||||||||||||||||||||||||
Exercised | (1,429 | ) | 20.75 | 182,904 | (1,429 | ) | 20.75 | 182,904 | ||||||||||||||||||||||||||||||||||||||||
Forfeited | (315 | ) | 41.72 | (315 | ) | 41.72 | ||||||||||||||||||||||||||||||||||||||||||
|
|
|
|
|
|
|
|
|
|
|
| |||||||||||||||||||||||||||||||||||||
Outstanding at December 31, 2014 | 5,131 | $ | 58.71 | 2,370 | $ | 21.75 | $ | 461,770 | 5,131 | 58.71 | 2,370 | 21.75 | 461,770 | |||||||||||||||||||||||||||||||||||
Vested and expected to vest at December 31, 2014 | 5,131 | $ | 58.71 | |||||||||||||||||||||||||||||||||||||||||||||
Granted | 654 | 154.56 | $ | 35.32 | ||||||||||||||||||||||||||||||||||||||||||||
Exercised | (586 | ) | 33.97 | 63,863 | ||||||||||||||||||||||||||||||||||||||||||||
Forfeited | (196 | ) | 95.16 | |||||||||||||||||||||||||||||||||||||||||||||
|
|
|
|
|
| |||||||||||||||||||||||||||||||||||||||||||
Outstanding at December 31, 2015 | 5,003 | $ | 72.72 | 2,545 | $ | 26.82 | $ | 351,277 | ||||||||||||||||||||||||||||||||||||||||
Expected to vest at December 31, 2015 | 5,003 | $ | 72.72 | |||||||||||||||||||||||||||||||||||||||||||||
The following table summarizes information about stock options outstanding at December 31, 20142015 (shares in thousands):
Exercise Price | Options Outstanding | Weighted Average Remaining Vesting Life in Years | Options Exercisable | |||||||||
$5.20 – 6.548 | 9 | — | 9 | |||||||||
10.00 – 14.00 | 803 | — | 803 | |||||||||
18.00 – 23.00 | 1,515 | 0.56 | 996 | |||||||||
27.83 – 34.72 | 190 | 0.83 | 86 | |||||||||
35.04 – 40.65 | 974 | 1.49 | 447 | |||||||||
47.63 – 58.02 | 24 | 1.91 | — | |||||||||
74.99 – 111.09 | 325 | 2.70 | 29 | |||||||||
115.45 – 149.68 | 1,291 | 3.17 | — | |||||||||
|
|
|
| |||||||||
| 5,131 | 2,370 | |||||||||||
|
|
|
| |||||||||
Exercise Price | Options Outstanding | Weighted Average Remaining Vesting Life in Years | Options Exercisable | |||||||||
$10.00 – 27.83 | 1,938 | 0.07 | 1,713 | |||||||||
29.99 – 40.65 | 995 | 0.50 | 712 | |||||||||
47.63 – 58.02 | 5 | 1.07 | — | |||||||||
74.99 – 111.09 | 231 | 1.72 | 55 | |||||||||
115.45 – 138.47 | 347 | 2.52 | 63 | |||||||||
146.36 – 158.24 | 1,487 | 2.44 | 2 | |||||||||
|
|
|
| |||||||||
| 5,003 | 2,545 | |||||||||||
|
|
|
| |||||||||
The aggregate intrinsic value of stock options exercisable at December 31, 20142015 was $300.9$295.5 million. The weighted average remaining contractual term of options exercisable at December 31, 20142015 was 5.75.1 years.
The fair value of stock option awards granted was estimated using the Black-Scholes option pricing model with the following weighted-average assumptions for grants or modifications during the years ended December 31 as follows:
| 2014 | 2013 | 2012 | ||||||||||
Risk-free interest rate | 1.24 | % | 0.76 | % | 0.59 | % | ||||||
Dividend yield | — | — | — | |||||||||
Expected volatility | 34.61 | % | 34.95 | % | 36.49 | % | ||||||
Expected life (in years) | 3.90 | 4.00 | 4.00 | |||||||||
The Company considered the retirement and forfeiture provisions of the options and utilized its historical experience to estimate the expected life of the options.
The Company utilizes the volatility of the share price of the Company’s common stock to estimate the volatility assumption for the Black-Scholes option pricing model.
The risk-free interest rate is based on the yield of a zero coupon U.S. Treasury security with a maturity equal to the expected life of the option from the date of the grant.
| 2015 | 2014 | 2013 | ||||||||||
Risk-free interest rate | 1.47 | % | 1.24 | % | 0.76 | % | ||||||
Dividend yield | — | — | — | |||||||||
Expected volatility | 27.77 | % | 34.61 | % | 34.95 | % | ||||||
Expected life (in years) | 4.46 | 3.90 | 4.00 | |||||||||
The weighted-average remaining contractual life for options outstanding was 6.96.7 and 6.76.9 years at December 31, 20142015 and 2013,2014, respectively.
Restricted Stock
Awards of restricted stock and restricted stock units are independent of stock option grants and are generally subject to forfeiture if employment terminates prior to vesting. The vesting of the shares is generally based on the passage of time, performance or market conditions, or a combination of these. Shares vesting based on the passage of time have vesting provisions ranging from one to four years. The fair value of restricted stock shares based on performance is based on the grant date fair value of the Company’s stock.
The fair value of restricted stock shares granted with performance based on market conditions was estimated using the Monte Carlo option pricing model with the following assumptions during 2013. There were no restricted stock shares granted based with performance based conditions or market conditions in 20142015 and 2012.2014.
| 2013 | ||||
Risk-free interest rate | 0.42 | % | ||
Dividend yield | — | |||
Expected volatility | 30.00 | % | ||
Expected life (in years) | 1.75 | |||
The risk-free interest rate and volatility assumptions were calculated consistently with those applied in the Black-Scholes options pricing model utilized in determining the fair value of the stock option awards.
The following table summarizes the changes in the number of shares of restricted stock and restricted stock units for the following periods (shares in thousands):
| Shares | Weighted Average Grant Date Fair Value | |||||||||||||||
Outstanding at December 31, 2011 | 840 | 23.15 | ||||||||||||||
Granted | 131 | 41.69 | ||||||||||||||
Cancelled | (25 | ) | 33.49 | |||||||||||||
Issued | (474 | ) | 22.05 | |||||||||||||
|
| Shares | Weighted Average Grant Date Fair Value | |||||||||||||
Outstanding at December 31, 2012 | 472 | 28.98 | 472 | $ | 28.98 | |||||||||||
Granted | 358 | 92.16 | 358 | 92.16 | ||||||||||||
Cancelled | (31 | ) | 35.42 | (31 | ) | 35.42 | ||||||||||
Issued | (165 | ) | 30.93 | (165 | ) | 30.93 | ||||||||||
|
|
|
| |||||||||||||
Outstanding at December 31, 2013 | 634 | 67.83 | 634 | 67.83 | ||||||||||||
Granted | 467 | 146.12 | 467 | 146.12 | ||||||||||||
Cancelled | (76 | ) | 31.48 | (76 | ) | 31.48 | ||||||||||
Issued | (309 | ) | 74.56 | (309 | ) | 74.56 | ||||||||||
|
|
|
| |||||||||||||
Outstanding at December 31, 2014 | 716 | $ | 121.38 | 716 | 121.38 | |||||||||||
Granted | 126 | 151.33 | ||||||||||||||
Cancelled | (52 | ) | 135.92 | |||||||||||||
Issued | (293 | ) | 85.40 | |||||||||||||
|
|
|
| |||||||||||||
Outstanding at December 31, 2015 | 497 | $ | 149.40 | |||||||||||||
|
| |||||||||||||||
6. Acquisitions
2015 Acquisitions
During 2015, the Company completed acquisitions of Shell portfolios related to our fuel card businesses in Europe, as well as a small acquisition internationally, with an aggregate purchase price of $45.7 million, made additional investments of $8.4 million related to its equity method investment at Masternaut Group Holdings Limited (“Masternaut”) and deferred payments of $3.4 million related to acquisitions occurring in prior years. The following table summarizes the preliminary acquisition accounting for the acquisitions completed during 2015 (in thousands):
Trade and other receivables | $ | 462 | ||
Prepaid expenses and other | 1,093 | |||
Property and equipment | 203 | |||
Goodwill | 10,082 | |||
Other intangible assets | 39,433 | |||
Deferred tax liabilities | (2,558 | ) | ||
Liabilities assumed | (3,055 | ) | ||
|
| |||
Aggregate purchase prices | $ | 45,660 | ||
|
|
The estimated fair value of intangible assets acquired and the related estimated useful lives consisted of the following (in thousands):
| Useful Lives (in Years) | Value | |||||||
Customer relationships | 14-20 | $ | 39,433 | |||||
|
| |||||||
| $ | 39,433 | |||||||
|
| |||||||
These acquisitions were not material individually or in the aggregate to the Company’s consolidated financial statements. The accounting for certain of these acquisitions is preliminary pending completing the valuation of intangible assets, income taxes and evaluation of acquired contingencies.
2014 Acquisitions
During 2014, the Company completed acquisitions with an aggregate purchase price of $3.67 billion, net of cash acquired of $165.8 million.
Equity Method Investment in Masternaut
On April 28, 2014, the Company completed an equity method investment in Masternaut, Group Holdings Limited (“Masternaut”), Europe’s largest provider of telematics solutions to commercial fleets. The Company owns 44% of the outstanding equity of Masternaut. This investment is included in “Equity method investment” in the Company’s consolidated balance sheets.
Comdata
On November 14, 2014, the Company acquired Comdata Inc. (“Comdata”) from Ceridian LLC, a portfolio company of funds affiliated with Thomas H. Lee Partners, L.P. (“THL”) and Fidelity National Financial Inc. (NYSE: FNF), for $3.42$3.4 billion, net of cash acquired. Comdata is a business-to-business provider of innovative
electronic payment solutions. As an issuer and a processor, Comdata provides fleet, virtual card and gift card solutions. This acquisition will complementcomplemented the Company’s current fuel card business in the U.S. and addadded a new product with the virtual payments business. Goodwill recognized is comprised primarily of expected synergies from combining the operations of the Company and Comdata and assembled workforce. The goodwill acquired with this business is not deductible for tax purposes. FleetCor financed the acquisition with approximately $2.4 billion of new debt and the issuance of approximately 7.6 million shares of FleetCor common stock, including amounts applied at the closing to the repayment of Comdata’s debt. Results from the acquired business have been reported in the Company’s North America segment since the date of acquisition. This acquisition resulted in $69.8 million of revenues, net and $19.1 million of net loss during 2014.
The following table summarizes the preliminary allocation of the purchase pricefinal acquisition accounting for Comdata (in thousands):
Restricted cash | $ | 93,312 | $ | 93,312 | ||||
Trade and other receivables | 637,242 | 638,137 | ||||||
Prepaid expenses and other | 16,077 | 15,443 | ||||||
Property and equipment | 17,984 | 17,984 | ||||||
Goodwill | 2,269,743 | 2,253,348 | ||||||
Other intangible assets | 1,630,700 | 1,630,700 | ||||||
Notes and other liabilities assumed | (802,112 | ) | (804,032 | ) | ||||
Deferred tax liabilities | (435,830 | ) | (423,977 | ) | ||||
Other long term liabilities | (6,841 | ) | (6,841 | ) | ||||
|
| |||||||
Aggregate purchase prices | $ | 3,420,275 | ||||||
Aggregate purchase price | $ | 3,414,074 | ||||||
|
| |||||||
IntangibleAcquisition accounting adjustments recorded during 2015 at Comdata were not material.
The final estimated fair value of intangible assets allocated in connection withacquired and the purchase price allocationsrelated estimated useful lives consisted of the following (in thousands):
| Useful Lives (in Years) | Value | |||||||
Customer relationships | 20 | $ | 1,269,700 | |||||
Trade names and trademarks—indefinite | N/A | 237,100 | ||||||
Software | 4 – 7 | 123,300 | ||||||
Non-competes | 3 | 600 | ||||||
|
| |||||||
| $ | 1,630,700 | |||||||
|
| |||||||
Customer relationships Trade names and trademarks—indefinite Software Non-competes The purchase price allocation related to this acquisition is preliminary as the Company is still completing the valuation for intangible assets, income taxes, certain acquired contingencies and the working capital adjustment period remains open. Goodwill recognized is comprised primarily of expected synergies from combining the operations of the Company and Comdata and assembled workforce. The goodwill acquired with this business is not deductible for tax purposes. Useful Lives
(in Years) Value 19 $ 1,269,700 N/A 237,100 4 – 7 123,300 3 600 $ 1,630,700
The following unaudited pro forma statements of income for the years ended December 31, 2014 and 2013 have been prepared to give effect to the Comdata acquisition described above assuming that it occurred on January 1, 2013. The pro forma statements of income are presented for illustrative purposes only and are not necessarily indicative of the results of operations that would have been obtained had this transaction actually occurred at the beginning of the periods presented, nor do they intend to be a projection of future results of operations. The pro forma statements of income have been prepared from the Company’s and Comdata’s historical audited consolidated statements of income for the years ended December 31, 2014 and 2013.
The pro forma information is based on estimates and assumptions that have been made solely for purposes of developing such pro forma information, including without limitations, purchase accounting adjustments. The pro forma financial information presented below also includes depreciation and amortization based on the valuation of Comdata’s tangible and intangible assets resulting from the acquisition. The pro forma financial information does not include any synergies or operating cost reductions that may be achieved from the combined operations.
| Pro forma statements of income for the year ended December 31 (unaudited) (in thousands except per share data) | ||||||||
| 2014 | 2013 | |||||||
Income statement data: | ||||||||
Revenues, net | $ | 1,715,090 | $ | 1,430,463 | ||||
Income before income taxes | 594,746 | 364,582 | ||||||
Net income | 421,693 | 226,667 | ||||||
Earnings per share: | ||||||||
Basic | $ | 4.64 | $ | 2.53 | ||||
Diluted | 4.51 | 2.46 | ||||||
Weighted average shares outstanding: | ||||||||
Basic | 90,940 | 89,418 | ||||||
Diluted | 93,604 | 92,280 | ||||||
Pro forma net income for 2013 at Comdata includes the impact of a nonrecurring $100.0 million legal settlement.
Other
During 2014, the Company has also acquired Pacific Pride, a U.S. fuel card business, and a fuel card portfoliobusiness from Shell in Germany. The following table summarizes the preliminary allocation of the purchase pricefinal acquisition accounting for these remaining acquisitions during 2014 (in thousands):
Trade and other receivables | $ | 62,260 | $ | 62,604 | ||||
Prepaid expenses and other | 232 | 232 | ||||||
Property and equipment | 71 | 71 | ||||||
Goodwill | 32,833 | 30,596 | ||||||
Other intangible assets | 48,343 | 47,974 | ||||||
Notes and other liabilities assumed | (66,524 | ) | (66,499 | ) | ||||
|
| |||||||
Aggregate purchase prices | $ | 77,215 | $ | 74,978 | ||||
|
| |||||||
IntangibleAcquisition accounting adjustments recorded during 2015 were not material.
The final estimated fair value of intangible assets allocated in connection withacquired and the purchase price allocationsrelated estimated useful lives consisted of the following (in thousands):
| Useful Lives (in Years) | Value | Useful Lives (in Years) | Value | |||||||||||||
Customer relationships | 14 –20 | $ | 15,943 | 8 | $ | 15,574 | ||||||||||
Trade names and trademarks—indefinite | N/A | 2,900 | N/A | 2,900 | ||||||||||||
Franchisee Agreements | 20 | 29,500 | ||||||||||||||
Franchisee agreements | 20 | 29,500 | ||||||||||||||
|
| |||||||||||||||
| $ | 48,343 | $ | 47,974 | |||||||||||||
|
| |||||||||||||||
The purchase price allocation related to these acquisitions is preliminary as the Company is still completing the valuation for intangible assets and certain acquired contingencies and the working capital adjustment period remains open. These other business acquisitions were not material individually or in the aggregate to the Company’s consolidated financial statements.
The Company incurred and expensed acquisition related costs of $29.2 million in 2014, which are included within general and administrative expenses in the Consolidated Statement of Income for the year ended December 31, 2014.
2013 Acquisitions
During 2013, the Company completed acquisitions with an aggregate purchase price of $839.3 million, net of cash acquired of $35.6 million, which included deferred payments of $36.8 million and the estimated fair value of contingent consideration of $83.1 million. During 2014, the Company made deferred payments of purchase price related to 2013 acquisitions of $23.2 million.
For certain acquisitions in 2013, the consideration transferred includes contingent consideration based on achieving specific financial metrics in future periods. The contingent consideration agreements (the “agreements”) require the Company to pay the respective prior owners if earnings before interest, taxes, depreciation and amortization (EBITDA) and revenues grow at a specified rate over the most recent corresponding specified period, based on a sliding scale. The fair value of the arrangements included in the acquisition consideration was estimated using a Monte Carlo Simulation approach and the probability-weighted discounted cash flow approach and considered historic expenses, historic EBITDA and revenue growth and current projections for the respective acquired entities.
During 2014, the Company recorded adjustments to the estimated fair value of contingent consideration of $28.1 million, based on actual results of the business, which included the impact of an unfavorable tax judgment against VB during the fourth quarter of 2014. Adjustments are recorded within other operating, net within our consolidated statements of income. At December 31, 2014,In February 2015, the Company has recorded $42.9paid $39.8 million of contingent consideration, which was paid on February 13, 2015.consideration.
Fleet Card
On March 25, 2013, the Company acquired certain fuel card assets from GE Capital Australia’s Custom Fleet leasing business. The consideration for the transaction was paid using the Company’s existing cash and credit facilities. GE Capital’s “Fleet Card” is a multi-branded fuel card product with wide acceptance in fuel outlets and automotive service and repair centers across Australia. Through this transaction, the Company acquired the Fleet Card product, brand, acceptance network contracts, supplier contracts, and approximately one-third of the customer relationships with regards to fuel cards (together, “Fleet Card”). The remaining customer relationships were retained by Custom Fleet, and are comprised of companies which have commercial relationships with Custom Fleet beyond fueling, such as fleet management and leasing. The purpose of this acquisition was to establish the Company’s presence in the Australian marketplace. Results from the acquired business have been reported in the Company’s International segment since the date of acquisition. This business acquisition was not material individually or in the aggregate with other current year acquisitions to the Company’s consolidated financial statements. The goodwill related to this acquisition is not deductible for tax purposes.
CardLink
On April 29, 2013, the Company acquired all of the outstanding stock of CardLink. The consideration for the transaction was paid using the Company’s existing cash and credit facilities. CardLink provides a proprietary fuel card program with acceptance at retail fueling stations across New Zealand. CardLink markets its fuel cards directly to mostly small-to-midsized businesses, and provides processing and outsourcing services to oil companies and other partners. With this transaction, the Company entered into a $12.0 million New Zealand dollar ($9.4 million) revolving line of credit, which will be used to fund the working capital needs of the CardLink business. The purpose of this acquisition was to enter the Australia and New Zealand regions and followsfollowed the Company’s recent purchase of GE Capital’s Fleet Card business in Australia. Results from the
acquired business have been reported in the Company’s International segment since the date of acquisition. This business acquisition was not material individually or in the aggregate with other current year acquisitions to the Company’s consolidated financial statements. The goodwill related to this acquisition is not deductible for tax purposes.
VB
On August 9, 2013, the Company acquired all of the outstanding stock of VB Servicos, Comercio e Administracao LTDA (“VB”), a provider of transportation cards and vouchers in Brazil. The consideration for the transaction was paid using the Company’s existing cash and credit facilities. VB is a provider of transportation cards in Brazil where employers are required by legislation to provide certain employees with prepaid public transportation cards to subsidize their commuting expenses. VB also markets food cards. The purpose of this acquisition was to strengthen the Company’s presence in the Brazilian marketplace. Results from the acquired business have been reported in the Company’s International segment since the date of acquisition. This business acquisition was not material individually or in the aggregate with other current year acquisitions to the Company’s consolidated financial statements. The goodwill related to this acquisition is deductible for tax purposes.
Epyx
On October 1, 2013, the Company acquired all of the outstanding stock of Epyx, a provider to the fleet maintenance, service and repair marketplace in the UK. Epyx provides an internet based system and a network of vehicle repair network service garages to fleet operators in the UK. The Epyx service helps its customers better manage their vehicle maintenance, service, and repair needs. The Epyx service automates repair authorization, schedules service appointments, controls costs, and simplifies overall vehicle service administration. Epyx earns transaction fees on each of the millions of service incidents that it supports each year. The purpose of this acquisition iswas to allow the Company to extend beyond fleet fueling in the UK marketplace to fleet maintenance services, a complementary service to existing fleet customers. Results from the acquired business have been reported in the
Company’s International segment since the date of acquisition. This business acquisition was not material individually or in the aggregate with other current year acquisitions to the Company’s consolidated financial statements. The goodwill acquired with this business is not deductible for tax purposes.
DB
On October 15, 2013, the Company acquired all of the outstanding stock of DB Trans S.A. (“DB”), a provider of payment solutions for independent truckers in Brazil. The purpose of this acquisition iswas to strengthen the Company’s presence in the Brazilian marketplace. Results from the acquired business have been reported in the Company’s International segment since the date of acquisition. This business acquisition was not material individually or in the aggregate with other current year acquisitions to the Company’s consolidated financial statements. The goodwill acquired with this business is not deductible for tax purposes.
NexTraq
On October 17, 2013, the Company acquired all of the outstanding stock of NexTraq, a U.S. based provider of telematics solutions to small and mid-sized businesses. NexTraq provides fleet operators with an internet based system that enhances workforce productivity through real time vehicle tracking, route optimization, job dispatch, and fuel usage monitoring. The purpose of this acquisition iswas to provide the Company with a cross marketing opportunity due to the similarity of the commercial fleet customer base. Results from the acquired business have been reported in the Company’s North America segment since the date of acquisition. This business acquisition was not material individually or in the aggregate with other current year acquisitions to the Company’s consolidated financial statements. The goodwill acquired with this business is not deductible for tax purposes.
2013 Totals
The following table summarizes the preliminaryfinal allocation of the purchase price for all acquisitions during 2013 (in thousands):
Trade and other receivables | $ | 71,767 | ||
Prepaid expenses and other | 12,151 | |||
Property and equipment | 5,791 | |||
Other long term assets | 53,737 | |||
Goodwill | 641,361 | |||
Other intangible assets | 473,000 | |||
Notes and other liabilities assumed | (284,974 | ) | ||
Deferred tax liabilities | (83,470 | ) | ||
Other long term liabilities | (50,092 | ) | ||
|
| |||
Aggregate purchase prices | $ | 839,271 | ||
|
|
Intangible assets allocated in connection with the purchase price allocations consisted of the following (in thousands):
| Useful Lives (in Years) | Value | |||||||
Customer relationships | 3 – 20 | $ | 357,260 | |||||
Trade names and trademarks—indefinite | N/A | 46,900 | ||||||
Trade names and trademarks | 15 | 200 | ||||||
Merchant network | 10 | 16,750 | ||||||
Software | 3 – 10 | 36,890 | ||||||
Non-competes | 5 | 15,000 | ||||||
|
| |||||||
| $ | 473,000 | |||||||
|
| |||||||
Goodwill recognized is comprised primarily of expected synergies from combining the operations of the Company and the acquired businesses. The Company incurred and expensed acquisition related costs of $6.0 million in 2013, which are included within general and administrative expenses in the Consolidated Statement of Income for the year ended December 31, 2013. Included within the purchase price allocation above for 2013 are certain indemnification assets and liabilities related to acquired businesses.
In connection with 2013 acquisitions, the Company has uncertain tax positions aggregating $11.3$6.9 million and contingent liabilities aggregating $49.2$17.3 million. The Company has been indemnified by the respective sellers for a portion of these acquired liabilities. As a result, an indemnification asset of $45.3$22.1 million was recorded. The reasonably possible range of acquisition related contingent liabilities that the Company estimates would be incurred is $60.4$22.5 million at the low end of the range to $89.6$24.2 million at the high end of the range.
2012 Acquisitions
During 2012, the Company completed several foreign acquisitions with an aggregate purchase price of $207.4 million, net of cash acquired, which includes deferred payments of $11.3 million and contingent consideration payments of $4.9 million. The Company has estimated the fair value of remaining payments related to this contingent consideration of $0.5 million at December 31, 2014.
Russian Fuel Card Company
On June 15, 2012, the Company acquired all of the outstanding stock of a leading Russian fuel card company. The consideration for the transaction was paid using the Company’s existing cash and credit facilities. In connection with the transaction, a final payment of $11.3 million was paid in December 2013. The acquired
company is a Russian leader in fuel card systems and serves major oil clients and hundreds of independent fuel card issuers. Its technology allows issuers to share their retail network, thereby expanding the reach of their networks. Results from the acquired Russian business have been reported in the Company’s International segment since the date of acquisition. The purpose of this acquisition was to further expand the Company’s presence in the Russian fuel card marketplace. This business acquisition was not material to the Company’s consolidated financial statements. Goodwill recognized is comprised primarily of expected synergies from combining the operations of the Company and the Russian fuel card company. This business acquisition was not material individually or in the aggregate with other current year acquisitions to the Company’s consolidated financial statements. The goodwill acquired with this business is not deductible for tax purposes.
CTF Technologies, Inc.
On July 3, 2012, the Company acquired all of the outstanding stock of CTF Technologies, Inc. (“CTF”), a British Columbia organization, for $156 million. The consideration for the transaction was paid using the Company’s existing cash and credit facilities. CTF Technologies Do Brasil Ltda and certain of the Company’s other subsidiaries are wholly-owned entities of CTF. The acquisition was carried out pursuant to a plan of arrangement under the Business Corporations Act (British Columbia) and was approved by final order of the Supreme Court of British Columbia. The purpose of the transaction was to establish the Company’s presence in the Brazilian marketplace.
CTF provides fuel payment processing services for over-the-road fleets, ships, mining equipment, and railroads in Brazil. CTF’s payment platform links together fleet operators, banks, and oil companies. CTF earns revenue primarily from a recurring transaction fee paid by the oil companies who purchase services for their fleet customers under multi-year customer contracts. This business acquisition was not material individually or in the aggregate with other current year acquisitions to the Company’s consolidated financial statements. The goodwill acquired with this business is not deductible for tax purposes.
2012 Totals
The following table summarizes the allocation of the purchase price for all acquisitions during 2012, net of cash acquired (in thousands):
Trade and other receivables | $ | 13,197 | ||
Prepaid expenses and other | 6,014 | |||
Property and equipment | 6,701 | |||
Goodwill | 165,477 | |||
Other intangible assets | 109,782 | |||
Notes and other liabilities assumed | (42,845 | ) | ||
Deferred tax liabilities | (50,936 | ) | ||
|
| |||
Aggregate purchase prices | $ | 207,390 | ||
|
|
The purchase price is net of cash and cash equivalents acquired, totaling $1.9 million, and also included deferred payments of $11.3 million and a contingent consideration of $4.9 million.
Intangible assets allocated in connection with the purchase price allocations consisted of the following (in thousands):
| Weighted Average Useful Lives (in Years) | Value | |||||||
Customer relationships | 10 – 20 | $ | 77,678 | |||||
Trade names and trademarks—indefinite | N/A | 16,900 | ||||||
Merchant network | 10 | 4,604 | ||||||
Software | 3 – 10 | 9,800 | ||||||
Non-compete | 2 – 6 | 800 | ||||||
|
| |||||||
| $ | 109,782 | |||||||
|
| |||||||
Goodwill recognized is comprised primarily of expected synergies from combining the operations of the Company and the acquired businesses. The Company incurred acquisition related costs of $2.5 million in 2012, which are included within general and administrative expenses in the Consolidated Statements of Income. These acquisitions did not materially affect revenues and earnings during 2012.
7. Goodwill and Other Intangible Assets
A summary of changes in the Company’s goodwill by reportable business segment is as follows (in thousands):
| December 31, 2013 | Acquisitions | Purchase Price Adjustments | Foreign Currency | December 31, 2014 | December 31, 2014(1) | Acquisitions | Purchase Price Adjustments | Foreign Currency | December 31, 2015 | |||||||||||||||||||||||||||||||
Segment | ||||||||||||||||||||||||||||||||||||||||
North America | $ | 366,594 | $ | 2,290,657 | $ | 2,166 | $ | — | $ | 2,659,417 | $ | 2,659,417 | $ | — | $ | (19,008 | ) | $ | — | $ | 2,640,409 | |||||||||||||||||||
International | 1,186,131 | 11,918 | (7,361 | ) | (38,243 | ) | 1,152,445 | 1,053,765 | 10,082 | (2,237 | ) | (155,985 | ) | 905,625 | ||||||||||||||||||||||||||
|
|
|
|
|
|
|
|
|
| |||||||||||||||||||||||||||||||
| $ | 1,552,725 | $ | 2,302,575 | $ | (5,195 | ) | $ | (38,243 | ) | $ | 3,811,862 | $ | 3,713,182 | $ | 10,082 | $ | (21,245 | ) | $ | (155,985 | ) | $ | 3,546,034 | |||||||||||||||||
|
|
|
|
|
|
|
|
|
| |||||||||||||||||||||||||||||||
| December 31, 2012 | Acquisitions | Purchase Price Adjustments | Foreign Currency | December 31, 2013 | December 31, 2013(1) | Acquisitions | Purchase Price Adjustments | Foreign Currency(1) | December 31, 2014(1) | |||||||||||||||||||||||||||||||
Segment | ||||||||||||||||||||||||||||||||||||||||
North America | $ | 276,714 | $ | 89,880 | $ | — | $ | — | $ | 366,594 | $ | 366,594 | $ | 2,290,657 | $ | 2,166 | $ | — | $ | 2,659,417 | ||||||||||||||||||||
International | 649,895 | 556,676 | 80 | (20,520 | ) | 1,186,131 | 1,169,078 | 11,918 | (7,361 | ) | (119,870 | ) | 1,053,765 | |||||||||||||||||||||||||||
|
|
|
|
|
|
|
|
|
| |||||||||||||||||||||||||||||||
| $ | 926,609 | $ | 646,556 | $ | 80 | $ | (20,520 | ) | $ | 1,552,725 | $ | 1,535,672 | $ | 2,302,575 | $ | (5,195 | ) | $ | (119,870 | ) | $ | 3,713,182 | ||||||||||||||||||
|
|
|
|
|
|
|
|
|
| |||||||||||||||||||||||||||||||
Goodwill and other intangible asset purchase price adjustments in 2014 and 2013 are related to working capital adjustments in prior year foreign acquisitions.
| (1) | Amounts related to International segment have been adjusted due to revision of financial statements as discussed in the summary of significant accounting policies footnote. |
At December 31, 2015 and 2014, and 2013, approximately $387.9$351.0 million and $412.7$387.9 million of the Company’s goodwill is deductible for tax purposes, respectively. Purchase pricedprice adjustments recorded in 2015 and 2014 are a result of the Company completing the purchase price allocationsits acquisition accounting and working capital adjustment periods for certain prior year acquisitions.
Other intangible assets consisted of the following at December 31 (in thousands):
| 2014 | 2013 | 2015 | 2014 | |||||||||||||||||||||||||||||||||||||||||||||||||||
| Weighted- Avg Useful Life (Years) | Gross Carrying Amounts | Accumulated Amortization | Net Carrying Amount | Gross Carrying Amounts | Accumulated Amortization | Net Carrying Amount | Weighted- Avg Useful Life (Years) | Gross Carrying Amounts | Accumulated Amortization | Net Carrying Amount | Gross Carrying Amounts (1) | Accumulated Amortization | Net Carrying Amount (1) | |||||||||||||||||||||||||||||||||||||||||
Customer and vendor agreements | 15.1 | $ | 2,139,339 | $ | (205,365 | ) | $ | 1,933,974 | $ | 850,809 | $ | (134,998 | ) | $ | 715,811 | 18.4 | $ | 2,071,928 | $ | (329,664 | ) | $ | 1,742,264 | $ | 2,098,341 | $ | (205,365 | ) | $ | 1,892,976 | ||||||||||||||||||||||||
Trade names and trademarks | indefinite | 337,467 | — | 337,467 | 99,690 | — | 99,690 | |||||||||||||||||||||||||||||||||||||||||||||||
Trade names and trademarks | 15.0 | 3,332 | (1,847 | ) | 1,485 | 3,341 | (1,635 | ) | 1,706 | |||||||||||||||||||||||||||||||||||||||||||||
Trade names and trademarks—indefinite lived | N/A | 318,048 | — | 318,048 | 329,593 | — | 329,593 | |||||||||||||||||||||||||||||||||||||||||||||||
Trade names and trademarks—other | 14.6 | 3,067 | (2,058 | ) | 1,009 | 3,096 | (1,847 | ) | 1,249 | |||||||||||||||||||||||||||||||||||||||||||||
Software | 5.0 | 174,507 | (21,511 | ) | 152,996 | 47,778 | (9,090 | ) | 38,688 | 5.1 | 170,085 | (54,250 | ) | 115,835 | 172,533 | (21,511 | ) | 151,022 | ||||||||||||||||||||||||||||||||||||
Non-compete agreements | 5.6 | 17,724 | (6,279 | ) | 11,445 | 18,499 | (3,131 | ) | 15,368 | 4.9 | 15,209 | (8,770 | ) | 6,439 | 17,681 | (6,279 | ) | 11,402 | ||||||||||||||||||||||||||||||||||||
|
|
|
|
|
|
|
|
|
|
|
| |||||||||||||||||||||||||||||||||||||||||||
Total other intangibles | $ | 2,672,369 | $ | (235,002 | ) | $ | 2,437,367 | $ | 1,020,117 | $ | (148,854 | ) | $ | 871,263 | $ | 2,578,337 | $ | (394,742 | ) | $ | 2,183,595 | $ | 2,621,244 | $ | (235,002 | ) | $ | 2,386,242 | ||||||||||||||||||||||||||
|
|
|
|
|
|
|
|
|
|
|
| |||||||||||||||||||||||||||||||||||||||||||
| (1) | Amounts have been adjusted due to revision of financial statements as discussed in the summary of significant accounting policies footnote. |
Changes in foreign exchange rates resulted in an $82.0 million decrease to the carrying values of other intangible assets in the year ended December 31, 2015. Amortization expense related to intangible assets for the years ended December 31, 2015, 2014 and 2013, and 2012, was $159.7 million, $86.1 million $49.3 million and $32.4$49.3 million, respectively.
The future estimated amortization of intangibles at December 31, 20142015 is as follows (in thousands):
2015 | $ | 159,990 | ||||||
2016 | 160,074 | $ | 143,979 | |||||
2017 | 156,908 | 152,889 | ||||||
2018 | 153,232 | 149,320 | ||||||
2019 | 137,495 | 136,571 | ||||||
2020 | 115,430 | |||||||
Thereafter | 1,332,201 | 1,167,358 | ||||||
8. Property, Plant and Equipment
Property, plant and equipment, net consisted of the following at December 31 (in thousands):
| Estimated Useful Lives (in Years) | 2014 | 2013 | Estimated Useful Lives (in Years) | 2015 | 2014 | |||||||||||||||
Computer hardware and software | 3 to 7 | $ | 100,383 | $ | 78,460 | 3 to 5 | $ | 131,409 | $ | 100,383 | ||||||||||
Card-reading equipment | 5 | 13,066 | 12,649 | 5 | 10,887 | 13,066 | ||||||||||||||
Furniture, fixtures, and vehicles | 3 to 6 | 10,319 | 9,420 | 5 | 10,291 | 10,319 | ||||||||||||||
Buildings and improvements | 10 to 30 | 11,294 | 10,571 | 5 to 7 | 10,982 | 11,294 | ||||||||||||||
|
|
|
| |||||||||||||||||
Property, plant and equipment, gross | 135,062 | 111,100 | 163,569 | 135,062 | ||||||||||||||||
Less: accumulated depreciation | (61,499 | ) | (57,144 | ) | (82,809 | ) | (61,499 | ) | ||||||||||||
|
|
|
| |||||||||||||||||
Property, plant and equipment, net | $ | 73,563 | $ | 53,956 | $ | 80,760 | $ | 73,563 | ||||||||||||
|
|
|
| |||||||||||||||||
Depreciation expense related to property and equipment for the years ended December 31, 2015, 2014 and 2013 and 2012 was $30.5 million, $21.1 million $16.9 million and $14.1$16.9 million, respectively. Depreciation expense includes $11.6 million, $9.2 million $7.3 million and $5.7$7.3 million, for capitalized computer software costs for the years ended December 31, 2015, 2014 2013 and 2012,2013, respectively. At December 31, 20142015 and 2013,2014, the Company had unamortized computer software costs of $33.0$44.9 million and $24.6$33.0 million, respectively.
9. Accrued Expenses
Accrued expenses consisted of the following at December 31 (in thousands):
| 2014 | 2013 | |||||||
Accrued bonuses | $ | 7,677 | $ | 7,912 | ||||
Accrued interest | 3,558 | 314 | ||||||
Accrued payroll and severance | 19,958 | 3,640 | ||||||
Accrued taxes | 28,974 | 63,202 | ||||||
Accrued commissions/rebates | 40,991 | 1,734 | ||||||
Other | 77,217 | 38,068 | ||||||
|
|
|
| |||||
| $ | 178,375 | $ | 114,870 | |||||
|
|
|
| |||||
Prior year figures have been reclassified to conform to current year presentation.
| 2015 | 2014 | |||||||
Accrued bonuses | $ | 11,995 | $ | 7,677 | ||||
Accrued interest | 433 | 3,558 | ||||||
Accrued payroll and severance | 6,479 | 19,958 | ||||||
Accrued taxes | 5,977 | 28,974 | ||||||
Accrued commissions/rebates | 49,157 | 40,991 | ||||||
Other | 76,636 | 77,217 | ||||||
|
|
|
| |||||
| $ | 150,677 | $ | 178,375 | |||||
|
|
|
| |||||
10. Debt
The Company’s debt instruments at December 31 consist primarily of term notes, revolving lines of credit and a Securitization Facility as follows (in thousands):
| 2014 | 2013 | 2015 | 2014 | |||||||||||||
Term note payable—domestic(a), net of discounts | $ | 2,261,005 | $ | 496,875 | ||||||||||||
Term notes payable—domestic(a), net of discounts | $ | 2,159,438 | $ | 2,261,005 | ||||||||||||
Revolving line of credit A Facility—domestic(a) | 595,000 | 425,000 | 160,000 | 595,000 | ||||||||||||
Revolving line of credit A Facility—foreign(a) | 53,204 | 202,839 | — | 53,204 | ||||||||||||
Revolving line of credit B Facility—foreign(a) | — | 7,099 | ||||||||||||||
Revolving line of credit—New Zealand(c) | — | — | ||||||||||||||
Other debt(d) | 9,508 | 5,565 | ||||||||||||||
Other debt(c) | 3,624 | 9,508 | ||||||||||||||
|
|
|
| |||||||||||||
Total notes payable and other obligations | 2,918,717 | 1,137,378 | 2,323,062 | 2,918,717 | ||||||||||||
Securitization facility(b) | 675,000 | 349,000 | ||||||||||||||
Securitization Facility(b) | 614,000 | 675,000 | ||||||||||||||
|
|
|
| |||||||||||||
Total notes payable, credit agreements and Securitization Facility | $ | 3,593,717 | $ | 1,486,378 | $ | 2,937,062 | $ | 3,593,717 | ||||||||
|
|
|
| |||||||||||||
Current portion | $ | 1,424,764 | $ | 1,011,439 | $ | 875,647 | $ | 1,424,764 | ||||||||
Long-term portion | 2,168,953 | 474,939 | 2,061,415 | 2,168,953 | ||||||||||||
|
|
|
| |||||||||||||
Total notes payable, credit agreements and Securitization Facility | $ | 3,593,717 | $ | 1,486,378 | $ | 2,937,062 | $ | 3,593,717 | ||||||||
|
|
|
| |||||||||||||
| (a) | On October 24, 2014, the Company entered into a |
| arrears. Interest on the term loan B facility accrues based on the Eurocurrency Rate or the Base Rate, as described above, except that the applicable margin is fixed at 3% for |
| November 14, 2021 for the term loan B. The term loans are payable in quarterly installments and are due on the last business day of each March, June, September, and December with the final principal payment due on the respective maturity date. Borrowings on the revolving line of credit are repayable at the option of one, two, three or nine months after borrowing, depending on the term of the borrowing on the facility. Borrowings on the foreign swing line of credit are due no later than ten business days after such loan is made. There were no borrowings outstanding at December 31, |
Principal payments of $546.9$103.5 million were made on the term loans during 2014.2015.
| (b) | The Company is party to a |
| (c) |
| Other debt includes the long term portion of contingent consideration and deferred payments associated with certain of our businesses. |
The Company was in compliance with all financial and non-financial covenants at December 31, 2014.2015.
The contractual maturities of the Company’s notes payable and other obligations at December 31, 20142015 are as follows (in thousands):
2015 | $ | 749,764 | ||||||
2016 | 109,582 | $ | 261,647 | |||||
2017 | 102,915 | 104,958 | ||||||
2018 | 203,131 | 203,127 | ||||||
2019 | 1,516,215 | 1,516,210 | ||||||
2020 | 1,676 | |||||||
Thereafter | 237,110 | 235,444 | ||||||
11. Income Taxes
Income before the provision for income taxes is attributable to the following jurisdictions (in thousands) for years ended December 31:
| 2014 | 2013 | 2012 | 2015 | 2014 | 2013 | |||||||||||||||||||
United States | $ | 233,933 | $ | 205,033 | $ | 186,301 | $ | 304,743 | $ | 233,933 | $ | 205,033 | ||||||||||||
Foreign | 279,010 | 198,536 | 124,489 | 231,261 | 279,010 | 198,536 | ||||||||||||||||||
|
|
|
|
|
| |||||||||||||||||||
Total | $ | 512,943 | $ | 403,569 | $ | 310,790 | $ | 536,004 | $ | 512,943 | $ | 403,569 | ||||||||||||
|
|
|
|
|
| |||||||||||||||||||
The provision (benefit) for income taxes for the years ended December 31 consists of the following (in thousands):
| 2014 | 2013 | 2012 | 2015 | 2014 | 2013 | |||||||||||||||||||
Current: | ||||||||||||||||||||||||
Federal | $ | 39,168 | $ | 72,909 | $ | 62,886 | $ | 82,926 | $ | 39,168 | $ | 72,909 | ||||||||||||
State | 8,208 | 7,369 | 4,551 | 8,051 | 8,208 | 7,369 | ||||||||||||||||||
Foreign | 55,144 | 46,026 | 29,551 | 51,970 | 55,144 | 46,026 | ||||||||||||||||||
|
|
|
|
|
| |||||||||||||||||||
Total current | 102,520 | 126,304 | 96,988 | 142,947 | 102,520 | 126,304 | ||||||||||||||||||
Deferred: | ||||||||||||||||||||||||
Federal | 41,814 | (1,287 | ) | 2,295 | 36,723 | 41,814 | (1,287 | ) | ||||||||||||||||
State | (596 | ) | 130 | 417 | 1,525 | (596 | ) | 130 | ||||||||||||||||
Foreign | 498 | (6,079 | ) | (5,109 | ) | (7,622 | ) | 498 | (6,079 | ) | ||||||||||||||
|
|
|
|
|
| |||||||||||||||||||
Total deferred | 41,716 | (7,236 | ) | (2,397 | ) | 30,626 | 41,716 | (7,236 | ) | |||||||||||||||
|
|
|
|
|
| |||||||||||||||||||
Total provision | $ | 144,236 | $ | 119,068 | $ | 94,591 | $ | 173,573 | $ | 144,236 | $ | 119,068 | ||||||||||||
|
|
|
|
|
| |||||||||||||||||||
The provision for income taxes differs from amounts computed by applying the U.S. federal tax rate of 35% to income before income taxes for the years ended December 31 due to the following (in thousands):
| 2014 | 2013 | 2012 | 2015 | 2014 | 2013 | |||||||||||||||||||||||||||||||||||||||||||
Computed “expected” tax expense | $ | 179,530 | 35.00 | % | $ | 141,249 | 35.00 | % | $ | 108,777 | 35.00 | % | $ | 187,601 | 35.0 | % | $ | 179,530 | 35.0 | % | $ | 141,249 | 35.0 | % | ||||||||||||||||||||||||
Changes resulting from: | ||||||||||||||||||||||||||||||||||||||||||||||||
Change in valuation allowance | 20,243 | 3.8 | (53 | ) | — | (222 | ) | — | ||||||||||||||||||||||||||||||||||||||||
Foreign income tax differential | (24,972 | ) | (4.87 | ) | (16,021 | ) | (3.97 | ) | (11,695 | ) | (3.76 | ) | (23,718 | ) | (4.4 | ) | (24,972 | ) | (4.9 | ) | (16,021 | ) | (4.0 | ) | ||||||||||||||||||||||||
State taxes net of federal benefits | 4,492 | 0.88 | 4,744 | 1.18 | 3,858 | 1.24 | 6,711 | 1.2 | 4,492 | 0.9 | 4,744 | 1.2 | ||||||||||||||||||||||||||||||||||||
Foreign-sourced nontaxable income | (8,128 | ) | (1.59 | ) | (11,967 | ) | (2.97 | ) | (8,840 | ) | (2.84 | ) | (10,573 | ) | (2.0 | ) | (8,128 | ) | (1.6 | ) | (11,967 | ) | (3.0 | ) | ||||||||||||||||||||||||
IRC Section 199 deduction | (10,221 | ) | (1.9 | ) | — | — | — | — | ||||||||||||||||||||||||||||||||||||||||
Other | (6,685 | ) | (1.32 | ) | 1,063 | 0.26 | 2,491 | 0.76 | 3,530 | 0.7 | (6,633 | ) | (1.3 | ) | 1,285 | 0.3 | ||||||||||||||||||||||||||||||||
|
|
|
|
|
|
|
|
|
|
|
| |||||||||||||||||||||||||||||||||||||
Provision for income taxes | $ | 144,236 | 28.10 | % | $ | 119,068 | 29.50 | % | $ | 94,591 | 30.40 | % | $ | 173,573 | 32.4 | % | $ | 144,236 | 28.1 | % | $ | 119,068 | 29.5 | % | ||||||||||||||||||||||||
|
|
|
|
|
|
|
|
|
|
|
| |||||||||||||||||||||||||||||||||||||
The Company recorded tax adjustments related to U.S. planning initiatives that were implemented during the third quarter of 2015. The impact of those adjustments, which involved amending tax returns for several prior years, was a decrease of tax expense of approximately $7.9 million.
The tax effects of temporary differences that give rise to significant portions of the deferred tax assets and liabilities at December 31 are as follows (in thousands):
| 2014 | 2013 | 2015 | 2014 | |||||||||||||
Deferred tax assets: | ||||||||||||||||
Accounts receivable, principally due to the allowance for doubtful accounts | $ | 7,434 | $ | 4,451 | $ | 6,277 | $ | 7,434 | ||||||||
Accrued expenses not currently deductible for tax | 5,610 | — | 5,797 | 5,610 | ||||||||||||
Stock based compensation | 16,405 | 12,022 | 35,066 | 16,405 | ||||||||||||
Income tax credit | 3,830 | 1,349 | ||||||||||||||
Income tax credits | 3,830 | 3,830 | ||||||||||||||
Net operating loss carry forwards | 127,487 | 4,438 | 39,970 | 127,487 | ||||||||||||
Fixed assets | 3,483 | 4,135 | ||||||||||||||
Basis Difference In Equity Investment | 3,262 | — | ||||||||||||||
Accrued Escheat | 12,058 | — | ||||||||||||||
Other | 9,385 | 541 | ||||||||||||||
Equity investment | 38,760 | 3,262 | ||||||||||||||
Accrued escheat | 13,497 | 12,058 | ||||||||||||||
Fixed assets, intangibles and other | 14,191 | 12,868 | ||||||||||||||
|
|
|
| |||||||||||||
Deferred tax assets before valuation allowance | 188,954 | 26,936 | 157,388 | 188,954 | ||||||||||||
Valuation allowance | (27,082 | ) | (1,450 | ) | (62,605 | ) | (27,082 | ) | ||||||||
|
|
|
| |||||||||||||
Deferred tax assets, net | 161,872 | 25,486 | 94,783 | 161,872 | ||||||||||||
|
|
|
| |||||||||||||
Deferred tax liabilities: | ||||||||||||||||
Property and equipment, principally due to differences between book and tax depreciation | (868 | ) | (4,180 | ) | ||||||||||||
Intangibles—including goodwill | (833,910 | ) | (226,396 | ) | ||||||||||||
Intangibles—including goodwill(1) | (732,017 | ) | (818,680 | ) | ||||||||||||
Basis difference in investment in foreign subsidiaries | (23,128 | ) | (25,145 | ) | (47,737 | ) | (23,128 | ) | ||||||||
Other | (17,684 | ) | (14,519 | ) | ||||||||||||
Property and equipment, principally due to differences between book and tax depreciation, and other | (19,544 | ) | (18,552 | ) | ||||||||||||
|
|
|
| |||||||||||||
Deferred tax liabilities | (875,590 | ) | (270,240 | ) | ||||||||||||
Deferred tax liabilities(1) | (799,298 | ) | (860,360 | ) | ||||||||||||
|
|
|
| |||||||||||||
Net deferred tax liabilities | $ | (713,718 | ) | $ | (244,754 | ) | ||||||||||
Net deferred tax liabilities(1) | $ | (704,515 | ) | $ | (698,488 | ) | ||||||||||
|
|
|
| |||||||||||||
| (1) | Deferred tax liabilities related to intangibles—including goodwill at December 31, 2014 have been adjusted due to revision of financial statements as discussed in the summary of significant accounting policies footnote. |
The Company’s deferred tax balances are classified in its balance sheets based on net current items and net non-current items as of December 31 as follows (in thousands):
| 2014 | 2013 | 2015 | 2014 | |||||||||||||
Current deferred tax assets and liabilities: | ||||||||||||||||
Current deferred tax assets | $ | 101,451 | $ | 4,750 | $ | 9,585 | $ | 101,451 | ||||||||
Current deferred tax liabilities | (672 | ) | — | |||||||||||||
|
| |||||||||||||||
Net current deferred taxes | 8,913 | 101,451 | ||||||||||||||
|
| |||||||||||||||
Long term deferred tax assets and liabilities: | ||||||||||||||||
Long term deferred tax assets | 60,421 | 20,736 | 1,639 | 60,421 | ||||||||||||
Long term deferred tax liabilities | (875,590 | ) | (270,240 | ) | ||||||||||||
Long term deferred tax liabilities(1) | (715,067 | ) | (860,360 | ) | ||||||||||||
|
|
|
| |||||||||||||
Net long term deferred tax liabilities | (815,169 | ) | (249,504 | ) | ||||||||||||
Net long term deferred taxes(1) | (713,428 | ) | (799,939 | ) | ||||||||||||
|
|
|
| |||||||||||||
Net deferred tax liabilities | $ | (713,718 | ) | $ | (244,754 | ) | ||||||||||
Net deferred tax liabilities(1) | $ | (704,515 | ) | $ | (698,488 | ) | ||||||||||
|
|
|
| |||||||||||||
| (1) | Long term deferred tax liabilities at December 31, 2014 have been adjusted due to revision of financial statements as discussed in the summary of significant accounting policies footnote. |
We reduce federal and state income taxes payable by the tax benefits associated with the exercise of certain stock options. To the extent realized tax deductions for options exceed the amount previously recognized as deferred tax benefits related to share-based compensation for these option awards, we record an excess tax benefit in stockholders’ equity. We recorded excess tax benefits of $26.4 million, $56.8 million $32.5 million and $29.4$32.5 million in the years ended 2015, 2014 and 2013, and 2012, respectively.
At December 31, 2014,2015, U.S. taxes were not provided on earnings of the Company’s foreign subsidiaries. The Company’s intent is for such earnings to be reinvested by the subsidiaries or to be repatriated only when it would be tax effective through the utilization of foreign tax credits. If in the future these earnings are repatriated to the U.S, or if the Company determines that the earnings will be remitted in the foreseeable future, an additional tax provision and related liability may be required. If such earnings were distributed, U.S. income taxes would be partially reduced by available credits for taxes paid to the jurisdictions in which the income was earned.
Cumulative undistributed earnings of non-U.S. subsidiaries for which U.S. taxes have not been provided are included in consolidated retained earnings in the amount of approximately $865.8 million, $568.8 million and $388.3$1,097.1 million at December 31, 2014, 2013 and 2012, respectively.2015. Because of the availability of United States foreign tax credits, it is not practicable to determine the domestic federal income tax liability that would be payable if such earnings were not reinvested indefinitely.
The valuation allowance for deferred tax assets at December 31, 2015 and 2014 and 2013 was $27.1$62.6 million and $1.5$27.1 million, respectively. The valuation allowance relates to foreign and state net operating loss carry forwards, basis differences related to an equity method investment and foreign tax credit carry forwards. The net change in the total valuation allowance for the years ended December 31, 20142015 and 20132014 was an increase of $25.6$35.5 million and $0.1$25.6 million, respectively. The increase in 2015 was primarily due to changes in our deferred tax asset related to basis differences in an equity method investment. The increase in 2014 was primarily due to the state net operating loss carry forwards and foreign tax credit carry forwards acquired with Comdata in 2014.
As of December 31, 2014,2015, the Company had a net operating loss carryforward for federal income tax purposes of $237.4 million that is available to offset federal taxable income through 2033. The Company had a net operating loss carryforwards for state income tax purposes of approximately $869.0$776.6 million that areis available to offset future state taxable income through 2026.2027. Additionally, the Company had $4.4$11.8 million net operating loss carryforwards for foreign income tax purposes that are available to offset future foreign taxable income. The foreign net operating loss carryforwards will not expire in future years.
The Company recognizes interest and penalties on unrecognized tax benefits (including interest and penalties calculated on uncertain tax positions on which the Company believes it will ultimately prevail) within the provision for income taxes on continuing operations in the consolidated financial statements. This policy is a continuation of the Company’s policy prior to adoption of the guidance regarding uncertain tax positions. During 2014, 20132015 and 2012,2014, the Company had recorded accrued interest and penalties related to the unrecognized tax benefits of $5.4 million and $7.4 million, $8.8respectively.
A reconciliation of the beginning and ending balances of the total amounts of gross unrecognized tax benefits including interest for the years ended December 31, 2015, 2014 and 2013 is as follows (in thousands):
Unrecognized tax benefits at December 31, 2012 | $ | 7,077 | ||
Additions based on tax provisions related to the current year | 1,337 | |||
Additions based on tax provisions related to the prior year | 15,249 | |||
Deductions based on settlement/expiration of prior year tax positions | (2,062 | ) | ||
|
| |||
Unrecognized tax benefits at December 31, 2013 | 21,601 | |||
Additions based on tax provisions related to the current year | 1,676 | |||
Deductions based on settlement/expiration of prior year tax positions | (4,636 | ) | ||
|
| |||
Unrecognized tax benefits at December 31, 2014 | $ | 18,641 | ||
Additions based on tax provisions related to the current year | 9,079 | |||
Additions based on tax provisions related to the prior year | 477 | |||
Deductions based on settlement/expiration of prior year tax positions | (6,363 | ) | ||
|
| |||
Unrecognized tax benefits at December 31, 2015 | $ | 21,834 | ||
|
|
As of December 31, 2015, the Company had total unrecognized tax benefits of $21.8 million and $1.5of which $15.0 million, respectively.if recognized, would affect its effective tax rate. It is not anticipated that there are any unrecognized tax benefits that will significantly increase or decrease within the next twelve months.
The Company files numerous consolidated and separate income tax returns in the U.S. federal jurisdiction and various state and foreign jurisdictions. The statute of limitations for the Company’s U.S. federal income tax returns has expired for years prior to 2011.2012. The statute of limitations for the Company’s U.K. income tax returns has expired for years prior to 2012.2013. The statute of limitations has expired for years prior to 20102012 for the Company’s Czech Republic income tax returns, 20112012 for the Company’s Russian income tax returns, 20092010 for the Company’s Mexican income tax returns, 20092010 for the Company’s Brazilian income tax returns, 20092010 for the Company’s Luxembourg income tax returns, 20102011 for the Company’s New Zealand income tax returns, and 2013 for the Company’s Australian income tax returns.
A reconciliation of the beginning and ending balances of the total amounts of gross unrecognized tax benefits including interest for the years ended December 31, 2014, 2013 and 2012 is as follows (in thousands):
Unrecognized tax benefits at December 31, 2011 | $ | 4,994 | ||
Additions based on tax provisions related to the current year | 1,870 | |||
Additions based on tax provisions related to the prior year | 716 | |||
Deductions based on settlement/expiration of prior year tax positions | (503 | ) | ||
|
| |||
Unrecognized tax benefits at December 31, 2012 | 7,077 | |||
Additions based on tax provisions related to the current year | 1,337 | |||
Additions based on tax provisions related to the prior year | 15,249 | |||
Deductions based on settlement/expiration of prior year tax positions | (2,062 | ) | ||
|
| |||
Unrecognized tax benefits at December 31, 2013 | 21,601 | |||
Additions based on tax provisions related to the current year | 1,676 | |||
Deductions based on settlement/expiration of prior year tax positions | (4,636 | ) | ||
|
| |||
Unrecognized tax benefits at December 31, 2014 | $ | 18,641 | ||
|
|
As of December 31, 2014 the Company had total unrecognized tax benefits of $18.6 million of which $7.3 million, if recognized, would affect its effective tax rate. It is not anticipated that there are any unrecognized tax benefits that will significantly increase or decrease within the next twelve months.
12. Leases
The Company enters into noncancelable operating lease agreements for equipment, buildings and vehicles. The minimum lease payments for the noncancelable operating lease agreements are as follows (in thousands):
2015 | $ | 12,425 | ||||||
2016 | 8,549 | $ | 12,694 | |||||
2017 | 6,808 | 10,891 | ||||||
2018 | 5,658 | 9,313 | ||||||
2019 | 2,752 | 6,437 | ||||||
2020 | 4,930 | |||||||
Thereafter | 5,427 | 23,329 | ||||||
Rent expense for noncancelable operating leases approximated $14.1million, $12.5 million $9.8 million and $8.5$9.8 million for the years ended December 31, 2015, 2014 2013 and 2012,2013, respectively. The leases are generally renewable at the Company’s option for periods of one to five years.
13. Commitments and Contingencies
In the ordinary course of business, the Company is involved in various pending or threatened legal actions. The Company has recorded reserves for certain legal proceedings. The amounts recorded are estimated and as additional information becomes available, the Company will reassess the potential liability related to its pending litigation and revise its estimate in the period that information becomes known. In the opinion of management, the amount of ultimate liability, if any, with respect to these actions will not have a material adverse effect on the Company’s consolidated financial position, results of operations, or liquidity.
In connection with 2013 acquisitions, the Company has uncertain tax positions aggregating $11.3 million and contingent liabilities aggregating $49.2 million. The Company has been indemnified by the respective sellers for a portion of these acquired liabilities. As a result, an indemnification asset of $45.3 million was recorded. The
internal estimates recorded for the contingent liabilities are subject to change based on our final evaluation of the information available at the acquisition date. Any changes to the contingent liability based on our final conclusion will be accompanied by a corresponding change to the indemnification asset. It is reasonably possible that future events related to an amnesty program offered by the Brazilian government for certain tax contingencies may result in confirmation of the estimated loss recorded in the first half of 2015.
14. Earnings Per Share
The Company reports basic and diluted earnings per share. Basic earnings per share is computed by dividing net income attributable to shareholders of the Company by the weighted average number of common shares outstanding during the reported period. Diluted earnings per share reflect the potential dilution related to equity-based incentives using the if-converted and treasury stock method. There were no anti-dilutive securities in 2014, 2013 and 2012. The calculation and reconciliation of basic and diluted earnings per share for the years ended December 31 (in thousands, except per share data): follows:
| 2014 | 2013 | 2012 | 2015 | 2014 | 2013 | |||||||||||||||||||
Net income | $ | 368,707 | $ | 284,501 | $ | 216,199 | $ | 362,431 | $ | 368,707 | $ | 284,501 | ||||||||||||
|
|
|
|
|
| |||||||||||||||||||
Denominator for basic earnings per share | 84,317 | 81,793 | 83,328 | 92,023 | 84,317 | 81,793 | ||||||||||||||||||
Dilutive securities | 2,665 | 2,862 | 2,408 | 2,116 | 2,665 | 2,862 | ||||||||||||||||||
|
|
|
|
|
| |||||||||||||||||||
Denominator for diluted earnings per share | 86,982 | 84,655 | 85,736 | 94,139 | 86,982 | 84,655 | ||||||||||||||||||
|
|
|
|
|
| |||||||||||||||||||
Basic earnings per share | $ | 4.37 | $ | 3.48 | $ | 2.59 | $ | 3.94 | $ | 4.37 | $ | 3.48 | ||||||||||||
Diluted earnings per share | 4.24 | 3.36 | 2.52 | 3.85 | 4.24 | 3.36 | ||||||||||||||||||
Basic
Diluted earnings per share for the year ended December 31, 2015 excludes the effect of 1.4 million shares includesof common stock that may be issued upon the impactexercise of share-based payment awards classified as participating securities, which are not material to the calculation of basic shares.employee stock options because such effect would be antidilutive. There were no antidilutive shares for 2014 and 2013. Diluted earnings per share also excludes the effect of 0.2 million, 0.5 million and 0.3 million shares of performance based restricted stock for which the performance criteria have not yet been achieved for the years ended December 31, 2015, 2014 and 2013, or 2012.respectively.
15. Segments
The Company reports information about its operating segments in accordance with the authoritative guidance related to segments. The Company’s reportable segments represent components of the business for which separate financial information is evaluated regularly by the chief operating decision maker in determining how to allocate resources and in assessing performance. The Company operates in two reportable segments, North America and International. Certain operating segments are aggregated in both our North America and International reportable segments. The Company has aggregated these operating segments due to commonality of the products in each of their business lines having similar economic characteristics, services, customers and processes. There were no significant intersegment sales.
The Company’s segment results are as follows as of and for the years ended December 31 (in thousands):
| 2014 | 2013 | 2012 | 2015 | 2014 | 2013 | |||||||||||||||||||
Revenues, net: | ||||||||||||||||||||||||
North America | $ | 668,328 | $ | 460,705 | $ | 400,164 | $ | 1,231,957 | $ | 668,328 | $ | 460,705 | ||||||||||||
International | 531,062 | 434,466 | 307,370 | 470,908 | 531,062 | 434,466 | ||||||||||||||||||
|
|
|
|
|
| |||||||||||||||||||
| $ | 1,199,390 | $ | 895,171 | $ | 707,534 | $ | 1,702,865 | $ | 1,199,390 | $ | 895,171 | |||||||||||||
|
|
|
|
|
| |||||||||||||||||||
Operating income: | ||||||||||||||||||||||||
North America | $ | 287,303 | $ | 220,526 | $ | 196,677 | $ | 442,052 | $ | 287,303 | $ | 220,526 | ||||||||||||
International | 278,146 | 200,106 | 128,251 | 225,482 | 278,146 | 200,106 | ||||||||||||||||||
|
|
|
|
|
| |||||||||||||||||||
| $ | 565,449 | $ | 420,632 | $ | 324,928 | $ | 667,534 | $ | 565,449 | $ | 420,632 | |||||||||||||
|
|
|
|
|
| |||||||||||||||||||
Depreciation and amortization: | ||||||||||||||||||||||||
North America | $ | 39,275 | $ | 22,267 | $ | 20,289 | $ | 127,863 | $ | 39,275 | $ | 22,267 | ||||||||||||
International | 73,086 | 50,470 | 31,747 | 65,590 | 73,086 | 50,470 | ||||||||||||||||||
|
|
|
|
|
| |||||||||||||||||||
| $ | 112,361 | $ | 72,737 | $ | 52,036 | $ | 193,453 | $ | 112,361 | $ | 72,737 | |||||||||||||
|
|
|
|
|
| |||||||||||||||||||
Capital expenditures: | ||||||||||||||||||||||||
North America | $ | 9,407 | $ | 6,132 | $ | 7,735 | $ | 19,883 | $ | 9,407 | $ | 6,132 | ||||||||||||
International | 17,663 | 14,653 | 11,376 | 21,992 | 17,663 | 14,653 | ||||||||||||||||||
|
|
|
|
|
| |||||||||||||||||||
| $ | 27,070 | $ | 20,785 | $ | 19,111 | $ | 41,875 | $ | 27,070 | $ | 20,785 | |||||||||||||
|
|
|
|
|
| |||||||||||||||||||
Long-lived assets (excluding goodwill): | ||||||||||||||||||||||||
North America | $ | 1,833,311 | $ | 173,608 | $ | 152,516 | $ | 1,721,153 | $ | 1,833,311 | $ | 173,608 | ||||||||||||
International | 750,051 | 852,390 | 447,391 | |||||||||||||||||||||
International(1) | 602,941 | 698,925 | 845,925 | |||||||||||||||||||||
|
|
|
|
|
| |||||||||||||||||||
| $ | 2,583,362 | $ | 1,025,998 | $ | 599,907 | $ | 2,324,094 | $ | 2,532,236 | $ | 1,019,533 | |||||||||||||
|
|
|
|
|
| |||||||||||||||||||
| (1) | Amounts at December 31, 2014 and 2013, respectively, have been adjusted due to revision of financial statements as discussed in the summary of significant accounting policies footnote. |
The Company attributes revenues, net from external customers to individual countries based upon the country in which the related services were rendered. The table below presents certain financial information related to the Company’s significant foreign operations as of and for the years ended December 31 (in thousands):
| 2014 | 2013 | 2012 | 2015 | 2014 | 2013 | |||||||||||||||||||
Revenues, net: | ||||||||||||||||||||||||
United States (country of domicile) | $ | 667,878 | $ | 460,111 | $ | 399,573 | $ | 1,231,641 | $ | 667,878 | $ | 460,111 | ||||||||||||
United Kingdom | 262,613 | 198,762 | 153,305 | 248,598 | 262,613 | 198,762 | ||||||||||||||||||
Long-lived assets (excluding goodwill): United States (country of domicile) United Kingdom(1) Brazil(1) 2015 2014 $ 1,721,055 $ 1,833,311 332,788 332,362 146,596 211,340
| 2014 | 2013 | |||||||
Long-lived assets (excluding goodwill): | ||||||||
United States (country of domicile) | $ | 1,833,311 | $ | 173,354 | ||||
United Kingdom | 342,023 | 352,538 | ||||||
Brazil | 227,812 | 293,055 | ||||||
| (1) | Amounts at December 31, 2014, have been adjusted due to revision of financial statements as discussed in the summary of significant accounting policies footnote. |
No single customer represented more than 10% of the Company’s consolidated revenue in 2015, 2014 2013 and 2012.2013.
16. Selected Quarterly Financial Data (Unaudited)
Fiscal Quarters Year Ended December 31, 2014 | First | Second | Third | Fourth | ||||||||||||||||||||||||||||
Fiscal Quarters Year Ended December 31, 2015 | First | Second | Third | Fourth | ||||||||||||||||||||||||||||
Revenues, net | $ | 253,908 | $ | 273,502 | $ | 295,283 | $ | 376,697 | $ | 416,166 | $ | 404,605 | $ | 451,493 | $ | 430,601 | ||||||||||||||||
Operating income | 114,136 | 134,484 | 144,207 | 172,622 | 163,774 | 169,151 | 188,460 | 146,149 | ||||||||||||||||||||||||
Net income | 75,109 | 88,549 | 95,509 | 109,540 | 94,153 | 98,678 | 116,770 | 52,830 | ||||||||||||||||||||||||
Earnings per share: | ||||||||||||||||||||||||||||||||
Basic earnings per share | $ | 0.91 | $ | 1.07 | $ | 1.14 | $ | 1.25 | $ | 1.03 | $ | 1.07 | $ | 1.27 | $ | 0.57 | ||||||||||||||||
Diluted earnings per share | 0.88 | 1.03 | 1.11 | 1.21 | 1.00 | 1.05 | 1.24 | 0.56 | ||||||||||||||||||||||||
Weighted average shares outstanding: | ||||||||||||||||||||||||||||||||
Basic weighted average shares outstanding | 82,737 | 82,996 | 83,611 | 87,877 | 91,750 | 91,904 | 92,110 | 92,321 | ||||||||||||||||||||||||
Diluted weighted average shares outstanding | 85,695 | 85,817 | 86,134 | 90,240 | 93,934 | 94,050 | 94,157 | 94,350 | ||||||||||||||||||||||||
Fiscal Quarters Year Ended December 31, 2013 | First | Second | Third | Fourth | ||||||||||||||||||||||||||||
Fiscal Quarters Year Ended December 31, 2014 | First | Second | Third | Fourth | ||||||||||||||||||||||||||||
Revenues, net | $ | 193,651 | $ | 220,869 | $ | 225,150 | $ | 255,501 | $ | 253,908 | $ | 273,502 | $ | 295,283 | $ | 376,697 | ||||||||||||||||
Operating income | 94,253 | 109,074 | 111,255 | 106,050 | 114,136 | 134,484 | 144,207 | 172,622 | ||||||||||||||||||||||||
Net income | 64,662 | 73,099 | 78,620 | 68,120 | 75,109 | 88,549 | 95,509 | 109,540 | ||||||||||||||||||||||||
Earnings per share: | ||||||||||||||||||||||||||||||||
Basic earnings per share | $ | 0.80 | $ | 0.90 | $ | 0.96 | $ | 0.83 | $ | 0.91 | $ | 1.07 | $ | 1.14 | $ | 1.25 | ||||||||||||||||
Diluted earnings per share | 0.77 | 0.87 | 0.93 | 0.80 | 0.88 | 1.03 | 1.11 | 1.21 | ||||||||||||||||||||||||
Weighted average shares outstanding: | ||||||||||||||||||||||||||||||||
Basic weighted average shares outstanding | 81,222 | 81,573 | 81,974 | 82,388 | 82,737 | 82,996 | 83,611 | 87,877 | ||||||||||||||||||||||||
Diluted weighted average shares outstanding | 83,960 | 84,461 | 84,905 | 85,277 | 85,695 | 85,817 | 86,134 | 90,240 | ||||||||||||||||||||||||
The sum of the quarterly earnings per common share amounts for 20142015 and 20132014 may not equal the earnings per common share for the 20142015 and 20132014 due to rounding.
The fourth quarter of 2015 includes unusual unfavorable items totaling $74.4 million. This represents a $40.0 million non-cash impairment charge related to the Company’s minority investment in Masternaut and a $34.4 million increase in non-cash stock based compensation expense.
The fourth quarter of 2014 includes unusual favorable items totallytotaling $29.5 million. This represents a $28.1 million favorable impact of fair value adjustments recorded related to contingent consideration arrangements for the Company’s acquisition of VB in Brazil and the net favorable impact of $1.4 million from the reversal of other various contingent liabilities related to the Company’s acquisitions of DB and VB in Brazil. The fourth quarter of 2014 also includes a $15.8 million loss on extinguishment of debt related to the Company’s write-off of debt issuance costs associated with the refinancing of the Existing Credit Facility and entry into the New Credit Agreement, along with the Company’s recent acquisition of Comdata.Comdata in November 2014.
ITEM 9. CHANGES IN AND DISAGREEMENTS WITH ACCOUNTANTS ON ACCOUNTING AND FINANCIAL DISCLOSURE
Not applicable.
ITEM 9A. CONTROLS AND PROCEDURES
Evaluation of Disclosure Controls and Procedures
As of December 31, 2014,2015, management carried out, under the supervision and with the participation of our principal executive officerChief Executive Officer and principal financial officer,Chief Financial Officer, an evaluation of the effectiveness of the design and operation of our disclosure controls and procedures (as defined in Rules 13a-15(e) and 15d-15(e) under the Securities Exchange Act of 1934). Based on this evaluation, our principal executive officerChief Executive Officer and principal financial officerChief Financial Officer concluded that, as of December 31, 2014,2015, our disclosure controls and procedures were effective in ensuring that information required to be disclosed by us in the reports that we file or submit under the Securities Exchange Act of 1934, as amended, is recorded, processed, summarized and reported within the time periods specified in applicable rules and forms and are designed to ensure that information required to be disclosed in those reports is accumulated and communicated to management, including our principal executiveChief Executive Officer and principal financial officers,Chief Financial Officer, as appropriate to allow timely decisions regarding required disclosure.
Management Report on Internal Control over Financial Reporting
Our management team is responsible for establishing and maintaining adequate internal control over financial reporting as defined in Rules 13a-15(f) and 15d-15(f) under the Securities Exchange Act of 1934. Our management assessed the effectiveness of our internal control over financial reporting as of December 31, 2014.2015. In making this assessment, our management used the criteria set forth by the Committee of Sponsoring Organizations of the Treadway Commission (COSO) inInternal Control-Integrated Framework.As of December 31, 2014,2015, management believes that the Company’s internal control over financial reporting is effective based on those criteria. Our independent registered public accounting firm has issued an audit report on our internal control over financial reporting, which is included in this annual report.
In connection with management’s evaluation, our management team excluded from its assessment of the effectiveness of our internal control over financial reporting as of December 31, 2014 the internal controls relating to six subsidiaries that we acquired during the year ended December 31, 2014 and for which financial results are included in our consolidated financial statements.
On November 14, 2014, we acquired all of the outstanding stock of Comdata Inc., a provider of electronic payment solutions in the U.S. We also acquired two other insignificant businesses during 2014. Collectively we refer to these transactions as the Acquisitions. These Acquisitions constituted $4.8 billion of total assets at December 31, 2014, $77 million of revenues and a net loss of $20 million, respectively, for the year then ended. This exclusion was in accordance with Securities and Exchange Commission guidance that an assessment of a recently acquired business may be omitted in management’s report on internal control over financial reporting in the year of acquisition.
Because of its inherent limitations, internal control over financial reporting may not prevent or detect all misstatements. Projections of any evaluation of effectiveness to future periods are subject to the risk that controls may become inadequate because of changes in conditions or that the degree of compliance with the policies or procedures may deteriorate. Internal control over financial reporting cannot provide absolute assurance of achieving financial reporting objectives because of its inherent limitations. Internal control over financial reporting is a process that involves human diligence and compliance and is subject to lapses in judgment and breakdowns resulting from human failures. Internal control over financial reporting also can be circumvented by collusion or improper management override. Due to such limitations, there is a risk that material misstatements
may not be prevented or detected on a timely basis by internal control over financial reporting. However, these inherent limitations are known features of the financial reporting process. Therefore, it is possible to design into the process safeguards to reduce, though not eliminate, such risk.
Changes in Internal Control over Financial Reporting
There were no changes in our internal control over financial reporting during the quarter ended December 31, 20142015 that have materially affected, or are reasonably likely to materially affect, our internal control over financial reporting.
Not applicable.
PART III
ITEM 10. DIRECTORS, EXECUTIVE OFFICERS AND CORPORATE GOVERNANCE
A list of our executive officers and biographical information appears in Part I, Item X of this Form 10-K. Information about our directors may be found under the caption “Nominees” and “Continuing Directors” in our Proxy Statement for the Annual Meeting of Shareholders to be held June 10, 20158, 2016 (the “Proxy Statement”). Information about our Audit Committee may be found under the caption “Board Committees” in the Proxy Statement. That information is incorporated herein by reference.
The information in the Proxy Statement set forth under the caption “Section 16(a) Beneficial Ownership Reporting Compliance” is incorporated herein by reference.
We have adopted the FleetCor Code of Business Conduct and Ethics (the “code of ethics”), which applies to our Chief Executive Officer, Chief Financial Officer, Chief Accounting Officer and Corporate Controller, and other finance organization employees. The code of ethics is publicly available on our Web site at www.fleetcor.com under Investor Relations. If we make any substantive amendments to the code of ethics or grant any waiver, including any implicit waiver, from a provision of the code to our Chief Executive Officer, Chief Financial Officer, or Chief Accounting Officer, we will disclose the nature of the amendment or waiver on that Web site or in a report on Form 8-K.
ITEM 11. EXECUTIVE COMPENSATION
The information in the Proxy Statement set forth under the captions “Director Compensation,” “Named Executive Officer Compensation,” “Compensation Committee Report,” and “Compensation Committee Interlocks and Insider Participation” is incorporated herein by reference.
ITEM 12. SECURITY OWNERSHIP OF CERTAIN BENEFICIAL OWNERS AND MANAGEMENT
AND RELATED STOCKHOLDER MATTERS
The information in the Proxy Statement set forth under the captions “Securities Authorized for Issuance Under Equity Compensation Plans,” “Information Regarding Beneficial Ownership of Principal Shareholders, Directors, and Management” and “Equity Compensation Plan Information” is incorporated herein by reference.
ITEM 13. CERTAIN RELATIONSHIPS AND RELATED TRANSACTIONS, AND DIRECTOR
INDEPENDENCE
The information set forth in the Proxy Statement under the captions “Director Independence” and “Certain Relationships and Related Transactions” is incorporated herein by reference.
ITEM 14. PRINCIPAL ACCOUNTANT FEES AND SERVICES
Information concerning principal accountant fees and services appears in the Proxy Statement under the headings “Fees Billed by Ernst & Young” and “Policy on Audit Committee Pre-Approval of Audit and Permissible Non-Audit Services of Independent Auditor” and is incorporated herein by reference.
PART IV
ITEM 15. EXHIBITS AND FINANCIAL STATEMENT SCHEDULES
(a) Financial Statements and Schedules
The financial statements are set forth under Item 8 of this Form 10-K, as indexed below. Financial statement schedules have been omitted since they either are not required, not applicable, or the information is otherwise included.
Index to Financial Statements
Financial statement schedules have been omitted since they either are not required, not applicable, or the information is otherwise included.
(b) Exhibit Listing
Exhibit | ||
| 2.1 | Stock Purchase Agreement, dated as of April 1, 2009, among FleetCor Technologies Operating Company, LLC, CLC Group, Inc., and the entities and individuals identified on the signature pages thereto (incorporated by reference to Exhibit No. 2.1 to Amendment No. 1 to the registrant’s Registration Statement on | |
| 2.2 | Share Purchase Agreement among Arval UK Group Limited, FleetCor UK Acquisition Limited and FleetCor Technologies, Inc. (incorporated by reference to exhibit No. 2.1 to the registrant’s | |
| 2.3 | Agreement and Plan of Merger, dated August 12, 2014, by and among Comdata Inc., Ceridian LLC, FleetCor Technologies, Inc. and FCHC Project, Inc. (incorporated by reference to Exhibit No. 2.1 to the registrant’s | |
| 2.4 | Amendment to Agreement and Plan of Merger, dated November 10, 2014, by and among Comdata Inc., Ceridian LLC, FleetCor Technologies, Inc. and FCHC Project, Inc. (incorporated by reference to Exhibit No. 10.2 to the | |
| 3.1 | Amended and Restated Certificate of Incorporation of FleetCor Technologies, Inc. (incorporated by reference to Exhibit | |
| 3.2 | Amended and Restated Bylaws of FleetCor Technologies, Inc. (incorporated by reference to Exhibit | |
| 4.1 | Form of Stock Certificate for Common Stock (incorporated by reference to Exhibit | |
Exhibit | ||
| 10.1* | Form of Indemnity Agreement entered into between FleetCor and its directors and executive officers (incorporated by reference to Exhibit 10.1 to Amendment No. 3 to the registrant’s Registration Statement on | |
| 10.2* | FleetCor Technologies, Inc. Amended and Restated Stock Incentive Plan (incorporated by reference to Exhibit 10.2 to Amendment No. 1 to the registrant’s Registration Statement on | |
| 10.3* | First Amendment to FleetCor Technologies, Inc. Amended and Restated Stock Incentive Plan (incorporated by reference to Exhibit 10.3 to Amendment No. 1 to the registrant’s Registration Statement on | |
| 10.4* | Second Amendment to FleetCor Technologies, Inc. Amended and Restated Stock Incentive Plan (incorporated by reference to Exhibit 10.4 to Amendment No. 1 to the registrant’s Registration Statement on | |
| 10.5* | Third Amendment to FleetCor Technologies, Inc. Amended and Restated Stock Incentive Plan (incorporated by reference to Exhibit 10.5 to Amendment No. 1 to the registrant’s Registration Statement on | |
| 10.6* | Fourth Amendment to FleetCor Technologies, Inc. Amended and Restated Stock Incentive Plan (incorporated by reference to Exhibit 10.6 to Amendment No. 1 to the registrant’s Registration Statement on | |
| 10.7* | Form of Incentive Stock Option Award Agreement pursuant to the FleetCor Technologies, Inc. Amended and Restated Stock Incentive Plan (incorporated by reference to Exhibit 10.7 to Amendment No. 1 to the registrant’s Registration Statement on | |
| 10.8* | Form of Non-Qualified Stock Option Award Agreement pursuant to the FleetCor Technologies, Inc. Amended and Restated Stock Incentive Plan (incorporated by reference to Exhibit 10.8 to Amendment No. 1 to the registrant’s Registration Statement on | |
| 10.9* | Form of Performance Share Restricted Stock Agreement pursuant to the FleetCor Technologies, Inc. Amended and Restated Stock Incentive Plan (incorporated by reference to Exhibit 10.9 to Amendment No. 1 to the registrant’s Registration Statement on | |
| 10.10* | Form of FleetCor Technologies, Inc. 2010 Equity Compensation Plan (incorporated by reference to Exhibit 10.10 to Amendment No. 2 to the registrant’s Registration Statement on | |
| 10.11* | FleetCor Technologies, Inc. Annual Executive Bonus Program (incorporated by reference to Exhibit 10.11 to Amendment No. 2 to the registrant’s Registration Statement on | |
| 10.12* | Employee Noncompetition, Nondisclosure and Developments Agreement, dated September 25, 2000, between Fleetman, Inc. and Ronald F. Clarke (incorporated by reference to Exhibit 10.12 to Amendment No. 2 to the registrant’s Registration Statement on | |
| 10.13* | Offer Letter, dated September 20, 2002, between FleetCor Technologies, Inc. and Eric R. Dey (incorporated by reference to Exhibit 10.13 to Amendment No. 2 to the registrant’s Registration Statement on | |
Exhibit | ||
| 10.14* | Offer Letter, dated March 17, 2009, between FleetCor Technologies, Inc. and Todd W. House (incorporated by reference to Exhibit 10.15 to Amendment No. 2 to the registrant’s Registration Statement on | |
| 10.15* | Service Agreement, dated July 9, 2007, between FleetCor Technologies, Inc. and Andrew R. Blazye (incorporated by reference to Exhibit 10.16 to Amendment No. 2 to the registrant’s Registration Statement on | |
| 10.16 | Sixth Amended and Restated Registration Rights Agreement, dated April 1, 2009, between FleetCor Technologies, Inc. and each of the stockholders party thereto (incorporated by reference to Exhibit 10.17 to Amendment No. 2 to the registrant’s Registration Statement on | |
| 10.17 | First Amendment to Sixth Amended and Restated Registration Rights Agreement (incorporated by reference to Exhibit No. 10.17 to the registrant’s form 10-K, filed with the SEC with the SEC on March 25, 2011) | |
| 10.18 | Form of Indemnity Agreement to be entered into between FleetCor and representatives of its major stockholders (incorporated by reference to Exhibit 10.37 to Amendment No. 3 to the registrant’s Registration Statement on | |
| 10.19 | Form of Director Restricted Stock Grant Agreement pursuant to the FleetCor Technologies, Inc. 2010 Equity Compensation Plan (incorporated by reference to Exhibit 10.38 to Amendment No. 6 to the registrant’s Registration Statement on | |
| 10.20* | Form of Employee Performance Share Restricted Stock Agreement pursuant to the FleetCor Technologies, Inc. 2010 Equity Compensation Plan (incorporated by reference to Exhibit 10.39 to Amendment No. 6 to the registrant’s Registration Statement on | |
| 10.21* | Form of Employee Incentive Stock Option Award Agreement pursuant to the FleetCor Technologies, Inc. 2010 Equity Compensation Plan (incorporated by reference to Exhibit 10.40 to Amendment No. 6 to the registrant’s Registration Statement on | |
| 10.22* | Form of Employee Non-Qualified Stock Option Award Agreement pursuant to the FleetCor Technologies, Inc. 2010 Equity Compensation Plan (incorporated by reference to Exhibit 10.41 to Amendment No. 6 to the registrant’s Registration Statement on | |
| 10.23 | Form of Director Non-Qualified Stock Option Award Agreement pursuant to the FleetCor Technologies, Inc. 2010 Equity Compensation Plan (incorporated by reference to Exhibit 10.42 to Amendment No. 6 to the registrant’s Registration Statement on | |
| 10.24* | Amended and Restated Employee Noncompetition, Nondisclosure and Developments Agreement, dated November 29, 2010, between FleetCor Technologies, Inc. and Ronald F. Clarke (incorporated by reference to Exhibit No. 10.43 to Amendment No. 6 to the registrant’s Registration Statement on | |
| 10.25 | Arrangement Agreement Among FleetCor Luxembourg Holdings2 S.À.R.L, FleetCor Technologies, Inc. and CTF Technologies, Inc. (incorporated by reference to Exhibit 10.1 to the Registrant’s Quarterly Report on Form 10-Q, filed with the SEC on May 10, 2012) | |
Exhibit | ||
| 10.26 | Repurchase Agreement, dated November 26, 2012, among the Company and the Repurchase Stockholders (incorporated by reference to Exhibit 10.1 to the Registrant’s Form 8-K, filed with the SEC on November 27, 2012) | |
| ||
| FleetCor Technologies, Inc. 2010 Equity Compensation Plan, as amended and restated effective May 30, 2013 (incorporated by reference from Appendix A to the Proxy Statement, filed with the SEC on April 24, 2013) | ||
| FleetCor Technologies, Inc. Section 162(M) Performance—Based Program (incorporated by reference to Annex A to the Registrant’s Proxy Statement, filed with the SEC on April 18, 2014) | ||
| Credit Agreement, dated October 24, 2014, among FleetCor Technologies Operating Company, LLC, as Borrower, FleetCor Technologies, Inc., as Parent, FleetCor Technologies Operating Company, LLC, as a borrower and guarantor, certain of the our foreign subsidiaries as borrowers, Bank of America, N.A., as administrative agent, swing line lender and L/C issuer and a syndicate of financial institutions (incorporated by reference to Exhibit No. 10.4 to the Registrant’s Form 10-Q filed with the SEC on November 10, 2014) | ||
| Fifth Amended and Restated Receivables Purchase Agreement, dated November 14, 2014, by and among FleetCor Technologies, Inc. and PNC Bank, National Association, as administrator for a group of purchasers and purchaser agents, and certain other parties (incorporated by reference to Exhibit No. 10.1 to the Registrant’s Form 8-K, filed with the SEC on November 17, 2014) | ||
| Amended and Restated Performance Guaranty dated as of November 14, 2014 made by FleetCor Technologies, Inc. and FleetCor Technologies Operating Company, LLC, in favor of PNC Bank, National Association, as administrator under the Fifth Amended and Restated Receivables Purchase Agreement (incorporated by reference to Exhibit 10.32 to the registrant’s Form 10-K, file number 001-35004, filed with the SEC on March 2, 2015) | ||
| Amended and Restated Purchase and Sale Agreement dated as of November 14, 2014, among various entities listed on Schedule I thereto, as originators, and FleetCor Funding LLC (incorporated by reference to Exhibit 10.32 to the registrant’s Form 10-K, file number 001-35004, filed with the SEC on March 2, 2015) | ||
| Receivables Purchase and Sale Agreement dated as of November 14, 2014, among Comdata TN, Inc. and Comdata Network, Inc. of California, as the sellers, and Comdata Inc., as the buyer (incorporated by reference to Exhibit 10.32 to the registrant’s Form 10-K, file number 001-35004, filed with the SEC on March 2, 2015) | ||
| Investor Rights Agreement, dated November 14, 2014, between FleetCor Technologies, Inc. and Ceridian LLC (incorporated by reference to Exhibit 10.32 to the registrant’s Form 10-K, file number 001-35004, filed with the SEC on March 2, 2015) | ||
| Offer Letter, dated June 19, 2013, between FleetCor Technologies, Inc. and John A. Reed (incorporated by reference to Exhibit No. 10.3 to the | ||
| 10.36* | Offer Letter, dated July 29, 2014, between FleetCor Technologies, Inc. and Armando Lins Netto (incorporated by reference to Exhibit 10.1 to the registrant’s Form 10-Q, file number 001-35004, filed with the SEC on May 11, 2015) | |
| 10.37 | First Amendment to the Fifth Amended and Restated Receivables Purchase Agreement, dated as of November 5, 2015, by and among FleetCor Funding LLC, FleetCor Technologies Operating Company, LLC and PNC Bank, National Association, as administrator for a group of purchasers and purchaser agents, and certain other parties(incorporated by reference to Exhibit 10.2 to the registrant’s Form 10-Q, file number 001-35004, filed with the SEC on November 9, 2015) | |
Exhibit | ||
| 10.38* | Employee agreement on confidentiality, work product, non-competition, and non-solicitation | |
| 10.39 | Second Amendment to the Fifth Amended and Restated Receivables Purchase Agreement, dated as of December 1, 2015, by and among FleetCor Funding LLC, FleetCor Technologies Operating Company, LLC and PNC Bank, National Association, as administrator for a group of purchasers and purchaser agents, and certain other parties | |
| 11.1 | Statement of Computation of Share Earnings (See Note 14) | |
| 21.1 | List of subsidiaries of FleetCor Technologies, Inc. | |
| 23.1 | Consent of Independent Registered Public Accounting Firm | |
| 31.1 | Certification of Chief Executive Officer Pursuant to Section 302 | |
| 31.2 | Certification of Chief Financial Officer Pursuant to Section 302 | |
| 32.1 | Certification of Chief Executive Officer Pursuant to Section 906 | |
| 32.2 | Certification of Chief Financial Officer Pursuant to Section 906 | |
| 101 | The following financial information | |
| * | Identifies management contract or compensatory plan or arrangement. |
Pursuant to the requirements of Section 13 or 15(d) of the Securities Exchange Act of 1934, the Registrant has duly caused this report to be signed on its behalf by the undersigned; thereunto duly authorized, in the City of Atlanta, State of Georgia, on March 2, 2015.February 29, 2016.
| FleetCor Technologies, Inc. | ||
By: | /S/ RONALD F. CLARKE | |
| Ronald F. Clarke | ||
| President and Chief Executive Officer | ||
Pursuant to the requirements of the Securities Exchange Act of 1934, this report has been signed below by the following persons on behalf of Registrant and in the capacities indicated on March 2, 2015.February 29, 2016.
Signature | Title | |
/S/ RONALD F. CLARKE Ronald F. Clarke | President, Chief Executive Officer and Chairman of the Board of Directors (Principal Executive Officer) | |
/S/ ERIC R. DEY Eric R. Dey | Chief Financial Officer (Principal Financial Officer and Principal Accounting Officer) | |
/
| ||
Michael Buckman | Director | |
/ Joseph W. Farrelly | Director | |
/ Thomas M. | Director | |
/ Mark A. Johnson | Director | |
/ Richard Macchia | Director | |
/ Jeffrey S. Sloan | Director | |
/ Steven T. Stull | Director | |
128127