
UNITED STATES
SECURITIES AND EXCHANGE COMMISSION
Washington, D.C. 20549
FORM 10-K
(Mark One)
☒ | ANNUAL REPORT PURSUANT TO SECTION 13 OR 15 (d) OF THE SECURITIES EXCHANGE ACT OF 1934 |
For the fiscal year ended December 31, 20142016
or
☐ | TRANSITION REPORT PURSUANT TO SECTION 13 OR 15 (d) OF THE SECURITIES EXCHANGE ACT OF 1934 |
For the transition period fromto
Commission File Number 000-27517

GAIAM,GAIA, INC.
Exact name of registrant as specified in its charter)
COLORADO | ||
84-1113527 | ||
(State or other jurisdiction of incorporation or organization) | (I.R.S. Employer Identification No.) |
833 WEST SOUTH BOULDER ROAD
LOUISVILLE, CO 80027
(Address of principal executive offices, including zip code)
(303) 222-3600
(Registrant’s telephone number, including area code)
Securities registered pursuant to Section 12(b) of the Act:
Title of Each Class | Name of Each Exchange on Which Registered | |
Class A Common Stock, $.0001 par value | NASDAQ Stock Market LLC |
Securities registered pursuant to section 12(g) of the Act:
None
Indicate by check mark if the registrant is a well-known seasoned issuer, as defined in Rule 405 of the Securities Act. YES ¨☐ NO x☒
Indicate by check mark if the registrant is not required to file reports pursuant to Section 13 or Section 15(d) of the Act. YES ¨☐ NO x☒
Indicate by check mark whether the registrant (1) has filed all reports required to be filed by Section 13 or 15(d) of the Securities Exchange Act of 1934 during the preceding 12 months (or for such shorter period that the registrant was required to file such reports), and (2) has been subject to such filing requirements for the past 90 days. YES x☒ NO ¨☐
Indicate by check mark whether the registrant has submitted electronically and posted on its corporate Web site, if any, every Interactive Data File required to be submitted and posted pursuant to Rule 405 of Regulation S-T (§ 232.405 of this chapter) during the preceding 12 months (or for such shorter period that the registrant was required to submit and post such files). Yes x☒ No ¨☐
Indicate by check mark if disclosure of delinquent filers pursuant to Item 405 of Regulation S-K (§229.405 of this chapter) is not contained herein, and will not be contained, to the best of registrant’s knowledge, in definitive proxy or information statements incorporated by reference in Part III of this Form 10-K or any amendment to this Form 10-K. ¨☐
Indicate by check mark whether the registrant is a large accelerated filer, an accelerated filer, a non-accelerated filer, or a smaller reporting company. See the definitions of “large accelerated filer,” “accelerated filer” and “smaller reporting company” in Rule 12b-2 of the Exchange Act.
Large accelerated filer | ☐ | Accelerated filer | ☒ | |||
Non-accelerated filer | ☐ | Smaller reporting company | ☐ | |||
Indicate by check mark whether the registrant is a shell company (as defined in Rule 12b-2 of the Act.) YES ¨☐ NO x☒
The aggregate market value of the voting common equity held by non-affiliates of the registrant was approximately $136,603,630$114,280,000 as of June 30, 2014,2016, based upon the closing price on the NASDAQ Global Market on that date. The registrant does not have non-voting common equity.
As of February 27, 2015, 19,089,00821, 2017, 9,752,531 shares of the registrant’s Class A common stock and 5,400,000 shares of the registrant’s Class B common stock were outstanding.
DOCUMENTS INCORPORATED BY REFERENCE
NoneThe following documents (or portions thereof) are incorporated by reference into the Parts of this Form 10-K noted:
Part III incorporates by reference from the definitive proxy statement for the registrant’s 2017 Annual Meeting of Shareholders to be filed with the Commission pursuant to Regulation 14A not later than 120 days after the end of the fiscal year covered by this Form.
Annual Report on Form 10-K
For the Fiscal Year Ended December 31, 20142016
Page Number | |||||||
1 | |||||||
Item 1. | 1 | ||||||
Item 1A. | 6 | ||||||
Item 1B. | 13 | ||||||
Item 2. | 13 | ||||||
Item 3. | 14 | ||||||
Item 4. | 14 | ||||||
14 | |||||||
Item 5. | 14 | ||||||
Item 6. | 15 | ||||||
Item 7. | Management’s Discussion and Analysis of Financial Condition and Results of Operations | 18 | |||||
Item 7A. | 26 | ||||||
Item 8. | 27 | ||||||
Item 9. | Changes in and Disagreements with Accountants on Accounting and Financial Disclosure | 46 | |||||
Item 9A. | 46 | ||||||
Item 9B. | 47 | ||||||
47 | |||||||
Item 10. | 47 | ||||||
Item 11. | 47 | ||||||
Item 12. | Security Ownership of Certain Beneficial Owners and Management and Related Stockholder Matters | 47 | |||||
Item 13. | Certain Relationships and Related Transactions, and Director Independence | 47 | |||||
Item 14. | 48 | ||||||
48 | |||||||
Item 15. | 48 | ||||||
50 | |||||||
Our Business
Since its start in 1996,Gaia, Inc., previously known as Gaiam, has grown to becomeInc., was incorporated under the laws of the State of Colorado on July 7, 1988 and operates a leader in the markets for yoga, fitness and wellness products and content. Gaiam brands include Gaiam, focused on yoga and fitness; Gaiam Restore, focused on wellness; SPRI by Gaiam, focused on fitness; and Gaiam TV, our global digital video subscription service.
We developservice and market yoga and fitness accessories, apparel, and media under Gaiam’s brands. These products are sold primarily through major national retailers in the United States, Canada, Europe, and other countries, with placement in over 38,000 retail doors worldwide. We also sell our products through our digital partners, websites and ecommerce channels. Our products and services are targeted to all levels of yoga and fitness enthusiasts, including professionals. We believeon-line community that consumers are attracted to our products because of their design, functional characteristics, and our unique brand heritage. Our accessories include yoga mats, bags, straps and blocks, media content including digital media and apps, restorative and massage accessories such as rollers, resistance cords and balance balls, and various other offerings. Our comprehensive line of apparel includes pants, shorts, tops and jackets designed around yoga.
Gaiam TV, our digital subscription service, provides our members access to approximately 7,000 video titles, 90% of which are available exclusively to subscribers for digital streaming on virtually any Internet-connected device anytime, anywhere.
On February 20, 2015, our wholly-owned subsidiary Gaia, Inc. (“Gaiam TV”) filed a registration statement on Form 10 in connection with the previously announced proposed separation of the Gaiam TV segment from the Gaiam Brand segment into two separate publicly traded companies. The proposed tax-free spin-off will occur through a distribution to Gaiam, Inc.’s shareholders of all the stock of Gaiam TV. Gaiam TV will hold all of the assets and liabilities of the Gaiam TV segment. The Gaiam Brand segment will remain with Gaiam, Inc. after the distribution. The completion of the separation is subject to satisfaction of several conditions. Furthermore, our board of directors has the right and ability, in its sole discretion, to abandon the proposed separation at any time before the distribution date. As a result, there can be no assurance that the separation will occur.
Our Heritage
Our heritage dates back to 1984 when our founder and Chairman, Jirka Rysavy, emigrated from Czechoslovakia to Boulder, CO and founded natural-food store concept Crystal Market (later Wild Oats), recycled-office products company Corporate Express (which was sold with $4.5 billion in revenues, and is now Staples), and Gaiam.
Gaiam has developed a reputation for quality and innovation that has helped elevate the practice and visibility of yoga, fitness and wellness and positively changed the way consumers interact and look at the world. Our long history and experience gives us a unique authenticity in the market.
Our Values
Gaiam adheres to values that are aligned with our customers’ loyalty to our brands, above and beyond their appreciation for the quality, design and effectiveness of our products. Authenticity and commitment to our core values are at the center of what we strive to achieve.
We also have a strong sense of corporate citizenship and contribution to our communities. We strive to respect our environment, to promote diversity and fulfillment among our employees, to coach talent and support those in need when and where we are able to.

Our Brands
Our brands reflect our commitment to designing innovative, high quality and affordable products that enhance our customers’ enjoyment of their yoga, fitness and wellness practices.
Gaiam is our main brand for yoga, fitness and wellness accessories, apparel, and media. Launched with our company’s founding, Gaiam started with yoga videos and apparel in the late 1990s, and has since expanded to include a full line of apparel, yoga mats, yoga mat bags, yoga blocks and straps, yoga and fitness props, balance balls, bags, and various other accessories. The brand addresses the needs of all levels of yoga practitioners with a high-quality and stylish product assortment. We have successfully leveraged the brand’s authenticity and heritage into wellness and active sitting products, including our balance ball chair, and fitness kits. We actively research and test new product concepts under the Gaiam brand, and have the ability to create new sub-brands like Gaiam Restore when the opportunity is significant.
Gaiam Restore is about empowering tools to get our customers back to their healthiest, most flexible selves. We launched the Restore sub-brand in 2012, when we recognized growing consumer interest in self-care. The Restore line helps enhance athletic performance, improve flexibility, boost range of motion and combat muscle soreness. The product line consists of foam rollers, foot rollers, massage kits, stretch cords and straps, pressure point massagers, hand and grip therapy accessories, trigger point massagers and various other products and accessories. Our substantial Restore product set enables us to provide a complete store-within-store experience to our retail partners, giving their customers a trusted source for both general and condition-specific wellness products.
SPRI by Gaiam is a leading manufacturer and distributor of professional fitness accessories, which we acquired in 2008. Founded over 30 years ago, SPRI first pioneered rubber resistance exercise products and has since expanded into many other categories of fitness equipment. Through its network of fitness professionals and advisors, SPRI has remained on the cutting edge of today’s exercise trends including our recent release of SPRI CrossTrain, a line of accessories for functional cross training. We are expanding our educational content through the recently redesigned SPRI.com, in addition to growing live course programming. These efforts support and educate the market on the effective use of our products, in addition to influencing new trends. Historically, we marketed SPRI products through professional channels, trainers and gyms, and through specialty fitness retail stores. In 2012, we began to market the products through our extensive network of sporting goods and select mass market retailers.
Gaiam TV is a global subscription video streaming service with approximately 7,000 titles focused on yoga, health and longevity, seeking truth, spiritual growth and conscious films & series. Its content caters to a unique and underserved subscriber base andbase. Our digital content library of over 7,700 titles is available to our subscribers across virtually any Internet connected deviceon most Internet-connected devices anytime, anywhere commercial free. The subscription also allows the downloading and viewing of files from the library without being actively connected to the internet. SubscribersOur subscribers have unlimited access to a vast library of inspiring films, personal growth related content, cutting edge documentaries, interviews, yoga classes, transformation related content, and more – 90% of which is exclusively available exclusively to our subscribers for digital streaming.
Our Products
We have a long history of technical innovation and product development, with over 22 patents and 2 patents pending and hundreds of new product introductions since our start in 1996. Our employees’ passion and intimacy with yoga, fitness and wellness provides a significant advantage that will help drive our Company to new levels.
Examples of our current products include:

Our StrategyContent Channels
We seekFrom the beginning, we have focused on establishing exclusive rights to generate sustainableunique content through in house productions, licensing and profitablestrategic content acquisitions. Today, our network includes the following channels:
Yoga – Through our Yoga channel, our subscribers enjoy unlimited access to streaming yoga, Eastern arts, and other movement-based classes. Currently, we are one of the world’s largest providers of streaming yoga classes. Blending ancient philosophy with modern technology, our classes on Eastern arts like T’ai Chi, Qigong, Ayurveda and more encourage the holistic integration of body, mind and spirit.
Transformation – Through our Transformation channel, we feature a wealth of content in the niche areas of alternative health, spiritual growth and expanded consciousness. Our original and licensed content empowers subscribers to live stronger, healthier, more productive and enlightened lives.
Seeking Truth – As an alternative to mainstream media, our Seeking Truth channel provides new and enlightening perspectives for today’s changing world. Through thought-provoking questions like who are we and why are we here, and topics that include ancient wisdom and metaphysics, we go beyond the boundaries of mainstream media, and encourage our viewers to find empowerment through knowledge and awareness. Through this channel, our subscribers have access to top names in the genre who conduct exclusive interviews and presentations not found anywhere else.
The Streaming Video Market and Gaia
The consumption of streaming video is expanding rapidly with more and more people augmenting their use of, or replacing broadcast television with streaming video to watch their favorite content on services like Netflix, Amazon Prime, Hulu Plus, HBO Now and Gaia. The streaming video market includes various free, ad-supported and subscription service offerings focused on various genres, including films, broadcast and original series, fitness and educational content.
Gaia’s position in the streaming video landscape is firmly supported by leveragingits wide variety of exclusive and unique content, which provides a complementary offering to other mostly entertainment-based streaming video services. Our original content is developed and produced in-house in our leadership positionproduction studios near Boulder, Colorado. Over 90% of our content is available for streaming exclusively on Gaia to most Internet-connected devices. By offering exclusive and brand awarenessunique content over a streaming service, we believe we will be able to significantly expand our business intarget subscriber base. Gaia believes the following ways:current size of our potential target market represents approximately 7% of the global population with access to broadband.
Streamline and Focus Our Business –During 2013, we sold our non-Gaiam branded entertainment media distribution operations, discontinued our direct response television marketing operations, and sold virtually all our investment in RGSE in order to restructure our business around our yoga, fitness, and wellness operations as well as Gaiam TV. We believe that maintaining focuswe differentiate ourselves from our competition and discipline will be critical as we seekhave been able to grow our leadership positionbusiness through the following demonstrated competitive strengths:
Exclusive Content and brands within these markets.Ubiquitous Access – We have amassed a library of unique content for which we hold exclusive worldwide streaming distribution rights and have established exclusive relationships with certain key talent in our areas of focus. Over 90% of our titles are available to our subscribers for streaming on virtually any Internet-connected device exclusively on Gaia.
ExtendGaia Unplugged – We are able to leverage our content licensing and ownership advantage to enable “subscriber download” as part of our subscription. A Gaia subscription allows subscribers to download and view titles in our library without being actively connected to the Internet as long as they remain a paying subscriber.
Proprietary and Curated Content – Proprietary and curated content lies at the core of our business model. Our Brand Into New Categories –Gaiam enjoys strong national brand awareness,media offerings introduce customers to us and help establish us as an authority in the conscious media market. Our in-house produced and owned content represents approximately 80% of our subscribers’ viewing time. Our licensed content has initial terms ranging from 3 to 20 years. With the growth in demand for digital rights, we believeexpect that we have successfully demonstratedour large library of produced and acquired content combined with our internal production capabilities will be a key driver in our ability to move into complementarygrow efficiently and adjacent product categories. For example,act as a hedge against the rising costs of digital rights.
International Rights – The strength of our Gaiam Restore product line representedproprietary content library created by our original content production strategy and our unique approach to content licensing have provided us with a step outsidelibrary of yoga, and has grown considerably since its launch in 2012. Similarly, our SPRI CrossTrain product line was a natural evolution of the SPRI brand, and is now carried in major sporting goods retailers in the US.
We are currently launching a line of Gaiam-branded yoga apparelniche content to which we hold exclusive worldwide distribution rights that we expect will give us accessbelieve would be difficult to acquire in today’s market. By obtaining these rights, we have created a significant barrier to entry for competitors in our content niches and have given ourselves the large and growing athletic apparel market.potential to reach a worldwide subscriber base with no additional licensing costs. Based on viewership, approximately 90% or our library is available worldwide.
Unique Subscriber Base – We believe that our brand combined withunique and exclusive content allows us to cater to a favorable competitive environment insubscriber base that traditional media companies have mostly ignored. We believe this segment ofsubscriber base can be significantly expanded as more and more people enter our niche categories and begin accessing streaming content over the market will become a significant part of our growth in the coming years.Internet.
Additionally, we are increasing our presence in the home and office with active sitting products. The Gaiam Balance Ball chair is a widely recognized product and forms the base of our active sitting strategy. With the continued success of our balance ball chair and the recent news coverage on the health issues associated with sitting for extended periods of time, we are designing a line of active sitting products that will further extend our brand.
Attract New DemographicsUnique Content Strength–We believe that the growing interest in yoga, fitness, and wellnessour unique focus, combined with our content exclusivity, positions us as a complementary service to larger streaming video providers who are primarily entertainment driven. In addition, this focus has createdallowed an opportunity for us to use our core brand assets to attract men and youth to these disciplines. Historically underrepresented in our disciplines and our customer base, both demographics are now a focus for our marketing and product development efforts. We plan to utilize our expertise in product development, merchandising, and content creation to develop unified sets of product and media content that appeal to men and children, and to sell these products through our existing wide retail distribution network and website.
Extend Our International Distribution Footprint –We believe that Gaiam has the ability to be the global brand for yoga, fitness and wellness by actively pursuing international expansion. International sales represented approximately 6% of our revenues in 2014 and we believe there is significant opportunity to address the yoga, fitness, and wellness market abroad and to do so as successfully asadvantages:
Yoga, we have addressed itan established consumer brand, a vast library of popular content, and knowledge and expertise on developing new content.
Transformation, we bring a unique focus to an otherwise crowded field. This channel empowers subscribers through programs about alternative and integrative medicines, holistic healing, longevity, meditation, and other shows on conscious topics that puts Gaia in the United States.
Grow our Retail Footprint–We currently have 17,000 branded stores-within-store presentations and believe the product category and demographic expansion strategies above will help us to grow our sales with existing customers and to enter new retail channels including department stores, grocery and drug stores. We believe that many retailers recognize an opportunity in the health and wellness lifestyle market, and are expanding their product mix in order to capitalize on this trend. Additionally, we launched our SPRI brand in retail only as recently as 2012, and are continuing to expand its penetration. Ascenter of December 31, 2014, SPRI was represented in approximately 3,000 U.S. retail doors.
Connect With Our Customers–Our business and customers continue to evolve and so will the way we engage with them. We are evolving our ecommerce experience to focus on engaging our target consumers through digital content and, social and mobile marketing. As part of this strategy, in 2014, we acquired the Yoga Studio app, a highly rated and successful yoga instruction app, which we will continue to develop and leverage as a point of brand engagement.rapidly growing market.
We recently launched a new website, GaiamPro.com,Seeking Truth, Gaia offers category-leading talent which enables us to better connect withdraw the yogamost popular and fitness studioauthentic speakers, authors and practitioner market – a key stepexperts in growing our brand presence within these highly influential channels. We have also completely redesigned our website, SPRI.com to focus on brand engagement across various devices, including tablet and mobile.the alternative media world.
Growth Drivers
These efforts are all grounded in our belief that consumers increasingly seek direct brand interactions, through engaging content and digital interactions. We will continue to develop and evolve better ways to connect with our consumers through our consumer channels and our retail partners.
Build Gaiam TV –Our core Gaiam TV strategy is to grow our streaming subscription business domestically and internationally using the following drivers:
Investment in Streaming Content – We believe that our investment in streaming content leads to more awareness and viewership of our unique content. This leads to subscriber baseacquisition and revenue growth, allowing us to invest more into our content library and enabling the growth cycle to continue. By investing in our in-house studios, digital asset management system and digital delivery platforms, we can produce and distribute new digital content at low incremental costs. With our end-to-end production capabilities
and unique, exclusive, relationships with thought leaders in our areas of focus, we believe we can develop content much more efficiently than our competitors.
Continuous Service Improvements – We have found that incremental improvements in our service and quality enhance our subscriber satisfaction and retention. In October 2016, we relaunched gaia.com with an entirely new technology stack at its core. The new site was built to optimize the speed and performance of streaming video playback, provide a unique and customized site experience for every subscriber and provide the foundation for our planned expansion into foreign languages. We continue to refine our technology, user interfaces, and delivery infrastructure to improve the customer experience.
Overall Adoption and Growth of Internet TV on Every Screen – Domestically, cable TV subscribers have been declining, while the demand for digital content services accessible on various devices has continued to grow. Gaia is accessible on a broad array of devices, including, but not limited to: Apple TV, iPad, iPhone, Roku, Chromecast, Android devices including phones, tablets and Amazon Fire, laptops, desktop computers and TVs through an HDMI cord. Through this accessibility, we believe that we enhance the value of our service to subscribers as well as position ourselves for continued growth as Internet and mobile delivery of content becomes more popular.
International Market Expansion – We believe the international streaming segment represents a significant long-term growth opportunity for us as people around the world begin to adopt the viewing behaviors of the US market. Our exclusive worldwide streaming rights allow us to expand internationally by adding foreign language support to our service without having to invest in local foreign operations. Today, approximately 30% of our subscribers are outside of the United States.
Complement our Existing Business with Selective Strategic Acquisitions – Our growth strategy is not solely dependent on acquisitions. However, we will consider strategic acquisitions that complement our existing business, increase our content library, expand our geographical reach, and add to our subscriber base. We will focus on companies with unique media content, a strong brand identity and subscribers that augment our existing subscriber base.
Marketing
We are building awareness and demand for the Gaia brand through various channels focusing on mobile and video. Organic search, paid search, digital and social media, email marketing, ambassador marketing, as well as various strategic partnerships make up our continually optimized portfolio of subscriber acquisition and retention tools. Rejoining subscribers are an important source of subscriber additions, many of which come back to Gaia.com after receiving special communications via email.
We maintain a website at www.gaia.com. The website address has been included only as a textual reference. Our website and the information contained on the website, or connected to the website, are not incorporated by reference into this Form 10-K. We have changed our principal marketing url to www.gaia.com from www.gaiamtv.com, and we will maintain www.gaiamtv.com as a redirect url.
History
We started as a conscious media and products company distributing conscious and non-theatrical media, with a maximum reach of approximately 70,000 retail doors in the United States. Over the past few years, we divested our solar energy business, our DVD distribution business, our Gaiam Branded consumer products business, and our eco-travel subsidiary for combined gains of over $150 million.
We also expanded the number of conscious media titles with our acquisition of the entire content library of Wisdom Television. Wisdom operated for 20 years as a cable and satellite channel. Wisdom was the only TV channel that remained dedicated, year after year, to conscious media. With our acquisition of their digital media library we expanded our unique library of content directed at independent and progressive thinkers.
In 2012 we brought our streaming video service out of beta-test status, and focus our efforts on growing our streaming subscription services domestically and internationally by expanding our unique and exclusivestreaming content, library, enhancing our user interface and extending our streaming content to even more Internet-connected devices.
In October 2013, we further expanded the digital yoga content available to our subscribers, and expanded our presence and subscriber base in the yoga community through our acquisition of My Yoga Online, the largest streaming yoga media service in Canada.
In October 2016, we relaunched gaia.com with an entirely new technology stack at its core. The new site was built to new Internet-connected devices as they are developed.
Our content is focused on yoga, healthoptimize the speed and longevity, seeking truth, spiritual growth and conscious films & series. This media content is specifically targeted toperformance of streaming video playback, provide a unique customer base which is interested in alternatives toand customized site experience for every subscriber and provide the content provided by mainstream media. We have been able to grow these content options both organically throughfoundation for our own productions and through strategic acquisitions. In addition, through ourplanned expansion into foreign languages.
These investments in our streaming video technology and our user interface, wesubscription business have been ableinstrumental in our ability to expand the many ways our subscription customer base can access our unique library of media titles.
Complement our Existing Business with Selective Strategic Acquisitions – Our growth strategy is not dependent on acquisitions. However, we will consider acquiring complementary branded businesses that strengthen our market positiongrow by expanding our product offerings, geographical reach or channel distribution. We often retain acquired company’s management to drive front-end business functions, such as creative presentation and marketing, while consolidating operational functions under our existing infrastructure where we can realize economies of scale.
Our Operations
Sales Channels, Product Development and Sourcing
We sell our branded products across various sales channels. We use our direct-to-consumer channel to test products before we distribute them through our retail channel. Because we use a multi-channel approach to our business, we are able to leverage product development costs across all channels of our business.
Our proprietary offerings are designed by our development team and sourced both domestically and internationally. We utilize third- party suppliers that produce our products to our specifications. We design our products to promote and support our customers’ healthy lifestyles. We also screen the environmental and social responsibility of our suppliers. In order to minimize risk, we often identify an alternate supplier for our products in a separate location.
Established Infrastructure
We have a distribution center centrally located near Cincinnati, Ohio. This distribution center provides fulfillment for much of our current domestic business needs and has the capacity to support the growth of our business. The center’s central U.S. location allows us to achieve shipping cost efficiencies to most locations. The center is also located within 30 minutes of several major shipping company hubs. We use a supply chain management system that supports our entire operation, including fulfillment, inventory management, and customer service.
Our Reporting Segments
We have two reportable segments: the Gaiam Brand segment, and the Gaiam TV segment. The Gaiam Brand segment includes all of our yoga, fitness, and wellness product and media distributed through our website, apps, retail network, and catalogs, and also includes our eco-travel business. The Gaiam TV segment includes our global digitalstreaming video subscription service. During 2014, the Gaiam Brand and the Gaiam TV segments represented 94.1% and 5.9% of our net revenues, respectively. Our Gaiam Brand segment is dependent upon a few major customers for a significant portion of its revenues. Sales to our largest customer, Target Corporation (“Target”) accounted for 29.3%, 32.1% and 22.9% of our total net revenue during 2014, 2013, and 2012, respectively. The loss of Target as a customer would have a material adverse effect on our business. No other customer accounted for 10% or more of our total net revenue.
See further information about our reporting segments in Note 14 to the Consolidated Financial Statements.
Our Competition
Our business and brands are benefiting from the convergence of function and fashion in the yoga and fitness apparel, and equipment space. We believe consumer purchase decisions are driven by a need for solution-oriented products and a desire to create a particular lifestyle perception through distinctive aesthetics. A number of highly successful brands including Lululemon, Under Armour, and Nike have recognized and capitalized on this convergence. Primary growth drivers in our business include products that provide a high level of performance or comfort, that exhibit consistent, attractive design characteristics, and are affordable.
The markets for our products are highly competitive. In each of our geographic markets, we face significant competition from numerous competitors, some of which are larger than us and have greater financial, marketing and operational resources with which to compete, and others that are smaller with fewer resources, but that may be deeply entrenched in local markets or have established themselves as niche category leaders. Some of our large wholesale customers also market competitive yoga, fitness and wellness apparel, accessories and equipment under their own private labels. In addition, our direct-to-consumer channels expose us to branded competitors who operate retail stores, as well as competitors who sell product online.
In addition to competing for end-consumer and wholesale market share, we also compete for manufacturing capacity of independent factory groups, primarily in Asia; and for experienced management, staff and suppliers to lead, operate and support our global business processes. Each of these areas of competition requires distinct operational and relationaldemand capabilities and expertise in orderincreasing our library of unique content of transformational media, intended to createawaken and maintain long-term competitive advantages.
Competitive Advantage
We believe our primary competitive advantages are:
We believe our brand is recognized as a leader in our industry. With a long history ininspire viewers around the yoga, fitness and wellness market, our reputation and longevity make us the first choice for many consumers. Our expertise enables us to produce and market unique and innovative products under our core brands using new materials and designs that take advantage of the newest health trends. Our employees leverage their own expertise and that of an external network of experts and advisors to continually research the trends in all of our markets, allowing us to continuously address the evolving needs of our consumers.
Discontinued Operations
In the fourth quarter of 2013, we sold our non-Gaiam-branded entertainment media distribution operations (“GVE”) and discontinued our direct response television marketing operations (“DRTV”). We now report these businesses as discontinued operations, and, accordingly, we have reclassified their financial results for all periods presented to reflect them as such. Unless otherwise noted, discussions in this Form 10-K pertain to our continuing operations.
Our Employees
As of February 27, 2015, we employed approximately 257 full-time and 4 part-time individuals. None of our employees are covered by a collective bargaining agreement.world.
Regulatory Matters
A number of existing and proposed laws restrict disclosure of consumers’ personal information, which may make it more difficult for us to generate additional names for our direct marketing, and restrict our ability to send unsolicited electronic mail or printed materials.mail. Although we believe we are generally in compliance with current laws and regulations and that these laws and regulations have not had a significant impact on our business to date, it is possible that existing or future regulatory requirements will impose a significant burden on us.
Competition
While our content offering is unique, the market for subscription based content delivered over the Internet is intensely competitive and subject to rapid change. Many consumers maintain simultaneous relationships with multiple providers and can easily shift spending from one provider to another. We are a focused provider within the streaming video market that is able to compete by providing exclusive content available on almost any device. Our principal competitors vary by world geographic region and include multichannel video programming distributors and Internet-based movie and TV content providers, including those that provide legal and illegal (pirated) streaming video content. We believe that due to the exclusivity of our content, we are positioning ourselves as a complementary service to large general content providers such as television broadcasters, cable television channels, and streaming services such as Netflix, Amazon Prime, Hulu Plus and HBO Now. Based on internal surveys of our subscribers, a majority of our U.S. subscribers also subscribe to Netflix.
Seasonality
Our member growth exhibits a seasonal pattern that reflects variations when consumers buy Internet-connected devices and, as a result, tend to increase their viewing, similar to those of traditional TV and cable networks. Our member growth is generally collect sales taxes only on salesgreatest in the fourth and first quarter (October through March), and slowest in the May through August period. As we expand internationally, we expect regional seasonality trends to residents of statesdemonstrate more predictable seasonal patterns as our service offering in whicheach market becomes more established and we have nexus. Currently,a longer history to assess such patterns.
Employees
As of February 24, 2017, we collect sales taxeshad approximately 114 employees, all of which are full-time employees. None of our employees are covered by a collective bargaining agreement.
Intellectual Property and Other Proprietary Rights
We regard our trademarks, service marks, copyrights, domain names, trade secrets, proprietary technologies and similar intellectual property as important to our success. We use a combination of trademark, copyright and trade
secret laws and confidentiality agreements to protect our proprietary intellectual property. Our ability to protect and enforce our intellectual property rights is subject to certain risks, and from time to time we encounter disputes over rights and obligations concerning intellectual property. We cannot provide assurance that we will prevail in any intellectual property disputes. We have changed our principal marketing url to www.gaia.com from www.gaiamtv.com, and we intend to maintain www.gaiamtv.com as a redirect url.
Discontinued Operations
During the second quarter of 2016, we sold our 51.4% equity interest in Natural Habitat, Inc. (“Natural Habitat”), our eco-travel subsidiary, in exchange for $12.85 million in cash, and recognized a gain of $10.3 million as disclosed in our Current Report on certain sales to residentsForm 8-K filed May 10, 2016.
During the third quarter of California, Colorado, Illinois, New York, New Jersey, Ohio,2016, we sold the assets and Texas. A numberliabilities of legislative proposals have been made atour Gaiam Brand business in exchange for a gross purchase price of $167.0 million, and recognized a gain of $114.5 million before taxes. Our Gaiam Brand business previously constituted the federal, statemajority of our consolidated revenues and local level,expenses, and by foreign governments, that would impose additional taxes onconsisted of Gaiam branded yoga, fitness and wellness consumer products, and content (excluding the streaming rights).
In the fourth quarter of 2013, we sold our non-Gaia-branded entertainment media distribution operations (“GVE”) and discontinued our direct response television marketing operations (“DRTV”). Discontinued operating results for 2014 and 2015 also include legal expenses associated with the sale of goodsour DVD distribution business to Cinedigm.
We report these businesses as discontinued operations, and, services overaccordingly, we have reclassified their financial results for all periods presented to reflect them as such. Unless otherwise noted, discussions in this Form 10-K pertain to our continuing operations.
Business Segments
Through June 30, 2016, we managed our company and aggregated our operational and financial information in two reportable segments, which were aligned based on their products or services.
Gaia: | This segment represented our ongoing business, and the accompanying financial statements show the results of this business segment. This segment included our subscription video streaming service and the results of our legacy DVD subscription business. |
Gaiam Brand: | This segment represents the operations that were sold during 2016 including our Gaiam branded yoga, fitness, and wellness products. It also included Natural Habitat until May 4, 2016. As discussed above, we completed the sale of the remaining Gaiam Brand business on July 1, 2016. The results of operations of the Gaiam Brand segment are shown as discontinued operations in the accompanying financial statements. |
Following the Internet, and certain states have taken measures to tax Internet-related activities. If legislation is enacted that requires us to collect sales taxes on sales to residents of other states or jurisdictions, our direct to consumer sales channels may be adversely affected. Our business is also subject to a number of other governmental regulations, including the Mail or Telephone Order Merchandise Rule and related regulationssale of the Federal Trade Commission. These regulations prohibit unfair methods of competitionGaiam Brand segment on July 1, 2016, our chief operating decision maker reviews operating results on a consolidated basis and unfair or deceptive acts or practices in connection with mail and telephone order sales and require sellers of mail and telephone order merchandise to conform to certain rules of conduct with respect to shipping dates and shipping delays. We are also subject to regulations of the U.S. Postal Service and various state and local consumer protection agencies relating to matters such as advertising, order solicitation, shipment deadlines and customer refunds and returns. In addition, merchandise that we import is subject to import and customs duties and, in some cases, import quotas.
Seasonality
See the “Quarterly and Seasonal Fluctuations” section of Item 7, Management’s Discussion and Analysis of Financial Condition and Results of Operations, for information pertaining to the seasonal aspects of our business.therefore have one reportable segment.
Website and Available Information
Our corporate website at gaiam.comwww.gaia.com provides information about us, our history, goals and philosophy, as well as certain financial reports and corporate press releases. Our gaiam.comwww.gaia.com website also features a library of information and articles on personal development and healthy lifestyles, along with an extensive offering of products, services and media.video content. We believe our website provides us with an opportunity to deepen our relationships with our customers and investors, educate them on a variety of issues, and improve our service. As part of this commitment, we have a link on our corporate website to our Securities and Exchange Commission filings, including our reports on Form 10-K, 10-Q and 8-K and amendments thereto. We make those reports available through our website, free of charge, as soon as reasonably practicable after these reports are filed with the Securities and Exchange Commission.
Additional information about our products and services can be found at SPRI.com and GaiamTV.com. We have included our websites addresseswebsite address only as inactive textual reference, and the information contained on our website is not incorporated by reference into this Form 10-K.
We wish to caution you that there are risks and uncertainties that could cause our actual results to be materially different from those indicated by forward looking statements that we make from time to time in filings with the Securities and Exchange Commission, news releases, reports, proxy statements, registration statementscommunications to shareholders and other written communications as well asand oral forward looking statements made from time to time by our representatives.communications. These risks and uncertainties include those risks described below of which we are presently aware. Historical results are not necessarily an indication of the future results. The risk factors below discuss important factors that could cause our business, financial condition, operating results and cash flows to be materially adversely affected.
If our efforts to attract and retain subscribers are not successful, our business will be adversely affected.
We have experienced significant subscriber growth since we began or subscription business in 2007. Our ability to continue to attract subscribers will depend in part on our ability to consistently provide our subscribers with a valuable and quality streaming experience. Furthermore, the relative service levels, content offerings, pricing and related features of our competitors may adversely impact our ability to attract and retain subscribers. We are competing for screen viewing time with many competing offerings, including multichannel video programming distributors providing free-on-demand content through authenticated Internet applications, Internet-based movie and TV content providers, including both those that provide legal and illegal (or pirated) streaming video content, and streaming video retail stores. If consumers do not perceive our service offering to be of value, or if we introduce new or adjust existing features or change the mix of content in a manner that is not favorably received by them, we may not be able to attract and retain subscribers.
In addition, many of our subscribers originate from word-of-mouth advertising from existing subscribers. If our efforts to satisfy our existing subscribers are not successful, we may not be able to attract new subscribers, and as a result, our ability to maintain and/or grow our business will be adversely affected. Subscribers cancel our service for many reasons, including a perception that they do not use the service sufficiently, the need to cut household expenses, unsatisfactory availability of content, competitive services providing a better value or experience and customer service issues are not satisfactorily resolved. We must continually add new subscribers both to replace subscribers who cancel and to grow our business beyond our current subscriber base. If too many of our subscribers cancel our service, or if we are unable to attract new subscribers in numbers sufficient to sustain and grow our business, our operating results will be adversely affected. If we are unable to successfully compete with current and new competitors in both retaining our existing subscribers and attracting new subscribers, our business will be adversely affected. Further, if excessive numbers of subscribers cancel our service, we may be required to incur significantly higher marketing expenditures than we currently anticipate in order to replace these subscribers with new subscribers.
If we are unable to compete effectively, our business will be adversely affected.
The market for streaming content is intensely competitive and subject to rapid change. New technologies and evolving business models for delivery of streaming content continue to develop at a fast pace. Through new and existing distribution channels, consumers are afforded various means for consuming streaming content. The various economic models underlying these differing means of streaming content delivery include subscription, transactional, ad-supported and piracy-based models. All of these have the potential to capture meaningful segments of the streaming content market. Several competitors have longer operating histories, larger customer bases, and stronger brand recognition than we do and have significant financial, marketing and other resources. They may secure better terms from suppliers, adopt more aggressive pricing and devote more resources to technology, and marketing. New entrants may enter the market with unique service offerings or approaches to providing streaming content and other companies also may enter into business combinations or alliances that strengthen their competitive positions. If we are unable to successfully or profitably compete with current and new competitors, programs and technologies, our business will be adversely affected, and we may not be able to increase market share and revenues, and achieve profitability.
We could be harmed by data loss or other security breaches.
As a result of our services being Internet-based and the fact that we process, store, and transmit data, including personal information, for our customers, failure to prevent or mitigate data loss or other security breaches, including breaches of our supplier’s technology and systems, could expose us or our customers to a risk of loss or misuse of such information, adversely affect our operating results, result in litigation or potential liability for us, and otherwise harm our business. We use third party technology and systems for a variety of reasons, including, without limitation, encryption and authentication technology, employee email, content delivery to customers, back-office support, and other functions. While we have not experienced past security breaches, there can be no assurance of a similar result in the future. Although we have developed systems and processes that are designed to protect customer information and prevent data loss and other security breaches, including systems and processes designed to reduce the impact of a security breach at a third party supplier, such measures cannot provide absolute security.
We have had operating losses, and we cannot assure future profitability.
We reported operating losses of $10.8 million, $9.0 million and $9.8 million for fiscal years 2016, 2015 and 2014, respectively (excluding the results from operations we sold including a pre-tax gain of $124.8 million in 2016). We cannot assure you that we will operate profitably in future periods and, if we do not, we may not be able to meet any future debt service requirements, working capital requirements, capital expenditure plans, production slate, acquisition plans or other cash needs. Our inability to meet those needs could have a material adverse effect on our business, financial condition, operating results, liquidity and prospects.
If we are not able to manage change and growth, our business could be adversely affected.
We are expanding our operations internationally, scaling our streaming service to effectively and reliably handle anticipated growth in both subscribers and features related to our service, as well as continuing to provide our Spiritual Cinema Circle monthly DVD subscription offerings for an additional fee. As we expand internationally, we are managing our business to address varied content offerings, consumer customs and practices, in particular those dealing with e-commerce and Internet video, as well as differing legal and regulatory environments. As we scale our streaming service, we are developing technology and utilizing third-party Internet-based or “cloud” computing services. If we are not able to manage the growing complexity of our business, including improving, refining or revising our systems and operational practices related to our streaming operations, our business may be adversely affected.
If our efforts to build unique brand identity and improve subscriber satisfaction and loyalty are not successful, we may not be able to attract or retain subscribers, and our operating results may be adversely affected.
We must continue to build and maintain a unique brand identity. We believe that a unique brand identity will be important in attracting and retaining subscribers who have a number of choices from which to obtain streaming content. To build a unique brand identity we believe we must continue to offer content and service features that our subscribers value and enjoy. We also believe that these must be coupled with effective consumer communications, such as marketing, customer service and public relations. If our efforts to promote and maintain our brand identity are not successful, our ability to attract and retain subscribers may be adversely affected. Such a result may adversely affect our operating results.
With respect to our expansion into international markets, we will also need to establish our brand identity in new markets and languages, and to the extent we are not successful, our business in new markets may be adversely impacted.
Changes in our subscriber acquisition sources could adversely affect our marketing expenses and subscriber levels may be adversely affected.
We utilize a broad mix of marketing and public relations programs, including social media websites such as Facebook and Twitter, to promote our service to potential new subscribers. We may limit or discontinue use or support of certain marketing sources or activities if advertising rates increase or if we become concerned that
subscribers or potential subscribers deem certain marketing practices intrusive or damaging to our brand. If available marketing channels are limited or curtailed, our ability to attract new subscribers may be adversely affected.
Companies that currently promote our services may cease promoting our services, may determine to compete more directly with our business or enter a similar business, or may decide to exclusively support our competitors. If we no longer have access to such marketing channels, our marketing efforts may be adversely affected. If we are unable to maintain or replace our sources of subscribers with similarly effective sources, or if the cost of our existing sources increases, our subscriber levels and marketing expenses may be adversely affected.
We face risks, such as unforeseen costs, and potential liabilities in connection with content we produce, license and/or distribute through our service.
As a distributor of content, we face potential liability for negligence, copyright or trademark infringement or other claims based on the nature and content of materials that we produce, license and/or distribute. We also may face potential liability for content used in promoting our service, including marketing materials and features on our website such as subscriber reviews.
We are responsible for production costs and other expenses related to our original content. We also take on risks associated with this production, such as completion and key talent risk. To the extent we do not accurately anticipate costs or mitigate risks, or if we become liable for content we produce, license and/or distribute, our business may suffer. Litigation to defend these claims could be costly and the expenses and damages arising from any liability or unforeseen production risks could harm our results of operations. We may not be indemnified to cover claims or costs of these types and we may not have insurance coverage for these types of claims.
We rely upon a number of partners to offer instant streaming of content to various devices.
We currently offer subscribers the ability to receive streaming content through a host of Internet-connected devices, including Internet-enabled TVs, digital video players and mobile devices. We intend to continue to broaden our capability to instantly stream content to other platforms over time. If we are not successful in maintaining existing and creating new relationships, or if we encounter technological, content licensing or other impediments to our streaming content, our ability to grow our business could be adversely impacted.
We have entered into agreements with certain consumer electronics partners, pursuant to which each makes available an “app” for viewing our content on its hardware platform. Our agreements with our consumer electronics partners are typically between one and three years in duration and our business could be adversely affected if, upon expiration, our partners do not continue to provide access to our service or are unwilling to do so on terms acceptable to us, which terms may include the degree of accessibility and prominence of our service.
Furthermore, the devices consumers use to access our content are manufactured and sold by entities other than Gaia and the devices’ performance and the connection between these devices and our service may result in consumer dissatisfaction that could result in claims against us or otherwise adversely impact our business. In addition, technology changes to our streaming functionality may require that partners update their devices. If partners do not update or otherwise modify their devices, our service and our subscribers’ use and enjoyment could be negatively impacted.
Any significant disruption in our computer systems or those of third parties that we utilize in our operations could result in a loss or degradation of service and could adversely impact our business.
Our reputation and ability to attract, retain and serve our subscribers is dependent upon the reliable performance of our computer systems and those of third parties that we utilize in our operations. We experience occasional system interruptions and delays that make our websites and services unavailable or slow to respond and prevent us from efficiently providing services to our customers, which may reduce the attractiveness of our services. If we are unable to effectively upgrade our systems and network infrastructure, and take other steps to improve the efficiency of our systems, it could cause system interruptions or delays and adversely affect our operating results.
Our systems may be subject to damage or interruption from adverse weather conditions, natural disasters, terrorist attacks, power loss, telecommunications failures, computer viruses, computer denial of service attacks, or other attempts to harm these systems. Interruptions in these systems, or to the Internet in general, could make our service unavailable or degraded or otherwise hinder our ability to deliver content to our subscribers. Service interruptions, errors in our software or the unavailability of computer systems used in our operations could diminish the overall attractiveness of our subscribership service to existing and potential subscribers.
The servers of third parties we use in our operations are vulnerable to computer viruses, physical or electronic break-ins and similar disruptions and periodically experience directed attacks intended to lead to interruptions and delays in our service and operations as well as loss, misuse or theft of data. Any attempt by hackers to disrupt our service or otherwise access our systems, if successful, could harm our business, be expensive to remedy and damage our reputation. We have implemented certain systems and processes to thwart hackers and to date, hackers have not had a material impact on our service or systems. However, this is no assurance that hackers may not be successful in the future. Our insurance does not cover expenses related to such disruptions or unauthorized access. Efforts to prevent hackers from disrupting our service or otherwise accessing our systems are expensive to implement and may limit the functionality of or otherwise negatively impact our service offering and systems. Any significant disruption to our service or access to our systems could result in a loss of subscribers and adversely affect our business and results of operation.
We utilize third-party Internet-based or “cloud” computing services in our business operations. We also utilize third-party content delivery networks to help us stream content in high volume to our subscribers over the Internet. Problems with these systems faced by us or our service providers, including technological or business-related disruptions, could adversely impact the experience of our subscribers.
We rely on our proprietary technology to stream content and to manage other aspects of our operations, and the failure of this technology to operate effectively could adversely affect our business.
We continually enhance or modify the technology used for our operations. We cannot be sure that any enhancements or other modifications we make to our operations will achieve the intended results or otherwise be of value to our subscribers. Future enhancements and modifications to our technology could consume considerable resources. If we are unable to maintain and enhance our technology to manage the streaming of content to our subscribers in a timely and efficient manner, or if our technology or that of third parties we utilize in our operations fails or otherwise operates improperly, our ability to retain existing subscribers and to add new subscribers may be impaired. Also, any harm to our subscribers’ personal computers or other devices caused by software used in our operations could have an adverse effect on our business, results of operations and financial condition.
Changes in how network operators handle and charge for access to data that travel across their networks could adversely impact our business.
We rely upon the ability of consumers to access our service through the Internet. To the extent that network operators implement usage-based pricing, including meaningful bandwidth caps, or otherwise try to monetize access to their networks by data providers, we could incur greater operating expenses and our subscriber acquisition and retention could be negatively impacted. Furthermore, to the extent network operators were to create tiers of Internet access service and either charge us for, or prohibit us from, being available through these tiers, our business could be negatively impacted.
Increases in payment processing fees, changes to operating rules, the acceptance of new types of payment methods or payment fraud could increase our operating expenses and adversely affect our business and results of operations.
Our subscribers pay for our services predominately using credit and debit cards. Our acceptance of these payment methods requires our payment of certain fees. From time to time, these fees may increase, either as a result of rate changes by the payment processing companies or as a result of a change in our business practices which increase the fees on a cost-per-transaction basis. Such increases may adversely affect our results of operations.
We are subject to rules, regulations and practices governing our accepted payment methods. These rules, regulations and practices could change or be reinterpreted to make it difficult or impossible for us to comply. If we fail to comply with these rules or requirements, we may be subject to fines and higher transaction fees and lose our ability to accept these payment methods, and our business and results of operations would be adversely affected.
We accept payment methods other than credit and debit cards. As our service continues to evolve and expand internationally, we will likely continue to explore accepting various forms of payment, which may have higher fees and costs than our currently accepted payment methods. If more consumers utilize higher cost payment methods, our payment costs could increase and our results of operations could be adversely impacted.
In addition, we do not obtain signatures from subscribers in connection with their use of payment methods. To the extent we do not obtain subscribers’ signatures, we may be liable for fraudulent payment transactions, even when the associated financial institution approves payment of the orders. From time to time, fraudulent payment methods are used to obtain service. While we do have safeguards in place, we nonetheless experience some fraudulent transactions. We do not currently carry insurance against the risk of fraudulent payment transactions. A failure to adequately control fraudulent payment transactions would harm our business and results of operations.
If our trademarks and other proprietary rights are not adequately protected to prevent unauthorized use or appropriation, the value of our brand and other intangible assets may be diminished, and our business may be adversely affected.
We rely and expect to continue to rely on a combination of confidentiality and license agreements with our employees, consultants and third parties with whom we have relationships, as well as trademark, copyright and trade secret protection laws, to protect our proprietary rights. We may also seek to enforce our proprietary rights through court proceedings. We may file trademark applications from time to time. These applications may not be approved, third parties may challenge any trademarks issued to or held by us, third parties may knowingly or unknowingly infringe our trademarks and other proprietary rights, and we may not be able to prevent infringement or misappropriation without substantial expense to us.
We currently hold various domain names, including www.gaia.com and www.gaiamtv.com. Failure to protect our domain names could adversely affect our reputation and make it more difficult for users to find our website and our service. We may be unable, without significant cost or at all, to prevent third parties from acquiring domain names that are similar to, infringe upon or otherwise decrease the value of our trademarks and other proprietary rights.
Intellectual property claims against us could be costly and result in the loss of significant rights related to, among other things, our website, title selection processes and marketing activities.
Our intellectual property rights extend to our technology, business processes and the content on our website. We use the intellectual property of third parties in marketing and providing our services through contractual and other rights. From time to time, third parties may allege that we have violated their intellectual property rights. If we are unable to obtain sufficient rights, successfully defend our use, or develop non-infringing technology and content or otherwise alter our business practices on a timely basis in response to claims of infringement, misappropriation, misuse or other violation of third-party intellectual property rights, our business and competitive position may be adversely affected.
Many companies devote significant resources to developing patents that could potentially affect many aspects of our business. There are numerous patents that broadly claim means and methods of conducting business on the Internet. We have not searched patents relative to our technology. Defending ourselves against intellectual property claims, whether they are with or without merit or are determined in our favor, will result in costly litigation and diversion of technical and management personnel. Infringement claims also may result in our inability to use our current website, streaming technology, our recommendation and personalization technology or inability to market our service. As a result of disputes, we may have to develop non-infringing technology, enter into royalty or licensing agreements, adjust our merchandising or marketing activities or take other actions to resolve the claims. These actions, if required, may be costly or unavailable on terms acceptable to us.
Piracy of video, including digital and Internet piracy may reduce the gross receipts from the exploitation of our content.
Video piracy is extensive in many parts of the world and is made easier by technological advances and the conversion of video into digital formats. This trend facilitates the creation, transmission and sharing of high quality unauthorized copies of content on DVDs, Blu-ray discs, and the Internet. We may have to implement elaborate and costly security and anti-piracy measures, which could result in significant expenses and losses of revenue. We cannot assure you that security and anti-piracy measures will prevent the piracy of our content. The proliferation of unauthorized copies of these products could have an adverse effect on our business, because these products could reduce the revenues we receive from our subscription service.
Our online activities are subject to a variety of laws and regulations relating to privacy which, if violated, could subject us to an increased risk of litigation and regulatory actions.
In addition to our websites and applications, we use third-party applications, websites, and social media platforms to promote our service and engage consumers, as well as monitor and collect certain information about users of our service. There are a variety of laws and regulations governing individual privacy and the protection and use of information collected from such individuals, particularly in relation to an individual’s personally identifiable information (e.g., credit card numbers). Many foreign countries have adopted similar laws governing individual privacy, some of which are more restrictive than similar U.S. laws. If our online activities were to violate any applicable current or future laws and regulations, we could be subject to litigation and regulatory actions, including fines and other penalties.
We may be subject to litigation which, if adversely determined, could cause us to incur substantial losses.
From time to time during the normal course of operating our businesses, we are subject to various litigation claims and legal disputes. Some of the litigation claims may not be covered under our insurance policies, or our insurance carriers may seek to deny coverage. As a result, we might also be required to incur significant legal fees, which may have a material adverse effect on our financial position. In addition, because we cannot accurately predict the outcome of any action,dispute, it is possible that, as a result of current and/or future litigation, we will be subject to adverse judgments or settlements that could significantly reduce our earnings or result in losses.
We are preparing to enter into arbitration with Cinedigm Corp. (“Cinedigm”) in connection withmay face legal liability for the sale of a subsidiary to Cinedigm. The outcome of the arbitration process cannot be predicted at this time. The ultimate resolution of the dispute could have a material impact to the Company, see Note 8 to the Consolidated Financial Statements.
Changes in general economic conditions could have a material impactcontent contained on our businesswebsite.
Changes in overall economic conditionsWe could face legal liability for defamation, negligence, copyright, patent or trademark infringement, personal injury or other claims based on the nature and content of materials that impact consumer spending could impact our results of operations. Future economic conditions affecting disposable income such as employment levels, consumer confidence, credit availability, business conditions, stock market volatility, inflation, acts of terrorism, threats of war, and interest and tax rates could reduce consumer spendingwe publish or cause consumers to shift their spending away from our products. If the economic conditions and performance of the retail and media environment worsen, we may experience material adverse impactsdistribute on our business, operating results and financial condition.
Increased competition could impact our financial results
We believe thatwebsite. If we are held liable for damages for the healthy lifestyles market includes thousands of small, local and regional businesses. Some smaller businesses may be able to more effectively personalize their relationships with customers, thereby gaining a competitive advantage. Although we believe that we do not compete directly with any single company that offers our entire range of merchandise and services, within each category we have competitors and we may face competition from new entrants. Some of our competitors or our potential competitors may have greater financial and marketing resources and greater brand recognition. In addition, larger, well-established and well-financed entities may acquire, invest in or form joint ventures with our competitors. Increased competition from these or other competitors could negatively impact our business.
Changing consumer preferences may have an adverse effectcontent on our website, our business
We target consumers who assign high value to personal development, healthy lifestyles, responsible media, and the environment. A decrease may suffer. Allegations of consumer interest in purchasing goods and services that promote the values we espouse would materially and adversely affect our customer base and sales revenues and, accordingly, our financial prospects. Further, consumer preferences and product trends are difficult to predict. Our future success depends in part on our ability to anticipate and respond to changes in consumer preferences and we may not respond in a timely or commercially appropriate manner to such changes. Failure to anticipate and respond to changing consumer preferences and product trendsimpropriety, even if unfounded, could lead to, among other things, lower sales of our products, increased merchandise returns and lower margins, which couldtherefore have a material adverse effect on our reputation and our business.
Our strategyIf government regulations relating to the Internet or other areas of offering branded productsour business change, we may need to alter the manner in which we conduct our business, or incur greater operating expenses.
The adoption or modification of laws or regulations relating to the Internet or other areas of our business could limit or otherwise adversely affect the manner in which we currently conduct our business. In addition, the continued growth and development of the market for online commerce may lead to inventory risk and higher costs
An important partmore stringent consumer protection laws, which may impose additional burdens on us. If we are required to comply with new regulations or legislation or new interpretations of our strategy is to feature branded products. These products are sold under our brand names and are manufactured to our specifications. We expect our reliance on branded merchandise to increase. The use of branded merchandise requiresexisting regulations or legislation, this compliance could cause us to incur additional expenses or alter our business model.
The adoption of any laws or regulations that adversely affect the growth, popularity or use of the Internet, including laws impacting Internet neutrality, could decrease the demand for our service and increase our cost of doing business. If Internet neutrality rules are rejected, broadband Internet access providers may be able to charge web-based services such as ours for priority access to customers, which could result in increased costs and risks relating to the design and purchasea loss of products, including submitting orders earlier and making longer initial purchase commitments.
In addition, the useexisting users, impairment of branded merchandise limits our ability to return unsold productsattract new users, and material adverse effects on our business and opportunities for growth. Additionally, as we expand internationally, government regulation concerning the Internet, and in particular, network neutrality, may be nascent or non-existent. Within such a regulatory environment,
coupled with potentially significant political and economic power of local network operators, we could experience discriminatory or anti-competitive practices that could impede our growth, cause us to vendors,incur additional expense or otherwise negatively affect our business.
We could be subject to economic, political, regulatory and other risks arising from international operations.
Operating in international markets requires significant resources and management attention and will subject us to regulatory, economic and political risks that may be different from and incremental to those in the United States. In addition to the risks that we face in the United States, our international operations may involve risks that could adversely affect our business, including the following: the need to adapt our content and user interfaces for specific cultural and language differences, including licensing a certain portion of our content library before we have developed a full appreciation for its performance within a given territory; difficulties and costs associated with staffing and managing foreign operations; management distraction; political or social unrest and economic instability; compliance with U.S. laws, such as the Foreign Corrupt Practices Act, export controls and economic sanctions, and local laws prohibiting corrupt payments to government officials; unexpected changes in regulatory requirements; less favorable foreign intellectual property laws; adverse tax consequences such as those related to repatriation of cash from foreign jurisdictions into the United States, non-income related taxes such as value-added tax or other indirect taxes, changes in tax laws or their interpretations, or the application of judgment in determining our global provision for income taxes and other tax liabilities given inter-company transactions and calculations where the ultimate tax determination is uncertain; fluctuations in currency exchange rates, which can resultcould impact revenues and expenses of our international operations and expose us to foreign currency exchange rate risk; profit repatriation and other restrictions on the transfer of funds; differing payment processing systems as well as consumer use and acceptance of electronic payment methods, such as credit and debit cards; new and different sources of competition; different and more stringent user protection, data protection, privacy and other laws; and availability of reliable broadband connectivity and wide area networks in higher markdowns in order to sell excess inventory. Our commitment to customer service typically results in our keeping a high level of merchandise in stock so we can fill orders quickly. Consequently, we run the risk of having excess inventory, which may also contribute to higher markdowns. targeted areas for expansion.
Our failure to manage any of these risks successfully execute a branded merchandise strategy or to achieve anticipated profit margins on these goods, or a higher than anticipated levelcould harm our international operations and our overall business, and results of overstocks, may materially adversely affect our revenues.operations.
We offermay lose key employees or may be unable to hire qualified employees.
We rely on the continued service and performance of our customers liberal merchandise return policies. senior management, including in particular Jirka Rysavy, our Chairman and the founder of Gaia, Inc. In our industry, there is substantial and continuous competition for highly skilled business, product development, technical and other personnel. Hiring qualified management is difficult due to the limited number of qualified professionals in the industry in which we operate. Failure to recruit, attract and retain personnel, particularly management personnel, could materially harm our business, financial condition, and results of operations.
We may face quarterly and seasonal fluctuations that could harm our business.
Our consolidated financial statements includerevenues and results of operations have fluctuated in the past, and will likely continue to fluctuate, on a reserve for anticipated merchandise returns, whichquarterly basis. Such fluctuation is based on historical return rates. It is possiblethe result of a seasonal pattern that actual returns may increasereflects variations when consumers buy Internet-connected devices and, as a result, tend to increase their viewing, similar to those of factors such asgeneral video streaming services. Our member growth is generally greatest in the introduction of new merchandise, changesfourth and first quarters (October through March), and slowest in merchandise mix or other factors. Any increase in our merchandise returns will correspondingly reduce our revenues and profits.the May through August period.
Acquisitions and new initiatives may harm our financial resultsresults.
We have historically expanded our operations in part through strategic acquisitions and through new initiatives that we generate. We cannot accurately predict the timing, size and success of these efforts. Our acquisition and new initiative strategies involve significant risks that could inhibit our growth and negatively impact our operating results, including the following: our ability to identify suitable acquisition candidates or new initiatives at acceptable prices; our ability to complete the acquisitions of candidates that we identify or develop our new initiatives; our ability to compete effectively for available acquisition opportunities; increases in asking prices by acquisition candidates to levels beyond our financial capability or to levels that would not result in the returns required by our
acquisition criteria; diversion of management’s attention to expansion efforts; unanticipated costs and contingent liabilities associated with acquisitions and new initiatives; failure of acquired businesses or new initiatives to achieve expected results; our failure to retain key customers or personnel of acquired businesses and difficulties entering markets in which we have no or limited experience. In addition, the size, timing and success of any future acquisitions and new initiatives may cause substantial fluctuations in our operating results from quarter to quarter. Consequently, our operating results for any quarter may not be indicative of the results that may be achieved for any subsequent quarter or for a full fiscal year. These fluctuations could adversely affect the market price of our Class A common stock.results.
The loss of the services of our key personnel could disrupt our business
We depend on the continued services and performance of our senior management and other key personnel, particularly Jirka Rysavy and Lynn Powers, who intends to retire once a replacement is identified and transitioned into Gaiam. A loss of one or more of the members of our senior management or key personnel, without suitable replacements, could severely and negatively impact our operations. Our strategy of allowing the management teams of some acquired companies to continue to exercise significant management responsibility for those companies makes it important that we retain key employees, particularly the sales and creative teams, of the companies we might acquire. Hiring qualified management is difficult due to the limited number of qualified professionals in the industry in which we operate. Failure to attract and retain personnel, particularly management personnel, could materially harm our business, financial condition, and results of operations.
Our founder and chairman, Jirka Rysavy, has voting control over our companycompany.
Mr. Rysavy holds 100% of our 5,400,000 outstanding shares of Class B common stock and also owns 648,682348,682 shares of Class A common stock. The shares of Class B common stock are convertible into shares of Class A common stock at any time. Each share of Class B common stock has ten votes per share, and each share of Class A common stock has one vote per share. Consequently, Mr. Rysavy holds approximately 75%85% of our voting stock and thus, is able to exert substantial influence over us and to control matters requiring approval by our shareholders, including the election of directors, increasing our authorized capital stock, or a merger or sale of substantially all of our assets. As a result of Mr. Rysavy’s control of us, no change of control can occur without Mr. Rysavy’s consent.
Our success depends on the value of our brand
Because of our reliance on sales of proprietary products, our success depends on our brand. Building and maintaining recognition of our brand are important for attracting and expanding our customer base. If the value of our brand were adversely affected, we cannot be certain that we would be able to attract new customers, retain existing customers or encourage repeat purchases, and if the value of our brand were to diminish, our revenues, results of operations and prospects would be adversely affected.
Our future cash flows may not be sufficient to meet our obligations and we may have difficulty obtaining financing
Our cash balance at December 31, 2014 was $15.8 million. We presently do not have any financing arrangements in place to assist us in meeting our obligations. There can be no assurance in the future whether we will generate sufficient cash flow from operations to meet our obligations or whether we would be able to secure financing or other sources of funds, such as from the sale of our shelf registration stock, should the need arise.
Product liability claims against us could result in adverse publicity and potentially significant monetary damages
As a seller of consumer products, we may face product liability claims in the event that use of our products results in injuries. If such injuries or claims of injuries were to occur, we could incur monetary damages and our business could be adversely affected by any resulting negative publicity. The successful assertion of product liability claims against us also could result in potentially significant monetary damages and, if our insurance protection is inadequate to cover these claims, could require us to make significant payments from our own resources.
We are dependent on third party suppliers for the success of our proprietary products
We are dependent on the success of our proprietary products, and we rely on a select group of manufacturers to provide us with sufficient quantities to meet our customers’ demands in a timely manner, produce these products in a humane and safe environment for both their workers and the planet, maintain quality standards consistent with our brand, and meet certain pricing guarantees. Our overseas sourcing arrangements carry risks associated with products manufactured outside of the U.S., including political unrest and trade restrictions, currency fluctuations, transportation difficulties, work stoppages, and other uncertainties. In addition, a number of our suppliers are small companies, and some of these vendors may not have sufficient capital, resources or personnel to maintain or increase their sales to us or to meet our needs for commitments from them. The failure of our suppliers to provide sufficient quantities of our proprietary products could decrease our revenues, increase our costs, and damage our customer service reputation.
We rely on communications and shipping networks to deliver our products
Given our emphasis on customer service, the efficient and uninterrupted operation of order-processing and fulfillment functions is critical to our business. To maintain a high level of customer service, we rely heavily on a number of different outside service providers, such as printers, telecommunications companies and delivery companies. Any interruption in services from our principal outside service providers, including delays or disruptions resulting from labor disputes, power outages, human error, adverse weather conditions or natural disasters, could materially adversely affect our business. In addition, freight carriers must ship products that we source overseas to our distribution center, and a work stoppage or political unrest could adversely affect our ability to fulfill our customer orders.
Information systems upgrades or integrations may disrupt our operations or financial reporting
We continually evaluate and upgrade our management information systems, which are critical to our business. These systems assist in processing orders, managing inventory, purchasing and shipping merchandise on a timely basis, responding to customer service inquiries, and gathering and analyzing operating data by business segment, customer, and stock keeping unit (a specific identifier for each different product). We are required to continually update these systems. Furthermore, if we acquire other companies, we will need to integrate the acquired companies’ systems with ours, a process that could be time-consuming and costly. If our systems cannot accommodate our growth or if they fail, we could incur substantial expenses and our business could be adversely affected.
Additionally, success in e-commerce depends upon our ability to provide a compelling and satisfying shopping experience. To remain competitive, we must continue to enhance and improve the responsiveness, functionality and features of our online technology, and if we are unable to do this, our business could be adversely affected.
A material security breach could cause us to lose sales, damage our reputation or result in liability to us
Our computer servers may be vulnerable to computer viruses, physical or electronic break-ins and similar disruptions. We may need to expend significant additional capital and other resources to protect against a security breach or to alleviate problems caused by any breaches. Our relationships with our customers may be adversely affected if the security measures that we use to protect personal information such as credit card numbers are ineffective. We currently rely on security and authentication technology that we license from third parties. We may not succeed in preventing all security breaches and our failure to do so could adversely affect our business.
Our systems may fail or limit user traffic, which would cause us to lose sales
We support a portion of our business through our call center in Louisville, Colorado. Even though we have back up arrangements, we are dependent on our ability to maintain our computer and telecommunications equipment in this center in effective working order and to protect against damage from fire, natural disaster, power loss, telecommunications failure or similar events. In addition, growth of our customer base may strain or exceed the capacity of our computer and telecommunications systems and lead to degradations in performance or systems failure. We have experienced capacity constraints and failure of information systems in the past that have resulted in decreased levels of service delivery or interruptions in service to customers for limited periods of time. Although we continually review and consider upgrades to our technical infrastructure and provide for system redundancies and backup power to limit the likelihood of systems overload or failure, substantial damage to our systems or a systems failure that causes interruptions for a number of days could adversely affect our business. Additionally, if we are unsuccessful in updating and expanding our infrastructure, including our call center, our ability to grow may be constrained.
Government regulation of the Internet and E-commerce is evolving and unfavorable changes could harm our business
We are subject to general business regulations and laws, as well as regulations and laws specifically governing the Internet and E-commerce. Such existing and future laws and regulations may impede the growth of the Internet or other online services. These regulations and laws may cover taxation, user privacy, pricing, content, copyrights, distribution, consumer protection, the provision of online payment services and quality of products and services. Many of the fundamental statutes and regulations applicable to our business were established before the adoption and growth of the Internet and e-commerce. There is lack of clarity on how existing laws and regulations governing issues such as property ownership, sales and other taxes and personal privacy apply to the Internet and E-commerce. Unfavorable resolution of these issues may harm our business.
Specifically, the application of indirect taxes (such as sales and use tax, value-added tax (VAT), goods and services tax, business tax and gross receipt tax) to e-commerce businesses such as ours and our customers is a complex and evolving issue. In many cases, it is not clear how existing tax laws and regulations apply to the Internet and E-commerce. In addition, governments are increasingly looking for ways to increase revenues, which has resulted in discussions about tax reform and other legislative action to increase tax revenues, including through indirect taxes. We generally collect sales taxes only on sales to residents of states in which we have nexus. Currently, we collect sales taxes on certain sales to residents of California, Colorado, Illinois, New York, New Jersey, Ohio, and Texas. A number of legislative proposals have been made at the federal, state and local level, and by foreign governments, that would impose additional taxes on the sale of goods and services over the Internet and certain states and other jurisdictions have taken measures to tax Internet-related activities. If legislation is enacted that requires us to collect taxes on sales to residents of other states or jurisdictions, sales in our direct to consumer businesses may be adversely affected. Further, a successful assertion by one or more states or other jurisdictions requiring us to collect taxes where we do not do so could result in substantial tax liabilities, including for past sales, as well as penalties and interest.
We may face legal liability for the content contained on our websites
We could face legal liability for defamation, negligence, copyright, patent or trademark infringement, personal injury or other claims based on the nature and content of materials that we publish or distribute on our websites. If we are held liable for damages for the content on our websites, our business may suffer. Further, one of our goals is for our websites to be trustworthy and dependable providers of information and services. Allegations of impropriety, even if unfounded, could therefore have a material adverse effect on our reputation and our business.
Relying on our centralized fulfillment center could expose us to losing revenue
Prompt and efficient fulfillment of our customers’ orders is critical to our business. Our facility near Cincinnati, Ohio handles a portion of our fulfillment functions and some customer-service related operations, such as returns processing. Many of our orders are filled and shipped from the Cincinnati facility. The balance is shipped by third party fulfillment centers or directly from suppliers. Because we rely on a centralized fulfillment center, our fulfillment functions could be severely impaired in the event of fire, extended adverse weather conditions, transportation difficulties or natural disasters. Because we recognize revenue only when we ship orders, interruption of our shipping could diminish our revenues.
We may face quarterly and seasonal fluctuations that could harm our business
Our revenue and results of operations have fluctuated and will continue to fluctuate on a quarterly basis as a result of a number of factors, including the timing of catalog offerings, timing of orders from retailers, recognition of costs or net sales contributed by new merchandise, fluctuations in response rates, fluctuations in paper, production and postage costs and expenses, merchandise returns, adverse weather conditions that affect distribution or shipping, shifts in the timing of holidays and changes in our merchandise mix. In particular, our net sales and profits have historically been higher during the fourth quarter holiday season. We believe that this seasonality will continue in the future.
Postage and shipping costs may increase and therefore increase our expenses
We ship our products, catalogs, and lifestyle publications to consumers and the cost of shipping is a material expenditure. Postage and shipping prices increase periodically and can be expected to increase in the future. Any inability to secure suitable or commercially favorable prices or other terms for the delivery of our merchandise and catalogs could have a material adverse effect on our financial condition and results of operations.
Our business is subject to reporting requirements that continue to evolve and change, which could continue to require significant compliance effort and resourcesresources.
Because our Class A common stock is publicly traded, we are subject to certain rules and regulations of federal, state and financial market exchange entities charged with the protection of investors and the oversight of companies whose securities are publicly traded. These entities, including the Public Company Accounting Oversight Board, the SecuritiesSEC and Exchange Commission and the NASDAQ, periodically issue new requirements and regulations and legislativeregulations. Legislative bodies also review and revise applicable laws. As interpretation and implementation of these laws and rules and promulgation of new regulations continues, we will continue to be required to commit significant financial and managerial resources and incur additional expenses.
Liability relating to environmental matters may impact the value of our real property.
We may be subject to environmental liabilities arising from our ownership of real property. Under various U.S. federal, state and local laws, an owner or operator of real property may become liable for the costs of removal of certain hazardous substances released on its property. These laws often impose liability without regard to whether the owner or operator knew of, or was responsible for, the release of such hazardous substances.
The presence of hazardous substances on real property owned by us may adversely affect our ability to sell such real property and we may incur substantial remediation costs, thus harming our financial condition. The discovery of material environmental liabilities attached to such real property could adversely affect our results of operations and financial condition.
Any of these events, in combination or individually, could disrupt our business and adversely affect our business, financial condition, results of operations and cash flows.
None.
Our principal executive offices areoffice is located in Louisville, Colorado. Our fulfillment center is located in the Cincinnati, Ohio area. The following table sets forth certain information relating to our primary facilities:
Primary
| Size | Use | Lease | |||||
Louisville, CO | 150,262 sq. ft. | Headquarters and studios | ||||||
| ||||||||
| Owned |
We rentlease to third parties approximately 61,400100,000 square feet of our building space located in Colorado. Our existing fulfillment center lease has renewal options permitting the extension of the lease for up to an additional three years. We believe our facilities arefacility is adequate to meet our current needs and that suitable additional facilities will be available for lease or purchase when, and as, we need them.
Item 3. |
On August 13, 2014, Cinedigm Corp. and Cinedigm Entertainment Holdings, LLC (together, “Cinedigm”) initiated an arbitration proceeding with the American Arbitration Association under the Membership Interest Purchase Agreement, dated October 17, 2013, by and among Cinedigm and the Company and one of its subsidiaries (the “MIPA”). Cinedigm’s arbitration demand alleges that the Company owes Cinedigm approximately $12.9 million under the working capital adjustment mechanism included in the MIPA. In addition, Cinedigm has claimed that Gaiam materially breached its representations and warranties under the MIPA, that the Company engaged in fraudulent and tortious acts in connection with the sale, and that the Company breached the terms of other agreements related to the transaction. The aggregate relief requested by Cinedigm exceeds $30.0 million and includes unspecified compensatory damages, attorneys’ fees, costs and interest, and other relief.
The Company believes that Cinedigm’s arbitration claims are without merit and represent a post-closing attempt to renegotiate the MIPA purchase price, and the Company intends to assert its positions vigorously through the legal process. Moreover, the Company believes that if the working capital mechanism is properly applied, Cinedigm owes the Company over $7.0 million, and the Company has initiated an arbitration process against Cinedigm. In addition to its working capital claim, the Company is pursuing a claim of approximately $700,000 against Cinedigm in connection with the Transition Services Agreement executed as part of the MIPA transaction, and is reviewing other claims that it may pursue against Cinedigm. The dispute outcome cannot be predicted at this time.
In view of the inherent difficulty of predicting the outcome of any asserted claim, particularly where large or indeterminate damages are sought, the Company cannot predict the outcome of any pending matter, the timing of ultimate resolution, or the eventual gain or loss (in each case, if any). However, in light of the uncertainty of litigation generally and the uncertainty of collection with regard to any judgment that the Company seeks, as well as the more certain substantial legal fees and costs that the Company expects to expend in the matter (which may continue into 2016), the Company has accrued a litigation-related reserve in the fourth quarter of 2014 of $3.0 million to cover such anticipated expenses and related reserves.
From time to time, we are involved in legal proceedings that we consider to be in the normal course of business. Claimed amountsAmounts claimed against us may be substantial but may not bear any reasonable relationship to the merits of the claim or the extent of any real risk of court or arbitral awards. We record accruals that can be reasonably estimated for losses related to those matters against us that we consider to be probable and that can be reasonably estimated.probable. Although it is not feasible to predict the outcome of these matters with certainty, it is reasonably possible that some legal proceedings may be disposed of or decided unfavorably to us and in excess of the amounts currently accrued. Based on available information, inIn the opinion of management, based on available information, settlements, arbitration awards and final judgments, if any, whichthat are considered probable of being rendered against us in litigation or arbitration in existence at December 31, 20142016 and that can be reasonably estimated are either reserved against or would not have a material adverse effect on our financial condition, results of operations or cash flows.
Not applicable.
Item 5. | Market for Registrant’s Common Equity, Related Stockholder Matters and Issuer Purchases of Equity Securities |
Stock Price History
Our Class A common stock is listed on the NASDAQ Global Market under the symbol “GAIA”. On February 27, 2015,21, 2017, we had 5,0113,462 shareholders of record and 19,089,0089,752,531 shares of $.0001 par value Class A common stock outstanding, and we had 5,400,000 shares of $.0001 par value Class B common stock outstanding, held by one shareholder.
The following table sets forth certain sales price data for our Class A common stock for the period indicated:
| High |
|
| Low |
| |||||||||||
| High | Low | |||||||||||||||
2014 | ||||||||||||||||
2016 |
|
|
|
|
|
|
|
| ||||||||
Fourth Quarter | $ | 7.85 | $ | 6.31 |
| $ | 10.07 |
|
| $ | 6.05 |
| ||||
Third Quarter | $ | 7.99 | $ | 6.44 |
| $ | 8.26 |
|
| $ | 7.03 |
| ||||
Second Quarter | $ | 8.76 | $ | 6.09 |
| $ | 8.00 |
|
| $ | 5.83 |
| ||||
First Quarter | $ | 7.36 | $ | 6.05 |
| $ | 6.49 |
|
| $ | 4.35 |
| ||||
2013 | ||||||||||||||||
2015 |
|
|
|
|
|
|
|
| ||||||||
Fourth Quarter | $ | 6.74 | $ | 4.99 |
| $ | 7.15 |
|
| $ | 5.94 |
| ||||
Third Quarter | $ | 6.06 | $ | 4.45 |
| $ | 7.25 |
|
| $ | 5.00 |
| ||||
Second Quarter | $ | 4.94 | $ | 3.70 |
| $ | 7.65 |
|
| $ | 6.14 |
| ||||
First Quarter | $ | 4.54 | $ | 2.95 |
| $ | 7.80 |
|
| $ | 6.05 |
| ||||
Issuer Purchases of Registered Equity Securities
None.
Period |
| (a) Total number of shares (or units) purchased |
|
|
| (b) Average price paid per share (or unit) |
|
| (c) Total number of shares (or units) purchased as part of publicly announced plans or programs |
|
| (d) Maximum number (or approximate dollar value) of shares (or units) that may yet be purchased under the plans or program |
| ||||
July 1 – 31 |
|
| 9,636,848 |
| (1) |
| $ | 7.75 |
|
|
| 9,636,848 |
|
|
| — |
|
August 1 – December 31 |
|
| — |
|
|
|
| — |
|
|
| — |
|
|
| — |
|
Total |
|
| 9,636,848 |
|
|
| $ | 7.75 |
|
|
| 9,636,848 |
|
|
| — |
|
(1): We announced a tender offer on May 10, 2016 to purchase in cash up to an aggregate of 12.0 million (i) shares of our issued and outstanding Class A Common Stock at a price of $7.75 per share, or (ii) vested and exercisable options to purchase shares of our Class A Common Stock at a price equal to $7.75 per option (less the exercise price of the option). A total of 9,636,848 shares and 842,114 options were validly tendered and not withdrawn prior to July 1, 2016, which was the expiration date of the offer. We made payments of $74.7 million for the shares and $1.4 million for the options. All repurchased shares were retired and all repurchased options were cancelled effective as of July 1, 2016.
Dividend Policy
No dividends were declared or paid during the years ended December 31, 2014, 20132016 and 2012.2015.
Sales of Unregistered Securities
On September 5, 2014 we issued 115,369 shares of our Class A common stock into escrow as partial payment for an acquisition we completed. The shares were released from escrow on March 5, 2015.
During 2013 we issued 1,055,000 shares of our Class A common stock into escrow as partial payment of an acquisition we completed. These shares were released from escrow in April 2014.
The issuance of the securities described above was exempt from registration under Section 4(a)(2) of the Securities Act because (a) the seller represented in writing that it acquired the securities for its own accounts, for investment purposes only and not with a view to sell them, (b) the issuance was not effected through any general solicitation or general advertising, (c) the seller had such knowledge and experience in financial and business matters as to be capable of evaluating the merits and risks of an investment in Gaiam, Inc., (d) a legend was placed on the stock certificates stating that the securities have not been registered under the Securities Act and cannot be sold or otherwise transferred without an effective registration or an exemption therefrom.None.
Equity Compensation Plan Information
The following table summarizes equity compensation plan information for our Class A common stock at December 31, 2014:2016:
Plan Category | Number of securities to be issued upon exercise of outstanding options, warrants and rights | Weighted average exercise price of outstanding options, warrants and rights | Number of securities remaining available for future issuance under equity compensation plans |
| Number of securities to be issued upon exercise of outstanding options, warrants and rights |
|
| Weighted average exercise price of outstanding options, warrants and rights |
|
| Number of securities remaining available for future issuance under equity compensation plans |
| ||||||||||||
Equity compensation plans approved by security holders | 1,448,684 | $ | 6.17 | 1,465,932 |
|
| 1,351,194 |
|
| $ | 2.76 |
|
|
| 1,648,806 |
| ||||||||
Equity compensation plans not approved by security holders | — | — | — |
|
| — |
|
|
| — |
|
|
| — |
| |||||||||
|
|
| ||||||||||||||||||||||
Total | 1,448,684 | $ | 6.17 | 1,465,932 |
|
| 1,351,194 |
|
| $ | 2.76 |
|
|
| 1,648,806 |
| ||||||||
|
|
| ||||||||||||||||||||||
We derived the selected consolidated statement of operations data and consolidated cash flow data for the years ended December 31, 2014, 20132016, 2015 and 20122014, and consolidated balance sheet data as of December 31, 20142016 and 20132015 set forth below from our audited consolidated financial statements, which are included elsewhere in this Form 10-K. We derived the selected consolidated statement of operations data and consolidated cash flow data for the years ended December 31, 20112013 and 20102012 and consolidated balance sheet data as of December 31, 2012, 20112014, 2013 and 20102012 set forth below from our audited consolidated financial statements which are not included in this Form 10-K. During 2016 we sold our Gaiam Brand and eco-travel business and during 2013, we sold our non-Gaiam brandednon-Gaia brand entertainment media distribution operations and discontinued our DRTV operations. These businessbusinesses are reported as discontinued operations for all periods presented below.
The historical operating results are not necessarily indicative of the results to be expected for any other period. You should read the data set forth below in conjunction with “Management’s Discussion and Analysis of Financial Condition and Results of Operations” and our consolidated financial statements and related notes, included elsewhere in this Form 10-K.
(in thousands, except per share data) Consolidated Statements of Operations Data: Net revenues Cost of goods sold Gross profit Expenses: Selling and operating Corporate, general and administration Transaction-related costs Other general income and expense Total expenses (Loss) Income from operations Interest and other (expense) income Gain on sale of investments Loss from equity method investment Loss from deconsolidation of subsidiary (Loss) income before income taxes Income tax expense (benefit) Net (loss) income from continuing operations (Loss) income from discontinued operations, net of tax Net (loss) income Net (income) loss attributable to noncontrolling interest Net (loss) income attributable to Gaiam, Inc. Net (loss) income per share attributable to Gaiam, Inc. common shareholders—basic: From continuing operations From discontinued operations Basic net (loss) income per share attributable to Gaiam, Inc. Net (loss) income per share attributable to Gaiam, Inc. common shareholders—diluted: From continuing operations From discontinued operations Diluted net (loss) income per share attributable to Gaiam, Inc. Weighted-average shares outstanding: Basic Diluted (in thousands) Consolidated Balance Sheet Data: Cash Working capital Total assets Total liabilities Total equity Years ended December 31, 2014 2013 (c)(d) 2012 (b) 2011 (a) 2010 (a) $ 166,694 $ 155,463 $ 127,242 $ 223,691 $ 204,017 91,189 90,155 70,723 144,835 122,917 75,505 65,308 56,519 78,856 81,100 68,723 64,657 56,292 73,525 64,574 11,161 11,249 10,400 11,828 10,772 707 76 — 2,393 — — 10,967 — 22,456 — 80,591 86,949 66,692 110,202 75,346 (5,086 ) (21,641 ) (10,173 ) (31,346 ) 5,754 (600 ) 2,421 (86 ) (90 ) 1,291 1,480 25,096 — — — (55 ) — (18,410 ) — — — — — (4,550 ) — (4,261 ) 5,876 (28,669 ) (35,986 ) 7,045 1,369 25,974 (9,444 ) (10,713 ) 2,192 (5,630 ) (20,098 ) (19,225 ) (25,273 ) 4,853 (3,327 ) (1,995 ) 6,648 3 216 (8,957 ) (22,093 ) (12,577 ) (25,270 ) 5,069 (959 ) (659 ) (305 ) 398 (794 ) $ (9,916 ) $ (22,752 ) $ (12,882 ) $ (24,872 ) $ 4,275 $ (0.27 ) $ (0.90 ) $ (0.86 ) $ (1.08 ) $ 0.17 (0.14 ) (0.09 ) 0.29 0.00 0.01 $ (0.41 ) $ (0.99 ) $ (0.57 ) $ (1.08 ) $ 0.18 $ (0.27 ) $ (0.90 ) $ (0.86 ) $ (1.08 ) $ 0.17 (0.14 ) (0.09 ) 0.29 0.00 0.01 $ (0.41 ) $ (0.99 ) $ (0.57 ) $ (1.08 ) $ 0.18 24,228 22,972 22,703 23,126 23,226 24,228 22,972 22,703 23,126 23,383 As of December 31, 2014 2013 (c) 2012 (b) 2011 (b) 2010 (a) $ 15,772 $ 32,229 $ 9,858 $ 14,545 $ 28,773 39,699 53,674 51,418 62,217 95,006 138,632 141,686 197,231 163,290 207,433 39,073 36,396 78,359 32,116 38,671 99,559 105,290 118,872 131,174 168,762
|
| Years ended December 31, |
| |||||||||||||||||
(in thousands, except per share data) |
| 2016 (a) |
|
| 2015 (b) |
|
| 2014 (b) |
|
| 2013 (c)(d) |
|
| 2012 (c)(d) |
| |||||
Consolidated Statement of Operations Data: |
|
|
|
|
|
|
|
|
|
|
|
|
|
|
|
|
|
|
|
|
Streaming revenues |
| $ | 14,736 |
|
| $ | 10,752 |
|
| $ | 8,040 |
|
| $ | 3,242 |
|
| $ | 953 |
|
DVD subscription and other revenues |
|
| 2,511 |
|
|
| 2,707 |
|
|
| 2,714 |
|
|
| 2,974 |
|
|
| 3,436 |
|
Net revenues |
|
| 17,247 |
|
|
| 13,459 |
|
|
| 10,754 |
|
|
| 6,216 |
|
|
| 4,389 |
|
Loss from operations |
|
| (16,575 | ) |
|
| (8,711 | ) |
|
| (10,726 | ) |
|
| (10,002 | ) |
|
| (6,069 | ) |
Loss from continuing operations |
|
| (10,782 | ) |
|
| (9,019 | ) |
|
| (9,846 | ) |
|
| (10,002 | ) |
|
| (6,069 | ) |
Income (loss) from discontinued operations, net of tax |
|
| 97,848 |
|
|
| (2,687 | ) |
|
| (70 | ) |
|
| (12,750 | ) |
|
| (6,813 | ) |
Net income (loss) |
| $ | 87,066 |
|
| $ | (11,706 | ) |
| $ | (9,916 | ) |
| $ | (22,752 | ) |
| $ | (12,882 | ) |
Income (loss) per share—basic and diluted: |
|
|
|
|
|
|
|
|
|
|
|
|
|
|
|
|
|
|
|
|
Continuing operations |
| $ | (0.54 | ) |
| $ | (0.37 | ) |
| $ | (0.41 | ) |
| $ | (0.44 | ) |
| $ | (0.27 | ) |
Discontinued operations |
|
| 4.93 |
|
|
| (0.11 | ) |
|
| — |
|
|
| (0.55 | ) |
|
| (0.30 | ) |
Net income (loss) per share |
| $ | 4.39 |
|
| $ | (0.48 | ) |
| $ | (0.41 | ) |
| $ | (0.99 | ) |
| $ | (0.57 | ) |
Weighted-average shares outstanding: |
|
|
|
|
|
|
|
|
|
|
|
|
|
|
|
|
|
|
|
|
Basic and diluted |
|
| 19,850 |
|
|
| 24,510 |
|
|
| 24,228 |
|
|
| 22,972 |
|
|
| 22,703 |
|
|
| As of December 31, |
| |||||||||||||||||
(in thousands) |
| 2016 |
|
| 2015 |
|
| 2014 |
|
| 2013 (c) |
|
| 2012 (c)(d) |
| |||||
Consolidated Balance Sheet Data: |
|
|
|
|
|
|
|
|
|
|
|
|
|
|
|
|
|
|
|
|
Cash |
| $ | 54,027 |
|
| $ | 1,266 |
|
| $ | 3,821 |
|
| $ | 1,520 |
|
| $ | 1,822 |
|
Working capital - continuing operations |
|
| 46,778 |
|
|
| (5,075 | ) |
|
| 3,111 |
|
|
| 90 |
|
|
| — |
|
Working capital - discontinued operations |
|
| — |
|
|
| 36,646 |
|
|
| 36,201 |
|
|
| 53,065 |
|
|
| 51,415 |
|
Total assets |
|
| 107,196 |
|
|
| 128,542 |
|
|
| 138,632 |
|
|
| 141,686 |
|
|
| 197,231 |
|
Total liabilities |
|
| 9,659 |
|
|
| 39,749 |
|
|
| 39,073 |
|
|
| 36,396 |
|
|
| 78,359 |
|
Total equity |
|
| 97,537 |
|
|
| 88,793 |
|
|
| 99,559 |
|
|
| 105,290 |
|
|
| 118,872 |
|
Consolidated Cash Flow Data: |
|
|
|
|
|
|
|
|
|
|
|
|
|
|
|
|
|
|
|
|
Net cash provided by (used in) operating activities |
| $ | (15,382 | ) |
| $ | 7,601 |
|
| $ | 9,788 |
|
| $ | (23,124 | ) |
| $ | 16,476 |
|
(a) | In 2016, we |
(b) | We recorded non-cash and cash charges of $12.1 million and $3.3 million during 2015 and 2014, respectively, associated with the legal dispute and settlement with Cinedigm. |
(c) | During 2013, we recognized $11.0 million for certain impairments and restructuring costs, $2.0 million net loss from discontinued operations due to the closure of our DRTV business, and the sale of GVE and a $25.0 million gain on the sale of stock. We also recorded a $23.2 million charge to income tax expense to provide a valuation allowance against our deferred tax assets. |
(d) | Our consolidated statement of operations data for 2012 presents our former investment in Real Goods Solar, Inc. (“RGSE”) |
| During May 2013, as a result of the |
The graph below shows, for the five years ended December 31, 2014,2016, the cumulative total return on an investment of $100 in our Class A common stock, assuming the investment was made on December 31, 2009, and also shows the relative stock performances of our Class A common stock commencing with Gaiam’s initial public offering on October 29, 1999 until December 31, 2014.2011. The graph compares such return with that of comparable investments assumed to have been made on the same date in (a) the NASDAQ Stock Market (U.S. Companies) Index and (b) a media peer group, comprised of Martha Stewart Living Omnimedia, Inc.; The Walt Disney Company; and Lions Gate Entertainment Corp. AlthoughMartha Stewart Living Omnimedia, Inc., which was previously included in our peer group, is not included in our peer group this year because it was acquired by another company in December 2015 and is no longer separately traded. The change in the composition of our peer group has no material effect on the cumulative total return for the assumedon an investment reflects a reinvestment of all dividends on December 31st of the year in which such dividends are paid, no cash dividends were paid on our common stock except for two dividends we paid in 2010.peer group. Our Class A common stock is quoted by The NASDAQ Stock Market’s Global Market under the trading symbol GAIA.
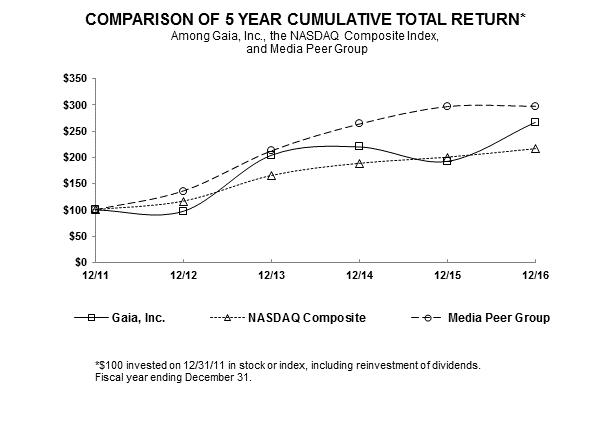
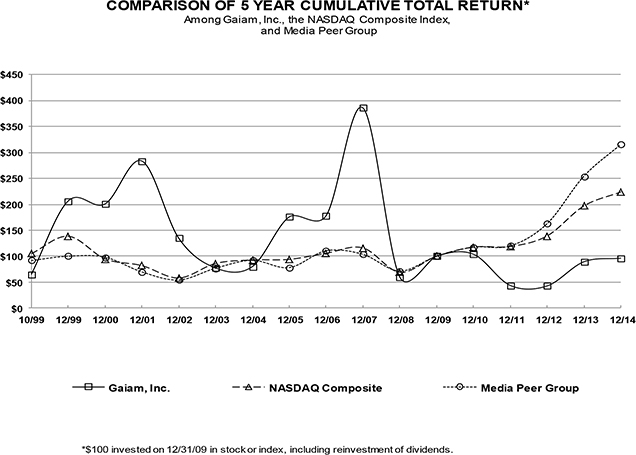
The stock price performance included in this graph is not necessarily indicative of future stock price performance.
Forward-Looking Statements
This report contains forward-looking statements that involve risks and uncertainties. When used in this discussion, we intend the words “anticipate,” “believe,” “plan,” “estimate,” “expect,” “strive,” “future,” “intend”, “will” and similar expressions as they relate to us to identify such forward-looking statements. Our actual results could differ materially from the results anticipated in these forward-
lookingforward-looking statements as a result of certain factors set forth under “Risk Factors”,Factors,” “Management’s Discussion and Analysis of Financial Condition and Results of Operations,” “Quantitative and Qualitative Disclosures About Market Risk” and elsewhere in this Form 10-K. Risks and uncertainties that could cause actual results to differ include, without limitation, general economic conditions, ongoing losses, competition, loss of key personnel, pricing, brand reputation, acquisitions, new initiatives we undertake, security and information systems, legal liability for website content, merchandise supply problems, failure of third parties to provide adequate service, reliance on centralized customer service, overstocks and merchandise returns, our reliance on a centralized fulfillment center, increases in postage and shipping costs, E-commerce trends, future Internet related taxes, our founder’s control of us, litigation, fluctuations in quarterly operating results, consumer trends, customer interest in our products, the effect of government regulation and programs and other risks and uncertainties included in our filings with the Securities and Exchange Commission. We caution you that no forward-looking statement is a guarantee of future performance, and you should not place undue reliance on these forward-looking statements which reflect our views only as of the date of this report. We undertake no obligation to update any forward-looking information.
You should read the following discussion and analysis of our financial condition and results of operations in conjunction with the consolidated financial statements and related notes included elsewhere in this document. This section is designed to provide information that will assist readers in understanding our consolidated financial statements, changes in certain items in those statements from year to year, the primary factors that caused those changes and how certain accounting principles, policies and estimates affect the consolidated financial statements.
Overview and Outlook
During 2014, the information reviewed by our Chief Operating Decision Makers (“CODMS”) has evolved with changes in our organization and new initiatives. These changes include our planned tax-free spin-off of Gaiam TV, and the migration of our legacy catalog business to a mobile-and social-centric digital model.
As of December 31, 2014, we now have two reportable business segments which are aligned based on their products or services: Gaiam Brand and Gaiam TV.
Gaiam Brand Segment
Gaiam is a leader in the markets for yoga, fitness and wellness products and media content. Gaiam brands include Gaiam, focused on yoga and fitness; Gaiam Restore, focused on wellness; SPRI focused on fitness; and our eco-travel business.
We develop and market fitness and yoga accessories, apparel, and media under Gaiam’s brands. These products are sold primarily through major national retailers in the United States, Canada, Europe, and other countries, with placement in over 38,000 retail doors worldwide. We also sell our products through our website and catalogs. Our products and services are targeted to all levels of yoga and fitness enthusiasts, including professionals. We believe that consumers are attracted to our products because of their design, functional characteristics, and our unique brand heritage. Our accessories include yoga mats, bags, straps and blocks, media content including digital media and apps, restorative and massage accessories such as rollers, resistance cords and balance balls, and various other offerings. Our comprehensive line of apparel includes pants, shorts, tops and jackets designed around yoga.
Through our business activities, we seek to position our brand as a trusted source for products that are relevant to our consumers’ active lifestyles. Our broad distribution network includes retail, online, and digital channels. Our business is vertically integrated from product design and content creation through product development and sourcing, to customer service and distribution. This efficient supply chain enables us to provide quality products at competitive prices for all of our brands.
We seek to drive sustainable and profitable growth in this segment by leveraging our brands’ leading market positions and heritage to expand our product offering and distribution channels. We believe that growth in yoga participation, greater awareness of health and wellness, and the success of our retail and online partners is increasing consumer interest in our brands and products, and creates new opportunities for us to expand our offering. Recent examples of our brand extension include the 2012 launch of Gaiam Restore and SPRI Dynamic Recovery brands, our at-home rehabilitative and restorative products, and the 2013 launch of our SPRI Cross Train line of high-intensity fitness accessories. We anticipate launching a yoga apparel line in the spring of 2015.
We recently launched or updated certain websites, evolving our e-commerce experience to focus on engaging customers through digital content, and social and mobile marketing across various devices. With the acquisition of Yoga Studio, the leading yoga app for mobile and tablet devices, in the fourth quarter of 2014, we launched our interactive digital strategy, which we will continue to develop and leverage as a point of brand engagement. We plan to invest in our online branding and digital offerings, develop emerging talent, utilize social media, and sponsor local events. Additionally, we will significantly reduce the circulation of our catalogs going forward as the direct-to-consumer business has shifted online.
Gaiam TV Segment
Gaiam TV isoperate a global digital video subscription service with approximately 7,000over 7,700 titles whichthat caters to ana unique and underserved subscriber base. Gaiam TV’sOur digital content is available to our subscribers on virtually any Internet connected devicemost Internet-connected devices anytime, anywhere commercial free. TheThrough our online Gaia subscription also allowsservice our subscribers to download and view files from the library without being actively connected to the internet. Through Gaiam TV subscriptions, customers have unlimited access to a vast library of inspiring films, personal growth related content, cutting edge documentaries, interviews, yoga classes, transformation related content, and more – 90% of which is exclusively available exclusively to our subscribers for digital streaming.streaming on most Internet-connected devices. A subscription also allows our subscribers to download and view files from our library without being actively connected to the Internet.
TheConsumption of streaming video market is currently booming: in August 2014, 196.5 million Internet users watched online videos in the United States alone, according to comScore. The first quarter of 2014 set a new recordexpanding rapidly with 35.6 billion global online video starts, representing a 43% increase compared to the first quarter of 2013, according to the U.S. Digital Video Benchmark report from Adobe.
Moremore and more people are augmenting their use of, or veering away fromreplacing broadcast television and turning to, streaming video to watch their favorite content on services like Netflix, Amazon Prime, Hulu Plus, HBO GoNow and Gaiam TV.Gaia.
Gaiam TV’sGaia’s position in the streaming video landscape is firmly supported by aits wide variety of exclusive and unique content, which provides a complementary offering to other entertainment-based streaming video services. Gaiam TV’sOur original content is developed and produced in-house in state-of-the-artour production studios near Boulder, Colorado. Over 90% of our content is available for streaming exclusively on Gaia. By offering exclusive and unique content over athrough our streaming service, we believe we will be able to significantly expand our target subscriber base.
Our available content is currently focused on yoga, transformation, seeking truth and conscious films. This content is specifically targeted to a unique customer base which is interested in alternatives and supplements to the content provided by mainstream media. We have grown these content options both organically through our own productions and through strategic acquisitions. In October 2013, Gaiam TV acquired My Yoga Online,addition, through our investments in our streaming video technology and our user interface, we have expanded the largest on-line yoga video streamingmany ways our subscription customer base can access our unique library of media titles.
Our core strategy is to grow our subscription business in Canada. With this acquisition we grewdomestically and internationally by expanding our unique and exclusive content library, enhancing our user interface, extending our streaming service to new Internet-connected devices as they are developed and creating a conscious community built on our content.
We are a Colorado corporation. Our principal and executive office is located at 833 West South Boulder Road, Suite G, Louisville, CO 80027-2452. Our telephone number at that address is (303) 222-3600. We maintain an Internet website at www.gaia.com. The website address has been included only as a textual reference. Our website and the information contained on that website, or connected to that website, are not incorporated by approximately 1,300 video titles and expanded our international subscriber base. We plan to continue investing in international expansion, both in terms of subscribers and content.reference into this Form 10-K.
Gaiam’s Board of Directors previously approved the separationSale of Gaiam TVBrand Segment
In May 2016, we sold our 51.4% interest in Natural Habitat to Lindblad Expeditions Holdings, Inc. (NASDAQ: LIND) for $12.8 million and Gaiam Brand into two separate publicly traded companies. recognized a gain of $10.3 million.
On July 1, 2016, we completed the sale of our branded consumer product business to Sequential Brands Group, Inc. (NASDAQ: SQBG) and its operating partner Fit For Life LLC. Gross consideration was $167 million and we recognized a gain of $114.5 million before taxes.
We currently expectused the separationmajority of the net proceeds to takeconduct a share repurchase tender offer and acquired approximately 9,637,000 shares of our Class A common stock and 840,000 vested stock options at a fixed price of $7.75 per share.
The remaining proceeds will be used to fund the formcontinuing growth and development of a tax-free spin-off to shareholders. Our board of directors has the right and ability, in its sole discretion, to abandon the proposed separation at any time before the distribution date. As a result, there can be no assurance that the separation will occur.our business, as well as general corporate purposes.
Results of Operations
The table below summarizes certain of our results for the periods indicated:
|
| Years ended December 31, |
| |||||||||
(in thousands, except per share data) |
| 2016 |
|
| 2015 |
|
| 2014 |
| |||
Streaming revenues |
| $ | 14,736 |
|
| $ | 10,752 |
|
| $ | 8,040 |
|
DVD subscription and other revenues |
|
| 2,511 |
|
|
| 2,707 |
|
|
| 2,714 |
|
Cost of streaming |
|
| 2,567 |
|
|
| 2,262 |
|
|
| 1,746 |
|
Cost of DVD subscription and other |
|
| 275 |
|
|
| 335 |
|
|
| 289 |
|
Selling and operating |
|
| 24,960 |
|
|
| 13,079 |
|
|
| 14,879 |
|
Corporate, general and administration |
|
| 6,020 |
|
|
| 6,494 |
|
|
| 4,566 |
|
Loss from operations |
|
| (16,575 | ) |
|
| (8,711 | ) |
|
| (10,726 | ) |
Interest and other income (expense) |
|
| (351 | ) |
|
| (311 | ) |
|
| 880 |
|
Loss before taxes |
|
| (16,926 | ) |
|
| (9,022 | ) |
|
| (9,846 | ) |
Income tax expense (benefit) |
|
| (6,144 | ) |
|
| (3 | ) |
|
| — |
|
Net loss from continuing operations |
|
| (10,782 | ) |
|
| (9,019 | ) |
|
| (9,846 | ) |
Income (loss) from discontinued operations, net |
|
| 97,848 |
|
|
| (2,687 | ) |
|
| (70 | ) |
Net income (loss) |
| $ | 87,066 |
|
| $ | (11,706 | ) |
| $ | (9,916 | ) |
The following table sets forth certain financial data as a percentage of revenue for the periods indicated:
|
| Years ended December 31, |
| |||||||||
|
| 2016 |
|
| 2015 |
|
| 2014 |
| |||
Net revenues |
|
|
|
|
|
|
|
|
|
|
|
|
Streaming |
|
| 85.4 | % |
|
| 79.9 | % |
|
| 74.8 | % |
DVD subscription and other |
|
| 14.6 | % |
|
| 20.1 | % |
|
| 25.2 | % |
Total net revenues |
|
| 100.0 | % |
|
| 100.0 | % |
|
| 100.0 | % |
Cost of revenues |
|
|
|
|
|
|
|
|
|
|
|
|
Cost of streaming |
|
| 14.9 | % |
|
| 16.8 | % |
|
| 16.2 | % |
Cost of DVD subscription and other |
|
| 1.6 | % |
|
| 2.5 | % |
|
| 2.7 | % |
Total cost of revenues |
|
| 16.5 | % |
|
| 19.3 | % |
|
| 18.9 | % |
Gross profit |
|
| 83.5 | % |
|
| 80.7 | % |
|
| 81.1 | % |
Expenses: |
|
|
|
|
|
|
|
|
|
|
|
|
Selling and operating |
|
| 144.7 | % |
|
| 97.1 | % |
|
| 138.3 | % |
Corporate, general and administration |
|
| 34.9 | % |
|
| 48.3 | % |
|
| 42.5 | % |
Total expenses |
|
| 179.6 | % |
|
| 145.4 | % |
|
| 180.8 | % |
Loss from operations |
|
| (96.1 | )% |
|
| (64.7 | )% |
|
| (99.7 | )% |
Interest and other income (expense) |
|
| (2.0 | )% |
|
| (2.3 | )% |
|
| 8.1 | % |
Loss before taxes |
|
| (98.1 | )% |
|
| (67.0 | )% |
|
| (91.6 | )% |
Income tax expense (benefit) |
|
| (35.6 | )% |
|
| — | % |
|
| — | % |
Net loss from continuing operations |
|
| (62.5 | )% |
|
| (67.0 | )% |
|
| (91.6 | )% |
Income (loss) from discontinued operations |
|
| 567.3 | % |
|
| (20.0 | )% |
|
| (0.6 | )% |
Net income (loss) |
|
| 504.8 | % |
|
| (87.0 | )% |
|
| (92.2 | )% |
Year Ended December 31, 20142016 Compared to Year Ended December 31, 20132015
Net revenue. Net revenue increased $11.2$3.7 million, or 7.2%28.1%, to $166.7$17.2 million during 2014 from $155.52016, compared to $13.5 million during 2013.2015. Net revenue in our Gaiam Brand segmentfrom streaming increased $7.0$3.9 million, or 4.7%37.1%, to $156.8$14.7 million during 20142016 from $149.8$10.8 million during 2013, due to the addition of a new major customer account and2015. The increase in streaming revenues was primarily driven by 52% growth in our Gaiam Restore and SPRI product lines. Growth in the Gaiam Brand segment was moderatednumber of paying subscribers. Net revenues were not significantly impacted by a few factors. First, revenues from our largest customer declined as the result of a data breach at the customer’s stores. Second, we made a strategic decision early in the year to reduce catalog circulation and focus our direct-to-consumer operations on a consumer engagement digital strategy. Third, the continued contraction in the physical DVD market reduced our media sales. Finally, we decided during the year to not renew a license we held to manufacture fitness accessories under a third-party brand. This decision resulted in lower revenues, but allowed us to focus more on our Gaiam and SPRI brands. Our eco-travel business, which is part of the Gaiam Brand segment, grew during the year as a result of improved economic conditions. Net revenue in our Gaiam TV segment increased $4.3 million,either changing prices or 75.4%, to $9.9 million during 2014 from $5.7 million during 2013 due primarily to subscriber growth at Gaiam TV and revenues from My Yoga Online, which was acquired during the fourth quarter of 2013.inflation.
Cost of goods sold. Cost of goods sold increased $1.0$0.2 million, or 1.1%9.4%, to $91.2$2.8 million during 20142016 from $90.2$2.6 million during 2013.2015. Cost of goods sold in our Gaiam Brand segmentfor streaming increased $0.6$0.3 million, or 13.5%, to $89.8$2.6 million during 20142016 from $89.2$2.3 million during 20132015 and, as a percentage of streaming revenue, decreased to 17.4% compared to 21.0% during 2015 due primarily to an increase in revenue and the lower cost of streaming associated with our higher volumes.
Selling and operating expenses. Selling and operating expenses increased $11.9 million, or 90.8%, to $25.0 million during 2016 from $13.1 million during 2015 and, as a percentage of net revenue, increased to 144.7% during 2016 from 97.2% during 2015. The increase was primarily due to increased marketing spending for subscriber acquisition to drive growth.
Corporate, general and administration expenses. Corporate, general and administration expenses decreased $0.5 million, or 7.3%, to $6.0 million during 2016 from $6.5 million during 2015 and, as a percentage of net revenue, decreased to 57.3%34.9% during 20142016 from 59.5%48.3% during 2013,2015. The decrease was primarily due to the elimination of duplicate costs upon the sale of the Gaiam Brand business on July 1, 2016, offset by increased costs associated with legal and accounting fees.
Income (loss) from discontinued operations. The operations of the Gaiam Brand segment are included in income (loss) from discontinued operations. We completed the sale of the Gaiam Brand business and Natural Habitat during 2016, recognizing a shiftgain of $114.5 million, which was offset by transaction costs, taxes and losses from the operation of discontinued operations of $(16.7) million, compared to losses from the operation of discontinued operations of $(2.7) million in product sales mix2015.
Net income (loss). As a result of the above factors, net income (including discontinued operations) was $87.1 million, or $4.39 per share, for 2016 compared to higher margin products, as well as improvementa net loss of $(11.7) million, or $(0.48) per share, for 2015. Net income (loss) was not significantly impacted by either changing prices or inflation.
Year Ended December 31, 2015 Compared to Year Ended December 31, 2014
Net revenue. Net revenue increased $2.7 million, or 25.2%, to $13.5 million during 2015, compared to $10.8 million during 2014. Net revenue from streaming increased $2.7 million, or 33.7%, to $10.8 million during 2015 from $8.1 million during 2014. The increase in coststreaming revenues was primarily driven by 58% growth in the number of paying subscribers from 2014. Net revenues were not significantly impacted by either changing prices or inflation.
Cost of goods for certain products.sold. Cost of goods sold (exclusiveincreased $0.6 million, or 27.6%, to $2.6 million during 2015 from $2.0 million during 2014. Cost of amortization of video library costs) in our Gaiam TV segmentgoods sold for streaming increased $0.4$0.6 million, or 29.6%, to $1.4$2.3 million during 2015 from $1.7 million during 2014 from $1.0and, as a percentage of streaming revenue, decreased to 21.0% compared to 21.7% during 2014 due primarily to an increase in revenue and the lower cost of streaming associated with our higher volumes.
Selling and operating expenses. Selling and operating expenses decreased $1.8 million, or 12.1%, to $13.1 million during 20132015 from $14.9 million during 2014 and, as a percentage of net revenue, decreased to 14.1%97.2% during 20142015 from 17.5%138.4% during 2013, primarily reflecting subscriber growth and the fixed nature of digital distribution costs.
Selling and operating expenses. Selling and operating expenses increased $4.1 million, or 6.3%, to $68.7 million during 2014 from $64.7 million during 2013 and, as a percentage of net revenue, decreased to 41.3% during 2014 from 41.6% during 2013,2014. The decrease was primarily due to additional investmentsreduced spending on paid subscriber acquisition efforts during 2015 as we focused on optimizing efficiency in our Gaiam TV segment.customer acquisition efforts and operating profitably (excluding transaction costs) during the third quarter of 2015.
Corporate, general and administration expenses. Corporate, general and administration expenses stayed flat at $11.2increased $1.9 million, or 42.2%, to $6.5 million during 2014 and 2013 and, as a percentage of net revenue, decreased to 6.7% during 20142015 from 7.2% during 2013.
Other general expense.During 2013, other general expense was $11.0 million. It was comprised of impairment charges of $7.1 million, restructuring-related termination benefits and future retirement benefits for one of our executive officers totaling $2.5 million, and $1.4 million of transaction-related and other expenses. The asset impairments and termination benefits, other than those for one of our executive officers, are due to the reorganization and refocus of our continuing businesses following the discontinuation of our non-Gaiam-branded entertainment media distribution and direct response television marketing operations.
Transaction-related expense.Transaction-related expense was $0.7 million in 2014 compared to $0.1 million in 2013. These expenses relate to fees associated with the spin-off of our Gaiam TV segment.
Interest and other income (expense), net. Interest and other income (expense), net was an expense of $0.6$4.6 million during 2014 compared to income of $2.4 million during 2013. The income in 2013 resulted primarily from the collection of principal and interest on our loans to RGSE, the carrying values for which had previously been reduced to zero through the recognition of losses from our equity method investment in RGSE.
Gain on sale of investment. Gain on sale of investment of $1.5 million in 2014 represents our gain recognized and net proceeds received from the sale of shares of our investment in RGSE stock and all our investment in Cinedigm stock. The gain of $25.1 million in 2013 represents our gain recognized and net proceeds received from the sale of virtually all of our investment in RGSE’s common stock.
Income tax expense. The company recognized income tax expense during 2014 of $1.4 million related to its majority-owned subsidiaries compared with income tax expense of $26.0 million in 2013. The 2013 tax expense includes a charge of $23.2 million which relates to the establishment of a full valuation allowance against all our deferred tax assets. Because the valuation allowance will remain in place until we return to profitability, we did not record any tax benefit in 2014 associated with our net loss. We continue to be optimistic about our future, and expect to return to operating profitability. When that happens, we expect to reverse the valuation allowance and record the related tax benefit for future use of our net operating loss carryforwards we expect to realize.
Loss from discontinued operations. During 2013, we sold our non-Gaiam branded entertainment division, GVE, and discontinued our DRTV operations. The 2014 loss reflects a reserve of $3.0 million for anticipated legal expenses and related reserves the Company recorded in connection with the upcoming arbitration associated with the sale of GVE and other expenses associated primarily with the wind down of the DRTV operations.
Net income (loss) attributable to Gaiam, Inc. Net loss attributable to Gaiam, Inc. was $9.9 million, or $0.41 per share, during 2014 compared to a loss of $22.8 million, or $0.99 per share, during 2013.
Year Ended December 31, 2013 Compared to Year Ended December 31, 2012
Net revenue. Net revenue increased $28.3 million, or 22.2%, to $155.5 million during 2013 from $127.2 million during 2012, with organic net revenue growth of $27.6 million or 21.7%. Net revenue in our Gaiam Brand segment increased $26.3 million, or 21.3%, to $149.8 million during 2013 from $123.5 million during 2012, due to better sales performance at our top 25 retailers, which was driven by the launch of our SPRI brand in a key sporting goods account, and a full year of sales of our Gaiam Restore product, which was released in the fourth quarter of 2012. Net revenue in our Gaiam TV segment increased $2.0 million, or 54.1%, to $5.7 million during 2013 from $3.7 million during 2012 due primarily to subscriber growth and partial revenues from My Yoga Online, which was acquired during the fourth quarter of 2013.
Cost of goods sold. Cost of goods sold increased $19.5 million, or 27.6%, to $90.2 million during 2013 from $70.7 million during 2012. Cost of goods sold in our Gaiam Brand segment increased $19.4 million to $89.2 million during 2013 from $69.8 million during 2012 and, as a percentage of net revenue, increased to 59.5%48.3% during 20132015 from 56.5%42.5% during 2012, primarily2014. The majority of the increase was due to a shift in product sales mix toward lower margin linesone-time charges incurred during the first half of product we produce under exclusive arrangements for third parties, and due to growth in our travel business which operates at a lower gross margin. Cost2015 associated with the previously planned separation of goods sold (exclusive of amortization of video library costs) in our Gaiam TVthe Gaia segment increased $0.1 million to $1.0 million during 2013 from $0.9 million during 2012 and, as a percentage of net revenue, decreased to 17.5% during 2013 from 24.3% during 2012, primarily reflecting subscriber growth and the fixed nature of digital distribution costs.Gaiam Brand segment into two separate public companies.
Selling and operating expenses. Selling and operating expenses increased $8.4 million, or 14.9%, to $64.7 million during 2013 from $56.3 million during 2012 and, as a percentage of net revenue, decreased to 41.6% during 2013 from 44.3% during 2012, primarily due to additional investments in our Gaiam TV segment.
Corporate, general and administration expenses. Corporate, general and administration expenses increased $0.8 million to $11.2 million during 2013 from $10.4 million during 2012 and, as a percentage of net revenue, decreased to 7.2% during 2013 from 8.2% during 2012, primarily as a result of increased personnel costs.
Other general expense.Other general expense was $11.0 million during 2013 and zero during 2012. The other general expense during 2013 is comprised of impairment charges of $7.1 million, restructuring-related termination benefits and future retirement benefits for one of our executive officers totaling $2.5 million, and $1.4 million of transaction-related and other expenses. The asset impairments and termination benefits, other than those for one of our executive officers, are due to the reorganization and refocus of our continuing businesses following the discontinuation of our non-Gaiam-branded entertainment media distribution and direct response television marketing operations.
Interest and other income (expense), net. Interest and other income (expense), net was income of $2.4 million during 2013 compared to expense of $0.1 million during 2012. Interest and other income, net during 2013 resulted primarily from the collection of principal and interest on our loans to RGSE, the carrying values for which had previously been reduced to zero through the recognition of losses from our equity method investment in RGSE.
Gain on sale of investment. Gain on sale of investment of $25.1 million during 2013 represents our gain recognized and net proceeds received from the sale of virtually all of our investment in RGSE’s common stock.
Loss from equity method investment. Loss from equity method investment was zero during 2013 and $18.4 million during 2012 and represented our portion of RGSE’s net loss for 2012. Since we no longer have significant influence over RGSE and accordingly have changed the accounting for our investment in RGSE from the equity to the cost method, we no longer recognize our portion of RGSE’s net loss in our financial results.
Income tax expense (benefit). Income tax expense during 2013 was increased primarily by a valuation allowance against our deferred tax assets and by the repatriation of cash from one of our foreign subsidiaries and other permanent differences. Income tax benefit during 2012 was increased primarily due to the reduction of a deferred tax liability related to the carrying value of our equity method investment in RGSE.
Income (loss) from continuingdiscontinued operations. The operations of the Gaiam Brand segment are included in income (loss) from discontinued operations. During 2015, losses from the operation of discontinued operations of $(2.7) million, compared to loss from the operation of discontinued operations of $(0.1) million during 2014.
Net income (loss). As a result of the above factors, loss from continuing operationsnet income (including discontinued operations) was $20.1$(11.7) million, before minority interest, or $0.90$(.48) per share, net of minority interest, during 20132015 compared to a net loss from continuing operations of $19.2$(9.9) million, or $0.86$(0.41) per share, during 2012.
Income from discontinued operations. During 2013, we sold GVE and discontinued our DRTV operations. Accordingly, we reclassified and now report the financial results for these businesses as discontinued operations. Income from discontinued operations decreased $8.6 million during 2013 from $6.6 million during 2012, primarily due to the discontinuance and asset write-off of DRTV.
2014. Net income (loss) attributable to Gaiam, Inc. Net loss attributable to Gaiam, Inc. was $22.8 million,not significantly impacted by either changing prices or $0.99 per share, during 2013 compared to a loss of $12.9 million, or $0.57 per share, during 2012.inflation.
Quarterly and Seasonal Fluctuations
The following tables set forth our unaudited results of operations for each of the quarters in 20142016 and 2013. During 2013, we sold our non-Gaiam-branded entertainment media distribution operations and discontinued our DRTV operations. We now report these businesses as discontinued operations, and, accordingly, we have reclassified their results of operations for all periods presented to reflect them as such.2015. In our opinion, this unaudited financial information includes all adjustments, consisting solely of normal recurring accruals and adjustments, necessary for a fair presentation of the results of operations for the quarters presented. You should read this financial information in conjunction with our consolidated financial statements and related notes included elsewhere in this Form 10-K. The results of operations for any quarter are not necessarily indicative of future results of operations.
| Year 2014 Quarters Ended | ||||||||||||||||
(in thousands, except per share data) | March 31 | June 30 | September 30 | December 31 | ||||||||||||
Net revenue | $ | 37,611 | $ | 32,451 | $ | 41,256 | $ | 55,376 | ||||||||
Gross profit | 17,020 | 15,468 | 18,018 | 24,999 | ||||||||||||
Gain on sale of investment (a) | 438 | 1,042 | — | — | ||||||||||||
(Loss) income from continuing operations | (2,098 | ) | (2,216 | ) | (2,559 | ) | 1,243 | |||||||||
Income (loss) from discontinued operations | 26 | 2 | (82 | ) | (3,273 | ) | ||||||||||
Net loss | (2,072 | ) | (2,214 | ) | (2,641 | ) | (2,030 | ) | ||||||||
Net loss attributable to Gaiam, Inc. | (2,134 | ) | (2,388 | ) | (3,026 | ) | (2,368 | ) | ||||||||
Diluted net loss per share attributable to Gaiam, Inc. | $ | (0.09 | ) | $ | (0.10 | ) | $ | (0.12 | ) | $ | (0.10 | ) | ||||
|
|
|
|
|
|
|
| |||||||||
Weighted average shares outstanding-diluted | 24,006 | 24,090 | 24,340 | 24,470 | ||||||||||||
|
|
|
|
|
|
|
| |||||||||
(in thousands, except per share data) Net revenue Gross profit Gain on sale of investment (a) (Loss) income from continuing operations Income (loss) from discontinued operations Net (loss) income Net (loss) income attributable to Gaiam, Inc. Net (loss) income per share attributable to Gaiam, Inc. common shareholders – diluted: From continuing operations From discontinued operations Diluted net (loss) income per share attributable to Gaiam, Inc. Weighted average shares outstanding-diluted Year 2013 Quarters Ended March 31 June 30 September 30 December 31 (b) $ 36,679 $ 31,897 $ 36,128 $ 50,759 15,750 13,314 14,693 21,551 — 16,429 1,975 6,692 (2,203 ) 8,112 (700 ) (25,307 ) 1,981 (129 ) 1,004 (4,851 ) (222 ) 7,983 304 (30,158 ) (277 ) 7,848 120 (30,444 ) $ (0.10 ) $ 0.36 $ (0.03 ) $ (1.08 ) 0.09 (0.01 ) 0.04 (0.21 ) $ (0.01 ) $ 0.35 $ 0.01 $ (1.29 ) 22,732 22,741 22,765 23,668
|
| Year 2016 Quarters Ended |
| |||||||||||||
(in thousands, except per share data) |
| March 31 |
|
| June 30 |
|
| September 30 |
|
| December 31 |
| ||||
Net revenue |
| $ | 3,830 |
|
| $ | 4,198 |
|
| $ | 4,462 |
|
| $ | 4,757 |
|
Gross profit |
|
| 3,117 |
|
|
| 3,451 |
|
|
| 3,762 |
|
|
| 4,075 |
|
Loss from continuing operations |
|
| (4,125 | ) |
|
| (3,085 | ) |
|
| (151 | ) |
|
| (3,421 | ) |
Income (loss) from discontinued operations |
|
| (3,499 | ) |
|
| 646 |
|
|
| 100,595 |
|
|
| 106 |
|
Net income (loss) |
|
| (7,624 | ) |
|
| (2,439 | ) |
|
| 100,444 |
|
|
| (3,315 | ) |
Basic and diluted net income (loss) per share |
| $ | (0.31 | ) |
| $ | (0.10 | ) |
| $ | 6.64 |
|
| $ | (0.22 | ) |
Weighted average shares outstanding - basic and diluted |
|
| 24,531 |
|
|
| 24,580 |
|
|
| 15,138 |
|
|
| 15,148 |
|
|
| Year 2015 Quarters Ended |
| |||||||||||||
(in thousands, except per share data) |
| March 31 |
|
| June 30 |
|
| September 30 (a) |
|
| December 31 |
| ||||
Net revenue |
| $ | 3,106 |
|
| $ | 3,285 |
|
| $ | 3,501 |
|
| $ | 3,567 |
|
Gross profit |
|
| 2,444 |
|
|
| 2,595 |
|
|
| 2,893 |
|
|
| 2,930 |
|
Loss from continuing operations |
|
| (3,036 | ) |
|
| (1,960 | ) |
|
| (660 | ) |
|
| (3,363 | ) |
Income (loss) from discontinued operations |
|
| (856 | ) |
|
| 843 |
|
|
| (8,154 | ) |
|
| 5,480 |
|
Net income (loss) |
|
| (3,892 | ) |
|
| (1,117 | ) |
|
| (8,814 | ) |
|
| 2,117 |
|
Basic and diluted net income (loss) per share |
| $ | (0.16 | ) |
| $ | (0.05 | ) |
| $ | (0.36 | ) |
| $ | 0.09 |
|
Weighted average shares outstanding - basic and diluted |
|
| 24,490 |
|
|
| 24,610 |
|
|
| 24,604 |
|
|
| 24,626 |
|
(a) | During the |
Quarterly fluctuations in our revenueOur subscriber base growth reflects seasonal variations driven primarily by when consumers buy Internet-connected devices and, operating results are dueas a result, tend to a numberincrease their viewing, similar to those of factors, including changes in market conditions, the timing of new product introductionstraditional TV and mailings to customers, advertising, acquisitions (including costs of acquisitions and expenses related to integration of acquisitions), divestitures, competition, pricing of products by vendors and expenditures on our systems and infrastructure. The impact on revenue and operating results due to the timing and extent of these factors can be significant.cable networks. Our sales are also affected by seasonal influences. On an aggregate basis, we generate our strongest revenuemember growth is generally greatest in the fourth and first quarter due to increased holiday(October through March), and slowest in the May through August period. This drives quarterly variations in our spending and retailer fitness purchases.on customer acquisition efforts, but does not drive a corresponding seasonality in net revenue.
Critical Accounting Policies
We prepare our consolidated financial statements in conformity with accounting principles generally accepted in the United States, which require us to make judgments, estimates and assumptions that affect the amounts reported in the consolidated financial statements and accompanying notes. Note 2 to the consolidated financial statements in Item 8 of this Form 10-K summarizes the significant accounting policies and methods used in the preparation of our consolidated financial statements.
We believe the following to be critical accounting policies whose application has a material impact on our financial presentation, and involve a higher degree of complexity, as they require us to make judgments and estimates about matters that are inherently uncertain.
Allowances for Doubtful AccountsMedia Library
Media Library represents the lower of unamortized cost or net realizable value of digital media content acquired through asset purchases, capitalized costs to produce our proprietary media content, and Product Returnsrights obtained through license arrangements and business combinations.
We maintain allowances for doubtful accounts for estimated losses resulting from the inabilityThe value of our customers to make required payments. We make estimatesacquired media library consists of the collectabilityfair value of our accounts receivable by analyzing historical bad debts,media assets obtained through asset acquisitions and business combinations recorded at the estimated fair value of the titles acquired, which is based on a number of factors, including the number of titles, the total hours of content, the production quality and age of the acquired media assets.
Our licensed media library is obtained through license arrangements. Generally, we pay an advance against a percentage royalty or an upfront license fee in exchange for the distribution rights for a specific customer creditworthiness, and current economic trends. If the financial condition of our customers were to deteriorate such that their ability to makelicense window, but we may also obtain a license for a fixed fee for perpetuity. These payments to us was impaired, additional allowances could be required.
We record allowances for product returns to be received in future periodsare capitalized at the time we recognizeof payment. Certain agreements also include an ongoing royalty obligation, which entitles the original sale. We base the amountslicensor to a share of the returns allowances upon historical experiencerevenues generated from the licensed works. These expenses are calculated and accrued on a monthly basis and included in costs of streaming. We pay these accrued royalties on a quarterly basis and therefore have included the related liability in accounts payable and accrued liabilities.
The value of our produced media library consists of capitalized costs incurred to produce original media content, including salary and overhead costs of our in-house production team and other third-party costs.
We amortize our media library in cost of streaming on a straight-line basis over the shorter of the license period or the estimated useful life of the titles, which typically ranges from 12 to 90 months. The amortization period begins with the first month of availability on our service.
Management reviews content viewership to determine whether viewing patterns correlate with initial estimates supporting the amortization period utilized. If current estimates indicate that viewing is significantly higher in earlier periods relative to the remaining amortization period, we will begin amortizing the respective titles on an accelerated basis over the amortization period. Based on this analysis, no additional amortization was recorded during 2016, 2015 or 2014.
Our media library is reviewed for impairment when an event or change in circumstances indicates that the carrying amount of the media library may not be recoverable. Recoverability of the media library is measured by a comparison of the carrying amount of the media library to estimated undiscounted future expectations.
Inventory
Inventory consists primarily of finished goods held for sale and is stated at the lower of cost (first-in, first-out method) or market. We identify the inventory itemscash flows expected to be written down for obsolescence based ongenerated by the item’s current sales status and condition. We write down discontinued or slow moving inventories based on an estimatemedia library. If the carrying amount of the markdown required to sell offmedia library exceeds its estimated future cash flows, an impairment charge is recognized by the inventory.
Goodwill and Other Intangibles
Goodwill represents the excess of the purchase consideration over the estimated fair value of assets acquired less liabilities assumed in a business acquisition. Our other intangibles consist of customer related assets.We have only one reporting unit; therefore, goodwill is assessed at the enterprise level. We review goodwill for impairment annually or more frequently if impairment indicators arise on a goodwill reporting unit level.as of December 31. We have the option of first assessing qualitative factors to determine whether events and circumstances indicate that it is more likely than not that the estimated fair value of a goodwill reporting unit is less than its carrying amount. If it is determined that the fair value for a goodwill reporting unit is more likely than not greater than the carrying amount for that goodwill, reporting unit, then the two-step impairment test is unnecessary. If it is determined that the two-step impairment test is necessary, then for step one, we compare the estimated fair value of a goodwill reporting unit with its carrying amount, including goodwill. If the estimated fair value of a goodwill reporting unit exceeds its carrying amount, we consider the goodwill of the reporting unitto not be impaired. If the carrying amount of a goodwill reporting unit exceeds its estimated fair value, we perform the second step of the goodwill impairment test to measure the amount of impairment loss. We use either a comparable market approach or a traditional present value method to test for potential impairment. The process of evaluating the potential impairment of goodwill is highly subjective and requires significant judgment at many points during the analysis. Application of alternative assumptions and definitions could yield significantly different results. During 2016, 2015 and 2014, no impairment of goodwill was indicated.
Income Taxes and Deferred Tax Balances
Purchase Accounting
We account for the acquisition of a controlling interest in a business using the acquisition method. In determining the estimated fair value of certain acquiredDeferred income tax assets and liabilities we make assumptions based upon many different factors, such as historical and other relevant information and analyses performed by independent parties. Assumptions may be incomplete, and unanticipated events and circumstances may occur that could affectare recorded with respect to temporary differences in the validityaccounting treatment of such assumptions, estimates, or actual results.
Media Library
Our media library asset represents the fair value of libraries of media acquired through business combinations, the purchase price of media rights to both video and audio titles, and the capitalized cost to produce media products, all of which we market to retailers and to e-commerce and subscription customers. We amortize the fair value of acquired or purchased media titles and content on a straight-line basis over succeeding periods on the basis of their estimated useful lives. We defer capitalized production costsitems for financial reporting purposes until the media is released, and then amortize these costs over succeeding periodsfor income tax purposes. Where, based on the basisweight of estimated sales. Historical sales statistics areavailable evidence, it is more likely than not that some amount of recorded deferred tax assets will not be realized, a valuation allowance is established for the principal factor usedamount that, in estimatingmanagement’s judgment, is sufficient to reduce the amortization rate. Ifdeferred tax asset to an amount that is more likely than not to be realized.
A tax position must meet a minimum probability threshold before a financial statement benefit is recognized. The minimum threshold is defined as a tax position that is more likely than not to be sustained upon examination by the actual useful lifeapplicable taxing authority, including resolution of any related appeals or litigation processes, based on the actual salestechnical merits of the position. The tax benefit to be recognized is measured as the largest amount of benefit that is greater than fifty percent likely of being realized upon ultimate settlement.
Revenues
Streaming revenues consist primarily of subscription fees paid by our media are significantly differentstreaming customers. DVD subscription and other revenues consist of subscription fees paid by our DVD customers and rental income from our estimates that could adversely impact our operating results.
Revenue
tenant leases. We recognize revenue in our Gaiam Brand segmentrevenues when the goodsfollowing four basic criteria are shippedmet: (i) persuasive evidence of an arrangement exists; (ii) delivery has occurred or services have been rendered; (iii) the seller’s price to the customerbuyer is fixed or determinable; and collection(iv) collectability is either probable or has occurred. The amount of revenue recognized is net of estimated returns and other chargebacks (or channel credits), which are estimated using historical return and credit rates. If the actual amount of returns and chargebacks were to vary significantly from our estimates, it could materially impact our results of operations in subsequent periods.reasonably assured. We recognize amounts billed to customers for postage and handling as revenuerevenues at the same time we recognize the revenuerevenues arising from the product sale. Travel revenues are recognized in the period which the trip begins. We recognize revenue in our Gaiam TV segment ratably over the subscription period after collection has occurred. We present revenuerevenues net of taxes collected from customers. Streaming revenues are recognized ratably over the subscription term. Deferred revenues consist of subscription fees collected from customers that have not been earned.
Share-Based Compensation
We recognize compensation cost for share-based awards based on the estimated fair value of the award on date of grant. We measure compensation cost at the grant date based on the estimated fair value of the award and recognize compensation cost upon the probable attainment of a specified performance condition over the estimated performance period or for time based awards over the service period. We use the Black-Scholes option or intrinsic valuation model to estimate the grant date fair value.value of the award. In estimating this fair value, there arewe use certain assumptions, that we use, as disclosed in Note 11.8. Share-Based Compensation, consisting of the expected life of the option, risk-free interest rate, dividend yield, and volatility. The use of a different estimate for any one of these componentsassumptions could have a material impact on the amount of calculated compensation expense.
Long-Lived Assets
We evaluate the carrying value of long-lived assets held and used, other than goodwill, when events or changes in circumstances indicate the carrying value may not be recoverable. We consider the carrying value of a long-lived asset impaired when the total projected undiscounted cash flows from the asset are separately identifiable and are less than the carrying value. We recognize a loss based on the amount by which the carrying value exceeds the estimated fair value of the long-lived asset. We determine the estimated fair value primarily using the projected cash flows from the asset discounted at a rate commensurate with the risk involved.
Deferred Tax Assets
Due to historical operating losses, we recorded a full valuation allowance on our deferred tax assets at the end of 2013 and therefore recorded an associated tax expense of $23.2 million. We have continued to maintain a full valuation allowance during 2014. We continue to be optimistic about our future, and expect to return to operating profitability. When that happens, we expect to reverse the valuation allowance and record the related tax benefit for future use of our net operation loss carryforwards we expect to realize.
Liquidity and Capital Resources
Our capital needs arise from working capital required to fund operations, capital expenditures related to acquisition and development of media content, development and marketing of our e-commerce and digital platforms, and new products, acquisitions of new businesses and other investments, replacements, expansions and improvements to our infrastructure, and future growth. These capital requirements depend on numerous factors, including the rate of market acceptance of our product offerings, our ability to expand our customer base, the cost of ongoing upgrades to our product offerings, the level of expenditures for sales and marketing, the level of investment in distribution systems and facilities and other factors. The timing and amount of these capital requirements are variable and we cannot accurately predict them. Additionally, we will continue to pursue opportunities to expand our media libraries, evaluate possible investments in businesses products and technologies, and increase our sales and marketing programs and brand promotions as needed. At December 31, 2014,2016, our cash balance was $15.8$54.0 million. Including our investment in Gaiam TV, weWe estimate that our capital expenditures, including produced content, will total approximately $6.0$15 million for 2015,2017, which will be funded through our available cash flow from operations.balance.
We currentlySince 2007, we have ahad an active shelf registration with the Securities and Exchange Commission for 5,000,000 shares of our Class A common stock and to date no shares have been issued under this shelf registration.
In the normal course of our business, we investigate, evaluate and discuss acquisition, joint venture, minority investment, strategic relationship and other business combination opportunities in our market. For any future investment, acquisition or joint venture opportunities, we may consider using then-available liquidity, issuing equity securities or incurring additional indebtedness.
While there can be no assurances, we believe our cash on hand, cash expected to be generated from future operations, and cash that could be raised by the sale of our shelf registration stock or from new credit facilities would be sufficient to fund our operations on both a short-term and long-term basis. However, our projected cash needs may change as a result of acquisitions, productcontent development, unforeseen operational difficulties or other factors.
On October 21, 2013, we consummated the sale of GVE, a wholly-owned subsidiary comprised of our non-Gaiam-branded entertainment media business, to Cinedigm for $51.7 million, comprised of cash, stock, and other assets and liabilities. In addition, the sale consideration also included a working capital adjustment which is currently in dispute. See Item 3. Legal Proceedings.
AsWe had no debt as of December 31, 2014 and 2013 we had no long-term debt. On October 21, 2013, each of our subsidiaries Gaiam Americas, Inc., SPRI Products, Inc., GT Direct, Inc., and Gaiam Vivendi Entertainment (collectively the “Borrowers”) paid in full their outstanding balance owed to PNC Bank, N.A. (“PNC”), $19,621,941 (inclusive of principal and interest and other fees), and terminated the underlying Revolving Credit and Security Agreement (“PNC Credit Agreement”), dated July 31, 2012, between the Borrowers and PNC. The Borrowers also paid an early termination fee of $350,000.2016.
The potential spinoff of Gaiam TV will have a significant impact on our liquidity if it occurs, as Gaiam will no longer be required to fund the operating losses or capital expenditures of Gaiam TV. As discussed in Note 17 to the consolidated financial statements, Gaiam and Gaiam TV have entered into an agreement to transfer the ownership of our principal offices to Gaiam TV, effective January 1, 2015. As a result, our principal offices, which are fully owned by us and have no associated debt, will no longer be available as a potential source of financing to Gaiam after the spinoff.
Cash Flows
The following table summarizes our primary sources (uses) of cash during the periods presented:
| Years ended December 31, | ||||||||||||
(in thousands) | 2014 | 2013 | 2012 | |||||||||
Net cash (used in) provided by: | ||||||||||||
Operating activities – continuing operations | $ | (8,827 | ) | $ | (15,555 | ) | $ | (1,106 | ) | |||
Operating activities – discontinued operations (a) | (142 | ) | (7,569 | ) | 17,582 | |||||||
|
|
|
|
|
| |||||||
Operating activities | (8,969 | ) | (23,124 | ) | 16,476 | |||||||
|
|
|
|
|
| |||||||
Investing activities – continuing operations | (8,437 | ) | 64,977 | (4,699 | ) | |||||||
Investing activities – discontinued operations | — | — | (13,491 | ) | ||||||||
|
|
|
|
|
| |||||||
Investing activities | (8,437 | ) | 64,977 | (18,190 | ) | |||||||
|
|
|
|
|
| |||||||
Financing activities – continuing operations | 1,656 | 777 | (583 | ) | ||||||||
Financing activities – discontinued operations | — | (19,967 | ) | (2,472 | ) | |||||||
|
|
|
|
|
| |||||||
Financing activities | 1,656 | (19,190 | ) | (3,055 | ) | |||||||
|
|
|
|
|
| |||||||
Effects of exchange rates on cash | (707 | ) | (292 | ) | 82 | |||||||
|
|
|
|
|
| |||||||
Net (decrease) increase in cash | $ | (16,457 | ) | $ | 22,371 | $ | (4,687 | ) | ||||
|
|
|
|
|
| |||||||
|
| Years ended December 31, |
| |||||||||
(in thousands) |
| 2016 |
|
| 2015 |
|
| 2014 |
| |||
Net cash provided by (used in): |
|
|
|
|
|
|
|
|
|
|
|
|
Operating activities – continuing operations |
| $ | (6,056 | ) |
| $ | (3,787 | ) |
| $ | (5,864 | ) |
Operating activities – discontinued operations |
|
| (9,326 | ) |
|
| 11,388 |
|
|
| 15,652 |
|
Operating activities |
|
| (15,382 | ) |
|
| 7,601 |
|
|
| 9,788 |
|
Investing activities – continuing operations |
|
| 145,533 |
|
|
| (6,380 | ) |
|
| (1,767 | ) |
Investing activities—discontinued operations |
|
| (319 | ) |
|
| (2,955 | ) |
|
| (6,670 | ) |
Investing activities |
|
| 145,214 |
|
|
| (9,335 | ) |
|
| (8,437 | ) |
Financing activities |
|
| (77,071 | ) |
|
| (326 | ) |
|
| 1,656 |
|
Effects of exchange rates on cash |
|
| — |
|
|
| (495 | ) |
|
| (707 | ) |
Net (decrease) increase in cash |
| $ | 52,761 |
|
| $ | (2,555 | ) |
| $ | 2,300 |
|
20142016 Compared to 20132015
Continuing Operations
Operating activities. Our operating activities forCash flow used in continuing operations used net cash of $8.8 million and $15.6increased $2.3 million during 20142016 compared to the same period in 2015. The increase was primarily due to operating losses and 2013, respectively. The net cash usedgrowth in our deferred revenue balances in conjunction with our subscriber growth.
Investing activities. Cash flow provided by operatinginvesting activities for– continuing operations increased $151.9 million during 20142016 compared to the same period in 2015. The increase is due to the $167.0 million sale of the Gaiam Brand business including Natural Habitat, offset by investments in our media library and other investments.
Financing activities. Cash flow used in financing activities increased $76.7 million during 2016 compared to the same period in 2015, primarily due to the use of $77.4 million to repurchase 9,636,848 shares of Class A common stock and 842,114 stock options in the tender offer completed in July 2016.
Discontinued Operations
Operating activities. Cash flow from discontinued operations decreased $20.7 million during 2016 compared to the same period in 2015. The decrease was primarily attributabledue to continuing investmentthe Gaiam Brand business only operating the first 6 months of 2016, operating losses, and longer collection cycles on accounts receivable in Gaiam TV, decreased participations payable of $3.5 million and increased receivables of $3.9 million, partially offset by increased accounts payable of $5.5 million. The net cash used by operating activities for continuing operations during 2013 was also primarily attributable to investment in Gaiam TV, decreased accounts payable of $4.4 million, partially offset by decreased inventory of $1.1 million.2016.
Investing activities. Our investing activities for continuing operations used net cash of $8.4 million and generated net cash of $65.0 million during 2014 and 2013, respectively. The net cashCash flow used in investing activities for continuing– discontinued operations decreased $2.6 million during 20142016 compared to the same period in 2015. The decrease was due to $5.5decreased investment activity prior to the Gaiam Brand business sale.
Continuing Operations
Operating activities. Cash flow used by continuing operations decreased $2.1 million usedduring 2015 compared to investthe same period in or acquire new business, $5.6 million2014. The decrease was primarily due to reduced operating losses and longer payment cycles on accounts payable in 2015.
Investing activities. Cash flow used to acquire new media, property and equipment, partially offset by $2.6 million of proceeds from sales of our investments in CDGM and RGSE. The net cash provided by investing activities for– continuing operations increased $4.6 million during 2013 was from2015 compared to the $25.1 million net proceeds from the sale of virtually all of oursame period in 2014 primarily due to increased investment in RGSE, cash received of $47.5 million for the sale of GVE, repayment on a loan made to RGSE of $2.1 million, offset by cash used to acquire property and equipment to maintain normal operations for $1.7 million andour media content for $1.7 million, and by cash used to acquire businesses of $6.3 million, net of cash acquired.library.
Financing activities. OurCash flow from financing activities for continuing operations generated net cash of $1.7 million and of $0.8decreased $2.0 million during 2015 compared to the same period in 2014, and 2013, respectively. The net cash generated by financing activities for continuing operations for both years was primarily due to a decrease in proceeds from issuance of stock upon stockrelated to option exercises.
Discontinued Operations
Operating activities. Our operating activities forCash provided by discontinued operations used net cash of $0.1 million and $7.6was $11.4 million during 20142015 compared to $15.7 million during 2014. The cash flows were provided primarily by income from operations and 2013, respectively. Thecollections of accounts receivables and varied due to working capital timing associated with the Gaiam Brand business.
Investing activities. Cash used in investing activities of discontinued operations was $3.0 million during 2015 compared to $6.7 million during 2014. A portion of the net cash used during 2014 primarily relates to the wind down of the DRTV business. The net cash used during 2013 was primarily attributable to the net loss of GVE and DRTV, and by seasonal reductions in working capital during our ownership period of GVE.
Financing activities. Our financing activities for discontinued operations used net cash of $20.0 million during 2013 and were zero during 2014. The net cash used during 2013 was for the repayment of borrowings on ouran outstanding line of credit.
2013 Compared to 2012Contractual Obligations
Continuing Operations
Operating activities. Our operating activities for continuing operations used net cash of $15.6 million and used net cash of $1.1 million during 2013 and 2012, respectively. The net cash used by operating activities for continuing operations during 2013 was primarily attributable to increased investment in Gaiam TV, decreased accounts payable of $4.4 million, partially offset by decreased inventory of $1.1 million. Our net cash used in operating activities for continuing operations during 2012 was primarily attributable to our net loss as adjusted by our noncash loss on equity investment of $18.4 million, cash provided by increased accrued liabilities of $9.5 million, offset by increased accounts receivable, other current assets, and decreased participations payable of $3.6 million, $6.2 million, and $4.7 million, respectively.
Investing activities. Our investing activities for continuing operations generated net cash of $65.0 million and used net cash of $4.7 million during 2013 and 2012, respectively. The net cash provided by investing activities for continuing operations during 2013 was from the $25.1 million net proceeds from the sale of virtually all of our investment in RGSE, cash received of $47.5 million for the sale of GVE, repayment on a loan made to RGSE of $2.1 million, offset by cash used to acquire property and equipment to maintain normal operations for $1.7 million and media content for $1.7 million, and by cash used to acquire businesses of $6.3 million, net of cash acquired. The net cash used in investing activities for continuing operations during 2012 was used primarily to acquire property and equipment for $2.6 million and media content for $1.1 million, to loan RGSE, net of interest received, $0.8 million, and for our travel subsidiary’s purchase of the noncontrolling interest of one of its businesses for $0.1 million.
Financing activities. Our financing activities for continuing operations generated net cash of $0.8 million and used net cash of $0.6 million during 2013 and 2012, respectively. The net cash generated by financing activities for continuing operations during 2013 was from issuance of stock, net of tax benefits, upon stock option exercises. The net cash used by financing activities for continuing operations during 2012 was used for the payment of a $0.6 million dividend to our travel subsidiary’s noncontrolling interest.
Discontinued Operations
Operating activities. Our operating activities for discontinued operations used net cash of $7.6 million and provided net cash of $17.6 million during 2013 and 2012, respectively. Excluding the net cash flows from the purchased Vivendi Entertainment working capital of approximately $18.7 million, net cash used in operating activities for discontinued operations would have been $1.1 million during 2012. The net cash used in operating activities for discontinued operations during 2013 was primarily attributable to our net loss, offset by asset impairment and other non-cash expenses relatedPrior to the sale of GVE and discontinuance of DRTV, and reduced by seasonal reductions in working capital during our ownership period of GVE. Our net cash provided by discontinued operations during 2012 was primarily attributable to our net income of $6.6 million, approximately $18.7 million of cash generated by working capital in Vivendi Entertainment, which was used to partially fund the acquisition of Vivendi, offset by an increase in working capital.
Investing activities. WeGaiam Brand business segment, we had no investing activities in our discontinued operations during 2013. Our investing activities for discontinued operations used net cash of $13.5 million during 2012. The net cash used in investing activities for discontinued operations during 2012 was used primarily for the $13.4 million cash portion of the purchase price for Gaiam Vivendi Entertainment.
Financing activities. Our financing activities for discontinued operations used net cash of $20.0 million and $2.5 million during 2013 and 2012, respectively. The net cash used in financing activities for discontinued operations during 2013 was for the repayment of borrowings on our line of credit. The net cash used by financing activities for discontinued operations during 2012 was used for the repayment of a promissory note for $18.7 million in connection with the acquisition of Gaiam Vivendi Entertainment, offset by net borrowings on a revolving line of credit of $16.2 million, the funds from which were mainly used for the acquisition of Gaiam Vivendi Entertainment and related working capital needs.
Contractual Obligations
We have commitments pursuant to operating lease agreements and media distribution agreements. The following table shows our commitments to make future payments or advances under these agreements asThese obligations were entirely assumed by the new owners of December 31, 2014:the Gaiam Brand business effective July 1, 2016.
(in thousands) | Total | < 1 year | 1-3 years | 3-5 years | > 5 years | |||||||||||||||
Operating lease payments | $ | 1,068 | $ | 769 | $ | 299 | $ | — | $ | — | ||||||||||
Minimum distribution payments | $ | 5,975 | $ | 3,350 | $ | 2,625 | $ | — | $ | — | ||||||||||
Off-Balance Sheet Arrangements
We do not participate in transactions that generate relationships with unconsolidated entities or financial partnerships, such as special purpose entities or variable interest entities, which have been established for the purpose of facilitating off-balance sheet arrangements or other limited purposes.
We are exposedWith the sale of our Gaiam Brand segment, we eliminated our exposure to market risks, which include changes in U.S. interestforeign exchange rates and foreign exchange rates. We do not engage in financial transactions for trading or speculative purposes, but do have on occasion forward contracts for or investments in foreign currency, the gains and losses from which have been immaterial. We hold a controlling financial interest in and, therefore consolidate Gaiam PTY, an Australian based joint venture. Since Gaiam PTY’s functional currency is the Australian dollar, this subsidiary exposes us to risk associated with foreign currency exchange rate fluctuations. However,determined we have determined that no material market risk exposure to our consolidated financial position, results from operations or cash flows existed as of December 31, 2014.2016.
We purchase a significant amount of inventory from vendors outside of the U.S. in transactions that are primarily U.S. dollar denominated transactions. A decline in the relative value of the U.S. dollar to other foreign currencies has and may continue to lead to increased purchasing costs.
Index to Consolidated Financial Statements
28 | ||||
| ||||
Gaia, Inc. Consolidated Financial Statements: | ||||
29 | ||||
30 | ||||
31 | ||||
32 | ||||
33 | ||||
| ||||
| ||||
Report of Independent RegisteredRegistered Public Accounting Firm
To the Board of Directors and Shareholders of
Gaiam,Gaia, Inc.
Louisville, Colorado
We have audited the accompanying consolidated balance sheets of Gaiam,Gaia, Inc. and subsidiaries (the “Company”) as of December 31, 20142016 and 2013,2015, and the related consolidated statements of operations, comprehensive loss,income (loss), changes in equity, and cash flows for each of the years in the three yearthree-year period ended December 31, 2014. Our audits also included the consolidated financial statement schedule II for the years ended December 31, 2014, 2013, and 2012.2016. We have also audited the Company’s internal control over financial reporting as of December 31, 2014,2016, based on criteria established in Internal Control-Integrated Framework (2013) issued in 2003 by the Committee of Sponsoring Organizations of the Treadway Commission (the “COSO Criteria”)(COSO). The Company’s management is responsible for these consolidated financial statements, for maintaining effective internal control over financial reporting, and for its assessment of the effectiveness of internal control over financial reporting, included in the accompanying management’s reportManagement’s Report on internal controlInternal Control over financial reporting.Financial Reporting. Our responsibility is to express an opinion on these consolidated financial statements and an opinion on the effectiveness of the Company’s internal control over financial reporting based on our audits.
We conducted our audits in accordance with the standards of the Public Company Accounting Oversight Board (United States). Those standards require that we plan and perform the audits to obtain reasonable assurance about whether the consolidated financial statements are free of material misstatement and whether effective internal control over financial reporting was maintained in all material respects. Our audits of the consolidated financial statements included examining, on a test basis, evidence supporting the amounts and disclosures in the consolidated financial statements, assessing the accounting principles used and significant estimates made by management, and evaluating the overall consolidated financial statement presentation. Our auditaudits of internal control over financial reporting included obtaining an understanding of internal control over financial reporting, assessing the risk that a material weakness exists, and testing and evaluating the design and operating effectiveness of internal control based on the assessed risk, andrisk. Our audits also included performing such other procedures as we considered necessary in the circumstances. We believe that our audits provide a reasonable basis for our opinions.
A company’s internal control over financial reporting is a process designed to provide reasonable assurance regarding the reliability of financial reporting and the preparation of financial statements for external purposes in accordance with generally accepted accounting principles. A company’s internal control over financial reporting includes those policies and procedures that (1) pertain to the maintenance of records that, in reasonable detail, accurately and fairly reflect the transactions and dispositions of the assets of the company;Company; (2) provide reasonable assurance that transactions are recorded as necessary to permit preparation of financial statements in accordance with generally accepted accounting principles, and that receipts and expenditures of the companyCompany are being made only in accordance with authorizations of management and directors of the company;Company; and (3) provide reasonable assurance regarding prevention or timely detection of unauthorized acquisition, use, or disposition of the company’sCompany’s assets that could have a material effect on the financial statements.
Because of its inherent limitations, internal control over financial reporting may not prevent or detect misstatements. Also, projections of any evaluation of effectiveness to future periods are subject to the risk that controls may become inadequate because of changes in conditions or that the degree of compliance with the policies or procedures may deteriorate.
In our opinion, the consolidated financial statements referred to above present fairly, in all material respects, the financial position of Gaiam,Gaia, Inc. and subsidiaries as of December 31, 20142016 and 2013,2015, and the results of their operations and their cash flows for each of the years in the three yearthree-year period ended December 31, 2014,2016, in conformity with accounting principles generally accepted in the United States of America. In our opinion, the related consolidated financial statement schedule II for the years ended December 31, 2014, 2013, and 2012, when considered in relation to the basic financial statements taken as a whole, presents fairly in all material respects the information set forth therein. Also in our opinion, Gaiam,Gaia, Inc. and subsidiaries maintained, in all material respects, effective internal control over financial reporting as of December 31, 2014,2016, based on the COSO Criteria.criteria established in Internal Control—Integrated Framework (2013) issued by the Committee of Sponsoring Organizations of the Treadway Commission (COSO).
EKS&H LLLP
March 13, 2015February 28, 2017
Denver, Colorado
GAIAM, INC.
| December 31, |
| As of December 31, |
| |||||||||||||
(in thousands, except share and per share data) | 2014 | 2013 |
| 2016 |
|
| 2015 |
| ||||||||
| ASSETS |
|
|
|
|
|
|
|
| ||||||||
Current assets: |
|
|
|
|
|
|
|
| ||||||||
Cash | $ | 15,772 | $ | 32,229 |
| $ | 54,027 |
|
| $ | 1,266 |
| ||||
Accounts receivable, net | 30,266 | 26,207 | ||||||||||||||
Inventory, less allowances | 20,154 | 20,275 | ||||||||||||||
Other current assets | 11,998 | 9,470 | ||||||||||||||
Accounts receivable |
|
| 554 |
|
|
| 465 |
| ||||||||
Prepaid expenses and other current assets |
|
| 1,303 |
|
|
| 729 |
| ||||||||
Current assets of discontinued operations | 582 | 1,889 |
|
| — |
|
|
| 68,860 |
| ||||||
|
| |||||||||||||||
Total current assets | 78,772 | 90,070 |
|
| 55,884 |
|
|
| 71,320 |
| ||||||
Property and equipment, net | 23,231 | 22,540 | ||||||||||||||
Media library, net | 7,691 | 5,211 | ||||||||||||||
Building and land, net |
|
| 16,896 |
|
|
| 17,786 |
| ||||||||
Media library, software and equipment, net |
|
| 12,861 |
|
|
| 11,738 |
| ||||||||
Goodwill | 15,448 | 13,999 |
|
| 10,609 |
|
|
| 10,609 |
| ||||||
Other intangibles, net | 823 | 1,155 | ||||||||||||||
Other assets | 12,667 | 8,711 | ||||||||||||||
|
| |||||||||||||||
Investments and other assets |
|
| 10,946 |
|
|
| 1,756 |
| ||||||||
Noncurrent assets of discontinued operations |
|
| — |
|
|
| 15,333 |
| ||||||||
Total assets | $ | 138,632 | $ | 141,686 |
| $ | 107,196 |
|
| $ | 128,542 |
| ||||
|
| |||||||||||||||
| LIABILITIES AND EQUITY |
|
|
|
|
|
|
|
| ||||||||
Current liabilities: |
|
|
|
|
|
|
|
| ||||||||
Accounts payable | $ | 18,837 | $ | 13,381 | ||||||||||||
Accrued liabilities | 19,859 | 17,503 | ||||||||||||||
Participations payable | 377 | 3,916 | ||||||||||||||
Accounts payable and accrued liabilities |
| $ | 6,672 |
|
| $ | 6,081 |
| ||||||||
Deferred revenue |
|
| 2,434 |
|
|
| 1,454 |
| ||||||||
Current liabilities of discontinued operations | — | 1,596 |
|
| — |
|
|
| 32,214 |
| ||||||
|
| |||||||||||||||
Total current liabilities | 39,073 | 36,396 |
|
| 9,106 |
|
|
| 39,749 |
| ||||||
Commitments and contingencies | ||||||||||||||||
Deferred taxes |
| 553 |
|
|
| — |
| |||||||||
Contingencies |
|
|
|
|
|
|
|
| ||||||||
Equity: |
|
|
|
|
|
|
|
| ||||||||
Gaiam, Inc. shareholders’ equity: | ||||||||||||||||
Class A common stock, $.0001 par value, 150,000,000 shares authorized, 19,084,958 and 18,595,121 shares issued and outstanding at December 31, 2014 and 2013, respectively | 2 | 2 | ||||||||||||||
Class B common stock, $.0001 par value, 50,000,000 shares authorized, 5,400,000 shares issued and outstanding at December 31, 2014 and 2013 | 1 | 1 | ||||||||||||||
Gaia, Inc. shareholders’ equity: |
|
|
|
|
|
|
|
| ||||||||
Class A common stock, $.0001 par value, 150,000,000 shares authorized, 9,752,531 and 19,130,681 shares issued and outstanding at December 31, 2016 and 2015, respectively |
|
| 1 |
|
|
| 2 |
| ||||||||
Class B common stock, $.0001 par value, 50,000,000 shares authorized, 5,400,000 shares issued and outstanding at December 31, 2016 and 2015, respectively |
|
| 1 |
|
|
| 1 |
| ||||||||
Additional paid-in capital | 171,315 | 167,875 |
|
| 98,504 |
|
|
| 172,371 |
| ||||||
Accumulated other comprehensive loss | (200 | ) | (33 | ) |
|
| — |
|
|
| (399 | ) | ||||
Accumulated deficit | (76,329 | ) | (66,413 | ) |
|
| (969 | ) |
|
| (88,035 | ) | ||||
|
| |||||||||||||||
Total Gaiam, Inc. shareholders’ equity | 94,789 | 101,432 | ||||||||||||||
Noncontrolling interest | 4,770 | 3,858 |
|
| — |
|
|
| 4,853 |
| ||||||
|
| |||||||||||||||
Total equity | 99,559 | 105,290 |
|
| 97,537 |
|
|
| 88,793 |
| ||||||
|
| |||||||||||||||
Total liabilities and equity | $ | 138,632 | $ | 141,686 |
| $ | 107,196 |
|
| $ | 128,542 |
| ||||
|
| |||||||||||||||
See accompanying notes to consolidated financial statements.
GAIAM, INC.
Consolidated Statements of Operations
(in thousands, except per share data) | 2014 | 2013 | 2012 | |||||||||
Consolidated Statements of Operations Data: | ||||||||||||
Net revenues | $ | 166,694 | $ | 155,463 | $ | 127,242 | ||||||
Cost of goods sold | 91,189 | 90,155 | 70,723 | |||||||||
|
|
|
|
|
| |||||||
Gross profit | 75,505 | 65,308 | 56,519 | |||||||||
|
|
|
|
|
| |||||||
Expenses: | ||||||||||||
Selling and operating | 68,723 | 64,657 | 56,292 | |||||||||
Corporate, general and administration | 11,161 | 11,249 | 10,400 | |||||||||
Transaction-related costs | 707 | 76 | — | |||||||||
Other general income and expense | — | 10,967 | — | |||||||||
|
|
|
|
|
| |||||||
Total expenses | 80,591 | 86,949 | 66,692 | |||||||||
|
|
|
|
|
| |||||||
Loss from operations | (5,086 | ) | (21,641 | ) | (10,173 | ) | ||||||
Interest and other (expense) income | (600 | ) | 2,421 | (86 | ) | |||||||
Gain on sale of investments | 1,480 | 25,096 | — | |||||||||
Loss from equity method investment | (55 | ) | — | (18,410 | ) | |||||||
|
|
|
|
|
| |||||||
(Loss) income before income taxes | (4,261 | ) | 5,876 | (28,669 | ) | |||||||
Income tax expense (benefit) | 1,369 | 25,974 | (9,444 | ) | ||||||||
|
|
|
|
|
| |||||||
Net loss from continuing operations | (5,630 | ) | (20,098 | ) | (19,225 | ) | ||||||
(Loss) income from discontinued operations, net of tax | (3,327 | ) | (1,995 | ) | 6,648 | |||||||
|
|
|
|
|
| |||||||
Net loss | (8,957 | ) | (22,093 | ) | (12,577 | ) | ||||||
Net income attributable to noncontrolling interest | (959 | ) | (659 | ) | (305 | ) | ||||||
|
|
|
|
|
| |||||||
Net loss attributable to Gaiam, Inc. | $ | (9,916 | ) | $ | (22,752 | ) | $ | (12,882 | ) | |||
|
|
|
|
|
| |||||||
Net loss per share attributable to Gaiam, Inc. common shareholders—basic and diluted: | ||||||||||||
From continuing operations | $ | (0.27 | ) | $ | (0.90 | ) | $ | (0.86 | ) | |||
From discontinued operations | (0.14 | ) | (0.09 | ) | 0.29 | |||||||
|
|
|
|
|
| |||||||
Basic and diluted net loss per share attributable to Gaiam, Inc. | $ | (0.41 | ) | $ | (0.99 | ) | $ | (0.57 | ) | |||
|
|
|
|
|
| |||||||
Weighted-average shares outstanding: | ||||||||||||
Basic and diluted | 24,228 | 22,972 | 22,703 | |||||||||
|
|
|
|
|
| |||||||
See Accompanying Notes to Consolidated Financial Statements.
GAIAM, INC.Consolidated Statements of Operations
|
| Years Ended December 31, |
| |||||||||
(in thousands, except per share data) |
| 2016 |
|
| 2015 |
|
| 2014 |
| |||
Net revenues |
|
|
|
|
|
|
|
|
|
|
|
|
Streaming |
| $ | 14,736 |
|
| $ | 10,752 |
|
| $ | 8,040 |
|
DVD subscription and other |
|
| 2,511 |
|
|
| 2,707 |
|
|
| 2,714 |
|
Total net revenues |
|
| 17,247 |
|
|
| 13,459 |
|
|
| 10,754 |
|
Cost of revenues |
|
|
|
|
|
|
|
|
|
|
|
|
Streaming |
|
| 2,567 |
|
|
| 2,262 |
|
|
| 1,746 |
|
DVD subscription and other |
|
| 275 |
|
|
| 335 |
|
|
| 289 |
|
Total cost of revenues |
|
| 2,842 |
|
|
| 2,597 |
|
|
| 2,035 |
|
Gross profit |
|
| 14,405 |
|
|
| 10,862 |
|
|
| 8,719 |
|
Expenses: |
|
|
|
|
|
|
|
|
|
|
|
|
Selling and operating |
|
| 24,960 |
|
|
| 13,079 |
|
|
| 14,879 |
|
Corporate, general and administration |
|
| 6,020 |
|
|
| 6,494 |
|
|
| 4,566 |
|
Total operating expenses |
|
| 30,980 |
|
|
| 19,573 |
|
|
| 19,445 |
|
Loss from operations |
|
| (16,575 | ) |
|
| (8,711 | ) |
|
| (10,726 | ) |
Interest and other (expense) income, net |
|
| (351 | ) |
|
| (311 | ) |
|
| 880 |
|
Loss before income taxes |
|
| (16,926 | ) |
|
| (9,022 | ) |
|
| (9,846 | ) |
Income tax benefit |
|
| (6,144 | ) |
|
| (3 | ) |
|
| — |
|
Loss from continuing operations |
|
| (10,782 | ) |
|
| (9,019 | ) |
|
| (9,846 | ) |
Income (loss) from discontinued operations, net of tax |
|
| 97,848 |
|
|
| (2,687 | ) |
|
| (70 | ) |
Net income (loss) |
| $ | 87,066 |
|
| $ | (11,706 | ) |
| $ | (9,916 | ) |
Income (loss) per share—basic and diluted: |
|
|
|
|
|
|
|
|
|
|
|
|
Continuing operations |
| $ | (0.54 | ) |
| $ | (0.37 | ) |
| $ | (0.41 | ) |
Discontinued operations |
|
| 4.93 |
|
|
| (0.11 | ) |
|
| — |
|
Basic and diluted net income (loss) per share |
| $ | 4.39 |
|
| $ | (0.48 | ) |
| $ | (0.41 | ) |
Weighted-average shares outstanding: |
|
|
|
|
|
|
|
|
|
|
|
|
Basic and diluted |
|
| 19,850 |
|
|
| 24,510 |
|
|
| 24,228 |
|
See accompanying Notes to Consolidated Financial Statements.
Consolidated Statements of Comprehensive LossIncome (Loss)
| Years Ended December 31, | ||||||||||||
(in thousands) | 2014 | 2013 | 2012 | |||||||||
Net loss | $ | (8,957 | ) | $ | (22,093 | ) | $ | (12,577 | ) | |||
|
|
|
|
|
| |||||||
Other comprehensive income (loss): | ||||||||||||
Foreign currency translation (loss) gain | (62 | ) | (292 | ) | 10 | |||||||
Unrealized gain on equity securities | 202 | 116 | — | |||||||||
Reclassification of gain on equity securities to net income | (319 | ) | — | — | ||||||||
|
|
|
|
|
| |||||||
Other comprehensive (loss) income | (179 | ) | (176 | ) | 10 | |||||||
|
|
|
|
|
| |||||||
Comprehensive loss | (9,136 | ) | (22,269 | ) | (12,567 | ) | ||||||
|
|
|
|
|
| |||||||
Less: comprehensive income attributable to the noncontrolling interest | 947 | 634 | 310 | |||||||||
|
|
|
|
|
| |||||||
Comprehensive loss attributable to Gaiam, Inc. | $ | (10,083 | ) | $ | (22,903 | ) | $ | (12,877 | ) | |||
|
|
|
|
|
| |||||||
|
| Years Ended December 31, |
| |||||||||
(in thousands) |
| 2016 |
|
| 2015 |
|
| 2014 |
| |||
Net income (loss) |
| $ | 87,066 |
|
| $ | (11,706 | ) |
| $ | (9,916 | ) |
Net loss attributable to the noncontrolling interest included in discontinued operations |
|
| — |
|
|
| (694 | ) |
|
| (959 | ) |
Total net income (loss) before noncontrolling interest |
|
| 87,066 |
|
|
| (11,012 | ) |
|
| (8,957 | ) |
Accumulated other comprehensive loss: |
|
|
|
|
|
|
|
|
|
|
|
|
Foreign currency translation loss, net of tax (included in discontinued operations) |
|
| — |
|
|
| (324 | ) |
|
| (62 | ) |
Changes in value of equity securities (included in discontinued operations) |
|
| — |
|
|
| — |
|
|
| (117 | ) |
Comprehensive income (loss) |
| $ | 87,066 |
|
| $ | (11,336 | ) |
| $ | (9,136 | ) |
See Accompanyingaccompanying Notes to Consolidated Financial Statements.
GAIAM, INC.
Consolidated Statement of Changes in Equity
| Gaiam, Inc. Shareholders | ||||||||||||||||||||||||||||||||
(in thousands, except shares) | Total Equity | Total Gaiam Equity | Accumulated Deficit | Accumulated Other Comprehensive Income | Common Stock Amount | Additional Paid-in Capital | Common Stock Shares | Noncontrolling Interest | ||||||||||||||||||||||||
Balance at December 31, 2011 | $ | 131,174 | $ | 128,110 | $ | (30,779 | ) | $ | 113 | $ | 3 | $ | 158,773 | 22,697,844 | $ | 3,064 | ||||||||||||||||
Issuance of Gaiam, Inc. common stock and share-based compensation | 1,011 | 1,011 | — | — | — | 1,011 | 32,620 | — | ||||||||||||||||||||||||
Adjustment due to subsidiary’s acquisition of a noncontrolling interest | (163 | ) | (170 | ) | — | — | — | (170 | ) | — | 7 | |||||||||||||||||||||
Subsidiary’s dividend to noncontrolling interest | (583 | ) | — | — | — | — | — | — | (583 | ) | ||||||||||||||||||||||
Comprehensive income (loss) | (12,567 | ) | (12,877 | ) | (12,882 | ) | 5 | — | — | — | 310 | |||||||||||||||||||||
|
|
|
|
|
|
|
|
|
|
|
|
|
|
|
| |||||||||||||||||
Balance at December 31, 2012 | 118,872 | 116,074 | (43,661 | ) | 118 | 3 | 159,614 | 22,730,464 | 2,798 | |||||||||||||||||||||||
Issuance of Gaiam, Inc. common stock in conjunction with an acquisition and share-based compensation | 8,261 | 8,261 | — | — | — | 8,261 | 1,264,657 | — | ||||||||||||||||||||||||
Noncontrolling interest portion of subsidiary’s business combinations | 426 | — | — | — | — | — | — | 426 | ||||||||||||||||||||||||
Comprehensive (loss) income | (22,269 | ) | (22,903 | ) | (22,752 | ) | (151 | ) | — | — | — | 634 | ||||||||||||||||||||
|
|
|
|
|
|
|
|
|
|
|
|
|
|
|
| |||||||||||||||||
Balance at December 31, 2013 | $ | 105,290 | $ | 101,432 | $ | (66,413 | ) | $ | (33 | ) | $ | 3 | $ | 167,875 | 23,995,121 | $ | 3,858 | |||||||||||||||
Issuance of Gaiam, Inc. common stock in conjunction with an acquisition and share-based compensation | 3,440 | 3,440 | — | — | — | 3,440 | 489,837 | — | ||||||||||||||||||||||||
Noncontrolling interest portion of subsidiary’s business combinations | 115 | — | — | — | — | — | — | 115 | ||||||||||||||||||||||||
Subsidiary’s dividend to noncontrolling interest | (150 | ) | — | — | — | — | — | — | (150 | ) | ||||||||||||||||||||||
Comprehensive income (loss) | (9,136 | ) | (10,083 | ) | (9,916 | ) | (167 | ) | — | — | — | 947 | ||||||||||||||||||||
|
|
|
|
|
|
|
|
|
|
|
|
|
|
|
| |||||||||||||||||
Balance at December 31, 2014 | $ | 99,559 | $ | 94,789 | $ | (76,329 | ) | $ | (200 | ) | $ | 3 | $ | 171,315 | 24,484,958 | $ | 4,770 | |||||||||||||||
|
|
|
|
|
|
|
|
|
|
|
|
|
|
|
| |||||||||||||||||
|
|
|
|
|
| Gaia, Inc. Shareholders |
|
|
|
|
| |||||||||||||||||
(in thousands, except shares) |
| Total Equity |
|
| Accumulated Deficit |
|
| Accumulated Other Comprehensive Loss |
|
| Common Stock Amount |
|
| Additional Paid-in Capital |
|
| Common Stock Shares |
|
| Noncontrolling Interest |
| |||||||
Balance at December 31, 2013 |
| $ | 105,290 |
|
| $ | (66,413 | ) |
| $ | (33 | ) |
| $ | 3 |
|
| $ | 167,875 |
|
|
| 23,995,121 |
|
| $ | 3,858 |
|
Issuance of Gaia, Inc. common stock in conjunction with an acquisition and share-based compensation |
|
| 3,440 |
|
|
| — |
|
|
| — |
|
|
| — |
|
|
| 3,440 |
|
|
| 489,837 |
|
|
| — |
|
Noncontrolling interest portion of subsidiary’s business combinations |
|
| 115 |
|
|
| — |
|
|
| — |
|
|
| — |
|
|
| — |
|
|
| — |
|
|
| 115 |
|
Subsidiary’s dividend to noncontrolling interest |
|
| (150 | ) |
|
| — |
|
|
| — |
|
|
| — |
|
|
| — |
|
|
| — |
|
|
| (150 | ) |
Comprehensive (loss) income |
|
| (9,136 | ) |
|
| (9,916 | ) |
|
| (167 | ) |
|
| — |
|
|
| — |
|
|
| — |
|
|
| 947 |
|
Balance at December 31, 2014 |
| $ | 99,559 |
|
| $ | (76,329 | ) |
| $ | (200 | ) |
| $ | 3 |
|
| $ | 171,315 |
|
|
| 24,484,958 |
|
| $ | 4,770 |
|
Issuance of Gaia, Inc. common stock and share-based compensation |
|
| 1,056 |
|
|
| — |
|
|
| — |
|
|
| — |
|
|
| 1,056 |
|
|
| 45,723 |
|
|
| — |
|
Subsidiary’s dividend to noncontrolling interest |
|
| (486 | ) |
|
| — |
|
|
| — |
|
|
| — |
|
|
| — |
|
|
| — |
|
|
| (486 | ) |
Comprehensive (loss) income |
|
| (11,336 | ) |
|
| (11,706 | ) |
|
| (199 | ) |
|
| — |
|
|
| — |
|
|
| — |
|
|
| 569 |
|
Balance at December 31, 2015 |
| $ | 88,793 |
|
| $ | (88,035 | ) |
| $ | (399 | ) |
| $ | 3 |
|
| $ | 172,371 |
|
|
| 24,530,681 |
|
| $ | 4,853 |
|
Issuance of Gaia, Inc. common stock for stock option exercises, share-based compensation and charitable contribution, net of tax |
|
| 2,300 |
|
|
| — |
|
|
| — |
|
|
| — |
|
|
| 2,300 |
|
|
| 258,698 |
|
|
| — |
|
Repurchase of shares |
|
| (76,168 | ) |
|
| — |
|
|
| — |
|
|
| (1 | ) |
|
| (76,167 | ) |
|
| (9,636,848 | ) |
|
| — |
|
Dividends paid to noncontrolling interest |
|
| (1,944 | ) |
|
| — |
|
|
| — |
|
|
| — |
|
|
| — |
|
|
| — |
|
|
| (1,944 | ) |
Elimination of noncontrolling interest and accumulated other comprehensive loss resulting from the sale of Gaiam Brand segment |
|
| (2,510 | ) |
|
| — |
|
|
| 399 |
|
|
| — |
|
|
| — |
|
|
| — |
|
|
| (2,909 | ) |
Net income |
|
| 87,066 |
|
|
| 87,066 |
|
|
|
|
|
|
|
|
|
|
|
|
|
|
|
|
|
|
|
|
|
Balance at December 31, 2016 |
| $ | 97,537 |
|
| $ | (969 | ) |
| $ | — |
|
| $ | 2 |
|
| $ | 98,504 |
|
|
| 15,152,531 |
|
| $ | — |
|
See Accompanyingaccompanying Notes to Consolidated Financial Statements.
GAIAM, INC.
Consolidated Statements of Cash Flows
| Years ended December 31, | ||||||||||||
(in thousands) | 2014 | 2013 (a) | 2012 (b) | |||||||||
Operating activities: | ||||||||||||
Net loss | $ | (8,957 | ) | $ | (22,093 | ) | $ | (12,577 | ) | |||
Loss (income) from discontinued operations | 3,327 | 1,995 | (6,648 | ) | ||||||||
|
|
|
|
|
| |||||||
Net loss from continuing operations | (5,630 | ) | (20,098 | ) | (19,225 | ) | ||||||
Adjustments to reconcile net loss from continuing operations to net cash (used in) provided by operating activities: | ||||||||||||
Depreciation | 1,989 | 2,301 | 2,107 | |||||||||
Amortization | 2,223 | 1,659 | 1,946 | |||||||||
Share-based compensation expense | 839 | 809 | 913 | |||||||||
Deferred income tax expense (benefit) | 28 | 23,861 | (6,120 | ) | ||||||||
Loss (gain) on translation of foreign currency | 564 | 42 | (76 | ) | ||||||||
Gain on sale of investments | (1,480 | ) | (25,096 | ) | — | |||||||
Loss on equity method investment | 55 | — | 18,410 | |||||||||
Gain from collection of note receivable | — | (2,300 | ) | — | ||||||||
Impairment and other losses | — | 9,194 | — | |||||||||
Changes in operating assets and liabilities, net of effects from acquisitions and dispositions: | ||||||||||||
Accounts receivable, net | (3,872 | ) | (2,072 | ) | (3,628 | ) | ||||||
Inventory, net | 56 | 1,097 | 1,645 | |||||||||
Deferred advertising costs | (250 | ) | 508 | 42 | ||||||||
Advances | (1,514 | ) | (44 | ) | 2,847 | |||||||
Other current assets | (2,425 | ) | (2,843 | ) | (6,228 | ) | ||||||
Accounts payable | 5,535 | (4,407 | ) | 1,463 | ||||||||
Participations payable | (3,539 | ) | 1,045 | (4,674 | ) | |||||||
Accrued liabilities | (1,406 | ) | 789 | 9,472 | ||||||||
|
|
|
|
|
| |||||||
Net cash used in operating activities – continuing operations | (8,827 | ) | (15,555 | ) | (1,106 | ) | ||||||
Net cash (used in) provided by operating activities – discontinued operations | (142 | ) | (7,569 | ) | 17,582 | |||||||
|
|
|
|
|
| |||||||
Net cash (used in) provided by operating activities | (8,969 | ) | (23,124 | ) | 16,476 | |||||||
|
|
|
|
|
| |||||||
Investing activities: | ||||||||||||
Net proceeds from the sale of investments | 2,646 | 25,096 | — | |||||||||
Collection from (loan to) related party | — | 2,100 | (830 | ) | ||||||||
Purchase of property, equipment and media rights | (5,590 | ) | (3,386 | ) | (3,723 | ) | ||||||
Proceeds from sale of business | — | 47,500 | — | |||||||||
Purchase of businesses and equity-method investments, net of cash acquired | (5,493 | ) | (6,333 | ) | (146 | ) | ||||||
|
|
|
|
|
| |||||||
Net cash (used in) provided by investing activities – continuing operations | (8,437 | ) | 64,977 | (4,699 | ) | |||||||
Net cash used in investing activities – discontinued operations | — | — | (13,491 | ) | ||||||||
|
|
|
|
|
| |||||||
Net cash (used in) provided by investing activities | (8,437 | ) | 64,977 | (18,190 | ) | |||||||
|
|
|
|
|
| |||||||
Financing activities: | ||||||||||||
Net proceeds from issuance of stock | 1,806 | 777 | — | |||||||||
Payment of dividends | (150 | ) | — | (583 | ) | |||||||
|
|
|
|
|
| |||||||
Net cash provided by (used in) financing activities – continuing operations | 1,656 | 777 | (583 | ) | ||||||||
Net cash used in financing activities – discontinued operations | — | (19,967 | ) | (2,472 | ) | |||||||
|
|
|
|
|
| |||||||
Net cash provided by (used in) financing activities | 1,656 | (19,190 | ) | (3,055 | ) | |||||||
|
|
|
|
|
| |||||||
Effect of exchange rates on cash | (707 | ) | (292 | ) | 82 | |||||||
Net (decrease) increase in cash | (16,457 | ) | 22,371 | (4,687 | ) | |||||||
Cash at beginning of year | 32,229 | 9,858 | 14,545 | |||||||||
|
|
|
|
|
| |||||||
Cash at end of year | $ | 15,772 | $ | 32,229 | $ | 9,858 | ||||||
|
|
|
|
|
| |||||||
Supplemental cash flow information: | ||||||||||||
Interest paid | $ | 14 | $ | 442 | $ | 468 | ||||||
Income taxes paid | 1,114 | 577 | 673 | |||||||||
Liabilities and debt assumed from acquisitions | 466 | 337 | 14,277 | |||||||||
Stock issued in connection with business acquisitions | $ | 840 | $ | 7,303 | $ | — | ||||||
|
| Years ended December 31, |
| |||||||||
(in thousands) |
| 2016 |
|
| 2015 |
|
| 2014 |
| |||
Operating activities: |
|
|
|
|
|
|
|
|
|
|
|
|
Net income (loss) |
| $ | 87,066 |
|
| $ | (11,706 | ) |
| $ | (9,916 | ) |
(Income) loss from discontinued operations |
|
| (97,848 | ) |
|
| 2,687 |
|
|
| 70 |
|
Net loss from continuing operations |
|
| (10,782 | ) |
|
| (9,019 | ) |
|
| (9,846 | ) |
Adjustments to reconcile net loss from continuing operations to net cash used in operating activities: |
|
|
|
|
|
|
|
|
|
|
|
|
Depreciation and amortization |
|
| 3,684 |
|
|
| 3,268 |
|
|
| 3,165 |
|
Loss on remeasurement of foreign currency |
|
| — |
|
|
| 408 |
|
|
| 564 |
|
Share-based compensation expense |
|
| 674 |
|
|
| 339 |
|
|
| 280 |
|
Changes in operating assets and liabilities: |
|
|
|
|
|
|
|
|
|
|
|
|
Accounts receivable, net |
|
| (161 | ) |
|
| (236 | ) |
|
| (98 | ) |
Prepaid expenses and other assets |
|
| (279 | ) |
|
| 395 |
|
|
| 1,007 |
|
Accounts payable and accrued liabilities |
|
| (172 | ) |
|
| 421 |
|
|
| (1,531 | ) |
Deferred revenue |
|
| 980 |
|
|
| 637 |
|
|
| 595 |
|
Net cash used in operating activities – continuing operations |
|
| (6,056 | ) |
|
| (3,787 | ) |
|
| (5,864 | ) |
Net cash provided by (used in) operating activities – discontinued operations |
|
| (9,326 | ) |
|
| 11,388 |
|
|
| 15,652 |
|
Net cash provided by (used in) operating activities |
|
| (15,382 | ) |
|
| 7,601 |
|
|
| 9,788 |
|
Investing activities: |
|
|
|
|
|
|
|
|
|
|
|
|
Additions to property, equipment and media library |
|
| (6,594 | ) |
|
| (6,380 | ) |
|
| (4,413 | ) |
Purchase of investment |
|
| (10,000 | ) |
|
| — |
|
|
| — |
|
Proceeds from sale of investments |
|
| — |
|
|
| — |
|
|
| 2,646 |
|
Proceeds from the sale of Gaiam Brand business, net |
|
| 162,127 |
|
|
| — |
|
|
| — |
|
Net cash provided by (used in) investing activities—continuing operations |
|
| 145,533 |
|
|
| (6,380 | ) |
|
| (1,767 | ) |
Net cash used in investing activities—discontinued operations |
|
| (319 | ) |
|
| (2,955 | ) |
|
| (6,670 | ) |
Net cash provided by (used in) investing activities |
|
| 145,214 |
|
|
| (9,335 | ) |
|
| (8,437 | ) |
Financing activities: |
|
|
|
|
|
|
|
|
|
|
|
|
Net proceeds from issuance of stock |
|
| 1,041 |
|
|
| 160 |
|
|
| 1,806 |
|
Repurchases of stock |
|
| (76,168 | ) |
|
| — |
|
|
| — |
|
Drawdowns on line of credit |
|
| 3,000 |
|
|
| — |
|
|
| — |
|
Repayments on line of credit |
|
| (3,000 | ) |
|
| — |
|
|
| — |
|
Dividends paid to noncontrolling interest |
|
| (1,944 | ) |
|
| (486 | ) |
|
| (150 | ) |
Net cash (used in) provided by financing activities |
|
| (77,071 | ) |
|
| (326 | ) |
|
| 1,656 |
|
Effect of exchange rates on cash |
|
| — |
|
|
| (495 | ) |
|
| (707 | ) |
Net increase (decrease) in cash |
|
| 52,761 |
|
|
| (2,555 | ) |
|
| 2,300 |
|
Cash at beginning of year |
|
| 1,266 |
|
|
| 3,821 |
|
|
| 1,521 |
|
Cash at end of year |
| $ | 54,027 |
|
| $ | 1,266 |
|
| $ | 3,821 |
|
Supplemental cash flow information |
|
|
|
|
|
|
|
|
|
|
|
|
Interest paid |
| $ | — |
|
| $ | 4 |
|
| $ | 14 |
|
Income taxes paid |
| $ | 2,430 |
|
| $ | 1,322 |
|
| $ | 1,114 |
|
Deferred tax asset impact on APIC |
| $ | 763 |
|
| $ | — |
|
| $ | — |
|
See Accompanyingaccompanying Notes to Consolidated Financial Statements.
Notes to Consolidated Financial Statements
References in this report to “we”, “us”, “our”, “Company” or “Gaiam”“Gaia” refer to Gaiam,Gaia, Inc. and its consolidated subsidiaries, unless we indicate otherwise.
1. Organization, Nature of Operations, and Principles of Consolidation
Gaia, Inc. (known as Gaiam, Inc. until July 2016), operates a global digital video subscription service and its consolidated subsidiaries (“on-line community that caters to a unique and underserved subscriber base. Our digital content is available to our subscribers on most Internet-connected devices anytime, anywhere commercial free. Through our online Gaia subscription service, our customers have unlimited access to a vast library of inspiring films, cutting edge documentaries, interviews, yoga classes, transformation related content, and more – 90% of which is exclusively available to our subscribers for digital streaming. A subscription also allows our subscribers to download and view files from our library without being actively connected to the Company”) provide a broad selection of yoga, fitness, and well-being products, with media, subscription and travel services to customers who value personal development, wellness, ecological lifestyles, responsible media, and conscious community.Internet. We were incorporated under the laws of the State of Colorado on July 7, 1988.
We have prepared the accompanying consolidated financial statements in accordance with accounting principles generally accepted in the United States, or GAAP, and they include our accounts and those of our subsidiaries, over which we exercise control. Intercompany transactions and balances have been eliminated.
Discontinued Operations
During 2013, we2016, Gaia sold our non-Gaiam-branded entertainment media distribution operationits 51.4% interest in Natural Habitat, Inc. (“Natural Habitat”) and discontinued our DRTV operations. completed the sale of the Gaiam Brand consumer product business.
Accordingly, the assets and liabilities, operating results, and cash flows for these businesses are presented as discontinued operations, separate from our continuing operations, for all periods presented in these consolidated financial statements and footnotes, unless indicated otherwise. See Note 15.11 Discontinued Operations.
Prior to the sale of our interest in Natural Habitat, our operations in foreign countries exposed us to market risk associated with foreign currency exchange rate fluctuations between the U.S. dollar and various foreign currencies. We used derivative instruments to manage a portion of our exposure to changes in currency exchange rates due to payments made by our eco-travel subsidiary to tour operators in other countries. Our primary objective for entering into currency derivatives was to reduce the volatility that changes in currency exchange rates had. We did not enter into derivative contracts for trading purposes. With the sale of our interests in Natural Habitat, we no longer use derivative instruments.
Prior to our sale of our interest in Natural Habitat and the Gaiam Brand consumer product business, certain of our subsidiaries were partly owned by others and we accounted for minority shareholders’ ownership through non-controlling interest in our consolidated financial statements. These non-controlling interests were assumed by the new owners of the respective entities. We therefore no longer have any minority shareholders that require non-controlling interests in our consolidated financial statements.
During 2016, 2015, and 2014, Natural Habitat paid its shareholders dividends of $4.0 million, $1.0 million, and $0.3 million, respectively, and, as a result, the non-controlling interests decreased by $1.9 million $0.5 million and $0.2 million, respectively. The amount of these non-controlling interests are reflected in (Loss) income from discontinued operations, net of tax.
Repurchases
We announced a tender offer on May 10, 2016 to purchase in cash up to an aggregate of 12.0 million (i) shares of our issued and outstanding Class A Common Stock at a price of $7.75 per share, or (ii) vested and exercisable options to purchase shares of our Class A Common Stock at a price equal to $7.75 per option (less the exercise price of the option). A total of 9,636,848 shares and 842,114 options were validly tendered and not withdrawn prior to July 1, 2016, which was the expiration date of the offer. We made payments of $74.7 million for the shares and $1.4
million for the options. All repurchased shares were retired and all repurchased options were cancelled effective as of July 1, 2016.
2. Significant Accounting Policies
Cash
Cash represents on-demand accounts with financial institutions that are denominated in U.S. dollars and foreign currencies. At each balance sheet date, cash on hand that is denominateddollars. We consider investments in a foreign currency is adjusted to reflect the exchange rate that existed at the balance sheet date. The difference is reported as a gainfinancial instruments purchased with an original maturity of 90 days or loss in our statement of operations each period. Historically, such gains or losses have been immaterial.
Concentration of Risk and Allowances for Doubtful Accounts
We have a concentration of credit risk in our accounts receivable because our top customer, Target, accounted for 44.1% and 43.6% of accounts receivable, net as of December 31, 2014 and 2013, respectively. Target is a major retailer in the United States to which we make significant sales during the year-end holiday season.
We maintain allowances for doubtful accounts for estimated losses resulting from the inability of our customers to make required payments. We make estimates of the collectability of our accounts receivable by analyzing historical bad debts, specific customer creditworthiness, and current economic trends. The allowance for doubtful accounts was $0.4 million and $0.6 million as of December 31, 2014 and 2013, respectively. If the financial condition of our customers were to deteriorate such that their ability to make payments to us was impaired, additional allowances could be required.
Product Returns
We record allowances for product returnsless to be received in future periods at the time we recognize the original sale.cash equivalents. We base the amounts of the returns allowances upon historical experience and future expectations. Our allowance for product returns was $0.8 million and $1.6 million as of December 31, 2014 and 2013, respectively.
Inventory
Inventory consists primarily of finished goods held for sale and is stated at the lower of cost (first-in, first-out method) or market. We identify the inventory items to be written down for obsolescence based on the item’s current sales status and condition. We write down discontinued or slow moving inventories based on an estimate of the markdown required to sell off the inventory. As of December 31, 2014 and 2013, we estimated obsolete or slow-moving inventory to be $1.2 million and $2.1 million, respectively.
Advertising Costs
Deferred advertising costs relate to the preparation, printing, advertising and distribution of catalogs. We defer such costs for financial reporting purposes until the catalogs are distributed, and then we amortize these costs over succeeding periods on the basis of estimated direct relationship sales. We amortize our seasonal catalogs within six months. Forecasted sales are the principal factor we use in estimating the amortization rate. We expense other advertising and promotional costs as incurred. Amounts recorded as advertising expense were $16.4 million, $15.3 million, and $13.6 million for the years ended December 31, 2014, 2013, and 2012, respectively, and we include thesealso classify amounts in sellingtransit from payment processors for customer credit card and operating expense. As we have announced the intention to significantly reduce production of catalogs in 2015, we expect future deferred advertising costs to be minimal.
We record sales discounts or other sales incentives as a reduction to revenue. We identify and record any cooperative advertising expenses we pay, which are for advertisements meeting the separable benefit and fair value tests, as part of selling and operating expense.
Property and Equipment
We state property and equipment at cost less accumulated depreciation and amortization. We include in property and equipment the cost of internal-use software, including software used in connection with our websites. We expense all costs related to the development of internal-use software other than those incurred during the application development stage. We capitalize the costs we incur during the application development stage and amortize them over the estimated useful life of the software, which is typically three years. We compute depreciation of property and equipment on the straight-line method over estimated useful lives, generally three3 to forty-five45 years. We amortize leasehold and building improvements over the shorter of the estimated useful lives of the assets or the remaining term of the lease or remaining life of the building, respectively. Depreciation expense is included in Selling and operating expense, and Corporate, general and administration expense in the accompanying statements of operations.
Investments
We account for investments in equity securities that have readily determinable fair values that are not trading securities as available-for-sale securities. Unrealized changes in the fair value of an available-for-sale security are reported in accumulated other comprehensive income, net of tax, until disposed of or determined to be other-than-temporarily impaired, at which time the realized changes are reported in our statement of operations.
Purchase Accounting
We account for the attainment of a controlling interest in a business using the acquisition method. In determining the estimated fair value of certain acquired assets and liabilities, we make assumptions based upon many different factors, such as historical and other relevant information and analyses performed by independent parties. Assumptions may be incomplete, and unanticipated events and circumstances may occur that could affect the validity of such assumptions, estimates, or actual results.
Media Library
Our mediaMedia library asset represents the fair value of libraries of media acquired through business combinations, the purchase price of media rights to both video and audio titles, and the capitalized cost to produce media products, all of which we market to retailers and to e-commerce and subscription customers. Our media library is shown in the accompanying balance sheets net of accumulated amortization of $14.5 million and $13.6 million at December 31, 2014 and 2013, respectively, and is amortized over the estimated useful lives of the titles, which range from five to fifteen years.
Capitalized media library production costs consist of costs incurred to produce the media content, net of accumulated amortization. We recognize these costs, as well as participation costs, as expenses on an individual title basis equal to the ratio that the current year’s gross revenues bear to our estimate of total ultimate gross revenues from all sources to be earned over a maximum seven-year period. We state capitalized production costs at the lower of unamortized cost or net realizable value of digital media content acquired through asset purchases, capitalized costs to produce our proprietary media content including salary and overhead costs of our in-house production team, rights obtained through license arrangements and business combinations.
We amortize our media library in cost of streaming on a straight-line basis over the shorter of the license period or the estimated fair valueuseful life of the titles, which typically ranges from 12 to 90 months. The amortization period begins with the first month of availability on our service.
Our media library is reviewed for impairment when an individual title basis. We continually review revenue forecasts, based primarily on historical sales statistics, and revise these forecasts when warranted by changing conditions. When estimates of total revenues and other eventsevent or changeschange in circumstances indicateindicates that the carrying amount of the media library may not be recoverable. Recoverability of the media library is measured by a title has ancomparison of the carrying amount of the media library to estimated fair value that is less thanundiscounted future cash flows expected to be generated by the media library. If the carrying amount of the media library exceeds its unamortized cost, we recognizeestimated future cash flows, an impairment loss in the current period forcharge is recognized by the amount by which the unamortized costcarrying value of the media library exceeds the title’s estimatedits fair value.
During 2014, capitalized production cost for released titles was approximately $2.0 million, and for those titles not yet released was $0.5 million. Additionally, as of December 31, 2014, we estimate that approximately $2.4 million or 42.8% of the unamortized costs for released titles will be amortized during 2015, and approximately 84.5% of the unamortized costs for released titles will be amortized within the next three years. Amortization expense for capitalized produced media content is shown in the table below.
Our acquired media rights have $1.6 million of remaining unamortized costs as of December 31, 2014 that will be amortized on a straight-line basis over 12 to 84 months. Amortization expense for acquired media rights is shown in the table below.
| For the Years Ended December 31, | ||||||||||||
(in thousands) | 2014 | 2013 | 2012 | |||||||||
Capitalized produced media content | $ | 767 | $ | 788 | $ | 900 | ||||||
Acquired media rights | 254 | 553 | 772 | |||||||||
|
|
|
|
|
| |||||||
Total media amortization expense | $ | 1,021 | $ | 1,341 | $ | 1,672 | ||||||
|
|
|
|
|
| |||||||
Based on total media library costs at December 31, 2014 and assuming no subsequent impairment of the underlying assets or a material increase in the video productions or media acquired, we expect the amortization expense for the next five years to be approximately $1.0 million per annum. Additionally, during 2015 we anticipate incurring approximately $2.5 million in royalties related to acquired and produced media content.
Goodwill and Other Intangibles
Goodwill represents the excess of the purchase consideration over the estimated fair value of assets acquired less liabilities assumed in a business acquisition. Our other intangibles consist of customer related assets.We have only one reporting unit; therefore, goodwill is assessed at the enterprise level. We review goodwill for impairment annually or more frequently if impairment indicators arise on a goodwill reporting unit level.December 31. We have the option of first assessing qualitative factors to determine whether events and circumstances indicate that it is more likely than not that the fair value of a goodwill reporting unit is less than its carrying amount. If it is determined that the estimated fair value for aof goodwill reporting unit is more likely than not greater than the carrying amount for thatof goodwill, reporting unit, then the two-step impairment test is unnecessary. If it is determined that the two-step impairment test is necessary, then for step one, we compare the estimated fair value of a goodwill reporting unit with its carrying amount, including goodwill. If the estimated fair value of a goodwill reporting unit exceeds its carrying amount, we consider the goodwill of the reporting unit not impaired. If the carrying amount of a goodwill reporting unit exceeds its estimated fair value, we perform the second step of the goodwill impairment test to measure the amount of impairment loss. We use either a comparable market approach or a traditional present value method to test for potential impairment. The process of evaluating the potential impairment of goodwill is highly subjective and requires significant judgment at many points during the analysis. Application of alternative assumptions and
definitions could yield significantly different results. During 2016, 2015 and 2014, no impairment of goodwill was indicated.
Long-Lived Assets
We evaluate the carrying value of long-lived assets held and used, other than goodwill, when events or changes in circumstances indicate the carrying value may not be recoverable. We consider the carrying value of a long-lived asset impaired when the total projected undiscounted cash flows from such asset are separately identifiable and are less than the carrying value. We recognize a loss based on the amount by which the carrying value exceeds the estimated fair value of the long-lived asset. We determine the estimated fair value primarily using the projected cash flows from the asset discounted at a rate commensurate with the risk involved.
Participations Payable
Participations payable represents amounts owed to talent involved with our media productions based on royalty or distribution agreements. Certain agreements include minimum royalty payments. All amounts due under such agreements are accrued at the time the related revenue is During 2016, 2015 and 2014, no impairment of long-lived assets was recognized.
Income Taxes
We provide for income taxes pursuant to the liability method. The liability method requires recognition of deferred income taxes based on temporary differences between financial reporting and income tax bases of assets and liabilities, using current enacted income tax rates and regulations. These differences will result in taxable income or deductions in future years when the reported amount of the asset or liability is recovered or settled, respectively. Considerable judgment is required in determining when these events may occur and whether recovery of an asset, including the utilization of a net operating loss or other carryforward prior to its expiration, is more likely than not. Due to historical losses, we established a full valuation allowance on
Revenue Recognition
Streaming revenues consist primarily of subscription fees paid by our deferred tax assets at the endstreaming customers. DVD subscription and other revenues consist of 2013.
Revenue
subscription fees paid by our DVD customers and rental income from tenant leases. We recognize revenue in our Gaiam Brand segmentrevenues when the goodsfollowing four basic criteria are shippedmet: (i) persuasive evidence of an arrangement exists; (ii) delivery has occurred or services have been rendered; (iii) the seller’s price to the customerbuyer is fixed or determinable; and collection(iv) collectability is either probable or has occurred. The amount of revenue recognized is net of estimated returns and other chargebacks (or channel credits), which are estimated using historical return and credit rates. If the actual amount of returns and chargebacks were to vary significantly from our estimates, it could materially impact our results of operations in subsequent periods.reasonably assured. We recognize amounts billed to customers for postage and handling as revenuerevenues at the same time we recognize the revenuerevenues arising from the product sale. Travel revenues are recognized in the period which the trip begins. We recognize revenue in our Gaiam TV segment ratably over the subscription period after collection has occurred. We present revenuerevenues net of taxes collected from customers. Streaming revenues are recognized ratably over the subscription term. Deferred revenues consist of subscription fees collected from customers that have not been earned.
Marketing
Marketing costs consist primarily of advertising expenses, which include promotional activities such as online advertising and public relations expenditures. Advertising costs are expensed as incurred. During 2016, 2015, and 2014 we expensed $13.2 million, $5.5 million, and $4.6 million, respectively.
Share-Based Compensation
We recognize compensation cost for share-based awards based on the estimated fair value of the award on date of grant. We measure compensation cost at the grant date based on the estimated fair value of the award and recognize compensation cost upon the probable attainment of a specified performance condition over the estimated performance period or for time based awards over the service period. We use the Black-Scholes option and intrinsic valuation model to estimate the fair value of the award. In estimating this fair value, we use certain assumptions, as disclosed in Note 11. Share-Based Compensation,8, consisting of the expected life of the option, risk-free interest rate, dividend yield, and volatility. The use of a different estimate for any one of these componentsassumptions could have a material impact on the amount of calculated compensation expense.
Defined Contribution Plan
We have adopted a defined contribution retirement plan under Section 401(k) of the Internal Revenue Code of 1986, as amended (“Internal Revenue Code”), which covers substantially all employees. Eligible employees may contribute amounts to the plan, via payroll withholding, subject to certain limitations. The 401(k) plan permits, but
does not require, us to make additional matching contributions to the 401(k) plan on behalf of all participants in the 401(k) plan. We match 50% of an employee’s contribution, up to an annual maximum matching contribution of $1,500. We made matching contributions to the 401(k) plan of $0.2 million, $0.3 million,$82,000, $56,000, and $0.2 million$42,000 in each of the years ended December 31, 2014, 2013,2016, 2015, and 2012,2014, respectively.
Foreign Currency TranslationFair Value Measurements
Our foreign subsidiaries use their local currency as their functional currency. We translate assetsFair value represents the price that would be received to sell an asset or paid to transfer a liability (an exit price) in the principal or most advantageous market for the asset or liability in an orderly transaction between market participants on the measurement date. Assets and liabilities into U.S. dollars at exchange ratesare valued based upon observable and non-observable inputs. Valuations using Level 1 inputs are based on unadjusted quoted prices that are available in effectactive markets for the identical assets or liabilities at the balance sheetmeasurement date. We translate income and expense accountsLevel 2 inputs utilize significant other observable inputs available at the average monthly exchange rates duringmeasurement date, other than quoted prices included in Level 1, either directly or indirectly; and valuations using Level 3 inputs are based on significant unobservable inputs that cannot be corroborated by observable market data and reflect the year. We record resulting translation adjustments, netuse of income taxes, as a separate component of accumulated other comprehensive income.
Comprehensive Income (Loss)
Our comprehensive income (loss) is comprisedsignificant management judgment. The carrying amounts of our net income (loss), noncontrolling interest net income (loss), foreign currency translation adjustments, net of tax,cash, accounts receivable, accounts payable and unrealized changes in theother current liabilities approximate their fair value of an equity security, net of tax.values.
The tax effects allocated to our accumulated other comprehensive income (loss) components were as follows:
| For the Years Ended December 31, | ||||||||||||
(in thousands) | 2014 | 2013 | 2012 | |||||||||
Before-tax amount | $ | (268 | ) | $ | (262 | ) | $ | 14 | ||||
Tax expense (benefit) | (89 | ) | (86 | ) | 4 | |||||||
|
|
|
|
|
| |||||||
Net-of-tax amount | $ | (179 | ) | $ | (176 | ) | $ | 10 | ||||
|
|
|
|
|
| |||||||
Net Income (Loss) Per Share Attributable To Gaiam, Inc. Common Shareholders
Basic net income (loss) per share attributable to Gaiam, Inc. common shareholders excludes any dilutive effects of options.outstanding stock awards. We compute basic net income (loss) per share attributable to Gaiam, Inc. common shareholders using the weighted average number of shares of common sharesstock outstanding during the period. We compute diluted net income (loss) per share attributable to Gaiam, Inc. common shareholders using the weighted average number of shares of common sharesstock and common stock equivalents outstanding during the period. We excluded weighted average common stock equivalents of 725,000, 1,440,000910,000, 954,000, and 1,387,000725,000 from the computation of diluted net income (loss) per share attributable to Gaiam, Inc. common shareholders for 2014, 20132016, 2015 and 2012,2014, respectively, because their effect was antidilutive.
Investments
The following table sets forth the computation of basicOur cost method investments are carried at cost and diluted net (loss) income per share attributable to Gaiam, Inc. common shareholders:adjusted for other-than-temporary declines in fair value.
| For the Years Ended December 31, | ||||||||||||
(in thousands, except per share data) | 2014 | 2013 | 2012 | |||||||||
Net (loss) income attributable to Gaiam, Inc. common shareholders: | ||||||||||||
(Loss) income from continuing operations | $ | (6,589 | ) | $ | (20,757 | ) | $ | (19,530 | ) | |||
(Loss) income from discontinued operations | (3,327 | ) | (1,995 | ) | 6,648 | |||||||
|
|
|
|
|
| |||||||
Net loss attributable to Gaiam, Inc. | $ | (9,916 | ) | $ | (22,752 | ) | $ | (12,882 | ) | |||
|
|
|
|
|
| |||||||
Weighted average shares for basic and diluted net (loss) income per share | 24,228 | 22,972 | 22,703 | |||||||||
|
|
|
|
|
| |||||||
Net (loss) income per share attributable to Gaiam, Inc. common shareholders—basic and diluted: | ||||||||||||
Loss from continuing operations | $ | (0.27 | ) | $ | (0.90 | ) | $ | (0.86 | ) | |||
(Loss) income from discontinued operations | (0.14 | ) | (0.09 | ) | 0.29 | |||||||
|
|
|
|
|
| |||||||
Basic and diluted net loss per share attributable to Gaiam, Inc. | $ | (0.41 | ) | $ | (0.99 | ) | $ | (0.57 | ) | |||
|
|
|
|
|
| |||||||
Fair Value of Financial Instruments
The carrying amounts ofWe evaluate our cashinvestments for impairments annually and cash equivalents, accounts receivable, accounts payable and other current liabilities approximate their fair values.
Recently Issued Accounting Pronouncements
In April of 2014, the Financial Accounting Standards Board (“FASB”) issued Accounting Standards Update (ASU) No. 2014-08,Presentation of Financial Statements (Topic 205) and Property, Plant, and Equipment (Topic 360): Reporting Discontinued Operations and Disclosures of Disposals of Components of an Entity. The amendmentswhen factors indicate that a significant decrease in the ASU change the criteria for reporting discontinued operations and expand the related disclosures. Under the new guidance, only disposals representing a strategic shiftvalue has occurred. Variables considered in operations are presented as discontinued operations. The new guidance also requires disclosuremaking such assessments may include near-term prospects of the pre-tax income attributable to a disposal of a significant part ofinvestees and the investees’ capital structure, as well as other economic variables which reflect assumptions market participants may use in pricing these assets. If an organization that does not qualify for discontinued operations reporting. The ASU requires prospective adoption andinvestment is effective for us in the first quarter of 2015. The new ASU is not expecteddeemed to have experienced an other-than-temporary decline below its cost basis, we reduce the carrying amount of the investment to its quoted or estimated fair value, as applicable, and establish a material impactnew cost basis for the investment. The Company did not record any impairment charges on our reported financial positioncost method investments during the years 2016, 2015, or results of operations.2014.
In May of 2014, the Financial Accounting Standards Board (“FASB”) issued ASU No. 2014-09,Revenue from Contracts with Customers (Topic 606)(“ASU 2014-09”).The new standard supersedes most previously existing revenue recognition rules, and will become effective for us in the first quarter of 2017. The core principle of the guidance is that an entity should recognize revenue to depict the transfer of promised goods or services to customers in an amount that reflects the consideration to which the entity expects to be entitled in exchange for those goods or services. Our revenue transactions typically consist of one, distinct, fixed-price performance obligation which is delivered to the customer at a single point in time, or over a subscription period. While we are still assessing the full impact of the new standard, we do not expect that it will have a material impact on our reported financial position or results of operations.
Use of Estimates and Reclassifications
The preparation of financial statements in accordance with GAAP requires us to make estimates and assumptions that affect the amounts reported in the accompanying financial statements and disclosures. Although we base these estimates on our best knowledge of current events and actions that we may undertake in the future, actual results may be different from the estimates. We have made certain reclassifications to prior period amounts to conform to the current period presentations.
Accounting Pronouncements Adopted in 2016
The Financial Accounting Standards Board (“FASB”) has issued Accounting Standards Update (“ASU”) No. 2015-17, Income Taxes - Balance Sheet Classification of Deferred Taxes (Topic 740). The amendments under the new guidance require that deferred tax liabilities and assets be classified as noncurrent in a classified statement of financial position. The guidance is effective for consolidated financial statements issued for annual periods beginning after December 15, 2016, and interim periods within those annual periods. Earlier application is permitted for all entities as of the beginning of an interim or annual reporting period. We adopted this guidance effective April 1, 2016, and it did not have a material impact on our reported financial position or results of operations.
3. Related Party TransactionsRecently Issued Accounting Pronouncements
Real Goods Solar, Inc. (“RGSE”) wasIn February 2016, the FASB issued ASU No. 2016-02, Leases (Topic 842). The new standard establishes a divisionright-of-use (ROU) model that requires a lessee to record a ROU asset and a lease liability on the balance sheet for all leases with terms longer than 12 months. Leases will be classified as either finance or operating, with classification affecting the pattern of expense recognition in the income statement. The new standard is effective for fiscal years beginning after December 15, 2018, including interim periods within those fiscal years. A modified retrospective transition approach is required for lessees for capital and operating leases existing at, or entered into after, the beginning of the earliest comparative period presented in the financial statements, with certain practical expedients available. Our preliminary assessment is that we do not expect the new standard to have a material impact on our company, until it was spun offreported financial position or results of operations.
In May 2014, the FASB issued ASU No. 2014-09, Revenue from Contracts with Customers (Topic 606). The new standard supersedes most previous revenue recognition rules, and will become effective for us in the first quarter of 2018. The core principle of the guidance is that an entity should recognize revenue to depict the transfer of promised goods or services to customers in an initial public offeringamount that reflects the consideration to which the entity expects in 2008. Onexchange for those goods or services. Our revenue transactions typically consist of one distinct, fixed-price performance obligation which is delivered to the customer at a single point in time, or over a subscription period. We are monitoring the evolving interpretations and implementation guidance. Our preliminary assessment is that we do not expect the new standard to have a material impact on our reported financial position or results of operations.
In March 2016, the FASB issued ASU No. 2016-09, Improvements to Employee Share-Based Payment Accounting, which amends Topic 718, Compensation – Stock Compensation. ASU No. 2016-09 simplifies several aspects of the accounting for share-based payment transactions, including the income tax consequences, classification of awards as either equity or liabilities, and classification on the statement of cash flows. ASU No. 2016-09 is effective for fiscal years beginning after December 31, 2011, we converted our RGSE Class B common shares, which had ten votes per share, to RGSE Class A common shares, which have one vote per share. As a result15, 2016, and interim periods within those fiscal years. We will adopt ASU No. 2016-09 in the first quarter of this conversion, our voting ownership decreased to approximately 37.5%2017 and thus, we no longer had financial controlthe impact of RGSE. Accordingly, we deconsolidated RGSE and reported it as an equity method investmentadoption of the ASU on our consolidated statement of operations for year ended December 31, 2012.financial statements will not be material.
At December 31, 2012, we had two loans receivable from RGSE totaling $2.7 million, bearing interest at an annual rate of 10%. The loans had zero carrying value. On April 23, 2013, we agreed to convert $0.1 of the loan balance into 62,111 shares of RGSE’s Class A common stock. On November 5, 2013, we collected $2.1 million in cash from RGSE and $0.2 million of tenant improvements in settlement of the two outstanding loans made. The $2.3 million gain resulting from the collection of these loans is reported in Interest and other income on our consolidated statement of operations for the year ended December 31, 2013.
During 2013, we also sold the majority of our investment in RGSE for total net proceeds of approximately $25 million. Following the sale of the majority of our position in May 2013, our voting ownership percentage declined to below 20% and our Chairman resigned as Chairman of RGSE’s board of directors and, thus, we no longer had significant influence over RGSE. Therefore, we changed our accounting for our investment in RGSE from the equity method to the cost method. From that time forward, we have not reported any portion of RGSE’s net income or loss in our results.
During 2012 we billed RGSE $0.3 million under our Intercorporate Services Agreement. The agreement was terminated and billing ceased after 2012.
Effective January 1, 2012, we entered into an Industrial Building Lease Agreement with RGSE for office space located in our owned building in Colorado. The five year lease commenced on January 1, 2012 and has a monthly payment of approximately $36,000 plus common area maintenance and tax expenses.
As specified by our Tax Sharing Agreement with RGSE, to the extent RGSE becomes entitled to utilize certain loss carryforwards relating to periods prior to its initial public offering, it will distribute to us the tax effect (estimated to be 34% for federal income tax purposes) of the amount of such tax loss carryforwards so utilized. These net operating loss carryforwards expire beginning in 2018 if not utilized, and are subject to IRS limitations. As of December 31, 2014, $4.4 million of these net operating loss carryforwards remained available for current and future utilization, meaning that RGSE’s potential future payments to us, which would be made over a period of several years, could therefore aggregate to approximately $1.6 million based on current tax rates. These tax assets have a full valuation allowance (See Note 13 Income Taxes) based on RGSE’s current financial performance.
4. Other Current Assets
Other current assets consist of the following as of December 31:
(in thousands) | 2014 | 2013 | ||||||
Prepaid travel deposits | $ | 5,216 | $ | 3,880 | ||||
Advances | 2,592 | 1,078 | ||||||
Deferred advertising costs | — | 311 | ||||||
Other current assets | 4,190 | 4,201 | ||||||
|
|
|
| |||||
| $ | 11,998 | $ | 9,470 | |||||
|
|
|
| |||||
5.3. Property and Equipment
Building and Other Assets
Property and equipment,Land, stated at lower of cost or estimated fair value, consists of the following as of December 31:
(in thousands) | 2014 | 2013 | ||||||
Land | $ | 5,603 | $ | 5,603 | ||||
Buildings | 16,809 | 16,637 | ||||||
Furniture, fixtures and equipment | 7,327 | 6,839 | ||||||
Leasehold improvements | 1,622 | 1,622 | ||||||
Website development costs and other software | 11,678 | 9,919 | ||||||
Studios, computer and telephone equipment | 9,293 | 9,182 | ||||||
Warehouse and distribution equipment | 1,765 | 1,765 | ||||||
|
|
|
| |||||
| 54,097 | 51,567 | |||||||
Accumulated depreciation and amortization | (30,866 | ) | (29,027 | ) | ||||
|
|
|
| |||||
| $ | 23,231 | $ | 22,540 | |||||
|
|
|
| |||||
(in thousands) |
| 2016 |
|
| 2015 |
| ||
Land |
| $ | 4,829 |
|
| $ | 4,829 |
|
Building |
|
| 16,874 |
|
|
| 17,699 |
|
|
|
| 21,703 |
|
|
| 22,528 |
|
Accumulated depreciation and amortization |
|
| (4,807 | ) |
|
| (4,742 | ) |
|
| $ | 16,896 |
|
| $ | 17,786 |
|
Other Assets
Software, equipment and media library stated at lower of cost or estimated fair value, consists of the following as of December 31:
(in thousands) | 2014 | 2013 | ||||||
Working capital and related receivables, net (See Note 8) | $ | 7,250 | $ | 6,875 | ||||
Other assets | 5,417 | 1,836 | ||||||
|
|
|
| |||||
| $ | 12,667 | $ | 8,711 | |||||
|
|
|
| |||||
(in thousands) |
| 2016 |
|
| 2015 |
| ||
Website development costs and other software |
| $ | 4,421 |
|
| $ | 5,002 |
|
Studio, computer and telephone equipment |
|
| 693 |
|
|
| 435 |
|
Media library |
|
| 11,486 |
|
|
| 10,192 |
|
|
|
| 16,600 |
|
|
| 15,629 |
|
Accumulated depreciation and amortization |
|
| (3,739 | ) |
|
| (3,891 | ) |
|
| $ | 12,861 |
|
| $ | 11,738 |
|
6. Acquisitions
Future depreciation and amortization consists of the following:
Yoga Studio
(in thousands) |
|
|
|
|
2017 |
| $ | 3,985 |
|
2018 |
|
| 3,708 |
|
2019 |
|
| 2,897 |
|
2020 |
|
| 1,965 |
|
2021 |
|
| 1,697 |
|
Thereafter |
|
| 10,676 |
|
|
| $ | 24,928 |
|
4. Investments and Other Assets
In September 2014, our Gaiam Brand segment acquired all the outstanding stock of Modern Lotus Limited (“Yoga Studio”), the number-one-ranked paid yoga app on the U.S. App Store. The aggregate consideration paid by us exceeded the aggregate estimated fair value of the assets acquired and the liabilities assumed by $1.5 million which2016, we have recognized as goodwill. We attribute the goodwill to the recognized market position of the app.
My Yoga Online
In October 2013, our Gaiam TV segment acquired allpurchased 10% of the outstanding common stock and associated voting rights of My Yoga Online, ULC (“My Yoga Online”), an on-line yoga video streaming subscription business in Canada. The aggregate consideration paida privately held Colorado corporation for $10.0 million. We are accounting for this investment using the cost method. As part of our initial investment, we have the right, but not the obligation, to purchase additional shares. If we elect not to utilize our right to purchase additional shares or transfer these rights to another party by us exceeded the aggregate estimated fair valuecertain deadlines, we may be required to surrender and forfeit our existing stock ownership.
Other assets consist of the assets acquired and liabilities assumed by $10.6 million, which we have recognized as goodwill. This goodwill is attributable to the domain expertise of the assembled workforce that has demonstrated an ability to generate new content, subscriber growth and revenues from future subscribers.
The following table sets forth the changes in goodwill for the period December 31, 2012 through December 31, 2014 by segment.
(in thousands) | Gaiam Brand Segment | Gaiam TV Segment | Total | |||||||||
Balance at December 31, 2012 | $ | 2,673 | $ | — | $ | 2,673 | ||||||
Acquisitions | 717 | 10,609 | 11,326 | |||||||||
|
|
|
|
|
| |||||||
Balance at December 31, 2013 | 3,390 | 10,609 | 13,999 | |||||||||
Acquisitions | 1,449 | — | 1,449 | |||||||||
|
|
|
|
|
| |||||||
Balance at December 31, 2014 | $ | 4,839 | $ | 10,609 | $ | 15,448 | ||||||
|
|
|
|
|
| |||||||
The following table represents our intangibles assets by major class as of December 31, 2014 and 2013.31:
| As of December 31, | ||||||||
(in thousands) | 2014 | 2013 | ||||||
Indefinite Lived Intangibles | $ | 340 | $ | — | ||||
|
|
|
| |||||
Intangibles Subject to Amortization | ||||||||
Customer related: | ||||||||
Gross carrying amount | $ | 978 | $ | 1,038 | ||||
Accumulated amortization | (636 | ) | (582 | ) | ||||
|
|
|
| |||||
| $ | 342 | $ | 456 | |||||
|
|
|
| |||||
Marketing related: | ||||||||
Gross carrying amount | $ | 1,588 | $ | 1,436 | ||||
Accumulated amortization | (1,447 | ) | (737 | ) | ||||
|
|
|
| |||||
| $ | 141 | $ | 699 | |||||
|
|
|
| |||||
(in thousands) |
| 2016 |
|
| 2015 |
| ||
Cost method investments |
| $ | 10,000 |
|
| $ | — |
|
Other assets |
|
| 946 |
|
|
| 1,756 |
|
|
| $ | 10,946 |
|
| $ | 1,756 |
|
The amortization periods range from 24 to 60 months. Amortization expense for the years ended December 31, 2014, 2013, and 2012 was $0.7 million, $0.3 million, and $0.2 million, respectively.
7.5. Accounts Payable and Accrued Liabilities
AccruedAccounts payable and accrued liabilities consist of the following as of December 31:
(in thousands) | 2014 | 2013 | ||||||
Accrued compensation | $ | 3,323 | $ | 5,500 | ||||
Customer travel deposits | 11,370 | 8,478 | ||||||
Accrued legal expense and related reserves | 3,000 | — | ||||||
Other accrued liabilities | 2,166 | 3,525 | ||||||
|
|
|
| |||||
| $ | 19,859 | $ | 17,503 | |||||
|
|
|
| |||||
(in thousands) |
| 2016 |
|
| 2015 |
| ||
Accounts payable |
| $ | 2,054 |
|
| $ | 4,187 |
|
Accrued compensation |
|
| 844 |
|
|
| 394 |
|
Accrued expenses |
|
| 3,774 |
|
|
| 1,500 |
|
|
| $ | 6,672 |
|
| $ | 6,081 |
|
Accrued compensation at December 31, 2014 included severance and termination benefits of $1.8 million.
8. Commitments and6. Contingencies
Working Capital Arbitration
On August 13, 2014, Cinedigm Corp. and Cinedigm Entertainment Holdings, LLC (together, “Cinedigm”) initiated an arbitration proceeding with the American Arbitration Association under the Membership Interest Purchase Agreement, dated October 17, 2013, by and among Cinedigm and the Company and one of its subsidiaries (the “MIPA”). Cinedigm’s arbitration demand alleges that the Company owes Cinedigm approximately $12.9 million under the working capital adjustment mechanism included in the MIPA. In addition, Cinedigm has claimed that Gaiam materially breached its representations and warranties under the MIPA, that the Company engaged in fraudulent and tortious acts in connection with the sale, and that the Company breached the terms of other agreements related to the transaction. The aggregate relief requested by Cinedigm exceeds $30.0 million and includes unspecified compensatory damages, attorneys’ fees, costs and interest, and other relief.
The Company believes that Cinedigm’s arbitration claims are without merit and represent a post-closing attempt to renegotiate the MIPA purchase price, and the Company intends to assert its positions vigorously through the legal process. Moreover, the Company believes that if the working capital mechanism is properly applied, Cinedigm owes the Company over $7.0 million, and the Company has initiated an arbitration process against Cinedigm. In addition to its working capital claim, the Company is pursuing a claim of approximately $700,000 against Cinedigm in connection with the Transition Services Agreement executed as part of the MIPA transaction, and is reviewing other claims that it may pursue against Cinedigm. The dispute outcome cannot be predicted at this time.
In view of the inherent difficulty of predicting the outcome of any asserted claim, particularly where large or indeterminate damages are sought, the Company cannot predict the outcome of any pending matter, the timing of ultimate resolution, or the eventual gain or loss (in each case, if any). However, in light of the uncertainty of litigation generally and the uncertainty of collection with regard to any judgment that the Company seeks, as well as the more certain substantial legal fees and costs that the Company expects to expend in the matter (which may continue into 2016), the Company has accrued a litigation-related reserve in the fourth quarter of 2014 of $3.0 million to cover such anticipated expenses and related reserves.
Risks and Uncertainties
From time to time, we are involved in legal proceedings that we consider to be in the normal course of business. Claimed amounts against us may be substantial but may not bear any reasonable relationship to the merits of the claim or the extent of any real risk of court or arbitral awards. We record accruals for losses related to those matters against us that we consider to be probable and that can be reasonably estimated. Although it is not feasible to predict the outcome of these matters with certainty, it is reasonably possible that some legal proceedings may be disposed of or decided unfavorably to us and in excess of the amounts currently accrued. Based on available information, in the opinion of management, settlements, arbitration awards and final judgments, if any, whichthat are considered probable of being rendered against us in litigation or arbitration in existence at December 31, 20142016 and that can be reasonably estimated are either reserved against or would not have a material adverse effect on our financial condition, results of operations or cash flows.
Operating Leases
We lease office and warehouse space through operating leases. Some of the leases have renewal clauses, which range from 3 to 6 years.
The following schedule represents the annual future minimum payments under these commitments, as of December 31, 2014:
(in thousands) | Operating Leases | |||
2015 | $ | 769 | ||
2016 | 299 | |||
2017 | — | |||
|
| |||
Total minimum lease payments | $ | 1,068 | ||
|
| |||
We incurred rent expense of $1.1 million, $1.0 million and $1.0 million for the years ended December 31, 2014, 2013 and 2012, respectively.
Media Distribution Payments
In 2014, we entered into exclusive media distribution agreements which require that we make periodic minimum payments (against future distribution liabilities) through 2017. The following schedule shows the annual future minimum payments under these agreements, as of December 31, 2014:
(in thousands) | Distribution Payments | |||
2015 | $ | 3,350 | ||
2016 | 2,325 | |||
2017 | 300 | |||
|
| |||
Total media distribution payments | $ | 5,975 | ||
|
| |||
Spinoff of Gaiam TV
The potential spinoff of Gaiam TV will have a significant impact on our financial statements if it occurs. See further discussion in Note 17 to our consolidated financial statements.
9.7. Equity
Our common stock has two classes, Class A and Class B. Each holder of our Class A common shares is entitled to one vote for each share held on all matters submitted to a vote of shareholders. Each of our Class B common shares is entitled to ten votes on all matters submitted to a vote of shareholders. There are no cumulative voting rights. All
holders of our Class A common shares and our Class B common shares vote as a single class on all matters that are submitted to the shareholders for a vote.vote, except as provided by law or as set forth in our charter. Shareholders may consent to an action in writing and without a meeting under certain circumstances. Jirka Rysavy, our chairman, holds 100% of our 5,400,000 outstanding shares of class B common stock and also owns 648,682348,682 shares of Class A common stock. Consequently, our chairman holds approximately 75%85% of our voting stock and thus is able to exert substantial influence over us and to control matters requiring approval by our shareholders, including the election of directors, increasing our authorized capital stock, or a merger or sale of substantially all of our assets. As a result of Mr. Rysavy’s control of us, no change of control can occur without Mr. Rysavy’s consent.
Our Class A common shares and our Class B common shares are entitled to receive dividends, if any, as may be declared by theour board of directors out of legally available funds. In the event of a liquidation, dissolution or winding up of our Company, our Class A common shares and our Class B common shares are entitled to share ratably in our assets remaining after the payment of all of our debts and other liabilities. Holders of our Class A common shares and our Class B common shares have no preemptive, subscription or redemption rights, and there are no redemption or sinking fund provisions applicable to our Class A common shares or our Class B common shares.
Our Class B common shares may not be transferred unless converted into our Class A common shares, other than certain transfers to affiliates, family members, and charitable organizations. Our Class B common shares are convertible one-for-one into our Class A common shares, at the option of the holder of the Class B common shares.
During 2014, 20132016, 2015 and 2012,2014, we issued shares of our Class A common stock as shown in the table below under our 2009 Long-Term Incentive Plan.Plan (the “Plan”). We recorded the shares issued to our directors at their estimated fair value based on the market’s closing price of our stock on the date the shares were issued, which by policy is the last trading day of each quarter in which the services were rendered.
| For the Years Ended December 31, | ||||||||||||
| 2014 | 2013 | 2012 | ||||||||||
Shares issued to independent directors for services rendered, in lieu of cash compensation | 19,542 | 49,187 | 32,620 | |||||||||
Shares issued to employees upon exercise of stock options | 354,926 | 160,470 | — | |||||||||
|
| For the Years Ended December 31, |
| |||||||||
|
| 2016 |
|
| 2015 |
|
| 2014 |
| |||
Shares issued to independent directors for services rendered, in lieu of cash compensation |
|
| 18,638 |
|
|
| 16,887 |
|
|
| 19,542 |
|
Shares issued to employees upon exercise of stock options |
|
| 19,060 |
|
|
| 33,825 |
|
|
| 354,926 |
|
On October 11, 2013, we issued 15,759 shares of our Class A common stock under restricted stock award agreements of the same date to certain former members of our board of directors.
As of December 31, 2014,2016, we had the following Class A common shares reserved for future issuance:
Conversion of Class B common shares | 5,400,000 | ||||
Awards under the | |||||
Stock options outstanding | 522,850 | ||||
Restricted stock units outstanding |
|
| 828,344 | ||
Total shares reserved for future issuance | |||||
|
| 6,751,194 |
During May 2013, as a result of a decrease in our voting ownership to less than 20% and the resignation of our chairman from his position as Chairman of the Board for RGSE, we changed the accounting for our investment in RGSE from the equity to cost method. Thus, our consolidated balance sheet data at December 31, 2013 and our consolidated statement of operations data for 2013 after the change report RGSE as a cost method investment.
10. Non-Controlling Interests
We own 51.4% of our eco-travel subsidiary, Natural Habitat Adventures (“Natural Habitat”). The balance is owned by its founder. In addition, some of Natural Habitat’s subsidiaries also have minority shareholders. We own 50.01% of our Australian subsidiary, Gaiam Pty. The amount of these non-controlling interests is reflected separately in our consolidated financial statements, and all intercompany transactions have been eliminated.
During 2014 and 2012, Natural Habitat paid its shareholders dividends of $0.3 million and $1.2 million, respectively, and, as a result, the noncontrolling interests decreased by $0.2 million and $0.6 million, respectively. No dividends were declared or paid by Natural Habitat during 2013.
11.8. Share-Based Compensation
We are currently issuing optionsissue stock based compensation awards under the 2009 Long-Term Incentive Plan (the “Plan”). We previously issued options under the 1999 Long-Term Incentive Plan, which was replaced with the Plan. The purpose of the Plan is to advance our interests and those of our shareholders by providing incentives to certain persons who contribute significantly to our strategic and long-term performance objectives and growth. An aggregate of not more than 3 million of our Class A common shares, subject to certain adjustments, may be issued under the Plan, and the Plan terminates no later than April 23, 2019. The exercise price for our options is generally equal to the closing market price of our stock at the date of the grant, and the options normally vest at 2% per month for the 50 months beginning in the eleventh month after the grant date. Follow on option grants begin vesting in the first month after grant. We recognize the compensation expense related to share-based payment awards on a straight-line basis over the requisite service periods of the awards, which are generally five years for employees, and twofive years for board members. Commencing with options granted during 2012, we extended the exercise period from seven to ten years.
The determination of the estimated fair value of share-based payment awards on the date of grant using the Black-Scholes option-pricing model is affected by our stock price as well as assumptions regarding a number of complex and subjective variables. We derive the expected terms from the historical behavior of participant groupings. We base expected volatilities on the historically realizedhistorical volatility of our stock over the expected term. Our use of historically realized historical
volatilities is based upon the expectation that future volatility over the expected term is not likely to differ significantly from historical results. We base the risk-free interest rate used in the option valuation model on U.S. Treasury zero-coupon issues with remaining terms similar to the expected term on the options. We estimate forfeitures at the time of grant and revise those estimates in subsequent periods if actual forfeitures differ from those estimates. We primarily use historical data by participant groupings to estimate option forfeitures and record share-based compensation expense only for those awards that are expected to vest.
The following are the variables we used in the Black-Scholes option pricing model to determine the estimated grant date fair value for options granted under the Plan for each of the years presented:
| 2014 | 2013 | 2012 |
| 2016 |
|
| 2015 |
|
| 2014 |
| |||||||
Expected volatility | 48% - 59% | 57% - 61% | 59% |
| 36% - 43% |
|
| 34% - 50% |
|
| 48% - 59% |
| ||||||
Weighted-average volatility | 55% | 58% | 59% |
|
| 39% |
|
|
| 43% |
|
|
| 55% |
| |||
Expected dividends | — % | — % | — % |
|
| —% |
|
|
| —% |
|
|
| —% |
| |||
Expected term (in years) | 1.1 - 7.8 | 5.1 - 7.8 | 7.1 |
| .35 - 3.8 |
|
| 0.5 - 5.9 |
|
| 1.1 - 7.8 |
| ||||||
Risk-free rate | 0.14% - 2.37% | 1.33% - 2.32% | 1.36% - 1.61% |
| 0.54% - 1.11% |
|
| 0.26% - 1.73% |
|
| 0.14% - 2.37% |
| ||||||
In 2015, we commenced issuing restricted stock units (RSUs) under the Plan. The RSUs entitle the recipient to receive one share of Class A common stock for each RSU upon vesting. The RSUs vest with cliff vesting in 5 years, provided that the recipient is still an employee or director of Gaia on such date. The RSUs will be automatically forfeited and of no further force and effect if the vesting conditions are not met. The RSUs are generally priced at market price on the grant date. Under the Plan, during 2016, we have issued 828,344 RSUs, none of which are currently exercisable.
We use intrinsic valuation for RSUs, which due to the nature of these awards, is typically market price of our common stock on the date of grant.
The table below presents a summary of option activity under both our plansthe Plan, as of December 31, 2014,2016, and changes during the year then ended:
| Shares | Weighted- Average Exercise Price | Weighted- Average Remaining Contractual Term | Aggregate Intrinsic Value | |||||||||||||
Outstanding at January 1, 2014 | 1,662,450 | $ | 5.65 | |||||||||||||
Granted | 617,500 | 6.54 | ||||||||||||||
Exercised | (354,926 | ) | 5.09 | |||||||||||||
Cancelled or forfeited | (476,340 | ) | 5.64 | |||||||||||||
|
| |||||||||||||||
Outstanding at December 31, 2014 | 1,448,684 | $ | 6.17 | 6.3 | $ | 1,573,978 | ||||||||||
|
|
|
|
|
|
|
| |||||||||
Exercisable at December 31, 2014 | 615,084 | $ | 5.79 | 2.9 | $ | 896,466 | ||||||||||
|
|
|
|
|
|
|
| |||||||||
|
| Shares |
|
| Weighted- Average Exercise Price |
|
| Weighted- Average Remaining Contractual Term (Years) |
|
| Aggregate Intrinsic Value |
| ||||
Outstanding at January 1, 2016 |
|
| 1,478,724 |
|
| $ | 6.16 |
|
|
|
|
|
|
|
|
|
Option grants |
|
| 315,000 |
|
|
| 7.66 |
|
|
|
|
|
|
|
|
|
Restricted stock unit grants |
|
| 828,344 |
|
|
| — |
|
|
|
|
|
|
|
|
|
Exercised options |
|
| (1,032,174 | ) |
|
| 6.01 |
|
|
|
|
|
|
|
|
|
Cancelled or forfeited options |
|
| (238,700 | ) |
|
| 6.42 |
|
|
|
|
|
|
|
|
|
Outstanding at December 31, 2016 |
|
| 1,351,194 |
|
| $ | 2.76 |
|
|
| 6.0 |
|
| $ | 7,958,325 |
|
Exercisable options at December 31, 2016 |
|
| 121,950 |
|
| $ | 6.35 |
|
|
| 7.8 |
|
| $ | 280,553 |
|
During 2014, 2013 and 2012, we extendedThe table below presents our valuation data for the exercise period on the options of certain former board members and key employees and recognized an additional immediate expense of $0.1 million, $0.1 million and $0.1 million, respectively. On October 11, 2013, we issued 15,759 shares of our Class A common stock under restricted stock award agreements to certain former board members. The estimated fair value of these restricted stock awards was $0.1 million and was based on the closing market price of our stock on October 11, 2013. These restricted stock awards vested 100% on April 10, 2014.Plan:
(in thousands, except per share data) |
| 2016 |
|
| 2015 |
|
| 2014 |
| |||
Valuation Data: |
|
|
|
|
|
|
|
|
|
|
|
|
Weighted-average fair value (per share) |
| $ | 4.92 |
|
| $ | 1.86 |
|
| $ | 2.98 |
|
Total stock-based compensation expense |
| $ | 674 |
|
| $ | 339 |
|
| $ | 280 |
|
Total income tax impact on provision |
| $ | 551 |
|
| $ | 281 |
|
| $ | 313 |
|
We issue new shares upon the exercise of options.options and vesting of RSUs, which will occur in 2020 and 2022. We received $1.8approximately $1.0 million, $0.2 million and $0.8$1.8 million in cash from stock options exercised during 20142016, 2015 and 2013, respectively. No options were exercised during 2012. The weighted-average grant-date fair value of options granted during the years 2014, 2013, and 2012 was $ 2.98, $3.14, and $2.39, respectively. The total intrinsic value of options exercised during 2016, 2015, and 2014 and 2013 was $0.9
$1.8 million, $0.1 million, and $0.1$0.9 million, respectively. The total fair value of sharesoptions vested was $1.3 million, $0.9 million, and $0.6 million $0.6 million,during 2016, 2015, and $0.8 million during 2014, 2013, and 2012.2014.
Our share-based compensation cost charged against income was $0.8 million, $0.8 million, and $1.0 million during 2014, 2013, and 2012, respectively, and is included in corporate, general and administration expenses. The total income tax benefit recognized for share-based compensation was $0.3 million, $0.3 million, and $0.4 million for 2014, 2013, and 2012, respectively. As of December 31, 2014,2016, there was $1.6$7.3 million of unrecognized cost related to nonvestednon-vested shared-based compensation arrangements granted under our 2009 and 1999 Long-Term Incentive Plans.the Plan. We expect that cost to be recognized over a weighted-average period of 3.574.29 years.
12. Asset Impairments and Exit Activity Costs
During 2013, as a result of the reorganization and re-focus of our continuing businesses following the discontinuation of our non-Gaiam-branded entertainment media distribution and direct response television marketing operations, we impaired $4.4 million of media libraries and capitalized production costs, $1.5 million of advances, and $1.3 million of property, plant, and equipment, net of accumulated depreciation, and other investments. These noncash impairments reduced the carrying value of assets for our Gaiam Brand segment by $7.2 million. We estimated the fair value of each impaired asset category using a traditional present value technique, relying upon various sources of information for our assumptions, such as estimated future sales, internal budgets and projections, and judgment about the related product’s future earnings potential (level 3 of the fair value hierarchy). We also recorded termination benefits of $2.5 million related to the termination of certain employees associated with our restructuring and future retirement benefits for one of our executive officers. These asset impairment and termination benefit charges were recorded in other general expense on our consolidated statement of operations. Also included in other general expenses on our 2013 consolidated statement of operations are $1.3 million of expenses related to a brand study, recruiting for a new CEO, and other operating expenses that management believes are not ongoing expenses related to the operations of the Company.
Changes in the accrual liability associated with termination benefits were as follows:
Charges | $ | 2,472 | ||
Payments, net | (298 | ) | ||
|
| |||
Balance December 31, 2013 | 2,174 | |||
Payments, net | (308 | ) | ||
Reversals and Adjustments | (101 | ) | ||
|
| |||
Balance December 31, 2014 | $ | 1,765 | ||
|
|
The $1.8 million accrual balance at December 31, 2014 is expected to be paid $0.8 million in 2015, $ 0.5 million in 2016 and $0.5 million in 2017.
13.9. Income Taxes
Our provision for income tax expense (benefit)taxes is comprised of the following:
| For the Years Ended December 31, | ||||||||||||
(in thousands) | 2014 | 2013 | 2012 | |||||||||
Current: | ||||||||||||
Federal | $ | 887 | $ | 536 | $ | 184 | ||||||
State | 157 | (68 | ) | (88 | ) | |||||||
International | 175 | 223 | 196 | |||||||||
|
|
|
|
|
| |||||||
| 1,219 | 691 | 292 | ||||||||||
|
|
|
|
|
| |||||||
Deferred: | ||||||||||||
Federal | — | 22,418 | (5,590 | ) | ||||||||
State | — | 1,538 | (374 | ) | ||||||||
International | — | 73 | (3 | ) | ||||||||
|
|
|
|
|
| |||||||
| — | 24,029 | (5,967 | ) | |||||||||
|
|
|
|
|
| |||||||
Total income tax expense (benefit) | $ | 1,219 | 24,720 | (5,675 | ) | |||||||
|
|
|
|
|
| |||||||
Because our eco-travel subsidiary is not part of the consolidated tax group, the provision includes Federal taxes associated with its income. The state provision consists of the taxes due for subsidiaries of Gaiam which file taxes on a separate basis, and are not able to utilize combined group net operating losses.
The components of our income taxes consisted of the following:
|
| For the Years Ended December 31, |
| |||||||||
(in thousands) |
| 2016 |
|
| 2015 |
|
| 2014 |
| |||
Current: |
|
|
|
|
|
|
|
|
|
|
|
|
Federal |
| $ | — |
|
| $ | — |
|
| $ | — |
|
State |
|
| — |
|
|
| (3 | ) |
|
| — |
|
International |
|
| — |
|
|
| — |
|
|
| — |
|
Total current |
|
| — |
|
|
| (3 | ) |
|
| — |
|
Deferred: |
|
|
|
|
|
|
|
|
|
|
|
|
Federal |
|
| (5,884 | ) |
|
| — |
|
|
| — |
|
State |
|
| (260 | ) |
|
| — |
|
|
| — |
|
International |
|
| — |
|
|
| — |
|
|
| — |
|
Total deferred |
|
| (6,144 | ) |
|
| — |
|
|
| — |
|
Total income tax benefit |
| $ | (6,144 | ) |
| $ | (3 | ) |
| $ | — |
|
(in thousands) | 2014 | 2013 | 2012 | |||||||||
Income tax expense (benefit) from continuing operations | $ | 1,369 | $ | 25,974 | $ | (9,444 | ) | |||||
Income tax (benefit) expense from discontinued operations | (150 | ) | 209 | 3,769 | ||||||||
Income tax benefit from loss on disposal of discontinued operations | — | (1,463 | ) | — | ||||||||
|
|
|
|
|
| |||||||
Total income tax expense (benefit) | $ | 1,219 | 24,720 | (5,675 | ) | |||||||
|
|
|
|
|
| |||||||
Variations from the federal statutory rate are as follows:
(in thousands) | 2014 | 2013 | 2012 | |||||||||
Expected federal income tax (benefit) expense at statutory rate of 34% | $ | (2,631 | ) | $ | 898 | $ | (807 | ) | ||||
Effect of 2008 State NOL’s and option forfeitures | — | 49 | — | |||||||||
Effect of permanent enhanced charitable donation differences | — | — | (31 | ) | ||||||||
Effect of permanent other differences | 37 | 213 | 106 | |||||||||
Effect of change in financial statement carrying value of investment | — | — | (5,077 | ) | ||||||||
State income tax expense (benefit), net of federal benefit | (150 | ) | 24 | (40 | ) | |||||||
Establishment of valuation allowance on net deferred tax assets | 4,071 | 23,153 | — | |||||||||
Other | (70 | ) | 278 | 209 | ||||||||
Effect of differences between U.S. taxation and foreign taxation | (38 | ) | 105 | (35 | ) | |||||||
|
|
|
|
|
| |||||||
Total income tax expense (benefit) | $ | 1,219 | 24,720 | (5,675 | ) | |||||||
|
|
|
|
|
| |||||||
(in thousands) |
| 2016 |
|
| 2015 |
|
| 2014 |
| |||
Expected federal income tax expense (benefit) at statutory rate of 34% |
| $ | (5,755 | ) |
| $ | (3,068 | ) |
| $ | (3,348 | ) |
Effect of permanent other differences |
|
| 212 |
|
|
| 44 |
|
|
| — |
|
Difference in basis for sale of discontinued operations |
|
| (347 | ) |
|
| — |
|
|
| — |
|
State income tax benefit, net of federal benefit tax assets |
|
| (254 | ) |
|
| (135 | ) |
|
| (148 | ) |
Valuation allowance |
|
| — |
|
|
| 3,156 |
|
|
| 3,496 |
|
Total income tax (benefit) expense |
| $ | (6,144 | ) |
| $ | (3 | ) |
| $ | — |
|
Deferred income taxes reflect net tax effects of temporary differences between the carrying amounts of assets and liabilities for financial reporting purposes and the amounts used for income tax purposes. The components of the net accumulated deferred income tax assets (liabilities) as of December 31, 20142016 and 20132015 are as follows:
| December 31, | ||||||||
(in thousands) | 2014 | 2013 | ||||||
Deferred tax assets (liabilities): | ||||||||
Current: | ||||||||
Provision for doubtful accounts | $ | 1,211 | $ | 171 | ||||
Inventory-related expense | 483 | 950 | ||||||
Accrued liabilities | 2,641 | 3,341 | ||||||
Net operating loss carryforward | — | 820 | ||||||
Worthless stock deduction | 206 | 3,055 | ||||||
Prepaid and deferred catalog costs | — | (103 | ) | |||||
Other | 263 | 35 | ||||||
Exit activity accruals | — | 1,603 | ||||||
|
|
|
| |||||
Total current deferred tax assets | 4,804 | 9,872 | ||||||
Valuation allowance | (4,804 | ) | (9,872 | ) | ||||
|
|
|
| |||||
Total current deferred tax assets, net of valuation allowance | $ | — | $ | — | ||||
|
|
|
| |||||
Non-current: | ||||||||
Depreciation and amortization | $ | (1,506 | ) | $ | (825 | ) | ||
Section 181 qualified production expense | (2,770 | ) | (850 | ) | ||||
Net operating loss carryforward | 26,966 | 15,297 | ||||||
Charitable carryforward | 1,414 | 1,567 | ||||||
Loss (gain) from change in financial statement carrying value of investment, net | 48 | 55 | ||||||
Gain from foreign business acquisition | (347 | ) | (347 | ) | ||||
Impairment of intangibles | 367 | — | ||||||
Tax credits | 921 | 920 | ||||||
Other | (3 | ) | 69 | |||||
|
|
|
| |||||
Total non-current deferred tax assets | 25,090 | 15,886 | ||||||
Valuation allowance | (25,090 | ) | (15,886 | ) | ||||
|
|
|
| |||||
Total non-current deferred tax assets, net of valuation allowance | — | — | ||||||
|
|
|
| |||||
Total net deferred tax assets | $ | — | $ | — | ||||
|
|
|
| |||||
|
| As of December 31, |
| |||||
(in thousands) |
| 2016 |
|
| 2015 |
| ||
Deferred tax assets (liabilities): |
|
|
|
|
|
|
|
|
Stock-based compensation |
| $ | 264 |
|
| $ | 1,723 |
|
Depreciation and amortization |
|
| 43 |
|
|
| (1,896 | ) |
Section 181 qualified production expense |
|
| (2,550 | ) |
|
| (3,563 | ) |
Net operating loss carryforward |
|
| — |
|
|
| 30,727 |
|
Charitable carryforward |
|
| — |
|
|
| 1,899 |
|
Other |
|
| 737 |
|
|
| 4,108 |
|
Tax credits |
|
| 953 |
|
|
| 922 |
|
Valuation allowance |
|
| — |
|
|
| (33,920 | ) |
Total deferred tax liabilities, net of valuation allowance |
| $ | (553 | ) |
| $ | — |
|
As of December 31, 2014, our gross net operating losses were $69.0 million and $35.2 million for federal and state, respectively. The sourcessource of income (loss) before income taxes are as follows:
(in thousands) | 2014 | 2013 | 2012 | |||||||||
Domestic | $ | (4,947 | ) | $ | 5,503 | $ | (29,162 | ) | ||||
International | 686 | 373 | 493 | |||||||||
|
|
|
|
|
| |||||||
| $ | (4,261 | ) | $ | 5,876 | $ | (28,669 | ) | |||||
|
|
|
|
|
| |||||||
Income tax benefit for 2012 includes $6.0 million due to the reducing of a deferred tax liability related to the carrying value of our equity method investment in RGSE and the reduction of the carrying value of our loans to RGSE. See Note 3. Related Party Transactions.
Certain of our subsidiaries, namely those for which we own less than 80% of their shares and voting rights and/or are foreign entities, file tax returns separately from Gaiam’s consolidated tax group. At December 31, 2014, we had made a provision for U.S. federal and state income taxes on approximately $0.3 million of undistributed foreign earnings, which are not expected to remain outside of the U.S. indefinitely. Deferred tax liabilities have been established for future taxes on distribution of foreign earnings in the form of dividends or otherwise, in order to derive, for financial statement purposes, the U.S. income taxes (net of tax on foreign tax credits), state income taxes, and withholding taxes payable to the various foreign countries.
(in thousands) |
| 2016 |
|
| 2015 |
|
| 2014 |
| |||
Domestic |
| $ | (16,926 | ) |
| $ | (9,022 | ) |
| $ | (9,846 | ) |
International |
|
| — |
|
|
| — |
|
|
| — |
|
|
| $ | (16,926 | ) |
| $ | (9,022 | ) |
| $ | (9,846 | ) |
Periodically, we perform assessments of the realization of our net deferred tax assets considering all available evidence, both positive and negative. On the basis of this assessment,During 2013, we recorded a charge of $23.2 million to income tax expense to recorddetermined that a full valuation allowance against our deferred tax assets as of December 31, 2013. A significant piece of evidence evaluated was necessary due to the cumulative loss incurred over the three-year period ended December 31, 2013. BecauseDue to the gain on the sale of the Gaiam Brand segment and our expectation of utilizing the majority of our deferred tax assets to offset this gain, we released the valuation allowance will remain in place until we return to profitability, we did not record any tax benefit in 2014 associated with our net loss or other2016 on these deferred tax assets. We continue to be optimistic about our future, and expect to return to operating profitability. When that happens, we expect to reverse the valuation allowance and record the related tax benefit for future useutilize a gross amount of our$80.7 million of federal net operating loss carryforwards we expect to realize.
Based on RGSE’s establishmentlosses and of a valuation allowance for all its$30.2 million of state net deferred tax assets at December 31, 2012, we established a valuation allowance, by charging loss from equity method investment, for our entire $1.6 million deferred tax asset related to our Tax Sharing Agreement with RGSE. See Note 3. Related Party Transactions. We concluded that no other changes to our existing valuation allowances were necessary. We expect our net deferred tax assets, less the valuation allowances, at December 31, 2014 to be fully recoverable through the reversal of taxable temporary differences and normal business activities in future years.operating losses during 2016.
We realized $1.3$0.8 million and $0.1 million in tax benefits recorded to additional paid-in capital as a resultbecause of the exercise of stock options for the year ended December 31, 2014. We did not realize any tax deductions associated with stock exercises in 2014. We realized $0.5 million in tax deductionsduring 2016 and $0.7 million in tax benefits recorded to additional paid-in capital as a result of the exercise of stock options for the year ended December 31, 2013.2015, respectively. We recognize the tax benefit from an uncertain tax position only if it is more likely than not that the tax position will be sustained on examination by the taxing authorities, based on the technical merits of the position. We measure the tax benefits recognized in the consolidated financial statements from such a position based on the largest benefit that has a greater than 50% likelihood of being realized upon ultimate resolution. The application of income tax law is inherently complex. Laws and regulations in this area are voluminous and are often ambiguous. As such, we are required to make many subjective assumptions and judgments regarding our income tax exposures. Interpretations of and guidance surrounding income tax law and regulations change over time and may result in changes to our subjective assumptions and judgments which can materially affect amounts recognized in our consolidated balance sheets and consolidated statements of operations.
The result of our assessment of our uncertain tax positions did not have a material impact on our consolidated financial statements. Our federal and state tax returns for all years after 20102011 are subject to future examination by tax authorities for all our tax jurisdictions. We recognize interest and penalties related to income tax matters in interest and other income (expense) and corporate, general and administration expenses, respectively.
14.10. Segment Information and Geographic Information
Segment Information
During the fourth quarter of 2014, theThrough June 30, 2016, we managed our company and aggregated our operational and financial information reviewed by our Chief Operating Decision Makers evolved with changes in our organization and new initiatives. These changes include our planned spin-off of Gaiam TV, and the migration of our legacy catalog business to a mobile-and social-centric digital model. Accordingly, we have revised our segment groupings in the fourth quarter of 2014.
As of December 31, 2014, we are reporting two businessreportable segments, which arewere aligned based on their products or services:services.