maintains each Series of Units in between two to six sub-classes—Class 1, Class 1a, Class 2, Class 2a, Class 3, and Class 3a. Investors who have purchased Class 1 or Class 1a Units of any Series are charged a service fee of up to three percent (3.0%
| ● | maintains each Series of Units in three to seven sub-classes—Class 1, Class 1AP, Class 1a, Class 2, Class 2a, Class 3, and Class 3a. Investors who have purchased Class 1 or Class 1a Units of Equinox Frontier Diversified Fund, Equinox Frontier Masters Fund, and Equinox Frontier Long/Short Commodity Fund are charged a service fee of up to two percent (2.0%) annually of the NAV (or the purchase price, in case of the initial service fee) of each Unit purchased, for the benefit of Selling Agents selling such Class 1 or Class 1a Units. The initial service fee, which is amortized monthly at an annual rate of up to two percent (2.0%) of the average daily NAV of Class 1 or Class 1a of such Series, is prepaid to the Managing Owner by each Series, and paid to the selling agents by the Managing Owner in the month following sale; provided, however, that investors who redeem all or a portion of their Class 1 or Class 1a Units of any Series during the first twelve (12) months following the effective date of their purchase are subject to a redemption fee of up to two percent (2.0%) of the purchase price at which such investor redeemed to reimburse the Managing Owner for the then-unamortized balance of the prepaid initial service fee. Investors who have purchased Class 1 or Class 1a Units of Equinox Frontier Balanced Fund, Equinox Frontier Heritage Fund, Equinox Frontier Select Fund, and Equinox Frontier Winton Fund are charged a service fee of up to three percent (3.0%) annually of the NAV (of the purchase price, in case of the initial service fee) of each Unit purchased, for the benefit of selling agents selling such Class 1 or Class 1a Units. The initial service fee, which is amortized monthly at an annual rate of up to three percent (3.0%) of the average daily NAV of Class 1 or Class 1a of such Series, is prepaid to the Managing Owner by each Series, and paid to the selling agents by the Managing Owner in the month following sale; provided, however, that investors who redeem all or a portion of their Class 1 and Class 1a Units of any Series during the first twelve (12) months following the effective date of their
1
The assets of any particular Series include only those funds and other assets that are paid to, held by or distributed to the Trust on account of and for the benefit of that Series. Under the “Inter-Series Limitation on Liability” expressly provided for under Section 3804(a) of the Trust Act, separate and distinct records of the cash and equivalents, although pooled for maximizing returns, is maintained in the books and records of each Series. As of December 31, As of
2 Trading Advisors are responsible for the trading decisions of the respective Trading Companies or Galaxy Plus entities for which they trade. It is expected that between 10% and 30% of each Series’ assets normally will be invested in one or more Trading Companies or Galaxy Plus entities to be committed as margin for trading positions but from time to time these percentages may be substantially more or less. The remainder of each Series’ assets is maintained at the Trust level for cash management. Each of the respective Series has invested monies into pooled cash management assets which have included purchases of U.S. Treasury The Trading Advisors were selected based upon the Managing Owner’s evaluation of each Trading Advisor’s past performance, trading portfolios and strategies, as well as how each Trading Advisor’s performance, portfolio and strategies complement and differ from those of the other Trading Advisors.
The Managing Owner is a Delaware Prospectus dated April Regulation Under the Commodity Exchange Act, as amended, (the “Commodity Exchange Act”) commodity exchanges and commodity futures trading are subject to regulation by the CFTC. The NFA, a registered futures association under the Commodity Exchange Act, is the only non-exchange self-regulatory organization for commodity industry professionals. The CFTC has delegated responsibility to the NFA for the registration of “commodity In addition to such registration requirements, the CFTC and certain commodity exchanges have established limits on the maximum net long and net short positions that any person, including the Trust, may hold or control in particular commodities. Most exchanges also limit the maximum changes in futures contract prices that may occur during a single trading day. The Trust also trades in dealer markets for forward and swap contracts, which are not regulated by the CFTC. Federal and state banking authorities also do not regulate forward trading or forward dealers. In addition, the Trust trades on foreign commodity exchanges, which are not subject to regulation by any U.S. government agency. Operations A description of the business of the Trust, including trading approaches for each Series of Units, rights and obligations of the limited owners, compensation arrangements and fees and expenses is contained in the Prospectus, under the sections captioned “Risk Disclosure Statement,” “Summary,” “Risk Factors,” “Equinox Funds Trust,” “The Offering,” “Trading Limitations, Policies and 3 The Trading Companies and Galaxy Plus entities for each Series of Units engage in the speculative trading of a diversified portfolio of futures, forwards (including interbank foreign currencies), options contracts and other derivative instruments (including
Certain of the Trading Companies and Galaxy Plus entities have entered into contractual arrangements with independent commodity Selection and Replacement of Trading Advisors The performance of the The
The Following is a summary of the quantitative and qualitative analysis: Quantitative Analysis The Qualitative Analysis Although quantitative analysis statistically identifies the top performing 4 Multi-Manager Approach A multi-manager approach to portfolio management provides diversification of The trading system of each of the major commodity
A commodity 5 As of December 31,
Allocation as of December 31, 2016 (expressed as a percentage of aggregate notional exposure to commodity trading programs)
A description of the trading strategies of the major commodity Financial Information about Geographic Areas Although the Trust trades in the global futures and forward markets, it does not have operations outside of the Employees The Trust has no employees. The Trust is managed solely by the Managing Owner in its capacity as the managing owner of the Trust pursuant to the Trust Agreement. Available Information The Trust files quarterly, annual and current reports with the Securities and Exchange Commission (“SEC”). These reports are posted at 6 Additional Information
On December 5, 2016, Equinox Fund Management, LLC (“Equinox”), Frontier Fund Management LLC (the “New Managing Owner”), and Wakefield Advisors, LLC (“Wakefield”) entered into a Unit Purchase Agreement (the “Agreement”). Equinox was the Managing Owner of the Trust and the Series. Pursuant to the Agreement, Equinox agreed to transfer to the New Managing Owner such amount of Equinox’s General Units (as defined in the Trust Agreement) as the Managing Owner shall be required to hold in its capacity as managing owner of the Trust pursuant to the Trust Agreement, and redeem the remainder of Equinox’s General Units (the “Transaction”). The Transaction was consummated on March 6, 2017, and upon consummation of the Transaction, the New Managing Owner became the managing owner of the Trust and each Series, in replacement of Equinox. Consequently, consummation of the Transaction constituted a change of operational control in respect of the Trust and each Series. In connection with the foregoing, the Trust Agreement was amended to effect certain changes to replace Equinox as the managing owner and to reflect the New Managing Owner as the new managing owner. Also, the New Managing Owner has temporarily suspended the sale of Units (as defined in the Trust Agreement) while the Managing Owner engages with the Securities and Exchange Commission to have declared effective a post-effective amendment to the Series’ registration statements, as well as approval by the NFA. The Series will file Form 8-K to announce the resumption of the sale of Units, which the New Managing Owner expects will occur shortly. The New Managing Owner is seeking to cause the suspension to be lifted as promptly as practicable. Any forward-looking statements herein are based on expectations of the New Managing Owner at this time. Whether or not actual results and developments will conform to the New Managing Owner’s expectations and predictions, however, is subject to a number of risks and uncertainties, including the special considerations discussed in the Series’ prospectuses, general economic, market and business conditions, changes in laws or regulations or other actions made by governmental authorities or regulatory bodies, and other world economic and political developments. The Series and the New Managing Owner undertake no duty to update or revise any forward-looking statements, whether as a result of new information, future events or otherwise.
The Trust is a venture in a high-risk business. An investment in the Units of each Series is very speculative. You should make an investment in one or more of the Series only after consulting with independent, qualified sources of investment and tax advice and only if your financial condition will permit you to bear the risk of a total loss of your investment. You should consider an investment in the Units only as a long-term investment. Moreover, to evaluate the risks of this investment properly, you must familiarize yourself with the relevant terms and concepts relating to commodities trading and the regulation of commodities trading, which are discussed in the Prospectus in the Statement of Additional Information below, in the section captioned “The Futures Markets,” which is incorporated herein by reference. You should carefully consider all the information we have included or incorporated by reference in this Form 10-K and our subsequent periodic filings with the SEC. In particular, you should carefully consider the risk factors described below and read the risks and uncertainties as set forth in the “Management’s Discussion and Analysis of Financial Condition and Results of Operations” Section of this Form 10-K. Any of the following risks and uncertainties could materially adversely affect the Trust, its trading activities, operating results, financial condition and NAV and therefore could negatively impact the value of your investment. The information contained herein does not constitute investment, legal or tax advice. You should not invest in the Units unless you can afford to lose all of your investment. Market Risks The commodity interest markets in which the Trading Advisors trade are highly volatile, which could cause substantial losses and may cause you to lose your entire investment. Commodity interest contracts are highly volatile and are subject to occasional rapid and substantial fluctuations. Consequently, you could lose all or substantially all of your investment in the Units of any Series should such Series’ trading positions suddenly turn unprofitable. The profitability of any Series depends primarily on the ability of its Trading Advisor(s) to predict these fluctuations accurately. Price movements for commodity interests are influenced by, among other things:
The Trading Advisors’ technical trading methods may not take account of these factors except as they may be reflected in the technical input data analyzed by the Trading Advisors. In addition, governments from time to time intervene, directly and by regulation, in certain markets, often with the intent to influence prices directly. The effects of governmental intervention may be particularly significant at certain times in the financial instrument and currency markets, and this intervention may cause these markets to move rapidly. Futures, forward and options trading is volatile and may cause large losses. A principal risk in futures, forward and options trading is volatile performance. Because the trading decisions for the Equinox Frontier Winton Fund will be made by a single Trading Advisor, the trading for Equinox Frontier Winton Fund is similar to a single advisor fund in which one Options trading can be more volatile and expensive than futures trading. Certain Trading Advisors may trade options on futures. Although successful options trading requires many of the same skills as successful futures trading, the risks involved are somewhat different. Successful options trading requires a trader to accurately assess near-term market volatility because that volatility is immediately reflected in the price of outstanding options. Correct assessment of market volatility can therefore be of much greater significance in trading options than it is in many long-term futures strategies. If market volatility is incorrectly predicted, the use of options can be extremely expensive. 8 The Trading Advisors’ trading is subject to execution risks. Although each Series generally will purchase and sell actively traded contracts, orders may not be executed at or near the desired price, particularly in thinly traded markets, in markets that lack trading liquidity, or because of applicable “daily price fluctuation limits,” “speculative position limits” or market disruptions. If market illiquidity or disruptions occur, major losses could result. Futures The rapid fluctuations in the market prices of futures, forwards, and options make an investment in any of the Each Series’ performance will be volatile, and a Series could lose all or substantially all of its assets. The multi-advisor feature of each Series, except for Equinox Frontier Winton Fund, may reduce the return volatility relative of the performance of single-advisor investment funds. Options are volatile and inherently leveraged, and sharp movements in prices could cause the Trust to incur large losses. Certain Trading Advisors may trade options on futures. Although successful options trading Exchanges of futures for physicals may adversely affect performance. Certain Trading Advisors may engage in exchanges of futures for physicals for client accounts. An exchange of futures for physicals is a transaction permitted under the rules of many futures exchanges in which two parties holding futures positions may close out their positions without making an open, competitive trade on the exchange. Generally, the holder of a short futures position buys the physical commodity, while the holder of a long futures position sells the physical commodity. The prices at which such transactions are executed are negotiated between the parties. If a Trading Advisor engaging in exchanges of futures for physicals were prevented from such trading as a result of regulatory changes, the performance of client accounts of such Trading Advisor could be adversely affected. Cash flow needs may cause positions to be closed which may cause substantial losses. Certain Trading Advisors may trade options on futures. Futures contract gains and losses are marked-to-market daily for purposes of determining margin requirements. Option positions generally are not marked-to-market daily, although short option positions will require additional margin if the market moves against the position. Due to these differences in margin treatment between futures and options, there may be periods in which positions on both sides must be closed down prematurely due to short term cash flow needs. If this occurs during an adverse move in a spread or straddle relationship, then a substantial loss could occur. The Trading Companies or Galaxy Plus entities and Trust may enter into Swaps are not traded on exchanges and are not subject to the same type of government regulation as exchange markets. As a result, many of the protections afforded to participants on organized exchanges and in a regulated environment are not available in connection with these transactions. The Dodd-Frank Wall Street Reform and Consumer Protection Act, or the Dodd-Frank Act, will affect the manner in which There are no limitations on daily price movements in swaps. Speculative position limits are not applicable to swaps, although the counterparties to swaps may limit the size or duration of positions as a consequence of credit considerations. Participants in the swap markets are not required to make continuous markets in the swaps they trade. Participants could refuse to quote prices for swaps or quote prices with an unusually wide spread between the price at which they are prepared to buy and the price at which they are prepared to sell. In the case of any swap that references a fund or program managed by a 9 The trading on behalf of each Series will be margined, which means that sharp declines in prices could lead to large losses. Because the amount of margin funds necessary to be deposited with a futures clearing broker to enter into a futures, forward contract or option position is typically about 2% to 10% of the total value of the contract, each Trading Advisor may take positions on behalf of a Series with face values equal to several times such Series’ NAV. These low margin requirements provide a large amount of leverage. As a result of margining, even a small movement in the price of a contract can cause major losses. Any purchase or sale of a futures or forward contract or option position may result in losses that substantially exceed the amount invested. If severe short-term price declines occur, such declines could force the liquidation of open positions with large losses. Margin is normally monitored through the margin-to-equity ratio employed by each OTC transactions are subject to little, if any, regulation and may be subject to the risk of counterparty default. A portion of each Series’ assets may be used to trade OTC derivative contracts, such as forward contracts, option contracts, or swaps, or spot contracts. OTC contracts are typically traded on a principal-to-principal basis through dealer markets that are dominated by major money center and investment banks and other institutions and are essentially unregulated by the CFTC. You therefore do not receive the protection of CFTC regulation or the statutory scheme of the Commodity Exchange Act in connection with this trading activity. The markets for OTC contracts rely upon the integrity of market participants in lieu of the additional regulation imposed by the CFTC on participants in the futures markets. The lack of regulation in these markets could expose a Series in certain circumstances to significant losses in the event of trading abuses or financial failure by participants. Each Series also faces the risk of non-performance by the counterparties to the OTC contracts. Unlike in futures contracts, the counterparty to these contracts is generally a single bank or other financial institution, rather than a clearing organization backed by a group of financial institutions. As a result, there will be greater counterparty credit risk in these transactions. The clearing member, clearing organization or other counterparty may not be able to meet its obligations, in which case the applicable Series could suffer significant losses on these contracts. The Dodd-Frank Act will affect the manner in which OTC swap transactions are traded and the credit risk associated with such trading. Depending upon actions taken by regulatory authorities, these changes may also affect the manner of trading of OTC foreign currency transactions. Transactions that have been entered into prior to implementation of the provisions of the Dodd-Frank Act Assets Held in Accounts at U.S. Banks May Not Be Fully Insured. The assets of each Your investment could be illiquid. A Trading Advisor may not always be able to liquidate its commodity interest positions at the desired time or price. It is difficult to execute a trade at a specific price when there is a relatively small volume of buy and sell orders in a market. A market disruption, such as a foreign government taking political actions that disrupt the market in its currency or in a major export, can also make it difficult to liquidate a position. Alternatively, limits imposed by futures exchanges or other regulatory organizations, such as speculative position limits and daily price fluctuation limits, may contribute to a lack of liquidity with respect to some commodity interests. There is no secondary market for the Units and none is expected to develop. 10 Certain Restrictions on Redemption and Transfer of the Units Will Apply. Investors may redeem units daily on one business day notice, but certain restrictions on redemption and transfer will apply. For example, if you invest in Class 1 or 1a Units and redeem all or a portion of such Units on or before the end of the 12 full months following the purchase of such Units, you will be charged a redemption fee of up to 2.0% of the purchase price of any such units being redeemed. Also, transfers of Units are permitted only with the prior written consent of the Redemptions may be temporarily suspended. The Managing Owner may temporarily suspend redemptions for some or all of the Series for up to 30 days if the effect of any redemption, either alone or in conjunction with other redemptions, would be to impair the Trust’s ability to operate in pursuit of its objectives (for example, if the Managing Owner believes a redemption, if allowed, would materially advantage one investor over another investor). The Managing Owner anticipates suspending redemptions only under extreme circumstances, such as a natural disaster, force majeure, act of war, terrorism or other event which results in the closure of financial markets. During any suspension of redemptions, a redeeming Limited Owner invested in a Series for which redemptions were suspended would remain subject to market risk with respect to such Series. An investment in Units may not diversify an overall portfolio. Historically, managed futures have performed in a manner largely independent from the general equity and debt markets. If, however, a Series does not perform in a non-correlated manner with respect to the general financial markets or does not perform successfully, you will obtain little or no diversification benefits by investing in the Units. An investment in any Series of the Trust could increase, rather than reduce your overall portfolio losses during periods when the Trust and the equity and debt markets decline in value. There is no way of predicting whether the Trust will lose more or less than stocks and bonds in declining markets. You should therefore not consider the Units to be a hedge against losses in your core stock and bond portfolios. Past performance is not indicative of future results. Trading Risks There are disadvantages to making trading decisions based on technical analysis. Many of the Trading Advisors except certain Trading Advisors trading for the Equinox Frontier Long/Short Commodity Fund may base their trading decisions on trading strategies that use mathematical analyses of technical factors relating to past market performance rather than fundamental analysis. The buy and sell signals generated by a technical, trend-following trading strategy are derived from a study of actual daily, weekly and monthly price fluctuations, volume variations and changes in open interest in the markets. The profitability of any technical, trend-following trading strategy depends upon the occurrence in the future of significant, sustained price moves in some of the markets traded. A danger for trend-following traders is whip-saw markets, that is, markets in which a potential price trend may start to develop but reverses before an actual trend is realized. A pattern of false starts may generate repeated entry and exit signals in technical systems, resulting in unprofitable transactions. In the past, there have been prolonged periods without sustained price moves. Presumably these periods will continue to occur. Periods without sustained price moves may produce substantial losses for trend-following trading strategies. Further, any factor that may lessen the prospect of these types of moves in the future, such as increased governmental control of, or participation in, the relevant markets, may reduce the prospect that any trend- following trading strategy will be profitable in the future. There are disadvantages to making trading decisions based on fundamental analysis. Certain Trading Advisors will base their decisions on trading strategies which utilize in whole or in part fundamental analysis of underlying market forces. Fundamental analysis attempts to examine factors external to the trading market which affect the supply and demand for a particular commodity interest in order to predict future prices. Such analysis may not result in profitable trading because certain Trading Advisors may not have knowledge of all factors affecting supply and demand or may incorrectly interpret the information they do have. Furthermore, prices may often be affected by unrelated or unexpected factors and fundamental analysis may not enable the Trading Advisor to determine whether its previous decisions were incorrect in sufficient time to avoid substantial losses. In addition, fundamental analysis assumes that commodity markets are inefficient—i.e., that commodity prices do not always reflect all available information—which some market analysts dispute. Increased competition from other systematic traders could reduce the Trading Advisors’ profitability. There has been a dramatic increase over the past 15 to 25 years in the amount of assets managed pursuant to trading systems like those that some of the Trading Advisors may employ. This means increased trading competition among a larger number of market participants for transactions at favorable prices, which could operate to the detriment of some or all Series by preventing the Trading Advisors from effecting transactions at the desired prices. It may become more difficult for the Trading Advisors to implement their trading strategies if other commodity 11 Discretionary decision-making may result in missed opportunities or losses. Because each of the Trading Advisors’ strategies involves some discretionary aspects in addition to analysis of technical factors, certain Trading Advisors may occasionally use discretion in investing the assets of a Series. For example, the Trading Advisors often use discretion in selecting contracts and markets to be followed. In exercising such discretion, such Trading Advisor may take positions opposite to those recommended by the Trading Advisor’s trading system or signals. Discretionary decision making may also result in a Trading Advisor’s failing to capitalize on certain price trends or making unprofitable trades in a situation where another trader relying solely on a systematic approach might not have done so. Furthermore, such use of discretion may not enable the Series to avoid losses, and in fact, such use of discretion may cause the Series to forego profits which it may have otherwise earned had such discretion not been used. The Trading Companies or Galaxy Plus entities are subject to speculative position limits. The U.S. futures exchanges have established speculative position limits (referred to as “position limits”) on the maximum net long or net short position which any person or group of persons may hold or control in particular futures and options on futures. Most exchanges also limit the amount of fluctuation in commodity futures contract prices on a single trading day. Therefore, a Trading Advisor may have to modify its trading instructions or reduce the size of its positions in one or more futures or options contracts in order to avoid exceeding such position limits, which could adversely affect the profitability of the Trading In Increases in assets under management of any of the Trading Advisors could lead to diminished returns. We believe that none of the Trading Advisors The use of multiple Trading Advisors may result in offsetting or opposing trading positions and may also require one Trading Advisor to fund the margin requirements of another Trading Advisor. The use of multiple Trading Advisors for the Equinox Frontier Diversified Fund, Equinox Frontier Masters Fund, Equinox Frontier Balanced Fund, Equinox Frontier Heritage Fund, Equinox Frontier Select Fund, and Equinox Frontier Long/Short Commodity Fund may result in developments or positions that adversely affect the respective Series’ NAV. For example, because the Trading Advisors trading for the Equinox Frontier Diversified Fund, Equinox Frontier Masters Fund, Equinox Frontier Balanced Fund, Equinox Frontier Heritage Fund, Equinox Frontier Select Fund, and Equinox Frontier Long/Short Commodity Fund will be acting independently, such Series could buy and sell the same futures contract, thereby incurring additional expenses but with no net change in its holdings. The Trading Advisors also may compete, from time to time, for the same trades or other transactions, increasing the cost to such Series of making trades or transactions or causing some of them to be foregone altogether. Even though the margin requirements resulting from each Trading Advisor’s trading for any such Series ordinarily will be met from that Trading Advisor’s allocated net assets of such Series, a Trading Advisor for the Equinox Frontier Diversified Fund, Equinox Frontier Masters Fund, Equinox Frontier Balanced Fund, Equinox Frontier Heritage Fund, Equinox Frontier Select Fund, or Equinox Frontier Long/Short Commodity Fund may incur losses of such magnitude that such Series is unable to meet margin calls from the allocated net assets of that Trading Advisor. If losses of such magnitude were to occur, the Clearing Brokers for the Trading 12 The Trading Advisors’ trading programs bear some similarities and, therefore, may lessen the benefits to the Equinox Frontier Balanced Fund, Equinox Frontier Heritage Fund, Equinox Frontier Select Fund, Equinox Frontier Long/Short Commodity Fund, Equinox Frontier Diversified Fund and Equinox Frontier Masters Fund of having multiple Trading Advisors. Each Trading Advisor has, over time, developed and modified the program it will use in trading. Nevertheless, the Trading Advisors’ trading programs have some similarities. These similarities may, in fact, mitigate the positive effect of having multiple Trading Advisors for the Equinox Frontier Diversified Fund, Equinox Frontier Masters Fund, Equinox Frontier Balanced Fund, Equinox Frontier Heritage Fund, Equinox Frontier Select Fund and Equinox Frontier Long/Short Commodity Fund. For example, in periods where one Trading Advisor experiences a draw-down, it is possible that these similarities will cause the other Trading Advisors to also experience a draw-down. Each Series relies on its Trading Advisor(s) for success, and if a Trading Advisor’s trading is unsuccessful, the Series may incur losses. The Trading Advisor(s) for each Series will make the commodity trading decisions for that Series. Therefore, the success of each Series depends on the judgment and ability of the Trading Advisors. A Trading Advisor’s trading for any Series may not prove successful under all or any market conditions. If a Trading Advisor’s trading is unsuccessful, the applicable Series may incur losses. Similarly, the success of each Series that invests in swaps largely depends on the judgment and ability of the commodity There are disadvantages associated with terminating or replacing Trading A Trading Advisor generally is required to recoup previous trading losses in its trading program or a reference trading program, as applicable, before it can earn performance-based compensation. However, the Managing Owner may elect to replace a Trading Advisor, or any trading program or reference trading program, that has a “loss carryforward.” In that case, the It is also possible that (i) the advisory agreement with any Trading Advisor, once it expires, will not be renewed on the same terms as the current advisory agreement for that Trading Advisor, (ii) if assets of any Series allocated to a particular Trading Advisor, trading program or reference trading program are reallocated to a new or different Trading Advisor, trading program or reference trading program, the new or different Trading Advisor, with respect to its applicable trading program or reference trading program, will not manage the assets on terms as favorable to the Series as those previously negotiated, Each Trading Advisor advises other clients and may achieve more favorable results for its other accounts. Each of the Trading Advisors currently manages other trading accounts, and each will remain free to manage additional accounts, including its own accounts, in the future. A Trading Advisor may vary the trading strategies applicable to the Series for which it trades from those used for its other managed accounts, or its other managed accounts may impose a different cost structure than that of the Series for which it trades. Consequently, the results any Trading Advisor achieves for the Series for which it trades may not be similar to those achieved for other accounts managed by the Trading Advisor or its affiliates at the same time. Moreover, it is possible that those other accounts managed by the Trading Advisor or its affiliates may compete with the Series for which it trades for the same or similar positions in the commodity interest markets and that those other accounts may make trades at better prices than the Series for which it trades. A Trading Advisor may also have a financial incentive to favor other accounts because the compensation received from those other accounts exceeds, or may in the future exceed, the compensation that it receives from managing the account of the Series for which it trades. Because records with respect to other accounts are not accessible to investors in the Units, investors will not be able to determine if any Trading Advisor is favoring other accounts. The Trading Advisors’ positions may be concentrated from time to time, which may render each Series susceptible to larger losses than if the positions were more diversified. One or more of the Trading Advisors may from time to time cause a Series to hold a few, relatively large positions in relation to its assets. Consequently, a loss in any such position could result in a proportionately greater loss to such Series than if the Series’ assets had been spread among a wider number of instruments. 13 Markets or positions may be correlated and may expose a Series to significant risk of loss. Different markets traded or individual positions held by a Series of Units may be highly correlated to one another at times. Accordingly, a significant change in one such market or position may affect other such markets or positions. The Trading Advisors cannot always predict correlation. Correlation may expose such Series of Units both to significant risk of loss and significant potential for profit. Turnover in each Series’ portfolio may be high which could result in higher brokerage commissions and transaction fees and expenses. Each Trading Advisor will make certain trading decisions on the basis of short-term market considerations. The portfolio turnover rate may be substantial at times, either due to such decisions or to market conditions, and this could result in one or more Series incurring substantial brokerage commissions and other transaction fees and expenses. Stop-loss Orders May Not Prevent Large Losses. Certain of the Trading Advisors may use stop-loss orders. Such stop-loss orders may not effectively prevent substantial losses, and depending on market factors at the time, may not be able to be executed at such stop-loss levels. No risk control technique can assure that large losses will be avoided.
The Unregulated Nature of Uncleared Trades in the OTC Markets Creates Counterparty Risks that Do Not Exist in Futures Trading on Exchanges or in Cleared Swaps. Unlike futures contracts and cleared swaps, uncleared trades, such as forward contracts, some swaps and some OTC “spot” contracts, are entered into between private parties off an exchange or other trading platform and are not subject to clearing. As a result, the performance of those contracts is not guaranteed by an exchange or its clearinghouse and the Foreign Currency and Spot Contracts Historically Were Not Regulated When Traded Between Certain “Eligible Contract Participants” and Are Subject to Credit Risk. Each The percentage of each Series’ positions that are expected to constitute foreign currency forwards and foreign currency swaps can vary substantially from month to month. Trading on Foreign Exchanges Presents Greater Risks to the Series than Trading on U.S. Exchanges. Each 14 Trading on foreign exchanges involves some risks that trading on U.S. exchanges does not, such as: Lack of Investor Protection Regulation The rights of the Possible Governmental Intervention Generally, foreign brokers are not subject to the jurisdiction of the CFTC or any other U.S. regulator. In addition, the Relatively New Markets Some foreign exchanges on which the Exchange-Rate Exposure The Investments in Reference Programs Through a Swap or Other Derivative Instrument May Not Always Replicate Exactly Performance of the Relevant CTA Trading Program(s). Certain Series invest in reference programs through total return swaps with Deutsche Bank AG. Such swaps reference an index comprised of shares in segregated investment portfolios directed by CTAs selected by the There Are Certain Risks Associated with the Trust’s Investment in U.S. Government Debt Securities. With respect to the portion of the Trust’s assets apportioned for cash management, the Trust may invest in U.S. government securities which include any security issued or guaranteed as to principal or interest by the United States, or by a person controlled by or supervised by and acting as an instrumentality of the government of the United States pursuant to authority granted by Congress of the United States or any certificate of deposit for any of the foregoing, including U.S. Treasury bonds, U.S. Treasury bills and issues of agencies of the U.S. government (such as Ginnie Mae, Fannie Mae, or Freddie Mac). U.S. government securities are subject to market risk, interest rate risk and credit risk. Securities, such as those issued or guaranteed by Ginnie Mae or the U.S. Treasury, that are backed by the full faith and credit of the United States are guaranteed only as to the timely payment of interest and principal when held to maturity and the market prices for such securities will fluctuate. Notwithstanding that these securities are backed by the full faith and credit of the United States, circumstances could arise that would prevent the payment of interest or principal. This would result in losses to the Trust. Securities issued or guaranteed by U.S. government-related organizations, such as Fannie Mae and Freddie Mac, are not backed by the full faith and credit of the U.S. government and no assurance can be given that the U.S. government would provide financial support. Therefore, U.S. government-related organizations may not have the funds to meet their payment obligations in the future. The Trust’s Investment in U.S. Government Debt Securities Will Be Subject to Interest Rate Risk. The Trust’s cash management pool includes investments in U.S. government debt securities that change in value based on changes in interest rates. If rates increase, the value of these investments generally declines. On the other hand, if rates fall, the value of these investments generally increases. U.S. government securities with greater interest rate sensitivity and longer maturities tend to produce higher yields, but are subject to greater fluctuations in value. Usually, the changes in the value of fixed income securities will not affect cash income generated, but may affect the value of your investment. Given the current low interest rate environment, the risk associated with rising rates is heightened. 15 Operating Risks Past performance is not necessarily indicative of future performance. The Managing Owner has selected each Trading Advisor to manage the assets of each Series because each Trading Advisor performed well through the date of its selection. You must consider, however, the uncertain significance of past performance, and you should not rely to a substantial degree on the Trading Advisors’ or the Managing Owner’s records to date for predictive purposes. You should not assume that any Trading Advisor’s future trading decisions will create profit, avoid substantial losses or result in performance for the Series comparable to that Trading Advisor’s or to the Managing Owner’s past performance. In fact, as a significant amount of academic study has shown, futures funds more frequently than not under-perform the past performance records included in their prospectuses. The Because you and other investors will acquire, exchange, and redeem Units at different times, you may experience a loss on your Units even though the Series in which you have invested as a whole is profitable and even though other investors in that Series experience a profit. The past performance of any Series may not be representative of each investor’s investment experience in it. Likewise, you and other investors will invest in different Series managed by different Trading Advisors. Each Series’ assets are valued and accounted for separately from every other Series. Consequently, the past performance of one Series has no bearing on the past performance of another Series. You cannot, for example, consider the Equinox Frontier Balanced Fund’s past performance in deciding whether to invest in any other Series. You have limited performance information on which to evaluate an investment in a Series. Certain of the Series have limited performance histories upon which to evaluate your investment in such Series. Although past performance is not necessarily indicative of future results, if any such Series had a longer performance history, such performance history might provide you with more information on which to base your investment decision for such Series. As such Series have limited performance histories, you will have to make your decision to invest in any such Series without such possibly useful information. The Managing Owner may allocate nominal assets in respect of a Series that are in excess of the NAV of such Series. At any given time, the nominal assets, which are the total amount of assets of a Each Series is charged substantial fees and expenses regardless of profitability. Each Series is charged brokerage charges, Investors should note that the management fee payable to the Managing Owner is based on nominal assets rather than NAV. Therefore, the management fee will be greater as a percentage of a Series’ NAV to the extent that the nominal assets of such Series exceed its NAV. The Managing Owner expects that the nominal assets of each Series will generally be maintained at a level in excess of the net asset value for such Series and such excess may be substantial to the extent the Managing Owner deems necessary to achieve the desired level of volatility. 16 There are certain risks associated with investments in trading companies.
The Trading Companies are organized as
All of the Series There are certain risks associated with investments in Galaxy Plus entities. The assets of each Series are substantially invested in commodity pools offered through the Galaxy Plus Platform, and accordingly, each Series’ performance depends substantially upon the performance of each such commodity pool. Factors that may significantly affect a commodity pool’s performance include the investment strategies selected for it by the sponsor, Gemini Alternative Funds, LLC (the “Sponsor” or “Gemini”) and/or such commodity pool’s Trading Advisor in their sole discretion, the commodity pool’s adherence to the selected strategies, the effectiveness of such strategies and the specific trading activities of the commodity pool’s Trading Advisor, including the Trading Advisor’s selection of financial instruments. Each commodity pool on the Galaxy Plus Platform is advised by an independent Trading Advisor. As a result, many of the risks outlined above with respect to the Trading Advisors of each Series will also apply to the Trading Advisors of each commodity pool. The Galaxy Plus Platform was formed in April 2015 and has a limited history of operations. The commodity pools offered on the platform are recently established with a limited operating history or, in some cases, newly established with no operating history. There is a limited performance history, or in some cases, no performance history, to serve as a factor in evaluating an investment in the commodity pools on the Galaxy Plus Platform. The Galaxy Plus Platform allows multiple investors to subscribe for interests in its commodity pools. Investors other than a Series could cause a commodity pool to take, or omit to take, actions that may adversely affect the performance of, or value of a Series’ investments in, a commodity pool. A commodity pool may experience relatively large redemptions or investments related to actions of other investors in the commodity pool. In the event of such redemptions or investments, a Trading Advisor to the commodity pool could be required to sell futures, options or other investments or to invest cash at a time when it is not advantageous to do so, harming the performance of a Series. The commodity pools on the Galaxy Plus Platform operate independently from each Series, the Trust and the Managing Owner. The Managing Owner will have no control over, or involvement in, the operation and administration of the commodity pools. Gemini, as the sponsor of the commodity pools, may make operational and administrative decisions that could adversely affect the performance of the commodity pool and the value of a Series’ investment in the commodity pool. The Galaxy Plus Platform and/or its Sponsor will have the ability to restrict investments into, or divestments from, any of the commodity pools on the Galaxy Plus Platform. The success of each Series depends upon the ability to select Trading Advisors n the Galaxy Plus Platform through investments into, or divestments from, one or more commodity pools. If investments into or out of a commodity pool are limited or restricted by the Galaxy Plus Platform and/or its Sponsor, Gemini, the performance of a Series may be adversely affected. Unlike the Trading Companies managed by the Managing Owner, the on-going business operations of the Galaxy Plus Platform are administered by Gemini. If Gemini ceases operating, or effects administrative or other changes to, the Galaxy Plus Platform, a Series may no longer be able to access one or more Trading Advisors available through commodity pools on the Galaxy Plus Platform. The inability to gain exposure to Trading Advisors through the Galaxy Plus Platform may materially affect the performance of a Series. Each Series is subject to certain risks related to the operation and administration of the Galaxy Plus Platform by Gemini as a result of its investment in one or more commodity pools on the Galaxy Plus Platform. The investment of each Series in a commodity pool may be adversely affected due to possible human error or fraud on the part of an employee or agent of Gemini, prohibited trading activity by a commodity pool’s Trading Advisors due to a lack of internal controls or failed trading systems, Gemini’s noncompliance with applicable laws, rules and regulations and external events such as service provider failure, hardware or software failure or acts of god. 17 In addition, as the use of technology increases, each Series may be more susceptible to operational risks through breaches in cyber security. A breach in cyber security refers to both intentional and unintentional events that may cause the Series to lose proprietary information or operational capacity or suffer data corruption. As a result, each Series may incur regulatory penalties, reputational damage, additional compliance costs associated with corrective measures, and/or financial loss. In addition, cyber security breaches of the Series’ third party service providers or issuers in which the Series invest may also subject the Series to many of the same risks associated with direct cyber security breaches. Differing levels of fees received may create an incentive for the Managing Owner to favor certain Series over others. The Managing Owner charges the various Series differing levels of fees. This may create an incentive for the Managing Owner to favor certain Series over other Series in, among other things, the amount of time and effort spent managing any given Series and the selection of Trading Advisors for a given Series. Each Series may incur higher fees and expenses upon renewing existing or entering into new contractual relationships. The clearing agreements between the Clearing Brokers and the Trading Companies and Galaxy Plus entities generally are terminable by the Clearing Brokers once the Clearing Broker has given the Trading Company or Galaxy Plus entity the required notice. Upon termination of a clearing agreement, the Managing Owner may be required to renegotiate that agreement or make other arrangements for obtaining clearing. The services of the Clearing Brokers may not be available, or even if available, these services may not be available on the terms as favorable as those contained in the expired or terminated clearing agreements. The Series may be obligated to make payments under guarantee agreements. Each of the Series has guaranteed the obligations of the The incentive fees could be an incentive to the Trading Advisors to make riskier investments. The Managing Owner pays each Trading Advisor incentive fees based on the trading profits earned by it for the applicable Series, including unrealized appreciation on open positions. Accordingly, it is possible that the Managing Owner will pay an incentive fee on trading profits that do not become realized. Also, because the Trading Advisors are compensated based on the trading profits earned, each of the Trading Advisors has a financial incentive to make investments that are riskier than might be made if a Series’ assets were managed by a Trading Advisor that did not receive performance-based compensation. You have limited rights, and you cannot prevent the Trust from taking actions which could cause losses. You will exercise no control over the Trust’s day-to-day business. Therefore, the Trust will take certain actions and enter into certain transactions or agreements without your approval. For example, the Trust may retain a Trading Advisor for a Series in which you are invested, and such Trading Advisor may ultimately incur losses for the Series. As a Limited Owner, you will have no ability to influence the hiring, retention or firing of such Trading Advisor. However, certain actions, such as termination or dissolution of a Series, may only be taken upon the affirmative vote of Limited Owners holding Units representing at least a majority (over 50%) of the NAV of the Series (excluding Units owned by the Managing Owner and its affiliates). You may not be able to establish a basis for liability against a Trading Advisor, a Clearing Broker or the Swap Counterparty. Each Trading Advisor, Clearing Broker and 18 An unanticipated number of redemption requests over a short period of time could result in losses. Substantial redemptions of units could require a Series to liquidate investments more rapidly than otherwise desirable in order to raise the necessary cash to fund the redemptions, which could result in losses. Illiquidity in the markets could make it difficult to liquidate positions on favorable terms, which could result in additional losses. It may also be difficult for the Series to achieve a market position appropriately reflecting a smaller equity base. Reserves for contingent liabilities may be established upon redemption, and the Trust may withhold a portion of your redemption amount. When you redeem your units, the Trust may find it necessary to set up a reserve for undetermined or contingent liabilities and withhold a certain portion of your redemption amount. This could occur, for example, if (i) some of the positions of the Series in which you were invested were illiquid, (ii) there are any assets which cannot be properly valued on the redemption date, or (iii) there is any pending transaction or claim by or against the Trust involving or which may affect your capital account or your obligations. Conflicts of interest exist in the structure and operation of the Trust. A number of actual and potential conflicts of interest exist in the operation of the Trust’s business. The Managing Owner, the Trading Advisors and their respective principals are all engaged in other investment activities, and are not required to devote substantially all of their time to the Trust’s business. The failure or bankruptcy of one of its Futures Clearing Brokers, central clearing brokers, banks, counterparties or other custodians could result in a substantial loss of one or more Series’ assets. The Trust is subject to the risk of insolvency of an exchange, clearinghouse, central clearing broker, commodity broker, and counterparties with whom the Exchange-traded futures and futures-styled option contracts are marked to market on a daily basis, with variations in value credited or charged to the Trust’s account on a daily basis. The Clearing Brokers, as futures commission merchants for the Trust’s exchange-traded contracts, are required, pursuant to CFTC regulations, to segregate from their own assets, and for the sole benefit of their commodity customers, all funds held by such clients with respect to exchange-traded futures and futures-styled options contracts, including an amount equal to the net unrealized gain on all open futures and futures-styled options contracts. Similar requirements apply with respect to funds held in connection with cleared swap contracts. Bankruptcy law applicable to all U.S. futures brokers requires that, in the event of the bankruptcy of such a broker, all property held by the broker, including certain property specifically traceable to the Trust, will be returned, transferred, or distributed to the broker’s customers only to the extent of each customer’spro rata share of the assets held by such futures broker. The Managing Owner will attempt to limit the Trust’s deposits and transactions to well-capitalized institutions in an effort to mitigate such risks, but there can be no assurance that even a well-capitalized, major institution will not become bankrupt. In the event of a shortfall in segregated customer funds held by the futures commission merchant, the With respect to transactions a Series enters into that are not traded on an exchange, there are no daily settlements of variations in value and there is no requirement to segregate funds held with respect to such accounts. Thus, the funds that a Series invests in such transactions may not have the same protections as funds used as margin or to guarantee exchange-traded futures and options contracts. If the counterparty becomes insolvent and a Series has a claim for amounts deposited or profits earned on transactions with the counterparty, the Series’ claim may not receive a priority. Without a priority, the Trust is a general creditor and its claim will be paid, along with the claims of other general creditors, from any monies still available after priority claims are paid. Even funds of the Trust that the counterparty keeps separate from its own operating funds may not be safe from the claims of other general and priority creditors. There are no limitations on the amount of allocated assets a portfolio manager can trade on foreign exchanges or in forward contracts. 19 You will not be able to review any Series’ holdings on a daily basis, and you may suffer unanticipated losses. The Trading Advisors make trading decisions on behalf of the assets of each Series. While the Trading Advisors receive daily trade confirmations from the Clearing Brokers of each transaction entered into on behalf of each Series for which they manage the trading, each Series’ trading results are only reported to investors monthly in summary fashion. Accordingly, an investment in the Units does not offer investors the same transparency that a personal trading account offers. As a result, you may suffer unanticipated losses. You Will Not Be Aware of Changes to Trading Programs. Because of the proprietary nature of each Trading Advisor’s trading programs, you generally will not be advised if adjustments are made to a trading program in order to accommodate additional assets under management or for any other reason. The Trust could terminate before you achieve your investment objective causing potential loss of your investment or upsetting your investment portfolio. Unforeseen circumstances, including substantial losses or withdrawal of the Trust’s Managing Owner, could cause the Trust to terminate before its stated termination date of December 31, 2053. The Trust’s termination would cause the liquidation and potential loss of your investment and could upset the overall maturity and timing of your investment portfolio. Neither the Trust nor any of the trading companies is a registered investment company. Neither the Trust nor any of the trading companies is an investment company subject to the Investment Company Act. Accordingly, you do not have the protections afforded by that statute. For example, the Investment Company Act requires investment companies to have a majority of disinterested directors and regulates the relationship between the investment company and its investment adviser. Since neither the Trust nor the trading companies is a registered investment company, you will not benefit from such protections. The Managing Owner is leanly staffed and relies heavily on its key personnel to manage the Trust’s trading activities. The loss of such personnel could adversely affect the Trust. In managing and directing the day-to-day activities and affairs of the Trust, the Managing Owner relies heavily on its principals. The Managing Owner is leanly staffed, although there are back-up personnel for every key function. If any of its key persons were to leave or be unable to carry out his or her present responsibilities, it may have an adverse effect on the management of the Trust.
The Managing Owner places significant reliance on the Trading Advisors and their key personnel; the loss of such personnel could adversely affect a Series. The Managing Owner relies on the Trading Advisors to achieve trading gains for each Series, entrusting each of them with the responsibility for, and discretion over, the investment of their allocated portions of the Trust’s assets. The Trading Advisors, in turn, are dependent on the services of a limited number of persons to develop and refine their trading approaches and strategies and execute the trading transactions. The loss of the services of any Trading Advisor’s principals or key employees, or the failure of those principals or key employees to function effectively as a team, may have an adverse effect on that Trading Advisor’s ability to manage its trading activities successfully or may cause the Trading Advisor to cease operations entirely. This, in turn, could negatively impact one or more Series’ performance. Each of the Trading Advisors is wholly- (or majority-) owned and controlled, directly or indirectly, by single individuals who have major roles in developing, refining and implementing the Trading Advisor’s trading strategies and operating its business. The death, incapacity or other prolonged unavailability of such individuals likely would greatly hinder these Trading Advisors’ operations, and could result in their ceasing operations entirely, which could adversely affect the value of your investment. The Managing Owner may terminate, replace and/or add Trading Advisors in its sole discretion which may disrupt trading, adversely affecting the Net Asset Value of a Series. The Managing Owner may terminate, substitute or retain Trading Advisors on behalf of each Series in its sole discretion. The addition of a new Trading Advisor and/or the removal of one of the current Trading Advisors may cause disruptions in trading as assets are reallocated and new Trading Advisors transition over, which may have an adverse effect on the NAV of the affected Series. The Managing Owner’s allocation of the Trust’s assets among Trading Advisors may result in less than optimal performance by the Trust. The Managing Owner may reallocate assets among the Trading Advisors for the Equinox Frontier Diversified Fund, Equinox Frontier Masters Fund, Equinox Frontier Balanced Fund, Equinox Frontier Heritage Fund, Equinox Frontier Select Fund or Equinox Frontier Long/Short Commodity Fund upon termination of a Trading Advisor or retention of a new Trading Advisor or at the commencement of any month. Consequently, the net assets for such Series may be allocated among the Trading Advisors in a different manner than the currently anticipated allocations. The Managing Owner’s allocation of assets of any such Series may adversely affect the profitability of the trading of the Equinox Frontier Diversified Fund, Equinox Frontier Masters Fund, Equinox Frontier Balanced Fund, Equinox Frontier Heritage Fund, Equinox Frontier Select Fund and Equinox Frontier Long/Short Commodity Fund, possibly in an adverse manner. For example, a Trading Advisor for a Series may experience a high rate of return but may be managing only a small percentage of the net assets of such Series. In this case, the Trading Advisor’s performance could have a minimal effect on the NAV of such Series. 20 The success of each Series depends on the ability of the personnel of its Trading Advisor(s) to accurately implement their trading systems, and any failure to do so could subject a Series to losses. The Trading Advisors’ computerized trading systems rely on the Trading Advisors’ personnel to accurately process the systems’ outputs and execute the transactions called for by the systems. In addition, each Trading Advisor relies on its staff to properly operate and maintain the computer and communications systems upon which its trading systems rely. Execution and operation of each Trading Advisor’s systems is therefore subject to human errors. Any failure, inaccuracy or delay in implementing any of the Trading Advisors’ systems and executing transactions could impair the Regulation of the commodity interest markets is extensive and constantly changing; future regulatory developments are impossible to predict and may significantly, but adversely affect the Trust. The futures, options on futures and security futures markets are subject to comprehensive statutes, regulations and margin requirements. With respect to traditional futures exchanges, the CFTC and the exchanges are authorized to take extraordinary actions in the event of a market emergency, including, for example, the retroactive implementation of speculative position limits or higher margin requirements, the establishment of daily limits and the suspension of trading. The regulation of commodity interest transactions in the United States is a rapidly changing area of law and is subject to ongoing modification by governmental and judicial action. In addition, various national governments have expressed concern regarding the disruptive effects of speculative trading in the currency markets and the need to regulate the derivatives markets in general. The effect of any future regulatory change is impossible to predict, but could be substantial and adverse. The Risk Management Approaches of One or All of the Trading Advisors May Not Be Fully Effective, and a Series May Incur Losses. The mechanisms employed by each Trading Advisor to monitor and manage the risks associated with its trading activities on behalf of the Series for which it trades may not succeed in mitigating all identified risks. Even if a Trading Advisor’s risk management approaches are fully effective, it cannot anticipate all risks that it may face. If one or more of the Trading Advisors fails to identify and adequately monitor and manage all of the risks associated with its trading activities, the Series for which it trades may suffer losses. The Managing Owner May Adjust the Leverage Employed by a Trading Advisor to Maintain the Target Rate of Volatility. In its sole discretion, the To the extent that the Tax and ERISA Risks You are strongly urged to consult your own tax advisor and counsel about the possible tax consequences to you of an investment in the Trust. Tax consequences may differ for different investors, and you could be affected by changes in the tax laws. 21 You May Have Tax Liability Attributable to Your Investment in a Series Even if You Have Received No Distributions and Redeemed No Units, and Even if the Series Generated an Economic Loss. If a Series has profit for a taxable year (as determined for federal income tax purposes), the profit will be includible in your taxable income, whether or not cash or other property is actually distributed to you by the Series. The Managing Owner does not intend to make any distributions from any Series. Accordingly, it is anticipated that federal income taxes on your allocable share of a Series’ profits will exceed the amount of distributions to you, if any, for a taxable year. As such, you must be prepared to satisfy any tax liability from redemptions of Units or other sources. In addition, a Series may have capital losses from trading activities that cannot be deducted against the Series’ interest income, so that you may have to pay taxes on interest income even if the Series generates a net economic loss for a taxable year. You may be taxed on gains that the Trust never realizes. Because a substantial portion of the Trust’s open positions are “marked-to-market” at the end of each year, some of your tax liability for each year may be based on unrealized gains that the Trust may never actually realize. Partnership treatment is not assured, and if the Trust is not treated as a Partnership, you could suffer adverse tax consequences. The Managing Owner believes that the Trust and each Series will be treated as a partnership for Federal income tax purposes and, assuming that at least 90% of the gross income of the Trust, and each Series, has always constituted and will continue to constitute “qualifying income” within the meaning of Section 7704(d) of the Code, neither the Trust nor any Series will be treated as a publicly traded partnership treated as a corporation. The Managing Owner believes it is likely, but not certain, that the Trust, and each Series, will meet this income test. The Trust has not requested, and does not intend to request, a ruling from the Internal Revenue Service (the “IRS”), concerning its tax treatment or the tax treatment of any Series. If the Trust, or any Series, were to be treated as a corporation for Federal income tax purposes: the net income of the Trust, or the Series, would be taxed at corporate income tax rates, thereby substantially reducing its distributable cash; you would not be allowed to deduct losses of the Trust, or a Series; and distributions to you, other than liquidating distributions, would constitute dividends to the extent of the current or accumulated earnings and profits of the Trust, or a Series, and would be taxable as such. There is the possibility of a tax audit which could result in additional taxes to you. The Trust’s tax returns may be audited by a taxing authority, and such an audit could result in adjustments to the Trust’s returns. If an audit results in an adjustment, you may be compelled to file amended returns and to pay additional taxes plus interest and penalties. You will likely recognize short-term capital gain. Profits on futures contracts traded in regulated U.S. and some foreign exchanges, foreign currency contracts traded in the interbank market, and U.S. and some foreign exchange-traded options on commodities are generally taxed as short-term capital gain to the extent of 40% of gains with respect to section 1256 contracts. Special rules apply in the case of mixed straddles (generally, offsetting positions where some, but not all, of the positions are marked-to-market). These special rules could have the effect of limiting the amount of gain treated as long-term capital gain. The IRS could challenge allocations of recognized gains to Unitholders who redeem. The trust agreement provides that recognized gains may be specially allocated for tax purposes to redeeming limited owners. If the IRS were to successfully challenge such allocations, each remaining limited owner’s share of recognized gains would be increased. The IRS could take the position that deductions for certain Trust expenses are subject to various limitations. Non-corporate taxpayers are subject to certain limitations for deductions for “investment advisory expenses” for federal income tax and alternative minimum tax purposes. The IRS could argue that certain expenses of the Trust are investment advisory expenses. The investment of Benefit Plan Investors may be limited and/or Subject to Mandatory Redemption if any or all of the Series (or Class of any Series) are deemed to hold plan assets or if the Trading Advisors have fiduciary relationships with certain investing Benefit Plan Investors and Benefit Plan Investors are required to consider their fiduciary responsibilities in making an investment decision. Special considerations apply to investments in the Trust by individual retirement accounts, pension, profit-sharing, stock bonus, Keogh, welfare benefit and other employee benefit plans whether or not subject to ERISA or Section 4975 of the Code, each a Plan, a Plan that is subject to Part 4 of Subtitle B of Title I of ERISA or Section 4975 of the Code, or an ERISA Plan, and any entity whose underlying assets include plan assets by reason of a Plan’s investment in such entity is referred to as a “Benefit Plan Investor.” While the assets of the Trust or any Series (and Class of any Series) are intended not to constitute plan assets with respect to any Benefit Plan Investors, the United States Department of Labor, or the DOL, IRS or a court could disagree. If the DOL, IRS or a court were to find that the assets of some or all of the Series (or Class of any Series) are the assets of Benefit Plan Investors, the Managing Owner and the Trading Advisors to such Series (or Class) may be fiduciaries and certain transactions in or by the Trust could be prohibited. For example, if the Trust were deemed to hold “plan assets,” within the meaning of 29 C.F.R. § 2510.3-101, the Trading Advisors may have to refrain from directing certain transactions that are currently contemplated. Furthermore, whether or not the Trust is deemed to hold plan assets, if a Benefit Plan Investor has certain pre-existing relationships with the Managing Owner, one or more Trading Advisors, the selling agents or a Clearing Broker, investment in a Series may be limited or prohibited. In the event that, for any reason, the assets of any Series (or Class of any Series) might be deemed to be “plan assets,” and if any transactions would or might constitute prohibited transactions under ERISA or the Code and an exemption for such transaction or transactions is not available or cannot be obtained (or the Managing Owner determines not to seek such exemption), the Managing Owner reserves the right, upon notice to, but without the consent of any limited owner, to mandatorily redeem Units held by any limited owner that is a Benefit Plan Investor. Furthermore, whether or not a Series (or Class of any Series) are plan assets, Benefit Plan Investors should consider their fiduciary responsibilities before making a decision to invest in a Series (or Class of any Series) and Plan investors who are not subject to ERISA may be subject to similar responsibilities under state, local, or non-U.S. law. 22 Foreign investors may face exchange rate risk and local tax consequences. Foreign investors should note that the Units are denominated in U.S. dollars and that changes in the rates of exchange between currencies may cause the value of their investment to decrease. Regulatory Risks Regulation of the Commodity Interest Markets is Extensive and Constantly Changing; Future Regulatory Developments are Impossible to Predict, but May Significantly and Adversely Affect the Trust. The futures, options on futures and security futures markets are subject to comprehensive statutes, regulations and margin requirements. With respect to traditional futures exchanges, the CFTC and the exchanges are authorized to take extraordinary actions in the event of a market emergency, including, for example, the retroactive implementation of speculative position limits or higher margin requirements, the establishment of daily limits and the suspension of trading. The regulation of commodity interest transactions in the United States is a rapidly changing area of law and is subject to ongoing modification by governmental and judicial action. In addition, various national governments have expressed concern regarding the disruptive effects of speculative trading in the currency markets and the need to regulate the derivatives markets in general. The effect of any future regulatory change is impossible to predict, but could be substantial and adverse. CFTC registrations could be terminated which could adversely affect the Trust or a Series. If the Commodity Exchange Act registrations or NFA memberships of the Managing Owner or the registered Trading Advisors were no longer effective, these entities would not be able to act for the Trust, which could adversely affect the Trust or such Series. The Trust and the Managing Owner have been represented by unified counsel, and neither the Trust nor the Managing Owner will retain independent counsel to review this offering. The Trust and the Managing Owner have been represented by unified counsel. To the extent that the Trust, the Managing Owner or you could benefit from further independent review, such benefit will not be available unless you separately retain such independent counsel. The foregoing risk factors are not a complete explanation of all the risks involved in purchasing interests in a fund that invests in the highly speculative, highly leveraged trading of futures, forwards and options. You should read this entire Form 10-K and the Prospectus before determining to subscribe for Units.
None.
The Trust does not own or use any physical properties in the conduct of its business. Its assets currently consist of cash items such as custom time deposits, and, through each Trading Company, 23
This section describes the major pending legal proceedings, other than ordinary routine litigation incidental to the business, to which the Managing Owner or its subsidiaries is a party or to which any of their property is subject. There are no material legal proceedings On January 19, 2016, the Managing Owner consented to and became the subject of an Order Instituting Administrative and Cease and- Desist Proceedings Pursuant to Section 8A of the Securities Act of 1933, Section 21C of the Securities Exchange Act of 1934, and Section 203(e) of the Investment Advisers Act of 1940, Making Findings, and Imposing Remedial Sanctions and a Cease-and- Desist Order by the SEC to resolve allegations related to certain disclosures of certain options invested in by certain of the Series of the Trust, as well as the Managing Owner’s calculation and disclosure of management fees paid by investors in certain of the Series. On or about March 16, 2016, the Managing Owner consented to and became the subject of an Order Instituting Proceedings Pursuant to Sections 6(c) and 6(d) of the Commodity Exchange Act, Making Findings and Imposing Remedial Sanctions by the CFTC to resolve similar claims. Specifically, each of the SEC and CFTC found that the Trust’s disclosures regarding its Without admitting or denying the underlying allegations and without adjudication of
Not applicable. 24
No Units in any Series are publicly traded. The Units in each Series may be redeemed, in whole or in part, on a daily basis, subject to a notice requirement as set forth in the Prospectus. Except as otherwise set forth in the Prospectus, Units will be redeemed at a redemption price equal to 100% of the NAV per Unit of the applicable Series, calculated as of the point described in the Prospectus. The redemption of Units has no impact on the value of Units that remain outstanding. The Managing Owner may temporarily suspend redemptions under limited circumstances described in the Prospectus. The right to obtain redemption of Units of a Series is contingent upon such Series’ having property sufficient to discharge its liabilities on the date of redemption. Further, if a Limited Owner redeems all or a portion of its Class 1 The Managing Owner has the sole discretion in determining what distributions, if any, the Trust will make to the Limited Owners. The Trust has not affected distributions on the Units in any Series as of the date hereof and the Managing Owner does not intend to effect any distributions in the foreseeable future. The proceeds of offerings are deposited in the bank and brokerage accounts of the Trust, 25 The following table shows the number of Limited Owners and the number of Units outstanding in each Class of each Series as of December 31,
No Units are authorized for issuance by the Trust under equity compensation plans. During the year ended December 31, 26
The selected financial information as of and for the years ended December 31, 2016, 2015, 2014, 2013, You should read this information in conjunction with “Management’s Discussion and Analysis of Financial Condition and Results of Operations” and our financial statements and the related notes included therewith. Results from past periods are not necessarily indicative of results that may be expected for any future period. 27 AS OF AND FOR THE YEAR ENDED DECEMBER 31, 2016
28 AS OF AND FOR THE YEAR ENDED DECEMBER 31, 2015
29 AS OF AND FOR THE YEAR ENDED DECEMBER 31, 2014
30
AS OF AND FOR THE YEAR ENDED DECEMBER 31, 2013
31
AS OF AND FOR THE YEAR ENDED DECEMBER 31, 2012
32
Supplementary Quarterly Financial Information The following summarized quarterly financial information presents the Trust’s results of operations for the three-month periods ended March 31, June 30, September 30, and December 31, 2016. The information in this chart has been prepared under the consolidation accounting policy discussed in Note 2 of the Series of Equinox Frontier Funds Financial Statements that accompany this filing. That policy was implemented in the current year. Previously filed quarterly data was prepared prior to the implementation of this accounting policy and has been modified accordingly.
33 The following summarized quarterly financial information presents the Trust’s results of operations for the three-month periods ended March 31, June 30, September 30, and December 31, 2015.
34 The following summarized quarterly financial information presents the Trust’s results of operations for the three-month periods ended March 31, June 30, September 30, and December 31, 2014.
35
Overview The Trust is a Delaware statutory trust formed on August 8, 2003. The Trust is a multi-advisor commodity pool, as described in CFTC Regulation § 4.10(d)(2). The Trust is authorized to issue multiple Series of Units, pursuant to the requirements of the Trust Act. The assets of each Series are held and accounted for in separate and distinct records separately from the assets of other Series. The Trust is managed by the Managing Owner, and its term will expire on December 31, 2053 (unless terminated earlier in certain circumstances). The Trust, with respect to each Series of Units, engages in the speculative trading of a diversified portfolio of futures, Critical Accounting Policies and Estimates The preparation of financial statements in conformity with accounting principles generally accepted in the United States (“GAAP”) requires the Managing Owner to adopt accounting policies and make estimates and assumptions that affect amounts reported in the Trust’s financial statements. The Trust’s most significant accounting policy, described below, includes the valuation of its futures and forward contracts, options contracts, swap contracts, U.S. treasury securities and investments in unconsolidated Trading The Trust’s other significant accounting policies are described in detail in Note 2 of the financial statements. Investment Transactions and Valuation The Managing Owner has evaluated the nature and type of transactions processed and estimates that it makes in preparing the Trust’s financial statements and related disclosures and has adoptedAccounting Standard Codification (“ASC”) 820,Fair Value Measurements and Disclosure, and implemented the framework for measuring fair value for assets and liabilities. The Trust utilizes valuation techniques that are consistent with the market approach per the requirement of ASC 820 for the valuation of futures (exchange traded) contracts, forward (non-exchange traded) contracts, option contracts, swap contracts and other non-cash assets. The market approach uses prices and other relevant information generated by market transactions involving identical or comparable assets or liabilities. The Trust applies the valuation techniques in a consistent manner for each asset or liability. The Trust records all investments at fair value in its Statements of Financial Condition, with changes in fair value reported as a component of net gain/(loss) on investments in the Statements of Operations. Inputs to valuation techniques refer to the assumptions that market participants would use in pricing the assets or liabilities. Inputs may be observable, meaning those that reflect the assumptions market participants would use in pricing the financial asset or liability based on market data obtained from independent sources, or unobservable, meaning those that reflect the reporting entity’s own assumptions about the assumptions market participants would use in pricing the financial asset or liability based on the best information available in the circumstances. In addition, the Trust monitors counterparty credit risk and incorporates any identified risk factors when assigning input levels to underlying financial assets or liabilities. In that regard ASC 820 establishes a fair value hierarchy for valuation inputs that gives the highest priority to quoted prices in active markets for identical financial assets and the lowest priority to unobservable inputs. A full disclosure of the fair value hierarchy is presented in Note 3 of the financial statements—Fair Value Measurements. 36 Liquidity and Capital Resources The Trust will raise additional capital only through the sale of Units offered pursuant to the continuing offering, and does not intend to raise any capital through borrowing. Due to the nature of the Trust’s business, it makes no capital expenditures and has no capital assets that are not operating capital or assets. The Managing Owner is responsible for the payment of all of the ordinary expenses associated with the organization of the Trust and the offering of each Series of Units, except for the initial and ongoing service fee, if any, and no Series will be required to reimburse these expenses. As a result, 100% of each Series’ offering proceeds are initially available for that Series’ trading activities. A portion of each Trading Company’s assets is used as margin to maintain that Trading Company’s forward currency contract positions, and another portion is deposited in cash in segregated accounts in the name of each Trading Company maintained for each Trading Company at the clearing brokers in accordance with CFTC segregation requirements. At December 31, Approximately 10% to 30% of the Trust’s assets are expected to be committed as required margin for futures contracts and forwards and options trading and held by the respective broker, although the amount committed may vary significantly. Such assets are maintained in the form of cash or U.S. treasury bills in segregated accounts with the futures broker pursuant to the Commodity Exchange Act and regulations there under. Approximately 2% to 6% of the Trust’s assets are expected to be deposited with over-the-counter counterparties in order to initiate and maintain forward and swap contracts. Such assets are not held in segregation or otherwise regulated under the Commodity Exchange Act, unless such over-the-counter counterparty is registered as a futures commission merchant. These assets are held either in U.S. government securities or short-term time deposits with U.S.-regulated bank affiliates of the over-the-counter counterparties. The remaining approximately 64% to 88% of the Trust’s assets will normally be invested in cash equivalents and short-term investments, such as money market funds and time deposits and held by the clearing broker, the over-the-counter counterparties and by U.S. federally chartered banks. As of December 31, As a commodity pool, the Registrant has large cash positions. Such cash positions are used to pay margin for the trading of futures, forwards and options, and also to pay redemptions. Generally, the Registrant has not been forced to liquidate positions to fund redemptions. During the fiscal year ended December 31, Off-Balance Sheet Risk The term “off-balance sheet risk” refers to an unrecorded potential liability that, even though it does not appear on the balance sheet, may result in future obligation or loss. Each Trading Company trades in futures, forward and swap contracts and is therefore a party to financial instruments with elements of off-balance sheet market and credit risk. In entering into these contracts there exists a market risk that such contracts may be significantly influenced by market conditions, such as interest rate volatility, resulting in such contracts being less valuable. If the markets should move against all of the futures interests positions held by a Trading Company in respect of any Series at the same time, and if the Trading Advisor(s) of such Trading Company are unable to offset such futures interests positions, such Trading Company could lose all of its assets and the holders of Units of such Series would realize a 100% loss. The Managing Owner seeks to minimize market risk through real-time monitoring of open positions and the level of diversification of each Trading Advisor’s portfolio. It is anticipated that any Trading Advisor’s margin-to-equity ratio will typically not exceed approximately 35% although the actual ratio could be higher or lower from time to time. 37 In addition to market risk, trading futures, forward and swap contracts entails credit risk which is the risk that a counterparty will not be able to meet its obligations to a Trading Company. The counterparty for futures contracts traded in the U.S. and on most foreign exchanges is the clearinghouse associated with such exchange. In general, clearinghouses are backed by the corporate members of the clearinghouse who are required to share any financial burden resulting from the non-performance by one of their members and, as such, should significantly reduce this credit risk. In cases where the clearinghouse is not backed by the clearing members, like some foreign exchanges, it is normally backed by a consortium of banks or other financial institutions. Some non-U.S. exchanges, in contrast to U.S. exchanges are principals’ markets in which performance is the responsibility only of the individual counterparty with whom the Trading Company has entered into the transaction and not of the exchange or clearing corporation. In these kinds of markets, there is risk of bankruptcy or other failure or refusal to perform by the counterparty. In the case of forward contracts The Trust has entered into agreements, which provide for the indemnification of futures clearing brokers, currency trading companies, and commodity trading advisers, among others, against losses, costs, claims and liabilities arising from the performance of their individual obligations under such agreements, except for gross negligence or bad faith. The Trust has had no prior claims or payments pursuant to these agreements. The Trust’s individual maximum exposure under these arrangements is unknown, as this would involve future claims that may be made against the Trust that have not yet occurred. However, based on experience the Trust expects the risk of loss to be remote. Disclosure of Contractual Obligations The business of the Trust is the speculative trading of commodity interests. The majority of the Trust’s futures and forward positions, which may be categorized as “purchase obligations” under Item 303 of Regulation S-K, are short-term. That is, they are held for less than one year. Because the Trust does not enter into other long-term debt obligations, capital lease obligations, operating lease obligations or other long-term liabilities that would otherwise be reflected on the Trust’s Statement of Financial Condition, a table of contractual obligations has not been presented. Results of Operations for the Twelve Months Ended December 31, 2016 Series Returns and Other Information The returns for each Series and Class of Units for the twelve months ended December 31, 2016, and related information, are discussed below. The activities of the Trust on a consolidated basis are explained through the activity of the underlying Series. Please refer to the discussion of the Series activities in relation to the Trust on a consolidated basis. Each Series had exposure to commodity interest positions within one or more sectors during fiscal 2016. The performance of each Series was impacted over the course of the year by, among other things, the relative performance of the relevant sector or sectors and the commodities within those sectors, the changing allocations among, and the specific positions taken by, the Series’ Trading Advisors in, the relevant sector(s) and commodities, and the timing of entries and exits. For each of the Series, a sector attribution chart has been included at the end of the relevant discussion. Each chart depicts the performance of the relevant Series’ positions within each of the relevant sectors (determined by the Managing Owner using monthly gross return and NAV figures, with various adjustments to net out a proportional allocation of the fees and expenses chargeable to the Series) during the fourth quarter (except as otherwise noted) and for the full calendar year. Charts depicting the performance of the various Series’ positions within each of the relevant sectors during the prior three quarters were included in the Trust’s quarterly reports on Form 10-Q previously filed. Equinox Frontier Diversified Fund 2016 The Equinox Frontier Diversified Fund – Class 1 NAV gained 0.79% for the twelve months ended December 31, 2016, net of fees and expenses; the Equinox Frontier Diversified Fund – Class 2 NAV gained 2.58% for the twelve months ended December 31, 2016 net of fees and expenses; the Equinox Frontier Diversified Fund – Class 3 NAV gained 2.84% for the twelve months ended December 31, 2016 net of fees and expenses. For the twelve months ended December 31, 2016 the Equinox Frontier Diversified Fund recorded a net gain on investments of $4,169,841, net investment income of $323,854, and total expenses of $3,330,405, resulting in a net increase in Owners’ capital from operations attributable to controlling interests of $1,163,290. The NAV per Unit, Class 1, increased from $115.52 at December 31, 2015, to $116.43 as of December 31, 2016. The NAV per Unit, Class 2, increased from $129.60 at December 31, 2015, to $132.94 as of December 31, 2016. The NAV per Unit, Class 3, increased from $119.87 at December 31, 2015, to $123.27 as of December 31, 2016. Total Class 1 subscriptions and redemptions for the period were $560,094 and $7,446,278, respectively. Total Class 2 subscriptions and redemptions for the period were $8,879,067 and $6,038,305, respectively. Total Class 3 subscriptions and redemptions for the period were $6,329,267 and $2,690,710, respectively. Ending capital at December 31, 2016, is $5,189,420 for Class 1 and $38,231,581 for Class 2 and $13,050,390 for Class 3. 38 The Equinox Frontier Diversified Fund may have both long and short exposure to the Interest Rates, Currencies, Stock Indices, Energies, Metals, and Commodities sectors. Sector Attribution for the Equinox Frontier Diversified Fund
39 Two of the six sectors traded in the Equinox Frontier Diversified Fund were profitable in Q4 2016. Stock Indices and Currencies were profitable while Interest Rates, Energies, Agriculturals, and Metals finished negative for the quarter. The Stock Indices and Interest Rates sectors were positive year-to-date (“YTD”) while Metals, Currencies, Agriculturals and Energies were negative YTD. In terms of major CTA performance, four of the ten major CTAs in the Equinox Frontier Diversified Fund were profitable in Q4 2016. Emil Van Essen, H2O, QIM and Quantmetrics finished positive for the quarter. Aspect, Chesapeake, Crabel, Fort, Quest, and Winton finished negative for the quarter. In terms of YTD performance Crabel, Emil Van Essen, and QIM are positive YTD while Aspect, Chesapeake, Fort, H2O, Quantmetrics, Quest, and Winton are negative YTD. Equinox Frontier Long/Short Commodity Fund 2016 The Equinox Frontier Long/Short Commodity Fund – Class 2 NAV lost 2.09% for the twelve months ended December 31, 2016, net of fees and expenses; the Equinox Frontier Long/Short Commodity Fund – Class 3 NAV lost 1.01% for the twelve months ended December 31, 2016, net of fees and expenses; the Equinox Frontier Long/Short Commodity Fund – Class 1a NAV lost 2.09% for the twelve months ended December 31, 2016, net of fees and expenses; the Equinox Frontier Long/Short Commodity Fund – Class 2a NAV lost 0.49% for the twelve months ended December 31, 2016, net of fees and expenses; the Equinox Frontier Long/Short Commodity Fund – Class 3a NAV gained 0.60% for the twelve months ended December 31, 2016, net of fees and expenses. For the twelve months ended December 31, 2016, the Equinox Frontier Long/Short Commodity Fund recorded net gain on investments of $483,619, net investment income of $21,855, and total expenses of $506,768, resulting in a net decrease in Owners’ capital from operations attributable to controlling interests of $133,170 after operations attributable to non-controlling interests of $131,876. The NAV per Unit, Class 2, decreased from $132.10 at December 31, 2015, to $129.56 as of December 31, 2016. The NAV per Unit, Class 3, decreased from $132.14 at December 31, 2015, to $130.80 as of December 31, 2016. The NAV per Unit, Class 1a, decreased from $94.76 at December 31, 2015, to $92.78 as of December 31, 2016. The NAV per Unit, Class 2a, decreased from $106.19 at December 31, 2015, to $105.67 as of December 31, 2016. The NAV per Unit, Class 3a, decreased from $106.86 at December 31, 2015, to $107.50 as of December 31, 2016. Total Class 2 subscriptions and redemptions for the twelve months were $0 and $167,296, respectively. Total Class 3 subscriptions and redemptions for the twelve months were $0 and $1,457,594, respectively. Total Class 1a subscriptions and redemptions for the twelve months were $0 and $2,078,012, respectively. Total Class 2a subscriptions and redemptions for the twelve months were $0 and $314,992, respectively. Total Class 3a subscriptions and redemptions for the twelve months were $534,064 and $210,324, respectively. Ending capital at December 31, 2016, is $808,137 for Class 2, $4,404,630 for Class 3, 1,913,059 for Class 1a, $962,925 for Class 2a and $1,174,183 for Class 3a. The Equinox Frontier Long/Short Commodity Fund may have both long and short exposure to the Interest Rates, Currencies, Stock Indices, Energies, Metals, and Commodities sectors, although the majority of the exposure will typically be in the Energies, Metals, and Commodities sectors. 40 Sector Attribution for the Equinox Frontier Long/Short Commodity Fund
41
Three of the seven sectors traded in the Equinox Frontier Long/Short Commodity Fund were profitable in Q4 2016. Energies, Softs, and Financials finished positive for the quarter while Base Metals, Meats, Grains, and Precious Metals finished negative for the quarter. Energies, Precious Metals, and Softs are positive YTD while Base Metals, Grains, Meats, and Financials are negative YTD. In terms of major CTA performance, Emil Van Essen and Red Oak finished positive for the quarter while Chesapeake, JE Moody, and Rosetta were negative for the quarter. In terms of YTD performance, Emil Van Essen and Red Oak are positive YTD while Chesapeake, JE Moody, and Rosetta are negative YTD. Equinox Frontier Masters Fund 2016 The Equinox Frontier Masters Fund – Class 1 NAV lost 0.06% for the twelve months ended December 31, 2016, net of fees and expenses, the Equinox Frontier Masters Fund – Class 2 NAV gained 1.72% for the twelve months ended December 31, 2016, net of fees and expenses, the Equinox Frontier Masters Fund – Class 3 NAV gained 1.97% for the twelve months ended December 31, 2016, net of fees and expenses. For the twelve months ended December 31, 2016 the Equinox Frontier Masters Fund recorded a net gain on investments of $1,745,161, net investment income of $133,801, and total expenses of $1,386,826, resulting in a net increase in Owners’ capital from operations attributable to controlling interests of $492,136. The NAV per Unit, Class 1, decreased from $112.87 at December 31, 2015, to $112.80 as of December 31, 2016. The NAV per Unit, Class 2, increased from $126.60 at December 31, 2015, to $128.78 as of December 31, 2016. The NAV per Unit, Class 3 increased from $117.57 at December 31, 2015 to $119.89 as of December 31, 2016. Total Class 1 subscriptions and redemptions for the twelve months were $125,188 and $3,203,465, respectively. Total Class 2 subscriptions and redemptions for the twelve months were $157,500 and $2,592,906, respectively. Total Class 3 subscriptions and redemptions for the twelve months were $1,835,158 and $2,472,603, respectively. Ending capital at December 31, 2016, is $5,361,626 for Class 1, $5,657,562 for Class 2 and $6,150,119 for Class 3. 42 The Equinox Frontier Masters Fund may have both long and short exposure to the Interest Rates, Currencies, Stock Indices, Energies, Metals, Hybrids, and Commodities sectors. Sector Attribution for the Equinox Frontier Masters Fund
43 Two of the seven sectors traded in the Equinox Frontier Masters Fund were profitable in Q4 2016. Stock Indices and Hybrids were positive while, Metals, Currencies, Energies, Agriculturals, and Interest Rates were negative for the quarter. Currencies, Energies, Interest Rates, Stock Indices, and Hybrids were positive for the year. In terms of major CTA performance, Chesapeake, Transtrend, and Winton finished negative for the quarter while Emil Van Essen was positive during the quarter. In terms of YTD performance, Emil Van Essen and Transtrend were positive while Chesapeake and Winton were negative YTD. Equinox Frontier Balanced Fund 2016 The Equinox Frontier Balanced Fund – Class 1 NAV gained 5.29% for the twelve months ended December 31, 2016, net of fees and expenses; The Equinox Frontier Balanced Fund – Class 1AP NAV gained 8.52% for the twelve months ended December 31, 2016, net of fees and expenses; the Equinox Frontier Balanced Fund – Class 2 NAV gained 8.51% for the twelve months ended December 31, 2016, net of fees and expenses; the Equinox Frontier Balanced Fund – Class 2a NAV gained 9.15% for the twelve months ended December 31, 2016, net of fees and expenses; the Equinox Frontier Balanced Fund – Class 3a NAV gained 9.15% for the twelve months ended December 31, 2016, net of fees and expenses. For the twelve months ended December 31, 2016, the Equinox Frontier Balanced Fund recorded net gain on investments of $10,486,586, net investment income of $96,270, and total expenses of $4,637,078, resulting in a net increase in Owners’ capital from operations attributable to controlling interests of $5,297,666 after operations attributable to non- controlling interests of $648,112. The NAV per Unit, Class 1, increased from $128.03 at December 31, 2015, to $134.80 at December 31, 2016 The NAV per Unit, Class 1AP, increased from $133.59 at December 31, 2015, to $144.97 at December 31, 2016 The NAV per Unit, Class 2, increased from $179.69 at December 31, 2015, to $194.99 at December 31, 2016. For Class 2a, the NAV per Unit increased from $154.88 at December 31, 2015, to $169.05 at December 31, 2016. For Class 3a, the NAV per Unit increased from $154.37 at December 31, 2015, to $168.49 at December 31, 2016. Total Class 1 subscriptions and redemptions for the twelve months were $214,073 and $8,950,159, respectively. Total Class 1AP subscriptions and redemptions for the twelve months were $0 and $95,000, respectively. Total Class 2 subscriptions and redemptions for the twelve months were $19,471 and $2,180,977, respectively. Total Class 2a subscriptions and redemptions for the twelve months were $0 and $78,366, respectively. Total Class 3a subscriptions and redemptions for the twelve months were $0 and $897,320, respectively. Ending capital at December 31, 2016, was $56,955,371 for Class 1, $677,181 for Class 1 AP, $22,401,557 for Class 2, $516,256 for Class 2a and $1,749,006 for Class 3a. The Equinox Frontier Balanced Fund may have both long and short exposure to the Interest Rates, Currencies, Stock Indices, Energies, Metals, and Commodities sectors. 44 Sector Attribution for the Frontier Equinox Frontier Balanced Fund
45
Four of the six sectors traded in the Equinox Frontier Balanced Fund were profitable in Q4 2016. Currencies, Stock Indices Agricultures and Metals were profitable while Interest Rates and Energies finished negative for the quarter. The Stock Indices, Interest Rates, Agriculturals, and Energies sectors were positive YTD while Metals and Currencies were negative YTD. In terms of major CTA performance, Beach Horizon, Emil Van Essen, H2O, QIM, and Quantmetrics finished positive for the quarter. Aspect, Crabel, Fort, and Winton finished negative for the quarter. Brandywine, Cantab, Crabel, Emil Van Essen, Fort, H2O, and QIM were positive YTD. Aspect, Beach Horizon, Quantmetrics, and Winton were negative YTD. The series deallocated to Brandywine and Cantab during the year. Equinox Frontier Select Fund 2016 The Equinox Frontier Select Fund – Class 1 NAV gained 4.11% for the twelve months ended December 31, 2016, net of fees and expenses; The Equinox Frontier Select Fund – Class 1AP NAV gained 7.30% for the twelve months ended December 31, 2016, net of fees and expenses; the Equinox Frontier Select Fund – Class 2 NAV gained 7.31% for the twelve months ended December 31, 2016, net of fees and expenses. 46 For the twelve months ended December 31, 2016, the Equinox Frontier Select Fund recorded net gain on investments of $2,398,954, net investment income of $1,025, and total expenses of $792,796, resulting in a net increase in Owners’ capital from operations attributable to controlling interests of $617,789 after operations attributable to non-controlling interests of $989,394. The NAV per Unit, Class 1, increased from $90.35 at December 31, 2015, to $94.06 as of December 31, 2016. The NAV per Unit, Class 1AP, increased from $94.28 at December 31, 2015, to $101.16 as of December 31, 2016. The NAV per Unit, Class 2, increased from $125.11 at December 31, 2015, to $134.25 as of December 31, 2016. Total Class 1 subscriptions and redemptions for the twelve months ended December 31, 2016, were $16,022 and $1,700,518, respectively. Total Class 1AP subscriptions and redemptions for the twelve months ended December 31, 2016, were $0 and $21,949, respectively. Total Class 2 subscriptions and redemptions for the twelve months ended December 31, 2016, were $0 and $25,360, respectively. Ending capital, at December 31, 2016, was $10,540,702 for Class 1, $ 29,897 for Class 1AP, and $1,411,440 for Class 2. The Equinox Frontier Select Fund may have both long and short exposure to the Interest Rates, Currencies, Stock Indices, Energies, Metals, Hybrids, and Commodities sectors. 47 Sector Attribution for the Equinox Frontier Select Fund
48 Three of the seven sectors traded in the Equinox Frontier Select Fund were profitable in Q4 2016. Currencies, Metals, and Stock Indices were positive while, Energies, Agriculturals, Interest Rates, and Hybrids were negative for the quarter. Currencies, Interest Rates, Stock Indices, and Hybrids were positive YTD while Metals, Energies, and Agriculturals were negative YTD. In terms of major CTA performance Brevan Howard finished positive for the quarter. Brevan Howard and Transtrend finished the year positive. Equinox Frontier Winton Fund 2016 The Equinox Frontier Winton Fund – Class 1 NAV lost 5.88% for the twelve months ended December 31, 2016, net of fees and expenses; The Equinox Frontier Winton Fund – Class 1AP NAV lost 3.00% for the twelve months ended December 31, 2016, net of fees and expenses; the Equinox Frontier Winton Fund – Class 2 NAV lost 3.00% for the twelve months ended December 31, 2016, net of fees and expenses. For the twelve months ended December 31, 2016, the Equinox Frontier Winton Fund recorded net gain on investments of $1,071,349, net investment income of $7,717, and total expenses of $2,240,389, resulting in a net decrease in Owners’ capital from operations attributable to controlling interests of $1,625,498 after operations attributable to non-controlling interests of $464,175. The NAV per Unit, Class 1, decreased from $164.17 at December 31, 2015 to $154.51 as of December 31, 2016. The NAV per Unit, Class 1AP, decreased from $171.31 at December 31, 2015 to $166.17 as of December 31, 2016. The NAV per Unit, Class 2, decreased from $217.51 at December 31, 2015, to $210.98 as of December 31, 2016. Total Class 1 subscriptions for the year were $159,082 and redemptions were $1,620,516. Total Class 1AP subscriptions for the year were $0 and redemptions were $0. Total Class 2 subscriptions for the year were $0 and redemptions were $88,086. Ending capital, at December 31, 2016, was $20,228,679 for Class 1, $35,380 for Class 1AP, and $11,446,113 for Class 2. The Equinox Frontier Winton Fund may have both long and short exposure to the Interest Rates, Currencies, Stock Indices, Energies, Metals, and Commodities sectors. 49 Sector Attribution for the Equinox Frontier Winton Fund
Two of the six sectors traded in the Equinox Frontier Winton Fund were profitable in Q4 2016. Currencies and Stock Indices were positive while Metals, Energies, Agriculturals, and Interest Rates were negative for the quarter. Currencies and Interest Rates were positive YTD while Metals, Energies, Agriculturals, and Stock Indices were negative YTD. 50 Equinox Frontier Heritage Fund 2016 The Equinox Frontier Heritage Fund – Class 1 NAV lost 3.77% for the twelve months ended December 31, 2016, net of fees and expenses; The Equinox Frontier Heritage Fund – Class 1AP NAV lost 0.83% for the twelve months ended December 31, 2016, net of fees and expenses; the Equinox Frontier Heritage Fund – Class 2 NAV lost 0.83% for the twelve months ended December 31, 2016, net of fees and expenses. For the twelve months ended December 31, 2016, the Equinox Frontier Heritage Fund recorded net gain on investments of $524,782, net investment income of $1,430, and total expenses of $610,757, resulting in a net decrease in Owners’ capital from operations of $301,637, after non-controlling interest of $217,092. The NAV per Unit, Class 1, decreased from $124.27 at December 31, 2015, to $119.58 as of December 31, 2016. The NAV per Unit, Class 1AP, decreased from $129.67 at December 31, 2015, to $128.60 as of December 31, 2016. The NAV per Unit, Class 2, decreased from $173.54 at December 31, 2015, to $172.10 as of December 31, 2016. Total Class 1 subscriptions and redemptions for the twelve months were $35,716 and $871,326, respectively. Total Class 1AP subscriptions and redemptions for the twelve months were $0 and $56,051, respectively. Total Class 2 subscriptions and redemptions for the twelve months were $0 and $90,031, respectively. Ending capital, at December 31, 2016, was $7,507,072 for Class 1, $5,826 for Class 1AP and $2,744,375 for Class 2. The Equinox Frontier Heritage Fund may have both long and short exposure to the Interest Rates, Currencies, Stock Indices, Energies, Metals, and Commodities sectors. 51 Sector Attribution for the Equinox Frontier Heritage Fund
52 Two of the six sectors traded in the Equinox Frontier Heritage Fund were profitable in Q4 2016. Currencies and Stock Indices were positive while Metals, Energies, Agriculturals, and Interest Rates were negative for the quarter. Interest Rates and Stock Indices were positive YTD while Metals, Currencies, Energies, and Agriculturals were negative YTD. In terms of major CTA performance, Brevan Howard and Winton finished down for the quarter, while Brevan Howard finished positive YTD. Results of Operations for the Twelve Months Ended December 31, 2015 The returns for each Series and Class of Units for the twelve months ended December 31, 2015, and related information, are discussed below. The activities of the Trust on a consolidated basis are explained through the activity of the underlying Series. Please refer to the discussion of the Series activities in relation to the Trust on a consolidated basis. Each Series had exposure to commodity interest positions within one or more sectors during fiscal 2015. The performance of each Series was impacted over the course of the year by, among other things, the relative performance of the relevant sector or sectors and the commodities within those sectors, the changing allocations among, and the specific positions taken by, the Series’ Trading Advisors in, the relevant sector(s) and commodities, and the timing of entries and exits. For each of the Series, a sector attribution chart has been included at the end of the relevant discussion. Each chart depicts the performance of the relevant Series’ positions within each of the relevant sectors (determined by the Managing Owner using monthly gross return and NAV figures, with various adjustments to net out a proportional allocation of the fees and expenses chargeable to the Series) during the fourth quarter (except as otherwise noted) and for the full calendar year. Charts depicting the performance of the various Series’ positions within each of the relevant sectors during the prior three quarters were included in the Trust’s quarterly reports on Form 10-Q previously filed. Equinox Frontier Diversified Fund 2015 The Equinox Frontier Diversified Fund– Class 1 NAV gained 2.15% for the twelve months ended December 31, 2015, net of fees and expenses; the Equinox Frontier Diversified Fund– Class 2 NAV gained 3.95% for the twelve months ended December 31, 2015 net of fees and expenses; the Equinox Frontier Diversified Fund-Class 3 NAV gained 4.21% for the twelve months ended December 31, 2015 net of fees and expenses. For the twelve months ended December 31, 2015 the Equinox Frontier Diversified Fund recorded a net gain on investments of $7,062,279, net investment income of $603,350, and total expenses of $4,859,068, resulting in a net increase in Owners’ capital from operations of $2,585,692. The NAV per Unit, Class 1, increased from $113.09 at December 31, 2014, to $115.52 as of December 31, 2015. The NAV per Unit, Class 2, increased from $124.67 at December 31, 2014, to $129.60 as of December 31, 2015. The NAV per Unit, Class 3, increased from $115.03 at December 31, 2014 to $119.87 at December 31, 2015. Total Class 1 subscriptions and redemptions for the period were $1,849,550 and $10,085,317, respectively. Total Class 2 subscriptions and redemptions for the period were $4,193,326 and $6,595,532, respectively. Total Class 3 subscriptions and redemptions for the period were $6,490,334 and $2,875,045, respectively. Ending capital at December 31, 2015, was $11,814,234 for Class 1, $34,633,100 for Class 2 and $9,267,632 for Class 3. The Equinox Frontier Diversified Fund may have both long and short exposure to the Interest Rates, Currencies, Stock Indices, Energies, Metals, and Commodities sectors. 53 Sector Attribution for the Equinox Frontier Diversified Fund
Two of the six sectors traded in the Equinox Frontier Diversified Fund were profitable in Q4 2015. Metals and Energies were profitable while Currencies, Energies, Interest Rates and Stock Indices finished negative for the quarter. The Currencies sector was positive year-to-date (“YTD”) while Metals, Agriculturals, Interest Rates, Stock Indices and Energies were negative YTD. In terms of major CTA performance, seven of the eleven major CTAs in the Equinox Frontier Diversified Fund were profitable in Q4 2015. Chesapeake, Crabel, Doherty, Emil Van Essen, H20, QIM and Winton finished positive for the quarter. Brevan Howard, Fort, Quantmetrics and Quest finished negative for the quarter. In terms of YTD performance Chesapeake, Doherty, Emil Van Essen, H20, QIM and Winton are positive YTD while Brevan Howard, Fort, Quatmetrics, Quest and Crabel are negative YTD. 54 Equinox Frontier Long/Short Commodity Fund 2015 The Equinox Frontier Long/Short Commodity Fund – Class 2 NAV lost 4.48% for the twelve months ended December 31, 2015, net of fees and expenses; the Equinox Frontier Long/Short Commodity Fund – Class 3 NAV lost 4.48% for the twelve months ended December 31, 2015, net of fees and expenses; the Equinox Frontier Long/Short Commodity Fund – Class 1a NAV lost 6.29% for the twelve months ended December 31, 2015, net of fees and expenses; the Equinox Frontier Long/Short Commodity Fund – Class 2a NAV lost 4.63% for the twelve months ended December 31, 2015, net of fees and expenses; the Equinox Frontier Long/Short Commodity Fund – Class 3a NAV lost 4.39% for the twelve months ended December 31, 2015, net of fees and expenses. For the twelve months ended December 31, 2015, the Equinox Frontier Long/Short Commodity Fund recorded net loss on investments of $391,811, net investment income of $141,120, and total expenses of $1,207,403, resulting in a net decrease in Owners’ capital from operations attributable to controlling interests of $1,458,094. The NAV per Unit, Class 2, decreased from $138.30 at December 31, 2014, to $132.10 as of December 31, 2015. The NAV per Unit, Class 3, decreased from $138.34 at December 31, 2014, to $132.14 as of December 31, 2015. The NAV per Unit, Class 1a, decreased from $101.12 at December 31, 2014, to $94.76 as of December 31, 2015. The NAV per Unit, Class 2a, decreased from $111.35 at December 31, 2014, to $106.19 as of December 31, 2015. The NAV per Unit, Class 3a, decreased from $111.77 at December 31, 2014, to $106.86 as of December 31, 2015. Total Class 2 subscriptions and redemptions for the twelve months were $0 and $226,318, respectively. Total Class 3 subscriptions and redemptions for the twelve months were $0 and $1,101,195, respectively. Total Class 1a subscriptions and redemptions for the twelve months were $67,800 and $1,587,283, respectively. Total Class 2a subscriptions and redemptions for the twelve months were $29,300 and $402,748, respectively. Total Class 3a subscriptions and redemptions for the twelve months were $415,099 and $167,791, respectively. Ending capital at December 31, 2015, was $993,600 for Class 2, $5,906,669 for Class 3, $4,053,754 for Class 1a, $1,287,665 for Class 2a and $851,163 for Class 3a. The Equinox Frontier Long/Short Commodity Fund may have both long and short exposure to the Interest Rates, Currencies, Stock Indices, Energies, Metals, and Commodities sectors, although the majority of the exposure will typically be in the Energies, Metals, and Commodities sectors. 55 Sector Attribution for the Equinox Frontier Long/Short Commodity Fund
56
Two of the seven sectors traded in the Equinox Frontier Long/Short Commodity Fund were profitable in Q4 2015. Base Metals and Energies finished positive for the quarter while Meats, Grains, Precious Metals, Precious Metals, Financials and Softs finished negative for the quarter. Energies and Softs are positive YTD while Base Metals, Grains, Meats, Precious Metals and Financials are negative YTD. In terms of major CTA performance, Chesapeake, Emil Van Essen and JE Moody finished positive for the quarter while Red Oak Essen and Rosetta were negative for the quarter. In terms of YTD performance, Chesapeake, Emil Van Essen and JE Moody are positive YTD while Abraham, Red Oak and Rosetta are negative YTD. Equinox Frontier Masters Fund 2015 The Equinox Frontier Masters Fund – Class 1 NAV lost 3.21% for the twelve months ended December 31, 2015, net of fees and expenses; the Equinox Frontier Masters Fund – Class 2 NAV lost 1.50% for the twelve months ended December 31, 2015, net of fees and expenses, the Equinox Frontier Masters Fund – Class 3 NAV lost 1.25% for the twelve months ended December 31, 2015, net of fees and expenses. For the twelve months ended December 31, 2015 the Equinox Frontier Masters Fund recorded a net gain on investments of $1,398,913, net investment income of $260,900, and total expenses of $2,122,056, resulting in a net decrease in Owners’ capital from operations attributable to controlling interests of $462,243. The NAV per Unit, Class 1, decreased from $116.61 at December 31, 2014, to $112.87 as of December 31, 2015. The NAV per Unit, Class 2, decreased from $128.53 at December 31, 2014, to $126.60 as of December 31, 2015. The NAV per Unit, Class 3 decreased from $119.06 at December 31, 2014 to $117.57 as of December 31, 2015. Total Class 1 subscriptions and redemptions for the period were $2,092,649 and $5,299,823, respectively. Total Class 2 subscriptions and redemptions for the period were $174,300 and $1,041,711, respectively. Total Class 3 subscriptions and redemptions for the period were $3,820,000 and $2,162,727, respectively. Ending capital at December 31, 2015, was $8,323,800 for Class 1, $7,893,358 for Class 2 and $6,611,141 for Class 3. The Equinox Frontier Masters Fund may have both long and short exposure to the Interest Rates, Currencies, Stock Indices, Energies, Metals, and Commodities sectors. 57 Sector Attribution for the Equinox Frontier Masters Fund
Two of the seven sectors traded in the Equinox Frontier Masters Fund were profitable in Q4 2015. Metals and Energies were positive while Currencies, Agriculturals, Interest Rates, Stock Indices and Hybrids were negative for the quarter. Metals, Energies and Hybrids were positive for the year, while Currencies, Agriculturals, Interest Rates and Stock Indices were negative for the year. In terms of major CTA performance, Chesapeake, Emil Van Essen, Transtrend and Winton were positive during the quarter. Chesapeake and Emil Van Essen were positive YTD while Transtrend and Winton were negative YTD. 58 Equinox Frontier Balanced Fund 2015 The Equinox Frontier Balanced Fund – Class 1 NAV lost 2.67% for the twelve months ended December 31, 2015, net of fees and expenses; the Equinox Frontier Balanced Fund – Class 1AP NAV gained 0.29% for the twelve months ended December 31, 2015, net of fees and expenses; the Equinox Frontier Balanced Fund – Class 2 NAV gained 0.30% for the twelve months ended December 31, 2015, net of fees and expenses; the Equinox Frontier Balanced Fund – Class 2a NAV gained 1.22% for the twelve months ended December 31, 2015, net of fees and expenses; the Equinox Frontier Balanced Fund – Class 3a NAV gained 1.21% for the twelve months ended December 31, 2015, net of fees and expenses. For the twelve months ended December 31, 2015, the Equinox Frontier Balanced Fund recorded net gain on investments of $4,329,355, net investment income of $29,151, and total expenses of $5,591,382, resulting in a net decrease in Owners’ capital from operations attributable to controlling interests of $1,492,595 after operations attributable to non- controlling interests of $259,719. The NAV per Unit, Class 1, decreased from $131.54 at December 31, 2014, to $128.03 at December 31, 2015. The NAV per Unit, Class 1AP, increased from $133.20 at December 31, 2014, to $133.59 at December 31, 2015. The NAV per Unit, Class 2, increased from $179.16 at December 31, 2014, to $179.69 at December 31, 2015. For Class 2a, the NAV per Unit increased from $153.02 at December 31, 2014, to $154.88 at December 31, 2015. For Class 3a, the NAV per Unit increased from $152.52 at December 31, 2014, to $154.37 at December 31, 2015. Total Class 1 subscriptions and redemptions for the twelve months were $215,189 and $8,249,954, respectively. Total Class 1AP subscriptions and redemptions for the twelve months were $1,457 and $39,001, respectively. Total Class 2 subscriptions and redemptions for the twelve months were $19,235 and $982,356, respectively. Total Class 2a redemptions for the twelve month period were $60,850. There were no Class 2a subscriptions. Total Class 3a redemptions for the period were $127,078. There were no Class 3 subscriptions. Ending capital at December 31, 2015, was $62,563,337 for Class 1, $714,747 for Class 1AP, $22,708,408 for Class 2, $548,070 for Class 2a and $2,435,421 for Class 3a. The Equinox Frontier Balanced Fund may have both long and short exposure to the Interest Rates, Currencies, Stock Indices, Energies, Metals, and Commodities sectors. 59 Sector Attribution for the Frontier Equinox Frontier Balanced Fund
60
Two of the six sectors traded in the Equinox Frontier Balanced Fund were profitable in Q4 2015. Currencies and Energies were profitable while Metals, Agriculturals, Interest Rates and Stock Indices finished negative for the quarter. The Currencies, Interest Rates and Energies sectors were positive YTD while Metals, Agriculturals and Stock Indices were negative YTD. In terms of major CTA performance, Cantab, Crabel, Doherty, Emil Van Essen, Fort (GD), H20, QIM, and Winton finished positive for the quarter. Beach Horizon, Doherty, Emil Van Essen, Fort (GD), H20 AM, QIM and Winton were positive YTD. Beach Horizon, Brandywine, Fort (GC), Quantmetrics, and Quest finished negative for the quarter. Brandywine, Cantab, Crabel, Campbell, Fort (GC), Quantica, Quantmetrics, Quest and Systematic Alpha were negative YTD. 61 Equinox Frontier Select Fund 2015 The Equinox Frontier Select Fund – Class 1 NAV lost 5.50% for the twelve months ended December 31, 2015, net of fees and expenses; the Equinox Frontier Select Fund – Class 1AP NAV lost 2.62% for the twelve months ended December 31, 2015, net of fees and expenses. The Equinox Frontier Select Fund – Class 2 NAV lost 2.62% for the twelve months ended December 31, 2015, net of fees and expenses. For the twelve months ended December 31, 2015, the Equinox Frontier Select Fund recorded net gain on investments of $272,917, net investment income of $0, and total expenses of $968,941, resulting in a net decrease in Owners’ capital from operations of $730,624. The NAV per Unit, Class 1, decreased from $95.61 at December 31, 2014, to $90.35 as of December 31, 2015. The NAV per Unit, Class 1AP, decreased from $96.82 at December 31, 2014, to $94.28 as of December 31, 2015. The NAV per Unit, Class 2, decreased from $128.48 at December 31, 2014, to $125.11 as of December 31, 2014. Total Class 1 subscriptions and redemptions for the twelve months ended December 31, 2015, were $18,418 and $1,275,096, respectively. Total Class 1AP subscriptions and redemptions for the twelve months ended December 31, 2015, were $930 and $0, respectively. Total Class 2 redemptions for the twelve months ended December 31, 2015, were $187,051. There were no Class 2 subscriptions. Ending capital at December 31, 2015, was $11,710,517 for Class 1, $47,365 for Class 1AP and $1,338,173 for Class 2. The Equinox Frontier Select Fund may have both long and short exposure to the Interest Rates, Currencies, Stock Indices, Energies, Metals, and Commodities sectors. 62 Sector Attribution for the Equinox Frontier Select Fund
Two of the seven sectors traded in the Equinox Frontier Select Fund were profitable in Q4 2015. Metals and Energies were positive while Agriculturals, Currencies, Interest Rates, Hybrids and Stock Indices were negative for the quarter. Currencies, Energies and Metals were positive YTD while Agriculturals, Interest Rates, Hybrids and Stock Indices were negative YTD. In terms of major CTA performance Brevan Howard and Transtrend finished negative for the quarter, while Brevan Howard finished positive YTD and Transtrend finished negative YTD. 63 Equinox Frontier Winton Fund 2015 The Equinox Frontier Winton Fund – Class 1 NAV lost 6.70% for the twelve months ended December 31, 2015, net of fees and expenses; the Equinox Frontier Winton Fund – Class 1AP NAV lost 3.86% for the twelve months ended December 31, 2015, net of fees and expenses the Equinox Frontier Winton Fund – Class 2 NAV lost 3.85% for the twelve months ended December 31, 2015, net of fees and expenses. For the twelve months ended December 31, 2015, the Equinox Frontier Winton Fund recorded net gain on investments of $1,380,625, net investment income of $28, and total expenses of $2,967,166, resulting in a net decrease in Owners’ capital from operations of $2,160,638. The NAV per Unit, Class 1, decreased from $175.95 at December 31, 2014 to $164.17 as of December 31, 2015. The NAV per Unit, Class 1AP, decreased from $178.18 at December 31, 2014 to $171.31 as of December 31, 2015. The NAV per Unit, Class 2, decreased from $226.23 at December 31, 2014, to $217.51 as of December 31, 2015. Total Class 1 subscriptions for the year were $175,616 and redemptions were $2,337,287. There were no Class 1AP subscriptions or redemptions for 2015. Total Class 2 redemptions for the year were $787,381. There were no Class 2 subscriptions. Ending capital at December 31, 2015, was $23,022,800 for Class 1, $36,576 for Class 1AP and $11,882,167 for Class 2. The Equinox Frontier Winton Fund may have both long and short exposure to the Interest Rates, Currencies, Stock Indices, Energies, Metals, and Commodities sectors. Sector Attribution for the Equinox Frontier Winton Fund
Two of the six sectors traded in the Equinox Frontier Winton Fund were profitable in Q4 2015. Currencies and Energies were positive while Metals, Agriculturals, Interest Rates and Stock Indices were negative for the quarter. Metals, Energies and Interest Rates were positive YTD while Currencies, Agriculturals and Stock Indices were negative YTD. 64 Equinox Frontier Heritage Fund 2015 The Equinox Frontier Heritage Fund – Class 1 NAV lost 4.61% for the twelve months ended December 31, 2015, net of fees and expenses; the Equinox Frontier Heritage Fund – Class 1AP NAV lost 1.71% for the twelve months ended December 31, 2015, net of fees and expenses. the Equinox Frontier Heritage Fund – Class 2 NAV lost 1.71% for the twelve months ended December 31, 2015, net of fees and expenses. For the twelve months ended December 31, 2015, the Equinox Frontier Heritage Fund recorded net gain on investments of $555,165, net investment income of $1, and total expenses of $797,550, resulting in a net decrease in Owners’ capital from operations of $450,548, after non-controlling interest of $208,163. The NAV per Unit, Class 1, decreased from $130.28 at December 31, 2014, to $124.27 as of December 31, 2015. The NAV per Unit, Class 1AP, decreased from $131.93 at December 31, 2014, to $129.67 as of December 31, 2015. The NAV per Unit, Class 2, decreased from $176.56 at December 31, 2014, to $173.54 as of December 31, 2015. Total Class 1 subscriptions and redemptions for the twelve months were $41,712 and $766,234, respectively. Total Class 1AP subscriptions for the twelve months were $1,288. There were no redemptions for Class 1AP. Total Class 2 redemptions for the twelve months were $312,995. There were no subscriptions for Class 2. Ending capital at December 31, 2015, was $8,628,726 for Class 1, $58,523 for Class 1AP and $2,853,353 for Class 2. The Equinox Frontier Heritage Fund may have both long and short exposure to the Interest Rates, Currencies, Stock Indices, Energies, Metals, and Commodities sectors. 65 Sector Attribution for the Equinox Frontier Heritage Fund
Two of the six sectors traded in the Equinox Frontier Heritage Fund were profitable in Q4 2015. Metals and Energies were positive while Currencies, Agriculturals, Interest Rates and Stock Indices were negative for the quarter. Currencies, Metals and Energies were positive YTD while Agriculturals, Interest Rates and Stock Indices were negative YTD. In terms of major CTA performance, Brevan Howard finished down for both the quarter and the year, while Winton finished down YTD as well. 66 Results of Operations for the Twelve Months Ended December 31, 2014 Series Returns and Other Information The returns for each Series and Class of Units for the twelve months ended December 31, 2014, and related information, are discussed below. The activities of the Trust on a consolidated basis are explained through the activity of the underlying Series. Please refer to the discussion of the Series activities in relation to the Trust on a consolidated basis. Each Series had exposure to commodity interest positions within one or more sectors during fiscal 2014. The performance of each Series was impacted over the course of the year by, among other things, the relative performance of the relevant sector or sectors and the commodities within those sectors, the changing allocations among, and the specific positions taken by, the Series’ Trading Advisors in, the relevant sector(s) and commodities, and the timing of entries and exits. For each of the Series, a sector attribution chart has been included at the end of the relevant discussion. Each chart depicts the performance of the relevant Series’ positions within each of the relevant sectors (determined by the Managing Owner using monthly gross return and NAV figures, with various adjustments to net out a proportional allocation of the fees and expenses chargeable to the Series) during the fourth quarter (except as otherwise noted) and for the full calendar year. Charts depicting the performance of the various Series’ positions within each of the relevant sectors during the prior three quarters were included in the Trust’s quarterly reports on Form 10-Q previously filed. Equinox Frontier Diversified Fund 2014 The Equinox Frontier Diversified Fund– Class 1 NAV gained 29.84% for the twelve months ended December 31, 2014, net of fees and expenses; the Equinox Frontier Diversified Fund– Class 2 NAV gained 32.14% for the twelve months ended December 31, 2014 net of fees and expenses; the Equinox Frontier Diversified Fund-Class 3 NAV gained 36.60% for the twelve months ended December 31, 2014 net of fees and expenses. For the twelve months ended December 31, 2014 the Equinox Frontier Diversified Fund recorded a net gain on investments of and redemptions for the period were $695,759 and $8,646,009, respectively. Total Class 3 subscriptions and redemptions for the period were $5,633,483 and $1,437,475, respectively. Ending capital at December 31, 2014, was $19,195,036 for Class 1, $35,224,292 for Class 2 and $5,588,281 for Class 3. The Equinox Frontier Diversified Fund may have both long and short exposure to the Interest Rates, Currencies, Stock Indices, Energies, Metals, and Commodities sectors. 67 Sector Attribution for the Equinox Frontier Diversified Fund
Four of the six sectors traded in the Equinox Frontier Diversified Fund were profitable in Q4 2014. Currencies, Energies, Interest Rates and Stock Indices were profitable while Metals and Agriculturals finished negative for the quarter. The Currencies, Agriculturals, Interest Rates and Stock Indices sectors were positive year-to-date (“YTD”) while Metals and Energies were negative YTD. In terms of major CTA performance, eight of the ten major CTAs in the Equinox Frontier Diversified Fund were profitable in Q4 2014. Brevan Howard, Chesapeake, Crabel, Emil Van Essen, Fort, Quantmetrics, Quest Partners and Winton finished positive for the quarter. H20 and QIM finished negative for the quarter. In terms of YTD performance Breven Howard, Chesapeake, Crabel, Doherty, Fort, H20, Quantmetrics, Quest and Winton are positive YTD while Emil Van Essen and QIM are negative YTD. 68 Equinox Frontier Long/Short Commodity Fund 2014 The Equinox Frontier Long/Short Commodity Fund – Class 2 NAV gained 10.41% for the twelve months ended December 31, 2014, net of fees and expenses; the Equinox Frontier Long/Short Commodity Fund – Class 3 NAV gained 10.41% for the twelve months ended December 31, 2014, net of fees and expenses; the Equinox Frontier Long/Short Commodity Fund – Class 1a NAV gained 9.05% for the twelve months ended December 31, 2014, net of fees and expenses; the Equinox Frontier Long/Short Commodity Fund – Class 2a NAV gained 10.97% for the twelve months ended December 31, 2014, net of fees and expenses; the Equinox Frontier Long/Short Commodity Fund – Class 3a NAV gained 11.25% for the twelve months ended December 31, 2014, net of fees and expenses. For the twelve months ended December 31, 2014, the Equinox Frontier Long/Short Commodity Fund recorded net gain on investments of $1,582,778, net investment income of $216,027, and total expenses of $1,487,941, resulting in a net increase in Owners’ capital from operations attributable to controlling interests of $1,077,686. The NAV per Unit, Class 2, increased from $125.26 at December 31, 2013, to $138.30 as of December 31, 2014. The NAV per Unit, Class 3, increased from $125.30 at December 31, 2013, to $138.34 as of December 31, 2014. The NAV per Unit, Class 1a, increased from $92.73 at December 31, 2013, to $101.12 as of December 31, 2014. The NAV per Unit, Class 2a, increased from $100.34 at December 31, 2013, to $111.35 as of December 31, 2014. The NAV per Unit, Class 3a, increased from $100.47 at December 31, 2013, to $111.77 as of December 31, 2014 Total Class 2 subscriptions and redemptions for the twelve months were $0 and $2,130,879, respectively. Total Class 3 subscriptions and redemptions for the twelve months were $0 and $2,978,679, respectively. Total Class 1a subscriptions and redemptions for the twelve months were $107,716 and $3,407,382, respectively. Total Class 2a subscriptions and redemptions for the twelve months were $0 and $1,485,154, respectively. Total Class 3a subscriptions and redemptions for the twelve months were $514,745 and $186,230, respectively. Ending capital at December 31, 2014, was $1,246,481 for Class 2, $7,233,099 for Class 3, $5,776,906 for Class 1a, $1,702,551 for Class 2a and $657,882 for Class 3a. The Equinox Frontier Long/Short Commodity Fund may have both long and short exposure to the Interest Rates, Currencies, Stock Indices, Energies, Metals, and Commodities sectors, although the majority of the exposure will typically be in the Energies, Metals, and Commodities sectors. Sector Attribution for the Equinox Frontier Long/Short Commodity Fund
69
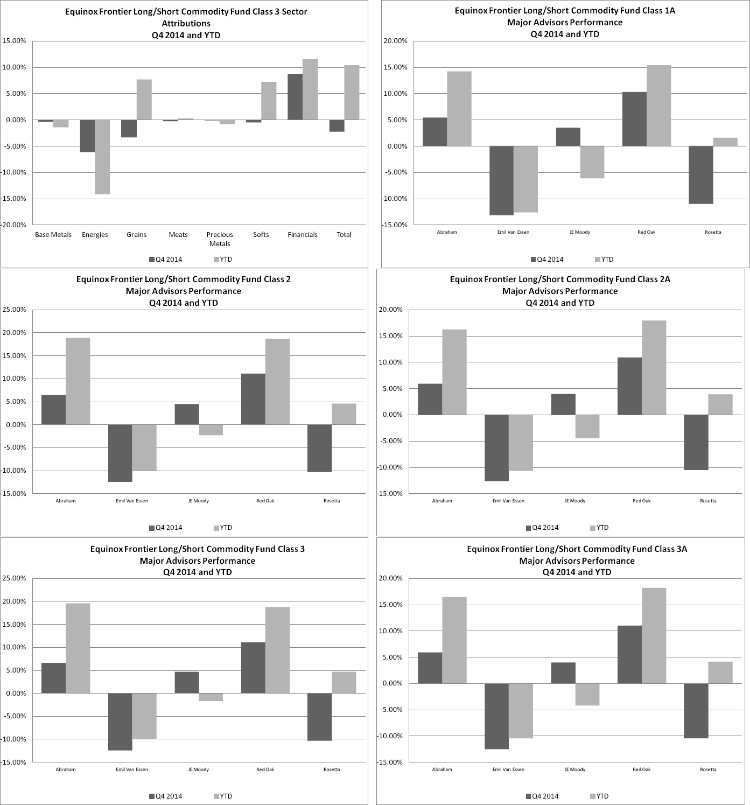
One of the seven sectors traded in the Equinox Frontier Long/Short Commodity Fund were profitable in Q4 2014. Financials finished positive for the quarter while Base Metals, Energies, Meats, Grains, Precious Metals and Softs finished negative for the quarter. Financials, Grains, Meats and Softs are positive YTD while Energies, Base Metals, and Precious Metals are negative YTD. In terms of major CTA performance, Abraham, Red Oak and JE Moody finished positive for the quarter while Emil Van Essen and Rosetta were negative for the quarter. In terms of YTD performance, Abraham, Red Oak and Rosetta are positive YTD while Emil Van Essen and JE Moody are negative YTD. 70 Equinox Frontier Masters Fund 2014 The Equinox Frontier Masters Fund – Class 1 NAV gained 26.98% for the twelve months ended December 31, 2014, net of fees and expenses; the Equinox Frontier Masters Fund – Class 2 NAV gained 29.23% for the twelve months ended December 31, 2014, net of fees and expenses, the Equinox Frontier Masters Fund – Class 3 NAV gained 29.54% for the twelve months ended December 31, 2014, net of fees and expenses. For the twelve months ended December 31, 2014 the Equinox Frontier Masters Fund recorded a net gain on investments of $8,093,183, net investment income of $298,175, and total expenses of $2,939,200, resulting in a net increase in Owners’ capital from operations attributable to controlling interests of $5,452,158. The NAV per Unit, Class 1, increased from $91.83 at December 31, 2013, to $116.61 as of December 31, 2014. The NAV per Unit, Class 2, increased from $99.46 at December 31, 2013, to $128.53 as of December 31, 2014. The NAV per Unit, Class 3 increased from $91.91 at December 31, 2013 to $119.06 as of December 31, 2014. Total Class 1 subscriptions and redemptions for the period were $574,921 and $14,142,871, respectively. Total Class 2 subscriptions and redemptions for the period were $35,000 and $3,624,212, respectively. Total Class 3 subscriptions and redemptions for the period were $5,049,885 and $1,407,811, respectively. Ending capital at December 31, 2014, was $11,850,911 for Class 1, $8,868,743 for Class 2 and $4,988,200 for Class 3. The Equinox Frontier Masters Fund may have both long and short exposure to the Interest Rates, Currencies, Stock Indices, Energies, Metals, and Commodities sectors. Sector Attribution for the Equinox Frontier Masters Fund
Five of the six sectors traded in the Equinox Frontier Masters Fund were profitable in Q4 2014. Metals, Currencies, Stock Indices, Interest Rates, and Energies were positive while, Agriculturals were negative for the quarter. Currencies, Energies, Agricultures, Interest Rates and Stock Indices were positive for the year. In terms of major CTA performance, Chesapeake, Emil Van Essen, Transtrend and Winton were positive during the quarter. All were positive YTD. Equinox Frontier Balanced Fund 2014 The Equinox Frontier Balanced Fund – Class 1 NAV gained 23.76% for the twelve months ended December 31, 2014, net of fees and expenses; the Equinox Frontier Balanced Fund – Class 1AP NAV gained 29.80% for the five months ended December 31, 2014, net of fees and expenses; the Equinox Frontier Balanced Fund – Class 2 NAV gained 27.53% for the twelve months ended December 31, 2014, net of fees and expenses; the Equinox Frontier Balanced Fund – Class 2a NAV gained 28.80% for the twelve months ended December 31, 2014, net of fees and expenses; the Equinox Frontier Balanced Fund – Class 3a NAV gained 28.81% for the twelve months ended December 31, 2014, net of fees and expenses. For the twelve months ended December 31, 2014, the Equinox Frontier Balanced Fund recorded net gain on investments of The Equinox Frontier Balanced Fund may have both long and short exposure to the Interest Rates, Currencies, Stock Indices, Energies, Metals, and Commodities sectors. 72 Sector Attribution for the Frontier Equinox Frontier Balanced Fund
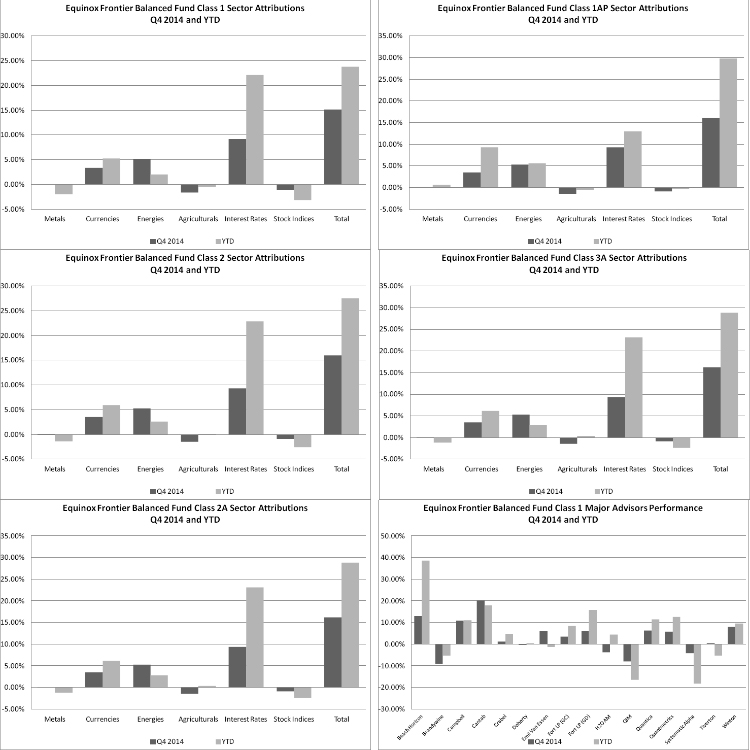
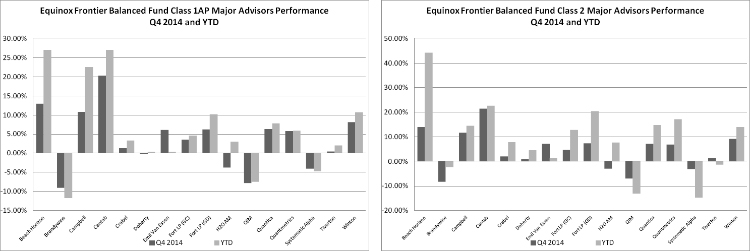 73
Three of the six sectors traded in the Equinox Frontier Balanced Fund were profitable in Q4 2014. Currencies, Energies and Interest Rates were profitable while Metals, Agriculturals and Stock Indices finished negative for the quarter. The Currencies, Agricultures, Energies, and Interest Rate sectors were positive YTD while Metals and Stock Indices were negative YTD. In terms of major CTA performance, Beach Horizon, Campbell, Cantab, Crabel, Doherty, Fort (GC), Fort (GD), Emil Van Essen, Quantica, Quantmetrics, Tiverton and Winton finished positive for the quarter. Beach Horizon, Cantab, Campbell, Crabel, Doherty, Emil Van Essen, Fort (GC), Fort (GD), H20 AM, Quantica, Quantmetrics, Tiverton and Winton were positive YTD. Brandywine, H20 AM, QIM and Systematic Alpha finished negative for the quarter. Brandywine, QIM, and Systematic Alpha were negative YTD. Equinox Frontier Select Fund 2014 The Equinox Frontier Select Fund – Class 1 NAV gained 19.72% for the twelve months ended December 31, 2014, net of fees and expenses; the Equinox Frontier Select Fund – Class 1AP NAV gained 28.19% for the five months ended December 31, 2014, net of fees and expenses. The Equinox Frontier Select Fund – Class 2 NAV gained 23.37% for the twelve months ended December 31, 2014, net of fees and expenses. For the twelve months ended December 31, 2014, the Equinox Frontier Select Fund recorded net gain on investments of $3,799,808, net investment income of $0, and total expenses of $1,364,426, resulting in a net increase in Owners’ capital from operations of $2,435,382. The NAV per Unit, Class 1, increased from $79.86 at December 31, 2013, to $95.61 as of December 31, 2014. The NAV per Unit, Class 1AP, increased from $75.53 at July 31, 2014, to $96.82 as of December 31, 2014. The NAV per Unit, Class 2, increased from $104.14 at December 31, 2013, to $128.48 as of December 31, 2014. Total Class 1 subscriptions and redemptions for the twelve months ended December 31, 2014, were $10,580 and $4,337,542, respectively. Total Class 1AP subscriptions and redemptions for the for the twelve months ended December 31, 2014, were $488,584. There were no Class 2 subscriptions. Ending capital at December 31, 2014, was $13,663,563 for Class 1, $47,785 for Class 1AP and $1,558,130 for Class 2. The Equinox Frontier Select Fund may have both long and short exposure to the Interest Rates, Currencies, Stock Indices, Energies, Metals, and Commodities sectors. 74 Sector Attribution for the Equinox Frontier Select Fund
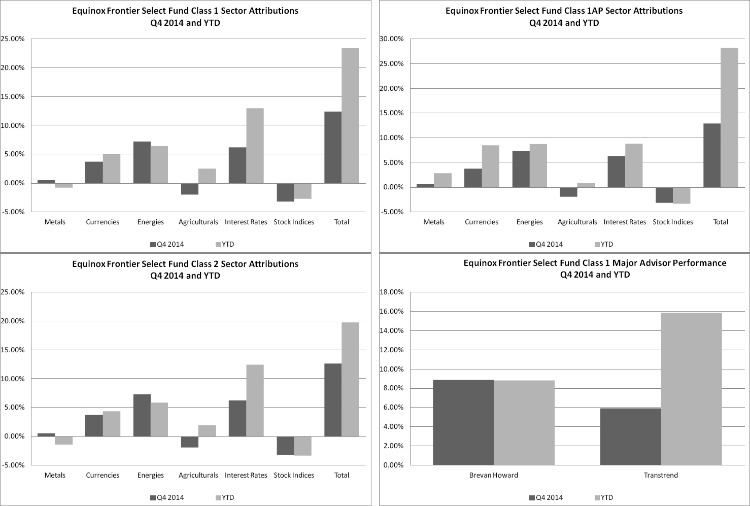
Four of the six sectors traded in the Equinox Frontier Select Fund were profitable in Q4 2014. Metals, Currencies, Energies and Interest Rates were positive while Agriculturals and Stock Indices were negative for the quarter. Currencies, Energies, In terms of major CTA performance Brevan Howard and Transtrend finished positive for the quarter and YTD. 75 Equinox Frontier Winton Fund 2014 The Equinox Frontier Winton Fund – Class 1 NAV gained 26.05% for the twelve months ended December 31, 2014, net of fees and expenses; the Equinox Frontier Winton Fund – Class 1AP NAV gained 28.25% for the five months ended December 31, 2014, net of fees and expenses the Equinox Frontier Winton Fund – Class 2 NAV gained 29.89% for the twelve months ended December 31, 2014, net of fees and expenses. For the twelve months ended December 31, 2014, the Equinox Frontier Winton Fund recorded net gain on investments of $12,603,511, net investment income of $55, and total expenses of $3,960,912, resulting in a net increase in Owners’ capital from operations of $8,642,654. The NAV per Unit, Class 1, increased from $139.59 at December 31, 2013 to $175.95 as of December 31, 2014. The NAV per Unit, Class 1AP, increased from 138.93 at July 31, 2014 to 178.18 as of December 31, 2014. The NAV per Unit, Class 2, increased from $174.17 at December 31, 2013, to $226.23 as of December 31, 2014. Total Class 1 subscriptions for the year were $169,066 and redemptions were $5,054,720. Total Class 1AP subscriptions for the The Equinox Frontier Winton Fund may have both long and short exposure to the Interest Rates, Currencies, Stock Indices, Energies, Metals, and Commodities sectors. Sector Attribution for the Equinox Frontier Winton Fund
Five of the six sectors traded in the Equinox Frontier Winton Fund were profitable in Q4 2014. Metals, Currencies, Energies, Interest Rates and Agricultures were positive while Stock Indices were negative for the quarter. Metals, Currencies, Energies Interest Rates and Stock Indices were positive YTD while Agriculturals were negative YTD. 76 Equinox Frontier Heritage Fund 2014 The Equinox Frontier Heritage Fund – Class 1 NAV gained 27.66% for the twelve months ended December 31, 2014, net of fees and expenses; the Equinox Frontier Heritage Fund – Class 1AP NAV gained 33.53% for the five months ended December 31, 2014, net of fees and expenses. the Equinox Frontier Heritage Fund – Class 2 NAV gained 31.56% for the twelve months ended December 31, 2014, net of fees and expenses. For the twelve months ended December 31, 2014, the Equinox Frontier Heritage Fund recorded net gain on investments of $4,838,618, net investment income of $1, and total expenses of $1,056,664, resulting in a net increase in Owners’ capital from operations of $2,812,848, after non-controlling interest of $969,107. The NAV per Unit, Class 1, increased from $102.05 at December 31, 2013, to $130.28 as of December 31, 2014. The NAV per Unit, Class 1AP, increased from $98.80 at July 31, 2014, to $131.93 as of December 31, 2014. The NAV per Unit, Class 2, increased from $134.21 at December 31, 2013, to $176.56 as of December 31, 2014. Total Class 1 subscriptions and redemptions for the twelve months were $26,517 and $3,615,044, respectively. Total Class 1AP subscriptions and redemptions for the The Equinox Frontier Heritage Fund may have both long and short exposure to the Interest Rates, Currencies, Stock Indices, Energies, Metals, and Commodities sectors. Sector Attribution for the Equinox Frontier Heritage Fund
77
Four of the six sectors traded in the Equinox Frontier Heritage Fund were profitable in Q4 2014. Metals, Currencies, Energies, and Interest Rates were positive while Agriculturals and Stock Indices were negative for the quarter. Currencies, Metals, Energies and Interest Rates were positive YTD while Agriculturals and Stock Indices were negative YTD. In terms of major CTA performance, Brevan Howard and Winton finished up for both the quarter and the year. 78
The Trust is a speculative commodity pool. The market sensitive instruments, which are held by the Trading Companies or Galaxy Plus entities in which the Series are invested, are acquired for speculative trading purposes, and all or a substantial amount of the Series’ assets are subject to the risk of trading loss. Unlike an operating company, the risk of market sensitive instruments is integral, not incidental, to the Series’ main line of business. Market movements result in frequent changes in the fair market value of each Trading Company’s open positions and, consequently, in each Series of the Trust’s earnings and cash flow. The Trading Companies’ and Galaxy Plus entities’ and consequently the Series’ market risk is influenced by a wide variety of factors, including the level and volatility of exchange rates, interest rates, equity price levels, the market value of financial instruments and contracts, the diversification effects among the open positions and the liquidity of the markets in which trades are made. Each Trading Company and Galaxy Plus entity rapidly acquires and liquidates both long and short positions in a wide range of different markets. Consequently, it is not possible to predict how a particular future market scenario will affect performance, and the past performance for any Series is not necessarily indicative of the future results of such Series. Additional risk of trading loss from investment in an unaffiliated Trading Company may result from the Managing Owner’s inability to directly control or stop trading in the event of exercise of certain withdrawal provisions in the investment agreement. The Trading Quantitative Market Risk Trading Risk The Series’ approximate risk exposure in the various market sectors traded by its Exchange maintenance margin requirements have been used by the Trust as the measure of its value at risk. Maintenance margin requirements are set by exchanges to equal or exceed the maximum losses reasonably expected to be incurred in the fair value of any given contract in 95% to 99% of any one-day interval. The maintenance margin levels are established by brokers, dealers and exchanges using historical price studies as well as an assessment of current market volatility and economic fundamentals to provide a probabilistic estimate of the maximum expected near-term one-day price fluctuation. Maintenance margin has been used rather than the more generally available initial margin, because initial margin includes a credit risk component that is not relevant to value at risk. In the case of market sensitive instruments that are not exchange-traded, including currencies and some energy products and metals, the margin requirements for the equivalent futures positions have been used as value at risk. In those cases in which a futures-equivalent margin is not available, dealers’ margins have been used. In the case of contracts denominated in foreign currencies, the value at risk figures include foreign currency margin amounts converted into U.S. dollars with an incremental adjustment to reflect the exchange rate risk inherent to the Series, which is valued in U.S. dollars, in expressing value at risk in a functional currency other than U.S. dollars. In quantifying each Series’ value at risk, 100% positive correlation in the different positions held in each market risk category has been assumed. Consequently, the margin requirements applicable to the open contracts have simply been aggregated to determine each trading category’s aggregate value at risk. The diversification effects resulting from the fact that the Series’ positions held through the Trading Companies and Galaxy Plus entities are rarely, if ever, 100% positively correlated have not been reflected. 79 Value at Risk by Market Sectors The following tables present the trading value at risk associated with each Series’ exposure to open positions (as held by the Trading Companies) by market sector as of December 31, Equinox Frontier Diversified Fund:
Equinox Frontier Long/Short Commodity Fund:
Equinox Frontier Masters Fund:
Equinox Frontier Balanced Fund:
Equinox Frontier Select Fund:
Equinox Frontier Winton Fund:
Equinox Frontier Heritage Fund:
80 As of December 31, Value at Risk: Foreign Markets The following table presents the portion of trading value at risk associated with each Series’ exposure to open positions (as held by the Trading Companies) by market sector as of December 31, Equinox Frontier Diversified Fund
Equinox Frontier Long/Short Commodity Fund
Equinox Frontier Masters Fund
Equinox Frontier Balanced Fund:
Equinox Frontier Select Fund:
Equinox Frontier Winton Fund:
Equinox Frontier Heritage Fund:
81 As of December 31, Material Limitations on Value at Risk as an Assessment of Market Risk The face value of the market sector instruments held on behalf of the Series is typically many times the applicable maintenance margin requirement, which generally ranges between approximately 1% and 10% of contract face value, as well as many times the capitalization of the Series. The magnitude of each Series’ open positions creates a risk of ruin not typically found in most other investment vehicles. Because of the size of their positions, certain market conditions, although unusual, but historically recurring from time to time, could cause a Series to incur severe losses over a short period of time. The value at risk table above, as well as the past performance of the Series, gives no indication of this risk of severe losses. Non-Trading Risk The Series have non-trading market risk on their foreign cash balances not needed for margin. However, these balances, as well as the market risk they represent, are immaterial. The Series also have non-trading market risk as a result of investing a portion of their available assets in U.S. government securities which include any security issued or guaranteed as to principal or interest by the U.S., or by a person controlled by or supervised by and acting as an instrumentality of the government of the U.S. pursuant to authority granted by Congress of the U.S. or any certificate of deposit for any of the foregoing, including U.S. treasury bonds, U.S. treasury bills and issues of agencies of the U.S. government, and certain cash items such as money market funds, certificates of deposit (under nine months) and time deposits. The market risk represented by these investments is also immaterial. Qualitative Market Risk The following are the primary trading risk exposures of the Series of the Trust as of December 31, Interest Rates Interest rate risk is one of the principal market exposures of each Series. Interest rate movements directly affect the price of interest rate futures positions held and indirectly the value of a Trading Company’s stock index and currency positions. Interest rate movements in one country as well as relative interest rate movements between countries materially impact profitability. The primary interest rate exposure is to interest rate fluctuations in the U.S. and the other G-7 countries. However, the Trading Companies and Galaxy Plus entities also may take futures positions on the government debt of smaller nations. The Managing Owner anticipates that G-7 interest rates will remain the primary market exposure of each Trading Company and Galaxy Plus entities and accordingly of each Series for the foreseeable future. The changes in interest rates which are expected to have the most effect on the Series are changes in long-term, as opposed to short-term rates. Most of the speculative positions to be held by the Trading Companies and Galaxy Plus entities will be in medium- to long-term instruments. Consequently, even a material change in short-term rates is expected to have little effect on the Series if the medium- to long-term rates remain steady. Aggregate interest income from all sources, including assets held at clearing brokers, of up to 2% (annualized) is paid to the Managing Owner by the Equinox Frontier Balanced Fund (Class 1 and Class 2 only), Equinox Frontier Winton Fund, Equinox Frontier Select Fund, and Equinox Frontier Heritage Fund. For the Equinox Frontier Diversified Fund, Equinox Frontier Long/Short Commodity Fund (Class 1a, Class 2a, Class 3a only), Equinox Frontier Masters Fund and Equinox Frontier Balanced Fund (Class Currencies Exchange rate risk is a significant market exposure of each Series of the Trust in general. For each Series of the Trust in general, currency exposure is to exchange rate fluctuations, primarily fluctuations that disrupt the historical pricing relationships between different currencies and currency pairs. These fluctuations are influenced by interest rate changes as well as political and general economic conditions. The Trading Advisors on behalf of a Series trade in a large number of currencies, including cross-rates, which are positions between two currencies other than the U.S. dollar. The Managing Owner does not anticipate that the risk profile of the Series’ currency sector will change significantly in the future. 82 Stock Indices For each Series, its primary equity exposure is equity price risk in the G-7 countries as well as other smaller jurisdictions. Each Series of the Trust is primarily exposed to the risk of adverse price trends or static markets in the major U.S., European and Japanese indices. Metals For each Series, its metals market exposure is fluctuations in the price of both precious metals, including gold and silver, as well as base metals including aluminum, copper, nickel and zinc. Some metals, such as gold, are used as surrogate stores of value, in place of hard currency, and thus have currency or interest rate risk associated with them relative to their price in a specific currency. Other metals, such as silver, platinum, copper and steel, have substantial industrial applications, and may be subject to forces affecting industrial production and demand. Agriculturals/Softs Each Series may also invest in raw commodities and may thus have exposure to agricultural price movements, which are often directly affected by severe or unexpected weather conditions or by political events in countries that comprise significant sources of commodity supply. Energy For each Series its primary energy market exposure is in oil, gas and other energy product price movements, often resulting from political developments and ongoing conflicts in the Middle East. Oil and gas prices can be volatile and substantial profits and losses have been and are expected to continue to be experienced in this market. Other Trading Risks As a result of leverage, small changes in the price of a Trading Company’s positions may result in substantial losses for a Series. Futures, forwards and options are typically traded on margin. This means that a small amount of capital can be used to invest in contracts of much greater total value. The resulting leverage means that a relatively small change in the market price of a contract can produce a substantial loss. Like other leveraged investments, any purchase or sale of a contract may result in losses in excess of the amount invested in that contract. The Trading Companies and Galaxy Plus entities may lose more than their initial margin deposits on a trade. The Trading Companies’ and Galaxy Plus entities’ trading is subject to execution risks. Market conditions may make it impossible for the Trading Advisors to execute a buy or sell order at the desired price, or to close out an open position. Daily price fluctuation limits are established by the exchanges and approved by the CFTC. When the market price of a contract reaches its daily price fluctuation limit, no trades can be executed at prices outside the limit. The holder of a contract may therefore be locked into an adverse price movement for several days or more and lose considerably more than the initial margin put up to establish the position. Thinly traded or illiquid markets also can make it difficult or impossible to execute trades. The Trading Advisor’s positions are subject to speculative limits. The CFTC and domestic exchanges have established speculative position limits on the maximum futures position which any person, or group of persons acting in concert, may hold or control in particular futures contracts or options on futures contracts traded on U.S. commodity exchanges. Under current regulations, other accounts of the Trading Advisors are combined with the positions held by them on behalf of the applicable Trading Company and Galaxy Plus entity for position limit purposes. This trading could preclude additional trading in these commodities by the Trading Advisors for the accounts of the Series. Systematic strategies do not consider fundamental types of data and do not have the benefit of discretionary decision making. The assets of the Series are allocated to Trading Advisors that rely on technical, systematic strategies that do not take into account factors external to the market itself (although certain of these strategies may have minor discretionary elements incorporated into their systematic strategy). The widespread use of technical trading systems frequently results in numerous However, because certain of the Trading Advisors’ strategies involve some discretionary aspects in addition to their technical factors, certain of the Trading Advisors may occasionally use discretion in investing the assets of a Trading Company. For example, the Trading Advisors often use discretion in selecting contracts and markets to be followed. In exercising such discretion, such Trading Advisor may take positions opposite to those recommended by the Trading Advisor’s trading system or signals. Discretionary decision making may also result in a Trading Advisor failing to capitalize on certain price trends or making unprofitable trades in a situation where another trader relying solely on a systematic approach might not have done so. Furthermore, such use of discretion may not enable the relevant Series of the Trust to avoid losses, and in fact, such use of discretion may cause such Series to forego profits which it may have otherwise earned had such discretion not been used. 83 Qualitative Disclosures Regarding Means of Managing Risk Exposure The means by which the Managing Owner attempts to manage the risk of the Trust’s open positions is essentially the same in all market categories traded. The Managing Owner applies risk management policies to trading which generally are designed to limit the total exposure of assets under management. In addition, the Managing Owner follows diversification guidelines which are often formulated in terms of the balanced volatility between markets and correlated groups. Cyber Risks and Security The Trust’s business requires it to use and store investor, employee and business partner personally identifiable information (“PII”). This may include, among other information, names, addresses, phone numbers, email addresses, contact preferences, tax identification numbers and payment account information. The Trust requires user names and passwords in order to access its information technology systems. The Trust also uses encryption and authentication technologies designed to secure the transmission and storage of data and prevent access to Trust data or accounts. These security measures are subject to third-party security breaches, employee error, malfeasance, faulty password management, or other irregularities. To help protect investors and the Trust, the Trust monitors accounts and systems for unusual activity and may freeze accounts under suspicious circumstances. The Trust devotes significant resources to network security, data encryption and other security measures to protect its systems and data, but these security measures cannot provide absolute security. To the extent the Trust was to experience a breach of its systems and was unable to protect sensitive data, such a breach could materially damage business partner and investor relationships. Moreover, if a computer security breach affects the Trust’s systems or results in the unauthorized release of PII, the Trust’s reputation and brand could be materially damaged and the Trust could be exposed to a risk of loss or litigation and possible liability. While the Trust maintains insurance coverage that, subject to policy terms and conditions and subject to a significant self-insured retention, is designed to address certain aspects of cyber risks, such insurance coverage may be insufficient to cover all losses or all types of claims that may arise in the continually evolving area of cyber risk.
Financial statements meeting the requirements of Regulation S-X appear beginning on page F-1 of this report. The supplementary financial information specified by Item 302 of Regulation S-K is included in this report under the heading “Selected Financial Data” above.
None.
Evaluation of Disclosure Controls and Procedures Under the supervision and with the participation of the management of the Managing Owner, including its Chief Executive Officer and Principal Financial Officer, the Trust evaluated the effectiveness of the design and operation of the disclosure controls and procedures (as defined in Rule 13a-15(e) under the Securities Exchange Act of 1934, as amended (the “Exchange Act”)), for the Trust and each Series as of December 31, 84 Report on Management’s Assessment of Internal Control over Financial Reporting The management of the Managing Owner is responsible for establishing and maintaining adequate internal control over financial reporting by the Trust. The Managing Owner’s internal control over financial reporting is a process designed to provide reasonable assurance regarding the reliability of financial reporting and the preparation of financial statements for external purposes in accordance with accounting principles generally accepted in the United States. The internal control over financial reporting for the Trust and each Series includes those policies and procedures that (i) pertain to the maintenance of records that, in reasonable detail, accurately and fairly reflect the transactions and dispositions of assets; (ii) provide reasonable assurance that transactions are recorded as necessary to permit preparation of financial statements in accordance with accounting principles generally accepted in the United States, and that receipts and expenditures are being made only in accordance with authorizations of the management of the Managing Owner; and (iii) provide reasonable assurance regarding prevention or timely detection of unauthorized acquisition, use or disposition of assets that could have a material effect on the financial statements of the Trust or any Series. Because of its inherent limitations, internal control over financial reporting may not prevent or detect misstatements. All internal control systems, no matter how well designed, have inherent limitations, including the possibility of human error and the circumvention of overriding controls. Accordingly, even effective internal control over financial reporting can provide only reasonable assurance with respect to financial statement preparation. Also, projections of any evaluation of effectiveness to future periods are subject to the risk that controls may become inadequate because of changes in conditions, or that the degree of compliance with the policies or procedures may deteriorate. Management assessed the effectiveness of the internal control over financial reporting for the Trust and each Series as of December 31, This annual report does not include an attestation report of the Trust’s independent registered public accounting firm regarding internal control over financial reporting. Management’s report was not subject to attestation by the Trust’s independent registered public accounting firm pursuant to the rules of the SEC that permit the Trust to provide only management’s report in this annual report. Changes in Internal Control Over Financial Reporting. There were Scope of Exhibit 31 Certifications The certifications of the Chief Executive Officer and the Principal Financial Officer of the Managing Owner and the New Managing Owner as of December 31, 2016 and as of March 31, 2017 (the date of this filing) are included as Exhibits 31.1 and 31.2, respectively, to this Form 10-K apply not only to the Trust as a whole but also to each Series individually.
None. 85
The Trust has no directors or executive officers and also does not have any employees. The Trust is managed solely by Equinox Fund Management, LLC, a Delaware limited liability company formed in June 2003, in the capacity as managing owner. The Managing Owner became registered with the CFTC as CPO as of August 6, 2003, and has been a member in the National Futures Association (the “NFA”), in such capacity since that date. On March 6, 2017, a transaction was consummated that gave operational control of the Trust to Frontier Fund Management, LLC and from that date Frontier Fund Management, LLC became the New Managing Owner. Principals of the Managing Owner The current officers and directors of the Managing Owner are as follows: Robert J. Enck,is the President and Chief Executive Officer
Principals of the New Managing Owner The current officers and directors of the Managing Owner are as follows: Patrick J. Kaneis the Chairman of the New Managing Owner since January 2012. Previously, Mr. Kane was the head ofalternative investments at Oppenheimer Asset Management until June 2011, overseeing approximately $3 billion in hedge funds and private equity investments. Mr. Kane joined Oppenheimer in 2001 as a senior member of 86 Patrick F. Hart III, is the Chief Previous affiliations of Mr.
Mr. Hart served nine years on the Introducing Broker Advisory Committee of the National Futures Association, or NFA. Additionally, he has served periodically on the NFA Arbitration and Nominating Committees since 1988. Mr. Hart has been a frequent guest speaker at international conferences and symposiums on the topic of alternative investment strategies. Moreover, Mr. Hart has contributed to numerous articles in leading investment publications and is a contributing author to the “Handbook of Managed Futures—Performance, Evaluation and Analysis” (McGraw-Hill 1997). Mr. Hart received a B.S. in Economics from Colorado State University in 1983. He holds FINRA Series 7, 63, and the CFTC/NFA Series 3 registrations. Mr. Hart also is a registered representative of ALPS Distributors, Inc. Michael B. Egan II,is the Secretary of the New Managing Owner since January 2012. Mr. Egan brings more than 25 years of alternative investment experience with a focus on commodity Trading Advisor research and multi-advisor portfolio construction. As a member of Frontier Fund Management LLC’s portfolio management team, Mr. Egan is involved in day-to-day portfolio and risk management for all of Frontier Fund Management LLC’s funds’ offerings as well as the development and structuring of new products. In addition, Mr. Egan has also served as Research Director of Three Palms, LLC since its founding in June 2003. He also serves as President of Hart Financial Group, LLC, a registered Commodity Pool Operator, where he has been registered as a principal since April 2015 and associated person since May 2006. Mr. Egan was also registered as an associated person of the
Garrett W. Phillips,is the Chief Operations Officer and Treasurer of the New Managing Owner since October 2016. He has also worked as the Chief Executive Officer for the Effective December 2015, Equinox has engaged Cipperman Compliance Services, LLC to provide outsourced compliance services for 87 Executive Committee of the Managing Owner The Executive Committee is responsible for the general oversight of the Managing Owner’s business and Equinox Frontier Funds and functions like the board of directors of a corporation. The members of the Executive Committee are Robert J. Enck—Mr. Enck’s biography appears above under the caption“Item 10. Directors, Executive Officers and Corporate Governance—Principals of the Managing Owner.”
David P. DeMuth, The sole member of the Managing Owner with a larger than 10% ownership interest is Plimpton Capital, LLC which has been listed as a principal of the Managing Owner since August 2003. There is not currently any material administrative, civil, or criminal action-whether pending, on appeal or concluded-against the Trust, its principals or the Managing Owner. Executive Committee of the New Managing Owner Patrick Kane—Mr. Kane’s biography appears above under the caption“Item 10. Directors, Executive Officers and Corporate Governance—Principals of the Managing Owner.” Patrick Hart—Mr. Hart’s biography appears above under the caption“Item 10. Directors, Executive Officers and Corporate Governance—Principals of the Managing Owner.” Garrett Phillips—Mr. Phillips’s biography appears above under the caption“Item 10. Directors, Executive Officers and Corporate Governance—Principals of the Managing Owner.” Michael Egan—Mr. Egan’s biography appears above under the caption“Item 10. Directors, Executive Officers and Corporate Governance—Principals of the Managing Owner.” Section 16(a) Beneficial Ownership Reporting Compliance Section 16 of the Exchange Act requires an issuer’s directors and certain executive officers and certain other beneficial owners of the issuer’s equity securities to periodically file notices of changes in their beneficial ownership with the SEC. The Trust does not have any directors or officers. However, the officers of the Managing Owner, as well as the Managing Owner itself, file such notices regarding their beneficial ownership in the Trust, if any. Audit Committee Financial Expert The Trust does not have a board of directors but instead is operated and managed by the Managing Owner. The Executive Committee of the Managing Owner has created an audit committee of the Trust consisting of all of the Executive Committee’s members. The Executive Committee of the Managing Owner, in its capacity as the audit committee for the Trust, has determined that Robert J. Enck, the Chief Executive Officer of the Managing Owner, qualifies as an “audit committee financial expert” in accordance with the applicable rules and regulations of the SEC. Mr. Enck is not independent of management. 88 Code of Ethics The Trust has not adopted a code of ethics because it does not have any officers or employees. The Managing Owner has adopted a code of ethics for employees and principals of the Managing Owner. In general, the Managing Owner, its principals, and all other persons associated with the Managing Owner shall observe high standards of commercial honor and just and equitable principles of trade in the conduct of their commodity futures business. All employees including anyone not on the regular payroll but filling in on a temporary basis shall be held to the highest standards of honesty and integrity. This conduct will be valid for all duties involved with the daily management and responsibilities as Managing Owner of the Trust. Employees will conduct their daily duties in a responsible manner to ensure that all customers are treated fairly and equally. The reputation of the Managing Owner is crucial to its business, and understanding that the Managing Owner will make every effort to ensure the reputation of the Managing Owner is not tarnished in any way. Employees are urged to seek the advice of their supervisor for any questions applicable to this code relative to their individual circumstances.
The Trust has no directors or officers. Its affairs are managed solely by the Managing Owner, which receives compensation for its services from the Trust, as follows: Management Fees Each Series of Units pays to the Managing Owner a monthly management fee equal to a certain percentage of the assets in Trading Companies attributable to such Series’ (including nominal
Incentive Fees Some Series pay to the Managing Owner an incentive fee of a certain percentage of new net trading profits generated in the Trading Companies by such Series, monthly or quarterly. In addition, the Managing Owner receives a quarterly incentive fee of a certain percentage of new net trading profits generated in the Galaxy Plus entities that have been allocated to the Series. Because the Equinox Frontier Diversified Fund, Equinox Frontier Masters Fund, Equinox Frontier Balanced Fund, Equinox Frontier Heritage Fund, Equinox Frontier Select Fund, and Equinox Frontier Long/Short Commodity Fund may each employ multiple Trading Advisors, these Series will pay the Managing Owner a monthly incentive fee calculated on a Trading Advisor by Trading Advisor basis. It is therefore possible that in any given period these Series may pay incentive fees to the Managing Owner for one or more Trading Advisors while each of these Series as a whole experiences losses. The incentive fee is 25% for the Equinox Frontier Diversified Fund and Equinox Frontier Balanced Fund and 20% for the Equinox Frontier Masters Fund, Equinox Frontier Winton Fund, Equinox Frontier Heritage Fund, Equinox Frontier Select Fund and Equinox Frontier Long/Short Commodity Fund. The Managing Owner may pay all or a portion of such incentive fees to the Trading Advisor(s) for such Series. Interest Income Aggregate interest income from all sources, including U.S. Treasury Securities assets net of premiums and cash held at clearing brokers, of up to the first 2% (annualized) of average net assets is paid to the Managing Owner by the Equinox Frontier Balanced Fund (Class 1 and Class Fund (Class 1a, Class 2a, Class 3a only), Equinox Frontier Masters Fund and Equinox Frontier Balanced Fund (Class 89 Other Fees
From January 1,
The Trust has no officers or directors. Its affairs are managed solely by the Managing Owner. Set forth in the table below is information regarding the beneficial ownership of Units of the principals of the Managing Owner as of December 31, Equinox Fund Management, LLC*:
The Trust has and will continue to have certain relationships with the Managing Owner and its affiliates. However, there have been no direct financial transactions between the Trust and the directors or officers of the Managing Owner. See “Item 11. Executive Compensation” and “Item 12. Security Ownership of Certain Beneficial Owners and Management.” 90
The following table sets forth the fees billed to Equinox Fund Management, LLC, the Managing Owner of the Trust, for professional services provided by FEE CATEGORY Audit Fees(1) Audit-Related Fees(2) Tax Fees(3) All Other Fees(4) TOTAL FEES
The Managing Owner approved all the services provided by 91
92
93
INDEX TO THE SERIES FINANCIAL STATEMENTS
INDEX TO THE TRUST FINANCIAL STATEMENTS (1)
INDEX TO TRADING COMPANY FINANCIAL STATEMENTS (2)
F-1
F-2 Report of Independent Registered Public Accounting Firm To the Executive Committee and Unitholders Equinox Frontier Funds We have audited the accompanying statements of financial condition, including the condensed schedules of investments, of the Equinox Frontier Diversified Fund, Equinox Frontier Long/Short Commodity Fund, Equinox Frontier Masters Fund, Equinox Frontier Balanced Fund, Equinox Frontier Select Fund, Equinox Frontier Winton Fund, and Equinox Frontier Heritage Fund of Equinox Frontier Funds (collectively, the Series) as of December 31, We conducted our audits in accordance with the standards of the Public Company Accounting Oversight Board (United States). Those standards require that we plan and perform the In our opinion, the financial statements referred to above present fairly, in all material respects, the financial position of the Equinox Frontier Diversified Fund, Equinox Frontier Long/Short Commodity Fund, Equinox Frontier Masters Fund, Equinox Frontier Balanced Fund, Equinox Frontier Select Fund, Equinox Frontier Winton Fund, and Equinox Frontier Heritage Fund of Equinox Frontier Funds as of December 31, As discussed in Note 11 to the financial statements, on March 6, 2017 a unit purchase agreement between Frontier Fund Management LLC (New Managing Owner) and Equinox Fund Management (Equinox) was consummated whereby Equinox’s general units were transferred to the New Managing Owner. Upon consummation, the New Managing Owner became the managing owner of the Trust and each Series, in replacement of Equinox. /s/ Denver, Colorado March 31, F-3
The accompanying notes are an integral part of these financial statements. F-4
The accompanying notes are an integral part of these financial statements. F-5
The accompanying notes are an integral part of these financial statements. F-6
Description SHORT FUTURES CONTRACTS * Various base metals futures contracts (Europe) Various base metals futures contracts (U.S.) Various currency futures contracts (Far East) Various currency futures contracts (U.S.) Various energy futures contracts (Europe) Various energy futures contracts (Far East) Various energy futures contracts (U.S.) Various interest rates futures contracts (Canada) Various interest rates futures contracts (Europe) Various interest rates futures contracts (Far East) Various interest rates futures contracts (Oceanic) Various interest rates futures contracts (U.S.) Various precious metal futures contracts (Far East) Various precious metal futures contracts (U.S.) Various soft futures contracts (Canada) Various soft futures contracts (Europe) Various soft futures contracts (Far East) Various soft futures contracts (U.S.) Various stock index futures contracts (Africa) Various stock index futures contracts (Europe) Various stock index futures contracts (Far East) Various stock index futures contracts (Mexico) Various stock index futures contracts (Oceanic) Various stock index futures contracts (U.S.) Total Short Futures Contracts CURRENCY FORWARDS * Various currency forwards contracts (NA) Total Currency Forwards Total Open Trade Equity (Deficit) OPTIONS PURCHASED * Various energy futures contracts (U.S.) Various soft futures contracts (U.S.) Various stock index futures contracts (U.S.) Total Options Purchased Description OPTIONS WRITTEN * Various energy futures contracts (U.S.) Various soft futures contracts (U.S.) Various stock index futures contracts (U.S.) Total Options Written SWAPS (1) Frontier XXXIV Balanced select swap (U.S.) Frontier Brevan Howard swap (U.S.) Frontier XXXV Diversified select swap (U.S.) Frontier XXXVII L/S select swap (U.S.) Total Swaps U.S. TREASURY SECURITIES (2) FACE VALUE $ 15,000,000 US Treasury Note 2.250% due 11/15/2024 (Cost $14,966,695) $ 75,000,000 US Treasury Note 6.000% due 02/15/2026 (Cost $99,579,227) $ 20,000,000 US Treasury Note 6.875% due 08/15/2025 (Cost $28,322,622) Additional Disclosure on U.S. Treasury Securities US Treasury Note 2.250% due 11/15/2024 (2) US Treasury Note 6.000% due 02/15/2026 (2) US Treasury Note 6.875% due 08/15/2025 (2) Additional Disclosure on U.S. Treasury Securities US Treasury Note 2.250% due 11/15/2024 (2) US Treasury Note 6.000% due 02/15/2026 (2) US Treasury Note 6.875% due 08/15/2025 (2)
The accompanying notes are an integral part of these financial statements. F-7
The accompanying notes are an integral part of these financial statements. F-8
The accompanying notes are an integral part of these financial statements. F-9
Description U.S. TREASURY SECURITIES (2) FACE VALUE $ 15,000,000 US Treasury Note 2.250% due 11/15/2024 (Cost $14,966,695) $ 75,000,000 US Treasury Note 6.000% due 02/15/2026 (Cost $99,579,227) $ 20,000,000 US Treasury Note 6.875% due 08/15/2025 (Cost $28,322,622) Additional Disclosure on U.S. Treasury Securities US Treasury Note 2.250% due 11/15/2024 (2) US Treasury Note 6.000% due 02/15/2026 (2) US Treasury Note 6.875% due 08/15/2025 (2) Additional Disclosure on U.S. Treasury Securities US Treasury Note 2.250% due 11/15/2024 (2) US Treasury Note 6.000% due 02/15/2026 (2) US Treasury Note 6.875% due 08/15/2025 (2) The accompanying notes are an integral part of these financial statements. F-10
Description OPTIONS WRITTEN * Various energy futures contracts (U.S.) Various soft futures contracts (U.S.) Total Options Written Swaps (1) Frontier XXXV Diversified select swap (U.S.) Frontier XXXVII L/S select swap (U.S.) Total Swaps U.S. TREASURY SECURITIES (2) U.S. Treasury Note 1.125% due 12/31/2019 (Cost $11,178,122) U.S. Treasury Note 2.000% due 09/30/2020 (Cost $11,611,497) U.S. Treasury Note 2.500% due 08/15/2023 (Cost $25,034,823) U.S. Treasury Note 2.125% due 08/15/2021 (Cost $13,066,678) U.S. Treasury Note 2.000% due 11/15/2021 (Cost $12,945,421) U.S. Treasury Note 6.000% due 02/15/2026 (Cost $99,579,227) U.S. Treasury Note 6.875% due 08/15/2025 (Cost $28,322,622) Additional Disclosure on U.S. Treasury Securities U.S. Treasury Note 1.125% due 12/31/2019 U.S. Treasury Note 2.000% due 09/30/2020 U.S. Treasury Note 2.500% due 08/15/2023 U.S. Treasury Note 2.125% due 08/15/2021 U.S. Treasury Note 2.000% due 11/15/2021 U.S. Treasury Note 6.000% due 02/15/2026 U.S. Treasury Note 6.875% due 08/15/2025 U.S. Treasury Note 1.125% due 12/31/2019 U.S. Treasury Note 2.000% due 09/30/2020 U.S. Treasury Note 2.500% due 08/15/2023 U.S. Treasury Note 2.125% due 08/15/2021 U.S. Treasury Note 2.000% due 11/15/2021 U.S. Treasury Note 6.000% due 02/15/2026 U.S. Treasury Note 6.875% due 08/15/2025
The accompanying notes are an integral part of these financial statements. F-11
Description U.S. TREASURY SECURITIES (2) U.S. Treasury Note 1.125% due 12/31/2019 (Cost $11,178,122) U.S. Treasury Note 2.000% due 09/30/2020 (Cost $11,611,497) U.S. Treasury Note 2.500% due 08/15/2023 (Cost $25,034,823) U.S. Treasury Note 2.125% due 08/15/2021 (Cost $13,066,678) U.S. Treasury Note 2.000% due 11/15/2021 (Cost $12,945,421) U.S. Treasury Note 6.000% due 02/15/2026 (Cost $99,579,227) U.S. Treasury Note 6.875% due 08/15/2025 (Cost $28,322,622) Additional Disclosure on U.S. Treasury Securities U.S. Treasury Note 1.125% due 12/31/2019 U.S. Treasury Note 2.000% due 09/30/2020 U.S. Treasury Note 2.500% due 08/15/2023 U.S. Treasury Note 2.125% due 08/15/2021 U.S. Treasury Note 2.000% due 11/15/2021 U.S. Treasury Note 6.000% due 02/15/2026 U.S. Treasury Note 6.875% due 08/15/2025 U.S. Treasury Note 1.125% due 12/31/2019 U.S. Treasury Note 2.000% due 09/30/2020 U.S. Treasury Note 2.500% due 08/15/2023 U.S. Treasury Note 2.125% due 08/15/2021 U.S. Treasury Note 2.000% due 11/15/2021 U.S. Treasury Note 6.000% due 02/15/2026 U.S. Treasury Note 6.875% due 08/15/2025
The accompanying notes are an integral part of these financial statements. F-12
The accompanying notes are an integral part of these financial statements. F-13
The Series of the Equinox Frontier Funds Statements of Operations For the Years Ended December 31,
The accompanying notes are an integral part of these financial statements. F-14 The Series of the Equinox Frontier Funds Statements of Operations For the Years Ended December 31, 2016, 2015 and 2014
The accompanying notes are an integral part of these financial statements. F-15 The Series of Equinox Frontier Funds Statements of Changes in Owners’ Capital For the Years Ended December 31,
Non- Controlling Non- Controlling Owners’ Capital, December 31, 2013 Sale of Units Redemption of Units Change in control of ownership—Trading Companies Operations attributable to non-controlling interests Net increase in capital resulting from operations attributable to controlling interest Owners’ Capital, December 31, 2014 Owners’ Capital—Units, December 31, 2011 Sale of Units Redemption of Units Owners’ Capital—Units, December 31, 2012 Sale of Units Redemption of Units Owners’ Capital—Units, December 31, 2013 Sale of Units Redemption of Units Owners’ Capital—Units, December 31, 2014 Non- Controlling Non- Controlling Net asset value per unit at December 31, 2011 Change in net asset value per unit for the year ended December 31, 2012 Net asset value per unit at December 31, 2012 Change in net asset value per unit for the year ended December 31, 2013 Net asset value per unit at December 31, 2013 Change in net asset value per unit for the year ended December 31, 2014 Net asset value per unit at December 31, 2014
The accompanying notes are an integral part of these financial statements. F-16
Non- Controlling Net asset value per unit at December 31, 2011 Change in net asset value per unit for the year ended December 31, 2012 Net asset value per unit at December 31, 2012 Change in net asset value per unit for the year ended December 31, 2013 Net asset value per unit at December 31, 2013 Change in net asset value per unit for the year ended December 31, 2014 Net asset value per unit at December 31, 2014
The accompanying notes are an integral part of these financial statements. F-17
The accompanying notes are an integral part of these financial statements. F-18
The accompanying notes are an integral part of these financial statements. F-19 The Series of Equinox Frontier Funds For the Years Ended December 31,
Interest receivable Receivable from other series Receivable from related parties Other assets Incentive fees payable to Managing Owner Management fees payable to Managing Owner Interest payable to Managing Owner Trading fees payable to Managing Owner Service fees payable to Managing Owner Payables to related parties Other liabilities Net cash provided by (used in) operating activities Cash Flows from Financing Activities: Proceeds from sale of units Payment for redemption of units Pending owner additions Owner redemptions payable Net cash provided by (used in) financing activities Net increase (decrease) in cash and cash equivalents Cash and cash equivalents, beginning of period Cash and cash equivalents, end of period The accompanying notes are an integral part of these financial statements. F-20 The Series of Equinox Frontier Funds Statements of Cash Flows For the Years Ended December 31,
The accompanying notes are an integral part of these financial statements. F-21 The Series of Equinox Frontier Funds Statements of Cash Flows For the Years Ended December 31,
The accompanying notes are an integral part of these financial statements. F-22 The Series of Equinox Frontier Funds
Equinox Frontier Funds, which is referred to in this report as the “Trust”, was formed on August 8, 2003, as a Delaware statutory trust. Please refer to the consolidated financial statements of the Trust included within this periodic report. The Trust is a multi-advisor commodity pool, as described in Commodity Futures Trading Commission (the “CFTC”) Regulation § 4.10(d)(2). The Trust has authority to issue separate series, or each, a Series, of units of beneficial interest (the “Units”) pursuant to the requirements of the Delaware Statutory Trust Act, as amended (the “Trust Act”). The assets of each Series are valued and accounted for separately from the assets of other Series. The Trust is not registered as an investment company under the Investment Company Act of 1940, as amended (the “Investment Company Act”). It is managed by its Purchasers of Units are limited owners of the Trust (“Limited Owners”) with respect to beneficial interests of the Series’ Units purchased. The Trust Act provides that, except as otherwise provided in the second amended and restated declaration of trust and trust agreement dated December 9, 2013, as further amended, by and among the Managing Owner, Wilmington Trust Company as trustee and the unitholders, as may be amended from time to time The Trust, in relation to the Series, has been organized to pool assets of investor funds for the purpose of trading in the United States (“U.S.”) and international markets for currencies, interest rates, stock indices, agricultural and energy products, precious and base metals and other commodities. The Trust, in relation to the Series, may also engage in futures contracts, forwards, option contracts and other interest in derivative instruments, including swap
The Trust has seven (7) separate and distinct Series of Units issued and outstanding: Equinox Frontier Diversified Fund, Equinox Frontier Masters Fund, Equinox Frontier Long/Short Commodity Fund, Equinox Frontier Balanced Fund, Equinox Frontier Select Fund, Equinox Frontier Winton Fund, and Equinox Frontier Heritage Fund, (each a “Series” and collectively, the “Series”). The Trust, with respect to the Series, may issue additional Series of Units. The Trust, with respect to each Series:
The assets of any particular Series include only those funds and other assets that are paid to, held by or distributed to the Trust, with respect to the Series, on account of and for the benefit of that Series. Under the “Inter-Series Limitation on Liability” expressly provided for under Section 3804(a) of the Trust Act, separate and distinct records of the cash and equivalents, although pooled for maximizing returns, are maintained in the books and records of each Series. As of December 31, F-24 As of December 31, The Trust has entered into agreements, which provide for the indemnification of futures clearing brokers, currency trading companies, and commodity trading advisers, among others, against losses, costs, claims and liabilities arising from the performance of their individual obligations under such agreements, except for gross negligence or bad faith.
The following are the significant accounting policies of the Series of the Trust. Basis of Presentation—The Series of the Trust follow U.S. Generally Accepted Accounting Principles (“GAAP”), as established by the Financial Accounting Standards Board (the “FASB”), to ensure consistent reporting of financial condition, condensed schedules of investments, results of operations, changes in capital and cash flows. The Trust is an investment company following accounting and reporting guidance in Accounting Standards Codification (“ASC”) 946. Consolidation—The Series, through investing in the Trading Companies and Galaxy Plus, authorize certain Trading Advisors to place trades and manage assets at pre-determined investment levels. The Trading Companies were organized by the Managing Owner for the purpose of investing in commodities interests and derivative instruments, and have no operating income or expenses, except for trading income and expenses and a risk analysis fee, all of which is allocated to the Series. Galaxy Plus is a series of Delaware limited liability companies, sponsored by Gemini Alternative Funds, LLC, that create exposure to a variety of third party professional managed futures and foreign exchange advisors. Galaxy Plus is available to qualified high-net-worth individuals and institutional investors. Trading Companies in which a Series has a controlling and majority Galaxy Plus entities are co-mingled investment vehicles. In addition to the Series, there are other non-affiliated investors in Galaxy Plus. Subscriptions and redemptions by these non-affiliated investors will have a direct impact on the Series ownership percentage in Galaxy Plus. It is expected that ownership percentage will fluctuate (sometimes significantly) on a week by week basis which could also result in frequent changes in the consolidating Series. Such fluctuations make consolidating the financial statements of the Galaxy Plus entities both impractical and misleading. Non-consolidation of these Galaxy Plus entities presents a more useful financial statement for the readers. As such, management has decided that presenting Galaxy Plus entities on a non-consolidated basis as investments in other investments companies (a “fund of funds” approach) is appropriate and preferable to the users of these financial statements. Refer to Note 5 for additional disclosures related to these private investment companies. As of December 31, F-25 For the year ended December 31, Trading Company XIV, LLC As of December 31, For the year ended December 31, As of December 31, For the year ended December 31, As of and for the As of and for the year ended December 31, 2015, the consolidated statement of financial condition and statement of operations of Equinox Frontier Select Fund included the assets and liabilities, and earnings, respectively, of its majority owned Trading Company, Frontier Trading Company XV, LLC except for the earnings from January 1, 2015 to January 2, 2015. For the year ended December 31, 2016, the consolidated statement of operations of Equinox Frontier Select Fund included the earnings of its majority owned Trading Company listed above. As of and for the year ended December 31, 2016 and 2015, the consolidated statement of financial condition and statement of operations of Equinox Frontier Winton Fund included the assets and liabilities, and earnings, respectively, of its majority owned Trading Company, Frontier Trading Company II, LLC. As of and for the year ended December 31, 2016 and 2015, Equinox Frontier Master Fund did not have a majority interest in any Trading Company. Each of the Series has invested in Frontier Trading Company XXXVIII, LLC on the same basis as its ownership in the cash pool. Frontier Trading Company XXXVIII, Use of Estimates—The preparation of financial statements in conformity with GAAP may require the Managing Owner to make estimates and assumptions that affect the reported amounts of assets and liabilities and disclosure of contingent assets and liabilities at the date of the financial statements and the reported amounts of revenue and expenses during the reporting period. The valuation of swap contracts requires significant estimates as well as the valuation of certain other investments. Please refer to Note 3 for discussion of valuation methodology. Actual results could differ from these estimates, and such differences could be material. Cash and Cash Equivalents—Cash and cash equivalents include cash and overnight investments in interest-bearing demand deposits held at banks with original maturities of three months or less. This cash is not restricted. Interest
U.S. Treasury Receivable From Futures Commission Merchants—The Series of the Trust Investment Any change in net unrealized gain or loss from the preceding period is reported in the statements of operations. Fair value of exchange-traded contracts is based upon exchange settlement prices. Fair value of non-exchange-traded contracts is based on third party quoted dealer values on the interbank market. For U.S. Treasury securities, interest is recognized in the period earned and the instruments are marked-to-market daily based on third party information. Transaction costs are recognized as incurred and reflected separately in the statements of operations. Purchase and Sales of Private Investment Companies—The Series are able to subscribe into and redeem from the Galaxy Plus entities on a weekly basis. The value of the Private Investment Companies is determined by the Sponsor and reported on a daily basis. The change in value is calculated as the difference between the total purchase proceeds and the fair value calculated by the Sponsor and is recorded as net unrealized gain/(loss) on private investment companies on the statements of operations. Foreign Allocation of Earnings—Each Series of the Trust may maintain between Each Series allocates funds to an affiliated Trading Company, or Companies, of the F-27 Investments and Swaps—The Trust, with respect to the Series, records investment transactions on a trade date basis and at fair value, with changes in fair value reported as a component of realized and unrealized gains/(losses) on investments in the statements of operations. Investments in Private Investment Companies are valued utilizing the net asset values as a practical expedient. Certain Series of the Trust strategically invest a portion or all of their assets in total return products or indices. In a typical Income Taxes—The Trust, with respect to the Series, applies the provisions of ASC 740Income Taxes (“ASC 740”), which provides guidance for how uncertain tax positions should be recognized, measured, presented and disclosed in the financial statements. This interpretation also provides guidance on derecognition, classification, interest and penalties, accounting in interim periods and disclosure. ASC 740 requires the evaluation of tax positions taken or expected to be taken in the course of preparing the Trust, with respect to the Series’, financial statements to determine whether the tax positions are “more-likely-than-not” of being sustained by the applicable tax authority. Tax positions with respect to tax at the Trust’s level not deemed to meet the “more-likely-than-not” threshold would be recorded as a tax benefit or expense in the current year. The Managing Owner has concluded there is no tax expense, interest or penalties to be recorded by the Trust, with respect to the Series. The In the opinion of the Managing Owner, (i) the Trust, with respect to the Series, is treated as a partnership for federal income tax purposes and, assuming that at least 90% of the gross income of the Trust constitutes “qualifying income” within the meaning of Section 7704(d) of the Code, (ii) the Trust is not a publicly traded partnership treated as a corporation, and Fees and Expenses—All management fees, incentive fees, service fees and trading fees of the Trust, with respect to the Series, are paid to the Managing Owner. It is the responsibility of the Managing Owner to pay all Trading Advisor management and incentive fees, selling agent service fees and all other operating expenses and continuing offering costs of the Trust, with respect to the Series. Only management fees and incentive fees related to assets allocated through Trading Companies are included as expenses on the Statement of Operations. The Series are all charged management and incentive fees on the asset allocated through the Galaxy Plus entities. Those fees are included in unrealized gain/(loss) on private investment companies on the Statements of Operations. Service Fees—The Trust may maintain each Series of Units in Masters Fund or Class 2a Units of the Equinox Frontier Long/Short Commodity Fund sold) until such Class 2 or Class 2a Units which are subject to the fee limitation are reclassified as Class 3 or Class 3a Units of the applicable Series for administrative purposes. Currently the service fee is not charged to Class 1AP investors. The Managing Owner may also pay selling agents certain additional fees and expenses for administrative and other services rendered and expenses incurred by such selling agents. F-28 These service fees are part of the offering costs of the Trust, with respect to the Series, which include registration and filing fees, legal and blue sky expenses, accounting and audit, printing, marketing support and other offering costs which are borne by the Managing Owner. With respect to the service fees, the initial service fee (for the first 12 months) relating to a purchase of Class 1 and Class 1a Units by an investor is prepaid by the Managing Owner to the relevant selling agent in the month following such purchase and is reimbursed for such payment by the Series monthly in arrears in an amount based upon a corresponding percentage of NAV, calculated daily. Consequently, the Managing Owner bears the risk of the downside and the benefit of the upside potential of any difference between the amount of the initial service fee prepaid by it and the amount of the reimbursement thereof, which may result from variations in NAV over the following 12 months. Pending Owner Additions—Funds received for new subscriptions and for additions to existing owner interests are recorded as capital additions at the NAV per unit of the second business day following receipt. Recently Adopted Accounting
In February, 2015, the FASB issued Accounting Standards Update (ASU) No. 2015-02, Consolidation (Topic 810): Amendments to the Consolidation Analysis. ASU 2015-02 provides guidance on the consolidation evaluation for reporting organizations that are required to evaluate whether they should consolidate certain legal entities such as limited partnerships, limited liability corporations, and securitization structures (collateralized debt obligations, collateralized loan obligations, and mortgage-backed security transactions). ASU 2015-02 is effective for periods beginning after December 15, 2015. The adoption of ASU 2015-02
Subsequent Events—The
In connection with the valuation of investments the Series apply ASC Level 1 Inputs Unadjusted quoted prices in active markets for identical financial assets that the reporting entity has the ability to access at the measurement date. Level 2 Inputs Inputs other than quoted prices included in Level 1 that are observable for the financial assets or liabilities, either directly or indirectly. These might include quoted prices for similar financial assets in active markets, quoted prices for identical or similar financial assets in markets that are not active, inputs other than quoted prices that are observable for the financial assets or inputs that are derived principally from or corroborated by market data by correlation or other means. Level 3 Inputs Unobservable inputs for determining the fair value of financial assets that reflect an entity’s own assumptions about the assumptions that market participants would use in pricing the financial asset. F-29 The Trust, with respect to the Series, uses the following methodologies to value instruments within its financial asset portfolio at fair value: Trading Securities. These instruments include U.S. Treasury securities and open trade equity positions (futures contracts) that are actively traded on public markets with quoted pricing for corroboration. U.S. Treasury securities and futures contracts are reported at fair value using Level 1 inputs. Trading securities instruments further include open trade equity positions (trading options and currency forwards) that are quoted prices for identical or similar assets that are not traded on active markets. Trading options and currency forwards are reported at fair value using Level 2 inputs. Swap
Investment in Unconsolidated Trading Companies. This investment represents the fair value of the allocation of cash, futures, forwards, options and swaps to each respective Series relative to its trading allocations from unconsolidated Trading Companies. A Series may redeem its investment in any of the Trading Companies on a daily basis at the Trading Company’s stated net asset value. Each of the Series, all of which are under the same management as the Trading Companies, has access to the underlying positions of the Trading Companies, and as such, the level determination is reflected on that look-through basis. Any redemption of an investment in a Trading Company classified as Level 3 will reflect that classification of the underlying investment owned by the Trading Company. As such, the Series report investments in unconsolidated Trading Companies at fair value using the corresponding inputs of the underlying securities of the Trading Companies which results in the Series reporting the corresponding level determination from the inputs of the Trading Company. Investments in Private Investment Companies. Investments in private investment companies are valued utilizing the net asset values provided by the underlying Private Investment Companies as a practical expedient. The Fund applies the practical expedient to its investments in Private Investment Companies on an investment-by-investment basis, and consistently with the Fund’s entire position in a particular investment, unless it is probable that the Fund will sell a portion of an investment at an amount different from the net asset value of the investment. Management has adopted Accounting Standards Update (“ASU”) ASU 2015-07,Disclosures for Investments in Certain Entities That Calculate Net Asset Value per Share (or Its Equivalent)— a consensus of the Emerging Issues Task Force issued, on May 1, 2015. The guidance in this standard was effective for interim and annual periods beginning after December 15, 2015. In accordance with Subtopic 820-10, certain investments that are measured at fair value using the net asset value per share (or its equivalent) have not been classified in the fair value hierarchy below. F-30 The following table summarizes the instruments that comprise the Trust, with respect to the Series, financial asset portfolio, by Series, measured at fair value on a recurring basis as of December 31,
F-31 December 31, 2014 Equinox Frontier Balanced Fund Open Trade Equity (Deficit) Investments in Unconsolidated Trading Companies Swap Contracts U.S. Treasury Securities Equinox Frontier Select Fund Investments in Unconsolidated Trading Companies U.S. Treasury Securities Equinox Frontier Winton Fund Investments in Unconsolidated Trading Companies U.S. Treasury Securities Equinox Frontier Heritage Fund Investments in Unconsolidated Trading Companies Swap Contracts U.S. Treasury Securities December 31, 2013 Equinox Frontier Diversified Fund Investment in Unconsolidated Trading Companies Swap Contracts U.S. Treasury Securities Equinox Frontier Masters Fund Investment in Unconsolidated Trading Companies U.S. Treasury Securities Equinox Frontier Long/Short Commodity Fund Open Trade Equity (Deficit) Options purchased Options Written Investment in Unconsolidated Trading Companies Swap Contracts U.S. Treasury Securities Equinox Frontier Balanced Fund Open Trade Equity (Deficit) Options purchased Options Written Investment in Unconsolidated Trading Companies Swap Contracts U.S. Treasury Securities Equinox Frontier Select Fund Investment in Unconsolidated Trading Companies U.S. Treasury Securities
December 31, 2013 Equinox Frontier Winton Fund Investment in Unconsolidated Trading Companies U.S. Treasury Securities Equinox Frontier Heritage Fund Investment in Unconsolidated Trading Companies Swap Contracts U.S. Treasury Securities The changes in Level 3 assets measured at fair value on a recurring basis are summarized in the following tables. Swap contract asset gains and losses F-32
For the Year Ended December 31, Swaps:
Investments in Unconsolidated Trading Companies:
F-33
For the Year Ended December 31, Swaps:
Investments in Unconsolidated Trading Companies:
The Series of the Trust assess the levels of the investments at each measurement date, and transfers between levels are recognized on the actual date of the event or change in circumstances that caused the transfer in accordance with the Series’ accounting policy regarding the recognition of transfers between levels of the fair value hierarchy. During the year ended December 31, The amounts reflected in the change in ownership allocation result from changes in ownership in the underlying Trading Companies at the Series level, which have resulted in changes in consolidation or de-consolidation by the Series. The ownership in the Trading Companies is accounted for under the equity method, which approximates fair value. The Equinox Frontier Heritage Fund and the Equinox Frontier Select Fund jointly own the Frontier Brevan Howard swap. The Equinox Frontier Heritage Fund owns the majority interest in the Frontier Brevan Howard swap. F-34 The total change in unrealized appreciation (depreciation) included in the statements of operations attributable to level 3 investments still held at December 31, 2016:
The total change in unrealized appreciation (depreciation) included in the statements of operations attributable to level 3 investments still held at December 31,
The total change in unrealized appreciation (depreciation) included in the statements of operations attributable to level 3 investments still held at December 31,
F-35
In addition to authorizing Trading Advisors to manage pre-determined investment levels of futures, option on futures and forward contracts, certain Series of the Trust will strategically invest a portion or all of their assets in total return Each Series’ investment in The Managing Owner follows a procedure in selecting well-established financial institutions which the Managing Owner, in its sole discretion, considers to be reputable, reliable, financially responsible and well established to act as swap counterparties. The procedure includes due diligence review of documentation on all new and existing financial institution counterparties prior to initiation of the relationship, and quarterly ongoing review during the relationship, to ensure that counterparties meet the Managing Owner’s minimum credit requirements, the counterparty average rating being no less than an investment grade rating as defined by the rating agencies. As of December 31, The Series may strategically invest assets in one or more
To help to reduce counterparty risk on the Series, the Managing Owner has the right to reduce the Series’ exposure and remove cash from the Series’ total return swaps with Deutsche Bank AG. This cash holding shall be in excess of $250,000, and may not exceed 40% of the Index exposure in total. Index exposure is defined as the total notional amount plus any profit. The funds are charged interest on this cash holding and any amount removed will be offset against the final settlement value of the swap. As of December 31, 2016, the Equinox Frontier Balanced Fund, The Series
F-36 The Series have invested in the following
Investments in unconsolidated Companies and Private Investment Companies. Trading Companies and Private Investment Companies allocate trading profits or losses on the basis of the proportion of each Series’ capital allocated for trading to each respective Trading Company, which bears no relationship to the amount of cash invested by a Series in the Trading F-37 The following table summarizes each of the Series’ investments in unconsolidated Trading and Private Investment Companies as of December 31,
The Galaxy Plus entities are made up a feeder funds in which the Series invest and master trading entities into which the feeder funds invest. No investment held by the Galaxy Plus master trading entity is greater than 5% of the Series’ total capital. F-38 The following table summarizes each of the Series’ equity in earnings from unconsolidated Trading and Private Investment Companies for the years ended December 31,
F-39 The Series investments in private investment companies have certain redemption and liquidity restrictions which are described in the following table: Equinox Frontier Select Fund Frontier Trading Company V LLC Frontier Trading Company VI LLC Frontier Trading Company XV, LLC Frontier Trading Company XXI, LLC Frontier Trading Company XXXVIII, LLC Frontier Trading Company XXXIX, LLC Total Equinox Frontier Winton Fund Frontier Trading Company II LLC Frontier Trading Company XXXVIII ,LLC Total Equinox Frontier Heritage Fund Frontier Trading Company II LLC Frontier Trading Company V LLC Frontier Trading Company XXXVIII, LLC Frontier Trading Company XXXIX, LLC Total
F-40
The Managing Owner contributes funds to the Trust, with respect to the Series, in order to have a 1% interest (“Minimum Purchase Commitment”) in the aggregate capital, profits and losses of all Series and in return will receive units designated as general units in the Series in which the Managing Owner invests such funds. The general units may only be purchased by the Managing Owner and may be subject to no advisory fees or advisory fees at reduced rates. Otherwise, the general units hold the same rights as the limited units. The Managing Owner Expenses Management Fees—Each Series of Units pays to the Managing Owner a monthly management fee equal to a percentage of the nominal assets of such Series allocated to Trading Companies, calculated on a daily basis. In addition, the Managing Owner receives a monthly management equal to a certain percentage of the assets in the Galaxy Plus entities attributable to such Series’ (including nominal assets), calculated on a monthly basis. The management fees attributable to Galaxy Plus entities are included in unrealized gain/(loss) on private investment companies on the Statements of Operations. The total amount of assets of a The management fee as a percentage of the applicable Trading 0.75% per annum of such Series’ NAV, calculated F-41 Incentive Fees—Some Series pay to the Managing Owner an incentive fee of a certain percentage of new net trading profits generated in the Trading Companies by such Series, monthly or quarterly. In addition, the Managing Owner receives a quarterly incentive fee of a certain percentage of new net trading profits generated in the Galaxy Plus entities that have been allocated to the Series. The incentive fees attributable to Galaxy Plus entities are included in unrealized gain/(loss) on private investment companies on the Statements of Operations Because the Equinox Frontier Balanced Fund, Equinox Frontier Heritage Fund, Equinox Frontier Select Fund, and Equinox Frontier Long/Short Commodity Fund may each employ multiple Trading Advisors, these Series will pay the Managing Owner a monthly incentive fee calculated on a Trading Advisor by Trading Advisor basis. It is therefore possible that in any given period the Series may pay incentive fees to the Managing Owner for one or more Trading Advisors while each of these Series as a whole experiences losses. The incentive fee is 25% for the Equinox Frontier Balanced Fund and the Equinox Frontier Diversified Fund and 20% for the Equinox Frontier Winton Fund, Equinox Frontier Heritage Fund, Equinox Frontier Select Fund, Equinox Frontier Long/Short Commodity Fund and Equinox Frontier Masters Fund. The Managing Owner may pay all or a portion of such incentive fees to the Trading Advisor(s) for such Series. Service Fees—In addition, with respect to Class 1 and Class 1a Units of each Series, as applicable, the Series pays monthly or F-42 The following table summarizes fees earned by the Managing Owner for the years ended December 31,
F-43 The following table summarizes fees payable to the Managing Owner as of December 31,
With respect to the service fees, the initial service fee (for the first 12 months) relating to a purchase of Units by an investor is prepaid by the Managing Owner to the relevant selling agent in the month following such purchase and is reimbursed therefore by the Series monthly in arrears in an amount based upon a corresponding percentage of NAV, calculated daily. Consequently, the Managing Owner bears the risk and the benefit of the upside potential of any difference between the amount of the initial service fee prepaid by it and the amount of the reimbursement thereof, which may result from variations in NAV over the following 12 months.
Aggregate interest income from all sources, including U.S. Treasury Securities assets net of premiums and cash held at clearing brokers, of up to the first 2% (annualized) is paid to the Managing Owner by the Equinox Frontier Balanced Fund (Class 1 and Class F-44 The following table outlines the
Equinox Frontier Winton Fund Equinox Frontier Winton Fund Equinox Frontier Heritage Fund Equinox Frontier Heritage Fund Equinox Frontier Heritage Fund Total
Equinox Financial Group, LLC, an affiliate of the Trust, provides management services for the Managing Owner who paid Solon Capital, LLC, an affiliate of the Trust, provides product development and marketing services. For these services, the Managing Owner paid Solon Capital, LLC, Equinox Group Distributors LLC, an affiliate under common control of the Managing Owner, serves as wholesaler of the Trust by marketing to broker/dealer organizations. During the year, Equinox Frontier Long/Short Commodity Fund borrowed from the pooled cash management account to fund a portion of its investments in Galaxy Plus entities. As of December 31, 2016, the Equinox Frontier Long/Short Commodity Fund owes the other Series $1,608,862. Equinox Frontier Long/Short Commodity Fund is being charged an annual interest rate of 0.25% on this borrowing. F-45 During the year ended December 31, 2016, each Series changed its administrator from BNP Paribas to Gemini Hedge Fund Services, LLC. Gemini Hedge Fund Services, LLC is an affiliate of the Sponsor. During the year ended December 31, 2016, each Series changed its transfer agency provider from Phoenix American Financial Services, Inc. to Gemini Fund Services, LLC. Gemini Fund Services, LLC is an affiliate of the Sponsor.
The following information presents the financial highlights of the Series for the years ended December 31,
Per unit operating performance (1) Net asset value, December 31, 2012 Net operating results: Interest income Expenses Net gain/(loss) on investments, net of non-controlling interests Net income/(loss) Net asset value, December 31, 2013 Ratios to average net assets (3) Net investment income/(loss) Expenses before incentive fees (4) Expenses after incentive fees (4) Total return before incentive fees (2) Total return after incentive fees (2)
F-46 Per unit operating performance (1) Net asset value, December 31, 2011 Net operating results: Interest income Expenses Net gain/(loss) on investments, net of non-controlling interests Net income/(loss) Net asset value, December 31, 2012 Ratios to average net assets (3) Net investment income/(loss) Expenses before incentive fees (6) Expenses after incentive fees (6) Total return before incentive fees (2) Total return after incentive fees (2) Per unit operating performance (1) Net asset value, December 31, 2011 Net operating results: Interest income Expenses Net gain/(loss) on investments, net of non-controlling interests Net income/(loss) Net asset value, December 31, 2012 Ratios to average net assets (3) Net investment income/(loss) Expenses before incentive fees (6) Expenses after incentive fees (6) Total return before incentive fees (2) Total return after incentive fees (2)
F-47
F-48
The Series’ primary business is to engage in speculative trading of a diversified portfolio of futures, forwards (including interbank foreign currencies), options contracts and other derivative instruments (including swap contracts). The Series do not enter into or hold positions for hedging purposes as defined under ASC 815,Derivatives and Hedging (“ASC 815”). The detail of the fair value of the Series’ derivatives by instrument types as of December 31, The following tables summarize the monthly averages of futures contracts bought and sold for each respective Series of the Trust:
The following tables summarize the trading revenues for the years ended December 31, Realized Trading Revenue from Futures, Forwards and Options for the Year
Realized Trading Revenue from Futures, Forwards and Options for the Year
Realized Trading Revenue from Futures, Forwards and Options for the Year
F-50 Net Change in Open Trade Equity from Futures, Forwards and Options for the Year Ended December 31, 2016
Net Change in Open Trade Equity from Futures, Forwards and Options for the Year Ended December 31, 2015
Net Change in Open Trade Equity from Futures, Forwards and Options for the Year Ended December 31, 2014
Certain financial instruments and derivative instruments are eligible for offset in the statements of financial condition under GAAP. The Series’ open trade equity/(deficit), options written, and receivables from futures F-51 The following tables present gross and net information about the Series’ assets and liabilities subject to master netting arrangements as disclosed on the statements of financial condition as of December 31,
As of December 31, 2015
F-52
The purchase and sale of futures and options on futures contracts require margin deposits with FCMs. Additional deposits may be necessary for any loss on contract value. The Commodity Exchange Act, as amended (the “Commodity Exchange Act”) requires an FCM to segregate all customer transactions and assets from the FCM’s proprietary activities. A customer’s cash and other property (for example, U.S. treasury bills) deposited with an FCM are considered commingled with all other customer funds subject to the FCM’s segregation requirements. In the event of an FCM’s insolvency, recovery may be limited to a pro rata share of segregated funds available. It is possible that the recovered amount could be less than the total of cash and other property deposited. The term “off-balance sheet risk” refers to an unrecorded potential liability that, even though it does not appear on the statements of financial condition, may result in future obligation or loss in excess of the amount paid by the Series for a particular investment. Each Trading Company expects to trade in futures, options, forward and swap contracts and will therefore be a party to financial instruments with elements of off-balance sheet market and credit risk. In entering into these contracts, there exists a market risk that such contracts may be significantly influenced by market conditions, such as interest rate volatility, resulting in such contracts being less valuable. If the markets should move against all of the futures positions held by a Trading Company in respect of any Series at the same time, and if the Trading Advisor(s) of such Trading Company are unable to offset such futures interests positions, such Trading Company could lose all of its assets and the holders of Units of such Series would realize a 100% loss. The Managing Owner will seek to minimize market risk through real-time monitoring of open positions and the level of diversification of each Trading Advisor’s portfolio. It is anticipated that any Trading Advisor’s margin-to-equity ratio will typically not exceed approximately 35% although the actual ratio could be higher or lower from time to time. In addition to market risk, trading futures, forward and swap contracts entails credit risk that a counterparty will not be able to meet its obligations to a Trading Company. The counterparty for futures contracts traded in the United States and on most foreign exchanges is the clearinghouse associated with such exchange. In general, clearinghouses are backed by the corporate members of the clearinghouse who are required to share any financial burden resulting from the non-performance by one of their members and, as such, should significantly reduce this credit risk. In cases where the clearinghouse is not backed by the clearing members, like some foreign exchanges, it is normally backed by a consortium of banks or other financial institutions. Some non-U.S. exchanges, in contrast to U.S. exchanges, are principals’ markets in which performance is the responsibility only of the individual counterparty with whom the Trading Company has entered into the transaction, and not of the exchange or clearing corporation. In these kinds of markets, there is risk of bankruptcy or other failure or refusal to perform by the counterparty. In the case of forward contracts traded on the interbank market and swaps, neither is traded on exchanges. The counterparty is generally a single bank or other financial institution, rather than a group of financial institutions; thus there may be a greater counterparty credit risk. The Managing Owner expects the Trading Advisors to trade only with those counterparties which it believes to be creditworthy. All positions of each Trading Company will be valued each day on a mark-to-market basis. There can be no assurance that any clearing member, clearinghouse or other counterparty will be able to meet its obligations to any Trading Company. The Managing Owner has established procedures to actively monitor and minimize market and credit risks. The Limited Owners bear the risk of loss only to the extent of the market value of their respective investments and, in certain specific circumstances, distributions and redemptions received.
The Trust has entered into agreements, which provide for the indemnification of futures clearing brokers, and commodity trading advisers, among others, against losses, costs, claims and liabilities arising from the performance of their individual obligations under such agreements, except for gross negligence or bad faith. The Trust has had no prior claims or payments pursuant to these agreements. The Trust’s individual maximum exposure under these arrangements is unknown, as this would involve future claims that may be made against the Trust that have not yet occurred. However, based on experience the Trust expects the risk of loss to be remote. Maximum exposure is unfulfilled obligations of the Series up to the amount of equity at risk with UBS Securities LLC of the referenced Series as allocated from the Trading Company. The Series have not recorded any liability for the guarantees in the accompanying financial statements as it expects any possibility of losses to be remote. The Trust has guaranteed the obligations of the Trading Companies under the customer agreements with UBS Securities LLC as Clearing Broker. In the event that one Series of the Trust is unable to meet its obligations to UBS Securities LLC, the assets of the other Series will be available to UBS Securities LLC as part of the guarantee, but only to the extent of such Series’ pro rata allocation to the Trading Company. The Series have not recorded any liability for the indemnifications in the accompanying financial statement, as it expects any possibility of losses to be remote. As of September 2016, the Trust no longer uses UBS Securities LLC as a Clearing Broker. F-53
On The Transaction was consummated on In connection with the foregoing, the Trust Agreement was amended to effect certain changes to replace Equinox as the Managing Owner and to reflect the New Managing Owner as the new managing owner. Also, the New Managing Owner has temporarily suspended the sale of Units (as defined in the The New Managing Owner is seeking to cause the suspension to be Any forward-looking statements herein are based on expectations of the New Managing Owner at this time. Whether or not actual results and developments will conform to the New Managing Owner’s expectations and predictions, however, is subject to a number of risks and uncertainties, including the special considerations discussed in the F-54 Report of Independent Registered Public Accounting Firm To the Executive Committee Equinox Frontier Funds We have audited the accompanying consolidated statements of financial condition, including the consolidated condensed schedules of investments, of Equinox Frontier Funds (the Trust) as of December 31, We conducted our audits in accordance with the standards of the Public Company Accounting Oversight Board (United States). Those standards require that we plan and perform the In our opinion, the consolidated financial statements referred to above present fairly, in all material respects, the financial position of Equinox Frontier Funds as of December 31, As discussed in Note 10 to the consolidated financial statements, on March 6, 2017 a unit purchase agreement between Frontier Fund Management LLC (New Managing Owner) and Equinox Fund Management (Equinox) was consummated whereby Equinox’s general units were transferred to the New Managing Owner. Upon consummation, the New Managing Owner became the managing owner of the Trust and each Series, in replacement of Equinox. /s/ Denver, Colorado March 31, F-55 Consolidated Statements of Financial Condition December 31,
The accompanying notes are an integral part of these consolidated financial statements. F-56 Consolidated Condensed Schedule of Investments December 31,
Description CURRENCY FORWARDS * Various currency forwards contracts (NA) Total Currency Forwards Total Open Trade Equity (Deficit) OPTIONS PURCHASED * Various energy futures contracts (U.S.) Various soft futures contracts (U.S.) Various stock index futures contracts (U.S.) Total Options Purchased OPTIONS WRITTEN * Various energy futures contracts (U.S.) Various soft futures contracts (U.S.) Various stock index futures contracts (U.S.) Total Options Written SWAPS (1) Frontier XXXIV Balanced select swap (U.S.) Frontier Brevan Howard swap (U.S.) Frontier XXXV Diversified select swap (U.S.) Frontier XXXVII L/S select swap (U.S.) Total Swaps U.S. TREASURY SECURITIES FACE VALUE $15,000,000 US Treasury Note 2.250% due 11/15/2024 (Cost $14,966,695) $75,000,000 US Treasury Note 6.000% due 02/15/2026 (Cost $99,579,227) $20,000,000 US Treasury Note 6.875% due 08/15/2025 (Cost $28,322,622) Total U.S. Treasury Securities
The accompanying notes are an integral part of these consolidated financial statements. F-57 Consolidated Condensed Schedule of Investments December 31,
Description OPTIONS PURCHASED * Various base metals futures contracts (Europe) Various currency futures contracts (U.S.) Various energy futures contracts (U.S.) Various interest rates futures contracts (U.S.) Various precious metal futures contracts (U.S.) Various soft futures contracts (U.S.) Various stock index futures contracts (U.S.) Total Options Purchased OPTIONS WRITTEN * Various base metals futures contracts (Europe) Various currency futures contracts (U.S.) Various energy futures contracts (U.S.) Various interest rates futures contracts (U.S.) Various precious metal futures contracts (U.S.) Various soft futures contracts (U.S.) Various stock index futures contracts (U.S.) Total Options Written SWAPS (1) Frontier XXXIV Balanced select swap (U.S.) Frontier Brevan Howard swap (U.S.) Frontier XXXV Diversified select swap (U.S.) Frontier XXXVII L/S select swap (U.S.) Total Swaps U.S. TREASURY SECURITIES FACE VALUE $11,500,000 US Treasury Note 1.125% due 12/31/2019 (Cost $11,178,122) $11,500,000 US Treasury Note 2.000% due 09/30/2020 (Cost $11,611,497) $25,000,000 US Treasury Note 2.500% due 08/15/2023 (Cost $25,034,823) $13,000,000 US Treasury Note 2.125% due 08/15/2021 (Cost $13,066,678) $13,000,000 US Treasury Note 2.000% due 11/15/2021 (Cost $12,945,421) $75,000,000 US Treasury Note 6.000% due 02/15/2026 (Cost $99,579,227) $20,000,000 US Treasury Note 6.875% due 08/15/2025 (Cost $28,322,622) Total U.S. Treasury Securities
The accompanying notes are an integral part of these consolidated financial statements. F-58
The accompanying notes are an integral part of these consolidated financial statements. F-59
The consolidated Trust is not unitized as are the individual Series of the Trust
The accompanying notes are an integral part of these consolidated financial statements. F-60
The accompanying notes are an integral part of these consolidated financial statements. F-61
Equinox Frontier Funds, which is referred to in this report as Purchasers of Units are The Trust has been organized to pool investor funds for the purpose of trading in the The Trust has seven (7) separate and distinct Series of Units issued and outstanding: Equinox Frontier Diversified Fund, Equinox Frontier Masters Fund, Equinox Frontier Long/Short Commodity Fund, Equinox Frontier Balanced Fund, Equinox Frontier Select Fund, Equinox Frontier Winton Fund, and Equinox Frontier Heritage The Trust, with respect to each Series:
The assets of any particular Series include only those funds and other assets that are paid to, held by or distributed to the Trust on account of and for the benefit of that Series. Under the “Inter-Series Limitation on Liability” expressly provided for under Section 3804(a) of the Trust Act, separate and distinct records of the cash and equivalents, although pooled for maximizing returns, is maintained in the books and records of each Series. As of December 31, Fund separates Units into three separate Classes—Class 1, Class 2, and Class 3. The Trust, with respect to the Equinox Frontier
The Trust has entered into agreements, which provide for the indemnification of futures clearing brokers, currency trading companies, and commodity trading advisers, among others, against losses, costs, claims and liabilities arising from the performance of their individual obligations under such agreements, except for gross negligence or bad faith.
The following are the significant accounting policies of the Trust. Basis of Presentation—The Trust Consolidation— Galaxy Plus entities are co-mingled investment vehicles. In addition to the Trust, there are other non-affiliated investors in Galaxy Plus. Subscriptions and redemptions by these non-affiliated investors will have a direct impact on the Trust ownership percentage in Galaxy Plus. It is expected that ownership percentage will fluctuate (sometimes significantly) on a week by week basis which could also result in frequent changes in the consolidating Series. Such fluctuations make consolidating the financial statements of the Galaxy Plus entities both impractical and misleading. Non-consolidation of these Galaxy Plus entities presents a more useful financial statement for the readers. As such, management has decided that presenting Galaxy Plus entities on a non-consolidated basis as investments in other investments companies (a “fund of funds” approach) is appropriate and preferable to the users of these financial statements. Refer to Note 5 for additional disclosures related to these private investment companies. Use of Estimates—The preparation of consolidated financial statements in conformity with GAAP may require the Managing Owner to make estimates and assumptions that affect the reported amounts of assets and liabilities and disclosure of contingent assets and liabilities at the date of the financial statements and the reported amounts of revenue and expenses during the reporting period. The valuation of swap contracts requires significant estimates as well as the valuation of certain other investments. Please refer to Note 3 for discussion of valuation methodology. Actual results could differ from these estimates and such differences could be material. Cash and Cash Equivalents—Cash and cash equivalents include cash and overnight investments in interest-bearing demand deposits held at banks with original maturities of three months or less. This cash is not restricted. Interest Income—U.S. Treasury Securities are pooled for purposes of maximizing returns on these assets to investors of all Series. Interest income from pooled cash management assets is recognized on the accrual basis and allocated daily to each Series based upon its daily proportion of ownership of the pool. Aggregate interest income from all sources, including U.S. F-64 U.S. Treasury Securities—U.S. Treasury Securities are reported at fair value as Level 1 inputs under ASC 820,Fair Value Measurements and Disclosures (“ASC 820”). The Trust values U.S. Treasury Securities at fair value and records the daily change in value in the consolidated statements of operations as net unrealized gain/(loss) on U.S. Treasury securities. Accrued interest is reported on the consolidated statements of financial condition as interest receivable. Receivable Investment Transactions—Futures, options on futures, forward and swap contracts are recorded on a trade date basis and realized gains or losses are recognized when contracts are settled. Unrealized gains or losses on open contracts (the difference between contract trade price and market price) are reported in the consolidated statements of financial condition as a net unrealized gain or loss, as there exists a right of offset of unrealized gains or losses in accordance with FASB ASC 210,Balance Sheet (“ASC 210”) and Accounting Standards Update (ASU) 2013-01,Balance Sheet (Topic 210). Any change in net unrealized gain or loss from the preceding period is reported in the consolidated statements of operations. Fair value of exchange-traded contracts is based upon exchange settlement prices. Fair value of non-exchange-traded contracts is based on third party quoted dealer values on the interbank market. For U.S. Treasury securities, interest was recognized in the period earned and the instruments were marked-to-market daily based on third party information. Transaction costs are recognized as incurred and reflected separately in the consolidated statements of operations. Purchase and Sales of Private Investment Companies – The Trust is able to subscribe into and redeem from the Galaxy Plus entities on a weekly basis. The value of the Private Investment Companies is determined by the Sponsor and reported on a daily basis. The change in value is calculated as the difference between the total purchase proceeds and the fair value calculated by the Sponsor and is recorded as net unrealized gain/(loss) on private investment companies on the statements of operations. Foreign Allocation of Earnings—Each Series of the Trust may maintain Each Series allocates funds to an affiliated Trading Company, or Companies, of the Trust, or unaffiliated Galaxy Plus entity. Each Trading Company allocates all of its daily trading gains or losses to the Series in proportion to each Series’ ownership trading level interest in the Trading Company, adjusted on a daily basis (except for Trading Advisors and other investments such as swaps that are directly allocated to a specific series). Likewise, trading gains and losses earned and incurred by the Series through their investments in Galaxy Plus entities are allocated to those Series on a daily basis. The allocation of gains and losses in Galaxy Plus entities are based on each Series pro-rata shares of the trading level of that entity which is updated at the beginning of each month or more frequently if there is a subscription or redemption activity in the entity. The value of all open contracts and cash held at clearing brokers is similarly allocated to the Series in proportion to each Series’ funds allocated to the Trading Companies or Galaxy Plus entities. Investments and performance, that is used to determine a daily fair value NAV for the swap contracts. F-65 Income In the opinion of the Managing Owner, (i) the Trust is treated as a partnership for Federal income tax purposes and, assuming that at least 90% of the gross income of the Trust constitutes “qualifying income” within the meaning of Section 7704(d) of the Code, (ii) the Trust is not a publicly traded partnership treated as a corporation, and Fees and Service Fees—The Trust may maintain each Series of Units in These service fees are part of the offering costs of the Trust, which include registration and filing fees, legal and blue sky expenses, accounting and audit, printing, marketing support and other offering costs which are the Managing Owner. With respect to the service fees, the initial service fee (for the first 12 months) relating to a purchase of Class 1 and Class 1a Units by an investor is prepaid by the Managing Owner to the relevant selling agent in the month following such purchase and is reimbursed for such payment by the Series monthly in arrears in an amount based upon a corresponding percentage of NAV, calculated daily. Consequently, the Managing Owner bears the risk of the downside and enjoys the benefit of the upside potential of any difference between the amount of the initial service fee prepaid by it and the amount of the reimbursement thereof, which may result from variations in NAV over the following 12 months. F-66 Pending Owner Additions—Funds received for new subscriptions and for additions to existing owner interests are recorded as capital additions at the NAV per unit of the second business day following receipt. Recently Adopted Accounting
In February, 2015, the FASB issued Accounting Standards Update (ASU) No. 2015-02, Consolidation (Topic 810): Amendments to the Consolidation Analysis. ASU 2015-02 provides guidance on the consolidation evaluation for reporting organizations that are required to evaluate whether they should consolidate certain legal entities such as limited partnerships, limited liability corporations, and securitization structures (collateralized debt obligations, collateralized loan obligations, and mortgage-backed security transactions). ASU 2015-02 is effective for periods beginning after December 15, 2015. The adoption of ASU 2015-02 Subsequent Events—The Trust follows the provisions of ASC 855,Subsequent Events, which establishes general standards of accounting for and disclosure of events that occur after the balance sheet date and up through the date the financial statements are issued.
In connection with the valuation of investments the Trust applies ASC 820,Fair Value Measurement (“ASC 820”). ASC 820 provides clarification that when a quoted price in an active market for the identical asset or liability is not available, a reporting entity is required to measure fair value using certain techniques. ASC 820 also clarifies that when estimating the fair value of an asset or liability, a reporting entity is not required to include a separate input or adjustment to other inputs relating to the existence of a restriction that prevents the transfer of an asset or liability. ASC 820 also clarifies that both a quoted price in an active market for the identical asset or liability at the measurement date and the quoted price for the identical asset or liability when traded as an asset in an active market when no adjustments to the quoted price of the asset are required are Level 1 fair value measurements. Level 1 Inputs Unadjusted quoted prices in active markets for identical financial assets that the reporting entity has the ability to access at the measurement date. Level 2 Inputs Inputs other than quoted prices included in Level 1 that are observable for the financial assets or liabilities, either directly or indirectly. These might include quoted prices for similar financial assets in active markets, quoted prices for identical or similar financial assets in markets that are not active, inputs other than quoted prices that are observable for the financial assets or inputs that are derived principally from or corroborated by market data by correlation or other means. Level 3 Inputs Unobservable inputs for determining the fair value of financial assets that reflect an entity’s own assumptions about the assumptions that market participants would use in pricing the financial asset. The Trust uses the following methodologies to value instruments within its financial asset portfolio at fair value: Trading Securities. These instruments include U.S. Treasury securities and open trade equity positions (futures contracts) that are actively traded on public markets with quoted pricing for corroboration. U.S. Treasury securities and futures contracts are reported at fair value using Level 1 inputs. Trading securities instruments further include F-67 Swap
Investments in Private Investment The following table summarizes the instruments that comprise the Trust’s financial asset portfolio,
The changes in Level 3 assets measured at fair value on a recurring basis are summarized in the following tables. Swap contract asset gains and losses (realized/unrealized) included in earnings are classified in “realized and unrealized gain (loss) on investments – net F-68
Balance of recurring Level 3 assets as of January 1, 2013 Total gains or losses (realized/unrealized): Included in earnings-realized Included in earnings-unrealized Purchases of investments Sales of investments Transfers in and/or out of Level 3 Balance of recurring Level 3 assets as of December 31, 2013 The Trust assesses the levels of the investments at each measurement date, and transfers between levels are recognized on the actual date of the event or change in circumstances that caused the transfer in accordance with the Trust’s accounting policy regarding the recognition of transfers between levels of the fair value hierarchy. During the years ended December 31, The total change in unrealized appreciation (depreciation) included in the statements of operations attributable to level 3 investments still held at December 31, 2016:
The total change in unrealized appreciation (depreciation) included in the statements of operations attributable to level 3 investments still held at December 31, 2015:
The total change in unrealized appreciation (depreciation) included in the statements of operations attributable to level 3 investments still held at December 31, 2014.
In addition to authorizing Trading Advisors to manage pre-determined investment levels of futures and forward contracts, certain Series of the Trust will strategically invest a portion or all of their assets in total return swaps, selected at the direction of the Managing Owner. Total return The Trust’s investment in F-69 The Managing Owner follows a procedure in selecting well-established financial institutions which the Managing Owner, in its sole discretion, considers to be reputable, reliable, financially responsible and well established to act as swap counterparties. The procedure includes due diligence review of documentation on all new and existing financial institution counterparties prior to initiation of the relationship, and quarterly ongoing review during the relationship, to ensure that counterparties meet the Managing Owner’s minimum credit requirements, the counterparty average rating being no less than an investment grade rating as defined by the rating agencies. As of December 31, The Trust strategically invests assets in one or more swaps linked to certain underlying investments or indices at the direction of the Managing Owner. The Trading Company in which the assets of the Trust will be invested will not own any of the investments or indices referenced by any swap entered into by the Trust. In addition, neither the swap counterparty nor any advisor referenced by any such swap is a Trading Advisor to the Trust.
The Trust had invested in the following swaps as of and for the year ended December 31,
The Trust had invested in the following swaps as of and for the year ended December 31, 2015:
Investments in Private Investment Companies represent cash and open trade equity invested in the Private Investment Companies as well as the cumulative trading profits or losses allocated to the Trust by the Private Investment Companies. Private Investment Companies allocate trading profits or losses on the basis of the proportion of the Trust’s capital allocated for trading to each respective Private Investment Company, which bears no relationship to the amount of cash invested by the Trust in the Private Investment Companies. Investments in Private Investment Companies are valued using the NAV provided by the underlying private investment. F-70 The following table summarizes each of the Trust’s investments in Private Investment Companies as of December 31, 2016:
The Galaxy Plus entities are made up a feeder funds in which the Trust invests and master trading entities into which the feeder funds invest. No investment held by the Galaxy Plus master trading entity is greater than 5% of the Trust’s total capital. The following table summarizes each of the Trust’s equity in earnings from Private Investment Companies for the year ended December 31, 2016:
F-71 The Trust’s investments in private investment companies have certain redemption and liquidity restrictions which are described in the following table:
The Managing Owner contributes funds to the Trust in order to have a 1% interest in the aggregate capital, profits and losses and in return will receive units designated as general units in the Series of the Trust in which the Managing Owner invests such funds. The general units may only be purchased by the Managing Owner and may be subject to no advisory fees or management advisory fees at reduced rates. Otherwise, the general units hold the same rights as the limited units. The Managing Owner is required to maintain at least a 1% interest (“Minimum Purchase Commitment”) in the aggregate capital, profits and losses of the Trust so long as it is acting as the Managing Owner of the Trust. Such contribution was made by the Managing Owner before trading commenced for the Trust and will be maintained throughout the existence of the Trust, and the Managing Owner will make such purchases as are necessary to effect this requirement. Additionally, the Managing Owner agreed with certain regulatory bodies to maintain a 1% interest specifically in the Equinox Frontier Balanced Fund Class Expenses Management Fees—Each Series of Units pays to the Managing Owner a monthly management fee equal to a percentage of the nominal assets of such Series allocated to Trading Companies, calculated on a daily basis. In addition, the Managing Owner receives a monthly management equal to a certain percentage of the assets in the Galaxy Plus entities attributable to such Series’ (including notional assets), calculated on a monthly basis. The management fees attributable to Galaxy Plus entities are included in unrealized gain/(loss) on private investment companies on the Statements of Operations. The total amount of assets of a F-72 The management fee as a percentage of the applicable Trading Fees—In connection with each Series’ trading activities,
Incentive Fees—Some Series Service Fees—In addition, with respect to Class 1 and Class 1a Units of each Series of the Trust, as applicable, the Series pays monthly or quarterly to the Managing Owner a service fee of up to 3% annually, which the Managing Owner pays to selling agents of the Trust. As of December 31,
For the year ended December 31, For the year ended December 31, 2015, the Trust paid the Managing Owner $5,723,374, $5,028,224, $4,309,654 and $3,452,315 for incentive fees, management fees, service fees, and trading fees, respectively. For the year ended December 31, 2014, the Trust paid the Managing Owner $11,993,289, $5,857,792, $4,357,428 and $3,327,096 for incentive fees, management fees, service fees, and trading fees, respectively.
With respect to the service fees, the initial service fee (for the first 12 months) relating to a purchase of Units by an investor is prepaid by the Managing Owner to the relevant selling agent in the month following such purchase and is reimbursed therefore by the Series monthly in arrears in an amount based upon a corresponding percentage of NAV, calculated daily. Consequently, the Managing Owner bears the risk and enjoys the benefit of the upside potential of any difference between the amount of the initial service fee prepaid by it and the amount of the reimbursement thereof, which may result from variations in NAV over the following 12 months. F-73 For the years ended December 31, Aggregate interest income from all sources, including U.S. Treasury Securities assets net of premiums and cash held at clearing brokers, of up to the first 2% (annualized) is paid to the Managing Owner by the Equinox Frontier Balanced Fund (Class 1 and Class 2 only), Equinox Frontier Winton Fund, Equinox Frontier Select Fund, and Equinox Frontier Heritage Fund. For the Equinox Frontier Diversified Fund, Equinox Frontier Long/Short Commodity Fund (Class 1a, Class 2a, Class 3a only), Equinox Frontier Masters Fund, and Equinox Frontier Balanced Fund (Class
Equinox Financial Group, LLC, an affiliate of the Trust, provides management services for the Managing Owner who paid Solon Capital, LLC, an affiliate of the Trust, provides product development and marketing services. For these services, the Managing Owner paid Solon Capital, LLC, Equinox Group Distributors LLC, an affiliate under common control of the Managing Owner, serves as wholesaler of the Trust by marketing to broker/dealer organizations. During the year ended December 31, 2016 each Series changed its administrator from BNP Paribas to Gemini Hedge Fund Services, LLC. Gemini Hedge Fund Services, LLC is an affiliate of the Sponsor. During the year ended December 31, 2016, each Series changed its transfer agency provider from Phoenix American Financial Services, Inc. to Gemini Fund Services, LLC. Gemini Fund Services, LLC is an affiliate of the Sponsor.
The following information presents the financial highlights of the Trust for the year ended December 31,
The Trust financial highlights are calculated based upon the Trust’s consolidated financial statements. The consolidated Trust does not issue units and therefore the financial highlights do not disclose any unitized data. F-74
The Trust’s primary business is to engage in speculative trading of a diversified portfolio of futures, forwards (including interbank foreign currencies), options contracts and other derivative instruments (including swap contracts). The Trust does not enter into or hold positions for hedging purposes as defined under ASC 815. The detail of the fair value of the Trust’s derivatives by instrument types as of December 31, For the years ended December 31, The following tables summarize the trading revenues for the years ended December 31,
F-75
F-76
Certain financial instruments and derivative instruments are eligible for offset in the statements of financial condition under GAAP. The Trust’s open trade equity/(deficit), options written, and receivables from futures commission merchants (each, an “FCM”) are subject to master netting arrangements and collateral arrangements and meet the GAAP guidance to qualify for offset. A master netting arrangement with a counterparty creates a right of offset for amounts due to and from that same counterparty that is enforceable in the event of a default or bankruptcy. The Trust’s policy is to recognize amounts subject to master netting arrangements on a net basis on the consolidated statements of financial condition. F-77 The following tables present gross and net information about the Trust’s assets and liabilities subject the master netting arrangements as disclosed on the consolidated statements of financial condition as of December 31,
The purchase and sale of futures and options on futures contracts require margin deposits with FCMs. Additional deposits may be necessary for any loss on contract value. The Commodity Exchange Act requires an FCM to segregate all customer transactions and assets from the FCM’s proprietary activities. A customer’s cash and other property (for example, U.S. treasury bills) deposited with an FCM are considered commingled with all other customer funds subject to the FCM’s segregation requirements. In the event of an FCM’s insolvency, recovery may be limited to a pro rata share of segregated funds available. It is possible that the recovered amount could be less than the total of cash and other property deposited. The term “off-balance sheet risk” refers to an unrecorded potential liability that, even though it does not appear on the statements of financial condition, may result in future obligation or loss in excess of the amount paid by the Series for a particular investment. Each Trading Company and Galaxy Plus entity expects to trade in futures, options, forward and swap contracts and will therefore be a party to financial instruments with elements of off-balance sheet market and credit risk. In entering into these contracts, there exists a market risk that such contracts may be significantly influenced by market conditions, such as interest rate volatility, resulting in such contracts being less valuable. If the markets should move against all of the futures positions held by a Trading Company or Galaxy Plus entity in respect of any Series at the same time, and if the Trading Advisor(s) of such Trading Company or Galaxy Plus entity are unable to offset such futures interests positions, such Trading Company or Galaxy Plus entity could lose all of its assets and the holders of Units of such Series would realize a 100% loss. The Managing Owner will seek to minimize market risk through real-time monitoring of open positions and the level of diversification of each Trading Advisor’s portfolio. It is anticipated that any Trading Advisor’s margin-to-equity ratio will typically not exceed approximately 35% although the actual ratio could be higher or lower from time to time. F-78 In addition to market risk, trading futures, forward and swap contracts entails credit risk that a counterparty will not be able to meet its obligations to a Trading contrast to U.S. exchanges, are principals’ markets in which performance is the responsibility only of the individual counterparty with whom the Trading Company has entered into the transaction, and not of the exchange or clearing corporation. In these kinds of markets, there is risk of bankruptcy or other failure or refusal to perform by the counterparty. In the case of forward contracts traded on the interbank market and swaps, neither is traded on exchanges. The counterparty is generally a single bank or other financial institution, rather than a group of financial institutions; thus there may be a greater counterparty credit risk. The Managing Owner expects the Trading Advisors to trade only with those counterparties which it believes to be creditworthy. All positions of each Trading Company will be valued each day on a mark-to-market basis. There can be no assurance that any clearing member, clearinghouse or other counterparty will be able to meet its obligations to any Trading Company. The Managing Owner has established procedures to actively monitor and minimize market and credit risks. The Limited Owners bear the risk of loss only to the extent of the market value of their respective investments and, in certain specific circumstances, distributions and redemptions received.
The Trust has entered into agreements, which provide for the indemnification of futures clearing brokers, and commodity trading advisers, among others, against losses, costs, claims and liabilities arising from the performance of their individual obligations under such agreements, except for gross negligence or bad faith. The Trust has had no prior claims or payments pursuant to these agreements. The Trust’s individual maximum exposure under these arrangements is unknown, as this would involve future claims that may be made against the Trust that have not yet occurred. However, based on experience the Trust expects the risk of loss to be remote. Maximum exposure is unfulfilled obligations of the Trust up to the amount of equity at risk with The Trust has guaranteed the obligations of the trading companies under the customer agreements with UBS Securities LLC as Clearing Broker. In the event that one Series of the Trust is unable to meet its obligations to UBS Securities LLC, the assets of the other Series will be available to UBS Securities LLC as part of the guarantee, but only to the extent of such Series’ pro rata allocation to the trading company. The Trust has not recorded any liability for the indemnifications in the accompanying financial statements as it expects any possibility of losses to be remote.
On The Transaction was consummated on In connection with the foregoing, the Trust Agreement was amended to effect certain changes to replace Equinox as the Managing Owner and to reflect the New Managing Owner as the new managing owner. Also, the New Managing Owner has temporarily suspended the sale of Units (as defined in the The New Managing Owner is seeking to cause the suspension to be Any forward-looking statements herein are based on expectations of the New Managing Owner at this time. Whether or not actual results and developments will conform to the New Managing Owner’s expectations and predictions, however, is subject to a number of risks and uncertainties, including the special considerations discussed in the F-79 Report of Independent Registered Public Accounting Firm To the Executive Committee and Equinox Frontier Funds, as We have audited the accompanying statements of financial condition, including the condensed schedules of investments, of the Frontier Trading Company I, LLC, Frontier Trading Company II, LLC, Frontier Trading Company We conducted our audits in accordance with the standards of the Public Company Accounting Oversight Board (United States). Those standards require that we plan and perform the In our opinion, the financial statements referred to above present fairly, in all material respects, the financial position of the Frontier Trading Company I, LLC, Frontier Trading Company II, LLC, Frontier Trading Company As discussed in Note 9 to the financial statements, on March 6, 2017 a unit purchase agreement between Frontier Fund Management LLC (New Managing Owner) and Equinox Fund Management (Equinox) was consummated whereby Equinox’s general units were transferred to the New Managing Owner. Upon consummation, the New Managing Owner became the managing owner of the Trust and each Series, in replacement of Equinox. /s/ Denver, Colorado March 31, F-80
Receivable from futures commission merchants Open trade equity, at fair value Swap contracts, at fair value Interest receivable Total Assets LIABILITIES Payable to futures commission merchants Interest payable Options written, at fair value Open trade deficit, at fair value Total Liabilities MEMBERS’ EQUITY (Net Asset Value) Total Liabilities and Members’ Equity Receivable from futures commission merchants Open trade equity, at fair value Swap contracts, at fair value Interest receivable Total Assets LIABILITIES Payable to futures commission merchants Interest payable Options written, at fair value Open trade deficit, at fair value Total Liabilities MEMBERS’ EQUITY (Net Asset Value) Total Liabilities and Members’ Equity Receivable from futures commission merchants Open trade equity, at fair value Swap contracts, at fair value Interest receivable Total Assets LIABILITIES Payable to futures commission merchants Interest payable Other liabilities Open trade deficit, at fair value Total Liabilities MEMBERS’ EQUITY (Net Asset Value) Total Liabilities and Members’ Equity
The accompanying notes are an integral part of these financial statements. F-81
Description Heat Oil Settling 5/28/2015 (number of contracts:-372) Brent Crude Oil Last Day Settling 2/12/2015 (number of contracts:-229) Brent Crude Settling 7/1/2015 (number of contracts: -74) NYH RBOB Unleaded Gas Settling 12/30/2015 (number of contracts:-388) NYH RBOB Unleaded Gas Settling 7/30/2015 (number of contracts:-130) Gas Oil Settling 3/31/2015 (number of contracts: -54) Brent Crude Settling 2/1/2015 (number of contracts: -77) Crude Oil Settling 2/1/2015 (number of contracts: -54) Various interest rates futures contracts (Canada) Various interest rates futures contracts (Europe) Various interest rates futures contracts (Far East) Various interest rates futures contracts (Oceanic) Various interest rates futures contracts (U.S.) Various precious metal futures contracts (Far East) Various precious metal futures contracts (U.S.) Various soft futures contracts (Canada) Various soft futures contracts (Europe) Various soft futures contracts (Far East) Various soft futures contracts (U.S.) Coffee Settling 5/29/2015 (number of contracts:-370) Various stock index futures contracts (Africa) Various stock index futures contracts (Europe) Various stock index futures contracts (Far East) Various stock index futures contracts (Mexico) Various stock index futures contracts (Oceanic) Various stock index futures contracts (U.S.) Total Short Futures Contracts CURRENCY FORWARDS * Various currency forwards contracts (NA) Total Currency Forwards Total Open Trade Equity (Deficit) Description OPTIONS PURCHASED * Various energy futures contracts (U.S.) Crude Oil Settling 1/16/2015 (number of contracts: 1438) Crude Oil Settling 5/18/2015 (number of contracts: 1044) Crude Oil Settling 6/19/2015 (number of contracts: 2034) Crude Oil Settling 3/19/2015 (number of contracts: 1044) Crude Oil Settling 2/19/2015 (number of contracts: 1438) Crude Oil Settling 9/21/2015 (number of contracts: 2034) Crude Oil Settling 10/19/2015 (number of contracts: 2034) Crude Oil Settling 11/19/2015 (number of contracts: 2034) Crude Oil Settling 8/19/2015 (number of contracts: 2034) Crude Oil Settling 4/20/2015 (number of contracts: 1044) Crude Oil Settling 7/20/2015 (number of contracts: 2034) Various soft futures contracts (U.S.) Various stock index futures contracts (U.S.) Total Options Purchased OPTIONS WRITTEN * Various energy futures contracts (U.S.) Various soft futures contracts (U.S.) Various stock index futures contracts (U.S.) Total Options Written SWAPS (1) Frontier XXXIV Balanced select swap (U.S.) Frontier Brevan Howard swap (U.S.) Frontier XXXV Diversified select swap (U.S.) Frontier XXXVII L/S select swap (U.S.) Total Swaps
Description Various interest rates futures contracts (Europe) Various interest rates futures contracts (Far East) Various interest rates futures contracts (Oceanic) Various interest rates futures contracts (U.S.) Various precious metal futures contracts (Far East) Various precious metal futures contracts (U.S.) Various soft futures contracts (Canada) Various soft futures contracts (Europe) Various soft futures contracts (Far East) Various soft futures contracts (U.S.) Various stock index futures contracts (Africa) Various stock index futures contracts (Europe) Various stock index futures contracts (Far East) Various stock index futures contracts (Mexico) Various stock index futures contracts (Oceanic) Various stock index futures contracts (U.S.) Total Short Futures Contracts CURRENCY FORWARDS * Various currency forwards contracts (NA) Total Currency Forwards Total Open Trade Equity (Deficit) OPTIONS PURCHASED * Various energy futures contracts (U.S.) Various soft futures contracts (U.S.) Various stock index futures contracts (U.S.) Total Options Purchased OPTIONS WRITTEN * Various energy futures contracts (U.S.) Various soft futures contracts (U.S.) Various stock index futures contracts (U.S.) Total Options Written SWAPS (3) Frontier XXXIV Balanced select swap (U.S.) Frontier Brevan Howard swap (U.S.) Frontier XXXV Diversified select swap (U.S.) Frontier XXXVII L/S select swap (U.S.) Total Swaps
Description Various interest rates futures contracts (Far East) Various interest rates futures contracts (Oceanic) Various interest rates futures contracts (U.S.) Various precious metal futures contracts (Far East) Various precious metal futures contracts (U.S.) Various soft futures contracts (Canada) Various soft futures contracts (Europe) Various soft futures contracts (Far East) Various soft futures contracts (U.S.) Various stock index futures contracts (Africa) Various stock index futures contracts (Europe) Various stock index futures contracts (Far East) Various stock index futures contracts (Mexico) Various stock index futures contracts (Oceanic) Various stock index futures contracts (U.S.) Total Short Futures Contracts CURRENCY FORWARDS * Various currency forwards contracts (NA) Total Currency Forwards Total Open Trade Equity (Deficit) OPTIONS PURCHASED * Various energy futures contracts (U.S.) Various soft futures contracts (U.S.) Various stock index futures contracts (U.S.) Total Options Purchased OPTIONS WRITTEN * Various energy futures contracts (U.S.) Various soft futures contracts (U.S.) Various stock index futures contracts (U.S.) Total Options Written SWAPS (1) Frontier XXXIV Balanced select swap (U.S.) Frontier Brevan Howard swap (U.S.) Frontier XXXV Diversified select swap (U.S.) Frontier XXXVII L/S select swap (U.S.) Total Swaps
Description Various base metals futures contracts (U.S.) Various currency futures contracts (Far East) Various currency futures contracts (U.S.) Various energy futures contracts (Europe) Various energy futures contracts (U.S.) NYH RBOB Unleaded Gas settling 2/1/2014 (number of contracts: -509) Natural Gas settling 10/1/2014 (number of contracts: -636) Various interest rates futures contracts (Canada) Various interest rates futures contracts (Europe) Various interest rates futures contracts (Far East) Various interest rates futures contracts (Oceanic) Various interest rates futures contracts (U.S.) Various precious metal futures contracts (U.S.) Various soft futures contracts (Canada) Various soft futures contracts (Europe) Various soft futures contracts (U.S.) Cocoa settling 3/1/2014 (number of contracts: -616) Corn settling 5/1/2014 (number of contracts: -383) Sugar #11 settling 5/1/2014 (number of contracts: -861) Wheat settling 7/1/2014 (number of contracts: -439) Various stock index futures contracts (Europe) Various stock index futures contracts (Far East) Various stock index futures contracts (U.S.) Total Short Futures Contracts CURRENCY FORWARDS * Various currency forwards contracts (NA) Total Currency Forwards Total Open Trade Equity (Deficit) OPTIONS PURCHASED * Various base metals futures contracts (Europe) Various currency futures contracts (U.S.) Various energy futures contracts (U.S.) Various interest rates futures contracts (U.S.) Various soft futures contracts (U.S.) Various stock index futures contracts (U.S.) Total Options Purchased OPTIONS WRITTEN * Various base metals futures contracts (Europe) Various currency futures contracts (U.S.) Various energy futures contracts (U.S.) Various interest rates futures contracts (U.S.) Various soft futures contracts (U.S.) Various stock index futures contracts (U.S.) Total Options Written Description Swaps (1) Total Swaps
The accompanying notes are an integral part of these consolidated financial statements. F-82 The Trading Companies of the Equinox Frontier Funds Condensed December 31,
The accompanying notes are an integral part of these consolidated financial statements. F-83
The accompanying notes are an integral part of these consolidated financial statements. F-84
The accompanying notes are an integral part of these consolidated financial statements. F-85
The accompanying notes are an integral part of these consolidated financial statements. F-86
The accompanying notes are an integral part of these financial statements. F-87
Cash Flows from Operating Activities Net increase (decrease) in members’ equity resulting from operations Adjustments to reconcile net increase (decrease) in members’ equity resulting from operations to net cash provided by (used in) operating activities: Decrease (increase) in receivable from futures commission merchants Decrease (increase) in open trade equity, at fair value Decrease (increase) in options purchased, at fair value Decrease (increase) in written options, at fair value Net realized (gain) loss on swap contracts (Purchases) of swap contracts Sales of swap contracts Net unrealized (gain) loss on swap contracts Decrease (increase) in interest receivable (Decrease) increase in interest payable Net cash provided by (used in) operating activities Cash Flows from Financing Activities Capital Contributed Capital Distributed Net cash provided by (used in) financing activities Net change in cash and cash equivalents Cash and cash equivalents, beginning of period Cash and cash equivalents, end of period Cash Flows from Operating Activities Net increase (decrease) in members’ equity resulting from operations Adjustments to reconcile net increase (decrease) in members’ equity resulting from operations to net cash provided by (used in) operating activities: Decrease (increase) in receivable from futures commission merchants Decrease (increase) in open trade equity, at fair value Decrease (increase) in options purchased, at fair value Decrease (increase) in written options, at fair value Net realized (gain) loss on swap contracts (Purchases) of swap contracts Sales of swap contracts Net unrealized (gain) loss on swap contracts Decrease (increase) in interest receivable (Decrease) increase in interest payable Net cash provided by (used in) operating activities Cash Flows from Financing Activities Capital Contributed Capital Distributed Net cash provided by (used in) financing activities Net change in cash and cash equivalents Cash and cash equivalents, beginning of period Cash and cash equivalents, end of period Cash Flows from Operating Activities Net increase (decrease) in members’ equity resulting from operations Adjustments to reconcile net increase (decrease) in members’ equity resulting from operations to net cash provided by (used in) operating activities: Decrease (increase) in receivable from futures commission merchants Decrease (increase) in open trade equity, at fair value Decrease (increase) in written options, at fair value Net realized (gain) loss on swap contracts (Purchases) of swap contracts Sales of swap contracts Net unrealized (gain) loss on swap contracts Decrease (increase) in interest receivable (Decrease) increase in interest payable Net cash provided by (used in) operating activities Cash Flows from Financing Activities Capital Contributed Capital Distributed Net cash provided by (used in) financing activities Net change in cash and cash equivalents Cash and cash equivalents, beginning of period Cash and cash equivalents, end of period Cash Flows from Operating Activities Net increase (decrease) in members’ equity resulting from operations Adjustments to reconcile net increase (decrease) in members’ equity resulting from operations to net cash provided by (used in) operating activities: Decrease (increase) in receivable from futures commission merchants Decrease (increase) in open trade equity, at fair value Decrease (increase) in written options, at fair value Net realized (gain) loss on swap contracts (Purchases) of swap contracts Sales of swap contracts Net unrealized (gain) loss on swap contracts Decrease (increase) in interest receivable (Decrease) increase in interest payable Net cash provided by (used in) operating activities Cash Flows from Financing Activities Capital Contributed Capital Distributed Net cash provided by (used in) financing activities Net change in cash and cash equivalents Cash and cash equivalents, beginning of period Cash and cash equivalents, end of period Cash Flows from Operating Activities Net increase (decrease) in members’ equity resulting from operations Adjustments to reconcile net increase (decrease) in members’ equity resulting from operations to net cash provided by (used in) operating activities: Decrease (increase) in receivable from futures commission merchants Decrease (increase) in open trade equity, at fair value Decrease (increase) in written options, at fair value Net realized (gain) loss on swap contracts (Purchases) of swap contracts Sales of swap contracts Net unrealized (gain) loss on swap contracts Decrease (increase) in interest receivable (Decrease) increase in interest payable Net cash provided by (used in) operating activities Cash Flows from Financing Activities Capital Contributed Capital Distributed Net cash provided by (used in) financing activities Net change in cash and cash equivalents Cash and cash equivalents, beginning of period Cash and cash equivalents, end of period
| ||||||||||||||||||||||||||||||||||||||||||||||||||||||||||||||||||||||||||||||||||||||||||||||||||||||||||||||||||||||||||||||||||||||||||||||||||||||||||||||||||||||||||||||||||||||||||||||||||||||||||||||||||||||||||||||||||||||||||||||||||||||||||||||||||||||||||||||||||||||||||||||||||||||||||||||||||||||||||||||||||||||||||||||||||||||||||||||||||||||||||||||||||||||||||||||||||||||||||||||||||||||||||||||||||||||||||||||||||||||||||||||||||||||||||||||||||||||||||||||||||||||||||||||||||||||||||||||||||||||||||||||||||||||||||||||||||||||||||||||||||||||||||||||||||||||||||||||||||||||||||||||||||||||||||||||||||||||||||||||||||||||||||||||||||||||||||||||||||||||||||||||||||||||||||||||||||||||||||||||||||||||||||||||||||||||||||||||||||||||||||||||||||||||||||||||||||||||||||||||||||||||||||||||||||||||||||||||||||||||||||||||||||||||||||||||||||||||||||||||||||||||||||||||||||||||||||||||||||||||||||||||||||||||||||||||||||||||||||||||||||||||||||||||||||||||||||||||||||||||
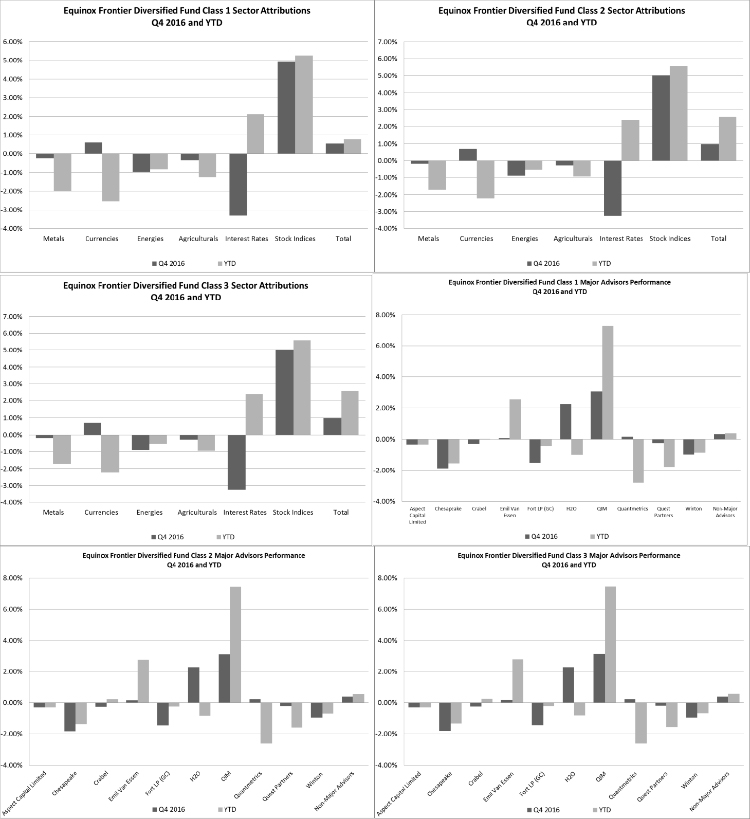
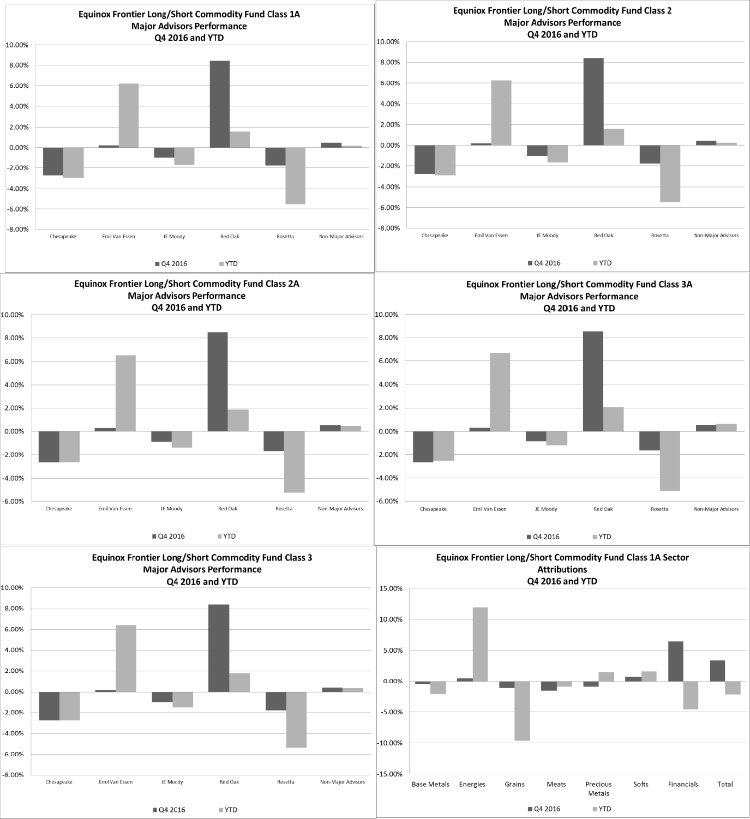
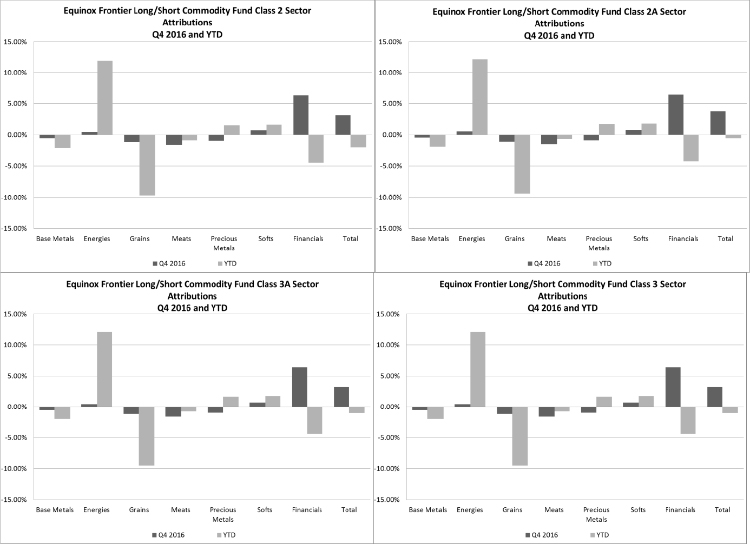
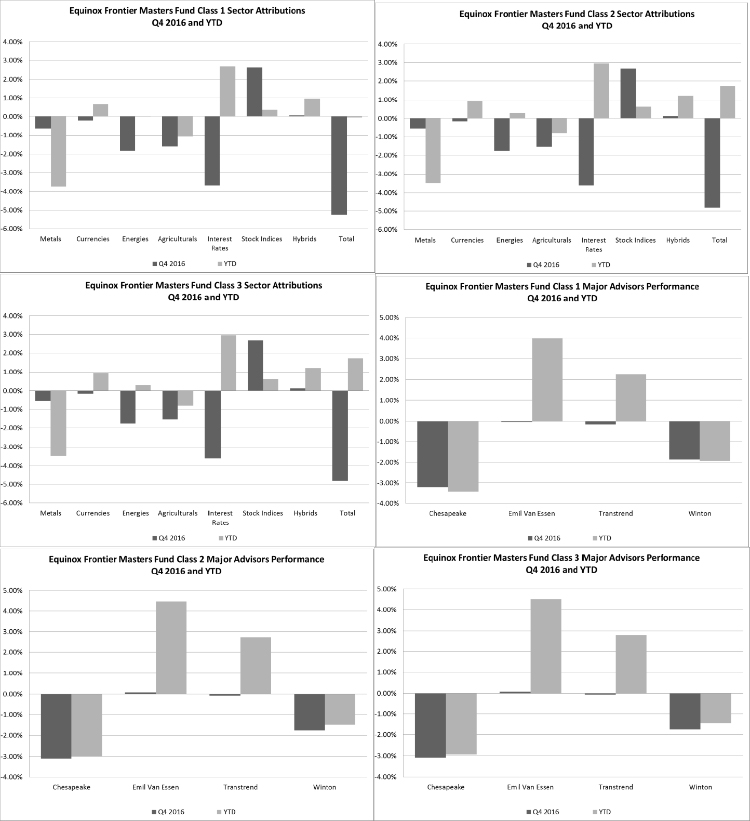
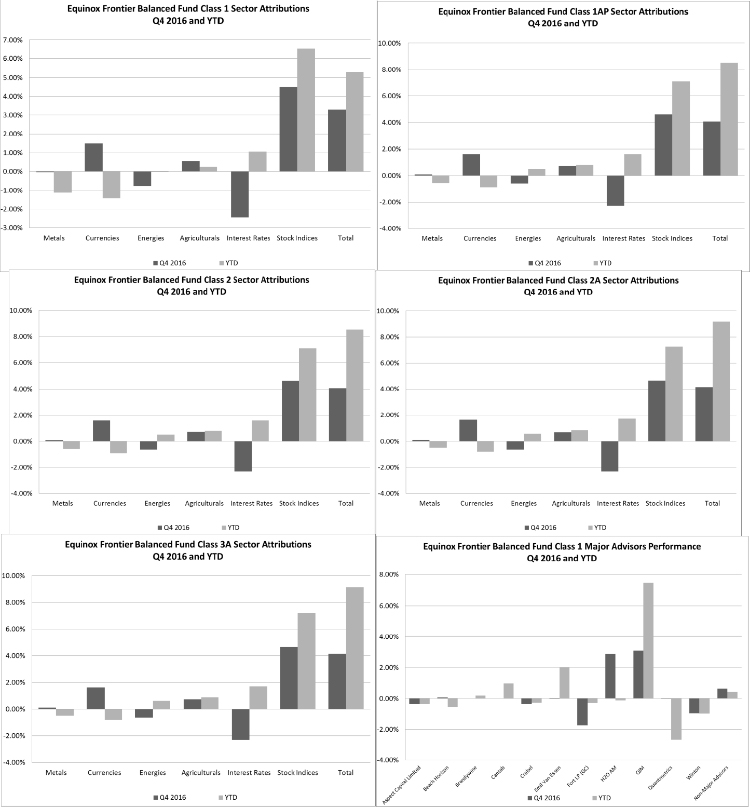
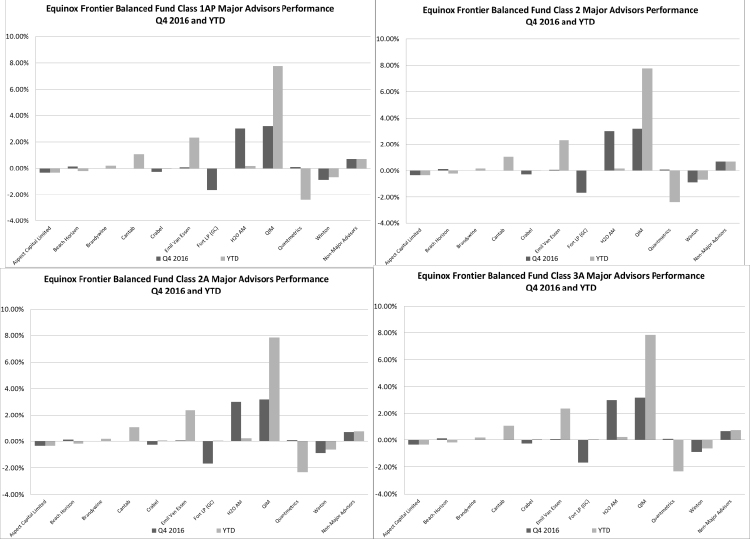
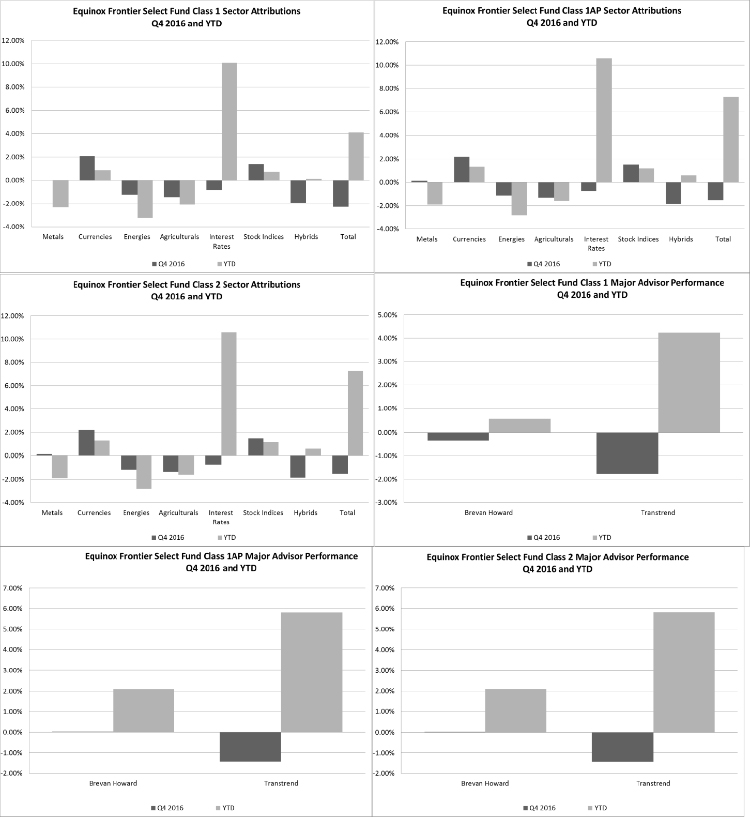
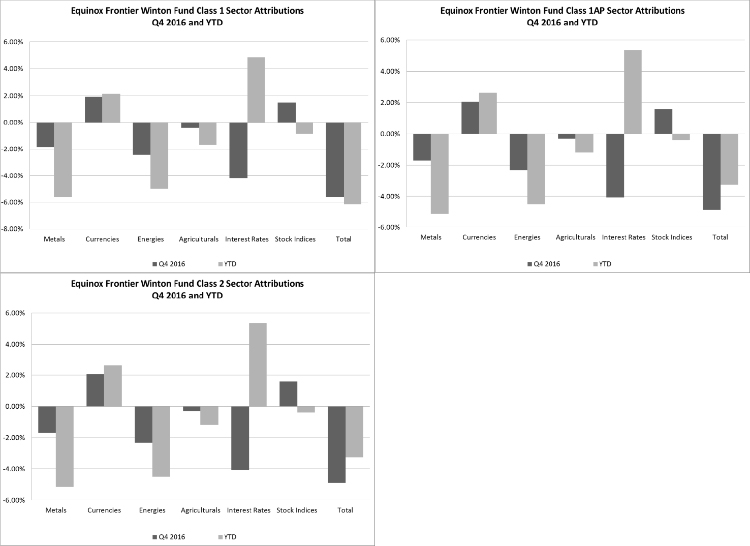
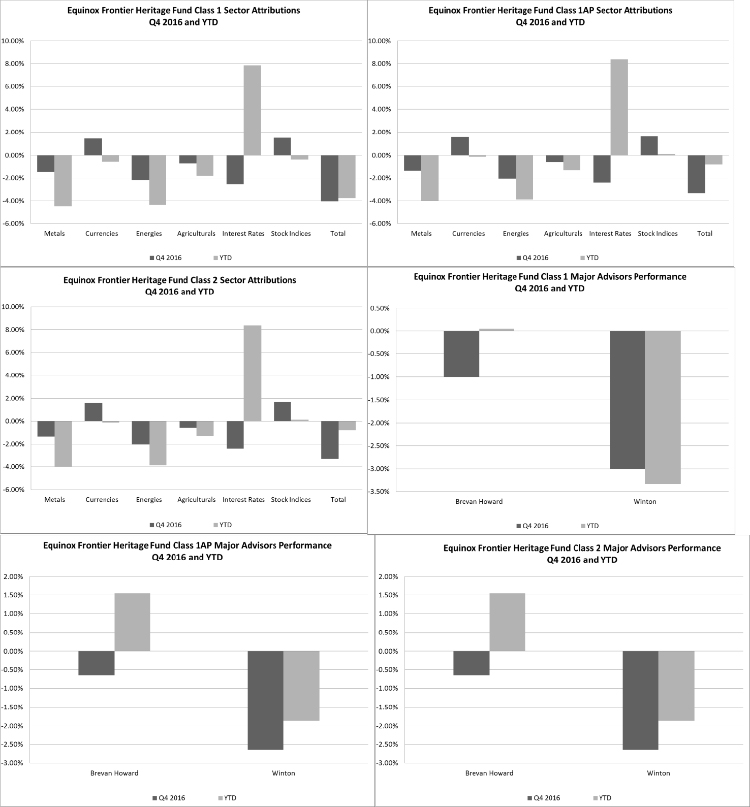
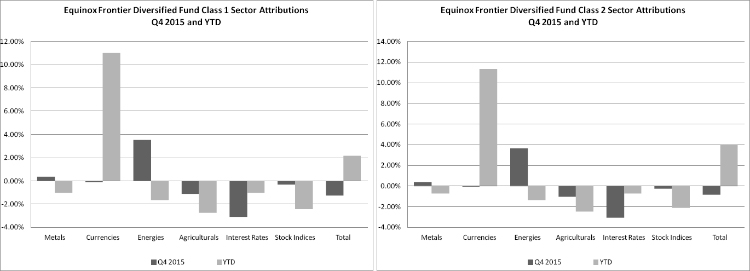
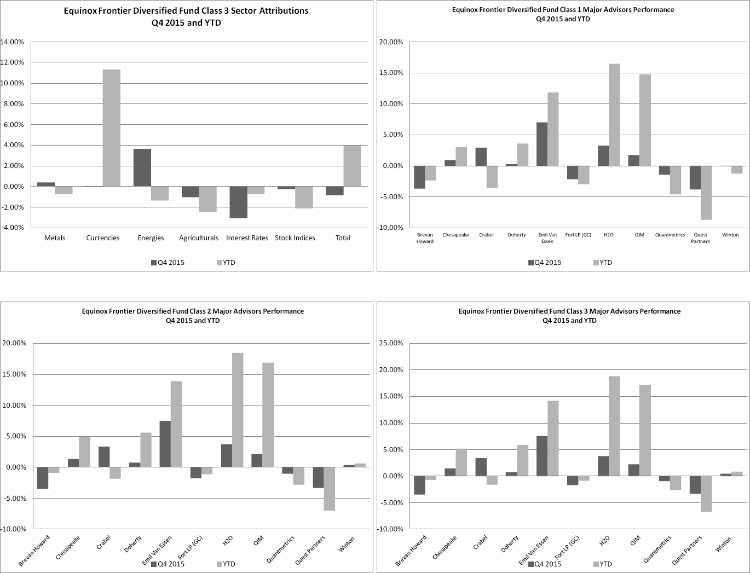
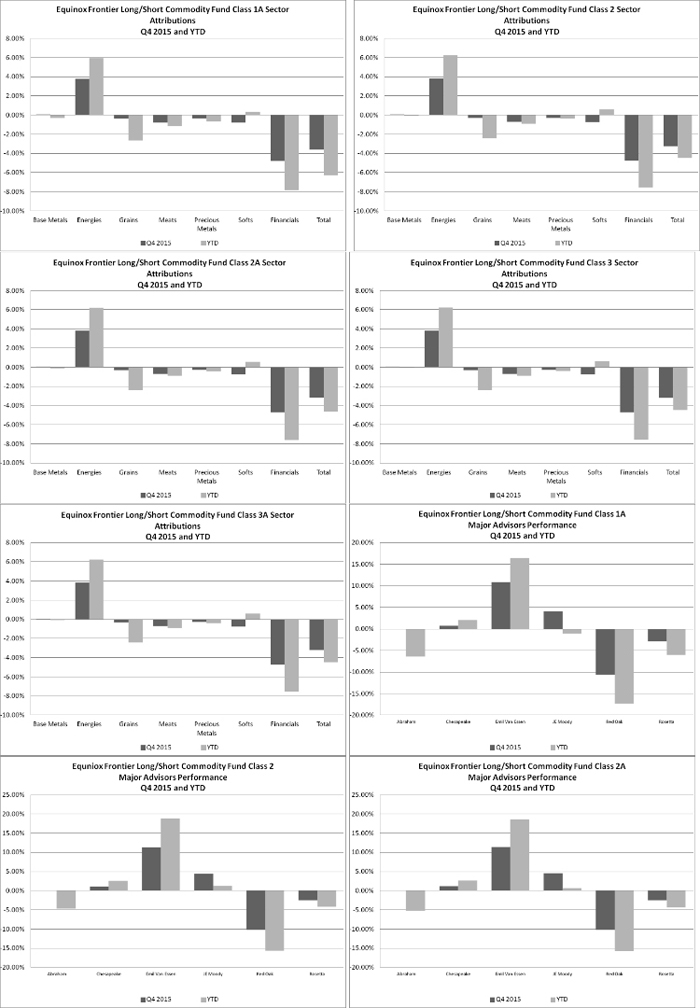

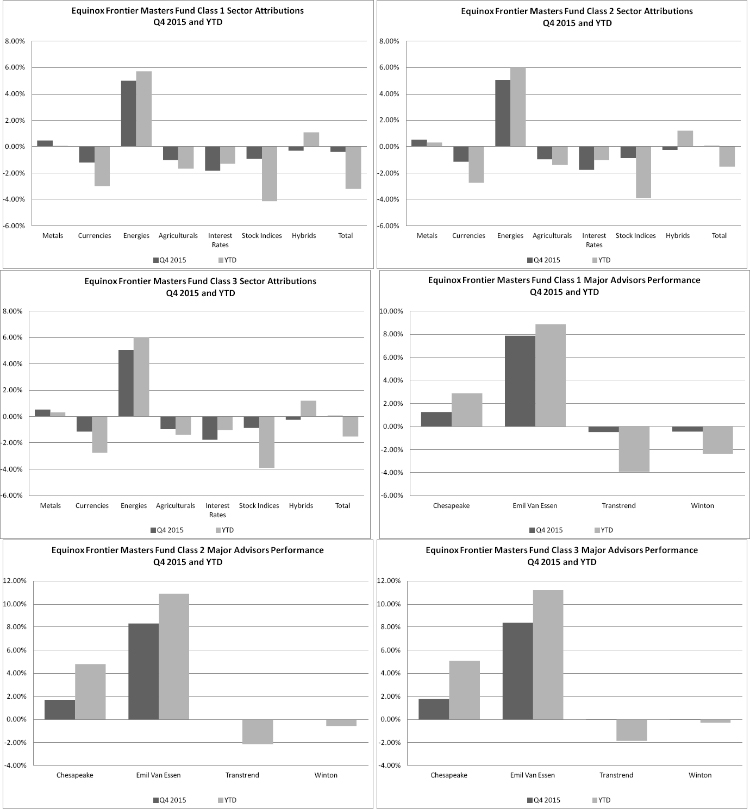
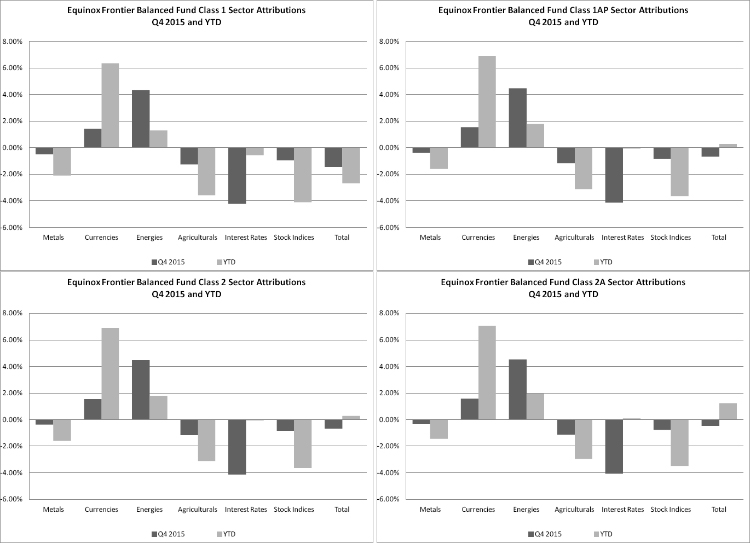
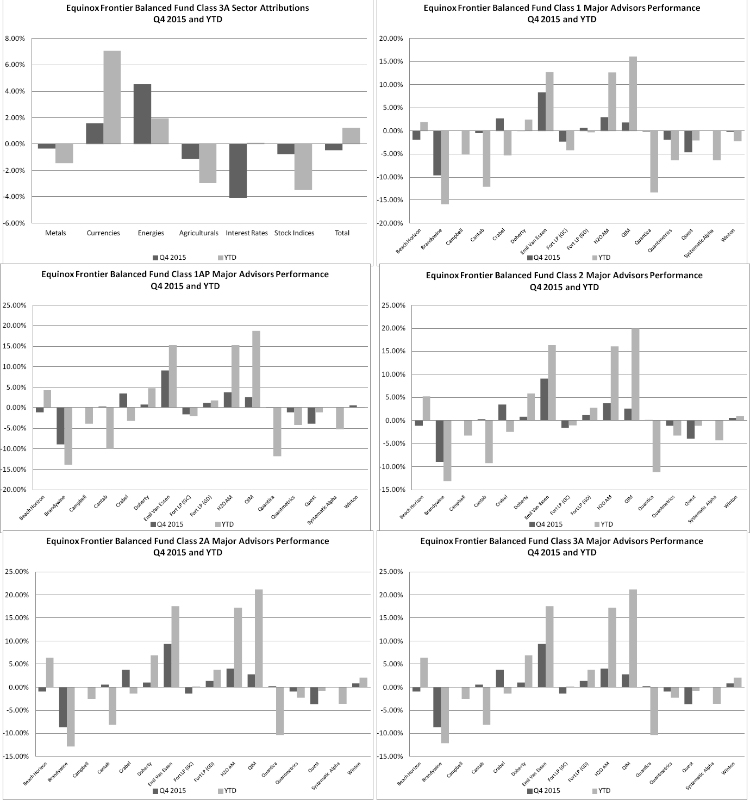
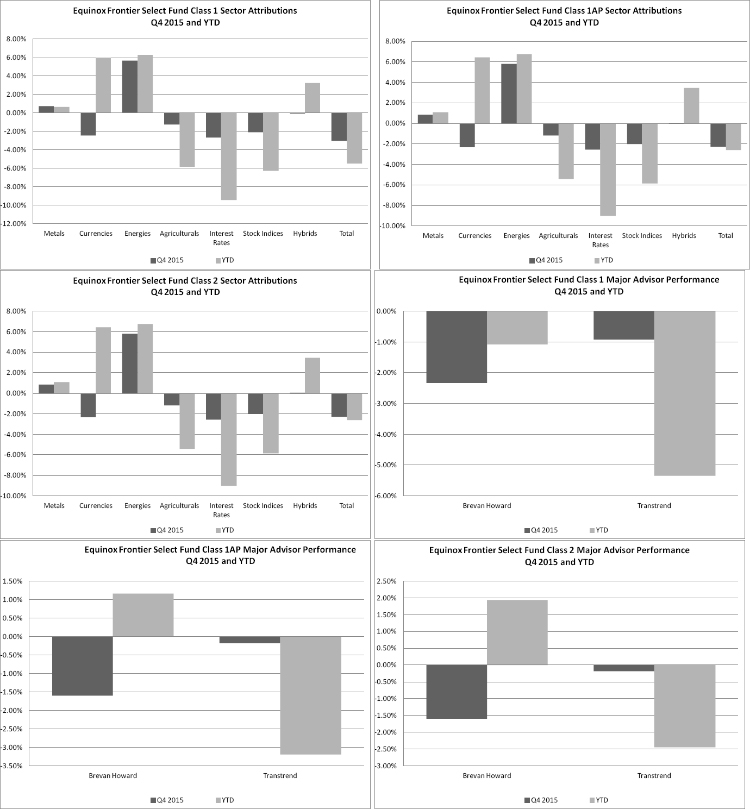
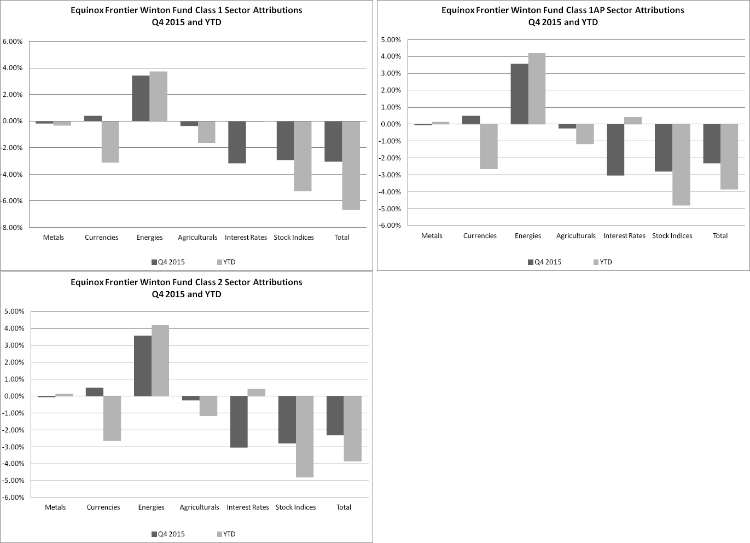
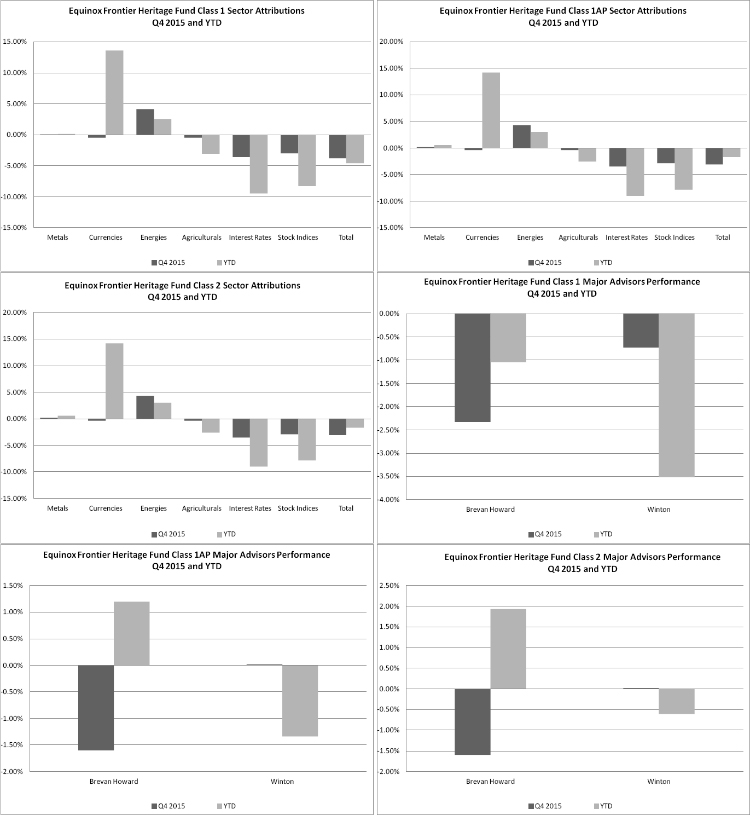
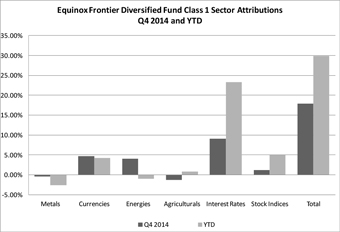
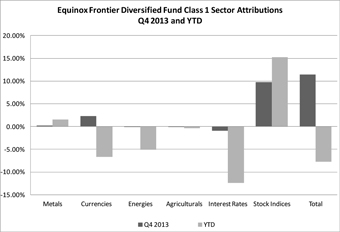
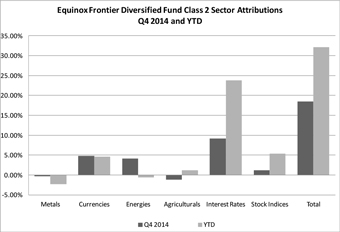
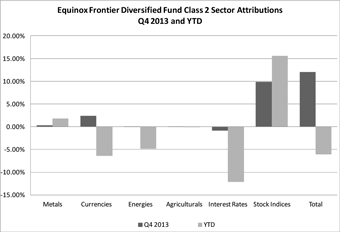
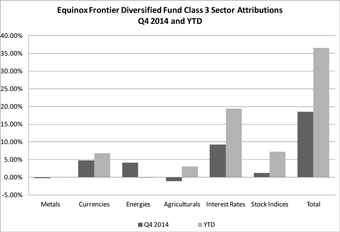
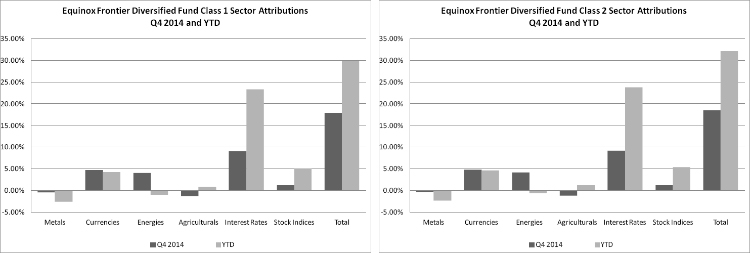
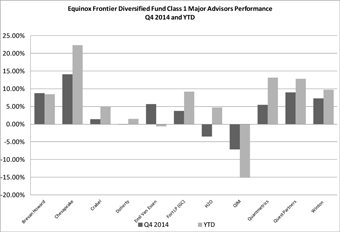


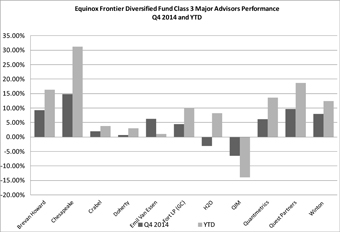
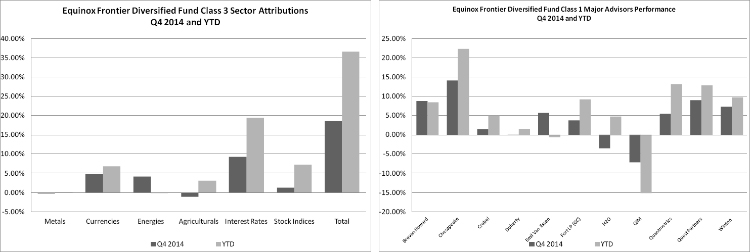


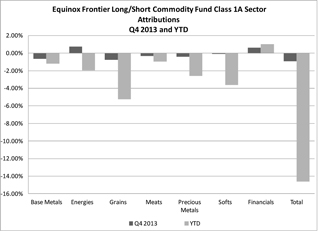
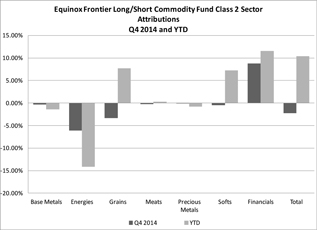
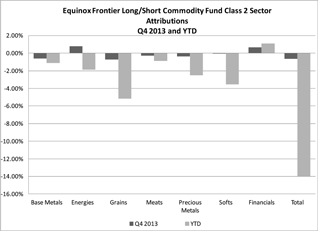
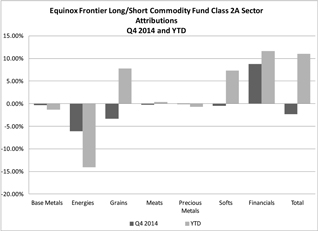

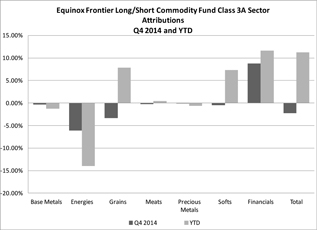

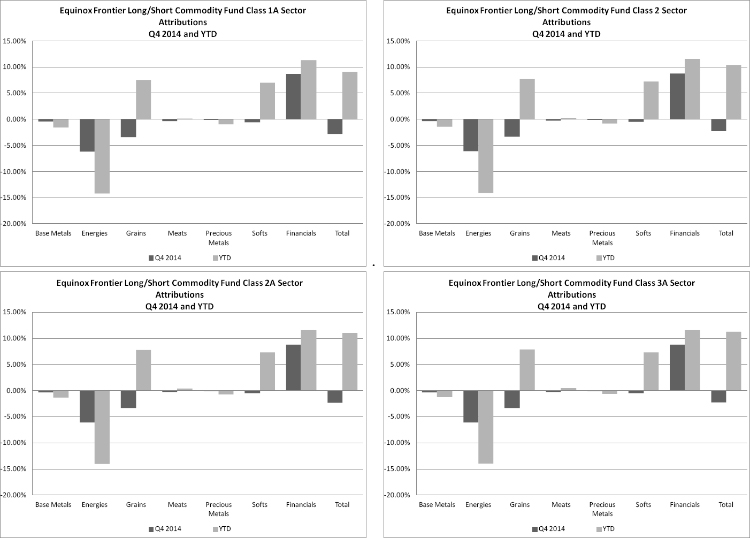
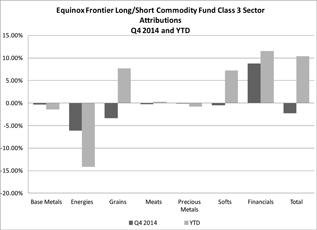
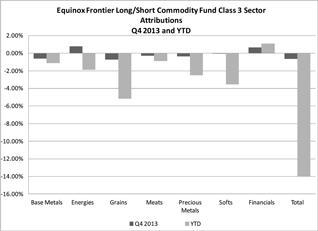
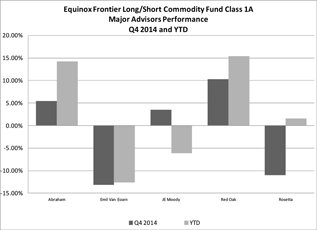
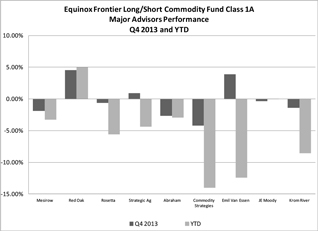
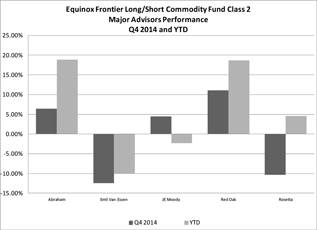


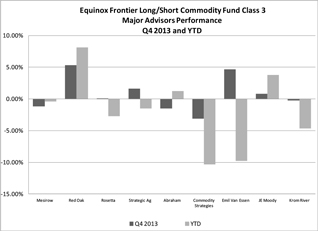


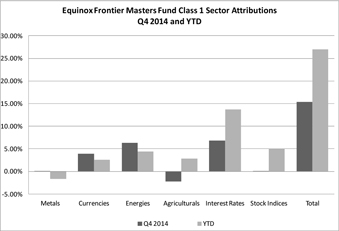
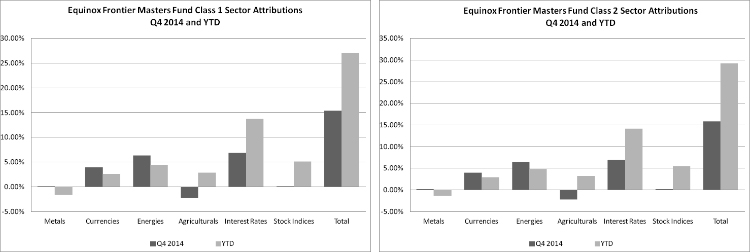
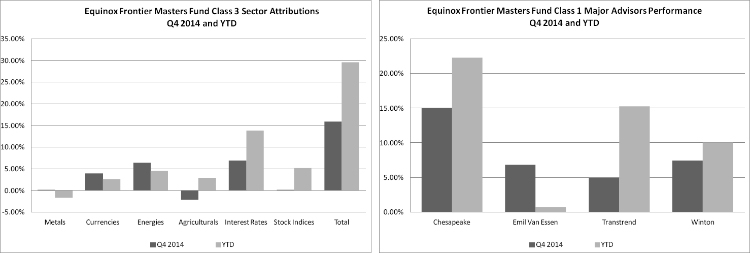
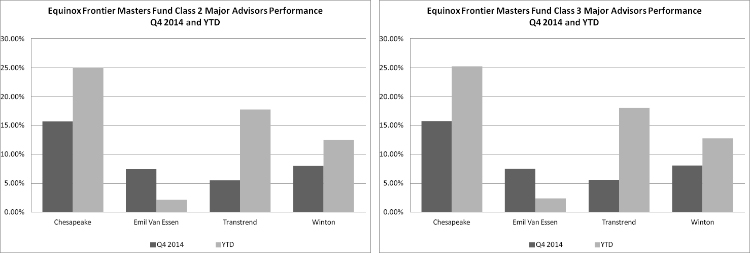

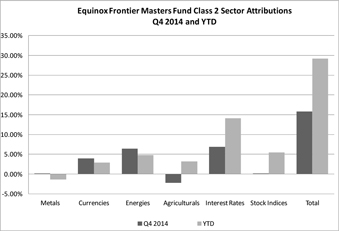


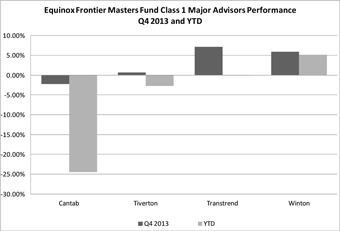
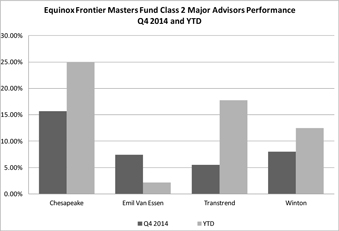


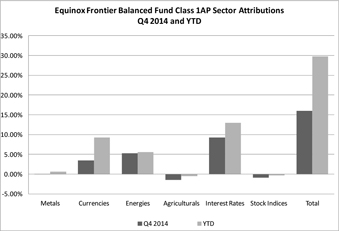
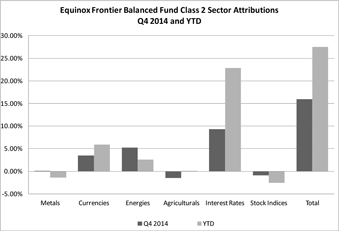
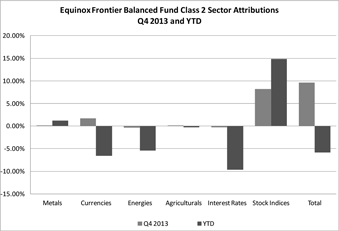


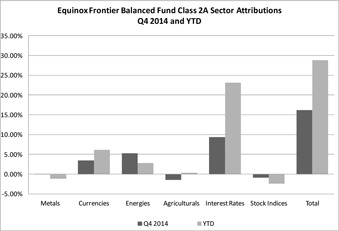
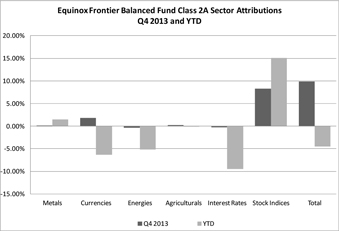
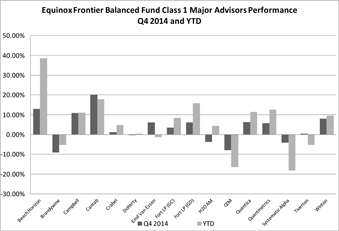
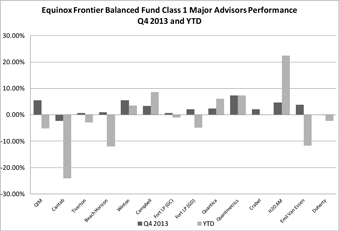
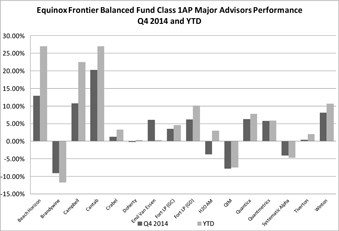
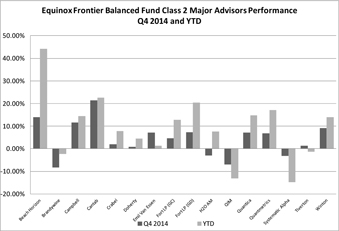
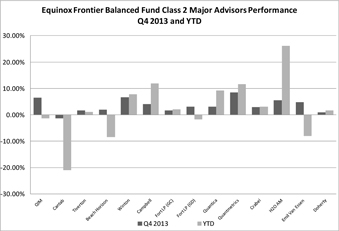


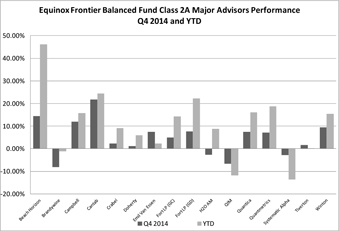


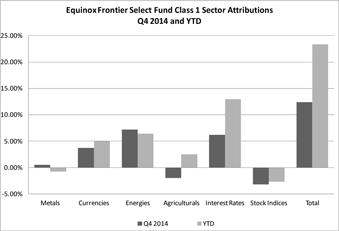

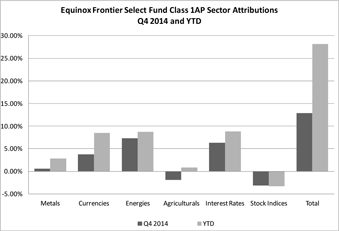


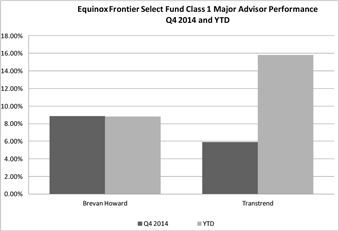
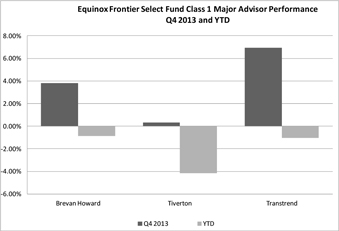

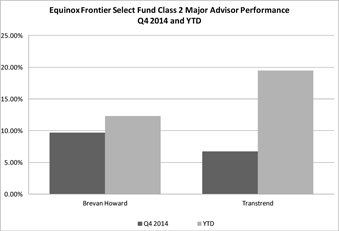

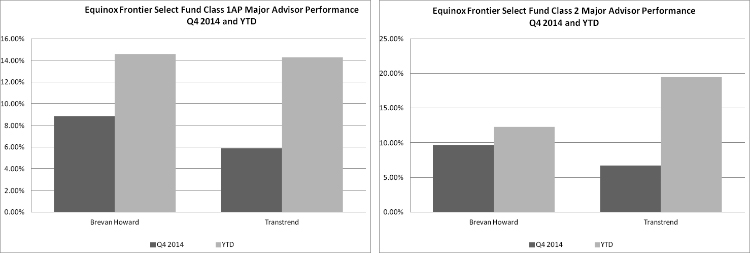
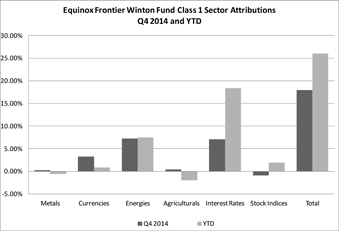

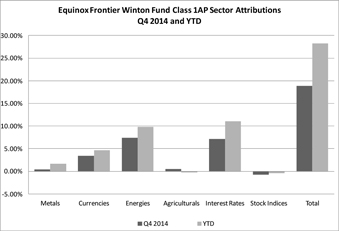
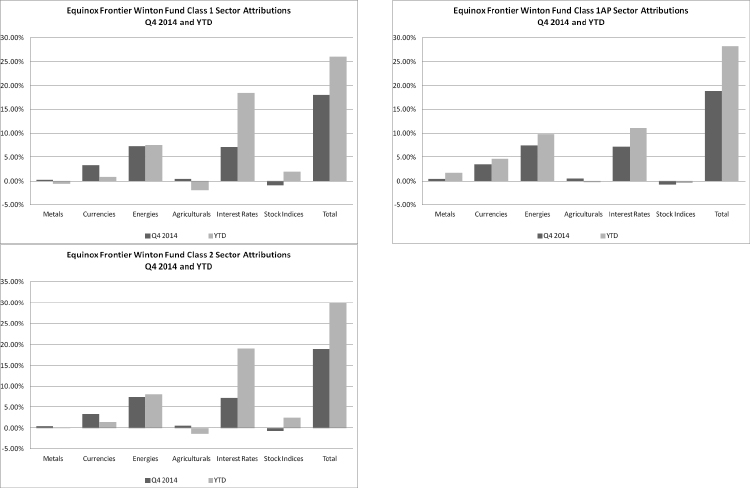
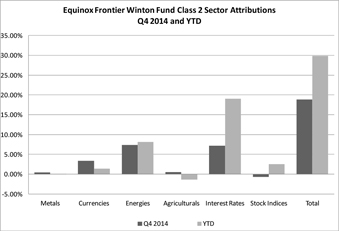
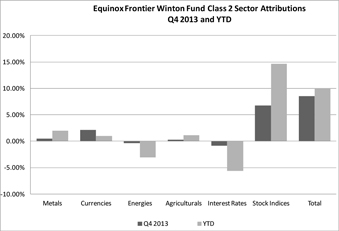
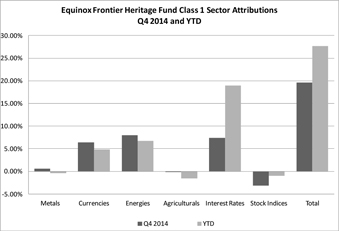


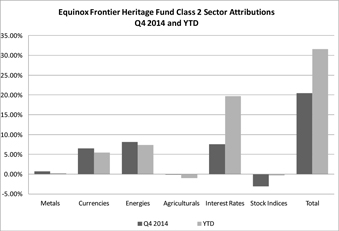
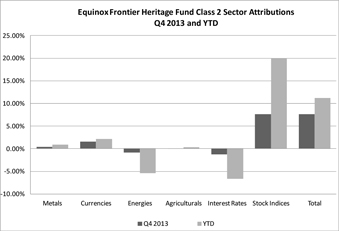
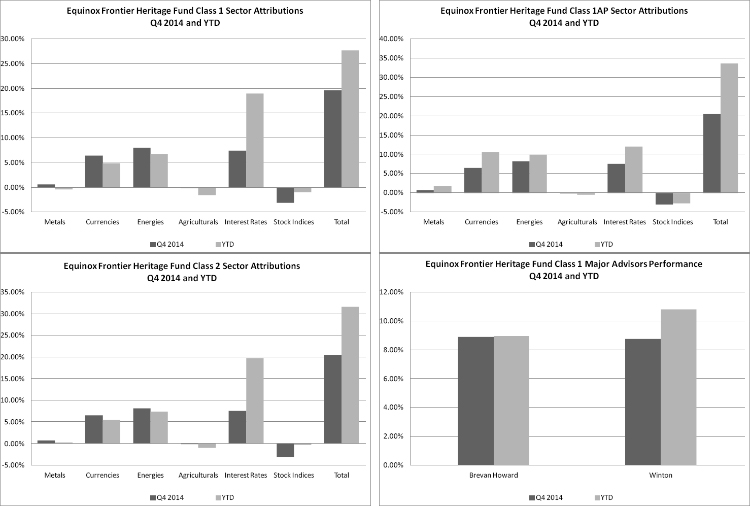
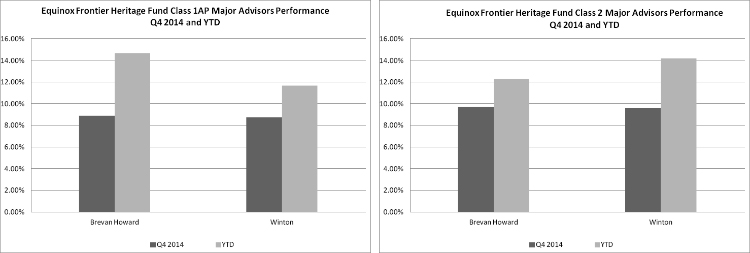
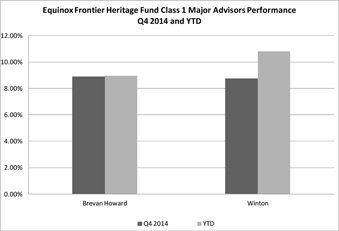
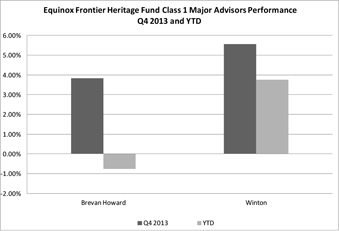
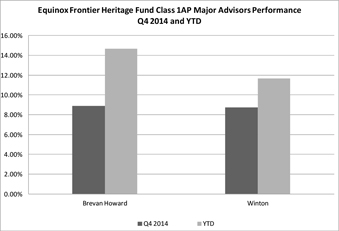
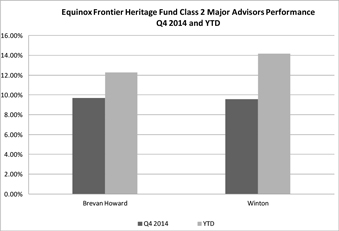


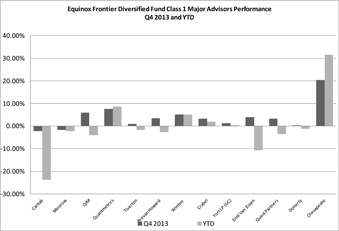
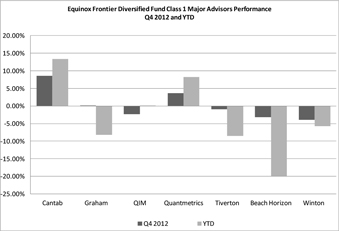
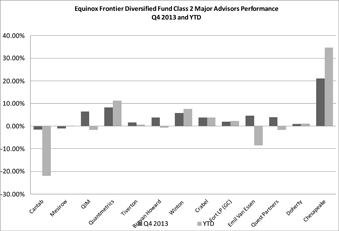
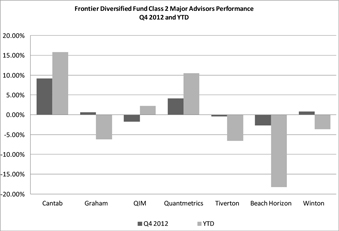
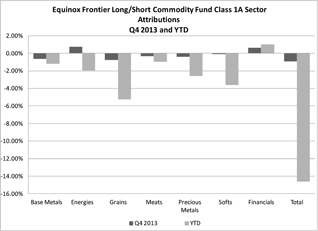
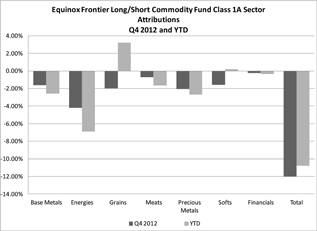
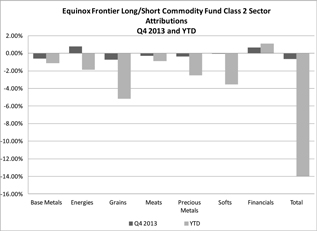

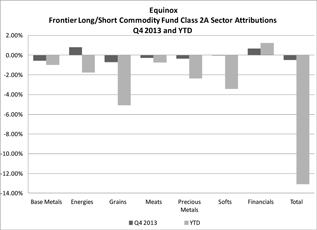

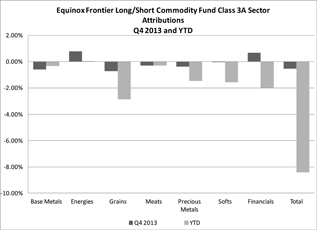


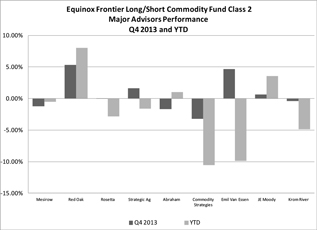

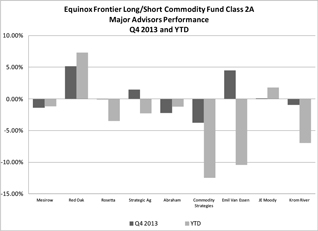

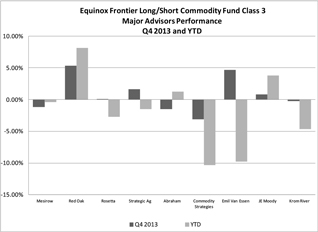

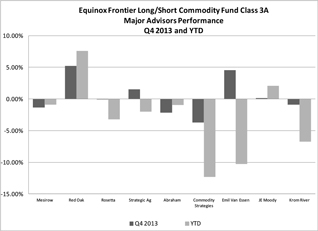
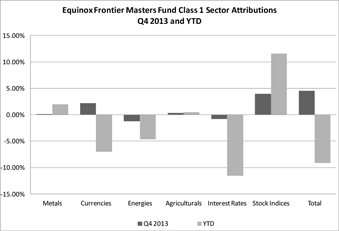

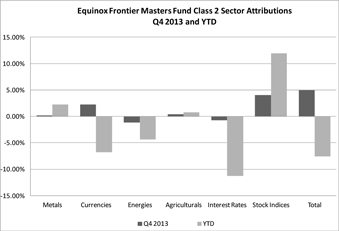
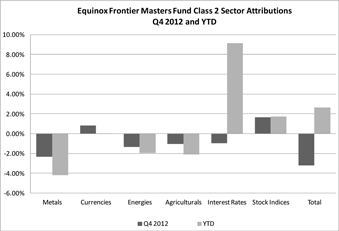

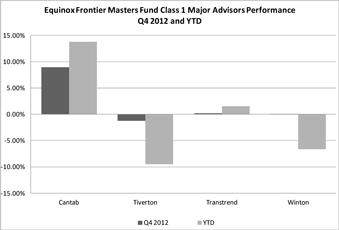
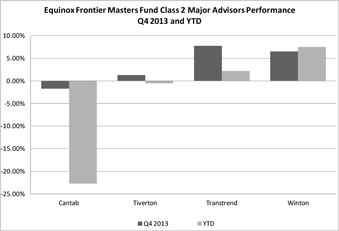


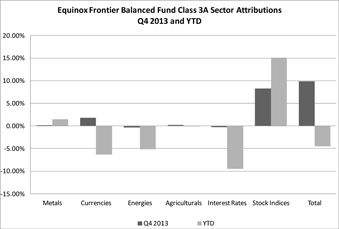
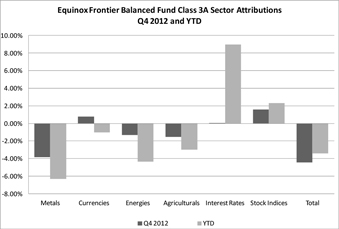


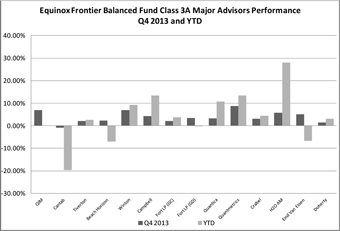

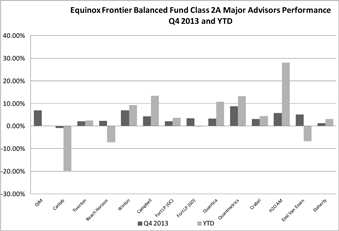
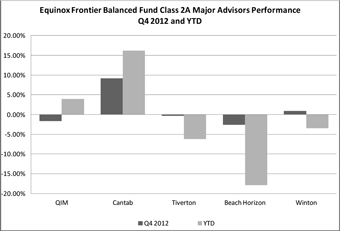
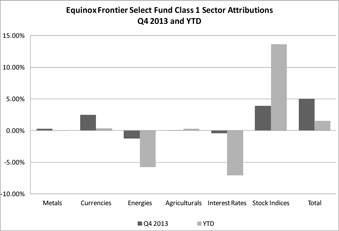
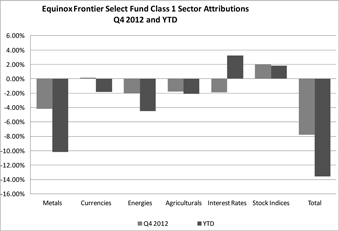
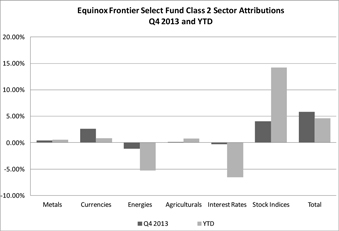


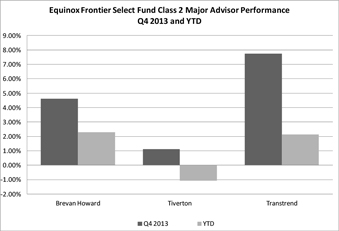
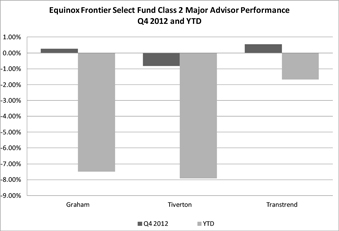
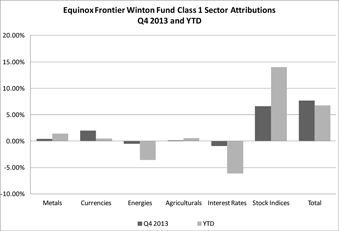
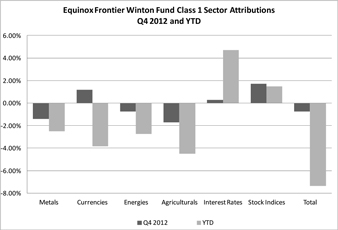
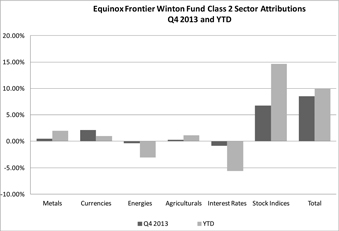


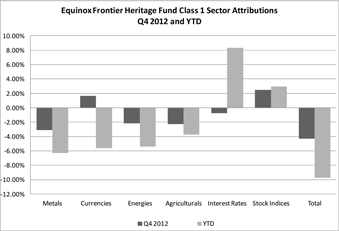


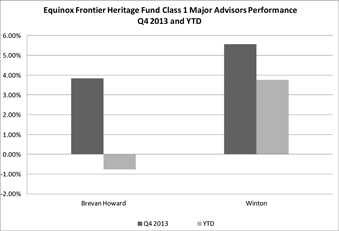


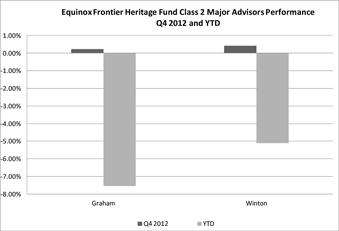
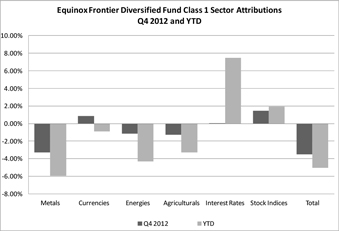
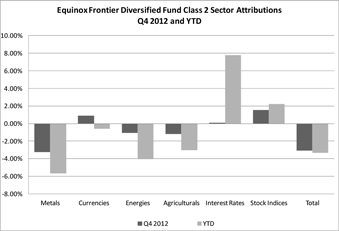

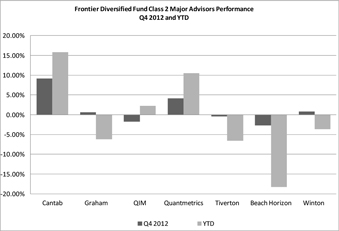
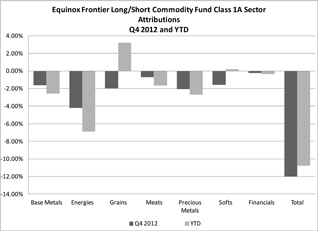


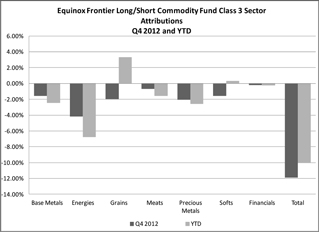
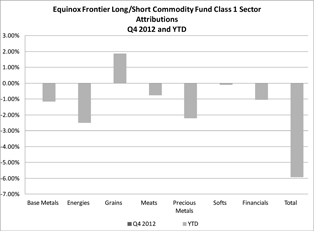
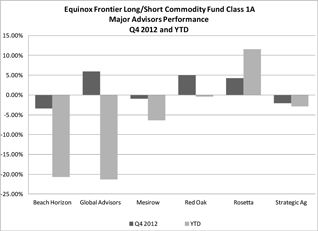

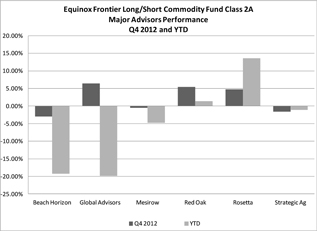
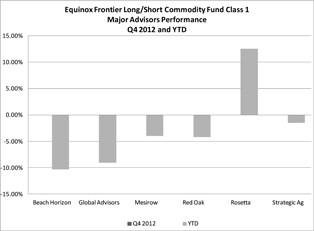
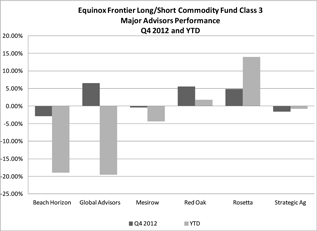
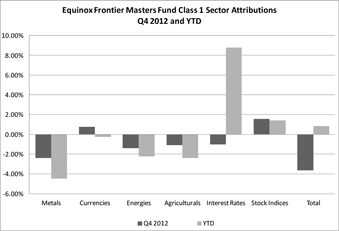


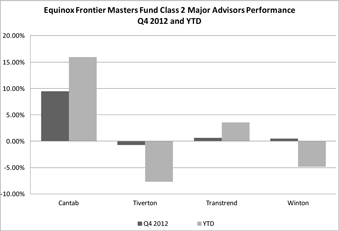
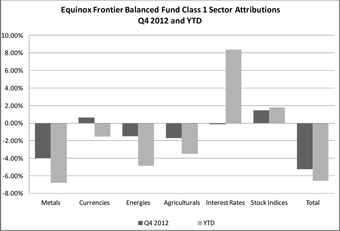


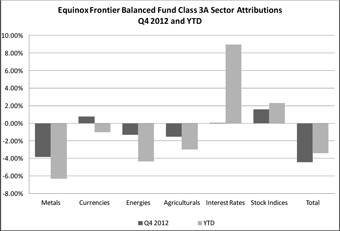
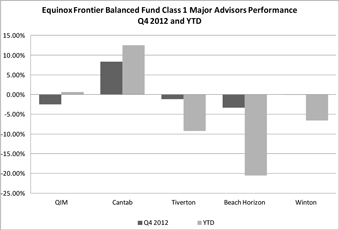


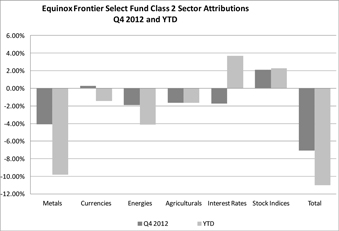
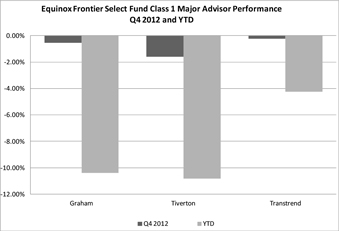

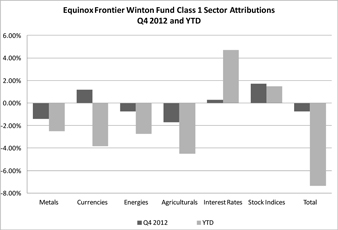
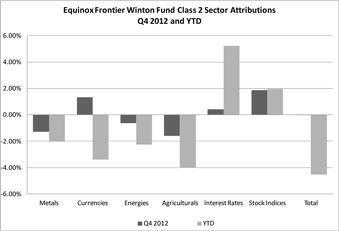
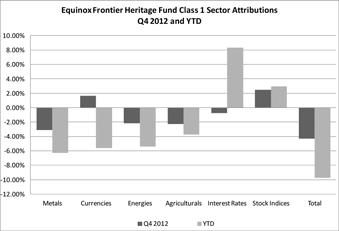
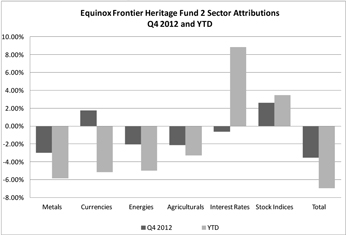
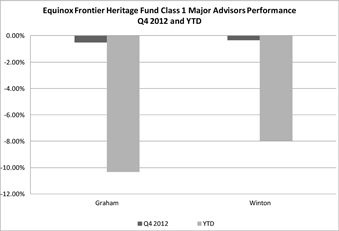

These financial statements and related notes pertain to the following companies: Frontier Trading Company I LLC, Frontier Trading Company II LLC, Frontier Trading Company V, LLC, Frontier Trading Company VII LLC, Frontier Trading Company IX LLC Frontier Trading Company XIV, LLC,, Frontier Trading Company XV LLC, Frontier Trading Company XVII, LLC,XXIII, Frontier Trading Company XVIII, LLC, Frontier Trading Company XXI, LLC, Frontier Trading Company XXIII, LLC, , Frontier Trading Company XXIX, LLC Frontier Trading Company XXXIV, LLC, Frontier Trading Company XXXV LLC, Frontier Trading Company XXXVII, LLC, Frontier Trading Company XXXVIII, LLC, and Frontier Trading Company XXXIX, LLC (the “Trading Companies”).
Equinox Frontier Funds (the “Trust”), was formed as a Delaware statutory trust on August 8, 2003, with separate Series of Units (the “Series”). Its term will expire on December 31, 2053 (unless terminated earlier in certain circumstances). The Trust is a multi-advisor commodity pool as described in Commodity Futures Trading Commission, or CFTC Regulation § 4.10(d)(2).
All capital of the Trading Companies is provided by the Series and there are no other investors in the Trading Companies.
Each Trading Company authorizes certain Trading Advisors to place trades and manage assets at pre-determined investment levels. The Trading Companies were organized for the purpose of investing in securities and derivative instruments, and have no operating income or expenses, except for trading income and expenses.
Trading Companies engage in the speculative trading of a diversified portfolio of futures, forwards (including interbank foreign currencies) and options contracts and other derivative instruments (including swap contracts) and may, from time to time, engage in cash and spot transactions. A brief description of the Trading Company’s main types of investments is set forth below:
A futures contract is a standardized contract traded on an exchange that calls for the future delivery of a specified quantity of a commodity at a specified time and place.
| ● | A futures contract is a standardized contract traded on an exchange that calls for the future delivery of a specified quantity of a commodity at a specified time and place. Exposure to futures contracts is done directly by the trading companies or indirectly through an investment in a Private Investment Company that trades futures. |
A forward contract is an individually negotiated contract between principals, not traded on an exchange, to buy or sell a specified quantity of a commodity at or before a specified date at a specified price.
| ● | A forward contract is an individually negotiated contract between principals, not traded on an exchange, to buy or sell a specified quantity of a commodity at or before a specified date at a specified price. |
An option on a futures contract, forward contract or a commodity gives the buyer of the option the right, but not the obligation, to buy or sell a futures contract, forward contract or a commodity, as applicable, at a specified price on or before a specified date. Options on futures contracts are standardized contracts traded on an exchange, while options on forward contracts and commodities, referred to collectively as over-the-counter options, generally are individually negotiated, principal-to-principal contracts not traded on an exchange.
| ● | An option on a futures contract, forward contract or a commodity gives the buyer of the option the right, but not the obligation, to buy or sell a futures contract, forward contract or a commodity, as applicable, at a specified price on or before a specified date. Options on futures contracts are standardized contracts traded on an exchange, while options on forward contracts and commodities, referred to collectively as over-the-counter options, generally are individually negotiated, principal-to-principal contracts not traded on an exchange. |
| ● | A swap contract generally involves an exchange of a stream of payments between the contracting parties. Swap contracts generally are not uniform and not exchange-traded. |
A swap contract generally involves an exchange of a stream of payments between the contracting parties. Swap contracts generally are not uniform and not exchange-traded.
The Trust has entered into agreements, which provide for the indemnification of futures clearing brokers, currency trading companies, and commodity trading advisers, among others, against losses, costs, claims and liabilities arising from the performance of their individual obligations under such agreements, except for gross negligence or bad faith.
| 2. |
The following are the significant accounting policies of the Trading Companies.
Basis of Presentation—The Trading Companies follow Generally Accepted Accounting Principles (“GAAP”), as established by the Financial Accounting Standards Board (the “FASB”), to ensure consistent reporting of financial condition, condensed schedules of investments, results of operations, changes in capital and cash flows.
Receivable from Futures Commission Merchants—The Trading Companies deposit assets with a FCM subject to CFTC regulations and various exchange and broker requirements. Margin requirements are satisfied by the deposit of cash with such FCM. The Trading Companies earn interest income on its assets deposited with the FCM. A portion of the receivable is restricted cash required to meet maintenance margin requirements. Cash with the clearing broker as of December 31, 2016 included restricted cash for margin requirements of $2,631,477 for the Frontier Trading Company I LLC, $3,623,496 for the Frontier Trading Company XV LLC, and $14,604,203 for the Frontier Trading Company II LLC.
F-88
Use of Estimates—The preparation of financial statements in conformity with GAAP may require the management of the Trading Companies to make estimates and assumptions that affect the reported amounts of assets and liabilities and disclosure of contingent assets and liabilities at the date of the financial statements and the reported amounts of revenue and expenses during the reporting period. The valuation of swap contracts requires significant estimates as well as the valuation of certain other investments. Please refer to Note 3 for discussion of valuation methodology. Actual results could differ from these estimates, and such differences could be material.
Investment Transactions—Futures,options on futures, forward and forwardswap contracts are recorded on a trade date basis and realized gains or losses are recognized when contracts are settled. Unrealized gains or losses on open contracts (the difference between contract trade price and market price) are reported in the Statementstatements of Operationsfinancial condition as a Net change in open trade equity (deficit) for futures and forwards as there exists a right of offset of unrealized gains or losses in accordance with ASC 210.Balance Sheet (“ASC 210”)and Accounting Standards Update (ASU) 2013-01.Balance Sheet (Topic 210).
Any change in net unrealized gain or loss from the preceding period is reported in the Statementsstatements of Operations.operations. Fair value of exchange-traded contracts is based upon exchange settlement prices. Fair value of non-exchange-traded contracts is based on third party quoted dealer values on the interbank market. For U.S. Treasury securities, interest is recognized in the period earned and the instruments are marked-to-market daily based on third party information. Transaction costs are recognized as incurred and reflected separately in the statements of operations.
Foreign Currency Transactions—The Trading Company’s functional currency is the U.S. dollar, however, they transact business in currencies other than the U.S. dollar. The Series do not isolate that portion of the results of operations resulting from changes in foreign exchange rates on investments from fluctuations arising from changes in market prices of securities held. Such fluctuations are included with the net realized or unrealized gain or loss from investments.
Purchase and Sales of Private Investment Companies —Trading Companies are able to subscribe into and redeem from the Galaxy Plus entities on a weekly basis. The value of the Private Investment Companies is determined by the Sponsor and reported on a daily basis. The change in value is calculated as the difference between the total purchase proceeds and the fair value calculated by the Sponsor and is recorded as net unrealized gain/(loss) on private investment companies on the statements of operations.
Investments and Swaps—The Trading Companies record investment transactions on a trade date basis and all investments are recorded at fair value, with changes in fair value reported as a component of realized and unrealized gains/(losses) on investments in the statements of operations. The Trading Companies strategically invest a portion or all of their assets in total return Swaps,swaps, selected at the discretion of management. Swaps are privately negotiated contracts designed to provide investment returns linked to those produced by one or more underlying investment products or indices. In a typical Swap,swap, two parties agree to exchange the returns (or differentials in rates of return) earned or realized on one or more particular predetermined investment or instrument. The gross returns to be exchanged or “swapped” between the parties are calculated with respect to a “notional amount” (i.e., the amount of value of the underlying asset used in computing the particular interest rate, return, or other amount to be exchanged) in a particular investment, or in a “basket” of securities. The valuation of swap contracts requires significant estimates. Swap contracts are reported utilizing Level 3 Inputs. The significant unobservable inputs used in the fair value measurement of the Trust’s Swapswap contracts are asset liquidity, debt valuation, credit risk, volatility, market risk, distributions, dividends, risk premiums, and other risk management tools. Significant increases (decreases) in any of those inputs in isolation would result in a significantly lower (higher) fair value measurement. Swap Contracts are reported at fair value based upon a weekly indicative value that is calculated by management using bid/ask prices from the counterparty. This fair value is corroborated by valuations provided by a third party pricing service. The third party pricing service
utilizes a Black Scholes pricing model with input adjustments factoring in volatility and liquidity of the instruments. All valuation processes are monitored by the valuation committee.
Income Taxes—The Trading Companies apply the provisions of ASC 740Income Taxes(“ASC 740”), which provides guidance for how uncertain tax positions should be recognized, measured, presented and disclosed in the financial statements. This interpretation also provides guidance on derecognition, classification, interest and penalties, accounting in interim periods and disclosure. ASC 740 requires the evaluation of tax positions taken or expected to be taken in the course of preparing the Trading Companies’ financial statements to determine whether the tax positions are “more-likely-than-not” of being sustained by the applicable tax authority. Tax positions with respect to tax at the Trading Company level not deemed to meet the “more-likely-than-not” threshold would be recorded as a tax benefit or expense in the current year. Management has concluded there is no tax expense, interest or penalties to be recorded by the Trading Companies. The 20112013 through 20142016 tax years generally remain subject to examination by U.S. federal and most state tax authorities.
Fees and Expenses—The Trading Companies incur no expenses other than trading commissions resulting from normal trading activity. All operating expenses such as legal, accounting, etc. are paid for, without reimbursement, by Equinox Fund Management, LLC, the Managing Owner of the Trust.
Recently Adopted Accounting PronouncementsPronouncement—— In June of 2013,May 2015, the FASB issued ASU 2013-08No. 2015-07, “Fair Value Measurement (Topic 820) — Disclosures for Investments in Certain Entities That Calculate Net Asset Value per Share (or Its Equivalent).” ASU No. 2015-07 removes the requirement to (i) modify Topic 946include investments in the fair value hierarchy for determining whether an entitywhich the fair value is an investment company; (ii) updatemeasured at NAV using the measurement requirements for noncontrolling interests in other investment companies;practical expedient under “Fair Value Measurements and (iii) require additional disclosures for investment companies under GAAP. This guidanceDisclosures (Topic 820).” ASU No. 2015-07 is effective for annual and interimreporting periods beginning on or after December 15, 2013. An entity should provide2015, including interim periods within that reporting period. ASU No. 2015-07 is required to be applied retrospectively to all periods presented beginning in the year of adoption. ASU No. 2015-07 only impacts the Trading Company’s disclosures, required by those amendments retrospectively for all comparative periods presented. The adoption of this guidance diddoes not have a material impact onaffect the Trading Company’s financial positions orcondition, results of operations.operations, or cash flows.
Reclassification—Certain amounts in the 2013 financial statements have been reclassified to conform with the 2014 presentation. NoneF-89
Subsequent Events—The Trading Companies follow the provisions of FASB ASC 855,Subsequent Events, which establishes general standards of accounting for and disclosure of events that occur after the balance sheet date and up through the date the financial statements are issued. Refer to Note 9.
| 3. |
In connection with the valuation of investments, the Trading Companies apply ASC 820. ASC 820 provides clarification that when a quoted price in an active market for the identical asset or liability is not available, a reporting entity is required to measure fair value using certain techniques. ASC 820 also clarifies that when estimating the fair value of an asset or liability, a reporting entity is not required to include a separate input or adjustment to other inputs relating to the existence of a restriction that prevents the transfer of an asset or liability. ASC 820 also clarifies that both a quoted price in an active market for the identical asset or liability at the measurement date and the quoted price for the identical asset or liability when traded as an asset or liability in an active market when no adjustments to the quoted price of the asset are required are Level 1 fair value measurements.
Level 1 Inputs
Unadjusted quoted prices in active markets for identical financial assets that the reporting entity has the ability to access at the measurement date.
Level 2 Inputs
Inputs other than quoted prices included in Level 1 that are observable for the financial assets or liabilities, either directly or indirectly. These might include quoted prices for similar financial assets in active markets, quoted prices for identical or similar financial assets in markets that are not active, inputs other than quoted prices that are observable for the financial assets or inputs that are derived principally from or corroborated by market data by correlation or other means.
Level 3 Inputs
Unobservable inputs for determining the fair value of financial assets that reflect an entity’s own assumptions about the assumptions that market participants would use in pricing the financial asset.
The Trading Companies uses the following methodologies to value instruments within its financial asset portfolio at fair value:
Trading Securities. These instruments include open trade equity positions (futures contracts) that are actively traded on public markets with quoted pricing for corroboration. Futures contracts are reported at fair value using Level 1 inputs. Trading securities instruments further include open trade equity positions (trading options and currencies) that are quoted prices for identical or similar assets that are not traded on active markets. Trading options and currencies are reported at fair value using Level 2 inputs.
Swap ContractsContracts.. Certain Trading CompaniesSeries of the Trust strategically invest a portion or all of their assets in total return Swaps,swaps, selected at the direction of the Managing Owner. Swaps are privately negotiated contracts designed to provide investment returns linked to those produced by one or more investment products or indices. In a typical Swap,swap, two parties agree to exchange the returns (or differentials in rates of return) earned or realized on one or more particular predetermined investments or instruments. The gross returns to be exchanged or “swapped” between the parties are calculated with respect to a “notional amount” (i.e., the amount of value of the underlying asset used in computing the particular interest rate, return, or other amount to be exchanged) in a particular investment, or in a “basket” of securities. Swap contracts are reported at fair value basis upon daily reports from the counterparty. In addition, a third party takes receives the inputs from the counterparty, makes certain adjustments, and runs it through their pricing model to come up with their daily price. The Managing Owner valuesfair value measurements of the investments of based on the CTA’s estimated position information on a same-trading day basis.swap contracts are valued using unadjusted inputs that were not internally developed. The Managing Owner reviews and compares approves current day pricing of the CTA positions, as received from the counterparty which includes intra-day volatility and volume and daily index performance, that is usedas well as from the third party. Differences in prices exceeding 5% are investigated. Unexplainable differences are escalated to determine a daily fair value NAV for the swap contracts. The fair value is corroborated through the use of a third party pricing service (“pricing service”). The valuation of swap contracts requires significant estimates utilizing Level 3 Inputs corroborated by management through the use of a third party pricing service (“pricing service”). The pricing service, utilizing proprietary model-intensive methodologies, selects and implements the pricing model appropriate for each swap valuation. The pricing service does not provide detail of the pricing model to management. The Managing Owner through the Valuation Committee charted by the Executive Committee of the Trust, engages, via inquiry and review of methodology documentation, with the service provider to gain an understanding of the valuation model selected; the components of the model, both observable and unobservable; and quality control testing procedures in place. The Valuation committee meets on a monthly basis and as needed to discuss any updates or changes in the valuation process, reporting to the Executive Committee. The pricing service’s methodology includes performance of tolerance testing on its valuation models to ensure consistency and reasonableness of the values derived. The tolerance testing includes valuing the components of the product separately, i.e. underlying asset, volatility, financing rates, and so forth. The tolerance testing is part of the initial valuation setup and throughout the ongoing daily valuation process. The pricing service also has several layers of quality control including: engineering / reverse engineering process to understand each swap and its’ subcomponent parts fully; comparative analysis against other valuations performed with similar composition and characteristics; review of output valuation against expectations based on observable price movements of underlying futures; and lastly, periodic review by senior financial engineer to ensure design and function of model is stable and perform as expected.
The Managing Owner has chartered a valuation committee to provide oversight of the valuation process. The valuation committee meets at least monthly to discuss the valuation process and any valuation issues that may arise. The valuation committee is comprised of senior members of the Managing Owner’s management team with varying areas of expertise that add value toValuation Committee for evaluation and resolution.
Investments in Private Investment Companies. Investments in private investment companies are valued utilizing the committee. The valuation committee reports to both the Managing Owner’s Investment Oversight and Risk Committee and the Trust’s Executive Committee. The committee further remains in communication with the Managing Owner’s Due Diligence Committee that provides ongoing counterparty risk monitoring of the swap counterparties. The committee monitors daily pricingnet asset values provided by the swap counterpartyunderlying Private Investment Companies as a practical expedient. The Fund applies the practical expedient to its investments in Private Investment Companies on an investment-by-investment basis, and daily valuation provided byconsistently with the third party pricing service to ensureFund’s entire position in a particular investment, unless it is probable that the changeFund will sell a portion of an investment at an amount different from the net asset value of the investment. Management has adopted Accounting Standards Update (“ASU”) ASU 2015-07,Disclosures for Investments in Certain Entities That Calculate Net Asset Value per Share (or Its Equivalent)— a consensus of the Emerging Issues Task Force issued, on May 1, 2015. The guidance in this standard was effective for interim and annual periods beginning after December 15, 2015. In accordance with Subtopic 820-10, certain investments that are measured at fair value is reasonable and valuations areusing the net asset value per share (or its equivalent) have not been classified in accordance with current regulations and best practices. The committee may request a price challenge if the daily valuation provided by the counterparty valuations differs significantly from the valuation obtained by the pricing service. The Managing Owner’s valuation committee monitors some additional input factors such as liquidity, volatility, and counterparty risk in order to further review the valuations provide by the pricing service.fair value hierarchy below.
F-90
The following table summarizes the instruments that comprise the Trading Companies financial asset portfolio measured at fair value on a recurring basis as of December 31, 20142016 and 2013,2015, segregated by the level of valuation inputs within the fair value hierarchy utilized to measure fair value:
| Total | ||||||||||||||||||||||||||||||||
December 31, 2014 | Level 1 Inputs | Level 2 Inputs | Level 3 Inputs | Total Fair Value | ||||||||||||||||||||||||||||
| December 31, 2016 | Level 1 Inputs | Level 2 Inputs | Level 3 Inputs | Fair Value | ||||||||||||||||||||||||||||
Frontier Trading Company I LLC | ||||||||||||||||||||||||||||||||
Open Trade Equity (Deficit) | $ | 3,171,968 | $ | 43,237 | $ | — | $ | 3,215,205 | $ | 288,647 | $ | (50,986 | ) | $ | — | $ | 237,661 | |||||||||||||||
Options Purchased | — | 288,413 | — | 288,413 | ||||||||||||||||||||||||||||
Options Written | — | (253,017 | ) | — | (253,017 | ) | ||||||||||||||||||||||||||
Frontier Trading Company II LLC | ||||||||||||||||||||||||||||||||
Open Trade Equity (Deficit) | $ | 4,029,156 | $ | (555,872 | ) | — | 3,473,284 | 1,123,666 | 98,858 | — | 1,222,524 | |||||||||||||||||||||
Frontier Trading Company VII LLC | ||||||||||||||||||||||||||||||||
Open Trade Equity (Deficit) | 3,469,339 | — | — | 3,469,339 | ||||||||||||||||||||||||||||
Options Purchased | — | 8,787,472 | — | 8,787,472 | ||||||||||||||||||||||||||||
Options Written | — | (8,710,817 | ) | — | (8,710,817 | ) | ||||||||||||||||||||||||||
Frontier Trading Company XIV, LLC | ||||||||||||||||||||||||||||||||
Open Trade Equity (Deficit) | 1,341,051 | (316,183 | ) | — | 1,024,868 | |||||||||||||||||||||||||||
Frontier Trading Company XV, LLC | ||||||||||||||||||||||||||||||||
Open Trade Equity (Deficit) | 1,658,917 | — | — | 1,658,917 | ||||||||||||||||||||||||||||
Frontier Trading Company XXIII, LLC | ||||||||||||||||||||||||||||||||
Open Trade Equity (Deficit) | 893,605 | — | — | 893,605 | ||||||||||||||||||||||||||||
Frontier Trading Company XXIX, LLC | ||||||||||||||||||||||||||||||||
Open Trade Equity (Deficit) | (279,840 | ) | — | — | (279,840 | ) | 635,782 | 6,712 | — | 642,494 | ||||||||||||||||||||||
Frontier Trading Company XXXIV, LLC | ||||||||||||||||||||||||||||||||
Swap Contracts | — | — | 18,246,955 | 18,246,955 | — | — | 18,939,450 | 18,939,450 | ||||||||||||||||||||||||
Frontier Trading Company XXXV, LLC | ||||||||||||||||||||||||||||||||
Swap Contracts | — | — | 6,570,409 | 6,570,409 | — | — | 8,637,847 | 8,637,847 | ||||||||||||||||||||||||
Frontier Trading Company XXXVII, LLC | ||||||||||||||||||||||||||||||||
Swap Contracts | — | — | 3,633,060 | 3,633,060 | — | — | 4,220,468 | 4,220,468 | ||||||||||||||||||||||||
Frontier Trading Company XXXVIII, LLC | ||||||||||||||||||||||||||||||||
Open Trade Equity (Deficit) | 1,369,043 | — | — | 1,369,043 | ||||||||||||||||||||||||||||
| Private Investment Companies | — | 11,183,404 | — | 11,183,404 | ||||||||||||||||||||||||||||
Frontier Trading Company XXXIX, LLC | ||||||||||||||||||||||||||||||||
Swap Contracts | — | — | 7,543,966 | 7,543,966 | — | — | 8,391,414 | 8,391,414 | ||||||||||||||||||||||||
F-91
December 31, 2013 Frontier Trading Company I LLC Open Trade Equity (Deficit) Options Purchased Options Written Frontier Trading Company II LLC Open Trade Equity (Deficit) Frontier Trading Company VII LLC Open Trade Equity (Deficit) Options Purchased Options Written Frontier Trading Company XIV, LLC Open Trade Equity (Deficit) Frontier Trading Company XV, LLC Open Trade Equity (Deficit) Options Purchased Options Written Frontier Trading Company XXIII, LLC Open Trade Equity (Deficit) Frontier Trading Company XXXIV, LLC Swap Contracts Frontier Trading Company XXXIX, LLC Swap Contracts Frontier Trading Company XXXV, LLC Swap Contracts Frontier Trading Company XXXVII, LLC Swap Contracts Frontier Trading Company XXXVIII, LLC Open Trade Equity (Deficit) Level 1 Inputs Level 2 Inputs Level 3 Inputs Total Fair
Value $ 3,162,843 $ — $ — $ 3,162,843 — 165,983 — 165,983 — (183,932 ) — (183,932 ) 4,302,702 18,591 — 4,321,293 (191,069 ) — — (191,069 ) — 98,740 — 98,740 — (172,650 ) — (172,650 ) 246,639 459,545 — 706,184 3,317,215 769,823 — 4,087,038 — 2,769,147 — 2,769,147 — (865,940 ) — (865,940 ) 67,845 — — 67,845 — — 10,126,168 10,126,168 — — 5,435,184 5,435,184 — — 3,437,632 3,437,632 — — 2,456,545 2,456,545 3,520,515 — — 3,520,515
| Total | ||||||||||||||||
| December 31, 2015 | Level 1 Inputs | Level 2 Inputs | Level 3 Inputs | Fair Value | ||||||||||||
| Frontier Trading Company I LLC | ||||||||||||||||
| Open Trade Equity (Deficit) | $ | 755,452 | $ | — | $ | — | $ | 755,452 | ||||||||
| Options Purchased | — | 371,758 | — | 371,758 | ||||||||||||
| Options Written | — | (165,760 | ) | — | (165,760 | ) | ||||||||||
| Frontier Trading Company II LLC | ||||||||||||||||
| Open Trade Equity (Deficit) | 599,579 | — | — | 599,579 | ||||||||||||
| Frontier Trading Company VII LLC | ||||||||||||||||
| Open Trade Equity (Deficit) | (6,482,499 | ) | — | — | (6,482,499 | ) | ||||||||||
| Options Purchased | — | 154,380 | — | 154,380 | ||||||||||||
| Frontier Trading Company XIV, LLC | ||||||||||||||||
| Open Trade Equity (Deficit) | 34,848 | — | — | 34,848 | ||||||||||||
| Frontier Trading Company XV, LLC | ||||||||||||||||
| Open Trade Equity (Deficit) | 462,340 | — | — | 462,340 | ||||||||||||
| Frontier Trading Company XXIII, LLC | ||||||||||||||||
| Open Trade Equity (Deficit) | (27,706 | ) | — | — | (27,706 | ) | ||||||||||
| Frontier Trading Company XXIX, LLC | ||||||||||||||||
| Open Trade Equity (Deficit) | 4,750 | — | — | 4,750 | ||||||||||||
| Frontier Trading Company XXXIV, LLC | ||||||||||||||||
| Swap Contracts | — | — | 19,157,522 | 19,157,522 | ||||||||||||
| Frontier Trading Company XXXIX, LLC | ||||||||||||||||
| Swap Contracts | — | — | 7,960,269 | 7,960,269 | ||||||||||||
| Frontier Trading Company XXXV, LLC | ||||||||||||||||
| Swap Contracts | — | — | 8,685,850 | 8,685,850 | ||||||||||||
| Frontier Trading Company XXXVII, LLC | ||||||||||||||||
| Swap Contracts | — | — | 4,332,427 | 4,332,427 | ||||||||||||
| Frontier Trading Company XXXVIII, LLC | ||||||||||||||||
| Open Trade Equity (Deficit) | 304,878 | — | — | 304,878 | ||||||||||||
F-92
The changes in Level 3 assets measured at fair value on a recurring basis are summarized in the following tables. Swap Contract asset gains and losses (realized/unrealized) included in earnings are classified in “net realized and unrealized gain/(loss) on investments—net realized and unrealized gain/(loss) on swap contracts” on the statements of operations. During the yearyears ended December 31, 2014,2016 and 2015, all identified level three assets are components of the Frontier Trading Company XXXIV, XXXV, XXXVII, and XXXIX LLC. DuringXXXIX.
| Frontier Trading Company | Frontier Trading Company | |||||||
| XXXIV LLC | XXXIX, LLC | |||||||
| For The Year Ending | For The Year Ending | |||||||
| December 31, 2016 | December 31, 2016 | |||||||
| Balance of recurring Level 3 assets as of December 31, 2015 | $ | 19,157,522 | $ | 7,960,269 | ||||
| Total gains or losses (realized/unrealized): | ||||||||
| Included in earnings-realized | — | — | ||||||
| Included in earnings-unrealized | (218,073 | ) | 431,145 | |||||
| Purchases, sales, issuances, and settlements, net | — | — | ||||||
| Transfers in and/or out of Level 3 | — | — | ||||||
| Balance of recurring Level 3 assets as of December 31, 2016 | $ | 18,939,449 | $ | 8,391,414 | ||||
| Frontier Trading Company | Frontier Trading Company | |||||||
| XXXV LLC | XXXVII, LLC | |||||||
| For The Year Ending | For The Year Ending | |||||||
| December 31, 2016 | December 31, 2016 | |||||||
| Balance of recurring Level 3 assets as of December 31, 2015 | $ | 8,685,850 | $ | 4,332,427 | ||||
| Total gains or losses (realized/unrealized): | ||||||||
| Included in earnings-realized | — | — | ||||||
| Included in earnings-unrealized | (48,003 | ) | (111,959 | ) | ||||
| Purchases, sales, issuances, and settlements, net | — | — | ||||||
| Transfers in and/or out of Level 3 | — | — | ||||||
| Balance of recurring Level 3 assets as of December 31, 2016 | $ | 8,637,847 | $ | 4,220,468 | ||||
F-93
| Frontier Trading Company | Frontier Trading Company | |||||||
| XXXIV LLC | XXXIX, LLC | |||||||
| For The Year Ending | For The Year Ending | |||||||
| December 31, 2015 | December 31, 2015 | |||||||
| Balance of recurring Level 3 assets as of January 1, 2015 | $ | 18,246,955 | $ | 7,540,466 | ||||
| Total gains or losses (realized/unrealized): | ||||||||
| Included in earnings-realized | — | — | ||||||
| Included in earnings-unrealized | 910,567 | 419,803 | ||||||
| Included in other comprehensive income | — | — | ||||||
| Purchases, sales, issuances, and settlements, net | — | — | ||||||
| Transfers in and/or out of Level 3 | — | — | ||||||
| Balance of recurring Level 3 assets as of December 31, 2015 | $ | 19,157,522 | $ | 7,960,269 | ||||
| Frontier Trading Company | Frontier Trading Company | |||||||
| XXXV LLC | XXXVII, LLC | |||||||
| For The Year Ending | For The Year Ending | |||||||
| December 31, 2015 | December 31, 2015 | |||||||
| Balance of recurring Level 3 assets as of January 1, 2015 | $ | 6,570,409 | $ | 3,633,060 | ||||
| Total gains or losses (realized/unrealized): | ||||||||
| Included in earnings-realized | — | — | ||||||
| Included in earnings-unrealized | 2,115,441 | (300,633 | ) | |||||
| Included in other comprehensive income | — | — | ||||||
| Purchases, sales, issuances, and settlements, net | — | 1,000,000 | ||||||
| Transfers in and/or out of Level 3 | — | — | ||||||
| Balance of recurring Level 3 assets as of December 31, 2015 | $ | 8,685,850 | $ | 4,332,427 | ||||
The total change in unrealized appreciation (depreciation) included in the year endedstatements of operations attributable to level 3 investments still held at December 31, 2013, all identified2016:
| Frontier Trading | Frontier Trading | Frontier Trading | Frontier Trading | |||||||||||||
| Company XXXV LLC | Company XXXVII LLC | Company XXXIV LLC | Company XXXIX LLC | |||||||||||||
| Swaps | $ | (48,002 | ) | $ | (111,960 | ) | $ | (218,070 | ) | $ | 431,146 | |||||
The total change in unrealized appreciation (depreciation) included in the statements of operations attributable to level three assets are components3 investments still held at December 31, 2015:
| Frontier Trading | Frontier Trading | Frontier Trading | Frontier Trading | |||||||||||||
| Company XXXV LLC | Company XXXVII LLC | Company XXXIV LLC | Company XXXIX LLC | |||||||||||||
| Swaps | $ | 2,115,441 | $ | (300,633 | ) | $ | (910,566 | ) | $ | 419,803 | ||||||
The total change in unrealized appreciation (depreciation) included in the statements of the Frontier Trading Company I, XVII, XXXIV, XXXV, XXXVII, and XXXIX LLC.operations attributable to level 3 investments still held at December 31, 2014:
Swap Contracts Balance of recurring Level 3 assets as of January 1, 2014 Total gains or losses (realized/unrealized): Included in earnings-realized Included in earnings-unrealized Included in other comprehensive income Purchases, sales, issuances, and settlements, net Transfers in and/or out of Level 3 Balance of recurring Level 3 assets as of December 31, 2014 Frontier Trading Company
XXXIV LLC
For The Year Ending
December 31, 2014 Frontier Trading Company
XXXIX, LLC
For The Year Ending
December 31, 2014 $ 10,126,168 $ 5,435,184 — — 8,120,787 2,108,782 — — — — — — $ 18,246,955 $ 7,543,966
| Frontier Trading Company XXXV LLC For The Year Ending December 31, 2014 | Frontier Trading Company XXXVII, LLC For The Year Ending December 31, 2014 | |||||||
Balance of recurring Level 3 assets as of January 1, 2014 | $ | 3,437,632 | $ | 2,456,545 | ||||
Total gains or losses (realized/unrealized): | ||||||||
Included in earnings-realized | — | — | ||||||
Included in earnings-unrealized | 3,132,777 | 1,176,515 | ||||||
Included in other comprehensive income | — | — | ||||||
Purchases, sales, issuances, and settlements, net | — | — | ||||||
Transfers in and/or out of Level 3 | — | — | ||||||
|
|
|
| |||||
Balance of recurring Level 3 assets as of December 31, 2014 | $ | 6,570,409 | $ | 3,633,060 | ||||
|
|
|
| |||||
| Frontier Trading | Frontier Trading | Frontier Trading | Frontier Trading | |||||||||||||
| Company XXXV LLC | Company XXXVII LLC | Company XXXIV LLC | Company XXXIX LLC | |||||||||||||
| Swaps | $ | 3,132,776 | $ | 1,176,514 | $ | 8,120,996 | $ | 2,105,281 | ||||||||
F-94
Swap Contracts | Frontier Trading Company I LLC For The Year Ending December 31, 2013 | Frontier Trading Company XVII, LLC For The Year Ending December 31, 2013 | ||||||
Balance of recurring Level 3 assets as of January 1, 2013 | $ | 17,785,734 | $ | 4,503,744 | ||||
Total gains or losses (realized/unrealized): | ||||||||
Included in earnings-realized | (1,646,391 | ) | (1,908,743 | ) | ||||
Included in earnings-unrealized | 214,266 | 1,746,256 | ||||||
Purchases, sales, issuances, and settlements, net | (16,353,609 | ) | (4,341,257 | ) | ||||
Transfers in and/or out of Level 3 | — | — | ||||||
|
|
|
| |||||
Balance of recurring Level 3 assets as of December 31, 2013 | $ | — | $ | — | ||||
|
|
|
| |||||
| Frontier Trading Company XXXIV LLC For The Year Ending December 31, 2013 | Frontier Trading Company XXXIX, LLC For The Year Ending December 31, 2013 | |||||||
Balance of recurring Level 3 assets as of January 1, 2013 | $ | — | $ | — | ||||
Total gains or losses (realized/unrealized): | ||||||||
Included in earnings-realized | — | — | ||||||
Included in earnings-unrealized | 526,168 | (561,316 | ) | |||||
Included in other comprehensive income | — | — | ||||||
Purchases, sales, issuances, and settlements, net | 9,600,000 | 5,996,500 | ||||||
Transfers in and/or out of Level 3 | — | — | ||||||
|
|
|
| |||||
Balance of recurring Level 3 assets as of December 31, 2013 | $ | 10,126,168 | $ | 5,435,184 | ||||
|
|
|
| |||||
Balance of recurring Level 3 assets as of January 1, 2013 Total gains or losses (realized/unrealized): Included in earnings-realized Included in earnings-unrealized Included in other comprehensive income Purchases, sales, issuances, and settlements, net Transfers in and/or out of Level 3 Balance of recurring Level 3 assets as of December 31, 2013 Frontier Trading Company
XXXV, LLC
For The Year Ending
December 31, 2013 Frontier Trading Company
XXXVII, LLC
For The Year Ending
December 31, 2013 $ — $ — — — 37,632 (423,455 ) — — 3,400,000 2,880,000 — — $ 3,437,632 $ 2,456,545
The Trading Companies assess the levels of the investments at each measurement date, and transfers between levels are recognized on the actual date of the event or change in circumstances that caused the transfer in accordance with the Trading Company’s accounting policy regarding the recognition of transfers between levels of the fair value hierarchy. During the year ended December 31, 20142016 and 2013,2015, the Trust did not transfer any assets between LevelsLevel 1, Level 2 or Level 3.
The total change in unrealized appreciation (depreciation) included in the statements of operations attributable to level 3 investments still held at December 31, 2014.
| Frontier Trading Company XXXIV LLC | Frontier Trading Company XXXV, LLC | Frontier Trading Company XXXVII, LLC | Frontier Trading Company XXXIX, LLC | |||||||||||||
Swaps | $ | 8,120,787 | $ | 3,132,777 | $ | 1,176,514 | $ | 2,108,782 | ||||||||
The total change in unrealized appreciation (depreciation) included in the statements of operations attributable to level 3 investments still held at December 31, 2013.
| 4. | Swap Contracts |
| Frontier Trading Company XXXIV LLC | Frontier Trading Company XXXV, LLC | Frontier Trading Company XXXVII, LLC | Frontier Trading Company XXXIX, LLC | |||||||||||||
Swaps | $ | 526,168 | $ | 37,632 | $ | (423,455 | ) | $ | (561,316 | ) | ||||||
The total change in unrealized appreciation (depreciation) included in the statements of operations attributable to level 3 investments still held at December 31, 2012.
| Frontier Trading Company I LLC | Frontier Trading Company XVII LLC | |||||||
Swaps | $ | 78,977 | $ | (1,378,028 | ) | |||
Per swap disclosure no realized on open swap postions as of 12/31/2012.
4. Swaps
In addition to authorizing Trading Advisors to manage pre-determined investment levels of futures and forward contracts, certain Trading Companies of the Trust will strategically invest a portion or all of their assets in total return swaps, selected at the direction of management. Swaps are privately negotiated contracts designed to provide investment returns linked to those produced by one or more investment products or indices. In a typical swap, two parties agree to exchange the returns (or differentials in rates of return) earned or realized on one or more particular predetermined investments or instruments. The gross returns to be exchanged or “swapped” between the parties are calculated with respect to a “notional amount” (i.e., the amount or value of the underlying asset used in computing the particular interest rate, return, or other amount to be exchanged) in a particular investment, or in a “basket” of securities.
Each Trading Companies’Company’s investment in swaps will likely differ substantially over time due to cash flows, portfolio management decisions and market movements. The Swapsswaps serve to diversify the investment holdings of each Trading Company and to provide access to programs and advisors that would not be otherwise available to the Trading Company, and are not used for hedging purposes.
Management follows a procedure in selecting well-established financial institutions which management, in its sole discretion, considers to be reputable, reliable, financially responsible and well established, to act as swap counterparties. The procedure includes due diligence review of documentation on all new and existing financial institution counterparties prior to initiation of relationship, and quarterly ongoing review during the relationship, to ensure that counterparties meet the managements’ minimum credit requirements, the counterparty average rating being no less than an investment grade rating as defined by the rating agencies.
The Trading Companies strategically invest assets in one or more swaps linked to certain underlying investments or indices, at the direction of management. The Trading Companies will not own any of the investments or indices referenced by any swap. In addition, the swap counterparty to the Trading Company is not a Trading Advisor to these Trading Companies.
The
To help to reduce counterparty risk on the Trading Companies, have investedthe Managing Owner has the right to reduce the Trading Companies’ exposure and remove cash from the Trading Companies’ total return swaps with Deutsche Bank AG. This cash holding shall be in excess of $250,000, and may not exceed 40% of the following SwapsIndex exposure in total. Index exposure is defined as the total notional amount plus any profit. The funds are charged interest on this cash holding and any amount removed will be offset against the final settlement value of the swap. As of December 31, 2014.2016, the Frontier Trading Company XXXIV LLC, Frontier Trading Company XXXV LLC, Frontier Trading Company XXXVII LLC, and Frontier Trading Company XXXIX LLC, had $4,926,555, $2,500,000, $115,000, and $1,900,000, respectively, in cash holdings as shown in the Fund’s Statements of Financial Conditions under advance on unrealized swap appreciation, which relates to the Trading Companies’ total return swaps with Deutsche Bank AG.
F-95
| XXXIX Brevan Howard Total Return Swap | XXXIV Balanced select swap Total Return Swap | XXXV Diversified select swap Total Return Swap | XXXVII L/S select swap Total Return Swap | |||||||||||||
Counterparty | DeutscheBank AG | DeutscheBank AG | DeutscheBank AG | DeutscheBank AG | ||||||||||||
Notional Amount | $ | 17,663,283 | $ | 67,610,098 | $ | 35,500,000 | $ | 13,590,513 | ||||||||
Termination Date | 3/26/2018 | 8/2/2018 | 8/2/2018 | 8/7/2018 | ||||||||||||
Cash Collateral | $ | 5,993,000 | $ | 9,600,000 | $ | 3,400,000 | $ | 2,880,000 | ||||||||
Swap Value | $ | 1,547,466 | $ | 8,646,955 | $ | 3,170,409 | $ | 753,060 | ||||||||
Investee Returns | Total Returns | Total Returns | Total Returns | Total Returns | ||||||||||||
Realized Gain/(Loss) | $ | 0 | $ | 0 | $ | 0 | $ | 0 | ||||||||
|
|
|
|
|
|
|
| |||||||||
Change in Unrealized Gain/(Loss) | $ | 2,108,782 | $ | 8,120,786 | $ | 3,132,777 | $ | 1,176,515 | ||||||||
|
|
|
|
|
|
|
| |||||||||
Fair Value as of 12/31/2014 | $ | 7,543,966 | $ | 18,246,955 | $ | 6,570,409 | $ | 3,633,060 | ||||||||
|
|
|
|
|
|
|
| |||||||||
The Trading Companies have invested in the following Swapsswaps as of December 31, 2013.2016.
| XXXIX Brevan Howard | XXXIV Balanced Select Swap | XXXV Diversified Select Swap | XXXVII L/S Select Swap | |||||||||||||||||
| Total Return Swap | Total Return Swap | Total Return Swap | Total Return Swap | |||||||||||||||||
| Brevan Howard Total Return Swap | XXXIV Balanced select swap Total Return Swap | XXXV Diversified select swap Total Return Swap | ||||||||||||||||||
Counterparty | DeutscheBank AG | DeutscheBank AG | DeutscheBank AG | DeutscheBank AG | DeutscheBank AG | DeutscheBank AG | DeutscheBank AG | |||||||||||||
Notional Amount | $ | 18,663,283 | $ | 64,400,000 | $ | 25,500,000 | $11,413,283 | $22,580,043 | $13,851,707 | $1,877,692 | ||||||||||
Termination Date | 3/26/2018 | 8/2/2018 | 8/2/2018 | 3/26/2018 | 8/2/2018 | 8/2/2018 | 8/7/2018 | |||||||||||||
Cash collateral | $ | 5,996,500 | $ | 9,600,000 | $ | 3,400,000 | ||||||||||||||
Swap value | $ | (561,316 | ) | $ | 526,168 | $ | 37,632 | |||||||||||||
| Cash Collateral | $5,986,000 | $9,600,000 | $3,400,000 | $3,880,000 | ||||||||||||||||
| Swap Value | $2,405,414 | $9,339,450 | $5,237,847 | $340,468 | ||||||||||||||||
Investee Returns | Total Returns | Total Returns | Total Returns | Total Returns | Total Returns | Total Returns | Total Returns | |||||||||||||
Realized Gain/(Loss) | $ | — | $ | — | $ | — | $0 | $0 | $0 | $0 | ||||||||||
|
|
| ||||||||||||||||||
Change in Unrealized Gain/(Loss) | $ | (561,316) | $ | 526,168 | $ | 37,632 | $431,145 | ($218,073) | ($48,003) | ($111,959) | ||||||||||
|
|
| ||||||||||||||||||
Fair Value as of 12/31/2013 | $ | 5,435,184 | $ | 10,126,168 | $ | 3,437,632 | ||||||||||||||
|
|
| ||||||||||||||||||
| Fair Value as of 12/31/2016 | $8,391,414 | $18,939,450 | $8,637,847 | $4,220,468 | ||||||||||||||||
| Advance on swap appreciation | ($1,900,000) | ($4,926,555) | ($2,500,000) | ($115,000) | ||||||||||||||||
Counterparty Notional Amount Termination Date Cash collateral Swap value Investee Returns Realized Gain/(Loss) Change in Unrealized Gain/(Loss) Fair Value as of 12/31/2013 XXXVII L/S select
swap Total Return Swap Balanced Series
Option/Swap Currency Swap
Option DeutscheBank AG DeutscheBank Societe Generale $ 34,400,000 $ 0 $ 0 8/7/2018 11/21/2014 6/30/2016 $ 2,880,000 $ (423,455 ) Total Returns Total Returns Total Returns $ — $ (1,646,391 ) $ (1,908,743 ) $ (423,455) $ 214,265 1,746,256 $ 2,456,545 $ — $ —
| Brevan Howard | XXXIV Balanced Select Swap | XXXV Diversified Select Swap | XXXVII L/S Select Swap | |||||
| Total Return Swap | Total Return Swap | Total Return Swap | Total Return Swap | |||||
| Counterparty | DeutscheBank AG | DeutscheBank AG | DeutscheBank AG | DeutscheBank AG | ||||
| Notional Amount | $12,663,283 | $22,580,043 | $13,851,707 | $1,877,592 | ||||
| Termination Date | 3/26/2018 | 8/2/2018 | 8/2/2018 | 8/7/2018 | ||||
| Cash Collateral | $5,993,000 | $9,600,000 | $3,400,000 | $3,880,000 | ||||
| Swap Value | $1,967,269 | $9,557,519 | $5,285,850 | $452,428 | ||||
| Investee Returns | Total Returns | Total Returns | Total Returns | Total Returns | ||||
| Realized Gain/(Loss) | $0 | $0 | $0 | $0 | ||||
| Change in Unrealized Gain/(Loss) | $419,803 | $910,566 | $2,115,441 | ($300,633) | ||||
| Fair Value as of 12/31/2015 | $7,960,269 | $19,157,519 | $8,685,850 | $4,332,428 |
F-96
| 5. |
The following information presents the financial highlights of the Trading Companies for the years ended December 31, 2014, 20132016, 2015 and 2012.2014.
| Frontier Trading | Frontier Trading | Frontier Trading | ||||||||||||||||||||||||||||||||||||||||||||||||||||||||||||||||||||||
| Frontier Trading | Frontier Trading | Frontier Trading | Company I LLC | Company II LLC | Company VII, LLC (1) | |||||||||||||||||||||||||||||||||||||||||||||||||||||||||||||||||||
| Company I LLC (2) | Company II LLC (2) | Company V LLC (2) | 12/31/2016 | 12/31/2015 | 12/31/2014 | 12/31/2016 | 12/31/2015 | 12/31/2014 | 12/31/2016 | 12/31/2015 | 12/31/2014 | |||||||||||||||||||||||||||||||||||||||||||||||||||||||||||||
| 12/31/2014 | 12/31/2013 | 12/31/2012 | 12/31/2014 | 12/31/2013 | 12/31/2012 | 12/31/2014 | 12/31/2013 | 12/31/2012 | ||||||||||||||||||||||||||||||||||||||||||||||||||||||||||||||||
Total Income (loss) | -0.12 | % | -0.09 | % | -0.20 | % | 0.03 | % | 0.08 | % | 0.14 | % | n/a | 0.06 | % | 0.12 | % | |||||||||||||||||||||||||||||||||||||||||||||||||||||||
| Net Investment Gain | -0.01 | % | -0.11 | % | -0.12 | % | 0.04 | % | 0.02 | % | 0.03 | % | 0.05 | % | -0.02 | % | -0.03 | % | ||||||||||||||||||||||||||||||||||||||||||||||||||||||
Total Return | 145.03 | % | 72.48 | % | -6.48 | % | 241.28 | % | 170.80 | % | -9.23 | % | n/a | 36.79 | % | -12.78 | % | 19.51 | % | 63.74 | % | 145.03 | % | 36.78 | % | 67.48 | % | 241.28 | % | 145.34 | % | 117.20 | % | 37.77 | % | |||||||||||||||||||||||||||||||||||||
| Frontier Trading | Frontier Trading | Frontier Trading | ||||||||||||||||||||||||||||||||||||||||||||||||||||||||||||||||||||||
| Frontier Trading | Frontier Trading | Frontier Trading | Company XIV, LLC (2) | Company XV, LLC | Company XXIII, LLC (3) | |||||||||||||||||||||||||||||||||||||||||||||||||||||||||||||||||||
| Company VII, LLC (2) | Company IX, LLC (2) | Company XIV, LLC (2) | 12/31/2016 | 12/31/2015 | 12/31/2014 | 12/31/2016 | 12/31/2015 | 12/31/2014 | 12/31/2016 | 12/31/2015 | 12/31/2014 | |||||||||||||||||||||||||||||||||||||||||||||||||||||||||||||
| 12/31/2014 | 12/31/2013 | 12/31/2012 | 12/31/2014 | 12/31/2013 | 12/31/2012 | 12/31/2014 | 12/31/2013 | 12/31/2012 | ||||||||||||||||||||||||||||||||||||||||||||||||||||||||||||||||
Total Income (loss) | -0.03 | % | -0.01 | % | 0.00 | % | n/a | n/a | 0.50 | % | -0.20 | % | -0.10 | % | -0.39 | % | ||||||||||||||||||||||||||||||||||||||||||||||||||||||||
| Net Investment Gain | 0.11 | % | -0.01 | % | -0.20 | % | 0.01 | % | 0.01 | % | -0.02 | % | -0.42 | % | -0.45 | % | -0.46 | % | ||||||||||||||||||||||||||||||||||||||||||||||||||||||
Total Return | 37.77 | % | -29.85 | % | -29.58 | % | n/a | n/a | -20.78 | % | 159.10 | % | -73.46 | % | 98.90 | % | 75.41 | % | -27.64 | % | 159.10 | % | 32.45 | % | -0.93 | % | 19.79 | % | -99.9 | % | 48.44 | % | 2149.00 | % | ||||||||||||||||||||||||||||||||||||||
| Frontier Trading | Frontier Trading | Frontier Trading | ||||||||||||||||||||||||||||||||||||||||||||||||||||||||||||||||||||||
| Frontier Trading | Frontier Trading | Frontier Trading | Company XXIX, LLC (4) | Company XXXIX, LLC | Company XXXIV, LLC | |||||||||||||||||||||||||||||||||||||||||||||||||||||||||||||||||||
| Company XV, LLC (2) | Company XVII, LLC (1), (2) | Company XVIII, LLC (1), (2) | 12/31/2016 | 12/31/2015 | 12/31/2014 | 12/31/2016 | 12/31/2015 | 12/31/2014 | 12/31/2016 | 12/31/2015 | 12/31/2014 | |||||||||||||||||||||||||||||||||||||||||||||||||||||||||||||
| 12/31/2014 | 12/31/2013 | 12/31/2012 | 12/31/2014 | 12/31/2013 | 12/31/2012 | 12/31/2014 | 12/31/2013 | 12/31/2012 | ||||||||||||||||||||||||||||||||||||||||||||||||||||||||||||||||
Total Income (loss) | -0.02 | % | 0.03 | % | -0.20 | % | n/a | 0.00 | % | 0.00 | % | n/a | -0.27 | % | -0.30 | % | ||||||||||||||||||||||||||||||||||||||||||||||||||||||||
| Net Investment Gain | 0.06 | % | -0.04 | % | 0.01 | % | 0.00 | % | 0.00 | % | 0.00 | % | 0.00 | % | -0.02 | % | -0.05 | % | ||||||||||||||||||||||||||||||||||||||||||||||||||||||
Total Return | 19.79 | % | 11.08 | % | -48.52 | % | n/a | -3.61 | % | -23.43 | % | n/a | -59.41 | % | -23.16 | % | -100.00 | % | -56.27 | % | -37.15 | % | 5.02 | % | -29108.31 | % | 38.75 | % | 2.30 | % | 1.43 | % | 41.75 | % | ||||||||||||||||||||||||||||||||||||||
| Frontier Trading | Frontier Trading | Frontier Trading | ||||||||||||||||||||||||||||||||||
| Company XXI, LLC (1), (2) | Company XXIII, LLC (2), (3) | Company XXIX, LLC (5) | ||||||||||||||||||||||||||||||||||
| 12/31/2014 | 12/31/2013 | 12/31/2012 | 12/31/2014 | 12/31/2013 | 12/31/2012 | 12/31/2014 | 12/31/2013 | 12/31/2012 | ||||||||||||||||||||||||||||
Total Income (loss) | n/a | n/a | -0.52 | % | -0.46 | % | -0.40 | % | 0.00 | % | 0.01 | % | 0.00 | % | 0.00 | % | ||||||||||||||||||||
Total Return | n/a | n/a | 13.65 | % | 2148.57 | % | -55.09 | % | -45.38 | % | -37.15 | % | 0.00 | % | 0.00 | % | ||||||||||||||||||||
| Frontier Trading | Frontier Trading | Frontier Trading | ||||||||||||||||||||||||||||||||||
| Company XXXIX, LLC (2) | Company XXXIV, LLC (2), (4) | Company XXXV, LLC (2), (4) | ||||||||||||||||||||||||||||||||||
| 12/31/2014 | 12/31/2013 | 12/31/2012 | 1/0/1900 | 12/31/2013 | 12/31/2012 | 1/0/1900 | 12/31/2013 | 12/31/2012 | ||||||||||||||||||||||||||||
Total Income (loss) | 0.00 | % | 0.00 | % | n/a | -0.05 | % | 0.00 | % | n/a | 0.00 | % | 0.00 | % | n/a | |||||||||||||||||||||
Total Return | 38.73 | % | -9.41 | % | n/a | 41.75 | % | 5.48 | % | n/a | 91.13 | % | 1.11 | % | n/a | |||||||||||||||||||||
| Frontier Trading | Frontier Trading | Frontier Trading | ||||||||||||||||||||||||||||||||||||||||||||||||||||||||||||||||
Frontier Trading | Frontier Trading | Company XXXV, LLC | Company XXXVII, LLC | Company XXXVIII, LLC | ||||||||||||||||||||||||||||||||||||||||||||||||||||||||||||||
| Company XXXVII, LLC (2), (4) | Company XXXVIII, LLC (2), (4) | 12/31/2016 | 12/31/2015 | 12/31/2014 | 12/31/2016 | 12/31/2015 | 12/31/2014 | 12/31/2016 | 12/31/2015 | 12/31/2014 | ||||||||||||||||||||||||||||||||||||||||||||||||||||||||
| 1/0/1900 | 12/31/2013 | 12/31/2012 | 1/0/1900 | 12/31/2013 | 12/31/2012 | |||||||||||||||||||||||||||||||||||||||||||||||||||||||||||||
Total Income (loss) | 0.00 | % | 0.00 | % | n/a | -0.07 | % | -0.01 | % | n/a | ||||||||||||||||||||||||||||||||||||||||||||||||||||||||
| Net Investment Gain | 0.00 | % | 0.00 | % | 0.00 | % | 0.00 | % | 0.00 | % | 0.00 | % | -0.02 | % | -0.04 | % | -0.07 | % | ||||||||||||||||||||||||||||||||||||||||||||||||
Total Return | 47.89 | % | -14.70 | % | n/a | 85.85 | % | 134.53 | % | n/a | 7.97 | % | 32.20 | % | 91.13 | % | -2.57 | % | -2.86 | % | 47.89 | % | -71.58 | % | -58.46 | % | 85.85 | % | ||||||||||||||||||||||||||||||||||||||
| (1) | Trading |
| (2) | Trading Company XIV ceased trading operations April 21, 2016 |
| (3) | Trading Company XXIII |
| (4) | Trading |
| 6. | Investments in Unconsolidated Trading Companies and Private Investment Companies |
Investments in Private Investment Companies represent cash and open trade equity invested in the Private Investment Companies as well as the cumulative trading profits or losses allocated to the Trust by the Private Investment Companies. Private Investment Companies allocate trading profits or losses on the basis of the proportion of the Trading Company’s capital allocated for trading to the Private Investment Company, which bears no relationship to the amount of cash invested by the Trading Company in the Private Investment Companies. Investments in Private Investment Companies are valued using the NAV provided by the underlying private investment.
As of December 31, 2016, Frontier Trading Company XXXVIII, LLC’s investment into Galaxy Plus Fund – Quest FIT Feeder Fund (535) LLC had a fair value of $11,184,103. For the year ended December 31, 2016, Galaxy Plus Fund – Quest FIT Feeder Fund (535) LLC incurred $78,605 in trading commissions and had $2,328,567 and $134,141 in realized and unrealized trading gains, respectively, for a net income of $2,384,103. Galaxy Plus Fund – Quest FIT Feeder Fund (535) LLC allows for weekly redemptions upon 24 hours written notice. There are no liquidity restrictions.
| 7. |
The Trading Companies’ primary business is to engage in speculative trading of a diversified portfolio of futures, forwards (including interbank foreign currencies), options contracts and other derivative instruments (including swap contracts). The Trading Companies do not enter into or hold positions for hedging purposes as defined under ASC 815. The detail of the fair value of the Trading Companies’ derivatives by instrument types as of December 31, 20142016 and 20132015 is included in the Condensed Schedules of Investments. See Note 4 for further disclosure related to the Trading Companies’ positions in swap contracts.
F-97
The following tables summarize the monthly averages of futures contracts bought and sold for each respective Trading Company:
For The Year Ended December 31, 2014
| For the Year Ended December 31, 2016 | ||||||||
| Monthly average contracts: | ||||||||
| Bought | Sold | |||||||
| Frontier Trading Company I LLC | 18,202 | 18,243 | ||||||
| Frontier Trading Company II LLC | 2,082 | 2,130 | ||||||
| Frontier Trading Company VII LLC | 3,085 | 3,086 | ||||||
| Frontier Trading Company XIV LLC | 795 | 803 | ||||||
| Frontier Trading Company XV LLC | 4,154 | 4,001 | ||||||
| Frontier Trading Company XXIII LLC | 1,682 | 1,615 | ||||||
| Frontier Trading Company XXIX LLC | 64 | 71 | ||||||
| Frontier Trading Company XXXVIII LLC | 1,341 | 1,208 | ||||||
| For the Year Ended December 31, 2015 | ||||||||
| Monthly average contracts: | ||||||||
| Bought | Sold | |||||||
| Frontier Trading Company I LLC | 14,984 | 15,185 | ||||||
| Frontier Trading Company II LLC | 1,508 | 1,597 | ||||||
| Frontier Trading Company VII LLC | 13,402 | 13,274 | ||||||
| Frontier Trading Company XIV LLC | 1,338 | 1,359 | ||||||
| Frontier Trading Company XV LLC | 2,153 | 2,225 | ||||||
| Frontier Trading Company XXIII LLC | 2,926 | 2,962 | ||||||
| Frontier Trading Company XXIX LLC | 526 | 537 | ||||||
| Frontier Trading Company XXXIV LLC | 972 | 972 | ||||||
| Frontier Trading Company XXXVIII LLC | 1,275 | 1,349 | ||||||
| For the Year Ended December 31, 2014 | ||||||||
| Monthly average contracts: | ||||||||
| Bought | Sold | |||||||
| Frontier Trading Company I LLC | 10,431 | 10,301 | ||||||
| Frontier Trading Company II LLC | 1,658 | 1,626 | ||||||
| Frontier Trading Company VII LLC | 11,107 | 11,212 | ||||||
| Frontier Trading Company XIV LLC | 3,156 | 3,140 | ||||||
| Frontier Trading Company XV LLC | 4,102 | 4,066 | ||||||
| Frontier Trading Company XXIII LLC | 1,981 | 1,952 | ||||||
| Frontier Trading Company XXIX LLC | 42 | 22 | ||||||
| Frontier Trading Company XXXIV LLC | 1,936 | 1,938 | ||||||
| Frontier Trading Company XXXVIII LLC | 1,730 | 1,622 | ||||||
F-98
Monthly average contracts: | Bought | Sold | ||||||
Frontier Trading Company I LLC | 10,431 | 10,301 | ||||||
Frontier Trading Company II LLC | 1,658 | 1,626 | ||||||
Frontier Trading Company VII, LLC | 11,107 | 11,212 | ||||||
Frontier Trading Company XIV, LLC | 3,156 | 3,140 | ||||||
Frontier Trading Company XV, LLC | 4,102 | 4,066 | ||||||
Frontier Trading Company XXIII, LLC | 1,981 | 1,952 | ||||||
Frontier Trading Company XXIX, LLC | 42 | 22 | ||||||
Frontier Trading Company XXXIV, LLC | 1,936 | 1,938 | ||||||
Frontier Trading Company XXXVIII, LLC | 1,730 | 1,622 | ||||||
For The Year Ended December 31, 2013Table of Contents
Monthly average contracts: | Bought | Sold | ||||||
Frontier Trading Company I LLC | 13,344 | 13,477 | ||||||
Frontier Trading Company II LLC | 1,951 | 2,039 | ||||||
Frontier Trading Company V LLC | 623 | 771 | ||||||
Frontier Trading Company VII, LLC | 11,664 | 11,995 | ||||||
Frontier Trading Company XIV, LLC | 14,726 | 15,608 | ||||||
Frontier Trading Company XV, LLC | 5,432 | 5,459 | ||||||
Frontier Trading Company XVIII, LLC | 356 | 404 | ||||||
Frontier Trading Company XXIII, LLC | 1,834 | 1,778 | ||||||
Frontier Trading Company XXXVIII, LLC | 435 | 534 | ||||||
The following tables summarize the trading revenues for the years ended December 31, 2014, 20132016, 2015 and 2012,2014, approximately by sector:
Realized Trading Revenue from Futures, Forwards, and Options
for the Year Ended December 31, 20142016(2)(1)
| Frontier Trading | Frontier Trading | Frontier Trading | Frontier Trading | |||||||||||||||||||||||||
Type of contract | Frontier Trading Company I LLC | Frontier Trading Company II LLC | Frontier Trading Company VII, LLC | |||||||||||||||||||||||||
| Type of Contract | Company I LLC | Company II LLC | Company VII LLC | Company XIV LLC | ||||||||||||||||||||||||
Metals | $ | (437,457 | ) | $ | 170,841 | $ | 690,535 | $ | (570,904 | ) | $ | (2,388,857 | ) | $ | (2,735,981 | ) | $ | 15,680 | ||||||||||
Currencies | 1,750,349 | 3,665,521 | 2,527,403 | (1,134,947 | ) | 2,449,081 | (333,855 | ) | 180,074 | |||||||||||||||||||
Energies | 1,194,230 | 5,800,067 | (3,255,197 | ) | (540,962 | ) | (1,997,815 | ) | 1,426,316 | 173,411 | ||||||||||||||||||
Agriculturals | 1,309,078 | (1,089,242 | ) | (158,431 | ) | (793,888 | ) | (645,570 | ) | 634,825 | (128,046 | ) | ||||||||||||||||
Interest rates | 10,676,345 | 12,258,469 | 123,894 | 6,698,984 | 3,484,057 | (342,396 | ) | 1,341,209 | ||||||||||||||||||||
Stock indices | 3,172,068 | 1,689,346 | 219,589 | 1,051,934 | (282,419 | ) | (128,497 | ) | (462,833 | ) | ||||||||||||||||||
|
|
| ||||||||||||||||||||||||||
Realized trading income/(loss) (2) | $ | 17,664,613 | $ | 22,495,002 | $ | 147,793 | ||||||||||||||||||||||
| Realized trading income/(loss)(1) | $ | 4,710,217 | $ | 618,478 | $ | (1,479,588 | ) | $ | 1,119,495 | |||||||||||||||||||
|
|
| ||||||||||||||||||||||||||
| Frontier Trading | Frontier Trading | Frontier Trading | Frontier Trading | |||||||||||||||||||||||||
Type of contract | Frontier Trading Company XIV, LLC | Frontier Trading Company XV, LLC | Frontier Trading Company XXIII, LLC (3) | |||||||||||||||||||||||||
| Type of Contract | Company XV LLC | Company XXIII LLC | Company XXIX LLC | Company XXXVIII LLC | ||||||||||||||||||||||||
Metals | $ | (882,227 | ) | $ | 575,380 | $ | (217,610 | ) | $ | (410,694 | ) | $ | 125,165 | $ | (8,260 | ) | $ | (496,363 | ) | |||||||||
Currencies | 2,737,165 | 1,090,109 | 1,160,826 | 885,773 | (661,239 | ) | 5,174 | (1,715,921 | ) | |||||||||||||||||||
Energies | 237,904 | 561,158 | (605,056 | ) | (341,104 | ) | (403,582 | ) | (54,266 | ) | 33,941 | |||||||||||||||||
Agriculturals | 829,935 | 949,454 | ��� | (239,338 | ) | — | 4,630 | (188,884 | ) | |||||||||||||||||||
Interest rates | 3,297,947 | 2,379,839 | 5,823,668 | 1,821,478 | 3,627,111 | 154,416 | (1,732,861 | ) | ||||||||||||||||||||
Stock indices | (1,068,847 | ) | (875,183 | ) | 667,519 | 375,929 | (660,900 | ) | 41,389 | (541,633 | ) | |||||||||||||||||
|
|
| ||||||||||||||||||||||||||
Realized trading income/(loss) (2) | $ | 5,151,877 | $ | 4,680,757 | $ | 6,829,347 | ||||||||||||||||||||||
|
|
| ||||||||||||||||||||||||||
Type of contract | Frontier Trading Company XXIX, LLC (5) | Frontier Trading Company XXXIV, LLC | Frontier Trading Company XXXVIII, LLC | |||||||||||||||||||||||||
Metals | $ | (52,470 | ) | $ | 7,721 | $ | (111,695 | ) | ||||||||||||||||||||
Currencies | (94,092 | ) | (261,257 | ) | 5,323,603 | |||||||||||||||||||||||
Energies | (358,642 | ) | 180 | 408,068 | ||||||||||||||||||||||||
Agriculturals | (24,200 | ) | — | (248,904 | ) | |||||||||||||||||||||||
Interest rates | 138,650 | — | (5,722,822 | ) | ||||||||||||||||||||||||
Stock indices | 80,496 | (1,806,979 | ) | 1,968,275 | ||||||||||||||||||||||||
|
|
| ||||||||||||||||||||||||||
Realized trading income/(loss) (2) | (310,258 | ) | (2,060,335 | ) | 1,616,525 | |||||||||||||||||||||||
|
|
| ||||||||||||||||||||||||||
| Realized trading income/(loss)(1) | $ | 2,092,044 | $ | 2,026,555 | $ | 143,083 | $ | (4,641,720 | ) | |||||||||||||||||||
Unrealized Trading Revenue from Futures, Forwards, and Options
for the Year Ended December 31, 2014 (1)2016(2)
| Frontier Trading | Frontier Trading | Frontier Trading | Frontier Trading | |||||||||||||||||||||||||
Type of contract | Frontier Trading Company I LLC | Frontier Trading Company II LLC | Frontier Trading Company VII, LLC | |||||||||||||||||||||||||
| Type of Contract | Company I LLC | Company II LLC | Company VII LLC | Company XIV LLC | ||||||||||||||||||||||||
Metals | $ | (111,947 | ) | $ | (379,502 | ) | $ | (67,120 | ) | $ | (16,549 | ) | $ | (577,784 | ) | $ | 2,998,383 | $ | (36,385 | ) | ||||||||
Currencies | 365,702 | (685,924 | ) | 90,671 | (695,645 | ) | 147,840 | (34,630 | ) | (68,823 | ) | |||||||||||||||||
Energies | 389,322 | 526,450 | 410,565 | 109,673 | (165,261 | ) | 3,264,774 | 87,766 | ||||||||||||||||||||
Agriculturals | (89,486 | ) | (281,100 | ) | 967,983 | 8,545 | 105,158 | 169,070 | (2,760 | ) | ||||||||||||||||||
Interest rates | 1,577,387 | 2,337,987 | (432,162 | ) | 43,332 | 699,717 | (2,272 | ) | 55,947 | |||||||||||||||||||
Stock indices | (946,046 | ) | (2,365,920 | ) | (409,378 | ) | 293,774 | 311,568 | 42,046 | (70,230 | ) | |||||||||||||||||
|
|
| ||||||||||||||||||||||||||
Unrealized trading income/(loss) (1) | $ | 1,184,932 | $ | (848,009 | ) | $ | 560,559 | |||||||||||||||||||||
| Unrealized trading income/(loss)(2) | $ | (256,870 | ) | $ | 521,238 | $ | 6,437,371 | $ | (34,485 | ) | ||||||||||||||||||
|
|
| ||||||||||||||||||||||||||
| Frontier Trading | Frontier Trading | Frontier Trading | Frontier Trading | |||||||||||||||||||||||||
Type of contract | Frontier Trading Company XIV, LLC | Frontier Trading Company XV, LLC | Frontier Trading Company XXIII, LLC (3) | |||||||||||||||||||||||||
| Type of Contract | Company XV LLC | Company XXIII LLC | Company XXIX LLC | Company XXXVIII LLC | ||||||||||||||||||||||||
Metals | $ | 164,178 | $ | (593,950 | ) | $ | 20,878 | $ | (97,042 | ) | $ | (4,280 | ) | $ | 10,744 | $ | (62,455 | ) | ||||||||||
Currencies | (743,778 | ) | (1,724,126 | ) | (278,910 | ) | 244,511 | (118,177 | ) | (38,876 | ) | (270,069 | ) | |||||||||||||||
Energies | 873,446 | 875,619 | 2,817 | (457,543 | ) | 61,323 | (10,686 | ) | 2,020 | |||||||||||||||||||
Agriculturals | (28,250 | ) | (53,695 | ) | — | (47,280 | ) | — | 40,435 | 146,494 | ||||||||||||||||||
Interest rates | 371,048 | 464,025 | 1,653,065 | 435,147 | 80,695 | 5,426 | 52,293 | |||||||||||||||||||||
Stock indices | (317,959 | ) | (417,885 | ) | (572,090 | ) | 122,797 | 8,145 | (11,793 | ) | 52,098 | |||||||||||||||||
|
|
| ||||||||||||||||||||||||||
Unrealized trading income/(loss) (1) | $ | 318,685 | $ | (1,450,012 | ) | $ | 825,760 | |||||||||||||||||||||
|
|
| ||||||||||||||||||||||||||
Type of contract | Frontier Trading Company XXIX, LLC (5) | Frontier Trading Company XXXIV, LLC | Frontier Trading Company XXXVIII, LLC (4) | |||||||||||||||||||||||||
Metals | $ | (41,409 | ) | $ | — | $ | (53,485 | ) | ||||||||||||||||||||
Currencies | 9,969 | — | (285,427 | ) | ||||||||||||||||||||||||
Energies | (322,182 | ) | — | 65,813 | ||||||||||||||||||||||||
Agriculturals | (18,006 | ) | — | (111,612 | ) | |||||||||||||||||||||||
Interest rates | 61,567 | — | (1,228,893 | ) | ||||||||||||||||||||||||
Stock indices | 30,221 | — | (537,869 | ) | ||||||||||||||||||||||||
|
|
| ||||||||||||||||||||||||||
Unrealized trading income/(loss) (1) | (279,840 | ) | — | (2,151,473 | ) | |||||||||||||||||||||||
|
|
| ||||||||||||||||||||||||||
| Unrealized trading income/(loss)(2) | $ | 200,590 | $ | 27,706 | $ | (4,750 | ) | $ | (79,619 | ) | ||||||||||||||||||
| (1) | In the |
| (2) | In the Statement of Operations under net change in open trade equity |
F-99
Realized Trading Revenue from Futures, Forwards and Options
for the Year Ended December 31, 2013 (2)2015(1)
| Frontier Trading | Frontier Trading | Frontier Trading | Frontier Trading | |||||||||||||||||||||||||||||
Type of contract | Frontier Trading Company I LLC | Frontier Trading Company II LLC | Frontier Trading Company V LLC | Frontier Trading Company VII, LLC | Company I LLC | Company II LLC | Company VII, LLC | Company XIV, LLC | ||||||||||||||||||||||||
Metals | $ | 412,573 | $ | 1,614,525 | $ | (177,747 | ) | $ | (1,480,598 | ) | $ | 638,640 | $ | 412,683 | $ | 2,770,377 | $ | (173,565 | ) | |||||||||||||
Currencies | (814,671 | ) | 3,701,872 | 1,296,788 | 790,928 | 1,473,437 | (346,462 | ) | 572,927 | (1,062,588 | ) | |||||||||||||||||||||
Energies | (2,799,303 | ) | (2,918,095 | ) | (1,334,769 | ) | (4,910,183 | ) | 3,075,926 | 3,898,848 | 13,476,409 | 1,755,803 | ||||||||||||||||||||
Agriculturals | (2,421,228 | ) | 2,015,773 | 471,906 | 341,441 | (618,275 | ) | 295,065 | 1,146,162 | (308,178 | ) | |||||||||||||||||||||
Interest rates | 2,423,384 | (7,118,246 | ) | (757,720 | ) | 598,983 | 4,813,887 | 4,204,957 | (803,460 | ) | 767,420 | |||||||||||||||||||||
Stock indices | 4,755,435 | 13,887,786 | 6,411,757 | 1,459,036 | 2,273,642 | (1,544,747 | ) | 173,194 | (850,694 | ) | ||||||||||||||||||||||
|
|
|
| |||||||||||||||||||||||||||||
Realized trading income/(loss) (2) | $ | 1,556,190 | $ | 11,183,615 | $ | 5,910,215 | $ | (3,200,393 | ) | |||||||||||||||||||||||
|
|
|
| |||||||||||||||||||||||||||||
Type of contract | Frontier Trading Company XIV, LLC | Frontier Trading Company XV, LLC | Frontier Trading Company XVIII, LLC (3) | Frontier Trading Company XXIII, LLC (3) | ||||||||||||||||||||||||||||
Metals | $ | 6,112,168 | $ | (493,033 | ) | $ | (247,744 | ) | $ | (322,627 | ) | |||||||||||||||||||||
Currencies | (19,294,266 | ) | (79,489 | ) | (51,616 | ) | 40,582 | |||||||||||||||||||||||||
Energies | (2,176,306 | ) | (927,698 | ) | (237,383 | ) | (252,872 | ) | ||||||||||||||||||||||||
Agriculturals | (705,599 | ) | (618,122 | ) | (337,113 | ) | (292,693 | ) | ||||||||||||||||||||||||
Interest rates | (22,508,513 | ) | (1,567,281 | ) | (571,998 | ) | (1,305,716 | ) | ||||||||||||||||||||||||
Stock indices | 12,638,587 | 3,519,159 | 703,216 | 958,376 | ||||||||||||||||||||||||||||
|
|
|
| |||||||||||||||||||||||||||||
Realized trading income/(loss) (2) | $ | (25,933,929 | ) | $ | (166,464 | ) | $ | (742,638 | ) | $ | (1,174,950 | ) | ||||||||||||||||||||
|
|
|
| |||||||||||||||||||||||||||||
Type of contract | Frontier Trading Company XXXVIII, LLC (3) | |||||||||||||||||||||||||||||||
Metals | $ | 45,320 | ||||||||||||||||||||||||||||||
Currencies | 1,639,963 | |||||||||||||||||||||||||||||||
Energies | (894,269 | ) | ||||||||||||||||||||||||||||||
Agriculturals | (604,553 | ) | ||||||||||||||||||||||||||||||
Interest rates | (271,753 | ) | ||||||||||||||||||||||||||||||
Stock indices | 209,465 | |||||||||||||||||||||||||||||||
| ||||||||||||||||||||||||||||||||
Realized trading income/(loss) (2) | $ | 124,173 | ||||||||||||||||||||||||||||||
| ||||||||||||||||||||||||||||||||
| Realized trading income/(loss)(1) | $ | 11,657,257 | $ | 6,920,344 | $ | 17,335,609 | $ | 128,198 | ||||||||||||||||||||||||
| Frontier Trading | Frontier Trading | Frontier Trading | Frontier Trading | |||||||||||||
| Type of contract | Company XV, LLC | Company XXIII, LLC | Company XXIX, LLC | Company XXXIV, LLC | ||||||||||||
| Metals | $ | 318,485 | $ | (321,260 | ) | $ | (680,920 | ) | $ | (2,157 | ) | |||||
| Currencies | (1,140,254 | ) | (349,146 | ) | (68,374 | ) | 31,785 | |||||||||
| Energies | 2,554,164 | 685,793 | (755,954 | ) | — | |||||||||||
| Agriculturals | (430,338 | ) | — | (405,228 | ) | — | ||||||||||
| Interest rates | 466,376 | 1,569,067 | (162,699 | ) | (69,996 | ) | ||||||||||
| Stock indices | (383,176 | ) | 398,225 | 261,267 | (423,235 | ) | ||||||||||
| Realized trading income/(loss)(1) | $ | 1,385,257 | $ | 1,982,679 | (1,811,908 | ) | (463,603 | ) | ||||||||
| Frontier Trading | ||||
| Type of contract | Company XXXVIII, LLC | |||
| Metals | $ | (146,993 | ) | |
| Currencies | 776,564 | |||
| Energies | (702,562 | ) | ||
| Agriculturals | (755,577 | ) | ||
| Interest rates | (2,939,346 | ) | ||
| Stock indices | 1,351,855 | |||
| Realized trading income/(loss)(1) | (2,416,059 | ) | ||
Unrealized Trading Revenue from Futures, Forwards and Options
for the Year Ended December 31, 2013 (1)2015(2)
| Frontier Trading | Frontier Trading | Frontier Trading | Frontier Trading | |||||||||||||||||||||||||||||
Type of contract | Frontier Trading Company I LLC | Frontier Trading Company II LLC | Frontier Trading Company V LLC | Frontier Trading Company VII, LLC | Company I LLC | Company II LLC | Company VII, LLC | Company XIV, LLC | ||||||||||||||||||||||||
Metals | $ | 1,212,080 | $ | 1,436,076 | $ | 366,938 | $ | (8,186,850 | ) | $ | 225,190 | $ | 342,136 | $ | (3,034,728 | ) | $ | 134,618 | ||||||||||||||
Currencies | 104,438 | (898,048 | ) | (374,472 | ) | 2,874,502 | (346,776 | ) | (77,235 | ) | (166,305 | ) | 334,553 | |||||||||||||||||||
Energies | (289,840 | ) | 107,134 | 136,348 | (21,526,796 | ) | (487,009 | ) | (369,441 | ) | (9,809,446 | ) | (950,395 | ) | ||||||||||||||||||
Agriculturals | (63,428 | ) | 515,298 | (190,376 | ) | 7,375,646 | 28,013 | 51,330 | 115,115 | (4,647 | ) | |||||||||||||||||||||
Interest rates | (1,483,357 | ) | (1,007,888 | ) | (97,299 | ) | 17,321,998 | (1,490,244 | ) | (2,060,991 | ) | 740,922 | (437,886 | ) | ||||||||||||||||||
Stock indices | 2,905,375 | 2,669,283 | (1,152,310 | ) | 5,780,441 | 878,018 | (759,504 | ) | 122,840 | (66,627 | ) | |||||||||||||||||||||
|
|
|
| |||||||||||||||||||||||||||||
Unrealized trading income/(loss) (1) | $ | 2,385,268 | $ | 2,821,855 | $ | (1,311,171 | ) | $ | 3,638,941 | |||||||||||||||||||||||
|
|
|
| |||||||||||||||||||||||||||||
Type of contract | Frontier Trading Company XIV, LLC | Frontier Trading Company XV, LLC | Frontier Trading Company XVIII, LLC (3) | Frontier Trading Company XXIII, LLC (3) | ||||||||||||||||||||||||||||
Metals | $ | 874,183 | $ | 1,897,220 | $ | 24,089 | $ | 40,362 | ||||||||||||||||||||||||
Currencies | 1,309,342 | 2,953,457 | (48,985 | ) | 364,150 | |||||||||||||||||||||||||||
Energies | (1,070,845 | ) | (558,216 | ) | 1,489 | (58,852 | ) | |||||||||||||||||||||||||
Agriculturals | 255,624 | 556,112 | 40,202 | (224,679 | ) | |||||||||||||||||||||||||||
Interest rates | 502,102 | (233,344 | ) | (39,175 | ) | (978,553 | ) | |||||||||||||||||||||||||
Stock indices | 956,215 | (731,655 | ) | (63,280 | ) | 694,236 | ||||||||||||||||||||||||||
|
|
|
| |||||||||||||||||||||||||||||
Unrealized trading income/(loss) (1) | $ | 2,826,621 | $ | 3,883,574 | $ | (85,660 | ) | $ | (163,336 | ) | ||||||||||||||||||||||
|
|
|
| |||||||||||||||||||||||||||||
Type of contract | Frontier Trading Company XXXVIII, LLC (3) | |||||||||||||||||||||||||||||||
Metals | $ | 105,975 | ||||||||||||||||||||||||||||||
Currencies | 1,089,489 | |||||||||||||||||||||||||||||||
Energies | 35,080 | |||||||||||||||||||||||||||||||
Agriculturals | 265,629 | |||||||||||||||||||||||||||||||
Interest rates | 1,233,037 | |||||||||||||||||||||||||||||||
Stock indices | 791,078 | |||||||||||||||||||||||||||||||
| ||||||||||||||||||||||||||||||||
Unrealized trading income/(loss) (1) | $ | 3,520,288 | ||||||||||||||||||||||||||||||
| ||||||||||||||||||||||||||||||||
| Unrealized trading income/(loss)(2) | $ | (1,192,808 | ) | $ | (2,873,705 | ) | $ | (12,031,602 | ) | $ | (990,384 | ) | ||||||||||||||||||||
| Frontier Trading | Frontier Trading | Frontier Trading | Frontier Trading | |||||||||||||
| Type of contract | Company XV, LLC | Company XXIII, LLC | Company XXIX, LLC | Company XXXVIII, LLC | ||||||||||||
| Metals | $ | 341,471 | $ | (66,888 | ) | $ | 30,664 | $ | 5,425 | |||||||
| Currencies | 72,012 | (39,897 | ) | 28,909 | (466,640 | ) | ||||||||||
| Energies | (87,414 | ) | (38,274 | ) | 332,868 | (104,322 | ) | |||||||||
| Agriculturals | (193,258 | ) | — | (22,429 | ) | (195,062 | ) | |||||||||
| Interest rates | (1,031,166 | ) | (705,395 | ) | (66,993 | ) | (15,968 | ) | ||||||||
| Stock indices | (298,164 | ) | (70,857 | ) | (18,428 | ) | (287,597 | ) | ||||||||
| Unrealized trading income/(loss)(2) | $ | (1,196,519 | ) | $ | (921,311 | ) | 284,591 | (1,064,164 | ) | |||||||
| (1) | In the |
| (2) | In the Statement of Operations under net change in open trade equity |
F-100
Realized Trading Revenue from Futures, Forwards and Options
for the Year Ended December 31, 2012 (2)2014(1)
| Frontier Trading | Frontier Trading | Frontier Trading | Frontier Trading | |||||||||||||||||||||||||||||
Type of contract | Frontier Trading Company I LLC | Frontier Trading Company II LLC | Frontier Trading Company III LLC | Frontier Trading Company V LLC | Company I LLC | Company II LLC | Company VII, LLC | Company XIV, LLC | ||||||||||||||||||||||||
Metals | $ | 1,073,536 | $ | (695,515 | ) | $ | — | $ | (876,030 | ) | $ | (437,457 | ) | $ | 170,841 | $ | 690,535 | $ | (882,227 | ) | ||||||||||||
Currencies | (72,453 | ) | (849,000 | ) | — | (600,627 | ) | 1,750,349 | 3,665,521 | 2,527,403 | 2,737,165 | |||||||||||||||||||||
Energies | 2,139,250 | (1,973,402 | ) | — | (2,772,182 | ) | 1,194,230 | 5,800,067 | (3,255,197 | ) | 237,904 | |||||||||||||||||||||
Agriculturals | 2,206,100 | (407,523 | ) | — | (162,926 | ) | 1,309,078 | (1,089,242 | ) | (158,431 | ) | 829,935 | ||||||||||||||||||||
Interest rates | (5,962,492 | ) | 3,312,713 | — | 4,162,463 | 10,676,345 | 12,258,469 | 123,894 | 3,297,947 | |||||||||||||||||||||||
Stock indices | (955,723 | ) | (929,218 | ) | — | (2,547,143 | ) | 3,172,068 | 1,689,346 | 219,589 | (1,068,847 | ) | ||||||||||||||||||||
|
|
|
| |||||||||||||||||||||||||||||
Realized trading income/(loss) (2) | $ | (1,571,782 | ) | $ | (1,541,945 | ) | $ | — | $ | (2,796,445 | ) | |||||||||||||||||||||
|
|
|
| |||||||||||||||||||||||||||||
Type of contract | Frontier Trading Company VI LLC | Frontier Trading Company VII, LLC | Frontier Trading Company IX, LLC | Frontier Trading Company XIV, LLC | ||||||||||||||||||||||||||||
Metals | $ | — | $ | (2,477,120 | ) | $ | (484,830 | ) | $ | (346,874 | ) | |||||||||||||||||||||
Currencies | — | (58,199 | ) | (1,170,545 | ) | 11,551,738 | ||||||||||||||||||||||||||
Energies | — | (12,210,665 | ) | 151,181 | (7,771,337 | ) | ||||||||||||||||||||||||||
Agriculturals | — | (15,890,742 | ) | 249,196 | (585,742 | ) | ||||||||||||||||||||||||||
Interest rates | — | 3,335,233 | (457,977 | ) | 31,443,188 | |||||||||||||||||||||||||||
Stock indices | — | (792,785 | ) | 1,123,927 | 2,004,526 | |||||||||||||||||||||||||||
|
|
|
| |||||||||||||||||||||||||||||
Realized trading income/(loss) (2) | $ | — | $ | (28,094,277 | ) | $ | (589,048 | ) | $ | 36,295,498 | ||||||||||||||||||||||
|
|
|
| |||||||||||||||||||||||||||||
Type of contract | Frontier Trading Company XV, LLC | Frontier Trading Company XVIII, LLC (3) | Frontier Trading Company XXI, LLC (4) | Frontier Trading Company XXIII, LLC (4) | ||||||||||||||||||||||||||||
Metals | $ | (6,722,059 | ) | $ | 201,264 | $ | (699,089 | ) | $ | (684,083 | ) | |||||||||||||||||||||
Currencies | (2,596,001 | ) | 35,336 | 207,262 | 483,754 | |||||||||||||||||||||||||||
Energies | 552,102 | 468,349 | (6,108,999 | ) | (723,685 | ) | ||||||||||||||||||||||||||
Agriculturals | 1,715,864 | 114,163 | (769,265 | ) | (1,553,978 | ) | ||||||||||||||||||||||||||
Interest rates | (162,664 | ) | (667,998 | ) | 8,930,606 | 5,186 | ||||||||||||||||||||||||||
Stock indices | (1,340,616 | ) | 496,617 | 263,198 | 164,494 | |||||||||||||||||||||||||||
|
|
|
| |||||||||||||||||||||||||||||
Realized trading income/(loss) (2) | $ | (8,553,374 | ) | $ | 647,731 | $ | 1,823,712 | $ | (2,308,312 | ) | ||||||||||||||||||||||
|
|
|
| |||||||||||||||||||||||||||||
| Realized trading income/(loss)(1) | $ | 17,664,613 | $ | 22,495,002 | $ | 147,793 | $ | 5,151,877 | ||||||||||||||||||||||||
| Frontier Trading | Frontier Trading | Frontier Trading | Frontier Trading | |||||||||||||
| Type of contract | Company XV, LLC | Company XXIII, LLC | Company XXIX, LLC | Company XXXIV, LLC | ||||||||||||
| Metals | $ | 575,380 | $ | (217,610 | ) | $ | (52,470 | ) | $ | 7,721 | ||||||
| Currencies | 1,090,109 | 1,160,826 | (94,092 | ) | (261,257 | ) | ||||||||||
| Energies | 561,158 | (605,056 | ) | (358,642 | ) | 180 | ||||||||||
| Agriculturals | 949,454 | — | (24,200 | ) | — | |||||||||||
| Interest rates | 2,379,839 | 5,823,668 | 138,650 | — | ||||||||||||
| Stock indices | (875,183 | ) | 667,519 | 80,496 | (1,806,979 | ) | ||||||||||
| Realized trading income/(loss)(1) | $ | 4,680,757 | $ | 6,829,347 | $ | (310,258 | ) | $ | (2,060,335 | ) | ||||||
| Frontier Trading | ||||
| Type of contract | Company XXXVIII, LLC | |||
| Metals | $ | (111,695 | ) | |
| Currencies | 5,323,603 | |||
| Energies | 408,068 | |||
| Agriculturals | (248,904 | ) | ||
| Interest rates | (5,722,822 | ) | ||
| Stock indices | 1,968,275 | |||
| Realized trading income/(loss)(1) | $ | 1,616,525 | ||
Unrealized Trading Revenue from Futures, Forwards and Options
for the Year Ended December 31, 2012 (1)2014(2)
| Frontier Trading | Frontier Trading | Frontier Trading | Frontier Trading | |||||||||||||||||||||||||||||
Type of contract | Frontier Trading Company I LLC | Frontier Trading Company II LLC | Frontier Trading Company III LLC | Frontier Trading Company V LLC | Company I LLC | Company II LLC | Company VII, LLC | Company XIV, LLC | ||||||||||||||||||||||||
Metals | $ | (110,769 | ) | $ | 711,013 | $ | — | $ | 45,401 | $ | (111,947 | ) | $ | (379,502 | ) | $ | (67,120 | ) | $ | 164,178 | ||||||||||||
Currencies | 61,955 | (3,426,750 | ) | — | (87,190 | ) | 365,702 | (685,924 | ) | 90,671 | (743,778 | ) | ||||||||||||||||||||
Energies | 67,588 | (304,706 | ) | — | (29,494 | ) | 389,322 | 526,450 | 410,565 | 873,446 | ||||||||||||||||||||||
Agriculturals | (132,871 | ) | 665,339 | — | (489 | ) | (89,486 | ) | (281,100 | ) | 967,983 | (28,250 | ) | |||||||||||||||||||
Interest rates | 579,973 | (270,682 | ) | — | 34,505 | 1,577,387 | 2,337,987 | (432,162 | ) | 371,048 | ||||||||||||||||||||||
Stock indices | 252,372 | 86,776 | — | (89,819 | ) | (946,046 | ) | (2,365,920 | ) | (409,378 | ) | (317,959 | ) | |||||||||||||||||||
|
|
|
| |||||||||||||||||||||||||||||
Unrealized trading income/(loss) (1) | $ | 718,247 | $ | (2,539,010 | ) | $ | — | $ | (127,086 | ) | ||||||||||||||||||||||
|
|
|
| |||||||||||||||||||||||||||||
Type of contract | Frontier Trading Company VI LLC | Frontier Trading Company VII, LLC | Frontier Trading Company IX, LLC | Frontier Trading Company XIV, LLC | ||||||||||||||||||||||||||||
Metals | $ | — | $ | 433,960 | $ | (468,789 | ) | $ | (2,409,225 | ) | ||||||||||||||||||||||
Currencies | — | 476,938 | (1,233,551 | ) | 1,126,149 | |||||||||||||||||||||||||||
Energies | — | 25,156,302 | 199,498 | 1,813,680 | ||||||||||||||||||||||||||||
Agriculturals | — | (8,633,169 | ) | 287,054 | (606,400 | ) | ||||||||||||||||||||||||||
Interest rates | — | 2,344,677 | (405,079 | ) | (2,916,232 | ) | ||||||||||||||||||||||||||
Stock indices | — | 2,937,680 | 1,176,098 | 1,110,540 | ||||||||||||||||||||||||||||
|
|
|
| |||||||||||||||||||||||||||||
Unrealized trading income/(loss) (1) | $ | — | $ | 22,716,388 | $ | (444,768 | ) | $ | (1,881,488 | ) | ||||||||||||||||||||||
|
|
|
| |||||||||||||||||||||||||||||
Type of contract | Frontier Trading Company XV, LLC | Frontier Trading Company XVIII, LLC (3) | Frontier Trading Company XXI, LLC (4) | Frontier Trading Company XXIII, LLC (4) | ||||||||||||||||||||||||||||
Metals | $ | 752,043 | $ | 5,971,843 | $ | (28,353 | ) | $ | 817,959 | |||||||||||||||||||||||
Currencies | 579,363 | 6,876,046 | 81,807 | (636,313 | ) | |||||||||||||||||||||||||||
Energies | �� | 556,669 | 5,538,479 | (599,044 | ) | 161,761 | ||||||||||||||||||||||||||
Agriculturals | (435,339 | ) | (7,863,600 | ) | 148,522 | (826,559 | ) | |||||||||||||||||||||||||
Interest rates | (810,952 | ) | 4,841,656 | 133,585 | 359,082 | |||||||||||||||||||||||||||
Stock indices | 622,132 | (15,874,956 | ) | (528,891 | ) | 355,251 | ||||||||||||||||||||||||||
|
|
|
| |||||||||||||||||||||||||||||
Unrealized trading income/(loss) (1) | $ | 1,263,916 | $ | (510,533 | ) | $ | (792,373 | ) | $ | 231,181 | ||||||||||||||||||||||
|
|
|
| |||||||||||||||||||||||||||||
| Unrealized trading income/(loss)(2) | $ | 1,184,932 | $ | (848,009 | ) | $ | 560,559 | $ | 318,685 | |||||||||||||||||||||||
| Frontier Trading | Frontier Trading | Frontier Trading | Frontier Trading | |||||||||||||
| Type of contract | Company XV, LLC | Company XXIII, LLC (3) | Company XXIX, LLC (5) | Company XXXVIII, LLC (4 | ||||||||||||
| Metals | $ | (593,950 | ) | $ | 20,878 | $ | (41,409 | ) | $ | (53,485 | ) | |||||
| Currencies | (1,724,126 | ) | (278,910 | ) | 9,969 | (285,427 | ) | |||||||||
| Energies | 875,619 | 2,817 | (322,182 | ) | 65,813 | |||||||||||
| Agriculturals | (53,695 | ) | — | (18,006 | ) | (111,612 | ) | |||||||||
| Interest rates | 464,025 | 1,653,065 | 61,567 | (1,228,893 | ) | |||||||||||
| Stock indices | (417,885 | ) | (572,090 | ) | 30,221 | (537,869 | ) | |||||||||
| Unrealized trading income/(loss)(2) | $ | (1,450,012 | ) | $ | 825,760 | $ | (279,840 | ) | $ | (2,151,473 | ) | |||||
| (1) | In the |
| (2) | In the Statement of Operations under net change in open trade equity |
F-101
Certain financial instruments and derivative instruments are eligible for offset in the statements of financial condition under GAAP. The Series’ open trade equity/(deficit), options written, and receivables from futures commissioncommissions merchants (each, an “FCM”) are subject to master netting arrangements and collateral arrangements and meet the U.S. GAAP guidance to qualify for offset. A master netting arrangement with a counterparty creates a right of offset for amounts due to and from that same counterparty that is enforceable in the event of a default or bankruptcy. The Series’ policy is to recognize amounts subject to master netting arrangements on a net basis on the statements of financial condition.
The following tables present gross and net information about the Series’ assets and liabilities subject to master netting arrangements as disclosed on the statements of financial condition as of December 31, 20142016 and 2013.2015.
| Net Amounts of | ||||||||||||||||||||||||
As of December 31, 2014 | Gross Amounts of recognized Derivative Assets | Gross Amounts of recognized Derivative Liabilities | Net Amounts of Derivative Assets and Liabilities Presented in the Statements of Financial Condition | |||||||||||||||||||||
| As of December 31, 2016 | Derivative Assets | |||||||||||||||||||||||
| and Liabilities | ||||||||||||||||||||||||
| Gross Amounts of | Gross Amounts of | Presented in the | ||||||||||||||||||||||
| recognized | recognized Derivative | Statements of | ||||||||||||||||||||||
| Derivative Assets | Liabilities | Financial Condition | ||||||||||||||||||||||
Frontier Trading Company I, LLC | ||||||||||||||||||||||||
Open Trade Equity/(Deficit) | $ | 3,369,866 | $ | (154,661 | ) | $ | 3,215,205 | $ | 515,659 | $ | (277,998 | ) | $ | 237,661 | ||||||||||
Options Written | — | (253,017 | ) | (253,017 | ) | |||||||||||||||||||
Options Purchased | 288,413 | — | $ | 288,413 | ||||||||||||||||||||
Frontier Trading Company II, LLC | ||||||||||||||||||||||||
Open Trade Equity/(Deficit) | $ | 4,029,155 | $ | (555,871 | ) | $ | 3,473,284 | $ | 2,393,850 | $ | (1,171,326 | ) | $ | 1,222,524 | ||||||||||
Frontier Trading Company VII, LLC | ||||||||||||||||||||||||
Open Trade Equity/(Deficit) | $ | 4,471,373 | $ | (1,002,034 | ) | $ | 3,469,339 | |||||||||||||||||
Options Purchased | 8,787,472 | — | 8,787,472 | |||||||||||||||||||||
Options Written | — | (8,710,817 | ) | (8,710,817 | ) | |||||||||||||||||||
Frontier Trading Company XIV, LLC | ||||||||||||||||||||||||
Open Trade Equity/(Deficit) | $ | 1,341,051 | $ | (316,183 | ) | $ | 1,024,868 | |||||||||||||||||
Frontier Trading Company XV, LLC | ||||||||||||||||||||||||
Open Trade Equity/(Deficit) | $ | 2,047,683 | $ | (388,766 | ) | $ | 1,658,917 | $ | 834,176 | $ | (191,682 | ) | $ | 642,494 | ||||||||||
Frontier Trading Company XXIII, LLC | ||||||||||||||||||||||||
Open Trade Equity/(Deficit) | $ | 893,605 | $ | — | $ | 893,605 | ||||||||||||||||||
Frontier Trading Company XXIX, LLC | ||||||||||||||||||||||||
Open Trade Equity/(Deficit) | $ | — | $ | (279,840 | ) | $ | (279,840 | ) | ||||||||||||||||
Frontier Trading Company XXXIV, LLC | ||||||||||||||||||||||||
Swap Contracts | $ | 18,246,955 | $ | — | $ | 18,246,955 | $ | 18,939,450 | $ | — | $ | 18,939,450 | ||||||||||||
Frontier Trading Company XXXV, LLC | ||||||||||||||||||||||||
Swap Contracts | $ | 6,570,409 | $ | — | $ | 6,570,409 | $ | 8,637,847 | $ | — | $ | 8,637,847 | ||||||||||||
Frontier Trading Company XXXVII, LLC | ||||||||||||||||||||||||
Swap Contracts | $ | 3,633,060 | $ | — | $ | 3,633,060 | $ | 4,220,468 | $ | — | $ | 4,220,468 | ||||||||||||
Frontier Trading Company XXXVIII, LLC | ||||||||||||||||||||||||
Open Trade Equity/(Deficit) | $ | 1,369,043 | $ | — | $ | 1,369,043 | ||||||||||||||||||
Frontier Trading Company XXXIX, LLC | ||||||||||||||||||||||||
Swap Contracts | $ | 7,543,966 | $ | — | $ | 7,543,966 | $ | 8,391,414 | $ | — | $ | 8,391,414 | ||||||||||||
F-102
As of December 31, 2013 Frontier Trading Company I, LLC Open Trade Equity/(Deficit) Options Purchased Options Written Swap Contracts Frontier Trading Company II, LLC Open Trade Equity/(Deficit) Frontier Trading Company VII, LLC Open Trade Equity/(Deficit) Options Purchased Options Written Frontier Trading Company XIV, LLC Open Trade Equity/(Deficit) Frontier Trading Company XV, LLC Open Trade Equity/(Deficit) Options Purchased Options Written Frontier Trading Company XXIII, LLC Open Trade Equity/(Deficit) Frontier Trading Company XXXIV, LLC Swap Contracts Frontier Trading Company XXXIX, LLC Swap Contracts Frontier Trading Company XXXV, LLC Swap Contracts Frontier Trading Company XXXVII, LLC Swap Contracts Frontier Trading Company XXXVIII, LLC Open Trade Equity/(Deficit) Gross Amounts
of recognized
Derivative Assets Gross Amounts of
recognized
Derivative Liabilities Net Amounts of
Derivative Assets
and Liabilities
Presented in the
Statements of
Financial
Condition $ 3,162,843 $ — $ 3,162,843 165,983 — 165,983 — (183,932 ) (183,932 ) — $ 4,321,293 $ — $ 4,321,293 $ 227,827 $ (418,896 ) $ (191,069 ) 98,740 — 98,740 — (172,650 ) (172,650 ) $ 706,184 $ — $ 706,184 $ 4,087,038 $ — $ 4,087,038 2,769,147 — 2,769,147 — (865,940 ) (865,940 ) $ 75,237 $ (7,392 ) $ 67,845 $ 10,126,168 $ — $ 10,126,168 $ 7,540,466 $ — $ 7,540,466 $ 3,437,632 $ — $ 3,437,632 $ 2,456,545 $ — $ 2,456,545 $ 3,520,515 $ — $ 3,520,515
| Net Amounts of | ||||||||||||
| As of December 31, 2015 | Derivative Assets | |||||||||||
| and Liabilities | ||||||||||||
| Gross Amounts of | Gross Amounts of | Presented in the | ||||||||||
| recognized | recognized Derivative | Statements of | ||||||||||
| Derivative Assets | Liabilities | Financial Condition | ||||||||||
| Frontier Trading Company I, LLC | ||||||||||||
| Open Trade Equity/(Deficit) | $ | 795,813 | $ | (40,361 | ) | $ | 755,452 | |||||
| Options Purchased | 371,758 | — | 371,758 | |||||||||
| Options Written | — | (165,760 | ) | (165,760 | ) | |||||||
| Frontier Trading Company II, LLC | ||||||||||||
| Open Trade Equity/(Deficit) | $ | 768,117 | $ | (168,538 | ) | $ | 599,579 | |||||
| Frontier Trading Company VII, LLC | ||||||||||||
| Open Trade Equity/(Deficit) | $ | 11,386 | $ | (6,493,885 | ) | $ | (6,482,499 | ) | ||||
| Options Purchased | 154,380 | — | 154,380 | |||||||||
| Frontier Trading Company XIV, LLC | ||||||||||||
| Open Trade Equity/(Deficit) | $ | 34,484 | $ | — | $ | 34,484 | ||||||
| Frontier Trading Company XV, LLC | ||||||||||||
| Open Trade Equity/(Deficit) | $ | 495,021 | $ | (32,681 | ) | $ | 462,340 | |||||
| Frontier Trading Company XXIII, LLC | ||||||||||||
| Open Trade Equity/(Deficit) | $ | 7,381 | $ | (35,087 | ) | $ | (27,706 | ) | ||||
| Frontier Trading Company XXIX, LLC | ||||||||||||
| Open Trade Equity/(Deficit) | $ | 4,750 | $ | — | $ | 4,750 | ||||||
| Frontier Trading Company XXXIV, LLC | ||||||||||||
| Swap Contracts | $ | 19,157,522 | $ | — | $ | 19,157,522 | ||||||
| Frontier Trading Company XXXV, LLC | ||||||||||||
| Swap Contracts | $ | 8,685,850 | $ | — | $ | 8,685,850 | ||||||
| Frontier Trading Company XXXVII, LLC | ||||||||||||
| Swap Contracts | $ | 4,332,427 | $ | — | $ | 4,332,427 | ||||||
| Frontier Trading Company XXXVIII, LLC | ||||||||||||
| Open Trade Equity/(Deficit) | $ | 304,878 | $ | — | $ | 304,878 | ||||||
| Frontier Trading Company XXXIX, LLC | ||||||||||||
| Swap Contracts | $ | 7,960,269 | $ | — | $ | 7,960,269 | ||||||
| 7. |
The purchase and sale of futures and options on futures contracts require margin deposits with futures commission merchants (each, an “FCM”). Additional deposits may be necessary for any loss on contract value. The Commodity Exchange Act requires an FCM to segregate all customer transactions and assets from the FCM’s proprietary activities. A customer’s cash and other property (for example, U.S. Treasury bills) deposited with an FCM are considered commingled with all other customer funds subject to the FCM’s segregation requirements. In the event of an FCM’s insolvency, recovery may be limited to a pro rata share of segregated funds available. It is possible that the recovered amount could be less than the total of cash and other property deposited.
The term “off-balance sheet risk” refers to an unrecorded potential liability that, even though it does not appear on the Statement of Financial Condition, may result in future obligation or loss in excess of the amount paid by the trading Companies for a particular investment. Each Trading Company expects to trade in futures, options, forward and swap contracts and will therefore be a party to financial instruments with elements of off-balance sheet market and credit risk. In entering into these contracts, there exists a market risk that such contracts may be significantly influenced by market conditions, such as interest rate volatility, resulting in such contracts being less valuable. If the markets should move against all of the futures positions held by a Trading Company at the same time, and if the Trading Advisor(s) of such Trading Company are unable to offset such futures interests positions, such Trading Company could lose all of its assets. Management will seek to minimize market risk through real-time monitoring of open positions and the level of diversification of each Trading Advisor’s portfolio. It is anticipated that any Trading Advisor’s margin-to-equity ratio will typically not exceed approximately 35% although the actual ratio could be higher or lower from time to time.
F-103
In addition to market risk, trading futures, forward and swap contracts entails credit risk in that a counterparty will not be able to meet its obligations to a Trading Company. The counterparty for futures contracts traded in the United States and on most foreign exchanges is the clearinghouse associated with such exchange. In general, clearinghouses are backed by the corporate members of the clearinghouse who are required to share any financial burden resulting from the non-performance by one of their members and, as such, should significantly reduce this credit risk. In cases where the clearinghouse is not backed by the clearing members, like some foreign exchanges, it is normally backed by a consortium of banks or other financial institutions. Some non-U.S. exchanges, in contrast to U.S. exchanges, are principals’ markets in which performance is the responsibility only of the individual counterparty with whom the Trading Company has entered into the transaction, and not of the exchange or clearing corporation. In these kinds of markets, there is risk of bankruptcy or other failure or refusal to perform by the counterparty.
In the case of forward contracts traded on the interbank market and swaps, neither is traded on exchanges. The counterparty is generally a single bank or other financial institution, rather than a group of financial institutions; thus there may be a greater counterparty credit risk. Management expects the Trading Advisors to trade only with those counterparties which it believes to be creditworthy. All positions of each Trading Company will be valued each day on a mark-to-market basis. There can be no assurance that any clearing member, clearinghouse or other counterparty will be able to meet its obligations to any Trading Company.
Management has established procedures to actively monitor and minimize market and credit risks. Investors in units of the Equinox Frontier Funds bear the risk of loss only to the extent of the market value of their respective investments and, in certain specific circumstances, distributions and redemptions received.
| 8. |
The Trading Companies have entered into agreements, which provide for the indemnification of futures clearing brokers, currency trading companies, and commodity trading advisers, among others, against losses, costs, claims and liabilities arising from the performance of their individual obligations under such agreements, except for
gross negligence or bad faith. The Trading Companies have had no prior claims or payments pursuant to these agreements. The Trading Companies’ individual maximum exposure under these arrangements is unknown, as this would involve future claims that may be made against the Trading Companies that have not yet occurred. However, based on experience the Trading Companies expect the risk of loss to be remote.
| 9. | Subsequent Events |
On December 5, 2016, Equinox Fund Management, LLC (“Equinox”), Frontier Fund Management LLC (the “New Managing Owner”), and Wakefield Advisors, LLC (“Wakefield”) entered into a Unit Purchase Agreement (the “Agreement”). Equinox was the Managing Owner of the Trust and the Series. Pursuant to the Agreement, Equinox agreed to transfer to the New Managing Owner such amount of Equinox’s General Units (as defined in the Trust Agreement) as the Managing Owner shall be required to hold in its capacity as managing owner of the Trust pursuant to the Trust Agreement, and redeem the remainder of Equinox’s General Units (the “Transaction”).
The Transaction was consummated on March 6, 2017, and upon consummation of the Transaction, the New Managing Owner became the managing owner of the Trust and each Series, in replacement of Equinox. Consequently, consummation of the Transaction constituted a change of control in respect of the Trust and each Series.
In connection with the foregoing, the Trust Agreement was amended to effect certain changes to replace Equinox as the Managing Owner and to reflect the New Managing Owner as the new managing owner. Also, the New Managing Owner has temporarily suspended the sale of Units (as defined in the Trust Agreement) while the Managing Owner engages with the Securities and Exchange Commission to have declared effective a post-effective amendment to the Series’ registration statements, as well as approval by the NFA. The Series will file Form 8-K to announce the resumption of the sale of Units, which the New Managing Owner expects will occur shortly.
The New Managing Owner is seeking to cause the suspension to be lifted as promptly as practicable.
Any forward-looking statements herein are based on expectations of the New Managing Owner at this time. Whether or not actual results and developments will conform to the New Managing Owner’s expectations and predictions, however, is subject to a number of risks and uncertainties, including the special considerations discussed in the Series’ prospectuses, general economic, market and business conditions, changes in laws or regulations or other actions made by governmental authorities or regulatory bodies, and other world economic and political developments. The Series and the New Managing Owner undertake no duty to update or revise any forward-looking statements, whether as a result of new information, future events or otherwise.
F-104
| Galaxy Plus Fund LLC |
| (A Delaware Series Limited Liability Company) |
| The attached annual report is filed under exemption pursuant to |
| Section 4.7 of the regulations under the Commodity Exchange Act. |
| Financial Report |
| December 31, 2016 |
F-105
Independent Auditor’s Report
Board of Directors
Galaxy Plus Fund LLC
Report on the Financial Statements
We have audited the accompanying financial statements of Galaxy Plus Fund – FORT Contrarian Feeder Fund (510) LLC, Galaxy Plus Fund – Emil van Essen STP Feeder Fund (516) LLC, Galaxy Plus Fund – Quest Feeder Fund (517) LLC, Galaxy Plus Fund – Chesapeake Feeder Fund (518) LLC, Galaxy Plus Fund – LRR Feeder Fund (522) LLC, Galaxy Plus Fund – QIM Feeder Fund (526) LLC, Galaxy Plus Fund – Quantmetrics Feeder Fund (527) LLC, Galaxy Plus Fund – Doherty Feeder Fund (528) LLC, Galaxy Plus Fund – Aspect Feeder Fund (532) LLC, and Galaxy Plus Fund – Quest FIT Feeder Fund (535) LLC, (collectively, the Funds) which comprise the statements of financial condition, including the condensed schedules of investments, as of December 31, 2016, and the related statements of operations, and changes in members’ equity for the periods ended December 31, 2016, and the related notes to the financial statements.
Management's Responsibility for the Financial Statements
Management is responsible for the preparation and fair presentation of these financial statements in accordance with accounting principles generally accepted in the United States of America; this includes the design, implementation and maintenance of internal control relevant to the preparation and fair presentation of financial statements that are free from material misstatement, whether due to fraud or error.
Auditor’s Responsibility
Our responsibility is to express an opinion on these financial statements based on our audits. We conducted our audits in accordance with auditing standards generally accepted in the United States of America. Those standards require that we plan and perform the audit to obtain reasonable assurance about whether the financial statements are free from material misstatement.
An audit involves performing procedures to obtain audit evidence about the amounts and disclosures in the financial statements. The procedures selected depend on the auditor’s judgment, including the assessment of the risks of material misstatement of the financial statements, whether due to fraud or error. In making those risk assessments, the auditor considers internal control relevant to the entity’s preparation and fair presentation of the financial statements in order to design audit procedures that are appropriate in the circumstances, but not for the purpose of expressing an opinion on the effectiveness of the entity’s internal control. Accordingly, we express no such opinion. An audit also includes evaluating the appropriateness of accounting policies used and the reasonableness of significant accounting estimates made by management, as well as evaluating the overall presentation of the financial statements.
We believe that the audit evidence we have obtained is sufficient and appropriate to provide a basis for our audit opinion.
F-106
Opinion
In our opinion, the financial statements referred to above present fairly, in all material respects, the financial position of Galaxy Plus Fund – FORT Contrarian Feeder Fund (510) LLC, Galaxy Plus Fund – Emil van Essen STP Feeder Fund (516) LLC, Galaxy Plus Fund – Quest Feeder Fund (517) LLC, Galaxy Plus Fund – Chesapeake Feeder Fund (518) LLC, Galaxy Plus Fund – LRR Feeder Fund (522) LLC, Galaxy Plus Fund – QIM Feeder Fund (526) LLC, Galaxy Plus Fund – Quantmetrics Feeder Fund (527) LLC, Galaxy Plus Fund – Doherty Feeder Fund (528) LLC, Galaxy Plus Fund – Aspect Feeder Fund (532) LLC, and Galaxy Plus Fund – Quest FIT Feeder Fund (535) LLC as of December 31, 2016, and the results of their operations for the periods ended December 31, 2016, in accordance with accounting principles generally accepted in the United States of America.
/s/ RSM US LLP
Denver, Colorado
March 24, 2017
F-107
| Galaxy Plus Fund LLC |
| (A Delaware Series Limited Liability Company) |
| Statements of Financial Condition |
| December 31, 2016 |
| (Expressed in U.S. Dollars) |
| Galaxy Plus | Galaxy Plus | Galaxy Plus | Galaxy Plus | Galaxy Plus | ||||||||||||||||
| Fund LLC - | Fund LLC - | Fund LLC - | Fund LLC - | Fund LLC - | ||||||||||||||||
| 510 Series | 516 Series | 517 Series | 518 Series | 522 Series | ||||||||||||||||
| Assets | ||||||||||||||||||||
| Investment in Master Fund - at fair value | $ | 11,452,916 | $ | 11,651,029 | $ | 3,883,778 | $ | 11,505,482 | $ | 7,717,549 | ||||||||||
| Cash at bank | 481,816 | 10,726 | 1,537 | 3,906 | 5,094 | |||||||||||||||
| Total assets | $ | 11,934,732 | $ | 11,712,495 | $ | 3,885,315 | $ | 11,509,388 | $ | 7,722,643 | ||||||||||
| Liabilities and members’ equity | ||||||||||||||||||||
| Payable to Master Fund | — | $ | — | $ | — | $ | 1,000 | $ | 3,000 | |||||||||||
| Accrued incentive fees | 356 | 103,064 | — | — | 93,653 | |||||||||||||||
| Accrued management fees | 17,974 | 37,679 | 8,474 | 28,050 | 32,345 | |||||||||||||||
| Accrued sponsor fees | 8,819 | 10,197 | 3,478 | 5,987 | 5,148 | |||||||||||||||
| Accrued operating expenses | 2,334 | 466 | 376 | 363 | 1,253 | |||||||||||||||
| Total liabilities | 29,483 | 151,406 | 12,328 | 35,400 | 135,399 | |||||||||||||||
| Members’ equity | 11,905,249 | 11,561,089 | 3,872,987 | 11,473,988 | 7,587,244 | |||||||||||||||
| Total liabilities and members’ equity | $ | 11,934,732 | $ | 11,712,495 | $ | 3,885,315 | $ | 11,509,388 | $ | 7,722,643 | ||||||||||
(continued)
F-108
| Galaxy Plus Fund LLC |
| (A Delaware Series Limited Liability Company) |
| Statements of Financial Condition (continued) |
| December 31, 2016 |
| (Expressed in U.S. Dollars) |
| Galaxy Plus | Galaxy Plus | Galaxy Plus | Galaxy Plus | Galaxy Plus | ||||||||||||||||
| Fund LLC - | Fund LLC - 527 | Fund LLC - | Fund LLC - | Fund LLC - | ||||||||||||||||
| 526 Series | Series | 528 Series | 532 Series | 535 Series | ||||||||||||||||
| Assets | ||||||||||||||||||||
| Investment in Master Fund - at fair value | $ | 21,456,623 | $ | 19,261,458 | $ | 6,557,058 | $ | 4,627,141 | $ | 11,198,960 | ||||||||||
| Cash at bank | 54,433 | 6,707 | 2,470 | 915 | 5,541 | |||||||||||||||
| Total assets | $ | 21,604,203 | $ | 19,268,165 | $ | 6,559,528 | $ | 4,628,056 | $ | 11,204,501 | ||||||||||
| Liabilities and members’ equity | ||||||||||||||||||||
| Payable to Master Fund | $ | — | $ | 1,000 | $ | 1,000 | $ | 1,000 | $ | — | ||||||||||
| Accrued incentive fees | 1,066,204 | — | 21,229 | — | — | |||||||||||||||
| Accrued management fees | 34,263 | 24,782 | 6,535 | 5,148 | 9,396 | |||||||||||||||
| Accrued sponsor fees | 16,530 | 11,886 | 3,267 | 1,287 | 11,284 | |||||||||||||||
| Accrued sales commissions | 76 | — | — | — | — | |||||||||||||||
| Accrued operating expenses | 560 | 344 | 387 | 391 | 417 | |||||||||||||||
| Total liabilities | 1,117,633 | 38,012 | 32,418 | 7,826 | 21,097 | |||||||||||||||
| Members’ equity | 20,486,570 | 19,230,153 | 6,527,110 | 4,620,230 | 11,183,404 | |||||||||||||||
| Total liabilities and members’ equity | $ | 21,604,203 | $ | 19,268,165 | $ | 6,559,528 | $ | 4,628,056 | $ | 11,204,501 | ||||||||||
See notes to financial statements.
F-109
| Galaxy Plus Fund LLC |
| (A Delaware Series Limited Liability Company) |
| Statements of Operations |
| For the periods ended December 31, 2016 |
| (Expressed in U.S. Dollars) |
| Galaxy Plus | Galaxy Plus | Galaxy Plus | Galaxy Plus | Galaxy Plus | ||||||||||||||||
| Fund LLC - | Fund LLC - | Fund LLC - | Fund LLC - | Fund LLC - | ||||||||||||||||
| 510 Series | 516 Series | 517 Series | 518 Series | 522 Series | ||||||||||||||||
| Net investment income (loss) allocated from Master Fund: | ||||||||||||||||||||
| Interest expense | $ | (21 | ) | $ | — | $ | (4,008 | ) | $ | (6,758 | ) | $ | — | |||||||
| Net investment income (loss) allocated from Master Fund | (21 | ) | — | (4,008 | ) | (6,758 | ) | — | ||||||||||||
| Fund expenses: | ||||||||||||||||||||
| Operating expenses | 85 | 4,626 | 3,310 | 3,257 | 13,293 | |||||||||||||||
| Management fee | 183,564 | 313,384 | 62,579 | 206,132 | 246,656 | |||||||||||||||
| Incentive fee | 144,254 | 411,343 | — | 92,986 | 93,653 | |||||||||||||||
| Sponsor fee | 37,681 | 41,273 | 13,559 | 21,808 | 20,365 | |||||||||||||||
| Total fund expenses | 365,584 | 770,626 | 79,448 | 324,183 | 373,967 | |||||||||||||||
| Total net investment loss | (365,605 | ) | (770,626 | ) | (83,456 | ) | (330,941 | ) | (373,967 | ) | ||||||||||
| Realized and unrealized gain (loss) on investments and foreign currency transactions allocated from Master Fund: | ||||||||||||||||||||
| Net realized gain/(loss) from investments and foreign currency transactions | (840,031 | ) | 3,933,951 | (1,753,745 | ) | 409,456 | 104,010 | |||||||||||||
| Net increase/(decrease) in unrealized appreciation(depreciation) on investments and translation of assets and liabilities denominated in foreign currencies | (178,228 | ) | (1,253,066 | ) | 209,587 | (423,735 | ) | 598,204 | ||||||||||||
| Net realized and unrealized gain (loss) on investments and foreign currency transactions allocated from investment in master fund | (1,018,259 | ) | 2,680,885 | (1,544,158 | ) | (14,279 | ) | 702,214 | ||||||||||||
| Net increase (decrease) in members’ equity resulting from operations | $ | (1,383,864 | ) | $ | 1,910,259 | $ | (1,627,614 | ) | $ | (345,220 | ) | $ | 328,247 | |||||||
(continued)
F-110
| Galaxy Plus Fund LLC |
| (A Delaware Series Limited Liability Company) |
| Statements of Operations (continued) |
| For the periods ended December 31, 2016 |
| (Expressed in U.S. Dollars) |
| Galaxy Plus | Galaxy Plus | Galaxy Plus | Galaxy Plus | Galaxy Plus | ||||||||||||||||
| Fund LLC - | Fund LLC - | Fund LLC - | Fund LLC - | Fund LLC - | ||||||||||||||||
| 526 Series | 527 Series | 528 Series | 532 Series | 535 Series | ||||||||||||||||
| Net investment income (loss) allocated from Master Fund: | ||||||||||||||||||||
| Interest expense | $ | (6,967 | ) | $ | (2,843 | ) | $ | — | $ | — | $ | (2,085 | ) | |||||||
| Net investment income (loss) allocated from Master Fund | (6,967 | ) | (2,843 | ) | — | — | (2,085 | ) | ||||||||||||
| Fund expenses: | ||||||||||||||||||||
| Operating expenses | 3,680 | 3,149 | 2,843 | 476 | 1,881 | |||||||||||||||
| Management fee | 192,167 | 161,651 | 34,794 | 5,148 | 31,484 | |||||||||||||||
| Incentive fee | 1,533,714 | — | 52,658 | — | — | |||||||||||||||
| Sponsor fee | 48,638 | 39,624 | 8,809 | 1,287 | 18,890 | |||||||||||||||
| Total fund expenses | 1,778,199 | 204,424 | 99,104 | 6,911 | 52,255 | |||||||||||||||
| Total net investment loss | (1,785,166 | ) | (207,267 | ) | (99,104 | ) | (6,911 | ) | (54,340 | ) | ||||||||||
| Realized and unrealized gain (loss) on investments and foreign currency transactions allocated from Master Fund: | ||||||||||||||||||||
| Net realized gain/(loss) from investments and foreign currency transactions | 6,004,016 | (293,244 | ) | 212,854 | (86,651 | ) | 2,303,603 | |||||||||||||
| Net increase/(decrease) in unrealized appreciation(depreciation) on investments and translation of assets and liabilities denominated in foreign currencies | 325,784 | 822 | 76,775 | (286,208 | ) | 134,141 | ||||||||||||||
| Net realized and unrealized gain (loss) on investments and foreign currency transactions allocated from investment in master fund | 6,329,800 | (292,422 | ) | 289,629 | (372,859 | ) | 2,437,744 | |||||||||||||
| Net increase (decrease) in members’ equity resulting from operations | $ | 4,544,634 | $ | (499,689 | ) | $ | 190,525 | $ | (379,770 | ) | $ | 2,383,404 | ||||||||
See notes to financial statements.
F-111
| Galaxy Plus Fund LLC |
| (A Delaware Series Limited Liability Company) |
| Statements of Changes in Members’ Equity |
| For the periods ended December 31, 2016 |
| (Expressed in U.S. Dollars) |
| Galaxy Plus | Galaxy Plus | Galaxy Plus | Galaxy Plus | Galaxy Plus | ||||||||||||||||
| Fund LLC - | Fund LLC - | Fund LLC - | Fund LLC - | Fund LLC - | ||||||||||||||||
| 510 Series | 516 Series | 517 Series | 518 Series | 522 Series | ||||||||||||||||
| Increase/(decrease) in members’ equity from operations: | ||||||||||||||||||||
| Total net investment income/(loss) | $ | (365,605 | ) | $ | (770,626 | ) | $ | (83,456 | ) | $ | (330,941 | ) | $ | (373,967 | ) | |||||
| Net realized gain/(loss) from investments and foreign currency transactions | (840,031 | ) | 3,933,951 | (1,753,745 | ) | 409,456 | 104,010 | |||||||||||||
| Net increase/(decrease) in unrealized appreciation (depreciation) on investments and translation of assets and liabilities denominated in foreign currencies | (178,228 | ) | (1,253,066 | ) | 209,587 | (423,735 | ) | 598,204 | ||||||||||||
| Net increase/(decrease) in members’ equity resulting from operations | (1,383,864 | ) | 1,910,259 | (1,627,614 | ) | (345,220 | ) | 328,247 | ||||||||||||
| Increase/(decrease) in members’ equity from capital transactions: | ||||||||||||||||||||
| Proceeds from issuance of capital | 15,625,755 | 12,442,497 | 5,500,601 | 11,724,791 | 7,696,404 | |||||||||||||||
| Proceeds from in-kind contributions | — | — | 94,417 | — | ||||||||||||||||
| In-kind assumed derivative liabilities | — | — | — | — | (27,740 | ) | ||||||||||||||
| Payments for redemption of capital | (6,755,636 | ) | (2,791,667 | ) | — | — | (409,667 | ) | ||||||||||||
| Net increase/(decrease) in members’ equity from capital transactions | 8,870,119 | 9,650,830 | 5,500,601 | 11,819,208 | 7,258,997 | |||||||||||||||
| Total net increase/(decrease) in members’ equity | 7,486,255 | 11,561,089 | 3,872,987 | 11,473,988 | 7,587,244 | |||||||||||||||
| Members’ equity, beginning of the period | 4,418,994 | — | — | — | — | |||||||||||||||
| Members’ equity, end of the period | $ | 11,905,249 | $ | 11,561,089 | $ | 3,872,987 | $ | 11,473,988 | $ | 7,587,244 | ||||||||||
(continued)
F-112
| Galaxy Plus Fund LLC |
| (A Delaware Series Limited Liability Company) |
| Statements of Changes in Members’ Equity (continued) |
| For the periods ended December 31, 2016 |
| (Expressed in U.S. Dollars) |
| Galaxy Plus | Galaxy Plus | Galaxy Plus | Galaxy Plus | Galaxy Plus | ||||||||||||||||
| Fund LLC - | Fund LLC - | Fund LLC - | Fund LLC - | Fund LLC - | ||||||||||||||||
| 526 Series | 527 Series | 528 Series | 532 Series | 535 Series | ||||||||||||||||
| Increase/(decrease) in members’ equity from operations: | ||||||||||||||||||||
| Total net investment income/(loss) | $ | (1,785,166 | ) | $ | (207,267 | ) | $ | (99,104 | ) | $ | (6,911 | ) | $ | (54,340 | ) | |||||
| Net realized gain/(loss) from investments and foreign currency transactions | 6,004,016 | (293,244 | ) | 212,854 | (86,651 | ) | 2,303,603 | |||||||||||||
| Net increase/(decrease) in unrealized appreciation (depreciation) on investments and translation of assets and liabilities denominated in foreign currencies | 325,784 | 822 | 76,775 | (286,208 | ) | 134,141 | ||||||||||||||
| Net increase/(decrease) in members’ equity resulting from operations | 4,544,634 | (499,689 | ) | 190,525 | (379,770 | ) | 2,383,404 | |||||||||||||
| Increase/(decrease) in members’ equity from capital transactions: | ||||||||||||||||||||
| Proceeds from issuance of capital | 18,207,797 | 19,729,842 | 6,260,915 | 5,000,000 | 8,800,000 | |||||||||||||||
| Proceeds from in-kind contributions | — | — | 75,670 | — | — | |||||||||||||||
| Payments for redemption of capital | (2,265,861 | ) | — | — | — | — | ||||||||||||||
| Net increase/(decrease) in members’ equity from capital transactions | 15,941,936 | 19,729,842 | 6,336,585 | 5,000,000 | 8,800,000 | |||||||||||||||
| Total net increase/(decrease) in members’ equity | 20,486,570 | 19,230,153 | 6,527,110 | 4,620,230 | 11,183,404 | |||||||||||||||
| Members’ equity, beginning of the period | — | — | — | — | — | |||||||||||||||
| Members’ equity, end of the period | $ | 20,486,570 | $ | 19,230,153 | $ | 6,527,110 | $ | 4,620,230 | $ | 11,183,404 | ||||||||||
See notes to financial statements.
F-113
| Galaxy Plus Fund LLC |
| (A Delaware Series Limited Liability Company) |
| Notes to the Financial Statements |
| Note 1. | Organization and Structure |
Galaxy Plus Fund LLC (the “Onshore Platform”) was formed in Delaware as a series limited liability company on April 14, 2014. The Onshore Platform is part of the Galaxy Plus Managed Account Platform (the “Platform”). Both are sponsored by Gemini Alternatives Funds, LLC (the “Sponsor” or “GAF”) as a means of making available to qualified high net-worth individuals and institutional investors (including fund of hedge funds) (“Investors”) a variety of third-party professional managed futures and foreign exchange advisors (“Advisors”) in an investment environment which facilitates access to multiple Advisors without having to negotiate individually with any Advisor, meet their account minimums, or establish futures and forward dealing accounts.
Each of the Onshore Platform’s respective series (each a “Fund”, collectively the “Funds”) invest in a separately formed Delaware limited liability company (each a “Master Fund”, collectively the “Master Funds”). Unless specified otherwise, each Master Fund is managed by a different Advisor. Collectively, the Advisors implement a wide range of trading strategies, trade entirely independently from each other and are not affiliated with the Sponsor. The Trading Advisor Supplement (the “Supplement”), which was provided to each of the investors, and can be provided by the Sponsor if requested, includes specific information relating to each Master Fund and its respective Advisor, including a description of the Advisor, their trading strategy, and the financial terms.
The structure of the Platform permits the Funds to offer Investors a choice of trading leverage levels as well as the ability to adjust such levels in response to changes in Advisor performance, general market conditions and the Investor’s own portfolio objectives. Each Investor’s selected trading leverage is managed by the Funds by allocating the Investor’s subscription proceeds between the Funds’ bank accounts and the corresponding Master Funds.
Galaxy Plus Fund SPC (the “Offshore Platform”) is part of the Platform and is sponsored by GAF primarily for non-U.S. Investors. The Offshore Platform operates in substantially the same manner as the Onshore Platform and also invests in the same Master Funds.
GAF was formed in October 2013 and its principal office is located in Chicago, Illinois. GAF is registered with the U.S. Commodity Futures Trading Commission (CFTC) as a commodity pool operator and commodity trading advisor, and is a member of the National Futures Association (NFA).
The Platform has appointed the Sponsor, under the terms of the Limited Liability Company Agreement (the “LLC Agreement”) as the managing member of the Onshore Platform. In such capacity, the Sponsor has the authority, to manage, with wide discretionary powers, the business and affairs of the Onshore Platform including the authority to select the administrator for the Onshore Platform. The LLC Agreement will continue to remain in force until terminated by either the Sponsor or the Platform upon not less than sixty (60) days’ prior written notice. In certain circumstances (for example, the insolvency of either party or in the event all trading for the Platform by the Advisors are suspended), the LLC Agreement may be immediately terminated by either party. Capitalized terms throughout these notes are defined in the LLC Agreement
In accordance with Delaware law, the assets held in each Fund shall be applied and held solely for the benefit of the members in such Fund and no member of another Fund shall have any claim or right to any asset allocated to another Fund. The assets of each Fund shall be applied solely to satisfy only that respective Fund’s liabilities.
If an asset is not attributable to any particular Fund, the Sponsor shall have the discretion to determine the basis upon which such asset shall be allocated among the Funds and the Sponsor shall have the absolute discretion to vary such allocation. If the assets not attributable to any Fund give rise to any net profits, the Sponsor may, in its absolute discretion, allocate the net profits to any Fund.
F-114
| Galaxy Plus Fund LLC |
| (A Delaware Series Limited Liability Company) |
| Notes to the Financial Statements |
During 2016, the Onshore Platform consisted, in part, of the Funds described below. The Funds listed, herein, contain Class EF interest. That interest was created specifically for a strategic investor (see Note 3) The Funds are considered significant subsidiaries of that strategic investor under S-X 3-09. The financial statement for each of the Master Funds referenced below are attached to this report and should be read in conjunction with each Fund’s financial statements.
9. Galaxy Plus Fund – FORT Contrarian Feeder Fund (510) LLC (“510”) – On its inception date, August 6, 2015, 510 invested its assets in Galaxy Plus Fund – FORT Contrarian Master Fund (510) LLC, a Delaware limited liability company. As of December 31, 2016, 510 owned 100% of its Master Fund.
Galaxy Plus Fund – Emil van Essen STP Feeder Fund (516) LLC (“516”) – On its inception date, April 15, 2016, 516 invested its assets in Galaxy Plus Fund – Emil van Essen STP Master Fund (516) LLC, a Delaware limited liability company. As of December 31, 2016, 516 owned 100% of its Master Fund.
Galaxy Plus Fund – Quest Feeder Fund (517) LLC (“517”) – On its inception date, June 29, 2016, 517 invested its assets in Galaxy Plus Fund – Quest Master Fund (517) LLC, a Delaware limited liability company. As of December 31, 2016, 517 owned 100% of its Master Fund.
Galaxy Plus Fund – Chesapeake Feeder Fund (518) LLC (“518”) – On its inception date, June 7, 2016, 518 invested its assets in Galaxy Plus Fund – Chesapeake Master Fund (518) LLC, a Delaware limited liability company. As of December 31, 2016, 518 owned 100% of its Master Fund.
Galaxy Plus Fund – LRR Feeder Fund (522) LLC (“522”) – On its inception date, April 28, 2016, 522 invested its assets in Galaxy Plus Fund – LRR Master Fund (522) LLC, a Delaware limited liability company. As of December 31, 2016, 522 owned 100% of its Master Fund.
Galaxy Plus Fund – QIM Feeder Fund (526) LLC (“526”) – On its inception date, June 22, 2016, 526 invested its assets in Galaxy Plus Fund – QIM Master Fund (526) LLC, a Delaware limited liability company. As of December 31, 2016, 526 owned 100% of its Master Fund.
Galaxy Plus Fund – Quantmetrics Feeder Fund (527) LLC (“527”) – On its inception date, June 13, 2016, 527 invested its assets in Galaxy Plus Fund – Quantmetrics Master Fund (527) LLC, a Delaware limited liability company. As of December 31, 2016, 527 owned 100% of its Master Fund.
Galaxy Plus Fund – Doherty Feeder Fund (528) LLC (“528”) – On its inception date, July 19, 2016, 528 invested its assets in Galaxy Plus Fund – Doherty Master Fund (528) LLC, a Delaware limited liability company. As of December 31, 2016, 528 owned 100% of its Master Fund.
Galaxy Plus Fund – Aspect Feeder Fund (532) LLC (“532”) – On its inception date, December 16, 2016, 532 invested its assets in Galaxy Plus Fund – Aspect Master Fund (532) LLC, a Delaware limited liability company. As of December 31, 2016, 532 owned 100% of its Master Fund.
Galaxy Plus Fund – Quest FIT Feeder Fund (535) LLC (“535”) – On its inception date, September 19, 2016, 535 invested its assets in Galaxy Plus Fund – Quest FIT Master Fund (535) LLC, a Delaware limited liability company. As of December 31, 2016, 535 owned 100% of its Master Fund.
F-115
| Galaxy Plus Fund LLC |
| (A Delaware Series Limited Liability Company) |
| Notes to the Financial Statements |
| Note 2. | Summary of Significant Accounting Policies |
The following is a summary of significant accounting policies consistently followed in the preparation of the Onshore Platform’s financial statements.
Principles of accounting:The accompanying financial statements are expressed in United States dollars (USD) and have been prepared in accordance with accounting principles generally accepted in the United States of America (U.S. GAAP), as established by the Financial Accounting Standards Board (FASB), to ensure consistent reporting of financial condition and results of operations. The Funds are investment companies and follow the accounting and reporting guidance in FASB Accounting Standards Codification Topic 946.
Investments:Each Fund invests its assets in its respective Master Fund.
Investment in Master Fund: Each Fund’s investment in its respective Master Fund is carried at fair value and represents the Fund’s pro-rata interest in the net assets of the Master Fund as of the close of business on the relevant valuation date. The assets of each Master Fund are carried at fair value. At each valuation date, each Master Fund’s income, expenses, net realized gain/(loss) and net increase/(decrease) in unrealized appreciation/(depreciation) are allocated to the respective Fund, based on the Fund’s pro rata interest in the net assets of the Master Fund, and recorded in the respective Fund’s Statement of Operations. The financial statements of the Master Fund are attached to this report and should be read in conjunction with the Onshore Platform’s financial statements.
Cash:The Funds maintain deposits with financial institutions in amounts that at times maybe in excess of federally insured limits. The amount of cash held at the financial institutions is determined by the Investors choice of trading leverage levels respective to the maximum trading level of the Funds, as determined by the Sponsor. The Funds do not believe they are exposed to any significant credit risk.
Subscriptions received in advance:Subscriptions received in advance are subscriptions proceeds received for the purchase of capital effective subsequent to period end.
Use of estimates:The preparation of financial statements in accordance with U.S. GAAP requires management to make estimates and assumptions that affect the reported amounts of assets and liabilities and disclosure of contingent assets and liabilities at the date of the financial statements and the reported amounts of income and expenses during the reporting period. Actual results could differ from those estimates.
Interest income/expense: Interest income and expense is recognized on an accrual basis and includes the Master Fund’s interest income/expense from its broker that is allocated on a pro rata basis to the respective Fund.
Allocation of income and gains and losses: Profits and losses for each monthly accounting period, or shorter period if there are mid-month subscriptions and/or redemptions, are generally allocated, at the discretion of the Sponsor, pro-rata to the members based on their respective ownership percentage on the first day of each period throughout the year..
Income taxes: The Onshore Platform evaluates tax positions taken or expected to be taken to determine whether the tax positions are “more-likely-thank-not” of being sustained by the applicable tax authority. For tax positions meeting the “more-likely-thank-not” threshold, the tax amount recognized in the financial statements is reduced by the largest benefit that had a greater than fifty percent likelihood of being realized upon ultimate settlement with the relevant taxing authority. The Funds have determined that
F-116
| Galaxy Plus Fund LLC |
| (A Delaware Series Limited Liability Company) |
| Notes to the Financial Statements |
there is no tax liability resulting from uncertain income tax positions taken or expect to be taken with respect to all open tax years. No income tax returns are currently under examination. The Funds’ U.S. Federal tax returns for the periods since each Fund’s inception remain open.
The Funds are treated as partnerships for U.S. Federal income tax purposes and, as such, are generally not subject to U.S. Federal, state or local income taxes. The members of the Funds are liable for their share of all U.S. Federal, state, and local taxes, if any imposed on the net investment income and realized gains of the Funds.
Indemnifications:The Sponsor and its affiliates are indemnified against certain liabilities arising out of the performance of their duties for the Onshore Platform. In addition, in the normal course of business, the Onshore Platform enters into contracts with vendors and others that provide for general indemnifications. The Funds’ maximum exposure under these arrangements is unknown as this would involve future claims that may be made against the Onshore Platform. However, the Onshore Platform expects the risk of loss to be remote.
Statement of cash flows: The Onshore Platform has elected not to provide statements of cash flows as permitted by GAAP as all of the following conditions have been met:
| ● | During the period, substantially all of the Funds’ investments were carried at fair value and classified as Level 1 or Level 2 measurements in accordance with FASB ASC 820; |
| ● | The Funds had little or no debt during the period; |
| ● | The Onshore Platform financial statements include statements of changes in members’ equity. |
Subscriptions and redemptions: Subscriptions and redemptions can typically be made on a weekly basis as of the first day (Monday) of each week; (or, if such day is not a business day, the first business day thereafter) (each, a Subscription Date or a Redemption Date). The Onshore Platform may accept subscriptions or redemptions more frequently than the first day of each week, depending upon the size of the requested subscription or redemption amount, with the approval of the Sponsor.
| Note 3. | Classes of Interest and Series |
Four different classes of Interests (“Interests”) are currently offered by each Fund: Class A, Class B, Class C and Class EF Interests. Each Class is generally subject to different fees. Investors are eligible to receive Class A, Class B or Class C Interests depending on their aggregate Trading Level, as discussed in Note 5, on the Platform.
Class A Interests are available to (i) Investors who make capital contributions with an assigned Trading Level of $25,000,000 or more, as aggregated across all Funds in which capital contributions are invested, (ii) other collective investment vehicles or commodity pools sponsored by the Sponsor or its affiliates, and (iii) such other Investors as the Sponsor may determine. Class A Interests are subject to a Sponsor Fee and Sales Commissions.
Class B Interests are available to (i) Investors who make capital contributions with an assigned Trading Level between $5,000,000 and $24,999,999, as aggregated across all Funds in which capital contributions are invested, and (ii) such other Investors as the Sponsor may determine. Class B Interests are subject to a Sponsor Fee and Sales Commissions.
F-117
| Galaxy Plus Fund LLC |
| (A Delaware Series Limited Liability Company) |
| Notes to the Financial Statements |
Class C Interests are available to Investors who make capital contributions with an assigned Trading Level of less than $5,000,000, as aggregated across all Funds in which capital contributions are invested. Class C Interests are subject to a Sponsor Fee and Sales Commissions.
Class EF Interests are reserved for a strategic investor and not available to other investors without consent from the Sponsor. There is no stated minimum Trading Level for Class EF Interest. Class EF Interests are subject to a Sponsor Fee.
Once an Investor becomes eligible for Class B Interests, any Class C Interests held by such investor will be automatically converted into Class B Interests. Once an Investor becomes eligible for Class A Interests, any Class B Interests held by such Investor will be automatically converted into Class A Interests. Similarly, if an investor’s aggregate Trading Level falls below the minimum for Class A or Class B, such interests will be converted to Class B or Class C, as appropriate. All such conversions will occur at the first trading day after such minimum is breached.
An Investor of Class A, B, or C Interests, which invests more than once in a Fund, will receive a separate series with respect to each investment. Incentive Fees are calculated separately with respect to each such series. Series at or above their respective High Water Marks at the end of an Incentive Fee Calculation Period are subject to consolidation (i.e., “roll-up”) at the discretion of the Sponsor.
The Sponsor may from time to time offer additional classes or subclasses of Interest having different rights and privileges (including but not limited to different fees, funding factors, investment minimums and/or liquidity terms) from those described herein. The issuance of such additional class or sub-class of Interest will not require Investor’s approval; provided, that the terms of any such additional class or subclass of Interest do not materially adversely affect the Investors in the applicable Fund as a whole. Such additional class or sub-class of Interest may or may not be generally available to other Investors.
The amount of capital activity by each class of Interest for each Fund for the periods ended December 31, 2016, is as follows:
| Galaxy Plus | Galaxy Plus | Galaxy Plus | Galaxy Plus | Galaxy Plus | ||||||||||||||||
| Fund LLC - | Fund LLC - | Fund LLC - | Fund LLC - | Fund LLC - | ||||||||||||||||
| 510 Series | 510 Series | 510 Series | 516 Series | 517 Series | ||||||||||||||||
| Class A | Class C | Class EF | Class EF | Class EF | ||||||||||||||||
| Subscriptions | $ | 2,907,875 | $ | 66,667 | $ | 12,651,213 | $ | 12,442,497 | $ | 5,500,601 | ||||||||||
| Redemptions | (6,755,636 | ) | — | — | (2,791,667 | ) | — | |||||||||||||
| Transfers In | — | — | — | — | — | |||||||||||||||
| Transfers out | — | — | — | — | — | |||||||||||||||
| December 31, 2016 | $ | (3,847,761 | ) | $ | 66,667 | $ | 12,651,213 | $ | 9,650,830 | $ | 5,500,601 | |||||||||
F-118
| Galaxy Plus Fund LLC |
| (A Delaware Series Limited Liability Company) |
| Notes to the Financial Statements |
| Galaxy Plus | Galaxy Plus | Galaxy Plus | Galaxy Plus | Galaxy Plus | ||||||||||||||||
| Fund LLC - | Fund LLC - | Fund LLC - | Fund LLC - | Fund LLC - | ||||||||||||||||
| 518 Series | 522 Series | 526 Series | 526 Series | 527 Series | ||||||||||||||||
| Class EF | Class EF | Class C | Class EF | Class EF | ||||||||||||||||
| Subscriptions | $ | 11,819,208 | $ | 7,668,664 | $ | 166,667 | $ | 18,041,130 | $ | 19,729,842 | ||||||||||
| Redemptions | — | (409,667 | ) | — | (2,265,861 | ) | — | |||||||||||||
| Transfers In | — | — | — | — | — | |||||||||||||||
| Transfers out | — | — | — | — | — | |||||||||||||||
| December 31, 2016 | $ | 11,819,208 | $ | 7,258,997 | $ | 166,667 | $ | 15,775,269 | $ | 19,729,842 | ||||||||||
| Galaxy Plus | Galaxy Plus | Galaxy Plus | ||||||||||||||||||
| Fund LLC - | Fund LLC - | Fund LLC - | ||||||||||||||||||
| 528 Series | 532 Series | 535 Series | ||||||||||||||||||
| Class EF | Class EF | Class EF | ||||||||||||||||||
| Subscriptions | $ | 6,336,585 | $ | 5,000,000 | $ | 8,800,000 | ||||||||||||||
| Redemptions | — | — | — | |||||||||||||||||
| Transfers In | — | — | — | |||||||||||||||||
| Transfers out | — | — | — | |||||||||||||||||
| December 31, 2016 | $ | 6,336,585 | $ | 5,000,000 | $ | 8,800,000 | ||||||||||||||
Some of the contributions made during the periods ended December 31, 2016 were in-kind contributions and have been presented as such on the Statements of Changes in Members’ Equity.
Transfers into and out of a Fund relating to movement from one class of Share to another, change in beneficial ownership, and consolidation to an older series may occur from time to time. Roll-ups are considered transfers for financial reporting purposes. Since the amount of transfers into and out of each Fund offset, such transfers are not shown in the Funds’ Statements of Changes in Members’ Equity. For the periods ended December 31, 2016, there were no transfers.
| Note 4. | Management, Incentive, Sponsor and Other Fees |
Each Fund class will pay its respective Advisor, or in the case of Class EF, the managing owner of the member, both asset based (management fee) and performance based (incentive fee) compensation as outlined in the Supplement. In addition, each Fund class will pay the Sponsor asset based (sponsor fee) compensation and, if applicable, a selling agent will receive from each fund class an asset based fee (sales commission). All asset based fees are calculated on the same uniform fee base which is the beginning of the period Trading Level (as defined in the Supplement and discussed in Note 5) plus periodic trading profits and losses for the Fund. Investors can be charged different management and incentive fees at the discretion of the Sponsor.
Management Fee:Each Advisor earns a management fee (the “Management Fee”) which is calculated and accrued monthly (prorated for partial periods) and payable in arrears as of the last business day of each month. The rate at which the Management Fee is calculated is specific to each Fund and typically ranges from 0% to 3.50% per annum. Each Advisor may enter into fee sharing arrangements with the Sponsor, pursuant to which the Sponsor will receive a portion of the Management Fee to be paid to such advisor. During the period ended December 31, 2016, 510 paid $14,685 to the Sponsor related to these
F-119
| Galaxy Plus Fund LLC |
| (A Delaware Series Limited Liability Company) |
| Notes to the Financial Statements |
fee sharing arrangements. In addition, the Sponsor can enter into agreements with Selling Agents in which the Selling Agent will receive a portion of the Management Fee on assets they introduce to the Funds. During the periods ended December 31, 2016, 510 paid management fees of $171 to Selling Agents.
Incentive Fee:As of the end of each calendar quarter, each Fund will pay an incentive fee (the “Incentive Fee”) to the Advisor equal to the percentage (the “Incentive Fee Rate”) of the New Net Profit (defined below) attributable to each series of Interest in such Fund. The Incentive Fee Rate is specific to each Fund and typically ranges from 20% to 30%.
Any Incentive Fee, if accrued, will also be made in respect of Interests withdrawn, at the time of such withdrawal, as if the withdrawal date were the end of a calendar quarter.
“New Net Profit” means, with respect to each series of Interest, the amount by which the Net Asset Value of such series of Interest as of the date of determination exceeds the High Water Mark (defined below) then attributable to such series of Interest.
Net Asset Value, for purposes of calculating the Incentive Fee, is calculated prior to reduction for the Incentive Fee being calculated. Net Asset Value is calculated after deduction for the Management Fee (regardless of whether such Management Fee is paid to an Advisor or to the Sponsor), but prior to deduction for the Sponsor Fee, Sales Commissions, and/or Operating Expenses.
“High Water Mark” means, with respect to each series of Interest, the greater of: (i) the aggregate Capital Contributions made to such series of Interest; and (ii) the Net Asset Value of such series of Interest as of the end of the most recent Incentive Fee Calculation Period as of which an Incentive Fee was made from such series of Interest (after deduction for the Incentive Fee then made). The High Water Mark with respect to a series of Interest is reduced proportionately when any withdrawal is made from such series of Interest — i.e., the High Water Mark immediately prior to any such withdrawal is multiplied by the fraction of the numerator of which is the Net Asset Value of such series of Interest immediately after such withdrawal and the denominator of which is such Net Asset Value immediately prior to such withdrawal (Net Asset Value in each case being calculated prior to reduction for any Incentive Fee).
As the Incentive Fee is calculated separately with respect to each investment made by an Investor, an Investor which invests more than once in a Fund is at risk of being subject to Incentive Fees in respect of capital contributions made at different times even though the overall value of such Investor’s investment in such Fund has declined.
The Trading Advisors may enter into side agreements with various investors changing the management/ incentive fees charged to those investors.
The managing owner of the Class EF members have entered into separate agreements with the Trading Advisors in which the managing owner will retain a portion of both the management and incentive fees charged to the Class EF members. During the periods ended December 31, 2016, the amount of management fees and incentive fees retained by the managing owner of Class EF interest are as follows:
F-120
| Galaxy Plus Fund LLC |
| (A Delaware Series Limited Liability Company) |
| Notes to the Financial Statements |
| Galaxy Plus | Galaxy Plus | Galaxy Plus | Galaxy Plus | Galaxy Plus | ||||||||||||||||
| Fund LLC - | Fund LLC - | Fund LLC - | Fund LLC - | Fund LLC - | ||||||||||||||||
| 510 Series | 516 Series | 517 Series | 518 Series | 522 Series | ||||||||||||||||
| Management Fee | $ | 15,007 | $ | 89,157 | $ | 62,579 | $ | 175,171 | $ | 81,489 | ||||||||||
| Incentive Fee | 26,226 | 385,717 | — | 87,723 | 11,527 | |||||||||||||||
| Galaxy Plus | Galaxy Plus | Galaxy Plus | Galaxy Plus | Galaxy Plus | ||||||||||||||||
| Fund LLC - | Fund LLC - | Fund LLC - | Fund LLC - | Fund LLC - | ||||||||||||||||
| 526 Series | 527 Series | 528 Series | 532 Series | 535 Series | ||||||||||||||||
| Management Fee | $ | 111,745 | $ | 29,573 | $ | 23,082 | $ | 858 | $ | — | ||||||||||
| Incentive Fee | 92,180 | — | 7,493 | — | — | |||||||||||||||
The amount of management fees and incentive fees due to the managing owner of the class EF members as of December 31, 2016 are as follows:
| Galaxy Plus | Galaxy Plus | Galaxy Plus | Galaxy Plus | Galaxy Plus | ||||||||||||||||
| Fund LLC - | Fund LLC - | Fund LLC - | Fund LLC - | Fund LLC - | ||||||||||||||||
| 510 Series | 516 Series | 517 Series | 518 Series | 522 Series | ||||||||||||||||
| Accrued Management Fee | $ | 2,552 | $ | 9,444 | $ | 8,474 | $ | 23,810 | $ | 10,694 | ||||||||||
| Accrued Incentive Fee | — | 99,665 | — | — | 11,527 | |||||||||||||||
| Galaxy Plus | Galaxy Plus | Galaxy Plus | Galaxy Plus | Galaxy Plus | ||||||||||||||||
| Fund LLC - | Fund LLC - | Fund LLC - | Fund LLC - | Fund LLC - | ||||||||||||||||
| 526 Series | 527 Series | 528 Series | 532 Series | 535 Series | ||||||||||||||||
| Accrued Management Fee | $ | 19,890 | $ | 4,530 | $ | 4,348 | $ | 858 | $ | — | ||||||||||
| Accrued Incentive Fee | 45,933 | — | 5,771 | — | — | |||||||||||||||
Sponsor Fee:The Sponsor will receive from each Interest a monthly sponsor fee (the “Sponsor Fee”) calculated as a percentage (the “Sponsor Fee Rate”) applicable to each Class of Interests. The Sponsor Fee is calculated and accrued monthly and payable in arrears as of the last business day of each month. The Sponsor Fee is pro rated for partial periods. The annual Sponsor Fee Rate is 0.25% for Class A Interests, 0.50% for Class B Interests, 0.80% for Class C Interests, and 0.15% for Class EF Interests.
Sales Commission:Class A, B and C Interests are subject to monthly ongoing sales commissions (“Sales Commissions”) equal to a percentage (the “Sales Commission Rate”) applicable to each Class of Interest. Sales Commissions are calculated and accrued monthly and payable in arrears as of the last business day of each month. Sales Commissions are pro rated for partial periods. Sales Commissions are specific to an Investor and are agreed upon between the Investor and Selling Agent prior to making a contribution to the Onshore Platform. The Sales Commission Rate generally ranges between 0%-2% per annum. With the exception of 526, no sales commissions were charged during the periods ended December 31, 2016. Sales commissions are included in the Sponsor Fee totals on the Statements of Operations.
Operating Expenses:The Sponsor will be responsible for paying all ongoing operating costs of each Fund and the Platform as the expenses are incurred, including, but not limited to, any administrative,
F-121
| Galaxy Plus Fund LLC |
| (A Delaware Series Limited Liability Company) |
| Notes to the Financial Statements |
transfer, exchange and withdrawal processing costs; legal, compliance, regulatory, reporting, filing, escrow, accounting and printing fees and expenses; and any other operating or administrative expenses related to accounting, research, due diligence or reporting; however, each Fund will be responsible for paying all of its execution and clearing brokerage commissions; forward and other over-the-counter trading spreads; Fund set-up and organization expenses (which can be capped at the discretion of the Sponsor); bank wire fees; and extraordinary expenses such as litigation and indemnification.
Effective December 1, 2016, the Sponsor amended the Offering Memorandum of the Onshore Platform so that expenses related to audit and taxes will be borne by the Funds. The professional services related to the 2016 financial statement audits and 2016 tax return preparation are performed in calendar year 2017. As a result, the 2016 audit and tax fees will be recorded as expenses by the funds in 2017 when these services are performed.
| Note 5. | Notional Funding |
The ability to customize notional funding in the various Funds is a special feature of the Onshore Platform. The Sponsor determines each Fund’s Maximum Funding Factor (i.e., the maximum ratio of Trading Level to actual capital invested in such Fund) and may increase or reduce such Maximum Funding Factor at any time. In establishing a Fund’s Maximum Funding Factor, the Sponsor generally considers the Advisor’s maximum 5 day drawdown and its typical margin-to-equity ratio and sets the Maximum Funding Factor to protect against any failure to meet margin calls.
The leverage used by a Master Fund (i.e., the ratio of the notional amount of the futures and forward contracts held by such Master Fund to the Trading Level of such Master Fund) will fluctuate on an ongoing basis. The Advisors will adjust such leverage in response to market conditions and will not maintain any set relationship between the Trading Level of a Master Fund and the notional amount of the futures and forward positions held for such Master Fund. The notional amount of the futures and forward contracts held by a Master Fund is likely to exceed the Trading Level of such Master Fund by a factor of 10 or more.
Investors customize their notional funding of their investment in a Fund by choosing an Effective Funding Factor (which must be no greater than the Maximum Funding Factor). The Effective Funding Factor so chosen is implemented by the applicable Fund by keeping a portion of the capital at the Fund’s bank account or, as the Fund matures, by keeping a certain percentage of an Investor’s investment to the Fund’s bank account rather than allocating such capital to the corresponding Master Fund. All capital allocated by a Fund to its corresponding Master Fund is traded at the Maximum Funding Factor for such Fund.
Due to market appreciation/depreciation and other factors, an Investor’s Trading Level to actual capital contributed by such Investor will diverge — potentially materially — from such Investor’s selected Effective Funding Factor. As a result, the Sponsor will from time to time rebalance allocations between the corresponding Master Fund and Fund’s bank account in an attempt to reflect the desired Effective Funding Factor. Such rebalancing is not done pursuant to any predefine parameters but is done at the Sponsor’s discretion.
F-122
| Galaxy Plus Fund LLC |
| (A Delaware Series Limited Liability Company) |
| Notes to the Financial Statements |
| Note 6. | In-Kind Contributions |
On 518’s commencement of operation date in June of 2016, the first subscription was made, in part, via a transfer of assets on that date. Investors contributed $94,417 in unrealized appreciation on open futures contracts. 518 immediately made an in-kind contribution in Master on that same date.
On 522’s commencement of operation date in April of 2016, the first subscription was made, in part, via an assumption of liabilities on that date. 522 assumed liabilities of $27,740 in fair value of options written from the initial investors. 522 immediately made an in-kind contribution in Master on that same date.
On 528’s commencement of operation date in July of 2016, the first subscription was made, in part, via a transfer of assets on that date. Investors contributed $125,475 in fair value of options purchased and assumed liabilities of $49,805 in fair value of options written. 528 immediately made an in-kind contribution in Master on that same date.
| Note 7. | Financial Instruments with off-balance sheet risk and concentration of credit risk |
At December 31, 2016, none of the Funds have direct commitments to buy or sell financial instruments, including derivative instruments. Each Fund does have indirect buy and sell commitments that arise through the positions held by the Master Fund in which each respective Fund invests. However, as an investor in a Master Fund, each Fund’s risk at December 31, 2016, is limited to the fair value of its investment in the Master Fund.
| Note 8. | Financial highlights |
Financial highlights for each Fund and its respective Class(es) for the periods ended December 31, 2016 are presented in the table below. The information has been derived from information presented in the financial statements.
F-123
| Galaxy Plus Fund LLC |
| (A Delaware Series Limited Liability Company) |
| Notes to the Financial Statements |
| Galaxy Plus | Galaxy Plus | Galaxy Plus | Galaxy Plus | |||||||||||||
| Fund LLC - | Fund LLC - | Fund LLC - | Fund LLC - | |||||||||||||
| 510 Series | 510 Series | 510 Series | 516 Series | |||||||||||||
| Class A | Class C | Class EF | Class EF | |||||||||||||
| Total return before incentive fee | 3.59 | % | 2.46 | % | -11.22 | % | 18.07 | % | ||||||||
| Incentive fee | -0.29 | % | -0.53 | % | -1.10 | % | -3.38 | % | ||||||||
| Total return after incentive fee (A) | 3.30 | % | 1.93 | % | -12.32 | % | 14.69 | % | ||||||||
| Ratio to average members’ equity (B): | ||||||||||||||||
| Expenses excluding incentive fee | 4.04 | % | 8.37 | % | 2.26 | % | 3.88 | % * | ||||||||
| Incentive fee | 0.28 | % | 0.52 | % | 1.15 | % | 3.19 | % | ||||||||
| Total expenses and incentive fee | 4.32 | % | 8.89 | % | 3.41 | % | 7.07 | % | ||||||||
| Net investment income (loss) (C) | -4.32 | % | -8.89 | % | 3.41 | % | -7.07 | % * | ||||||||
| Galaxy Plus | Galaxy Plus | Galaxy Plus | Galaxy Plus | |||||||||||||
| Fund LLC - | Fund LLC - | Fund LLC - | Fund LLC - | |||||||||||||
| 517 Series | 518 Series | 522 Series | 526 Series | |||||||||||||
| Class EF | Class EF | Class EF | Class C | |||||||||||||
| Total return before incentive fee | -29.59 | % | -2.25 | % | 6.22 | % | 12.42 | % | ||||||||
| Incentive fee | 0.00 | % | -0.79 | % | -1.25 | % | -3.66 | % | ||||||||
| Total return after incentive fee (A) | -29.59 | % | -3.04 | % | 4.97 | % | 8.76 | % | ||||||||
| Ratio to average members’ equity (B): | ||||||||||||||||
| Expenses excluding incentive fee | 3.81 | % * | 3.27 | % * | 5.89 | % * | 2.93 | % * | ||||||||
| Incentive fee | 0.00 | % | 0.73 | % | 1.35 | % | 3.54 | % | ||||||||
| Total expenses and incentive fee | 3.81 | % | 4.00 | % | 7.24 | % | 6.47 | % | ||||||||
| Net investment income (loss) (C) | -3.81 | % * | -4.00 | % * | -7.24 | % * | -6.47 | % * | ||||||||
F-124
| Galaxy Plus Fund LLC |
| (A Delaware Series Limited Liability Company) |
| Notes to the Financial Statements |
| Galaxy Plus | Galaxy Plus | Galaxy Plus | Galaxy Plus | |||||||||||||
| Fund LLC - | Fund LLC - | Fund LLC - | Fund LLC - | |||||||||||||
| 526 Series | 527 Series | 528 Series | 532 Series | |||||||||||||
| Class EF | Class EF | Class EF | Class EF | |||||||||||||
| Total return before incentive fee | 34.45 | % | -2.53 | % | 3.85 | % | -7.60 | % | ||||||||
| Incentive fee | -8.29 | % | 0.00 | % | -0.82 | % | 0.00 | % | ||||||||
| Total return after incentive fee (A) | 26.16 | % | -2.53 | % | 3.03 | % | -7.60 | % | ||||||||
| Ratio to average members’ equity (B): | ||||||||||||||||
| Expenses excluding incentive fee | 2.86 | % * | 1.98 | % * | 1.39 | % * | 3.44 | % * | ||||||||
| Incentive fee | 9.24 | % | 0.00 | % | 0.81 | % | 0.00 | % | ||||||||
| Total expenses and incentive fee | 12.10 | % | 1.98 | % | 2.20 | % | 3.44 | % | ||||||||
| Net investment income (loss) (C) | -12.10 | % * | -1.98 | % * | -2.20 | % * | -3.44 | % * | ||||||||
| Galaxy Plus | ||||||||||||||||
| Fund LLC - | ||||||||||||||||
| 535 Series | ||||||||||||||||
| Class EF | ||||||||||||||||
| Total return before incentive fee | 27.08 | % | ||||||||||||||
| Incentive fee | 0.00 | % | ||||||||||||||
| Total return after incentive fee (A) | 27.08 | % | ||||||||||||||
| Ratio to average members’ equity (B): | ||||||||||||||||
| Expenses excluding incentive fee | 1.87 | % * | ||||||||||||||
| Incentive fee | 0.00 | % | ||||||||||||||
| Total expenses and incentive fee | 1.87 | % | ||||||||||||||
| Net investment income (loss) (C) | -1.87 | % * | ||||||||||||||
| * | Ratios annualized for partial periods. |
| (A) | Total return is based on the change in average members’ equity during the period of a theoretical investment made at the inception of the Fund. |
| (B) | The total expense and net investment income (loss) ratios are computed based upon weighted-average members’ equity as a whole for the periods ended December 31, 2016. |
| (C) | The net investment income/(loss) ratio excludes net realized and unrealized gains (losses) on investments. |
Financial highlights are calculated for each permanent, non-managing class of interest. An individual member’s return and ratios may vary based on different incentive and/or management fee arrangements, and the timing of capital interest transactions. The net investment income/(loss) and total expense ratios, excluding nonrecurring expenses, have been annualized for partial periods. Total returns have not been annualized.
F-125
| Galaxy Plus Fund LLC |
| (A Delaware Series Limited Liability Company) |
| Notes to the Financial Statements |
| Note 9. | Subsequent events |
In accordance with FASB ASC 855,Subsequent Events, the Sponsor has evaluated all subsequent events requiring recognition and disclosure in the Onshore Platform’s financial statements through March 24, 2017, the date the financial statements were available for issuance.
F-126
| Galaxy Plus Fund – Aspect |
| Master Fund (532) LLC |
| (A Delaware Limited Liability Company) |
| The attached annual report is filed under exemption pursuant to |
| Section 4.7 of the regulations under the Commodity Exchange Act. |
| Financial Report |
| December 31, 2016 |
F-127
Independent Auditor’s Report
Board of Directors
Galaxy Plus Fund LLC
Report on the Financial Statements
We have audited the accompanying financial statements of Galaxy Plus Fund – Aspect Master Fund (532) LLC (the Fund), which comprise the statement of financial condition, including the condensed schedule of investments, as of December 31, 2016, and the related statements of operations, and changes in member’s equity for the period from December 16, 2016 (commencement of operations) to December 31, 2016, and the related notes to the financial statements.
Management's Responsibility for the Financial Statements
Management is responsible for the preparation and fair presentation of these financial statements in accordance with accounting principles generally accepted in the United States of America; this includes the design, implementation and maintenance of internal control relevant to the preparation and fair presentation of financial statements that are free from material misstatement, whether due to fraud or error.
Auditor’s Responsibility
Our responsibility is to express an opinion on these financial statements based on our audit. We conducted our audit in accordance with auditing standards generally accepted in the United States of America. Those standards require that we plan and perform the audit to obtain reasonable assurance about whether the financial statements are free from material misstatement.
An audit involves performing procedures to obtain audit evidence about the amounts and disclosures in the financial statements. The procedures selected depend on the auditor’s judgment, including the assessment of the risks of material misstatement of the financial statements, whether due to fraud or error. In making those risk assessments, the auditor considers internal control relevant to the entity’s preparation and fair presentation of the financial statements in order to design audit procedures that are appropriate in the circumstances, but not for the purpose of expressing an opinion on the effectiveness of the entity’s internal control. Accordingly, we express no such opinion. An audit also includes evaluating the appropriateness of accounting policies used and the reasonableness of significant accounting estimates made by management, as well as evaluating the overall presentation of the financial statements.
We believe that the audit evidence we have obtained is sufficient and appropriate to provide a basis for our audit opinion.
F-128
Opinion
In our opinion, the financial statements referred to above present fairly, in all material respects, the financial position of Galaxy Plus Fund – Aspect Master Fund (532) LLC as of December 31, 2016, and the results of its operations for the period from December 16, 2016 (commencement of operations) to December 31, 2016, in accordance with accounting principles generally accepted in the United States of America.
/s/ RSM US LLP
Denver, Colorado
March 24, 2017
F-129
| Galaxy Plus Fund - Aspect Master Fund (532) LLC |
| (A Delaware Limited Liability Company) |
| Statement of Financial Condition |
| December 31, 2016 |
| (Expressed in U.S. Dollars) |
| Assets | ||||
| Equity in commodity trading accounts at clearing brokers: | ||||
| Cash | $ | 2,611,117 | ||
| Restricted cash - margin balance | 2,301,058 | |||
| Receivable from onshore feeder fund | 1,000 | |||
| Total assets | $ | 4,913,175 | ||
| Liabilities and Member’s Equity | ||||
| Liabilities | ||||
| Deficit in commodity trading accounts at clearing brokers: | ||||
| Investments in futures contracts at fair value (represents unrealized depreciation on open derivative contracts, net) | $ | 286,034 | ||
| Total liabilities | 286,034 | |||
| Member’s equity | 4,627,141 | |||
| Total liabilities and member’s equity | $ | 4,913,175 | ||
See notes to financial statements.
F-130
| Galaxy Plus Fund - Aspect Master Fund (532) LLC |
| (A Delaware Limited Liability Company) |
| Condensed Schedule of Investments |
| December 31, 2016 |
| (Expressed in U.S. Dollars) |
| Number of | Percent of | |||||||||
| Contracts/Units | Fair Value | Member’s Equity | ||||||||
| Long positions: | ||||||||||
| Derivative contracts: | ||||||||||
| Domestic (United States): | ||||||||||
| Futures contracts: | ||||||||||
| Agriculture | 4 | $ | (7,613 | ) | (0.16 | )% | ||||
| Currency | 14 | (16,970 | ) | (0.37 | ) | |||||
| Energy | 7 | 13,732 | 0.30 | |||||||
| Index | 50 | (31,795 | ) | (0.69 | ) | |||||
| Metals | 4 | (9,375 | ) | (0.20 | ) | |||||
| Foreign: | ||||||||||
| Futures contracts: | ||||||||||
| Energy | 1 | (100 | ) | (0.00 | ) | |||||
| Index | 110 | 15,820 | 0.34 | |||||||
| Interest | 25 | 12,208 | 0.26 | |||||||
| Metals | 6 | (26,275 | ) | (0.57 | ) | |||||
| Total long positions | (50,368 | ) | (1.09 | ) | ||||||
| Short positions: | ||||||||||
| Derivative contracts: | ||||||||||
| Domestic (United States): | ||||||||||
| Futures contracts: | ||||||||||
| Agriculture | 37 | (16,256 | ) | (0.35 | ) | |||||
| Currency | 96 | (99,543 | ) | (2.15 | ) | |||||
| Interest | 138 | (74,241 | ) | (1.60 | ) | |||||
| Metals | 7 | (13,630 | ) | (0.29 | ) | |||||
| Foreign: | ||||||||||
| Futures contracts: | ||||||||||
| Index | 8 | (1,886 | ) | (0.04 | ) | |||||
| Interest | 199 | (34,228 | ) | (0.74 | ) | |||||
| Metals | 3 | 4,118 | 0.09 | |||||||
| Total short positions | (235,666 | ) | (5.09 | ) | ||||||
| Investments in futures contracts, at fair value | $ | (286,034 | ) | (6.18 | )% | |||||
See notes to financial statements.
F-131
| Galaxy Plus Fund - Aspect Master Fund (532) LLC |
| (A Delaware Limited Liability Company) |
| Statement of Operations |
| For the period from December 16, 2016 (Commencement of Operations) to December 31, 2016 |
| (Expressed in U.S. Dollars) |
| Net investment income | $ | — | ||
| Realized and unrealized loss on investments and foreign currency transactions: | ||||
| Net realized loss from: | ||||
| Derivative contracts1 | $ | (86,638 | ) | |
| Foreign currency transactions | (13 | ) | ||
| (86,651 | ) | |||
| Net increase (decrease) in unrealized depreciation on: | ||||
| Derivative contracts | (286,034 | ) | ||
| Translation of assets and liabilities denominated in foreign currencies | (174 | ) | ||
| (286,208 | ) | |||
| Net realized and unrealized loss on investments and foreign currency transactions | (372,859 | ) | ||
| Net decrease in member’s equity resulting from operations | $ | (372,859 | ) | |
| 1 | Includes broker trading commissions |
See notes to financial statements.
F-132
| Galaxy Plus Fund - Aspect Master Fund (532) LLC |
| (A Delaware Limited Liability Company) |
| Statement of Changes in Member’s Equity |
| For the period from December 16, 2016 (Commencement of Operations) to December 31, 2016 |
| (Expressed in U.S. Dollars) |
| Changes in member’s equity from operations: | ||||
| Net investment income | $ | — | ||
| Net realized gain (loss) from derivative contracts and foreign currency transactions | (86,651 | ) | ||
| Net increase (decrease) in unrealized depreciation on derivative contracts and translation of assets and liabilities denominated in foreign currencies | (286,208 | ) | ||
| Net decrease in member’s equity resulting from operations | (372,859 | ) | ||
| Changes in member’s equity from capital transactions: | ||||
| Proceeds from issuance of capital | 5,000,000 | |||
| Net increase in member’s equity resulting from capital transactions | 5,000,000 | |||
| Total increase | 4,627,141 | |||
| Member’s equity, beginning of period | — | |||
| Member’s equity, end of period | $ | 4,627,141 | ||
See notes to financial statements.
F-133
| Galaxy Plus Fund – Aspect Master Fund (532) LLC |
| (A Delaware Limited Liability Company) |
| Notes to the Financial Statements |
| Note 1. | Organization and Structure |
Galaxy Plus Fund – Aspect Master Fund (532) LLC (the “Master Fund”) was formed in Delaware as a limited liability company on April 20, 2016 and commenced operations on December 16, 2016. The Master Fund was created to serve as the trading entity managed Aspect Capital Limited, L.L.C. (the “Trading Advisor”) pursuant to its Aspect Core Diversified Program (the “Program”). The Program applies a proprietary and systematic quantitative investment approach to generate profit from trends in both rising and falling markets.
The Master Fund and other separately formed Delaware limited liability companies (“Other Master Funds”), are investment vehicles available under the Galaxy Plus Managed Account Platform (the “Platform”). The Master Fund and the Platform are sponsored by Gemini Alternative Funds, LLC (the “Sponsor” or “GAF”) as a means of making available, to qualified high net-worth individuals and institutional investors (including fund of hedge funds) (“Investors”), a variety of third-party professional managed futures and foreign exchange advisors (“Advisors”). The Trading Advisor is not affiliated with the Sponsor.
GAF was formed in October 2013 and its principal office is located in Chicago, Illinois. GAF is registered with the U.S. Commodity Futures Trading Commission (CFTC) as a commodity pool operator and commodity trading advisor, and is a member of the National Futures Association (NFA).
Galaxy Plus Fund LLC, a Delaware Series Limited Liability Company (the “Onshore Platform”), and Galaxy Plus Fund SPC, a Cayman Islands Segregated Portfolio Company (the “Offshore Platform”) serve as the feeder funds for the Platform and invest substantially all of the assets of the respective segregated portfolios (each a “Fund”) in the Master Fund or other Master Funds. Galaxy Plus Fund – Aspect Feeder Fund (532) (“LLC532”), a separated series of the Onshore Platform and Galaxy Plus Fund – Aspect Offshore Feeder Fund (532) Segregated Portfolio (“SPC532”), a segregated portfolio of the Offshore Platform, can each invest in the Master Fund. As of December 31, 2016, SPC 532 had not commenced operations.
LLC532 and SPC532 are collectively hereafter referred to as the “Feeder Funds”.
Subscriptions and redemptions into the Feeder Funds are the corresponding transactions with the Master Fund and are governed by the Onshore Platform’s and the Offshore Platform’s respective Confidential Offering Memorandums.
The Platform has appointed the Sponsor, under the terms of the Limited Liability Company Agreement (the “LLC Agreement”) as the managing member of the Master Fund. In such capacity, the Sponsor has the authority, to manage, with wide discretionary powers, the business and affairs of the Master Fund including the authority to select the administrator for the Master Fund. The LLC Agreement will continue to remain in force until terminated by either the Sponsor or the Platform upon not less than sixty (60) days’ prior written notice. In certain circumstances (for example, the insolvency of either party or in the event all trading for the Platform by the Advisors are suspended), the LLC Agreement may be immediately terminated by either party.
F-134
| Galaxy Plus Fund – Aspect Master Fund (532) LLC |
| (A Delaware Limited Liability Company) |
| Notes to the Financial Statements |
The Master Fund and the Sponsor have entered into a tri-party contract (the “Trading Agreement”) with the Trading Advisor pursuant to which the Master Fund’s trading accounts are managed, subject to rights of termination, by the Trading Advisor in accordance with the Program. The Trading Advisor may alter its Program (including its trading systems and methods and including the addition and/or deletion of any financial interests or contracts traded in the Master Fund’s trading accounts), provided that the Trading Advisor provide prior notice to the Master Fund and the Sponsor of any material change to the Trading Advisor’s Program. From time to time, the Trading Advisor (or its affiliates) may manage additional accounts, and these accounts will increase the level of competition for the same trades desired for the Master Fund, including the priorities of order entry. There is no specific limit as to the number of accounts the Trading Advisors (or their affiliates) may manage. In addition, the positions of all of the accounts owned or controlled by the Trading Advisor (or its affiliates) are aggregated for the purposes of applying speculative position limits. The management, incentive, and sponsor fees are paid directly by the Feeder Funds, and for this reason are not recorded as expenses of the Master Fund.
| Note 2. | Summary of Significant Accounting Policies |
The following is a summary of significant accounting policies consistently followed in the preparation of the Master Fund’s financial statements.
Principles of accounting:The accompanying financial statements are expressed in United States dollars (USD) and have been prepared in accordance with Generally Accepted Accounting Principles (GAAP), as established by the Financial Accounting Standards Board (FASB), to ensure consistent reporting of financial condition and results of operations. The Master Fund is an investment company and follows the accounting and reporting guidance in FASB Account Standards Codification Topic 946.
None.
Cash and restricted cash: Cash held in the commodity trading accounts at clearing broker consists of either cash maintained in the custody of the broker, a portion of which is required margin for open positions, or amounts due to/from the broker for margin or unsettled trades. The Master Fund may also hold cash in a non-interest bearing USD commercial bank account. The Master Fund holds various currencies at the clearing broker, of which $4,954,266 is held in USD and a payable of ($42,091) in foreign currencies as of December 31, 2016, and are recorded in cash and restricted cash – margin balance on the statement of financial condition. The non-U.S. currencies fluctuate in value on a daily basis relative to the USD. A portion of this cash is restricted cash required to meet maintenance margin requirements. Cash with the clearing broker as of December 31, 2016 included restricted cash for margin requirements of $2,301,058. This cash becomes unrestricted when the underlying positions to which it is applicable are liquidated. Cash with the clearing broker as of December 31, 2016 included amounts due to the broker for unsettled trades of $0.
Offsetting of amounts related to certain contracts: When the requirements are met, the Master Fund offsets certain fair value amounts recognized for net derivative positions executed with the same counterparty under the same master netting arrangement (see Note 5).
F-135
| Galaxy Plus Fund – Aspect Master Fund (532) LLC |
| (A Delaware Limited Liability Company) |
| Notes to the Financial Statements |
Valuation and Revenue Recognition:Depending on the Program and Investments traded, The Master Fund follows the following valuation and revenue recognition policies. All investments are recorded at their estimated fair value, as described in Note 3.
Futures and options on futures contracts: The Master Fund may enter into futures and options on futures contracts. Upon entering into a futures contract, The Master Fund agrees to receive or deliver a fixed quantity of an underlying instrument or commodity for an agreed-upon price, while an option contract provides the option purchaser with the right, but not the obligation, to buy or sell a security or financial instrument at a predetermined exercise price during a defined period. Futures and options on futures contracts are recorded on the trade date. The difference between the original contract amount and the fair value of futures contracts purchased or sold is reflected as unrealized appreciation/(depreciation) on open contracts. Options on futures contracts are reflected in investments at fair value. The difference between the premiums paid or received on open options on futures contracts and fair value of such options is recorded as unrealized appreciation/(depreciation) on open contracts. The fair value of futures and options on futures contracts is based upon daily exchange settlement prices. The realized gain or loss is determined on the settlement of intraday trades first and then by the FIFO method.
Foreign currency transactions: The Master Fund’s financial statements are denominated in USD. However, foreign currency forward contracts, non-U.S. futures contracts, and non-U.S. options on futures contracts are denominated in currencies other than USD. Assets and liabilities and transactions denominated in currencies other than the USD are translated into USD at the rates in effect either at the close of business on the last business day of the reporting period or on the date of such transactions, respectively. Net realized foreign exchange gain or loss arises from the sales of foreign currencies and currency gains or losses realized between trade and settlement dates. Net unrealized foreign exchange gain and loss arises from changes in the fair value of assets and liabilities resulting from changes in exchange rates.
Trading costs: Trading costs generally consist of brokerage commissions, brokerage fees, clearing fees, exchange and regulatory fees, transaction and NFA fees. Fees vary by type of contract for each purchase and sale or sale and purchase (round turn) of futures, options on futures, and forward contracts. Commissions are paid on each individual purchase and sale transaction. These costs are recognized as expenses for futures and options on futures transactions, and are included in net realized gain/loss from derivative contracts on the Statement of Operations.
Interest income/expense: Interest income and expense is recognized on an accrual basis.
Allocation of income and gains and losses: Profits and losses for each monthly accounting period, or shorter period if there are mid-month subscriptions and/or redemptions, are allocated pro-rata to the Feeder Funds based on their respective ownership percentage on the first day of each period throughout the year.
Income taxes: The Master Fund will not be subject to United States federal income taxation other than certain withholding taxes. The Master Fund evaluates tax positions taken or expected to be taken to determine whether the tax positions are more-likely-than-not of being sustained by the applicable tax authority. For tax positions meeting the more-likely-than-not threshold, the tax amount recognized in the financial statements is reduced by the largest benefit that has a greater than fifty percent likelihood of being realized upon ultimate settlement with the relevant taxing authority. The Master Fund has determined that there is no tax liability resulting from uncertain income tax positions taken or expected to be taken with respect to all open tax years. The Master Fund’s U.S. Federal tax returns for the period ended December 31, 2016, remain open. The Master Fund recognizes interest and penalties, if any, related to unrecognized tax benefits as income tax expense in the statement of operations. During the period, the Master Fund did not accrue any interest or penalties.
F-136
| Galaxy Plus Fund – Aspect Master Fund (532) LLC |
| (A Delaware Limited Liability Company) |
| Notes to the Financial Statements |
Use of estimates:The preparation of financial statements in accordance with GAAP requires management to make estimates and assumptions that affect the reported amounts of assets and liabilities and disclosure of contingent assets and liabilities at the date of the financial statements and the reported amounts of income and expenses during the reporting period. Actual results could differ from those estimates.
Indemnifications:The Sponsor and its affiliates are indemnified against certain liabilities arising out of the performance of their duties for The Master Fund. In addition, in the normal course of business, the Master Fund enters into contracts with vendors and others that provide for general indemnifications. The Master Fund’s maximum exposure under these arrangements is unknown as this would involve future claims that may be made against the Master Fund. However, the Master Fund expects the risk of loss to be remote.
Statement of cash flows: The Master Fund has elected not to provide a statement of cash flows as permitted by GAAP as all of the following conditions have been met:
| ● | During the period, substantially all of the Master Fund’s investments were carried at fair value and classified as Level 1 or Level 2 measurements in accordance with FASB ASC 820; |
| ● | The Master Fund had little or no debt during the period; |
| ● | The Master Fund’s financial statements include a statement of changes in member’s equity. |
Subscriptions and redemptions: Subscriptions and redemptions can typically be made on a weekly basis as of the first day (Monday) of each week; (or, if such day is not a business day, the first business day thereafter) (each, a Subscription Date or a Redemption Date). The Master Fund may accept subscriptions or redemptions more frequently than the first day of each week, depending upon the size of the requested subscription or redemption amount, with the approval of the Sponsor.
| Note 3. | Fair Value Measurements |
The Master Fund’s investments are stated at fair value in accordance with FASB ASC 820, Fair Value Measurements and Disclosures (ASC 820). ASC 820 defines fair value, establishes a framework for measuring fair value and expands disclosures about fair value measurements. ASC 820 also emphasizes that fair value is a market-based measurement, not an entity-specific measurement, and sets out a fair value hierarchy with the highest priority being quoted prices in active market. Under ASC 820, fair value measurements are disclosed by level within that hierarchy, as follows:
Level 1 — Values for investments classified as Level 1 are based on unadjusted quoted prices for identical investments in an active market. Since valuations are based on quoted prices that are readily accessible at the measurement date, valuation of these investments does not entail a significant degree of judgment.
Level 2 — Values for investments classified as Level 2 are based on quoted prices for similar investments in an active or non-active markets for which all significant inputs are observable either directly or indirectly. Level 2 inputs may also include discounts related to restrictions on the investments.
Level 3 — Values for investments categorized as Level 3 are based on prices or valuation techniques that require inputs that are both significant to the fair value and unobservable, including valuations by the Sponsor in the absence of readily ascertainable fair values.
A description of the valuation methodologies applied to the Master Fund’s major categories of assets and liabilities measured at fair value on a recurring basis follows. Inputs that are used in determining fair value of an investment may include price information, credit data, volatility statistics, and other factors. These
F-137
| Galaxy Plus Fund – Aspect Master Fund (532) LLC |
| (A Delaware Limited Liability Company) |
| Notes to the Financial Statements |
inputs can be either observable or unobservable. All of the inputs for the Master Fund were observable as of December 31, 2016. The availability of observable inputs can vary between investments and is affected by various factors such as type of investment and the volume and level of activity for that investment or similar investments in the marketplace.
Exchange-traded derivative contracts that are actively traded are valued based on daily quoted settlement prices from the respective exchange and are categorized in Level 1 of the fair value hierarchy. Exchange-traded derivative contracts not actively traded and over-the-counter (OTC) derivative contracts can include futures contracts, option on futures contracts, forward contracts and option contracts whose values are based on an underlying such as interest rates, foreign currencies, credit standing of reference entities, equities or commodities. Such derivative contracts are valued using observable market data, including currency spot rates or quoted prices of the related underlying obtained from the applicable exchange or market. OTC derivative contracts are valued using the above described pricing methodology and are categorized as Level 2 within the fair value hierarchy.
The Master Fund assesses the levels of the investments at each measurement date, and transfers between levels are recognized on the actual date of the event or change in circumstances that caused the transfer in accordance with the Master Fund’s accounting policy regarding the recognition of transfers between levels of the fair value hierarchy. There were no transfers among levels 1, 2, and 3 during the period ended December 31, 2016.
The inputs or methodologies used for valuing investments are not necessarily indicative of the risk associated with investing in those instruments.
F-138
| Galaxy Plus Fund – Aspect Master Fund (532) LLC |
| (A Delaware Limited Liability Company) |
| Notes to the Financial Statements |
The following tables present the classification of derivatives, by type, into the fair value hierarchy levels as of December 31, 2016. Presentation is gross – as an asset if in a gain position and a liability if in a loss position.
| Fair Value Measurements at Reporting Date Using | ||||||||||||||||
| Quoted Prices | Significant Other | Significant | ||||||||||||||
| in Active | Observable | Unobservable | ||||||||||||||
| Markets | Inputs | Inputs | ||||||||||||||
| Description | Fair Value | (Level 1) | (Level 2) | (Level 3) | ||||||||||||
| Assets: | ||||||||||||||||
| Derivative contracts: | ||||||||||||||||
| Futures contracts: | ||||||||||||||||
| Agriculture | $ | 469 | $ | 469 | $ | — | $ | — | ||||||||
| Currency | 256 | 256 | — | — | ||||||||||||
| Energy | 14,432 | 14,432 | — | — | ||||||||||||
| Index | 64,694 | 64,694 | — | — | ||||||||||||
| Interest | 17,325 | 17,325 | — | — | ||||||||||||
| Metals | 5,609 | 5,609 | — | — | ||||||||||||
| Total investment assets at fair value | 102,785 | 102,785 | — | — | ||||||||||||
| Liabilities: | ||||||||||||||||
| Derivative contracts: | ||||||||||||||||
| Futures contracts: | ||||||||||||||||
| Agriculture | (24,338 | ) | (24,338 | ) | — | — | ||||||||||
| Currency | (116,769 | ) | (116,769 | ) | — | — | ||||||||||
| Energy | (800 | ) | (800 | ) | — | — | ||||||||||
| Index | (82,555 | ) | (82,555 | ) | — | — | ||||||||||
| Interest | (113,586 | ) | (113,586 | ) | — | — | ||||||||||
| Metals | (50,771 | ) | (50,771 | ) | — | — | ||||||||||
| Total investment liabilities at fair value | (388,819 | ) | (388,819 | ) | — | — | ||||||||||
| Total net investment at fair value | $ | (286,034 | ) | $ | (286,034 | ) | $ | — | $ | — | ||||||
F-139
| Galaxy Plus Fund – Aspect Master Fund (532) LLC |
| (A Delaware Limited Liability Company) |
| Notes to the Financial Statements |
| Note 4. | Derivative Financial Instruments |
Derivative financial instruments speculatively traded by the Master Fund can include U.S. and foreign futures, options on futures contracts and forward currency contracts (collectively, derivatives) whose values are based upon an underlying asset, indices, or reference rates, and generally represent future commitments to exchange cash flows, or to purchase or sell other financial instruments at specified future dates. A derivative contract may be traded on an exchange or OTC. Exchange-traded derivatives are standardized and include futures and option on futures contracts. OTC derivative contracts are negotiated between contracting parties and include forward currency contracts and certain options. Derivatives are subject to various risks similar to those related to the underlying financial instruments including market and credit risks.
Market risk is the potential for changes in the value of derivatives due to market changes, including interest and foreign exchange rate movements and fluctuations in commodity and security prices. Market risk is directly impacted by the volatility and liquidity in the markets in which the related underlying assets are traded. The market risk of the Master Fund is managed by the underlying Trading Advisors according to each respective Program. The Master Fund is exposed to a market risk equal to the notional contract value of the derivatives contracts purchased and unlimited liability on such contracts sold short.
Credit risk is the possibility that a loss may occur due to the failure of a counterparty to perform according to the terms of a contract. Credit risk due to exchange traded derivative financial instruments is significantly reduced by the regulatory requirements of the individual exchanges on which the instruments are traded. At any point in time, the credit risk for OTC derivatives is limited to the net unrealized gain for each counterparty for which a netting agreement exists, if any. In a similar fashion, liabilities represent net amounts owed to counterparties. The credit risk exposure for the Master Fund’s outstanding OTC derivatives was $0 at December 31, 2016.
Purchase and sale of futures contracts requires margin deposits with the broker. Additional deposits may be necessary for any loss on contract value. The U.S. Commodity Exchange Act requires a broker to segregate all customer transactions and assets from such broker’s proprietary activities. A customer’s cash and other property (for example, U.S. Treasury bills) deposited with a broker are considered commingled with all other customer funds subject to the broker’s segregation requirements. In the event of a broker’s insolvency, recovery may be limited to a pro rata share of segregated funds available. It is possible that the recovered amount could be less than total cash and other property deposited.
The Master Fund has a substantial portion of its assets on deposit with counterparties. In the event of a counterparty’s insolvency, recovery of The Master Fund’s assets on deposit may be limited to account insurance or other protection afforded such deposits.
The notional value represents amounts related to the Master Fund’s stock exchange indices, commodities, interest rate and foreign currencies upon which the fair value of the futures contracts held by the Master Fund are based. Notional values do not represent the current fair value of, and are not necessarily indicative of the future cash flows of the Master Fund’s futures and forward contracts. Further, the underlying price changes in relation to variables specified by the notional values affects the fair value of these derivative financial instruments. Theoretically, the Master Fund’s exposure is equal to the notional value of contracts purchased and unlimited on such contracts sold short. As of December 31, 2016, the Master Fund had open futures contracts with the following notional values by sector:
F-140
| Galaxy Plus Fund – Aspect Master Fund (532) LLC |
| (A Delaware Limited Liability Company) |
| Notes to the Financial Statements |
| Description | Quantity | Notional Value | Description | Quantity | Notional Value | |||||||||
| Long: | Short: | |||||||||||||
| Agriculture | 4 | $ | 200,800 | Agriculture | 37 | $ | (833,523 | ) | ||||||
| Currency | 14 | 1,005,500 | Currency | 96 | (10,153,788 | ) | ||||||||
| Energy | 8 | 409,568 | Index | 8 | (259,054 | ) | ||||||||
| Index | 160 | 12,411,899 | Interest | 337 | (98,099,644 | ) | ||||||||
| Interest | 25 | 3,549,392 | Metals | 10 | (1,046,944 | ) | ||||||||
| Metals | 10 | 732,057 | ||||||||||||
During the period ended December 31, 2016, the Master Fund participated in 551 futures contract transactions.
Below is a summary of net trading gains and (losses) by investment type and industry:
| Net Trading | ||||
| Gain (Loss)* | ||||
| Futures contracts: | ||||
| Agriculture | $ | (29,808 | ) | |
| Currency | (159,301 | ) | ||
| Energy | 14,792 | |||
| Index | (34,488 | ) | ||
| Interest | (113,719 | ) | ||
| Metals | (48,675 | ) | ||
| Total futures contracts | (371,199 | ) | ||
| Trading costs | (1,473 | ) | ||
| Total net trading gain (loss) | (372,672 | ) | ||
| * | Includes both realized loss of ($86,638) and unrealized loss of ($286,034) and is located in net realized and unrealized gain (loss) on investments on the statement of operations. Amounts exclude foreign currency transactions and translation. |
F-141
| Galaxy Plus Fund – Aspect Master Fund (532) LLC |
| (A Delaware Limited Liability Company) |
| Notes to the Financial Statements |
| Note 5. | Balance Sheet Offsetting |
The Master Fund is required to disclose the impact of offsetting assets and liabilities presented in the statement of financial condition to enable users of the financial statements to evaluate the effect or potential effect of netting arrangements on its financial position for recognized assets and liabilities. These recognized assets and liabilities include financial instruments and derivative instruments that are either subject to an enforceable master netting arrangement or similar agreement or meet the following right of set-off criteria: each of the two parties owes the other determinable amounts, the Master Fund has the right to set-off the amounts owed with the amounts owed by the other party, the Master Fund intends to set off, and the Fund’s right of set-off is enforceable at law.
The Master Fund is subject to enforceable master netting agreements with certain counterparties. These agreements govern the terms of certain transactions, and reduce the counterparty risk associated with relevant transactions by specifying offsetting mechanisms and collateral posting arrangements at prearranged exposure levels. Since different types of transactions have different mechanics and are sometimes traded out of different legal entities of a particular counterparty organization, each type of transaction may be covered by a different master netting arrangement, possibly resulting in the need for multiple agreements with a single counterparty. Master netting agreements may not be specific to each different asset type; in such instances, they would allow the Master Fund to close out and net its total exposure to a specified counterparty in the events of default or early termination with respect to any and all the transactions governed under a single agreement with the counterparty.
The following tables summarize the Master Fund’s netting arrangements:
| Net Amount of | ||||||||||||
| Gross Amounts | Offset in the | Assets (Liabilities) | ||||||||||
| of Recognized | Statement of | in the Statement of | ||||||||||
| Description | Assets (Liabilities) | Financial Condition | Financial Condition | |||||||||
| Futures | $ | (388,819 | ) | $ | 102,785 | $ | (286,034 | ) | ||||
| Total | $ | (388,819 | ) | $ | 102,785 | $ | (286,034 | ) | ||||
| Net Amount | ||||||||||||
| Net amount in | Cash Collateral | which is not offset | ||||||||||
| the Statement of | Received by | in the Statement of | ||||||||||
| Financial Condition | Counterparty | Financial Condition | ||||||||||
| Counterparty A | $ | (286,034 | ) | $ | 2,301,058 | $ | 2,015,024 | |||||
| Total | $ | (286,034 | ) | $ | 2,301,058 | $ | 2,015,024 | |||||
F-142
| Galaxy Plus Fund – Aspect Master Fund (532) LLC |
| (A Delaware Limited Liability Company) |
| Notes to the Financial Statements |
| Note 6. | Related Parties |
Gemini Hedge Fund Services, LLC an affiliate of the Sponsor, provides administration services for the Master Fund.
| Note 7. | Financial Highlights |
Financial highlights of the Master Fund for the period December 15, 2016 (commencement of operations) through December 31, 2016 are presented in the table below. The information has been derived from information presented in the financial statements.
| Total return (A) | (7.46 | )% | ||
| Ratio to average member’s equity (B): | ||||
| Net investment income (C) | — | % | ||
| Total expenses | — | % |
| (A) | Total return is based on the change in average member’s equity during the period of a theoretical investment made at the inception of the Master Fund. |
| (B) | The total expense and net investment loss ratios are computed based upon weighted-average member’s equity as a whole for the period ended December 31, 2016. |
| (C) | The net investment loss ratio excludes net realized and unrealized gains (losses) on investments. |
Financial highlights are calculated for each member class taken as a whole. An individual member’s return and ratios may vary based on the timing of capital transactions. The negative total return would have been larger, and the net investment income and total expense ratios would have been higher if the management and incentive fees, as well as the sponsor fees, had been charged to the Master Fund. The ratios, excluding nonrecurring expenses, have been annualized. Total return has not been annualized.
| Note 8. | Subsequent Events |
In accordance with FASB ASC 855,Subsequent Events, the Sponsor has evaluated all subsequent events requiring recognition and disclosure in the Master Fund’s financial statements through March 24, 2017, the date the financial statements were available for issuance. The Sponsor has determined that there are no material events that would require recognition or disclosure in the Master Fund’s financial statements through this date.
F-143
| Galaxy Plus Fund – Aspect Master Fund (532) LLC |
| (A Delaware Limited Liability Company) |
| Oath and Affirmation of the Commodity Pool Operator |
To the best of the knowledge and belief of the undersigned, the information contained in the annual report as of December 31, 2016 and for the period from December 16, 2016 (commencement of operations) to December 31, 2016, is accurate and complete.
 | |
| David Young, President | |
| Gemini Alternative Funds, LLC — Sponsor |
F-144
Galaxy Plus Fund –
Chesapeake Master Fund (518)
LLC
(A Delaware Limited Liability Company)
The attached annual report is filed under exemption pursuant to
Section 4.7 of the regulations under the Commodity Exchange Act.
Financial Report
December 31, 2016
F-145
Independent Auditor’s Report
Board of Directors
Galaxy Plus Fund LLC
Report on the Financial Statements
We have audited the accompanying financial statements of Galaxy Plus Fund – Chesapeake Master Fund (518) LLC (the Fund), which comprise the statement of financial condition, including the condensed schedule of investments, as of December 31, 2016, and the related statements of operations, and changes in member’s equity for the period from June 7, 2016 (commencement of operations) to December 31, 2016, and the related notes to the financial statements.
Management's Responsibility for the Financial Statements
Management is responsible for the preparation and fair presentation of these financial statements in accordance with accounting principles generally accepted in the United States of America; this includes the design, implementation and maintenance of internal control relevant to the preparation and fair presentation of financial statements that are free from material misstatement, whether due to fraud or error.
Auditor’s Responsibility
Our responsibility is to express an opinion on these financial statements based on our audit. We conducted our audit in accordance with auditing standards generally accepted in the United States of America. Those standards require that we plan and perform the audit to obtain reasonable assurance about whether the financial statements are free from material misstatement.
An audit involves performing procedures to obtain audit evidence about the amounts and disclosures in the financial statements. The procedures selected depend on the auditor’s judgment, including the assessment of the risks of material misstatement of the financial statements, whether due to fraud or error. In making those risk assessments, the auditor considers internal control relevant to the entity’s preparation and fair presentation of the financial statements in order to design audit procedures that are appropriate in the circumstances, but not for the purpose of expressing an opinion on the effectiveness of the entity’s internal control. Accordingly, we express no such opinion. An audit also includes evaluating the appropriateness of accounting policies used and the reasonableness of significant accounting estimates made by management, as well as evaluating the overall presentation of the financial statements.
We believe that the audit evidence we have obtained is sufficient and appropriate to provide a basis for our audit opinion.
F-146
Opinion
In our opinion, the financial statements referred to above present fairly, in all material respects, the financial position of Galaxy Plus Fund – Chesapeake Master Fund (518) LLC as of December 31, 2016, and the results of its operations for the period from June 7, 2016 (commencement of operations) to December 31, 2016, in accordance with accounting principles generally accepted in the United States of America.
/s/ RSM US LLP
Denver, Colorado
March 24, 2017
F-147
| Galaxy Plus Fund - Chesapeake Master Fund (518) LLC |
| (A Delaware Limited Liability Company) |
| Statement of Financial Condition |
| December 31, 2016 |
| (Expressed in U.S. Dollars) |
| Assets | ||||
| Equity in commodity trading accounts at clearing brokers: | ||||
| Cash | $ | 6,104,869 | ||
| Restricted cash - margin balance | 5,814,400 | |||
| Receivable from onshore feeder fund | 1,000 | |||
| Other assets | 11,065 | |||
| Total assets | $ | 11,931,334 | ||
| Liability and Member’s Equity | ||||
| Liability | ||||
| Deficit in commodity trading accounts at clearing brokers: | ||||
| Investments in futures contracts at fair value (represents unrealized depreciation on open derivative contracts, net) | $ | 425,852 | ||
| Total liability | 425,852 | |||
| Member’s equity | 11,505,482 | |||
| Total liability and member’s equity | $ | 11,931,334 |
See notes to financial statements.
F-148
| Galaxy Plus Fund - Chesapeake Master Fund (518) LLC |
| (A Delaware Limited Liability Company) |
| Condensed Schedule of Investments |
| December 31, 2016 |
| (Expressed in U.S. Dollars) |
| Number of | Percent of | |||||||||||
| Contracts/Units | Fair Value | Member’s Equity | ||||||||||
| Long positions: | ||||||||||||
| Derivative contracts: | ||||||||||||
| Domestic (United States): | ||||||||||||
| Futures contracts: | ||||||||||||
| Agriculture | 81 | $ | (96,938 | ) | (0.84 | )% | ||||||
| Currency | 169 | (120,815 | ) | (1.05 | ) | |||||||
| Energy | 3 | 395 | 0.01 | |||||||||
| Index | 2,085 | (183,693 | ) | (1.60 | ) | |||||||
| Metals | 8 | (39,860 | ) | (0.35 | ) | |||||||
| Foreign: | ||||||||||||
| Futures contracts: | ||||||||||||
| Agriculture | 95 | (40,914 | ) | (0.36 | ) | |||||||
| Energy | 4 | 925 | 0.01 | |||||||||
| Interest | 2 | 7,881 | 0.07 | |||||||||
| Metals | 52 | 32,589 | 0.28 | |||||||||
| Total long positions | (440,430 | ) | (3.83 | ) | ||||||||
| Short positions: | ||||||||||||
| Derivative contracts: | ||||||||||||
| Domestic (United States): | ||||||||||||
| Futures contracts: | ||||||||||||
| Agriculture | 102 | 42,890 | 0.37 | |||||||||
| Currency | 188 | 15,126 | 0.14 | |||||||||
| Index | 123 | 5,176 | 0.04 | |||||||||
| Interest | 236 | (44,437 | ) | (0.39 | ) | |||||||
| Metals | 3 | (6,000 | ) | (0.05 | ) | |||||||
| Foreign: | ||||||||||||
| Futures contracts: | ||||||||||||
| Agriculture | 135 | 51,799 | 0.45 | |||||||||
| Interest | 224 | (21,880 | ) | (0.19 | ) | |||||||
| Metals | 9 | (28,096 | ) | (0.24 | ) | |||||||
| Total short positions | 14,578 | 0.13 | ||||||||||
| Investments in futures contracts, at fair value | $ | (425,852 | ) | (3.70 | )% | |||||||
See notes to financial statements.
F-149
| (A Delaware Limited Liability Company) |
| Statement of Operations |
| For the period from June 7, 2016 (Commencement of Operations) to December 31, 2016 |
| (Expressed in U.S. Dollars) |
| Expenses: | ||||
| Interest expense | $ | 6,758 | ||
| Total expenses | 6,758 | |||
| Net investment loss | (6,758 | ) | ||
| Realized and unrealized gain (loss) on investments and foreign currency transactions: | ||||
| Net realized gain from: | ||||
| Derivative contracts1 | 405,614 | |||
| Foreign currency transactions | 3,842 | |||
| 409,456 | ||||
| Net increase (decrease) in unrealized depreciation on: | ||||
| Derivative contracts | (425,852 | ) | ||
| Translation of assets and liabilities denominated in foreign currencies | 2,117 | |||
| (423,735 | ) | |||
| Net realized and unrealized loss on investments and foreign currency transactions | (14,279 | ) | ||
| Net decrease in member’s equity resulting from operations | $ | (21,037 | ) |
| 1 | Includes broker trading commisions |
See notes to financial statements.
F-150
| Galaxy Plus Fund - Chesapeake Master Fund (518) LLC |
| (A Delaware Limited Liability Company) |
| Statement of Changes in Member’s Equity |
| For the period from June 7, 2016 (Commencement of Operations) to December 31, 2016 |
| (Expressed in U.S. Dollars) |
| Changes in member’s equity from operations: | ||||
| Net investment loss | $ | (6,758 | ) | |
| Net realized gain (loss) from derivative contracts and foreign currency transactions | 409,456 | |||
| Net increase (decrease) in unrealized depreciation on derivative contracts and translation of assets and liabilities denominated in foreign currencies | (423,735 | ) | ||
| Net decrease in member’s equity resulting from operations | (21,037 | ) | ||
| Changes in member’s equity from capital transactions: | ||||
| Proceeds from issuance of capital | 11,724,790 | |||
| Proceeds from in-kind contribution | 94,417 | |||
| Payments for redemptions of capital | (292,688 | ) | ||
| Net increase in member’s equity resulting from capital transactions | 11,526,519 | |||
| Total increase | 11,505,482 | |||
| Member’s equity, beginning of period | — | |||
| Member’s equity, end of period | $ | 11,505,482 |
See notes to financial statements.
F-151
| Galaxy Plus Fund – Chesapeake Master Fund (518) LLC |
| (A Delaware Limited Liability Company) |
| Notes to the Financial Statements |
| Note 1. | Organization and Structure |
Galaxy Plus Fund – Chesapeake Master Fund (518) LLC (the “Master Fund”) was formed in Delaware as a limited liability company on January 6, 2016 and commenced operation on June 7, 2016. The Master Fund was created to serve as the trading entity managed by Chesapeake Capital Corporation (the “Trading Advisor”) pursuant to its Diversified Program (the “Program”). The Program employs a systematic disciplined investment approach based on trend and momentum, diversification, and capital preservation.
The Master Fund and other separately formed Delaware limited liability companies (“Other Master Funds”), are investment vehicles available under the Galaxy Plus Managed Account Platform (the “Platform”). The Master Fund and the Platform are sponsored by Gemini Alternative Funds, LLC (the “Sponsor” or “GAF”) as a means of making available, to qualified high net-worth individuals and institutional investors (including fund of hedge funds) (“Investors”), a variety of third-party professional managed futures and foreign exchange advisors (“Advisors”). The Trading Advisor is not affiliated with the Sponsor.
GAF was formed in October 2013 and its principal office is located in Chicago, Illinois. GAF is registered with the U.S. Commodity Futures Trading Commission (CFTC) as a commodity pool operator and commodity trading advisor, and is a member of the National Futures Association (NFA).
Galaxy Plus Fund LLC, a Delaware Series Limited Liability Company (the “Onshore Platform”), and Galaxy Plus Fund SPC, a Cayman Islands Segregated Portfolio Company (the “Offshore Platform”) serve as the feeder funds for the Platform and invest substantially all of the assets of the respective segregated portfolios (each a “Fund”) in the Master Fund or other Master Funds. Galaxy Plus Fund - Chesapeake Feeder Fund (518) (“LLC518”), a separated series of the Onshore Platform and Galaxy Plus Fund – Chesapeake Offshore Feeder Fund (518) Segregated Portfolio (“SPC518”), a segregated portfolio of the Offshore Platform, can each invest in the Master Fund. As of December 31, 2016, SPC518 has not yet commenced operations.
LLC518 and SPC518 are collectively hereafter referred to as the “Feeder Funds”.
Subscriptions and redemptions into the Feeder Funds are the corresponding transactions with the Master Fund and are governed by the Onshore Platform’s and the Offshore Platform’s respective Confidential Offering Memorandums.
The Platform has appointed the Sponsor, under the terms of the Limited Liability Company Agreement (the “LLC Agreement”) as the managing member of the Master Fund. In such capacity, the Sponsor has the authority, to manage, with wide discretionary powers, the business and affairs of the Master Fund including the authority to select the administrator for the Master Fund. The LLC Agreement will continue to remain in force until terminated by either the Sponsor or the Platform upon not less than sixty (60) days’ prior written notice. In certain circumstances (for example, the insolvency of either party or in the event all trading for the Platform by the Advisors are suspended), the LLC Agreement may be immediately terminated by either party.
F-152
| Galaxy Plus Fund – Chesapeake Master Fund (518) LLC |
| (A Delaware Limited Liability Company) |
| Notes to the Financial Statements |
The Master Fund and the Sponsor have entered into a tri-party contract (the “Trading Agreement”) with the Trading Advisor pursuant to which the Master Fund’s trading accounts are managed, subject to rights of termination, by the Trading Advisor in accordance with the Program. The Trading Advisor may alter its Program (including its trading systems and methods and including the addition and/or deletion of any financial interests or contracts traded in the Master Fund’s trading accounts), provided that the Trading Advisor provide prior notice to the Master Fund and the Sponsor of any material change to the Trading Advisor’s Program. From time to time, the Trading Advisor (or its affiliates) may manage additional accounts, and these accounts will increase the level of competition for the same trades desired for the Master Fund, including the priorities of order entry. There is no specific limit as to the number of accounts the Trading Advisors (or their affiliates) may manage. In addition, the positions of all of the accounts owned or controlled by the Trading Advisor (or its affiliates) are aggregated for the purposes of applying speculative position limits. The management, incentive, and sponsor fees are paid directly by the Feeder Funds, and for this reason are not recorded as expenses of the Master Fund.
| Note 2. | Summary of Significant Accounting Policies |
The following is a summary of significant accounting policies consistently followed in the preparation of the Master Fund’s financial statements.
Principles of accounting:The accompanying financial statements are expressed in United States dollars (USD) and have been prepared in accordance with Generally Accepted Accounting Principles (GAAP), as established by the Financial Accounting Standards Board (FASB), to ensure consistent reporting of financial condition and results of operations. The Master Fund is an investment company and follows the accounting and reporting guidance in FASB Account Standards Codification Topic 946.
Cash and restricted cash: Cash held in the commodity trading accounts at clearing broker consists of either cash maintained in the custody of the broker, a portion of which is required margin for open positions, or amounts due to/from the broker for margin or unsettled trades. The Master Fund may also hold cash in a non-interest bearing USD commercial bank account. The Master Fund holds various currencies at the clearing broker, of which $12,052,692 is held in USD and a payable balance of ($133,423) in foreign currencies as of December 31, 2016, and are recorded in cash and restricted cash – margin balance on the statement of financial condition. The non-U.S. currencies fluctuate in value on a daily basis relative to the USD. A portion of this cash is restricted cash required to meet maintenance margin requirements. Cash with the clearing broker as of December 31, 2016 included restricted cash for margin requirements of $5,814,400. This cash becomes unrestricted when the underlying positions to which it is applicable are liquidated. Cash with the clearing broker as of December 31, 2016 included amounts due to the broker for unsettled trades of $0.
Offsetting of amounts related to certain contracts: When the requirements are met, the Master Fund offsets certain fair value amounts recognized for derivative positions executed with the same counterparty under the same master netting arrangement (See Note 5).
F-153
| Galaxy Plus Fund – Chesapeake Master Fund (518) LLC |
| (A Delaware Limited Liability Company) |
| Notes to the Financial Statements |
Valuation and Revenue Recognition:Depending on the Program and Investments traded, The Master Fund follows the following valuation and revenue recognition policies. All investments are recorded at their estimated fair value, as described in Note 3.
Futures and options on futures contracts: The Master Fund may enter into futures and options on futures contracts. Upon entering into a futures contract, The Master Fund agrees to receive or deliver a fixed quantity of an underlying instrument or commodity for an agreed-upon price, while an option contract provides the option purchaser with the right, but not the obligation, to buy or sell a security or financial instrument at a predetermined exercise price during a defined period. Futures and options on futures contracts are recorded on the trade date. The difference between the original contract amount and the fair value of futures contracts purchased or sold is reflected as unrealized appreciation/ (depreciation) on open contracts. Options on futures contracts are reflected in investments at fair value. The difference between the premiums paid or received on open options on futures contracts and fair value of such options is recorded as unrealized appreciation/(depreciation) on open contracts. The fair value of futures and options on futures contracts is based upon daily exchange settlement prices. The realized gain or loss is determined on the settlement of intraday trades first and then by the FIFO method.
Foreign currency transactions: The Master Fund’s financial statements are denominated in USD. However, foreign currency forward contracts, non-U.S. futures contracts, and non-U.S. options on futures contracts are denominated in currencies other than USD. Assets and liabilities and transactions denominated in currencies other than the USD are translated into USD at the rates in effect either at the close of business on the last business day of the reporting period or on the date of such transactions, respectively. Net realized foreign exchange gain or loss arises from the sales of foreign currencies and currency gains or losses realized between trade and settlement dates. Net unrealized foreign exchange gain and loss arises from changes in the fair value of assets and liabilities resulting from changes in exchange rates.
Trading costs: Trading costs generally consist of brokerage commissions, brokerage fees, clearing fees, exchange and regulatory fees, transaction and NFA fees. Fees vary by type of contract for each purchase and sale or sale and purchase (round turn) of futures, options on futures, and forward contracts. Commissions are paid on each individual purchase and sale transaction. These costs are recognized as expenses for futures and options on futures transactions and are included in net realized gain/loss from derivative contracts on the Statement of Operations.
Interest income/expense: Interest income and expense is recognized on an accrual basis.
Allocation of income and gains and losses: Profits and losses for each monthly accounting period, or shorter period if there are mid-month subscriptions and/or redemptions, are allocated pro-rata to the Feeder Funds based on their respective ownership percentage on the first day of each period throughout the year.
Income taxes: The Master Fund will not be subject to United States federal income taxation other than certain withholding taxes. The Master Fund evaluates tax positions taken or expected to be taken to determine whether the tax positions are more-likely-than-not of being sustained by the applicable tax authority. For tax positions meeting the more-likely-than-not threshold, the tax amount recognized in the financial statements is reduced by the largest benefit that has a greater than fifty percent likelihood of being realized upon ultimate settlement with the relevant taxing authority. The Master Fund has determined that there is no tax liability resulting from uncertain income tax positions taken or expected to be taken with respect to all open tax years. The Master Fund’s U.S. Federal tax returns for the period ended December 31, 2016, remain open. The Master Fund recognizes interest and penalties, if any,
F-154
| Galaxy Plus Fund – Chesapeake Master Fund (518) LLC |
| (A Delaware Limited Liability Company) |
| Notes to the Financial Statements |
related to unrecognized tax benefits as income tax expense in the statement of operations. During the period, the Master Fund did not accrue any interest or penalties.
Use of estimates:The preparation of financial statements in accordance with GAAP requires management to make estimates and assumptions that affect the reported amounts of assets and liabilities and disclosure of contingent assets and liabilities at the date of the financial statements and the reported amounts of income and expenses during the reporting period. Actual results could differ from those estimates.
Indemnifications:The Sponsor and its affiliates are indemnified against certain liabilities arising out of the performance of their duties for The Master Fund. In addition, in the normal course of business, the Master Fund enters into contracts with vendors and others that provide for general indemnifications. The Master Fund’s maximum exposure under these arrangements is unknown as this would involve future claims that may be made against the Master Fund. However, the Master Fund expects the risk of loss to be remote.
Statement of cash flows: The Master Fund has elected not to provide a statement of cash flows as permitted by GAAP as all of the following conditions have been met:
| ● | During the period, substantially all of the Master Fund’s investments were carried at fair value and classified as Level 1 or Level 2 measurements in accordance with FASB ASC 820; |
| ● | The Master Fund had little or no debt during the period; |
| ● | The Master Fund’s financial statements include a statement of changes in member’s equity. |
Subscriptions and redemptions: Subscriptions and redemptions can typically be made on a weekly basis as of the first day (Monday) of each week; (or, if such day is not a business day, the first business day thereafter) (each, a Subscription Date or a Redemption Date). The Master Fund may accept subscriptions or redemptions more frequently than the first day of each week, depending upon the size of the requested subscription or redemption amount, with the approval of the Sponsor.
| Note 3. | Fair Value Measurements |
The Master Fund’s investments are stated at fair value in accordance with FASB ASC 820, Fair Value Measurements and Disclosures (ASC 820). ASC 820 defines fair value, establishes a framework for measuring fair value and expands disclosures about fair value measurements. ASC 820 also emphasizes that fair value is a market-based measurement, not an entity-specific measurement, and sets out a fair value hierarchy with the highest priority being quoted prices in active market. Under ASC 820, fair value measurements are disclosed by level within that hierarchy, as follows:
Level 1 — Values for investments classified as Level 1 are based on unadjusted quoted prices for identical investments in an active market. Since valuations are based on quoted prices that are readily accessible at the measurement date, valuation of these investments does not entail a significant degree of judgment.
Level 2 — Values for investments classified as Level 2 are based on quoted prices for similar investments in an active or non-active markets for which all significant inputs are observable either directly or indirectly. Level 2 inputs may also include discounts related to restrictions on the investments.
Level 3 — Values for investments categorized as Level 3 are based on prices or valuation techniques that require inputs that are both significant to the fair value and unobservable, including valuations by the Sponsor in the absence of readily ascertainable fair values.
F-155
| Galaxy Plus Fund – Chesapeake Master Fund (518) LLC |
| (A Delaware Limited Liability Company) |
| Notes to the Financial Statements |
A description of the valuation methodologies applied to the Master Fund’s major categories of assets and liabilities measured at fair value on a recurring basis follows. Inputs that are used in determining fair value of an investment may include price information, credit data, volatility statistics, and other factors. These inputs can be either observable or unobservable. All of the inputs for the Master Fund were observable as of December 31, 2016. The availability of observable inputs can vary between investments and is affected by various factors such as type of investment and the volume and level of activity for that investment or similar investments in the marketplace.
Exchange-traded derivative contracts that are actively traded are valued based on daily quoted settlement prices from the respective exchange and are categorized in Level 1 of the fair value hierarchy. Exchange-traded derivative contracts not actively traded and over-the-counter (OTC) derivative contracts can include futures contracts, option on futures contracts, forward contracts and option contracts whose values are based on an underlying such as interest rates, foreign currencies, credit standing of reference entities, equities or commodities. Such derivative contracts are valued using observable market data, including currency spot rates or quoted prices of the related underlying obtained from the applicable exchange or market. OTC derivative contracts are valued using the above described pricing methodology and are categorized as Level 2 within the fair value hierarchy.
The Master Fund assesses the levels of the investments at each measurement date, and transfers between levels are recognized on the actual date of the event or change in circumstances that caused the transfer in accordance with the Master Fund’s accounting policy regarding the recognition of transfers between levels of the fair value hierarchy. There were no transfers among levels 1, 2, and 3 during the period ended December 31, 2016.
The inputs or methodologies used for valuing investments are not necessarily indicative of the risk associated with investing in those instruments.
F-156
| Galaxy Plus Fund – Chesapeake Master Fund (518) LLC |
| (A Delaware Limited Liability Company) |
| Notes to the Financial Statements |
The following tables present the classification of derivatives, by type, into the fair value hierarchy levels as of December 31, 2016. Presentation is gross – as an asset if in a gain position and a liability if in a loss position.
| Fair Value Measurements at Reporting Date Using | ||||||||||||||||
| Quoted Prices | Significant Other | Significant | ||||||||||||||
| in Active | Observable | Unobservable | ||||||||||||||
| Markets | Inputs | Inputs | ||||||||||||||
| Description | Fair Value | (Level 1) | (Level 2) | (Level 3) | ||||||||||||
| Assets: | ||||||||||||||||
| Derivative contracts: | ||||||||||||||||
| Futures contracts: | ||||||||||||||||
| Agriculture | $ | 196,586 | $ | 196,586 | $ | — | $ | — | ||||||||
| Currency | 197,951 | 197,951 | — | — | ||||||||||||
| Energy | 3,010 | 3,010 | — | — | ||||||||||||
| Index | 105,124 | 105,124 | — | — | ||||||||||||
| Interest | 46,146 | 46,146 | — | — | ||||||||||||
| Metals | 127,303 | 127,303 | — | — | ||||||||||||
| Total investment assets at fair value | 676,120 | 676,120 | — | — | ||||||||||||
| Liabilities: | ||||||||||||||||
| Derivative contracts: | ||||||||||||||||
| Futures contracts: | ||||||||||||||||
| Agriculture | (239,749 | ) | (239,749 | ) | — | — | ||||||||||
| Currency | (303,640 | ) | (303,640 | ) | — | — | ||||||||||
| Energy | (1,690 | ) | (1,690 | ) | — | — | ||||||||||
| Index | (283,641 | ) | (283,641 | ) | — | — | ||||||||||
| Interest | (104,582 | ) | (104,582 | ) | — | — | ||||||||||
| Metals | (168,670 | ) | (168,670 | ) | — | — | ||||||||||
| Total investment liabilities at fair value | (1,101,972 | ) | (1,101,972 | ) | — | — | ||||||||||
| Total net investment at fair value | $ | (425,852 | ) | $ | (425,852 | ) | $ | — | $ | — | ||||||
F-157
| Galaxy Plus Fund – Chesapeake Master Fund (518) LLC |
| (A Delaware Limited Liability Company) |
| Notes to the Financial Statements |
| Note 4. | Derivative Financial Instruments |
Derivative financial instruments speculatively traded by the Master Fund can include U.S. and foreign futures, options on futures contracts and forward currency contracts (collectively, derivatives) whose values are based upon an underlying asset, indices, or reference rates, and generally represent future commitments to exchange cash flows, or to purchase or sell other financial instruments at specified future dates. A derivative contract may be traded on an exchange or OTC. Exchange-traded derivatives are standardized and include futures and option on futures contracts. OTC derivative contracts are negotiated between contracting parties and include forward currency contracts and certain options. Derivatives are subject to various risks similar to those related to the underlying financial instruments including market and credit risks.
Market risk is the potential for changes in the value of derivatives due to market changes, including interest and foreign exchange rate movements and fluctuations in commodity and security prices. Market risk is directly impacted by the volatility and liquidity in the markets in which the related underlying assets are traded. The market risk of the Master Fund is managed by the underlying Trading Advisors according to each respective Program. The Master Fund is exposed to a market risk equal to the notional contract value of the derivatives contracts purchased and unlimited liability on such contracts sold short.
Credit risk is the possibility that a loss may occur due to the failure of a counterparty to perform according to the terms of a contract. Credit risk due to exchange traded derivative financial instruments is significantly reduced by the regulatory requirements of the individual exchanges on which the instruments are traded. At any point in time, the credit risk for OTC derivatives is limited to the net unrealized gain for each counterparty for which a netting agreement exists, if any. In a similar fashion, liabilities represent net amounts owed to counterparties. The credit risk exposure for the Master Fund’s outstanding OTC derivatives was $0 at December 31, 2016.
Purchase and sale of futures contracts requires margin deposits with the broker. Additional deposits may be necessary for any loss on contract value. The U.S. Commodity Exchange Act requires a broker to segregate all customer transactions and assets from such broker’s proprietary activities. A customer’s cash and other property (for example, U.S. Treasury bills) deposited with a broker are considered commingled with all other customer funds subject to the broker’s segregation requirements. In the event of a broker’s insolvency, recovery may be limited to a pro rata share of segregated funds available. It is possible that the recovered amount could be less than total cash and other property deposited.
The Master Fund has a substantial portion of its assets on deposit with counterparties. In the event of a counterparty’s insolvency, recovery of The Master Fund’s assets on deposit may be limited to account insurance or other protection afforded such deposits.
The notional value represents amounts related to the Master Fund’s stock exchange indices, commodities, interest rate and foreign currencies upon which the fair value of the futures contracts held by the Master Fund are based. Notional values do not represent the current fair value of, and are not necessarily indicative of the future cash flows of the Master Fund’s futures and forward contracts. Further, the underlying price changes in relation to variables specified by the notional values affects the fair value of these derivative financial instruments. Theoretically, the Master Fund’s exposure is equal to the notional value of contracts purchased and unlimited on such contracts sold short. As of December 31, 2016, the Master Fund had open futures contracts with the following notional values by sector:
F-158
| Galaxy Plus Fund – Chesapeake Master Fund (518) LLC |
| (A Delaware Limited Liability Company) |
| Notes to the Financial Statements |
| Description | Quantity | Notional Value | Description | Quantity | Notional Value | |||||||||||||
| Long: | Short: | |||||||||||||||||
| Agriculture | 176 | $ | 4,295,326 | Agriculture | 237 | $ | (4,580,359 | ) | ||||||||||
| Currency | 169 | 13,042,755 | Currency | 188 | (19,846,112 | ) | ||||||||||||
| Energy | 7 | 388,247 | Index | 123 | (839,216 | ) | ||||||||||||
| Index | 2,085 | 16,290,529 | Interest | 460 | (80,443,020 | ) | ||||||||||||
| Interest | 2 | 310,850 | Metals | 12 | (970,948 | ) | ||||||||||||
| Metals | 60 | 4,041,915 | ||||||||||||||||
During the period ended December 31, 2016, the Master Fund participated in 2,837 futures contract transactions.
Below is a summary of net trading gains and (losses) by investment type and industry:
| Net Trading | ||||
| Gain (Loss)* | ||||
| Futures contracts: | ||||
| Agriculture | $ | (22,570 | ) | |
| Currency | 558,170 | |||
| Energy | (53,624 | ) | ||
| Index | 196,686 | |||
| Interest | (421,152 | ) | ||
| Metals | (242,409 | ) | ||
| Total futures | 15,101 | |||
| Trading costs | (35,339 | ) | ||
| Total net trading gain (loss) | (20,238 | ) | ||
| * | Includes both realized gain of $405,614 and unrealized loss of ($425,852) and is located in net realized and unrealized gain (loss) on investments on the statement of operations. Amounts exclude foreign currency transactions and translation. |
F-159
| Galaxy Plus Fund – Chesapeake Master Fund (518) LLC |
| (A Delaware Limited Liability Company) |
| Notes to the Financial Statements |
| Note 5. | Balance Sheet Offsetting |
The Master Fund is required to disclose the impact of offsetting assets and liabilities presented in the statement of financial condition to enable users of the financial statements to evaluate the effect or potential effect of netting arrangements on its financial position for recognized assets and liabilities. These recognized assets and liabilities include financial instruments and derivative instruments that are either subject to an enforceable master netting arrangement or similar agreement or meet the following right of set-off criteria: each of the two parties owes the other determinable amounts, the Master Fund has the right to set-off the amounts owed with the amounts owed by the other party, the Master Fund intends to set off, and the Fund’s right of set-off is enforceable at law.
The Master Fund is subject to enforceable master netting agreements with certain counterparties. These agreements govern the terms of certain transactions, and reduce the counterparty risk associated with relevant transactions by specifying offsetting mechanisms and collateral posting arrangements at prearranged exposure levels. Since different types of transactions have different mechanics and are sometimes traded out of different legal entities of a particular counterparty organization, each type of transaction may be covered by a different master netting arrangement, possibly resulting in the need for multiple agreements with a single counterparty. Master netting agreements may not be specific to each different asset type; in such instances, they would allow the Master Fund to close out and net its total exposure to a specified counterparty in the events of default or early termination with respect to any and all the transactions governed under a single agreement with the counterparty.
The following tables summarize the Master Fund’s netting arrangements:
| Net Amount of | ||||||||||||
| Gross Amounts | Offset in the | Assets (Liabilities) | ||||||||||
| of Recognized | Statement of | in the Statement of | ||||||||||
| Description | Assets (Liabilities) | Financial Condition | Financial Condition | |||||||||
| Futures | $ | (1,101,972 | ) | $ | 676,120 | $ | (425,852 | ) | ||||
| Total | $ | (1,101,972 | ) | $ | 676,120 | $ | (425,852 | ) | ||||
| Net Amount | ||||||||||||
| Net amount in | Cash Collateral | which is not offset | ||||||||||
| the Statement of | Received by | in the Statement of | ||||||||||
| Financial Condition | Counterparty | Financial Condition | ||||||||||
| Counterparty A | $ | (425,852 | ) | $ | 5,814,400 | $ | 5,388,548 | |||||
| Total | $ | (425,852 | ) | $ | 5,814,400 | $ | 5,388,548 | |||||
F-160
| Galaxy Plus Fund – Chesapeake Master Fund (518) LLC |
| (A Delaware Limited Liability Company) |
| Notes to the Financial Statements |
| Note 6. | Related Parties |
Gemini Hedge Fund Services, LLC an affiliate of the Sponsor, provides administration services for the Master Fund.
| Note 7. | Subscription in kind |
The Master Fund commenced operations on June 7, 2016. The first subscription into the Master Fund was made by LLC518 and was done, in part, via a transfer of assets on that date. LLC518 contributed $94,417 in unrealized appreciation on open futures contracts.
| Note 8. | Financial Highlights |
Financial highlights of the Master Fund for the period June 7, 2016 (commencement of operations) through December 31, 2016 are presented in the table below. The information has been derived from information presented in the financial statements.
| Total return (A) | (0.46 | )% | ||
| Ratio to average member’s equity (B): | ||||
| Net investment income (C) | (0.09 | )% | ||
| Total expenses | 0.09 | % |
| (A) | Total return is based on the change in average member’s equity during the period of a theoretical investment made at the inception of the Master Fund. |
| (B) | The total expense and net investment loss ratios are computed based upon weighted-average member’s equity as a whole for the period ended December 31, 2016. |
| (C) | The net investment loss ratio excludes net realized and unrealized gains (losses) on investments. |
Financial highlights are calculated for each member class taken as a whole. An individual member’s return and ratios may vary based on the timing of capital transactions. The total return and net investment income would have been lower and total expense ratios would have been higher if the Trading Advisor management and incentive fees, as well as the sponsor fees, had been charged to the Master Fund instead of the Feeder Fund. The ratios, excluding nonrecurring expenses, have been annualized. Total return has not been annualized.
| Note 9. | Subsequent Events |
In accordance with FASB ASC 855,Subsequent Events, the Sponsor has evaluated all subsequent events requiring recognition and disclosure in the Master Fund’s financial statements through March 24, 2017, the date the financial statements were available for issuance. The Sponsor has determined that there are no material events that would require recognition or disclosure in the Master Fund’s financial statements through this date.
F-161
| Galaxy Plus Fund – Chesapeake Master Fund (518) LLC |
| (A Delaware Limited Liability Company) |
| Oath and Affirmation of the Commodity Pool Operator |
To the best of the knowledge and belief of the undersigned, the information contained in the annual report as of December 31, 2016 and for the period from June 7, 2016 (commencement of operations) to December 31, 2016, is accurate and complete.
|
| David Young, President |
| Gemini Alternative Funds, LLC — Sponsor |
F-162
| Galaxy Plus Fund – Doherty |
| Master Fund (528) LLC |
| (A Delaware Limited Liability Company) |
| The attached annual report is filed under exemption pursuant to |
| Section 4.7 of the regulations under the Commodity Exchange Act. |
| Financial Report |
| December 31, 2016 |
F-163
Independent Auditor’s Report
Board of Directors
Galaxy Plus Fund LLC
Report on the Financial Statements
We have audited the accompanying financial statements of Galaxy Plus Fund – Doherty Master Fund (528) LLC (the Fund), which comprise the statement of financial condition, including the condensed schedule of investments, as of December 31, 2016, and the related statements of operations, and changes in member’s equity for the period from July 19, 2016 (commencement of operations) to December 31, 2016, and the related notes to the financial statements.
Management's Responsibility for the Financial Statements
Management is responsible for the preparation and fair presentation of these financial statements in accordance with accounting principles generally accepted in the United States of America; this includes the design, implementation and maintenance of internal control relevant to the preparation and fair presentation of financial statements that are free from material misstatement, whether due to fraud or error.
Auditor’s Responsibility
Our responsibility is to express an opinion on these financial statements based on our audit. We conducted our audit in accordance with auditing standards generally accepted in the United States of America. Those standards require that we plan and perform the audit to obtain reasonable assurance about whether the financial statements are free from material misstatement.
An audit involves performing procedures to obtain audit evidence about the amounts and disclosures in the financial statements. The procedures selected depend on the auditor’s judgment, including the assessment of the risks of material misstatement of the financial statements, whether due to fraud or error. In making those risk assessments, the auditor considers internal control relevant to the entity’s preparation and fair presentation of the financial statements in order to design audit procedures that are appropriate in the circumstances, but not for the purpose of expressing an opinion on the effectiveness of the entity’s internal control. Accordingly, we express no such opinion. An audit also includes evaluating the appropriateness of accounting policies used and the reasonableness of significant accounting estimates made by management, as well as evaluating the overall presentation of the financial statements.
We believe that the audit evidence we have obtained is sufficient and appropriate to provide a basis for our audit opinion.
F-164
Opinion
In our opinion, the financial statements referred to above present fairly, in all material respects, the financial position of Galaxy Plus Fund – Doherty Master Fund (528) LLC as of December 31, 2016, and the results of its operations for the period from July 19, 2016 (commencement of operations) to December 31, 2016, in accordance with accounting principles generally accepted in the United States of America.
/s/ RSM US LLP
Denver, Colorado
March 24, 2017
F-165
Galaxy Plus Fund - Doherty Master Fund (528) LLC
(A Delaware Limited Liability Company)
| Statement of Financial Condition |
| December 31, 2016 |
| (Expressed in U.S. Dollars) |
| Assets | ||||
| Equity in commodity trading accounts at clearing brokers: | ||||
| Cash | $ | 6,032,278 | ||
| Restricted cash - margin balance | 496,013 | |||
| Options purchased, at fair value (cost: $284,965) | 173,153 | |||
| Receivable from onshore feeder fund | 1,000 | |||
| Other assets | 11,869 | |||
| Total assets | $ | 6,714,313 | ||
| Liabilities and member’s equity | ||||
| Liabilities | ||||
| Deficit in commodity trading accounts at clearing brokers: | ||||
| Investments in futures contracts at fair value (represents unrealized depreciation on open derivative contracts, net) | $ | 6,600 | ||
| Options written, at fair value (proceeds: $345,843) | 150,655 | |||
| Total liabilities | 157,255 | |||
| Member’s equity | 6,557,058 | |||
| Total liabilities and member’s equity | $ | 6,714,313 | ||
See notes to financial statements.
F-166
Galaxy Plus Fund - Doherty Master Fund (528) LLC
(A Delaware Limited Liability Company)
| Condensed Schedule of Investments |
| December 31, 2016 |
| (Expressed in U.S. Dollars) |
| Number of | Percent of | |||||||||||
| Contracts/Units | Fair Value | Member’s Equity | ||||||||||
| Long positions: | ||||||||||||
| Derivative contracts: | ||||||||||||
| Domestic (United States): | ||||||||||||
| Options purchased on futures contracts: | ||||||||||||
| Index (cost: $284,965) | 230 | $ | 173,153 | 2.64 | % | |||||||
| Futures contracts: | ||||||||||||
| Index | 6 | (6,600 | ) | (0.10 | ) | |||||||
| Total long positions | 166,553 | 2.54 | ||||||||||
| Short positions: | ||||||||||||
| Derivative contracts: | ||||||||||||
| Domestic (United States): | ||||||||||||
| Options written on futures contracts: | ||||||||||||
| Index (proceeds: $345,843) | 2,037 | (150,655 | ) | (2.30 | ) | |||||||
| Total short positions | (150,655 | ) | (2.30 | ) | ||||||||
| Investments and options, at fair value | $ | 15,898 | 0.24 | % | ||||||||
See notes to financial statements.
F-167
Galaxy Plus Fund - Doherty Master Fund (528) LLC
(A Delaware Limited Liability Company)
Statement of Operations
For the period from July 19, 2016 (Commencement of Operations) to December 31, 2016
| (Expressed in U.S. Dollars) |
| Net investment income | $ | — | ||
| Realized and unrealized gain (loss) on investments: | ||||
| Net realized gain (loss) from: | ||||
| Derivative contracts1 | 212,853 | |||
| 212,853 | ||||
| Net increase (decrease) in unrealized appreciation on: | ||||
| Derivative contracts | 76,776 | |||
| 76,776 | ||||
| Net realized and unrealized gain on investments and foreign currency transactions | 289,629 | |||
| Net increase in member’s equity resulting from operations | $ | 289,629 |
| 1 | Includes broker trading commissions |
See notes to financial statements.
F-168
Galaxy Plus Fund - Doherty Master Fund (528) LLC
(A Delaware Limited Liability Company)
| Statement of Changes in Member’s Equity |
| For the period from July 19, 2016 (Commencement of Operations) to December 31, 2016 |
| (Expressed in U.S. Dollars) |
| Changes in member’s equity from operations: | ||||
| Net investment income | $ | — | ||
| Net realized gain (loss) from investments | 212,853 | |||
| Net increase (decrease) in unrealized appreciation on investments | 76,776 | |||
| Net increase in member’s equity resulting from operations | 289,629 | |||
| Changes in member’s equity from capital transactions: | ||||
| Proceeds from issuance of capital | 6,260,916 | |||
| Proceeds from in-kind contribution | 75,670 | |||
| Payments for redemptions of capital | (69,157 | ) | ||
| Net increase in member’s equity resulting from capital transactions | 6,267,429 | |||
| Total increase | 6,557,058 | |||
| Member’s equity, beginning of period | — | |||
| Member’s equity, end of period | $ | 6,557,058 |
See notes to financial statements.
F-169
| Galaxy Plus Fund – Doherty Master Fund (528) LLC |
| (A Delaware Limited Liability Company) |
| Notes to the Financial Statements |
| Note 1. | Organization and Structure |
Galaxy Plus Fund – Doherty Master Fund (528) LLC (the “Master Fund”) was formed in Delaware as a limited liability company on April 20, 2016 and commenced operation on July 19, 2016. The Master Fund was created to serve as the trading entity managed by Doherty Advisory, L.L.C. (the “Trading Advisor”) pursuant to its Relative Value Moderate (the “Program”). The Program is a discretionary pure relative value/market neutral arbitrage strategy.
The Master Fund and other separately formed Delaware limited liability companies (“Other Master Funds”), are investment vehicles available under the Galaxy Plus Managed Account Platform (the “Platform”). The Master Fund and the Platform are sponsored by Gemini Alternative Funds, LLC (the “Sponsor” or “GAF”) as a means of making available, to qualified high net-worth individuals and institutional investors (including fund of hedge funds) (“Investors”), a variety of third-party professional managed futures and foreign exchange advisors (“Advisors”). The Trading Advisor is not affiliated with the Sponsor.
GAF was formed in October 2013 and its principal office is located in Chicago, Illinois. GAF is registered with the U.S. Commodity Futures Trading Commission (CFTC) as a commodity pool operator and commodity trading advisor, and is a member of the National Futures Association (NFA).
Galaxy Plus Fund LLC, a Delaware Series Limited Liability Company (the “Onshore Platform”), and Galaxy Plus Fund SPC, a Cayman Islands Segregated Portfolio Company (the “Offshore Platform”) serve as the feeder funds for the Platform and invest substantially all of the assets of the respective segregated portfolios (each a “Fund”) in the Master Fund or other Master Funds. Galaxy Plus Fund – Doherty Feeder Fund (528) (“LLC528”), a separated series of the Onshore Platform and Galaxy Plus Fund – Doherty Offshore Feeder Fund (528) Segregated Portfolio (“SPC528”), a segregated portfolio of the Offshore Platform, can each invest in the Master Fund. As of December 31, 2016, SPC528 has not yet commenced operations.
LLC528 and SPC528 are collectively hereafter referred to as the “Feeder Funds”.
Subscriptions and redemptions into the Feeder Funds are the corresponding transactions with the Master Fund and are governed by the Onshore Platform’s and the Offshore Platform’s respective Confidential Offering Memorandums.
The Platform has appointed the Sponsor, under the terms of the Limited Liability Company Agreement (the “LLC Agreement”) as the managing member of the Master Fund. In such capacity, the Sponsor has the authority, to manage, with wide discretionary powers, the business and affairs of the Master Fund including the authority to select the administrator for the Master Fund. The LLC Agreement will continue to remain in force until terminated by either the Sponsor or the Platform upon not less than sixty (60) days’ prior written notice. In certain circumstances (for example, the insolvency of either party or in the event all trading for the Platform by the Advisors are suspended), the LLC Agreement may be immediately terminated by either party.
F-170
| Galaxy Plus Fund – Doherty Master Fund (528) LLC |
| (A Delaware Limited Liability Company) |
| Notes to the Financial Statements |
The Master Fund and the Sponsor have entered into a tri-party contract (the “Trading Agreement”) with the Trading Advisor pursuant to which the Master Fund’s trading accounts are managed, subject to rights of termination, by the Trading Advisor in accordance with the Program. The Trading Advisor may alter its Program (including its trading systems and methods and including the addition and/or deletion of any financial interests or contracts traded in the Master Fund’s trading accounts), provided that the Trading Advisor provide prior notice to the Master Fund and the Sponsor of any material change to the Trading Advisor’s Program. From time to time, the Trading Advisor (or its affiliates) may manage additional accounts, and these accounts will increase the level of competition for the same trades desired for the Master Fund, including the priorities of order entry. There is no specific limit as to the number of accounts the Trading Advisors (or their affiliates) may manage. In addition, the positions of all of the accounts owned or controlled by the Trading Advisor (or its affiliates) are aggregated for the purposes of applying speculative position limits. The management, incentive, and sponsor fees are paid directly by the Feeder Funds, and for this reason are not recorded as expenses of the Master Fund.
| Note 2. | Summary of Significant Accounting Policies |
The following is a summary of significant accounting policies consistently followed in the preparation of the Master Fund’s financial statements.
Principles of accounting:The accompanying financial statements are expressed in United States dollars (USD) and have been prepared in accordance with Generally Accepted Accounting Principles (GAAP), as established by the Financial Accounting Standards Board (FASB), to ensure consistent reporting of financial condition and results of operations. The Master Fund is an investment company and follows the accounting and reporting guidance in FASB Account Standards Codification Topic 946.
Cash and restricted cash: Cash held in the commodity trading accounts at clearing broker consists of either cash maintained in the custody of the broker, a portion of which is required margin for open positions, or amounts due to/from the broker for margin or unsettled trades. The Master Fund may also hold cash in a non-interest bearing USD commercial bank account. The Master Fund can hold various currencies at the clearing broker, of which $6,528,291 is held in USD and $0 in foreign currencies as of December 31, 2016, and are recorded in cash and restricted cash – margin balance on the statement of financial condition. The non-U.S. currencies fluctuate in value on a daily basis relative to the USD. A portion of this cash is restricted cash required to meet maintenance margin requirements. Cash with the clearing broker as of December 31, 2016 included restricted cash for margin requirements of $496,013. This cash becomes unrestricted when the underlying positions to which it is applicable are liquidated. Cash with the clearing broker as of December 31, 2016 included amounts due to the broker for unsettled trades of $0.
Offsetting of amounts related to certain contracts: When the requirements are met, the Master Fund offsets certain fair value amounts recognized for net derivative positions executed with the same counterparty under the same master netting arrangement (See Note 5).
F-171
| Galaxy Plus Fund – Doherty Master Fund (528) LLC |
| (A Delaware Limited Liability Company) |
| Notes to the Financial Statements |
Valuation and Revenue Recognition: Depending on the Program and Investments traded, The Master Fund follows the following valuation and revenue recognition policies. All investments are recorded at their estimated fair value, as described in Note 3.
Futures and options on futures contracts: The Master Fund may enter into futures and options on futures contracts. Upon entering into a futures contract, The Master Fund agrees to receive or deliver a fixed quantity of an underlying instrument or commodity for an agreed-upon price, while an option contract provides the option purchaser with the right, but not the obligation, to buy or sell a security or financial instrument at a predetermined exercise price during a defined period. Futures and options on futures contracts are recorded on the trade date. The difference between the original contract amount and the fair value of futures contracts purchased or sold is reflected as unrealized appreciation/(depreciation) on open contracts. Options on futures contracts are reflected in investments at fair value. The difference between the premiums paid or received on open options on futures contracts and fair value of such options is recorded as unrealized appreciation/(depreciation) on open contracts. The fair value of futures and options on futures contracts is based upon daily exchange settlement prices. The realized gain or loss is determined on the settlement of intraday trades first and then by the FIFO method.
Trading costs: Trading costs generally consist of brokerage commissions, brokerage fees, clearing fees, exchange and regulatory fees, transaction and NFA fees. Fees vary by type of contract for each purchase and sale or sale and purchase (round turn) of futures, options on futures, and forward contracts. Commissions are paid on each individual purchase and sale transaction. These costs are recognized as expenses for futures and options on futures transactions and are included in net realized gain/loss from derivative contracts on the Statement of Operations.
Interest income/expense: Interest income and expense is recognized on an accrual basis.
Allocation of income and gains and losses: Profits and losses for each monthly accounting period, or shorter period if there are mid-month subscriptions and/or redemptions, are allocated pro-rata to the Feeder Funds based on their respective ownership percentage on the first day of each period throughout the year.
Income taxes: The Master Fund will not be subject to United States federal income taxation other than certain withholding taxes. The Master Fund evaluates tax positions taken or expected to be taken to determine whether the tax positions are more-likely-than-not of being sustained by the applicable tax authority. For tax positions meeting the more-likely-than-not threshold, the tax amount recognized in the financial statements is reduced by the largest benefit that has a greater than fifty percent likelihood of being realized upon ultimate settlement with the relevant taxing authority. The Master Fund has determined that there is no tax liability resulting from uncertain income tax positions taken or expected to be taken with respect to all open tax years. The Master Fund’s U.S. Federal tax returns for the period ended December 31, 2016, remain open. The Master Fund recognizes interest and penalties, if any, related to unrecognized tax benefits as income tax expense in the statement of operations. During the period, the Master Fund did not accrue any interest or penalties.
Use of estimates:The preparation of financial statements in accordance with GAAP requires management to make estimates and assumptions that affect the reported amounts of assets and liabilities and disclosure of contingent assets and liabilities at the date of the financial statements and the reported amounts of income and expenses during the reporting period. Actual results could differ from those estimates.
Indemnifications:The Sponsor and its affiliates are indemnified against certain liabilities arising out of the performance of their duties for The Master Fund. In addition, in the normal course of business, the Master Fund enters into contracts with vendors and others that provide for general indemnifications. The Master Fund’s maximum exposure under these arrangements is unknown as this would involve future claims that may be made against the Master Fund. However, the Master Fund expects the risk of loss to be remote.
F-172
| Galaxy Plus Fund – Doherty Master Fund (528) LLC |
| (A Delaware Limited Liability Company) |
| Notes to the Financial Statements |
Statement of cash flows: The Master Fund has elected not to provide a statement of cash flows as permitted by GAAP as all of the following conditions have been met:
| ● | During the period, substantially all of the Master Fund’s investments were carried at fair value and classified as Level 1 or Level 2 measurements in accordance with FASB ASC 820; |
| ● | The Master Fund had little or no debt during the period; |
| ● | The Master Fund’s financial statements include a statement of changes in member’s equity. |
Subscriptions and redemptions: Subscriptions and redemptions can typically be made on a weekly basis as of the first day (Monday) of each week; (or, if such day is not a business day, the first business day thereafter) (each, a Subscription Date or a Redemption Date). The Master Fund may accept subscriptions or redemptions more frequently than the first day of each week, depending upon the size of the requested subscription or redemption amount, with the approval of the Sponsor.
| Note 3. | Fair Value Measurements |
The Master Fund’s investments are stated at fair value in accordance with FASB ASC 820, Fair Value Measurements and Disclosures (ASC 820). ASC 820 defines fair value, establishes a framework for measuring fair value and expands disclosures about fair value measurements. ASC 820 also emphasizes that fair value is a market-based measurement, not an entity-specific measurement, and sets out a fair value hierarchy with the highest priority being quoted prices in active market. Under ASC 820, fair value measurements are disclosed by level within that hierarchy, as follows:
Level 1 — Values for investments classified as Level 1 are based on unadjusted quoted prices for identical investments in an active market. Since valuations are based on quoted prices that are readily accessible at the measurement date, valuation of these investments does not entail a significant degree of judgment.
Level 2 — Values for investments classified as Level 2 are based on quoted prices for similar investments in an active or non-active markets for which all significant inputs are observable either directly or indirectly. Level 2 inputs may also include discounts related to restrictions on the investments.
Level 3 — Values for investments categorized as Level 3 are based on prices or valuation techniques that require inputs that are both significant to the fair value and unobservable, including valuations by the Sponsor in the absence of readily ascertainable fair values.
A description of the valuation methodologies applied to the Master Fund’s major categories of assets and liabilities measured at fair value on a recurring basis follows. Inputs that are used in determining fair value of an investment may include price information, credit data, volatility statistics, and other factors. These inputs can be either observable or unobservable. All of the inputs for the Master Fund were observable as of December 31, 2016. The availability of observable inputs can vary between investments and is affected by various factors such as type of investment and the volume and level of activity for that investment or similar investments in the marketplace.
Exchange-traded derivative contracts that are actively traded are valued based on daily quoted settlement prices from the respective exchange and are categorized in Level 1 of the fair value hierarchy. Exchange-traded derivative contracts not actively traded and over-the-counter (OTC) derivative contracts can include futures contracts, option on futures contracts, forward contracts and option contracts whose values are based on an underlying such as interest rates, foreign currencies, credit standing of reference entities, equities or commodities. Such derivative contracts are valued using observable market data, including currency spot rates or quoted prices of the related underlying obtained from the applicable exchange or market. OTC derivative contracts are valued using the above described pricing methodology and are categorized as Level 2 within the fair value hierarchy.
F-173
| Galaxy Plus Fund – Doherty Master Fund (528) LLC |
| (A Delaware Limited Liability Company) |
| Notes to the Financial Statements |
The Master Fund assesses the levels of the investments at each measurement date, and transfers between levels are recognized on the actual date of the event or change in circumstances that caused the transfer in accordance with the Master Fund’s accounting policy regarding the recognition of transfers between levels of the fair value hierarchy. There were no transfers among levels 1, 2, and 3 during the period ended December 31, 2016.
The inputs or methodologies used for valuing investments are not necessarily indicative of the risk associated with investing in those instruments.
F-174
| Galaxy Plus Fund – Doherty Master Fund (528) LLC |
| (A Delaware Limited Liability Company) |
| Notes to the Financial Statements |
The following tables present the classification of derivatives, by type, into the fair value hierarchy levels as of December 31, 2016. Presentation is gross – as an asset if in a gain position and a liability if in a loss position.
| Fair Value Measurements at Reporting Date Using | ||||||||||||||||
| Quoted Prices | Significant Other | Significant | ||||||||||||||
| in Active | Observable | Unobservable | ||||||||||||||
| Markets | Inputs | Inputs | ||||||||||||||
| Description | Fair Value | (Level 1) | (Level 2) | (Level 3) | ||||||||||||
| Assets: | ||||||||||||||||
| Derivative contracts: | ||||||||||||||||
| Options purchased on futures | ||||||||||||||||
| contracts: | ||||||||||||||||
| Index | $ | 173,153 | $ | 173,153 | $ | — | $ | — | ||||||||
| Total investment assets at fair value | 173,153 | 173,153 | — | — | ||||||||||||
| Liabilities: | ||||||||||||||||
| Derivative contracts: | ||||||||||||||||
| Options written on futures contracts: | ||||||||||||||||
| Index | (150,655 | ) | (150,655 | ) | — | — | ||||||||||
| Futures contracts: | ||||||||||||||||
| Index | (6,600 | ) | (6,600 | ) | — | — | ||||||||||
| Total investment liabilities at fair value | (157,255 | ) | (157,255 | ) | — | — | ||||||||||
| Total net investment at fair value | $ | 15,898 | $ | 15,898 | $ | — | $ | — | ||||||||
F-175
| Galaxy Plus Fund – Doherty Master Fund (528) LLC |
| (A Delaware Limited Liability Company) |
| Notes to the Financial Statements |
| Note 4. | Derivative Financial Instruments |
Derivative financial instruments speculatively traded by the Master Fund can include U.S. and foreign futures, options on futures contracts and forward currency contracts (collectively, derivatives) whose values are based upon an underlying asset, indices, or reference rates, and generally represent future commitments to exchange cash flows, or to purchase or sell other financial instruments at specified future dates. A derivative contract may be traded on an exchange or OTC. Exchange-traded derivatives are standardized and include futures and option on futures contracts. OTC derivative contracts are negotiated between contracting parties and include forward currency contracts and certain options. Derivatives are subject to various risks similar to those related to the underlying financial instruments including market and credit risks.
Market risk is the potential for changes in the value of derivatives due to market changes, including interest and foreign exchange rate movements and fluctuations in commodity and security prices. Market risk is directly impacted by the volatility and liquidity in the markets in which the related underlying assets are traded. The market risk of the Master Fund is managed by the underlying Trading Advisors according to each respective Program. The Master Fund is exposed to a market risk equal to the notional contract value of the derivatives contracts purchased and unlimited liability on such contracts sold short.
Credit risk is the possibility that a loss may occur due to the failure of a counterparty to perform according to the terms of a contract. Credit risk due to exchange traded derivative financial instruments is significantly reduced by the regulatory requirements of the individual exchanges on which the instruments are traded. At any point in time, the credit risk for OTC derivatives is limited to the net unrealized gain for each counterparty for which a netting agreement exists, if any. In a similar fashion, liabilities represent net amounts owed to counterparties. The credit risk exposure for the Master Fund’s outstanding OTC derivatives was $0 at December 31, 2016.
Purchase and sale of futures contracts requires margin deposits with the broker. Additional deposits may be necessary for any loss on contract value. The U.S. Commodity Exchange Act requires a broker to segregate all customer transactions and assets from such broker’s proprietary activities. A customer’s cash and other property (for example, U.S. Treasury bills) deposited with a broker are considered commingled with all other customer funds subject to the broker’s segregation requirements. In the event of a broker’s insolvency, recovery may be limited to a pro rata share of segregated funds available. It is possible that the recovered amount could be less than total cash and other property deposited.
The Master Fund has a substantial portion of its assets on deposit with counterparties. In the event of a counterparty’s insolvency, recovery of The Master Fund’s assets on deposit may be limited to account insurance or other protection afforded such deposits.
The notional value represents amounts related to the Master Fund’s stock exchange indices, commodities, interest rate and foreign currencies upon which the fair value of the futures contracts held by the Master Fund are based. Notional values do not represent the current fair value of, and are not necessarily indicative of the future cash flows of the Master Fund’s futures and forward contracts. Further, the underlying price changes in relation to variables specified by the notional values affects the fair value of these derivative financial instruments. Theoretically, the Master Fund’s exposure is equal to the notional value of contracts purchased and unlimited on such contracts sold short. As of December 31, 2016, the Master Fund had open futures contracts with the following notional values by sector:
| Description | Quantity | Notional Value | ||||||
| Long: | ||||||||
| Index | 6 | $ | 670,875 | |||||
F-176
| Galaxy Plus Fund – Doherty Master Fund (528) LLC |
| (A Delaware Limited Liability Company) |
| Notes to the Financial Statements |
During the period ended December 31, 2016, the Master Fund participated in 280 futures contract, and 3,687 options on futures contract transactions.
Transactions in options written during the period ending December 31, 2016, were as follows:
| Combined | ||||||||
| Number of | Premiums | |||||||
| Contracts | Received | |||||||
| Options outstanding at July 19, 2016 | — | $ | — | |||||
| Options written | 7,603 | 1,033,536 | ||||||
| Options terminated in closing purchase transaction | (267 | ) | (65,527 | ) | ||||
| Options expired | (5,239 | ) | (606,413 | ) | ||||
| Options exercised | (60 | ) | (15,753 | ) | ||||
| Options outstanding at December 31, 2016 | 2,037 | $ | 345,843 | |||||
Below is a summary of net trading gains and (losses) by investment type and industry:
| Net Trading | ||||
| Gain (Loss)* | ||||
| Options on futures contracts: | ||||
| Index | $ | (78,665 | ) | |
| Total options on futures contracts | (78,665 | ) | ||
| Futures contracts: | ||||
| Index | 387,629 | |||
| Total futures contracts | 387,629 | |||
| Trading costs | (19,335 | ) | ||
| Total net trading gain (loss) | 289,629 | |||
| * | Includes both realized gain of $212,853 and unrealized gain of $76,776 and is located in net realized and unrealized gain (loss) on investments on the statement of operations. Amounts exclude foreign currency transactions and translation. |
F-177
| Galaxy Plus Fund – Doherty Master Fund (528) LLC |
| (A Delaware Limited Liability Company) |
| Notes to the Financial Statements |
| Note 5. | Balance Sheet Offsetting |
The Master Fund is required to disclose the impact of offsetting assets and liabilities presented in the statement of financial condition to enable users of the financial statements to evaluate the effect or potential effect of netting arrangements on its financial position for recognized assets and liabilities. These recognized assets and liabilities include financial instruments and derivative instruments that are either subject to an enforceable master netting arrangement or similar agreement or meet the following right of set-off criteria: each of the two parties owes the other determinable amounts, the Master Fund has the right to set-off the amounts owed with the amounts owed by the other party, the Master Fund intends to set off, and the Fund’s right of set-off is enforceable at law.
The Master Fund is subject to enforceable master netting agreements with certain counterparties. These agreements govern the terms of certain transactions, and reduce the counterparty risk associated with relevant transactions by specifying offsetting mechanisms and collateral posting arrangements at prearranged exposure levels. Since different types of transactions have different mechanics and are sometimes traded out of different legal entities of a particular counterparty organization, each type of transaction may be covered by a different master netting arrangement, possibly resulting in the need for multiple agreements with a single counterparty. Master netting agreements may not be specific to each different asset type; in such instances, they would allow the Master Fund to close out and net its total exposure to a specified counterparty in the events of default or early termination with respect to any and all the transactions governed under a single agreement with the counterparty.
The following tables summarize the Master Fund’s netting arrangements:
| Net Amount of | ||||||||||||
| Gross Amounts | Offset in the | Assets (Liabilities) | ||||||||||
| of Recognized | Statement of | in the Statement of | ||||||||||
| Description | Assets (Liabilities) | Financial Condition | Financial Condition | |||||||||
| Futures | $ | (6,600 | ) | $ | — | $ | (6,600 | ) | ||||
| Options purchased on futures contracts | 173,153 | — | 173,153 | |||||||||
| Options written on futures contracts | (150,655 | ) | — | (150,655 | ) | |||||||
| Total | $ | 15,898 | $ | — | $ | 15,898 | ||||||
| Net Amount | ||||||||||||
| Net amount in | Cash Collateral | which is not offset | ||||||||||
| the Statement of | Received by | in the Statement of | ||||||||||
| Financial Condition | Counterparty | Financial Condition | ||||||||||
| Counterparty A | $ | 15,898 | $ | 496,013 | $ | 511,911 | ||||||
| Total | $ | 15,898 | $ | 496,013 | $ | 511,911 | ||||||
F-178
| Galaxy Plus Fund – Doherty Master Fund (528) LLC |
| (A Delaware Limited Liability Company) |
| Notes to the Financial Statements |
| Note 6. | Related Parties |
Gemini Hedge Fund Services, LLC an affiliate of the Sponsor, provides administration services for the Master Fund.
| Note 7. | Subscription in kind |
The Master Fund commenced operations on July 19, 2016. The first subscription into the Master Fund was made by LLC528 and was done, in part, via a transfer of assets on that date. LLC518 contributed net $75,670 in fair value of options purchased.
| Note 8. | Financial Highlights |
Financial highlights of the Master Fund for the period July 19, 2016 (commencement of operations) through December 31, 2016 are presented in the table below. The information has been derived from information presented in the financial statements.
| Total return (A) | 4.59 | % | ||
| Ratio to average member’s equity (B): | ||||
| Net investment income (C) | — | % | ||
| Total expenses | — | % |
| (A) | Total return is based on the change in average member’s equity during the period of a theoretical investment made at the inception of the Master Fund. |
| (B) | The total expense and net investment loss ratios are computed based upon weighted-average member’s equity as a whole for the period ended December 31, 2016. |
| (C) | The net investment loss ratio excludes net realized and unrealized gains (losses) on investments. |
Financial highlights are calculated for each member class taken as a whole. An individual member’s return and ratios may vary based on the timing of capital transactions. The total return and net investment income would have been lower, and total expense ratios would have been higher if the management and incentive fees, as well as sponsor fees, had been charged to the Master Fund. The ratios, excluding nonrecurring expenses, have been annualized. Total return has not been annualized.
| Note 9. | Subsequent Events |
In accordance with FASB ASC 855,Subsequent Events, the Sponsor has evaluated all subsequent events requiring recognition and disclosure in the Master Fund’s financial statements through March 24, 2017, the date the financial statements were available for issuance. The Sponsor has determined that there are no material events that would require recognition or disclosure in the Master Fund’s financial statements through this date.
F-179
| Galaxy Plus Fund – Doherty Master Fund (528) LLC |
| (A Delaware Limited Liability Company) |
| Oath and Affirmation of the Commodity Pool Operator |
To the best of the knowledge and belief of the undersigned, the information contained in the annual report as of December 31, 2016 and for the period from July 19, 2016 (commencement of operations) to December 31, 2016, is accurate and complete.
| | |
| David Young, President | |
| Gemini Alternative Funds, LLC — Sponsor |
F-180
Galaxy Plus Fund –
Emil van Essen STP Master
Fund (516) LLC
(A Delaware Limited Liability Company)
The attached annual report is filed under exemption pursuant to
Section 4.7 of the regulations under the Commodity Exchange Act.
Financial Report
December 31, 2016
F-181
Independent Auditor’s Report
Board of Directors
Galaxy Plus Fund LLC
Report on the Financial Statements
We have audited the accompanying financial statements of Galaxy Plus Fund – Emil van Essen STP Master Fund (516) LLC (the Fund), which comprise the statement of financial condition, including the condensed schedule of investments, as of December 31, 2016, and the related statements of operations, and changes in member’s equity for the period from April 15, 2016 (commencement of operations) to December 31, 2016, and the related notes to the financial statements.
Management's Responsibility for the Financial Statements
Management is responsible for the preparation and fair presentation of these financial statements in accordance with accounting principles generally accepted in the United States of America; this includes the design, implementation and maintenance of internal control relevant to the preparation and fair presentation of financial statements that are free from material misstatement, whether due to fraud or error.
Auditor’s Responsibility
Our responsibility is to express an opinion on these financial statements based on our audit. We conducted our audit in accordance with auditing standards generally accepted in the United States of America. Those standards require that we plan and perform the audit to obtain reasonable assurance about whether the financial statements are free from material misstatement.
An audit involves performing procedures to obtain audit evidence about the amounts and disclosures in the financial statements. The procedures selected depend on the auditor’s judgment, including the assessment of the risks of material misstatement of the financial statements, whether due to fraud or error. In making those risk assessments, the auditor considers internal control relevant to the entity’s preparation and fair presentation of the financial statements in order to design audit procedures that are appropriate in the circumstances, but not for the purpose of expressing an opinion on the effectiveness of the entity’s internal control. Accordingly, we express no such opinion. An audit also includes evaluating the appropriateness of accounting policies used and the reasonableness of significant accounting estimates made by management, as well as evaluating the overall presentation of the financial statements.
We believe that the audit evidence we have obtained is sufficient and appropriate to provide a basis for our audit opinion.
F-182
Opinion
In our opinion, the financial statements referred to above present fairly, in all material respects, the financial position of Galaxy Plus Fund – Emil van Essen STP Master Fund (516) LLC as of December 31, 2016, and the results of its operations for the period from April 15, 2016 (commencement of operations) to December 31, 2016, in accordance with accounting principles generally accepted in the United States of America.
/s/ RSM US LLP
Denver, Colorado
March 24, 2017
F-183
| Galaxy Plus Fund - Emil van Essen STP Master Fund (516) LLC |
| (A Delaware Limited Liability Company) |
| Statement of Financial Condition |
| December 31, 2016 |
| (Expressed in U.S. Dollars) |
| Assets | ||||
| Equity in commodity trading accounts at clearing brokers: | ||||
| Cash | $ | 9,899,772 | ||
| Restricted cash - margin balance | 3,039,420 | |||
| Other assets | 11,987 | |||
| Total assets | $ | 12,951,179 | ||
| Liabilities and Member’s Equity | ||||
| Liabilities | ||||
| Deficit in commodity trading accounts at clearing brokers: | ||||
| Investments in futures contracts at fair value (represents unrealized depreciation on open derivative contracts, net) | $ | 1,249,410 | ||
| Payable to Onshore Feeder Fund | 50,740 | |||
| Total liabilities | 1,300,150 | |||
| Member’s equity | 11,651,029 | |||
| Total liabilities and member’s equity | $ | 12,951,179 |
See notes to financial statements.
F-184
| Galaxy Plus Fund - Emil van Essen STP Master Fund (516) LLC |
| (A Delaware Limited Liability Company) |
| Condensed Schedule of Investments |
| December 31, 2016 |
| (Expressed in U.S. Dollars) |
| Percent of | ||||||||||||
| Number of | Member’s | |||||||||||
| Contracts/Units | Fair Value | Equity | ||||||||||
| Long positions: | ||||||||||||
| Derivative contracts: | ||||||||||||
| Domestic (United States): | ||||||||||||
| Futures contracts: | ||||||||||||
| Agriculture | ||||||||||||
| Cattle | ||||||||||||
| Maturing June 2017 | 382 | $ | 585,461 | 5.02 | % | |||||||
| Other maturities | 40 | 86,572 | 0.74 | |||||||||
| Other | 352 | (67,518 | ) | (0.58 | ) | |||||||
| Energy | ||||||||||||
| Crude | ||||||||||||
| Maturing March 2018 | 416 | 1,806,575 | 15.51 | |||||||||
| Other maturities1,2 | 272 | 681,526 | 5.85 | |||||||||
| Gasoline | ||||||||||||
| Maturing March 2017 | 154 | 856,153 | 7.35 | |||||||||
| Other2 | 667 | 927,263 | 7.96 | |||||||||
| Interest | 232 | (74,449 | ) | (0.64 | ) | |||||||
| Metals | 144 | (187,498 | ) | (1.61 | ) | |||||||
| Foreign: | ||||||||||||
| Futures contracts: | ||||||||||||
| Energy | 44 | 156,200 | 1.34 | |||||||||
| Total long positions | $ | 4,770,285 | 40.94 | % | ||||||||
(Continued)
F-185
| Galaxy Plus Fund - Emil van Essen STP Master Fund (516) LLC |
| (A Delaware Limited Liability Company) |
| Condensed Schedule of Investments (Continued) |
| December 31, 2016 |
| (Expressed in U.S. Dollars) |
| Percent of | ||||||||||||
| Number of | Member’s | |||||||||||
| Contracts/Units | Fair Value | Equity | ||||||||||
| Short positions: | ||||||||||||
| Derivative contracts: | ||||||||||||
| Domestic (United States): | ||||||||||||
| Futures contracts: | ||||||||||||
| Agriculture | ||||||||||||
| Cattle | ||||||||||||
| Maturing April 2017 | 422 | $ | (823,991 | ) | (7.07 | )% | ||||||
| Other | 352 | 54,479 | 0.47 | |||||||||
| Energy | ||||||||||||
| Crude | ||||||||||||
| Maturing December 2017 | 197 | (857,258 | ) | (7.36 | ) | |||||||
| Maturing January 2018 | 241 | (1,244,171 | ) | (10.69 | ) | |||||||
| Other maturities2,3 | 423 | (604,685 | ) | (5.19 | ) | |||||||
| Diesel Fuel2,3 | 197 | (752,358 | ) | (6.46 | ) | |||||||
| Natural Gas2,4 | 523 | (849,502 | ) | (7.30 | ) | |||||||
| Gasoline | ||||||||||||
| Maturing February 2017 | 154 | (836,606 | ) | (7.18 | ) | |||||||
| Other maturities | 44 | (211,411 | ) | (1.81 | ) | |||||||
| Interest | 232 | 60,274 | 0.52 | |||||||||
| Metals | 72 | 163,716 | 1.41 | |||||||||
| Foreign: | ||||||||||||
| Futures contracts: | ||||||||||||
| Energy | 80 | (118,182 | ) | (1.01 | ) | |||||||
| Total short positions | (6,019,695 | ) | (51.67 | ) | ||||||||
| Investments and options, at fair value | $ | (1,249,410 | ) | (10.73 | )% | |||||||
| 1 | Maturities range from May 2017 through February 2018 |
| 2 | No individual contract or contract month is greater than 5% of member’s equity |
| 3 | Maturities range from February 2017 through June 2017 |
| 4 | Maturities range from February 2017 through October 2018 |
See notes to financial statements.
F-186
| Galaxy Plus Fund - Emil van Essen STP Master Fund (516) LLC |
| (A Delaware Limited Liability Company) |
| Statement of Operations |
| For the period from April 15, 2016 (Commencement of Operations) to December 31, 2016 |
| (Expressed in U.S. Dollars) |
| Net investment income | $ | — | ||
| Realized and unrealized gain (loss) on investments and foreign currency transactions: | ||||
| Net realized gain (loss) from: | ||||
| Derivative contracts1 | 3,934,142 | |||
| Foreign currency transactions | (191 | ) | ||
| 3,933,951 | ||||
| Net increase (decrease) in unrealized depreciation on: | ||||
| Derivative contracts | (1,249,410 | ) | ||
| Translation of assets and liabilities denominated in foreign currencies | (3,656 | ) | ||
| (1,253,066 | ) | |||
| Net realized and unrealized gain on investments and foreign currency transactions | 2,680,885 | |||
| Net increase in member’s equity resulting from operations | $ | 2,680,885 |
| 1 | Includes broker trading commisions |
See notes to financial statements.
F-187
| Galaxy Plus Fund - Emil van Essen STP Master Fund (516) LLC |
| (A Delaware Limited Liability Company) |
| Statement of Changes in Member’s Equity |
| For the period from April 15, 2016 (Commencement of Operations) to December 31, 2016 |
| (Expressed in U.S. Dollars) |
| Changes in member’s equity from operations: | ||||
| Net investment income | $ | — | ||
| Net realized gain (loss) from derivative contracts and foreign currency transactions | 3,933,951 | |||
| Net increase (decrease) in unrealized depreciation on derivative contracts and translation of assets and liabilities denominated in foreign currencies | (1,253,066 | ) | ||
| Net increase in member’s equity resulting from operations | 2,680,885 | |||
| Changes in member’s equity from capital transactions: | ||||
| Proceeds from issuance of capital | 12,442,498 | |||
| Payments for redemptions of capital | (3,472,354 | ) | ||
| Net increase in member’s equity resulting from capital transactions | 8,970,144 | |||
| Total increase | 11,651,029 | |||
| Member’s equity, beginning of period | — | |||
| Member’s equity, end of period | $ | 11,651,029 |
See notes to financial statements.
F-188
| Galaxy Plus Fund – Emil van Essen STP Master Fund (516) LLC |
| (A Delaware Limited Liability Company) |
| Notes to the Financial Statements |
| Note 1. | Organization and Structure |
Galaxy Plus Fund – Emil van Essen STP Master Fund (516) LLC (the “Master Fund”) was formed in Delaware as a limited liability company on January 7, 2016 and commenced operations on April 15, 2016. The Master Fund was created to serve as the trading entity managed by Emil van Essen, L.L.C. (the “Trading Advisor”) pursuant to its The Multi-Strategy Program (the “Program”). The Program is an approximate 50/50 combination of the Spread Trading Program and the Long-Short Commodity Program.
The Master Fund and other separately formed Delaware limited liability companies (“Other Master Funds”), are investment vehicles available under the Galaxy Plus Managed Account Platform (the “Platform”). The Master Fund and the Platform are sponsored by Gemini Alternative Funds, LLC (the “Sponsor” or “GAF”) as a means of making available, to qualified high net-worth individuals and institutional investors (including fund of hedge funds) (“Investors”), a variety of third-party professional managed futures and foreign exchange advisors (“Advisors”). The Trading Advisor is not affiliated with the Sponsor.
GAF was formed in October 2013 and its principal office is located in Chicago, Illinois. GAF is registered with the U.S. Commodity Futures Trading Commission (CFTC) as a commodity pool operator and commodity trading advisor, and is a member of the National Futures Association (NFA).
Galaxy Plus Fund LLC, a Delaware Series Limited Liability Company (the “Onshore Platform”), and Galaxy Plus Fund SPC, a Cayman Islands Segregated Portfolio Company (the “Offshore Platform”) serve as the feeder funds for the Platform and invest substantially all of the assets of the respective segregated portfolios (each a “Fund”) in the Master Fund or other Master funds. Galaxy Plus Fund – Emil van Essen Feeder Fund (516) (“LLC516”), a separated series of the Onshore Platform and Galaxy Plus Fund – Emil van Essen Offshore Feeder Fund (516) Segregated Portfolio (“SPC516”), a segregated portfolio of the Offshore Platform, can each invest in the Master Fund. As of December 31, 2016, SPC 516 had not yet commenced operations.
LLC530 and SPC530 are collectively hereafter referred to as the “Feeder Funds”.
Subscriptions and redemptions into the Feeder Funds are the corresponding transactions with the Master Fund and are governed by the Onshore Platform’s and the Offshore Platform’s respective Confidential Offering Memorandums.
The Platform has appointed the Sponsor, under the terms of the Limited Liability Company Agreement (the “LLC Agreement”) as the managing member of the Master Fund. In such capacity, the Sponsor has the authority, to manage, with wide discretionary powers, the business and affairs of the Master Fund including the authority to select the administrator for the Master Fund. The LLC Agreement will continue to remain in force until terminated by either the Sponsor or the Platform upon not less than sixty (60) days’ prior written notice. In certain circumstances (for example, the insolvency of either party or in the event all trading for the Platform by the Advisors are suspended), the LLC Agreement may be immediately terminated by either party.
F-189
| Galaxy Plus Fund – Emil van Essen STP Master Fund (516) LLC |
| (A Delaware Limited Liability Company) |
| Notes to the Financial Statements |
The Master Fund and the Sponsor have entered into a tri-party contract (the “Trading Agreement”) with the Trading Advisor pursuant to which the Master Fund’s trading accounts are managed, subject to rights of termination, by the Trading Advisor in accordance with the Program. The Trading Advisor may alter its Program (including its trading systems and methods and including the addition and/or deletion of any financial interests or contracts traded in the Master Fund’s trading accounts), provided that the Trading Advisor provide prior notice to the Master Fund and the Sponsor of any material change to the Trading Advisor’s Program. From time to time, the Trading Advisor (or its affiliates) may manage additional accounts, and these accounts will increase the level of competition for the same trades desired for the Master Fund, including the priorities of order entry. There is no specific limit as to the number of accounts the Trading Advisors (or their affiliates) may manage. In addition, the positions of all of the accounts owned or controlled by the Trading Advisor (or its affiliates) are aggregated for the purposes of applying speculative position limits. The management, incentive, and sponsor fees are paid directly by the Feeder Funds, and for this reason are not recorded as expenses of the Master Fund.
Note 2. Summary of Significant Accounting Policies
The following is a summary of significant accounting policies consistently followed in the preparation of the Master Fund’s financial statements.
Principles of accounting:The accompanying financial statements are expressed in United States dollars (USD) and have been prepared in accordance with Generally Accepted Accounting Principles (GAAP), as established by the Financial Accounting Standards Board (FASB), to ensure consistent reporting of financial condition and results of operations. The Master Fund is an investment company and follows the accounting and reporting guidance in FASB Account Standards Codification Topic 946.
Cash and restricted cash: Cash held in the commodity trading accounts at clearing broker consists of either cash maintained in the custody of the broker, a portion of which is required margin for open positions, or amounts due to/from the broker for margin or unsettled trades. The Master Fund may also hold cash in a non-interest bearing USD commercial bank account. The Master Fund holds various currencies at the clearing broker, of which $12,890,986 is held in USD and $48,206 in foreign currencies as of December 31, 2016, and are recorded in cash and restricted cash – margin balance on the statement of financial condition. The non-U.S. currencies fluctuate in value on a daily basis relative to the USD. A portion of this cash is restricted cash required to meet maintenance margin requirements. Cash with the clearing broker as of December 31, 2016 included restricted cash for margin requirements of $3,039,420. This cash becomes unrestricted when the underlying positions to which it is applicable are liquidated. Cash with the clearing broker as of December 31, 2016 included amounts due to the broker for unsettled trades of $0.
Offsetting of amounts related to certain contracts: When the requirements are met, the Master Fund offsets certain fair value amounts recognized for net derivative positions executed with the same counterparty under the same master netting arrangement (see Note 5).
F-190
| Galaxy Plus Fund – Emil van Essen STP Master Fund (516) LLC |
| (A Delaware Limited Liability Company) |
| Notes to the Financial Statements |
Valuation and Revenue Recognition:Depending on the Program and Investments traded, The Master Fund follows the following valuation and revenue recognition policies. All investments are recorded at their estimated fair value, as described in Note 3.
Futures and options on futures contracts: The Master Fund may enter into futures and options on futures contracts. Upon entering into a futures contract, The Master Fund agrees to receive or deliver a fixed quantity of an underlying instrument or commodity for an agreed-upon price, while an option contract provides the option purchaser with the right, but not the obligation, to buy or sell a security or financial instrument at a predetermined exercise price during a defined period. Futures and options on futures contracts are recorded on the trade date. The difference between the original contract amount and the fair value of futures contracts purchased or sold is reflected as unrealized appreciation/(depreciation) on open contracts. Options on futures contracts are reflected in investments at fair value. The difference between the premiums paid or received on open options on futures contracts and fair value of such options is recorded as unrealized appreciation/(depreciation) on open contracts. The fair value of futures and options on futures contracts is based upon daily exchange settlement prices. The realized gain or loss is determined on the settlement of intraday trades first and then by the FIFO method.
Foreign currency transactions: The Master Fund’s financial statements are denominated in USD. However, foreign currency forward contracts, non-U.S. futures contracts, and non-U.S. options on futures contracts are denominated in currencies other than USD. Assets and liabilities and transactions denominated in currencies other than the USD are translated into USD at the rates in effect either at the close of business on the last business day of the reporting period or on the date of such transactions, respectively. Net realized foreign exchange gain or loss arises from the sales of foreign currencies and currency gains or losses realized between trade and settlement dates. Net unrealized foreign exchange gain and loss arises from changes in the fair value of assets and liabilities resulting from changes in exchange rates.
Trading costs: Trading costs generally consist of brokerage commissions, brokerage fees, clearing fees, exchange and regulatory fees, transaction and NFA fees. Fees vary by type of contract for each purchase and sale or sale and purchase (round turn) of futures, options on futures, and forward contracts. Commissions are paid on each individual purchase and sale transaction. These costs are recognized as expenses for futures and options on futures transactions and are included in net realized gain/loss from derivative contracts on the Statement of Operations.
Interest income/expense: Interest income and expense is recognized on an accrual basis.
Allocation of income and gains and losses: Profits and losses for each monthly accounting period, or shorter period if there are mid-month subscriptions and/or redemptions, are allocated pro-rata to the Feeder Funds based on their respective ownership percentage on the first day of each period throughout the year.
Income taxes: The Master Fund will not be subject to United States federal income taxation other than certain withholding taxes. The Master Fund evaluates tax positions taken or expected to be taken to determine whether the tax positions are more-likely-than-not of being sustained by the applicable tax authority. For tax positions meeting the more-likely-than-not threshold, the tax amount recognized in the financial statements is reduced by the largest benefit that has a greater than fifty percent likelihood of being realized upon ultimate settlement with the relevant taxing authority. The Master Fund has determined that there is no tax liability resulting from uncertain income tax positions taken or expected to be taken with respect to all open tax years. The Master Fund’s U.S. Federal tax returns for the period ended December 31, 2016, remain open. The Master Fund recognizes interest and penalties, if any, related to unrecognized tax benefits as income tax expense in the statement of operations. During the period, the Master Fund did not accrue any interest or penalties.
F-191
| Galaxy Plus Fund – Emil van Essen STP Master Fund (516) LLC |
| (A Delaware Limited Liability Company) |
| Notes to the Financial Statements |
Use of estimates:The preparation of financial statements in accordance with GAAP requires management to make estimates and assumptions that affect the reported amounts of assets and liabilities and disclosure of contingent assets and liabilities at the date of the financial statements and the reported amounts of income and expenses during the reporting period. Actual results could differ from those estimates.
Indemnifications:The Sponsor and its affiliates are indemnified against certain liabilities arising out of the performance of their duties for The Master Fund. In addition, in the normal course of business, the Master Fund enters into contracts with vendors and others that provide for general indemnifications. The Master Fund’s maximum exposure under these arrangements is unknown as this would involve future claims that may be made against the Master Fund. However, the Master Fund expects the risk of loss to be remote.
Statement of cash flows: The Master Fund has elected not to provide a statement of cash flows as permitted by GAAP as all of the following conditions have been met:
| ● | During the period, substantially all of the Master Fund’s investments were carried at fair value and classified as Level 1 or Level 2 measurements in accordance with FASB ASC 820; |
| ● | The Master Fund had little or no debt during the period; |
| ● | The Master Fund’s financial statements include a statement of changes in member’s equity. |
Subscriptions and redemptions: Subscriptions and redemptions can typically be made on a weekly basis as of the first day (Monday) of each week; (or, if such day is not a business day, the first business day thereafter) (each, a Subscription Date or a Redemption Date). The Master Fund may accept subscriptions or redemptions more frequently than the first day of each week, depending upon the size of the requested subscription or redemption amount, with the approval of the Sponsor.
| Note 3. | Fair Value Measurements |
The Master Fund’s investments are stated at fair value in accordance with FASB ASC 820, Fair Value Measurements and Disclosures (ASC 820). ASC 820 defines fair value, establishes a framework for measuring fair value and expands disclosures about fair value measurements. ASC 820 also emphasizes that fair value is a market-based measurement, not an entity-specific measurement, and sets out a fair value hierarchy with the highest priority being quoted prices in active market. Under ASC 820, fair value measurements are disclosed by level within that hierarchy, as follows:
Level 1 — Values for investments classified as Level 1 are based on unadjusted quoted prices for identical investments in an active market. Since valuations are based on quoted prices that are readily accessible at the measurement date, valuation of these investments does not entail a significant degree of judgment.
Level 2 — Values for investments classified as Level 2 are based on quoted prices for similar investments in an active or non-active markets for which all significant inputs are observable either directly or indirectly. Level 2 inputs may also include discounts related to restrictions on the investments.
Level 3 — Values for investments categorized as Level 3 are based on prices or valuation techniques that require inputs that are both significant to the fair value and unobservable, including valuations by the Sponsor in the absence of readily ascertainable fair values.
A description of the valuation methodologies applied to the Master Fund’s major categories of assets and liabilities measured at fair value on a recurring basis follows. Inputs that are used in determining fair value of an investment may include price information, credit data, volatility statistics, and other factors. These
F-192
| Galaxy Plus Fund – Emil van Essen STP Master Fund (516) LLC |
| (A Delaware Limited Liability Company) |
| Notes to the Financial Statements |
inputs can be either observable or unobservable. All of the inputs for the Master Fund were observable as of December 31, 2016. The availability of observable inputs can vary between investments and is affected by various factors such as type of investment and the volume and level of activity for that investment or similar investments in the marketplace.
Exchange-traded derivative contracts that are actively traded are valued based on daily quoted settlement prices from the respective exchange and are categorized in Level 1 of the fair value hierarchy. Exchange-traded derivative contracts not actively traded and over-the-counter (OTC) derivative contracts can include futures contracts, option on futures contracts, forward contracts and option contracts whose values are based on an underlying such as interest rates, foreign currencies, credit standing of reference entities, equities or commodities. Such derivative contracts are valued using observable market data, including currency spot rates or quoted prices of the related underlying obtained from the applicable exchange or market. OTC derivative contracts are valued using the above described pricing methodology and are categorized as Level 2 within the fair value hierarchy.
The Master Fund assesses the levels of the investments at each measurement date, and transfers between levels are recognized on the actual date of the event or change in circumstances that caused the transfer in accordance with the Master Fund’s accounting policy regarding the recognition of transfers between levels of the fair value hierarchy. There were no transfers among levels 1, 2, and 3 during the period ended December 31, 2016.
The inputs or methodologies used for valuing investments are not necessarily indicative of the risk associated with investing in those instruments.
F-193
| Galaxy Plus Fund – Emil van Essen STP Master Fund (516) LLC |
| (A Delaware Limited Liability Company) |
| Notes to the Financial Statements |
The following tables present the classification of derivatives, by type, into the fair value hierarchy levels as of December 31, 2016. Presentation is gross – as an asset if in a gain position and a liability if in a loss position.
| Fair Value Measurements at Reporting Date Using | ||||||||||||||||
| Quoted Prices | Significant Other | Significant | ||||||||||||||
| in Active | Observable | Unobservable | ||||||||||||||
| Markets | Inputs | Inputs | ||||||||||||||
| Description | Fair Value | (Level 1) | (Level 2) | (Level 3) | ||||||||||||
| Assets: | ||||||||||||||||
| Derivative contracts: | ||||||||||||||||
| Futures contracts: | ||||||||||||||||
| Agriculture | $ | 926,560 | $ | 926,560 | $ | — | $ | — | ||||||||
| Energy | 4,621,523 | 4,621,523 | — | — | ||||||||||||
| Interest | 60,274 | 60,274 | — | — | ||||||||||||
| Metals | 168,374 | 168,374 | — | — | ||||||||||||
| Total investment assets at fair value | 5,776,731 | 5,776,731 | — | — | ||||||||||||
| Liabilities: | ||||||||||||||||
| Derivative contracts: | ||||||||||||||||
| Futures contracts: | ||||||||||||||||
| Agriculture | (1,091,557 | ) | (1,091,557 | ) | — | — | ||||||||||
| Energy | (5,667,979 | ) | (5,667,979 | ) | — | — | ||||||||||
| Interest | (74,449 | ) | (74,449 | ) | — | — | ||||||||||
| Metals | (192,156 | ) | (192,156 | ) | — | — | ||||||||||
| Total investment liabilities at fair value | (7,026,141 | ) | (7,026,141 | ) | — | — | ||||||||||
| Total net investment at fair value | $ | (1,249,410 | ) | $ | (1,249,410 | ) | $ | — | $ | — | ||||||
| Note 4. | Derivative Financial Instruments |
Derivative financial instruments speculatively traded by the Master Fund can include U.S. and foreign futures, options on futures contracts, and forward currency contracts (collectively, derivatives) whose values are based upon an underlying asset, indices, or reference rates, and generally represent future commitments to exchange cash flows, or to purchase or sell other financial instruments at specified future dates. A derivative contract may be traded on an exchange or OTC. Exchange-traded derivatives are standardized and include futures and option on futures contracts. OTC derivative contracts are negotiated between contracting parties and include forward currency contracts and certain options. Derivatives are subject to various risks similar to those related to the underlying financial instruments including market and credit risks.
F-194
| Galaxy Plus Fund – Emil van Essen STP Master Fund (516) LLC |
| (A Delaware Limited Liability Company) |
| Notes to the Financial Statements |
Market risk is the potential for changes in the value of derivatives due to market changes, including interest and foreign exchange rate movements and fluctuations in commodity and security prices. Market risk is directly impacted by the volatility and liquidity in the markets in which the related underlying assets are traded. The market risk of the Master Fund is managed by the underlying Trading Advisors according to each respective Program. The Master Fund is exposed to a market risk equal to the notional contract value of the derivatives contracts purchased and unlimited liability on such contracts sold short.
Credit risk is the possibility that a loss may occur due to the failure of a counterparty to perform according to the terms of a contract. Credit risk due to exchange traded derivative financial instruments is significantly reduced by the regulatory requirements of the individual exchanges on which the instruments are traded. At any point in time, the credit risk for OTC derivatives is limited to the net unrealized gain for each counterparty for which a netting agreement exists, if any. In a similar fashion, liabilities represent net amounts owed to counterparties. The credit risk exposure for the Master Fund’s outstanding OTC derivatives was $0 at December 31, 2016.
Purchase and sale of futures contracts requires margin deposits with the broker. Additional deposits may be necessary for any loss on contract value. The U.S. Commodity Exchange Act requires a broker to segregate all customer transactions and assets from such broker’s proprietary activities. A customer’s cash and other property (for example, U.S. Treasury bills) deposited with a broker are considered commingled with all other customer funds subject to the broker’s segregation requirements. In the event of a broker’s insolvency, recovery may be limited to a pro rata share of segregated funds available. It is possible that the recovered amount could be less than total cash and other property deposited.
The Master Fund has a substantial portion of its assets on deposit with counterparties. In the event of a counterparty’s insolvency, recovery of The Master Fund’s assets on deposit may be limited to account insurance or other protection afforded such deposits.
The notional value represents amounts related to the Master Fund’s stock exchange indices, commodities, interest rate and foreign currencies upon which the fair value of the futures contracts held by the Master Fund are based. Notional values do not represent the current fair value of, and are not necessarily indicative of the future cash flows of the Master Fund’s futures and forward contracts. Further, the underlying price changes in relation to variables specified by the notional values affects the fair value of these derivative financial instruments. Theoretically, the Master Fund’s exposure is equal to the notional value of contracts purchased and unlimited on such contracts sold short. As of December 31, 2016, the Master Fund had open futures contracts with the following notional values by sector:
| Description | Quantity | Notional Value | Description | Quantity | Notional Value | |||||||||||||
| Long: | Short: | |||||||||||||||||
| Agriculture | 774 | $ | 25,631,910 | Agriculture | 774 | $ | (27,345,460 | ) | ||||||||||
| Energy | 1,553 | 78,201,502 | Energy | 1,859 | (99,919,567 | ) | ||||||||||||
| Interest | 232 | 56,840,000 | Interest | 232 | (57,118,400 | ) | ||||||||||||
| Metals | 144 | 7,802,070 | Metals | 72 | (4,532,400 | ) | ||||||||||||
During the period ended December 31, 2016, the Master Fund participated in 3,234 futures contract, and 24 options on futures contract transactions.
F-195
| Galaxy Plus Fund – Emil van Essen STP Master Fund (516) LLC |
| (A Delaware Limited Liability Company) |
| Notes to the Financial Statements |
Transactions in options written during the period ending December 31, 2016, were as follows:
| Number of | Premiums | |||||||
| Contracts | Received | |||||||
| Options outstanding at April 15, 2016 | — | $ | — | |||||
| Options written | 1,784 | 173,640 | ||||||
| Options terminated in closing purchase transaction | — | — | ||||||
| Options expired | (1,784 | ) | (173,640 | ) | ||||
| Options exercised | — | — | ||||||
| Options outstanding at December 31, 2016 | — | $ | — | |||||
Below is a summary of net trading gains and (losses) by investment type and industry:
| Net Trading | ||||
| Gain (Loss)* | ||||
| Options on futures contracts: | ||||
| Energy | $ | (90,450 | ) | |
| Total options on future contracts | (90,450 | ) | ||
| Futures contracts: | ||||
| Agriculture | 412,690 | |||
| Energy | 1,485,335 | |||
| Interest | 109,881 | |||
| Metals | 1,121,772 | |||
| Total futures contracts | 3,129,678 | |||
| Trading costs | (354,496 | ) | ||
| Total net trading gain (loss) | 2,684,732 | |||
| * | Includes both realized gain of $3,934,142 and unrealized loss of ($1,249,410) and is located in net realized and unrealized gain (loss) on investments on the statement of operations. Amounts exclude foreign currency transactions and translation. |
F-196
| Galaxy Plus Fund – Emil van Essen STP Master Fund (516) LLC |
| (A Delaware Limited Liability Company) |
| Notes to the Financial Statements |
| Note 5. | Balance Sheet Offsetting |
The Master Fund is required to disclose the impact of offsetting assets and liabilities presented in the statement of financial condition to enable users of the financial statements to evaluate the effect or potential effect of netting arrangements on its financial position for recognized assets and liabilities. These recognized assets and liabilities include financial instruments and derivative instruments that are either subject to an enforceable master netting arrangement or similar agreement or meet the following right of set-off criteria: each of the two parties owes the other determinable amounts, the Master Fund has the right to set-off the amounts owed with the amounts owed by the other party, the Master Fund intends to set off, and the Fund’s right of set-off is enforceable at law.
The Master Fund is subject to enforceable master netting agreements with certain counterparties. These agreements govern the terms of certain transactions, and reduce the counterparty risk associated with relevant transactions by specifying offsetting mechanisms and collateral posting arrangements at prearranged exposure levels. Since different types of transactions have different mechanics and are sometimes traded out of different legal entities of a particular counterparty organization, each type of transaction may be covered by a different master netting arrangement, possibly resulting in the need for multiple agreements with a single counterparty. Master netting agreements may not be specific to each different asset type; in such instances, they would allow the Master Fund to close out and net its total exposure to a specified counterparty in the events of default or early termination with respect to any and all the transactions governed under a single agreement with the counterparty.
The following tables summarize the Master Fund’s netting arrangements:
| Net Amount of | ||||||||||||
| Gross Amounts | Offset in the | Assets (Liabilities) | ||||||||||
| of Recognized | Statement of | in the Statement of | ||||||||||
| Description | Assets (Liabilities) | Financial Condition | Financial Condition | |||||||||
| Futures | $ | (7,026,141 | ) | $ | 5,776,731 | $ | (1,249,410 | ) | ||||
| Total | $ | (7,026,141 | ) | $ | 5,776,731 | $ | (1,249,410 | ) | ||||
| Net Amount | ||||||||||||
| Net amount in | Cash Collateral | which is not offset | ||||||||||
| the Statement of | Received by | in the Statement of | ||||||||||
| Financial Condition | Counterparty | Financial Condition | ||||||||||
| Counterparty A | $ | (1,249,410 | ) | $ | 3,039,420 | $ | 1,790,010 | |||||
| Total | $ | (1,249,410 | ) | $ | 3,039,420 | $ | 1,790,010 | |||||
F-197
| Galaxy Plus Fund – Emil van Essen STP Master Fund (516) LLC |
| (A Delaware Limited Liability Company) |
| Notes to the Financial Statements |
| Note 6. | Related Parties |
Gemini Hedge Fund Services, LLC an affiliate of the Sponsor, provides administration services for the Master Fund.
| Note 7. | Financial Highlights |
Financial highlights of the Master Fund for the period April 15, 2016 (commencement of operations) through December 31, 2016 are presented in the table below. The information has been derived from information presented in the financial statements.
| Total Return (A) | 21.48 | % | ||
| Ratio to average member’s equity (B): | ||||
| Net investment income (C) | — | % | ||
| Total expenses | — | % |
| (A) | Total return is based on the change in average member’s equity during the period of a theoretical investment made at the inception of the Master Fund. |
| (B) | The total expense and net investment loss ratios are computed based upon weighted-average member’s equity as a whole for the period ended December 31, 2016. |
| (C) | The net investment loss ratio excludes net realized and unrealized gains (losses) on investments. |
Financial highlights are calculated for each member class taken as a whole. An individual member’s return and ratios may vary based on the timing of capital transactions. The total return and the net investment loss would have been lower and total expense ratios would have been higher if the management and incentive fees, as well as sponsor fees, had been charged to the Master Fund. The ratios, excluding nonrecurring expenses, have been annualized. Total return has not been annualized.
| Note 8. | Subsequent Events |
In accordance with FASB ASC 855,Subsequent Events, the Sponsor has evaluated all subsequent events requiring recognition and disclosure in the Master Fund’s financial statements through March 24, 2017, the date the financial statements were available for issuance. The Sponsor has determined that there are no material events that would require recognition or disclosure in the Master Fund’s financial statements through this date.
F-198
| Galaxy Plus Fund – Emil van Essen STP Master Fund (516) LLC |
| (A Delaware Limited Liability Company) |
| Oath and Affirmation of the Commodity Pool Operator |
To the best of the knowledge and belief of the undersigned, the information contained in the annual report as of December 31, 2016 and for the period from April 15, 2016 (commencement of operations) to December 31, 2016, is accurate and complete.
|
| David Young, President |
| Gemini Alternative Funds, LLC — Sponsor |
F-199
Galaxy Plus Fund – FORT
Contrarian Master Fund (510)
LLC
(A Delaware Limited Liability Company)
The attached annual report is filed under exemption pursuant to
Section 4.7 of the regulations under the Commodity Exchange Act.
Financial Report
December 31, 2016
F-200
Independent Auditor’s Report
Board of Directors
Galaxy Plus Fund LLC
Report on the Financial Statements
We have audited the accompanying financial statements of Galaxy Plus Fund – FORT Contrarian Master Fund (510) LLC (the Fund), which comprise the statement of financial condition, including the condensed schedule of investments, as of December 31, 2016, and the related statements of operations, and changes in member’s equity for the year then ended, and the related notes to the financial statements.
Management's Responsibility for the Financial Statements
Management is responsible for the preparation and fair presentation of these financial statements in accordance with accounting principles generally accepted in the United States of America; this includes the design, implementation and maintenance of internal control relevant to the preparation and fair presentation of financial statements that are free from material misstatement, whether due to fraud or error.
Auditor’s Responsibility
Our responsibility is to express an opinion on these financial statements based on our audit. We conducted our audit in accordance with auditing standards generally accepted in the United States of America. Those standards require that we plan and perform the audit to obtain reasonable assurance about whether the financial statements are free from material misstatement.
An audit involves performing procedures to obtain audit evidence about the amounts and disclosures in the financial statements. The procedures selected depend on the auditor’s judgment, including the assessment of the risks of material misstatement of the financial statements, whether due to fraud or error. In making those risk assessments, the auditor considers internal control relevant to the entity’s preparation and fair presentation of the financial statements in order to design audit procedures that are appropriate in the circumstances, but not for the purpose of expressing an opinion on the effectiveness of the entity’s internal control. Accordingly, we express no such opinion. An audit also includes evaluating the appropriateness of accounting policies used and the reasonableness of significant accounting estimates made by management, as well as evaluating the overall presentation of the financial statements.
We believe that the audit evidence we have obtained is sufficient and appropriate to provide a basis for our audit opinion.
F-201
Opinion
In our opinion, the financial statements referred to above present fairly, in all material respects, the financial position of Galaxy Plus Fund – FORT Contrarian Master Fund (510) LLC as of December 31, 2016, and the results of its operations for the year then ended in accordance with accounting principles generally accepted in the United States of America.
/s/ RSM US LLP
Denver, Colorado
March 24, 2017
F-202
| Galaxy Plus Fund - FORT Contrarian Master Fund (510) LLC |
| (A Delaware Limited Liability Company) |
| Statement of Financial Condition |
| December 31, 2016 |
| (Expressed in U.S. Dollars) |
| Assets | ||||
| Equity in commodity trading accounts at clearing brokers: | ||||
| Cash | $ | 8,363,795 | ||
| Restricted cash - margin balance | 3,263,570 | |||
| Other assets | 9,333 | |||
| Total assets | $ | 11,636,698 | ||
| Liability and Member’s Equity | ||||
| Liabilities | ||||
| Deficit in in commodity trading accounts at clearing brokers: | ||||
| Investments in futures contracts at fair value (represents unrealized depreciation on open derivative contracts, net) | $ | 178,326 | ||
| Redemptions payable | 5,456 | |||
| Total liabilities | 183,782 | |||
| Member’s equity | 11,452,916 | |||
| Total liabilities and member’s equity | $ | 11,636,698 |
See notes to financial statements.
F-203
| Galaxy Plus Fund - FORT Contrarian Master Fund (510) LLC |
| (A Delaware Limited Liability Company) |
| Condensed Schedule of Investments |
| December 31, 2016 |
| (Expressed in U.S. Dollars) |
| Number of | Percent of | |||||||||||
| Contracts/Units | Fair Value | Member’s Equity | ||||||||||
| Long positions: | ||||||||||||
| Derivative contracts: | ||||||||||||
| Domestic (United States): | ||||||||||||
| Futures contracts: | ||||||||||||
| Currency | 154 | $ | (149,873 | ) | (1.31 | )% | ||||||
| Energy | 15 | 3,285 | 0.03 | |||||||||
| Index | 65 | (39,082 | ) | (0.34 | ) | |||||||
| Interest | 854 | (127,980 | ) | (1.12 | ) | |||||||
| Metals | 8 | (23,205 | ) | (0.20 | ) | |||||||
| Foreign: | ||||||||||||
| Futures contracts: | ||||||||||||
| Energy | 4 | 6,200 | 0.05 | |||||||||
| Index | 144 | 116,019 | 1.01 | |||||||||
| Interest | 945 | 133,285 | 1.17 | |||||||||
| Total long positions | (81,351 | ) | (0.71 | ) | ||||||||
| Short positions: | ||||||||||||
| Derivative contracts: | ||||||||||||
| Domestic (United States): | ||||||||||||
| Futures contracts: | ||||||||||||
| Currency | 187 | (74,333 | ) | (0.65 | ) | |||||||
| Energy | 8 | (11,885 | ) | (0.10 | ) | |||||||
| Foreign: | ||||||||||||
| Futures contracts: | ||||||||||||
| Energy | 1 | (380 | ) | (0.01 | ) | |||||||
| Interest | 87 | (10,377 | ) | (0.09 | ) | |||||||
| Total short positions | (96,975 | ) | (0.85 | ) | ||||||||
| Investments in futures contracts, at fair value | $ | (178,326 | ) | (1.56 | )% | |||||||
See notes to financial statements.
F-204
| Galaxy Plus Fund - FORT Contrarian Master Fund (510) LLC |
| (A Delaware Limited Liability Company) |
| Statement of Operations |
| For the year ended December 31, 2016 |
| (Expressed in U.S. Dollars) |
| Investment Income: | ||||
| Interest income | $ | — | ||
| Expenses: | ||||
| Interest expense | 21 | |||
| Total expenses | 21 | |||
| Net investment loss | (21 | ) | ||
| Realized and unrealized loss on investments and foreign currency transactions: | ||||
| Net realized loss from: | ||||
| Derivative contracts1 | (827,897 | ) | ||
| Foreign currency transactions | (12,134 | ) | ||
| (840,031 | ) | |||
| Net increase (decrease) in unrealized depreciation on: | ||||
| Derivative contracts | (177,990 | ) | ||
| Translation of assets and liabilities denominated in foreign currencies | (238 | ) | ||
| (178,228 | ) | |||
| Net realized and unrealized loss on investments and foreign currency transactions | (1,018,259 | ) | ||
| Net decrease in member’s equity resulting from operations | $ | (1,018,280 | ) |
| 1 | Includes broker trading commisions |
See notes to financial statements.
F-205
| Galaxy Plus Fund - FORT Contrarian Master Fund (510) LLC |
| (A Delaware Limited Liability Company) |
| Statement of Changes in Member’s Equity |
| For the year ended December 31, 2016 |
| (Expressed in U.S. Dollars) |
| Changes in member’s equity from operations: | ||||
| Net investment loss | $ | (21 | ) | |
| Net realized gain (loss) from derivative contracts and foreign currency transactions | (840,031 | ) | ||
| Net increase (decrease) in unrealized depreciation on derivative contracts and translation of assets and liabilities denominated in foreign currencies | (178,228 | ) | ||
| Net decrease in member’s equity resulting from operations | (1,018,280 | ) | ||
| Changes in member’s equity from capital transactions: | ||||
| Proceeds from issuance of capital | 14,319,802 | |||
| Payments for redemptions of capital | (4,144,889 | ) | ||
| Net increase in member’s equity resulting from capital transactions | 10,174,913 | |||
| Total increase | 9,156,633 | |||
| Member’s equity, beginning of year | 2,296,283 | |||
| Member’s equity, end of year | $ | 11,452,916 |
See notes to financial statements.
F-206
| Galaxy Plus Fund – FORT Contrarian Master Fund (510) LLC |
| (A Delaware Limited Liability Company) |
| Notes to the Financial Statements |
| Note 1. | Organization and Structure |
Galaxy Plus Fund – FORT Contrarian Master Fund (510) LLC (the “Master Fund”) was formed in Delaware as a limited liability company on June 5, 2015. The Master Fund was created to serve as the trading entity managed by Fort L.P. (the “Trading Advisor”) pursuant to its Global Contrarian (the “Program”). The Program is a systematic, trend-anticipating trading program that seeks to capitalize on medium to long-term trends.
The Master Fund and other separately formed Delaware limited liability companies (“Other Master Funds”), are investment vehicles available under the Galaxy Plus Managed Account Platform (the “Platform”). The Master Fund and the Platform are sponsored by Gemini Alternative Funds, LLC (the “Sponsor” or “GAF”) as a means of making available, to qualified high net-worth individuals and institutional investors (including funds of hedge funds) (“Investors”), a variety of third-part professional managed futures and foreign exchange advisors (“Advisors”). The Trading Advisor is not affiliated with the Sponsor.
GAF was formed in October 2013 and its principal office is located in Chicago, Illinois. GAF is registered with the U.S. Commodity Futures Trading Commission (CFTC) as a commodity pool operator and commodity trading advisor, and is a member of the National Futures Association (NFA).
Galaxy Plus Fund LLC, a Delaware Series Limited Liability Company (the “Onshore Platform”), and Galaxy Plus Fund SPC, a Cayman Islands Segregated Portfolio Company (the “Offshore Platform”) serve as the feeder funds for the Platform and invest substantially all of the assets of the respective segregated portfolios (each a “Fund”) in the Master Fund or other Master funds. Galaxy Plus Fund – FORT Contrarian Feeder Fund (510) LLC (“LLC510”), a separated series of the Onshore Platform and Galaxy Plus Fund – Fort Contrarian Offshore Feeder Fund (510) Segregated Portfolio (“SPC510”), a segregated portfolio of the Offshore Platform, can each invest in the Master Fund. As of December 31, 2016, SPC 510 had not yet commenced operations.
LLC510 and SPC510 are collectively hereafter referred to as the “Feeder Funds”.
Subscriptions and redemptions into the Feeder Funds are the corresponding transactions with the Master Fund and are governed by the Onshore Platform’s and the Offshore Platform’s respective Confidential Offering Memorandums.
The Platform has appointed the Sponsor, under the terms of the Limited Liability Company Agreement (the “LLC Agreement”) as the managing member of the Master Fund. In such capacity, the Sponsor has the authority, to manage, with wide discretionary powers, the business and affairs of the Master Fund including the authority to select the administrator for the Master Fund. The LLC Agreement will continue to remain in force until terminated by either the Sponsor or the Platform upon not less than sixty (60) days’ prior written notice. In certain circumstances (for example, the insolvency of either party or in the event all trading for the Platform by the Advisors are suspended), the LLC Agreement may be immediately terminated by either party.
F-207
| Galaxy Plus Fund – FORT Contrarian Master Fund (510) LLC |
| (A Delaware Limited Liability Company) |
| Notes to the Financial Statements |
The Master Fund and the Sponsor have entered into a tri-party contract (the “Trading Agreement”) with the Trading Advisor pursuant to which the Master Fund’s trading accounts are managed, subject to rights of termination, by the Trading Advisor in accordance with the Program. The Trading Advisor may alter its Program (including its trading systems and methods and including the addition and/or deletion of any financial interests or contracts traded in the Master Fund’s trading accounts), provided that the Trading Advisor provide prior notice to the Master Fund and the Sponsor of any material change to the Trading Advisor’s Program. From time to time, the Trading Advisor (or its affiliates) may manage additional accounts, and these accounts will increase the level of competition for the same trades desired for the Master Fund, including the priorities of order entry. There is no specific limit as to the number of accounts the Trading Advisors (or their affiliates) may manage. In addition, the positions of all of the accounts owned or controlled by the Trading Advisor (or its affiliates) are aggregated for the purposes of applying speculative position limits. The management, incentive, and sponsor fees are paid directly by the Feeder Funds, and for this reason are not recorded as expenses of the Master Fund.
| Note 2. | Summary of Significant Accounting Policies |
The following is a summary of significant accounting policies consistently followed in the preparation of the Master Fund’s financial statements.
Principles of accounting:The accompanying financial statements are expressed in United States dollars (USD) and have been prepared in accordance with Generally Accepted Accounting Principles (GAAP), as established by the Financial Accounting Standards Board (FASB), to ensure consistent reporting of financial condition and results of operations. The Master Fund is an investment company and follows the accounting and reporting guidance in FASB Account Standards Codification Topic 946.
Cash and restricted cash: Cash held in the commodity trading accounts at clearing broker consists of either cash maintained in the custody of the broker, a portion of which is required margin for open positions, or amounts due to/from the broker for margin or unsettled trades. The Master Fund may also hold cash in a non-interest bearing USD commercial bank account. The Master Fund holds various currencies at the clearing broker, of which $11,639,859 is held in USD and a payable balance of ($12,494) in foreign currencies as of December 31, 2016, and are recorded in cash and restricted cash – margin balance on the statement of financial condition. The non-U.S. currencies fluctuate in value on a daily basis relative to the USD. A portion of this cash is restricted cash required to meet maintenance margin requirements. Cash with the clearing broker as of December 31, 2016 included restricted cash for margin requirements of $3,263,570. This cash becomes unrestricted when the underlying positions to which it is applicable are liquidated. Cash with the clearing broker as of December 31, 2016 included amounts due to the broker for unsettled trades of $0.
Offsetting of amounts related to certain contracts: When the requirements are met, the Master Fund offsets certain fair value amounts recognized for net derivative positions executed with the same counterparty under the same master netting arrangement (See Note 5).
F-208
| Galaxy Plus Fund – FORT Contrarian Master Fund (510) LLC |
| (A Delaware Limited Liability Company) |
| Notes to the Financial Statements |
Valuation and Revenue Recognition:Depending on the Program and Investments traded, The Master Fund follows the following valuation and revenue recognition policies. All investments are recorded at their estimated fair value, as described in Note 3.
Futures and options on futures contracts: The Master Fund may enter into futures and options on futures contracts. Upon entering into a futures contract, The Master Fund agrees to receive or deliver a fixed quantity of an underlying instrument or commodity for an agreed-upon price, while an option contract provides the option purchaser with the right, but not the obligation, to buy or sell a security or financial instrument at a predetermined exercise price during a defined period. Futures and options on futures contracts are recorded on the trade date. The difference between the original contract amount and the fair value of futures contracts purchased or sold is reflected as unrealized appreciation (depreciation) on open contracts. Options on futures contracts are reflected in investments at fair value. The difference between the premiums paid or received on open options on futures contracts and fair value of such options is recorded as unrealized appreciation/(depreciation) on open contracts. The fair value of futures and options on futures contracts is based upon daily exchange settlement prices. The realized gain or loss is determined on the settlement of intraday trades first and then by the FIFO method.
Foreign currency transactions: The Master Fund’s financial statements are denominated in USD. However, foreign currency forward contracts, non-U.S. futures contracts, and non-U.S. options on futures contracts are denominated in currencies other than USD. Assets and liabilities and transactions denominated in currencies other than the USD are translated into USD at the rates in effect either at the close of business on the last business day of the reporting period or on the date of such transactions, respectively. Net realized foreign exchange gains or losses arise from the sales of foreign currencies and currency gains or losses realized between trade and settlement dates. Net unrealized foreign exchange gains and losses arise from changes in the fair value of assets and liabilities resulting from changes in exchange rates.
Trading costs: Trading costs generally consist of brokerage commissions, brokerage fees, clearing fees, exchange and regulatory fees, transaction and NFA fees. Fees vary by type of contract for each purchase and sale or sale and purchase (round turn) of futures, options on futures, and forward contracts. Commissions are paid on each individual purchase and sale transaction. These costs are recognized as expenses for futures and options on futures transactions and are included in net realized gain/loss from derivative contracts on the Statement of Operations.
Interest income/expense: Interest income and expense is recognized on an accrual basis.
Allocation of income and gains and losses: Profits and losses for each monthly accounting period, or shorter period if there are mid-month subscriptions and/or redemptions, are allocated pro-rata to the Feeder Funds based on their respective ownership percentage on the first day of each period throughout the year.
F-209
| Galaxy Plus Fund – FORT Contrarian Master Fund (510) LLC |
| (A Delaware Limited Liability Company) |
| Notes to the Financial Statements |
Income taxes: The Master Fund will not be subject to United States federal income taxation other than certain withholding taxes. The Master Fund evaluates tax positions taken or expected to be taken to determine whether the tax positions are more-likely-than-not of being sustained by the applicable tax authority. For tax positions meeting the more-likely-than-not threshold, the tax amount recognized in the financial statements is reduced by the largest benefit that has a greater than fifty percent likelihood of being realized upon ultimate settlement with the relevant taxing authority. The Master Fund has determined that there is no tax liability resulting from uncertain income tax positions taken or expected to be taken with respect to all open tax years. The Master Fund’s U.S. Federal tax returns for the years ended December 31, 2015 and 2016, remain open. The Master Fund recognizes interest and penalties, if any, related to unrecognized tax benefits as income tax expense in the statement of operations. During the period, the Master Fund did not accrue any interest or penalties.
Use of estimates:The preparation of financial statements in accordance with GAAP requires management to make estimates and assumptions that affect the reported amounts of assets and liabilities and disclosure of contingent assets and liabilities at the date of the financial statements and the reported amounts of income and expenses during the reporting period. Actual results could differ from those estimates.
Indemnifications:The Sponsor and its affiliates are indemnified against certain liabilities arising out of the performance of their duties for The Master Fund. In addition, in the normal course of business, the Master Fund enters into contracts with vendors and others that provide for general indemnifications. The Master Fund’s maximum exposure under these arrangements is unknown as this would involve future claims that may be made against the Master Fund. However, the Master Fund expects the risk of loss to be remote.
Statement of cash flows: The Master Fund has elected not to provide a statement of cash flows as permitted by GAAP as all of the following conditions have been met:
| ● | During the year, substantially all of the Master Fund’s investments were carried at fair value and classified as Level 1 or Level 2 measurements in accordance with FASB ASC 820; |
| ● | The Master Fund had little or no debt during the year; |
| ● | The Master Fund’s financial statements include a statement of changes in member’s equity. |
Subscriptions and redemptions: Subscriptions and redemptions can typically be made on a weekly basis as of the first day (Monday) of each week; (or, if such day is not a business day, the first business day thereafter) (each, a Subscription Date or a Redemption Date). The Master Fund may accept subscriptions or redemptions more frequently than the first day of each week, depending upon the size of the requested subscription or redemption amount, with the approval of the Sponsor.
| Note 3. | Fair Value Measurements |
The Master Fund’s investments are stated at fair value in accordance with FASB ASC 820, Fair Value Measurements and Disclosures (ASC 820). ASC 820 defines fair value, establishes a framework for measuring fair value and expands disclosures about fair value measurements. ASC 820 also emphasizes that fair value is a market-based measurement, not an entity-specific measurement, and sets out a fair value hierarchy with the highest priority being quoted prices in active market. Under ASC 820, fair value measurements are disclosed by level within that hierarchy, as follows:
Level 1 — Values for investments classified as Level 1 are based on unadjusted quoted prices for identical investments in an active market. Since valuations are based on quoted prices that are readily accessible at the measurement date, valuation of these investments does not entail a significant degree of judgment.
F-210
| Galaxy Plus Fund – FORT Contrarian Master Fund (510) LLC |
| (A Delaware Limited Liability Company) |
| Notes to the Financial Statements |
Level 2 — Values for investments classified as Level 2 are based on quoted prices for similar investments in an active or non-active markets for which all significant inputs are observable either directly or indirectly. Level 2 inputs may also include discounts related to restrictions on the investments.
Level 3 — Values for investments categorized as Level 3 are based on prices or valuation techniques that require inputs that are both significant to the fair value and unobservable, including valuations by the Sponsor in the absence of readily ascertainable fair values.
A description of the valuation methodologies applied to the Master Fund’s major categories of assets and liabilities measured at fair value on a recurring basis follows. Inputs that are used in determining fair value of an investment may include price information, credit data, volatility statistics, and other factors. These inputs can be either observable or unobservable. All of the inputs for the Master Fund were observable as of December 31, 2016. The availability of observable inputs can vary between investments and is affected by various factors such as type of investment and the volume and level of activity for that investment or similar investments in the marketplace.
Exchange-traded derivative contracts that are actively traded are valued based on daily quoted settlement prices from the respective exchange and are categorized in Level 1 of the fair value hierarchy. Exchange-traded derivative contracts not actively traded and over-the-counter (OTC) derivative contracts can include futures contracts, option on futures contracts, forward contracts and option contracts whose values are based on an underlying such as interest rates, foreign currencies, credit standing of reference entities, equities or commodities. Such derivative contracts are valued using observable market data, including currency spot rates or quoted prices of the related underlying obtained from the applicable exchange or market. OTC derivative contracts are valued using the above described pricing methodology and are categorized as Level 2 within the fair value hierarchy.
The Master Fund assesses the levels of the investments at each measurement date, and transfers between levels are recognized on the actual date of the event or change in circumstances that caused the transfer in accordance with the Master Fund’s accounting policy regarding the recognition of transfers between levels of the fair value hierarchy. There were no transfers among levels 1, 2, and 3 during the year ended December 31, 2016.
The inputs or methodologies used for valuing investments are not necessarily indicative of the risk associated with investing in those instruments.
F-211
| Galaxy Plus Fund – FORT Contrarian Master Fund (510) LLC |
| (A Delaware Limited Liability Company) |
| Notes to the Financial Statements |
The following tables present the classification of derivatives, by type, into the fair value hierarchy levels as of December 31, 2016. Presentation is gross – as an asset if in a gain position and a liability if in a loss position.
| Fair Value Measurements at Reporting Date Using | ||||||||||||||||
| Quoted Prices | Significant Other | Significant | ||||||||||||||
| in Active | Observable | Unobservable | ||||||||||||||
| Markets | Inputs | Inputs | ||||||||||||||
| Description | Fair Value | (Level 1) | (Level 2) | (Level 3) | ||||||||||||
| Assets: | ||||||||||||||||
| Derivative contracts: | ||||||||||||||||
| Futures contracts: | ||||||||||||||||
| Currency | $ | 37,882 | $ | 37,882 | $ | — | $ | — | ||||||||
| Energy | 20,329 | 20,329 | — | — | ||||||||||||
| Index | 144,838 | 144,838 | — | — | ||||||||||||
| Interest | 266,315 | 266,315 | — | — | ||||||||||||
| Metals | 800 | 800 | — | — | ||||||||||||
| Total investment assets at fair value | 470,164 | 470,164 | — | — | ||||||||||||
| Liabilities: | ||||||||||||||||
| Derivative contracts: | ||||||||||||||||
| Futures contracts: | ||||||||||||||||
| Currency | (262,088 | ) | (262,088 | ) | — | — | ||||||||||
| Energy | (23,109 | ) | (23,109 | ) | — | — | ||||||||||
| Index | (67,901 | ) | (67,901 | ) | — | — | ||||||||||
| Interest | (271,387 | ) | (271,387 | ) | — | — | ||||||||||
| Metals | (24,005 | ) | (24,005 | ) | — | — | ||||||||||
| Total investment liabilities at fair value | (648,490 | ) | (648,490 | ) | — | — | ||||||||||
| Total net investment at fair value | $ | (178,326 | ) | $ | (178,326 | ) | $ | — | $ | — | ||||||
F-212
| Galaxy Plus Fund – FORT Contrarian Master Fund (510) LLC |
| (A Delaware Limited Liability Company) |
| Notes to the Financial Statements |
| Note 4. | Derivative Financial Instruments |
Derivative financial instruments speculatively traded by the Master Fund can include U.S. and foreign futures, options on futures contracts, and forward currency contracts (collectively, derivatives) whose values are based upon an underlying asset, indices, or reference rates, and generally represent future commitments to exchange cash flows, or to purchase or sell other financial instruments at specified future dates. A derivative contract may be traded on an exchange or OTC. Exchange-traded derivatives are standardized and include futures and option on futures contracts. OTC derivative contracts are negotiated between contracting parties and include forward currency contracts and certain options. Derivatives are subject to various risks similar to those related to the underlying financial instruments including market and credit risks.
Market risk is the potential for changes in the value of derivatives due to market changes, including interest and foreign exchange rate movements and fluctuations in commodity and security prices. Market risk is directly impacted by the volatility and liquidity in the markets in which the related underlying assets are traded. The market risk of the Master Fund is managed by the underlying Trading Advisors according to each respective Program. The Master Fund is exposed to a market risk equal to the notional contract value of the derivatives contracts purchased and unlimited liability on such contracts sold short.
Credit risk is the possibility that a loss may occur due to the failure of a counterparty to perform according to the terms of a contract. Credit risk due to exchange traded derivative financial instruments is significantly reduced by the regulatory requirements of the individual exchanges on which the instruments are traded. At any point in time, the credit risk for OTC derivatives is limited to the net unrealized gain for each counterparty for which a netting agreement exists, if any. In a similar fashion, liabilities represent net amounts owed to counterparties. The credit risk exposure for the Master Fund’s outstanding OTC derivatives was $0 at December 31, 2016.
Purchase and sale of futures contracts requires margin deposits with the broker. Additional deposits may be necessary for any loss on contract value. The U.S. Commodity Exchange Act requires a broker to segregate all customer transactions and assets from such broker’s proprietary activities. A customer’s cash and other property (for example, U.S. Treasury bills) deposited with a broker are considered commingled with all other customer funds subject to the broker’s segregation requirements. In the event of a broker’s insolvency, recovery may be limited to a pro rata share of segregated funds available. It is possible that the recovered amount could be less than total cash and other property deposited.
The Master Fund has a substantial portion of its assets on deposit with counterparties. In the event of a counterparty’s insolvency, recovery of The Master Fund’s assets on deposit may be limited to account insurance or other protection afforded such deposits.
The notional value represents amounts related to the Master Fund’s stock exchange indices, commodities, interest rate and foreign currencies upon which the fair value of the futures contracts held by the Master Fund are based. Notional values do not represent the current fair value of, and are not necessarily indicative of the future cash flows of the Master Fund’s futures and forward contracts. Further, the underlying price changes in relation to variables specified by the notional values affects the fair value of these derivative financial instruments. Theoretically, the Master Fund’s exposure is equal to the notional value of contracts purchased and unlimited on such contracts sold short. As of December 31, 2016, the Master Fund had open futures contracts with the following notional values by sector:
F-213
| Galaxy Plus Fund – FORT Contrarian Master Fund (510) LLC |
| (A Delaware Limited Liability Company) |
| Notes to the Financial Statements |
| Description | Quantity | Notional Value | Description | Quantity | Notional Value | |||||||||||||
| Long: | Short: | |||||||||||||||||
| Currency | 154 | 8,936,045 | Currency | 187 | $ | (18,503,140 | ) | |||||||||||
| Energy | 19 | $ | 991,065 | Energy | 9 | (599,766 | ) | |||||||||||
| Index | 209 | 16,572,988 | Interest | 87 | (14,575,999 | ) | ||||||||||||
| Interest | 1,799 | 389,310,282 | ||||||||||||||||
| Metals | 8 | 518,408 | ||||||||||||||||
During the year ended December 31, 2016, the Master Fund participated in 18,602 futures contract transactions.
Below is a summary of net trading gains and (losses) by investment type and industry:
| Net Trading | ||||
| Gain (Loss)* | ||||
| Futures contracts: | ||||
| Currency | $ | 627,772 | ||
| Energy | (495,058 | ) | ||
| Index | 879,821 | |||
| Interest | (1,926,191 | ) | ||
| Metals | (2,660 | ) | ||
| Total futures contracts | (916,316 | ) | ||
| Trading costs | (89,571 | ) | ||
| Total net trading gain (loss) | $ | (1,005,887 | ) | |
| * | Includes both realized loss of ($827,897) and unrealized loss of ($177,990) and is located in net realized and unrealized gain (loss) on investments and foreign currency transactions on the statement of operations. Amounts exclude foreign currency transactions and translation. |
| Note 5. | Balance Sheet Offsetting |
Master Fund is required to disclose the impact of offsetting assets and liabilities presented in the statement of financial condition to enable users of the financial statements to evaluate the effect or potential effect of netting arrangements on its financial position for recognized assets and liabilities. These recognized assets and liabilities include financial instruments and derivative instruments that are either subject to an enforceable master netting arrangement or similar agreement or meet the following right of set-off criteria: each of the two parties owes the other determinable amounts, the Master Fund has the right to set-off the amounts owed with the amounts owed by the other party, the Master Fund intends to set off, and the Fund’s right of set-off is enforceable at law.
The Master Fund is subject to enforceable master netting agreements with certain counterparties. These agreements govern the terms of certain transactions, and reduce the counterparty risk associated with relevant transactions by specifying offsetting mechanisms and collateral posting arrangements at prearranged exposure levels. Since different types of transactions have different mechanics and are
F-214
| Galaxy Plus Fund – FORT Contrarian Master Fund (510) LLC |
| (A Delaware Limited Liability Company) |
| Notes to the Financial Statements |
sometimes traded out of different legal entities of a particular counterparty organization, each type of transaction may be covered by a different master netting arrangement, possibly resulting in the need for multiple agreements with a single counterparty. Master netting agreements may not be specific to each different asset type; in such instances, they would allow the Master Fund to close out and net its total exposure to a specified counterparty in the events of default or early termination with respect to any and all the transactions governed under a single agreement with the counterparty.
The following tables summarize the Master Fund’s netting arrangements:
| Net Amount of | ||||||||||||
| Gross Amounts | Offset in the | Assets (Liabilities) | ||||||||||
| of Recognized | Statement of | in the Statement of | ||||||||||
| Description | Assets (Liabilities) | Financial Condition | Financial Condition | |||||||||
| Futures | $ | (648,490 | ) | $ | 470,164 | $ | (178,326 | ) | ||||
| Total | $ | (648,490 | ) | $ | 470,164 | $ | (178,326 | ) | ||||
| Net Amount | ||||||||||||
| Net amount in | Cash Collateral | which is not offset | ||||||||||
| the Statement of | Received by | in the Statement of | ||||||||||
| Financial Condition | Counterparty | Financial Condition | ||||||||||
| Counterparty A | $ | (178,326 | ) | $ | 3,263,570 | $ | 3,085,244 | |||||
| Total | $ | (178,326 | ) | $ | 3,263,570 | $ | 3,085,244 | |||||
| Note 6. | Related Parties |
Gemini Hedge Fund Services, LLC an affiliate of the Sponsor, provides administration services for the Master Fund.
F-215
| Galaxy Plus Fund – FORT Contrarian Master Fund (510) LLC |
| (A Delaware Limited Liability Company) |
| Notes to the Financial Statements |
| Note 7. | Financial Highlights |
Financial highlights of the Master Fund for the year ended December 31, 2016 are presented in the table below. The information has been derived from information presented in the financial statements.
| Total return (A) | 5.30 | % | ||
| Ratio to average member’s equity (B): | ||||
| Net investment income (C ) | (0.00 | )%* | ||
| Total expenses | 0.00 | %* |
| * | Amount represents less thant 0.005%. |
| (A) | Total return is based on the change in average member’s equity during the period of a theoretical investment made at the inception of the Master Fund. |
| (B) | The total expense and net investment loss ratios are computed based upon weighted-average member’s equity as a whole for the period ended December 31, 2016. |
| (C) | The net investment loss ratio excludes net realized and unrealized gains (losses) on investments. |
Financial highlights are calculated for each member class taken as a whole. An individual member’s return and ratios may vary based on the timing of capital transactions. The total return would have been lower, and the net investment loss and total expense ratios would have been higher if the Trading Advisor management and incentive fees, as well as the sponsor fees, had been charged to the Master Fund instead of the Feeder Fund.
| Note 8. | Subsequent Events |
In accordance with FASB ASC 855,Subsequent Events, the Sponsor has evaluated all subsequent events requiring recognition and disclosure in the Master Fund’s financial statements through March 24, 2017, the date the financial statements were available for issuance. The Sponsor has determined that there are no material events that would require recognition or disclosure in the Master Fund’s financial statements through this date.
F-216
| Galaxy Plus Fund – FORT Contrarian Master Fund (510) LLC |
| (A Delaware Limited Liability Company) |
| Oath and Affirmation of the Commodity Pool Operator |
To the best of the knowledge and belief of the undersigned, the information contained in the annual report as of, and for the year ended December 31, 2016 is accurate and complete.
|
| David Young, President |
| Gemini Alternative Funds, LLC — Sponsor |
F-217
Galaxy Plus Fund – LRR
Master Fund (522) LLC
(A Delaware Limited Liability Company)
The attached annual report is filed under exemption pursuant to
Section 4.7 of the regulations under the Commodity Exchange Act.
Financial Report
December 31, 2016
F-218
Independent Auditor’s Report
Board of Directors
Galaxy Plus Fund LLC
Report on the Financial Statements
We have audited the accompanying financial statements of Galaxy Plus Fund – LRR Master Fund (522) LLC (the Fund), which comprise the statement of financial condition, including the condensed schedule of investments, as of December 31, 2016, and the related statements of operations, and changes in member’s equity for the period from April 28, 2016 (commencement of operations) to December 31, 2016, and the related notes to the financial statements.
Management's Responsibility for the Financial Statements
Management is responsible for the preparation and fair presentation of these financial statements in accordance with accounting principles generally accepted in the United States of America; this includes the design, implementation and maintenance of internal control relevant to the preparation and fair presentation of financial statements that are free from material misstatement, whether due to fraud or error.
Auditor’s Responsibility
Our responsibility is to express an opinion on these financial statements based on our audit. We conducted our audit in accordance with auditing standards generally accepted in the United States of America. Those standards require that we plan and perform the audit to obtain reasonable assurance about whether the financial statements are free from material misstatement.
An audit involves performing procedures to obtain audit evidence about the amounts and disclosures in the financial statements. The procedures selected depend on the auditor’s judgment, including the assessment of the risks of material misstatement of the financial statements, whether due to fraud or error. In making those risk assessments, the auditor considers internal control relevant to the entity’s preparation and fair presentation of the financial statements in order to design audit procedures that are appropriate in the circumstances, but not for the purpose of expressing an opinion on the effectiveness of the entity’s internal control. Accordingly, we express no such opinion. An audit also includes evaluating the appropriateness of accounting policies used and the reasonableness of significant accounting estimates made by management, as well as evaluating the overall presentation of the financial statements.
We believe that the audit evidence we have obtained is sufficient and appropriate to provide a basis for our audit opinion.
F-219
Opinion
In our opinion, the financial statements referred to above present fairly, in all material respects, the financial position of Galaxy Plus Fund – LRR Master Fund (522) LLC as of December 31, 2016, and the results of its operations for the period from April 28, 2016 (commencement of operations) to December 31, 2016, in accordance with accounting principles generally accepted in the United States of America.
/s/ RSM US LLP
Denver, Colorado
March 24, 2017
F-220
| Galaxy Plus Fund - LRR Master Fund (522) LLC |
| (A Delaware Limited Liability Company) |
| Statement of Financial Condition |
| December 31, 2016 |
| (Expressed in U.S. Dollars) |
| Assets | ||||
| Equity in commodity trading accounts at clearing brokers: | ||||
| Cash | $ | 6,021,563 | ||
| Restricted cash - margin balance | 1,134,600 | |||
| Investments in futures contracts at fair value (represents unrealized appreciation on open derivative contracts, net) | 157,324 | |||
| Options purchased, at fair value (cost: $287,229) | 577,440 | |||
| Receivable from onshore feeder fund | 3,000 | |||
| Other assets | 33,202 | |||
| Total assets | $ | 7,927,129 | ||
| Liabilities and member’s equity | ||||
| Liabilities | ||||
| Deficit in in commodity trading accounts at clearing brokers: | ||||
| Options written, at fair value (proceeds: $360,249) | $ | 209,580 | ||
| Total liabilities | 209,580 | |||
| Member’s equity | 7,717,549 | |||
| Total liabilities and member’s equity | $ | 7,927,129 |
See notes to financial statements.
F-221
| Galaxy Plus Fund - LRR Master Fund (522) LLC |
| (A Delaware Limited Liability Company) |
| Condensed Schedule of Investments |
| December 31, 2016 |
| (Expressed in U.S. Dollars) |
| Number of | Percent of | |||||||||||
| Contracts/Units | Fair Value | Member’s Equity | ||||||||||
| Long positions: | ||||||||||||
| Derivative contracts: | ||||||||||||
| Domestic (United States): | ||||||||||||
| Options purchased on futures contracts: | ||||||||||||
| Agriculture | ||||||||||||
| Milk (cost: $287,229)1 | 226 | $ | 577,440 | 7.48 | % | |||||||
| Futures contracts: | ||||||||||||
| Agriculture | 281 | 225,956 | 2.93 | |||||||||
| Currency | 94 | (18,499 | ) | (0.24 | ) | |||||||
| Energy | 18 | 18,203 | 0.24 | |||||||||
| Metals | 25 | (60,620 | ) | (0.79 | ) | |||||||
| Foreign: | ||||||||||||
| Futures contracts: | ||||||||||||
| Metals | 22 | (117,607 | ) | (1.52 | ) | |||||||
| Total long positions | 624,873 | 8.10 | ||||||||||
| Short positions: | ||||||||||||
| Derivative contracts: | ||||||||||||
| Domestic (United States): | ||||||||||||
| Options written on futures contracts: | ||||||||||||
| Agriculture (proceeds: $360,249) | 344 | (209,580 | ) | (2.72 | ) | |||||||
| Futures contracts: | ||||||||||||
| Agriculture | 42 | 56,681 | 0.73 | |||||||||
| Currency | 71 | 89,474 | 1.16 | |||||||||
| Index | 11 | 16,640 | 0.22 | |||||||||
| Interest | 21 | 2,813 | 0.04 | |||||||||
| Foreign: | ||||||||||||
| Futures contracts: | ||||||||||||
| Interest | 38 | (55,717 | ) | (0.72 | ) | |||||||
| Total short positions | (99,689 | ) | (1.29 | ) | ||||||||
| Investments in future contracts, at fair value | $ | 525,184 | 6.81 | % | ||||||||
| 1 | Maturities range from March 2017 through December 2017 |
See notes to financial statements.
F-222
| Galaxy Plus Fund - LRR Master Fund (522) LLC |
| (A Delaware Limited Liability Company) |
| Statement of Operations |
| For the period from April 28, 2016 (Commencement of Operations) to December 31, 2016 |
| (Expressed in U.S. Dollars) |
| Net investment income | $ | — | ||
| Realized and unrealized gain (loss) on investments and foreign currency transactions: | ||||
| Net realized gain from: | ||||
| Derivative contracts1 | 72,602 | |||
| Foreign currency transactions | 31,408 | |||
| 104,010 | ||||
| Net increase (decrease) in unrealized appreciation on: | ||||
| Derivative contracts | 598,204 | |||
| Translation of assets and liabilities denominated in foreign currencies | — | |||
| 598,204 | ||||
| Net realized and unrealized gain on investments and foreign currency transactions | 702,214 | |||
| Net increase in member’s equity resulting from operations | $ | 702,214 |
| 1 | Includes broker trading commisions |
See notes to financial statements.
F-223
| Galaxy Plus Fund - LRR Master Fund (522) LLC |
| (A Delaware Limited Liability Company) |
| Statement of Changes in Member’s Equity |
| For the period from April 28, 2016 (Commencement of Operations) to December 31, 2016 |
| (Expressed in U.S. Dollars) |
| Changes in member’s equity from operations: | ||||
| Net investment income | $ | — | ||
| Net realized gain (loss) from derivative contracts and foreign currency transactions | 104,010 | |||
| Net increase (decrease) in unrealized appreciation on derivative contracts and translation of assets and liabilities denominated in foreign currencies | 598,204 | |||
| Net increase in member’s equity resulting from operations | 702,214 | |||
| Changes in member’s equity from capital transactions: | ||||
| Proceeds from issuance of capital | 7,686,246 | |||
| In-kind assumed derivative liabilities | (27,740 | ) | ||
| Payments for redemptions of capital | (643,171 | ) | ||
| Net increase in member’s equity resulting from capital transactions | 7,015,335 | |||
| Total increase | 7,717,549 | |||
| Member’s equity, beginning of period | — | |||
| Member’s equity, end of period | $ | 7,717,549 |
See notes to financial statements.
F-224
| Galaxy Plus Fund – LRR Master Fund (522) LLC |
| (A Delaware Limited Liability Company) |
| Notes to the Financial Statements |
| Note 1. | Organization and Structure |
Galaxy Plus Fund – LRR Master Fund (522) LLC (the “Master Fund”) was formed in Delaware as a limited liability company on January 26, 2016 and commenced operation on April 28, 2016. The Master Fund is a multi-advisor managed futures fund that allocates and reallocates its capital to different trading advisors implementing various trading programs. As of December 31, 2016, these trading advisors were Landmark Trading Company (“Landmark”), Rosetta Capital Management, LLC (“Rosetta”), and Red Oak Commodity Advisors, Inc (“Red Oak”) (collectively, the “Trading Advisors”). Landmark and Red Oak run discretionary programs and Rosetta runs a technical program. Each Trading Advisor runs their Program independently of one another.
The Master Fund and other separately formed Delaware limited liability companies (“Other Master Funds”), are investment vehicles available under the Galaxy Plus Managed Account Platform (the “Platform”). The Master Fund and the Platform are sponsored by Gemini Alternative Funds, LLC (the “Sponsor” or “GAF”) as a means of making available, to qualified high net-worth individuals and institutional investors (including fund of hedge funds) (“Investors”), a variety of third-party professional managed futures and foreign exchange advisors (“Advisors”). The Trading Advisors are not affiliated with the Sponsor.
GAF was formed in October 2013 and its principal office is located in Chicago, Illinois. GAF is registered with the U.S. Commodity Futures Trading Commission (CFTC) as a commodity pool operator and commodity trading advisor, and is a member of the National Futures Association (NFA).
Galaxy Plus Fund LLC, a Delaware Series Limited Liability Company (the “Onshore Platform”), and Galaxy Plus Fund SPC, a Cayman Islands Segregated Portfolio Company (the “Offshore Platform”) serve as the feeder funds for the Platform and invest substantially all of the assets of the respective segregated portfolios (each a “Fund”) in the Master Fund or other Master Funds. Galaxy Plus Fund – LRR Feeder Fund (522) (“LLC522”), a separated series of the Onshore Platform and Galaxy Plus Fund – LRR Offshore Feeder Fund (522) Segregated Portfolio (“SPC522”), a segregated portfolio of the Offshore Platform, can each invest in the Master Fund. As of December 31, 2016, SPC 522 had not yet commenced operations.
LLC522 and SPC522 are collectively hereafter referred to as the “Feeder Funds”.
Subscriptions and redemptions into the Feeder Funds are the corresponding transactions with the Master Fund and are governed by the Onshore Platform’s and the Offshore Platform’s respective Confidential Offering Memorandums.
The Platform has appointed the Sponsor, under the terms of the Limited Liability Company Agreement (the “LLC Agreement”) as the managing member of the Master Fund. In such capacity, the Sponsor has the authority, to manage, with wide discretionary powers, the business and affairs of the Master Fund including the authority to select the administrator for the Master Fund. The LLC Agreement will continue to remain in force until terminated by either the Sponsor or the Platform upon not less than sixty (60) days’ prior written notice. In certain circumstances (for example, the insolvency of either party or in the event all trading for the Platform by the Advisors are suspended), the LLC Agreement may be immediately terminated by either party.
F-225
| Galaxy Plus Fund – LRR Master Fund (522) LLC |
| (A Delaware Limited Liability Company) |
| Notes to the Financial Statements |
The Master Fund and the Sponsor have entered into tri-party contracts (the “Trading Agreements”) with the Trading Advisors pursuant to which the Master Fund’s trading accounts are managed, subject to rights of termination, by the Trading Advisors in accordance with the Program. The Trading Advisors may alter their programs (including thier trading systems and methods and including the addition and/or deletion of any financial interests or contracts traded in the Master Fund’s trading accounts), provided that the Trading Advisors provide prior notice to the Master Fund and the Sponsor of any material change to the Trading Advisor’s Program. From time to time, the Trading Advisors (or their affiliates) may manage additional accounts, and these accounts will increase the level of competition for the same trades desired for the Master Fund, including the priorities of order entry. There is no specific limit as to the number of accounts the Trading Advisors (or their affiliates) may manage. In addition, the positions of all of the accounts owned or controlled by the Trading Advisors (or their affiliates) are aggregated for the purposes of applying speculative position limits. The management, incentive, and sponsor fees are paid directly by the Feeder Funds, and for this reason are not recorded as expenses of the Master Fund.
| Note 2. | Summary of Significant Accounting Policies |
The following is a summary of significant accounting policies consistently followed in the preparation of the Master Fund’s financial statements.
Principles of accounting:The accompanying financial statements are expressed in United States dollars (USD) and have been prepared in accordance with Generally Accepted Accounting Principles (GAAP), as established by the Financial Accounting Standards Board (FASB), to ensure consistent reporting of financial condition and results of operations. The Master Fund is an investment company and follows the accounting and reporting guidance in FASB Account Standards Codification Topic 946.
Cash and restricted cash: Cash held in the commodity trading accounts at clearing broker consists of either cash maintained in the custody of the broker, a portion of which is required margin for open positions, or amounts due to/from the broker for margin or unsettled trades. The Master Fund may also hold cash in a non-interest bearing USD commercial bank account. The Master Fund can holds various currencies at the clearing broker, of which $7,156,163 is held in USD and $0 in foreign currencies as of December 31, 2016, and are recorded in cash and restricted cash – margin balance on the statement of financial condition. The non-U.S. currencies fluctuate in value on a daily basis relative to the USD. A portion of this cash is restricted cash required to meet maintenance margin requirements. Cash with the clearing broker as of December 31, 2016 included restricted cash for margin requirements of $1,134,600. This cash becomes unrestricted when the underlying positions to which it is applicable are liquidated. Cash with the clearing broker as of December 31, 2016 included amounts due to the broker for unsettled trades of $0.
Offsetting of amounts related to certain contracts: When the requirements are met, the Master Fund offsets certain fair value amounts recognized for net derivative positions executed with the same counterparty under the same master netting arrangement (See Note 5).
F-226
| Galaxy Plus Fund – LRR Master Fund (522) LLC |
| (A Delaware Limited Liability Company) |
| Notes to the Financial Statements |
Valuation and Revenue Recognition: Depending on the Program and Investments traded, the Master Fund follows the following valuation and revenue recognition policies. All investments are recorded at their estimated fair value, as described in Note 3.
Futures and options on futures contracts: The Master Fund may enter into futures and options on futures contracts. Upon entering into a futures contract, The Master Fund agrees to receive or deliver a fixed quantity of an underlying instrument or commodity for an agreed-upon price, while an option contract provides the option purchaser with the right, but not the obligation, to buy or sell a security or financial instrument at a predetermined exercise price during a defined period. Futures and options on futures contracts are recorded on the trade date. The difference between the original contract amount and the fair value of futures contracts purchased or sold is reflected as unrealized appreciation/(depreciation) on open contracts. Options on futures contracts are reflected in investments at fair value. The difference between the premiums paid or received on open options on futures contracts and fair value of such options is recorded as unrealized appreciation/(depreciation) on open contracts. The fair value of futures and options on futures contracts is based upon daily exchange settlement prices. The realized gain or loss is determined on the settlement of intraday trades first and then by the FIFO method.
Foreign currency transactions: The Master Fund’s financial statements are denominated in USD. However, foreign currency forward contracts, non-U.S. futures contracts, and non-U.S. options on futures contracts are denominated in currencies other than USD. Assets and liabilities and transactions denominated in currencies other than the USD are translated into USD at the rates in effect either at the close of business on the last business day of the reporting period or on the date of such transactions, respectively. Net realized foreign exchange gain or loss arises from the sales of foreign currencies and currency gains or losses realized between trade and settlement dates. Net unrealized foreign exchange gain and loss arises from changes in the fair value of assets and liabilities resulting from changes in exchange rates.
Trading costs: Trading costs generally consist of brokerage commissions, brokerage fees, clearing fees, exchange and regulatory fees, transaction and NFA fees. Fees vary by type of contract for each purchase and sale or sale and purchase (round turn) of futures, options on futures, and forward contracts. Commissions are paid on each individual purchase and sale transaction. These costs are recognized as expenses for futures and options on futures transactions and are included in net realized gain/loss from derivative contracts on the Statement of Operations.
Interest income/expense: Interest income and expense is recognized on an accrual basis.
Allocation of income and gains and losses: Profits and losses for each monthly accounting period, or shorter period if there are mid-month subscriptions and/or redemptions, are allocated pro-rata to the Feeder Funds based on their respective ownership percentage on the first day of each period throughout the year.
Income taxes: The Master Fund will not be subject to United States federal income taxation other than certain withholding taxes. The Master Fund evaluates tax positions taken or expected to be taken to determine whether the tax positions are more-likely-than-not of being sustained by the applicable tax authority. For tax positions meeting the more-likely-than-not threshold, the tax amount recognized in the financial statements is reduced by the largest benefit that has a greater than fifty percent likelihood of being realized upon ultimate settlement with the relevant taxing authority. The Master Fund has determined that there is no tax liability resulting from uncertain income tax positions taken or expected to be taken with respect to all open tax years. The Master Fund’s U.S. Federal tax returns for the period ended December 31, 2016, remain open. The Master Fund recognizes interest and penalties, if any, related to unrecognized tax benefits as income tax expense in the statement of operations. During the period, the Master Fund did not accrue any interest or penalties.
F-227
| Galaxy Plus Fund – LRR Master Fund (522) LLC |
| (A Delaware Limited Liability Company) |
| Notes to the Financial Statements |
Use of estimates:The preparation of financial statements in accordance with GAAP requires management to make estimates and assumptions that affect the reported amounts of assets and liabilities and disclosure of contingent assets and liabilities at the date of the financial statements and the reported amounts of income and expenses during the reporting period. Actual results could differ from those estimates.
Indemnifications:The Sponsor and its affiliates are indemnified against certain liabilities arising out of the performance of their duties for The Master Fund. In addition, in the normal course of business, the Master Fund enters into contracts with vendors and others that provide for general indemnifications. The Master Fund’s maximum exposure under these arrangements is unknown as this would involve future claims that may be made against the Master Fund. However, the Master Fund expects the risk of loss to be remote.
Statement of cash flows: The Master Fund has elected not to provide a statement of cash flows as permitted by GAAP as all of the following conditions have been met:
| ● | During the period, substantially all of the Master Fund’s investments were carried at fair value and classified as Level 1 or Level 2 measurements in accordance with FASB ASC 820; |
| ● | The Master Fund had little or no debt during the period; |
| ● | The Master Fund’s financial statements include a statement of changes in member’s equity. |
Subscriptions and redemptions: Subscriptions and redemptions can typically be made on a weekly basis as of the first day (Monday) of each week; (or, if such day is not a business day, the first business day thereafter) (each, a Subscription Date or a Redemption Date). The Master Fund may accept subscriptions or redemptions more frequently than the first day of each week, depending upon the size of the requested subscription or redemption amount, with the approval of the Sponsor.
| Note 3. | Fair Value Measurements |
The Master Fund’s investments are stated at fair value in accordance with FASB ASC 820, Fair Value Measurements and Disclosures (ASC 820). ASC 820 defines fair value, establishes a framework for measuring fair value and expands disclosures about fair value measurements. ASC 820 also emphasizes that fair value is a market-based measurement, not an entity-specific measurement, and sets out a fair value hierarchy with the highest priority being quoted prices in active market. Under ASC 820, fair value measurements are disclosed by level within that hierarchy, as follows:
Level 1 — Values for investments classified as Level 1 are based on unadjusted quoted prices for identical investments in an active market. Since valuations are based on quoted prices that are readily accessible at the measurement date, valuation of these investments does not entail a significant degree of judgment.
Level 2 — Values for investments classified as Level 2 are based on quoted prices for similar investments in an active or non-active markets for which all significant inputs are observable either directly or indirectly. Level 2 inputs may also include discounts related to restrictions on the investments.
Level 3 — Values for investments categorized as Level 3 are based on prices or valuation techniques that require inputs that are both significant to the fair value and unobservable, including valuations by the Sponsor in the absence of readily ascertainable fair values.
A description of the valuation methodologies applied to the Master Fund’s major categories of assets and liabilities measured at fair value on a recurring basis follows. Inputs that are used in determining fair value of an investment may include price information, credit data, volatility statistics, and other factors. These
F-228
| Galaxy Plus Fund – LRR Master Fund (522) LLC |
| (A Delaware Limited Liability Company) |
| Notes to the Financial Statements |
inputs can be either observable or unobservable. All of the inputs for the Master Fund were observable as of December 31, 2016. The availability of observable inputs can vary between investments and is affected by various factors such as type of investment and the volume and level of activity for that investment or similar investments in the marketplace.
Exchange-traded derivative contracts that are actively traded are valued based on daily quoted settlement prices from the respective exchange and are categorized in Level 1 of the fair value hierarchy. Exchange-traded derivative contracts not actively traded and over-the-counter (OTC) derivative contracts can include futures contracts, option on futures contracts, forward contracts and option contracts whose values are based on an underlying such as interest rates, foreign currencies, credit standing of reference entities, equities or commodities. Such derivative contracts are valued using observable market data, including currency spot rates or quoted prices of the related underlying obtained from the applicable exchange or market. OTC derivative contracts are valued using the above described pricing methodology and are categorized as Level 2 within the fair value hierarchy.
The Master Fund assesses the levels of the investments at each measurement date, and transfers between levels are recognized on the actual date of the event or change in circumstances that caused the transfer in accordance with the Master Fund’s accounting policy regarding the recognition of transfers between levels of the fair value hierarchy. There were no transfers among levels 1, 2, and 3 during the period ended December 31, 2016.
The inputs or methodologies used for valuing investments are not necessarily indicative of the risk associated with investing in those instruments.
F-229
| Galaxy Plus Fund – LRR Master Fund (522) LLC |
| (A Delaware Limited Liability Company) |
| Notes to the Financial Statements |
The following tables present the classification of derivatives, by type, into the fair value hierarchy levels as of December 31, 2016. Presentation is gross – as an asset if in a gain position and a liability if in a loss position.
| Fair Value Measurements at Reporting Date Using | ||||||||||||||||
| Quoted Prices | Significant Other | Significant | ||||||||||||||
| in Active | Observable | Unobservable | ||||||||||||||
| Markets | Inputs | Inputs | ||||||||||||||
| Description | Fair Value | (Level 1) | (Level 2) | (Level 3) | ||||||||||||
| Assets: | ||||||||||||||||
| Derivative contracts: | ||||||||||||||||
| Options purchased on futures contracts: | ||||||||||||||||
| Agriculture | $ | 577,440 | $ | 577,440 | $ | — | $ | — | ||||||||
| Futures contracts: | ||||||||||||||||
| Agriculture | 344,861 | 344,861 | — | — | ||||||||||||
| Currency | 106,710 | 106,710 | — | — | ||||||||||||
| Energy | 18,203 | 18,203 | — | — | ||||||||||||
| Index | 16,640 | 16,640 | — | — | ||||||||||||
| Interest | 10,383 | 10,383 | — | — | ||||||||||||
| Total investment assets at fair value | 1,074,237 | 1,074,237 | — | — | ||||||||||||
| Liabilities: | ||||||||||||||||
| Derivative contracts: | ||||||||||||||||
| Options written on futures contracts: | ||||||||||||||||
| Agriculture | (209,580 | ) | (209,580 | ) | — | — | ||||||||||
| Futures contracts: | ||||||||||||||||
| Agriculture | (62,224 | ) | (62,224 | ) | — | — | ||||||||||
| Currency | (35,735 | ) | (35,735 | ) | — | — | ||||||||||
| Interest | (63,287 | ) | (63,287 | ) | — | — | ||||||||||
| Metals | (178,227 | ) | (178,227 | ) | — | — | ||||||||||
| Total investment liabilities at fair value | (549,053 | ) | (549,053 | ) | — | — | ||||||||||
| Total net investment at fair value | $ | 525,184 | $ | 525,184 | $ | — | $ | — | ||||||||
F-230
| Galaxy Plus Fund – LRR Master Fund (522) LLC |
| (A Delaware Limited Liability Company) |
| Notes to the Financial Statements |
| Note 4. | Derivative Financial Instruments |
Derivative financial instruments speculatively traded by the Master Fund can include U.S. and foreign futures, options on futures contracts, and forward currency contracts (collectively, derivatives) whose values are based upon an underlying asset, indices, or reference rates, and generally represent future commitments to exchange cash flows, or to purchase or sell other financial instruments at specified future dates. A derivative contract may be traded on an exchange or OTC. Exchange-traded derivatives are standardized and include futures and option on futures contracts. OTC derivative contracts are negotiated between contracting parties and include forward currency contracts and certain options. Derivatives are subject to various risks similar to those related to the underlying financial instruments including market and credit risks.
Market risk is the potential for changes in the value of derivatives due to market changes, including interest and foreign exchange rate movements and fluctuations in commodity and security prices. Market risk is directly impacted by the volatility and liquidity in the markets in which the related underlying assets are traded. The market risk of the Master Fund is managed by the underlying Trading Advisors according to each respective Program. The Master Fund is exposed to a market risk equal to the notional contract value of the derivatives contracts purchased and unlimited liability on such contracts sold short.
Credit risk is the possibility that a loss may occur due to the failure of a counterparty to perform according to the terms of a contract. Credit risk due to exchange traded derivative financial instruments is significantly reduced by the regulatory requirements of the individual exchanges on which the instruments are traded. At any point in time, the credit risk for OTC derivatives is limited to the net unrealized gain for each counterparty for which a netting agreement exists, if any. In a similar fashion, liabilities represent net amounts owed to counterparties. The credit risk exposure for the Master Fund’s outstanding OTC derivatives was $0 at December 31, 2016.
Purchase and sale of futures contracts requires margin deposits with the broker. Additional deposits may be necessary for any loss on contract value. The U.S. Commodity Exchange Act requires a broker to segregate all customer transactions and assets from such broker’s proprietary activities. A customer’s cash and other property (for example, U.S. Treasury bills) deposited with a broker are considered commingled with all other customer funds subject to the broker’s segregation requirements. In the event of a broker’s insolvency, recovery may be limited to a pro rata share of segregated funds available. It is possible that the recovered amount could be less than total cash and other property deposited.
The Master Fund has a substantial portion of its assets on deposit with counterparties. In the event of a counterparty’s insolvency, recovery of The Master Fund’s assets on deposit may be limited to account insurance or other protection afforded such deposits.
F-231
| Galaxy Plus Fund – LRR Master Fund (522) LLC |
| (A Delaware Limited Liability Company) |
| Notes to the Financial Statements |
The notional value represents amounts related to the Master Fund’s stock exchange indices, commodities, interest rate and foreign currencies upon which the fair value of the futures contracts held by the Master Fund are based. Notional values do not represent the current fair value of, and are not necessarily indicative of the future cash flows of the Master Fund’s futures and forward contracts. Further, the underlying price changes in relation to variables specified by the notional values affects the fair value of these derivative financial instruments. Theoretically, the Master Fund’s exposure is equal to the notional value of contracts purchased and unlimited on such contracts sold short. As of December 31, 2016, the Master Fund had open futures contracts with the following notional values by sector:
| Description | Quantity | Notional Value | Description | Quantity | Notional Value | |||||||||||||
| Long: | Short: | |||||||||||||||||
| Agriculture | 281 | $ | 9,678,311 | Agriculture | 42 | $ | (1,091,702 | ) | ||||||||||
| Currency | 94 | 6,308,096 | Currency | 71 | (8,840,750 | ) | ||||||||||||
| Energy | 18 | 650,880 | Index | 11 | (1,728,705 | ) | ||||||||||||
| Metals | 47 | 3,703,237 | Interest | 59 | (8,841,826 | ) | ||||||||||||
During the period ended December 31, 2016, the Master Fund participated in 882 futures contract, and 96 options on futures contract transactions.
Transactions in options written during the period ending December 31, 2016, were as follows:
| Number of | Premiums | |||||||
| Contracts | Received | |||||||
| Options outstanding at April 28, 2016 | — | $ | — | |||||
| Options written | 939 | 722,649 | ||||||
| Options terminated in closing purchase transaction | (421 | ) | (338,210 | ) | ||||
| Options expired | (174 | ) | (24,190 | ) | ||||
| Options exercised | — | — | ||||||
| Options outstanding at December 31, 2016 | 344 | $ | 360,249 | |||||
F-232
| Galaxy Plus Fund – LRR Master Fund (522) LLC |
| (A Delaware Limited Liability Company) |
| Notes to the Financial Statements |
Below is a summary of net trading gains and (losses) by investment type and industry:
| Net Trading | ||||
| Gain (Loss)* | ||||
| Options on futures contracts: | ||||
| Agriculture | $ | 471,295 | ||
| Total options on futures contracts | 471,295 | |||
| Futures contracts: | ||||
| Agriculture | (91,333 | ) | ||
| Currency | 238,953 | |||
| Energy | (96,311 | ) | ||
| Index | (82,943 | ) | ||
| Interest | 195,280 | |||
| Metals | 73,105 | |||
| Total futures contracts | 236,751 | |||
| Trading costs | (37,240 | ) | ||
| Total net trading gain (loss) | 670,806 | |||
| * | Includes both realized gain of $72,602 and unrealized gain of $598,204 and is located in net realized and unrealized gain (loss) on investments on the statement of operations. Amounts exclude foreign currency transactions and translation. |
F-233
| Galaxy Plus Fund – LRR Master Fund (522) LLC |
| (A Delaware Limited Liability Company) |
| Notes to the Financial Statements |
| Note 5. | Balance Sheet Offsetting |
The Master Fund is required to disclose the impact of offsetting assets and liabilities presented in the statement of financial condition to enable users of the financial statements to evaluate the effect or potential effect of netting arrangements on its financial position for recognized assets and liabilities. These recognized assets and liabilities include financial instruments and derivative instruments that are either subject to an enforceable master netting arrangement or similar agreement or meet the following right of set-off criteria: each of the two parties owes the other determinable amounts, the Master Fund has the right to set-off the amounts owed with the amounts owed by the other party, the Master Fund intends to set off, and the Fund’s right of set-off is enforceable at law.
The Master Fund is subject to enforceable master netting agreements with certain counterparties. These agreements govern the terms of certain transactions, and reduce the counterparty risk associated with relevant transactions by specifying offsetting mechanisms and collateral posting arrangements at prearranged exposure levels. Since different types of transactions have different mechanics and are sometimes traded out of different legal entities of a particular counterparty organization, each type of transaction may be covered by a different master netting arrangement, possibly resulting in the need for multiple agreements with a single counterparty. Master netting agreements may not be specific to each different asset type; in such instances, they would allow the Master Fund to close out and net its total exposure to a specified counterparty in the events of default or early termination with respect to any and all the transactions governed under a single agreement with the counterparty.
The following tables summarize the Master Fund’s netting arrangements:
| Net Amount of | ||||||||||||
| Gross Amounts | Offset in the | Assets (Liabilities) | ||||||||||
| of Recognized | Statement of | in the Statement of | ||||||||||
| Description | Assets (Liabilities) | Financial Condition | Financial Condition | |||||||||
| Futures | $ | 496,797 | $ | (339,473 | ) | $ | 157,324 | |||||
| Options purchased on futures contracts | 577,440 | — | 577,440 | |||||||||
| Options written on futures contracts | (209,580 | ) | — | (209,580 | ) | |||||||
| Total | $ | 864,657 | $ | (339,473 | ) | $ | 525,184 | |||||
| Net Amount | ||||||||||||
| Net amount in | Cash Collateral | which is not offset | ||||||||||
| the Statement of | Received by | in the Statement of | ||||||||||
| Financial Condition | Counterparty | Financial Condition | ||||||||||
| Counterparty A | $ | 525,184 | $ | 1,134,600 | $ | 1,659,784 | ||||||
| Total | $ | 525,184 | $ | 1,134,600 | $ | 1,659,784 | ||||||
F-234
| Galaxy Plus Fund – LRR Master Fund (522) LLC |
| (A Delaware Limited Liability Company) |
| Notes to the Financial Statements |
| Note 6. | Related Parties |
Gemini Hedge Fund Services, LLC an affiliate of the Sponsor, provides administration services for the Master Fund.
| Note 7. | Subscription in kind |
The Master Fund commenced operations on April 28, 2016. The first subscription into the Master Fund was made by LLC522 and was done, in part, via an assumption of liabilities on that date. The Master Fund assumed $27,740 in fair value of options written from LLC522.
| Note 8. | Financial Highlights |
Financial highlights of the Master Fund for the period April 28, 2016 (commencement of operations) through December 31, 2016 are presented in the table below. The information has been derived from information presented in the financial statements.
| Total return (A) | 10.59 | % | ||
| Ratio to average member’s equity (B): | ||||
| Net investment income (C) | — | % | ||
| Total expenses | — | % |
| (A) | Total return is based on the change in average member’s equity during the period of a theoretical investment made at the inception of the Master Fund. |
| (B) | The total expense and net investment loss ratios are computed based upon weighted-average member’s equity as a whole for the period ended December 31, 2016. |
| (C) | The net investment loss ratio excludes net realized and unrealized gains (losses) on investments. |
Financial highlights are calculated for each member class taken as a whole. An individual member’s return and ratios may vary based on the timing of capital transactions. The total return would have been lower, and the net investment income and total expense ratios would have been higher if the management and incentive fees, as well as sponsor fees, had been charged to the Master Fund. The ratios, excluding nonrecurring expenses, have been annualized. Total return has not been annualized.
| Note 9. | Subsequent Events |
In accordance with FASB ASC 855,Subsequent Events, the Sponsor has evaluated all subsequent events requiring recognition and disclosure in the Master Fund’s financial statements through March 24, 2017, the date the financial statements were available for issuance. The Sponsor has determined that there are no material events that would require recognition or disclosure in the Master Fund’s financial statements through this date.
F-235
| Galaxy Plus Fund – LRR Master Fund (522) LLC |
| (A Delaware Limited Liability Company) |
| Oath and Affirmation of the Commodity Pool Operator |
To the best of the knowledge and belief of the undersigned, the information contained in the annual report as of December 31, 2016 and for the period from April 28, 2016 (commencement of operations) to December 31, 2016, is accurate and complete.
|
| David Young, President |
| Gemini Alternative Funds, LLC — Sponsor |
F-236
Galaxy Plus Fund – QIM
Master Fund (526) LLC
(A Delaware Limited Liability Company)
The attached annual report is filed under exemption pursuant to
Section 4.7 of the regulations under the Commodity Exchange Act.
Financial Report
December 31, 2016
F-237
Independent Auditor’s Report
Board of Directors
Galaxy Plus Fund LLC
Report on the Financial Statements
We have audited the accompanying financial statements of Galaxy Plus Fund – QIM Master Fund (526) LLC (the Fund), which comprise the statement of financial condition, including the condensed schedule of investments, as of December 31, 2016, and the related statements of operations, and changes in member’s equity for the period from June 22, 2016 (commencement of operations) to December 31, 2016, and the related notes to the financial statements.
Management's Responsibility for the Financial Statements
Management is responsible for the preparation and fair presentation of these financial statements in accordance with accounting principles generally accepted in the United States of America; this includes the design, implementation and maintenance of internal control relevant to the preparation and fair presentation of financial statements that are free from material misstatement, whether due to fraud or error.
Auditor’s Responsibility
Our responsibility is to express an opinion on these financial statements based on our audit. We conducted our audit in accordance with auditing standards generally accepted in the United States of America. Those standards require that we plan and perform the audit to obtain reasonable assurance about whether the financial statements are free from material misstatement.
An audit involves performing procedures to obtain audit evidence about the amounts and disclosures in the financial statements. The procedures selected depend on the auditor’s judgment, including the assessment of the risks of material misstatement of the financial statements, whether due to fraud or error. In making those risk assessments, the auditor considers internal control relevant to the entity’s preparation and fair presentation of the financial statements in order to design audit procedures that are appropriate in the circumstances, but not for the purpose of expressing an opinion on the effectiveness of the entity’s internal control. Accordingly, we express no such opinion. An audit also includes evaluating the appropriateness of accounting policies used and the reasonableness of significant accounting estimates made by management, as well as evaluating the overall presentation of the financial statements.
We believe that the audit evidence we have obtained is sufficient and appropriate to provide a basis for our audit opinion.
F-238
Opinion
In our opinion, the financial statements referred to above present fairly, in all material respects, the financial position of Galaxy Plus Fund – QIM Master Fund (526) LLC as of December 31, 2016, and the results of its operations for the period from June 22, 2016 (commencement of operations) to December 31, 2016, in accordance with accounting principles generally accepted in the United States of America.
/s/ RSM US LLP
Denver, Colorado
March 24, 2017
F-239
| Galaxy Plus Fund - QIM Master Fund (526) LLC |
| (A Delaware Limited Liability Company) |
| Statement of Financial Condition |
| December 31, 2016 |
| (Expressed in U.S. Dollars) |
| Assets | ||||
| Equity in commodity trading accounts at clearing brokers: | ||||
| Cash | $ | 6,500,666 | ||
| Restricted cash - margin balance | 14,705,935 | |||
| Investments in futures contracts at fair value (represents unrealized appreciation on open derivative contracts, net) | 331,143 | |||
| Other assets | 12,026 | |||
| Total assets | $ | 21,549,770 | ||
| Liabilities and Member’s Equity | ||||
| Liabilities | ||||
| Due to feeder | $ | 93,147 | ||
| Total liabilities | 93,147 | |||
| Member’s equity | 21,456,623 | |||
| Total liabilities and member’s equity | $ | 21,549,770 |
See notes to financial statements.
F-240
| Galaxy Plus Fund - QIM Master Fund (526) LLC |
| (A Delaware Limited Liability Company) |
| Condensed Schedule of Investments |
| December 31, 2016 |
| (Expressed in U.S. Dollars) |
| Number of | Percent of | |||||||||||
| Contracts/Units | Fair Value | Member’s Equity | ||||||||||
| Long positions: | ||||||||||||
| Derivative contracts: | ||||||||||||
| Domestic (United States): | ||||||||||||
| Futures contracts: | ||||||||||||
| Energy | 69 | $ | 75,753 | 0.35 | % | |||||||
| Index | 471 | (225,052 | ) | (1.05 | ) | |||||||
| Metals | 56 | (3,328 | ) | (0.02 | ) | |||||||
| Foreign: | ||||||||||||
| Futures contracts: | ||||||||||||
| Energy | 38 | 50,860 | 0.24 | |||||||||
| Index | 728 | 169,354 | 0.79 | |||||||||
| Interest | 507 | 540,355 | 2.52 | |||||||||
| Total long positions | 607,942 | 2.83 | ||||||||||
| Short positions: | ||||||||||||
| Derivative contracts: | ||||||||||||
| Domestic (United States): | ||||||||||||
| Futures contracts: | ||||||||||||
| Currency | 77 | (49,524 | ) | (0.23 | ) | |||||||
| Index | 6 | 5,720 | 0.03 | |||||||||
| Interest | 260 | (86,257 | ) | (0.40 | ) | |||||||
| Foreign: | ||||||||||||
| Futures contracts: | ||||||||||||
| Index | 13 | (33,580 | ) | (0.16 | ) | |||||||
| Interest | 119 | (113,158 | ) | (0.53 | ) | |||||||
| Total short positions | (276,799 | ) | (1.29 | ) | ||||||||
| Investments in futures contracts, at fair value | $ | 331,143 | 1.54 | % | ||||||||
See notes to financial statements.
F-241
| Galaxy Plus Fund - QIM Master Fund (526) LLC |
| (A Delaware Limited Liability Company) |
| Statement of Operations |
| For the period from June 22, 2016 (Commencement of Operations) to December 31, 2016 |
| (Expressed in U.S. Dollars) |
| Expenses: | ||||
| Interest expense | $ | 6,967 | ||
| Total expenses | 6,967 | |||
| Net investment loss | (6,967 | ) | ||
| Realized and unrealized gain (loss) on investments and foreign currency transactions: | ||||
| Net realized gain from: | ||||
| Derivative contracts1 | 5,988,931 | |||
| Foreign currency transactions | 15,085 | |||
| 6,004,016 | ||||
| Net increase (decrease) in unrealized appreciation on: | ||||
| Derivative contracts | 331,143 | |||
| Translation of assets and liabilities denominated in foreign currencies | (5,359 | ) | ||
| 325,784 | ||||
| Net realized and unrealized gain on investments and foreign currency transactions | 6,329,800 | |||
| Net increase in member’s equity resulting from operations | $ | 6,322,833 |
| 1 | Includes broker trading commisions |
See notes to financial statements.
F-242
| Galaxy Plus Fund - QIM Master Fund (526) LLC |
| (A Delaware Limited Liability Company) |
| Statement of Changes in Member’s Equity |
| For the period from June 22, 2016 (Commencement of Operations) to December 31, 2016 |
| (Expressed in U.S. Dollars) |
| Changes in member’s equity from operations: | ||||
| Net investment loss | $ | (6,967 | ) | |
| Net realized gain (loss) from derivative contracts and foreign currency transactions | 6,004,016 | |||
| Net increase (decrease) in unrealized appreciation on derivative contracts and translation of assets and liabilities denominated in foreign currencies | 325,784 | |||
| Net increase in member’s equity resulting from operations | 6,322,833 | |||
| Changes in member’s equity from capital transactions: | ||||
| Proceeds from issuance of capital | 18,192,995 | |||
| Payments for redemptions of capital | (3,059,205 | ) | ||
| Net increase in member’s equity resulting from capital transactions | 15,133,790 | |||
| Total increase | 21,456,623 | |||
| Member’s equity, beginning of period | — | |||
| Member’s equity, end of period | $ | 21,456,623 |
See notes to financial statements.
F-243
| Galaxy Plus Fund – QIM Master Fund (526) LLC |
| (A Delaware Limited Liability Company) |
| Notes to the Financial Statements |
| Note 1. | Organization and Structure |
Galaxy Plus Fund – QIM Master Fund (526) LLC (the “Master Fund”) was formed in Delaware as a limited liability company on April 19, 2016 and commenced operation on June 22, 2016. The Master Fund was created to serve as the trading entity managed by Quantitative Investment Management, L.L.C. (the “Trading Advisor”) pursuant to its Global Program (the “Program”). The Program is a short to medium-term trading strategy designed to capitalize on market inefficiencies across a wide array of futures markets.
The Master Fund and other separately formed Delaware limited liability companies (“Other Master Funds”), are investment vehicles available under the Galaxy Plus Managed Account Platform (the “Platform”). The Master Fund and the Platform are sponsored by Gemini Alternative Funds, LLC (the “Sponsor” or “GAF”) as a means of making available, to qualified high net-worth individuals and institutional investors (including fund of hedge funds) (“Investors”), a variety of third-party professional managed futures and foreign exchange advisors (“Advisors”). The Trading Advisor is not affiliated with the Sponsor.
GAF was formed in October 2013 and its principal office is located in Chicago, Illinois. GAF is registered with the U.S. Commodity Futures Trading Commission (CFTC) as a commodity pool operator and commodity trading advisor, and is a member of the National Futures Association (NFA).
Galaxy Plus Fund LLC, a Delaware Series Limited Liability Company (the “Onshore Platform”), and Galaxy Plus Fund SPC, a Cayman Islands Segregated Portfolio Company (the “Offshore Platform”) serve as the feeder funds for the Platform and invest substantially all of the assets of the respective segregated portfolios (each a “Fund”) in the Master Fund or other Master Funds. Galaxy Plus Fund – QIM Feeder Fund (526) (“LLC526”), a separated series of the Onshore Platform and Galaxy Plus Fund – QIM Offshore Feeder Fund (526) Segregated Portfolio (“SPC526”), a segregated portfolio of the Offshore Platform, can each invest in the Master Fund. As of December 31, 2016, SPC 526 had not yet commenced operations.
LLC526 and SPC526 are collectively hereafter referred to as the “Feeder Funds”.
Subscriptions and redemptions into the Feeder Funds are the corresponding transactions with the Master Fund and are governed by the Onshore Platform’s and the Offshore Platform’s respective Confidential Offering Memorandums.
The Platform has appointed the Sponsor, under the terms of the Limited Liability Company Agreement (the “LLC Agreement”) as the managing member of the Master Fund. In such capacity, the Sponsor has the authority, to manage, with wide discretionary powers, the business and affairs of the Master Fund including the authority to select the administrator for the Master Fund. The LLC Agreement will continue to remain in force until terminated by either the Sponsor or the Platform upon not less than sixty (60) days’ prior written notice. In certain circumstances (for example, the insolvency of either party or in the event all trading for the Platform by the Advisors are suspended), the LLC Agreement may be immediately terminated by either party.
F-244
| Galaxy Plus Fund – QIM Master Fund (526) LLC |
| (A Delaware Limited Liability Company) |
| Notes to the Financial Statements |
The Master Fund and the Sponsor have entered into a tri-party contract (the “Trading Agreement”) with the Trading Advisor pursuant to which the Master Fund’s trading accounts are managed, subject to rights of termination, by the Trading Advisor in accordance with the Program. The Trading Advisor may alter its Program (including its trading systems and methods and including the addition and/or deletion of any financial interests or contracts traded in the Master Fund’s trading accounts), provided that the Trading Advisor provide prior notice to the Master Fund and the Sponsor of any material change to the Trading Advisor’s Program. From time to time, the Trading Advisor (or its affiliates) may manage additional accounts, and these accounts will increase the level of competition for the same trades desired for the Master Fund, including the priorities of order entry. There is no specific limit as to the number of accounts the Trading Advisors (or their affiliates) may manage. In addition, the positions of all of the accounts owned or controlled by the Trading Advisor (or its affiliates) are aggregated for the purposes of applying speculative position limits. The management, incentive, and sponsor fees are paid directly by the Feeder Funds, and for this reason are not recorded as expenses of the Master Fund.
| Note 2. | Summary of Significant Accounting Policies |
The following is a summary of significant accounting policies consistently followed in the preparation of the Master Fund’s financial statements.
Principles of accounting:The accompanying financial statements are expressed in United States dollars (USD) and have been prepared in accordance with Generally Accepted Accounting Principles (GAAP), as established by the Financial Accounting Standards Board (FASB), to ensure consistent reporting of financial condition and results of operations. The Master Fund is an investment company and follows the accounting and reporting guidance in FASB Account Standards Codification Topic 946.
Cash and restricted cash: Cash held in the commodity trading accounts at clearing broker consists of either cash maintained in the custody of the broker, a portion of which is required margin for open positions, or amounts due to/from the broker for margin or unsettled trades. The Master Fund may also hold cash in a non-interest bearing USD commercial bank account. The Master Fund holds various currencies at the clearing broker, of which $19,572,265 is held in USD and $1,634,336 in foreign currencies as of December 31, 2016, and are recorded in cash and restricted cash – margin balance on the statement of financial condition. The non-U.S. currencies fluctuate in value on a daily basis relative to the USD. A portion of this cash is restricted cash required to meet maintenance margin requirements. Cash with the clearing broker as of December 31, 2016 included restricted cash for margin requirements of $14,705,935. This cash becomes unrestricted when the underlying positions to which it is applicable are liquidated. Cash with the clearing broker as of December 31, 2016 included amounts due to the broker for unsettled trades of $0.
Offsetting of amounts related to certain contracts: When the requirements are met, the Master Fund offsets certain fair value amounts recognized for net derivative positions executed with the same counterparty under the same master netting arrangement (See Note 5).
F-245
| Galaxy Plus Fund – QIM Master Fund (526) LLC |
| (A Delaware Limited Liability Company) |
| Notes to the Financial Statements |
Valuation and Revenue Recognition: Depending on the Program and Investments traded, The Master Fund follows the following valuation and revenue recognition policies. All investments are recorded at their estimated fair value, as described in Note 3.
Futures and options on futures contracts: The Master Fund may enter into futures and options on futures contracts. Upon entering into a futures contract, The Master Fund agrees to receive or deliver a fixed quantity of an underlying instrument or commodity for an agreed-upon price, while an option contract provides the option purchaser with the right, but not the obligation, to buy or sell a security or financial instrument at a predetermined exercise price during a defined period. Futures and options on futures contracts are recorded on the trade date. The difference between the original contract amount and the fair value of futures contracts purchased or sold is reflected as unrealized appreciation/(depreciation) on open contracts. Options on futures contracts are reflected in investments at fair value. The difference between the premiums paid or received on open options on futures contracts and fair value of such options is recorded as unrealized appreciation/(depreciation) on open contracts. The fair value of futures and options on futures contracts is based upon daily exchange settlement prices. The realized gain or loss is determined on the settlement of intraday trades first and then by the FIFO method.
Foreign currency transactions: The Master Fund’s financial statements are denominated in USD. However, foreign currency forward contracts, non-U.S. futures contracts, and non-U.S. options on futures contracts are denominated in currencies other than USD. Assets and liabilities and transactions denominated in currencies other than the USD are translated into USD at the rates in effect either at the close of business on the last business day of the reporting period or on the date of such transactions, respectively. Net realized foreign exchange gain or loss arises from the sales of foreign currencies and currency gains or losses realized between trade and settlement dates. Net unrealized foreign exchange gain and loss arises from changes in the fair value of assets and liabilities resulting from changes in exchange rates.
Trading costs: Trading costs generally consist of brokerage commissions, brokerage fees, clearing fees, exchange and regulatory fees, transaction and NFA fees. Fees vary by type of contract for each purchase and sale or sale and purchase (round turn) of futures, options on futures, and forward contracts. Commissions are paid on each individual purchase and sale transaction. These costs are recognized as expenses for futures and options on futures transactions and are included in net realized gain/loss from derivative contracts on the Statement of Operations.
Interest income/expense: Interest income and expense is recognized on an accrual basis.
Allocation of income and gains and losses: Profits and losses for each monthly accounting period, or shorter period if there are mid-month subscriptions and/or redemptions, are allocated pro-rata to the Feeder Funds based on their respective ownership percentage on the first day of each period throughout the year.
Income taxes: The Master Fund will not be subject to United States federal income taxation other than certain withholding taxes. The Master Fund evaluates tax positions taken or expected to be taken to determine whether the tax positions are more-likely-than-not of being sustained by the applicable tax authority. For tax positions meeting the more-likely-than-not threshold, the tax amount recognized in the financial statements is reduced by the largest benefit that has a greater than fifty percent likelihood of being realized upon ultimate settlement with the relevant taxing authority. The Master Fund has determined that there is no tax liability resulting from uncertain income tax positions taken or expected to be taken with respect to all open tax years. The Master Fund’s U.S. Federal tax returns for the period ended December 31, 2016, remain open. The Master Fund recognizes interest and penalties, if any, related to unrecognized tax benefits as income tax expense in the statement of operations. During the period, the Master Fund did not accrue any interest or penalties.
F-246
| Galaxy Plus Fund – QIM Master Fund (526) LLC |
| (A Delaware Limited Liability Company) |
| Notes to the Financial Statements |
Use of estimates:The preparation of financial statements in accordance with GAAP requires management to make estimates and assumptions that affect the reported amounts of assets and liabilities and disclosure of contingent assets and liabilities at the date of the financial statements and the reported amounts of income and expenses during the reporting period. Actual results could differ from those estimates.
Indemnifications:The Sponsor and its affiliates are indemnified against certain liabilities arising out of the performance of their duties for The Master Fund. In addition, in the normal course of business, the Master Fund enters into contracts with vendors and others that provide for general indemnifications. The Master Fund’s maximum exposure under these arrangements is unknown as this would involve future claims that may be made against the Master Fund. However, the Master Fund expects the risk of loss to be remote.
Statement of cash flows: The Master Fund has elected not to provide a statement of cash flows as permitted by GAAP as all of the following conditions have been met:
| ● | During the period, substantially all of the Master Fund’s investments were carried at fair value and classified as Level 1 or Level 2 measurements in accordance with FASB ASC 820; |
| ● | The Master Fund had little or no debt during the period; |
| ● | The Master Fund’s financial statements include a statement of changes in member’s equity. |
Subscriptions and redemptions: Subscriptions and redemptions can typically be made on a weekly basis as of the first day (Monday) of each week; (or, if such day is not a business day, the first business day thereafter) (each, a Subscription Date or a Redemption Date). The Master Fund may accept subscriptions or redemptions more frequently than the first day of each week, depending upon the size of the requested subscription or redemption amount, with the approval of the Sponsor.
| Note 3. | Fair Value Measurements |
The Master Fund’s investments are stated at fair value in accordance with FASB ASC 820, Fair Value Measurements and Disclosures (ASC 820). ASC 820 defines fair value, establishes a framework for measuring fair value and expands disclosures about fair value measurements. ASC 820 also emphasizes that fair value is a market-based measurement, not an entity-specific measurement, and sets out a fair value hierarchy with the highest priority being quoted prices in active market. Under ASC 820, fair value measurements are disclosed by level within that hierarchy, as follows:
Level 1 — Values for investments classified as Level 1 are based on unadjusted quoted prices for identical investments in an active market. Since valuations are based on quoted prices that are readily accessible at the measurement date, valuation of these investments does not entail a significant degree of judgment.
Level 2 — Values for investments classified as Level 2 are based on quoted prices for similar investments in an active or non-active markets for which all significant inputs are observable either directly or indirectly. Level 2 inputs may also include discounts related to restrictions on the investments.
Level 3 — Values for investments categorized as Level 3 are based on prices or valuation techniques that require inputs that are both significant to the fair value and unobservable, including valuations by the Sponsor in the absence of readily ascertainable fair values.
A description of the valuation methodologies applied to the Master Fund’s major categories of assets and liabilities measured at fair value on a recurring basis follows. Inputs that are used in determining fair value
F-247
| Galaxy Plus Fund – QIM Master Fund (526) LLC |
| (A Delaware Limited Liability Company) |
| Notes to the Financial Statements |
of an investment may include price information, credit data, volatility statistics, and other factors. These inputs can be either observable or unobservable. All of the inputs for the Master Fund were observable as of December 31, 2016. The availability of observable inputs can vary between investments and is affected by various factors such as type of investment and the volume and level of activity for that investment or similar investments in the marketplace.
Exchange-traded derivative contracts that are actively traded are valued based on daily quoted settlement prices from the respective exchange and are categorized in Level 1 of the fair value hierarchy. Exchange-traded derivative contracts not actively traded and over-the-counter (OTC) derivative contracts can include futures contracts, option on futures contracts, forward contracts and option contracts whose values are based on an underlying such as interest rates, foreign currencies, credit standing of reference entities, equities or commodities. Such derivative contracts are valued using observable market data, including currency spot rates or quoted prices of the related underlying obtained from the applicable exchange or market. OTC derivative contracts are valued using the above described pricing methodology and are categorized as Level 2 within the fair value hierarchy.
The Master Fund assesses the levels of the investments at each measurement date, and transfers between levels are recognized on the actual date of the event or change in circumstances that caused the transfer in accordance with the Master Fund’s accounting policy regarding the recognition of transfers between levels of the fair value hierarchy. There were no transfers among levels 1, 2, and 3 during the period ended December 31, 2016.
The inputs or methodologies used for valuing investments are not necessarily indicative of the risk associated with investing in those instruments.
F-248
| Galaxy Plus Fund – QIM Master Fund (526) LLC |
| (A Delaware Limited Liability Company) |
| Notes to the Financial Statements |
The following tables present the classification of derivatives, by type, into the fair value hierarchy levels as of December 31, 2016. Presentation is gross – as an asset if in a gain position and a liability if in a loss position.
| Fair Value Measurements at Reporting Date Using | ||||||||||||||||
| Quoted Prices | Significant Other | Significant | ||||||||||||||
| in Active | Observable | Unobservable | ||||||||||||||
| Markets | Inputs | Inputs | ||||||||||||||
| Description | Fair Value | (Level 1) | (Level 2) | (Level 3) | ||||||||||||
| Assets: | ||||||||||||||||
| Derivative contracts: | ||||||||||||||||
| Futures contracts: | ||||||||||||||||
| Currency | $ | 6,194 | $ | 6,194 | $ | — | $ | — | ||||||||
| Energy | 127,499 | 127,499 | — | — | ||||||||||||
| Index | 186,983 | 186,983 | — | — | ||||||||||||
| Interest | 563,253 | 563,253 | — | — | ||||||||||||
| Metals | 33,875 | 33,875 | — | — | ||||||||||||
| Total investment assets at fair value | 917,804 | 917,804 | — | — | ||||||||||||
| Liabilities: | ||||||||||||||||
| Derivative contracts: | ||||||||||||||||
| Futures contracts: | ||||||||||||||||
| Currency | (55,718 | ) | (55,718 | ) | — | — | ||||||||||
| Energy | (886 | ) | (886 | ) | — | — | ||||||||||
| Index | (270,541 | ) | (270,541 | ) | — | — | ||||||||||
| Interest | (222,313 | ) | (222,313 | ) | — | — | ||||||||||
| Metals | (37,203 | ) | (37,203 | ) | — | — | ||||||||||
| Total investment liabilities at fair value | (586,661 | ) | (586,661 | ) | — | — | ||||||||||
| Total net investment at fair value | $ | 331,143 | $ | 331,143 | $ | — | $ | — | ||||||||
F-249
| Galaxy Plus Fund – QIM Master Fund (526) LLC |
| (A Delaware Limited Liability Company) |
| Notes to the Financial Statements |
| Note 4. | Derivative Financial Instruments |
Derivative financial instruments speculatively traded by the Master Fund can include U.S. and foreign futures, options on futures contracts, and forward currency contracts (collectively, derivatives) whose values are based upon an underlying asset, indices, or reference rates, and generally represent future commitments to exchange cash flows, or to purchase or sell other financial instruments at specified future dates. A derivative contract may be traded on an exchange or OTC. Exchange-traded derivatives are standardized and include futures and option on futures contracts. OTC derivative contracts are negotiated between contracting parties and include forward currency contracts and certain options. Derivatives are subject to various risks similar to those related to the underlying financial instruments including market and credit risks.
Market risk is the potential for changes in the value of derivatives due to market changes, including interest and foreign exchange rate movements and fluctuations in commodity and security prices. Market risk is directly impacted by the volatility and liquidity in the markets in which the related underlying assets are traded. The market risk of the Master Fund is managed by the underlying Trading Advisors according to each respective Program. The Master Fund is exposed to a market risk equal to the notional contract value of the derivatives contracts purchased and unlimited liability on such contracts sold short.
Credit risk is the possibility that a loss may occur due to the failure of a counterparty to perform according to the terms of a contract. Credit risk due to exchange traded derivative financial instruments is significantly reduced by the regulatory requirements of the individual exchanges on which the instruments are traded. At any point in time, the credit risk for OTC derivatives is limited to the net unrealized gain for each counterparty for which a netting agreement exists, if any. In a similar fashion, liabilities represent net amounts owed to counterparties. The credit risk exposure for the Master Fund’s outstanding OTC derivatives was $0 at December 31, 2016.
Purchase and sale of futures contracts requires margin deposits with the broker. Additional deposits may be necessary for any loss on contract value. The U.S. Commodity Exchange Act requires a broker to segregate all customer transactions and assets from such broker’s proprietary activities. A customer’s cash and other property (for example, U.S. Treasury bills) deposited with a broker are considered commingled with all other customer funds subject to the broker’s segregation requirements. In the event of a broker’s insolvency, recovery may be limited to a pro rata share of segregated funds available. It is possible that the recovered amount could be less than total cash and other property deposited.
The Master Fund has a substantial portion of its assets on deposit with counterparties. In the event of a counterparty’s insolvency, recovery of The Master Fund’s assets on deposit may be limited to account insurance or other protection afforded such deposits.
The notional value represents amounts related to the Master Fund’s stock exchange indices, commodities, interest rate and foreign currencies upon which the fair value of the futures contracts held by the Master Fund are based. Notional values do not represent the current fair value of, and are not necessarily indicative of the future cash flows of the Master Fund’s futures and forward contracts. Further, the underlying price changes in relation to variables specified by the notional values affects the fair value of these derivative financial instruments. Theoretically, the Master Fund’s exposure is equal to the notional value of contracts purchased and unlimited on such contracts sold short. As of December 31, 2016, the Master Fund had open futures contracts with the following notional values by sector:
F-250
| Galaxy Plus Fund – QIM Master Fund (526) LLC |
| (A Delaware Limited Liability Company) |
| Notes to the Financial Statements |
| Description | Quantity | Notional Value | Description | Quantity | Notional Value | |||||||||||||
| Long: | Short: | |||||||||||||||||
| Energy | 107 | $ | 5,750,480 | Currency | 77 | $ | (9,585,868 | ) | ||||||||||
| Index | 1,199 | 83,220,998 | Index | 19 | (2,248,308 | ) | ||||||||||||
| Interest | 507 | 89,166,742 | Interest | 379 | (51,788,857 | ) | ||||||||||||
| Metals | 56 | 4,835,880 | ||||||||||||||||
During the period ended December 31, 2016, the Master Fund participated in 15,996 futures contract transactions.
Below is a summary of net trading gains and (losses) by investment type and industry:
| Net Trading | ||||
| Gain (Loss)* | ||||
| Futures contracts: | ||||
| Currency | $ | (72,964 | ) | |
| Energy | (599,938 | ) | ||
| Index | 6,853,123 | |||
| Interest | 286,872 | |||
| Metals | (56,901 | ) | ||
| Total futures contracts | 6,410,192 | |||
| Trading costs | (90,118 | ) | ||
| Total net trading gain (loss) | 6,320,074 | |||
| * | Includes both realized gain of $5,988,931 and unrealized gain of $331,143 and is located in net realized and unrealized gain (loss) on investments on the statement of operations. Amounts exclude foreign currency transactions and translation. |
F-251
| Galaxy Plus Fund – QIM Master Fund (526) LLC |
| (A Delaware Limited Liability Company) |
| Notes to the Financial Statements |
| Note 5. | Balance Sheet Offsetting |
The Master Fund is required to disclose the impact of offsetting assets and liabilities presented in the statement of financial condition to enable users of the financial statements to evaluate the effect or potential effect of netting arrangements on its financial position for recognized assets and liabilities. These recognized assets and liabilities include financial instruments and derivative instruments that are either subject to an enforceable master netting arrangement or similar agreement or meet the following right of set-off criteria: each of the two parties owes the other determinable amounts, the Master Fund has the right to set-off the amounts owed with the amounts owed by the other party, the Master Fund intends to set off, and the Fund’s right of set-off is enforceable at law.
The Master Fund is subject to enforceable master netting agreements with certain counterparties. These agreements govern the terms of certain transactions, and reduce the counterparty risk associated with relevant transactions by specifying offsetting mechanisms and collateral posting arrangements at prearranged exposure levels. Since different types of transactions have different mechanics and are sometimes traded out of different legal entities of a particular counterparty organization, each type of transaction may be covered by a different master netting arrangement, possibly resulting in the need for multiple agreements with a single counterparty. Master netting agreements may not be specific to each different asset type; in such instances, they would allow the Master Fund to close out and net its total exposure to a specified counterparty in the events of default or early termination with respect to any and all the transactions governed under a single agreement with the counterparty.
The following tables summarize the Master Fund’s netting arrangements:
| Net Amount of | ||||||||||||
| Gross Amounts | Offset in the | Assets (Liabilities) | ||||||||||
| of Recognized | Statement of | in the Statement of | ||||||||||
| Description | Assets (Liabilities) | Financial Condition | Financial Condition | |||||||||
| Futures | $ | (586,661 | ) | $ | 917,804 | $ | 331,143 | |||||
| Total | $ | (586,661 | ) | $ | 917,804 | $ | 331,143 | |||||
| Net Amount | ||||||||||||
| Net amount in | Cash Collateral | which is not offset | ||||||||||
| the Statement of | Received by | in the Statement of | ||||||||||
| Financial Condition | Counterparty | Financial Condition | ||||||||||
| Counterparty A | $ | 331,143 | $ | 14,705,935 | $ | 15,037,078 | ||||||
| Total | $ | 331,143 | $ | 14,705,935 | $ | 15,037,078 | ||||||
F-252
| Galaxy Plus Fund – QIM Master Fund (526) LLC |
| (A Delaware Limited Liability Company) |
| Notes to the Financial Statements |
| Note 6. | Related Parties |
Gemini Hedge Fund Services, LLC an affiliate of the Sponsor, provides administration services for the Master Fund.
| Note 7. | Financial Highlights |
Financial highlights of the Master Fund for the period June 22, 2016 (commencement of operations) through December 31, 2016 are presented in the table below. The information has been derived from information presented in the financial statements.
| Total return (A) | 35.88 | % | ||
| Ratio to average member’s equity (B): | ||||
| Net investment loss(C) | (0.07 | )% | ||
| Total expenses | 0.07 | % |
| (A) | Total return is based on the change in average member’s equity during the period of a theoretical investment made at the inception of the Master Fund. |
| (B) | The total expense and net investment loss ratios are computed based upon weighted-average member’s equity as a whole for the period ended December 31, 2016. |
| (C) | The net investment loss ratio excludes net realized and unrealized gains (losses) on investments. |
Financial highlights are calculated for each member class taken as a whole. An individual member’s return and ratios may vary based on the timing of capital transactions. The total return would have been lower, and the net investment loss and total expense ratios would have been higher if the management and incentive fees, as well as sponsor fee, had been charged to the Master Fund. The ratios, excluding nonrecurring expenses, have been annualized. Total return has not been annualized.
| Note 8. | Subsequent Events |
In accordance with FASB ASC 855,Subsequent Events, the Sponsor has evaluated all subsequent events requiring recognition and disclosure in the Master Fund’s financial statements through March 24, 2017, the date the financial statements were available for issuance. The Sponsor has determined that there are no material events that would require recognition or disclosure in the Master Fund’s financial statements through this date.
F-253
| Galaxy Plus Fund – QIM Master Fund (526) LLC |
| (A Delaware Limited Liability Company) |
| Oath and Affirmation of the Commodity Pool Operator |
To the best of the knowledge and belief of the undersigned, the information contained in the annual report as of December 31, 2016 for the period from June 22, 2016 (commencement of operations) to December 31, 2016, is accurate and complete.
|
| David Young, President |
| Gemini Alternative Funds, LLC — Sponsor |
F-254
| Galaxy Plus Fund – |
| Quantmetrics |
| Master Fund (527) LLC |
| (A Delaware Limited Liability Company) |
| The attached annual report is filed under exemption pursuant to |
| Section 4.7 of the regulations under the Commodity Exchange Act. |
| Financial Report |
| December 31, 2016 |
F-255
Independent Auditor’s Report
Board of Directors
Galaxy Plus Fund LLC
Report on the Financial Statements
We have audited the accompanying financial statements of Galaxy Plus Fund – Quantmetrics Master Fund (527) LLC (the Fund), which comprise the statement of financial condition as of December 31, 2016, and the related statements of operations, and changes in member’s equity for the period from June 13, 2016 (commencement of operations) to December 31, 2016, and the related notes to the financial statements.
Management's Responsibility for the Financial Statements
Management is responsible for the preparation and fair presentation of these financial statements in accordance with accounting principles generally accepted in the United States of America; this includes the design, implementation and maintenance of internal control relevant to the preparation and fair presentation of financial statements that are free from material misstatement, whether due to fraud or error.
Auditor’s Responsibility
Our responsibility is to express an opinion on these financial statements based on our audit. We conducted our audit in accordance with auditing standards generally accepted in the United States of America. Those standards require that we plan and perform the audit to obtain reasonable assurance about whether the financial statements are free from material misstatement.
An audit involves performing procedures to obtain audit evidence about the amounts and disclosures in the financial statements. The procedures selected depend on the auditor’s judgment, including the assessment of the risks of material misstatement of the financial statements, whether due to fraud or error. In making those risk assessments, the auditor considers internal control relevant to the entity’s preparation and fair presentation of the financial statements in order to design audit procedures that are appropriate in the circumstances, but not for the purpose of expressing an opinion on the effectiveness of the entity’s internal control. Accordingly, we express no such opinion. An audit also includes evaluating the appropriateness of accounting policies used and the reasonableness of significant accounting estimates made by management, as well as evaluating the overall presentation of the financial statements.
We believe that the audit evidence we have obtained is sufficient and appropriate to provide a basis for our audit opinion.
F-256
Opinion
In our opinion, the financial statements referred to above present fairly, in all material respects, the financial position of Galaxy Plus Fund – Quantmetrics Master Fund (527) LLC as of December 31, 2016, and the results of its operations for the period from June 13, 2016 (commencement of operations) to December 31, 2016, in accordance with accounting principles generally accepted in the United States of America.
/s/ RSM US LLP
Denver, Colorado
March 24, 2017
F-257
Galaxy Plus Fund - Quantmetrics Master Fund (527) LLC
(A Delaware Limited Liability Company)
Statement of Financial Condition
December 31, 2016
(Expressed in U.S. Dollars)
| Assets | ||||
| Equity in commodity trading accounts at clearing brokers: | ||||
| Cash | $ | 19,152,703 | ||
| Restricted cash - margin balance | 97,035 | |||
| Receivable from onshore feeder fund | 1,000 | |||
| Other assets | 10,720 | |||
| Total assets | $ | 19,261,458 | ||
| Liabilities and Member’s Equity | ||||
| Total Liabilities | $ | — | ||
| Member’s equity | 19,261,458 | |||
| Total liabilities and member’s equity | $ | 19,261,458 |
See notes to financial statements.
F-258
| Galaxy Plus Fund - Quantmetrics Master Fund (527) LLC |
| (A Delaware Limited Liability Company) |
| Statement of Operations |
| For the period from June 13, 2016 (Commencement of Operations) to December 31, 2016 |
| (Expressed in U.S. Dollars) |
| Investment Income: | ||||
| Interest income | $ | — | ||
| Expenses: | ||||
| Interest expense | 2,843 | |||
| Total expenses | 2,843 | |||
| Net investment loss | (2,843 | ) | ||
| Realized and unrealized gain (loss) on investments and foreign currency transactions: | ||||
| Net realized loss from: | ||||
| Derivative contracts1 | (260,477 | ) | ||
| Foreign currency transactions | (32,767 | ) | ||
| (293,244 | ) | |||
| Net increase (decrease) in unrealized depreciation on: | ||||
| Translation of assets and liabilities denominated in foreign currencies | 822 | |||
| 822 | ||||
| Net realized and unrealized loss on investments and foreign currency transactions | (292,422 | ) | ||
| Net decrease in member’s equity resulting from operations | $ | (295,265 | ) |
| 1 | Includes broker trading commissions |
See notes to financial statements.
F-259
| Galaxy Plus Fund - Quantmetrics Master Fund (527) LLC |
| (A Delaware Limited Liability Company) |
| Statement of Changes in Member’s Equity |
| For the period from June 13, 2016 (Commencement of Operations) to December 31, 2016 |
| (Expressed in U.S. Dollars) |
| Changes in member’s equity from operations: | ||||
| Net investment loss | $ | (2,843 | ) | |
| Net realized gain (loss) from derivative contracts and foreign currency transactions | (293,244 | ) | ||
| Net increase (decrease) in unrealized appreciation on derivative contracts and translation of assets and liabilities denominated in foreign currencies | 822 | |||
| Net decrease in member’s equity resulting from operations | (295,265 | ) | ||
| Changes in member’s equity from capital transactions: | ||||
| Proceeds from issuance of capital | 19,729,843 | |||
| Payments for redemptions of capital | (173,120 | ) | ||
| Net increase in member’s equity resulting from capital transactions | 19,556,723 | |||
| Total increase | 19,261,458 | |||
| Member’s equity, beginning of period | — | |||
| Member’s equity, end of period | $ | 19,261,458 |
See notes to financial statements.
F-260
| Galaxy Plus Fund – Quantmetrics Master Fund (527) LLC |
| (A Delaware Limited Liability Company) |
| Notes to the Financial Statements |
| Note 1. | Organization and Structure |
Galaxy Plus Fund – Quantmetrics Master Fund (527) LLC (the “Master Fund”) was formed in Delaware as a limited liability company on April 20, 2016 and commenced operations on June 13, 2016. The Master Fund was created to serve as the trading entity managed by QuantMetrics Capital Management, L.L.C. (the “Trading Advisor”) pursuant to its QM Multi Strategy Program (the “Program”). The Program is a systematic trading strategy with a focus on short term imbalances in the futures markets.
The Master Fund and other separately formed Delaware limited liability companies (“Other Master Funds”), are investment vehicles available under the Galaxy Plus Managed Account Platform (the “Platform”). The Master Fund and the Platform are sponsored by Gemini Alternative Funds, LLC (the “Sponsor” or “GAF”) as a means of making available, to qualified high net-worth individuals and institutional investors (including fund of hedge funds) (“Investors”), a variety of third-party professional managed futures and foreign exchange advisors (“Advisors”). The Trading Advisor is not affiliated with the Sponsor.
GAF was formed in October 2013 and its principal office is located in Chicago, Illinois. GAF is registered with the U.S. Commodity Futures Trading Commission (CFTC) as a commodity pool operator and commodity trading advisor, and is a member of the National Futures Association (NFA).
Galaxy Plus Fund LLC, a Delaware Series Limited Liability Company (the “Onshore Platform”), and Galaxy Plus Fund SPC, a Cayman Islands Segregated Portfolio Company (the “Offshore Platform”) serve as the feeder funds for the Platform and invest substantially all of the assets of the respective segregated portfolios (each a “Fund”) in the Master Fund or other Master Funds. Galaxy Plus Fund – Quantmetrics Feeder Fund (527) (“LLC527”), a separated series of the Onshore Platform and Galaxy Plus Fund – Quantmetrics Offshore Feeder Fund (527) Segregated Portfolio (“SPC527”), a segregated portfolio of the Offshore Platform, can each invest in the Master Fund. As of December 31, 2016, SPC 527 had not yet commenced operations.
LLC527 and SPC527 are collectively hereafter referred to as the “Feeder Funds”.
Subscriptions and redemptions into the Feeder Funds are the corresponding transactions with the Master Fund and are governed by the Onshore Platform’s and the Offshore Platform’s respective Confidential Offering Memorandums.
The Platform has appointed the Sponsor, under the terms of the Limited Liability Company Agreement (the “LLC Agreement”) as the managing member of the Master Fund. In such capacity, the Sponsor has the authority, to manage, with wide discretionary powers, the business and affairs of the Master Fund including the authority to select the administrator for the Master Fund. The LLC Agreement will continue to remain in force until terminated by either the Sponsor or the Platform upon not less than sixty (60) days’ prior written notice. In certain circumstances (for example, the insolvency of either party or in the event all trading for the Platform by the Advisors are suspended), the LLC Agreement may be immediately terminated by either party.
F-261
| Galaxy Plus Fund – Quantmetrics Master Fund (527) LLC |
| (A Delaware Limited Liability Company) |
| Notes to the Financial Statements |
The Master Fund and the Sponsor have entered into a tri-party contract (the “Trading Agreement”) with the Trading Advisor pursuant to which the Master Fund’s trading accounts are managed, subject to rights of termination, by the Trading Advisor in accordance with the Program. The Trading Advisor may alter its Program (including its trading systems and methods and including the addition and/or deletion of any financial interests or contracts traded in the Master Fund’s trading accounts), provided that the Trading Advisor provide prior notice to the Master Fund and the Sponsor of any material change to the Trading Advisor’s Program. From time to time, the Trading Advisor (or its affiliates) may manage additional accounts, and these accounts will increase the level of competition for the same trades desired for the Master Fund, including the priorities of order entry. There is no specific limit as to the number of accounts the Trading Advisors (or their affiliates) may manage. In addition, the positions of all of the accounts owned or controlled by the Trading Advisor (or its affiliates) are aggregated for the purposes of applying speculative position limits. The management and incentive fees due to the Trading Advisor, in accordance with the Trading Agreement, are paid directly by the Feeder Funds, and for this reason are not recorded as expenses of the Master Fund.
| Note 2. | Summary of Significant Accounting Policies |
The following is a summary of significant accounting policies consistently followed in the preparation of the Master Fund’s financial statements.
Principles of accounting:The accompanying financial statements are expressed in United States dollars (USD) and have been prepared in accordance with Generally Accepted Accounting Principles (GAAP), as established by the Financial Accounting Standards Board (FASB), to ensure consistent reporting of financial condition and results of operations. The Master Fund is an investment company and follows the accounting and reporting guidance in FASB Account Standards Codification Topic 946.
Cash and restricted cash: Cash held in the commodity trading accounts at clearing broker consists of either cash maintained in the custody of the broker, a portion of which is required margin for open positions, or amounts due to/from the broker for margin or unsettled trades. The Master Fund may also hold cash in a non-interest bearing USD commercial bank account. The Master Fund holds various currencies at the clearing broker, of which $19,022,620 is held in USD and $227,118 in foreign currencies as of December 31, 2016, and are recorded in cash and restricted cash – margin balance on the statement of financial condition. The non-U.S. currencies fluctuate in value on a daily basis relative to the USD. A portion of this cash is restricted cash required to meet maintenance margin requirements. Cash with the clearing broker as of December 31, 2016 included restricted cash for margin requirements of $97,035. This cash becomes unrestricted when the underlying positions to which it is applicable are liquidated. Cash with the clearing broker as of December 31, 2016 included amounts due to the broker for unsettled trades of $0.
Offsetting of amounts related to certain contracts: When the requirements are met, the Master Fund offsets certain fair value amounts recognized for net derivative positions executed with the same counterparty under the same master netting arrangement (See Note 5).
F-262
| Galaxy Plus Fund – Quantmetrics Master Fund (527) LLC |
| (A Delaware Limited Liability Company) |
| Notes to the Financial Statements |
Valuation and Revenue Recognition:Depending on the Program and Investments traded, The Master Fund follows the following valuation and revenue recognition policies. All investments are recorded at their estimated fair value, as described in Note 3.
Futures and options on futures contracts: The Master Fund may enter into futures and options on futures contracts. Upon entering into a futures contract, The Master Fund agrees to receive or deliver a fixed quantity of an underlying instrument or commodity for an agreed-upon price, while an option contract provides the option purchaser with the right, but not the obligation, to buy or sell a security or financial instrument at a predetermined exercise price during a defined period. Futures and options on futures contracts are recorded on the trade date. The difference between the original contract amount and the fair value of futures contracts purchased or sold is reflected as unrealized appreciation/(depreciation) on open contracts. Options on futures contracts are reflected in investments at fair value. The difference between the premiums paid or received on open options on futures contracts and fair value of such options is recorded as unrealized appreciation/(depreciation) on open contracts. The fair value of futures and options on futures contracts is based upon daily exchange settlement prices. The realized gain or loss is determined on the settlement of intraday trades first and then by the FIFO method.
Foreign currency transactions: The Master Fund’s financial statements are denominated in USD. However, foreign currency forward contracts, non-U.S. futures contracts, and non-U.S. options on futures contracts are denominated in currencies other than USD. Assets and liabilities and transactions denominated in currencies other than the USD are translated into USD at the rates in effect either at the close of business on the last business day of the reporting period or on the date of such transactions, respectively. Net realized foreign exchange gain or loss arises from the sales of foreign currencies and currency gains or losses realized between trade and settlement dates. Net unrealized foreign exchange gain and loss arises from changes in the fair value of assets and liabilities resulting from changes in exchange rates.
Trading costs: Trading costs generally consist of brokerage commissions, brokerage fees, clearing fees, exchange and regulatory fees, transaction and NFA fees. Fees vary by type of contract for each purchase and sale or sale and purchase (round turn) of futures, options on futures, and forward contracts. Commissions are paid on each individual purchase and sale transaction. These costs are recognized as expenses for futures and options on futures transactions and are included in net realized gain/loss from derivative contracts on the Statement of Operations.
Interest income/expense: Interest income and expense is recognized on an accrual basis.
Allocation of income and gains and losses: Profits and losses for each monthly accounting period, or shorter period if there are mid-month subscriptions and/or redemptions, are allocated pro-rata to the Feeder Funds based on their respective ownership percentage on the first day of each period throughout the year.
Income taxes: The Master Fund will not be subject to United States federal income taxation other than certain withholding taxes. The Master Fund evaluates tax positions taken or expected to be taken to determine whether the tax positions are more-likely-than-not of being sustained by the applicable tax authority. For tax positions meeting the more-likely-than-not threshold, the tax amount recognized in the financial statements is reduced by the largest benefit that has a greater than fifty percent likelihood of being realized upon ultimate settlement with the relevant taxing authority. The Master Fund has determined that there is no tax liability resulting from uncertain income tax positions taken or expected to be taken with respect to all open tax years. The Master Fund’s U.S. Federal tax returns for the period ended December 31, 2016, remain open. The Master Fund recognizes interest and penalties, if any, related to unrecognized tax benefits as income tax expense in the statement of operations. During the period, the Master Fund did not accrue any interest or penalties.
F-263
| Galaxy Plus Fund – Quantmetrics Master Fund (527) LLC |
| (A Delaware Limited Liability Company) |
| Notes to the Financial Statements |
Use of estimates:The preparation of financial statements in accordance with GAAP requires management to make estimates and assumptions that affect the reported amounts of assets and liabilities and disclosure of contingent assets and liabilities at the date of the financial statements and the reported amounts of income and expenses during the reporting period. Actual results could differ from those estimates.
Indemnifications:The Sponsor and its affiliates are indemnified against certain liabilities arising out of the performance of their duties for The Master Fund. In addition, in the normal course of business, the Master Fund enters into contracts with vendors and others that provide for general indemnifications. The Master Fund’s maximum exposure under these arrangements is unknown as this would involve future claims that may be made against the Master Fund. However, the Master Fund expects the risk of loss to be remote.
Statement of cash flows: The Master Fund has elected not to provide a statement of cash flows as permitted by GAAP as all of the following conditions have been met:
| ● | During the period, substantially all of the Master Fund’s investments were carried at fair value and classified as Level 1 or Level 2 measurements in accordance with FASB ASC 820; |
| ● | The Master Fund had little or no debt during the period; |
| ● | The Master Fund’s financial statements include a statement of changes in member’s equity. |
Subscriptions and redemptions: Subscriptions and redemptions can typically be made on a weekly basis as of the first day (Monday) of each week; (or, if such day is not a business day, the first business day thereafter) (each, a Subscription Date or a Redemption Date). The Master Fund may accept subscriptions or redemptions more frequently than the first day of each week, depending upon the size of the requested subscription or redemption amount, with the approval of the Sponsor.
| Note 3. | Fair Value Measurements |
The Master Fund’s investments are stated at fair value in accordance with FASB ASC 820, Fair Value Measurements and Disclosures (ASC 820). ASC 820 defines fair value, establishes a framework for measuring fair value and expands disclosures about fair value measurements. ASC 820 also emphasizes that fair value is a market-based measurement, not an entity-specific measurement, and sets out a fair value hierarchy with the highest priority being quoted prices in active market. Under ASC 820, fair value measurements are disclosed by level within that hierarchy, as follows:
Level 1 — Values for investments classified as Level 1 are based on unadjusted quoted prices for identical investments in an active market. Since valuations are based on quoted prices that are readily accessible at the measurement date, valuation of these investments does not entail a significant degree of judgment.
Level 2 — Values for investments classified as Level 2 are based on quoted prices for similar investments in an active or non-active markets for which all significant inputs are observable either directly or indirectly. Level 2 inputs may also include discounts related to restrictions on the investments.
Level 3 — Values for investments categorized as Level 3 are based on prices or valuation techniques that require inputs that are both significant to the fair value and unobservable, including valuations by the Sponsor in the absence of readily ascertainable fair values.
F-264
| Galaxy Plus Fund – Quantmetrics Master Fund (527) LLC |
| (A Delaware Limited Liability Company) |
| Notes to the Financial Statements |
A description of the valuation methodologies applied to the Master Fund’s major categories of assets and liabilities measured at fair value on a recurring basis follows. Inputs that are used in determining fair value of an investment may include price information, credit data, volatility statistics, and other factors. These inputs can be either observable or unobservable. As of December 31, 2016, the Master Fund held no investments. The availability of observable inputs can vary between investments and is affected by various factors such as type of investment and the volume and level of activity for that investment or similar investments in the marketplace.
Exchange-traded derivative contracts that are actively traded are valued based on daily quoted settlement prices from the respective exchange and are categorized in Level 1 of the fair value hierarchy. Exchange-traded derivative contracts not actively traded and over-the-counter (OTC) derivative contracts can include futures contracts, option on futures contracts, forward contracts and option contracts whose values are based on an underlying such as interest rates, foreign currencies, credit standing of reference entities, equities or commodities. Such derivative contracts are valued using observable market data, including currency spot rates or quoted prices of the related underlying obtained from the applicable exchange or market. OTC derivative contracts are valued using the above described pricing methodology and are categorized as Level 2 within the fair value hierarchy.
The Master Fund assesses the levels of the investments at each measurement date, and transfers between levels are recognized on the actual date of the event or change in circumstances that caused the transfer in accordance with the Master Fund’s accounting policy regarding the recognition of transfers between levels of the fair value hierarchy. There were no transfers among levels 1, 2, and 3 during the period ended December 31, 2016.
The inputs or methodologies used for valuing investments are not necessarily indicative of the risk associated with investing in those instruments. At December 31, 2016, the Master Fund had held no investments.
| Note 4. | Derivative Financial Instruments |
Derivative financial instruments speculatively traded by the Master Fund can include U.S. and foreign futures, options on futures contracts, and forward currency contracts (collectively, derivatives) whose values are based upon an underlying asset, indices, or reference rates, and generally represent future commitments to exchange cash flows, or to purchase or sell other financial instruments at specified future dates. A derivative contract may be traded on an exchange or OTC. Exchange-traded derivatives are standardized and include futures and option on futures contracts. OTC derivative contracts are negotiated between contracting parties and include forward currency contracts and certain options. Derivatives are subject to various risks similar to those related to the underlying financial instruments including market and credit risks.
Market risk is the potential for changes in the value of derivatives due to market changes, including interest and foreign exchange rate movements and fluctuations in commodity and security prices. Market risk is directly impacted by the volatility and liquidity in the markets in which the related underlying assets are traded. The market risk of the Master Fund is managed by the underlying Trading Advisors according to each respective Program. The Master Fund is exposed to a market risk equal to the notional contract value of the derivatives contracts purchased and unlimited liability on such contracts sold short.
Credit risk is the possibility that a loss may occur due to the failure of a counterparty to perform according to the terms of a contract. Credit risk due to exchange traded derivative financial instruments is significantly reduced by the regulatory requirements of the individual exchanges on which the instruments
F-265
| Galaxy Plus Fund – Quantmetrics Master Fund (527) LLC |
| (A Delaware Limited Liability Company) |
| Notes to the Financial Statements |
are traded. At any point in time, the credit risk for OTC derivatives is limited to the net unrealized gain for each counterparty for which a netting agreement exists, if any. In a similar fashion, liabilities represent net amounts owed to counterparties. The credit risk exposure for the Master Fund’s outstanding OTC derivatives was $0 at December 31, 2016.
Purchase and sale of futures contracts requires margin deposits with the broker. Additional deposits may be necessary for any loss on contract value. The U.S. Commodity Exchange Act requires a broker to segregate all customer transactions and assets from such broker’s proprietary activities. A customer’s cash and other property (for example, U.S. Treasury bills) deposited with a broker are considered commingled with all other customer funds subject to the broker’s segregation requirements. In the event of a broker’s insolvency, recovery may be limited to a pro rata share of segregated funds available. It is possible that the recovered amount could be less than total cash and other property deposited. The Master Fund has a substantial portion of its assets on deposit with counterparties. In the event of a counterparty’s insolvency, recovery of The Master Fund’s assets on deposit may be limited to account insurance or other protection afforded such deposits.
The notional value represents amounts related to the Master Fund’s stock exchange indices, commodities, interest rate and foreign currencies upon which the fair value of the futures contracts held by the Master Fund are based. Notional values do not represent the current fair value of, and are not necessarily indicative of the future cash flows of the Master Fund’s futures and forward contracts. Further, the underlying price changes in relation to variables specified by the notional values affects the fair value of these derivative financial instruments. Theoretically, the Master Fund’s exposure is equal to the notional value of contracts purchased and unlimited on such contracts sold short. The Master Fund held no open positions as of December 31, 2016.
During the period ended December 31, 2016, the Master Fund participated in 45,184 futures contract transactions.
Below is a summary of net trading gains and (losses) by investment type and industry:
| Net Trading | ||||
| Gain (Loss)* | ||||
| Futures contracts: | ||||
| Currency | $ | (348,068 | ) | |
| Index | 234,276 | |||
| Interest | 28,147 | |||
| Total futures | (85,645 | ) | ||
| Trading costs | (174,832 | ) | ||
| Total net trading gain (loss) | (260,477 | ) | ||
| * | Includes realized loss of ($260,477) and is located in net realized gain (loss) on investments the statement of operations. Amounts exclude foreign currency transactions and translation. |
| Note 5. | Balance Sheet Offsetting |
The Master Fund is required to disclose the impact of offsetting assets and liabilities presented in the statement of financial condition to enable users of the financial statements to evaluate the effect or potential effect of netting arrangements on its financial position for recognized assets and liabilities.
F-266
| Galaxy Plus Fund – Quantmetrics Master Fund (527) LLC |
| (A Delaware Limited Liability Company) |
| Notes to the Financial Statements |
These recognized assets and liabilities include financial instruments and derivative instruments that are either subject to an enforceable master netting arrangement or similar agreement or meet the following right of set-off criteria: each of the two parties owes the other determinable amounts, the Master Fund has the right to set-off the amounts owed with the amounts owed by the other party, the Master Fund intends to set off, and the Fund’s right of set-off is enforceable at law.
The Master Fund is subject to enforceable master netting agreements with certain counterparties. These agreements govern the terms of certain transactions, and reduce the counterparty risk associated with relevant transactions by specifying offsetting mechanisms and collateral posting arrangements at prearranged exposure levels. Since different types of transactions have different mechanics and are sometimes traded out of different legal entities of a particular counterparty organization, each type of transaction may be covered by a different master netting arrangement, possibly resulting in the need for multiple agreements with a single counterparty. Master netting agreements may not be specific to each different asset type; in such instances, they would allow the Master Fund to close out and net its total exposure to a specified counterparty in the events of default or early termination with respect to any and all the transactions governed under a single agreement with the counterparty. There were no offsetting balances as the Master Fund did not hold any investments as of December 31, 2016.
| Note 6. | Related Party |
Gemini Hedge Fund Services, LLC an affiliate of the Sponsor, provides administration services for the Master Fund.
| Note 7. | Financial Highlights |
Financial highlights of the Master Fund for the period June 13, 2016 (commencement of operations) through December 31, 2016 are presented in the table below. The information has been derived from information presented in the financial statements.
| Total return (A) | (1.49 | )% | ||
| Ratio to average member’s equity (B): | ||||
| Net investment loss (C) | (0.03 | )% | ||
| Total expenses | 0.03 | % |
| (A) | Total return is based on the change in average member’s equity during the period of a theoretical investment made at the inception of the Master Fund. |
| (B) | The total expense and net investment loss ratios are computed based upon weighted-average member’s equity as a whole for the period ended December 31, 2016. |
| (C) | The net investment loss ratio excludes net realized and unrealized gains (losses) on investments. |
Financial highlights are calculated for each member class taken as a whole. An individual member’s return and ratios may vary based on the timing of capital transactions. The negative total return would have been larger, and the net investment loss and total expense ratios would have been higher if the management and incentive fees, as well as sponsor fee, had been charged to the Master Fund. The ratios, excluding nonrecurring expenses, have been annualized. Total return has not been annualized.
F-267
| Galaxy Plus Fund – Quantmetrics Master Fund (527) LLC |
| (A Delaware Limited Liability Company) |
| Notes to the Financial Statements |
| Note 8. | Subsequent Events |
In accordance with FASB ASC 855,Subsequent Events, the Sponsor has evaluated all subsequent events requiring recognition and disclosure in the Master Fund’s financial statements through March 24, 2017, the date the financial statements were available for issuance. The Sponsor has determined that there are no material events that would require recognition or disclosure in the Master Fund’s financial statements through this date.
F-268
| Galaxy Plus Fund – Quantmetrics Master Fund (527) LLC |
| (A Delaware Limited Liability Company) |
| Oath and Affirmation of the Commodity Pool Operator |
To the best of the knowledge and belief of the undersigned, the information contained in the annual report as of December 31, 2016 for the period from June 13, 2016 (commencement of operations) to December 31, 2016, is accurate and complete.
| | |
| David Young, President | |
| Gemini Alternative Funds, LLC — Sponsor |
F-269
| Galaxy Plus Fund – |
| Quest Master Fund (517) LLC |
| (A Delaware Limited Liability Company) |
| The attached annual report is filed under exemption pursuant to |
| Section 4.7 of the regulations under the Commodity Exchange Act. |
| Financial Report |
| December 31, 2016 |
F-270
Independent Auditor’s Report
Board of Directors
Galaxy Plus Fund LLC
Report on the Financial Statements
We have audited the accompanying financial statements of Galaxy Plus Fund – Quest Master Fund (517) LLC (the Fund), which comprise the statement of financial condition, including the condensed schedule of investments, as of December 31, 2016, and the related statements of operations, and changes in member’s equity for the period from June 29, 2016 (commencement of operations) to December 31, 2016, and the related notes to the financial statements.
Management's Responsibility for the Financial Statements
Management is responsible for the preparation and fair presentation of these financial statements in accordance with accounting principles generally accepted in the United States of America; this includes the design, implementation and maintenance of internal control relevant to the preparation and fair presentation of financial statements that are free from material misstatement, whether due to fraud or error.
Auditor’s Responsibility
Our responsibility is to express an opinion on these financial statements based on our audit. We conducted our audit in accordance with auditing standards generally accepted in the United States of America. Those standards require that we plan and perform the audit to obtain reasonable assurance about whether the financial statements are free from material misstatement.
An audit involves performing procedures to obtain audit evidence about the amounts and disclosures in the financial statements. The procedures selected depend on the auditor’s judgment, including the assessment of the risks of material misstatement of the financial statements, whether due to fraud or error. In making those risk assessments, the auditor considers internal control relevant to the entity’s preparation and fair presentation of the financial statements in order to design audit procedures that are appropriate in the circumstances, but not for the purpose of expressing an opinion on the effectiveness of the entity’s internal control. Accordingly, we express no such opinion. An audit also includes evaluating the appropriateness of accounting policies used and the reasonableness of significant accounting estimates made by management, as well as evaluating the overall presentation of the financial statements.
We believe that the audit evidence we have obtained is sufficient and appropriate to provide a basis for our audit opinion.
F-271
Opinion
In our opinion, the financial statements referred to above present fairly, in all material respects, the financial position of Galaxy Plus Fund – Quest Master Fund (517) LLC as of December 31, 2016, and the results of its operations for the period from June 29, 2016 (commencement of operations) to December 31, 2016, in accordance with accounting principles generally accepted in the United States of America.
/s/ RSM US LLP
Denver, Colorado
March 24, 2017
F-272
| Galaxy Plus Fund - Quest Master Fund (517) LLC |
| (A Delaware Limited Liability Company) |
| Statement of Financial Condition |
| December 31, 2016 |
| (Expressed in U.S. Dollars) |
| Assets | ||||
| Equity in commodity trading accounts at clearing brokers: | ||||
| Cash | $ | 1,184,681 | ||
| Restricted cash - margin balance | 2,477,718 | |||
| Investments in futures contracts at fair value (represents unrealized appreciation on open derivative contracts, net) | 209,675 | |||
| Other assets | 11,704 | |||
| Total assets | $ | 3,883,778 | ||
| Liabilities and Member’s Equity | ||||
| Total liabilities | $ | — | ||
| Member’s equity | 3,883,778 | |||
| Total liabilities member’s equity | $ | 3,883,778 | ||
See notes to financial statements.
F-273
| Galaxy Plus Fund - Quest Master Fund (517) LLC |
| (A Delaware Limited Liability Company) |
| Condensed Schedule of Investments |
| December 31, 2016 |
| (Expressed in U.S. Dollars) |
| Number of | Percent of | |||||||||||
| Contracts/Units | Fair Value | Member’s Equity | ||||||||||
| Long positions: | ||||||||||||
| Derivative contracts: | ||||||||||||
| Domestic (United States): | ||||||||||||
| Futures contracts: | ||||||||||||
| Agriculture | 18 | $ | 3,954 | 0.10 | % | |||||||
| Currency | 13 | (1,156 | ) | (0.03 | ) | |||||||
| Energy | 41 | 68,049 | 1.75 | |||||||||
| Index | 32 | (14,175 | ) | (0.36 | ) | |||||||
| Metals | 7 | (11,945 | ) | (0.31 | ) | |||||||
| Foreign: | ||||||||||||
| Futures contracts: | ||||||||||||
| Energy | 15 | 22,590 | 0.58 | |||||||||
| Index | 99 | 128,239 | 3.31 | |||||||||
| Interest | 49 | 23,765 | 0.61 | |||||||||
| Total long positions | 219,321 | 5.65 | ||||||||||
| Short positions: | ||||||||||||
| Derivative contracts: | ||||||||||||
| Domestic (United States): | ||||||||||||
| Futures contracts: | ||||||||||||
| Agriculture | 46 | 36,553 | 0.94 | |||||||||
| Currency | 125 | (41,748 | ) | (1.07 | ) | |||||||
| Interest | 75 | (3,328 | ) | (0.09 | ) | |||||||
| Metals | 10 | 20,665 | 0.53 | |||||||||
| Foreign: | ||||||||||||
| Futures contracts: | ||||||||||||
| Index | 6 | (9,396 | ) | (0.24 | ) | |||||||
| Interest | 316 | (12,392 | ) | (0.32 | ) | |||||||
| Total short positions | (9,646 | ) | (0.25 | ) | ||||||||
| Investments in futures contracts, at fair value | $ | 209,675 | 5.40 | % | ||||||||
See notes to financial statements.
F-274
| Galaxy Plus Fund - Quest Master Fund (517) LLC |
| (A Delaware Limited Liability Company) |
| Statement of Operations |
| For the period from June 29, 2016 (Commencement of Operations) to December 31, 2016 |
| (Expressed in U.S. Dollars) |
| Expenses: | ||||
| Interest expense | $ | 4,008 | ||
| Total expenses | 4,008 | |||
| Net investment loss | (4,008 | ) | ||
| Realized and unrealized gain (loss) on investments and foreign currency transactions: | ||||
| Net realized loss from: | ||||
| Derivative contracts | (1,750,466 | ) | ||
| Foreign currency transactions | (3,279 | ) | ||
| (1,753,745 | ) | |||
| Net increase (decrease) in unrealized appreciation on: | ||||
| Derivative contracts | 209,675 | |||
| Translation of assets and liabilities denominated in foreign currencies | (88 | ) | ||
| 209,587 | ||||
| Net realized and unrealized loss on investments and foreign currency transactions | (1,544,158 | ) | ||
| Net decrease in member’s equity resulting from operations | $ | (1,548,166 | ) | |
See notes to financial statements.
F-275
| Galaxy Plus Fund - Quest Master Fund (517) LLC |
| (A Delaware Limited Liability Company) |
| Statement of Changes in Member’s Equity |
| For the period from June 29, 2016 (Commencement of Operations) to December 31, 2016 |
| (Expressed in U.S. Dollars) |
| Changes in member’s equity from operations: | ||||
| Net investment loss | $ | (4,008 | ) | |
| Net realized gain (loss) from derivative contracts and foreign currency transactions | (1,753,745 | ) | ||
| Net increase (decrease) in unrealized appreciation on derivative contracts and translation of assets and liabilities denominated in foreign currencies | 209,587 | |||
| Net decrease in member’s equity resulting from operations | (1,548,166 | ) | ||
| Changes in member’s equity from capital transactions: | ||||
| Proceeds from issuance of capital | 5,500,600 | |||
| Payments for redemptions of capital | (68,656 | ) | ||
| Net increase in member’s equity resulting from capital transactions | 5,431,944 | |||
| Total increase | 3,883,778 | |||
| Member’s equity, beginning of period | — | |||
| Member’s equity, end of period | $ | 3,883,778 | ||
See notes to financial statements.
F-276
| Galaxy Plus Fund – Quest Master Fund (517) LLC |
| (A Delaware Limited Liability Company) |
| Notes to the Financial Statements |
| Note 1. | Organization and Structure |
Galaxy Plus Fund – Quest Master Fund (517) LLC (the “Master Fund”) was formed in Delaware as a limited liability company on January 12, 2016 and commenced operation on June 29, 2016. The Master Fund was created to serve as the trading entity managed by Quest Partner, L.L.C. (the “Trading Advisor”) pursuant to its Quest Tracker Index “QTI” (the “Program”). The Program is a systematic program that seeks to replicate the performance generated by the broad class of managed futures trading strategies of trend following.
The Master Fund and other separately formed Delaware limited liability companies (“Other Master Funds”), are investment vehicles available under the Galaxy Plus Managed Account Platform (the “Platform”). The Master Fund and the Platform are sponsored by Gemini Alternative Funds, LLC (the “Sponsor” or “GAF”) as a means of making available, to qualified high net-worth individuals and institutional investors (including fund of hedge funds) (“Investors”), a variety of third-party professional managed futures and foreign exchange advisors (“Advisors”). The Trading Advisor is not affiliated with the Sponsor.
GAF was formed in October 2013 and its principal office is located in Chicago, Illinois. GAF is registered with the U.S. Commodity Futures Trading Commission (CFTC) as a commodity pool operator and commodity trading advisor, and is a member of the National Futures Association (NFA).
Galaxy Plus Fund LLC, a Delaware Series Limited Liability Company (the “Onshore Platform”), and Galaxy Plus Fund SPC, a Cayman Islands Segregated Portfolio Company (the “Offshore Platform”) serve as the feeder funds for the Platform and invest substantially all of the assets of the respective segregated portfolios (each a “Fund”) in the Master Fund or other Master Funds. Galaxy Plus Fund – Quest Feeder Fund (517) (“LLC517”), a separated series of the Onshore Platform and Galaxy Plus Fund – Quest Offshore Feeder Fund (517) Segregated Portfolio (“SPC517”), a segregated portfolio of the Offshore Platform, can each invest in the Master Fund. As of December 31, 2016, SPC 517 had not yet commenced operations.
LLC517 and SPC517 are collectively hereafter referred to as the “Feeder Funds”.
Subscriptions and redemptions into the Feeder Funds are the corresponding transactions with the Master Fund and are governed by the Onshore Platform’s and the Offshore Platform’s respective Confidential Offering Memorandums.
The Platform has appointed the Sponsor, under the terms of the Limited Liability Company Agreement (the “LLC Agreement”) as the managing member of the Master Fund. In such capacity, the Sponsor has the authority, to manage, with wide discretionary powers, the business and affairs of the Master Fund including the authority to select the administrator for the Master Fund. The LLC Agreement will continue to remain in force until terminated by either the Sponsor or the Platform upon not less than sixty (60) days’ prior written notice. In certain circumstances (for example, the insolvency of either party or in the event all trading for the Platform by the Advisors are suspended), the LLC Agreement may be immediately terminated by either party.
F-277
| Galaxy Plus Fund – Quest Master Fund (517) LLC |
| (A Delaware Limited Liability Company) |
| Notes to the Financial Statements |
The Master Fund and the Sponsor have entered into a tri-party contract (the “Trading Agreement”) with the Trading Advisor pursuant to which the Master Fund’s trading accounts are managed, subject to rights of termination, by the Trading Advisor in accordance with the Program. The Trading Advisor may alter its Program (including its trading systems and methods and including the addition and/or deletion of any financial interests or contracts traded in the Master Fund’s trading accounts), provided that the Trading Advisor provide prior notice to the Master Fund and the Sponsor of any material change to the Trading Advisor’s Program. From time to time, the Trading Advisor (or its affiliates) may manage additional accounts, and these accounts will increase the level of competition for the same trades desired for the Master Fund, including the priorities of order entry. There is no specific limit as to the number of accounts the Trading Advisors (or their affiliates) may manage. In addition, the positions of all of the accounts owned or controlled by the Trading Advisor (or its affiliates) are aggregated for the purposes of applying speculative position limits. The management, incentive, and sponsor fees are paid directly by the Feeder Funds, and for this reason are not recorded as expenses of the Master Fund.
| Note 2. | Summary of Significant Accounting Policies |
The following is a summary of significant accounting policies consistently followed in the preparation of the Master Fund’s financial statements.
Principles of accounting:The accompanying financial statements are expressed in United States dollars (USD) and have been prepared in accordance with Generally Accepted Accounting Principles (GAAP), as established by the Financial Accounting Standards Board (FASB), to ensure consistent reporting of financial condition and results of operations. The Master Fund is an investment company and follows the accounting and reporting guidance in FASB Account Standards Codification Topic 946.
Cash and restricted cash: Cash held in the commodity trading accounts at clearing broker consists of either cash maintained in the custody of the broker, a portion of which is required margin for open positions, or amounts due to/from the broker for margin or unsettled trades. The Master Fund may also hold cash in a non-interest bearing USD commercial bank account. The Master Fund holds various currencies at the clearing broker, of which $3,668,972 is held in USD and a payable balance of ($6,573) in foreign currencies as of December 31, 2016, and are recorded in cash and restricted cash – margin balance on the statement of financial condition. The non-U.S. currencies fluctuate in value on a daily basis relative to the USD. A portion of this cash is restricted cash required to meet maintenance margin requirements. Cash with the clearing broker as of December 31, 2016 included restricted cash for margin requirements of $2,477,718. This cash becomes unrestricted when the underlying positions to which it is applicable are liquidated. Cash with the clearing broker as of December 31, 2016 included amounts due to the broker for unsettled trades of $0.
Offsetting of amounts related to certain contracts: When the requirements are met, the Master Fund offsets certain fair value amounts recognized for net derivative positions executed with the same counterparty under the same master netting arrangement (See Note 5).
F-278
| Galaxy Plus Fund – Quest Master Fund (517) LLC |
| (A Delaware Limited Liability Company) |
| Notes to the Financial Statements |
Valuation and Revenue Recognition: Depending on the Program and Investments traded, The Master Fund follows the following valuation and revenue recognition policies. All investments are recorded at their estimated fair value, as described in Note 3.
Futures and options on futures contracts: The Master Fund may enter into futures and options on futures contracts. Upon entering into a futures contract, The Master Fund agrees to receive or deliver a fixed quantity of an underlying instrument or commodity for an agreed-upon price, while an option contract provides the option purchaser with the right, but not the obligation, to buy or sell a security or financial instrument at a predetermined exercise price during a defined period. Futures and options on futures contracts are recorded on the trade date. The difference between the original contract amount and the fair value of futures contracts purchased or sold is reflected as unrealized appreciation/(depreciation) on open contracts. Options on futures contracts are reflected in investments at fair value. The difference between the premiums paid or received on open options on futures contracts and fair value of such options is recorded as unrealized appreciation/(depreciation) on open contracts. The fair value of futures and options on futures contracts is based upon daily exchange settlement prices. The realized gain or loss is determined on the settlement of intraday trades first and then by the FIFO method.
Foreign currency transactions: The Master Fund’s financial statements are denominated in USD. However, foreign currency forward contracts, non-U.S. futures contracts, and non-U.S. options on futures contracts are denominated in currencies other than USD. Assets and liabilities and transactions denominated in currencies other than the USD are translated into USD at the rates in effect either at the close of business on the last business day of the reporting period or on the date of such transactions, respectively. Such fluctuations are included with the unrealized appreciation (depreciation) on open derivative contracts, net. Net unrealized foreign exchange gain and loss arises from changes in the fair value of assets and liabilities resulting from changes in exchange rates.
Trading costs: Trading costs generally consist of brokerage commissions, brokerage fees, clearing fees, exchange and regulatory fees, transaction and NFA fees. Fees vary by type of contract for each purchase and sale or sale and purchase (round turn) of futures, options on futures, and forward contracts. Commissions are paid on each individual purchase and sale transaction. These costs are recognized as expenses for futures and options on futures transactions and are included in net realized gain/loss from derivative contracts on the Statement of Operations.
Interest income/expense: Interest income and expense is recognized on an accrual basis.
Allocation of income and gains and losses: Profits and losses for each monthly accounting period, or shorter period if there are mid-month subscriptions and/or redemptions, are allocated pro-rata to the Feeder Funds based on their respective ownership percentage on the first day of each period throughout the year.
Income taxes: The Master Fund will not be subject to United States federal income taxation other than certain withholding taxes. The Master Fund evaluates tax positions taken or expected to be taken to determine whether the tax positions are more-likely-than-not of being sustained by the applicable tax authority. For tax positions meeting the more-likely-than-not threshold, the tax amount recognized in the financial statements is reduced by the largest benefit that has a greater than fifty percent likelihood of being realized upon ultimate settlement with the relevant taxing authority. The Master Fund has determined that there is no tax liability resulting from uncertain income tax positions taken or expected to be taken with respect to all open tax years. The Master Fund’s U.S. Federal tax returns for the period ended December 31, 2016, remain open. The Master Fund recognizes interest and penalties, if any, related to unrecognized tax benefits as income tax expense in the statement of operations. During the period, the Master Fund did not accrue any interest or penalties.
F-279
| Galaxy Plus Fund – Quest Master Fund (517) LLC |
| (A Delaware Limited Liability Company) |
| Notes to the Financial Statements |
Use of estimates:The preparation of financial statements in accordance with GAAP requires management to make estimates and assumptions that affect the reported amounts of assets and liabilities and disclosure of contingent assets and liabilities at the date of the financial statements and the reported amounts of income and expenses during the reporting period. Actual results could differ from those estimates.
Indemnifications:The Sponsor and its affiliates are indemnified against certain liabilities arising out of the performance of their duties for The Master Fund. In addition, in the normal course of business, the Master Fund enters into contracts with vendors and others that provide for general indemnifications. The Master Fund’s maximum exposure under these arrangements is unknown as this would involve future claims that may be made against the Master Fund. However, the Master Fund expects the risk of loss to be remote.
Statement of cash flows: The Master Fund has elected not to provide a statement of cash flows as permitted by GAAP as all of the following conditions have been met:
| ● | During the period, substantially all of the Master Fund’s investments were carried at fair value and classified as Level 1 or Level 2 measurements in accordance with FASB ASC 820; |
| ● | The Master Fund had little or no debt during the period; |
| ● | The Master Fund’s financial statements include a statement of changes in member’s equity. |
Subscriptions and redemptions: Subscriptions and redemptions can typically be made on a weekly basis as of the first day (Monday) of each week; (or, if such day is not a business day, the first business day thereafter) (each, a Subscription Date or a Redemption Date). The Master Fund may accept subscriptions or redemptions more frequently than the first day of each week, depending upon the size of the requested subscription or redemption amount, with the approval of the Sponsor.
| Note 3. | Fair Value Measurements |
The Master Fund’s investments are stated at fair value in accordance with FASB ASC 820, Fair Value Measurements and Disclosures (ASC 820). ASC 820 defines fair value, establishes a framework for measuring fair value and expands disclosures about fair value measurements. ASC 820 also emphasizes that fair value is a market-based measurement, not an entity-specific measurement, and sets out a fair value hierarchy with the highest priority being quoted prices in active market. Under ASC 820, fair value measurements are disclosed by level within that hierarchy, as follows:
Level 1 — Values for investments classified as Level 1 are based on unadjusted quoted prices for identical investments in an active market. Since valuations are based on quoted prices that are readily accessible at the measurement date, valuation of these investments does not entail a significant degree of judgment.
Level 2 — Values for investments classified as Level 2 are based on quoted prices for similar investments in an active or non-active markets for which all significant inputs are observable either directly or indirectly. Level 2 inputs may also include discounts related to restrictions on the investments.
Level 3 — Values for investments categorized as Level 3 are based on prices or valuation techniques that require inputs that are both significant to the fair value and unobservable, including valuations by the Sponsor in the absence of readily ascertainable fair values.
A description of the valuation methodologies applied to the Master Fund’s major categories of assets and liabilities measured at fair value on a recurring basis follows. Inputs that are used in determining fair value
F-280
| Galaxy Plus Fund – Quest Master Fund (517) LLC |
| (A Delaware Limited Liability Company) |
| Notes to the Financial Statements |
of an investment may include price information, credit data, volatility statistics, and other factors. These inputs can be either observable or unobservable. All of the inputs for the Master Fund were observable as of December 31, 2016. The availability of observable inputs can vary between investments and is affected by various factors such as type of investment and the volume and level of activity for that investment or similar investments in the marketplace.
Exchange-traded derivative contracts that are actively traded are valued based on daily quoted settlement prices from the respective exchange and are categorized in Level 1 of the fair value hierarchy. Exchange-traded derivative contracts not actively traded and over-the-counter (OTC) derivative contracts can include futures contracts, option on futures contracts, forward contracts and option contracts whose values are based on an underlying such as interest rates, foreign currencies, credit standing of reference entities, equities or commodities. Such derivative contracts are valued using observable market data, including currency spot rates or quoted prices of the related underlying obtained from the applicable exchange or market. OTC derivative contracts are valued using the above described pricing methodology and are categorized as Level 2 within the fair value hierarchy.
The Master Fund assesses the levels of the investments at each measurement date, and transfers between levels are recognized on the actual date of the event or change in circumstances that caused the transfer in accordance with the Master Fund’s accounting policy regarding the recognition of transfers between levels of the fair value hierarchy. There were no transfers among levels 1, 2, and 3 during the period ended December 31, 2016.
The inputs or methodologies used for valuing investments are not necessarily indicative of the risk associated with investing in those instruments.
F-281
| Galaxy Plus Fund – Quest Master Fund (517) LLC |
| (A Delaware Limited Liability Company) |
| Notes to the Financial Statements |
The following tables present the classification of derivatives, by type, into the fair value hierarchy levels as of December 31, 2016. Presentation is gross – as an asset if in a gain position and a liability if in a loss position.
| Fair Value Measurements at Reporting Date Using | ||||||||||||||||
| Quoted Prices | Significant Other | Significant | ||||||||||||||
| in Active | Observable | Unobservable | ||||||||||||||
| Markets | Inputs | Inputs | ||||||||||||||
| Description | Fair Value | (Level 1) | (Level 2) | (Level 3) | ||||||||||||
| Assets: | ||||||||||||||||
| Derivative contracts: | ||||||||||||||||
| Futures contracts: | ||||||||||||||||
| Agriculture | $ | 50,117 | $ | 50,117 | $ | — | $ | — | ||||||||
| Currency | 25,228 | 25,228 | — | — | ||||||||||||
| Energy | 90,639 | 90,639 | — | — | ||||||||||||
| Index | 130,467 | 130,467 | — | — | ||||||||||||
| Interest | 70,986 | 70,986 | — | — | ||||||||||||
| Metals | 20,700 | 20,700 | — | — | ||||||||||||
| Total investment assets at fair value | 388,137 | 388,137 | — | — | ||||||||||||
| Liabilities: | ||||||||||||||||
| Derivative contracts: | ||||||||||||||||
| Futures contracts: | ||||||||||||||||
| Agriculture | (9,610 | ) | (9,610 | ) | — | — | ||||||||||
| Currency | (68,132 | ) | (68,132 | ) | — | — | ||||||||||
| Index | (25,799 | ) | (25,799 | ) | — | — | ||||||||||
| Interest | (62,941 | ) | (62,941 | ) | — | — | ||||||||||
| Metals | (11,980 | ) | (11,980 | ) | — | — | ||||||||||
| Total investment liabilities at fair value | (178,462 | ) | (178,462 | ) | — | — | ||||||||||
| Total net investment at fair value | $ | 209,675 | $ | 209,675 | $ | — | $ | — | ||||||||
F-282
| Galaxy Plus Fund – Quest Master Fund (517) LLC |
| (A Delaware Limited Liability Company) |
| Notes to the Financial Statements |
| Note 4. | Derivative Financial Instruments |
Derivative financial instruments speculatively traded by the Master Fund can include U.S. and foreign futures, options on futures contracts, and forward currency contracts (collectively, derivatives) whose values are based upon an underlying asset, indices, or reference rates, and generally represent future commitments to exchange cash flows, or to purchase or sell other financial instruments at specified future dates. A derivative contract may be traded on an exchange or OTC. Exchange-traded derivatives are standardized and include futures and option on futures contracts. OTC derivative contracts are negotiated between contracting parties and include forward currency contracts and certain options. Derivatives are subject to various risks similar to those related to the underlying financial instruments including market and credit risks.
Market risk is the potential for changes in the value of derivatives due to market changes, including interest and foreign exchange rate movements and fluctuations in commodity and security prices. Market risk is directly impacted by the volatility and liquidity in the markets in which the related underlying assets are traded. The market risk of the Master Fund is managed by the underlying Trading Advisors according to each respective Program. The Master Fund is exposed to a market risk equal to the notional contract value of the derivatives contracts purchased and unlimited liability on such contracts sold short.
Credit risk is the possibility that a loss may occur due to the failure of a counterparty to perform according to the terms of a contract. Credit risk due to exchange traded derivative financial instruments is significantly reduced by the regulatory requirements of the individual exchanges on which the instruments are traded. At any point in time, the credit risk for OTC derivatives is limited to the net unrealized gain for each counterparty for which a netting agreement exists, if any. In a similar fashion, liabilities represent net amounts owed to counterparties. The credit risk exposure for the Master Fund’s outstanding OTC derivatives was $0 at December 31, 2016.
Purchase and sale of futures contracts requires margin deposits with the broker. Additional deposits may be necessary for any loss on contract value. The U.S. Commodity Exchange Act requires a broker to segregate all customer transactions and assets from such broker’s proprietary activities. A customer’s cash and other property (for example, U.S. Treasury bills) deposited with a broker are considered commingled with all other customer funds subject to the broker’s segregation requirements. In the event of a broker’s insolvency, recovery may be limited to a pro rata share of segregated funds available. It is possible that the recovered amount could be less than total cash and other property deposited.
The Master Fund has a substantial portion of its assets on deposit with counterparties. In the event of a counterparty’s insolvency, recovery of The Master Fund’s assets on deposit may be limited to account insurance or other protection afforded such deposits.
The notional value represents amounts related to the Master Fund’s stock exchange indices, commodities, interest rate and foreign currencies upon which the fair value of the futures contracts held by the Master Fund are based. Notional values do not represent the current fair value of, and are not necessarily indicative of the future cash flows of the Master Fund’s futures and forward contracts. Further, the underlying price changes in relation to variables specified by the notional values affects the fair value of these derivative financial instruments. Theoretically, the Master Fund’s exposure is equal to the notional value of contracts purchased and unlimited on such contracts sold short. As of December 31, 2016, the Master Fund had open futures contracts with the following notional values by sector:
F-283
| Galaxy Plus Fund – Quest Master Fund (517) LLC |
| (A Delaware Limited Liability Company) |
| Notes to the Financial Statements |
| Description | Quantity | Notional Value | Description | Quantity | Notional Value | |||||||||
| Long: | Short: | |||||||||||||
| Agriculture | 18 | $ | 732,117 | Agriculture | 46 | $ | (1,067,729 | ) | ||||||
| Currency | 13 | 1,714,199 | Currency | 125 | (10,354,445 | ) | ||||||||
| Energy | 56 | 2,904,642 | Index | 6 | (444,351 | ) | ||||||||
| Index | 131 | 9,848,493 | Interest | 391 | (101,275,507 | ) | ||||||||
| Interest | 49 | 7,485,508 | Metals | 10 | (940,915 | ) | ||||||||
| Metals | 7 | 444,150 | ||||||||||||
During the period ended December 31, 2016, the Master Fund participated in 3,293 futures contract transactions.
Below is a summary of net trading gains and (losses) by investment type and industry:
| Net Trading | ||||
| Gain (Loss)* | ||||
| Futures contracts: | ||||
| Agriculture | $ | (70,719 | ) | |
| Currency | (564,186 | ) | ||
| Energy | (656,150 | ) | ||
| Index | 366,302 | |||
| Interest | (671,396 | ) | ||
| Metals | 97,913 | |||
| Total futures contracts | (1,498,236 | ) | ||
| Trading costs | (42,555 | ) | ||
| Total net trading gain (loss) | $ | (1,540,791 | ) | |
| * | Includes both realized loss of ($1,750,466) and unrealized gain of $209,675 and is located in net realized and unrealized gain (loss) on investments on the statement of operations. Amounts exclude foreign currency transactions and translation. |
F-284
| Galaxy Plus Fund – Quest Master Fund (517) LLC |
| (A Delaware Limited Liability Company) |
| Notes to the Financial Statements |
| Note 5. | Balance Sheet Offsetting |
The Master Fund is required to disclose the impact of offsetting assets and liabilities presented in the statement of financial condition to enable users of the financial statements to evaluate the effect or potential effect of netting arrangements on its financial position for recognized assets and liabilities. These recognized assets and liabilities include financial instruments and derivative instruments that are either subject to an enforceable master netting arrangement or similar agreement or meet the following right of set-off criteria: each of the two parties owes the other determinable amounts, the Master Fund has the right to set-off the amounts owed with the amounts owed by the other party, the Master Fund intends to set off, and the Fund’s right of set-off is enforceable at law.
The Master Fund is subject to enforceable master netting agreements with certain counterparties. These agreements govern the terms of certain transactions, and reduce the counterparty risk associated with relevant transactions by specifying offsetting mechanisms and collateral posting arrangements at prearranged exposure levels. Since different types of transactions have different mechanics and are sometimes traded out of different legal entities of a particular counterparty organization, each type of transaction may be covered by a different master netting arrangement, possibly resulting in the need for multiple agreements with a single counterparty. Master netting agreements may not be specific to each different asset type; in such instances, they would allow the Master Fund to close out and net its total exposure to a specified counterparty in the events of default or early termination with respect to any and all the transactions governed under a single agreement with the counterparty.
The following tables summarize the Master Fund’s netting arrangements:
| Net Amount of | ||||||||||||
| Gross Amounts | Offset in the | Assets (Liabilities) | ||||||||||
| of Recognized | Statement of | in the Statement of | ||||||||||
| Description | Assets (Liabilities) | Financial Condition | Financial Condition | |||||||||
| Futures | $ | (178,462 | ) | $ | 388,137 | $ | 209,675 | |||||
| Total | $ | (178,462 | ) | $ | 388,137 | $ | 209,675 | |||||
| Net Amount | ||||||||||||
| Net amount in | Cash Collateral | which is not offset | ||||||||||
| the Statement of | Received by | in the Statement of | ||||||||||
| Financial Condition | Counterparty | Financial Condition | ||||||||||
| Counterparty A | $ | 209,675 | $ | 2,477,718 | $ | 2,687,393 | ||||||
| Total | $ | 209,675 | $ | 2,477,718 | $ | 2,687,393 | ||||||
F-285
| Galaxy Plus Fund – Quest Master Fund (517) LLC |
| (A Delaware Limited Liability Company) |
| Notes to the Financial Statements |
| Note 6. | Related Parties |
Gemini Hedge Fund Services, LLC an affiliate of the Sponsor, provides administration services for the Master Fund.
| Note 7. | Financial Highlights |
Financial highlights of the Master Fund for the period June 29, 2016 (commencement of operations) through December 31, 2016 are presented in the table below. The information has been derived from information presented in the financial statements.
| Total return (A) | (28.26 | )% | ||
| Ratio to average member’s equity (B): | ||||
| Net investment loss (C) | (0.18 | )% | ||
| Total expenses | 0.18 | % | ||
| (A) | Total return is based on the change in average member’s equity during the period of a theoretical investment made at the inception of the Master Fund. |
| (B) | The total expense and net investment loss ratios are computed based upon weighted-average member’s equity as a whole for the period ended December 31, 2016. |
| (C) | The net investment loss ratio excludes net realized and unrealized gains (losses) on investments. |
Financial highlights are calculated for each member class taken as a whole. An individual member’s return and ratios may vary based on the timing of capital transactions. The negative total return would have been larger, and the net investment loss and total expense ratios would have been higher if the management and incentive fees, as well as sponsor fees, had been charged to the Master Fund. The ratios, excluding nonrecurring expenses, have been annualized. Total return has not been annualized.
| Note 8. | Subsequent Events |
In accordance with FASB ASC 855,Subsequent Events, the Sponsor has evaluated all subsequent events requiring recognition and disclosure in the Master Fund’s financial statements through March 24, 2017, the date the financial statements were available for issuance. The Sponsor has determined that there are no material events that would require recognition or disclosure in the Master Fund’s financial statements through this date.
F-286
| Galaxy Plus Fund – Quest Master Fund (517) LLC |
| (A Delaware Limited Liability Company) |
| Oath and Affirmation of the Commodity Pool Operator |
To the best of the knowledge and belief of the undersigned, the information contained in the annual report as of December 31, 2016 for the period from June 29, 2016 (commencement of operations) to December 31, 2016, is accurate and complete.
| |
| David Young, President | |
| Gemini Alternative Funds, LLC — Sponsor |
F-287
| Galaxy Plus Fund – Quest FIT |
| Master Fund (535) LLC |
| (A Delaware Limited Liability Company) |
| The attached annual report is filed under exemption pursuant to |
| Section 4.7 of the regulations under the Commodity Exchange Act. |
| Financial Report |
| December 31, 2016 |
F-288
Independent Auditor’s Report
Board of Directors
Galaxy Plus Fund LLC
Report on the Financial Statements
We have audited the accompanying financial statements of Galaxy Plus Fund – Quest FIT Master Fund (535) LLC (the Fund), which comprise the statement of financial condition, including the condensed schedule of investments, as of December 31, 2016, and the related statements of operations, and changes in member’s equity for the period from September 19, 2016 (commencement of operations) to December 31, 2016, and the related notes to the financial statements.
Management's Responsibility for the Financial Statements
Management is responsible for the preparation and fair presentation of these financial statements in accordance with accounting principles generally accepted in the United States of America; this includes the design, implementation and maintenance of internal control relevant to the preparation and fair presentation of financial statements that are free from material misstatement, whether due to fraud or error.
Auditor’s Responsibility
Our responsibility is to express an opinion on these financial statements based on our audit. We conducted our audit in accordance with auditing standards generally accepted in the United States of America. Those standards require that we plan and perform the audit to obtain reasonable assurance about whether the financial statements are free from material misstatement.
An audit involves performing procedures to obtain audit evidence about the amounts and disclosures in the financial statements. The procedures selected depend on the auditor’s judgment, including the assessment of the risks of material misstatement of the financial statements, whether due to fraud or error. In making those risk assessments, the auditor considers internal control relevant to the entity’s preparation and fair presentation of the financial statements in order to design audit procedures that are appropriate in the circumstances, but not for the purpose of expressing an opinion on the effectiveness of the entity’s internal control. Accordingly, we express no such opinion. An audit also includes evaluating the appropriateness of accounting policies used and the reasonableness of significant accounting estimates made by management, as well as evaluating the overall presentation of the financial statements.
We believe that the audit evidence we have obtained is sufficient and appropriate to provide a basis for our audit opinion.
F-289
Opinion
In our opinion, the financial statements referred to above present fairly, in all material respects, the financial position of Galaxy Plus Fund – Quest FIT Master Fund (535) LLC as of December 31, 2016, and the results of its operations for the period from September 19, 2016 (commencement of operations) to December 31, 2016, in accordance with accounting principles generally accepted in the United States of America.
/s/ RSM US LLP
Denver, Colorado
March 24, 2017
F-290
| Galaxy Plus Fund - Quest FIT Master Fund (535) LLC |
| (A Delaware Limited Liability Company) |
| Statement of Financial Condition |
| December 31, 2016 |
| (Expressed in U.S. Dollars) |
| Assets | ||||
| Equity in commodity trading accounts at clearing brokers: | ||||
| Cash | $ | 6,429,802 | ||
| Restricted cash - margin balance | 4,623,294 | |||
| Investments in futures contracts at fair value (represents unrealized appreciation on open derivative contracts, net) | 134,483 | |||
| Other assets | 13,407 | |||
| Total assets | $ | 11,200,986 | ||
| Liabilities and Member’s Capital | ||||
| Liabilities | ||||
| Other liability | $ | 2,026 | ||
| Total liabilities | 2,026 | |||
| Member’s equity | 11,198,960 | |||
| Total liabilities and member’s equity | $ | 11,200,986 | ||
See notes to financial statements.
F-291
| Galaxy Plus Fund - Quest FIT Master Fund (535) LLC |
| (A Delaware Limited Liability Company) |
| Condensed Schedule of Investments |
| December 31, 2016 |
| (Expressed in U.S. Dollars) |
| Number of | Percent of | |||||||||||
| Contracts/Units | Fair Value | Member’s Equity | ||||||||||
| Long positions: | ||||||||||||
| Derivative contracts: | ||||||||||||
| Domestic (United States): | ||||||||||||
| Futures contracts: | ||||||||||||
| Agriculture | 36 | $ | 1,830 | 0.02 | % | |||||||
| Currency | 14 | (6,955 | ) | (0.06 | ) | |||||||
| Energy | 34 | 65,767 | 0.59 | |||||||||
| Index | 31 | (12,833 | ) | (0.11 | ) | |||||||
| Metals | 11 | (15,395 | ) | (0.14 | ) | |||||||
| Foreign: | ||||||||||||
| Futures contracts: | ||||||||||||
| Energy | 20 | 30,100 | 0.27 | |||||||||
| Index | 170 | 176,847 | 1.58 | |||||||||
| Total long positions | 239,361 | 2.15 | ||||||||||
| Short positions: | ||||||||||||
| Derivative contracts: | ||||||||||||
| Domestic (United States): | ||||||||||||
| Futures contracts: | ||||||||||||
| Agriculture | 21 | 1,352 | 0.01 | |||||||||
| Currency | 170 | (69,524 | ) | (0.62 | ) | |||||||
| Interest | 173 | 10,383 | 0.09 | |||||||||
| Metals | 14 | 38,410 | 0.34 | |||||||||
| Foreign: | ||||||||||||
| Futures contracts: | ||||||||||||
| Interest | 549 | (85,499 | ) | (0.76 | ) | |||||||
| Total short positions | (104,878 | ) | (0.94 | ) | ||||||||
| Investments in futures contracts, at fair value | $ | 134,483 | 1.21 | % | ||||||||
See notes to financial statements.
F-292
| Galaxy Plus Fund - Quest FIT Master Fund (535) LLC |
| (A Delaware Limited Liability Company) |
| Statement of Operations |
| For the period from September 19, 2016 (Commencement of Operations) to December 31, 2016 |
| (Expressed in U.S. Dollars) |
| Investment Income: | ||||
| Interest income | $ | — | ||
| Expenses: | ||||
| Interest expense | 2,085 | |||
| Total expenses | 2,085 | |||
| Net investment loss | (2,085 | ) | ||
| Realized and unrealized gain (loss) on investments and foreign currency transactions: | ||||
| Net realized gain (loss) from: | ||||
| Derivative contracts1 | 2,320,422 | |||
| Foreign currency transactions | (16,819 | ) | ||
| 2,303,603 | ||||
| Net increase (decrease) in unrealized appreciation on: | ||||
| Derivative contracts | 134,483 | |||
| Translation of assets and liabilities denominated in foreign currencies | (342 | ) | ||
| 134,141 | ||||
| Net realized and unrealized gain on investments and foreign currency transactions | 2,437,744 | |||
| Net increase in member’s equity resulting from operations | $ | 2,435,659 | ||
| 1 | Includes broker trading commissions |
See notes to financial statements.
F-293
| Galaxy Plus Fund - Quest FIT Master Fund (535) LLC |
| (A Delaware Limited Liability Company) |
| Statement of Changes in Member’s Equity |
| For the period from September 19, 2016 (Commencement of Operations) to December 31, 2016 |
| (Expressed in U.S. Dollars) |
| Changes in member’s equity from operations: | ||||
| Net investment loss | $ | (2,085 | ) | |
| Net realized gain (loss) from derivative contracts and foreign currency transactions | 2,303,603 | |||
| Net increase (decrease) in unrealized appreciation on derivative contracts and translation of assets and liabilities denominated in foreign currencies | 134,141 | |||
| Net increase in member’s equity resulting from operations | 2,435,659 | |||
| Changes in member’s equity from capital transactions: | ||||
| Proceeds from issuance of capital | 8,800,000 | |||
| Payments for redemptions of capital | (36,699 | ) | ||
| Net increase in member’s equity resulting from capital transactions | 8,763,301 | |||
| Total increase | 11,198,960 | |||
| Member’s equity, beginning of period | — | |||
| Member’s equity, end of period | $ | 11,198,960 | ||
See notes to financial statements.
F-294
| Galaxy Plus Fund – Quest FIT Master Fund (535) LLC |
| (A Delaware Limited Liability Company) |
| Notes to the Financial Statements |
| Note 1. | Organization and Structure |
Galaxy Plus Fund – Quest FIT Master Fund (535) LLC (the “Master Fund”) was formed in Delaware as a limited liability company on June 23, 2016 and commenced operations on September 19, 2016. The Master Fund was created to serve as the trading entity managed by Quest Partners L.L.C. (the “Trading Advisor”) pursuant to its Quest Fixed Income Hedge Program (the “Program”). The Program is a quantitative trading program designed to capture short-term, medium-term, and long-term trends in various markets.
The Master Fund and other separately formed Delaware limited liability companies (“Other Master Funds”), are investment vehicles available under the Galaxy Plus Managed Account Platform (the “Platform”). The Master Fund and the Platform are sponsored by Gemini Alternative Funds, LLC (the “Sponsor” or “GAF”) as a means of making available, to qualified high net-worth individuals and institutional investors (including fund of hedge funds) (“Investors”), a variety of third-party professional managed futures and foreign exchange advisors (“Advisors”). The Trading Advisor is not affiliated with the Sponsor.
GAF was formed in October 2013 and its principal office is located in Chicago, Illinois. GAF is registered with the U.S. Commodity Futures Trading Commission (CFTC) as a commodity pool operator and commodity trading advisor, and is a member of the National Futures Association (NFA).
Galaxy Plus Fund LLC, a Delaware Series Limited Liability Company (the “Onshore Platform”), and Galaxy Plus Fund SPC, a Cayman Islands Segregated Portfolio Company (the “Offshore Platform”) serve as the feeder funds for the Platform and invest substantially all of the assets of the respective segregated portfolios (each a “Fund”) in the Master Fund or other Master Funds. Galaxy Plus Fund – Quest FIT Feeder Fund (535) (“LLC535”), a separated series of the Onshore Platform and Galaxy Plus Fund – Quest FIT Offshore Feeder Fund (535) Segregated Portfolio (“SPC535”), a segregated portfolio of the Offshore Platform, each can invest in the Master Fund. As of December 31, 2016, SPC 535 had not yet commenced operations.
LLC535 and SPC535 are collectively hereafter referred to as the “Feeder Funds”.
Subscriptions and redemptions into the Feeder Funds are the corresponding transactions with the Master Fund and are governed by the Onshore Platform’s and the Offshore Platform’s respective Confidential Offering Memorandums.
The Platform has appointed the Sponsor, under the terms of the Limited Liability Company Agreement (the “LLC Agreement”) as the managing member of the Master Fund. In such capacity, the Sponsor has the authority, to manage, with wide discretionary powers, the business and affairs of the Master Fund including the authority to select the administrator for the Master Fund. The LLC Agreement will continue to remain in force until terminated by either the Sponsor or the Platform upon not less than sixty (60) days’ prior written notice. In certain circumstances (for example, the insolvency of either party or in the event all trading for the Platform by the Advisors are suspended), the LLC Agreement may be immediately terminated by either party.
F-295
| Galaxy Plus Fund – Quest FIT Master Fund (535) LLC |
| (A Delaware Limited Liability Company) |
| Notes to the Financial Statements |
The Master Fund and the Sponsor have entered into a tri-party contract (the “Trading Agreement”) with the Trading Advisor pursuant to which the Master Fund’s trading accounts are managed, subject to rights of termination, by the Trading Advisor in accordance with the Program. The Trading Advisor may alter its Program (including its trading systems and methods and including the addition and/or deletion of any financial interests or contracts traded in the Master Fund’s trading accounts), provided that the Trading Advisor provide prior notice to the Master Fund and the Sponsor of any material change to the Trading Advisor’s Program. From time to time, the Trading Advisor (or its affiliates) may manage additional accounts, and these accounts will increase the level of competition for the same trades desired for the Master Fund, including the priorities of order entry. There is no specific limit as to the number of accounts the Trading Advisors (or their affiliates) may manage. In addition, the positions of all of the accounts owned or controlled by the Trading Advisor (or its affiliates) are aggregated for the purposes of applying speculative position limits. The management, incentive, and sponsor fees are paid directly by the Feeder Funds, and for this reason are not recorded as expenses of the Master Fund.
| Note 2. | Summary of Significant Accounting Policies |
The following is a summary of significant accounting policies consistently followed in the preparation of the Master Fund’s financial statements.
Principles of accounting:The accompanying financial statements are expressed in United States dollars (USD) and have been prepared in accordance with Generally Accepted Accounting Principles (GAAP), as established by the Financial Accounting Standards Board (FASB), to ensure consistent reporting of financial condition and results of operations. The Master Fund is an investment company and follows the accounting and reporting guidance in FASB Account Standards Codification Topic 946.
Cash and restricted cash: Cash held in the commodity trading accounts at clearing broker consists of either cash maintained in the custody of the broker, a portion of which is required margin for open positions, or amounts due to/from the broker for margin or unsettled trades. The Master Fund may also hold cash in a non-interest bearing USD commercial bank account. The Master Fund holds various currencies at the clearing broker, of which $11,069,528 is held in USD and a payable of ($16,432) in foreign currencies as of December 31, 2016, and are recorded in cash and restricted cash – margin balance on the statement of financial condition. The non-U.S. currencies fluctuate in value on a daily basis relative to the USD. A portion of this cash is restricted cash required to meet maintenance margin requirements. Cash with the clearing broker as of December 31, 2016 included restricted cash for margin requirements of $4,623,294. This cash becomes unrestricted when the underlying positions to which it is applicable are liquidated. Cash with the clearing broker as of December 31, 2016 included amounts due to the broker for unsettled trades of $0.
Offsetting of amounts related to certain contracts: When the requirements are met, the Master Fund offsets certain fair value amounts recognized for net derivative positions executed with the same counterparty under the same master netting arrangement (See Note 5).
F-296
| Galaxy Plus Fund – Quest FIT Master Fund (535) LLC |
| (A Delaware Limited Liability Company) |
| Notes to the Financial Statements |
Valuation and Revenue Recognition:Depending on the Program and Investments traded, The Master Fund follows the following valuation and revenue recognition policies. All investments are recorded at their estimated fair value, as described in Note 3.
Futures and options on futures contracts: The Master Fund may enter into futures and options on futures contracts. Upon entering into a futures contract, The Master Fund agrees to receive or deliver a fixed quantity of an underlying instrument or commodity for an agreed-upon price, while an option contract provides the option purchaser with the right, but not the obligation, to buy or sell a security or financial instrument at a predetermined exercise price during a defined period. Futures and options on futures contracts are recorded on the trade date. The difference between the original contract amount and the fair value of futures contracts purchased or sold is reflected as unrealized appreciation/(depreciation) on open contracts. Options on futures contracts are reflected in investments at fair value. The difference between the premiums paid or received on open options on futures contracts and fair value of such options is recorded as unrealized appreciation/(depreciation) on open contracts. The fair value of futures and options on futures contracts is based upon daily exchange settlement prices. The realized gain or loss is determined on the settlement of intraday trades first and then by the FIFO method.
Foreign currency transactions: The Master Fund’s financial statements are denominated in USD. However, foreign currency forward contracts, non-U.S. futures contracts, and non-U.S. options on futures contracts are denominated in currencies other than USD. Assets and liabilities and transactions denominated in currencies other than the USD are translated into USD at the rates in effect either at the close of business on the last business day of the reporting period or on the date of such transactions, respectively. Net realized foreign exchange gain or loss arises from the sales of foreign currencies and currency gains or losses realized between trade and settlement dates. Net unrealized foreign exchange gain and loss arises from changes in the fair value of assets and liabilities resulting from changes in exchange rates.
Trading costs: Trading costs generally consist of brokerage commissions, brokerage fees, clearing fees, exchange and regulatory fees, transaction and NFA fees. Fees vary by type of contract for each purchase and sale or sale and purchase (round turn) of futures, options on futures, and forward contracts. Commissions are paid on each individual purchase and sale transaction. These costs are recognized as expenses for futures and options on futures transactions and are included in net realized gain/loss from derivative contracts on the Statement of Operations.
Interest income/expense: Interest income and expense is recognized on an accrual basis.
Allocation of income and gains and losses: Profits and losses for each monthly accounting period, or shorter period if there are mid-month subscriptions and/or redemptions, are allocated pro-rata to the Feeder Funds based on their respective ownership percentage on the first day of each period throughout the year.
Income taxes: The Master Fund will not be subject to United States federal income taxation other than certain withholding taxes. The Master Fund evaluates tax positions taken or expected to be taken to determine whether the tax positions are more-likely-than-not of being sustained by the applicable tax authority. For tax positions meeting the more-likely-than-not threshold, the tax amount recognized in the financial statements is reduced by the largest benefit that has a greater than fifty percent likelihood of being realized upon ultimate settlement with the relevant taxing authority. The Master Fund has determined that there is no tax liability resulting from uncertain income tax positions taken or expected to be taken with respect to all open tax years. The Master Fund’s U.S. Federal tax returns for the period ended December 31, 2016, remain open. The Master Fund recognizes interest and penalties, if any, related to unrecognized tax benefits as income tax expense in the statement of operations. During the period, the Master Fund did not accrue any interest or penalties.
F-297
| Galaxy Plus Fund – Quest FIT Master Fund (535) LLC |
| (A Delaware Limited Liability Company) |
| Notes to the Financial Statements |
Use of estimates:The preparation of financial statements in accordance with GAAP requires management to make estimates and assumptions that affect the reported amounts of assets and liabilities and disclosure of contingent assets and liabilities at the date of the financial statements and the reported amounts of income and expenses during the reporting period. Actual results could differ from those estimates.
Indemnifications:The Sponsor and its affiliates are indemnified against certain liabilities arising out of the performance of their duties for The Master Fund. In addition, in the normal course of business, the Master Fund enters into contracts with vendors and others that provide for general indemnifications. The Master Fund’s maximum exposure under these arrangements is unknown as this would involve future claims that may be made against the Master Fund. However, the Master Fund expects the risk of loss to be remote.
Statement of cash flows: The Master Fund has elected not to provide a statement of cash flows as permitted by GAAP as all of the following conditions have been met:
| ● | During the period, substantially all of the Master Fund’s investments were carried at fair value and classified as Level 1 or Level 2 measurements in accordance with FASB ASC 820; |
| ● | The Master Fund had little or no debt during the period; |
| ● | The Master Fund’s financial statements include a statement of changes in member’s equity. |
Subscriptions and redemptions: Subscriptions and redemptions can typically be made on a weekly basis as of the first day (Monday) of each week; (or, if such day is not a business day, the first business day thereafter) (each, a Subscription Date or a Redemption Date). The Master Fund may accept subscriptions or redemptions more frequently than the first day of each week, depending upon the size of the requested subscription or redemption amount, with the approval of the Sponsor.
| Note 3. | Fair Value Measurements |
The Master Fund’s investments are stated at fair value in accordance with FASB ASC 820, Fair Value Measurements and Disclosures (ASC 820). ASC 820 defines fair value, establishes a framework for measuring fair value and expands disclosures about fair value measurements. ASC 820 also emphasizes that fair value is a market-based measurement, not an entity-specific measurement, and sets out a fair value hierarchy with the highest priority being quoted prices in active market. Under ASC 820, fair value measurements are disclosed by level within that hierarchy, as follows:
Level 1 — Values for investments classified as Level 1 are based on unadjusted quoted prices for identical investments in an active market. Since valuations are based on quoted prices that are readily accessible at the measurement date, valuation of these investments does not entail a significant degree of judgment.
Level 2 — Values for investments classified as Level 2 are based on quoted prices for similar investments in an active or non-active markets for which all significant inputs are observable either directly or indirectly. Level 2 inputs may also include discounts related to restrictions on the investments.
Level 3 — Values for investments categorized as Level 3 are based on prices or valuation techniques that require inputs that are both significant to the fair value and unobservable, including valuations by the Sponsor in the absence of readily ascertainable fair values.
A description of the valuation methodologies applied to the Master Fund’s major categories of assets and liabilities measured at fair value on a recurring basis follows. Inputs that are used in determining fair value of an investment may include price information, credit data, volatility statistics, and other factors. These
F-298
| Galaxy Plus Fund – Quest FIT Master Fund (535) LLC |
| (A Delaware Limited Liability Company) |
| Notes to the Financial Statements |
inputs can be either observable or unobservable. All of the inputs for the Master Fund were observable as of December 31, 2016. The availability of observable inputs can vary between investments and is affected by various factors such as type of investment and the volume and level of activity for that investment or similar investments in the marketplace.
Exchange-traded derivative contracts that are actively traded are valued based on daily quoted settlement prices from the respective exchange and are categorized in Level 1 of the fair value hierarchy. Exchange-traded derivative contracts not actively traded and over-the-counter (OTC) derivative contracts can include futures contracts, option on futures contracts, forward contracts and option contracts whose values are based on an underlying such as interest rates, foreign currencies, credit standing of reference entities, equities or commodities. Such derivative contracts are valued using observable market data, including currency spot rates or quoted prices of the related underlying obtained from the applicable exchange or market. OTC derivative contracts are valued using the above described pricing methodology and are categorized as Level 2 within the fair value hierarchy.
The Master Fund assesses the levels of the investments at each measurement date, and transfers between levels are recognized on the actual date of the event or change in circumstances that caused the transfer in accordance with the Master Fund’s accounting policy regarding the recognition of transfers between levels of the fair value hierarchy. There were no transfers among levels 1, 2, and 3 during the period ended December 31, 2016.
The inputs or methodologies used for valuing investments are not necessarily indicative of the risk associated with investing in those instruments.
F-299
| Galaxy Plus Fund – Quest FIT Master Fund (535) LLC |
| (A Delaware Limited Liability Company) |
| Notes to the Financial Statements |
The following tables present the classification of derivatives, by type, into the fair value hierarchy levels as of December 31, 2016. Presentation is gross – as an asset if in a gain position and a liability if in a loss position.
| Fair Value Measurements at Reporting Date Using | ||||||||||||||||
| Quoted Prices | Significant Other | Significant | ||||||||||||||
| in Active | Observable | Unobservable | ||||||||||||||
| Markets | Inputs | Inputs | ||||||||||||||
| Description | Fair Value | (Level 1) | (Level 2) | (Level 3) | ||||||||||||
| Assets: | ||||||||||||||||
| Derivative contracts: | ||||||||||||||||
| Futures contracts: | ||||||||||||||||
| Agriculture | $ | 21,754 | $ | 21,754 | $ | — | $ | — | ||||||||
| Currency | 27,589 | 27,589 | — | — | ||||||||||||
| Energy | 95,867 | 95,867 | — | — | ||||||||||||
| Index | 181,417 | 181,417 | — | — | ||||||||||||
| Interest | 106,989 | 106,989 | — | — | ||||||||||||
| Metals | 38,480 | 38,480 | — | — | ||||||||||||
| Total investment assets at fair value | 472,096 | 472,096 | — | — | ||||||||||||
| Liabilities: | ||||||||||||||||
| Derivative contracts: | ||||||||||||||||
| Futures contracts: | ||||||||||||||||
| Agriculture | (18,572 | ) | (18,572 | ) | — | — | ||||||||||
| Currency | (104,068 | ) | (104,068 | ) | — | — | ||||||||||
| Index | (17,403 | ) | (17,403 | ) | — | — | ||||||||||
| Interest | (182,105 | ) | (182,105 | ) | — | — | ||||||||||
| Metals | (15,465 | ) | (15,465 | ) | — | — | ||||||||||
| Total investment liabilities at fair value | (337,613 | ) | (337,613 | ) | — | — | ||||||||||
| Total net investment at fair value | $ | 134,483 | $ | 134,483 | $ | — | $ | — | ||||||||
F-300
| Galaxy Plus Fund – Quest FIT Master Fund (535) LLC |
| (A Delaware Limited Liability Company) |
| Notes to the Financial Statements |
| Note 4. | Derivative Financial Instruments |
Derivative financial instruments speculatively traded by the Master Fund can include U.S. and foreign futures, options on futures contracts, and forward currency contracts (collectively, derivatives) whose values are based upon an underlying asset, indices, or reference rates, and generally represent future commitments to exchange cash flows, or to purchase or sell other financial instruments at specified future dates. A derivative contract may be traded on an exchange or OTC. Exchange-traded derivatives are standardized and include futures and option on futures contracts. OTC derivative contracts are negotiated between contracting parties and include forward currency contracts and certain options. Derivatives are subject to various risks similar to those related to the underlying financial instruments including market and credit risks.
Market risk is the potential for changes in the value of derivatives due to market changes, including interest and foreign exchange rate movements and fluctuations in commodity and security prices. Market risk is directly impacted by the volatility and liquidity in the markets in which the related underlying assets are traded. The market risk of the Master Fund is managed by the underlying Trading Advisors according to each respective Program. The Master Fund is exposed to a market risk equal to the notional contract value of the derivatives contracts purchased and unlimited liability on such contracts sold short.
Credit risk is the possibility that a loss may occur due to the failure of a counterparty to perform according to the terms of a contract. Credit risk due to exchange traded derivative financial instruments is significantly reduced by the regulatory requirements of the individual exchanges on which the instruments are traded. At any point in time, the credit risk for OTC derivatives is limited to the net unrealized gain for each counterparty for which a netting agreement exists, if any. In a similar fashion, liabilities represent net amounts owed to counterparties. The credit risk exposure for the Master Fund’s outstanding OTC derivatives was $0 at December 31, 2016.
Purchase and sale of futures contracts requires margin deposits with the broker. Additional deposits may be necessary for any loss on contract value. The U.S. Commodity Exchange Act requires a broker to segregate all customer transactions and assets from such broker’s proprietary activities. A customer’s cash and other property (for example, U.S. Treasury bills) deposited with a broker are considered commingled with all other customer funds subject to the broker’s segregation requirements. In the event of a broker’s insolvency, recovery may be limited to a pro rata share of segregated funds available. It is possible that the recovered amount could be less than total cash and other property deposited.
The Master Fund has a substantial portion of its assets on deposit with counterparties. In the event of a counterparty’s insolvency, recovery of The Master Fund’s assets on deposit may be limited to account insurance or other protection afforded such deposits.
The notional value represents amounts related to the Master Fund’s stock exchange indices, commodities, interest rate and foreign currencies upon which the fair value of the futures contracts held by the Master Fund are based. Notional values do not represent the current fair value of, and are not necessarily indicative of the future cash flows of the Master Fund’s futures and forward contracts. Further, the underlying price changes in relation to variables specified by the notional values affects the fair value of these derivative financial instruments. Theoretically, the Master Fund’s exposure is equal to the notional value of contracts purchased and unlimited on such contracts sold short. As of December 31, 2016, the Master Fund had open futures contracts with the following notional values by sector:
F-301
| Galaxy Plus Fund – Quest FIT Master Fund (535) LLC |
| (A Delaware Limited Liability Company) |
| Notes to the Financial Statements |
| Description | Quantity | Notional Value | Description | Quantity | Notional Value | |||||||||
| Long: | Short: | |||||||||||||
| Agriculture | 36 | $ | 1,220,205 | Agriculture | 21 | $ | (655,515 | ) | ||||||
| Currency | 14 | 1,845,422 | Currency | 170 | (14,304,117 | ) | ||||||||
| Energy | 54 | 3,121,817 | Interest | 722 | (173,451,824 | ) | ||||||||
| Index | 201 | 12,952,702 | Metals | 14 | (1,296,485 | ) | ||||||||
| Metals | 11 | 694,700 | ||||||||||||
During the period ended December 31, 2016, the Master Fund participated in 1,372 futures contract transactions.
Below is a summary of net trading gains and (losses) by investment type and industry:
| Net Trading | ||||
| Gain (Loss)* | ||||
| Futures contracts: | ||||
| Agriculture | $ | (139,027 | ) | |
| Currency | 730,385 | |||
| Energy | (54,259 | ) | ||
| Index | 495,186 | |||
| Interest | 985,234 | |||
| Metals | 462,350 | |||
| Total futures | 2,479,869 | |||
| Trading costs | (24,964 | ) | ||
| Total net trading gain (loss) | 2,454,905 | |||
| * | Includes both realized gain of $2,320,422 and unrealized gain of $134,483 and is located in net realized and unrealized gain (loss) on investments on the statement of operations. Amounts exclude foreign currency transactions and translation. |
F-302
| Galaxy Plus Fund – Quest FIT Master Fund (535) LLC |
| (A Delaware Limited Liability Company) |
| Notes to the Financial Statements |
| Note 5. | Balance Sheet Offsetting |
The Master Fund is required to disclose the impact of offsetting assets and liabilities presented in the statement of financial condition to enable users of the financial statements to evaluate the effect or potential effect of netting arrangements on its financial position for recognized assets and liabilities. These recognized assets and liabilities include financial instruments and derivative instruments that are either subject to an enforceable master netting arrangement or similar agreement or meet the following right of set-off criteria: each of the two parties owes the other determinable amounts, the Master Fund has the right to set-off the amounts owed with the amounts owed by the other party, the Master Fund intends to set off, and the Fund’s right of set-off is enforceable at law.
The Master Fund is subject to enforceable master netting agreements with certain counterparties. These agreements govern the terms of certain transactions, and reduce the counterparty risk associated with relevant transactions by specifying offsetting mechanisms and collateral posting arrangements at prearranged exposure levels. Since different types of transactions have different mechanics and are sometimes traded out of different legal entities of a particular counterparty organization, each type of transaction may be covered by a different master netting arrangement, possibly resulting in the need for multiple agreements with a single counterparty. Master netting agreements may not be specific to each different asset type; in such instances, they would allow the Master Fund to close out and net its total exposure to a specified counterparty in the events of default or early termination with respect to any and all the transactions governed under a single agreement with the counterparty.
The following tables summarize the Master Fund’s netting arrangements:
| Net Amount of | ||||||||||||
| Gross Amounts | Offset in the | Assets (Liabilities) | ||||||||||
| of Recognized | Statement of | in the Statement of | ||||||||||
| Description | Assets (Liabilities) | Financial Condition | Financial Condition | |||||||||
| Futures | $ | (337,613 | ) | $ | 472,096 | $ | 134,483 | |||||
| Total | $ | (337,613 | ) | $ | 472,096 | $ | 134,483 | |||||
| Net Amount | ||||||||||||
| Net amount in | Cash Collateral | which is not offset | ||||||||||
| the Statement of | Received by | in the Statement of | ||||||||||
| Financial Condition | Counterparty | Financial Condition | ||||||||||
| Counterparty A | $ | 134,483 | $ | 4,623,294 | $ | 4,757,777 | ||||||
| Total | $ | 134,483 | $ | 4,623,294 | $ | 4,757,777 | ||||||
F-303
| Galaxy Plus Fund – Quest FIT Master Fund (535) LLC |
| (A Delaware Limited Liability Company) |
| Notes to the Financial Statements |
| Note 6. | Related Parties |
Gemini Hedge Fund Services, LLC an affiliate of the Sponsor, provides administration services for the Master Fund.
| Note 7. | Financial Highlights |
Financial highlights of the Master Fund for the period September 19, 2016 (commencement of operations) through December 31, 2016 are presented in the table below. The information has been derived from information presented in the financial statements.
| Total return (A) | 27.75 | % | ||
| Ratio to average member’s equity (B): | ||||
| Net investment income (C) | (0.07 | )% | ||
| Total expenses | 0.07 | % | ||
| (A) | Total return is based on the change in average member’s equity during the period of a theoretical investment made at the inception of the Master Fund. |
| (B) | The total expense and net investment loss ratios are computed based upon weighted-average member’s equity as a whole for the period ended December 31, 2016. |
| (C) | The net investment loss ratio excludes net realized and unrealized gains (losses) on investments. |
Financial highlights are calculated for each member class taken as a whole. An individual member’s return and ratios may vary based on the timing of capital transactions. The total return would have been lower, and the net investment loss and total expense ratios would have been higher if the management, incentive fees as well as sponsor fee, had been charged to the Master Fund. The ratios, excluding nonrecurring expenses, have been annualized. Total return has not been annualized.
| Note 8. | Subsequent Events |
In accordance with FASB ASC 855,Subsequent Events, the Sponsor has evaluated all subsequent events requiring recognition and disclosure in the Master Fund’s financial statements through March 24, 2017, the date the financial statements were available for issuance. The Sponsor has determined that there are no material events that would require recognition or disclosure in the Master Fund’s financial statements through this date.
F-304
| Galaxy Plus Fund – Quest FIT Master Fund (535) LLC |
| (A Delaware Limited Liability Company) |
| Oath and Affirmation of the Commodity Pool Operator |
To the best of the knowledge and belief of the undersigned, the information contained in the annual report as of December 31, 2016 and for the period from September 19, 2016 (commencement of operations) to December 31, 2016, is accurate and complete.
| |
| David Young, President | |
| Gemini Alternative Funds, LLC — Sponsor |
F-305
Pursuant to the requirements of the Securities Exchange Act of 1934, the registrant has duly caused this report to be signed on its behalf by the undersigned thereunto duly authorized.
Equinox Frontier Funds
| |||||||
| (Registrant) | |||||||
| Date: March 31, | 2017 | By: | /s/ | ||||
| Robert J. Enck | |||||||
| Robert J. Enck | |||||||
President and Chief Executive Officer | |||||||
| of Equinox Fund Management, LLC, | |||||||
| the Managing Owner of Equinox Frontier Funds | |||||||
Pursuant to the requirements of the Securities Exchange Act of 1934, this report has been signed below by the following persons on behalf of the registrant and in the capacities and on the dates indicated.
Equinox Fund Management, LLC
|
|
| ||||
| ||||||
|
| |||||
| ||||||
|
| |||||
|
| |||||
SIGNATURES
Pursuant to the requirements of the Securities Exchange Act of 1934, the registrant has duly caused this report to be signed on its behalf by the undersigned thereunto duly authorized.
| ||||||
| ||||||
| ||||||
Pursuant to the requirements of the Securities Exchange Act of 1934, this report has been signed below by the following persons on behalf of the registrant and in the capacities and on the dates indicated.
Equinox Fund Management, LLC
|
|
| ||||
| ||||||
|
| |||||
| ||||||
| ||||||
|
| |||||
SIGNATURES
Pursuant to the requirements of the Securities Exchange Act of 1934, this report has been signed below by the following persons on behalf of the registrant and in the capacities and on the dates indicated.
Equinox Fund Management, LLC
| ||||||
| ||||||
| ||||||
Pursuant to the requirements of the Securities Exchange Act of 1934, this report has been signed below by the following persons on behalf of the registrant and in the capacities and on the dates indicated.
Equinox Fund Management, LLC
BY: | /s/ | Robert J. Enck | March 31, | |||
| Robert J. Enck, Chairman and Member of the Executive Committee of Equinox Frontier Funds | ||||||
President and Chief Executive
| ||||||
|
| |||||
| ||||||
|
| |||||
| /s/ | David P. DeMuth | March 31, | ||||
| David P. DeMuth, Member of the Executive Committee of Equinox Frontier Funds | ||||||
| Frontier Fund Management LLC | ||||||
| BY: | /s/ | Patrick Kane | March 31, 2017 | |||
| Patrick Kane, Member of the Executive Committee of Frontier Fund Management LLC | ||||||
| /s/ | Patrick Hart | March 31, 2017 | ||||
| Patrick Hart, Member of the Executive Committee of Frontier Fund Management LLC | ||||||
F-306
SIGNATURES
SIGNATURES
Pursuant to the requirements of the Securities Exchange Act of 1934, the registrant has duly caused this report to be signed on its behalf by the undersigned thereunto duly authorized.
| Equinox Frontier Balanced Fund, | |||||||
a Series of Equinox Frontier Funds
| |||||||
| (Registrant) | |||||||
| Date: March 31, | 2017 | By: | / | ||||
| s/ Robert J. Enck | |||||||
| Robert J. Enck | |||||||
President and Chief Executive Officer | |||||||
| of Equinox Fund Management, LLC, | |||||||
| the Managing Owner of Equinox Frontier Funds | |||||||
Pursuant to the requirements of the Securities Exchange Act of 1934, this report has been signed below by the following persons on behalf of the registrant and in the capacities and on the dates indicated.
Equinox Fund Management, LLC
Pursuant to the requirements of the Securities Exchange Act of 1934, this report has been signed below by the following persons on behalf of the registrant and in the capacities and on the dates indicated.
Equinox Fund Management, LLC
BY: | /s/ | Robert J. Enck | March 31, | |||
| Robert J. Enck, Chairman and Member of the Executive Committee of Equinox Frontier Funds | ||||||
President and Chief Executive
| ||||||
|
| |||||
| ||||||
| /s/ | David P. DeMuth |
| March 31, | |||
| Chief Investment Officer of Equinox Fund Management, LLC the Managing Owner of Equinox Frontier Funds | ||||||
| Frontier Fund Management LLC | ||||||
| BY: | /s/ | Patrick Kane |
| March 31, | ||
SIGNATURES
Pursuant to the requirements of the Securities Exchange Act of 1934, the registrant has duly caused this report to be signed on its behalf by the undersigned thereunto duly authorized.
| ||||||||
| ||||||||
| ||||||||
| /s/ | Patrick Hart | March 31, 2017 | ||||||
| Patrick Hart, Member of the | ||||||||
SIGNATURES
Pursuant to the requirements of the Securities Exchange Act of 1934, this report has been signed below by the following persons on behalf of the registrant and in the capacities and on the dates indicated.
Equinox Fund Management, LLC
| Equinox Frontier Heritage Fund, | |||||||
|
|
| |||||
| |||||||
|
| ||||||
| |||||||
|
| ||||||
|
| ||||||
SIGNATURES
Pursuant to the requirements of the Securities Exchange Act of 1934, the registrant has duly caused this report to be signed on its behalf by the undersigned thereunto duly authorized.
a Series of Equinox Frontier Funds
| ||||||
| (Registrant) | ||||||
| Date: March 31, | 2017 | By: | / | |||
| s/ Robert J. Enck | ||||||
| Robert J. Enck | ||||||
President and Chief Executive | ||||||
| Officer | ||||||
| of Equinox | ||||||
| Fund Management, LLC, | ||||||
| the Managing Owner of Equinox | ||||||
| Frontier Funds | ||||||
Pursuant to the requirements of the Securities Exchange Act of 1934, this report has been signed below by the following persons on behalf of the registrant and in the capacities and on the dates indicated.
Equinox Fund Management, LLC
BY: | /s/ | Robert J. Enck | March 31, | |||
| Robert J. Enck, Chairman and Member of the Executive Committee of Equinox Frontier Funds | ||||||
| President and Chief Executive Officer of Equinox Fund Management, LLC, the Managing Owner of Equinox Frontier Funds | ||||||
| /s/ | David P. DeMuth |
| March 31, | |||
| ||||||
| ||||||
| ||||||
| David P. DeMuth, Member of the Executive Committee of Equinox Frontier Funds | ||||||
| Frontier Fund Management LLC | ||||||
| BY: | /s/ | Patrick Kane | March 31, 2017 | |||
| Patrick Kane, Member of the Executive Committee of Frontier Fund Management LLC | ||||||
| /s/ | Patrick Hart | March 31, 2017 | ||||
| Patrick Hart, Member of the Executive Committee of Frontier Fund Management LLC | ||||||
SIGNATURES
SIGNATURES
Pursuant to the requirements of the Securities Exchange Act of 1934, the registrant has duly caused this report to be signed on its behalf by the undersigned thereunto duly authorized.
| Equinox Frontier Winton Fund, | |||||||
a Series of Equinox Frontier Funds
| |||||||
| (Registrant) | |||||||
| Date: March 31, | 2017 | By: | / | ||||
| s/ Robert J. Enck | |||||||
| Robert J. Enck | |||||||
President and Chief Executive Officer | |||||||
| of Equinox Fund Management, LLC, | |||||||
| the Managing Owner of Equinox Frontier Funds | |||||||
Pursuant to the requirements of the Securities Exchange Act of 1934, this report has been signed below by the following persons on behalf of the registrant and in the capacities and on the dates indicated.
Equinox Fund Management, LLC
BY: | /s/ | Robert J. Enck | March 31, | |||
| Robert J. Enck, Chairman and Member of the Executive Committee of Equinox Frontier Funds | ||||||
| President and Chief Executive Officer of Equinox Fund Management, LLC, the Managing Owner of Equinox Frontier Funds | ||||||
| /s/ | David P. DeMuth |
| March 31, | |||
| ||||||
| ||||||
| ||||||
| David P. DeMuth, Member of the Executive Committee of Equinox Frontier Funds | ||||||
| Frontier Fund Management LLC | ||||||
| BY: | /s/ | Patrick Kane | March 31, 2017 | |||
| Patrick Kane, Member of the Executive Committee of Frontier Fund Management LLC | ||||||
| /s/ | Patrick Hart | March 31, 2017 | ||||
| Patrick Hart, Member of the Executive Committee of Frontier Fund Management LLC | ||||||
SIGNATURES
SIGNATURES
Pursuant to the requirements of the Securities Exchange Act of 1934, the registrant has duly caused this report to be signed on its behalf by the undersigned thereunto duly authorized.
| Equinox Frontier Select Fund, | |||||||
a Series of Equinox Frontier Funds
| |||||||
| (Registrant) | |||||||
| Date: March 31, | 2017 | By: | / | ||||
| s/ Robert J. Enck | |||||||
| Robert J. Enck | |||||||
President and Chief Executive Officer | |||||||
| of Equinox Fund Management, LLC, | |||||||
| the Managing Owner of Equinox Frontier Funds | |||||||
Pursuant to the requirements of the Securities Exchange Act of 1934, this report has been signed below by the following persons on behalf of the registrant and in the capacities and on the dates indicated.
Equinox Fund Management, LLC
BY: | /s/ | Robert J. Enck | March 31, | |||
| Robert J. Enck, Chairman and Member of the Executive Committee of Equinox Frontier Funds | ||||||
| President and Chief Executive Officer of Equinox Fund Management, LLC, the Managing Owner of Equinox Frontier Funds | ||||||
| /s/ | David P. DeMuth |
| March 31, | |||
| ||||||
| ||||||
| Frontier Fund Management LLC | ||||||
| BY: | /s/ | Patrick Kane | March 31, 2017 | |||
| Patrick Kane, Member of the Executive Committee of Frontier Fund Management LLC | ||||||
| /s/ | Patrick Hart | March 31, 2017 | ||||
| Patrick Hart, Member of the Executive Committee of Frontier Fund Management LLC | ||||||
SIGNATURES
Pursuant to the requirements of the Securities Exchange Act of 1934, the registrant has duly caused this report to be signed on its behalf by the undersigned thereunto duly authorized.
| Equinox Frontier Long/Short Commodity Fund, | ||
| a Series of Equinox Frontier Funds | ||
| (Registrant) | ||
| Date: March 31, 2017 | By: | /s/Robert J. Enck |
| Robert J. Enck | ||
| President and Chief | ||
| of Equinox Fund Management, LLC, | ||
| the Managing Owner of Equinox Frontier Funds | ||
Pursuant to the requirements of the Securities Exchange Act of 1934, this report has been signed below by the following persons on behalf of the registrant and in the capacities and on the dates indicated.
Equinox Fund Management, LLC
| BY: | /s/ | Robert J. Enck | March 31, 2017 | |||
| Robert J. Enck, Chairman and Member of the Executive Committee of Equinox Frontier Funds | ||||||
| President and Chief Executive Officer of Equinox Fund Management, LLC, the Managing Owner of Equinox Frontier Funds | ||||||
| /s/ | David P. DeMuth | March 31, | ||||
| David P. DeMuth, Member of the Executive Committee of Equinox Frontier Funds | ||||||
| Frontier Fund Management LLC | ||||||
| BY: | /s/ | Patrick Kane | March 31, 2017 | |||
| Patrick Kane, Member of the Executive Committee of Frontier Fund Management LLC | ||||||
| /s/ | Patrick Hart | March 31, 2017 | ||||
| Patrick Hart, Member of the Executive Committee of Frontier Fund Management LLC | ||||||
SIGNATURES
Pursuant to the requirements of the Securities Exchange Act of 1934, the registrant has duly caused this report to be signed on its behalf by the undersigned thereunto duly authorized.
| Equinox Frontier Diversified Fund, | ||
| a Series of Equinox Frontier Funds | ||
| (Registrant) | ||
| Date: March 31, 2017 | By: | /s/ Robert J. Enck |
| Robert J. Enck | ||
| President and Chief Executive Officer of Equinox Fund | ||
| Management, LLC, the Managing Owner | ||
| of Equinox Frontier Funds | ||
Pursuant to the requirements of the Securities Exchange Act of 1934, this report has been signed below by the following persons on behalf of the registrant and in the capacities and on the dates indicated.
Equinox Fund Management, LLC
| BY: | /s/ | Robert J. Enck | March 31, 2017 | |
| Robert J. Enck, Chairman and Member of the Executive Committee of Equinox Frontier Funds | ||||
| President and Chief Executive Officer of Equinox Fund Management, LLC, the Managing Owner of Equinox Frontier Funds | ||||
| /s/ | David P. DeMuth | March 31, 2017 | ||
| David P. DeMuth, Member of the Executive Committee of Equinox Frontier Funds | ||||
| Frontier Fund Management LLC | ||||
| BY: | /s/ | Patrick Kane | March 31, 2017 | |
| Patrick Kane, Member of the Executive Committee of Frontier Fund Management LLC | ||||
| /s/ | Patrick Hart | March 31, 2017 | ||
| Patrick Hart, Member of the Executive Committee of Frontier Fund Management LLC | ||||
SIGNATURES
Pursuant to the requirements of the Securities Exchange Act of 1934, the registrant has duly caused this report to be signed on its behalf by the undersigned thereunto duly authorized.
| Equinox Frontier Masters Fund, | ||
| a Series of Equinox Frontier Funds | ||
| (Registrant) | ||
| Date: March 31, 2017 | By: | /s/ Robert J. Enck |
| Robert J. Enck | ||
| President and Chief Executive Officer of Equinox Fund | ||
| Management, LLC, the Managing Owner | ||
| of Equinox Frontier Funds | ||
Pursuant to the requirements of the Securities Exchange Act of 1934, this report has been signed below by the following persons on behalf of the registrant and in the capacities and on the dates indicated.
Equinox Fund Management, LLC
| BY: | /s/ | Robert J. Enck | March 31, 2017 | |
| Robert J. Enck, Chairman and Member of the Executive Committee of Equinox Frontier Funds | ||||
| President and Chief Executive Officer of Equinox Fund Management, LLC, the Managing Owner of Equinox Frontier Funds | ||||
| /s/ | David P. DeMuth | March 31, 2017 | ||
| David P. DeMuth, Member of the Executive Committee of Equinox Frontier Funds | ||||
| Frontier Fund Management LLC | ||||
| BY: | /s/ | Patrick Kane | March 31, 2017 | |
| Patrick Kane, Member of the Executive Committee of Frontier Fund Management LLC | ||||
| /s/ | Patrick Hart | March 31, 2017 | ||
| Patrick Hart, Member of the Executive Committee of Frontier Fund Management LLC | ||||