| • | | WealthBench. WealthBench is anfrom other operating segments. In 2018, for example, ESG content was fully integrated into and made available through our MSCI Analytics Platform in response to demand from institutional managers who are looking for ways to integrate ESG into their investment planning platform for private banks, financial advisers, brokerages and trust companies. WealthBench assists users in delivering informed, tailored investment planning proposals for high net worth individuals reflecting their needs, goals and risk tolerances while remaining consistent with firm-driven investment and risk-based policies. WealthBench incorporates robust analytics, market-consistent inputs and transparent methodologies.processes. |
| • | | CreditManager. CreditManager is a portfolio credit risk management system used primarily by banks to calculate economic capital, facilitate risk-based pricing and measure credit risk concentrations. The application is designed to consolidate and compare risks and opportunities across multiple credit exposures including bonds, credit derivatives and traditional lending. |
All Other Segment—ESG
MSCI’s ESG products offer research and ratings that enable institutional investorsOur Analytics segment also provides various managed services to assess risks and opportunities arising from ESG issues,help clients operate more efficiently as well as evaluate both individual securities and investment portfolios. MSCI develops screening and modeling tools that allow users to align investments with a set of ESG values such as perceptionsaddress the needs of certain specialized areas of the investment community by providing a reporting service and performance reporting tools to institutional consultants and investors in hedge funds.
Managed Services. As described in Part I, Item 1. “Business—Growth Strategy,” we have, and continue to expand our, capabilities to deliver new workflow solutions and data services to our clients to enable them to operate more efficiently. Our services include consolidation of client portfolio data from various sources, data reconciliation analysis, uploading of data into our risk and portfolio management applications, review of results and identification of data anomalies and customized reporting. Our Managed Services lower our clients’ internal cost of doing business activities, religious views or international norms; generate buy/restricted listsby allowing clients to focus on value-added work, enabling faster implementations and making the use of our products more efficient. HedgePlatform. HedgePlatform, is a reporting service that allows clients who invest in hedge funds, including funds of funds, pension funds and endowments, to measure, evaluate and monitor the risk of their hedge fund investments across multiple hedge fund strategies. We collect position-level information from hedge funds on a monthly basis and provide clients with risk information for each individual hedge fund in which they invest as well as aggregate risk information for their overall portfolio of hedge funds. Clients who use RiskManager to measure the risk of their own holdings can further integrate the positions collected via our HedgePlatform service to allow computation of risk across their entire portfolio, while the confidential and proprietary nature of the underlying hedge fund holdings is maintained. All Other – ESG MSCI ESG Research analyzes over 7,8004companies that meet those criteria;worldwide to help institutional investors understand how environmental, social and governance factors can impact the implicationslong-term risk of restrictions on portfolios; and examine company specific profiles. The tools also include the ability to monitor a company’s adherence to internationally recognized norms and principles.their investments. Subscribers to MSCI ESG Research included 47 of the top 50include global asset managers, leading asset owners, consultants, advisers and academics. In addition, MSCI ESG Research data and ratings are used in the construction of equity and fixed income indexes to help institutional investors more effectively benchmark ESG investment performance, issue index-based investment products, as of December 31, 2015 (as rankedwell as manage, measure and report on ESG mandates. Additionally, the data and ratings produced by P&I in its report dated April 2015).MSCI ESG Research are made available on most applications offered by our Analytics segment. MSCI’s ESG products from MSCIofferings include: MSCI ESG Ratings. MSCI ESG Ratings are designed to identify ESG risks or opportunities that may not be captured through conventional analyses. This includes ratings of equity issuers and fixed income securities, including corporate, sovereign and other government related bonds. Ratings are designed to identify and analyze ESG issues, including exposures (e.g., business segment and geographic risk), management and industry-specific measures that may include the intersection of a company’s major social and environmental impacts with its core business operations, thereby identifying potential risks and opportunities for the company and its investors. | • | | • | MSCI ESG Business Involvement Screening Research. MSCI ESG Business Involvement Screening Research hasis a dedicated, in-house ESG research team, whichscreening service that enables MSCI to control, monitor and manage data quality. Our research analysts assess thousands of data points across 34 ESG issues, covering more than 5,900 global companies in more than 70 sectors, including more than 150 fixed-income issuers, as of December 31, 2015. MSCI ESG Research led nine major categories, including “Best SRI Research” firm and “Best Corporate Governance” firm in the |
| 2015 Independent Research in Responsible Investment (IRRI) survey. We also use MSCI ESG Research to create MSCI ESG indexes, which are included in our Index segment.
|
| • | | MSCI ESG Ratings. MSCI ESG Ratings are designed to provide institutional investors with the ability to integratemanage ESG into investment decisions by identifying risksstandards and opportunities that may not be captured through conventional analysis. This includes ratings for 25,000 equitiesrestrictions reliably and 140,000 fixed-income securities. In addition, MSCI also assigns ESG ratings to more than 2,200 companies worldwide, covering an additional 90,000 fixed-income securities. Ratings are designed to identify and analyze ESG issues, including exposures (e.g., business segment and geographic risk), management and industry-specific measures that may include the intersection of a company’s major social and environmental impacts with its core business operations, thereby identifying potential risks and opportunities for the company and its investors. |
| • | | MSCI ESG GovernanceMetrics.MSCI ESG GovernanceMetrics provides institutional investors with corporate governance research and data on over 7,000 public companies worldwide.efficiently. Asset managers, investment advisers and asset owners can access company profiles, rankings and underlying governance and accounting metricsscreening research through the online MSCI ESG Manager platform or a data feed to satisfy clienttheir clients’ investment guidelines, enhance engagement activitiesimplement client mandates and manage potential ESG portfolio risks. |
4 | Does not include subsidiary-level companies. |
10
All Other Segment—– Real Estate MSCI’s
Our Real Estate productssegment includes research, reporting, market data and benchmarking offerings that provide real estate performance analysisanalytics for funds, investors managers, lenders and occupiers. We provide products and offer services that include research, reporting and benchmarking. MSCI’smanagers. Our Real Estate performance and risk analytics range from multi-asset classenterprise-wide to property-specific analysis. MSCISome of the risk analysis generated in the Real Estate segment is also providesused in the products offered by our other operating segments. For example, the MAC models created in our Analytics segment offers a view of risk across market and asset classes, including private real estate, by incorporating content generated in the Real Estate segment. We also provide business intelligence to real estate owners, managers, developers and brokers worldwide. MSCI’s Real Estate products comprise private real estate benchmarks and indexes typically branded “IPD” andofferings include:
| • | | Portfolio Analysis Service (“PAS”)MSCI Enterprise Analytics. PAS MSCI Enterprise Analytics is an interactive application that offers a single platform for real estate risk management and performance attribution that analyzes the strengths and weaknesses of a real estate portfolio’s performance relativeintegrated analysis to its benchmark. PAS provides portfolio management tools that are designed to assist in building effective real estate portfolios, allowing users to gain additional portfolio insight to help them make informed investment decisions. Performance attribution enables users to analyze the sources of portfolio risk and return on an absolute or relative basis. PAS providesprivate real estate investors with a granular understanding of the exposures and returns of their real estate portfolio, from the building to the fund level. |
| • | | IPD Global Intel. IPD Global Intel is a databank that equips asset owners, researchers, strategists and portfolio and risk managers with data analytics to enhance their understanding of local, regional and global real estate performance and risks. IPD Global Intel comprises a consolidated set of global, regional, national, city and submarket indexes with breakdowns by property type. Drawing from actual performance data on approximately 1,300 funds and 66,000 real estate assets, IPD Global Intel provides investors and managers, providing them with the ability to evaluate and analyze the drivers of portfolio performance across an authoritative view of market trends and time series,organizations’ investments, as well as actionable information on propertyreview exposures and concentrations across markets, for more than 30 countries. |
Growth Strategy
We believe we are well positioned for growth over time. Our multi-pronged strategy is focused on addressing the most critical needs of institutional investors and building on our strong client relationships and integral role in the investment process.
Client Growth
We believe there are opportunities to increase our business with existing clients and to add new clients. We intend to:
| • | | Increase product subscriptions within our current client base. We expect that our productsasset types and services will enable us to offer clients more ways to achieve their current and future objectives. Many of our clients use only a limited number of our products, and we believe there are opportunities to sell additional content and tools to existing clients and to increase the number of users and locations. We believe our knowledge of our clients and our familiarity with their investment processes enables us to license these additional products to our clients. |
| • | | Expand our client base. We seek to add new clients by increasing our sales efforts and by leveraging the investments made in recent years, including transitioning away from our historic product-centric approach to a client needs-centric approach by merging our legacy product brands under an umbrella MSCI brand. We also believe that efforts to expand our geographic presence in recent years have positioned us to further leverage our brand strength, product reach and access to the global investment community to attract new clients. |
| • | | Focus on client relationship management.During 2015, we realigned MSCI’s global client coverage organization to sharpen our focus on current clients and improve our ability to identify new prospects. Our Analytics team transformed its product line across multiple dimensions, including strategy, product development, execution and governance. We also consolidated legacy risk management analytics and portfolio management analytics sales teams into one integrated team, as well as incorporated ESG and Real Estate sales and service teams into our overall client coverage organization. To ensure that MSCI provides world-class service to our largest accounts, we have assigned senior account managers (“SAMs”) to cover such accounts on a dedicated basis. |
| • | | Increase licensing of indexes for ETFs and other exchange traded investment products. Based on demand for our indexes as the basis for ETFs, we believe that there is opportunity for continued growth and expansion in the market, among both asset owners and managers, including registered investment advisors. We will continue to pursue opportunities to increase licensing of our indexes for index-linked investment products to capitalize on the growth in number and variety of our indexes and related products. The table below illustrates the growth trend with respect to the number of exchange listings of ETFs linked to MSCI equity indexes in the Americas, Europe, the Middle East and Africa (“EMEA”) and Asia. |
| | | | | | | | | | | | | | Number of Exchange Listings of ETFs Linked to MSCI Equity Indexes | | | | | | | As of | | Region | | December 31,
2015 | | | December 31,
2014 | | | December 31,
2013 | | Americas | | | 273 | | | | 239 | | | | 190 | | EMEA | | | 466 | | | | 409 | | | | 381 | | Asia | | | 59 | | | | 39 | | | | 36 | | | | | | | | | | | | | | | Total | | | 798 | | | | 687 | | | | 607 | | | | | | | | | | | | | | |
Historical values of the assets in ETFs linked to our indexes are set forth in a table under Part II, Item 7. “Management’s Discussion and Analysis of Financial Condition and Results of Operations—Results of Operations” below.
| • | | Increase managed services offerings. Continued pressure on management fees is causing our clients to look for ways to become more operationally efficient. MSCI’s Managed Services include end-to-end services that aim to assist clients with meeting operational and regulatory requirements by providing a convenient and cost-effective way to outsource data processing, systems administration and reporting. By outsourcing these functions to MSCI’s data management professionals, we hope to free up our clients to focus on value-added work such as risk budgeting, asset allocation and manager selection andincreasingly diverse portfolios.
|
| monitoring. Our end-to-end services include consolidation of data from various sources, data reconciliation analysis, uploading of data into MSCI’s risk and portfolio management applications, identification of anomalies and customized reporting at a client’s direction.
|
Develop New Products and Product Enhancements
We plan to develop new product offerings and continue to enhance our existing products. Much of our product development is based on an ongoing and active dialogue with clients, which helps us to understand their needs and anticipate market developments. We intend to:
| • | | Create innovative product offerings and enhancements.We see strong demand for new MSCI products and services that can help clients implement their investment strategies. We strive to transform clients’ challenges into opportunities by introducing innovative new products and enhancements to existing products. In Index, this includes developing new indexes, including custom indexes and currency-hedged indexes. In Analytics, we are transforming our platform in response to clients’ needs for investment differentiation, operational efficiency, risk management and regulatory compliance, and producing content that addresses those needs cost effectively. As ESG moves more into the mainstream of investing, we are developing new research and ratings products that assess corporate responsibility. Additionally, in Real Estate, we are building new products for Real Estate markets in a number of countries, as well as creating a platform that delivers products more efficiently and offers clients new ways to interact with our data. |
| • | | Execute on investments to expand our capacity to design and develop new products. Over the past two years, we have increased investment in product development teams, research, data production systems, technology infrastructure and software application design to enable us to design and develop new products more quickly and cost-effectively over time. Further increasing our ability to construct additional indexes, and design software applications more effectively, will allow us to address client needs and bring new products and product enhancements to the market more quickly. During 2015, we upgraded our technology infrastructure by moving one of our data centers to a world-class data center in Nevada. This move significantly increased our capacity to meet the growing needs of our largest global clients. |
| • | | Growth through acquisitions. We intend to continue to seek to acquire products, technologies and companies that will complement our product offerings and client base, as well as increase our ability to provide investment decision support tools to equity, fixed income and multi-asset class investment institutions, and the financial intermediaries that serve such institutions. |
Competitive Advantages
We believe MSCI’s competitive advantages include:
| • | | Our strong client relationships and deep understanding of client needs. One of the advantages of MSCI is that our vantage point enables us to view financial markets in terms of what matters to global investors and financial institutions. From 35 offices in the Americas, EMEA and Asia, we engage in conversations with institutional investors looking beyond geographic boundaries and asset classes to produce content and knowledge about global risk-taking and opportunity. We believe that our consultative approach to product development, dedication to client support and our range of products enable us to build strong relationships with investment professionals and institutions around the world. The skills, knowledge and experience of our research, applications development, global sales, data management and production and product management teams enable us to develop and enhance our models, methodologies, data and software applications in accordance with client demands and needs. We consult with clients and other market participants during the product development process to take into account their actual investment objectives and requirements. As of December 31, 2015, MSCI’s clients included: |
97 of the top 100 global asset managers (as ranked by P&I in its report dated April 2015);
87 of the top 100 global pension funds (as ranked by P&I/Towers Watson in their report dated September 2015);
69MSCI Global Intel. MSCI Global Intel is a leading database that equips asset owners, researchers, strategists and portfolio and risk managers with data analytics to enhance their understanding of local, regional and global real estate performance and risks. The tool comprises a consolidated set of global, regional, national, city and submarket indexes with segmentation by property type. It also allows users to generate tailored analyses through MSCI Global Intel PLUS with custom filters on asset specific characteristics such as property type, location and risk profile to create the top 100 global hedge funds (as ranked by Preqin as of 2015);appropriate comparisons that are essential to managing performance and risk. 86MSCI Income Risk Service (“MSCI IRIS”). For real estate investors who need to manage and report on the specific risk of their real estate portfolios and assets, MSCI IRIS measures the top 100 global banks (as ranked byincome risk factors that drive future return volatility. MSCI IRIS provides investors with transparency on the lease duration, market risk, counterparty credit risk and income concentration risk relative to the markets in which they compete. The Banker Database astool offers actionable insights into portfolio resilience and sources of 2015). We believe that our relationships with the leading institutional investors are broader and more global than our peers.
| • | | Data quality.MSCI offers proprietary software and databases that house data from more than 200 third-party sources as well as data that MSCI produces. Our data-management teams work to achieve the highest standards for data quality and accuracy. MSCI currently calculates more than 180,000 end-of-day indexes daily and more than 10,000 indexes in real time. |
| • | | Extensive historical databases. MSCI has amassed extensive databases of historical global market data, proprietary equity index data, private real estate benchmark data, risk data and ESG data. We believe our substantial and valuable databases of proprietary index and risk data, including over 40 years of certain index data history, nearly 40 years of certain risk and real estate data history, as well as over 14 years of certain historical governance data, would be difficult and costly to replicate. The information is not available from any single source and would require intensive data checking and quality assurance testing that we have performed over our many years of accumulating this data. Historical data is a critical component of our clients’ investment processes, allowing them to research and back-test investment strategies and analyze portfolios over many investment and business cycles and under a variety of historical situations and market environments. |
| • | | Client integration of our products. Many of our clients have integrated our products into their performance measurement and risk management processes, where these products become an integral part of our clients’ daily portfolio management functions. In certain cases, our clients are requested by their customers to report using our tools or data. Additionally, our tools can help clients comply with local regulations or client reporting requirements. Consequently, we believe that certain of our clients may experience business disruption and additional costs if they cease using or replace our products. |
| • | | Brand recognition. We believe that MSCI’s brand is well-established and recognized throughout the institutional investment community worldwide. The strength of MSCI’s brand reflects the longstanding quality and widespread use of our products. We believe our indexes, platforms and content are well-positioned to be the tools of choice for investment institutions increasingly looking to third-party products and services for help with benchmarking, index-linked product creation and portfolio and multi-asset class market risk management. |
| • | | Global products and operations. Our products cover most major investment markets throughout the world. For example, the MSCI Global Equity Index family provides broad equity market coverage for over 80 countries in our developed, emerging and frontier market categories; and MSCI produces equity risk data for 45 single country models, 10 regional equity models and an integrated multi-asset class risk model covering equity markets and fixed income markets. As of December 31, 2015, MSCI’s clients were located in 86 countries, with many of them having a presence in multiple locations around the world. As of December 31, 2015, MSCI’s employees were located in 22 countries in order to maintain close contact with our clients and the international markets we follow. We believe our global presence and focus allow us to serve our clients well and capitalize on a great number of business opportunities in many countries and regions of the world. |
| • | | Sophisticated models with practical application. We have invested significant time and resources for more than three decades in developing highly sophisticated and practical index methodologies and risk models that combine financial theory and investment practice. We continually enhance our models to reflect the evolution of markets and to incorporate methodological advances into risk forecasting. New models and major enhancements to existing models are reviewed by our modelrisk to inform strategic review, committee. |
| • | | Open architecture and transparency. We have an open architecture philosophy aimed at increasing data access and integration features in our products and services. Clients can access our data through our software applications, third-party applications or their own applications. We also recognize that the marketplace is complex and multi-layered, as a competitor in one context may be a supplier or distributor in another context. For example, Standard & Poor’s competes with us in index products, supplies index data that we distribute in our portfolio analytics software products and jointly developed and maintains GICS and GICS Direct with us. In order to provide transparency, we document and disclose many details of our models and methodologies to our clients so that they can better understand and utilize the tools we offer. Consistent with our open architecture approach, we believe this transparency benefits us and our clients. |
| • | | Scalable application platforms. We will continue to invest in our data centers, technology platform and software products to provide highly scalable solutions for the processing of large volumes of asset and portfolio data. In doing so, we are able to offer clients computing capacity that they would otherwise not be able to access in a cost-effective manner through internal development. |
| • | | Highly skilled employees. Our workforce is highly skilled, technical and, in some instances, specialized. In particular, our research and software application development departments include individuals with backgrounds in mathematics, statistics, finance, portfolio investment and application development who combine advanced academic credentials with market experience. Our employees’ experience and knowledge give us access to, and allow us to add value at, the highest levels of our clients’ organizations. |
Clients
As of December 31, 2015, MSCI served approximately 6,400 clients across 86 countries worldwide, with 52.2% of revenues coming from clients in the Americas, 35.5% in EMEA and 12.3% in Asia and Australia. To calculate the number of clients, we may count certain affiliates, user locations, or business units within a single organization as separate clients. For example, the asset management and broker-dealer units of a diversified financial services firm may be treated as separate clients, even though the financial services firm is the only party to the applicable subscriptions or licenses. If we aggregate all related clients under their respective parent entity, the number of clients would be approximately 3,850, as of December 31, 2015.lease restructuring decisions.
Our Aggregate Retention Rate was 93.4% and 93.0% for the years ended December 31, 2015 and 2014, respectively. See Part II, Item 7. “Management’s Discussion and Analysis of Financial Condition and Results of Operations—Key Financial Metrics and Drivers—Operating Metrics—Aggregate Retention Rate” for the definition of Aggregate Retention Rate and more detailed aggregate retention rate data.
Revenues from our 10 largest clients contributed a total of 26.0%, 25.8% and 25.1% to our total revenues for the years ended December 31, 2015, 2014 and 2013, respectively.
In the years ended December 31, 2015, 2014 and 2013, our largest client organization by revenue, BlackRock, Inc. and its affiliates (“BlackRock”), accounted for 10.3%, 10.6% and 9.7% of our operating revenues, respectively. For the years ended December 31, 2015, 2014 and 2013, 93.0%, 92.1% and 89.1%, respectively, of our revenues from BlackRock were attributable to fees based on the AUM of ETFs linked to MSCI equity indexes, including its iShares ETF business.
Geographic Information and Client Region We currently have branches or subsidiaries in the following locations: Australia, Brazil, Canada, Chile, China, England, France, Germany, Hong Kong, Hungary, India, Italy, Japan, Korea, Mexico, the Netherlands, the Philippines, Singapore, South Africa, Sweden, Switzerland, Taiwan, United Arab Emirates and the U.S. See Note 13,12, “Segment Information,” of the Notes to Consolidated Financial Statements included herein for additional information on our revenues and certain assets by geographic area. Marketing
We market our products to asset owners and managers, chief investment officers, active and passive portfolio managers, chief risk officers and financial intermediaries. Our research and product management teams seek to understand our clients’ investment processes and needs in order to design tools that help clients understand the dimensions of performance and risk in their portfolios and make better-informed investment decisions.
Members of our research team and other employees regularly speak at industry conferences, as well as at our own events. For example, we hosted approximately 800 seminars, webinars, conferences and workshops in various locations across the globe in 2015. These events bring our staff and our clients together, expose those clients to our latest research and product enhancements and give our staff an opportunity to gain insight into our clients’ needs.
Our marketing professionals arrange interviews for our industry and product experts in prominent financial and trade media and issue press releases from time to time on client wins, new research and product developments. We also communicate with both existing clients and prospective clients through our email newsletters which deliver research, insights and product specific news, through our public website and client portals, and via social media.
Our marketing department collaborates with our product specialists to analyze our clients’ use of our products and to analyze the competitive landscape for our products. We also supplement these direct marketing efforts with targeted online advertising and co-branding initiatives with some of our major clients.
Sales and Client Support
As of December 31, 2015, our client coverage offices included approximately 280 salespeople and 300 client-support personnel worldwide. Of these, over 85 were located in New York and 100 were located in London.
We have expanded our sales efforts to increase our revenues and our client service efforts to further ensure client satisfaction and develop client loyalty. For example, over the last few years, we opened sales and client coverage offices in Santiago, Chile and Seoul, Korea and expanded our sales presence in China and the Middle East. In 2015, we also significantly increased the number of client coverage employees in Mumbai, India and Monterrey, Mexico.
We also have sales and client support teams that are dedicated to specific client segments in order to increase our impact in each such segment, including with respect to asset managers, hedge funds, asset owners, financial advisors, private wealth managers and broker dealers. In the Americas, we also increased our focus on smaller asset managers and hedge funds, financial advisors and insurance firms. Our sales and client support staff are based around the world to enable us to provide valuable face-to-face client service and focus efforts on developing new clients in more locations.
The sophisticated nature of our products and their uses demand a sales and client support staff with strong academic and financial backgrounds. Most new sales require several face-to-face meetings with the prospective client and the sales process for large and complex sales is likely to involve a team comprising sales, client support, product management and research. For example, for Barra and RiskMetrics branded products, sales and client support personnel are available to onboard new clients and new users, which includes providing intensive on-site training in the use of the models, data and software applications underlying each product. Client support also provides ongoing support, which may include on-site visits, telephone and email, and routine support needed in connection with the use of the product or how it can help clients improve their processes, all of which are included in the recurring subscription fee. We believe that the size, quality, knowledge and experience of our sales and client support staff, as well as their proximity to clients, differentiate us from our competitors.
Product Development and Production
We take a coordinated team approach to product development and production. Our product management, research, data operations and technology and application development departments are at the center of this process.
Drawing on decades of experience with the investment process worldwide, our research department develops, reviews and enhances our various methodologies and models. Our global data operations and technology team designs and manages our processes and systems for market data procurement, proprietary data production and quality control. Our application development team builds our sophisticated software applications. As part of our product development process, we also commonly consult with clients and other market participants to understand their specific needs and investment process requirements. Our product management team facilitates this collaborative product development and production approach. The roles and functions of our product development and production teams include:Competition
| • | | Research. Our models are developed by a cross-functional research team of mathematicians, economists, statisticians, financial engineers and investment industry experts. Our index and risk and analytics research departments combine advanced academic credentials with broad financial and investment industry experience. They work on both developing new models and methodologies and enhancing existing ones. We monitor investment trends and their drivers globally; analyze product-specific needs in areas such as capitalization-weighted, factor and specialized indexes; and examine instrument valuation, risk modeling, portfolio construction, asset allocation and VaR simulation. An important way we monitor global investment trends and their implications for our business is through the forum provided by our Editorial Advisory Board (“EAB”). Our EAB, which was established in 1999, meets twice a year and is comprised of senior investment professionals from around the world and senior members of our performance and risk research team. In 2015, our index and portfolio and risk analytics researchers participated in numerous industry events and conferences, and their papers have been published in leading academic and industry journals. They also play a leading role in many of the seminars, workshops and webinars we host throughout the year, presenting and discussing their latest research findings with both existing and prospective clients. |
| • | | Data Operations and Information Technology. Our data operations and technology teams consist of a combination of operations and information technology specialists. We licensed a large volume and variety of market data for every major market in the world, including fundamental and return data, from more than 200 third-party sources in 2015. We apply our models and methodologies to this market data to produce our proprietary risk and index data. Our data operations team oversees this complex process. Our experienced information technology staff builds proprietary software and databases that house all of the data we license or produce in order for our data operations team to perform data quality checks and run our data production systems. Our software and data resides on servers, networks and databases engineered and managed by our IT Infrastructure team, and operated and monitored by our IT Operations team. This technology suite resides in our global data centers in Nevada, U.S. and Geneva, Switzerland. Our data factory produces our proprietary index data such as end-of-day and real time equity indexes, real estate benchmarks, and our proprietary risk data such as daily and monthly equity risk forecasts, real estate performance and risk reporting and MSCI ESG Research reports. We have data operations and technology offices in North America, Europe and Asia. |
| • | | Application Development. Certain of our proprietary risk data are made available to clients through our proprietary software applications, such as Barra Aegis, BarraOne, RiskManager, HedgePlatform, WealthBench, Credit Manager and ESG Manager. Our application development team consists of individuals with experience in both the finance and software industries. Our staff has an extensive skill set, including expertise in both the Java-based technologies used in our web-based, on-demand software application tool for multi-asset class risk analysis and reporting and Microsoft-based technologies used in our desktop equity and fixed income analytics software products. We also have extensive experience with database technologies, computational programming techniques, scalability and performance analysis and quality assurance. We use a customized code base and software
|
| development methodology that leverages best practices from the software industry, including agile programming, test-driven development, parallel tracking, iterative cycles, prototyping and beta releases. We build our software applications by compiling multiple components, which enables us to reuse designs and codes in multiple products. Our software development projects involve extensive collaboration with our product management team and directly with clients. We have application development offices in the U.S., Europe and Asia.
|
Competition
Many industry participants compete with us by offering one or more indexes in similar index products.categories. Such productsindexes vary widely in scope, including by geographic region, business sector and risk category.category and may be used by clients in a variety of ways in many different markets around the world. A number of these markets have become increasingly competitive in recent years. Our
Among our Index products compete with offerings from FTSE Russell, a subsidiary of The London Stock Exchange Group PLC;competitors are S&P Dow Jones Indices LLC (a joint venture company owned 27% by CME Group, Inc. and CME Group Services LLC and 73% by The McGraw-Hill Financial,S&P Global Inc.); and FTSE Russell, a subsidiary of the Center for Research in Securities Prices (CRSP); EDHEC-Risk Institute; DAX; STOXX Ltd.; BM&FBovespa; the Korea Stock Exchange; China Securities Index Co., Ltd.; the Hang Seng Index (a strategic partnership between CME Group, Inc. and Singapore Exchange Limited); Research Affiliates LLC; Morningstar, Inc.; Nikkei Inc.; Nomura Securities, Ltd.; the TokyoLondon Stock Exchange Inc.; Intercontinental Exchange, Inc.; Nasdaq, Inc.; and Solactive AG.Group PLC. 11
There is also growing competition amongfrom industry participants, including asset managers and investment banks, that create their own range of indexes, often in cooperation with index providers such as Solactive, which may, among other things, provide some form of calculation agent service. This is especially true for factor indexes, often referred to as “smart beta indexes.” Asset managers, such as WisdomTree and Goldman Sachs Asset Management, manage funds, or ETF indexesincluding ETFs, based on their own proprietary indexes;indexes, and many investment banks have launched structured products or entered into OTCcreated over-the-counter derivatives based on their own proprietary indexes. This is often referred to as self-indexing. Our Analytics productsofferings compete with offerings from a range of competitors, including Algorithmics (a unit of IBM), Axioma, Inc., BlackRock Solutions, Bloomberg Finance L.P., Capital IQ’s ClariFI (a Standard & Poor’s business),and FactSet Research Systems Inc., Imagine Software, KMV (a unit of Moody’s Corporation), Northfield Information Services, Inc., State Street Analytics, SunGard (a unit of FIS) and Wilshire Analytics. Additionally, manysome of the larger broker-dealers have developed proprietary analytics tools for their clients. Similarly, manysome of the large global investment institutions, particularly the larger global organizations, such as custodians, have developed their own internal risk management and performance analytics tools. tools that they offer to their clients. We also have a variety of competitors for our other productsofferings that comprise a smaller portion of our revenues. Intellectual Property and otherOther Proprietary Rights We consider many aspects of our products,offerings, processes and services to be proprietary. We have registered among others, “MSCI,” “Barra,” “RiskMetrics,” “RiskManager,” “InvestorForce,” and “IPD”among other marks, as trademarks or service marks in the United States and in certain foreign countries. We will continue to evaluate the registration of additional trademarks, service marks and copyrights as appropriate. From time to time, we also file patent applications to protect our proprietary rights. We currently hold 23 U.S. and foreign patents and have three U.S. patents pending. Additionally, many of our products,offerings, processes and services require the use of intellectual property obtained from third parties. It may be necessary in the future to seek or renew licenses relating to various aspects of our products, processesofferings and services. Although we believe the ownership of such patents, copyrights, trademarks, service marks, the implementation of certain measures to protect our intellectual property and proprietary rights and our ability to obtain the rights to use intellectual property of third parties are important to our business and contribute in part to our overall success, we do not believe we are dependent on any one of our intellectual property rights or any one license to use third-party intellectual property. For a description of the risks associated with legal protection of our intellectual property and other rights, infringement claims and the ability to obtain or renew licenses for third-party intellectual property, see Part I, Item 1A. “Risk Factors—Legal Protections for our intellectual property rights and other rights may not be sufficient or available to protect our competitive advantages. Third parties may infringe on our intellectual property rights, and third-party litigation may materially adversely affect our ability to protect our intellectual property rightsFactors” below. Company History
The following is a summary of the Company’s history since its inception:
MSCI TimelineEmployees
| | | | | 1969 | | • | | MSCI began as a pioneer in developing the market for global equity indexes. | | | | | | • | | We began licensing our first equity index products in 1969. | | | | 1998 | | • | | We were incorporated in 1998 and, until we became a public company in November 2007, our only two shareholders were Morgan Stanley and Capital Group International. | | | | 2004 | | • | | In June 2004, we acquired Barra, LLC (formerly Barra, Inc., “Barra”), a provider of portfolio risk analytics tools that launched its first risk analytics products in 1975. This broadened our product range beyond index products. | | | | 2007 | | • | | In November 2007, we completed our initial public offering. Simultaneously, we reclassified our outstanding common stock into class A and class B shares. | | | | 2008 | | • | | In April 2008, Capital Group International divested its ownership position. | | | | 2009 | | • | | In May 2009, Morgan Stanley divested its ownership position and we became a fully independent, stand-alone public company. | | | | 2010 | | • | | In June 2010, we acquired RiskMetrics Group, Inc. (“RiskMetrics”), a leading provider of risk management and governance products and services. In addition to this core product line, RiskMetrics owned Institutional Shareholder Services Inc. (“ISS”), a pioneer in the development of policy-based proxy voting recommendations. | | | | | | • | | RiskMetrics also owned the Center for Financial Research and Analysis (“CFRA”), Innovest Strategic Value Advisors, Inc. (“Innovest”) and KLD Research and Analytics (“KLD Research”). Innovest and KLD Research are now known as MSCI ESG Research Inc. (“MSCI ESG Research”). | | | | | | • | | In July 2010, we acquired Measurisk, LLC (“Measurisk”), a provider of risk transparency and risk measurement tools for hedge fund investors. With our clients demanding increasing levels of transparency from their hedge fund managers, this acquisition helped us develop a broad platform and set the standard for analyzing and reporting hedge fund risk. Measurisk’s products are now part of our hedge fund risk transparency offerings. | | | | 2012 | | • | | In November 2012, we acquired real estate performance measurement group IPD Group Limited (“IPD”). The acquisition of IPD expanded MSCI’s multi-asset class offerings by facilitating the integration of private real estate assets into our models, as well as adding a family of real estate indexes to MSCI’s suite of equity indexes. | | | | 2013 | | •
| | In January 2013, we acquired Investor Force Holdings, Inc. (“InvestorForce”), a leading provider of performance reporting tools to the institutional investment community in the U.S. The InvestorForce offering enables us to provide consultants with integrated, daily monitoring, analysis of and reporting on institutional assets. | | | | | | • | | In March 2013, we completed the sale of the CFRA product line. |
| | | | | 2014 | | • | | In April 2014, we completed the sale of ISS. | | | | | | • | | In August 2014, we acquired Governance Holdings Co. (“GMI Ratings”), a provider of corporate governance research and ratings to institutional investors, banks, insurers, auditors, regulators and corporations seeking to incorporate ESG factors into risk assessment and decision-making. This acquisition enhanced our existing platform of ESG research and tools, allowing us to deliver a more comprehensive suite of ESG products and services to our clients. | | | | 2015 | | • | | In October 2015, we acquired all of the assets of Insignis, Inc. (“Insignis”), a leading provider of daily automated collection, aggregation and management of financial data. We believe this acquisition will help us further automate the collection and integration of data across our risk and performance management platforms. |
For more information about our acquisitions and dispositions, see Note 3, “Dispositions and Discontinued Operations,” and Note 12, “Acquisitions,” of the Notes to Consolidated Financial Statements included herein.
Employees
We had 2,7543,112 and 2,9263,038 employees as of December 31, 20152018 and 2014,2017, respectively. As of December 31, 20152018 and 2014, 52.8%2017, 61.4% and 50.5%59.0% of our employees, respectively, were located in emerging market centers. As of December 31, 2018 our employees were based in 21 countries in order to maintain close contact with our clients and the international markets we follow. Government Regulation The Company is subject to reporting, disclosure and recordkeeping obligations pursuant to SEC requirements.requirements. Pursuant to the European Union’s benchmark regulation, the United Kingdom’s Financial Conduct Authority (“UK FCA”) authorized MSCI Limited (a subsidiary of MSCI Inc.) to be the benchmark administrator for all MSCI equity indexes on March 5, 2018. The Company is currently implementing the EU benchmark regulation for a limited set of the UK MSCI private real estate indexes. Information about index regulation is periodically updated on our website at https://www.msci.com/index-regulation. The contents of our website, including this webpage, are not, however, a part of or incorporated by reference in this Annual Report on Form 10-K. MSCI ESG Research is a registered investment adviser and must comply with the requirements of the Investment Advisers Act of 1940 (the “Advisers Act”) and related SEC regulations. Such requirements relate to, among other things, disclosure obligations, recordkeeping and reporting requirements, marketing restrictions and general anti-fraud prohibitions. It is possible that in addition to MSCI ESG Research and certain of its subsidiaries, other entities in our corporate family may be required to register as an investment adviser under the Advisers Act or comply with similar laws or requirements in states or foreign jurisdictions. We registered in 2012 with the State Council Information Office of the Ministry of Commerce and the State Administration for Industry and Commerce 12
in China as a foreign institution supplying financial information services in China. SeeThis license is currently administered by the Cyberspace Administration of China. For a description of the risks associated with government regulation, see Part I, Item 1A. “Risk Factors—Changes in government regulations, including the implementation of new or pending financial regulations, could materially adversely affect our business, financial condition or results of operations.”Factors” below. Executive Officers
Executive Officers of the Registrant Name | | Age | | Position | Henry A. Fernandez | | 5760 | | Chairman and Chief Executive Officer and President | Robert QutubC.D. Baer Pettit | | 54 | | President | Kathleen A. Winters | | 51 | | Chief Financial Officer and Treasurer | Laurent Seyer | | 54 | | Chief Operating Officer and Chief Client Officer | Scott A. Crum | | 5962 | | Chief Human Resources Officer | Richard J. Napolitano | | 49 | | Principal Accounting Officer and Global Controller | C.D. Baer Pettit | | 51 | | Chief Operating Officer | Laurent Seyer | | 51 | | Global Head of Client Coverage | Diana H. Tidd | | 46 | | Head of Index | Peter J. Zangari | | 48 | | Head of Analytics |
There are no family relationships between any of our executive officers and any director or other executive officer of the Company. Henry A. Fernandez Mr. Fernandez has served as the Chairman since October 2007 and as the Chief Executive Officer (“CEO”), President and a director since 1998. He also served as President from 1998 until October 2017. Before leading MSCI’s transition to becoming a fully independent, standalone public company in 2009, he was a Managing Director at Morgan Stanley, where he worked in emerging markets product strategy, equity derivative sales and trading, mergers and acquisitions, worldwide corporate finance and mortgage finance for U.S. financial institutions. Mr. Fernandez worked for Morgan Stanley from 1983 to 1991 and from 1994 to 2009. Mr. Fernandez also serves on the boards of Georgetowndirectors/trustees of Stanford University, the Hoover Institution at StanfordKing Abdullah University of Science and Technology, Memorial Sloan-Kettering Cancer Center, the Foreign Policy Association, Memorial Sloan-Kettering Cancer Center,and Catholic Charities of the Archdiocese of New York and the American Nicaraguan Foundation.York. Mr. Fernandez is the former Chair of the Advisory Council of the Stanford University Graduate School of Business. He holds a Bachelor of Arts in economics from Georgetown University, an M.B.A. from the Stanford University Graduate School of Business and pursued doctoral studies in economics at Princeton University.
Robert QutubC.D. Baer Pettit
Mr. QutubPettit has served as the Company's President since October 2017. As President, Mr. Pettit oversees the Company's business functions, including client coverage, marketing, product management, research and product development, technology and operations. He previously served as Chief Operating Officer from 2015 to 2017, Head of the Product Group from February 2015 to September 2015, Head of Index Products from 2011 to 2015, Head of Marketing from 2005 to 2012 and Head of Client Coverage from 2001 to 2012. Prior to joining the Company, Mr. Pettit worked for Bloomberg L.P. from 1992 to 1999. Mr. Pettit holds a Master of Arts degree in history from Cambridge University and a Master of Science degree from the School of Foreign Service at Georgetown University. Kathleen A. Winters Ms. Winters has served as the Chief Financial Officer (the “CFO”)and Treasurer since August 2012.May 2016. Prior to joining MSCI, Ms. Winters served as the Vice President and Chief Financial Officer of Performance Materials and Technologies, an operating segment of Honeywell International, Inc. (“Honeywell”) from 2012 to 2016. She served in various positions of increasing responsibility at Honeywell from 2002 to 2016, including Vice President, Corporate Controller and Chief Accounting Officer, Vice President of Business Analysis and Planning, and Chief Financial Officer of the Specialty Products business group. Ms. Winters began her career at PricewaterhouseCoopers LLP (“PwC”) where she served in various positions from 1989 to 2001 within the Technology Information Communications and Entertainment practice. She earned her Bachelor of Science degree in Accounting from Boston College. 13
Laurent Seyer Mr. QutubSeyer has served as the Company's Chief Operating Officer since October 2017 and Chief Client Officer since 2016. As Chief Operating Officer and Chief Client Officer, Mr. Seyer manages the Company's sales, marketing, client relationship management and client service teams globally. He previously served as the Global Head of Client Coverage from 2014 to 2016. Prior to joining the Company, Mr. Seyer worked for Bank of America from 1994 to 2012AXA Investment Managers in several senior finance positions,Paris, most recently as Global Head of the CFO of Consumer and Business Banking. During his career at Bank of America, Mr. Qutub also served as the CFO of other major segments, including Global Banking and Markets and Global Wealth Investment Management.Client Group. Prior to joining Bankthat, he spent 24 years at Societe Generale in a number of America,leadership positions, including as CEO of Lyxor Asset Management. Mr. Seyer graduated from Institut d'Etudes Politiques of Paris, where he was a Manager in the Financial Services Group for PricewaterhouseCoopers LLP from 1988 to 1994. Mr. Qutub served in the U.S. Marine Corps on active duty from 1981 to 1984. Since June 2014, Mr. Qutub has been a member of the board of directorsstudied law and finance and audit committee of the USAA Federal Savings Bank. Mr. Qutub earned a Bachelor of Science in accounting from the University of North Carolina—Charlotte. He is also a member of the American Institute of Certified Public Accountants. As previously announced, Mr. Qutub will retire from MSCI on the earlier of May 6, 2016 and the effective date of the appointment of his successor.economics. Scott A. Crum Mr. Crum has served as the Chief Human Resources Officer since April 2014. Prior to joining MSCI, Mr. Crum served as Headglobal head of Global Human Resourceshuman resources for four publicly traded companies. Mr. Crum worked for Avon Products, Inc. as Senior Vice President of Human Resources and Chief People Officer from September 2012 to May 2013. From July 2010 to June 2012, Mr. Crum served as Senior Vice President and Chief People Officer of Motorola Mobility Holdings, Inc., one of two publicly traded companies formally created when Motorola Inc. split in January 2011.2011 until it was acquired by Google. Prior to that, he served as the Senior Vice President and Director of Human Resources of ITT Corporation from September 2002 to July 2010 and HeadSenior Vice President of Administration and Employee RelationsResources at General Instruments Corp. from 1997 to 2000. Mr. Crum holds a Bachelor of Business Administration with a concentration in industrial relations from Southern Methodist University. Richard J. Napolitano
Mr. Napolitano has served as the Principal Accounting Officer since February 2014 and Global Controller since June 2011. Prior to joining MSCI, Mr. Napolitano worked at Morgan Stanley from 2005 to 2011, J.P. Morgan Chase from 1996 to 2005 and Ernst & Young from 1988 to 1996. At these firms, he held various positions including, among others, Business Unit or Product Chief Financial Officer or Controller, Head of External Reporting and Accounting Policies and Audit Senior Manager. Mr. Napolitano earned his Bachelor of Science in accounting and an M.B.A. in finance from the Leonard N. Stern School of Business at New York University. He is also a member of the American Institute of Certified Public Accountants.
C.D. Baer Pettit
Mr. Pettit has served as the Chief Operating Officer since September 2015. As such, Mr. Pettit oversees the firm’s operations, technology and product lines and reports directly to the Chief Executive Officer. Before taking on his current role, Mr. Pettit served as Head of the Product Group from February 2015 to September 2015, Head of Client Coverage from 2001 to August 2012, Head of Marketing from 2005 to August 2012 and Head of Index Products from September 2011 to September 2015. Prior to joining MSCI, Mr. Pettit worked for Bloomberg L.P. from 1992 to 1999, most recently as Deputy Head of European Sales. He holds a Master of Arts degree in history from Cambridge University and a Master of Science degree from the School of Foreign Service at Georgetown University.
Laurent Seyer
Mr. Seyer has served as the Global Head of Client Coverage since December 2014. Prior to joining MSCI, Mr. Seyer worked for AXA Investment Managers LLC in Paris, most recently as Global Head of the Client Group. Prior to that, he spent 24 years atSociete Generale in a number of leadership positions, including as CEO of Lyxor Asset Management from 2006 to 2012, and held senior roles in equity derivatives and structured product sales, mergers and acquisitions, corporate finance, and corporate development and business strategy. Mr. Seyer graduated from Institut d’Etudes Politiques, where he studied law and economics.
Diana H. Tidd
Ms. Tidd has served as the Head of Index since February 2016 when her role was expanded from Head of Equity Index Products, a role she had held since October 2015. In such capacity, she is responsible for all aspects of product management and business strategy for the MSCI indexes. During her tenure at MSCI, Ms. Tidd has served in a variety of roles, including Head of Americas Client Coverage for six years. Prior to joining MSCI in 1999, Ms. Tidd worked at Brown Brothers Harriman & Co. in Boston for five years where she had roles in the Risk and Europe teams, before becoming Head of the Asia Team in the global custody division. She started her career in the Trust and Estates division of the Private Bank at Bankers Trust Co. Ms. Tidd serves on the board of Women in ETFs, as well as WAVE, West Africa Village Education. Ms. Tidd graduated with a Bachelor of Arts degree in Political Science from Colgate University and received a Master’s Degree in Latin American Studies from Stanford University.
Peter J. Zangari
Mr. Zangari has served as the Head of Analytics since February 2015, which includes the formerly separately managed risk management analytics product line and portfolio management analytics product line, the latter of which Mr. Zangari had served as the Head of since August 2011. Prior to joining MSCI, Mr. Zangari held progressively senior-level positions at Goldman Sachs since 1998, most recently as the Head of Risk and a member of the leadership team for the Quantitative Investment Strategies (“QIS”) business of Goldman Sachs Asset Management (“GSAM”). Prior to joining QIS, Mr. Zangari was responsible for building out and managing GSAM’s proprietary equity risk and attribution platform. Mr. Zangari has a Bachelor of Arts degree in economics from Fordham University and a PhD in economics, with a specialization in applied econometrics and computational statistics, from Rutgers University.
Available Information Our corporate headquarters areis located at 7 World Trade Center, 250 Greenwich Street, 49th Floor, New York, New York, 10007, and our telephone number is (212) 804-3900. We maintain a website on the Internetinternet atwww.msci.com. www.msci.com. The contents of our website are not a part of or incorporated by reference in this Annual Report on Form 10-K. We file annual, quarterly and current reports, proxy statements and other information with the SEC. You may read and copy any materials we file with the SEC at the SEC’s Public Reference Room at 100 F Street, N.E., Washington, D.C. 20549. You may obtain information about the operation of the Public Reference Room by calling the SEC at 1-800-SEC-0330. The SEC maintains an Interneta website that contains reports, proxy and information statements and other information that we file electronically with the SEC atwww.sec.gov. www.sec.gov. We also make available free of charge, on or through our website, these reports, proxy statements and other information as soon as reasonably practicable following the time they are electronically filed with or furnished to the SEC. To access these, click on the “SEC Filings” link found on our Investor Relations homepage (http://ir.msci.com). We also use our Investor Relations homepage and corporate Twitter account (@MSCI_Inc) as channels of distribution of Company information. The information we post through these channels may be deemed material. Accordingly, investors should monitor these channels, in addition to following our press releases, SEC filings and public conference calls and webcasts. In addition, you may automatically receive email alerts and other information about us when you enroll your email address by visiting the “Email Alert Subscription” section of our Investor Relations homepage athttp://ir.msci.com/alerts.cfm?.alerts.cfm. The contents of our website, including our Investor Relations homepage, and social media channels are not, however, a part of or incorporated by reference in this Annual Report on Form 10-K. Item 1A. Risk Factors
You should carefully consider the following risks and all of the other information set forth in this Annual Report on Form 10-K. If any of the following risks actually occurs, our business, financial condition or results of operations could be materially and adversely affected. You should read the section titled “Forward-Looking Statements” on page 1 for a description of the types of statements that are considered forward-looking statements, as well as the significance of such statements in the context of this Annual Report on Form 10-K. 14
Risks Related to Our Business If we loseWe are dependent on third parties to supply data and software for our products and are dependent on certain vendors to distribute our data. A refusal by a key vendor to distribute our data or any loss of key outside suppliers of data andor software products or ifreduction in the accuracy or quality of such data or products or any failure by us to comply with our vendors’ licensing requirements could impair our ability to provide our clients with the data, products or services they desire, which could have a material adverse effect on our business, financial condition or results of theseoperations.
We rely on the accuracy and quality of third-party data and software products and depend on the ability and willingness of third-party data and software providers to deliver and support reliable products, enhance their current products, develop new products on a timely and cost-effective basis, and respond to emerging industry standards and other technological changes to produce and deliver our products, provide services and develop new products and services. Additionally, we rely on certain third-party vendors to distribute our data to clients. While some of our vendors generate revenue in connection with distributing our data, others do not derive a direct financial benefit. Should any of our key vendors refuse to distribute our data for any reason, we would need to find alternative ways to distribute our data, which may have a material adverse effect on our business, financial condition or results of operations. If the data and software products from our suppliers have errors, are delayed, have design defects, become incompatible with future versions of our products, are unavailable on acceptable terms or are delayed,not available at all, we may not be able to provide our clients with the information and products they desire. Our ability to producedeliver our products and develop new products is dependent upon the products of other suppliers, including certain data, softwareservices and service suppliers. Our Index, Analytics, Real Estate, and ESG products are dependent upon and of little value without updates from our data suppliers. Similarly, most of our software products are dependent upon and of little value without continuing access to historical and current data. Throughout our businesses, we utilize certain data provided by third party data sources in a variety of ways, including large volumes of data from certain stock exchanges around the world. As of December 31, 2015, there were over 200 such data suppliers. If the data from our suppliers has errors, is delayed, has design defects, is unavailable on acceptable terms or is not available at all, our business, financial condition or results of operations could be materially adversely affected. As of December 31, 2018, we relied on the data of over 200 suppliers, including large volumes of data from certain stock exchanges around the world.
Many of our data and software suppliers compete with one another and, in some cases, with us. For example, Standard & Poor’s competes with us in index products, supplies index data that we distribute in our portfolio analytics software products and jointly developed and maintains GICS and GICS Direct with us. Some of our agreements with data suppliers allow them to cancel on short notice and we have not completed formal agreements with all of our data suppliers, such as certain stock exchanges. From time to time we receive notices from data suppliers, including stock exchanges, threatening to terminate the provision of their data to us, and some data suppliers, including at least one stock exchange, have terminated the provision of their data to us. Termination of the provision of data by one or more of our significant data suppliers or exclusion from, or restricted use of, or litigation in connection with a data provider’s information could decrease the information available for us to use (and offer our clients) and may have a material adverse effect on our business, financial condition or results of operations. Although data suppliers and stock exchanges typically benefit from providing broad access to their data, some of our competitors could enter into exclusive contracts with our data suppliers, including with certain stock exchanges. If our competitors enter into such exclusive contracts, we may be precluded from receiving certain data from these suppliers or restricted in our use of such data, which would give our competitors a competitive advantage. Such exclusive contracts could hinder our ability to provide our clients with the data they prefer, which could lead to a decrease in our client base and could have a material adverse effect on our business, financial condition or results of operations. SomeWe also monitor our use of third-party data suppliers have sought and otherssoftware products to comply with applicable licensing requirements. Despite our efforts, our use of certain third-party data and software products has been challenged in the past and there can be no assurance that such third parties may seeknot challenge our use in the future, resulting in increased data acquisition or software costs, loss of rights and/or costly legal actions. Our business could be materially adversely affected if we are unable to timely or effectively replace the functionality provided by data or software that becomes unavailable or fails to operate effectively for any reason. Our operating costs could increase licensingif license fees for providing their contentthird-party data or software products increase or the efforts to us. Ifincorporate enhancements to third-party or other data or software are substantial and we are unable to negotiate acceptable licensing arrangements with these data suppliers or find alternative
sources of equivalent content, we may be required to reducedata or software products. If any of these risks materialize, they could have a material adverse effect on our profit marginsbusiness, financial condition or experience a reduction in our market share.results of operations. 15
Our clients that pay us a fee based on the assets of an index-linked investment product may seek to negotiate a lower asset-based fee percentage or lower the total expense ratio of such products or may cease using our indexes, which could limit the growth of or decrease our revenues from asset-based fees. A portion of our revenues are from asset-based fees and these revenue streams are concentrated in some of our largest clients, including BlackRock, Inc. and its affiliates (“BlackRock”), and in our largest market, the U.S. Our clients, including our largest clients, may seek to negotiate a lower asset-based fee percentage for a variety of reasons. As the assets of index-linked investment products, including ETFs, mutual funds and institutional accounts, managed by our clients change, they may request to pay us lower asset-based fee percentages.percentages, which are sometimes calculated as a percentage of the relevant product’s total expense ratio (“TER”). Additionally, competition is intense and increasing rapidly among our clients that provide exchange traded funds (“ETFs”), among other products.index-linked investment products, including ETFs. The fees ETF providers of index-linked investment products charge their clients are one of the competitive differentiators for these ETF managers.managers with some providers seeking to win or retain business by charging their clients lower fees. As noted above, in many cases our fees can be affected by an increase or decrease in an investment product’s TER. A reduction in the TER or an elimination of TER may negatively impact our revenues. Additionally, our clients, including our largest clients, may seek to lower or eliminate AUM floors (i.e., minimum asset-based fee percentages) or impose or lower AUM ceilings (i.e., maximum asset-based fee percentages). Such changes in our fee structure could individually, or in the aggregate, negatively impact our revenues. Moreover, clients that have licensed our indexes to serve as the basis of index-linked investment products are generally not required to continue to use our indexes and could elect to cease offering the product or could change the indexswitch to a non-MSCI index, andlower fee index. For example, at least one large client has ceased using MSCI indexes as the basis for a significant number of its index fundsfunds. Additionally, clients that license our indexes to serve as the basis for listed futures and options contracts might discontinue such contracts. We have a differentiated licensing strategy for our indexes and from time to time experience faster growth in lower fee product areas, resulting in a lower average asset-based fee percentage for licensing our indexes. While we look to maximize the price and volume trade-off over the long-term, there can be no assurance that we will be able to do so in the past.future. Results for any given quarter could be materially adversely affected by stronger growth in AUM in index-linked investment products with lower than average product fees not sufficiently offset by growth in AUM in index-linked investment products in higher than average product fees. In suchthe instances described above, our asset-based fees could dramatically decrease, which could have a material adverse effect on our business, financial condition or results of operations. The ability of our licensees to cease using our indexes is generally true not just with respect to an index’s use as the basis of an ETF but also with respect to its use as the basis of other financial products, including mutual funds and institutional funds. Finally, to the extent that an asset manager finds it beneficial to offer clients ETFs and institutional fundsmultiple kinds of index-linked investment products based on the same indexes, a shift away from use of an index as the basis of one type of product may lead to a corresponding shift away from the use of the same index as the basis of the otheranother type of product. If we are required to offer clients materially lower asset-based fee percentages with respect to index-linked investment products that generate fees based on the assets of such products or our largest clients cease to use our indexes, our revenues could be negatively impacted, which could have a material adverse effect on our business, financial condition or results of operations. Our revenues attributable to asset-based feesbusiness may be affected by changes in the capital markets, particularly the equity capital markets. A decreasemarkets, and is dependent on our clients’ continued investment in our revenuesequity securities as well as the measurement of the performance of their equity investment against equity benchmarks. If investment in equity markets declines, revenue attributable to theseour clients’ use of our indexes or Analytics products could decrease which could have a material adverse effect on our business, financial condition or results of operations. ClientsA significant portion of our revenues comes from our products that useare focused on various aspects of managing or monitoring equity portfolios. Our equity indexes serve as equity benchmarks against which our indexesclients can measure the performance of their investments and are also used by clients as the basis for certain index-linked investment products, such as ETFs and mutual funds, commonly pay usfor a fee based on the value of the investment product’s assets. The value of an investment product’s assets may increase or decrease in response to changes in market performance and cash inflows and outflows, which could impact our revenues. In addition, in many cases our fees canFor example, cash inflows into an ETF may be affectedoffset by an increase or decrease in a product provider’s total expense ratio (“TER”). In those cases, a reductiondecline in the TER may negatively impact our revenues.performance of the ETF and vice versa. Asset-based fees make up a significant portion of our revenues. They accounted for 18.4%23.5% and 17.8%21.7% of revenues for the fiscal years ended December 31, 20152018 and 2014,2017, respectively. These asset-based fees accounted
16
for 48.3%56.1% and 47.6%55.5% of the total revenues from our ten largest clients for the fiscal years ended December 31, 20152018 and 2014,2017, respectively. Our Analytics segment offers performance attribution and portfolio management content, applications and services that provide clients with an integrated view of risk and return of their equity portfolios. Additionally, equity models developed in our Analytics segment are used to construct MSCI Factor Indexes. A move away from equity investing could decrease demand for such products. Volatile capital markets, which may impact whether investors choose to invest in developed or emerging markets, or in the U.S. or non-U.S. markets, as well as changing investment styles, among other factors, may influence an investor’s decision to invest in and maintain an investment in an index-linked investment product.product or lead clients to significantly deemphasize equity securities in their investment strategies, which could have a material adverse effect on our business, financial condition or results of operations. If clients decide to measure performance on an absolute return basis instead of against an equity benchmark, the demand for our equity indexes could decrease. While we offer products and services to both active and passive investment managers, an economic trend that significantly favors active investment could lead to decreased demand for index-linked investment products or equity based investment strategies, which could decrease our revenues. Accordingly, the value of assets linked to ETFsin index-linked investment products can fluctuate significantly over short periods of time.time and such volatility may be further impacted by fluctuations in foreign currency exchange rates. If we are unable to offset the impact of decreased revenues associated with our indexes and Analytics products, including by managing our operating costs, our profitability could be materially adversely affected. See “—Our growth and profitability may not continue at the same rate as we have experienced in the past for several reasons, including if our operating costs are higher than expected, which could have a material adverse effect on our business, financial condition andor results of operations may be negatively impacted to the extent that our current and potential future clients are affected by adverse changes in the financial markets” below. Our business relies heavily on electronic delivery systems, the Internet andAny resulting failures, disruptions or instability of our information technology platform, electronic delivery systems, or the internet, including a cybersecurity breach or cyberattack, may result in reputational harm and any failures, disruptionshave a material adverse effect on our business, financial condition or instability may materially adversely affect our ability to serve our clients.results of operations.
We depend heavily on the capacity, reliability and security of our information technology platform, electronic delivery systems and itstheir components, including our data centers, and the Internet.internet to seamlessly provide clients with products and customer service. Heavy use of our electronic delivery systems and other factors such as loss of service from third parties, operational failures, sabotage, break-ins and similar disruptions from unauthorized tamperingchanges (tampering, intrusions or hacking,hacking), human error, cyber-terrorism,cyberterrorism, cybercrime, ransomware, terrorist attacks affecting sites where we are located, natural disasters, power loss, telecommunications failures, technical breakdowns, internet failures or computer viruses could impair our systems’ operations or interrupt their availability for extended periods of time. Our ability to effectively use the Internetinternet may also be impaired due to infrastructure failures, service outages at third-party Internetinternet providers or increased government regulation. If disruptions, failures or slowdowns occur with respect to our electronic delivery systems, the Internet oroperations, including to our information technology platform, our electronic delivery systems or the internet, our reputation and our ability to distribute our products effectively and to serve our clients, including those clients for whom we provide managed services or to whom we distribute index and constituent data on a real time basis that is used to manage funds that replicate MSCI indexes, may be materially adversely affected. For example, we have in recent years experienced denial-of-service attacks. While we have been able to defend our systems against such disruptions and attacks in the past, there is no assurance that we will be able to do so successfully in the future. Wefuture or that our disaster recovery or business continuity plans will be effective in mitigating the risks and costs associated with the particular event that has occurred. While we have also experienced unanticipated interruption and delaycontinue to invest in risk management and information security measures, including employee training, disaster recovery and business continuity plans, the performancetotal cost of ongoing development and deliveryimplementation may increase over time given enhanced government and regulatory scrutiny of certainthe measures taken by companies to protect against cybersecurity breaches. Although we currently estimate that the total cost of ongoing development and implementation of our products afterdisaster recovery and business continuity plans will not have a material impact on our business, financial condition or results of operations, we migrated certaincannot provide any assurance that our estimates regarding the timing and cost of our applications and infrastructure to new data centers and may experience such interruptions and delays in the future with respectimplementing these plans will be accurate. Any material breaches of cybersecurity or third-party reports of perceived security vulnerability to the migrations within existing data centersCompany’s systems, even if no breach has occurred, could cause the Company to suffer reputational harm, loss of 17
customers and revenue, regulatory actions and scrutiny, litigation or financial losses that are either not insured against or not fully covered through any insurance maintained by the Company. Any of the foregoing could lead to new data centers. In response to such issues, we have in the pastunexpected or higher than estimated costs and could again be required to provide service credits. We could also experience cancellations and reduced demand for our products and services, resulting in decreased revenues. We may also incur increased operating expenses to repair, replace or remediate systems, equipment or facilities, and to protect ourselves from and defend against such disruptions and attacks. Accordingly, any significant failures, disruptions or instability affecting our information technology platform, electronic delivery systems or the Internet may have a material adverse effect on our business, financial condition or results of operations and our insurance may not be adequate to compensate us for all losses, failures, or breaches. operations. See “—Any failure to ensure and protect the confidentiality of client data could adversely affect our brand and reputation and have a material adverse effect on our business, financial condition or results of operations” below. Any failure to ensure and protect the confidentiality of data could adversely affect our brand and reputation and have a material adverse effect on our business, financial condition or results of operations. Many of our products provide for the exchange of sensitive information with our clients through a variety of media, such as the Internet, softwareinternet, applications and dedicated transmission lines. We rely on a complex system of internal processes and software controls along with policies, procedures and training to protect client data that we receive in the ordinary course of business, including sensitive and confidential client data such as material non-public information and client portfolio data that may be provided to us or hosted on our systems, against unauthorized data access or disclosure. The Company may also be exposed to more targeted cyberattacks aimed at accessing certain information on our systems because of our prominence in the global marketplace, including client data, our ESG ratings of corporate issuers and the composition of our indexes. As a result of increased cyber threats and cybersecurity and privacy regulations, clients have increasingly requested additional security measures on the products we provide and details about our internal processes and software controls, policies and procedures related to security, processing integrity and confidentiality or privacy. Such requests may increase our cost of implementation and expose us to additional cybersecurity risks. If we fail to maintain the adequacy of our internal controls, including any failure to implement required new or improved controls, or if we experience difficulties in the implementation of our internal controls, policies or procedures or additional security measures requested by clients, if we experience cyberattacks that lead to a security or data privacy breach or if an employee purposely circumvents or violates our internal controls, policies or procedures, then unauthorized access to, or disclosure or misappropriation of, client data could occur. Additionally, while we believe our internal controls, policies and procedures are currently adequate in protecting the confidentiality of data, breaches of confidentiality may still occur as a result of human error, particularly in connection with a more manual process for processing such data. Such breaches, unauthorized access, disclosure or misappropriation may result in claims against us by our clients or regulatory inquiry or censure, which could, individually or in the aggregate, damage our brand and reputation and/or have a material adverse effect on our business, financial condition or results of operations. If a failure of our internal controls, policies or procedures or a cyberattack results in a security or data privacy breach, we could also incur increased operating expenses to remediate the problems caused by the breach and prevent future breaches, which could have a material adverse effect on our business, financial condition or results of operations. See “—Changes in government regulations, including the implementation of new or pending financial or operational regulations or the repeal of existing financial or operational regulations, could materially adversely affect our business, financial condition or results of operations—Data Privacy Legislationoperations” below. Migration of our applications and infrastructure to new technologies, data centers and software could result in unanticipated interruption and delay in the performance and delivery of our products which could impair our ability to provide clients with products and customer service. Such impairment may have a material adverse effect on our financial condition or results of operations. We have experienced unanticipated interruption and delay in the performance and delivery of certain of our products after we migrated certain of our applications and infrastructure to new data centers. While we have taken steps to mitigate such interruptions and delays, we cannot provide assurance that they will not occur again in the future even after extensive testing of new software and hardware. We could also experience cancellations and reduced demand for our products and services due to such interruptions and delays, which may result in decreased revenues. We may also experience unanticipated interruption and delay in the performance and delivery of certain of our products after adopting new technologies and software, including cloud computing, virtualization and Agile software development, in place of more traditional methods of development and support. We may also incur increased operating expenses to recover data, repair, replace or remediate systems, equipment or facilities, and to protect ourselves from and defend against such disruptions and attacks. Accordingly, any significant failures, disruptions or instability affecting our information technology platform, electronic delivery systems or the internet 18
may have a material adverse effect on our financial condition or results of operations and our insurance may not be adequate to compensate us for all losses, failures, or breaches. We have confidentiality and conflict of interest policies in place regarding changes to theindex composition of our indexesdecisions and have implemented information barrier procedures to protect the confidentiality of theany material, non-public information regarding changes to and the integrity of our equity indexes. If our confidentiality policies, conflict of interest policies or information barrier procedures fail, our reputation could be damaged and our business, financial condition or results of operations could be materially adversely affected.affected We change the composition of our indexes from time to time. We believe that, in some cases, the changes we make to our equity indexes can affect the prices of constituent securities as well as products based on our indexes. Our index clients rely on us to keep confidential material non-public information about changes to the future composition of an index and to protect against the misuse of that information until the change to the composition of the index is disclosed to clients. We have confidentiality policies in place and have implemented information barrier procedures to limit access to this information and to prevent the unauthorized disclosure and misuse of information regarding material non-public changes relating to the composition of our equity indexes. These policies are designed to limit dissemination of information not only between MSCI and the rest of the world, but also within MSCI. We have conflict of interest policies in place to ensure that employees act with integrity, including not putting their own personal interests or financial gain above the interests of the Company and our clients. If our confidentiality policies, conflict of interest policies or information barrier procedures fail or we are delayed in implementing such procedures as necessary with respect to a newly acquired business and an employee inadvertently discloses, or deliberately misuses material non-public information about a changerelated to one of our indexes in violation of such policies, our reputation may suffer. Clients’ loss of trust and confidence in our confidentiality policies, conflict of interest policies or information barrier policies and procedures could lead to a negativenegatively impact our brand or reputation throughout the investment community, which could have a material adverse effect on our business, financial condition or results of operations. In addition, certainCertain exchanges permit our clients to list ETFs or other financialindex-linked investment products based on our equity indexes only if we provide a representation to the exchange that we have reasonable information barrier procedures in place designed to address the unauthorized disclosure and misuse of material non-public information about changesrelated to the composition of our equity indexes. If an exchange determines that our information barrier procedures are not sufficient, the exchange might refuse to list or might delist investment products based on our equity indexes, which may have a material adverse effect on our business, financial condition or results of operations.
IncreasedRapidly increasing competition and financial and budgetary pressures affecting clients in our industry may cause price reductions or loss of market share, which may materially adversely affect our business, financial condition or results of operations.
We face rapidly increasing competition across all markets for our products.products and services. Our competitors range in size from large companies with substantial resources to small, single-product businesses that are highly specialized. Our larger competitors may have access to more resources and may be able to achieve greater economies of scale, and our specialized competitors that are focused on a narrower product line may be more effective in devoting technical, marketing and financial resources to compete with us with respect to a particular product. LargerSome competitors may offer price incentives or different pricing structures that are more attractive to clients to expand their market share, and may also consolidate with one another or form joint ventures or other business arrangements, which could allow for a narrower pool of competitors that are better capitalized or that are able to gain a competitive advantage through synergies resulting from an expanded suite of products and services. In addition, barriers to entry may be low in many of the markets for our products and services, including for single-purpose product companies. Low barriers to entry could lead to the emergence of new competitors. For example, more broker-dealers and data suppliers could begin developing their own proprietary risk analytics or indexes. Recent developments, including increases in the availability of free or relatively inexpensive information, advances in public cloud computing and the increase in open source code, as well as proprietary software in specific areas, such as pricing, high volume computing, orchestration layers for services, and visualization, have increasingly 19
allowed free or relatively inexpensive access to information sources, which has reduced barriers to entry even further. Low barriers to entry could lead to the emergence of new competitors; for example, more broker-dealers and data suppliers could begin developing their own proprietary risk analytics or indexes. See “—Increased accessibility to free or relatively inexpensive information sources may reduce demand for our products and materially adversely affect our business, financial condition or results of operations” below. Financial and budgetary pressures affecting our clients, including those resulting from weak or volatile economic conditions, may lead certain clients to reduce their overall spending on our products or services, including by seeking similar products or services at a lower cost than what we are able to provide, by consolidating their spending with fewer providers, by consolidating with other clients or by self-sourcing certain of their informational needs. Accordingly, competitive and market pressures may result in fewer clients, fewer subscriptions or investment product licenses, including as a result of client closures and consolidations, price reductions, prolonged selling and renewal cycles, and increased operating costs, such as for marketing and product development, which could, individually or in the aggregate, result in lower revenue, gross margins and operating income.a material adverse effect on our business, financial condition or results of operations. See “—Our clients that pay us a fee based on the assets of an index-linked investment product may seek to negotiate a lower asset-based fee percentage or lower the total expense ratio of such products or may cease using our indexes, which could limit the growth of or decrease our revenues from asset-based fees” above and Part I, Item 1. “Business—Our Competition” above. To remain competitive and generate customer demand, we must successfully develop new and enhanced products and product enhancementsservices and effectively manage transitions and product integrations. Failure to do so could limit our ability to maintain or grow current revenues, which could have a material adverse effect on our business, financial condition or results of operations. We operate in an industry that is characterized by rapid technological change and evolving industry standards. Due to the highly volatile and competitive nature of this industry and the impact of technological change on our products and services, we must continually introduce new products and services, enhance existing products and services, including through integration of products and services within MSCI and with third-party platforms, existing products and services, and effectively generate customer demand for new and upgraded products and services. If, among other things, we fail to accurately predictanticipate or respond or adapt to evolving technologies and changing industry standards, if we fail to anticipate and meet the needs of our clients through the successful development of new products and services, if our new products and services are not attractive to our clients or cannot be integrated with third-party platforms, if our new products do not perform as well as anticipated, if we misprice our new products and services, if the launch of new products and offering of new services is not timely, or if competitors in any business line introduce products, services, systems and processes that are more competitive than ours or that gain greater market acceptance, we could lose market share and clients to our competitors which could materially adversely affect our business, financial condition or results of operations. We must make long-term investments and commit significant resources before knowing whether these investments will eventually result in products and services that satisfy our clients’ needs and generate revenues required to provide the desired results. For example, we have made, and need to continue to make, investments in our technology platform in order to provide competitive products and services to our clients. From time to time, we also incur costs to integrate existing products and platformsservices and transition clients to enhanced products and services, which also present execution risks and challenges. If we are unable to effectively manage transitions to new or enhanced products and services, our business, financial condition or results of operations could be materially adversely affected. See “—If our products contain undetected errors or fail to perform properly due to defects, malfunctions or similar problems, itwe may, among other things, become subject to increased costs or liability based on the use of our products or services to support our clients’ investment processes, which could have a material adverse effect on our business, financial condition or results of operations” below. If we are unable to manage our operating costs as anticipated or our operating costs are higher than expected, our operating results may fluctuate significantly.
We may experience higher than expected operating costs, including increased personnel costs, occupancy costs, selling and marketing costs, investments in geographic expansion, communication costs, travel costs, software development costs, professional fees, costs related to information technology infrastructure and other costs. If operating costs exceed our expectations and cannot be adjusted accordingly, our anticipated profitability may be reduced and our anticipated results of operations and financial position may be materially adversely affected.
A limited number of clients account for a material portion of our revenue. Cancellation of subscriptions or investment product licenses by any of these clients could have a material adverse effect on our business, financial condition or results of operations. For the fiscal years endedAs of December 31, 20152018 and 2014,2017, revenues from our ten largest clients accounted for 26.0%28.6% and 25.8%27.8% of our total revenues, respectively. Our revenue growth depends on our ability to obtain new clients and achieve and sustain a high level of renewal rates with respect to our existing subscription base.base and our investment product licenses. Failure ofto achieve one or more of these subscription objectives could have a material adverse effect on our business,
20
financial condition and operating results. For the fiscal year ended December 31, 2015,2018, our largest client organization by revenue, BlackRock, accounted for 10.3%11.9% of our total revenues. For the fiscal years ended December 31, 20152018 and 2014, 93.0%2017, 95.8% and 92.1%95.3%, respectively, of the revenue from BlackRock came from fees based on the assets in BlackRock’s ETFs that are based on our indexes. A contract with BlackRock from which we derive a material portion of our revenues has a term which ends in March 2020 with auto-renewal for successive one-year periods unless either party provides advanced written notice of termination. If one or more of our largest clients cancels or reduces its subscriptions or investment product licenses and we are unsuccessful in replacing those subscriptions or licenses, our business, financial condition or results of operations could be materially adversely affected. See also “—Our clients that pay us a fee based on the assets of an index-linked investment product may seek to negotiatea lower asset-based fee percentage or lower the total expense ratio of such products or may cease using our indexes, which could limit the growth of or decrease our revenues from asset-based fees” above. Our growth and profitability may not continue at the same rate as we have experienced in the past for several reasons, including if our operating costs are higher than expected, which could have a material adverse effect on our business, financial condition or results of operations. We have experienced significant growth since we began operations. There can be no assurance that we will be able to maintain the levels of growth and profitability that we have experienced in the past. AmongIf we experience higher than expected operating costs, including increased personnel costs, regulatory compliance costs, occupancy costs, selling and marketing costs, investments in geographic expansion, communication costs, travel costs, application development costs, professional fees, costs related to information technology infrastructure and other things,costs, and we cannot adjust to these costs, our operating results may fluctuate significantly or our anticipated profitability may be reduced and our anticipated results of operations and financial position may be materially adversely affected. Additionally, there can be no assurance that we will be as successful in our product development, and marketing efforts, or capital return or allocation strategies as we have been in the past, or that such efforts will result in growth or profit margins comparable to those we have experienced in the past. See “—To remain competitive and generate customer demand, we must successfully develop new and enhanced products and product enhancementsservices and effectively manage transitions and product integrations.integrations. Failure to do so could limit our ability to maintain or grow current revenues, which could have a material adverse effect on our business, financial condition or results of operations” above. We are dependent on key personnel in our professional staff for their expertise. If we fail to attract or retain the necessary qualified personnel, including through our compensation programs, our business, financial condition or results of operations could be materially adversely affected. The development, maintenance and support of our products and services are dependent upon the knowledge, skills, experience and abilityabilities of our highly skilled, educated and trained employees. Accordingly, we believe that the success of our business depends to a significant extent upon the continued service of our executive officersexecutives and other key management, research and product development, sales and marketing, product management, operations, information technology and other technical personnel. Although we do not believe that we are overly dependent upon any individual employee, our management and other employees may terminate their employment at any time and the loss of any of our key employees could have a material adverse effect on our business, financial condition or results of operations. During 2015 and 2016,If our Board of Directors adopted significant changes to the Company’s compensation approach and philosophy, including the implementation of a more formulaic approach to the payment of annual cash incentive compensation based on the achievement of certain financial metrics and long-term equity incentive compensation based on the achievement of share-based performance targets for certain awards to executive officers and managing directors. If our cash and equity incentive plans, including our new cash bonus plan and long-term equity incentive compensation program,programs do not adequately engage our key employees or are not competitive, we may lose key personnel. If we fail to attract, engage and retain the necessary qualified personnel, the quality of our products and services as well as our ability to support and retain our customers and achieve business objectives may suffer, which could have a material adverse effect on our business, financial condition or results of operations.
OurAny future expansion may place significant strain on our management and other resources.
We must plan and manage our expansion effectively to increase revenue and profitability. Our expansion in recent years, includingthe past and any future expansion, particularly in emerging market locations, has placed, and is expected to continue to place, significant demands on our personnel, management and other resources. We must continue to improve our operational, financial, human resources, management, legal and compliance processes and
21
information systems to keep pace with the prior expansion of our business. There can also be no assurance that, if in the future, we continue to expand organically or by way of acquisitions,acquisition, our management will be effective in attracting, engaging and retaining additional qualified personnel, including additional managers or key employees, developing effective leadership in all of our locations, expanding our physical facilities and information technology infrastructure, integrating acquired businesses or otherwise managing expansion. Additionally, new hires require significant training and may, in some cases, take a significant amount of time before becoming fully productive. Any failure to effectively manage expansion or to effectively manage the business could have a material adverse effect on our business, financial condition or results of operations. See “—We are subject to unanticipated costs in connection with political, economic, legal, operational, franchise and other risks as a result of our international operations, which could materially adversely impact our businesses in many ways”” below, “—We are dependent on key personnel in our professional staff for their expertise. If we fail to attract or retain the necessary qualified personnel, including through our compensation programs, our business, financial condition or results of operations could be materially adversely affected” above, Part II, Item 7. “Management’s Discussion and Analysis of Financial Condition and Results of Operations” below and Part I, Item 1. “Business—Company History” above.below. Changes in government regulations, including the implementation of new or pending financial or operational regulations or the repeal of existing financial or operational regulations, could materially adversely affect our business, financial condition or results of operations. The financial services industry is subject to extensive regulation at the federal and state levels, as well as by foreign governments.governments, with some jurisdictions regulating indexes directly. These regulations are complex, evolve frequently, and are subject to administrative interpretation and judicial construction in ways that could materially adversely affect our business. It is very difficult to predict the future impact of the broad and expanding legislative and regulatory requirements affecting our business and our clients’ businesses. If we fail to comply with any applicable laws, rules or regulations, we could be subject to fines or other penalties. Additionally, we may be required to comply with multiple and potentially conflicting laws, rules or regulations in various jurisdictions, which could, individually or in the aggregate, result in materially higher compliance costs to us. It is possible that laws or regulations could cause us to restrict or change the way we license and price our products or could impose additional costs on us. Some changes to the laws, rules and regulations applicable to our clients could restrict our clients’ ability to use our products and services unless we change our products and services or could otherwise impact theirour clients’ demand for our products and services. Likewise,As such, to the extent that our clients become bound by certain laws, rules or regulations, we may incur higher costs in connection with modifying our products or processesservices at their request even in instances where we are not directly legally bound. To the extent that we rely on our clients and vendors to provide data for our products and services and certain laws, rules or regulations impact our clients’ and vendors’ ability or willingness to provide that data to us or regulate the fees for which such data can be provided, our ability to continue to produce our products and services or the related costs could be negatively impacted. There can be no assurance that changes in laws, rules or regulations will not have a material adverse effect on our business, financial condition or results of operations. The regulations that most materially impact us are described below: Brexit. In March 2017, the United Kingdom (“UK”) triggered Article 50 and notified the European Union (“EU”) of its intention of leaving the EU following the UK’s June 2016 referendum vote to leave the EU (commonly referred to as “Brexit”). Negotiations on the terms of the UK’s future relationship with the EU have been ongoing, with the UK due to exit the EU on March 29, 2019 (unless an extension is agreed). Depending on the final terms reached between the UK and the EU, Brexit could lead to legal uncertainty and potentially divergent national laws and regulations that affect our business. As described below, our business, particularly the Index business, is subject to increasing regulation, and potential changes in EU regulation and/or additional regulation in the UK could cause additional operating obligations and increased costs for our business. In particular, we will need to ensure that post-Brexit we are licensed to provide indexes in the EU as well as the UK under each of the EU and UK benchmark regulations by the end of the transition period set out in the regulations (by January 1, 2020). There is also uncertainty as to how the UK’s access to the EU Single Market and the wider trading, legal, regulatory, tax and labor environments, especially in the UK and EU, will be impacted, including the resulting impact on our business and that of our clients. Any such changes may adversely affect our operations and financial results because we have significant operations in Europe and certain members 22
of our senior management team are based in London. For example, changes in labor and tax laws which increase the cost to our staff of living and working in the UK or the EU, in particular changes that result in increased tax obligations or changes in immigration regulations, may impact the ability to hire and retain non-UK staff in the UK or UK staff in the EU. See also “—OurWe may have exposure to additional tax liabilities in various jurisdictions” below.Additionally, any changes to the passporting or other regulations relating to doing business in various EU countries by relying on a regulatory permission in the UK (or doing business in the UK by relying on a regulatory permission in an EU country) could increase our costs of doing business, or our ability to do so. A change in such regulations, or other regulations, could increase our costs of doing business, or in some cases affect our ability to do business, which could have a material adverse effect on our business, financial condition or results of operations. See also “— Our revenues, expenses, assets and liabilities are subject to foreign currency exchange rate fluctuation risk” for additional information on the impact of Brexit on our revenues and expenses that are denominated in British pounds sterling. Regulation Affecting Benchmarks. Compliance efforts associated with regulations affecting benchmarks and the related technical standards and guidance could have a negative impact on our business and results of operationsoperations. In particular, compliance could lead to a change in our business practices and/or our ability to offer indexes in certain jurisdictions, including the EU, including without limitation, by increasing our costs of doing business, including direct costs paid to regulators, diminishing our intellectual property rights, imposing constraints on our ability to meet contractual commitments to our data providers, or causing our data providers to refuse to provide data to us, any of which could have a material adverse effect on our equity and real estate index product lines. Regulation (EU) 2016/1011 on indexes used as benchmarks in financial instruments and financial contracts or to measure the performance of investment funds was published on June 30, 2016 with effect on January 1, 2018 (with a two-year transition period until January 1, 2020). The regulation governs index development, calculation, dissemination, governance, maintenance and recordkeeping, as well as input data licensing, collection and dissemination. Additionally, the European Securities and Markets Authority (“ESMA”) issues guidance from time to time regarding interpretations of the regulation and new proposals to amend the benchmark regulation are in process. On March 5, 2018, MSCI Limited (a subsidiary of MSCI Inc.) was granted authorization by the United Kingdom Financial Conduct Authority as a UK administrator for all MSCI equity indexes. The Company is currently implementing the EU benchmark regulation for a limited set of the UK MSCI private real estate indexes. Under the Markets in Financial Instruments Regulation (Regulation (EU) No 600/2014), where the value of a financial instrument is calculated by reference to a benchmark, a person with proprietary rights to the benchmark will be required to ensure that clearing entities and trading venues may license the benchmark and receive relevant price and data feeds and information regarding the composition, methodology and pricing of the benchmark for the purposes of clearing and trading. Access to such licenses and information will have to be offered by the benchmark owner within three months of the request and on fair, reasonable and non-discriminatory terms that are no less favorable than the terms offered to other trading venues unless a different basis can be objectively justified. Compliance with this regulation is required by January 1, 2020. On December 18, 2012, ESMA published guidelines on ETFs and other Undertakings for Collective Investment in Transferable Securities (“UCITS”) issues (ESMA/2012/832EN), which are updated from time to time by ESMA (“Guidelines”). The Guidelines limit the types of indexes that can be used as the basis of UCITS funds and require, among other things, index constituents, together with their respective weightings, to be made easily accessible free of charge, such as via the internet, to investors and prospective investors on a delayed and periodic basis. We have made available a client communication with respect to our policies as they relate to the Guidelines. On July 17, 2013, the International Organization of Securities Commissions (“IOSCO”) published its final report on principles for financial benchmarks (“IOSCO Principles”). The IOSCO Principles cover conflicts of interest, benchmark quality and integrity, methodology requirements, procedures related to handling complaints, documentation requirements and audit reviews. The IOSCO Principles require benchmark administrators to publicly disclose whether they comply with the IOSCO Principles within 23
12 months of their initial publication, with such compliance subject to audit. We announced our implementation of the IOSCO Principles on July 16, 2014 and posted our adherence statements and audit results on our website in each of July 2014, 2015 and 2016. In 2017, we used those resources to implement the Regulation (EU) 2016/1011 and continued to rely on our 2016 adherence statements and audit results. We posted our explanatory note and updates arising from our implementation of the Regulation (EU) 2016/1011 in December 2017. For 2018, for our equity indexes, we posted our IOSCO adherence statement on our website in December 2018; and for our real estate indexes we continue to rely on our 2017 approach as we continue to implement the Regulation (EU) 2016/1011. Additionally, on January 3, 2018, under the Markets in Financial Instruments Regulation (Regulation (EU) No 600/2014), rules became effective in the EU that require sell-side firms to unbundle the costs of research, and separately charge buy-side firms for execution, investment research and other advisory services. MSCI is not such a firm, and we rely on our clients to determine whether their use of our products and services falls within the definition of investment research, and from which budget our fees are to be paid. The impact of these decisions on our clients’ budgets and the ongoing uncertainty around the application of the rules has led to and could continue to lead to delays in the execution of agreements and the potential loss of revenue in the EU, specifically for certain of our ESG Research products. Data Privacy Legislation. Changes in laws, rules or regulations, or consumer environments relating to privacy or information collection and use may affect our ability to collect, manage, aggregate, store, transfer and use personal data. There could be a material adverse impact on our direct marketing due to the enactment of legislation or industry regulations, or simply a change in practices, arising from public concern over privacy issues. Restrictions could be placed upon the collection, management, aggregation, storage, transfer and use of information that is currently legally available, in which case our cost of collecting, managing, aggregating, storing, transferring or using certain types of data could materially increase. It is also possible that we could be prohibited from collecting, managing, aggregating, storing, transferring or using certain types of data, which could materially adversely affect our ability to meet our clients’ needs. Most recently, California passed the Consumer Privacy Act (“CPA”), which takes effect on January 1, 2020. The CPA regulates the processing of personal data of all Californians and imposes significant penalties for non-compliance. The European Parliament adopted the General Data Protection Regulation (“GDPR”) which took effect on May 25, 2018. The GDPR imposes enhanced operational requirements for companies that receive or process personal data of residents of the EU and includes significant penalties for non-compliance. In Japan, the Act on the Protection of Personal Information (“APPI”) was recently amended and came into effect on May 30, 2017. The APPI regulates the use of personal information and personal data of “data subjects” for business purposes without regard to whether such use is within Japan. Investment Advisers Act. Except with respect to certain products provided by MSCI ESG Research and certain of its designated foreign affiliates, we believe that our products and services do not constitute or provide investment advice as contemplated by the Advisers Act. Future developments in our product lines or changes to current laws, rules or regulations could cause this status to change. The Advisers Act imposes fiduciary duties, recordkeeping and reporting requirements, disclosure requirements, limitations on agency and principal transactions between an adviser and advisory clients, as well as general anti-fraud prohibitions. It is possible that in addition to MSCI ESG Research and certain of its subsidiaries, other entities in our corporate family may be negatively impactedrequired to register as an investment adviser under the extent that our clients are affected by adverse changesAdvisers Act or comply with similar laws or requirements in the financial markets” below.states or foreign jurisdictions. See Part I, Item 1. “Business—Government Regulation” above for additional information about similar regulations in other countries. | • | | Investment Advisers Act. Except with respect to certain products provided by MSCI ESG Research Inc. and certain of its subsidiaries, we believe that our products do not constitute or provide investment advice as contemplated by the Investment Advisers Act of 1940 (“Advisers Act”). Future developments in our product line or changes to current laws, rules or regulations could cause this status to change. The Advisers Act imposes fiduciary duties, recordkeeping and reporting requirements, disclosure requirements, limitations on agency and principal transactions between an adviser and advisory clients, as well as general anti-fraud prohibitions. It is possible that in addition to MSCI ESG Research and certain of its subsidiaries, other entities in our corporate family may be required to register as an investment adviser under the Advisers Act or comply with similar laws or requirements in states or foreign jurisdictions. |
| • | | • | Dodd-Frank Act and Other Financial Regulations. AsRegulations. We may be materially adversely affected as a result of new or revised legislation or regulations imposed by the globalSEC, other U.S. or foreign governmental regulatory authorities or self-regulatory organizations that supervise the financial crisis,markets around the U.S. Congress undertook major financial reform which led toworld. Uncertainty caused by political change in the United States and Europe (e.g., Brexit and the change in presidential administration in 2017 and congressional composition in the United States in 2018) heightens regulatory uncertainty. The enactment of the Dodd-Frank Act on July 21, 2010 of theDodd-Frank Act. The Dodd-Frank Act could havehad a significant impact on many aspects of the way in |
| which the financial services industry conducts business and has and will continue to impose substantial new regulation on, and regulatory oversight of, a wide variety of financial services institutions. Although many ofbusiness. However, the effectsfull effect of the Dodd-Frank Act willis still unknown given that certain rules and |
24
| | regulations promulgated under the Dodd-Frank Act have yet to take effect or may be largely unknown until allrepealed or modified. As a result of the regulations have been finalized and implemented,regulatory uncertainty surrounding the Dodd-Frank Act, complying with its existing and future requirements could negatively impact the business, operations and financial viability of many of our clients which, in turn, could have a negative impact on our business and results of operations. |
We may also be materially adversely affected as a result of new or revised legislation or regulations imposed by the SEC, other U.S. or foreign governmental regulatory authorities or self-regulatory organizations that supervise the financial markets around the world. In addition, we may be materially adversely affected by changes in the interpretation or enforcement of existing laws and rules by these governmental authorities and self-regulatory organizations. It is impossible to determine the extent of the impact of any new laws, regulations or initiatives that may be proposed, or whether any of the proposals will become law. Compliance with any new laws or regulations could make compliance more difficult and expensive and affect the manner in which we conduct business.
In some instances, in connection with the provision of data and services, we have incurred additional costs to implement processes and systems at the request of our clients to ensure that the products and services that they in turn provide to their clients using our data are compliant with the financial regulations to which our clients may be subject. To the extent that our clients are subject to increased regulation, we may be indirectly impacted and could incur increased costs that could have a negative impact on the profitability of certain products. | • | | Data Privacy Legislation. Changes in laws, rules or regulations, or consumer environments relating to privacy or information collection and use may affect our ability to collect and use personal data. There could be a material adverse impact on our direct marketing due to the enactment of legislation or industry regulations, or simply a change in practices, arising from public concern over privacy issues. Restrictions could be placed upon the collection, management, aggregation, storage and use of information that is currently legally available, in which case our cost of collecting certain types of data could materially increase. It is also possible that we could be prohibited from collecting, storing or disseminating certain types of data, which could materially adversely affect our ability to meet our clients’ needs. |
| • | | Potential and Proposed Regulation Affecting Benchmarks. On September 18, 2013, the European Commission issued its proposal for regulating indexes used as benchmarks in financial instruments and financial contracts and as benchmarks used to measure the performance of investment funds (COM (2013) 641/3 and 2013/0314 (COD)). Agreement in principle has been reached among the European Commission, Parliament and Council and we expect that the final regulation, when adopted and implemented, will govern many aspects of our equity and real estate index product lines, including, but not limited to, index development, calculation, dissemination, governance, maintenance and recordkeeping, as well as input data licensing, collection and dissemination. Because final guidance on the relevant technical standards has not yet been drafted by the European Securities and Markets Authority (“ESMA”), it is difficult to predict its full effect on our index business. Nevertheless, our compliance with any one or more substantive provisions of the final regulation, which we do not expect to be required until late 2017 or early 2018, could have a material adverse effect on our business practices and/or our ability to offer indexes in the European Union, including without limitation, by materially increasing our costs of doing business, diminishing our intellectual property rights, imposing constraints on our ability to meet contractual commitments to our data contributors, or causing our data contributors to refuse to contribute data to us at a reasonable cost or at all. |
On October 20, 2011, the European Commission issued its proposal for MiFID/MiFIR 2 (COM (2011) 0652 and COM (2011) 0656). Agreement in principle has been reached among the European Commission, Parliament and Council, and we expect that the regulation when it becomes effective and when our compliance is required (expected in 2019), will, among other things, mandate that, where the
value of a financial instrument is calculated by reference to a benchmark, a person with proprietary rights to the benchmark will be required to ensure that clearing entities and trading venues may license the benchmark and receive relevant price and data feeds and information regarding the composition, methodology and pricing of the benchmark for the purposes of clearing and trading. It is also expected that access to such licenses and information will have to be offered by the benchmark owner within three months of the request and on fair, reasonable and non-discriminatory terms that are no less favorable than the terms offered to other trading venues unless a different basis can be objectively justified. Because final guidance on the relevant technical standards has not yet been issued by ESMA, it is difficult to predict its full effect on our index business. In the event that compliance with this regulation leads to a material change in our business practices or our ability to offer our indexes, materially increases our cost of doing business or materially diminishes our intellectual property rights, it could have a material adverse effect on our index business.
On December 18, 2012, ESMA published guidelines on ETFs and other Undertakings for Collective Investment in Transferable Securities (“UCITS”) issues (ESMA/2012/832EN), which are updated from time to time by ESMA (“Guidelines”). The Guidelines limit the types of indexes that can be used as the basis of UCITS funds and require, among other things, index constituents, together with their respective weightings, to be made easily accessible free of charge, such as via the Internet, to investors and prospective investors on a delayed and periodic basis. The Guidelines became effective as of February 17, 2013 with respect to newly launched UCITS funds. They became effective for all UCITS funds on February 17, 2014. We have made available a client communication with respect to our policies as they relate to the Guidelines. To the extent that ESMA issues new guidance or different or new interpretations with respect to the Guidelines, complying with such guidance could have a negative impact on our business and results of operations, including a material negative impact on our licensing of index data and/or our indexes as the basis of ETFs and UCITS. Additionally, other jurisdictions outside of Europe have adopted, and others could adopt, similar concepts, proposals or regulations.
On July 17, 2013, the International Organization of Securities Commissions (“IOSCO”) published its final report on principles for financial benchmarks (“IOSCO Principles”). The IOSCO Principles cover conflicts of interest, benchmark quality and integrity, methodology requirements, procedures related to handling complaints, documentation requirements and audit reviews. The IOSCO Principles require benchmark administrators to publicly disclose whether they comply with the IOSCO Principles within 12 months of their initial publication, with such compliance subject to audit. On July 16, 2014, we announced our implementation of the IOSCO Principles and have posted our annual audit results on our website. Additionally, other jurisdictions could adopt similar principles or concepts, which could lead to a material change in our business practices or our ability to offer our indexes, materially increase our cost of doing business, materially diminish our intellectual property rights, materially impact our contractual commitments to our data contributors or cause our data contributors to refuse to contribute data to us at a reasonable cost or at all, any of which could have material adverse effect on our equity and real estate index product lines.
Our clients may become more self-sufficient, which may reduce demand for our products or services and materially adversely affect our business, financial condition or results of operations. Our clients may internally develop internally certain functionality contained in the products or services they currently license from us. For example, a number of our clients have obtained regulatory clearance to create indexes for use as the basis of ETFs that they manage. For example, on September 20, 2016, Blackrock received exemptive relief from the SEC to create certain indexes for use as the basis of ETFs that it would manage. Similarly, some of our clients who currently license our risk data to analyze their portfolio risk may develop their own tools to collect data and assess risk, making our products or services unnecessary for them. Similarly, a number of our clients have obtained regulatory clearance to create indexes for use as the basis of ETFs that they manage. Additionally, in August 2011, BlackRock announced that it was seeking regulatory clearance to create indexes for use as the basis of ETFs that it would manage. To the extent that our clients become more self-sufficient, demand for our products or services may be reduced, which could have a material adverse effect on our business, financial condition or results of operations. A growing number of asset managers and investment banks, in partnership with index providers that offer calculation agent services, or acting together with an industry group or association, have created or may create their own range of proprietary indexes, which they use to manage funds or as the basis of ETFs, structured products or OTCover-the-counter derivatives. See “—A limited number of clients account for amaterial portion of our revenue. Cancellation of subscriptions or investment product licenses by any of these clients could have a material adverse effect on our business, financial condition or results of operations” above and “—Increased competition and financial and budgetary pressures affecting clients in our industry may cause price reductions or loss of market share, which may materially adversely affect our business, financial condition or results of operations”operations” above. Legal protections for our intellectual property rights and other rights may not be sufficient or available to protect our competitive advantages. Third parties may infringe on our intellectual property rights and third-party litigationor we may materially adversely affect our ability to protect ourinfringe upon their intellectual property rights.rights, which, in each case, could have a material adverse effect on our business, financial condition or results of operations. We consider many aspects of our products and processesservices to be proprietary. We rely primarily on a combination of trade secret, patent, copyrightsecrets, patents, copyrights and trademark rights, as well as contractual protections and technical measures, to protect our products and processes. Despite our efforts, third parties may still try to challenge, invalidate or circumvent our rights and protections.services. There is no guarantee that any trade secret, patent, copyrightsecrets, patents, copyrights or trademark rights that we may obtain will protect our competitive advantages, nor is there any assurance that our competitors will not infringe upon our rights. As we have experienced, even if we attempt to protect our intellectual property rights through litigation, it may require considerable cost, time and resources to do so, and there is no guarantee that we will be successful. Furthermore, our competitors may also independently develop and patent or otherwise protect products and processes that are the same or similar to ours. In addition, theExisting laws of certain foreignsome countries in which we operate do not protect our proprietary rights to the same extent as do the laws of the U.S. Also, some elementsprovide services or products may offer only limited protection of our products and processes may not be subject to intellectual property protection.rights. Despite our efforts, third parties may still try to challenge, invalidate or circumvent our rights and protections. Also, we may be unable to detect the unauthorized use of our intellectual property and take the necessary steps to enforce our rights, which may have a material adverse impact on our business, financial condition or results of operations. | • | | Trademarks and Service Marks—We have registered “MSCI,” “Barra,” “FEA,” “InvestorForce,” “IPD” and “RiskMetrics” as trademarks or service marks in the U.S. and in certain foreign countries. We have also registered other marks for certain products and services in the U.S. and in certain foreign countries. When we enter a new geographic market or introduce a new product brand, there can be no assurance that our existing trademark or service mark of choice will be available. Furthermore, the fact that we have registered trademarks is not an assurance that other companies may not use the same or similar names. |
| • | | Patents—We currently hold 23 U.S. and foreign patents. We currently have three U.S. patent applications pending. Patent applications can be extremely costly to process and defend. There can be no assurance that we will be issued any patents that we apply for or that any of the rights granted under any patent that we obtain will be sufficient to protect our competitive advantages. |
| • | | Copyrights—We believe our proprietary software and proprietary data are copyright protected. If a court were to determine that any of our proprietary software or proprietary data, such as our index level data, is not copyright protected, it could have a material adverse effect on our business, financial condition or results of operations. |
| • | | Confidentiality and Trade Secrets—Our license agreements limit our clients’ right to copy or disclose our proprietary software and data. It is possible, however, that a client might still make unauthorized copies of our proprietary software or data, which could have a material adverse effect on our business, financial condition or results of operations. For example, if a client who licensed a large volume of our proprietary historical data made that information publicly available, we might lose potential clients who could freely obtain a copy of the data. We also seek to protect our proprietary software and data through trade secret protection and through non-disclosure obligations with our employees. However, if an employee breaches his or her non-disclosure obligation and reveals a trade secret or other confidential information, we could lose the trade secret or confidentiality protection, which could have a material adverse effect on our business, financial condition or results of operations. Furthermore, it may be very difficult to ascertain if a former employee is inappropriately using or disclosing our
|
| confidential or proprietary information. We have investigated suspicions that former employees have used or disclosed our confidential or proprietary information, but we may not be able to determine with certainty whether misappropriation has occurred.
|
Likewise, we cannot be certainOur services and products, or the products of others that we are aware or in the future will be aware of every instance in which this sort of behavior may occur. Additionally, the enforceability of our license and other agreements’ non-disclosure obligations and the availability of remediesoffer to us in the event of a breach may vary due to the many different jurisdictions in which our clients, and employees are located.
| • | | License Agreements—Our products are generally made available to end users on a periodic subscription basis under a license agreement signed by the client. We also permit access to some data, such as certain index information, through the Internet under online licenses that are affirmatively acknowledged by the licensee or under terms of use. There can be no assurance that third parties will abide by the terms of our licenses or that all of our license agreements will be enforceable. See “—We are dependent on the use of third-party software and data, and any reduction in third-party productquality or any failure by us to comply with our licensing requirements could have a material adverse effect on our business, financial condition or results of operations” below for risks associated with the use of intellectual property obtained from third parties. |
| • | | Third-Party Litigation—There have been a number of lawsuits in multiple jurisdictions, including in the U.S. and Germany, regarding whether issuers of index-linked investment products are required to obtain a license from the index owner or whether issuers may issue investment products based on a publicly-available index level data without obtaining permission from (or making payment to) the index owner. The outcome of these cases depends on a number of factors, including the governing law, the amount of information about the index available without a license and the other particular facts and circumstances of the cases. In some instances, the results of these cases are favorable to the index owner, as in a case originally filed in the Illinois state courts in 2006 involving the International Securities Exchange and its proposed use of the Dow Jones Industrial Average and the S&P 500 index. In other instances, the results have been unfavorable to the index owner, as in a 2009 case in German federal court ruling that the owner of an index trademark who publishes the index in a manner generally available to all market participants cannot prohibit, on the basis of German trademark law, a third party from referring to the index as a reference value in options issued by the third party if the trademark is used for informational and factual purposes and its use does not imply that a relationship exists with the trademark owner. If other courts or regulators or other governmental bodies in relevant jurisdictions determine that a license is not required to issue investment products linked to indexes, this could have a material adverse effect on our business, financial condition or results of operations. See “—Changes in government regulations, including the implementation of new or pending financial regulations, could materially adversely affect our business, financial condition or results of operations” above. It might also lead to changes in current industry practices such that we would no longer make our index level data publicly available, such as via our website or news media, on a timely basis. |
Third parties may claim we infringe upon the intellectual property rights of third parties. From time to time, we receive claims or notices from third parties alleging infringement or potential infringement of their intellectual property rights. Suchrights; and the number of these claims may grow. These intellectual property claims would likely be costly to defend, could require us to pay damages, or limit our future use of certain technologies, which could have a material adverse effect onmay harm our business, financial conditionreputation and prevent us from offering some services or results of operations.products.
Third parties may claim we infringe upon their25
Pursuing intellectual property rights. Businesses operating in the financial services sector, including our competitors and potential competitors, have increasingly pursuedclaims or may consider pursuing patent protection for their technologies and business methods. If any third parties were to obtain a patent on a relevant index methodology, risk model, software application or other relevant product or process, we could be sued for infringement. Furthermore, there is always a risk that third parties will sue us for infringement or misappropriation of other intellectual property rights, such as trademarks, copyrights or trade secrets. From time to time, such complaints are filed by or we receive such notices from others alleging intellectual property infringement or potential infringement. The number of these claims may grow. Respondingresponding to intellectual property claims, regardless of merit, can consume valuable time, and result in costly litigation or cause delays. We may be forced to settle such claims on unfavorable terms, and there can be no assurance that we would prevail in any litigation arising from such claims if such claims are not settled. We may be required to pay damages, to stop sellingproviding or using the affected products or applicationsservices or to enter into royalty and licensing agreements. There can be no assurance that any royalty or licensing agreements will be made, if at all, on terms that are commercially acceptable to us. From time to time we receive notices calling upon us to defend partners, clients, suppliers or distributors against such third-party claims under indemnification clauses in our contracts. If any of these risks materialize, the impact of claims of intellectual property infringement could have a material adverse effect on our business, financial condition or results of operations.
Furthermore, our competitors may also independently develop and patent or otherwise protect products and services that are the same or similar to ours. Also, some elements of our products and services may not be subject to intellectual property protection. Trademarks and Service Marks — When we enter a new geographic market or introduce a new product brand, there can be no assurance that our existing trademark or service mark of choice will be available. Furthermore, the fact that we have registered trademarks is not an assurance that other companies may not use the same or similar names. Patents — Patent applications can be extremely costly to process and defend. There can be no assurance that we will be issued any patents that we apply for or that any of the rights granted under any patent that we obtain will be sufficient to protect our competitive advantages. Copyrights — We believe our proprietary software and proprietary data are copyright protected. If a court were to determine that any of our proprietary software or proprietary data, such as our index level data, is not copyright protected, it could have a material adverse effect on our business, financial condition or results of operations. Confidentiality and Trade Secrets — Our license agreements limit our clients’ right to copy or disclose our proprietary software and data. It is possible, however, that a client might still make unauthorized copies of our proprietary software or data, which could have a material adverse effect on our business, financial condition or results of operations. For example, if a client who licensed a large volume of our proprietary historical data made that information publicly available, we might lose potential clients who could freely obtain a copy of the data. We also seek to protect our proprietary software and data through trade secret protection and through non-disclosure obligations with our employees. However, if an employee breaches his or her non-disclosure obligation and reveals a trade secret or other confidential information, we could lose the trade secret or confidentiality protection, which could have a material adverse effect on our business, financial condition or results of operations. Furthermore, it may be very difficult to ascertain if a former employee is inappropriately using or disclosing our confidential or proprietary information. We have investigated suspicions that former employees have used or disclosed our confidential or proprietary information, but we may not be able to determine with certainty whether misappropriation has occurred. Likewise, we cannot be certain that we are aware or in the future will be aware of every instance in which this sort of behavior may occur. Additionally, the enforceability of our license and other agreements’ non-disclosure obligations and the availability of remedies to us in the event of a breach may vary due to the many different jurisdictions in which our clients and employees are located. License Agreements — Our products are generally made available to end users on a periodic subscription basis under a license agreement signed by the client. We also permit access to some data, such as certain index information, through the internet under online licenses that are affirmatively acknowledged by the licensee or under terms of use. There can be no assurance that third parties will abide by the terms of our licenses or that all of our license agreements will be enforceable. | • | Third-Party Litigation — There have been a number of lawsuits in multiple jurisdictions, including in the U.S. and Germany, regarding whether issuers of index-linked investment products are required to obtain a license from the index owner or whether issuers may issue investment products based on publicly-available index level data without obtaining permission from (or making payment to) the index |
26
| | owner. The outcome of these cases depends on a number of factors, including the governing law, the amount of information about the index available without a license and the other particular facts and circumstances of the cases. In some instances, the results have been unfavorable to the index owner. If courts or regulators or other governmental bodies in relevant jurisdictions determine that a license is not required to issue investment products linked to indexes, this could have a material adverse effect on our business, financial condition or results of operations. See “— Changes in government regulations, including the implementation of new or pending financial or operational regulations or the repeal of existing financial or operational regulations, could materially adversely affect our business, financial condition or results of operations” above. It might also lead to changes in current industry practices such that we would no longer make our index level data publicly available, such as via our website or news media, on a timely basis. |
Our use of open source code could introduce security vulnerabilities into our internal network system, impose unanticipated delays or costs in deploying our products, or impose conditions or restrictions on our ability to commercialize our products or keep them confidential. We rely on open source code to develop software and to incorporate it in our products, as well as to support our internal systems and infrastructure. The use of open source code may entail greater risks than the use of third-party commercial software, as open source licensors generally do not provide warranties or other contractual protections regarding infringement claims, or the quality of the code or the security of the code. Despite our efforts and processes to prevent breaches of our internal network system through security patches and software updates, we are still vulnerable to cyberattacks launched by those seeking to exploit vulnerabilities in such code. Such cyberattacks could have a materially adverse effect on our business, financial condition or results of operations. Further, some open source licenses provide that if we combine our proprietary softwareapplications with open source software in a certain manner, we could be required to release the source code of our proprietary softwareapplications to the public. This would allow our competitors to create similar products with less development effort and time and ultimately put us at a competitive disadvantage. Additionally, the terms of many open source code licenses are ambiguous and have not been interpreted by U.S. courts. Accordingly, there are risks that there may be a failure in our procedures for controlling the usage of open source code or that these licenses could be construed in a manner that could impose unanticipated conditions or restrictions on our ability to commercialize our products. In either event, we could be required to seek licenses from third parties on terms that are not commercially feasible in order to continue offering our products, to make generally available (in source code form) portions of our proprietary code, to re-engineer our products or systems, to discontinue the licensing of our products if re-engineering could not be accomplished on a timely or cost-effective basis, or to take other remedial action that could divert resources away from our development efforts. Any of these requirements could materially adversely affect our business, financial condition or results of operations. We are dependent on the use of third-party software and data, and any reduction in third-party product quality or any failure by us to comply with our licensing requirements could have a material adverse effect on our business, financial condition or results of operations.
We rely on third-party software and data in connection with our product development and offerings. We depend on the ability and willingness of third-party software and data providers to deliver and support reliable products, enhance their current products, develop new products on a timely and cost-effective basis, and respond to emerging industry standards and other technological changes. The third-party software and data we use may become obsolete or incompatible with future versions of our products. We also monitor our use of third-party software and data to comply with applicable license requirements. Despite our efforts, our use of certain third-party software and data has been challenged in the past and there can be no assurance that such third parties may not challenge our use in the future, resulting in increased software or data acquisition costs, loss of rights and/or costly legal actions. Our business could be materially adversely affected if we are unable to timely or effectively replace the functionality provided by software or data that becomes unavailable or fails to operate effectively for any reason. In addition, our operating costs could increase if license fees for third-party software or data increase or the efforts to incorporate enhancements to third-party or other software or data are substantial. Some of these third-party suppliers are also our competitors, increasing the risks noted above. If any of these risks materialize, they could have a material adverse effect on our business, financial condition or results of operations.
If our products contain undetected errors or fail to perform properly due to defects, malfunctions or similar problems, itwe may, among other things, become subject to increased costs or liability based on the use of our products or services to support our clients’ investment processes, which could have a material adverse effect on our business, financial condition or results of operations. Our products and services support the investment processes of our clients, which relate to, in the aggregate, trillions of dollars in assets. Products we develop or license including our indexes, may contain undetected errors or defects despite testing. Such errorsUse of our products or services as part of the investment process creates the risk that our clients, the parties whose assets are managed by our clients or the companies that we rate or assess in our ESG segment, may pursue claims against us for very significant dollar amounts based on what may be alleged to be even a small error in our data, methodologies or analysis or malfunction in certain of our products or services. Errors or defects can exist at any point in a product’s life cycle, but are frequently found after introduction of new products or enhancements to existing products. We continually introduce new methodologies and products, and new versions of our products. Despite internal testing and testing by current clients, our current and future products may contain errors in our data, methodologies or analysis, serious defects or malfunctions. If we detect any errors before we release a product or publish a methodology or analysis, we might have to delay the product or index release for an extended period of time while we address the problem. We may not discover errors that affect our new 27
or current products or enhancements until after they are deployed, and we may need to provide enhancements or corrections to correctaddress such errors, and in certain cases it may be impracticable to correct such errors.do so. If undetected errors exist in our products, data, methodologies or methodologies,analysis, or if our products fail to perform properly due to defects, malfunctions or similar problems, it could result in harm to our brand or reputation, lost sales, delays in commercial release, third party claims, contractual disputes, negative publicity, delays in or loss of market acceptance of our products, license terminations or renegotiations and/or unexpected expenses and diversion of resources to remedy or mitigate such errors. Additionally, any undetected errors, defects, malfunctions or similar problems in our products, data, methodologies or methodologiesanalysis could lead to significant failures, disruptions or slowdowns with respect to our product delivery to clients. The realization of any of these events could materially adversely affect our business, financial condition or results of operations. See “—Our business relies heavily on electronic delivery systems, the Internet andAny resulting failures, disruptions or instability of our information technology platform, and any failures, disruptionselectronic delivery systems, or instabilitythe internet, including a cybersecurity breach or cyberattack, may materially adversely affect our ability to serve our clients” aboveresult in reputational harm and “—We may become subject to liability based on the use of our products to support our clients’ investment processes” below. Our business is dependent on our clients’ continued investment in equity securities as well as the measurement of the performance of our clients’ equity investments against equity benchmarks. If investment in equity markets declines, if our clients significantly reduce their investments in equity securities, or if they discontinue the use of equity benchmarks to measure performance, our business, financial condition or results of operations could be materially adversely affected.
A significant portion of our revenues comes from our products that are focused on various aspects of managing or monitoring equity portfolios. Volatility in equity markets over an extended period or other factors may lead to an overall decline in the viability of such markets, which could reduce new business opportunities for us and our clients. To the extent our clients significantly deemphasize equity securities in their investment strategies, the demand for our equity products would likely decrease, which could have a material adverse effect on our business, financial condition or results of operations. See “—Our revenues attributable” above.
While we have provisions in our client contracts that are designed to asset-based feeslimit our exposure to potential liability claims brought by our clients or third parties based on the use of our products or services or delay or failure to provide services, these provisions do not always eliminate liability resulting from the occurrence of any of these events entirely and may be affected by changeshave certain exceptions that could result in the capital markets, particularlyprovision of credits, contractual penalties and adverse monetary judgments, or be invalidated by unfavorable judicial decisions or by federal, state, foreign or local laws. Any such claims brought against us, even if the equity capital markets. A decrease inoutcome were to be ultimately favorable to us, would involve a significant commitment of our revenues attributable to these productsmanagement, personnel, financial and other resources and could have a materialnegative impact on our reputation or pose a significant disruption to our normal business operations. In addition, the duration or outcome of such claims and lawsuits is difficult if not impossible to predict, which could further exacerbate the adverse effect they may have on our business financial condition or results of operations” above. Additionally, our equity index products serve as equity benchmarks against which our clients can measure the performance of their investments. If clients decide to measure performance on an absolute return basis instead of against an equity benchmark, the demand for our equity indexes could decrease. Any such decrease in demand for our equity index products could have a material adverse effect on our business, financial condition or results of operations.
Cancellation of subscriptions or investment product licenses or renegotiation of terms by a significant number of clients could have a material adverse effect on our business, financial condition or results of operations.
Our principal business model is to license annual, recurring subscriptions to our products for use at specified locations and often by a given number of users or for a certain volume of products or services. For most of our
products, our clients may cancel their subscriptions or investment product licenses at the end of the current term. While we believe the annual, recurring subscription model supports our marketing efforts by allowing clients to subscribe without the requirement of a long-term commitment, the cancellation of subscriptions or investment product licenses by a significant number of clients at any given time may have a material adverse effect on our business, financial condition or results of operations.
Increased accessibility to free or relatively inexpensive information sources may reduce demand for our products and materially adversely affect our business, financial condition or results of operations.
In recent years, the availability of free or relatively inexpensive information has increased, particularly through advances in public cloud computing and the increase in open source as well as proprietary software, and this trend may continue. The availability of free or relatively inexpensive information may reduce demand for our products. Weak economic conditions can also result in clients seeking to utilize lower-cost information that is available from alternative sources. To the extent that our clients choose to use these sources for their information needs, our business, financial condition or results of operations may be materially adversely affected. See “—Changes in government regulations, including the implementation of new or pending financial regulations, could materially adversely affect our business, financial condition or results of operations—Potential and Proposed Regulation Affecting Benchmarks” above.
Our financial condition and results of operations may be negatively impacted to the extent that our current and potential future clients are affected by adverse changes in the financial markets.
Unfavorable changes in global or domestic financial market conditions may negatively impact the performance and financial viability of our current and potential clients, the majority of which are in the financial services industry. As a result, adverse financial market conditions could result in reduced demand for our products and services due to, among other things, the closure or consolidation of our clients, a decrease in the number of fund launches, including hedge fund launches or a shift in our clients’ investment patterns; the inability of our customers to pay for products or services, including forgoing products or services, delaying payment or underpaying; prolonged selling and renewal cycles; and increased reserves for doubtful accounts and write-offs of accounts receivable.
If we are unable to successfully identify, execute and realize synergies from acquisitions, or if we experience integration, financing, or other risks resulting from our acquisitions, our financial results may be materially adversely affected. An element of our growth strategy is growth through acquisitions. As we continue pursuing selective acquisitions to support our growth strategy, we seek to be a disciplined acquirer, and there can be no assurance that we will be able to identify suitable candidates for successful acquisition at acceptable prices. In addition, our ability to achieve the expected returns and synergies from our past and future acquisitions depends in part upon our ability to effectively integrate the offerings, technology, sales, administrative functions and personnel of these businesses into our business. We cannot assure youprovide assurance that we will be successful in integrating acquired businesses or that our acquired businesses will perform at the levels we anticipate. In addition, our past and future acquisitions may subject us to unanticipated risks or liabilities or disrupt our operations. Any acquisition could present a number of risks, including: including incorrect assumptions regarding the future results of acquired operations or assets, or expected cost reductions or other synergies expected to be realized as a result of acquiring operations or assets; failure to integrate the operations or management of any acquired operations or assets successfully and on a timely and cost effective basis;
failure to achieve assumed synergies; insufficient knowledgesynergies or successful integration of the operations and markets of acquired businesses, including where the acquired company operates in many countries and in markets with which we have limited experience;
management, increased debt which may be incurred under terms less favorable than those associated with our current debt and which may, among other things, reduce our free cash flow and increase our risk of default; acquisitions, dilution of our common stock; stock, loss of key personnel; personnel and diversion of management’s attention from existing operations or other priorities; and operations. inability to secure, on terms we find acceptable, sufficient financing that may be required for any such acquisition or investment.
In the event that we experience a high level of acquisition-related activity within a limited period of time, the possibility of occurrence ofprobability that these risks would occur would likely increase for that period. In addition, if we are unsuccessful in completing acquisitions of other businesses, operations or assets or if such opportunities for expansion do not arise, our future growth, business, financial condition or results of operations could be materially adversely affected. Our revenues, expenses, assets and liabilities are subject to foreign currency exchange rate fluctuation risk. We are subject to foreign currency exchange rate fluctuation risk. Exchange rate movements can impact the U.S. dollar reported value of our revenues, expenses, assets and liabilities denominated in non-U.S. dollar currencies or where the currency of such items is different than the functional currency of the entity where these items were recorded. For all operations outside the U.S. where the Company has designated the local non-U.S. dollar currency as the functional currency, revenue and expenses are translated using average monthly exchange rates and assets and liabilities are translated into U.S. dollars using month-end exchange rates. For these operations, currency translation adjustments arising from a change in the rate of exchange between the functional currency and the U.S. dollar are accumulated in a separate component of shareholders’ equity. In addition, transaction gains and losses arising from a change in exchange rates for transactions denominated in a currency other than the functional currency of the entity are reflected in non-operating “Other expense (income), net” inadditional information on our Consolidated Statement of Income. We generally invoice our clients in U.S. dollars; however, we invoice a portion of our clients in Euros, British pounds sterling, Japanese yen and a limited number of other non-U.S. dollar currencies. For the years ended December 31, 2015 and 2014, 17.8% and 20.2%, respectively, of our revenues are subject to foreign currency exchange rate risk, see Part II, Item 7A “—Quantitative and primarily includes clients billed in foreign currency as well as U.S. dollar exposures on non-U.S. dollar foreign operating entities. Of the 17.8% of non-U.S dollar exposure for the year ended December 31, 2015, 37.0% was in British pounds sterling, 35.8% was in Euros and 21.6% was in Japanese yen. Of the 20.2% of non-U.S dollar exposure for the year ended December 31, 2014, 38.3% was in Euros, 34.0% was in British pounds sterling and 21.7% was in Japanese yen.Qualitative Disclosures About Market Risk—Foreign Currency Risk.”
Revenues from index-linked investment products represented 18.4% and 17.8% of operating revenues for the years ended December 31, 2015 and 2014, respectively. While a substantial portion of our fees for index-linked investment products are invoiced in U.S. dollars, the fees are based on the investment product’s assets, of which two-thirds are invested in securities denominated in currencies other than the U.S. dollar. Accordingly, declines in such other currencies against the U.S. dollar will decrease the fees payable to us under such licenses. In addition, declines in such currencies against the U.S. dollar could impact the attractiveness of such investment products resulting in net fund outflows, which would further reduce the fees payable under such licenses.28
We are exposed to additional foreign currency risk in certain of our operating costs. Approximately 41.3% and 43.1% of our operating expenses, including operating expense attributable to income (loss) from
discontinued operations, net of income taxes, for the years ended December 31, 2015 and 2014, respectively, were denominated in foreign currencies, the significant majority of which were denominated in British pounds sterling, Indian rupees, Swiss francs, Euros, Hungarian forints, Hong Kong dollars, Chinese yuan and Mexican pesos. Expenses incurred in foreign currency may increase as we expand our business outside the U.S.
We have certain monetary assets and liabilities denominated in currencies other than local functional amounts and when these balances were remeasured into their local functional currency, either a gain or a loss resulted from the change of the value of the functional currency as compared to the originating currencies. We manage foreign currency exchange rate risk, in part, through the use of derivative financial instruments comprised principally of forward contracts on foreign currency which are not designated as hedging instruments for accounting purposes. The objective of the derivative instruments is to minimize the impact on the income statement impact associated withof the volatility of amounts denominated in certain foreign currencies. We recognized total foreign currency exchange losses of $2.2 million and $3.0 million for the years ended December 31, 2015 and 2014, respectively. Although we believe that our guidelines and policies are reasonable and prudent, any hedging instruments that we are currently party to or may enter into in the future may not be successful, resulting in an adverse impact on our results of operations.
To the extent that our international activities recorded in local currencies increase or decrease in the future, our exposure to fluctuations in foreign currency exchange rates may correspondingly increase and could have a material adverse effect on our business, financial condition or results of operations. We may become subject to liability based Depending on the use of our productsfinal terms reached between the UK and the EU, Brexit has and may continue to support our clients’ investment processes.
Our products supportcause significant volatility in currency exchange rates, especially between the investment processesU.S. dollar and the British pound sterling. The weaker British pound sterling means that revenues earned in British pound sterling translate to lower reported U.S. dollar revenues. The weaker British pound sterling also means that expenses incurred in British pound sterling translate to lower reported U.S. dollar expenses. The weaker British pound sterling could also impair the purchasing power of our clients which relate to, in the aggregate, trillions of dollars in assets. Use of our products as part of the investment process creates the risk that our clients, or the parties whose assets are managed by our clients, may pursue claims against us for very significant dollar amounts based on what may be alleged to be even a small error in certain of our products. Our client agreements have provisions designed to limit our exposure to potential liability claims brought by our clients or third parties based on the use of our products or failure to provide services under our client contracts. However, these provisions do not always eliminate liability entirely and may have certain exceptions that could result in decreased demand for our products and services. The fall in the provisionBritish pound sterling relative to the U.S. dollar, and the strengthening of credits, contractual penalties and adverse monetary judgments, or be invalidated by unfavorable judicial decisions or by federal, state, foreign or local laws.
Claims against us, even if the outcome wereU.S. dollar relative to be ultimately favorable to us, would involve a significant commitmentnumber of our management, personnel, financial and other resources andcurrencies including the British pound sterling, could have a negative impactsignificant impacts on our reputation or pose a significant disruption to our normal business operations. In addition, the duration or outcome of such claims and lawsuits is difficult if not impossible to predict, which could further exacerbate the adverse effect they may have on our business operations.
Our indebtedness could materially adversely affect our business, financial condition or results of operations.
The Company has issued an aggregate principal amountOur indebtedness could materially adversely affect our cash flows and financial flexibility.
As of $1.6December 31, 2018, we had $2.6 billion of outstanding indebtedness in the form of senior unsecured notes in two discrete private offerings of $800.0 million each. On November 20, 2014, we(collectively, the “Senior Notes”). We completed a private offering of $800.0 million aggregate principal amount of 5.250% Senior Notes5.25% senior unsecured notes due 2024 (the “2024 Senior Notes”) and entered intoon November 20, 2014, a new $200.0 million senior unsecured revolving credit agreement (our “2014 Revolving Credit Agreement”). We used the net proceeds from the offering of the 2024 Senior Notes, together with cash on hand, to prepay in full the $794.8 million of outstanding indebtedness under our amended and restated senior secured term loan facility. On August 13, 2015, the Company completed its second private offering of $800.0 million aggregate principal amount of 5.750% Senior Notes5.75% senior unsecured notes due 2025 (the “2025 Senior Notes,” and together with the 2024 Senior Notes, the “Senior Notes”). The Company intends to use the net proceeds from the on August 13, 2015, a private offering of the $500.0 million aggregate principal amount of 4.75% senior unsecured notes due 2026 (the “2026 Senior Notes”) on August 4, 2016 and a private offering of $500.0 million aggregate principal amount of 5.375% senior unsecured notes due 2027 (the “2027 Senior Notes”) on May 18, 2018.2025 Senior Notes for general corporate purposes, including, without limitation, previously announced repurchases of our common stock. See Part II, Item 7. “Management’s Discussion and Analysis of Financial Condition and Results of Operations—Liquidity and Capital Resources” for additional information regarding our 2014 RevolvingWe also maintain a $250.0 million senior unsecured revolving credit agreement (the “Revolving Credit Agreement and the Senior Notes.
AsAgreement”), which was undrawn as of December 31, 2015, we had $1.6 billion of outstanding indebtedness under the Senior Notes and $200.0 million of undrawn aggregate commitments under our 20142018. The Revolving Credit Agreement which includes $25.0 million for the issuance of letters of credit. Any borrowings under our 2014 Revolving Credit Agreement may be voluntarily prepaid and reborrowed. However, the undrawn portion of the aggregate commitments is subject to an unused commitment fee which, upon specified increases in leverage, will rise by the applicable margin (as defined below).
The Senior Notes and our 2014 Revolving Credit Agreement are fully and unconditionally, and jointly and severally, guaranteed by our direct or indirect wholly-owned domestic subsidiaries that account for more than 5% of our and our subsidiaries’ consolidated assets, other than certain excluded subsidiaries (the “subsidiary guarantors”)0.30%. Any amounts due under our 2014 Revolving Credit Agreement would be our and the subsidiary guarantors’ senior unsecured obligations and rank equallyWe recognized an interest expense associated with the Senior Notes and any of our other unsecured, unsubordinated debt, senior to any of our subordinated debt and effectively subordinated to our secured debt to the extent of the assets securing such debt. Our 2014 Revolving Credit Agreement andof approximately $133.1 million for the indentures dated as of November 20, 2014 and August 13, 2015, governing our Senior Notes, respectively (together, the “Indentures governing our Senior Notes”), among us, each of the subsidiary guarantors, and Wells Fargo Bank, National Association, as trustee, contain restrictive covenants that limit our ability and our existing and future subsidiaries’ abilities to, among other things, incur liens; incur additional indebtedness; make investments; make acquisitions, merge, dissolve, liquidate, consolidate with or into another person; sell, transfer or dispose of assets; pay dividends or other distributions in respect of our capital stock; change the nature of our business; enter into any transactions with affiliates other than on an arm’s length basis; and prepay, redeem or repurchase debt. In addition, the Indentures governing our Senior Notes restrict our non-guarantor subsidiaries’ ability to create, assume, incur or guarantee additional indebtedness without such non-guarantor subsidiaries guaranteeing the Senior Notes on apari passu basis.
Our 2014 Revolving Credit Agreement also requires us to comply with the following two financial ratio maintenance covenants, which are tested at least quarterly on a rolling four-quarter basis: (i) our maximum consolidated leverage ratio must not exceed 3.75:1.00 and (ii) our minimum consolidated interest coverage ratio must be at least 4.00:1.00. Under the terms of our 2014 Revolving Credit Agreement, certain increases (or decreases) in our consolidated leverage ratio may result in an increase (or decrease) in the fees applicable to (i) outstanding borrowings under such facility and (ii) undrawn commitments under such facility, in each case, in a predetermined percentage amount (the “applicable margin”). If we experience, as of a scheduled quarterly test date, an increase in our consolidated leverage ratio above a threshold amount specified in our 2014 Revolving Credit Agreement, the interest rates on our outstanding borrowings and/or the fee rate on our unused commitments will rise by the applicable margin. Consequently, any increase in our consolidated leverage ratio could result in higher debt service costs under such facility, even if we do not have borrowings outstanding under such facility.
On August 13, 2015, the Company completed the offering of the 2025 Senior Notes, which caused our Consolidated Leverage Ratio to increase to 3.08:1.00 as ofyear ended December 31, 2015. As a result of our increase in leverage,2018.
Although we are currently subject to the highest applicable margin provided for under our 2014 Revolving Credit Agreement, which has increased the rate on our unused commitments to 0.35%. In addition, our 2014 Revolving Credit Agreement and the Indentures governing our Senior Notes contain certain affirmative covenants. Any of these restrictions may interfere with our ability to obtain financings and to engage in business activities, which could have a material adverse effect on our business, financial condition or results of operations. See “—A change in our credit ratings could materially adversely affect our financial condition” below.
If we incur substantial additional indebtedness, the risks described above could be further exacerbated.
We may need to incur additional indebtedness, including secured indebtedness, in the future in the ordinary course of business. The terms of our 2014 Revolving Credit Agreement and the Indentures governing our Senior Notes restrict, but do not completely prohibit, us from doing so. Our 2014 Revolving Credit Agreement provides for an incremental facilitybelieve that allows us to increase aggregate commitments by an additional $200.0 million under certain circumstances. In addition, the Indentures governing our Senior Notes allows us to issue additional Senior Notes under certain circumstances. Accordingly, we may be able to incur substantial additional debt from time to time under our existing debt agreements and otherwise, to finance working capital, capital expenditures, investments or acquisitions, or for other purposes. If we do so, the risks related to our level of indebtedness could intensify. Specifically, a high level of indebtedness could, among other things:
require us to dedicate a substantial portion of our cash flows from operations or proceeds of any equity issuance or additional debt incurrencewill be sufficient to payments onservice our outstanding indebtedness, reducing the availability of our cash flow to fund working capital, capital expenditures, dividend payments, development activity, acquisitions and other general corporate purposes;
increase our vulnerability to adverse general economic or industry conditions;
limit our flexibility in planning for, or reacting to, changes in our business or the markets in which we operate;
make us more vulnerable to increases in interest rates, as borrowings under our 2014 Revolving Credit Agreement are at variable rates;
limit our ability to obtain additional financing in the future for working capital or other purposes, such as raising the funds necessary to repurchase all of the Senior Notes tendered to us upon the occurrence of specified changes of control in our ownership;
increase our interest expense;
make it difficult for us to optimally capitalize and manage the cash flow for our business; and
place us at a competitive disadvantage compared to our competitors that have less indebtedness.
If we are unable to comply with the restrictions and covenants in our debt agreements, there could be a default under the terms of such agreements, which could result in an acceleration of repayment.
If we are unable to comply with the restrictions and covenants in our 2014 Revolving Credit Agreement and the Indentures governing our Senior Notes, there could be a default under the terms of these debt agreements. Our ability to comply with these restrictions and covenants, including meeting financial ratios and tests, may be affected by events beyond our control including prevailing economic, financial and industry conditions. As a result, there can be nocannot provide assurance that we will be ablegenerate and maintain cash flows sufficient to comply with these restrictionspermit us to pay the principal, premium, if any, and covenants or meet such financial ratios and tests, and any such default under our debt agreements could have a material adverse effectinterest on our business by, among other things, limiting our ability to take advantage of financing, merger and acquisition or other corporate opportunities.
Additionally, if certain events of default occur, continue or remain uncured under our debt agreements, we are required to repurchase, redeem, repay or prepay, as the case may be, the debt under such agreement prior to maturity and/or such debt could become accelerated and immediately due and payable. For example, upon the occurrence of specified changes of control in our ownership, the holders of the Senior Notes have the right to compel us to repurchase all or part of the 2024 Senior Notes or 2025 Senior Notes, as applicable, in cash at a price equal to 101.0% of the aggregate principal amount to be repurchased plus accrued interest. Additionally, the holders of the 2024 Senior Notes or 2025 Senior Notes may, in connection with certain events of default, accelerate the principal amount of the 2024 Senior Notes or 2025 Senior Notes, as applicable, together with accrued and unpaid interest, and declare the same to be due and payable after giving the required notice.
Likewise, under our 2014 Revolving Credit Agreement, the lenders may, in connection with certain events of default, elect to terminate borrowing commitments and declare all outstanding borrowings, together with accrued and unpaid interest and other fees, to be due and payable.
Our debt agreements also contain cross-default or cross-acceleration provisions, pursuant to which a default is deemed to have occurred under such agreement if a default or acceleration occurs under another debt agreement. For example, our 2014 Revolving Credit Agreement and the Indentures governing our Senior Notes contain cross-default provisions relating to nonpayment by us or any of our subsidiaries in connection with debt aggregating $50.0 million or more (subject to certain cure periods). If any of the above events should occur, we and our subsidiaries may not have sufficient assets to repay in full all of our outstanding indebtedness. Additionally, we may not be able to amend our debt agreements or obtain needed waivers on satisfactory terms.
To service our indebtedness, we will require a significant amount of cash. However, our ability to generate cash depends on many factors beyond our control. If we are unable to generate a sufficient amount of cash, our financial condition and results of operations could be negatively impacted.
Our ability to make payments on our indebtedness and to fund planned capital expenditures depends on our ability to generate and access cash in the future, which, in turn, is subject to general economic, financial, competitive, regulatory and other factors, many of which are beyond our control. We cannot assure you thatIf we will maintain cash flows sufficientare unable to permit us to pay the principal, premium, if any, and interest on our indebtedness. Our business may not generate sufficient cash flow from operations and we may not have available to us future borrowings in an amount sufficient to enable us to pay our indebtedness or to fund our other liquidity needs. In these circumstances,access offshore cash, we may need to refinance all or a portion of our indebtedness on or before maturity. However,maturity and we may not be able to secure additional financing on terms favorable or acceptable to us or at all. Absent sufficient cash flow from our operations and the ability to refinance, we could also be forced to sell assets to make up for any shortfall in our payment obligations. The restrictive covenants in our debt agreements, however, limit our and our subsidiaries’ ability to sell assets and also restrict the use of proceeds from such a sale. If we cannot refinance or otherwise pay our obligations as they mature and fund our liquidity needs, our business, financial condition, results of operations, cash flows, liquidity, ability to obtain financing and ability to compete in our industry could be materially adversely affected. Absent sufficientWe may need to incur substantial additional debt from time to time under our existing debt agreements to finance working capital, capital expenditures, investments or acquisitions, or for other purposes. If we do so, the risks related to our level of indebtedness could intensify, including by making it difficult for us to optimally capitalize and manage the cash flow and the abilityfor our business or placing us at a competitive disadvantage compared to refinance, we could also be forced to sell assets to make up for any shortfall in our payment obligations. However,competitors that have less indebtedness.
29
Furthermore, the terms of our 2014 Revolving Credit Agreement and the Indentures governing our Senior Notesdebt agreements include restrictive covenants that limit, among other things, our and our existing and future subsidiaries’ abilityfinancial flexibility. If we are unable to sell assetscomply with the restrictions and also restrict the use of proceeds from suchcovenants in our debt agreements, there could be a sale. Accordingly, we may not be able to sell assets quickly enough or for sufficient amounts to enable us to meet our obligations on our indebtedness. Increased costs of financing, a reductiondefault that, in some cases, if continuing, could result in the availability of short-term and long-term funding and access to capital, fluctuations in the levels of interest rates and inflation, could materially adversely affect our liquidity, operating expenses or results of operations.
At December 31, 2015, we had no borrowings outstanding under our 2014 Revolving Credit Agreement and allaccelerated payment of our outstanding long-term debt was subject to a fixed interest rate. Adverse conditions inobligations or the domestic and global financial markets could, however, increase our costs for additional financing and negatively affect our ability to refinance, repurchase, redeem, repay or prepay, astermination of borrowing commitments on the case may be, our debt at or prior to maturity, raise capital or fund other typespart of obligations. Our access to capital is also impacted by changes in interest rates and inflation, which could restrict the availability to us of short-term and long-term funding. Recent interest rates in the U.S. have been at historically low levels, and increases in these rates could increase our interest expense and reduce our funds available for operations and other purposes with respect to newly incurred debt, or borrowings, if any,lenders under our 2014 Revolving Credit Agreement. Additionally, any downgrades to our credit rating or outlook may increaseSee Part II, Item 7. “Management’s Discussion and Analysis of Financial Condition and Results of Operations—Liquidity and Capital Resources” for a description of the cost, and reduce the availability, of financing. See “—A changerestrictive covenants in our credit ratings could materially adversely affect our financial condition” below.debt agreements.
If we borrow under our 2014 Revolving Credit Agreement, such indebtedness would bear interest at fluctuating interest rates, primarily based on the London Interbank Offered Rate (“LIBOR”) for deposits of U.S.
dollars. LIBOR tends to fluctuate based on general economic conditions, general interest rates, Federal Reserve rates and the supply of and demand for credit in the London interbank market. Increases in the interest rate generally, and particularly when coupled with any significant variable rate indebtedness, could materially adversely impact our interest expenses. To the extent we borrow under our 2014 Revolving Credit Agreement, we are not required to enter into interest rate swaps to hedge such indebtedness. If we decide not to enter into hedges on such indebtedness, our interest expense on such indebtedness will fluctuate based on LIBOR or other variable interest rates. Consequently, we may have difficulties servicing such unhedged indebtedness and funding our other fixed costs, and our available cash flow for general corporate requirements may be materially adversely affected.
If we do enter into interest rate swap agreements, developing an effective strategy for movements in interest rates is complex, and no strategy can completely insulate us from risks associated with such fluctuations. In addition, the counterparty to a derivative instrument could default on its obligation thereby exposing us to credit risk. Further, we may have to repay certain costs, such as transaction fees or brokerage costs, if a derivative instrument is terminated by us. Finally, our interest rate risk management activities could expose us to substantial losses if interest rates move materially differently from our expectations. As a result, our interest rate hedging activities may not effectively manage our interest rate sensitivity or have the desired beneficial impact on our financial condition or results of operations.
A change in our credit ratings could materially adversely affect our financial condition. Our credit ratings are not recommendations to buy, sell or hold any of our common stock or outstanding debt. Our outstanding debt under the Senior Notes which amounts to an aggregate principal amount of approximately $1.6 billion, currently has a non-investment grade rating. Any rating assigned to such debt is subject to ongoing evaluation by the credit rating agencies and could be lowered or withdrawn entirely at any time by such agency if, in the agency’s judgment, future circumstances relating to the basis of the rating so warrant. Such future circumstances include, but are not limited to, adverse changes to our results of operations, financial condition or cash flows, or revisions to our corporate strategy pertaining to capitalization or leverage. For example, on July 28, 2015, the Board of Directors authorized corporate action that led to a change in the Company’s target leverage and interest expense, allowing for the issuance of our 2025 Senior Notes on August 13, 2015. Following the Board of Directors’ authorization, one of the ratings agencies described the increase as substantially higher than current leverage levels and as a result downgraded our credit rating. This recent downgrade, and any further downgrade, could adversely affect the amount of capital we can access, as well as the terms of any financing we obtain. In addition, our debt covenants contain certain obligations that are triggered by a change in our credit rating. The Senior Notes contain covenants that require the Company to offer to repurchase the 2024 Senior Notes, the 2025 Senior Notes, the 2026 Senior Notes or 2025the 2027 Senior Notes, as applicable, in cash at a price equal to 101.0% of their par value, in the event of a change of control of the Company or disposition of substantially all of the Company’s assets. The Company is obligated to make such repurchase offer to noteholders if the following two conditions are met at the time of, or as a result of, such change of control or asset sale transaction: (i) the Senior Notes are rated below investment grade by each rating agency that rates the Senior Notes and (ii) the Senior Notes are downgraded by any rating agency. Any adverse change in our credit rating could have a negative effect on our liquidity and future growth through transactions in which we rely on the ability to receive debt capital at an advantageous cost and on favorable terms. Accordingly, actual or anticipated changes or downgrades to or withdrawal of our credit ratings, including any announcement that our ratings are under review or have been assigned a negative outlook, could have a material adverse effect on our financial condition, results of operations and cash flows, and on the market value of our common stock and outstanding debt. Certain events could lead to interruptions in our operations, which may materially adversely affect our business, financial condition or results of operations.
Our operations depend on our ability to seamlessly provide clients with products and customer service. We must protect our equipment and the information stored in our computer-based networks and databases against fires, floods, earthquakes and other natural disasters, as well as power losses, computer and telecommunications failures, technological breakdowns, Internet failures, computer viruses, unauthorized intrusions, terrorist attacks on sites where we are located, and other events. We also depend on accessible physical office facilities and hardware for our employees in order for our operations to function properly. There can be no assurance that the business continuity plans that we have sufficiently cover or reduce the risk of interruption in our operations caused by these events. Additionally, we may incur significant data recovery costs following any such event, and the scope of recovery will depend on, among other things, the effectiveness of our business continuity plans in mitigating the risks associated with the particular event that has occurred.
Such events could also have a material adverse effect on our clients. For example, immediately after the terrorist attacks on September 11, 2001, our clients who were located in the World Trade Center area were concentrating on disaster recovery rather than licensing additional products. In addition, delivery of some of the data we receive from New York-based suppliers was delayed. The grounding of air transportation impaired our ability to conduct sales visits and other meetings at client sites. During the resulting temporary closure of the U.S. stock markets, some of the data updates supporting our products were interrupted. These types of interruptions could affect our ability to sell and deliver products and could have a material adverse effect on our business, financial condition or results of operations.
Although we currently estimate that the total cost of ongoing development and implementation of our business continuity plans will not have a material impact on our business, financial condition or results of operations, we cannot provide any assurance that our estimates regarding the timing and cost of implementing these plans will be accurate. Unexpected or higher than estimated costs could have a material adverse effect on our financial condition or results of operations.
We are subject to unanticipated costs in connection with political, economic, legal, operational, franchise and other risks as a result of our international operations, which could materially adversely impact our businesses in many ways.businesses. As we continue to expand our international operations, we increase our exposure to political, economic, legal, operational, franchise and other risks that are inherent in operating in many countries, including risks of possible capital controls, exchange controls, customs duties, sanctions compliance, tax penalties, levies or assessments, broad regulatory discretion and other restrictive governmental actions, as well as the outbreak of hostilities or political and governmental instability in certain of the countries or regions in which we conduct operations. A significant number of our employees are located in offices outside of the U.S. and a number of those employees are located in emerging market locations. For example, as of December 31, 2015, 52.8% of our employees were located in emerging market locations. The cost of establishing and maintaining these offices, including costs related to information technology infrastructure, as well as the costs of attracting, training and retaining employees in these locations may be higher, or may increase at a faster rate, than we anticipate, which could have a material adverse effect on our business, financial condition or results of operations. 30
Additionally, the laws and regulations in many countries applicable to our business are uncertain and evolving, and it may be difficult for us to determine the exact requirements of local laws in every market. Our inability to maintain consistent internal policies and procedures across our offices and remain in compliance with local laws in a particular market could have a significant and negative effect not only on our businesses in that market but also on our reputation generally. In order to penetrate markets outside of the U.S., we must provide a suite of products and services that fit the needs of the local market. Demand for our products and services is still nascent in many parts of the world.
Many countries have not fully developed laws and regulations regarding risk management and ESG and, in many cases, institutions in these countries have not developed widely accepted best practices regarding the same. If we do not appropriately tailor our products and services to fit the needs of the local market, we may be unable to effectively grow sales of our products and services outside of the U.S. There can be no assurances that demand for our products and services will develop in these countries. We may be exposed to liabilities under applicableas a result of failure to comply with anti-corruption laws and any determination that we violated these laws could have a material adverse effect on our business. We are subject to various anti-corruption laws that prohibit improper payments or benefits or offers of payments or benefits to foreign governments and their officials and, in some cases, to employees of a business for the purpose of directing, obtaining or retaining business. We have business in countries and regions which are less developed and are generally recognized as potentially more corrupt business environments. Our activities in these countries create the risk of unauthorized payments or offers of payments by one of our employees or agents that could be in violation of various anti-corruption laws including the Foreign Corrupt Practices Act of 1977, as amended (the “FCPA”) and the U.K. Bribery Act 2010. We have implemented safeguards and policies to discourage these practices by our employees and agents. However, our existing safeguards and any future improvements may prove to be less than fully effective and our employees or agents may engage in conduct for which we might be held responsible. If employees violate our policies or we fail to maintain adequate record-keeping and internal accounting practices to accurately record our transactions we may be subject to regulatory sanctions. Violations of the FCPA or other anti-corruption laws may result in severe criminal or civil sanctions and penalties, and we may be subject to other liabilities which could have a material adverse effect on our business, results of operations and financial condition. Our brand and reputation are key assets and competitive advantages of our Company and our business may be affected by how we are perceived in the marketplace.
Our ability to attract and retain customers is affected by external perceptions of our brand and reputation. Negative perceptions or publicity could damage our reputation with customers, prospects and the public generally, which could negatively impact, among other things, our ability to attract and retain customers, employees and suppliers, as well as suitable candidates for acquisition or other combinations. See “—Any failure to ensure and protect the confidentiality of client data could adversely affect our reputation and have a material adverse effect on our business, financial condition or results of operations” above, “—We have confidentiality policies in place regarding changes to the composition of our equity indexes and have implemented information barrier procedures to protect the confidentiality of the material, non-public information regarding changes to our equity indexes. If our confidentiality policies or information barrierprocedures fail, our reputation could be damaged and our business, financial condition or results of operations could be materially adversely affected” above and “—If our products contain undetected errors or fail to perform properly due to defects, malfunctions or similar problems, it could have a material adverse effect on our business, financial condition or results of operations” above.
We may have exposure to additional tax liabilities in various jurisdictions. As a global corporation, we are subject to income taxes as well as non-income or indirect taxes, in the U.S. and various foreign jurisdictions. Significant judgment is required in determining our global provision for income taxes and other tax liabilities. In the ordinary course of a global business, there are many intercompany transactions and calculations where the ultimate tax determination is uncertain. We are regularly under audit by tax authorities. Changes in domestic and international tax laws could negatively impact our overall effective tax rate. In particular, Brexit could create uncertainty with respect to our corporate tax rate as well as the tax rates of our employees based in the UK. We are regularly under audit by tax authorities. Although we believe that our tax provisions are reasonable, there can be no assurance that the final determination of tax audits or tax disputes will not be different from what is reflected in our historical income tax provisions and accruals. To the extent we are required to pay amounts in excess of our reserves, such differences could have a material adverse effect on our Consolidated Statement of Income for a particular future period. In addition, an unfavorable tax settlement could require use of our cash and result in an increase in our effective tax rate in the period in which such resolution occurs. We are also subject to non-income taxes, such as payroll, sales, use, value-added, net worth, withholding, property and goods and services taxes, in the U.S. and various foreign jurisdictions. We are regularly under audit by tax authorities with respect to these non-income taxes and may have exposure to additional non-income tax liabilities. Future changes in tax law could materially affect our tax obligations and effective tax rate. 31
The 2017 U.S. Tax Cuts and Jobs Act (“Tax Reform”) was enacted on December 22, 2017, and significantly affected U.S. tax law by changing how the U.S. imposes income tax on multinational corporations. Tax Reform requires complex computations not previously provided in U.S. tax law. Further, compliance with Tax Reform and the accounting for such provisions require accumulation of information not previously required or regularly produced. Our 2018 financial statements reflect the final adjustments to the provisional estimate of Tax Reform based on our interpretations of the current guidance. However, Tax Reform could be subject to potential amendments and technical corrections. The U.S. Department of Treasury has broad authority to issue regulations and interpretative guidance that may significantly impact how we will apply the law and may impact our results of operations in the period issued. Our investments in recorded goodwill and other intangible assets as a result of acquisitions, including goodwill and other intangible assets resulting from our acquisitions, could be impaired as a result of future business conditions, requiring us to record substantial write-downs that would reduce our operating income. We have goodwill and intangible assets of $1,957.1$1,826.6 million recorded on our balance sheet as of December 31, 2015.2018. We evaluate the recoverability of recorded goodwill amounts and intangible assets annually or when evidence of potential impairment exists. The annualIntangible assets are reviewed for impairment test iswhenever events or changes in circumstances indicate that the carrying value of the asset may not be recoverable. These impairment tests are based on several factors requiring management’s judgment. Changes in fair market valuations and our operating performance or business conditions, in general, could result in future impairments of goodwill or intangible assets which could materially adversely affect our results of operations. In addition, if we are not successful in achieving anticipated operating efficiencies associated with acquisitions, our goodwill and intangible assets may become impaired. In connection with our initial public offering and separation from Morgan Stanley, we entered into agreements with Morgan Stanley where we agreed to indemnify Morgan Stanley for, among other things, certain past, present and future liabilities related to our business. Pursuant to certain agreements we entered into with Morgan Stanley relating to the provision of services and other matters, we agreed to indemnify Morgan Stanley for, among other matters, certain past, present and future liabilities related to our business. Such liabilities include certain unknown liabilities, which could be significant. Risks Related to Ownership of Our Common Stock
The market price of our common stock may be volatile, which could result in substantial losses.
The market price of our common stock is likely to fluctuate in the future for a variety of factors, some of which are beyond our control. One possible outcome of such fluctuation could be a decline in the value of your investment. For example, some of the factors that may cause the market price of our common stock to fluctuate include:
fluctuations in our quarterly financial results or the quarterly financial results of companies perceived to be similar to us;
changes in or failure to meet guidance or long-term targets provided by the Company with respect to financial and operating metrics;
changes in operating margins;
declines in the value of AUM in ETFs linked to MSCI indexes;
| • | | loss of key clients (See “—Our clients that pay us a fee based on the assets of an investment product may seek to negotiate a lower asset-based fee percentage or may cease using our indexes, which could limit the growth of or decrease our revenues from asset-based fees” above); |
changes in estimates of our financial results or recommendations by securities analysts;
failure of any of our products to achieve or maintain market acceptance;
failure to produce or distribute our products;
changes in market valuations of similar companies;
success of competitive products;
changes in our capital structure, such as future issuances of securities or the incurrence of additional debt;
changes in our dividend policy or stock repurchase program;
announcements by us or our competitors of significant products, contracts, acquisitions or strategic alliances;
litigation involving our Company, our general industry or both;
changes in or departures of key personnel;
investors’ general perception of us, including any perception of misuse of sensitive information;
changes in general economic, industry and market conditions in one or more significant regions around the world; and
changes in regulatory developments in the U.S., foreign countries or both and changes in other dynamics.
In addition, if the market for stocks in our industry, or the stock market in general, experiences a loss of investor confidence, the trading price of our common stock could decline for reasons unrelated to our business, financial condition or results of operations. If any of the foregoing occurs, it could cause our stock price to fall and may expose us to lawsuits that, even if unsuccessful, could be costly to defend and a distraction to management.
Our business performance might not be sufficient for us to meet the full-year financial guidance or long-term targets that we provide publicly. We provide full-year financial guidance and long-term targets to the public based upon our assumptions regarding our expected financial performance. For example, we provide assumptions regarding our ability to manage our expenses, generate free cash flow, achieve a certain effective tax rate access cash generated outside of the U.S. and achieve our profitability targets. While we believe that our annual financial guidance and long-term targets provide Future sales of our common stock, or the perception that such sales may occur, could depress our common stock price.
Sales of a substantial number of shares of our common stock, or the perception that such sales may occur, could depress the market price of our common stock. This would include sales of our common stock underlying restricted shares of common stock and options to purchase shares of common stock granted in connection with our initial public offering and pursuant to our equity incentive compensation plans.
As of February 19, 2016, 98,786,211 shares of our common stock were outstanding and freely tradable without restriction or further registration under the Securities Act of 1933, as amended, by persons other than our affiliates within the meaning of Rule 144 under the Securities Act.
In November 2007, we filed a registration statement registering under the Securities Act the 12,500,000 shares of common stock reserved for issuance in respect of incentive awards to our officers and
certain of our employees pursuant to the MSCI Amended and Restated 2007 Equity Incentive Compensation Plan and the 500,000 shares of common stock reserved for issuance in respect of equity awards made to our directors who are not employees of the Company or Morgan Stanley pursuant to the MSCI Independent Directors’ Equity Compensation Plan. As of December 31, 2015, we had issued 7,813,090 and 173,393 shares of common stock under the MSCI Amended and Restated 2007 Equity Incentive Compensation Plan and MSCI Independent Directors’ Equity Compensation Plan, respectively. In February 2016, the Board of Directors, upon the recommendation of the Compensation Committee, approved the MSCI Inc. 2016 Omnibus Plan (“Omnibus Plan”), a new equity incentive compensation plan that the Company will propose for approval at the Company’s 2016 annual meeting of shareholders. Pursuant to the Omnibus Plan, the Company will reserve additional shares of common stock for issuance, which will be registered under the Securities Act if the plan is approved by the Company’s shareholders. See Part II, Item 5. “Market for Registrant’s Common Equity, Related Stockholder Matters and Issuer Purchases of Equity—Equity Compensation Plans.”
In connection with the acquisition of RiskMetrics, we filed a registration statement registering under the Securities Act the 4,257,779 shares of MSCI common stock reserved for issuance in respect of incentive awards to officers and certain employees of RiskMetrics pursuant to the RiskMetrics Group, Inc. 2000 Stock Option Plan, RiskMetrics Group, Inc. 2004 Stock Option Plan, Institutional Shareholder Services Holdings, Inc. Equity Incentive Plan and RiskMetrics Group, Inc. 2007 Omnibus Incentive Compensation Plan (collectively, the “RMG Plans”). As of December 31, 2015, we had issued 3,837,798 shares of common stock under the RMG Plans. In June 2010, we also filed a registration statement assuming 3,060,090 shares available under the RiskMetrics Group, Inc. 2007 Omnibus Incentive Compensation Plan. As of December 31, 2015, we had issued 2,097,370 shares of common stock under the RiskMetrics Group, Inc. 2007 Omnibus Incentive Compensation Plan, which terminated on June 30, 2012. See Note 10, “Shareholders’ Equity” of the Notes to the Consolidated Financial Statements included herein.
Also in the future, we may issue additional shares of our common stock in connection with investments and acquisitions. The amount of our common stock issued in connection with an investment or acquisition could constitute a material portion of the outstanding common stock.
Provisions in our Third Amended and Restated Certificate of Incorporation and Amended and Restated By-laws and Delaware law might discourage, delay or prevent a change of control of our Company or changes in our management and, therefore, depress the trading price of our common stock.
Provisions of our Third Amended and Restated Certificate of Incorporation and Amended and Restated By-laws and Delaware law may discourage, delay or prevent a merger, acquisition or other change in control that shareholders may consider favorable, including transactions in which you might otherwise receive a premium for your shares of our common stock. These provisions may also prevent or frustrate attempts by our shareholders to replace or remove our management. These provisions include:
limitations on the removal of directors;
advance notice requirements for shareholder proposals and director nominations;
the inability of shareholders, after a change in control, to act by written consent or to call special meetings;
the ability of our Board of Directors to make, alter or repeal our By-laws; and
the ability of our Board of Directors to designate the terms of and issue new series of preferred stock without shareholder approval.
Generally, the amendment of our Third Amended and Restated Certificate of Incorporation requires approval by our Board of Directors and a majority vote of shareholders. Any amendment to our By-laws requires the approval of either a majority of our Board of Directors or holders of at least 80% of the votes entitled to be cast by the outstanding capital stock in the election of our Board of Directors.
Section 203 of the General Corporation Law of the State of Delaware prohibits a person who acquires more than 15% but less than 85% of all classes of our outstanding voting stock without the approval of our Board of Directors from merging or combining with us for a period of three years, unless the merger or combination is approved by the affirmative vote of at least two-thirds of our outstanding voting stock not owned by such person. These provisions would apply even if the proposed merger or acquisition could be considered beneficial by some shareholders.
The existence of the foregoing provisions and anti-takeover measures could limit the price that investors might be willing to pay in the future for shares of our common stock. They could also deter potential acquirers of the Company, thereby reducing the likelihood that a premium would be paid for your common stock in an acquisition.
We may not be able to maintain payments of dividends at current levels and the failure to do so may negatively affect the market price of our common stock.
On September 17, 2014, our Board of Directors approved a plan to initiate a regular quarterly cash dividend to our shareholders. On October 30, 2014, we began paying regular quarterly cash dividends and have paid such dividends each quarter thereafter. On February 2, 2016, our Board of Directors declared our next quarterly cash dividend, in an amount of $0.22 per share of common stock, to be paid on March 11, 2016 to shareholders of record as of the close of trading on February 19, 2016. Although we plan to continue to pay regular quarterly cash dividends at the target rates (currently 30%-40% of Adjusted EPS) established by our Board of Directors from time to time, there can be no assurance that we will be able to continue to do so or that we will achieve an annual dividend rate in any particular amount. Our Board of Directors may, in its discretion, decrease the quarterly or annual rate of dividends or entirely discontinue the payment of dividends at any time if it deems such action to be in the best interests of the Company and our shareholders.
Our cash dividend policy is based upon our Board of Directors’ assessment of our financial condition and the general business environment in which we operate at the time of declaration. Any future declaration and payment of cash dividends to our shareholders depends on the assessment of a number of factors, some of which are beyond our control, and a change in any one or more factors could affect our dividend policy. These factors include: our results of operations and liquidity; future prospects for earnings and cash flows; our available cash on hand and anticipated cash needs; the level and timing of capital expenditures, principal repayments and other capital needs; our ability to comply with current or future financial and negative covenants that limit our ability to pay dividends and make certain other restricted payments (including the incurrence covenants contained in our 2014 Revolving Credit Agreement and the Indentures governing our Senior Notes); tax treatment of dividends in the U.S.; legal restrictions on the payment of dividends and other provisions of law in any applicable jurisdiction; and any other factors that our Board of Directors may deem relevant in light of the prevailing conditions at the time of such assessment. As a result, we can give no assurance that we will in the future choose or be able to declare or pay a cash dividend, maintain our current level of dividends or increase them over time. Our failure to declare or pay a dividend, a reduction in the level of such dividend or the discontinuance of such dividend could materially adversely affect the market price of our common stock.
The share repurchase programs approved by our Board of Directors may not result in enhanced value to shareholders and may negatively affect our share price.
On October 28, 2015, our Board of Directors approved a share repurchase program authorizing the purchase of up to $1.0 billion worth of shares of our common stock (the “2015 Repurchase Program”). Share repurchases made pursuant to the 2015 Repurchase Program may take place in the open market or in privately negotiated transactions from time to time based on market and other conditions. This authorization may be modified, suspended or terminated by our Board of Directors at any time without prior notice. The 2015 Repurchase Program carries risks and uncertainties, including, among other things, that the authorized purchases will not be completed within the expected timing or will not be made at the best possible price. Additionally, we are permitted to, and may, discontinue the 2015 Repurchase Program at any time, including, without limitation, upon
determining that we have insufficient cash flows or surplus levels required by Delaware law to continue to execute such program. Any such discontinuation or inability to continue to execute the 2015 Repurchase Program could cause the market price of our common stock to decline. Accordingly, there can be no assurance that we will pursue or be successful in completing the execution of the 2015 Repurchase Program or any future repurchase program. Additionally, the existence of a share repurchase program could cause the market price of our common stock to be higher than it would be in the absence of such a program and could potentially reduce the market liquidity for our shares. As a result, any repurchase program may not ultimately result in enhanced value to our shareholders and may not prove to be the best use of our cash resources.
Item 1B. |
| Unresolved Staff Comments |
Nothing required to be disclosed. 32
Item 2. | PropertiesProperties
|
Our corporate headquarters is located in New York, New York. This is also our largest sales office and one of our main research centers. As of December 31, 2015,2018, our principal offices consisted of the following leased properties: | | | | | | | | | | | | Number of | | | | Location | | Square Feet | | | Number of
Offices | | | Expiration Date | | Square Feet | | | Offices | | | Expiration Date | Mumbai, India | | | 126,286 | | | | 1 | | | September 30, 2018 | | | 126,286 | | | | 1 | | | August 31, 2023 | New York, New York | | | 125,811 | | | | 1 | | | February 28, 2033 | | | 125,811 | | | | 1 | | | February 28, 2033 | Budapest, Hungary | | | 44,225 | | | | 1 | | | February 29, 2024 | | | 49,318 | | | | 1 | | | February 29, 2024 | Monterrey, Mexico | | | | 46,569 | | | | 1 | | | October 31, 2028 | Berkeley, California | | | 34,178 | | | | 1 | | | February 29, 2020 | | | 34,178 | | | | 1 | | | February 28, 2030 | London, England | | | 32,365 | | | | 1 | | | December 25, 2026 | | | 30,519 | | | | 1 | | | December 25, 2026 | Monterrey, Mexico | | | 28,933 | | | | 1 | | | December 31, 2020 | | Manila, Philippines | | | | 25,750 | | | | 1 | | | February 29, 2024 | Norman, Oklahoma | | | 23,664 | | | | 1 | | | May 31, 2024 | | | 23,664 | | | | 1 | | | May 31, 2024 | Manila, Philippines | | | 20,904 | | | | 1 | | | February 28, 2019 | | Conshohocken, Pennsylvania | | | 15,590 | | | | 1 | | | June 30, 2019 | | Boston, Massachusetts | | | 13,506 | | | | 1 | | | November 30, 2021 | | | 13,506 | | | | 1 | | | November 30, 2021 | Chicago, Illinois | | | | 8,859 | | | | 1 | | | August 31, 2025 | Geneva, Switzerland | | | 11,883 | | | | 1 | | | March 31, 2019 | | | 8,826 | | | | 1 | | | August 31, 2028 | Beijing, China | | | 10,757 | | | | 1 | | | December 31, 2016 | |
As of December 31, 2015,2018, we also leased and occupied offices in the following locations:locations (in descending order of square footage): San Francisco, California; Chicago, Illinois;Beijing, China; Frankfurt, Germany; Shanghai, China; Hong Kong, China; Frankfurt, Germany; Paris, France; Shanghai, China; Sydney, Australia; Tokyo, Japan; Ann Arbor, Michigan; Portland, Maine; Sydney, Australia; Toronto, Canada; Singapore; Amsterdam, Netherlands; Johannesburg, South Africa;Seoul, Korea; Milan, Italy; Gaithersburg, Maryland; Cape Town, South Africa; Milan, Italy; Stockholm, Sweden; Sao Paolo, Brazil; Dubai, United Arab Emirates; Seoul, Korea;Barcelona, Spain; and Taipei, Taiwan; and Santiago, Chile.Taiwan. We believe that our properties are in good operating condition and adequately serve our current business operations. We also anticipate that suitable additional or alternative space, including those under lease options, will be available at commercially reasonable terms for future expansion. Various lawsuits, claims and proceedings have been or may be instituted or asserted against us in the ordinary course of business. While the amounts claimed could be substantial, the ultimate liability cannot now be determined because of the considerable uncertainty that exists. Therefore, it is possible that our business, operating results, financial condition or cash flows in a particular period could be materially adversely affected by certain contingencies. However, based on facts currently available, management believes that the disposition of matters that are currently pending or asserted will not, individually or in the aggregate, have a material effect on our business, operating results, financial condition or cash flows. Item 4. | Mine Safety Disclosures |
Not applicable. 33
PART II Item 5. | Market for Registrant’sRegistrant’s Common Equity, Related Stockholder Matters and Issuer Purchases of Equity Securities |
Stock Price and Dividends Our common stock has traded on the New York Stock Exchange since November 15, 2007 and trades under the symbol “MSCI.” As of February 19, 2016,15, 2019, there were 146121 shareholders of record of our common stock. The following table presents the high and low closing sales prices per share and cash dividends declared and distributed per share of our common stock from January 1, 2014 through December 31, 2015. | | | | | | | | | | | | | Years Ended | | High | | | Low | | | Dividends per
Share of
Common
Stock | | | | | | December 31, 2015 | | | | | | | | | | | | | First Quarter | | $ | 61.31 | | | $ | 47.24 | | | $ | 0.18 | | Second Quarter | | $ | 63.75 | | | $ | 60.32 | | | $ | 0.18 | | Third Quarter | | $ | 68.16 | | | $ | 57.78 | | | $ | 0.22 | | Fourth Quarter | | $ | 72.85 | | | $ | 57.95 | | | $ | 0.22 | | | | | | December 31, 2014 | | | | | | | | | | | | | First Quarter | | $ | 46.27 | | | $ | 40.28 | | | $ | — | | Second Quarter | | $ | 45.85 | | | $ | 40.54 | | | $ | — | | Third Quarter | | $ | 48.98 | | | $ | 43.90 | | | $ | — | | Fourth Quarter | | $ | 48.92 | | | $ | 42.20 | | | $ | 0.18 | |
On February 19, 2016, the per share closing price of our common stock on the New York Stock Exchange was $71.55.
Dividend Policy On September 17, 2014, the Board of Directors approved a plan to initiate a regular quarterly cash dividend. On February 2, 2016,January 30, 2019, our Board of Directors declared our nexta quarterly cash dividend, in an amount of $0.22$0.58 per share of common stock, to be paid on March 11, 201615, 2019 to shareholders of record as of the close of trading on February 19, 2016.22, 2019. The payment amounts of future dividends will be determined by the Board of Directors in light of conditions then existing, including our earnings, financial condition and capital requirements, business conditions, corporate law requirements and other factors. The Transfer Agent and Registrar for our common stock is Broadridge Financial Solutions, Inc. Equity Compensation Plans On November 2, 2007 and November 5, 2007, our shareholders andFebruary 18, 2016, the Board of Directors, approved, respectively,upon the implementationrecommendation of the Compensation & Talent Management Committee of the Board of Directors (the “Compensation Committee”), approved the MSCI Inc. 2016 Non-Employee Directors Compensation Plan (the “Directors Plan”), a cash and equity incentive compensation plan that was approved by shareholders at the Company’s 2016 annual meeting of shareholders. The Directors Plan replaced the Company’s then existing non-employee director compensation plan—the MSCI Inc. Independent Directors’ Equity Compensation Plan (as amended and restated on January 12,(the “2011 Plan”). The total number of shares authorized to be awarded under the Directors Plan is 352,460, which is equal to the number of shares that remained available for issuance under the 2011 the “IDECP”). Plan. Under the IDECP, theDirectors Plan, directors that are not employees of the Company receive annual Board retainer fees and fees for serving on the Company’s committees, if applicable, and pursuant to the terms of the IDECP, a director may make an election to receive all or any portion of such director’s retainer and committee fees in shares of our common stock. Directors who are not employeesstock in lieu of the Companycash. Non-employee directors are entitled to receive an annual grant of $140,000 each in stock units$160,000 and the lead director is entitled to an additional $25,000$50,000 in stock units which are typically(a total of $210,000), in each case, subject to a one-year vesting schedule. Under the MSCI Inc. DirectorNon-Employee Directors Deferral Plan, directors may elect to defer receipt of all or any portion of any shares of our common stock issuable upon conversion of any stock unit or any retainer elected to be paid in shares of our common stock until (i) 60 days following separation of service or (ii) the earlier of a specified date or 60 days following separation of service. The total number of shares authorized to be awarded under the plan is 500,000. On February 18, 2016, the Board of Directors, upon the recommendation of the Compensation Committee, approved the MSCI Inc. 2016 Non-Employee Director Equity Compensation Plan (the “2016 Director Plan”), a new cash and equity incentive compensation plan that the Company will propose for approval at the Company’s 2016 annual meeting of shareholders. The Company does not expect to reserve any additional shares of common stock for issuance in connection with the 2016 Director Plan. On November 2, 2007 and November 5, 2007, our shareholders and Board of Directors approved, respectively, the implementation of the MSCI 2007 Equity Incentive Compensation Plan. On April 9, 2008, our shareholders approved the MSCI Amended and Restated 2007 Equity Incentive Compensation Plan (as further amended, the “MSCI EICP”) and the MSCI Inc. Performance Formula and Incentive Plan (the “Performance Plan”). The MSCI EICP permits the Compensation Committee to make grants of a variety of equity based awards (such as stock, restricted stock, stock units and options) totaling up to 12,500,000 shares to eligible recipients, including employees and consultants. No awards are permitted to be granted under this plan after April 9, 2018. On February 18, 2016, the Board of Directors, upon the recommendation of the Compensation Committee, approved the MSCI Inc. 2016 Omnibus Plan (“Omnibus Plan”), a newan equity incentive compensation plan that the Company will propose for approvalwas approved by shareholders at the Company’s 2016 annual meeting of shareholders. The Omnibus Plan replaced the Company’s then existing equity compensation plan—the MSCI Inc. Amended and Restated 2007 Equity Incentive Compensation Plan (as amended, the “2007 Plan”). Compensation paid to the Company’s executive officers historically complied with the performance-based compensation exception under 162(m) of the IRC (“162(m)”) by being granted pursuant to the MSCI Inc. Performance Formula and Incentive Plan (the “Performance Plan”). Shareholder approval of the Omnibus Plan constituted approval of the material terms of the performance goals under the Omnibus Plan for purposes of 162(m). Despite the changes implemented by Tax Reform, the Company will continue to maintain the Performance Plan and may make awards pursuant to this plan.
Pursuant to the Omnibus Plan, the Company will reserve additionalreserved 7,565,483 shares of common stock for issuance (resulting in an expected aggregate reserve of 7.5 million shares (inclusive of the share reserve remaining under the MSCI EICP);issuance; plus any additional shares which become available due to forfeiture, expiration or cancellation of outstanding awards, as described in Note 1, “Introduction and Basis of Presentation,” of the Notes to Consolidated Financial Statements included herein), 34
which will bewere registered under the Securities Act if the plan is approvedof 1933, as amended (the “Securities Act”) following approval by the Company’s shareholders. This is in addition to currently outstanding awards under the MSCI EICP.2007 Plan. The CompanyOmnibus Plan permits the Compensation Committee to make grants of a variety of equity-based awards (such as stock options, stock appreciation rights, restricted stock units, restricted stock, performance awards and other stock-based awards) totaling up to 7,565,483 and other cash-based awards to eligible recipients, including employees and consultants. No awards will continuebe granted under the Omnibus Plan after the earliest to maintainoccur of (i) April 28, 2026, (ii) the Performancemaximum number of shares available for issuance having been issued and (iii) the Board of Directors terminating the Omnibus Plan and may make tax-qualified awards pursuant to this plan.in accordance with its terms. In connection with the acquisition of RiskMetrics Group, LLC (“RiskMetrics”) in 2010, we filed a registration statement registering under the Securities Act the 4,257,779 shares of MSCI common stock reserved for issuance in respect of incentive awards to officers and certain employees of RiskMetrics pursuant to the RiskMetrics Group, Inc. 2000 Stock Option Plan, RiskMetrics Group, Inc. 2004 Stock Option Plan, Institutional Shareholder Services Holdings, Inc. Equity Incentive Plan and RiskMetrics Group, Inc. 2007 Omnibus Incentive Compensation Plan (collectively, the “RMG Plans”). In June 2010, we also filed a registration statement assuming 3,060,090 shares available under the RiskMetrics Group, Inc. 2007 Omnibus Incentive Compensation Plan, which terminated on June 30, 2012. The following table presents certain information with respect to our equity compensation plans at December 31, 2015:2018: | | | | | | | | | | | | | | | | Number of
Securities to be
Issued Upon
Vesting of
Restricted Stock
Units and Exercise
of Outstanding
Options
a | | | Weighted Average
Unit Award Value
of Restricted Stock
Units and
Weighted-Average
Exercise Price of
Outstanding
Options
b | | | Number of
Securities
Remaining
Available for
Future Issuance
under Equity
Compensation
Plans (excluding
securities reflected
in column (a))
c | | Equity Compensation Plans Approved by Security Holders | | | | | | | | | | | | | MSCI Independent Directors’ Equity Compensation Plan(1) | | | 42,229 | | | $ | 52.20 | | | | 352,564 | | MSCI Amended and Restated 2007 Equity Incentive Compensation Plan | | | 1,259,124 | | | $ | 43.71 | | | | 6,372,957 | | RiskMetrics Group, Inc. 2000 Stock Option Plan | | | — | | | $ | — | | | | — | | RiskMetrics Group, Inc. 2004 Stock Option Plan | | | 62,689 | | | $ | 19.72 | | | | — | | RiskMetrics Group, Inc. 2007 Omnibus Incentive Compensation Plan | | | 196,210 | | | $ | 22.22 | | | | — | | | | | | | | | | | | | | | Total | | | 1,560,252 | | | $ | 40.27 | | | | 6,725,521 | | | | | | | | | | | | | | |
(1) | The MSCI Independent Directors’ Equity Compensation Plan does not authorize the issuance of options to purchase MSCI common stock. |
| | Number of Securities to be Issued Upon Vesting of Restricted Stock Units and Exercise of Outstanding Options a | | | Weighted Average Unit Award Value of Restricted Stock Units and Weighted -Average Exercise Price of Outstanding Options b | | | Number of Securities Remaining Available for Future Issuance under Equity Compensation Plans (excluding securities reflected in column (a)) c | | Equity Compensation Plans Not Approved by Security Holders | | | — | | | $ | — | | | | — | | Equity Compensation Plans Approved by Security Holders | | | | | | | | | | | | | MSCI Amended and Restated 2007 Equity Incentive Compensation Plan | | | 611,374 | | | $ | 58.98 | | | | — | | RiskMetrics Group, Inc. 2007 Omnibus Incentive Compensation Plan | | | 61,977 | | | $ | 22.74 | | | | — | | MSCI Inc. 2016 Omnibus Plan | | | 716,726 | | | $ | 97.64 | | | | 6,740,573 | | MSCI Inc. 2016 Non-Employee Directors Compensation Plan | | | 11,004 | | | $ | 149.83 | | | | 297,688 | | Total | | | 1,401,081 | | | $ | 77.87 | | | | 7,038,261 | |
Stock Repurchases On December 13, 2012,October 26, 2016, the Board of Directors approved a stock repurchase program authorizingfor the purchase of up to $300.0$750.0 million worth of shares of MSCI’sthe Company’s common stock beginning immediately and continuing through December 31, 2014 (the “2012(together with the amount then remaining under a previously existing share repurchase program, the “2016 Repurchase Program”). Prior to 2014, the Company repurchased an aggregate of $200.0 million worth of shares of MSCI’s common stock through multiple accelerated share repurchase (“ASR”) agreements under the 2012 Repurchase Program. On February 6, 2014, MSCI utilized the remaining $100.0 million repurchase authorization provided by the 2012 Repurchase Program.
On February 4, 2014,May 1, 2018, the Board of Directors approved aauthorized an additional stock repurchase program authorizing the purchase of up to $300.0 million worth of shares of MSCI’s common stock, which was increased to $850.0 million on September 17, 2014 (the “2014 Repurchase Program”). On October 14, 2015, the Company exhausted the $850.0 million share repurchase authorization under the 2014 Repurchase Program.
On October 28, 2015, the Board of Directors approved a new stock repurchase program authorizingfor the purchase of up to $1.0 billion worth of shares of MSCI’sthe Company’s common stock (the “2015(together with the $523.1 million of authorization then remaining under the 2016 Repurchase Program, the “2018 Repurchase Program”). Share
35
repurchases made pursuant to the 20152018 Repurchase Program may take place in the open market or in privately negotiated transactions from time to time based on market and other conditions. This authorization may be modified, suspended or terminated by the Board of Directors at any time without prior notice. As of December 31, 2018, there was $808.1 million of available authorization remaining under the 2018 Repurchase Program. On September 18, 2014, as part of
For the 2014 Repurchase Program,year ended December 31, 2018, the Company entered into an ASR agreement to initiate share repurchases aggregating $300.0 million (the “September 2014 ASR Agreement”). As a result of the September 2014 ASR Agreement, the Company receivedrepurchased approximately 4.56.2 million shares of MSCI’s common stock on September 19, 2014 and approximately 1.2 million shares of MSCI’s common stock on May 21, 2015 for a combinedat an average price of $52.79$148.34 per share. On June 2, 2015, the Company began purchasing sharesshare for a total value of its common stock on the$925.0 million pursuant to open market in accordance with SEC Rule 10b5-1. Through December 31, 2015,repurchases under the Company paid $670.8 million to receive approximately 10.7 million shares of MSCI’s common stock on the open market as part of both the 2014 Repurchase Program and the 20152018 Repurchase Program.
Pursuant to the 2014 Repurchase Program and the 2015 Repurchase Program, as of December 31, 2015, the Company purchased a total of 16.4 million shares of MSCI’s common stock for an average purchase price of $59.22 per share.
Since September 2014 and through December 31, 2015, approximately $1.1 billion was returned through share repurchases and cash dividends and a total of $1.4 billion was returned to shareholders since 2012.
The following table provides information with respect to purchases made by or on behalf of the Company of its common stock during the quarter ended December 31, 2015.2018. There were no other share repurchases during the quarter outside of the repurchases noted below. Issuer Purchases of Equity Securities | | | | | | | | | | | | | | | | | Period | | Total
Number
of Shares
Purchased (1) | | | Average
Price
Paid
Per Share | | | Total
Number of
Shares
Purchased
As Part of
Publicly
Announced
Plans or
Programs | | | Approximate
Dollar Value of
Shares that
May Yet Be
Purchased
Under the
Plans or
Programs (2) | | Month #1 (October 1, 2015-October 31, 2015) | | | 2,273,483 | | | $ | 59.29 | | | | 2,269,186 | | | $ | 1,000,000,000 | | Month #2 (November 1, 2015-November 30, 2015) | | | 695,301 | | | $ | 68.33 | | | | 688,223 | | | $ | 952,974,000 | | Month #3 (December 1, 2015-December 31, 2015) | | | 1,047,474 | | | $ | 70.44 | | | | 1,046,354 | | | $ | 879,283,000 | | | | | | | | | | | | | | | | | | | Total | | | 4,016,258 | | | $ | 63.76 | | | | 4,003,763 | | | $ | 879,283,000 | | | | | | | | | | | | | | | | | | |
Period | | Total Number of Shares Purchased (1) | | | Average Price Paid Per Share | | | Total Number of Shares Purchased As Part of Publicly Announced Plans or Programs | | | Approximate Dollar Value of Shares that May Yet Be Purchased Under the Plans or Programs (2) | | Month #1 (October 1, 2018-October 31, 2018) | | | 777,349 | | | $ | 153.92 | | | | 777,030 | | | $ | 1,344,652,000 | | Month #2 (November 1, 2018-November 30, 2018) | | | 2,297,622 | | | $ | 148.57 | | | | 2,294,078 | | | $ | 1,003,839,000 | | Month #3 (December 1, 2018-December 31, 2018) | | | 1,371,422 | | | $ | 142.86 | | | | 1,370,023 | | | $ | 808,146,000 | | Total | | | 4,446,393 | | | $ | 147.74 | | | | 4,441,131 | | | $ | 808,146,000 | |
(1) | Includes (i) shares purchased by the Company on the open market under the 2018 Repurchase Program; (ii) shares withheld to satisfy tax withholding obligations on behalf of employees that occur upon vesting and delivery of outstanding shares underlying restricted stock units; (ii)(iii) shares withheld to satisfy tax withholding obligations and exercise price on behalf of employees that occur upon exercise and delivery of outstanding shares underlying stock options; and (iii)(iv) shares held in treasury under the MSCI Inc. DirectorNon-Employee Directors Deferral Plan. The value of the shares withheld wereto satisfy tax withholding obligations was determined using the fair market value of the Company’s common stock on the date of withholding, using a valuation methodology established by the Company. The amount also includes shares repurchased under the 2014 Repurchase Program. |
(2) | See Note 10,8, “Shareholders’ Equity” of the Notes to the Consolidated Financial Statements included herein for further information regarding our stock repurchase programs. |
Recent Sales of Unregistered Securities TheSince January 1, 2016, the Company has issued an aggregate principalprinciple amount of $1.6$1.0 billion in senior unsecured notesSenior Notes in two discrete private placements, eachofferings in the amountamounts of $800.0$500.0 million each, to qualified institutional buyers pursuant to Rule 144A under the Securities Act of 1933, as amended (the “Securities Act”), and to certain non-U.S. persons in accordance with Regulation S under the Securities Act. The Company completed its offering of the 20252027 Senior Notes on May 15, 2018 and the 2026 Senior Notes on August 13, 2015 and its offering of the 2024 Senior Notes on November 20, 2014.4, 2016. The Senior Notes have not been registered under the Securities Act or any state securities laws.
There were no unregistered sales of equity securities in the year ended December 31, 2015.2018. Use of Proceeds from Sale of Registered Securities None. 36
FIVE-YEAR STOCK PERFORMANCE GRAPH The following graph compares the cumulative total shareholders’ return on our common stock, the Standard & Poor’s 500 Stock Index and the NYSE Composite Index since December 31, 20102013 assuming an investment of $100 at the closing price on December 31, 2010.2013. In calculating total annual shareholders’ return, reinvestment of dividends, if any, is assumed. The indexes are included for comparative purposes only. They do not necessarily reflect management’s opinion that such indexes are an appropriate measure of the relative performance of the common stock. This graph is not “soliciting material,” is not to be deemed filed with the SEC and is not to be incorporated by reference in any of our filings under the Securities Act of 1933 or the Securities Exchange Act of 1934, as amended, whether made before or after the date hereof and irrespective of any general incorporation language in any such filing. 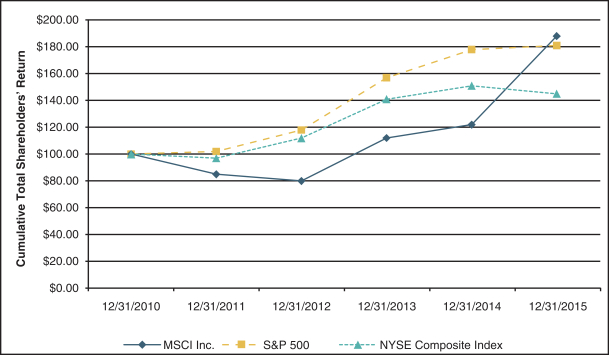 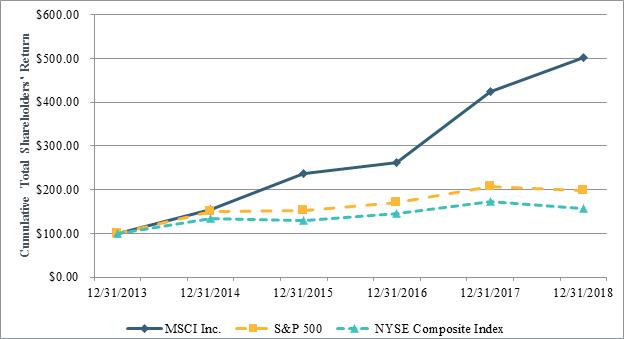
Total Investment Value | | | | | | | | | | | | Years Ended | | | | | Years Ended | | | December 31, | | | December 31, | | | December 31, | | | December 31, | | | December 31, | | | December 31, | | | | | December 31,
2015 | | | December 31,
2014 | | | December 31,
2013 | | | December 31,
2012 | | | December 31,
2011 | | | 2013 | | | 2014 | | | 2015 | | | 2016 | | | 2017 | | | 2018 | | MSCI Inc. | | $ | 188 | | | $ | 122 | | | $ | 112 | | | $ | 80 | | | $ | 85 | | | $ | 100 | | | $ | 154 | | | $ | 236 | | | $ | 261 | | | $ | 424 | | | $ | 502 | | S&P 500 | | $ | 181 | | | $ | 178 | | | $ | 157 | | | $ | 118 | | | $ | 102 | | | $ | 100 | | | $ | 151 | | | $ | 153 | | | $ | 171 | | | $ | 208 | | | $ | 199 | | NYSE Composite Index | | $ | 145 | | | $ | 151 | | | $ | 141 | | | $ | 112 | | | $ | 97 | | | $ | 100 | | | $ | 135 | | | $ | 129 | | | $ | 145 | | | $ | 172 | | | $ | 157 | |
Source: Bloomberg Item 6. | Selected Consolidated Financial Data |
Our selected consolidated financial data for the periods presented should be read in conjunction with “Item 7. Management’s Discussion and Analysis of Financial Condition and Results of Operations” and the consolidated financial statements and notes thereto beginning on page F-1 of this Annual Report on Form 10-K. The selected Consolidated Statement of Income data for the years ended December 31, 2015, 20142018, 2017 and 20132016 and the selected Consolidated Statement of Financial Condition data as of December 31, 20152018 and 20142017 are derived from our audited consolidated financial statements beginning on page F-1 of this Annual Report on Form 10-K. Our consolidated financial statements for the years ended December 31, 2015, 20142018, 2017 and 20132016 have been audited and 37
reported upon by an independent registered public accounting firm in each period. The selected Consolidated Statement of Income data for the years ended December 31, 20122015 and 20112014 and the selected Consolidated Statement of Financial Condition data as of December 31, 2013, 20122016, 2015 and 20112014 are derived from our audited consolidated financial statements not included in this Annual Report on Form 10-K. The selected financial information presented below may not be indicative of our future performance. | | | | | | | | | | | | | | | | | | | | | | | | As of or For the
Years Ended | | | | | December 31,
2015 (1) | | | December 31,
2014 (2) | | | December 31,
2013 (4) | | | December 31,
2012 (5) | | | December 31,
2011 | | | | | (in thousands, except operating margin and per share data) | | Operating revenues | | $ | 1,075,013 | | | $ | 996,680 | | | $ | 913,364 | | | $ | 826,990 | | | $ | 781,355 | | Total operating expenses | | | 671,115 | | | | 659,514 | | | | 573,033 | | | | 508,755 | | | | 484,193 | | | | | | | | | | | | | | | | | | | | | | | Operating income | | | 403,898 | | | | 337,166 | | | | 340,331 | | | | 318,235 | | | | 297,162 | | Other expense (income), net | | | 54,344 | | | | 28,828 | | | | 27,503 | | | | 57,434 | | | | 59,592 | | Provision for income taxes | | | 119,516 | | | | 109,396 | | | | 112,918 | | | | 96,010 | | | | 78,634 | | | | | | | | | | | | | | | | | | | | | | | Income from continuing operations | | | 230,038 | | | | 198,942 | | | | 199,910 | | | | 164,791 | | | | 158,936 | | Income (loss) from discontinued operations, net of income taxes | | | (6,390 | ) | | | 85,171 | (3) | | | 22,647 | | | | 19,447 | | | | 14,518 | | | | | | | | | | | | | | | | | | | | | | | Net income | | $ | 223,648 | | | $ | 284,113 | | | $ | 222,557 | | | $ | 184,238 | | | $ | 173,454 | | | | | | | | | | | | | | | | | | | | | | | Operating margin | | | 37.6 | % | | | 33.8 | % | | | 37.3 | % | | | 38.5 | % | | | 38.0 | % | Earnings per basic common share from continuing operations | | $ | 2.11 | | | $ | 1.72 | | | $ | 1.66 | | | $ | 1.34 | | | $ | 1.31 | | Earnings per diluted common share from continuing operations | | | (0.06 | ) | | | 0.73 | | | | 0.19 | | | | 0.16 | | | | 0.12 | | | | | | | | | | | | | | | | | | | | | | | Earnings per basic common share | | $ | 2.05 | | | $ | 2.45 | | | $ | 1.85 | | | $ | 1.50 | | | $ | 1.43 | | | | | | | | | | | | | | | | | | | | | | | Earnings per basic common share from continuing operations | | $ | 2.09 | | | $ | 1.70 | | | $ | 1.64 | | | $ | 1.32 | | | $ | 1.29 | | Earnings per diluted common share from continuing operations | | | (0.06 | ) | | | 0.73 | | | | 0.19 | | | | 0.16 | | | | 0.12 | | | | | | | | | | | | | | | | | | | | | | | Earnings per basic common share | | $ | 2.03 | | | $ | 2.43 | | | $ | 1.83 | | | $ | 1.48 | | | $ | 1.41 | | | | | | | | | | | | | | | | | | | | | | | Weighted average shares outstanding used in computing earnings per share | | | | | | | | | | | | | | | | | | | | | Basic | | | 109,124 | | | | 115,737 | | | | 120,100 | | | | 122,023 | | | | 120,717 | | | | | | | | | | | | | | | | | | | | | | | Diluted | | | 109,926 | | | | 116,706 | | | | 121,074 | | | | 123,204 | | | | 122,276 | | | | | | | | | | | | | | | | | | | | | | | Dividends declared per common share | | $ | 0.80 | | | $ | 0.18 | | | $ | — | | | $ | — | | | $ | — | | | | | | | | | | | | | | | | | | | | | | | Cash and cash equivalents | | $ | 777,706 | | | $ | 508,799 | | | $ | 358,434 | | | $ | 183,309 | | | $ | 252,211 | | | | | | | | | | | | | | | | | | | | | | | Short-term investments | | $ | — | | | $ | — | | | $ | — | | | $ | 70,898 | | | $ | 140,490 | | | | | | | | | | | | | | | | | | | | | | | Accounts receivable (net of allowances) | | $ | 208,239 | | | $ | 178,717 | | | $ | 169,490 | | | $ | 153,557 | | | $ | 180,566 | | | | | | | | | | | | | | | | | | | | | | |
| | | | | | | | | | | | | | | | | | | | | | | | As of or For the
Years Ended | | | | | December 31,
2015 (1) | | | December 31,
2014 (2) | | | December 31,
2013 (4) | | | December 31,
2012 (5) | | | December 31,
2011 | | | | | (in thousands, except operating margin and per share data) | | Goodwill and intangible assets, net of accumulated amortization | | $ | 1,957,111 | | | $ | 1,998,532 | | | $ | 2,408,871 | | | $ | 2,438,827 | | | $ | 2,367,809 | | | | | | | | | | | | | | | | | | | | | | | Total assets | | $ | 3,146,987 | | | $ | 2,882,533 | | | $ | 3,129,286 | | | $ | 3,013,118 | | | $ | 3,072,849 | | | | | | | | | | | | | | | | | | | | | | | Deferred revenue | | $ | 317,552 | | | $ | 310,775 | | | $ | 319,735 | | | $ | 308,022 | | | $ | 289,217 | | | | | | | | | | | | | | | | | | | | | | | Current maturities of long-term debt | | $ | — | | | $ | — | | | $ | 18,301 | | | $ | 40,654 | | | $ | 5,964 | | | | | | | | | | | | | | | | | | | | | | | Long-term debt, net of current maturities | | $ | 1,579,404 | | | $ | 788,358 | | | $ | 782,652 | | | $ | 805,227 | | | $ | 1,048,462 | | | | | | | | | | | | | | | | | | | | | | | Total shareholders’ equity | | $ | 901,487 | | | $ | 1,432,833 | | | $ | 1,564,347 | | | $ | 1,413,950 | | | $ | 1,294,151 | | | | | | | | | | | | | | | | | | | | | | |
| | As of or For the | | | | | Years Ended | | | | | December 31, | | | December 31, | | | December 31, | | | December 31, | | | December 31, | | | | | 2018 (1) | | | 2017 (2) | | | | 2016 | | | 2015 (3) | | | 2014 (4) | | | | | (in thousands, except operating margin and per share data) | Operating revenues | | $ | 1,433,984 | | | $ | 1,274,172 | | | $ | 1,150,669 | | | $ | 1,075,013 | | | $ | 996,680 | | | Total operating expenses | | | 747,086 | | | | 694,402 | | | | 662,565 | | | | 671,115 | | | | 659,514 | | | Operating income | | | 686,898 | | | | 579,770 | | | | 488,104 | | | | 403,898 | | | | 337,166 | | | Other expense (income), net | | | 57,002 | | | | 112,871 | | | | 102,166 | | | | 54,344 | | | | 28,828 | | | Provision for income taxes | | | 122,011 | | | | 162,927 | | | | 125,083 | | | | 119,516 | | | | 109,396 | | | Income from continuing operations, net of income taxes | | | 507,885 | | | | 303,972 | | | | 260,855 | | | | 230,038 | | | | 198,942 | | | Income (loss) from discontinued operations, net of income taxes | | | — | | | | — | | | | — | | | | (6,390 | ) | | | 85,171 | | (5) | Net income | | $ | 507,885 | | | $ | 303,972 | | | $ | 260,855 | | | $ | 223,648 | | | $ | 284,113 | | | Operating margin | | | 47.9 | % | | | 45.5 | % | | | 42.4 | % | | | 37.6 | % | | | 33.8 | % | | Basic earnings per share: | | | | | | | | | | | | | | | | | | | | | | Earnings per basic common share from continuing operations | | $ | 5.83 | | | $ | 3.36 | | | $ | 2.72 | | | $ | 2.11 | | | $ | 1.72 | | | Earnings per basic common share from discontinued operations | | | — | | | | — | | | | — | | | | (0.06 | ) | | | 0.73 | | | Earnings per basic common share | | $ | 5.83 | | | $ | 3.36 | | | $ | 2.72 | | | $ | 2.05 | | | $ | 2.45 | | | Diluted earnings per share: | | | | | | | | | | | | | | | | | | | | | | Earnings per diluted common share from continuing operations | | $ | 5.66 | | | $ | 3.31 | | | $ | 2.70 | | | $ | 2.09 | | | $ | 1.70 | | | Earnings per diluted common share from discontinued operations | | | — | | | | — | | | | — | | | | (0.06 | ) | | | 0.73 | | | Earnings per diluted common share | | $ | 5.66 | | | $ | 3.31 | | | $ | 2.70 | | | $ | 2.03 | | | $ | 2.43 | | | Weighted average shares outstanding used in computing earnings per share | | | | | | | | | | | | | | | | | | | | | | Basic | | | 87,179 | | | | 90,336 | | | | 95,986 | | | | 109,124 | | | | 115,737 | | | Diluted | | | 89,701 | | | | 91,914 | | | | 96,540 | | | | 109,926 | | | | 116,706 | | | Dividends declared per common share | | $ | 1.92 | | | $ | 1.32 | | | $ | 1.00 | | | $ | 0.80 | | | $ | 0.18 | | |
38
| | As of or For the | | | | | Years Ended | | | | | December 31, | | | December 31, | | | December 31, | | | December 31, | | | December 31, | | | | | 2018 (1) | | | 2017 | | | | 2016 | | | 2015 (3) | | | 2014 (4) | | | | | (in thousands) | Cash and cash equivalents | | $ | 904,176 | | | $ | 889,502 | | | $ | 791,834 | | | $ | 777,706 | | | $ | 508,799 | | | Accounts receivable (net of allowances) | | $ | 473,433 | | | $ | 327,597 | | | $ | 221,504 | | | $ | 208,239 | | | $ | 178,717 | | | Goodwill and intangibles, net of accumulated amortization | | $ | 1,826,564 | | | $ | 1,882,457 | | | $ | 1,903,490 | | | $ | 1,957,111 | | | $ | 1,998,532 | | | Total assets | | $ | 3,387,952 | | | $ | 3,275,668 | | | $ | 3,082,578 | | | $ | 3,146,987 | | | $ | 2,882,533 | | | Deferred revenue | | $ | 537,977 | | | $ | 374,365 | | | $ | 334,358 | | | $ | 317,552 | | | $ | 310,775 | | | Long-term debt, net of current maturities | | $ | 2,575,502 | | | $ | 2,078,093 | | | $ | 2,075,201 | | | $ | 1,579,404 | | | $ | 788,358 | | | Total shareholders' equity (deficit) | | $ | (166,494 | ) | | $ | 401,012 | | | $ | 317,605 | | | $ | 901,487 | | | $ | 1,432,833 | | |
(1) | Includes the impact of the Financial Engineering Associates, Inc. (“FEA”) and Investor Force Holdings, Inc. (“InvestorForce”) divestitures. |
(2) | As a result of the adoption of Accounting Standards Update 2017-07, the Company has restated its Consolidated Statements of Income by reclassifying $0.6 million of non-service related pension costs from Operating Expenses to Other expense (income) for the year ended December 31, 2017. |
(3) | Includes the impact of the Insignis business (“Insignis”) from the October 16, 2015 acquisition date, which was not material. Deferred taxes have been presented in accordance with ASU 2015-17new accounting guidance prospectively beginning on December 31, 2015. Prior periods have not been retrospectively restated to match this presentation. |
(2)(4)
| Includes the results of GMI Ratings from the August 11, 2014 acquisition date, the impact of which was not material. |
(3)(5)
| Includes the net gain resulting from the dispositiondivestiture of ISS, the impact of which was not material.Institutional Shareholder Services Inc. in 2014. |
39
(4) | Includes the results of InvestorForce from the January 29, 2013 acquisition date, the impact of which was not material. |
(5) | Includes the results of IPD from the November 30, 2012 acquisition date, the impact of which was not material. |
| Item 7. | Management’s Discussion and Analysis of Financial Condition and Results of Operations |
The following discussion and analysis of the financial condition and results of our operations should be read in conjunction with the consolidated financial statements and related notes included elsewhere in this Annual Report on Form 10-K. This discussion contains forward-looking statements that involve risks and uncertainties. Our actual results could differ materially from those described below. Such risks and uncertainties include, but are not limited to, those identified below and those described in Part 1, Item 1A. “Risk Factors,” within this Annual Report on Form 10-K. Overview MSCI offers content, applicationsWe are a leading provider of mission-critical investment decision support tools and services — we power investors to support the needs of institutional investors throughoutmake better decisions about their investment processes. MSCIportfolios. Our tools and services help investors better understand the drivers of risk and return and build portfolios to more effectively and efficiently achieve their investment objectives. We are able to do this by leveraging our knowledge of the global investment process and our expertise in research, data, and technology in order to deliver actionable solutions to our clients. We are dynamic and flexible in the delivery of our content and capabilities, such as our indexes; portfolio construction tools and risk-management services; ESG research and ratings; and real estate benchmarks, return analytics services and market insights; much of which can be accessed by our clients through multiple channels and platforms.
Our clients comprise a wide spectrum of the global investment industry and include the following key client segments: asset owners such as pension(pension funds, endowments, foundations, central banks, sovereign wealth funds, family offices and insurance companies;companies), asset management firms, such asmanagers (institutional, mutual funds, hedge funds, providers of exchange-traded funds (“ETFs”);ETFs, insurance, private wealth, managers;private banks and real estate investment trusts), financial intermediaries such as banks,(banks, broker-dealers, exchanges, custodians, trust companies and investment consultants.consultants) and wealth managers (including an increasing number of “robo-advisors”). Our productsThrough a combined use of the content and services include indexescapabilities provided by each of our operating segments — Index, Analytics, ESG and analytical models; ratings and analysis that enable institutional investorsReal Estate — our clients gain a broad view of the global investment industry, which enables them to integrate environmental, social and governance (“ESG”) factors intomanage their investment strategies; and analysis of real estateobjectives across multiple asset classes in both privately and publicly owned portfolios. Clients use our content and applications to help construct portfolios and allocate assets. Our analytical tools help them measure and manage risk across all major asset classes. MSCI products and services can also be customized to meet the specific needs of our clients. an increasingly integrated manner.
As of December 31, 2015,2018, we had approximately 6,400over 7,000 clients across 8690 countries. To calculate the number of clients, we may count certainuse the shipping address of the ultimate customer utilizing the product which counts affiliates, user locations, or business units within a single organization as separate clients. If we aggregate all related clients under their respective parent entity, the number of clients would be approximately 3,850,over 4,000 as of December 31, 2015. We2018. As of December 31, 2018, we had offices in 3531 cities in 2221 countries to help serve our diverse client base, with 52.2%50.2% of our revenues coming from clients in the Americas, 35.5%35.4% in Europe, the Middle East and Africa (“EMEA”) and 12.3%14.4% in Asia and Australia. Our principal business model is generally to license annual, recurring subscriptions tofor the majority of our Index, Analytics and ESG products and services for use at specified locations, oftena fee due in advance of the service period. We also license annual recurring subscriptions for the majority of our Real Estate products for a fee which is primarily paid in arrears after the product is delivered, with the exception of the Market Information product for which the fees are generally paid in advance. Recurring fees may vary based on a number of factors including by a givenproduct or service, number of users or for a certain volume of services, for an annual fee paid up-front. Additionally, ourservices. Our recurring subscriptions include our managed services offering, whereby we overseeclient contracts do not have a financing component and the production of risk and performance reports on behalf of our clients. Fees attributable to annual, recurring subscriptions are recorded as deferred revenues on our Consolidated Statement of Financial Condition and are recognized on our Consolidated Statement of Income as the serviceconsideration received is rendered. Furthermore, atypically not variable. A portion of our revenuesfees are variable and comes from clients who use our indexes as the basis for index-linked investment products, such as ETFs, or as the basis for passively managed funds and separate accounts. These clients commonly pay us a license fee, for the use of our intellectual propertytypically in arrears, primarily based on the AUM in their investment product’s assets.products and these fees are typically variable. We also generate revenueshave variable fees from certain exchanges that use our indexes as the basis for futures and options contracts and pay us a license fee for the use of our intellectual propertyin arrears, primarily based on theirthe volume of trades. In addition, we generate revenues from subscription agreements for the receipttrades or number of periodic benchmark reports, digests and other publications, which are most often associated with our real estate products that are recognized upon delivery of such reports or data updates.instruments. We also receive revenues fromrealize one-time fees commonly related to certain implementation services, historical or customized reports, advisoryhistorical data sets, certain derivative financial products and certain implementation and consulting services, andas well as from certainparticular products and services that are designed for one-time usage.purchased on a non-renewal basis. 40
In evaluating our financial performance, we focus on revenue and profit growth, including GAAP andresults accounted for under accounting principles generally accepted in the United States (“GAAP”) as well as non-GAAP measures, for the Company as a whole as well asand by operating segment. In addition, we focus on operating metrics, including Run Rate, subscription sales and Aggregate Retention Rate to manage the business. Our business is not highly capital intensive and, as such, we expect to continue to convert a high percentage of our profits into excess cash in the future. Our growth strategy includes: (a) expanding leadership in research-enhanced content, (b) strengthening existing and deepeningnew client relationships by providing solutions, (c) improving access to our solutions through cutting-edge technology and platforms, (d) expanding value-added service offerings and (e) executing strategic relationships and acquisitions with investment institutions worldwide; (b) developing new and enhancing existing product offerings, including combining existing product features or data derived from our products to create new products; and (c) seeking to acquire products, technologies and companies that will enhance, complement or expand our client base and product offerings.
During the years ended December 31, 2014 and 2013, we significantly invested in and expanded our operating functions and infrastructure, including additional product management, sales and client support staff and facilities in locations around the world as well as our research and our data operationscomplementary content and technology functions. The purpose was to maximize our medium-term revenue and profit growth, while at the same time ensuring that MSCI would remain a leading provider of investment decision support tools into the future. As a result, the rate of growth of our investments and expenses had, in recent years, exceeded that of our revenues, which had slowed the growth of, or even reduced, our earnings. For example, for the year ended December 31, 2014, our revenues grew by 9.1% but our operating income decreased by 0.9% compared to the year ended December 31, 2013 due, in part, to increased investment in our business. We completed our incremental level of investment in the year ended December 31, 2014, and have again achieved operating margin expansion for the year ended December 31, 2015.companies.
Changes in Presentation
Effective during the year ended December 31, 2015, we changed our reportable segments to reflect certain changes made to the management of our product lines. This presentation better aligns our financial reporting with how our products and services are offered to our clients and offers additional insight into how we manage the Company. We previously disclosed one reportable segment. Following the change, we began disclosing three reportable segments: Index, Analytics and All Other. The All Other segment consists of ESG and Real Estate. See Note 13, “Segment Information,” of the Notes to the Consolidated Financial Statements included herein for further information about MSCI’s reportable segments.
Effective during the year ended December 31, 2015, we changed our presentation of operating expenses in order to provide more transparency into our underlying cost base, consistent with how we manage the Company. Prior to the change, operating expenses were grouped and presented as cost of services and selling, general and administrative. See Note 1, “Introduction And Basis Of Presentation,” of the Notes to the Consolidated Financial Statements included herein for further information.
The previously issued financial information has been recast to conform to the current presentation.
Key Financial Metrics and Drivers WeAs discussed in the previous section, we utilize a portfolio of key financial metrics to manage the Company, including GAAP and non-GAAP measures. As detailed below, we review revenues by type and by segment, or major product line. We also review expenses by activity, which provides more transparency into how resources are being deployed. In addition, we utilize operating metrics including Run Rate, subscription sales and Aggregate Retention Rate to analyze past performance and to provide insight into our latest reported portfolio of recurring business.
In the discussion that follows, we provide certain variances excluding the impact of foreign currency exchange rate fluctuations. Foreign currency exchange rate fluctuations reflect the difference between the current period results as reported compared to the current period results recalculated using the foreign currency exchange rates in effect for the comparable prior period. While operating revenues adjusted for the impact of foreign currency fluctuations includes asset-based fees that have been adjusted for the impact of foreign currency fluctuations, the underlying AUM, which is the primary component of asset-based fees, is not adjusted for foreign currency fluctuations. Approximately two-thirds of the AUM are invested in securities denominated in currencies other than the U.S. dollar, and accordingly, any such impact is excluded from the disclosed foreign currency adjusted variances. Revenues Our revenues are characterized by type, which broadly reflects the nature of how they are recognized or earned. Our revenue types are recurring subscription, asset-based fees and non-recurring revenues. We also group our revenues by segment and provide the revenue type within each segment. See Part 1, Item 1. “Business—Our ProductOperating Segments” above for additional details on the products and services that we offer. Recurring subscription revenues represent fees earned from clients primarily under renewable contracts or agreements and are recognized in most cases ratably over the term of the license or service pursuant to the contract terms. The contracts state the terms under which these fees are to be calculated. The fees are recognized as we provide the product and service to the client over the license period and are generally billed in advance, prior to the license start date. When implementation services are included, we recognize revenues ratably from the date the application is put into production through the end of the license period. Revenues associated with the implementation services, which are allocated based on MSCI’s best estimated sales price for such implementation services, are recognized ratably over the useful life of those services. Revenues from subscription agreements for the receipt of periodic benchmark reports, digests, and other publications, which are most often associated with our real estate benchmark business, are recognized upon delivery of such reports or data updates. Asset-based fees are principally recognized basedrepresent fees earned on the estimated assets under management (“AUM”)AUM linked to our indexes from independent third-party sources or the most recently reported information provided by the client. Asset-based fees also include revenues related to futures and options contracts linked to our indexes, which are primarily based on trading volumes. Non-recurring revenues primarily represent fees earned on products and services where we do not have renewal contracts and primarily include revenues for providing historical data, certain implementation services and other special client requests. Based on Effective January 1, 2018, MSCI adopted the naturenew revenue standard as set forth under ASC Subtopic 606-10, “Revenue from Contracts with Customers.” See Note 1, “Introduction and Basis of Presentation—Significant Accounting Policies—Revenue Recognition,” of the services provided, non-recurring revenues are recognized upon delivery, invoicing or overNotes to the service period.Consolidated Financial Statements included herein for further information on our revenue recognition policy. 41
Operating Expenses We group our operating expenses into the following activity categories: Research and development (“R&D”); General and administrative (“G&A”); Amortization of intangible assets; and Depreciation and amortization of property, equipment and leasehold improvements. Costs are assigned to these activity categories based on the nature of the expense or, when not directly attributable, an estimate is allocated based on the type of the effort involved. Cost of Revenues Cost of revenues consists of costs related to the production and servicing of our products and services and primarily includes related information technology costs, including data center, platform and infrastructure costs; costs to acquire, produce and maintain market data information; costs of research to support maintain and rebalancemaintain existing products; costs of product management teams; costs of client service and consultant teams to support customer needs; as well as other support costs directly attributable to the cost of revenues including certain human resources, finance and legal costs. Selling and Marketing Selling and marketing expenses consistsconsist of costs associated with acquiring new clients or selling new products or product renewals to existing clients and primarily includes the costs of our sales force and marketing teams, as well as costs incurred in other groups associated with acquiring new business, including product management, research, technology and sales operations. Research and Development R&D expenses consistsconsist of the costs to develop new or enhance existing products and the costs to develop new or improved technology and service platforms for the delivery of our products and services and primarily includesinclude the costs of application development, research, product management, project management and the technology support associated with these efforts. General and Administrative G&A expenses consistsconsist of costs primarily related to finance operations, human resources, office of the CEO, legal, corporate technology, corporate development and certain other administrative costs that are not directly attributed, but are instead allocated, to a product or service. Amortization of Intangible Assets Amortization of intangible assets expense relates to definite-lived intangible assets arising from past acquisitions and consistsinternal capitalized software projects. Intangibles arising from past acquisitions consist of customer relationships, trademarks and trade names, technology and software, proprietary processes and data and non-competition agreements. We amortize definite-lived intangible assets over their estimated useful lives. Definite-lived intangible assets are tested for impairment when impairment indicators are present, and, if impaired, written down to fair value based on either discounted cash flows or appraised values. No impairment of intangible assets has been identified during any of the periods presented. We have no indefinite-lived intangibles. The intangible assets have remaining useful lives ranging from one to 20 years.assets. 42
Depreciation and amortization of property, equipment and leasehold improvements This category consists of expenses related to depreciating or amortizing the cost of furniture &and fixtures, computer and related equipment and leasehold improvements over the estimated useful life of the assets. Other Expense (Income), net This category consists primarily of interest we pay on our outstanding indebtedness, interest we collect on cash and short-term investments, transition services income associated with our sale of ISS, foreign currency exchange rate gains and losses as well as other non-operating income and expense items. Non-GAAP Financial Measures Adjusted EBITDA “Adjusted EBITDA,” a measure used by management to assess operating performance, is defined as net income plus income (loss) from discontinued operations, net of income taxes,before (1) provision for income taxes, (2) other expense (income), net, (3) depreciation and amortization of property, equipment and leasehold improvements, (4) amortization of intangible assets and, at times, (5) certain other transactions or adjustments. “Adjusted EBITDA expenses,” a measure used by management to assess operating performance, is defined as operating expenses less depreciation and amortization of property, equipment and leasehold improvements and amortization of intangible assets.assets and, at times, certain other transactions or adjustments. The Company believes the Adjusted EBITDA and Adjusted EBITDA expenses are believed to be meaningful measures are importantof the operating performance of the Company because they adjust for significant one-time, unusual or non-recurring items as well as eliminate the accounting effects of capital spending and acquisitions that do not directly affect what management considers to be the Company’s core operating performance in highlighting trends because these measures exclude costs that are more fixed from period tothe period. In addition, these measures provide more comparability between the historical operating results and recent operating results that reflect changes due to acquisitions, investments and capital structure. All companies do not calculate adjusted EBITDA and adjusted EBITDA expenses in the same way. These measures can differ significantly from company to company depending on, among other things, long-term strategic decisions regarding capital structure, the tax jurisdictions
in which companies operate and capital investments. Accordingly, the Company’s computation of the Adjusted EBITDA and Adjusted EBITDA expenses measures may not be comparable to similarly titled measures computed by other companies. Run Rate Run Rate is a key operating metric and is important because an increase or decrease in our Run Rate ultimately impacts our operating revenues over time. At the end of any period, we generally have subscription and investment product license agreements in place for a large portion of total revenues for the following 12 months. We measure the fees related to these agreements and refer to this as “Run Rate.” See “—Operating Metrics—Run Rate” below for additional information on the calculation of this metric. Subscription Sales Subscription sales is a key operating metric and is important because new subscription sales increase our Run Rate and ultimately our operating revenues.revenues over time. See “—Operating Metrics—Metrics—Subscription Sales” below for additional information. Aggregate Retention Rate
Another key operating metric is Aggregate Retention Rate which is important because subscription cancellations decrease our Run Rate and ultimately our operating revenues.revenues over time. See “—Operating Metrics—Aggregate Retention Rate” below for additional information on the calculation of this metric. 43
Critical Accounting Policies and Estimates Our consolidated financial statements are prepared in accordance with accounting principles generally accepted in the United States (“GAAP”).GAAP. These accounting principles require us to make certain estimates and judgments that can affect the reported amounts of assets and liabilities as of the date of the consolidated financial statements, as well as the reported amounts of revenues and expenses during the periods presented. We believe the estimates and judgments upon which we rely are reasonable based upon information available to us at the time these estimates and judgments are made. To the extent there are material differences between these estimates and actual results, our consolidated financial statements will be affected. See Note 1, “Introduction And Basis Of Presentation—Significant Accounting Policies,” and Note 2, “Recent Accounting Standards Updates,” of the Notes to the Consolidated Financial Statements included herein for a listing of our accounting policies. Factors Affecting the Comparability of Results Acquisition of GMI RatingsDivestitures
On August 11, 2014,1, 2016, we completed the acquisitiondivestiture of GMI Ratings for $15.5 millionour Real Estate occupiers business, which was included as a component of the All Other segment through our subsidiary MSCI ESG Research Inc. GMI Ratings is a providerthe date of corporate governance research and ratings on over 6,000 companies worldwide. Clientsdivestiture. The value of GMI Ratings include leading institutional investors, banks, insurers, auditors, regulators and corporations seeking to incorporate ESG factors into risk assessment and decision-making. The purchase price allocations for the GMI Ratings acquisition were $9.9 million for goodwill, $3.6 million for identifiable intangible assets, $6.7 million for assets other than identifiable intangibledisposed assets and $4.7liabilities and the resulting gain on disposal were not material to the Company.
On April 9, 2018, we completed the divestiture of FEA for $21.0 million for other liabilities.in cash, which resulted in a gain of $10.6 million. FEA was included as a component of the Analytics segment through the date of divestiture. The results of GMI Ratings were included in our results of operations from its acquisitionFEA were not material to the Company. On October 12, 2018, we completed the divestiture of InvestorForce and received $62.8 million in cash, subject to a working capital adjustment, which resulted in a gain of $46.6 million. InvestorForce was included as a component of the Analytics segment through the date of August 11, 2014.divestiture. The GMI Ratings acquisition has not had a significant impact on our results of operations.operations from InvestorForce were not material to the Company. Share Repurchases On December 13, 2012, theThe Board of Directors has approved a stock repurchase program authorizingfor the purchase of upthe Company’s common stock. See Note 9, “Shareholders’ Equity (Deficit),” of the Notes to $300.0 million worth of shares ofConsolidated Financial Statements included herein for additional information on our common stock beginning immediately and continuing throughrepurchase program.
For the year ended December 31, 2014 (the “2012 Repurchase Program”). We utilized $200.0 million of2016, the repurchase authority through December 31, 2013. On February 6, 2014, we utilized the remaining $100.0 million repurchase authorization provided by the 2012 Repurchase Program by entering into an ASR agreement to initiate share repurchases aggregating $100.0 million (the “February 2014 ASR Agreement”).
On February 4, 2014, the Board of Directors approved a stock repurchase program authorizing the purchase of up to $300.0 million worth of shares of our common stock, which was subsequently increased to $850.0 million (the “2014 Repurchase Program”). On October 14, 2015, we exhausted the $850.0 million share repurchase authorization under the 2014 Repurchase Program.
On October 28, 2015, the Board of Directors approved a new stock repurchase program authorizing the purchase of up to $1.0 billion worth of shares of our common stock (the “2015 Repurchase Program”). Share repurchases made pursuant to the 2015 Repurchase Program may take place in the open market or in privately negotiated transactions from time to time based on market and other conditions. This authorization may be modified, suspended or terminated by the Board of Directors at any time without prior notice.
On September 18, 2014, as part of the 2014 Repurchase Program, we entered into an ASR agreement to initiate share repurchases aggregating $300.0 million (the “September 2014 ASR Agreement”). As a result of the September 2014 ASR Agreement, we receivedCompany repurchased approximately 4.510.3 million shares of our common stock on September 19, 2014 and approximately 1.2 million shares of our common stock on May 21, 2015 for a combinedat an average price of $52.79$73.71 per share.
On June 2, 2015, we began purchasing sharesshare for a total value of our common stock on the$759.4 million pursuant to open market in accordance with SEC Rule 10b5-1. Throughrepurchases.
For the year ended December 31, 2015, we paid $670.8 million to receive2017, the Company repurchased approximately 10.71.6 million shares at an average price of our common stock on the$87.96 per share for a total value of $136.9 million pursuant to open market as part ofrepurchases. For the 2014 Repurchase Program and the 2015 Repurchase Program. Pursuant to the 2014 Repurchase Program and the 2015 Repurchase Program, as ofyear ended December 31, 2015, we purchased2018, the Company repurchased approximately 6.2 million shares at an average price of $148.34 per share for a total value of 16.4$925.0 million shares of our common stock for an average purchase price of $59.22 per share.
Since the announcement of the September 2014 $1.0 billion capital return plan and through December 31, 2015, approximately $1.1 billion was returned through share repurchases and cash dividends and a total of $1.4 billion was returnedpursuant to shareholders since 2012.open market repurchases.
The weighted average shares outstanding used in calculatingto calculate our basic and diluted earnings per share decreased by 5.8% and 3.6% for the year ended December 31, 20152018 decreased by 2.4% compared to the year ended December 31, 2017, and 2014, respectively, reflectingby 4.8% for the year ended December 31, 2017 compared to the year ended December 31, 2016. The decreases in both periods primarily reflect the impact of share repurchases made pursuant to the share repurchase programs,2016 and 2018 Repurchase Programs, partially offset by the impact of higher dilution, primarily caused by restricted stock units and stock options convertingfor which the ultimate payout is tied to shares.the achievement of multi-year total shareholder return targets. Senior Notes and Credit Agreement On November 20, 2014, we completed our first private offeringWe have issued an aggregate of $800.0 million aggregate principal amount of 5.25% senior unsecured notes due 2024 (the “2024$2.6 billion in Senior Notes”)Notes and also entered into a new $200.0$250 million senior unsecured revolving credit agreement (the “2014 Revolving Credit Agreement with a syndicate of banks. See “–Liquidity and Capital Resources–Senior Notes and Credit Agreement”). We used the net proceeds from the offering below and Note 5, “Commitments and Contingencies,” of the 2024Notes to Consolidated Financial Statements included herein for additional information on our Senior Notes together with cash on hand, to repay in full our outstanding term loan indebtednessand Revolving Credit Agreement.
44
Tax Cuts and Jobs Act of $794.8 million, which bore interest at LIBOR plus a margin of 2.25%.2017 On August 13, 2015, we completed our second private offeringDecember 22, 2017, the U.S. government enacted comprehensive tax legislation commonly referred to as the Tax Cuts and Jobs Act (“Tax Reform”). Tax Reform significantly revised the U.S. corporate income tax by, among other things, lowering U.S. corporate income tax rates, implementing a territorial tax system and imposing a one-time tax on deemed repatriation of $800.0historic earnings of foreign subsidiaries (the “Toll Charge”). In the year ended December 31, 2017, as part of Tax Reform, the Company recorded a provisional net charge to the provision for income taxes of $34.5 million aggregate principal amountfor the year ended December 31, 2017. The net charge of 5.75% senior unsecured notes due 2025 (the “2025 Senior Notes”)$34.5 million primarily included an estimated tax charge of approximately $47.5 million related to the Toll Charge and received $789.5an estimated tax charge of approximately $16.0 million related to a change in assertion that profits were permanently reinvested overseas as of December 31, 2017, partially offset by an estimated tax benefit of approximately $29.0 million related to the revaluation of deferred taxes at the now-lower statutory corporate rate. In the year ended December 31, 2018, the Company finalized the Toll Charge and determined the final impact of Tax Reform resulting in a net benefit of $10.5$11.2 million that included a benefit of debt issuance costs. As$5.7 million on the true-up of the Toll Charge and a benefit of $2.6 million for a reduction in the expected withholding taxes from foreign subsidiaries. The Company also recorded a benefit of $2.9 million related to the revaluation of deferred taxes at the lower statutory rate as a result of these offerings, our interest expense fortax planning. The cumulative net charge of Tax Reform was $23.3 million. Basis of Presentation Certain prior period amounts have been reclassified to conform to the current year has increased. The annual interest expense related to these offerings is expected to be approximately $92.0 million. We intend to use the net proceeds from the offering of the 2025 Senior Notes for general corporate purposes, including, without limitation, buybacks of MSCI common stock. period presentation.Results of Operations Year Ended December 31, 20152018 Compared to Year Ended December 31, 20142017 The following table presents the results of operations for the years indicated: | | | | | | | | | | Years Ended | | | | | | | | | | | | | Years Ended | | | | | | | | December 31, | | | December 31, | | | | | | | | | | | | | December 31,
2015 | | December 31,
2014 | | Increase/
(Decrease) | | | 2018 | | | 2017 | | | Increase/(Decrease) | | | | | (in thousands, except
per share data) | | | | | | | | (in thousands, except per share data) | | | | | | Operating revenues | | $ | 1,075,013 | | | $ | 996,680 | | | $ | 78,333 | | | | 7.9 | % | | $ | 1,433,984 | | | $ | 1,274,172 | | | $ | 159,812 | | | | 12.5 | % | Operating expenses: | | | | | | | | | | | | | | | | | | | | | | | | | Cost of revenues | | | 267,695 | | | 276,623 | | | (8,928 | ) | | | (3.2 | %) | | | 287,335 | | | | 273,681 | | | | 13,654 | | | | 5.0 | % | Selling and marketing | | | 162,294 | | | 163,839 | | | (1,545 | ) | | | (0.9 | %) | | | 192,923 | | | | 177,121 | | | | 15,802 | | | | 8.9 | % | Research and development | | | 77,320 | | | 71,095 | | | 6,225 | | | | 8.8 | % | | | 81,411 | | | | 75,849 | | | | 5,562 | | | | 7.3 | % | General and administrative | | | 86,007 | | | 76,369 | | | 9,638 | | | | 12.6 | % | | | 99,882 | | | | 87,764 | | | | 12,118 | | | | 13.8 | % | Amortization of intangible assets | | | 46,910 | | | 45,877 | | | 1,033 | | | | 2.3 | % | | | 54,189 | | | | 44,547 | | | | 9,642 | | | | 21.6 | % | Depreciation and amortization of property, equipment, and leasehold improvements | | | 30,889 | | | 25,711 | | | 5,178 | | | | 20.1 | % | | | | | | | | | | | | | | | Depreciation and amortization of property, equipment and leasehold improvements | | | | 31,346 | | | | 35,440 | | | | (4,094 | ) | | | (11.6 | %) | Total operating expenses | | | 671,115 | | | 659,514 | | | 11,601 | | | | 1.8 | % | | | 747,086 | | | | 694,402 | | | | 52,684 | | | | 7.6 | % | | | | | | | | | | | | | | Operating income | | | 403,898 | | | 337,166 | | | 66,732 | | | | 19.8 | % | | | 686,898 | | | | 579,770 | | | | 107,128 | | | | 18.5 | % | Other expense (income), net | | | 54,344 | | | 28,828 | | | 25,516 | | | | 88.5 | % | | | 57,002 | | | | 112,871 | | | | (55,869 | ) | | | (49.5 | %) | | | | | | | | | | | | | | Income from continuing operations before provision for income taxes | | | 349,554 | | | 308,338 | | | 41,216 | | | | 13.4 | % | | Income before provision for income taxes | | | | 629,896 | | | | 466,899 | | | | 162,997 | | | | 34.9 | % | Provision for income taxes | | | 119,516 | | | 109,396 | | | 10,120 | | | | 9.3 | % | | | 122,011 | | | | 162,927 | | | | (40,916 | ) | | | (25.1 | %) | | | | | | | | | | | | | | Income from continuing operations | | | 230,038 | | | 198,942 | | | 31,096 | | | | 15.6 | % | | Income (loss) from discontinued operations, net of income taxes | | | (6,390 | ) | | 85,171 | | | (91,561 | ) | | | (107.5 | %) | | | | | | | | | | | | | | | Net income | | $ | 223,648 | | | $ | 284,113 | | | $ | (60,465 | ) | | | (21.3 | %) | | $ | 507,885 | | | $ | 303,972 | | | $ | 203,913 | | | | 67.1 | % | | | | | | | | | | | | | | | | | | | | | | | | | | | | | Earnings per basic common share: | | | | | | | | | | From continuing operations | | $ | 2.11 | | | $ | 1.72 | | | $ | 0.39 | | | | 22.7 | % | | From discontinued operations | | | (0.06 | ) | | 0.73 | | | (0.79 | ) | | | (108.2 | %) | | | | | | | | | | | | | | | Earnings per basic common share | | $ | 2.05 | | | $ | 2.45 | | | $ | (0.40 | ) | | | (16.3 | %) | | $ | 5.83 | | | $ | 3.36 | | | $ | 2.47 | | | | 73.5 | % | | | | | | | | | | | | | | Earnings per diluted common share: | | | | | | | | | | From continuing operations | | $ | 2.09 | | | $ | 1.70 | | | $ | 0.39 | | | | 22.9 | % | | From discontinued operations | | | (0.06 | ) | | 0.73 | | | (0.79 | ) | | | (108.2 | %) | | | | | | | | | | | | | | | | | | | | | | | | | | | | | | Earnings per diluted common share | | $ | 2.03 | | | $ | 2.43 | | | $ | (0.40 | ) | | | (16.5 | %) | | $ | 5.66 | | | $ | 3.31 | | | $ | 2.35 | | | | 71.0 | % | | | | | | | | | | | | | | | | | | | | | | | | | | | | | Operating margin | | | 37.6 | % | | 33.8 | % | | | | | | | 47.9 | % | | | 45.5 | % | | | | | | | | | | | | | | | | | | | | |
45
Operating Revenues Our revenues are grouped by the following types: recurring subscription, asset-based fees and non-recurring revenues. We also group revenues by major product or reportable segmentlines as follows: Index, Analytics and All Other, which includes the ESG and Real Estate products.product lines. The following table presents operating revenues by recurring subscriptions, asset-based fees and non-recurring revenues for the years indicated: | | | | | | | | | | Years Ended | | | | | | | | | | | | | Years Ended | | | | | | | | | December 31, | | | December 31, | | | | | | | | | | | | | December 31,
2015 | | | December 31,
2014 | | | Increase/(Decrease) | | | 2018 | | | | 2017 | | | Increase/(Decrease) | | | | | (in thousands) | | | | | | | | | (in thousands) | | | | | | Recurring subscriptions | | | 857,527 | | | | 801,183 | | | | 56,344 | | | | 7.0 | % | | $ | 1,066,536 | | | $ | 973,023 | | | $ | 93,513 | | | | 9.6 | % | Asset-based fees | | | 197,974 | | | | 177,105 | | | | 20,869 | | | | 11.8 | % | | | 336,565 | | | | 276,092 | | | | 60,473 | | | | 21.9 | % | Non-recurring revenue | | | 19,512 | | | | 18,392 | | | | 1,120 | | | | 6.1 | % | | | | | | | | | | | | | | | Non-recurring | | | | 30,883 | | | | 25,057 | | | | 5,826 | | | | 23.3 | % | Total operating revenues | | $ | 1,075,013 | | | $ | 996,680 | | | $ | 78,333 | | | | 7.9 | % | | $ | 1,433,984 | | | $ | 1,274,172 | | | $ | 159,812 | | | | 12.5 | % | | | | | | | | | | | | | |
Total operating revenues grew 7.9%12.5% to $1,075.0$1,434.0 million for the year ended December 31, 20152018 compared to $996.7$1,274.2 million for the year ended December 31, 2014.2017. Adjusting for the impact of foreign currency exchange rate fluctuations, total operating revenues would have increased 12.4% for the year ended December 31, 2018 compared to the year ended December 31, 2017. Revenue from recurring subscriptions increased 7.0%9.6% to $857.5$1,066.5 million for the year ended December 31, 20152018 compared to $801.2$973.0 million for the year ended December 31, 2014. The increase in subscription revenues was2017, primarily driven by growth fromin Index products, as well as higherwhich increased $50.3 million, or 11.8%, and growth in Analytics products’ revenues, partially offset by lower Real Estate products’ revenues within our All Other segment.products, which increased $22.1 million, or 4.9%. Adjusting for the impact of foreign currency exchange rate fluctuations, recurring subscriptions revenues would have increased 8.8%9.4% for the year ended December 31, 20152018 compared to the year ended December 31, 2014.2017. Revenues from asset-based fees increased 11.8%21.9% to $198.0$336.6 million for the year ended December 31, 20152018 compared to $177.1$276.1 million for the year ended December 31, 2014.2017. The increase in asset-based fees was driven by higher average AUMstrong growth across all types of index-linked investment products, including a $34.7 million, or 18.2%, increase in both ETFs and non-ETF passive funds as well as higher trading volumes in futures and options contracts, all linked to MSCI indexes. The average value of AUM inrevenue from ETFs linked to MSCI indexes, which was driven by a 21.9% increase in average AUM, partially offset by the impact of a change in product mix. In addition, revenue from non-ETF passive products grew $22.0 million, or 30.3%, primarily driven by higher AUM and an increased $56.3 billion,contribution from higher-fee products. Revenues from exchange traded futures and options contracts based on MSCI indexes grew $3.8 million, or 15.5%28.2%, compared to the year ended December 31, 2014. Approximately two-thirdsdriven, in part, by an increase in total trading volumes. The impact of the underlying securities included in the AUM of our index-linked investment products are denominated in currencies other than the U.S. dollar.foreign currency exchange rate fluctuations on revenues from asset-based fees was negligible. The following table presents the value of AUM in ETFs linked to MSCI indexes and the sequential change of such assets as of the end of each of the periods indicated: | | | | | | | | | | | | | | | | | | | | | | | | | | | | | | | | | | | | Period Ended(1) | | | | | 2014 | | | 2015 | | | | | March 31, | | | June 30, | | | September 30, | | | December 31, | | | March 31, | | | June 30, | | | September 30, | | | December 31, | | | | | (in billions) | | AUM in ETFs linked to MSCI Indexes(2) | | $ | 340.8 | | | $ | 378.7 | | | $ | 377.9 | | | $ | 373.3 | | | $ | 418.0 | | | $ | 435.4 | | | $ | 390.2 | | | $ | 433.4 | | Sequential Change in Value | | | | | | | | | | | | | | | | | | | | | | | | | Market Appreciation/(Depreciation) | | $ | 1.3 | | | $ | 15.2 | | | $ | (17.2 | ) | | $ | (8.3 | ) | | $ | 13.0 | | | $ | (6.9 | ) | | $ | (48.2 | ) | | $ | 14.5 | | Cash Inflow/(Outflow) | | | 6.6 | | | | 22.7 | | | | 16.4 | | | | 3.7 | | | | 31.7 | | | | 24.3 | | | | 3.0 | | | | 28.7 | | | | | | | | | | | | | | | | | | | | | | | | | | | | | | | | | | | Total Change | | $ | 7.9 | | | $ | 37.9 | | | $ | (0.8 | ) | | $ | (4.6 | ) | | $ | 44.7 | | | $ | 17.4 | | | $ | (45.2 | ) | | $ | 43.2 | | | | | | | | | | | | | | | | | | | | | | | | | | | | | | | | | | |
| | Period Ended (1) | | | | 2017 | | | 2018 | | (in billions) | | March 31, | | | June 30, | | | September 30, | | | December 31, | | | March 31, | | | June 30, | | | September 30, | | | December 31, | | AUM in ETFs linked to MSCI indexes (2), (3) | | $ | 555.7 | | | $ | 624.3 | | | $ | 674.3 | | | $ | 744.3 | | | $ | 764.9 | | | $ | 744.7 | | | $ | 765.5 | | | $ | 695.6 | | Sequential Change in Value | | | | | | | | | | | | | | | | | | | | | | | | | | | | | | | | | Market Appreciation/ (Depreciation) | | $ | 35.8 | | | $ | 23.6 | | | $ | 32.2 | | | $ | 32.0 | | | $ | (11.7 | ) | | $ | (19.4 | ) | | $ | 15.6 | | | $ | (94.7 | ) | Cash Inflows | | | 38.5 | | | | 45.0 | | | | 17.8 | | | | 38.0 | | | | 32.3 | | | | (0.8 | ) | | | 5.2 | | | | 24.8 | | Total Change | | $ | 74.3 | | | $ | 68.6 | | | $ | 50.0 | | | $ | 70.0 | | | $ | 20.6 | | | $ | (20.2 | ) | | $ | 20.8 | | | $ | (69.9 | ) |
Source: Bloomberg and MSCI (1) | The historical values of the assets in ETFs linked to our indexes as of the last day of the month and the monthly average balance can be found under the link “AUM in ETFs Linked to MSCI Indexes”indexes” on our |
46
| Investor Relations homepage athttp://ir.msci.com. This information is updated on or about the second U.S. business day of each month. Information contained on our website is not incorporated by reference into this Annual Report on Form 10-K or any other report filed with the SEC. |
(2(2))
| The value of assets under management in ETFs linked to MSCI Indexes is calculated by multiplying the ETF net asset value by the number of shares outstanding. |
(3) | The AUM in ETFs numbers also include AUM in Exchange Traded Notes, the value of which is less than 1.0% of the AUM amounts presented. |
The following table presents the average value of AUM in ETFs linked to MSCI indexes for the periods indicated: As of
| | Year-to-Date Average (1) | | | | 2017 | | | 2018 | | | | March | | | June | | | September | | | December | | | March | | | June | | | September | | | December | | AUM in ETFs linked to MSCI Indexes | | $ | 524.1 | | | $ | 559.5 | | | $ | 591.1 | | | $ | 621.4 | | | $ | 779.5 | | | $ | 778.0 | | | $ | 770.6 | | | $ | 757.2 | | _____________ | | | | | | | | | | | | | | | | | | | | | | | | | | | | | | | | | Source: Bloomberg and MSCI | | | | | | | | | | | | | | | | | | | | | | | | | | | | | | | | | (1)For additional information on AUM amounts presented in this table, please refer to the footnotes in the table presenting AUM in ETFs linked to MSCI equity indexes for "Period Ended" in Part II, Item 7. "Management's Discussion and Analysis of Financial Condition and Results of Operations—Results of Operations—Operating Revenues." | |
For the year ended December 31, 2015,2018, the average value of AUM in ETFs linked to MSCI equity indexes was $433.4$757.2 billion, up $60.1$135.8 billion, or 16.1%21.9%, from $373.3$621.4 billion as offor the year ended December 31, 2014. Of the $433.4 billion of AUM in ETFs linked to MSCI equity indexes as of December 31, 2015, 57.8% were linked to indexes related to developed markets outside of the U.S., 19.8% were linked to U.S. market indexes, 17.2% were linked to emerging market indexes and 5.2% were linked to other global indexes.2017. Non-recurring revenues increased 6.1%23.3% to $19.5$30.9 million for the year ended December 31, 2015,2018, compared to $18.4$25.1 million for the year ended December 31, 2014,2017, primarily resulting from higher one-time sales ofdriven by growth in Index and Analytics products, partially offset by lower one-time sales of Real Estate products within our All Other segment.which increased $5.7 million, or 36.7%. The following table presents operating revenues by reportable segment and revenue type for the years indicated: | | | | | | | | | | Years Ended | | | | | | | | | | | | | Years Ended | | | | | | | | | December 31, | | | December 31, | | | | | | | | | | | | | December 31,
2015 | | | December 31,
2014 | | | Increase/(Decrease) | | | 2018 | | | | 2017 | | | Increase/(Decrease) | | | | | (in thousands) | | | | | | | | | (in thousands) | | | | | | Operating revenues: | | | | | | | | | | | | | | | | | | | | | | | | | Index | | | | | | | | | | | | | | | | | | | | | | | | | Recurring subscriptions | | $ | 353,136 | | | $ | 320,113 | | | $ | 33,023 | | | | 10.3 | % | | $ | 477,612 | | | $ | 427,289 | | | $ | 50,323 | | | | 11.8 | % | Asset-based fees | | | 197,974 | | | | 177,105 | | | | 20,869 | | | | 11.8 | % | | | 336,565 | | | | 276,092 | | | | 60,473 | | | | 21.9 | % | Non-recurring | | | 7,854 | | | | 6,674 | | | | 1,180 | | | | 17.7 | % | | | 21,298 | | | | 15,578 | | | | 5,720 | | | | 36.7 | % | | | | | | | | | | | | | | Index total | | | 558,964 | | | | 503,892 | | | | 55,072 | | | | 10.9 | % | | | 835,475 | | | | 718,959 | | | | 116,516 | | | | 16.2 | % | | | | | | | | | | | | | | Analytics | | | | | | | | | | | | | | | | | | Recurring subscriptions | | | | 474,334 | | | | 452,253 | | | | 22,081 | | | | 4.9 | % | Non-recurring | | | | 5,605 | | | | 6,016 | | | | (411 | ) | | | (6.8 | %) | Analytics total | | | 433,424 | | | | 414,085 | | | | 19,339 | | | | 4.7 | % | | | 479,939 | | | | 458,269 | | | | 21,670 | | | | 4.7 | % | | | | | | | | | | | | | | All Other | | | | | | | | | | | | | | | | | | | | | | | | | ESG | | | 37,611 | | | | 28,294 | | | | 9,317 | | | | 32.9 | % | | Real Estate | | | 45,014 | | | | 50,409 | | | | (5,395 | ) | | | (10.7 | %) | | | | | | | | | | | | | | | Recurring subscriptions | | | | 114,590 | | | | 93,481 | | | | 21,109 | | | | 22.6 | % | Non-recurring | | | | 3,980 | | | | 3,463 | | | | 517 | | | | 14.9 | % | All Other total | | | 82,625 | | | | 78,703 | | | | 3,922 | | | | 5.0 | % | | | 118,570 | | | | 96,944 | | | | 21,626 | | | | 22.3 | % | | | | | | | | | | | | | | Total operating revenues | | $ | 1,075,013 | | | $ | 996,680 | | | $ | 78,333 | | | | 7.9 | % | | $ | 1,433,984 | | | $ | 1,274,172 | | | $ | 159,812 | | | | 12.5 | % | | | | | | | | | | | | | |
Refer to the section titled, “Segment Results of Operations” for an explanation of the results. 47
Operating Expenses Operating expenses increased 1.8%7.6% to $671.1$747.1 million for the year ended December 31, 20152018 compared to $659.5$694.4 million for the year ended December 31, 2014.2017. Adjusting for the impact of foreign currency exchange rate fluctuations, total operating expenses would have increased 7.3% for the year ended December 31, 2018 compared to the year ended December 31, 2017. The following table presents operating expenses by activity for the years indicated: | | Years Ended | | | | | | | | | | | | December 31, | | | December 31, | | | | | | | | | | | | 2018 | | | 2017 | | | Increase/(Decrease) | | | | (in thousands) | | | | | | Operating expenses: | | | | | | | | | | | | | | | | | Cost of revenues | | $ | 287,335 | | | $ | 273,681 | | | $ | 13,654 | | | | 5.0 | % | Selling and marketing | | | 192,923 | | | | 177,121 | | | | 15,802 | | | | 8.9 | % | Research and development | | | 81,411 | | | | 75,849 | | | | 5,562 | | | | 7.3 | % | General and administrative | | | 99,882 | | | | 87,764 | | | | 12,118 | | | | 13.8 | % | Amortization of intangible assets | | | 54,189 | | | | 44,547 | | | | 9,642 | | | | 21.6 | % | Depreciation and amortization of property, equipment and leasehold improvements | | | 31,346 | | | | 35,440 | | | | (4,094 | ) | | | (11.6 | %) | Total operating expenses | | $ | 747,086 | | | $ | 694,402 | | | $ | 52,684 | | | | 7.6 | % |
Cost of Revenues Cost of revenues for the year ended December 31, 2018 increased 5.0% to $287.3 million compared to $273.7 million for the year ended December 31, 2017, reflecting increases across all reportable segments. The change was driven by increases in compensation and benefits costs, primarily relating to benefits, incentive compensation and wages and salaries, as well as increases in non-compensation costs, including professional fees, market data costs, miscellaneous expenses and information technology costs. Selling and Marketing Selling and marketing expenses for the year ended December 31, 2018 increased 8.9% to $192.9 million compared to $177.1 million for the year ended December 31, 2017, reflecting increases in the Index and All Other segments. The change was driven by increases in compensation and benefits costs, as well as increases in non-compensation costs, including marketing and occupancy costs, partially offset by lower miscellaneous expenses. Research and Development R&D expenses for the year ended December 31, 2018 increased 7.3% to $81.4 million compared to $75.8 million for the year ended December 31, 2017, reflecting higher investments across all reportable segments. The change was driven by increases in compensation and benefits costs, primarily relating to incentive compensation, benefits, and wages and salaries, as well as increases in non-compensation costs, including information technology, occupancy and travel and entertainment costs and professional fees. General and Administrative G&A expenses for the year ended December 31, 2018 increased 13.8% to $99.9 million compared to $87.8 million for the year ended December 31, 2017, reflecting increases across all reportable segments. The change was driven by increases in non-compensation costs primarily relating to professional fees, non-income taxes and miscellaneous fees, as well as increases in compensation and benefits costs, primarily due to higher wages and salaries, incentive compensation and benefits. 48
The following table presents operating expenses using compensation and non-compensation categories, rather than using activity categories, for the years indicated: | | Years Ended | | | | | | | | | | | | December 31, | | | December 31, | | | | | | | | | | | | 2018 | | | 2017 | | | Increase/(Decrease) | | | | (in thousands) | | | | | | Compensation and benefits | | $ | 471,655 | | | $ | 440,307 | | | $ | 31,348 | | | | 7.1 | % | Non-compensation expenses | | | 189,896 | | | | 174,108 | | | | 15,788 | | | | 9.1 | % | Amortization of intangible assets | | | 54,189 | | | | 44,547 | | | | 9,642 | | | | 21.6 | % | Depreciation and amortization of property, equipment and leasehold improvements | | | 31,346 | | | | 35,440 | | | | (4,094 | ) | | | (11.6 | %) | Total operating expenses | | $ | 747,086 | | | $ | 694,402 | | | $ | 52,684 | | | | 7.6 | % |
Compensation and benefits costs are our most significant expense and typically represent more than 60% of operating expenses or more than 70% of Adjusted EBITDA expenses. We had 3,112 employees as of December 31, 2018 compared to 3,038 employees as of December 31, 2017, reflecting a 2.4% growth in the number of employees. Continued growth of our emerging market centers around the world is an important factor in our ability to manage and control the growth of our compensation and benefits costs. As of December 31, 2018, 61.4% of our employees were located in emerging market centers compared to 59.0% as of December 31, 2017. Compensation and benefits costs for the year ended December 31, 2018 increased 7.1% to $471.7 million compared to $440.3 million for the year ended December 31, 2017, primarily driven by increases in incentive compensation, wages and salaries and benefits, partially offset by lower severance. Non-compensation expenses for the year ended December 31, 2018 increased 9.1% to $189.9 million compared to $174.1 million for the year ended December 31, 2017, primarily driven by higher professional fees, information technology, market data, occupancy, non-income taxes and travel and entertainment costs and miscellaneous fees. Amortization of Intangibles Amortization of intangible asset expense for the year ended December 31, 2018 increased 21.6% to $54.2 million compared to $44.5 million for the year ended December 31, 2017. The increase during the year was due to a $7.9 million non-cash charge related to the write-off of the IPD tradename used by the Real Estate segment, as well as higher amortization of capitalized software development costs released into production, partially offset by other intangible assets becoming fully amortized. Depreciation and amortization of property, equipment and leasehold improvements Depreciation and amortization of property, equipment and leasehold improvements for the year ended December 31, 2018 decreased 11.6% to $31.3 million compared to $35.4 million for the year ended December 31, 2017. The decrease was primarily the result of certain storage and data center assets becoming fully depreciated. Other Expense (Income), Net Other expense (income), net for the year ended December 31, 2018 decreased 49.5% to $57.0 million compared to $112.9 million for the year ended December 31, 2017, primarily reflecting the impact of the $10.6 million and $46.6 million gains realized from the FEA and InvestorForce divestitures, respectively. In addition, higher interest expense associated with higher outstanding debt, was partially offset by higher interest income associated with higher yields on higher cash balances. 49
Income Taxes The provision for income tax expense decreased 25.1% to $122.0 million for the year ended December 31, 2018 compared to $162.9 million for the year ended December 31, 2017, primarily relating to the year-over-year change of $45.7 million attributed to Tax Reform. In addition, the Company benefited from a lower U.S. statutory tax rate of 21.0% for the year ended December 31, 2018 compared to 35.0% for the year ended December 31, 2017, as well as tax planning to reduce withholding taxes on repatriation of foreign earnings. These amounts reflect effective tax rates of 19.4% and 34.9% for the years ended December 31, 2018 and 2017, respectively. Included in the effective tax rate of 19.4% for the year ended December 31, 2018 is a 1.8 percentage point benefit related to Tax Reform, a 6.9 percentage point benefit related to the reduction in the operating tax rate and a 1.9 percentage point benefit as a result of tax planning and other miscellaneous favorable discrete items. Net Income As a result of the factors described above, net income for the year ended December 31, 2018 increased 67.1% to $507.9 million compared to $304.0 million for the year ended December 31, 2017. Adjusted EBITDA The following table presents the calculation of the non-GAAP Adjusted EBITDA measure for the years indicated: | | Years Ended | | | | | | | | | | | | December 31, | | | December 31, | | | | | | | | | | | | 2018 | | | 2017 | | | Increase/(Decrease) | | | | (in thousands) | | | | | | Operating revenues: | | $ | 1,433,984 | | | $ | 1,274,172 | | | $ | 159,812 | | | | 12.5 | % | Adjusted EBITDA expenses | | | 661,551 | | | | 614,415 | | | | 47,136 | | | | 7.7 | % | Adjusted EBITDA | | $ | 772,433 | | | $ | 659,757 | | | $ | 112,676 | | | | 17.1 | % | Adjusted EBITDA margin % | | | 53.9 | % | | | 51.8 | % | | | | | | | | | Operating margin % | | | 47.9 | % | | | 45.5 | % | | | | | | | | |
Adjusted EBITDA increased 17.1% to $772.4 million for the year ended December 31, 2018 compared to $659.8 million for the year ended December 31, 2017. Adjusted EBITDA margin increased to 53.9% for the year ended December 31, 2018 compared to 51.8% for the year ended December 31, 2017. The improvement in margin reflects a higher rate of growth in operating revenues, primarily attributable to the Index segment, as compared to the rate of growth of Adjusted EBITDA expenses. 50
Reconciliation of Adjusted EBITDA to Net Income and Adjusted EBITDA Expenses to Operating Expenses The following table presents the reconciliation of Adjusted EBITDA to net income for the years indicated: | | Years Ended | | | | | | | | | | | | December 31, | | | December 31, | | | | | | | | | | | | 2018 | | | 2017 | | | Increase/(Decrease) | | | | (in thousands) | | | | | | Index Adjusted EBITDA | | $ | 607,853 | | | $ | 522,241 | | | $ | 85,612 | | | | 16.4 | % | Analytics Adjusted EBITDA | | | 143,645 | | | | 125,624 | | | | 18,021 | | | | 14.3 | % | All Other Adjusted EBITDA | | | 20,935 | | | | 11,892 | | | | 9,043 | | | | 76.0 | % | Consolidated Adjusted EBITDA | | | 772,433 | | | | 659,757 | | | | 112,676 | | | | 17.1 | % | Amortization of intangible assets | | | 54,189 | | | | 44,547 | | | | 9,642 | | | | 21.6 | % | Depreciation and amortization of property, equipment and leasehold improvements | | | 31,346 | | | | 35,440 | | | | (4,094 | ) | | | (11.6 | %) | Operating income | | | 686,898 | | | | 579,770 | | | | 107,128 | | | | 18.5 | % | Other expense (income), net | | | 57,002 | | | | 112,871 | | | | (55,869 | ) | | | (49.5 | %) | Provision for income taxes | | | 122,011 | | | | 162,927 | | | | (40,916 | ) | | | (25.1 | %) | Net income | | $ | 507,885 | | | $ | 303,972 | | | $ | 203,913 | | | | 67.1 | % |
The following table presents the reconciliation of Adjusted EBITDA expenses to operating expenses for the years indicated: | | Years Ended | | | | | | | | | | | | December 31, | | | December 31, | | | | | | | | | | | | 2018 | | | 2017 | | | Increase/(Decrease) | | | | (in thousands) | | | | | | Index Adjusted EBITDA expenses | | $ | 227,622 | | | $ | 196,718 | | | $ | 30,904 | | | | 15.7 | % | Analytics Adjusted EBITDA expenses | | | 336,294 | | | | 332,645 | | | | 3,649 | | | | 1.1 | % | All Other Adjusted EBITDA expenses | | | 97,635 | | | | 85,052 | | | | 12,583 | | | | 14.8 | % | Consolidated Adjusted EBITDA expenses | | | 661,551 | | | | 614,415 | | | | 47,136 | | | | 7.7 | % | Amortization of intangible assets | | | 54,189 | | | | 44,547 | | | | 9,642 | | | | 21.6 | % | Depreciation and amortization of property, equipment and leasehold improvements | | | 31,346 | | | | 35,440 | | | | (4,094 | ) | | | (11.6 | %) | Total operating expenses | | $ | 747,086 | | | $ | 694,402 | | | $ | 52,684 | | | | 7.6 | % |
Segment Results The results for each of our three reportable segments for the years ended December 31, 2018 and 2017 are presented below: 51
Index Segment The following table presents the results for the Index segment for the years indicated: | | Years Ended | | | | | | | | | | | | December 31, | | | December 31, | | | | | | | | | | | | 2018 | | | 2017 | | | Increase/(Decrease) | | | | (in thousands) | | | | | | Operating revenues: | | | | | | | | | | | | | | | | | Recurring subscriptions | | $ | 477,612 | | | $ | 427,289 | | | $ | 50,323 | | | | 11.8 | % | Asset-based fees | | | 336,565 | | | | 276,092 | | | | 60,473 | | | | 21.9 | % | Non-recurring | | | 21,298 | | | | 15,578 | | | | 5,720 | | | | 36.7 | % | Operating revenues total | | | 835,475 | | | | 718,959 | | | | 116,516 | | | | 16.2 | % | Adjusted EBITDA expenses | | | 227,622 | | | | 196,718 | | | | 30,904 | | | | 15.7 | % | Adjusted EBITDA | | $ | 607,853 | | | $ | 522,241 | | | $ | 85,612 | | | | 16.4 | % | Adjusted EBITDA margin % | | | 72.8 | % | | | 72.6 | % | | | | | | | | |
Revenues related to Index products increased 16.2% to $835.5 million for the year ended December 31, 2018 compared to $719.0 million for the year ended December 31, 2017. Revenues from recurring subscriptions were up 11.8% to $477.6 million for the year ended December 31, 2018 compared to $427.3 million for the year ended December 31, 2017. The increase was driven by growth in core products and strong growth in factor and ESG indexes and custom and specialized index products. Adjusting for the impact of foreign currency exchange rate fluctuations, recurring subscriptions would have increased 11.7% for the year ended December 31, 2018 compared to the year ended December 31, 2017. Revenues from asset-based fees increased 21.9% to $336.6 million for the year ended December 31, 2018 compared to $276.1 million for the year ended December 31, 2017. The increase in asset-based fees was driven by strong growth across all types of index-linked investment products, including a $34.7 million, or 18.2%, increase in revenue from ETFs linked to MSCI indexes, which was driven by a 21.9% increase in average AUM, partially offset by the impact of a change in product mix. In addition, revenue from non-ETF passive products grew $22.0 million, or 30.3%, primarily driven by higher AUM and an increased contribution from higher-fee products. Revenues from exchange traded futures and options contracts based on MSCI indexes grew $3.8 million, or 28.2%, driven, in part, by an increase in total trading volumes. The impact of foreign currency exchange rate fluctuations on revenues from asset-based fees was negligible. Index segment Adjusted EBITDA expenses increased 15.7% to $227.6 million for the year ended December 31, 2018 compared to $196.7 million for the year ended December 31, 2017, reflecting higher expenses across all expense activity categories to fund current and future revenue growth. Adjusting for the impact of foreign currency exchange rate fluctuations, Adjusted EBITDA expenses would have increased 15.4% for the year ended December 31, 2018 compared to the year ended December 31, 2017. 52
Analytics Segment The following table presents the results for the Analytics segment for the years indicated: | | Years Ended | | | | | | | | | | | | December 31, | | | December 31, | | | | | | | | | | | | 2018 | | | 2017 | | | Increase/(Decrease) | | | | (in thousands) | | | | | | Operating revenues: | | | | | | | | | | | | | | | | | Recurring subscriptions | | $ | 474,334 | | | $ | 452,253 | | | $ | 22,081 | | | | 4.9 | % | Non-recurring | | | 5,605 | | | | 6,016 | | | | (411 | ) | | | (6.8 | %) | Operating revenues total | | | 479,939 | | | | 458,269 | | | | 21,670 | | | | 4.7 | % | Adjusted EBITDA expenses | | | 336,294 | | | | 332,645 | | | | 3,649 | | | | 1.1 | % | Adjusted EBITDA | | $ | 143,645 | | | $ | 125,624 | | | $ | 18,021 | | | | 14.3 | % | Adjusted EBITDA margin % | | | 29.9 | % | | | 27.4 | % | | | | | | | | |
Analytics segment revenues increased 4.7% to $479.9 million for the year ended December 31, 2018 compared to $458.3 million for the year ended December 31, 2017, primarily driven by growth in both Equity and Multi-Asset Class Analytics products, partially offset by declines in Energy and Commodity Analytics products, resulting from the FEA divestiture, and declines from the divestiture of InvestorForce. Adjusting for foreign currency exchange rate fluctuations, Analytics segment revenues would have increased 4.6% for the year ended December 31, 2018 compared to the year ended December 31, 2017. Adjusting for foreign currency exchange rate fluctuations and excluding the impact of the divestiture of InvestorForce and FEA, Analytics segment revenues would have increased 7.0% for the year ended December 31, 2018 compared to the year ended December 31, 2017. Analytics segment Adjusted EBITDA expenses increased 1.1% to $336.3 million for the year ended December 31, 2018 compared to $332.6 million for the year ended December 31, 2017, primarily reflecting higher expenses across the G&A and R&D expense activity categories. Adjusting for the impact of foreign currency exchange rate fluctuations, Adjusted EBITDA expenses would have increased 0.9% for the year ended December 31, 2018 compared to the year ended December 31, 2017. All Other Segment The following table presents the results for the All Other segment, which consists of the ESG and Real Estate product lines, for the years indicated: | | Years Ended | | | | | | | | | | | | December 31, | | | December 31, | | | | | | | | | | | | 2018 | | | 2017 | | | Increase/(Decrease) | | | | (in thousands) | | | | | | Operating revenues: | | | | | | | | | | | | | | | | | Recurring subscriptions | | $ | 114,590 | | | $ | 93,481 | | | $ | 21,109 | | | | 22.6 | % | Non-recurring | | | 3,980 | | | | 3,463 | | | | 517 | | | | 14.9 | % | Operating revenues total | | | 118,570 | | | | 96,944 | | | | 21,626 | | | | 22.3 | % | Adjusted EBITDA expenses | | | 97,635 | | | | 85,052 | | | | 12,583 | | | | 14.8 | % | Adjusted EBITDA | | $ | 20,935 | | | $ | 11,892 | | | $ | 9,043 | | | | 76.0 | % | Adjusted EBITDA margin % | | | 17.7 | % | | | 12.3 | % | | | | | | | | |
All Other segment revenues increased 22.3% to $118.6 million for the year ended December 31, 2018 compared to $96.9 million for the year ended December 31, 2017. The increase in All Other revenues was driven by a $16.6 million, or 30.2%, increase in ESG revenues to $71.4 million, and a $5.1 million, or 12.0%, increase in Real Estate revenues to $47.2 million. The increase in ESG revenues was driven by strong growth in ESG Ratings product revenues. The increase in Real Estate revenues was primarily driven by higher revenues from Enterprise Analytics and Market Information products. Adjusting for the impact of foreign currency exchange rate fluctuations, ESG revenues would have increased 30.4%, Real Estate revenues would have increased 8.3% and All Other operating 53
revenues would have increased 20.8% for the year ended December 31, 2018 compared to the year ended December 31, 2017. All Other segment Adjusted EBITDA expenses increased 14.8% to $97.6 million for the year ended December 31, 2018 compared to $85.1 million for the year ended December 31, 2017, primarily driven by higher expenses attributable to both ESG and Real Estate operations. Adjusting for the impact of foreign currency exchange rate fluctuations, Adjusted EBITDA expenses would have increased 14.6% for the year ended December 31, 2018 compared to the year ended December 31, 2017. Results of Operations Year Ended December 31, 2017 Compared to Year Ended December 31, 2016 The following table presents the results of operations for the years indicated: | | Years Ended | | | | | | | | | | | | December 31, | | | December 31, | | | | | | | | | | | | 2017 | | | 2016 | | | Increase/(Decrease) | | | | (in thousands, except per share data) | | | | | | Operating revenues | | $ | 1,274,172 | | | $ | 1,150,669 | | | $ | 123,503 | | | | 10.7 | % | Operating expenses: | | | | | | | | | | | | | | | | | Cost of revenues | | | 273,681 | | | | 252,107 | | | | 21,574 | | | | 8.6 | % | Selling and marketing | | | 177,121 | | | | 166,666 | | | | 10,455 | | | | 6.3 | % | Research and development | | | 75,849 | | | | 75,204 | | | | 645 | | | | 0.9 | % | General and administrative | | | 87,764 | | | | 87,235 | | | | 529 | | | | 0.6 | % | Amortization of intangible assets | | | 44,547 | | | | 47,033 | | | | (2,486 | ) | | | (5.3 | %) | Depreciation and amortization of property, equipment and leasehold improvements | | | 35,440 | | | | 34,320 | | | | 1,120 | | | | 3.3 | % | Total operating expenses | | | 694,402 | | | | 662,565 | | | | 31,837 | | | | 4.8 | % | Operating income | | | 579,770 | | | | 488,104 | | | | 91,666 | | | | 18.8 | % | Other expense (income), net | | | 112,871 | | | | 102,166 | | | | 10,705 | | | | 10.5 | % | Income before provision for income taxes | | | 466,899 | | | | 385,938 | | | | 80,961 | | | | 21.0 | % | Provision for income taxes | | | 162,927 | | | | 125,083 | | | | 37,844 | | | | 30.3 | % | Income from continuing operations | | $ | 303,972 | | | $ | 260,855 | | | $ | 43,117 | | | | 16.5 | % | | | | | | | | | | | | | | | | | | Earnings per basic common share | | $ | 3.36 | | | $ | 2.72 | | | $ | 0.64 | | | | 23.5 | % | | | | | | | | | | | | | | | | | | Earnings per diluted common share | | $ | 3.31 | | | $ | 2.70 | | | $ | 0.61 | | | | 22.6 | % | | | | | | | | | | | | | | | | | | Operating margin | | | 45.5 | % | | | 42.4 | % | | | | | | | | | | | | | | | | | | | | | | | | | |
Operating Revenues The following table presents operating revenues by recurring subscriptions, asset-based fees and non-recurring revenues for the years indicated: | | Years Ended | | | | | | | | | | | | December 31, | | | December 31, | | | | | | | | | | | | 2017 | | | | 2016 | | | Increase/(Decrease) | | | | (in thousands) | | | | | | Recurring subscriptions | | $ | 973,023 | | | $ | 913,668 | | | $ | 59,355 | | | | 6.5 | % | Asset-based fees | | | 276,092 | | | | 210,229 | | | | 65,863 | | | | 31.3 | % | Non-recurring | | | 25,057 | | | | 26,772 | | | | (1,715 | ) | | | (6.4 | %) | Total operating revenues | | $ | 1,274,172 | | | $ | 1,150,669 | | | $ | 123,503 | | | | 10.7 | % |
54
Total operating revenues grew 10.7% to $1,274.2 million for the year ended December 31, 2017 compared to $1,150.7 million for the year ended December 31, 2016. Adjusting for the impact of foreign currency exchange rate fluctuations, total operating revenues would have increased 11.1% for the year ended December 31, 2017 compared to the year ended December 31, 2016. Revenue from recurring subscriptions increased 6.5% to $973.0 million for the year ended December 31, 2017 compared to $913.7 million for the year ended December 31, 2016, primarily driven by growth in Index products, which increased $37.9 million, or 9.7%. Adjusting for the impact of foreign currency exchange rate fluctuations, recurring subscription revenues would have increased 7.0% for the year ended December 31, 2017 compared to the year ended December 31, 2016. Revenues from asset-based fees increased 31.3% to $276.1 million for the year ended December 31, 2017 compared to $210.2 million for the year ended December 31, 2016. The increase in asset-based fees was driven by several items, including a $48.2 million, or 33.9%, growth in revenue from ETFs linked to MSCI indexes, which was driven by a 39.2% increase in average AUM, partially offset by the impact of a change in the product mix. In addition, revenue from non-ETF passive products grew $14.0 million, or 23.8%, driven by higher AUM and an increased contribution from higher fee products. Revenues from exchange traded futures and options contracts based on MSCI indexes also grew $3.7 million, or 38.8%, driven by a strong increase in total trading volumes and a more favorable product mix. The following table presents the value of AUM in ETFs linked to MSCI indexes and the sequential change of such assets as of the end of each of the periods indicated: | | Period Ended (1) | | | | 2016 | | | 2017 | | (in billions) | | March 31, | | | June 30, | | | September 30, | | | December 31, | | | March 31, | | | June 30, | | | September 30, | | | December 31, | | AUM in ETFs linked to MSCI indexes (2), (3) | | $ | 438.3 | | | $ | 439.7 | | | $ | 474.9 | | | $ | 481.4 | | | $ | 555.7 | | | $ | 624.3 | | | $ | 674.3 | | | $ | 744.3 | | Sequential Change in Value | | | | | | | | | | | | | | | | | | | | | | | | | | | | | | | | | Market Appreciation/ (Depreciation) | | $ | (1.7 | ) | | $ | (2.5 | ) | | $ | 23.7 | | | $ | (8.7 | ) | | $ | 35.8 | | | $ | 23.6 | | | $ | 32.2 | | | $ | 32.0 | | Cash Inflows | | | 6.6 | | | | 3.9 | | | | 11.5 | | | | 15.2 | | | | 38.5 | | | | 45.0 | | | | 17.8 | | | | 38.0 | | Total Change | | $ | 4.9 | | | $ | 1.4 | | | $ | 35.2 | | | $ | 6.5 | | | $ | 74.3 | | | $ | 68.6 | | | $ | 50.0 | | | $ | 70.0 | |
Source: Bloomberg and MSCI (1) | The historical values of the assets in ETFs linked to our indexes as of the last day of the month and the monthly average balance can be found under the link “AUM in ETFs Linked to MSCI indexes” on our Investor Relations homepage at http://ir.msci.com. This information is updated on or about the second U.S. business day of each month. Information contained on our website is not incorporated by reference into this Annual Report on Form 10-K or any other report filed with the SEC. |
(2) The value of assets under management in ETFs linked to MSCI Indexes is calculated by multiplying the ETF net asset value by the number of shares outstanding. (3) The AUM in ETFs numbers also include AUM in Exchange Traded Notes, the value of which is less than 1.0% of the AUM amounts presented. | | Year-to-Date Average (1) | | | | 2016 | | | 2017 | | | | March | | | June | | | September | | | December | | | March | | | June | | | September | | | December | | AUM in ETFs linked to MSCI Indexes | | $ | 407.9 | | | $ | 423.5 | | | $ | 438.1 | | | $ | 446.4 | | | $ | 524.1 | | | $ | 559.5 | | | $ | 591.1 | | | $ | 621.4 | | ______________ | | | | | | | | | | | | | | | | | | | | | | | | | | | | | | | | | Source: Bloomberg and MSCI | | | | | | | | | | | | | | | | | | | | | | | | | | | | | | | | | (1) For additional information on AUM amounts presented in this table, please refer to the footnotes in the table presenting AUM in ETFs linked to MSCI equity indexes for "Period Ended" in Part II, Item 7. "Management's Discussion and Analysis of Financial Condition and Results of Operations—Results of Operations—Operating Revenues." | |
For the year ended December 31, 2017, the average value of AUM in ETFs linked to MSCI equity indexes was $621.4 billion, up $175.0 billion, or 39.2%, from $446.4 billion for the year ended December 31, 2016. 55
Non-recurring revenues decreased 6.4% to $25.1 million for the year ended December 31, 2017, compared to $26.8 million for the year ended December 31, 2016, primarily resulting from lower one-time sales of Analytics products. The following table presents operating revenues by reportable segment and revenue type for the years indicated: | | Years Ended | | | | | | | | | | | | December 31, | | | December 31, | | | | | | | | | | | | 2017 | | | 2016 | | | Increase/(Decrease) | | | | (in thousands) | | | | | | Operating revenues: | | | | | | | | | | | | | | | | | Index | | | | | | | | | | | | | | | | | Recurring subscriptions | | $ | 427,289 | | | $ | 389,348 | | | $ | 37,941 | | | | 9.7 | % | Asset-based fees | | | 276,092 | | | | 210,229 | | | | 65,863 | | | | 31.3 | % | Non-recurring | | | 15,578 | | | | 13,974 | | | | 1,604 | | | | 11.5 | % | Index total | | | 718,959 | | | | 613,551 | | | | 105,408 | | | | 17.2 | % | Analytics | | | | | | | | | | | | | | | | | Recurring subscriptions | | | 452,253 | | | | 439,864 | | | | 12,389 | | | | 2.8 | % | Non-recurring | | | 6,016 | | | | 8,489 | | | | (2,473 | ) | | | (29.1 | %) | Analytics total | | | 458,269 | | | | 448,353 | | | | 9,916 | | | | 2.2 | % | All Other | | | | | | | | | | | | | | | | | Recurring subscriptions | | | 93,481 | | | | 84,456 | | | | 9,025 | | | | 10.7 | % | Non-recurring | | | 3,463 | | | | 4,309 | | | | (846 | ) | | | (19.6 | %) | All Other total | | | 96,944 | | | | 88,765 | | | | 8,179 | | | | 9.2 | % | Total operating revenues | | $ | 1,274,172 | | | $ | 1,150,669 | | | $ | 123,503 | | | | 10.7 | % |
Refer to the section titled, “Segment Results of Operations” for an explanation of the results. Operating Expenses Operating expenses increased 4.8% to $694.4 million for the year ended December 31, 2017 compared to $662.6 million for the year ended December 31, 2016. Adjusting for the impact of foreign currency exchange rate fluctuations, operating expenses would have increased 5.8%5.1% for the year ended December 31, 20152017 compared to the year ended December 31, 2014.2016. The following table presents operating expenses by activity for the years indicated: | | | | | | | | | | Years Ended | | | | | | | | | | | | | Years Ended | | | | | | | | | December 31, | | | December 31, | | | | | | | | | | | | | December 31,
2015 | | | December 31,
2014 | | | Increase/(Decrease) | | | 2017 | | | 2016 | | | Increase/(Decrease) | | | | | (in thousands) | | | | | | | | | (in thousands) | | | | | | Operating expenses: | | | | | | | | | | | | | | | | | | | | | | | | | Cost of revenues | | $ | 267,695 | | | $ | 276,623 | | | $ | (8,928 | ) | | | (3.2 | %) | | $ | 273,681 | | | $ | 252,107 | | | $ | 21,574 | | | | 8.6 | % | Selling and marketing | | | 162,294 | | | | 163,839 | | | | (1,545 | ) | | | (0.9 | %) | | | 177,121 | | | | 166,666 | | | | 10,455 | | | | 6.3 | % | Research and development | | | 77,320 | | | | 71,095 | | | | 6,225 | | | | 8.8 | % | | | 75,849 | | | | 75,204 | | | | 645 | | | | 0.9 | % | General and administrative | | | 86,007 | | | | 76,369 | | | | 9,638 | | | | 12.6 | % | | | 87,764 | | | | 87,235 | | | | 529 | | | | 0.6 | % | Amortization of intangible assets | | | 46,910 | | | | 45,877 | | | | 1,033 | | | | 2.3 | % | | | 44,547 | | | | 47,033 | | | | (2,486 | ) | | | (5.3 | %) | Depreciation and amortization of property, equipment and leasehold improvements | | | 30,889 | | | | 25,711 | | | | 5,178 | | | | 20.1 | % | | | 35,440 | | | | 34,320 | | | | 1,120 | | | | 3.3 | % | | | | | | | | | | | | | | Total operating expenses | | $ | 671,115 | | | $ | 659,514 | | | $ | 11,601 | | | | 1.8 | % | | $ | 694,402 | | | $ | 662,565 | | | $ | 31,837 | | | | 4.8 | % | | | | | | | | | | | | | |
56
Cost of Revenues Cost of revenues for the year ended December 31, 2015 decreased 3.2%2017 increased 8.6% to $267.7$273.7 million compared to $276.6$252.1 million for the year ended December 31, 2014, primarily2016, reflecting increases across all three reportable segments. The change was driven by lower non-compensationincreases in compensation and benefit costs, reflecting strong cost disciplineprimarily relating to wages and salaries, severance and incentive compensation, as well as the impact of compensation primarily driven by lower staffing levels, partially offset by higher severancenon-compensation information technology costs, market data costs, occupancy costs, personnel related costs and travel and entertainment costs. Selling and Marketing Selling and marketing expenses for the year ended December 31, 2015 decreased 0.9%2017 increased 6.3% to $162.3$177.1 million compared to $163.9$166.7 million for the year ended December 31, 2014, primarily2016, reflecting increases in the Index and All Other segments. The change was driven by loweran overall increase in compensation and benefit costs, relatedrelating to incentive compensation, severance, wages and salaries and benefits, as well as higher non-compensation marketing costs and travel &and entertainment partially offset by higher compensation and benefits primarily related to higher severance.costs. Research and Development R&D expenses for the year ended December 31, 20152017 increased 8.8%0.9% to $77.3$75.9 million compared to $71.1$75.2 million for the year ended December 31, 2014, primarily driven by2016, reflecting higher compensation and benefits costs as a result of more R&D projects, higher severance and lower net capitalized costs related to internally developed software. The reduction in net capitalized costs is the result of the reversal of a technology projectinvestments in the Analytics segment of $3.4 million forand ESG within the year ended December 31, 2015 compared to a $1.0 million reversal forAll Other segment, offset by decreases in the year ended December 31, 2014.Index segment. The change was driven by higher non-compensation information technology costs partially offset by lower occupancy costs. General and Administrative G&A expenses for the year ended December 31, 20152017 increased 12.6%0.6% to $86.0$87.8 million compared to $76.4$87.2 million for the year ended December 31, 2014, primarily2016, driven by higher costs in the Index segment partially offset by lower costs in Real Estate within the All Other segment. The change was driven by an increase in compensation and benefits costs, primarily relating to an increase in wages and salaries and benefits, partially offset by a decrease in severance, as well as higherthe impact of lower non-compensation professional fees. The following table presents operating expenses using compensation and non-compensation categories, rather than using activity categories, for the years indicated: | | | | | | | | | | Years Ended | | | | | | | | | | | | | Years Ended | | | | | | | | | December 31, | | | December 31, | | | | | | | | | | | | | December 31,
2015 | | | December 31,
2014 | | | Increase/(Decrease) | | | 2017 | | | 2016 | | | Increase/(Decrease) | | | | | (in thousands) | | | | | | | | | (in thousands) | | | | | | Compensation and benefits | | $ | 426,238 | | | $ | 412,550 | | | $ | 13,688 | | | | 3.3 | % | | $ | 440,307 | | | $ | 414,322 | | | $ | 25,985 | | | | 6.3 | % | Non-compensation expenses | | | 167,078 | | | | 175,376 | | | | (8,298 | ) | | | (4.7 | %) | | | 174,108 | | | | 166,890 | | | | 7,218 | | | | 4.3 | % | Amortization of intangible assets | | | 46,910 | | | | 45,877 | | | | 1,033 | | | | 2.3 | % | | | 44,547 | | | | 47,033 | | | | (2,486 | ) | | | (5.3 | %) | Depreciation and amortization of property, equipment and leasehold improvements | | | 30,889 | | | | 25,711 | | | | 5,178 | | | | 20.1 | % | | | 35,440 | | | | 34,320 | | | | 1,120 | | | | 3.3 | % | | | | | | | | | | | | | | Total operating expenses | | $ | 671,115 | | | $ | 659,514 | | | $ | 11,601 | | | | 1.8 | % | | $ | 694,402 | | | $ | 662,565 | | | $ | 31,837 | | | | 4.8 | % | | | | | | | | | | | | | |
Compensation and benefits costs are our most significant expense and typically represent more than 60% of our operating expenses or more than 70% of the combined total of the cost of revenues, selling and marketing, R&D and G&A expense categories. We had 2,7543,038 employees as of December 31, 20152017 compared to 2,9262,862 employees as of December 31, 2014.2016. Our continued growth in emerging market centers around the world is an important factor in our ability to manage and control the growth of our compensation and benefits expenses. As of December 31, 2015, 52.8%2017, 59.0% of our employees were located in emerging market centers compared to 50.5%56.2% of our employees as of December 31, 2014.2016. Compensation and benefits costs for the year ended December 31, 20152017 increased 3.3%6.3% to $426.2$440.3 million compared to $412.6$414.3 million for the year ended December 31, 2014. The increase was2016, primarily impacteddriven by higher costs related toincreases in wages and salaries, incentive compensation, severance and benefits, as well as lower capitalized labor costs related to internally developed software.benefits. 57
Non-compensation expenses for the year ended December 31, 2015 decreased 4.7%2017 increased 4.3% to $167.1$174.1 million compared to $175.4$166.9 million for the year ended December 31, 2014,2016, primarily reflecting decreases indriven by higher information technology, marketing, travel &and entertainment recruiting and marketing,market data costs, partially offset by increases in information technology. Amortization of Intangibleslower professional fees and recruiting costs.
Amortization of intangiblesIntangibles Amortization of intangible asset expense for the year ended December 31, 2015 increased 2.3%2017 decreased 5.3% to $46.9$44.5 million compared to $45.9$47.0 million for the year ended December 31, 2014,2016. The decrease during the year was due to $5.5 million of lower amortization from intangibles associated with past acquisitions primarily resulting fromrelated to certain intangible assets associated with the RiskMetrics acquisition becoming fully amortized, partially offset by $3.0 million of increased amortization of our capitalized software.software development costs relating to new internally developed software implementations. Depreciation and amortization of property, equipment and leasehold improvements For the years ended December 31, 2015 and 2014, depreciationDepreciation and amortization of property, equipment and leasehold improvements totaled $30.9for the year ended December 31, 2017 increased 3.3% to $35.4 million and $25.7compared to $34.3 million respectively.for the year ended December 31, 2016. The 20.1% increase was primarily reflected higherthe result of increased depreciation of investments madeassociated with continued investment in our information technology infrastructure.data centers as well as increased software amortization relating to new system implementations.
Other Expense (Income), Net Other expense (income), net for the year ended December 31, 20152017 increased 10.5% to $54.3$112.9 million compared to $28.8$102.2 million for the year ended December 31, 2014, with the increase2016, primarily driven by $30.6$14.4 million of higher interest expense resulting from the higher interest rates associated with our Senior Notes and the increased level of indebtedness associated with the 2026 Senior Notes offering, partially offset by $6.4higher interest income associated with higher cash balances as well as the impact of a $3.7 million from gains on the sale of investments realizedcharge in the year ended December 31, 2015. 2016 related to estimated losses associated with miscellaneous transactions.Income Taxes The provision for income tax expense was $119.5 million and $109.4increased 30.3% to $162.9 million for the yearsyear ended December 31, 20152017 compared to $125.1 million for the year ended December 31, 2016 as a result of a net charge of $34.5 million related to Tax Reform discussed above and 2014, respectively.higher income before provision for income taxes. These amounts reflect effective tax rates of 34.2%34.9% and 35.5%32.4% for the years ended December 31, 20152017 and 2014,2016, respectively. TheIncluded in the effective tax rate of 34.2%34.9% for the year ended December 31, 2015 reflects2017 is 7.4 percentage points related to Tax Reform, with the remaining 27.5 percentage points related to the operating tax rate and other miscellaneous favorable discrete items. The ongoing efforts to better align our tax profile with our global operating footprint helped improve our operating tax rate adjusted for the impact of certain discrete items. Included in therate. The discrete items was a claim for an additional deductionincluded $5.7 million of stock-based compensation excess tax benefits related to U.S. production activities for prior years, which was partially offset by a provision for state tax liabilities related to prior years. Overall, the discrete items decreased our effective tax rate by 0.6% inadoption of new accounting guidance that first impacted results during the year ended December 31, 2015.2017. See Note 2, “Recent Accounting Standards Updates,” of the Notes to Consolidated Financial Statements included herein for more information.
The effectiveTax Reform significantly revises the future ongoing U.S. corporate income tax rate for U.S. corporations, reducing it from a maximum of 35.5%35.0% to a flat 21.0% effective beginning on January 1, 2018.
Net Income As a result of the factors described above, net income for the year ended December 31, 2014 reflects our operating rate adjusted for the impact of certain discrete items that2017 increased our effective tax rate by 0.3 percentage points. Included in our effective tax rate was the benefit of the 2014 federal research and development credit, the effect of which reduced our full year effective tax rate by 0.9 percentage points. Income (loss) from Discontinued Operations, Net of Income Taxes
On April 30, 2014, MSCI completed the sale of ISS for cash consideration of $367.4 million. ISS, together with the previously sold CFRA product line, is reflected as discontinued operations in our consolidated financial statements. Loss from discontinued operations, net of income taxes, for the year ended December 31, 2015 reflects the impact of a $6.416.5% to $304.0 million out-of-period income tax charge associated with tax obligations triggered upon the sale of ISS. Income from discontinued operations, net of income taxes was $85.2compared to $260.9 million for the year ended December 31, 2014 and the results included a net gain of $78.7 million resulting from the disposition of ISS.2016.
58
Adjusted EBITDA The following table presents the calculation of the non-GAAP Adjusted EBITDA measure for the years indicated: | | | | | | | | | | Years Ended | | | | | | | | | | | | | Years Ended | | | | | | | | December 31, | | | December 31, | | | | | | | | | | | | | December 31,
2015 | | December 31,
2014 | | Increase/(Decrease) | | | 2017 | | | 2016 | | | Increase/(Decrease) | | | | | (in thousands) | | | | | | | | (in thousands) | | | | | | Operating revenues | | $ | 1,075,013 | | | $ | 996,680 | | | $ | 78,333 | | | | 7.9 | % | | Operating revenues: | | | $ | 1,274,172 | | | $ | 1,150,669 | | | $ | 123,503 | | | | 10.7 | % | Adjusted EBITDA expenses | | | 593,316 | | | 587,926 | | | 5,390 | | | | 0.9 | % | | | 614,415 | | | | 581,212 | | | | 33,203 | | | | 5.7 | % | | | | | | | | | | | | | | Adjusted EBITDA | | $ | 481,697 | | | $ | 408,754 | | | $ | 72,943 | | | | 17.8 | % | | $ | 659,757 | | | $ | 569,457 | | | $ | 90,300 | | | | 15.9 | % | | | | | | | | | | | | | | Adjusted EBITDA margin % | | | 44.8 | % | | 41.0 | % | | | | | | | 51.8 | % | | | 49.5 | % | | | | | | | | | Operating margin % | | | 37.6 | % | | 33.8 | % | | | | | | | 45.5 | % | | | 42.4 | % | | | | | | | | |
Adjusted EBITDA increased 17.8%15.9% to $481.7$659.8 million for the year ended December 31, 20152017 compared to $408.8$569.5 million for the year ended December 31, 2014.2016. Adjusted EBITDA margin increased to 44.8%51.8% for the year ended December 31, 20152017 compared to 41.0%49.5% for the year ended December 31, 2014.2016. The improvement in margin reflects a higher rate of growth in operating revenues, outpacingprimarily attributable to strong operating results within the growth in expenses, attributable, in part,Index segment, as compared to the benefitsrate of the incremental investments we made in 2014 and prior periods. growth of Adjusted EBITDA expenses.Reconciliation of Adjusted EBITDA to Net Income and Adjusted EBITDA Expenses to Operating Expenses The following table presents the reconciliation of Adjusted EBITDA to net income for the years indicated: | | | | | | | | | | Years Ended | | | | | | | | | | | | | Years Ended | | | | | | | | | December 31, | | | December 31, | | | | | | | | | | | | | December 31,
2015 | | | December 31,
2014 | | | Increase/(Decrease) | | | 2017 | | | 2016 | | | Increase/(Decrease) | | | | | (in thousands) | | | | | | | | | (in thousands) | | | | | | Index Adjusted EBITDA | | $ | 392,987 | | | $ | 349,685 | | | $ | 43,302 | | | | 12.4 | % | | $ | 522,241 | | | $ | 431,478 | | | $ | 90,763 | | | | 21.0 | % | Analytics Adjusted EBITDA | | | 95,468 | | | | 72,173 | | | | 23,295 | | | | 32.3 | % | | | 125,624 | | | | 128,507 | | | | (2,883 | ) | | | (2.2 | %) | All Other Adjusted EBITDA | | | (6,758 | ) | | | (13,104 | ) | | | 6,346 | | | | 48.4 | % | | | 11,892 | | | | 9,472 | | | | 2,420 | | | | 25.5 | % | | | | | | | | | | | | | | | Consolidated Adjusted EBITDA | | | 481,697 | | | | 408,754 | | | | 72,943 | | | | 17.8 | % | | | 659,757 | | | | 569,457 | | | | 90,300 | | | | 15.9 | % | Amortization of intangible assets | | | 46,910 | | | | 45,877 | | | | 1,033 | | | | 2.3 | % | | | 44,547 | | | | 47,033 | | | | (2,486 | ) | | | (5.3 | %) | Depreciation and amortization of property, equipment and leasehold improvements | | | 30,889 | | | | 25,711 | | | | 5,178 | | | | 20.1 | % | | | 35,440 | | | | 34,320 | | | | 1,120 | | | | 3.3 | % | | | | | | | | | | | | | | | Operating income | | | 403,898 | | | | 337,166 | | | | 66,732 | | | | 19.8 | % | | | 579,770 | | | | 488,104 | | | | 91,666 | | | | 18.8 | % | Other expense (income), net | | | 54,344 | | | | 28,828 | | | | 25,516 | | | | 88.5 | % | | | 112,871 | | | | 102,166 | | | | 10,705 | | | | 10.5 | % | Provision for income taxes | | | 119,516 | | | | 109,396 | | | | 10,120 | | | | 9.3 | % | | | 162,927 | | | | 125,083 | | | | 37,844 | | | | 30.3 | % | Income from continuing operations | | | 230,038 | | | | 198,942 | | | | 31,096 | | | | 15.6 | % | | Income (loss) from discontinued operations, net of income taxes | | | (6,390 | ) | | | 85,171 | | | | (91,561 | ) | | | (107.5 | %) | | | | | | | | | | | | | | | Net income | | $ | 223,648 | | | $ | 284,113 | | | $ | (60,465 | ) | | | (21.3 | %) | | $ | 303,972 | | | $ | 260,855 | | | $ | 43,117 | | | | 16.5 | % | | | | | | | | | | | | | |
59
The following table presents the reconciliation of Adjusted EBITDA expenses to operating expenses for the years indicated: | | | | | | | | | | Years Ended | | | | | | | | | | | | | Years Ended | | | | | | | | | December 31, | | | December 31, | | | | | | | | | | | | | December 31,
2015 | | | December 31,
2014 | | | Increase/(Decrease) | | | 2017 | | | 2016 | | | Increase/(Decrease) | | | | | (in thousands) | | | | | | | | | (in thousands) | | | | | | Index Adjusted EBITDA expenses | | $ | 165,977 | | | $ | 154,207 | | | $ | 11,770 | | | | 7.6 | % | | $ | 196,718 | | | $ | 182,073 | | | $ | 14,645 | | | | 8.0 | % | Analytics Adjusted EBITDA expenses | | | 337,956 | | | | 341,912 | | | | (3,956 | ) | | | (1.2 | %) | | | 332,645 | | | | 319,846 | | | | 12,799 | | | | 4.0 | % | All Other Adjusted EBITDA expenses | | | 89,383 | | | | 91,807 | | | | (2,424 | ) | | | (2.6 | %) | | | 85,052 | | | | 79,293 | | | | 5,759 | | | | 7.3 | % | | | | | | | | | | | | | | | Consolidated Adjusted EBITDA expenses | | | 593,316 | | | | 587,926 | | | | 5,390 | | | | 0.9 | % | | | 614,415 | | | | 581,212 | | | | 33,203 | | | | 5.7 | % | Amortization of intangible assets | | | 46,910 | | | | 45,877 | | | | 1,033 | | | | 2.3 | % | | | 44,547 | | | | 47,033 | | | | (2,486 | ) | | | (5.3 | %) | Depreciation and amortization of property, equipment and leasehold improvements | | | 30,889 | | | | 25,711 | | | | 5,178 | | | | 20.1 | % | | | 35,440 | | | | 34,320 | | | | 1,120 | | | | 3.3 | % | | | | | | | | | | | | | | Total operating expenses | | $ | 671,115 | | | $ | 659,514 | | | $ | 11,601 | | | | 1.8 | % | | $ | 694,402 | | | $ | 662,565 | | | $ | 31,837 | | | | 4.8 | % | | | | | | | | | | | | | |
Segment Results The results for each of our three reportable segments for the years ended December 31, 20152017 and 20142016 are presented below: Index Segment The following table presents the results for the Index segment for the years indicated: | | | | | | | | | | Years Ended | | | | | | | | | | | | | Years Ended | | | | | | | | December 31, | | | December 31, | | | | | | | | | | | | | December 31,
2015 | | December 31,
2014 | | Increase/(Decrease) | | | 2017 | | | 2016 | | | Increase/(Decrease) | | | | | (in thousands) | | | | | | | | (in thousands) | | | | | | Operating revenues: | | | | | | | | | | | | | | | | | | | | | | | | | Recurring subscriptions | | $ | 353,136 | | | $ | 320,113 | | | $ | 33,023 | | | | 10.3 | % | | $ | 427,289 | | | $ | 389,348 | | | $ | 37,941 | | | | 9.7 | % | Asset-based fees | | | 197,974 | | | 177,105 | | | 20,869 | | | | 11.8 | % | | | 276,092 | | | | 210,229 | | | | 65,863 | | | | 31.3 | % | Non-recurring | | | 7,854 | | | 6,674 | | | 1,180 | | | | 17.7 | % | | | 15,578 | | | | 13,974 | | | | 1,604 | | | | 11.5 | % | | | | | | | | | | | | | | Operating revenues total | | | 558,964 | | | 503,892 | | | 55,072 | | | | 10.9 | % | | | 718,959 | | | | 613,551 | | | | 105,408 | | | | 17.2 | % | Adjusted EBITDA expenses | | | 165,977 | | | 154,207 | | | 11,770 | | | | 7.6 | % | | | 196,718 | | | | 182,073 | | | | 14,645 | | | | 8.0 | % | | | | | | | | | | | | | | Adjusted EBITDA | | $ | 392,987 | | | $ | 349,685 | | | $ | 43,302 | | | | 12.4 | % | | $ | 522,241 | | | $ | 431,478 | | | $ | 90,763 | | | | 21.0 | % | | | | | | | | | | | | | | Adjusted EBITDA margin % | | | 70.3 | % | | 69.4 | % | | | | | | | 72.6 | % | | | 70.3 | % | | | | | | | | |
Revenues related to Index products increased 10.9%17.2% to $559.0$719.0 million for the year ended December 31, 20152017 compared to $503.9$613.6 million for the year ended December 31, 2014.2016. Recurring subscription revenuesRevenues from recurring subscriptions were up 10.3%9.7% to $353.1$427.3 million for the year ended December 31, 20152017 compared to $320.1$389.3 million for the year ended December 31, 2014.2016. The increase was primarily driven by solid growth in benchmark and data products broadly, including strong growth in market capcore products, combined with higher growth in new products, including factor and ESG and thematicindexes, as well as growth in custom index products. Adjusting for the impact of foreign currency exchange rate fluctuations, recurring subscription revenues would have increased 11.1% for the year ended December 31, 2015 compared to the year ended December 31, 2014.
Revenues from asset-based fees increased 11.8%31.3% to $198.0$276.1 million for the year ended December 31, 20152017 compared to $177.1$210.2 million for the year ended December 31, 2014.2016. The increase in asset-based fees was primarily driven by an increaseseveral items, including a $48.2 million, or 33.9%, growth in revenue from ETF’s, as well as strong growth in revenues from non-ETF institutional passive funds and exchange-traded futures and options linked to MSCI indexes. Average AUM in ETFs linked to MSCI indexes, increased $56.3 billion, or 15.5%, to $418.8 billion primarilywhich was driven by cash inflows,a 39.2% increase in average AUM, partially offset by market depreciation.the impact of a change in the product mix. In addition, revenue from non-ETF passive products grew $14.0 million, or 23.8%, driven by higher AUM and an increased contribution from higher fee products. Revenues from exchange traded futures and options contracts based on MSCI indexes also grew $3.7 million, or 38.8%, driven by a strong increase in total trading volumes and a more favorable product mix. 60
Index segment Adjusted EBITDA expenses increased 7.6%8.0% to $166.0$196.7 million for the year ended December 31, 20152017 compared to $154.2$182.1 million for the year ended December 31, 2014. The increase2016, primarily reflectsreflecting higher compensationcost of revenues and benefits costsselling and marketing expenses associated with our selling, developmentstronger operating performance and G&A activities.growth in the product line. Partially offsetting these increases were lower R&D expenses associated with higher allocations and investments in the prior year. Adjusting for the impact of foreign currency exchange rate fluctuations, Adjusted EBITDA expenses would have increased 12.6%8.4% for the year ended December 31, 20152017 compared to the year ended December 31, 2014. 2016.Analytics Segment The following table presents the results for the Analytics segment for the years indicated: | | | | | | | | | | Years Ended | | | | | | | | | | | | | Years Ended | | | | | | | | December 31, | | | December 31, | | | | | | | | | | | | | December 31,
2015 | | December 31,
2014 | | Increase/(Decrease) | | | 2017 | | | 2016 | | | Increase/(Decrease) | | | | | (in thousands) | | | | | | | | (in thousands) | | | | | | Operating revenues | | $ | 433,424 | | | $ | 414,085 | | | $ | 19,339 | | | | 4.7 | % | | Operating revenues: | | | | | | | | | | | | | | | | | | Recurring subscriptions | | | $ | 452,253 | | | $ | 439,864 | | | $ | 12,389 | | | | 2.8 | % | Non-recurring | | | | 6,016 | | | | 8,489 | | | | (2,473 | ) | | | (29.1 | %) | Operating revenues total | | | | 458,269 | | | | 448,353 | | | | 9,916 | | | | 2.2 | % | Adjusted EBITDA expenses | | | 337,956 | | | 341,912 | | | (3,956 | ) | | | (1.2 | %) | | | 332,645 | | | | 319,846 | | | | 12,799 | | | | 4.0 | % | | | | | | | | | | | | | | Adjusted EBITDA | | $ | 95,468 | | | $ | 72,173 | | | $ | 23,295 | | | | 32.3 | % | | $ | 125,624 | | | $ | 128,507 | | | $ | (2,883 | ) | | | (2.2 | %) | | | | | | | | | | | | | | Adjusted EBITDA margin % | | | 22.0 | % | | 17.4 | % | | | | | | | 27.4 | % | | | 28.7 | % | | | | | | | | |
Our
Analytics segment revenues increased 4.7%2.2% to $433.4$458.3 million for the year ended December 31, 20152017 compared to $414.1$448.4 million for the year ended December 31, 2014. The increase was2016, primarily driven by higher revenues from RiskManager, BarraOnegrowth in both Equity and InvestorForceMulti-Asset Class Analytics products. Adjusting for the impact of foreign currency exchange rate fluctuations, Analytics segment revenues would have increased 6.2%2.9% for the year ended December 31, 20152017 compared to the year ended December 31, 2014.2016. Analytics segment Adjusted EBITDA expenses decreased 1.2%increased 4.0% to $338.0$332.6 million for the year ended December 31, 20152017 compared to $341.9$319.8 million for the year ended December 31, 2014. The decrease was due to a decline2016, primarily driven by higher R&D expenses associated with investments in the MSCI Analytics Platform and Fixed Income and Multi-Asset Class offerings, as well as higher cost of revenues and selling and marketing costs, partially offset by increases in G&A and R&D. The increase in R&D was primarily the result of the reversal of previously capitalized software costs associated with a technology project. Adjusting for the impact of foreign currency exchange rate fluctuations, Adjusted EBITDA expenses would have increased 2.3% for the year ended December 31, 2015 compared to the year ended December 31, 2014.revenues. All Other Segment The following table presents the results for the All Other segment, which consists of the ESG and Real Estate product lines, for the years indicated: | | | | | | | | | | Years Ended | | | | | | | | | | | | | Years Ended | | | | | | | | December 31, | | | December 31, | | | | | | | | | | | | | December 31,
2015 | | December 31,
2014 | | Increase/(Decrease) | | | 2017 | | | 2016 | | | Increase/(Decrease) | | | | | (in thousands) | | | | | | | | (in thousands) | | | | | | Operating revenues | | | | | | | | | | ESG | | $ | 37,611 | | | $ | 28,294 | | | $ | 9,317 | | | | 32.9 | % | | Real Estate | | | 45,014 | | | 50,409 | | | (5,395 | ) | | | (10.7 | %) | | | | | | | | | | | | | | | Operating revenues: | | | | | | | | | | | | | | | | | | Recurring subscriptions | | | $ | 93,481 | | | $ | 84,457 | | | $ | 9,024 | | | | 10.7 | % | Non-recurring | | | | 3,463 | | | | 4,308 | | | | (845 | ) | | | (19.6 | %) | Operating revenues total | | | 82,625 | | | 78,703 | | | 3,922 | | | | 5.0 | % | | | 96,944 | | | | 88,765 | | | | 8,179 | | | | 9.2 | % | Adjusted EBITDA expenses | | | 89,383 | | | 91,807 | | | (2,424 | ) | | | (2.6 | %) | | | 85,052 | | | | 79,293 | | | | 5,759 | | | | 7.3 | % | | | | | | | | | | | | | | Adjusted EBITDA | | $ | (6,758 | ) | | $ | (13,104 | ) | | $ | 6,346 | | | | 48.4 | % | | $ | 11,892 | | | $ | 9,472 | | | $ | 2,420 | | | | 25.5 | % | | | | | | | | | | | | | | Adjusted EBITDA margin % | | | (8.2 | %) | | (16.6 | %) | | | | | | | 12.3 | % | | | 10.7 | % | | | | | | | | |
All Other segment revenues increased 5.0%9.2% to $82.6$96.9 million for the year ended December 31, 20152017 compared to $78.7$88.8 million for the year ended December 31, 2014.2016. The increase in All Other revenues was driven by $9.3a 21.8% increase in ESG revenues to $54.8 million, or 32.9%, risepartially offset by a decrease in Real Estate revenues of 3.8% to $42.1 61
million. The increase in ESG revenues was driven by higher ESG Ratings product revenues, which benefited from increased investments. The decrease in Real Estate revenues was driven by lower revenues from our ESGPortfolio Analysis Service products, partially offset by $5.4 million, or 10.7%, declinean increase in revenues from Real EstateMarket Information products. AdjustingAdjusted for the impact of foreign currency exchange rate fluctuations and the divestiture of the Real Estate occupiers business, Real Estate revenues increased 0.3% and All Other segmentoperating revenues would have increased 12.2%11.3% for the year ended December 31, 20152017 compared to the year ended December 31, 2014, of which Real Estate revenues would have increased 0.4%.2016. All Other segment Adjusted EBITDA expenses decreased 2.6%increased 7.3% to $89.4$85.1 million for the year ended December 31, 20152017 compared to $91.8$79.3 million for the year ended December 31, 2014. The decrease was2016, primarily driven by higher cost of revenues attributable to ESG operations, partially offset by lower compensationgeneral and benefits costsadministrative and non-compensationselling and marketing costs attributable to Real Estate partially offset by higher compensation and benefits costs related to ESG.operations. Adjusting for the impact of foreign currency exchange rate fluctuations, Adjusted EBITDA expenses would have increased 4.0%7.8% for the year ended December 31, 20152017 compared to the year ended December 31, 2014. Results of Operations
Year Ended December 31, 2014 Compared to Year Ended December 31, 2013
The following table presents the results of operations for the years indicated:2016.
| | | | | | | | | | | | | | | | | | | | Years Ended | | | | | | | | December 31,
2014 | | | December 31,
2013 | | | Increase/(Decrease) | | | | | (in thousands, except per share data) | | | | | | | | Operating revenues | | $ | 996,680 | | | $ | 913,364 | | | $ | 83,316 | | | | 9.1 | % | Operating expenses: | | | | | | | | | | | | | | | | | Cost of revenues | | | 276,623 | | | | 240,697 | | | | 35,926 | | | | 14.9 | % | Selling and marketing | | | 163,839 | | | | 137,693 | | | | 26,146 | | | | 19.0 | % | Research and development | | | 71,095 | | | | 61,003 | | | | 10,092 | | | | 16.5 | % | General and administrative | | | 76,369 | | | | 68,458 | | | | 7,911 | | | | 11.6 | % | Amortization of intangible assets | | | 45,877 | | | | 44,798 | | | | 1,079 | | | | 2.4 | % | Depreciation and amortization of property, equipment, and leasehold improvements | | | 25,711 | | | | 20,384 | | | | 5,327 | | | | 26.1 | % | | | | | | | | | | | | | | | | | | Total operating expenses | | | 659,514 | | | | 573,033 | | | | 86,481 | | | | 15.1 | % | | | | | | | | | | | | | | | | | | Operating income | | | 337,166 | | | | 340,331 | | | | (3,165 | ) | | | (0.9 | %) | Other expense (income), net | | | 28,828 | | | | 27,503 | | | | 1,325 | | | | 4.8 | % | | | | | | | | | | | | | | | | | | Income from continuing operations before provision for income taxes | | | 308,338 | | | | 312,828 | | | | (4,490 | ) | | | (1.4 | %) | Provision for income taxes | | | 109,396 | | | | 112,918 | | | | (3,522 | ) | | | (3.1 | %) | | | | | | | | | | | | | | | | | | Income from continuing operations | | | 198,942 | | | | 199,910 | | | | (968 | ) | | | (0.5 | %) | Income (loss) from discontinued operations, net of income taxes | | | 85,171 | | | | 22,647 | | | | 62,524 | | | | 276.1 | % | | | | | | | | | | | | | | | | | | Net income | | $ | 284,113 | | | $ | 222,557 | | | $ | 61,556 | | | | 27.7 | % | | | | | | | | | | | | | | | | | | Earnings per basic common share: | | | | | | | | | | | | | | | | | From continuing operations | | $ | 1.72 | | | $ | 1.66 | | | $ | 0.06 | | | | 3.6 | % | From discontinued operations | | | 0.73 | | | | 0.19 | | | | 0.54 | | | | 284.2 | % | | | | | | | | | | | | | | | | | | Earnings per basic common share | | $ | 2.45 | | | $ | 1.85 | | | $ | 0.60 | | | | 32.4 | % | | | | | | | | | | | | | | | | | | Earnings per diluted common share: | | | | | | | | | | | | | | | | | From continuing operations | | $ | 1.70 | | | $ | 1.64 | | | $ | 0.06 | | | | 3.7 | % | From discontinued operations | | | 0.73 | | | | 0.19 | | | | 0.54 | | | | 284.2 | % | | | | | | | | | | | | | | | | | | Earnings per diluted common share | | $ | 2.43 | | | $ | 1.83 | | | $ | 0.60 | | | | 32.8 | % | | | | | | | | | | | | | | | | | | Operating margin | | | 33.8% | | | | 37.3% | | | | | | | | | |
Operating Revenues
The following table presents operating revenues by recurring subscriptions, asset-based fees and non-recurring revenues for the years indicated:
| | | | | | | | | | | | | | | | | | | | Years Ended | | | | | | | | | | | December 31,
2014 | | | December 31,
2013 | | | Increase/(Decrease) | | | | | (in thousands) | | | | | | | | Recurring subscriptions | | | 801,183 | | | | 748,600 | | | | 52,583 | | | | 7.0 | % | Asset-based fees | | | 177,105 | | | | 149,487 | | | | 27,618 | | | | 18.5 | % | Non-recurring revenue | | | 18,392 | | | | 15,277 | | | | 3,115 | | | | 20.4 | % | | | | | | | | | | | | | | | | | | Total operating revenues | | $ | 996,680 | | | $ | 913,364 | | | $ | 83,316 | | | | 9.1 | % | | | | | | | | | | | | | | | | | |
Total operating revenues grew 9.1% to $996.7 million for the year ended December 31, 2014 compared to $913.4 million for the year ended December 31, 2013.
Revenue from recurring subscriptions increased 7.0% to $801.2 million for the year ended December 31, 2014 compared to $748.6 million for the year ended December 31, 2013. The increase in subscription revenues was primarily driven by growth from Index products as well as higher Analytics products revenues. Excluding the impact of revenues related to the GMI Ratings acquisition, recurring subscriptions revenues would have increased 6.6% for the year ended December 31, 2014 compared to the year ended December 31, 2013.
Revenues from asset-based fees increased 18.5% to $177.1 million for the year ended December 31, 2014 compared to $149.5 million for the year ended December 31, 2013. The increase was driven by higher average AUM in both ETFs and non-ETF passive funds as well as higher trading volumes in futures and options contracts, all linked to MSCI indexes. The average value of AUM in ETFs linked to MSCI indexes increased $37.5 billion, or 11.5%, compared to the year ended December 31, 2013.
The following table presents the value of AUM in ETFs linked to MSCI indexes and the sequential change of such assets as of the end of each of the periods indicated:
| | | | | | | | | | | | | | | | | | | | | | | | | | | | | | | | | | | | Period Ended | | | | | 2013 | | | 2014 | | | | | March 31, | | | June 30, | | | September 30, | | | December 31, | | | March 31, | | | June 30, | | | September 30, | | | December 31, | | | | | (in billions) | | AUM in ETFs linked to MSCI Indexes(1) | | $ | 357.3 | | | $ | 269.7 | | | $ | 302.6 | | | $ | 332.9 | | | $ | 340.8 | | | $ | 378.7 | | | $ | 377.9 | | | $ | 373.3 | | | | | | | | | Sequential Change in Value | | | | | | | | | | | | | | | | | | | | | | | | | Market Appreciation/(Depreciation) | | $ | 16.0 | | | $ | (13.2 | ) | | $ | 20.2 | | | $ | 10.9 | | | $ | 1.3 | | | $ | 15.2 | | | $ | (17.2 | ) | | $ | (8.3 | ) | Cash Inflow/(Outflow)(2) | | | (61.0 | ) | | | (74.4 | ) | | | 12.7 | | | | 19.4 | | | | 6.6 | | | | 22.7 | | | | 16.4 | | | | 3.7 | | | | | | | | | | | | | | | | | | | | | | | | | | | | | | | | | | | | | | | | | | | | Total Change | | $ | (45.0 | ) | | $ | (87.6 | ) | | $ | 32.9 | | | $ | 30.3 | | | $ | 7.9 | | | $ | 37.9 | | | $ | (0.8 | ) | | $ | (4.6 | ) | | | | | | | | | | | | | | | | | | | | | | | | | | | | | | | | | |
Source: Bloomberg and MSCI
(1) | The value of AUM in ETFs linked to MSCI Indexes is calculated by multiplying the ETF net asset value by the number of shares outstanding. |
(2) | Includes the loss of $82.8 billion and $74.8 billion of AUM related to certain Vanguard ETFs as of March 31, 2013 and June 30, 2013, respectively. |
As of December 31, 2014, the value of AUM in ETFs linked to MSCI equity indexes was $373.3 billion, up $40.4 billion, or 12.1%, from $332.9 billion as of December 31, 2013. Of the $373.3 billion of AUM in ETFs linked to MSCI equity indexes as of December 31, 2014, 50.8% were linked to indexes related to developed markets outside of the U.S., 23.5% were linked to emerging market indexes, 20.0% were linked to U.S. market indexes and 5.7% were linked to other global indexes.
Non-recurring revenues increased 20.4% to $18.4 million for the year ended December 31, 2014 compared to $15.3 million for the year ended December 31, 2013, primarily resulting from higher one-time sales in Real Estate products.
The following table presents operating revenues by reportable segment and revenue type for the years indicated:
| | | | | | | | | | | | | | | | | | | | Years Ended | | | | | | | | | | | December 31,
2014 | | | December 31,
2013 | | | Increase/(Decrease) | | | | | (in thousands) | | | | | | | | Operating revenues: | | | | | | | | | | | | | | | | | Index | | | | | | | | | | | | | | | | | Recurring subscriptions | | $ | 320,113 | | | $ | 292,241 | | | $ | 27,872 | | | | 9.5 | % | Asset-based fees | | | 177,105 | | | | 149,487 | | | | 27,618 | | | | 18.5 | % | Non-recurring | | | 6,674 | | | | 6,686 | | | | (12 | ) | | | (0.2 | %) | | | | | | | | | | | | | | | | | | Index total | | | 503,892 | | | | 448,414 | | | | 55,478 | | | | 12.4 | % | | | | | | | | | | | | | | | | | | Analytics total | | | 414,085 | | | | 397,203 | | | | 16,882 | | | | 4.3 | % | | | | | | | | | | | | | | | | | | All Other | | | | | | | | | | | | | | | | | ESG | | | 28,294 | | | | 21,308 | | | | 6,986 | | | | 32.8 | % | Real Estate | | | 50,409 | | | | 46,439 | | | | 3,970 | | | | 8.5 | % | | | | | | | | | | | | | | | | | | All Other total | | | 78,703 | | | | 67,747 | | | | 10,956 | | | | 16.2 | % | | | | | | | | | | | | | | | | | | Total operating revenues | | $ | 996,680 | | | $ | 913,364 | | | $ | 83,316 | | | | 9.1 | % | | | | | | | | | | | | | | | | | |
Refer to the section titled, “Segment Results of Operations” for an explanation of the results.
Operating Expenses
Operating expenses increased 15.1% to $659.5 million for the year ended December 31, 2014 compared to $573.0 million for the year ended December 31, 2013, which reflects, in part, the incremental investments we made in 2014 and prior.
We had 2,926 employees as of December 31, 2014 compared to 2,580 employees as of December 31, 2013. As of December 31, 2014, 50.5% of our employees were located in emerging market centers compared to 46.2% of our employees as of December 31, 2013.
The following table presents operating expenses by activity for the years indicated:
| | | | | | | | | | | | | | | | | | | | Years Ended | | | | | | | | | | | December 31,
2014 | | | December 31,
2013 | | | Increase/(Decrease) | | | | | (in thousands) | | | | | | | | Operating expenses: | | | | | | | | | | | | | | | | | Cost of revenues | | $ | 276,623 | | | $ | 240,697 | | | $ | 35,926 | | | | 14.9 | % | Selling and marketing | | | 163,839 | | | | 137,693 | | | | 26,146 | | | | 19.0 | % | Research and development | | | 71,095 | | | | 61,003 | | | | 10,092 | | | | 16.5 | % | General and administrative | | | 76,369 | | | | 68,458 | | | | 7,911 | | | | 11.6 | % | Amortization of intangible assets | | | 45,877 | | | | 44,798 | | | | 1,079 | | | | 2.4 | % | Depreciation and amortization of property, equipment and leasehold improvements | | | 25,711 | | | | 20,384 | | | | 5,327 | | | | 26.1 | % | | | | | | | | | | | | | | | | | | Total operating expenses | | $ | 659,514 | | | $ | 573,033 | | | $ | 86,481 | | | | 15.1 | % | | | | | | | | | | | | | | | | | |
Cost of Revenues
Cost of revenues for the year ended December 31, 2014 increased 14.9% to $276.6 million compared to $240.7 million for the year ended December 31, 2013. The increase was primarily driven by higher compensation and benefits costs associated with higher staffing levels as well as higher non-compensation costs including information technology, market data, occupancy and professional fees.
Selling and Marketing
Selling and marketing expenses for the year ended December 31, 2014 increased 19.0% to $163.8 million compared to $137.7 million for the year ended December 31, 2013. The increase was primarily driven by higher compensation and benefits costs associated with higher staffing levels and increased non-compensation costs primarily associated with conferences and events.
Research and Development
R&D expenses for the year ended December 31, 2014 increased 16.5% to $71.1 million compared to $61.0 million for the year ended December 31, 2013. The increase was primarily driven by higher compensation and benefits costs associated with higher staffing levels, partially offset by higher capitalized costs related to internally developed software.
General and Administrative
G&A expenses for the year ended December 31, 2014 increased 11.6% to $76.4 million compared to $68.5 million for the year ended December 31, 2013. The increase was primarily driven by higher professional fees, as well as higher compensation and benefits costs associated with higher staffing levels.
The following table presents operating expenses using compensation and non-compensation categories, rather than using activity categories, for the years indicated:
| | | | | | | | | | | | | | | | | | | | Years Ended | | | | | | | | | | | December 31,
2014 | | | December 31,
2013 | | | Increase/(Decrease) | | | | | (in thousands) | | | | | | | | Compensation and benefits | | $ | 412,550 | | | $ | 361,177 | | | $ | 51,373 | | | | 14.2 | % | Non-compensation expenses | | | 175,376 | | | | 146,674 | | | | 28,702 | | | | 19.6 | % | Amortization of intangible assets | | | 45,877 | | | | 44,798 | | | | 1,079 | | | | 2.4 | % | Depreciation and amortization of property, equipment and leasehold improvements | | | 25,711 | | | | 20,384 | | | | 5,327 | | | | 26.1 | % | | | | | | | | | | | | | | | | | | Total operating expenses | | $ | 659,514 | | | $ | 573,033 | | | $ | 86,481 | | | | 15.1 | % | | | | | | | | | | | | | | | | | |
Compensation and benefits costs for the year ended December 31, 2014 increased 14.2% to $412.6 million compared to $361.2 million for year ended December 31, 2013. The increase in compensation and benefits costs primarily reflects costs related to increased staffing levels.
Non-compensation expenses for the year ended December 31, 2014 increased 19.6% to $175.4 million compared to $146.7 million for the year ended December 31, 2013. The increase was primarily related to higher third-party professional fees as well as higher information technology costs, among other expenses.
Amortization of Intangibles
For the year ended December 31, 2014, amortization of intangibles expense totaled $45.9 million compared to $44.8 million for the year ended December 31, 2013. The 2.4% increase resulted from the increased amortization of intangible assets resulting from the amortization of our capitalized software as well as the GMI Ratings acquisition.
Depreciation and amortization of property, equipment and leasehold improvements
For the years ended December 31, 2014 and 2013, depreciation and amortization of property, equipment and leasehold improvements totaled $25.7 million and $20.4 million, respectively. The 26.1% increase primarily reflected higher depreciation of investments made in our information technology infrastructure.
Other Expense (Income), Net
Other expense (income), net for the year ended December 31, 2014 was $28.8 million, an increase of $1.3 million, or 4.8%, compared to $27.5 million for the year ended December 31, 2013. The increase primarily reflected higher interest expense related charges resulting from our refinancings, largely offset by the impact of income related to our transition services agreement with ISS. Interest expense increased by $5.6 million primarily reflecting a non-cash charge of $7.9 million in the fourth quarter of 2014 related to the accelerated amortization of deferred financing and debt discounts associated with the prepayment of our senior secured term loan facility compared to a similar $1.4 million charge recognized in the prior year associated with a credit facility extension.
Income Taxes
The provision for income tax expense was $109.4 million and $112.9 million for the years ended December 31, 2014 and 2013, respectively. These amounts reflect effective tax rates of 35.5% and 36.1% for the years ended December 31, 2014 and 2013, respectively.
The effective tax rate of 35.5% for the year ended December 31, 2014 reflects our operating rate adjusted for the impact of certain discrete items that increased our effective tax rate by 0.3 percentage points. Included in our effective tax rate was the benefit of the 2014 federal research and development credit, the effect of which reduced our full year effective tax rate by 0.9 percentage points.
Income (loss) from Discontinued Operations, Net of Income Taxes
Income from discontinued operations, net of income taxes was $85.2 million for the year ended December 31, 2014 compared to $22.6 million for the year ended December 31, 2013. The results for the year ended December 31, 2014 included a net gain of $78.7 million resulting from the disposition of ISS.
Adjusted EBITDA
The following table presents the calculation of Adjusted EBITDA for the years indicated:
| | | | | | | | | | | | | | | | | | | | Years Ended | | | | | | | | | | | December 31,
2014 | | | December 31,
2013 | | | Increase/(Decrease) | | | | | (in thousands) | | | | | | | | Operating revenues | | $ | 996,680 | | | $ | 913,364 | | | $ | 83,316 | | | | 9.1 | % | Adjusted EBITDA expenses | | | 587,926 | | | | 508,216 | | | | 79,710 | | | | 15.7 | % | | | | | | | | | | | | | | | | | | Adjusted EBITDA | | $ | 408,754 | | | $ | 405,148 | | | $ | 3,606 | | | | 0.9 | % | | | | | | | | | | | | | | | | | | Adjusted EBITDA margin % | | | 41.0 | % | | | 44.4 | % | | | | | | | | | Operating margin % | | | 33.8 | % | | | 37.3 | % | | | | | | | | |
Adjusted EBITDA increased 0.9% to $408.8 million for the year ended December 31, 2014 compared to $405.1 million for the year ended December 31, 2013. Adjusted EBITDA margin decreased to 41.0% for the year ended December 31, 2014 compared to 44.4% for the year ended December 31, 2013. The decline in margin reflects, in part, the incremental investments we made in 2014 and prior.
Reconciliation of Adjusted EBITDA to Net Income and Adjusted EBITDA Expenses to Operating Expenses
The following table presents the reconciliation of Adjusted EBITDA to net income for the years indicated:
| | | | | | | | | | | | | | | | | | | | Years Ended | | | | | | | | | | | December 31,
2014 | | | December 31,
2013 | | | Increase/(Decrease) | | | | | (in thousands) | | | | | | | | Index Adjusted EBITDA | | $ | 349,685 | | | $ | 323,558 | | | $ | 26,127 | | | | 8.1 | % | Analytics Adjusted EBITDA | | | 72,173 | | | | 97,806 | | | | (25,633 | ) | | | (26.2 | %) | All Other Adjusted EBITDA | | | (13,104 | ) | | | (16,216 | ) | | | 3,112 | | | | 19.2 | % | | | | | | | | | | | | | | | | | | Consolidated Adjusted EBITDA | | | 408,754 | | | | 405,148 | | | | 3,606 | | | | 0.9 | % | Lease exit charge | | | — | | | | (365 | ) | | | 365 | | | | (100.0 | %) | Amortization of intangible assets | | | 45,877 | | | | 44,798 | | | | 1,079 | | | | 2.4 | % | Depreciation and amortization of property, equipment and leasehold improvements | | | 25,711 | | | | 20,384 | | | | 5,327 | | | | 26.1 | % | | | | | | | | | | | | | | | | | | Operating income | | | 337,166 | | | | 340,331 | | | | (3,165 | ) | | | (0.9 | %) | Other expense (income), net | | | 28,828 | | | | 27,503 | | | | 1,325 | | | | 4.8 | % | Provision for income taxes | | | 109,396 | | | | 112,918 | | | | (3,522 | ) | | | (3.1 | %) | Income from continuing operations | | | 198,942 | | | | 199,910 | | | | (968 | ) | | | (0.5 | %) | Income (loss) from discontinued operations, net of income taxes | | | 85,171 | | | | 22,647 | | | | 62,524 | | | | 276.1 | % | | | | | | | | | | | | | | | | | | Net income | | $ | 284,113 | | | $ | 222,557 | | | $ | 61,556 | | | | 27.7 | % | | | | | | | | | | | | | | | | | |
The following table presents the reconciliation of Adjusted EBITDA expenses to operating expenses for the years indicated:
| | | | | | | | | | | | | | | | | | | | Years Ended | | | | | | | | | | | December 31,
2014 | | | December 31,
2013 | | | Increase/(Decrease) | | | | | (in thousands) | | | | | | | | Index Adjusted EBITDA expenses | | $ | 154,207 | | | $ | 124,856 | | | $ | 29,351 | | | | 23.5 | % | Analytics Adjusted EBITDA expenses | | | 341,912 | | | | 299,397 | | | | 42,515 | | | | 14.2 | % | All Other Adjusted EBITDA expenses | | | 91,807 | | | | 83,963 | | | | 7,844 | | | | 9.3 | % | | | | | | | | | | | | | | | | | | Consolidated Adjusted EBITDA expenses | | | 587,926 | | | | 508,216 | | | | 79,710 | | | | 15.7 | % | Lease exit charge | | | — | | | | (365 | ) | | | 365 | | | | (100.0 | %) | Amortization of intangible assets | | | 45,877 | | | | 44,798 | | | | 1,079 | | | | 2.4 | % | Depreciation and amortization of property, equipment and leasehold improvements | | | 25,711 | | | | 20,384 | | | | 5,327 | | | | 26.1 | % | | | | | | | | | | | | | | | | | | Total operating expenses | | $ | 659,514 | | | $ | 573,033 | | | $ | 86,481 | | | | 15.1 | % | | | | | | | | | | | | | | | | | |
Segment Results
The results for each of our three reportable segments for the years ended December 31, 2014 and 2013 are presented below:
Index Segment
The following table presents the results for the Index segment for the years indicated:
| | | | | | | | | | | | | | | | | | | | Years Ended | | | | | | | | | | | December 31,
2014 | | | December 31,
2013 | | | Increase/(Decrease) | | | | | (in thousands) | | | | | | | | Operating revenues: | | | | | | | | | | | | | | | | | Recurring subscriptions | | $ | 320,113 | | | $ | 292,241 | | | $ | 27,872 | | | | 9.5 | % | Asset-based fees | | | 177,105 | | | | 149,487 | | | | 27,618 | | | | 18.5 | % | Non-recurring | | | 6,674 | | | | 6,686 | | | | (12 | ) | | | (0.2 | %) | | | | | | | | | | | | | | | | | | Operating revenues total | | | 503,892 | | | | 448,414 | | | | 55,478 | | | | 12.4 | % | Adjusted EBITDA expenses | | | 154,207 | | | | 124,856 | | | | 29,351 | | | | 23.5 | % | | | | | | | | | | | | | | | | | | Adjusted EBITDA | | $ | 349,685 | | | $ | 323,558 | | | $ | 26,127 | | | | 8.1 | % | | | | | | | | | | | | | | | | | | Adjusted EBITDA margin % | | | 69.4 | % | | | 72.2 | % | | | | | | | | |
Revenues related to Index products increased 12.4% to $503.9 million for the year ended December 31, 2014 compared to $448.4 million for the year ended December 31, 2013.
Recurring subscription revenues were up 9.5% to $320.1 million for the year ended December 31, 2014 compared to $292.2 million for the year ended December 31, 2013, driven by growth in benchmark products.
Revenues from asset-based fees increased 18.5% to $177.1 million for the year ended December 31, 2014 compared to $149.5 million for the year ended December 31, 2013. The increase was driven by higher average AUM in both ETFs and non-ETF passive funds linked to MSCI indexes.
Index segment Adjusted EBITDA expenses increased 23.5% to $154.2 million for the year ended December 31, 2014 compared to $124.9 million for the year ended December 31, 2013. The increase reflected higher compensation and benefits costs, mainly within selling and marketing, as well as higher non-compensation costs.
Analytics Segment
The following table presents the results for the Analytics segment for the years indicated:
| | | | | | | | | | | | | | | | | | | | Years Ended | | | | | | | | | | | December 31,
2014 | | | December 31,
2013 | | | Increase/(Decrease) | | | | | (in thousands) | | | | | | | | Operating revenues | | $ | 414,085 | | | $ | 397,203 | | | $ | 16,882 | | | | 4.3 | % | Adjusted EBITDA expenses | | | 341,912 | | | | 299,397 | | | | 42,515 | | | | 14.2 | % | | | | | | | | | | | | | | | | | | Adjusted EBITDA | | $ | 72,173 | | | $ | 97,806 | | | $ | (25,633 | ) | | | (26.2 | %) | | | | | | | | | | | | | | | | | | Adjusted EBITDA margin % | | | 17.4 | % | | | 24.6 | % | | | | | | | | |
Our Analytics segment revenues increased 4.3% to $414.1 million for the year ended December 31, 2014 compared to $397.2 million for the year ended December 31, 2013. The increase was primarily driven by higher revenues from our RiskManager, HedgePlatform, InvestorForce and BarraOne, partially offset by lower revenues from equity risk models.
Analytics segment Adjusted EBITDA expenses increased 14.2% to $341.9 million for the year ended December 31, 2014 compared to $299.4 million for the year ended December 31, 2013. The increase was primarily within cost of revenues and attributable to higher compensation and benefits costs, reflecting higher staffing levels, as well as higher non-compensation costs.
All Other Segment
The following table presents the results for the All Other segment for the years indicated:
| | | | | | | | | | | | | | | | | | | | Years Ended | | | | | | | | | | | December 31,
2014 | | | December 31,
2013 | | | Increase/(Decrease) | | | | | (in thousands) | | | | | | | | Operating revenues | | | | | | | | | | | | | | | | | ESG | | $ | 28,294 | | | $ | 21,308 | | | $ | 6,986 | | | | 32.8 | % | Real Estate | | | 50,409 | | | | 46,439 | | | | 3,970 | | | | 8.5 | % | | | | | | | | | | | | | | | | | | Operating revenues total | | | 78,703 | | | | 67,747 | | | | 10,956 | | | | 16.2 | % | Adjusted EBITDA expenses | | | 91,807 | | | | 83,963 | | | | 7,844 | | | | 9.3 | % | | | | | | | | | | | | | | | | | | Adjusted EBITDA | | $ | (13,104 | ) | | $ | (16,216 | ) | | $ | 3,112 | | | | 19.2 | % | | | | | | | | | | | | | | | | | | Adjusted EBITDA margin % | | | (16.6 | %) | | | (23.9 | %) | | | | | | | | |
All Other segment revenues increased 16.2% to $78.7 million for the year ended December 31, 2014 compared to $67.7 million for the year ended December 31, 2013. The increase was driven by higher revenues from our ESG and Real Estate products. Excluding the impact of revenues related to the GMI Ratings acquisition, All Other segment revenues would have increased 11.8% for the year ended December 31, 2014 compared to the year ended December 31, 2013.
All Other segment Adjusted EBITDA expenses increased 9.3% to $91.8 million for the year ended December 31, 2014 compared to $84.0 million for the year ended December 31, 2013. The increase was primarily driven by higher compensation and benefits costs as well as higher non-compensation costs within ESG.
Operating Metrics Run Rate At the end of any period, we generally have subscription and investment product license agreements in place for a large portion of total revenues for the following 12 months. We measure the fees related to these agreements and refer to this as “Run Rate.” The “Run RateRate” estimates at a particular point in time primarily represents the forward-lookingannualized value of the recurring revenues under our client license agreements (“Client Contracts”) for the next 12 months, from then-current subscriptions and investment product licenses we provide to our clients under renewable contracts or agreements assuming all contracts or agreementsClient Contracts that come up for renewal are renewed and assuming then-current currency exchange rates.rates, subject to the adjustments and exclusions described below. For any licenseClient Contract where fees are linked to an investment product’s assets or trading volume,volume/fees, the Run Rate calculation reflects, for ETF fees,ETFs, the market value on the last trading day of the period, and for non-ETF funds and futures and options, the most recent periodic fee earned under such license quarterly volumes and/or subscription. Thereported exchange fees, and for other non-ETF products, the most recent client-reported assets. Run Rate does not include fees associated with “one-time” and other non-recurring transactions. In addition, we remove from theadd to Run Rate the feesannualized fee value of recurring new sales, whether to existing or new clients, when we execute Client Contracts, even though the license start date, and associated revenue recognition, may not be effective until a later date. We remove from Run Rate the annualized fee value associated with products or services under any subscription or investment product license agreementClient Contract with respect to which we have received
a notice of termination or non-renewal during the period and have determined that such notice evidences the client’s final decision to terminate or not renew the applicable subscriptionproducts or agreement,services, even though such notice is not effective until a later date. Because the Run Rate represents potential futureChanges in our recurring revenues there is typically a delayed impact on our operating revenues fromlag changes in our Run Rate. In addition, theThe actual amount of recurring revenues we will realize over the following 12 months will differ from the Run Rate because of:
for numerous reasons, including: fluctuations in revenues associated with new subscriptions and non-recurringrecurring sales; modifications, cancellations and non-renewals of existing agreements,Client Contracts, subject to specified notice requirements; differences between the recurring license start date and the date the Client Contract is executed due to, for example, contracts with onboarding periods; fluctuations in asset-based fees, which may result from changes in certain investment products’ total expense ratios, market movements, including foreign currency exchange rates, or from investment inflows into and outflows from investment products linked to our indexes; fluctuations in fees based on trading volumes of futures and options contracts linked to our indexes; fluctuations in the number of hedge funds for which we provide investment information and risk analysis to hedge fund investors; revenue recognition differences under U.S. GAAP, including those related to the timing of implementation and report deliveries for certain of our products and services; 62
| • | fluctuations in foreign currency exchange rates; and |
the impact of acquisitions and dispositions.divestitures. Changes in Run Rate between periods may be attributable to, among other things, increases from new subscriptions, decreases from cancellations, increases or decreases, as the case may be, from the change in the value of assets of investment products linked to MSCI indexes, the change in trading volumes of futures and options contracts linked to MSCI indexes, price changes, fluctuations in foreign currency exchange rates and the impact of acquisitions and dispositions.
The following table presents Run Rates by reportable segment and product category as of the dates indicated and the growth percentages over the years indicated: | | | | | | | | | | | | As of | | | Comparison of | | | | | As of | | | Comparison of | | | December 31, | | | December 31, | | | December 31, | | | December 31, | | | December 31, | | | | | December 31,
2015 | | | December 31,
2014 | | | December 31,
2013 | | | December 31,
2015 to 2014 | | December 31,
2014 to 2013 | | | | 2018 | | | | 2017 | | | | 2016 | | | 2018 to 2017 | | | 2017 to 2016 | | | | | (in thousands) | | | | | | | | (in thousands) | | | | | | | | | | Run Rates: | | | | | | | | | | | | Index: | | | | | | | | | | | | | | | | | | | | | | | | | | | | | | | Recurring subscriptions | | $ | 368,855 | | | $ | 335,277 | | | $ | 305,150 | | | | 10.0 | % | | 9.9 | % | | $ | 502,665 | | | $ | 451,048 | | | $ | 406,729 | | | | 11.4 | % | | | 10.9 | % | Asset-based fees | | | 201,047 | | | | 174,558 | | | | 158,305 | | | | 15.2 | % | | 10.3 | % | | | 311,908 | | | | 316,812 | | | | 216,982 | | | | (1.5 | %) | | | 46.0 | % | | | | | | | | | | | | | | | | Index total | | | 569,902 | | | | 509,835 | | | | 463,455 | | | | 11.8 | % | | 10.0 | % | | | 814,573 | | | | 767,860 | | | | 623,711 | | | | 6.1 | % | | | 23.1 | % | | | | | | | | | | | | | | | | Analytics | | | 436,671 | | | | 417,677 | | | | 405,082 | | | | 4.5 | % | | 3.1 | % | | | 491,861 | | | | 489,451 | | | | 451,533 | | | | 0.5 | % | | | 8.4 | % | | | | | | | | | | | | | | | | All Other: | | | | | | | | | | | | ESG – recurring subscriptions | | | 40,291 | | | | 34,482 | | | | 22,874 | | | | 16.8 | % | | 50.7 | % | | Real Estate – recurring subscriptions | | | 42,386 | | | | 44,731 | | | | 43,487 | | | | (5.2 | %) | | 2.9 | % | | | | | | | | | | | | | | | | | All Other total | | | 82,677 | | | | 79,213 | | | | 66,361 | | | | 4.4 | % | | 19.4 | % | | | | | | | | | | | | | | | | | All Other | | | | 124,886 | | | | 108,413 | | | | 88,074 | | | | 15.2 | % | | | 23.1 | % | Total Run Rate | | $ | 1,089,250 | | | $ | 1,006,725 | | | $ | 934,898 | | | | 8.2 | % | | 7.7 | % | | $ | 1,431,320 | | | $ | 1,365,724 | | | $ | 1,163,318 | | | | 4.8 | % | | | 17.4 | % | | | | | | | | | | | | | | | | | | | | | | | | | | | | | | | | | | | | Recurring subscription total | | $ | 888,203 | | | $ | 832,167 | | | $ | 776,593 | | | | 6.7 | % | | 7.2 | % | | Asset-based fees total | | | 201,047 | | | | 174,558 | | | | 158,305 | | | | 15.2 | % | | 10.3 | % | | | | | | | | | | | | | | | | | Recurring subscriptions total | | | $ | 1,119,412 | | | $ | 1,048,912 | | | $ | 946,336 | | | | 6.7 | % | | | 10.8 | % | Asset-based fees | | | | 311,908 | | | | 316,812 | | | | 216,982 | | | | (1.5 | %) | | | 46.0 | % | Total Run Rate | | $ | 1,089,250 | | | $ | 1,006,725 | | | $ | 934,898 | | | | 8.2 | % | | 7.7 | % | | $ | 1,431,320 | | | $ | 1,365,724 | | | $ | 1,163,318 | | | | 4.8 | % | | | 17.4 | % | | | | | | | | | | | | | | | |
December 31, 20152018 Compared to December 31, 20142017 Total Run Rate grew 8.2%4.8% to $1,089.3$1,431.3 million as of December 31, 20152018 compared to $1,006.7$1,365.7 million as of December 31, 2014.2017. Recurring subscription Run Rate grew 6.7% to $888.2$1,119.4 million as of December 31, 20152018 compared to $832.2$1,048.9 million as of December 31, 2014.2017. Adjusting for the impact of foreign currency exchange rate fluctuations, recurring subscription Run Rate would have increased 7.9%7.3% as of December 31, 20152018 compared to December 31, 2014.2017. Run Rate from asset-based fees increased 15.2%decreased 1.5% to $201.0$311.9 million atas of December 31, 2015,2018, from $174.6$316.8 million atas of December 31, 2014,2017, primarily driven by higherlower AUM in ETFs, andpartially offset by increases in non-ETF passive funds as well as increases inand futures and options contracts, all linked to MSCI indexes. As of December 31, 2015,2018, the value of AUM in ETFs linked to MSCI indexes was $433.4$695.6 billion, up $60.1down $48.7 billion, or 16.1%6.5%, from $373.3$744.3 billion as of December 31, 2014.2017. The increasedecrease of $60.1$48.7 billion consisted of net inflowsmarket depreciation of $87.7asset values of $110.2 billion, partially offset by market depreciationnet inflows of $27.6$61.5 billion. Index recurring subscription Run Rate grew 10.0%11.4% to $368.9$502.7 million atas of December 31, 20152018 compared to $335.3$451.0 million atas of December 31, 2014 on2017, driven by growth in benchmarkcore products, factor and data products.ESG indexes and custom and specialized index products and growth in the asset owners, hedge fund and wealth management client segments. Total Run Rate from Analytics products increased 4.5%0.5% to $436.7$491.9 million atas of December 31, 20152018 compared to $417.7$489.5 million atas of December 31, 2014,2017, primarily driven by growth in RiskManager, equity modelsboth Multi-Asset Class and Equity Analytics products, partially offset by the removal of Run Rate associated with FEA, which was divested in April 2018 and InvestorForce, products.which was divested in October 2018. Adjusting for the impact of foreign currency exchange rate fluctuations, Run Rate for Analytics would have increased 6.0% as of December 31, 2015 compared to December 31, 2014.
Total Run Rate from All Other products increased 4.4% to $82.7 million at December 31, 2015 compared to $79.2 million at December 31, 2014.
ESG products Run Rate increased 16.8% to $40.3 million at December 31, 2015 compared to $34.5 million at December 31, 2014. Adjusting for the impact of foreign currency exchange rate fluctuations, Run Rate would have increased 19.5%1.0% as of December 31, 20152018 compared to December 31, 2014.
Real Estate products Run Rate decreased 5.2% to $42.4 million at December 31, 2015 compared to $44.7 million at December 31, 2014. Adjusting for the impact of foreign currency exchange rate fluctuations, Run Rate would have increased 1.9% as of December 31, 2015 compared to December 31, 2014.
December 31, 2014 Compared to December 31, 2013
Total Run Rate grew 7.7% to $1,006.7 million as of December 31, 2014 compared to $934.9 million as of December 31, 2013. Recurring subscription Run Rate grew 7.2% to $832.2 million as of December 31, 2014 compared to $776.6 million as of December 31, 2013. Adjusting for the impact of foreign currency exchange rate fluctuations and excluding the acquisition of GMI Ratings, recurring subscription Run Rate would have increased 8.1% as of December 31, 2014 compared to December 31, 2013.
Run Rate from asset-based fees rose 10.3% to $174.6 million at December 31, 2014, from $158.3 million at December 31, 2013, primarily driven by higher average AUM in non-ETF passive funds as well as higher trading volumes in futures and options contracts, all linked to MSCI indexes. As of December 31, 2014, the value of AUM in ETFs linked to MSCI indexes was $373.3 billion, up $40.4 billion, or 12.1%, from $332.9 billion as of December 31, 2013. The increase of $40.4 billion consisted of net inflows of $49.4 billion, partially offset by market depreciation of $9.0 billion.
Index recurring subscription Run Rate grew 9.9% to $335.3 million at December 31, 2014 compared to $305.2 million at December 31, 2013 on growth in benchmark and data products.
Total Run Rate from Analytics products increased 3.1% to $417.7 million at December 31, 2014 compared to $405.1 million at December 31, 2013, primarily driven by growth in RiskManager, equity models, HedgePlatform and InvestorForce products.
Total Run Rate from All Other products increased 19.4% to $79.2 million at December 31, 2014 compared to $66.4 million at December 31, 2013.
ESG products Run Rate increased 50.7% to $34.5 million at December 31, 2014 compared to $22.9 million at December 31, 2013.2017. Adjusting for the impact of foreign currency exchange rate fluctuations and excluding the impact of the GMI Ratings acquisition,divestitures of InvestorForce and FEA, Analytics Run Rate would have increased 22.2%6.5% as of December 31, 20142018 compared to December 31, 2013.2017.
Real Estate products Run Rate from All Other products increased 2.9%15.2% to $44.7$124.9 million at December 31, 20142018 compared to $43.5$108.4 million at December 31, 2013.2017. The $16.5 million increase was primarily driven by a $14.8 million, or 23.0%, increase in ESG Run Rate to $79.5 million, and a $1.6 million, or 3.7%, increase in Real Estate Run Rate to $45.4 million. The increase in ESG Run Rate was primarily driven by strong growth in ESG Ratings products and an
63
increase in ESG Screening products. The increase in Real Estate Run Rate was primarily driven by growth in Market Information products. Adjusting for the impact of foreign currency exchange rate fluctuations, ESG Run Rate would have increased 11.9%25.1%, Real Estate Run Rate would have increased 8.9% and All Other Run Rate would have increased 18.6%, in each case, as of December 31, 20142018 compared to December 31, 2013. 2017.December 31, 2017 Compared to December 31, 2016 Total Run Rate grew 17.4% to $1,365.7 million as of December 31, 2017 compared to $1,163.3 million as of December 31, 2016. Recurring subscription Run Rate grew 10.8% to $1,048.9 million as of December 31, 2017 compared to $946.3 million as of December 31, 2016. Adjusting for the impact of foreign currency exchange rate fluctuations, recurring subscription Run Rate would have increased 9.5% as of December 31, 2017 compared to December 31, 2016. Run Rate from asset-based fees increased 46.0% to $316.8 million as of December 31, 2017, from $217.0 million as of December 31, 2016, primarily driven by higher AUM in ETFs as well as increases in non-ETF passive funds and futures and options contracts, all linked to MSCI indexes. As of December 31, 2017, the value of AUM in ETFs linked to MSCI indexes was $744.3 billion, up $262.9 billion, or 54.6%, from $481.4 billion as of December 31, 2016. The increase of $262.9 billion consisted of net inflows of $139.3 billion and market appreciation of $123.6 billion. Index recurring subscription Run Rate grew 10.9% to $451.0 million as of December 31, 2017 compared to $406.7 million as of December 31, 2016, driven by strong growth in core products, growth in new products, including factor and ESG indexes, as well as growth in custom index products. Run Rate from Analytics products increased 8.4% to $489.5 million as of December 31, 2017 compared to $451.5 million as of December 31, 2016, primarily driven by growth in both Multi-Asset Class and Equity Analytics products. Adjusting for the impact of foreign currency exchange rate fluctuations, Analytics Run Rate would have increased 6.8% as of December 31, 2017 compared to December 31, 2016. Run Rate from All Other products increased 23.1% to $108.4 million at December 31, 2017 compared to $88.1 million at December 31, 2016, driven by a $15.5 million, or 31.5%, increase in ESG Run Rate to $64.6 million and a $4.9 million, or 12.5%, increase in Real Estate Run Rate to $43.8 million. The increase in ESG Run Rate was primarily driven by growth in ESG Ratings products. The increase in Real Estate Run Rate was primarily driven by growth in Market Information and Portfolio Analysis Service products. Adjusting for the impact of foreign currency exchange rate fluctuations, ESG Run Rate would have increased 27.3%, Real Estate Run Rate would have increased 3.8% and All Other Run Rate would have increased 16.9%, in each case, as of December 31, 2017 compared to December 31, 2016. 64
Subscription Sales The following table presents our recurring subscription sales, cancellations and non-recurring sales by reportable segment for the years indicated: | | | | | | | | | | | | Years Ended | | | Comparison of | | | | | Years Ended | | Comparison of | | | December 31, | | | December 31, | | | December 31, | | | December 31, | | | December 31, | | | | | December 31,
2015 | | December 31,
2014 | | December 31,
2013 | | December 31,
2015 to 2014 | | December 31,
2014 to 2013 | | | 2018 | | | 2017 | | | 2016 | | | 2018 to 2017 | | | 2017 to 2016 | | | | | (in thousands) | | | | | | | (in thousands) | | | | | | | | | | New recurring subscription sales | | | | | | | | | | | | | | | | | | | | | | | | | | | | | | | Index | | $ | 49,521 | | | $ | 44,547 | | | $ | 42,389 | | | 11.2 | % | | 5.1 | % | | $ | 72,660 | | | $ | 61,308 | | | $ | 55,279 | | | | 18.5 | % | | | 10.9 | % | Analytics | | | 52,819 | | | 55,588 | | | 53,932 | | | (5.0 | %) | | 3.1 | % | | | 64,986 | | | | 64,177 | | | | 55,255 | | | | 1.3 | % | | | 16.1 | % | All Other | | | 16,657 | | | 17,508 | | | 14,660 | | | (4.9 | %) | | 19.4 | % | | | 26,201 | | | | 22,544 | | | | 19,978 | | | | 16.2 | % | | | 12.8 | % | | | | | | | | | | | | | | | | New recurring subscription sales total | | | 118,997 | | | 117,643 | | | 110,981 | | | 1.2 | % | | 6.0 | % | | | 163,847 | | | | 148,029 | | | | 130,512 | | | | 10.7 | % | | | 13.4 | % | | | | | | | | | | | | | | | | Subscription cancellations | | | | | | | | | | | | | | | | | | | | | | | | | | | | | | | Index | | | (16,254 | ) | | (14,310 | ) | | (16,064 | ) | | 13.6 | % | | (10.9 | %) | | | (20,819 | ) | | | (16,995 | ) | | | (17,417 | ) | | | 22.5 | % | | | (2.4 | %) | Analytics | | | (29,362 | ) | | (33,172 | ) | | (40,917 | ) | | (11.5 | %) | | (18.9 | %) | | | (33,671 | ) | | | (33,674 | ) | | | (39,205 | ) | | | (0.0 | %) | | | (14.1 | %) | All Other | | | (9,042 | ) | | (7,173 | ) | | (5,591 | ) | | 26.1 | % | | 28.3 | % | | | (6,421 | ) | | | (7,717 | ) | | | (8,288 | ) | | | (16.8 | %) | | | (6.9 | %) | | | | | | | | | | | | | | | | Subscription cancellations total | | | (54,658 | ) | | (54,655 | ) | | (62,572 | ) | | — | % | | (12.7 | %) | | | (60,911 | ) | | | (58,386 | ) | | | (64,910 | ) | | | 4.3 | % | | | (10.1 | %) | | | | | | | | | | | | | | | | Net new recurring subscription sales | | | | | | | | | | | | | | | | | | | | | | | | | | | | | | | Index | | | 33,267 | | | 30,237 | | | 26,325 | | | 10.0 | % | | 14.9 | % | | | 51,841 | | | | 44,313 | | | | 37,862 | | | | 17.0 | % | | | 17.0 | % | Analytics | | | 23,457 | | | 22,416 | | | 13,015 | | | 4.6 | % | | 72.2 | % | | | 31,315 | | | | 30,503 | | | | 16,050 | | | | 2.7 | % | | | 90.0 | % | All Other | | | 7,615 | | | 10,335 | | | 9,069 | | | (26.3 | %) | | 14.0 | % | | | 19,780 | | | | 14,827 | | | | 11,690 | | | | 33.4 | % | | | 26.8 | % | | | | | | | | | | | | | | | | Net new recurring subscription sales total | | | 64,339 | | | 62,988 | | | 48,409 | | | 2.1 | % | | 30.1 | % | | | 102,936 | | | | 89,643 | | | | 65,602 | | | | 14.8 | % | | | 36.6 | % | | | | | | | | | | | | | | | | Non-recurring | | | | | | | | | | | | Non-recurring sales | | | | | | | | | | | | | | | | | | | | | | Index | | | 8,964 | | | 8,956 | | | 7,438 | | | 0.1 | % | | 20.4 | % | | | 22,729 | | | | 16,310 | | | | 17,850 | | | | 39.4 | % | | | (8.6 | %) | Analytics | | | 7,286 | | | 4,837 | | | 2,243 | | | 50.6 | % | | 115.6 | % | | | 10,209 | | | | 10,306 | | | | 8,830 | | | | (0.9 | %) | | | 16.7 | % | All Other | | | 4,880 | | | 6,377 | | | 8,227 | | | (23.5 | %) | | (22.5 | %) | | | 3,438 | | | | 3,875 | | | | 4,247 | | | | (11.3 | %) | | | (8.8 | %) | | | | | | | | | | | | | | | | Non-recurring sales total | | | 21,130 | | | 20,170 | | | 17,908 | | | 4.8 | % | | 12.6 | % | | | 36,376 | | | | 30,491 | | | | 30,927 | | | | 19.3 | % | | | (1.4 | %) | | | | | | | | | | | | | | | | | Total Index | | | 42,231 | | | 39,193 | | | 33,763 | | | 7.8 | % | | 16.1 | % | | Total Analytics | | | 30,743 | | | 27,253 | | | 15,258 | | | 12.8 | % | | 78.6 | % | | Total All Other | | | 12,495 | | | 16,712 | | | 17,296 | | | (25.2 | %) | | (3.4 | %) | | | | | | | | | | | | | | | | | Gross sales | | | | | | | | | | | | | | | | | | | | | | Index | | | $ | 95,389 | | | $ | 77,618 | | | $ | 73,129 | | | | 22.9 | % | | | 6.1 | % | Analytics | | | | 75,195 | | | | 74,483 | | | | 64,085 | | | | 1.0 | % | | | 16.2 | % | All Other | | | | 29,639 | | | | 26,419 | | | | 24,225 | | | | 12.2 | % | | | 9.1 | % | Total gross sales | | | $ | 200,223 | | | $ | 178,520 | | | $ | 161,439 | | | | 12.2 | % | | | 10.6 | % | Net sales | | | | | | | | | | | | | | | | | | | | | | Index | | | $ | 74,570 | | | $ | 60,623 | | | $ | 55,712 | | | | 23.0 | % | | | 8.8 | % | Analytics | | | | 41,524 | | | | 40,809 | | | | 24,880 | | | | 1.8 | % | | | 64.0 | % | All Other | | | | 23,218 | | | | 18,702 | | | | 15,937 | | | | 24.1 | % | | | 17.3 | % | Total net sales | | $ | 85,469 | | | $ | 83,158 | | | $ | 66,317 | | | 2.8 | % | | 25.4 | % | | $ | 139,312 | | | $ | 120,134 | | | $ | 96,529 | | | | 16.0 | % | | | 24.5 | % | | | | | | | | | | | | | | | |
Aggregate
Retention Rate Another key metric is our “Aggregate“Retention Rate.” The following table presents our Retention Rate.” ThisRate by reportable segment and product category for the periods indicated for the years ended December 31, 2018, 2017 and 2016: 65
| | Index | | | Analytics | | | All Other | | | Total | | 2018 | | | | | | | | | | | | | | | | | Three Months Ended March 31, | | | 96.4 | % | | | 93.0 | % | | | 94.4 | % | | | 94.6 | % | Three Months Ended June 30, | | | 95.9 | % | | | 92.1 | % | | | 94.9 | % | | | 94.1 | % | Three Months Ended September 30, | | | 96.1 | % | | | 94.1 | % | | | 94.3 | % | | | 95.0 | % | Three Months Ended December 31, | | | 93.2 | % | | | 92.7 | % | | | 92.8 | % | | | 92.9 | % | Year Ended December 31, | | | 95.4 | % | | | 93.0 | % | | | 94.1 | % | | | 94.1 | % | 2017 | | | | | | | | | | | | | | | | | Three Months Ended March 31, | | | 96.9 | % | | | 93.3 | % | | | 92.4 | % | | | 94.7 | % | Three Months Ended June 30, | | | 97.0 | % | | | 93.9 | % | | | 90.8 | % | | | 94.9 | % | Three Months Ended September 30, | | | 95.5 | % | | | 93.4 | % | | | 90.7 | % | | | 94.0 | % | Three Months Ended December 31, | | | 93.9 | % | | | 89.7 | % | | | 91.1 | % | | | 91.6 | % | Year Ended December 31, | | | 95.8 | % | | | 92.5 | % | | | 91.2 | % | | | 93.8 | % | 2016 | | | | | | | | | | | | | | | | | Three Months Ended March 31, | | | 96.3 | % | | | 94.6 | % | | | 92.2 | % | | | 95.1 | % | Three Months Ended June 30, | | | 95.6 | % | | | 91.7 | % | | | 89.2 | % | | | 93.1 | % | Three Months Ended September 30, | | | 95.8 | % | | | 90.4 | % | | | 90.8 | % | | | 92.7 | % | Three Months Ended December 31, | | | 93.4 | % | | | 87.4 | % | | | 87.8 | % | | | 89.9 | % | Year Ended December 31, | | | 95.3 | % | | | 91.0 | % | | | 90.0 | % | | | 92.7 | % |
Retention Rate is an important metric is important because subscription cancellations decrease our Run Rate and ultimately our operating revenues.revenues over time. The annual Aggregate Retention Rate represents the retained subscription Run Rate (beginning subscription(subscription Run Rate at the beginning of the fiscal year less actual cancels during the year) as a percentage of the subscription Run Rate at the beginning of the fiscal year. If a client reduces the number of products to which it subscribes or switches between our products, we treat it as a cancellation for purposes of calculating our Aggregate Retention Rate. Our Aggregate Retention Rate is computed on a product-by-product basis. In addition, we treat any reduction in fees resulting from renegotiated contracts as a cancellation in the calculation to the extent of the reduction. We do not calculate Aggregate Retention Rate for that portion of our Run Rate attributable to assets in investment products linked to our indexes or to trading volumes of futures and options contracts linked to our indexes. Aggregate The Retention Rate for a non-annual period reflects the annualization of the cancels recorded in the period. The following table presents our Aggregate Retention Rate by reportable segment and product category for the periods indicated for the years ended December 31, 2015, 2014 and 2013:
| | | | | | | | | | | | | | | | | | | | Index | | | Analytics | | | All Other | | | Total | | 2015 | | | | | | | | | | | | | | | | | Quarter Ended March 31, | | | 97.2 | % | | | 92.9 | % | | | 90.7 | % | | | 94.4 | % | Quarter Ended June 30, | | | 95.4 | % | | | 93.8 | % | | | 90.7 | % | | | 94.2 | % | Quarter Ended September 30, | | | 95.4 | % | | | 95.3 | % | | | 89.1 | % | | | 94.8 | % | Quarter Ended December 31, | | | 92.7 | % | | | 89.9 | % | | | 83.9 | % | | | 90.4 | % | Year Ended December 31, | | | 95.2 | % | | | 93.0 | % | | | 88.6 | % | | | 93.4 | % | 2014 | | | | | | | | | | | | | | | | | Quarter Ended March 31, | | | 95.4 | % | | | 90.9 | % | | | 92.4 | % | | | 92.8 | % | Quarter Ended June 30, | | | 95.3 | % | | | 92.4 | % | | | 88.5 | % | | | 93.2 | % | Quarter Ended September 30, | | | 95.3 | % | | | 94.2 | % | | | 94.3 | % | | | 94.6 | % | Quarter Ended December 31, | | | 95.2 | % | | | 89.7 | % | | | 83.9 | % | | | 91.3 | % | Year Ended December 31, | | | 95.3 | % | | | 91.8 | % | | | 89.5 | % | | | 93.0 | % | 2013 | | | | | | | | | | | | | | | | | Quarter Ended March 31, | | | 95.6 | % | | | 90.1 | %�� | | | 92.0 | % | | | 92.4 | % | Quarter Ended June 30, | | | 94.9 | % | | | 90.7 | % | | | 90.2 | % | | | 92.3 | % | Quarter Ended September 30, | | | 94.4 | % | | | 91.0 | % | | | 96.2 | % | | | 92.7 | % | Quarter Ended December 31, | | | 92.1 | % | | | 86.6 | % | | | 83.7 | % | | | 88.5 | % | Year Ended December 31, | | | 94.2 | % | | | 89.6 | % | | | 90.5 | % | | | 91.5 | % |
The quarterly Aggregate Retention Rate is calculated by annualizing the actual cancellations recordedfor which we have received a notice of termination or for which we believe there is an intention not to renew during the quarter.non-annual period, and we believe that such notice or intention evidences the client’s final decision to terminate or not renew the applicable agreement, even though such notice is not effective until a later date. This annualized cancellation figure is then divided by the subscription Run Rate at the beginning of the fiscal year to calculate a cancellation rate. This cancellation rate is then subtracted from 100% to derive the annualized Aggregate Retention Rate for the quarter.period.
For example, in the fourth quarter of 2015,2018, we recorded cancellations of $19.9$18.2 million. To derive the Aggregate Retention Rate for the fourth quarter, we annualized the actual cancellations during the quarter of $19.9$18.2 million to derive $79.6$72.7 million of annualized cancellations. This $79.6$72.7 million was then divided by the $832.2$1,048.9 million subscription Run Rate at the beginning of the year to derive a cancellation rate of 9.6%6.9%. The 9.6%6.9% was then subtracted from 100.0% to derive an Aggregatea Retention Rate of 90.4%93.1% for the fourth quarter. Retention Rate is computed by operating segment on a product/service-by-product/service basis. In general, if a client reduces the number of products or services to which it subscribes within a segment, or switches between products or services within a segment, we treat it as a cancellation for purposes of calculating our Retention Rate except in the case of a product or service switch that management considers to be a replacement product or service. In those replacement cases, only the net change to the client subscription, if a decrease, is reported as a cancel. In the Analytics and the ESG segments, substantially all product or service switches are treated as replacement products or services and netted in this manner, while in our Index and Real Estate segments, product or service switches that are treated as replacement products or services and receive netting treatment occur only in certain limited instances. In addition, we treat any reduction in fees resulting from a down-sale of the same product or service as a cancellation to the extent of the reduction. We do not calculate Retention Rate for that portion of our Run Rate attributable to assets in index-linked investment products or futures and options contracts, in each case, linked to our indexes. This definition of Retention Rate was revised and was previously provided in our quarterly report on Form 10-Q filed with the SEC on August 3, 2018 to describe our methodology for calculating cancellations. We believe this 66
methodology has been applied in all material respects in calculating cancellation rates reported in the periods prior to the quarter ended June 30, 2018, and accordingly, we do not believe changes to those previously reported cancellation rates are required. For the year ended December 31, 2015, 36.5%2018, 29.8% of our cancellations occurred in the fourth quarter. Historically, the Aggregate Retention Rate has generally been higher during the first three quarters and lower in the fourth quarter, as the fourth quarter is traditionally the largest renewal period in the year. Liquidity and Capital Resources We require capital to fund ongoing operations, internal growth initiatives and acquisitions. Our primary sources of liquidity are cash flows generated from our operations, existing cash and cash equivalents and credit capacity under our existing credit facilities. In addition, we believe we have access to additional funding in the public and private markets. We intend to use these sources of liquidity to, among other things, service our existing and future debt obligations and fund our working capital requirements, capital expenditures, investments, acquisitions, dividend payments and repurchases of our common stock. In connection with our business strategy, we regularly evaluate acquisition opportunities. We believe our liquidity, along with other financing alternatives, will provide the necessary capital to fund these transactions and achieve our planned growth. Senior Notes and Credit Agreement We have issued an aggregate of $1.6$2.6 billion in senior unsecured notes in two discrete private offerings of $800.0 million each. On November 20, 2014, we completed our first private offering of $800.0 million aggregate principal amount of 5.25% senior unsecured notes due 2024 (the “2024 Senior Notes”)Notes and also entered into a $200.0$250 million senior unsecured revolving credit agreement (the “2014 Revolving Credit Agreement”) by and among the Company, as borrower, certain of MSCI’s subsidiaries, as guarantors, the lenders party thereto and JPMorgan Chase Bank, N.A., as administrative agent. We used the net proceeds from the offering of the 2024 Senior Notes, together with cash on hand, to repay in full our outstanding term loan indebtedness of $794.8 million, which bore interest at LIBOR plus a margin of 2.25%. On August 13, 2015, we completed our second private offering of $800.0 million aggregate principal amount of 5.75% senior unsecured notes due 2025 (the “2025 Senior Notes” and together with the 2024 Senior Notes, the “Senior Notes”). We intend to use the net proceeds from the offering of the 2025 Senior Notes for general corporate purposes, including, without limitation, buybacks of MSCI common stock.
The 2024 Senior Notes are scheduled to mature and be paid in full on November 20, 2024. At any time prior to November 15, 2019, we may redeem all or part of the 2024 Senior Notes upon not less than 30 nor more than 60 days’ prior notice at a redemption price equal to the sum of (i) 100% of the principal amount thereof, plus (ii) a make-whole premium as of the date of redemption, plus (iii) accrued and unpaid interest and additional interest, if any, thereon, to the date of redemption. In addition, we may redeem all or part of the 2024 Senior Notes, together with accrued and unpaid interest, on or after November 15, 2019, at redemption prices set forth in the indenture governing our 2024 Senior Notes. At any time prior to November 15, 2017, we may use the proceeds of certain equity offerings to redeem up to 35% of the aggregate principal amount of the 2024 Senior Notes, including any permitted additional notes, at a redemption price equal to 105.25% of the principal amount.
The 2014 Revolving Credit Agreement replacedwith a syndicate of banks. See Note 5, “Commitments and Contingencies,” of the prior senior secured revolving credit facility. The 2014Notes to Consolidated Financial Statements included herein for additional information on our Senior Notes and Revolving Credit Agreement has an initial term of five years that may be extended twice, at our request, in each case by one additional year.
The 2025 Senior Notes are scheduled to mature and be paid in full on August 15, 2025. At any time prior to August 15, 2020, we may redeem all or part of the 2025 Senior Notes upon not less than 30 nor more than 60 days’ prior notice at a redemption price equal to the sum of (i) 100% of the principal amount thereof, plus (ii) a make-whole premium as of the date of redemption, plus (iii) accrued and unpaid interest and additional interest, if any, thereon, to the date of redemption. In addition, we may redeem all or part of the 2025 Senior Notes, together with accrued and unpaid interest, on or after August 15, 2020, at redemption prices set forth in the indenture governing our 2025 Senior Notes. At any time prior to August 15, 2018, we may use the proceeds of certain equity offerings to redeem up to 35% of the aggregate principal amount of the 2025 Senior Notes, including any permitted additional notes, at a redemption price equal to 105.75% of the principal amount.
Interest payments attributable to the 2024 Senior Notes are due on May 15 and November 15 of each year. The first interest payment was made on May 15, 2015. We paid $41.4 million of interest attributable to the 2024 Senior Notes during the year ended December 31, 2015. Interest payments attributable to the 2025 Senior Notes are due on February 15 and August 15 of each year. The first interest payment was made on February 16, 2016.Agreement.
The Senior Notes and the 2014 Revolving Credit Agreement are fully and unconditionally, and jointly and severally, guaranteed by our direct or indirect wholly-owned domestic subsidiaries that account for more than 5% of our and our subsidiaries’ consolidated assets, other than certain excluded subsidiaries (the “subsidiary guarantors”). Amounts due under the 2014 Revolving Credit Agreement are our and the subsidiary guarantors’ senior unsecured obligations and rank equally with the Senior Notes and any of our other unsecured, unsubordinated debt, senior to any of our subordinated debt and effectively subordinated to our secured debt to the extent of the assets securing such debt. The Indenturesindentures governing our Senior Notes (the “Indentures”) among us, each of the subsidiary guarantors, and Wells Fargo Bank, National Association, as trustee, contain covenants that limit our and certain of our subsidiaries’ ability to, among other things, incur liens, enter into sale/leaseback transactions and consolidate, merge or sell all or substantially all of our assets. In addition, the Indentures restrict our non-guarantor subsidiaries’ ability to create, assume, incur or guarantee additional indebtedness without such non-guarantor subsidiaries guaranteeing the Senior Notes on apari passu basis. The 2014 Revolving Credit Agreement contains affirmative and restrictive covenants that, among other things, limit our ability and the ability of our existing or future subsidiaries to: incur liens and further negative pledges; incur additional indebtedness or prepay, redeem or repurchase indebtedness; make loans or hold investments; merge, dissolve, liquidate, consolidate with or into another person; enter into acquisition transactions; enter into sale/leaseback transactions; issue disqualified capital stock; 67
| • | sell, transfer or dispose of assets; |
pay dividends or make other distributions in respect of our capital stock or engage in stock repurchases, redemptions and other restricted payments; permit certain restrictions affecting our subsidiaries; change the nature of our business, accounting policies or fiscal periods; enter into any transactions with affiliates other than on an arm’s lengtharm’s-length basis; and amend our organizational documents or amend, modify or change the terms of certain agreements relating to our indebtedness. The 2014 Revolving Credit Agreement and the Indentures also contain customary events of default, including those relating to non-payment, breach of representations, warranties or covenants, cross-default and cross-acceleration, bankruptcy and insolvency events, invalidity or impairment of loan documentation or collateral, change of control and customary ERISA defaults. None of the restrictions above are expected to impact our ability to effectively operate the business. The 2014 Revolving Credit Agreement also requires us and our subsidiaries to achieve financial and operating results sufficient to maintain compliance with the following financial ratios on a consolidated basis through the termination of the 2014 Revolving Credit Agreement: (1) the maximum Consolidated Leverage Ratio (as defined in the 2014 Revolving Credit Agreement) measured quarterly on a rolling four-quarter basis shall not exceed 3.75:4.25:1.00 and (2) the minimum Consolidated Interest Coverage Ratio (as defined in the 2014 Revolving Credit Agreement) measured quarterly on a rolling four-quarter basis shall be at least 4.00:1.00. As of December 31, 2015,2018, our Consolidated Leverage Ratio was 3.08:3.13:1.00 and our Consolidated Interest Coverage Ratio was 8.64:6.59:1.00. There have been no amounts drawn under the Revolving Credit Agreement since it was entered into on November 20, 2014. Our non-guarantor subsidiaries of the Senior Notes consist of: (i) domestic subsidiaries of the Company that account for 5% or less of consolidated assets of the Company and its subsidiaries and (ii) any foreign or domestic subsidiary of the Company that is deemed to be a controlled foreign corporation within the meaning of Section 957 of the Internal Revenue Code of 1986, as amended. Our non-guarantor subsidiaries accounted for approximately $196.7$797.4 million, or 18.3%55.6%, of our total revenue for the twelve12 months ended December 31, 2015,2018, approximately $76.8$241.0 million, or 19.0%35.1%, of our consolidated operating income for the twelve12 months ended December 31, 2015,2018, and approximately $405.5$733.2 million, or 12.9%21.6%, of our consolidated total assets (excluding intercompany assets) and $162.5$485.6 million, or 7.2%13.7%, of our consolidated total liabilities, in each case as of December 31, 2015.2018. Share Repurchases On February 6, 2014, we entered intoThe Board of Directors has approved a stock repurchase program for the February 2014 ASR Agreementpurchase of the Company’s common stock in the open market. See Note 9, “Shareholders’ Equity (Deficit),” of the Notes to initiate shareConsolidated Financial Statements included herein for additional information on our stock repurchase program.
The following table provides information with respect to repurchases aggregating $100.0 million. As a result, we received 1.7 million shares of our common stock onpursuant to open market repurchases: Year Ended | | Average Price Paid Per Share | | | Total Number of Shares Repurchased | | | Dollar Value of Shares Repurchased | | | | | | | | (in thousands, except per share data) | | December 31, 2016 | | $ | 73.71 | | | | 10,303 | | | $ | 759,427 | | December 31, 2017 | | $ | 87.96 | | | | 1,556 | | | $ | 136,899 | | December 31, 2018 | | $ | 148.34 | | | | 6,236 | | | $ | 924,989 | |
68
Subsequent to the year ended December 31, 2018 and through February 7, 2014 and 0.615, 2019, the Company repurchased an additional 0.7 million shares of our common stock on May 5, 2014at an average price of $147.97 per share for a combined average purchase pricetotal value of $43.10 per share.$102.1 million. On September 18, 2014, we entered into the September 2014 ASR Agreement. On September 19, 2014, we paid $300.0 million in cash and received approximately 4.5 million sharesAs of our common stock under the September 2014 ASR Agreement. On May 21, 2015, we completed the September ASR Program, receiving approximately 1.2 million shares of our common stock. In total, 5.7 million shares of our common stock were delivered for an average purchase price of $52.79 per share. The repurchased shares are held in treasury.
On June 2, 2015, we began purchasing shares of our common stock on the open market in accordance with SEC Rule 10b5-1.
During October 2015, we completed the $850.0 million repurchase authorization under the 2014 Repurchase Program. Since the introduction of the 2014 Repurchase Program, we have purchasedFebruary 15, 2019, a total of 14.7$706.1 million shares of our common stock for an average purchase price of $57.99 perremained available on the share under the 2014 Repurchase Program.
On October 28, 2015, the Board of Directors approved a new stock repurchase program authorizing the purchase of up to $1.0 billion worth of shares of MSCI’s common stock (the “2015 Repurchase Program”). Share repurchases made pursuant to the 2015 Repurchase Program may take place in the open market or in privately negotiated transactions from time to time based on market and other conditions.authorization. This authorization may be modified, suspended or terminated by the Board of Directors at any time without prior notice.
Subsequent to the year ended December 31, 2015 and through February 19, 2016, an additional 2.6 million shares of our common stock were repurchased for a total value of $170.6 million.
Cash Dividends On February 2, 2016,September 17, 2014, our Board of Directors approved a plan to initiate a regular quarterly cash dividend to our shareholders. On October 30, 2014, we began paying regular quarterly cash dividends and have paid such dividends each quarter thereafter. On January 30, 2019, the Board of Directors declared a quarterly dividend of $0.22$0.58 per share of common stock to be paid on March 11, 201615, 2019 to shareholders of record as of the close of trading on February 19, 2016.22, 2019. Cash flowsFlows The following table presents the Company’s cash and cash equivalents as of the dates indicated: | | | | | | | | | | | | As of | | | | | December 31,
2015 | | | December 31,
2014 | | | | | (in thousands) | | Cash and cash equivalents | | $ | 777,706 | | | $ | 508,799 | |
| | As of | | | | December 31, | | | December 31, | | | | | 2018 | | | | 2017 | | | | (in thousands) | | Cash and cash equivalents | | $ | 904,176 | | | $ | 889,502 | |
Cash Provided by (Used In) Operating, Investing, and Financing ActivitiesThe following table presents the breakdown of the Company’s cash flows for the periods indicated:
| | | | | | | | | | | | | | | | Years Ended | | | | | December 31,
2015 | | | December 31,
2014(1) | | | December 31,
2013(2) | | | | | (in thousands) | | Net cash provided by operating activities
| | $ | 305,994 | | | $ | 305,673 | | | $ | 321,183 | | Net cash (used in) provided by investing activities | | $ | (48,861 | ) | | $ | 297,037 | | | $ | 4,121 | | Net cash provided by (used in) financing activities | | $ | 19,949 | | | $ | (442,328 | ) | | $ | (146,584 | ) | Effect of exchange rates on cash and cash equivalents | | $ | (8,175 | ) | | $ | (10,017 | ) | | $ | (3,595 | ) | | | | | | | | | | | | | | Net increase in cash and cash equivalents | | $ | 268,907 | | | $ | 150,365 | | | $ | 175,125 | | | | | | | | | | | | | | |
| | Years Ended | | | | December 31, | | | December 31, | | | December 31, | | | | | 2018 | | | 2017 | | | 2016 | | | | (in thousands) | | Net cash provided by operating activities | | $ | 612,762 | | | $ | 404,158 | | | $ | 442,363 | | Net cash provided by (used in) investing activities | | | 34,874 | | | | (48,046 | ) | | | (42,031 | ) | Net cash used in financing activities | | | (626,483 | ) | | | (267,543 | ) | | | (372,899 | ) | Effect of exchange rates on cash and cash equivalents | | | (6,479 | ) | | | 9,099 | | | | (13,305 | ) | Net increase in cash and cash equivalents | | $ | 14,674 | | | $ | 97,668 | | | $ | 14,128 | |
(1) | Includes results from ISS through its deposition on April 30, 2014. |
(2) | Includes full year results from ISS. |
Cash and Cash Equivalents Cash and cash equivalents were $777.7$904.2 million and $508.8$889.5 million as of December 31, 20152018 and 2014,2017, respectively. We seek to maintain minimum cash balances globally of approximately $200.0 million to $250.0 million for general operating purposes. As of December 31, 20152018 and 2014, $128.12017, $275.6 million and $102.3$503.0 million, respectively, of the cash and cash equivalents were held by foreign subsidiaries, which could besubsidiaries. As a result of Tax Reform, we can now more efficiently access a significant portion of our cash held outside of the U.S. in the short-term without being subject to U.S. federal income taxation on repatriation to the U.S. and some of which could be subject to local country taxes if repatriated to the U.S. In addition, repatriationtaxes. Repatriation of some foreign cash is further restricted bymay be subject to certain withholding taxes in local laws.jurisdictions and other distribution restrictions. The global cash and cash equivalent balances that are maintained will be available to meet our global needs whether for general corporate purpose or other needs, including acquisitions or expansion of our products. We believe that domesticglobal cash flows from operations, together with existing cash and cash equivalents and funds available under our existing credit facility and our ability to access the debt and capital markets for additional funds, will continue to be sufficient to fund our domesticglobal operating activities and cash commitments for investing and 69
financing activities, such as material capital expenditures and share repurchases, for at least the next 12 months following issuance of this Form 10-K and for the foreseeable future thereafter. In addition, we expect existingthat foreign cash flows from operations, together with existing cash and cash equivalents, will continue to be sufficient to fund our foreign operating activities and cash commitments for investing activities, such as material capital expenditures, for at least the next 12 months following issuance of this Form 10-K and for the foreseeable future thereafter. In addition, as a result of our efforts to align our tax profile with our global operating footprint, we expect our cash balances to grow outside the U.S. over time. These balances will be available to meet our needs outside the U.S. whether it be for general corporate purpose or other needs, including acquisitions or expansion of our products.
Cash Flows From Operating Activities Cash flows from operating activities consist of net income adjusted for certain non-cash items and changes in assets and liabilities. Cash provided by operating activities was $306.0$612.8 million and $305.7$404.2 million for the years ended December 31, 20152018 and 2014,2017, respectively. The year ended December 31, 2015 reflectsyear-over-year increase was primarily driven by higher cash inflows from operating results,collections, partially offset by higher payments related toof cash expenses and higher income tax and interest and cash taxes. Cash flows from operating activities for the year ended December 31, 2014 includes cash flows from discontinued operations.payments. Cash flows from operating activities consist of net income adjusted for certain non-cash items and changes in assets and liabilities. Cash provided by operating activities was $305.7$404.2 million and $321.2$442.4 million for the years ended December 31, 20142017 and 2013,2016, respectively. The year-over-year decrease primarily reflects higher cash expenses, during the year ended December 31, 2014.including higher interest and income tax payments, partially offset by increased cash collections.
Our primary uses of cash from operating activities are for the payment of cash compensation expenses, office rent, technology costs, market data costs, interest expenses and income taxes. Historically, the payment of cash for compensation and benefits is at its highest level in the first quarter when we pay discretionary employee compensation related to the previous fiscal year. Cash Flows From Investing Activities Cash provided by investing activities was $34.9 million for the year ended December 31, 2018 compared to cash used in investing activities of $48.0 million for the year ended December 31, 2017. The year-over-year change was primarily driven by the proceeds received from the FEA and InvestorForce divestitures. Cash used in investing activities was $48.9$48.0 million and $42.0 million for the years ended December 31, 2017 and 2016, respectively, primarily reflecting higher capitalized software development costs mainly related to investments in the MSCI Analytics Platform and Fixed Income products. Cash Flows From Financing Activities Cash used in financing activities was $626.5 million for the year ended December 31, 20152018 compared to cash provided by investing activities of $297.0$267.5 million for the year ended December 31, 2014.2017. The $345.9 million year-over-year decreasechange primarily reflects the impact for the year ended December 31, 2014higher repurchases of $362.8 million in cash received upon the disposition of ISS,shares and higher dividend payments, partially offset by the purchase of GMI Ratings.proceeds from our debt offering in May 2018. Cash provided by investing activities was $297.0 million and $4.1 million for the years ended December 31, 2014 and 2013, respectively. The $292.9 million year-over-year increaseused in cash provided by investing activities primarily reflects net cash inflows resulting from the disposition of ISS during the year ended December 31, 2014. Partially offsetting this were the cash inflows from the maturation of short-term investments received during the year ended December 31, 2013. In the year ended December 31, 2013, we began investing excess cash in money market funds and other similar cash equivalents rather than U.S. Treasury securities and other short-term investments as we had in prior periods. Cash Flows From Financing Activities
Cash provided by financing activities was $19.9$267.5 million for the year ended December 31, 20152017 compared to cash used in financing activities of $442.3$372.9 million for the year ended December 31, 2014.2016. The year-over-year increasechange primarily reflects the impact of our 2025 Senior Notes offering in August 2015, partially offset by higher sharelower repurchases as well as the payments of dividends, which began in the three months ended December 31, 2014.
Cash used in financing activities was $442.3 million and $146.6 million for the years ended December 31, 2014 and 2013, respectively. The year-over-year increase primarily reflects increased purchases of treasury shares, and the first dividend payment made, partially offset by lower repayments on our debt.proceeds from borrowings and higher dividend payments.
70
Contractual Obligations Our contractual obligations consist primarily of leases for office space, leases for equipment and other operating leases, obligations to vendors arising out of market data contracts and our debt obligations arising from the issuance of the Senior Notes. The following table summarizes our contractual obligations for the periods indicated as of December 31, 2015:2018: | | | | | | Years Ending December 31, | | | | | | | | | Years Ending December 31, | | | | | | | (in thousands) | | Total | | 2016 | | 2017 | | 2018 | | 2019 | | 2020 | | Thereafter | | | Total | | | 2019 | | | 2020 | | | 2021 | | | 2022 | | | 2023 | | | Thereafter | | Operating leases | | $ | 265,956 | | | $ | 28,170 | | | $ | 26,416 | | | $ | 25,064 | | | $ | 20,369 | | | $ | 17,863 | | | $ | 148,074 | | | $ | 262,156 | | | | 33,525 | | | | 31,966 | | | | 29,288 | | | | 25,335 | | | | 24,277 | | | | 117,765 | | Vendor obligations | | 96,046 | | | 42,495 | | | 20,724 | | | 19,611 | | | 8,488 | | | 4,728 | | | | — | | | | 108,206 | | | | 45,472 | | | | 16,555 | | | | 13,100 | | | | 10,976 | | | | 10,942 | | | | 11,161 | | Senior Notes(1) | | 2,438,000 | | | 88,000 | | | 88,000 | | | 88,000 | | | 88,000 | | | 88,000 | | | 1,998,000 | | | | 3,592,438 | | | | 138,625 | | | | 138,625 | | | | 138,625 | | | | 138,625 | | | | 138,625 | | | | 2,899,313 | | | | | | | | | | | | | | | | | | | | | | | | | Other obligations (2) | | | | 20,204 | | | | — | | | | — | | | | — | | | | — | | | | 2,278 | | | | 17,926 | | Total contractual obligations | | $ | 2,800,002 | | | $ | 158,665 | | | $ | 135,140 | | | $ | 132,675 | | | $ | 116,857 | | | $ | 110,591 | | | $ | 2,146,074 | | | $ | 3,983,004 | | | $ | 217,622 | | | $ | 187,146 | | | $ | 181,013 | | | $ | 174,936 | | | $ | 176,122 | | | $ | 3,046,165 | | | | | | | | | | | | | | | | | | | | | | | | |
(1) | Includes the impact of payments for the principal amount on the 2024 Senior Notes, 2025 Senior Notes, 2026 Senior Notes and the 20252027 Senior Notes plus interest based on the 5.25%, 5.75%, 4.75% and 5.75%5.375% coupon interest rate,rates, respectively. |
(2) | Primarily includes amounts payable related to the estimated Toll Charge. The Toll Charge is included within “Prepaid income taxes” and “Other non-current liabilities” in our Consolidated Statements of Financial Condition. |
The obligations related to MSCI’sour uncertain tax positions, which are not considered material, have been excluded from the table above because of the uncertainty surrounding the timing and final amounts of any settlement. Off-Balance Sheet Arrangements At December 31, 20152018 and 2014,2017, we did not have any relationships with unconsolidated entities or financial partnerships, such as entities often referred to as structured finance or special purpose entities, which would have been established for the purpose of facilitating off-balance sheet arrangements or other contractually narrow or limited purposes. Recent Accounting Standards Updates See Note 2, “Recent Accounting Standards Updates,” of the Notes to the Consolidated Financial Statements included herein for further information. Item 7A. | Qualitative and Quantitative Disclosures About Market Risk |
Item 7A.Quantitative and Qualitative Disclosures About Market Risk Foreign Currency Risk We are subject to foreign currency exchange fluctuation risk. Exchange rate movements can impact the U.S. dollar reporteddollar-reported value of our revenues, expenses, assets and liabilities denominated in non-U.S. dollar currencies or where the currency of such items is different than the functional currency of the entity where these items were recorded. For all operations outside the U.S. where the Company has designated the local non-U.S. dollar currency as the functional currency, revenue and expenses are translated using average monthly exchange rates and assets and liabilities are translated into U.S. dollars using month-end exchange rates. For these operations, currency translation adjustments arising from a change in the rate of exchange between the functional currency and the U.S. dollar are accumulated in a separate component of shareholders’ equity. In addition, transaction gains and losses arising from a change in exchange rates for transactions denominated in a currency other than the functional currency of the entity are reflected in non-operating “Other expense (income), net” in our Consolidated Statement of Income.
We generally invoice our clients in U.S. dollars; however, we invoice a portion of our clients in Euros, British pounds sterling, Japanese yen and a limited number of other non-U.S. dollar currencies. For the years ended December 31, 20152018 and 2014, 17.8%2017, 12.9% and 20.2%13.4%, respectively, of our revenues are subject to foreign currency exchange rate risk and primarily includes clients billed in foreign currency as well as U.S. dollar exposures on non-U.S. dollar foreign operating entities. Of the 17.8%12.9% of non-U.S dollar exposure for the year ended December 31, 2015, 37.0%2018, 42.2% was in Euros, 29.4% was in Japanese yen and 17.8% was in British pounds sterling, 35.8% was in Euros and 21.6% was in Japanese yen.sterling. Of the 20.2%13.4% of non-U.S dollar exposure for the year ended December 31, 2014, 38.3%2017, 39.6% was in Euros, 34.0%27.3% was in Japanese yen and 26.8% was in British pounds sterling and 21.7% was in Japanese yen.sterling. Revenues from index-linked investment products represented 18.4%23.5% and 17.8%21.7% of operating revenues for the years ended December 31, 20152018 and 2014,2017, respectively. While a substantial portion of our fees for index-linked 71
investment products are invoiced in U.S. dollars, the fees are based on the investment product’s assets, of which two-thirds are invested in securities denominated in currencies other than the U.S. dollar. Accordingly, declines in such other currencies against the U.S. dollar will decrease the fees payable to us under such licenses. In addition, declines in such currencies against the U.S. dollar could impact the attractiveness of such investment products resulting in net fund outflows, which would further reduce the fees payable under such licenses. We are exposed to additional foreign currency risk in certain of our operating costs. Approximately 41.3%40.4% and 43.1%36.9% of our operating expenses including operating expense attributable to income (loss) from discontinued operations, net of income taxes, for the years ended December 31, 20152018 and 2014,2017, respectively, were denominated in foreign currencies, the significant majority of which were denominated in British pounds sterling, Indian rupees, Swiss francs, Euros, Hungarian forints, Euros, Hong Kong dollars, Chinese yuanSwiss francs and Mexican pesos. Expenses incurred in foreign currency may increase as we expand our business outside the U.S. We have certain monetary assets and liabilities denominated in currencies other than local functional amounts and when these balances wereare remeasured into their local functional currency, either a gain or a loss resultedresults from the change of the value of the functional currency as compared to the originating currencies. We manage foreign currency exchange rate risk, in part, through the use of derivative financial instruments comprised principally of forward contracts on foreign currency which are not designated as hedging instruments for accounting purposes. The objective of the derivative instruments is to minimize the impact on the income statement impact associated withof the volatility of amounts denominated in certain foreign currencies. We recognized total foreign currency exchange losses of $0.4 million, $2.2 million $3.0 million and $2.4$0.2 million for the years ended December 31, 2015, 20142018, 2017 and 2013,2016, respectively. Item 8. | Financial Statements and Supplementary Data |
The information required by this Item is set forth beginning on page F-1 of this Annual Report on Form 10-K. Item 9. | Changes in and Disagreements withWith Accountants on Accounting and Financial Disclosure |
None. Item 9A. | Controls and Procedures |
(a). Evaluation of Disclosure Controls and Procedures The Company maintains disclosure controls and procedures that are designed to ensure that information required to be disclosed in the Company’s reports under the Securities Exchange Act of 1934, as amended (the “Exchange Act”), is recorded, processed, summarized and reported within the time periods specified in the SEC’s rules and forms, and that such information is accumulated and communicated to management, including our Chief Executive Officer (“CEO”) and Chief Financial Officer (“CFO”) as appropriate, to allow timely decisions regarding required disclosure. Management of the Company, with the participation of its CEO and CFO, evaluated the effectiveness of the Company’s disclosure controls and procedures. Based on their evaluation, as of December 31, 2015,2018, the end of the period covered by this Annual Report on Form 10-K, the Company’s CEO and CFO have concluded that the Company’s disclosure controls and procedures (as defined in Rules 13a-15(e) and 15d-15(e) under the Exchange Act) were effective. (b). Management’s Annual Report On Internal Control Over Financial Reporting Our management is responsible for establishing and maintaining adequate internal control over financial reporting. Internal control over financial reporting is defined in Rules 13a-15(f) and 15d-15(f) promulgated under the Exchange Act as a process designed by, or under the supervision of, our principal executive and principal financial officers or persons performing similar functions and effected by the Company’s Board of Directors, management and other personnel, to provide reasonable assurance regarding the reliability of financial reporting and the preparation of financial statements for external purposes in accordance with generally accepted accounting principles (“GAAP”)GAAP and includes those policies and procedures that: Pertainpertain to the maintenance of records that, in reasonable detail, accurately and fairly reflect our transactions and dispositions of our assets,
72
Provide | • | provide reasonable assurance that transactions are recorded as necessary to permit preparation of our financial statements in accordance with GAAP, and that our receipts and expenditures are being made only in accordance with authorizations of management and directors of the Company, and |
Provideprovide reasonable assurance regarding prevention or timely detection of unauthorized acquisition, use or disposition of our assets that could have a material effect on the financial statements.
Because of its inherent limitations, internal control over financial reporting may not prevent or detect misstatements. Also, projections of any evaluation of effectiveness to future periods are subject to the risk that controls may become inadequate because of changes in conditions, or that the degree of compliance with the policies or procedures may deteriorate. Management assessed the effectiveness of our internal control over financial reporting as of December 31, 20152018 based on the criteria described inInternal Control—Integrated Framework (2013)issued by the Committee of Sponsoring Organizations of the Treadway Commission (COSO). Based on this assessment, management, including the Company’s CEO and CFO, concluded that, as of December 31, 2015,2018, our internal control over financial reporting was effective in providing reasonable assurance regarding the reliability of financial reporting and the preparation of financial statements for external purposes in accordance with generally accepted accounting principles. PricewaterhouseCoopers LLP, our independent registered public accounting firm, has audited and issued a report on the effectiveness of our internal control over financial reporting as of December 31, 2015,2018, which appears on page F-2 of this Annual Report on Form 10-K. (c). Changes in Internal Control Over Financial Reporting There have been no changes in our internal control over financial reporting (as defined in Rules 13a-15(f) and 15d-15(f) under the Exchange Act) during the fiscal quarter ended December 31, 20152018 that have materially affected, or are reasonably likely to materially affect, our internal control over financial reporting. Item 9B. | Other Information |
None. 73
PART III Item 10.Directors, Executive Officers and Corporate Governance
Item 10. | Directors, Executive Officers and Corporate Governance |
Except for the information relating to our Executive Officers set forth in Part I of this Annual Report on Form 10-K, we incorporate by reference the information responsive to this Item appearing in our Proxy Statement, which will be filed no later than 120 days after December 31, 2015.2018. Information regarding our Code of Ethics and Business Conduct and Corporate Governance Policies is incorporated herein by reference from our Proxy Statement, which will be filed no later than 120 days after December 31, 2015.2018. Any amendments to, or waivers from, a provision of our CodesCode of Ethics that apply to our principal executive officer, principal financial officer, principal accounting officer or controller, or persons performing similar functions and that relates to any element of the Code of Ethics enumerated in paragraph (b) of Item 406 of Regulation S-K shall be disclosed by posting such information on our website atwww.msci.com. The information on our website is not and should not be considered a part of this Annual Report on Form 10-K. Item 11. Executive Compensation
Item 11. | Executive Compensation |
We incorporate by reference the information responsive to this Item appearing in our Proxy Statement, which will be filed no later than 120 days after December 31, 2015.2018. Item 12.Security Ownership of Certain Beneficial Owners and Management and Related Stockholder Matters
Item 12. | Security Ownership of Certain Beneficial Owners and Management and Related Stockholder Matters |
We incorporate by reference the information responsive to this Item appearing in our Proxy Statement, which will be filed no later than 120 days after December 31, 2015.2018. The information provided under Part II, Item 5. “Market for Registrant’s Common Equity, Related Stockholder Matters And Issuer Purchases of Equity Securities” of this Annual Report on Form 10-K is incorporated by reference herein. Item 13. Certain Relationships and Related Transactions, and Director Independence
Item 13. | Certain Relationships and Related Transactions, and Director Independence |
We incorporate by reference the information responsive to this Item appearing in our Proxy Statement, which will be filed no later than 120 days after December 31, 2015.2018. Item 14. Principal Accounting Fees and Services
Item 14. | Principal Accounting Fees and Services |
We incorporate by reference the information responsive to this Item appearing in our Proxy Statement, which will be filed no later than 120 days after December 31, 2015. 2018.
74
PART IV Item 15. Exhibits, Financial Statement Schedules
Item 15. | Exhibits, Financial Statement Schedules |
(a)(1)Financial Statements The financial statements begin on page F-1 of this Annual Report on Form 10-K. (a)(2)Financial Statement Schedules No financial statement schedules are provided because the information called for is not applicable or not required or is included in the consolidated financial statements or the notes thereto beginning on page F-1 of this Annual Report on Form 10-K. (a)(3)Exhibits The information required by this Item is set forth on the exhibit index that begins on page EX-1 of this Annual Report on Form 10-K. below.EXHIBIT INDEX SIGNATURES
Exhibit
Number | Description | Form | File No. | Exhibit No. | Filing Date | 3.1 | Third Amended and Restated Certificate of Incorporation | 10-Q | 001-33812 | 3.1 | 5/4/2012 | 3.2 | Amended and Restated By-laws | 10-Q | 001-33812 | 3.2 | 5/4/2012 | 4.1 | Form of Senior Indenture | S-3 | 333-206232 | 4.1 | 8/7/2015 | 4.2 | Form of Subordinated Indenture | S-3 | 333-206232 | 4.2 | 8/7/2015 | 4.3 | Form of Common Stock Certificate | 10-Q | 001-33812 | 4.1 | 5/4/2012 | 4.4 | Indenture, dated as of November 20, 2014, among MSCI Inc., each of the Subsidiary Guarantors party thereto and Wells Fargo Bank, National Association, as Trustee | 8-K | 001-33812 | 4.1 | 11/20/2014 | 4.5 | Form of Note for MSCI Inc. 5.250% Senior Notes due November 15, 2024 (included in Exhibit 4.4) | 8-K | 001-33812 | 4.2 | 11/20/2014 | 4.6 | Indenture, dated as of August 13, 2015, among MSCI Inc., each of the Subsidiary Guarantors party thereto and Wells Fargo Bank, National Association, as Trustee | 8-K | 001-33812 | 4.1 | 8/13/2015 | 4.7 | Form of Note for MSCI Inc. 5.750% Senior Notes due August 13, 2025 (included in Exhibit 4.6) | 8-K | 001-33812 | 4.2 | 8/13/2015 | 4.8 | Indenture, dated as of August 4, 2016, among MSCI Inc., each of the Subsidiary Guarantors party thereto and Wells Fargo Bank, National Association, as Trustee | 8-K | 001-33812 | 4.1 | 8/5/2016 |
75
Exhibit
Number | Description | Form | File No. | Exhibit No. | Filing Date | 4.9 | Form of Note for MSCI Inc. 4.750% Senior Notes due August 1, 2026 (included in Exhibit 4.8) | 8-K | 001-33812 | 4.2 | 8/5/2016 | 4.10 | Indenture, dated as of May 18, 2018, among MSCI Inc., each of the subsidiary guarantors party thereto and Wells Fargo Bank, National Association, as Trustee | 8-K | 001-33812 | 4.1 | 5/18/2018 | 4.11 | Form of Note for MSCI Inc. 5.375% Senior Notes due May 15, 2027 (included in Exhibit 4.10) | 8-K | 001-33812 | 4.2 | 5/18/2018 | 10.1† | Index License Agreement for Funds, dated as of March 18, 2000, between Morgan Stanley Capital International and Barclays Global Investors, N.A. | 10-K | 001-33812 | 10.1 | 2/27/2015 | 10.2† | Amendment to Index License Agreement for Funds between Morgan Stanley Capital International and Barclays Global Investors, N.A. | 10-K | 001-33812 | 10.2 | 2/29/2012 | 10.3† | Letter Agreement to Amend MSCI-BGI Fund Index License Agreement, dated as of June 21, 2001, between Morgan Stanley Capital International Inc. and Barclays Global Investors, N.A. | 10-K | 001-33812 | 10.3 | 1/31/2011 | 10.4† | Addendum to the Index License Agreement for Funds, dated as of September 18, 2002, between Morgan Stanley Capital International Inc. and Barclays Global Investors, N.A. | S-1/A | 333-144975 | 10.4 | 9/26/2007 | 10.5† | Amendment to the Index License Agreement for Funds, dated as of December 3, 2004, between Morgan Stanley Capital International Inc. and Barclays Global Investors, N.A. | S-1/A | 333-144975 | 10.5 | 10/26/2007 | 10.6† | Amendment to the Index License Agreement for Funds, dated as of May 1, 2005, between Morgan Stanley Capital International Inc. and Barclays Global Investors, N.A. | S-1/A | 333-144975 | 10.6 | 9/26/2007 | 10.7† | Amendment to the Index License Agreement for Funds, dated as of July 1, 2006, between Morgan Stanley Capital International Inc. and Barclays Global Investors, N.A. | S-1/A | 333-144975 | 10.7 | 10/26/2007 | 10.8 | Amendment to Index License Agreement for Funds, dated as of June 5, 2007, between Morgan Stanley Capital International Inc. and Barclays Global Investors, N.A. | 10-K | 001-33812 | 10.8 | 1/31/2011 | 10.9 | Amendment to Index License Agreement for Funds, dated as of November 7, 2008, between MSCI Inc. and Barclays Global Investors, N.A. | 10-K | 001-33812 | 10.9 | 2/29/2012 |
76
Exhibit
Number | Description | Form | File No. | Exhibit No. | Filing Date | 10.10† | Amendment to Index License Agreement for Funds, dated as of December 9, 2008, between MSCI Inc. and Barclays Global Investors, N.A. | 10-Q | 001-33812 | 10.2 | 7/2/2010 | 10.11 | Amendment to Index License Agreement for Funds, dated as of April 1, 2009, between MSCI Inc. and Barclays Global Investors, N.A. | 10-K | 001-33812 | 10.11 | 1/29/2010 | 10.12† | Amendment to Index License Agreement for Funds, dated as of May 21, 2009, between MSCI Inc. and Barclays Global Investors, N.A. | 10-Q | 001-33812 | 10.3 | 7/2/2010 | 10.13 | Amendment to Index License Agreement for Funds, dated as of September 30, 2009, between MSCI Inc. and Barclays Global Investors, N.A. | 10-Q | 001-33812 | 10.4 | 7/2/2010 | 10.14 | Amendment to Index License Agreement for Funds, dated as of October 6, 2009, between MSCI Inc. and Barclays Global Investors, N.A. | 10-K | 001-33812 | 10.14 | 1/29/2010 | 10.15† | Amendment to the Index License Agreement for Funds, dated as of October 4, 2011, by and between MSCI Inc. and BlackRock Institutional Trust Company, N.A. (formerly, Barclays Global Investors, N.A.). Replaces in its entirety the Amendment to Index License Agreement for Funds, dated as of October 27, 2009, between MSCI Inc. and Barclays Global Investors, N.A. filed as Exhibit 10.15 to Form 10-K (001-33812) filed with the SEC on February 29, 2012 | 10-K | 001-33812 | 10.15 | 3/1/2013 | 10.23 | Tax Sharing Agreement, dated as of November 20, 2007, between Morgan Stanley and MSCI Inc. | 10-K | 001-33812 | 10.12 | 2/28/2008 | 10.29* | MSCI Inc. Amended and Restated 2007 Equity Incentive Compensation Plan | 10-K | 001-33812 | 10.30 | 3/1/2013 | 10.30* | MSCI Independent Directors’ Equity Compensation Plan as amended and restated on January 12, 2011 | 10-K | 001-33812 | 10.39 | 1/31/2011 | 10.31* | MSCI Inc. Performance Formula and Incentive Plan | Proxy | 001-33812 | Annex C | 2/28/2008 | 10.32* | MSCI Equity Incentive Compensation Plan 2007 Founders Grant Award Certificate for Stock Options | 10-K | 001-33812 | 10.19 | 2/28/2008 | 10.34* | RiskMetrics Group, Inc. 2000 Stock Option Plan | S-8 | 333-165888 | 99.1 | 6/3/2010 | 10.35* | RiskMetrics Group, Inc. 2004 Stock Option Plan | S-8 | 333-165888 | 99.2 | 6/3/2010 | 10.36* | RiskMetrics Group, Inc. 2007 Omnibus Incentive Compensation Plan | 10-K | 001-33812 | 10.38 | 3/1/2013 |
77
Exhibit
Number | Description | Form | File No. | Exhibit No. | Filing Date | 10.43* | Award Agreement for 2010 Price Vested Stock Option Award for the Chief Executive Officer under the MSCI Inc. 2007 Amended and Restated Equity Incentive Compensation Plan | 10-K | 001-33812 | 10.54 | 1/31/2011 | 10.46† | Amendment to Index License Agreement for Funds, dated as of December 15, 2009, between MSCI Inc. and Blackrock Institutional Trust Company, N.A. | 10-K | 001-33812 | 10.57 | 1/31/2011 | 10.47 | Amendment to Index License Agreement for Funds, dated as of June 13, 2011, between MSCI Inc. and BlackRock Institutional Trust Company, N.A. | 10-K | 001-33812 | 10.58 | 2/29/2012 | 10.48 | Amendment to Index License Agreement for Funds, dated as of May 20, 2010 | 10-K | 001-33812 | 10.59 | 1/31/2011 | 10.49† | Schedule No. 11043 to the Master Index License Agreement for Index Based Funds, between MSCI Inc. and BlackRock Institutional Trust Company, N.A. (formerly, Barclays Global Investors, N.A.), dated as of September 1, 2010 | 10-K | 001-33812 | 10.60 | 1/31/2011 | 10.50† | Amendment to the Index License Agreement for Funds, dated as of November 19, 2010, between MSCI Inc. and Barclays Global Investors, N.A. | 10-K | 001-33812 | 10.50 | 2/27/2015 | 10.51 | Amendment to the Index License Agreement for Funds, dated as of June 21, 2011, by and between MSCI Inc. and BlackRock Institutional Trust Company, N.A. (formerly known as Barclays Global Investors, N.A.) | 10-K | 001-33812 | 10.62 | 2/29/2012 | 10.52† | Amendment to the Index License Agreement for Funds, dated as of July 1, 2011, by and between MSCI Inc. (formerly, Morgan Stanley Capital International Inc.) and Blackrock Institutional Trust Company, N.A. (formerly, Barclays Global Investors, N.A.) | 10-K/A | 001-33812 | 10.63 | 7/20/2012 | 10.53† | Amendment to the Index License Agreement for Funds, dated as of August 23, 2011, by and between MSCI Inc. and Blackrock Institutional Trust Company, N.A. (formerly, Barclays Global Investors, N.A.) | 10-K | 001-33812 | 10.53 | 2/27/2015 | 10.54 | Amendment to the Index License Agreement for Funds, dated as of October 4, 2011, by and between MSCI Inc. and BlackRock Institutional Trust Company, N.A. (formerly known as Barclays Global Investors, N.A.) | 10-K | 001-33812 | 10.65 | 2/29/2012 |
78
Exhibit
Number | Description | Form | File No. | Exhibit No. | Filing Date | 10.55† | Amendment to the Index License Agreement for Funds, dated as of October 4, 2011, by and between MSCI Inc. and BlackRock Institutional Trust Company, N.A. (formerly, Barclays Global Investors, N.A.) | 10-K | 001-33812 | 10.57 | 3/1/2013 | 10.56 | Amendment to the Index License Agreement for Funds, dated as of December 16, 2011, by and between MSCI Inc. (formerly, Morgan Stanley Capital International, Inc.) and BlackRock Institutional Trust Company, N.A. (formerly, Barclays Global Investors, N.A.) | 10-K | 001-33812 | 10.67 | 2/29/2012 | 10.57 | Agreement of Lease dated September 16, 2011, by and between 7 World Trade Center, LLC and MSCI Inc. | 8-K | 001-33812 | 10.1 | 9/22/2011 | 10.59* | Offer Letter, executed May 25, 2012, between MSCI Inc. and Robert Qutub | 8-K | 001-33812 | 10.1 | 5/30/2012 | 10.62† | Amendment to the Index License Agreement for Funds, dated as of February 16, 2012, by and between MSCI Inc. (formerly, Morgan Stanley Capital International Inc.) and BlackRock Institutional Trust Company, N.A. (formerly, Barclays Global Investors, N.A.) | 10-K | 001-33812 | 10.66 | 2/28/2014 | 10.63† | Amendment to the Index License Agreement for Funds, dated as of April 9, 2012, by and between MSCI Inc. (formerly, Morgan Stanley Capital International Inc.) and BlackRock Institutional Trust Company, N.A. (formerly, Barclays Global Investors, N.A.) | 10-K | 001-33812 | 10.63 | 2/27/2015 | 10.64† | Amendment to the Index License Agreement for Funds, dated as of June 1, 2012, by and between MSCI Inc. (formerly, Morgan Stanley Capital International Inc.) and BlackRock Institutional Trust Company, N.A. (formerly, Barclays Global Investors, N.A.) | 10-K | 001-33812 | 10.68 | 3/1/2013 | 10.65† | Amendment to the Index License Agreement for Funds, dated as of August 17, 2012, by and between MSCI Inc. (formerly, Morgan Stanley Capital International Inc.) and BlackRock Institutional Trust Company, N.A. (formerly, Barclays Global Investors, N.A.) | 10-K | 001-33812 | 10.69 | 3/1/2013 |
79
Exhibit
Number | Description | Form | File No. | Exhibit No. | Filing Date | 10.66† | Amendment to the Index License Agreement for Funds, dated as of August 20, 2012, by and between MSCI Inc. (formerly, Morgan Stanley Capital International Inc.) and BlackRock Institutional Trust Company, N.A. (formerly, Barclays Global Investors, N.A.) | 10-K | 001-33812 | 10.70 | 2/28/2014 | 10.67† | Amendment to the Index License Agreement for Funds, dated as of November 6, 2012, by and between MSCI Inc. (formerly, Morgan Stanley Capital International Inc.) and BlackRock Institutional Trust Company, N.A. (formerly, Barclays Global Investors, N.A.) | 10-K | 001-33812 | 10.71 | 2/28/2014 | 10.68† | Amendment to the Index License Agreement for Funds, dated as of November 15, 2012, by and between MSCI Inc. (formerly, Morgan Stanley Capital International Inc.) and BlackRock Institutional Trust Company, N.A. (formerly, Barclays Global Investors, N.A.) | 10-K | 001-33812 | 10.72 | 3/1/2013 | 10.69† | Amendment to the Index License Agreement for Funds, dated as of February 21, 2013, by and between MSCI Inc. (formerly, Morgan Stanley Capital International Inc.) and BlackRock Institutional Trust Company, N.A. (formerly, Barclays Global Investors, N.A.) | 10-K | 001-33812 | 10.73 | 2/28/2014 | 10.70† | Amendment to the Index License Agreement for Funds, dated as of March 20, 2013, by and between MSCI Inc. (formerly, Morgan Stanley Capital International Inc.) and BlackRock Institutional Trust Company, N.A. (formerly, Barclays Global Investors, N.A.) | 10-K | 001-33812 | 10.74 | 2/28/2014 | 10.71† | Amendment to the Index License Agreement for Funds, dated as of September 11, 2013, by and between MSCI Inc. (formerly, Morgan Stanley Capital International Inc.) and BlackRock Institutional Trust Company, N.A. (formerly, Barclays Global Investors, N.A.) | 10-K | 001-33812 | 10.71 | 2/27/2015 | 10.72† | Amendment to the Index License Agreement for Funds, dated as of December 10, 2013, by and between MSCI Inc. (formerly, Morgan Stanley Capital International Inc.) and BlackRock Institutional Trust Company, N.A. (formerly, Barclays Global Investors, N.A.) | 10-K | 001-33812 | 10.72 | 2/27/2015 |
80
Exhibit
Number | Description | Form | File No. | Exhibit No. | Filing Date | 10.73† | Amendment to the Index License Agreement for Funds, dated as of December 16, 2013, by and between MSCI Inc. (formerly, Morgan Stanley Capital International Inc.) and BlackRock Institutional Trust Company, N.A. (formerly, Barclays Global Investors, N.A.) | 10-K | 001-33812 | 10.73 | 2/27/2015 | 10.80* | Award Agreement for 2013 Non-Qualified Stock Option Award | 10-K | 001-33812 | 10.85 | 2/28/2014 | 10.82† | Amendment to the Index License Agreement for Funds, dated as of January 23, 2014, by and between MSCI Inc. (formerly, Morgan Stanley Capital International Inc.) and BlackRock Institutional Trust Company, N.A. (formerly, Barclays Global Investors, N.A.) | 10-K | 001-33812 | 10.82 | 2/27/2015 | 10.83† | Amendment to the Index License Agreement for Funds, dated as of January 23, 2014, by and between MSCI Inc. (formerly, Morgan Stanley Capital International Inc.) and BlackRock Institutional Trust Company, N.A. (formerly, Barclays Global Investors, N.A.) | 10-K | 001-33812 | 10.83 | 2/27/2015 | 10.84 | Stock Purchase Agreement, dated as of March 17, 2014, among MSCI Inc., RiskMetrics Group Holdings, LLC and VISS Acquisition Corp. | 8-K | 001-33812 | 2.1 | 3/20/2014 | 10.85† | Letter Agreement to amend the Amendment to the Index License Agreement for Funds, dated as of March 18, 2014, by and between MSCI Inc. (formerly, Morgan Stanley Capital International Inc.) and BlackRock Institutional Trust Company, N.A. (formerly, Barclays Global Investors, N.A.) | 10-K | 001-33812 | 10.85 | 2/27/2015 | 10.87* | Form of Award Agreement for Restricted Stock Units for Directors under the MSCI Inc. Independent Directors’ Equity Compensation Plan, as amended | 10-Q | 001-33812 | 10.2 | 5/2/2014 | 10.88* | Summary of Non-Employee Director Compensation | 10-K | 001-33812 | 10.88 | 2/26/2018 | 10.89† | Amendment to the Index License Agreement for Funds, dated as of July 9, 2014, by and between MSCI Inc. (formerly, Morgan Stanley Capital International Inc.) and BlackRock Fund Advisors (as successor to Barclays Global Investors, N.A.) | 10-K | 001-33812 | 10.89 | 2/27/2015 |
81
Exhibit
Number | Description | Form | File No. | Exhibit No. | Filing Date | 10.90† | Amendment to the Index License Agreement for Funds, dated as of July 16, 2014, by and between MSCI Inc. (formerly, Morgan Stanley Capital International Inc.) and BlackRock Fund Advisors (as successor to Barclays Global Investors, N.A.) | 10-K | 001-33812 | 10.90 | 2/27/2015 | 10.91† | Amendment to the Index License Agreement for Funds, dated as of August 15, 2014, by and between MSCI Inc. (formerly, Morgan Stanley Capital International Inc.) and BlackRock Fund Advisors (as successor to Barclays Global Investors, N.A.) | 10-K | 001-33812 | 10.91 | 2/27/2015 | 10.92† | Amendment to the Index License Agreement for Funds, dated as of September 9, 2014, by and between MSCI Inc. (formerly, Morgan Stanley Capital International Inc.) and BlackRock Fund Advisors (as successor to Barclays Global Investors, N.A.) | 10-K | 001-33812 | 10.92 | 2/27/2015 | 10.93† | Amendment to the Index License Agreement for Funds, dated as of September 17, 2014, by and between MSCI Inc. (formerly, Morgan Stanley Capital International Inc.) and BlackRock Fund Advisors (as successor to Barclays Global Investors, N.A.) | 10-K | 001-33812 | 10.93 | 2/27/2015 | 10.95† | Amendment to the Index License Agreement for Funds, dated as of September 22, 2014, by and between MSCI Inc. (formerly, Morgan Stanley Capital International Inc.) and BlackRock Fund Advisors (as successor to Barclays Global Investors, N.A.) | 10-K | 001-33812 | 10.95 | 2/27/2015 | 10.96† | Amendment to the Index License Agreement for Funds, dated as of October 30, 2014, by and between MSCI Inc. (formerly, Morgan Stanley Capital International Inc.) and BlackRock Fund Advisors (as successor to Barclays Global Investors, N.A.) | 10-K | 001-33812 | 10.96 | 2/26/2016 | 10.97 | Revolving Credit Agreement, dated as of November 20, 2014, among MSCI Inc., as the Borrower, each of the Subsidiary Guarantors party thereto, JPMorgan Chase Bank, N.A., as the Administrative Agent and L/C Issuer, the Other Lenders Party Thereto and JPMorgan Chase Bank, N.A., as Lead Arranger and Bookrunner (as amended as of May 18, 2018 by Amendment No. 2 to the Revolving Credit Agreement) (included as Exhibit A to Amendment No. 2 in Exhibit 10.174) | 8-K | 001-33812 | 10.1 | 5/18/2018 |
82
Exhibit
Number | Description | Form | File No. | Exhibit No. | Filing Date | 10.98 | Cooperation Agreement, dated as of January 29, 2015 (amended by Letter Agreement to Cooperation Agreement, dated as of March 10, 2016, by and among MSCI Inc., Value Act Capital Management, L.P. and D. Robert Hale) | 8-K | 001-33812 | 99.1 | 1/30/2015 | 10.99* | Form of Award Agreement for Restricted Stock Units for Executive Officers under the MSCI Inc. 2007 Amended and Restated Equity Incentive Compensation Plan | 10-K | 001-33812 | 10.101 | 2/27/2015 | 10.100* | Form of Annual Performance Award Agreement for Performance Stock Units for Managing Directors under the MSCI Inc. 2007 Amended and Restated Equity Incentive Compensation Plan | 10-Q | 001-33812 | 10.4 | 04/29/2016 | 10.101* | Form of Award Agreement for Restricted Stock Units for Managing Directors under the MSCI Inc. 2007 Amended and Restated Equity Incentive Compensation Plan | 10-Q | 001-33812 | 10.5 | 04/29/2016 | 10.102† | Amendment to the Index License Agreement for Funds, dated as of February 4, 2015, by and between MSCI Inc. (formerly, Morgan Stanley Capital International Inc.) and BlackRock Fund Advisors (as successor to Barclays Global Investors, N.A.) | 10-K | 001-33812 | 10.102 | 2/26/2016 | 10.103† | Amendment to the Index License Agreement for Funds, dated as of February 25, 2015, by and between MSCI Inc. (formerly, Morgan Stanley Capital International Inc.) and BlackRock Fund Advisors (as successor to Barclays Global Investors, N.A.) | 10-K | 001-33812 | 10.103 | 2/26/2016 | 10.104† | Letter Agreement (to amend the Amendment dated December 10, 2013) to the Index License Agreement for Funds, dated as of March 17, 2015, by and between MSCI Inc. (formerly, Morgan Stanley Capital International Inc.) and BlackRock Institutional Trust Company, N.A. (formerly, Barclays Global Investors, N.A.) | 10-K | 001-33812 | 10.104 | 2/26/2016 | 10.105† | Amendment to the Index License Agreement for Funds, dated as of April 20, 2015, by and between MSCI Inc. (formerly, Morgan Stanley Capital International Inc.) and BlackRock Fund Advisors (as successor to Barclays Global Investors, N.A.) | 10-K | 001-33812 | 10.105 | 2/26/2016 |
83
Exhibit
Number | Description | Form | File No. | Exhibit No. | Filing Date | 10.106† | Amendment to the Index License Agreement for Funds, dated as of April 20, 2015, by and between MSCI Inc. (formerly, Morgan Stanley Capital International Inc.) and BlackRock Fund Advisors (as successor to Barclays Global Investors, N.A.) | 10-K | 001-33812 | 10.106 | 2/26/2016 | 10.107* | Form of Award Agreement for Restricted Stock Units for Directors under the MSCI Inc. Independent Directors’ Equity Compensation Plan, as amended | 10-Q | 001-33812 | 10.1 | 5/1/2015 | 10.109* | MSCI Inc. Change in Control Severance Plan, adopted May 28, 2015 | 10-K | 001-33812 | 10.109 | 2/24/2017 | 10.110† | Amendment (to amend the Amendment dated February 21, 2013) to the Index License Agreement for Funds, dated as of June 1, 2015, by and between MSCI Inc. (formerly, Morgan Stanley Capital International Inc.) and BlackRock Fund Advisors (as successor to Barclays Global Investors, N.A.) | 10-K | 001-33812 | 10.110 | 2/26/2016 | 10.111† | Amendment to the Index License Agreement for Funds, dated as of June 1, 2015, by and between MSCI Inc. (formerly, Morgan Stanley Capital International Inc.) and BlackRock Fund Advisors (as successor to Barclays Global Investors, N.A.) | 10-K | 001-33812 | 10.111 | 2/26/2016 | 10.112† | Amendment (to amend the Amendment dated November 6, 2012) to the Index License Agreement for Funds, dated as of June 4, 2015, by and between MSCI Inc. (formerly, Morgan Stanley Capital International Inc.) and BlackRock Fund Advisors (as successor to Barclays Global Investors, N.A.) | 10-K | 001-33812 | 10.112 | 2/26/2016 | 10.113† | Amendment (to amend the Amendments dated January 23, 2014 and April 15, 2014) to the Index License Agreement for Funds, dated as of June 4, 2015, by and between MSCI Inc. (formerly, Morgan Stanley Capital International Inc.) and BlackRock Fund Advisors (as successor to Barclays Global Investors, N.A.) | Filed Herewith | 10.114* | Form of Performance Award Agreement for Performance Stock Units for Executive Officers under the MSCI Inc. 2007 Amended and Restated Equity Incentive Compensation Plan | 10-Q | 001-33812 | 10.2 | 7/31/2015 | 10.115* | Form of Special Performance Award Agreement for Performance Stock Units under the MSCI Inc. 2007 Amended and Restated Equity Incentive Compensation Plan | 10-Q | 001-33812 | 10.3 | 7/31/2015 |
84
Exhibit
Number | Description | Form | File No. | Exhibit No. | Filing Date | 10.116† | Amendment to the Index License Agreement for Funds, dated as of August 1, 2015, by and between MSCI Inc. (formerly, Morgan Stanley Capital International Inc.) and BlackRock Fund Advisors (as successor to Barclays Global Investors, N.A.) | 10-K | 001-33812 | 10.116 | 2/26/2016 | 10.117† | Amendment (to amend the Amendment dated October 4, 2011) to the Index License Agreement for Funds, dated as of August 3, 2015, by and between MSCI Inc. (formerly, Morgan Stanley Capital International Inc.) and BlackRock Fund Advisors (as successor to Barclays Global Investors, N.A.) | 10-K | 001-33812 | 10.117 | 2/26/2016 | 10.118† | Amendment (to amend the Amendment dated January 23, 2014) to the Index License Agreement for Funds, dated as of August 3, 2015, by and between MSCI Inc. (formerly, Morgan Stanley Capital International Inc.) and BlackRock Fund Advisors (as successor to Barclays Global Investors, N.A.) | 10-K | 001-33812 | 10.118 | 2/26/2016 | 10.119† | Amendment (to amend the Amendment dated August 15, 2014) to the Index License Agreement for Funds, dated as of August 3, 2015, by and between MSCI Inc. (formerly, Morgan Stanley Capital International Inc.) and BlackRock Fund Advisors (as successor to Barclays Global Investors, N.A.) | 10-K | 001-33812 | 10.119 | 2/26/2016 | 10.120† | Letter Agreement (to amend the Amendment dated August 15, 2014) to the Index License Agreement for Funds, dated as of August 3, 2015, by and between MSCI Inc. (formerly, Morgan Stanley Capital International Inc.) and BlackRock Institutional Trust Company, N.A. (formerly, Barclays Global Investors, N.A.) | 10-K | 001-33812 | 10.120 | 2/26/2016 | 10.121† | Letter Agreement (to amend the Amendment dated April 20, 2015) to the Index License Agreement for Funds, dated as of October 9, 2015, by and between MSCI Inc. (formerly, Morgan Stanley Capital International Inc.) and BlackRock Institutional Trust Company, N.A. (formerly, Barclays Global Investors, N.A.) | 10-K | 001-33812 | 10.121 | 2/26/2016 | 10.122† | Letter Agreement (to amend the Amendment dated December 10, 2013) to the Index License Agreement for Funds, dated as of December 17, 2015, by and between MSCI Inc. (formerly, Morgan Stanley Capital International Inc.) and BlackRock Institutional Trust Company, N.A. (formerly, Barclays Global Investors, N.A.) | 10-K | 001-33812 | 10.122 | 2/26/2016 |
85
Exhibit
Number | Description | Form | File No. | Exhibit No. | Filing Date | 10.123* | Transition and Release Agreement, dated as of February 10, 2016, by and between MSCI Inc. and Robert Qutub | 10-K | 001-33812 | 10.123 | 2/26/2016 | 10.124* | Form of 2016 Multi-Year Performance Award Agreement for Performance Stock Units for the Executive Committee under the MSCI Inc. 2007 Amended and Restated Equity Incentive Compensation Plan | 10-Q | 001-33812 | 10.6 | 4/29/2016 | 10.125* | Form of 2016 Multi-Year Performance Award Agreement for Performance Stock Units for the Executive Committee under the MSCI Inc. 2016 Omnibus Incentive Plan | 10-Q | 001-33812 | 10.7 | 4/29/2016 | 10.126 | Amendment (to amend the Amendment dated January 23, 2014) to the Index License Agreement for Funds, dated as of April 15, 2014, by and between MSCI Inc. (formerly, Morgan Stanley Capital International Inc.) and BlackRock Fund Advisors (as successor to Barclays Global Investors, N.A.) | 10-K | 001-33812 | 10.126 | 2/26/2016 | 10.127† | Amendment to the Index License Agreement for Funds, dated as of January 28, 2016, by and between MSCI Inc. (formerly, Morgan Stanley Capital International Inc.) and BlackRock Fund Advisors (as successor to Barclays Global Investors, N.A.) | 10-K | 001-33812 | 10.127 | 2/24/2017 | 10.128* | Offer Letter, effective as of March 15, 2016, between MSCI Inc. and Kathleen A. Winters | 8-K | 001-33812 | 10.1 | 4/27/2016 | 10.129† | Amendment to the Index License Agreement for Funds, dated as of February 29, 2016, by and between MSCI Inc. (formerly, Morgan Stanley Capital International Inc.) and BlackRock Fund Advisors (as successor to Barclays Global Investors, N.A.) | 10-K | 001-33812 | 10.129 | 2/26/2018 | 10.130† | Amendment to the Index License Agreement for Funds, dated as of April 8, 2016, by and between MSCI Inc. (formerly, Morgan Stanley Capital International Inc.) and BlackRock Fund Advisors (as successor to Barclays Global Investors, N.A.) | 10-K | 001-33812 | 10.130 | 2/24/2017 | 10.131† | Amendment (to amend the Amendment dated December 16, 2011) to the Index License Agreement for Funds, dated as of April 12, 2016, by and between MSCI Inc. (formerly, Morgan Stanley Capital International Inc.) and BlackRock Fund Advisors (as successor to Barclays Global Investors, N.A.) | 10-K | 001-33812 | 10.131 | 2/24/2017 |
86
Exhibit
Number | Description | Form | File No. | Exhibit No. | Filing Date | 10.132* | MSCI Inc. 2016 Omnibus Incentive Plan | S-8 | 333-210987 | 99.1 | 04/28/2016 | 10.133* | MSCI Inc. 2016 Non-Employee Directors Compensation Plan, as amended | 10-Q | 001-33812 | 10.3 | 5/5/2017 | 10.134* | Form of Award Agreement for Restricted Stock Units for Directors under the MSCI Inc. 2016 Non-Employee Directors Compensation Plan | 10-Q | 001-33812 | 10.3 | 4/29/2016 | 10.135* | Non-Employee Director Stock Ownership Guidelines | 10-Q | 001-33812 | 10.8 | 4/29/2016 | 10.136* | MSCI Inc. Non-Employee Director Deferral Plan, as amended | 10-Q | 001-33812 | 10.9 | 4/29/2016 | 10.137 | Letter Agreement to Cooperation Agreement, dated as of March 10, 2016, by and among MSCI Inc., Value Act Capital Management, L.P. and D. Robert Hale. | 10-Q | 001-33812 | 10.10 | 4/29/2016 | 10.138* | Offer Letter, effective as of October 15, 2014, by and between MSCI Inc. and Laurent Seyer | 10-Q | 001-33812 | 10.13 | 4/29/2016 | 10.140† | Amendment to the Index License Agreement for Funds, dated as of April 29, 2016, by and between MSCI Inc. (formerly, Morgan Stanley Capital International Inc.) and BlackRock Fund Advisors (as successor to Barclays Global Investors, N.A.) | 10-K | 001-33812 | 10.140 | 2/24/2017 | 10.141 | Amendment to the Schedules to the Index License Agreement for Funds, dated as of May 4, 2016, by and between MSCI Inc. (formerly, Morgan Stanley Capital International Inc.) and BlackRock Fund Advisors (as successor to Barclays Global Investors, N.A.) | 10-K | 001-33812 | 10.141 | 2/24/2017 | 10.142† | Amendment to the Index License Agreement for Funds, dated as of May 12, 2016, by and between MSCI Inc. (formerly, Morgan Stanley Capital International Inc.) and BlackRock Fund Advisors (as successor to Barclays Global Investors, N.A.) | 10-K | 001-33812 | 10.142 | 2/26/2018 | 10.143† | Amendment to the Index License Agreement for Funds, dated as of June 15, 2016, by and between MSCI Inc. (formerly, Morgan Stanley Capital International Inc.) and BlackRock Fund Advisors (as successor to Barclays Global Investors, N.A.) | 10-K | 001-33812 | 10.143 | 2/24/2017 |
87
Exhibit
Number | Description | Form | File No. | Exhibit No. | Filing Date | 10.144† | Amendment (to amend the Amendment dated February 29, 2016) to the Index License Agreement for Funds, dated as of July 21, 2016, by and between MSCI Inc. (formerly, Morgan Stanley Capital International Inc.) and BlackRock Fund Advisors (as successor to Barclays Global Investors, N.A.) | 10-K | 001-33812 | 10.144 | 2/24/2017 | 10.145* | Form of 2016 Award Agreement for Restricted Stock Units for Managing Directors under the MSCI Inc. 2016 Omnibus Incentive Plan | 10-Q | 001-33812 | 10.5 | 7/29/2016 | 10.146* | Amendment to the Index License Agreement for Funds, dated as of August 1, 2016, by and between MSCI Inc. (formerly, Morgan Stanley Capital International Inc.) and BlackRock Fund Advisors (as successor to Barclays Global Investors, N.A.) | 10-K | 001-33812 | 10.146 | 2/26/2018 | 10.147 | Amendment No. 1 to the Revolving Credit Agreement, dated August 4, 2016, among MSCI Inc., each of the Guarantors party thereto, the Lenders party thereto and JPMorgan Chase Bank, N.A., as Administrative Agent | 8-K | 001-33812 | 10.1 | 8/05/2016 | 10.148† | Amendment to the Index License Agreement for Funds, dated as of October 12, 2016, by and between MSCI Inc. (formerly, Morgan Stanley Capital International Inc.) and BlackRock Fund Advisors (as successor to Barclays Global Investors, N.A.) | 10-K | 001-33812 | 10.148 | 2/26/2018 | 10.149 | Amendment to the Schedules to the Index License Agreement for Funds, dated as of November 30, 2016, by and between MSCI Inc. (formerly, Morgan Stanley Capital International Inc.) and BlackRock Fund Advisors (as successor to Barclays Global Investors, N.A.) | 10-K | 001-33812 | 10.149 | 2/24/2017 | 10.150† | Amendment to the Index License Agreement for Funds, dated as of December 5, 2016, by and between MSCI Inc. (formerly, Morgan Stanley Capital International Inc.) and BlackRock Fund Advisors (as successor to Barclays Global Investors, N.A.) | 10-K | 001-33812 | 10.150 | 2/26/2018 | 10.151* | Form of Special Restricted Stock Unit Award Agreement under the MSCI Inc. 2016 Omnibus Incentive Plan | 10-K | 001-33812 | 10.151 | 2/24/2017 | 10.152* | Form of Award Agreement for Restricted Stock Units for Managing Directors under the MSCI Inc. 2016 Omnibus Incentive Plan | 10-K | 001-33812 | 10.152 | 2/24/2017 |
88
Exhibit
Number | Description | Form | File No. | Exhibit No. | Filing Date | 10.153* | Form of Annual Performance Award Agreement for Performance Stock Units for Managing Directors under the MSCI Inc. 2016 Omnibus Incentive Plan | 10-K | 001-33812 | 10.153 | 2/24/2017 | 10.154† | Amendment to a Schedule to the Index License Agreement for Funds, dated as of December 8, 2016, by and between MSCI Inc. (formerly, Morgan Stanley Capital International Inc.) and BlackRock Fund Advisors (as successor to Barclays Global Investors, N.A.) | 10-K | 001-33812 | 10.154 | 2/26/2018 | 10.155† | Amendment to the Index License Agreement for Funds, dated as of February 10, 2017, by and between MSCI Inc. (formerly, Morgan Stanley Capital International Inc.) and BlackRock Fund Advisors (as successor to Barclays Global Investors, N.A.) | 10-K | 001-33812 | 10.155 | 2/26/2018 | 10.156† | Amendment No. 1 to the Index License Agreement for Funds, dated as of April 6, 2017, by and between MSCI ESG Research LLC and BlackRock Fund Advisors | 10-K | 001-33812 | 10.156 | 2/26/2018 | 10.157† | Amendment to the Second Schedule to the Index License Agreement for Funds, dated as of April 12, 2017, by and between MSCI Inc. (formerly, Morgan Stanley Capital International Inc.) and BlackRock Fund Advisors (as successor to Barclays Global Investors, N.A.) | Filed Herewith | 10.158* | Form of Award Agreement for Restricted Stock Units for Directors Under the MSCI Inc. 2016 Non-Employee Directors Compensation Plan | 10-Q | 001-33812 | 10.1 | 5/5/2017 | 10.159† | Amendment to the Index License Agreement for Funds, dated as of May 26, 2017, by and between MSCI Inc. (formerly, Morgan Stanley Capital International Inc.) and BlackRock Fund Advisors (as successor to Barclays Global Investors, N.A.) | 10-K | 001-33812 | 10.159 | 2/26/2018 | 10.160† | Amendment to the Previous Amendment and Previous Name Change Amendment to the Index License Agreement for Funds, dated as of September 1, 2017, by and between MSCI Inc. (formerly, Morgan Stanley Capital International Inc.) and BlackRock Fund Advisors (as successor to Barclays Global Investors, N.A.) | 10-K | 001-33812 | 10.160 | 2/26/2018 | 10.161† | Amendment to the Index License Agreement for Funds, dated as of October 1, 2017, by and between MSCI Inc. (formerly, Morgan Stanley Capital International Inc.) and BlackRock Fund Advisors (as successor to Barclays Global Investors, N.A.) | Filed Herewith |
89
Exhibit
Number | Description | Form | File No. | Exhibit No. | Filing Date | 10.162 | Amendment to the Index License Agreement for Funds, dated as of October 1, 2017, by and between MSCI Inc. (formerly, Morgan Stanley Capital International Inc.) and BlackRock Fund Advisors (as successor to Barclays Global Investors, N.A.) | Filed Herewith | 10.163† | Amendment to the Index License Agreement for Funds, dated as of November 1, 2017, by and between MSCI Inc. (formerly, Morgan Stanley Capital International Inc.) and BlackRock Fund Advisors (as successor to Barclays Global Investors, N.A.) | 10-K | 001-33812 | 10.163 | 2/26/2018 | 10.164* | Form of Award Agreement for Restricted Stock Units for Managing Directors under the MSCI Inc. 2016 Omnibus Incentive Plan | 10-K | 001-33812 | 10.164 | 2/26/2018 | 10.165* | Form of Annual Performance Award Agreement for Performance Stock Units for Managing Directors under the MSCI Inc. 2016 Omnibus Incentive Plan | 10-K | 001-33812 | 10.165 | 2/26/2018 | 10.166* | Annual Incentive Plan | 10-K | 001-33812 | 10.166 | 2/26/2018 | 10.167* | Offer Letter, executed March 11, 2014, by and between MSCI Inc. and Scott Crum | 10-Q | 001-33812 | 10.1 | 5/4/2018 | 10.168* | Form of Award Agreement for Restricted Stock Units for Directors Under the MSCI Inc. 2016 Non-Employee Directors Compensation Plan | 10-Q | 001-33812 | 10.2 | 5/4/2018 | 10.169†† | Amendment to the Index License Agreement for Funds, dated as of January 18, 2018, by and between MSCI Inc. (formerly, Morgan Stanley Capital International Inc.) and BlackRock Fund Advisors (as successor to Barclays Global Investors, N.A.) | Filed Herewith | 10.170†† | Amendment to the Index License Agreement for Funds, dated as of February 8, 2018, by and between MSCI Inc. (formerly, Morgan Stanley Capital International Inc.) and BlackRock Fund Advisors (as successor to Barclays Global Investors, N.A.) | Filed Herewith | 10.171 | Amendment to the Previous Amendment to the Index License Agreement for Funds, dated as of February 19, 2018, by and between MSCI Inc. (formerly, Morgan Stanley Capital International Inc.) and BlackRock Fund Advisors (as successor to Barclays Global Investors, N.A.) | Filed Herewith |
90
Exhibit
Number | Description | Form | File No. | Exhibit No. | Filing Date | 10.172†† | Amendment No. 2 to the Index License Agreement for Funds, dated as of March 1, 2018, by and between MSCI ESG Research LLC and BlackRock Fund Advisors | Filed Herewith | 10.173 | Amendment to the Schedules to the Index License Agreement for Funds, dated as of May 15, 2018, by and between MSCI Inc. and BlackRock Fund Advisors | Filed Herewith | 10.174 | Amendment No. 2 to the Revolving Credit Agreement, dated as of May 18, 2018, among MSCI Inc., each of the subsidiary guarantors party thereto, JPMorgan Chase Bank, N.A., as Administrative Agent and L/C Issuer and the other lenders party thereto | 8-K | 001-33812 | 10.1 | 5/18/2018 | 10.175†† | Amendment to the Index License Agreement for Funds, dated as of June 1, 2018, by and between MSCI Inc. (formerly, Morgan Stanley Capital International Inc.) and BlackRock Fund Advisors (as successor to Barclays Global Investors, N.A.) | Filed Herewith | 10.176†† | Amendment No. 3 to the Index License Agreement for Funds, dated as of July 1, 2018, by and between MSCI ESG Research LLC and BlackRock Fund Advisors | Filed Herewith | 10.177 | Amendment to the Schedules to the Index License Agreement for Funds, dated as of September 1, 2018, by and between MSCI Inc. and BlackRock Fund Advisors | Filed Herewith | 10.178 | Amendment to the Previous Amendment to the Index License Agreement for Funds, dated as of September 10, 2018, by and between MSCI Inc. (formerly, Morgan Stanley Capital International Inc.) and BlackRock Fund Advisors (as successor to Barclays Global Investors, N.A.) | Filed Herewith | 10.179†† | Amendment to the Previous Amendment, the Previous Conversion Amendment and Previous Name Change Amendment to the Index License Agreement for Funds, dated as of September 10, 2018, by and between MSCI Inc. (formerly, Morgan Stanley Capital International Inc.) and BlackRock Fund Advisors (as successor to Barclays Global Investors, N.A.) | Filed Herewith |
91
Exhibit
Number | Description | Form | File No. | Exhibit No. | Filing Date | 10.180†† | Amendment to the Index License Agreement for Funds, dated as of October 1, 2018, by and between MSCI Inc. (formerly, Morgan Stanley Capital International Inc.) and BlackRock Institutional Trust Company, N.A. (formerly, Barclays Global Investors, N.A.) | Filed Herewith | 10.181†† | Amendment to the Index License Agreement for Funds, dated as of October 1, 2018, by and between MSCI Inc. (formerly, Morgan Stanley Capital International Inc.) and BlackRock Institutional Trust Company, N.A. (formerly, Barclays Global Investors, N.A.) | Filed Herewith | 10.182†† | Amendment to the Index License Agreement for Funds, dated as of November 1, 2018, by and between MSCI Inc. (formerly, Morgan Stanley Capital International Inc.) and BlackRock Fund Advisors (as successor to Barclays Global Investors, N.A.) | Filed Herewith | 10.183†† | Amendment to the Index License Agreement for Funds, dated as of November 1, 2018, by and between MSCI Inc. (formerly, Morgan Stanley Capital International Inc.) and BlackRock Fund Advisors (as successor to Barclays Global Investors, N.A.) | Filed Herewith | 10.184†† | Amendment to the Previous Amendment to the Index License Agreement for Funds, dated as of November 16, 2018, by and between MSCI Inc. (formerly, Morgan Stanley Capital International Inc.) and BlackRock Fund Advisors (as successor to Barclays Global Investors, N.A.) | Filed Herewith | 10.185* | Form of 2019 Award Agreement for Restricted Stock Units For Employees Under the MSCI Inc. 2016 Omnibus Incentive Plan | Filed Herewith | 10.186* | Form of 2019 Annual Performance Award Agreement for Performance Stock Units for Managing Directors Under the MSCI Inc. Omnibus Incentive Plan | Filed Herewith | 10.187* | Form of 2019 Annual Performance Award Agreement for Performance Stock Units for Managing Directors Under the MSCI Inc. Omnibus Incentive Plan | Filed Herewith | 10.188* | MSCI Inc. Executive Committee Stock Ownership Guidelines | Filed Herewith |
92
* | Indicates a management compensation plan, contract or arrangement. |
† | Confidential treatment has been granted for a portion of this exhibit. |
†† | Confidential treatment requested. |
Item 16. | Form 10-K Summary |
None. 93
SIGNATURES Pursuant to the requirements of Section 13 or 15(d) of the Securities Exchange Act of 1934, the Registrant has duly caused this Report to be signed on its behalf by the undersigned, thereunto duly authorized. | | | | | MSCI INC. | | | By: | | /S/ HENRY A. FERNANDEZ
| | | By: | Name: | /S/ HENRY A. FERNANDEZ | | | Name: | | Henry A. Fernandez | | | Title: | | Chairman and Chief Executive Officer and President
|
Date: February 26, 201622, 2019 94
POWER OF ATTORNEY KNOW ALL PERSONS BY THESE PRESENTS, that each person whose signature appears below constitutes and appoints Robert Qutub,Kathleen A. Winters, Frederick W. Bogdan and Cecilia Aza, and each or any one of them, his or her true and lawful attorneys-in-fact and agents, with full powers of substitution and resubstitution, for him or her and in his or her name, place and stead, in the capacities indicated below, to sign any and all amendments to this Annual Report on Form 10-K and to file the same, with all exhibits thereto and other documents in connection therewith, with the Securities and Exchange Commission, hereby ratifying and confirming his or her signatures as they may be signed by his or her said attorneys-in-fact and agents, or their substitute or substitutes, to any and all amendments to this Annual Report on Form 10-K. Pursuant to the requirements of Section 13 or 15(d) of the Securities Exchange Act of 1934, this report has been signed below by the following persons on behalf of the Registrant and in the capacities and on the dates indicated. | | | | | Signature | | Title | | Date | | | | | | /S/S/ HENRY A. FERNANDEZ | | Chairman and Chief Executive Officer | | February 22, 2019 | Henry A. Fernandez | | Chairman, Chief Executive Officer,
and President (principal(principal executive officer)
| | February 26, 2016 | | | | | | /S/ ROBERT QUTUB Robert QutubS/ KATHLEEN A. WINTERS
| | Chief Financial Officer (principaland Treasurer | | February 22, 2019 | Kathleen A. Winters | | (principal financial officer) | | February 26, 2016 | | | | | | /S/ RICHARD J. NAPOLITANO Richard J. NapolitanoS/ JENNIFER MAK
| | Principal Accounting Officer and Global Controller (principal | | February 22, 2019 | Jennifer Mak | | (principal accounting officer) | | February 26, 2016 | | | | | | /S/S/ ROBERT G. ASHE | | Director | | February 22, 2019 | Robert G. Ashe | | | | | | | | | | /S/ BENJAMIN F. DUPONT | | Director | | February 26, 2016 | | | 22, 2019 | /S/ BENJAMIN F. DUPONT
Benjamin F. duPont | | | | | | | | | | /S/ WAYNE EDMUNDS | | Director | | February 26, 201622, 2019 | Wayne Edmunds | | | | | | | | | | /S/ WAYNE EDMUNDS Wayne EdmundsS/ ALICE W. HANDY
| | Director | | February 26, 2016 | | | 22, 2019 | /S/ D. ROBERT HALE
D. Robert Hale
| | Director
| | February 26, 2016 |
| | | | | Signature
| | Title
| | Date
| | | | /S/ ALICE W. HANDY
Alice W. Handy | | | | | | | | | | /S/ CATHERINE R. KINNEY | | Director | | February 26, 2016 | | | 22, 2019 | /S/ CATHERINE R. KINNEY
Catherine R. Kinney | | | | | | | | | | /S/ WENDY E. LANE | | Director | | February 26, 2016 | | | 22, 2019 | /S/ WENDY E. LANE
Wendy E. Lane | | | | | | | | | | /S/ JACQUES P. PEROLD | | Director | | February 26, 2016 | | | 22, 2019 | Jacques P. Perold /S/S/ LINDA H. RIEFLER | | Director | | February 22, 2019 | Linda H. Riefler | | | | | | | | | | /S/ GEORGE W. SIGULER | | Director | | February 26, 2016 | | | 22, 2019 | /S/ GEORGE W. SIGULER
George W. Siguler | | | | | | | | | | /S/ MARCUS L. SMITH | | Director | | February 26, 2016 | | | 22, 2019 | /S/ PATRICK TIERNEY
Patrick TierneyMarcus L. Smith
| | Director
| | February 26, 2016 | | | | /S/ RODOLPHE M. VALLEE
Rodolphe M. Vallee | | Director
| | February 26, 2016 |
95
INDEX TO CONSOLIDATED FINANCIAL STATEMENTS | | | | | Consolidated Financial Statements | | Page | | ReportsReport of Independent Registered Public Accounting FirmsFirm
| | | F-2 | | Consolidated Statements of Financial Condition as of December 31, 20152018 and December 31, 20142017 | | | F-4 | | Consolidated Statements of Income for the Years Ended December 31, 2015,2018, December 31, 2014,2017, and December 31, 20132016 | | | F-5 | | Consolidated Statements of Comprehensive Income for the Years Ended December 31, 2015,2018, December 31, 2014,2017, and December 31, 20132016 | | | F-6 | | Consolidated Statements of Shareholders’ Equity (Deficit) for the Years Ended December 31, 2015,2018, December 31, 2014,2017, and December 31, 20132016 | | | F-7 | | Consolidated Statements of Cash Flows for the Years Ended December 31, 2015,2018, December 31, 2014,2017, and December 31, 20132016 | | | F-8 | | Notes to Consolidated Financial Statements | | | F-9 | |
F-1
REPORT OF INDEPENDENT REGISTEREDREGISTERED PUBLIC ACCOUNTING FIRM To the Board of Directors and Shareholders of MSCI Inc. In our opinion,
Opinions on the Financial Statements and Internal Control over Financial Reporting We have audited the accompanying consolidated statements of financial condition of MSCI Inc. and its subsidiaries (the “Company”) as of December 31, 2018 and 2017, and the related consolidated statements of income, of comprehensive income, of shareholders’ equity (deficit) and of cash flows for each of the three years in the period ended December 31, 2018, including the related notes (collectively referred to as the “consolidated financial statements”). We also have audited the Company's internal control over financial reporting as of December 31, 2018, based on criteria established in Internal Control - Integrated Framework (2013) issued by the Committee of Sponsoring Organizations of the Treadway Commission (COSO). In our opinion, the consolidated financial statements referred to above present fairly, in all material respects, the financial position of MSCI Inc. and its subsidiaries atthe Company as of December 31, 20152018 and December 31, 2014,2017, and the results of theirits operations and theirits cash flows for each of the twothree years in the period ended December 31, 20152018 in conformity with accounting principles generally accepted in the United States of America. Also in our opinion, the Company maintained, in all material respects, effective internal control over financial reporting as of December 31, 2015,2018, based on criteria established inInternal Control - IntegratedFramework (2013) issued by the Committee of Sponsoring Organizations of the Treadway Commission (COSO). COSO. Basis for Opinions The Company’sCompany's management is responsible for these consolidated financial statements, for maintaining effective internal control over financial reporting, and for its assessment of the effectiveness of internal control over financial reporting, included in Management’s Annual Report On Internal Control Over Financial Reporting appearing under Item 9A. Our responsibility is to express opinions on thesethe Company’s consolidated financial statements and on the Company’sCompany's internal control over financial reporting based on our integrated audits. We are a public accounting firm registered with the Public Company Accounting Oversight Board (United States) (PCAOB) and are required to be independent with respect to the Company in accordance with the U.S. federal securities laws and the applicable rules and regulations of the Securities and Exchange Commission and the PCAOB. We conducted our audits in accordance with the standards of the Public Company Accounting Oversight Board (United States).PCAOB. Those standards require that we plan and perform the audits to obtain reasonable assurance about whether the consolidated financial statements are free of material misstatement, whether due to error or fraud, and whether effective internal control over financial reporting was maintained in all material respects. Our audits of the consolidated financial statements included performing procedures to assess the risks of material misstatement of the consolidated financial statements, whether due to error or fraud, and performing procedures that respond to those risks. Such procedures included examining, on a test basis, evidence supportingregarding the amounts and disclosures in the consolidated financial statements, assessingstatements. Our audits also included evaluating the accounting principles used and significant estimates made by management, andas well as evaluating the overall presentation of the consolidated financial statement presentation.statements. Our audit of internal control over financial reporting included obtaining an understanding of internal control over financial reporting, assessing the risk that a material weakness exists, and testing and evaluating the design and operating effectiveness of internal control based on the assessed risk. Our audits also included performing such other procedures as we considered necessary in the circumstances. We believe that our audits provide a reasonable basis for our opinions. Definition and Limitations of Internal Control over Financial Reporting A company’s internal control over financial reporting is a process designed to provide reasonable assurance regarding the reliability of financial reporting and the preparation of financial statements for external purposes in accordance with generally accepted accounting principles. A company’s internal control over financial reporting includes those policies and procedures that (i) pertain to the maintenance of records that, in reasonable detail, accurately and fairly reflect the transactions and dispositions of the assets of the company; (ii) provide reasonable assurance that transactions are recorded as necessary to permit preparation of financial statements in accordance with generally accepted accounting principles, and that receipts and expenditures of the company are being made F-2
only in accordance with authorizations of management and directors of the company; and (iii) provide reasonable assurance regarding prevention or timely detection of unauthorized acquisition, use, or disposition of the company’s assets that could have a material effect on the financial statements. Because of its inherent limitations, internal control over financial reporting may not prevent or detect misstatements. Also, projections of any evaluation of effectiveness to future periods are subject to the risk that controls may become inadequate because of changes in conditions, or that the degree of compliance with the policies or procedures may deteriorate.
/s/ PricewaterhouseCoopers LLP New York, New York February 26, 2016 22, 2019REPORT OF INDEPENDENT REGISTERED PUBLIC ACCOUNTING FIRM
To the Board of Directors and Shareholders of MSCI Inc.
We have audited the consolidated statements of income, comprehensive income, shareholders’ equity, and cash flows of MSCI Inc. and subsidiaries (the “Company”) for the year ended December 31, 2013. These financial statements are the responsibility ofserved as the Company’s management. Our responsibility is to express an opinion on these financial statements based on our audit.auditor since 2014. We conducted our audit in accordance with the standards of the Public Company Accounting Oversight Board (United States). Those standards require that we plan and perform the audit to obtain reasonable assurance about whether the financial statements are free of material misstatement. An audit includes examining, on a test basis, evidence supporting the amounts and disclosures in the financial statements. An audit also includes assessing the accounting principles used and significant estimates made by management, as well as evaluating the overall financial statement presentation. We believe that our audits provide a reasonable basis for our opinion.
In our opinion, such consolidated financial statements present fairly, in all material respects, the results of operations and cash flows for MSCI Inc. and subsidiaries for the year ended December 31, 2013, in conformity with accounting principles generally accepted in the United States of America.F-3
/s/ DELOITTE & TOUCHE LLP
New York, New York
February 28, 2014 (February 27, 2015 as to the effects of discontinued operations as discussed in Note 3 and February 26, 2016 as to the change in segments as discussed in Note 13)
MSCI INC. CONSOLIDATED STATEMENTS OF FINANCIAL CONDITION | | | | | | | | | | | | As of | | | | | December 31,
2015 | | | December 31,
2014 | | | | | (in thousands, except per share and share data) | | ASSETS | | | | | | | | | Current assets: | | | | | | | | | Cash and cash equivalents | | $ | 777,706 | | | $ | 508,799 | | Accounts receivable (net of allowances of $1,117 and $857 as of December 31, 2015 and 2014, respectively) | | | 208,239 | | | | 178,717 | | Deferred taxes | | | — | | | | 22,209 | | Prepaid income taxes | | | 46,115 | | | | 29,180 | | Prepaid and other assets | | | 31,211 | | | | 30,553 | | | | | | | | | | | Total current assets | | | 1,063,271 | | | | 769,458 | | Property, equipment and leasehold improvements (net of accumulated depreciation of $114,680 and $92,808 at December 31, 2015 and 2014, respectively) | | | 98,926 | | | | 94,074 | | Goodwill | | | 1,565,621 | | | | 1,564,904 | | Intangible assets (net of accumulated amortization of $418,512 and $372,209 at December 31, 2015 and 2014, respectively) | | | 391,490 | | | | 433,628 | | Non-current deferred tax assets | | | 9,180 | | | | 3,944 | | Other non-current assets | | | 18,499 | | | | 16,525 | | | | | | | | | | | Total assets | | $ | 3,146,987 | | | $ | 2,882,533 | | | | | | | | | | | | | | LIABILITIES AND SHAREHOLDERS’ EQUITY | | | | | | | | | Current liabilities: | | | | | | | | | Accounts payable | | $ | 2,512 | | | $ | 2,835 | | Accrued compensation and related benefits | | | 116,619 | | | | 111,408 | | Other accrued liabilities | | | 61,433 | | | | 47,894 | | Deferred revenue | | | 317,552 | | | | 310,775 | | | | | | | | | | | Total current liabilities | | | 498,116 | | | | 472,912 | | Long-term debt | | | 1,579,404 | | | | 788,358 | | Deferred taxes | | | 110,937 | | | | 137,838 | | Other non-current liabilities | | | 57,043 | | | | 50,592 | | | | | | | | | | | Total liabilities | | | 2,245,500 | | | | 1,449,700 | | | | | | | | | | | | | | Commitments and Contingencies (see Note 6 and Note 10) | | | | | | | | | | | | Shareholders’ equity: | | | | | | | | | Preferred stock (par value $0.01; 100,000,000 shares authorized; no shares issued) | | | — | | | | — | | Common stock (par value $0.01; 750,000,000 common shares authorized at December 31, 2015 and 2014; 128,200,189 and 126,637,390 common shares issued at December 31, 2015 and 2014, respectively; and 101,013,148 and 112,072,469 common shares outstanding at December 31, 2015 and 2014, respectively) | | | 1,282 | | | | 1,266 | | Treasury shares, at cost (27,187,041 and 14,564,921 shares at December 31, 2015 and 2014, respectively) | | | (1,395,695 | ) | | | (588,378 | ) | Additional paid in capital | | | 1,173,183 | | | | 1,022,221 | | Retained earnings | | | 1,158,462 | | | | 1,022,695 | | Accumulated other comprehensive loss | | | (35,745 | ) | | | (24,971 | ) | | | | | | | | | | Total shareholders’ equity | | | 901,487 | | | | 1,432,833 | | | | | | | | | | | Total liabilities and shareholders’ equity | | $ | 3,146,987 | | | $ | 2,882,533 | | | | | | | | | | |
See Notes to Consolidated Financial Statements.
MSCI INC.
CONSOLIDATED STATEMENTS OF INCOME
| | | | | | | | | | | | | | | | Years Ended | | | | | December 31,
2015 | | | December 31,
2014 | | | December 31,
2013 | | | | | (in thousands, except per share and share data) | | | | | | Operating revenues | | $ | 1,075,013 | | | $ | 996,680 | | | $ | 913,364 | | | | | | Operating expenses: | | | | | | | | | | | | | Cost of revenues | | | 267,695 | | | | 276,623 | | | | 240,697 | | Selling and marketing | | | 162,294 | | | | 163,839 | | | | 137,693 | | Research and development | | | 77,320 | | | | 71,095 | | | | 61,003 | | General and administrative | | | 86,007 | | | | 76,369 | | | | 68,458 | | Amortization of intangible assets | | | 46,910 | | | | 45,877 | | | | 44,798 | | Depreciation and amortization of property, equipment and leasehold improvements | | | 30,889 | | | | 25,711 | | | | 20,384 | | | | | | | | | | | | | | | | | | | Total operating expenses | | | 671,115 | | | | 659,514 | | | | 573,033 | | | | | | | | | | | | | | | | | | | Operating income | | | 403,898 | | | | 337,166 | | | | 340,331 | | | | | | | | | | | | | | | Interest income | | | (1,166 | ) | | | (851 | ) | | | (889 | ) | Interest expense | | | 62,387 | | | | 31,820 | | | | 26,256 | | Other expense (income) | | | (6,877 | ) | | | (2,141 | ) | | | 2,136 | | | | | | | | | | | | | | | | | | | Other expense (income), net | | | 54,344 | | | | 28,828 | | | | 27,503 | | | | | | | | | | | | | | | | | | | Income from continuing operations before provision for income taxes | | | 349,554 | | | | 308,338 | | | | 312,828 | | Provision for income taxes | | | 119,516 | | | | 109,396 | | | | 112,918 | | | | | | | | | | | | | | | Income from continuing operations | | | 230,038 | | | | 198,942 | | | | 199,910 | | | | | | Income (loss) from discontinued operations, net of income taxes | | | (6,390 | ) | | | 85,171 | | | | 22,647 | | | | | | | | | | | | | | | Net income | | $ | 223,648 | | | $ | 284,113 | | | $ | 222,557 | | | | | | | | | | | | | | | | | | | Earnings per basic common share: | | | | | | | | | | | | | | | | | Earnings per basic common share from continuing operations | | $ | 2.11 | | | $ | 1.72 | | | $ | 1.66 | | | | | | Earnings per basic common share from discontinued operations | | | (0.06 | ) | | | 0.73 | | | | 0.19 | | | | | | | | | | | | | | | Earnings per basic common share | | $ | 2.05 | | | $ | 2.45 | | | $ | 1.85 | | | | | | | | | | | | | | | | | | | Earnings per diluted common share: | | | | | | | | | | | | | | | | | Earnings per diluted common share from continuing operations | | $ | 2.09 | | | $ | 1.70 | | | $ | 1.64 | | | | | | Earnings per diluted common share from discontinued operations | | | (0.06 | ) | | | 0.73 | | | | 0.19 | | | | | | | | | | | | | | | Earnings per diluted common share | | $ | 2.03 | | | $ | 2.43 | | | $ | 1.83 | | | | | | | | | | | | | | | | | | | Weighted average shares outstanding used in computing earnings per share: | | | | | | | | | | | | | Basic | | | 109,124 | | | | 115,737 | | | | 120,100 | | | | | | | | | | | | | | | | | | | Diluted | | | 109,926 | | | | 116,706 | | | | 121,074 | | | | | | | | | | | | | | | | | | | Dividends declared per common share | | $ | 0.80 | | | $ | 0.18 | | | $ | — | | | | | | | | | | | | | | |
See Notes to Consolidated Financial Statements.
MSCI INC.
CONSOLIDATED STATEMENTS OF COMPREHENSIVE INCOME
| | | | | | | | | | | | | | | | Years Ended | | | | | December 31,
2015 | | | December 31,
2014 | | | December 31,
2013 | | | | | (in thousands) | | | | | | Net income | | $ | 223,648 | | | $ | 284,113 | | | $ | 222,557 | | | | | | | | | | | | | | | Other comprehensive income (loss): | | | | | | | | | | | | | | | | | Foreign currency translation adjustments | | | (12,253 | ) | | | (18,053 | ) | | | 1,295 | | Income tax effect | | | 135 | | | | (132 | ) | | | (500 | ) | | | | | | | | | | | | | | Foreign currency translation adjustments, net | | | (12,118 | ) | | | (18,185 | ) | | | 795 | | | | | | | | | | | | | | | | | | | Unrealized gains (losses) on cash flow hedges | | | — | | | | — | | | | 1,364 | | Income tax effect | | | —�� | | | | — | | | | (524 | ) | | | | | | | | | | | | | | Unrealized gains (losses) on cash flow hedges, net | | | — | | | | — | | | | 840 | | | | | | | | | | | | | | | | | | | Unrealized gains (losses) on available-for-sale securities | | | — | | | | — | | | | (5 | ) | Income tax effect | | | — | | | | — | | | | 2 | | | | | | | | | | | | | | | Unrealized gains (losses) on available-for-sale securities, net | | | — | | | | — | | | | (3 | ) | | | | | | | | | | | | | | | | | | Pension and other post-retirement adjustments | | | 1,872 | | | | (8,299 | ) | | | 624 | | Income tax effect | | | (528 | ) | | | 2,163 | | | | (110 | ) | | | | | | | | | | | | | | Pension and other post-retirement adjustments, net | | | 1,344 | | | | (6,136 | ) | | | 514 | | | | | | | | | | | | | | | | | | | Other comprehensive income (loss), net of tax | | | (10,774 | ) | | | (24,321 | ) | | | 2,146 | | | | | | | | | | | | | | | | | | | Comprehensive income | | $ | 212,874 | | | $ | 259,792 | | | $ | 224,703 | | | | | | | | | | | | | | |
| | As of | | | | December 31, | | | December 31, | | | | 2018 | | | 2017 | | | | (In thousands, except per share and share data) | | ASSETS | | | | | | | | | Current assets: | | | | | | | | | Cash and cash equivalents | | $ | 904,176 | | | $ | 889,502 | | Accounts receivable (net of allowances of $1,027 and $1,700 at December 31, 2018 and December 31, 2017, respectively) | | | 473,433 | | | | 327,597 | | Prepaid income taxes | | | 19,273 | | | | 15,103 | | Prepaid and other assets | | | 38,207 | | | | 34,927 | | Total current assets | | | 1,435,089 | | | | 1,267,129 | | Property, equipment and leasehold improvements (net of accumulated depreciation and amortization of $185,505 and $171,280 at December 31, 2018 and December 31, 2017, respectively) | | | 90,877 | | | | 94,437 | | Goodwill | | | 1,545,761 | | | | 1,560,621 | | Intangible assets (net of accumulated amortization of $541,967 and $507,612 at December 31, 2018 and December 31, 2017, respectively) | | | 280,803 | | | | 321,836 | | Deferred tax assets | | | 14,903 | | | | 12,013 | | Other non-current assets | | | 20,519 | | | | 19,632 | | Total assets | | $ | 3,387,952 | | | $ | 3,275,668 | | | | | | | | | | | LIABILITIES AND SHAREHOLDERS' EQUITY | | | | | | | | | Current liabilities: | | | | | | | | | Accounts payable | | $ | 3,892 | | | $ | 1,612 | | Income taxes payable | | | 16,253 | | | | 14,828 | | Accrued compensation and related benefits | | | 137,045 | | | | 131,156 | | Other accrued liabilities | | | 113,841 | | | | 85,710 | | Deferred revenue | | | 537,977 | | | | 374,365 | | Total current liabilities | | | 809,008 | | | | 607,671 | | Long-term debt | | | 2,575,502 | | | | 2,078,093 | | Deferred tax liabilities | | | 82,008 | | | | 78,027 | | Other non-current liabilities | | | 87,928 | | | | 110,865 | | Total liabilities | | | 3,554,446 | | | | 2,874,656 | | | | | | | | | | | Commitments and Contingencies (see Note 5 and Note 9) | | | | | | | | | | | | | | | | | | Shareholders' equity (deficit): | | | | | | | | | Preferred Stock (par value $0.01, 100,000,000 shares authorized, no shares issued) | | | — | | | | — | | Common stock (par value $0.01; 750,000,000 common shares authorized; 130,029,926 and 129,543,856 common shares issued and 84,174,138 and 90,104,885 common shares outstanding at December 31, 2018 and December 31, 2017, respectively) | | | 1,300 | | | | 1,295 | | Treasury shares, at cost (45,855,788 and 39,438,971 common shares held at December 31, 2018 and December 31, 2017, respectively) | | | (3,272,774 | ) | | | (2,321,989 | ) | Additional paid in capital | | | 1,306,428 | | | | 1,264,849 | | Retained earnings | | | 1,856,951 | | | | 1,505,204 | | Accumulated other comprehensive loss | | | (58,399 | ) | | | (48,347 | ) | Total shareholders' equity (deficit) | | | (166,494 | ) | | | 401,012 | | Total liabilities and shareholders' equity (deficit) | | $ | 3,387,952 | | | $ | 3,275,668 | |
See Notes to Consolidated Financial Statements. F-4
MSCI INC. CONSOLIDATED STATEMENTS OF SHAREHOLDERS’ EQUITYINCOME | | | | | | | | | | | | | | | | | | | | | | | | | | | | Common
Stock | | | Treasury
Stock | | | Additional
Paid-in
Capital | | | Retained
Earnings | | | Accumulated
Other
Comprehensive
Income (Loss) | | | Total | | | | | (in thousands) | | Balance at December 31, 2012 | | $ | 1,240 | | | $ | (120,926 | ) | | $ | 1,000,014 | | | $ | 536,418 | | | $ | (2,796 | ) | | $ | 1,413,950 | | Net income | | | | | | | | | | | | | | | 222,557 | | | | | | | | 222,557 | | Other comprehensive income (loss), net of tax | | | | | | | | | | | | | | | | | | | 2,146 | | | | 2,146 | | Common stock issued | | | 8 | | | | | | | | | | | | | | | | | | | | 8 | | Compensation payable in common stock and options | | | | | | | | | | | 24,552 | | | | | | | | | | | | 24,552 | | Common stock repurchased and held in treasury | | | | | | | (147,183 | ) | | | 35,000 | | | | | | | | | | | | (112,183 | ) | Common stock issued to directors and held in treasury | | | | | | | (282 | ) | | | | | | | | | | | | | | | (282 | ) | Exercise of stock options | | | 8 | | | | | | | | 11,694 | | | | | | | | | | | | 11,702 | | Excess tax benefits from employee stock incentive plans | | | | | | | | | | | 1,897 | | | | | | | | | | | | 1,897 | | | | | | | | | | | | | | | | | | | | | | | | | | | | | | | | | | Balance at December 31, 2013 | | $ | 1,256 | | | $ | (268,391 | ) | | $ | 1,073,157 | | | $ | 758,975 | | | $ | (650 | ) | | $ | 1,564,347 | | Net income | | | | | | | | | | | | | | | 284,113 | | | | | | | | 284,113 | | Dividends | | | | | | | (4 | ) | | | | | | | (20,393 | ) | | | | | | | (20,397 | ) | Other comprehensive income (loss), net of tax | | | | | | | | | | | | | | | | | | | (24,321 | ) | | | (24,321 | ) | Common stock issued | | | 5 | | | | | | | | | | | | | | | | | | | | 5 | | Compensation payable in common stock and options | | | | | | | | | | | 26,553 | | | | | | | | | | | | 26,553 | | Common stock repurchased and held in treasury | | | | | | | (319,651 | ) | | | (90,000 | ) | | | | | | | | | | | (409,651 | ) | Common stock issued to directors and held in treasury | | | | | | | (332 | ) | | | | | | | | | | | | | | | (332 | ) | Exercise of stock options | | | 5 | | | | | | | | 9,676 | | | | | | | | | | | | 9,681 | | Excess tax benefits from employee stock incentive plans | | | | | | | | | | | 2,835 | | | | | | | | | | | | 2,835 | | | | | | | | | | | | | | | | | | | | | | | | | | | | | | | | | | Balance at December 31, 2014 | | $ | 1,266 | | | $ | (588,378 | ) | | $ | 1,022,221 | | | $ | 1,022,695 | | | $ | (24,971 | ) | | $ | 1,432,833 | | Net income | | | | | | | | | | | | | | | 223,648 | | | | | | | | 223,648 | | Dividends | | | | | | | | | | | 29 | | | | (87,881 | ) | | | | | | | (87,852 | ) | Other comprehensive income (loss), net of tax | | | | | | | | | | | | | | | | | | | (10,774 | ) | | | (10,774 | ) | Common stock issued | | | 6 | | | | | | | | | | | | | | | | | | | | 6 | | Compensation payable in common stock and options | | | | | | | | | | | 25,963 | | | | | | | | | | | | 25,963 | | Common stock repurchased and held in treasury | | | | | | | (806,782 | ) | | | 90,000 | | | | | | | | | | | | (716,782 | ) | Common stock issued to directors and held in treasury | | | | | | | (535 | ) | | | 29 | | | | | | | | | | | | (506 | ) | Exercise of stock options | | | 10 | | | | | | | | 19,688 | | | | | | | | | | | | 19,698 | | Excess tax benefits from employee stock incentive plans | | | | | | | | | | | 15,253 | | | | | | | | | | | | 15,253 | | | | | | | | | | | | | | | | | | | | | | | | | | | | | | | | | | Balance at December 31, 2015 | | $ | 1,282 | | | $ | (1,395,695 | ) | | $ | 1,173,183 | | | $ | 1,158,462 | | | $ | (35,745 | ) | | $ | 901,487 | | | | | | | | | | | | | | | | | | | | | | | | | | |
| | Years Ended | | | | December 31, | | | December 31, | | | December 31, | | | | 2018 | | | | 2017 | | | 2016 | | | | (In thousands, except per share data) | | Operating revenues | | $ | 1,433,984 | | | $ | 1,274,172 | | | $ | 1,150,669 | | Operating expenses: | | | | | | | | | | | | | Cost of revenues | | | 287,335 | | | | 273,681 | | | | 252,107 | | Selling and marketing | | | 192,923 | | | | 177,121 | | | | 166,666 | | Research and development | | | 81,411 | | | | 75,849 | | | | 75,204 | | General and administrative | | | 99,882 | | | | 87,764 | | | | 87,235 | | Amortization of intangible assets | | | 54,189 | | | | 44,547 | | | | 47,033 | | Depreciation and amortization of property, equipment and leasehold improvements | | | 31,346 | | | | 35,440 | | | | 34,320 | | Total operating expenses | | | 747,086 | | | | 694,402 | | | | 662,565 | | | | | | | | | | | | | | | Operating income | | | 686,898 | | | | 579,770 | | | | 488,104 | | | | | | | | | | | | | | | Interest income | | | (19,669 | ) | | | (6,314 | ) | | | (2,906 | ) | Interest expense | | | 133,114 | | | | 116,098 | | | | 101,651 | | Other expense (income) | | | (56,443 | ) | | | 3,087 | | | | 3,421 | | | | | | | | | | | | | | | Other expense (income), net | | | 57,002 | | | | 112,871 | | | | 102,166 | | | | | | | | | | | | | | | Income before provision for income taxes | | | 629,896 | | | | 466,899 | | | | 385,938 | | Provision for income taxes | | | 122,011 | | | | 162,927 | | | | 125,083 | | Net income | | $ | 507,885 | | | $ | 303,972 | | | $ | 260,855 | | | | | | | | | | | | | | | Earnings per basic common share | | $ | 5.83 | | | $ | 3.36 | | | $ | 2.72 | | | | | | | | | | | | | | | Earnings per diluted common share | | $ | 5.66 | | | $ | 3.31 | | | $ | 2.70 | | | | | | | | | | | | | | | Weighted average shares outstanding used in computing earnings per share: | | | | | | | | | | | | | Basic | | | 87,179 | | | | 90,336 | | | | 95,986 | | Diluted | | | 89,701 | | | | 91,914 | | | | 96,540 | | | | | | | | | | | | | | |
See Notes to Consolidated Financial Statements. F-5
MSCI INC. CONSOLIDATED STATEMENTS OF CASH FLOWSCOMPREHENSIVE INCOME | | | | | | | | | | | | | | | | Years Ended | | | | | December 31,
2015 | | | December 31,
2014 | | | December 31,
2013 | | | | | (in thousands) | | Cash flows from operating activities | | | | | | | | | | | | | Net income | | $ | 223,648 | | | $ | 284,113 | | | $ | 222,557 | | Adjustments to reconcile net income to net cash provided by operating activities: | | | | | | | | | | | | | Amortization of intangible assets | | | 46,910 | | | | 48,617 | | | | 58,203 | | Stock-based compensation expense | | | 28,558 | | | | 26,585 | | | | 25,004 | | Depreciation of property, equipment and leasehold improvements | | | 30,889 | | | | 25,930 | | | | 22,302 | | Amortization of debt origination fees | | | 2,135 | | | | 7,748 | | | | 3,348 | | Deferred taxes | | | (10,288 | ) | | | (4,960 | ) | | | (15,066 | ) | Amortization of discount on long-term debt | | | — | | | | 2,218 | | | | 1,066 | | Excess tax benefits from share-based compensation | | | (15,253 | ) | | | (2,835 | ) | | | (1,897 | ) | Gain on disposition of subsidiary, net of costs | | | — | | | | (84,620 | ) | | | — | | Other non-cash adjustments | | | (2,067 | ) | | | 1,847 | | | | (371 | ) | Changes in assets and liabilities, net of assets acquired and liabilities assumed: | | | | | | | | | | | | | Accounts receivable | | | (30,900 | ) | | | (26,821 | ) | | | (16,412 | ) | Prepaid income taxes | | | (1,972 | ) | | | (14,998 | ) | | | 7,927 | | Prepaid and other assets | | | (1,217 | ) | | | (9,857 | ) | | | (4,459 | ) | Accounts payable | | | (298 | ) | | | 2,128 | | | | (2,145 | ) | Deferred revenue | | | 8,047 | | | | 42,263 | | | | 11,399 | | Accrued compensation and related benefits | | | 5,087 | | | | 88 | | | | 7,057 | | Other accrued liabilities | | | 17,165 | | | | 8,428 | | | | (260 | ) | Other | | | 5,550 | | | | (201 | ) | | | 2,930 | | | | | | | | | | | | | | | | | | | Net cash provided by operating activities | | | 305,994 | | | | 305,673 | | | | 321,183 | | | | | | | | | | | | | | | | | | | Cash flows from investing activities | | | | | | | | | | | | | Acquisitions, net of cash acquired | | | (6,500 | ) | | | (14,921 | ) | | | (23,268 | ) | Proceeds from sales of investments | | | 6,736 | | | | — | | | | — | | Proceeds from redemption of short-term investments | | | — | | | | — | | | | 70,900 | | Dispositions, net of cash provided | | | — | | | | 362,811 | | | | — | | Capitalized software development costs | | | (8,500 | ) | | | (8,216 | ) | | | (3,285 | ) | Capital expenditures | | | (40,652 | ) | | | (42,659 | ) | | | (40,255 | ) | Proceeds from the sale of property, equipment and leasehold improvements | | | 55 | | | | 22 | | | | 29 | | | | | | | | | | | | | | | | | | | Net cash (used in) provided by investing activities | | | (48,861 | ) | | | 297,037 | | | | 4,121 | | | | | | | | | | | | | | | | | | | Cash flows from financing activities: | | | | | | | | | | | | | Proceeds from borrowing | | | 800,000 | | | | 800,000 | | | | — | | Repayment of long–term debt | | | — | | | | (810,000 | ) | | | (48,000 | ) | Payment of issuance costs in connection with long–term debt | | | (10,477 | ) | | | (14,800 | ) | | | — | | Repurchase of treasury shares | | | (700,715 | ) | | | (409,651 | ) | | | (112,183 | ) | Dividends paid | | | (87,743 | ) | | | (20,393 | ) | | | — | | Proceeds from the exercise of stock options | | | 3,631 | | | | 9,681 | | | | 11,702 | | Excess tax benefits from stock-based compensation | | | 15,253 | | | | 2,835 | | | | 1,897 | | | | | | | | | | | | | | | | | | | Net cash provided by (used in) financing activities | | | 19,949 | | | | (442,328 | ) | | | (146,584 | ) | | | | | | | | | | | | | | | | | | Effect of exchange rates changes | | | (8,175 | ) | | | (10,017 | ) | | | (3,595 | ) | | | | | | | | | | | | | | | | | | Net increase in cash and cash equivalents | | | 268,907 | | | | 150,365 | | | | 175,125 | | Cash and cash equivalents, beginning of period | | | 508,799 | | | | 358,434 | | | | 183,309 | | | | | | | | | | | | | | | | | | | Cash and cash equivalents, end of period | | $ | 777,706 | | | $ | 508,799 | | | $ | 358,434 | | | | | | | | | | | | | | | | | | | Supplemental disclosure of cash flow information: | | | | | | | | | | | | | Cash paid for interest | | $ | 42,110 | | | $ | 17,233 | | | $ | 20,429 | | | | | | | | | | | | | | | | | | | Cash paid for income taxes | | $ | 129,534 | | | $ | 120,419 | | | $ | 128,167 | | | | | | | | | | | | | | | | | | | Supplemental disclosure of non-cash investing activities: | | | | | | | | | | | | | | | | | Property, equipment and leasehold improvements in other accrued liabilities | | $ | 3,644 | | | $ | 6,731 | | | $ | 3,396 | | | | | | | | | | | | | | | | | | | Supplemental disclosure of non-cash financing activities: | | | | | | | | | | | | | | | | | Cash dividends declared, but not yet paid | | $ | 84 | | | $ | — | | | $ | — | | | | | | | | | | | | | | |
| | Years Ended | | | | December 31, | | | December 31, | | | December 31, | | | | 2018 | | | 2017 | | | 2016 | | | | (in thousands) | | Net income | | $ | 507,885 | | | $ | 303,972 | | | $ | 260,855 | | Other comprehensive income (loss): | | | | | | | | | | | | | | | | | | | | | | | | | | Foreign currency translation adjustments | | | (14,113 | ) | | | 13,358 | | | | (24,871 | ) | Income tax effect | | | — | | | | — | | | | (714 | ) | | | | | | | | | | | | | | Foreign currency translation adjustments, net | | | (14,113 | ) | | | 13,358 | | | | (25,585 | ) | | | | | | | | | | | | | | Pension and other post-retirement adjustments | | | 2,351 | | | | (525 | ) | | | 660 | | Income tax effect | | | (227 | ) | | | (445 | ) | | | (65 | ) | | | | | | | | | | | | | | Pension and other post-retirement adjustments, net | | | 2,124 | | | | (970 | ) | | | 595 | | | | | | | | | | | | | | | Net investment hedge adjustments | | | 1,937 | | | | — | | | | — | | Income tax effect | | | — | | | | — | | | | — | | | | | | | | | | | | | | | Net investment hedge adjustments, net | | | 1,937 | | | | — | | | | — | | | | | | | | | | | | | | | Other comprehensive (loss) income, net of tax | | | (10,052 | ) | | | 12,388 | | | | (24,990 | ) | | | | | | | | | | | | | | Comprehensive income | | $ | 497,833 | | | $ | 316,360 | | | $ | 235,865 | |
See Notes to Consolidated Financial Statements. F-6
MSCI INC. CONSOLIDATED STATEMENTS OF SHAREHOLDERS’ EQUITY (DEFICIT) | | | | | | | | | | | | | | | | | | Accumulated | | | | | | | | | | | | | | | | Additional | | | | | | | Other | | | | | | | | Common | | | Treasury | | | Paid-in | | | Retained | | | Comprehensive | | | | | | | | Stock | | | Stock | | | Capital | | | Earnings | | | Income (Loss) | | | Total | | | | (in thousands) | | Balance at December 31, 2015 | | $ | 1,282 | | | $ | (1,395,695 | ) | | $ | 1,173,183 | | | $ | 1,158,462 | | | $ | (35,745 | ) | | $ | 901,487 | | Net income | | | | | | | | | | | | | | | 260,855 | | | | | | | | 260,855 | | Dividends ($1.00 per common share) | | | | | | | | | | | 34 | | | | (97,093 | ) | | | | | | | (97,059 | ) | Other comprehensive income (loss), net of tax | | | | | | | | | | | | | | | | | | | (24,990 | ) | | | (24,990 | ) | Common stock issued | | | 5 | | | | | | | | | | | | | | | | | | | | 5 | | Compensation payable in common stock and options | | | | | | | | | | | 39,648 | | | | | | | | | | | | 39,648 | | Common stock repurchased and held in treasury | | | | | | | (774,565 | ) | | | | | | | | | | | | | | | (774,565 | ) | Common stock issued to directors and held in treasury | | | | | | | (479 | ) | | | 38 | | | | | | | | | | | | (441 | ) | Exercise of stock options | | | 3 | | | | | | | | 5,037 | | | | | | | | | | | | 5,040 | | Excess tax benefits from employee stock incentive plans | | | | | | | | | | | 7,625 | | | | | | | | | | | | 7,625 | | | | | | | | | | | | | | | | | | | | | | | | | | | Balance at December 31, 2016 | | $ | 1,290 | | | $ | (2,170,739 | ) | | $ | 1,225,565 | | | $ | 1,322,224 | | | $ | (60,735 | ) | | $ | 317,605 | | Net income | | | | | | | | | | | | | | | 303,972 | | | | | | | | 303,972 | | Dividends ($1.32 per common share) | | | | | | | | | | | 20 | | | | (120,992 | ) | | | | | | | (120,972 | ) | Other comprehensive income (loss), net of tax | | | | | | | | | | | | | | | | | | | 12,388 | | | | 12,388 | | Common stock issued | | | 4 | | | | | | | | | | | | | | | | | | | | 4 | | Compensation payable in common stock and options | | | | | | | | | | | 36,572 | | | | | | | | | | | | 36,572 | | Common stock repurchased and held in treasury | | | | | | | (150,461 | ) | | | | | | | | | | | | | | | (150,461 | ) | Common stock issued to directors and held in treasury | | | | | | | (789 | ) | | | 58 | | | | | | | | | | | | (731 | ) | Exercise of stock options | | | 1 | | | | | | | | 2,634 | | | | | | | | | | | | 2,635 | | Excess tax benefits from employee stock incentive plans | | | | | | | | | | | | | | | | | | | | | | | - | | | | | | | | | | | | | | | | | | | | | | | | | | | Balance at December 31, 2017 | | $ | 1,295 | | | $ | (2,321,989 | ) | | $ | 1,264,849 | | | $ | 1,505,204 | | | $ | (48,347 | ) | | $ | 401,012 | | Net income | | | | | | | | | | | | | | | 507,885 | | | | | | | | 507,885 | | ASC Topic 606 Retained Earnings Adjustment | | | | | | | | | | | | | | | 16,135 | | | | | | | | 16,135 | | Dividends ($1.92 per common share) | | | | | | | (77 | ) | | | 119 | | | | (172,273 | ) | | | | | | | (172,231 | ) | Other comprehensive income (loss), net of tax | | | | | | | | | | | | | | | | | | | (10,052 | ) | | | (10,052 | ) | Common stock issued | | | 5 | | | | | | | | | | | | | | | | | | | | 5 | | Compensation payable in common stock and options | | | | | | | | | | | 40,838 | | | | | | | | | | | | 40,838 | | Common stock repurchased and held in treasury | | | | | | | (949,888 | ) | | | | | | | | | | | | | | | (949,888 | ) | Common stock issued to directors and held in treasury | | | | | | | (820 | ) | | | 17 | | | | | | | | | | | | (803 | ) | Exercise of stock options | | | | | | | | | | | 605 | | | | | | | | | | | | 605 | | | | | | | | | | | | | | | | | | | | | | | | | | | Balance at December 31, 2018 | | $ | 1,300 | | | $ | (3,272,774 | ) | | $ | 1,306,428 | | | $ | 1,856,951 | | | $ | (58,399 | ) | | $ | (166,494 | ) |
See Notes to Consolidated Financial Statements. F-7
MSCI INC. CONSOLIDATED STATEMENTS OF CASH FLOWS | | Years Ended | | | | December 31, | | | December 31, | | | December 31, | | | | 2018 | | | 2017 | | | 2016 | | | | (in thousands) | | Cash flows from operating activities | | | | | | | | | | | | | Net income | | $ | 507,885 | | | $ | 303,972 | | | $ | 260,855 | | Adjustments to reconcile net income to net cash provided by operating activities: | | | | | | | | | | | | | Amortization of intangible assets | | | 54,189 | | | | 44,547 | | | | 47,033 | | Stock-based compensation expense | | | 38,897 | | | | 36,576 | | | | 32,001 | | Depreciation and amortization of property, equipment and leasehold improvements | | | 31,346 | | | | 35,440 | | | | 34,320 | | Amortization of debt origination fees | | | 3,715 | | | | 3,396 | | | | 3,068 | | Deferred taxes | | | (780 | ) | | | (18,902 | ) | | | (16,967 | ) | Gain on divestitures, net of costs | | | (61,402 | ) | | | — | | | | (449 | ) | Other non-cash adjustments | | | (188 | ) | | | 704 | | | | 1,192 | | Changes in assets and liabilities, net of the effect of acquisitions and dispositions: | | | | | | | | | | | | | Accounts receivable | | | (153,942 | ) | | | (105,593 | ) | | | (18,494 | ) | Prepaid income taxes | | | (4,069 | ) | | | (3,069 | ) | | | 41,332 | | Prepaid and other assets | | | (2,015 | ) | | | (4,470 | ) | | | 624 | | Accounts payable | | | 2,300 | | | | 1,027 | | | | (1,912 | ) | Accrued compensation and related benefits | | | 8,532 | | | | 8,659 | | | | 13,089 | | Income taxes payable | | | (2,890 | ) | | | — | | | | — | | Other accrued liabilities | | | 29,096 | | | | 15,933 | | | | 19,741 | | Deferred revenue | | | 185,077 | | | | 38,555 | | | | 21,809 | | Other | | | (22,989 | ) | | | 47,383 | | (1) | | 5,121 | | Net cash provided by operating activities | | | 612,762 | | | | 404,158 | | | | 442,363 | | | | | | | | | | | | | | | Cash flows from investing activities | | | | | | | | | | | | | Proceeds from sales of investments | | | — | | | | 771 | | | | — | | Proceeds from divestitures | | | 83,825 | | | | — | | | | 657 | | Proceeds from the sale of capital equipment | | | 10 | | | | — | | | | — | | Capital expenditures | | | (30,257 | ) | | | (33,177 | ) | | | (32,284 | ) | Capitalized software development costs | | | (18,704 | ) | | | (15,640 | ) | | | (10,344 | ) | Acquisitions, net of cash acquired | | | — | | | | — | | | | (60 | ) | Net cash provided by (used in) investing activities | | | 34,874 | | | | (48,046 | ) | | | (42,031 | ) | | | | | | | | | | | | | | Cash flows from financing activities | | | | | | | | | | | | | Proceeds from borrowing | | | 500,000 | | | | — | | | | 500,000 | | Proceeds from exercise of stock options | | | 605 | | | | 2,635 | | | | 5,040 | | Repurchase of common stock held in treasury | | | (949,888 | ) | | | (150,461 | ) | | | (774,565 | ) | Payment of dividends | | | (170,938 | ) | | | (119,717 | ) | | | (96,191 | ) | Payment of debt issuance costs in connection with debt | | | (6,262 | ) | | | - | | | | (7,183 | ) | Net cash used in financing activities | | | (626,483 | ) | | | (267,543 | ) | | | (372,899 | ) | | | | | | | | | | | | | | Effect of exchange rate changes | | | (6,479 | ) | | | 9,099 | | | | (13,305 | ) | | | | | | | | | | | | | | Net increase in cash | | | 14,674 | | | | 97,668 | | | | 14,128 | | Cash and cash equivalents, beginning of period | | | 889,502 | | | | 791,834 | | | | 777,706 | | Cash and cash equivalents, end of period | | $ | 904,176 | | | $ | 889,502 | | | $ | 791,834 | | | | | | | | | | | | | | | Supplemental disclosure of cash flow information: | | | | | | | | | | | | | Cash paid for interest | | $ | 125,986 | | | $ | 112,502 | | | $ | 89,139 | | Cash paid for income taxes | | $ | 143,215 | | | $ | 128,727 | | | $ | 97,845 | | Supplemental disclosure of non-cash investing activities | | | | | | | | | | | | | Property, equipment and leasehold improvements in other accrued liabilities | | $ | 2,999 | | | $ | 4,588 | | | $ | 4,422 | | Supplemental disclosure of non-cash financing activities | | | | | | | | | | | | | Cash dividends declared, but not yet paid | | $ | 862 | | | $ | 1,197 | | | $ | 830 | | | | | | | | | | | | | | | (1) Includes $43.6 million accrual for amounts payable after December 31, 2018 related to the estimated one-time tax charge on the deemed repatriation of historic earnings and profits of foreign subsidiaries. See Note 11, “Income Taxes,” for additional information. | |
See Notes to Consolidated Financial Statements. F-8
MSCI INC. NOTES TO CONSOLIDATED FINANCIAL STATEMENTS 1. INTRODUCTION AND BASIS OF PRESENTATION Organization MSCI Inc., together with its wholly-owned subsidiaries (the “Company” or “MSCI”), offers provides mission critical investment decision support tools and services. MSCI is dynamic and flexible in the delivery of content applications and services to support the needs of institutional investors throughout their investment processes. The Company’s flagship products are its global equity indexes, custom indexes, factor indexescapabilities, such as indexes; portfolio construction tools and ESG indexes; its analytics products, including multi-factor models, pricing models, methodologies for performance attribution, models for statistical analysis,risk-management services; environmental, social and tools for portfolio optimization, back testing and stress testing; its ESGgovernance (“ESG”) research and ratings; and its real estate benchmarks, indexes, business intelligencereturn analytics services and analytics. On March 17, 2014, MSCI Inc. entered into a definitive agreement to sell Institutional Shareholder Services Inc. (“ISS”). As a result, the Company reported the operating resultsmarket insights; much of ISS in “Income (loss) from discontinued operations, net of income taxes” in the Consolidated Statements of Income for the years ended December 31, 2015, 2014which can be accessed by clients through multiple channels and 2013. Unless otherwise indicated, the disclosures accompanying these consolidated financial statements reflect the Company’s continuing operations. The Company completed the sale of ISS on April 30, 2014. See Note 3, “Dispositions and Discontinued Operations,” for further details.
Following the disposition of ISS during the year ended December 31, 2014, MSCI had maintained one reportable segment. During the year ended December 31, 2015, MSCI changed its reportable segments to Index, Analytics and All Other. These three segments reflect certain changes made to the management of the Company’s product lines. This presentation also better aligns the Company’s financial reporting with how its products and services are offered to its clients and offers additional insight into how the Company is being managed. See Note 13, “Segment Information,” for further information about MSCI’s reportable segments.platforms.
Basis of Presentation The consolidated financial statements include the accounts of MSCI Inc. and its wholly-owned subsidiaries. The Company’s policy is to consolidate all entities in which it owns more than 50% of the outstanding voting stock unless it does not control the entity. It is also the Company’s policy to consolidate any variable interest entity for which the Company is the primary beneficiary, of which the Company has none, as required by the Financial Accounting Standards Board’s (“FASB”) Accounting Standards Codification (“ASC”) Subtopic 810-10, “810-10,Consolidations.” “Consolidations.” For investments in any entities in whichAs of December 31, 2018, the Company owns 20%had no such variable interest entities or less of the outstanding voting stock and significant influence does not exist, such investments are carried at cost.investments. The Company changed its presentation ofCompany’s operating expenses during the year ended December 31, 2015 in order to provide more transparency into the underlying cost base of the Company, consistent with how it is managed. Prior to the change, operating expenses were grouped and presented as cost of services and selling, general and administrative. Cost of services included costs related to research, data management and production, software engineering and production management functions. Selling, general and administrative consisted of expenses for sales and marketing staff, finance, human resources, legal and compliance, information technology infrastructure and corporate administration personnel. Operating expenses are now grouped and presented in the following activity categories: cost of revenues, selling and marketing, research and development and general and administrative. Costs are assigned to these activity categories based on the nature of the expense to which they directly relate, or, when not directly attributable, an estimate is allocated based on an allocation method that considers the type of effort involved.related to such activities. Cost of revenues consists of costs related to the production and servicing of the Company’s products and services and primarily includeincludes related information technology costs, associated with the production and delivery of its products and services, including data center, platform and infrastructure costs; costs to acquire, produce and maintain market data information; costs of research to support maintain and rebalancemaintain existing products; costs of MSCI INC.
NOTES TO CONSOLIDATED FINANCIAL STATEMENTS
product management teams; costs of client service and consultant teams to support customer needs; as well as other support costs directly attributable to the cost of revenues including certain human resources, finance and legal costs. Selling and marketing expenses consist of costs associated with acquiring new clients or selling new products or product renewals to existing clients and primarily includes the costs of ourMSCI’s sales force and marketing teams as well as costs incurred in other groups associated with acquiring new business, including product management, research, technology and sales operations. Research and development expenses consist of costs to develop new or enhance existing products and the costs to develop new or improved technology and service platforms for the delivery of ourMSCI’s products and services and primarily includes the costs of application development, research, product management, project management and the technology support associated with supporting these efforts. General and administrative expenses consist of costs primarily related to finance operations, human resources, office of the CEO, legal, corporate technology, corporate development and certain other administrative costs that are not directly attributed, but are instead allocated, to a product or service. The recasting of previously issued financial information hasCertain prior period amounts have been madereclassified to conform to the current presentation and does not represent a restatement of previously issued financial statements.period presentation.
Significant Accounting Policies Basis of Financial Statements and Use of Estimates The Company’s consolidated financial statements are prepared in accordance with accounting principles generally accepted in the United States of America (“GAAP”). These accounting principles require the Company to F-9
make certain estimates and judgments that can affect the reported amounts of assets and liabilities as of the date of the consolidated financial statements, as well as the reported amounts of revenue and expenses during the periods presented. Significant estimates and assumptions made by management include the deferral and recognition of revenue, research and development and software capitalization, the allowance for doubtful accounts, impairment of long-lived assets, accrued compensation, income taxes and other matters that affect the consolidated financial statements and related disclosures. The Company believes that estimates used in the preparation of these consolidated financial statements are reasonable; however, actual results could differ materially from these estimates. Inter-company balances and transactions are eliminated in consolidation. Revenue Recognition In general,MSCI adopted the new revenue standard set forth under Accounting Standards Codification Topic 606 “Revenue from Contracts with Customers,” or ASC Topic 606, as of January 1, 2018 using the Modified Retrospective Approach and as such, applied the new revenue standard only to contracts that were not completed at the January 1, 2018 adoption date and did not adjust prior reporting periods. An adjustment was recorded within the Consolidated Statement of Financial Condition as of January 1, 2018. The adoption resulted in more revenue being recognized upfront or earlier in the life of new client contracts for certain of the Company’s products and services, including fees related to the licensing of certain desktop applications as they relate to the energy and commodity analytics products, implementation services as they relate to Analytics products and services and the Company’s hosted applications and set-up fees as they relate to the Company’s custom index products. The new revenue standard also has the impact of ratably allocating revenue recognition as it relates to multi-year deals. The adoption of the standard also resulted in higher accounts receivable and deferred revenue balances. Under the old revenue standard, MSCI generally recorded the value of an invoice to accounts receivable and deferred revenue once the service period began. Under the new revenue standard, MSCI records accounts receivable and a corresponding offset to deferred revenue when an invoice is issued. See Note 3, “Revenue Recognition,” for further discussion of the impact of the change upon adoption of ASC Topic 606.
Performance Obligations and Transaction Price For revenue arrangements containing multiple products or services, the Company applies SEC Staff Accounting Bulletin No. 104accounts for the individual products or services as a separate performance obligation if they are distinct, the product or service is separately identifiable from other items in the arrangement, and if a client can benefit from it on its own or with other resources that are readily available to the client. If these criteria are not met, the promised products or services are accounted for as a combined performance obligation. The Company allocates the transaction price to each performance obligation based on the best estimate of the relative standalone selling price of each distinct product or service in the contract. The transaction price in the contract is allocated at contract inception to the distinct product or service underlying each performance obligation in proportion to the standalone selling prices. This standalone selling price may be the contract price, but is more often than not the best estimate of the price the Company would receive for selling the product or service to other similar customers. Discounts applied to the contract will be allocated based on the same proportion of standalone selling prices. For services where the transaction price is variable based upon assets under management (“SAB 104”AUM”), “volume of trades or number of investments linked to MSCI’s indexes, the transaction price is based upon pricing models and is not allocated at the inception of the contract but rather falls within the sales and usage-based royalty exception under which the price and associated revenue are based upon actual known performance or best estimates of actual performance during the performance period. Revenue Recognition,”is recognized when a customer obtains control of promised products or services in determiningan amount that reflects the consideration the entity expects to receive in exchange for those products or services. Revenue is recognized exclusive of any applicable sales or other indirect taxes. Determining when control has transferred can sometimes require management’s judgement (e.g., implementation services), which could affect the timing of revenue recognition. Accordingly, the Company recognizes revenue when all the following criteria are met: The Company has persuasive evidencedetermined that the above methods provide a faithful depiction of a legally binding arrangement, Delivery has occurred,
Client fee is deemed fixedthe transfer of control of products or determinable, and
Collection is probable.
MSCI INC.
NOTES TO CONSOLIDATED FINANCIAL STATEMENTSservices to the customer.
When a sales arrangement requires
F-10
Disaggregation of Revenue Our revenues are characterized by type, which broadly reflects the deliverynature of more than one producthow they are recognized or earned. Our revenue types are recurring subscription, asset-based fees and service, revenue is recognized pursuant to the requirements of ASC Subtopic 605-25, “Revenue Arrangements with Multiple Deliverables.” Under the provisions of ASC Subtopic 605-25, elements within a multi-deliverable arrangement should be considered separate units of accounting if both of the following criteria are met:non-recurring revenues. We also group our revenues by segment. Revenues By Type The delivered items have value to the client on a standalone basis, which means they can be sold separately by any vendor or the client could resell the delivered items on a standalone basis; and
If the arrangement includes a general right of return relative to the delivered items, delivery or performance of the undelivered items is considered probable and substantially in the control of the vendor.
The Company has signed contracts with substantially all clients that set forth the fees to be paid for its products and services. Further, the Company regularly assesses the receivable balances for each client for collectability. The Company’s application service license arrangements generally do not include acceptance provisions, which generally allow a client to test the solution for a defined period of time before committing to the license. If a license agreement includes an acceptance provision, the Company does not recognizeRecurring subscription revenues until the earlier of the receipt of a written client acceptancerepresent fees earned from clients primarily under renewable contracts or if not notified by the client that it is cancelling the license agreement, the expiration of the acceptance period.
The Company’s subscription agreements for hosted services include provisions that, among other things, allow clients, for no additional fee, to receive updates and modifications that may be made from time to time whenare generally paid annually or quarterly in advance and if available, for the term of the agreement, which is typically one year. These arrangements do not provide the client with the right to take possession of the application at any time. For sales arrangements with multiple deliverables, which may include application service subscription and professional services associated with implementation and other services, the Company evaluates each deliverablerecognized in these multiple-element arrangements to determine whether it represents a separate unit of accounting and allocates revenue accordingly, based on the Company’s best estimated sales price.
In most cases the Company recognizes revenues from subscription arrangements ratably over the term of the license agreementor service pursuant to the contract terms. The contracts state the terms under which these fees are to be calculated. The fees are recognized as the Company supplies the product and service to the client over the license period and are generally billed in advance, prior to the license start date. When implementation services are included, the Company recognizes revenues allocated to the subscription ratably from the date the application is put into production to the end of the license period. Revenues associated with implementation services are recognized ratably over the useful life of those services from the date the application is put into production. For products and services whose fees are based on estimated assets under management linked to the Company’s indexes, or contract values related to futures and options, the Company recognizes revenues based on estimates from independent third-party sources or the most recently reported information from the client. Revenues from subscription agreements for the receipt of periodic benchmark reports, digests and other publications, which are most often associated with the Company’sour real estate operating segment,offerings, are generally billed and recognized upon delivery of such reports or data updates.
The Company’s software-related arrangementsAsset-based fees are principally recognized based on the estimated AUM linked to our indexes from independent third-party sources or the most recently reported information provided by the client. Asset-based fees also include revenues related to futures and options contracts linked to our indexes, which are primarily based on trading volumes. Asset-based fees are generally variable based upon AUM or the volume of trades and are generally billed quarterly in arrears.
Non-recurring revenues primarily represent fees earned on products and services where we do not require significant modification or customization of any underlying software applications being licensed. Accordingly, the Company recognizes softwarehave renewal contracts and primarily include revenues pursuant to the requirements of ASC Subtopic 985-605, “Software-Revenue Recognition.” The Company’s subscription agreements for softwareproviding customized reports, historical data sets, certain derivative financial products include provisions that, among other things, would allow clients to receive unspecified, when and if available, software upgrades for no additional feecertain implementation and consulting services, as well as revenues from particular products and services that are purchased on a non-renewal basis. Based on the right to use the software products with maintenance and technical support for the termnature of the agreement, whichservices provided, non-recurring revenues are generally billed upon delivery and recognized upon delivery or over the service period. Revenues By Segment For products within the Index segment, with respect to index data subscriptions, MSCI’s performance obligation to deliver the data is typically one MSCI INC.
NOTES TO CONSOLIDATED FINANCIAL STATEMENTS
year. Software agreements may include other consultingsatisfied over time and, professional services. In accordance with ASC Subtopic 985-605, “Software Revenue Recognition,” the Company does not have vendor specific objective evidence (“VSOE”) for these elements and therefore begins to recognize software relatedaccordingly, revenue is recognized ratably over the term of the license agreement pursuant to the contract terms. With respect to licenses to create index-linked investment products, such as ETFs, passively managed funds, or licenses which allow certain exchanges to use MSCI’s indexes as the basis for futures and options contracts, MSCI’s performance obligation allows customers to use the Company’s intellectual property (e.g., the indexes) as the basis of the funds or other investment products the customers create over the term of the agreement. The fees earned for these rights are typically variable, in which case they are accrued under the sales and usage-based royalty exception pursuant to the level of performance achieved, which is measured based on AUM, volume of trades or other factors. The level of performance achieved is based on information obtained from independent third-party sources or best estimates taking into account the most recently reported information from the client.
For products within the Analytics segment, MSCI’s performance obligations include providing access to its proprietary models or hosted applications and, in some cases, delivery of managed services, which are all satisfied over time, and accordingly, revenue is recognized ratably over the term of the service period. For implementation services, MSCI meets its performance obligation once delivered.the implementation service is complete and the related service is available for the client to use and revenue is recognized at the point in time when the implementation service is completed. For products within the All Other segment, MSCI’s performance obligations under its ESG products are satisfied over time for the majority of the data subscriptions as MSCI provides and updates the data to the customer throughout the term of the agreement and revenue is recognized ratably over the term of the agreement. For custom ESG research data, the performance obligation is complete, and revenue is recognized, at the point in time that the data is updated and available to the customer. MSCI’s Real Estate products primarily include periodic benchmark reports, Market Information and other publications. MSCI primarily satisfies its performance obligations, and revenue is recognized, at the point in time when the Company delivers reports or publications. For Market Information products, publications are delivered throughout the year, and the revenue is recognized over time. Share-Based Compensation Certain of the Company’s employees have received share-based compensation under certainvarious compensation programs. The Company’s compensation expense reflects the fair value method of accounting for share-based payments under ASC Subtopic 718-10, “Compensation—Stock Compensation.” ASC Subtopic 718-10 requires F-11
measurement of compensation cost for equity-based awards at fair value and recognition of compensation cost over the service period, net of estimated forfeitures. The fair value of MSCI restricted stock units (“RSUs”) is measured using the closing price of MSCI’s common stock on the date prior to grant. Restricted stock units subject to performance conditions that are not linked to a market condition (“PSUs”) are based on performance measures that impact the amount of shares that each recipient will receive upon vesting. The fair value of PSUs is measured using the closing price of MSCI’s common stock on the date prior to grant. Restricted stock units that are subject to the achievement of multi-year total shareholder return targets (“MSUs”) are performance awards with a market condition. The fair value of MSUs is determined using a Monte Carlo simulation model that creates a normal distribution of future stock prices, which is then used to value the awards based on their individual terms. The fair value of MSCI standard stock options is determined using the Black-Scholes valuation model and the single grant life method. Under the single grant life method, option awards with graded vesting are valued using a single weighted-average expected option life. The fair value of MSCI stock options that contain stock price contingencies is determined using a Monte Carlo simulation model. The Company recognizes the expense for an award granted to an employee who is not retirement-eligible utilizing the graded vesting method over the requisite service period. For all awards, the Company bases initial accruals of compensation cost on the estimated number of units for which the requisite service is expected to be rendered and, for PSUs, the performance targets expected to be achieved is also considered. If the estimated number of units or the number of units ultimately delivered changes from previous estimates, the cumulative effect on current and prior periods of a change is recognized in compensation cost in the period of the change. Because the probability of actual shares expected to be earned is reflected in the fair value of MSUs on the grant date, the expense to be recognized for these awards is not adjusted to reflect the actual shares earned. Based on interpretive guidance related to share-based compensation, the Company’s policy is to accrue the estimated cost of share-based awards that are granted to retirement-eligible employees over the course of the prior year in which they were earned rather than expensing the awards on the date of grant. A portion of the awards granted to retirement-eligible employees consistconsisted of PSUs. For those PSUs, the Company bases initial accruals of compensation cost on the estimated number of units for which the requisite service is expected to be rendered. If the estimated number of units expected to convert changes from previous estimates based on the performance targets expected to be achieved, the cumulative effect of a change is recognized in compensation cost in the period of the change. Research and Development The Company accounts for research and development costs in accordance with several accounting pronouncements, including ASC Subtopic 730-10, “Research and Development.” ASC Subtopic 730-10 requires that research and development costs generally be expensed as incurred. The majority of the Company’s research MSCI INC.
NOTES TO CONSOLIDATED FINANCIAL STATEMENTS
and development costs are incurred in developing, reviewing and enhancing the methodologies and data models offered within its product portfolio by monitoring investment trends and drivers globally, as well as analyzing product-specific needs in areas such as capitalization-weighted, factor and specialized indexes, and instrument valuation, risk modeling, portfolio construction, asset allocation and value-at-risk simulation. The Company applies the provisions of ASC Subtopic 350-40, “Internal Use Software,” and accounts for the cost of computer software developed for internal use by capitalizing qualifying costs, which are substantially incurred during the application development stage. The amounts capitalized are included in Intangible Assets on the Consolidated Statement of Financial Condition and include external direct costs of services used in developing internal-use software and payroll and payroll-related costs of employees directly associated with the development activities. Additionally, costs incurred relating to upgrades and enhancements to the software are capitalized if it is determined that these upgrades or enhancements provide additional functionality to the software. ForDuring the yearyears ended December 31, 2015,2018 and 2017, the Company capitalized $8.6$18.7 million and $15.6 million, respectively, of costs related to software developed for internal use and reversed $3.4 million of previously capitalized costs associated with the termination of a technology project in the Analytics segment. As a result, $5.2 million was the net amount capitalized in the Consolidated Statement of Financial Condition for the year ended December 31, 2015.Condition.
For the year ended December 31, 2014, the Company capitalized $8.3 million of costs related to software developed for internal use and reversed $1.0 million of previously capitalized costs associated with the termination of a technology project in the Analytics segment. As a result, $7.3 million was the net amount capitalized in the Consolidated Statement of Financial Condition for the year ended December 31, 2014.F-12
Capitalized software development costs are amortized on a straight-line basis over the estimated useful life of the related product, which is typically three to five years, beginning with the date the software is placed into service. Costs incurred in the preliminary and post-implementation stages of ourMSCI’s products are expensed as incurred. Income Taxes Income tax expenseProvision for income taxes is provided for using the asset and liability method, under which deferred tax assets and deferred tax liabilities are determined based on the temporary differences between the financial statement and income tax bases of assets and liabilities using currently enacted tax rates. The Company elects to account for Global Intangible Low-Taxed Income (“GILTI”) in the year the tax is incurred. The Company recognizes interest and penalties related to income tax matters within “Provision for income taxes” in the Consolidated Statement of Income.
The Company regularly evaluates the likelihood of additional assessments in each of the taxing jurisdictions in which it is required to file income tax returns. The Company has recorded additional tax expense related to open tax years, which the Company’s management believes is adequate in relation to the potential for assessments. These amounts have been recorded in “Other non-current liabilities” on the Consolidated Statement of Financial Condition. The Company’s management believes the resolution of tax matters will not have a material effect on the Company’s consolidated financial condition. However, to the extent the Company is required to pay amounts in excess of its reserves, a resolution could have a material impact on its Consolidated Statement of Income for a particular future period. In addition, an unfavorable tax settlement could require use of cash and result in an increase in the effective tax rate in the period in which such resolution occurs. As of December 31, 2015, the Company elected to change its policy prospectively regarding the classification of deferred tax assets and liabilities and related valuation allowance on the Company’s Consolidated Statements of Financial Condition. To comply with the amendments in ASU 2015-17 (see Note 2, “Recent Accounting Standards Updates” for further information), the Company will classify all deferred tax assets and liabilities as noncurrent. Prior periods were not retrospectively adjusted for the change in accounting principle.
MSCI INC.
NOTES TO CONSOLIDATED FINANCIAL STATEMENTS
Deferred Revenue Deferred revenues represent both cash received and/or the amounts billed to customers for products and services in advance of delivery. services being provided and before the service period has begun. Deferred revenue is generally amortized ratably over the service period as the performance obligations are satisfied. Accounts Receivable The Company’s clients generally pay subscription fees annually or quarterly in advance. DeferredMSCI’s policy is to record to a receivable when a customer is billed. For products and services that are provided in advance of billing, such as for our asset-based fee products, unbilled revenue (or a “contract asset”) is generally amortized ratably overincluded in Accounts Receivable on the service period as revenue recognition criteria are met. Where the service period has not begun and the client has not paid or the contract has not been renewed, deferred revenues and accounts receivable are not recognized.Company’s Consolidated Statement of Financial Condition. Goodwill Goodwill is recorded as part of the Company’s acquisitions of businesses when the purchase price exceeds the fair value of the net tangible and separately identifiable intangible assets acquired. The Company’s goodwill is not amortized, but rather is subject to an impairment test each year, or more often if conditions indicate impairment may have occurred, pursuant to ASC Topic 350,Subtopic 350-10, “Intangibles—Goodwill and Other.” The Company tests goodwill for impairment on an annual basis on July 1 and on an interim basis when certain events and circumstances exist. The testing for impairment is performed at the reporting unit level. Goodwill impairment is determined by comparing the estimated fair value of a reporting unit with its respective bookcarrying value. If the estimated fair value exceeds the bookcarrying value, goodwill at the reporting unit level is not deemed to be impaired. If the estimated fair value is below bookcarrying value, however, further analysis is required to determine the amount of impairment. Additionally,impairment, if any. If necessary, an impairment charge will be recorded up to, but not more than, the book valuetotal amount of goodwill allocated to the reporting unit. The Company completed its annual goodwill impairment test as of July 1, 2018 on its four reporting units, which are the same as its four operating segments. The Company performed a reporting unit isstep zero, or a negative valuequalitative impairment test on each of its operating segments and it is determined that it iswas more likely than not that the goodwill is impaired, further analysis is required. fair value for each operating segment was not less than the carrying value for each. F-13
As the estimated fair value of the Company’s reporting units exceeded their respective bookcarrying value on the testing dates, no impairment of goodwill was recorded during the years ended December 31, 2015, 20142018, 2017 and 2013.2016. The Company changed its reportable segments during the year ended December 31, 2015. Simultaneously, segment reporting and goodwill reporting units were updated in connection with this change. The Company reallocated its goodwill to its reporting units using a relative fair value allocation approach in accordance with applicable accounting guidance. The Company’s reporting units are the same as its operating segments. See Note 13, “Segment Information” for further information about MSCI’s operating segments.
Intangible Assets The Company amortizes definite-lived intangible assets over their estimated useful lives. Definite-lived intangible assets are testedreviewed for impairment when impairment indicators are present, and,whenever events or changes in circumstances indicate that the carrying value of the asset may not be recoverable. The Company also reviews the useful lives on a quarterly basis to determine if impaired, written down tothe period of economic benefit has changed. If the carrying value of an intangible asset exceeds its fair value, based on either discounted cash flows or appraised values. Noan impairment of intangible assets has been identified during anycharge would be recognized in an amount equal to the amount by which the carrying value of the periods presented. intangible asset exceeds its fair value. During the year ended December 31, 2018, management decided to discontinue the use of the IPD tradename utilized by the Real Estate segment and has rebranded the segment to MSCI Real Estate. As a result, the remaining unamortized value of $7.9 million was written off. The Company hashad no indefinite-lived intangibles. The intangible assets have remaining useful lives ranging from one to 20 years.assets. Foreign Currency Translation Assets and liabilities of operations having non-U.S. dollar functional currencies are translated at year-end exchange rates, and income statement accounts are translated at weighted average exchange rates for the year. Gains or losses resulting from translating foreign currency financial statements, net of any related tax effects, are reflected in accumulated other comprehensive loss, a separate component of shareholders’ equity.equity (deficit). Gains or losses resulting from foreign currency transactions incurred in currencies other than the local functional currency are included in non-operating “Other expense (income)” on the Consolidated Statement of Income. Derivative Instruments The Company applies ASC Subtopic 815-10, “Derivatives and Hedging,,” which establishes accounting and reporting standards for derivative instruments and hedging activities. The Company may use interest rate swaps MSCI INC.
NOTES TO CONSOLIDATED FINANCIAL STATEMENTS
and forward contracts on foreign currency to manage risks generally associated with interest rate and foreign exchange rate fluctuations, respectively. The Company’s derivative financial instruments are used as risk management tools and not for speculative or trading purposes. For derivative instruments that are designated and qualify as hedging instruments for accounting purposes, the Company documents and links the relationships between the hedging instruments and hedged items. The Company also assesses and documents at the hedge’s inception whether the derivatives used in hedging transactions were effective in offsetting changes in fair values associated with the hedged items. ASC Subtopic 815-10 provides that, for derivative instruments that qualify for hedge accounting being used to hedge cash flows, changes in the fair value are recognized in accumulated other comprehensive income (loss), a separate component of shareholders’ equity, until the hedged item is recognized in earnings. In addition, the ineffective portion of a derivative’s change in fair value is immediately recognized in earnings. The Company manages foreign currency exchange rate risk through the use of derivative financial instruments comprised principally of forward contracts on foreign currency which are not designated as hedging instruments for accounting purposes. The objective of the derivative instruments is to minimize the income statement impact associated with assets and liabilities that are denominated in certain foreign currencies. Derivative instruments that do not qualify for hedge accounting are carried at fair value on the Consolidated Statement of Financial Condition with gains and losses recorded in the Consolidated Statement of Income in the period in which they are realized. Property, Equipment and Leasehold Improvements Property, equipment and leasehold improvements are stated at cost less accumulated depreciation and amortization. Depreciation of furniture and fixtures, and computer and communications equipment and leasehold improvements are amortized using the straight-line method over the estimated useful life of the asset. Estimates of useful lives are as follows: furniture & fixtures – seven years; and, computer and related equipment – two to five years. Leasehold improvements are amortized on a straight-line basis over one to 21 years, which represents the lesser of the estimated useful life of the asset or, where applicable, the remaining term of the lease. F-14
Treasury Stock The Company holds repurchased shares of common stock as treasury stock. The Company accounts for treasury stock under the cost method and includes treasury stock as a component of shareholders’ equity.equity (deficit). In accordance with ASC Subtopic 505-10,“Equity,” the Company accounts for the capped accelerated share repurchase (“ASR”) agreements into which it enters as two separate transactions: (a) as shares of common stock acquired in a treasury stock transaction recorded on the acquisition date of the shares and (b) as a forward contract indexed to the Company’s own common stock. As such, the Company accounts for the shares that it receives under capped ASR agreements during the period as a repurchase of its common stock for the purpose of calculating earnings per common share. The Company has determined that the forward contracts indexed to the Company’s common stock meet all the applicable criteria for equity classification in accordance with ASC Subtopic 815-10 and, therefore, the capped ASR agreements are not accounted for as derivative instruments.
Allowance for Doubtful Accounts The Company primarily licenses its products and services to institutional investors mainly in the United States, Europe and Asia (primarily Hong Kong and Japan). The Company periodically reviews receivable balances and maintains an allowance on customer accounts where estimated losses may result from the inability of its customers to make required payments. The Company does not require collateral.
MSCI INC.
NOTES TO CONSOLIDATED FINANCIAL STATEMENTS
An allowance for doubtful accounts is recorded when it is probable and estimable that a receivable will not be collected. Changes in the allowance for doubtful accounts from December 31, 20122015 to December 31, 20152018 were as follows: | | | | Amount | | | | | Amount | | | (in thousands) | | | | | (in thousands) | | | Balance as of December 31, 2012 | | $ | 964 | | | Balance as of December 31, 2015 | | | $ | 1,117 | | Addition to provision | | | 876 | | | | 1,011 | | Amounts written off, net of recoveries | | | (560 | ) | | | (1,093 | ) | | | | | | Balance as of December 31, 2013 | | $ | 1,280 | | | Balance as of December 31, 2016 | | | $ | 1,035 | | Addition to provision | | | 452 | | | | 1,422 | | Amounts written off, net of recoveries | | | (875 | ) | | | (757 | ) | | | | | | Balance as of December 31, 2014 | | $ | 857 | | | Addition to provision | | | 940 | | | Balance as of December 31, 2017 | | | $ | 1,700 | | Reduction to provision | | | | (224 | ) | Amounts written off, net of recoveries | | | (680 | ) | | | (449 | ) | | | | | | Balance as of December 31, 2015 | | $ | 1,117 | | | | | | | | Balance as of December 31, 2018 | | | $ | 1,027 | |
Accrued Compensation The Company makes significant estimates in determining its accrued non-stock basednon-stock-based compensation and benefits expenses. A significant portion of the Company’s employee incentive compensation programs are discretionary. EachAt the end of each fiscal year, end, the Company determines the amount of discretionary cash bonus expense. These estimates reflect an assessment of performance versus targets and other key performance indicators at the Company, operating segment and employee level. The Company also reviews compensation and benefits expenses throughout the year to determine how overall performance compares to management’s expectations. These and other factors, including historical performance, are taken into account in accruing discretionary cash compensation estimates quarterly. Concentrations For the years ended December 31, 20152018 and 2014,2017, BlackRock, Inc. accounted for 10.3%11.9% and 10.6%11.5%, respectively, of the Company’s consolidated operating revenues. For the year ended December 31, 2013,revenues while no single customer accounted forrepresented 10.0% or more of the Company’s consolidated operating revenues.revenues for the year ended December 31, 2016. For the years ended December 31, 2015, 20142018, 2017 and 2013,2016, BlackRock, Inc. accounted for 19.2%20.1%, 20.1%20.0% and 18.6%17.3%, respectively, of the Index segmentsegment’s operating revenues. No single customer accounted for 10.0% or more of operating revenues within the Analytics and All Other segments for the years ended December 31, 2015, 20142018, 2017 and 2013.2016. 2. RECENT ACCOUNTING STANDARDS UPDATES In April 2014,February 2016, the FASB issued Accounting Standards Update No. 2014-08,2016-02, “Presentation of Financial StatementsLeases (Topic 205) and Property, Plant, and Equipment (Topic 360): Reporting Discontinued Operations and Disclosures of Disposals of Components of an Entity,842),” or ASU 2014-08.2016-02. The amendments in this update change the requirements for reporting discontinued operations under ASC Subtopic 205-20,“Presentation of Financial Statements—Discontinued Operations,” such as limiting discontinued operations reporting to disposals of components of an entity that represent strategic shifts that have (or will have) a major effect on an entity’s operations and financial results. The amendments in this update also require expanded disclosuresFASB issued ASU 2016-02 in order to provide users of financial statements with moreincrease transparency and comparability among organizations by recognizing lease assets and liabilities on the balance sheet and disclosing key information about leasing arrangements. To meet that objective, the assets, liabilities, revenuesFASB amended the FASB Accounting Standards Codification and expenses of discontinued operations. Further, the amendments require an entity to disclose the pretax profit or loss of an individually significant component of an entity that does not qualify for discontinued operations reporting. This F-15
MSCI INC.
NOTES TO CONSOLIDATED FINANCIAL STATEMENTS
new guidancecreated Topic 842, Leases. ASU 2016-02 is to be applied prospectivelyeffective for annual reporting periods, beginning on or after December 15, 2014, andincluding interim periods within those years, with early adoption permitted. The adoption of ASU 2014-08 did not have a material effect on its consolidated financial statements.periods, beginning after December 15, 2018.
In May 2014,July 2018, the FASB issued Accounting Standards Update No. 2014-09,2018-10, “Revenue from Contracts with Customers,Codification Improvements to Topic 842, Leases,” or ASU 2014-09.2018-10, and Accounting Standards Update No. 2018-11, “Targeted Improvements,” or ASU 2018-11. The objective ofamendments in ASU 2014-09 is to establish2018-10 include how an entity should perform the lease classification reassessment, a single comprehensive model for entities to useclarification that a change in accounting for revenue arising from contracts with customers and will supersede mosta reference index or rate upon which some or all of the existing revenue recognition guidance, including industry-specific guidance. The core principlevariable lease payments in the contract are based does not constitute the resolution of ASU 2014-09 is thata contingency and a clarification as to whether to recognize a transition adjustment in earnings rather than through equity when an entity recognizes revenueinitially applies Topic 842 retrospectively to depict the transfer of promised goods or serviceseach prior reporting period. The amendments in ASU 2018-11 provide an optional transition method that permits an entity to customers in an amount that reflects the consideration to which the entity expects to be entitled in exchange for those goods or services. In applyinginitially apply the new guidance an entity will (1) identifyat the contract(s) withadoption date and recognize a customer; (2) identifycumulative-effect adjustment to the performance obligationsopening balance of retained earnings in the contract; (3)period of adoption and not recast comparative periods. As a result, prior period financial statements and disclosures will continue to be presented in accordance with ASC Topic 840. In addition, ASU 2018-11 also includes a practical expedient for lessors to not separate the lease and non-lease components of a contract. The effective date for this amendment is the same as ASU 2016-02 discussed above. The Company will be adopting ASU 2016-02 effective January 1, 2019 using the optional transition method available under ASU 2018-11. In preparation for adoption of the guidance, the Company is implementing internal controls and key system functionality to enable the preparation of financial information. MSCI will take advantage of the transition package of practical expedients permitted within the new guidance which, among other things, will allow the Company to carryforward the historical lease classification. In addition, MSCI will elect the hindsight practical expedient to determine the transaction price; (4) allocatereasonably certain lease term for existing leases. The Company will make an accounting policy election that will keep leases with an initial term of 12 months or less off of the transaction priceConsolidated Statement of Financial Condition and will result in recognizing those lease payments in the Consolidated Statement of Income on a straight-line basis over the lease term. While the Company is continuing to assess all potential impacts of the contract’s performance obligations;guidance, the guidance will have a material impact on the Consolidated Statement of Financial Condition but will not have a material impact on the Consolidated Statement of Income or Consolidated Statement of Cash Flows. The most significant impact will be the recognition of right-of-use (“ROU”) assets and (5) recognize revenue when, orlease liabilities for operating leases. Adoption of the guidance will result in the recognition and presentation of total operating lease ROU assets estimated to be approximately $170.0 million to $190.0 million and total operating lease liabilities estimated to be approximately $190.0 million to $210.0 million, both as of January 1, 2019. MSCI does not believe the entity satisfiesnew guidance will have a performance obligation. Companiesmaterial impact on its liquidity and under its current agreements it will have the option of using either a full retrospective or modified approach to adopt ASU 2014-09. no impact on its debt-covenant compliance. In August 2015,June 2016, the FASB issued Accounting Standards Update No. 2015-14,2016-13, “Revenue from Contracts with CustomersFinancial Instruments-Credit Losses (Topic 606)326): DeferralMeasurement of the Effective Date,Credit Losses on Financial Instruments,”or ASU 2015-14.2016-13. The amendments in ASU 2015-14 defer2016-13 introduce an approach based on expected losses to estimate credit losses on certain types of financial instruments, modify the effective date of the new revenue standard by one year by changing the effective date to beimpairment model for annual reporting periods (including interim periods within those periods) beginning after December 15, 2017 from December 15, 2016,available-for-sale debt securities and provide for a simplified accounting model for purchased financial assets with early adoption at the prior date permitted. The Company is continuing to evaluate the potential impact that the update will have on its consolidated financial statements. In January 2015, the FASB issued Accounting Standards Update No. 2015-01, “Income Statement—Extraordinary and Unusual Items (Subtopic 225-20): Simplifying Income Statement Presentation by Eliminating the Concept of Extraordinary Items,” orcredit deterioration since their origination. ASU 2015-01. ASU 2015-01 eliminates the concept of an extraordinary item from GAAP. As a result, a company will no longer be required to segregate extraordinary items from the results of ordinary operations, to separately present an extraordinary item on its income statement, net of tax, after income from continuing operations or to disclose income taxes and earnings-per-share data applicable to an extraordinary item. A reporting entity may apply the amendments prospectively or retrospectively to all prior periods presented in the financial statements. However, ASU 2015-01 will still retain the presentation and disclosure guidance for items that are unusual in nature and occur infrequently. The new guidance2016-13 is effective for annual reporting periods, (includingincluding interim periods within those periods)periods, beginning after December 15, 2015,2019, with early adoption permitted provided that the guidance is applied from the beginning of the fiscal year of adoption.after December 15, 2018. The adoption of ASU 2015-012016-13 is not expected to have a material effect on the Company’s consolidated financial statements.
In April 2015,January 2017, the FASB issued Accounting Standards Update No. 2015-03,2017-01, “Interest—ImputationBusiness Combinations (Topic 805): Clarifying the Definition of Interest: Simplifying the Presentation of Debt Issuance Costs,a Business,” or ASU 2015-03.2017-01. The objectiveamendments in ASU 2017-01 provide a screen to assist entities with evaluating whether transactions should be accounted for as acquisitions or disposals of assets or businesses. Under ASU 2017-01, an entity first determines whether substantially all of the fair value of the gross assets acquired is concentrated in a single identifiable asset or a group of similar identifiable assets. If this threshold is met, the set is not a business. If it is not met, the entity then evaluates whether the set meets the requirement that a business include, at a minimum, an input and a substantive process that together significantly contribute to the ability to create outputs. ASU 2017-01 also narrows the definition of outputs by more closely aligning it with how outputs are described in ASC Topic 606. The adoption of ASU 2015-03 is to simplify the presentation of debt issuance costs by requiring that debt issuance costs related to2017-01 did not have a recognized debt liability be presentedmaterial effect on the balance sheet as a direct deduction from the carrying amount of that debt liability, consistent with debt discounts. Prior to the issuance of ASU 2015-03, debt issuance costs were recognized and presented as a deferred charge (that is, an asset). The new guidance is effective for annual reporting periods (including interim periods within those periods) beginning after December 15, 2015, with early adoption permitted forCompany’s consolidated financial statements that have not been previously issued. The Company early adopted ASU 2015-03 retrospectively during the year ended December 31, 2015. As a result of the retrospective adoption, the Company reclassified unamortized deferred financing fees of $1.2 million from “Prepaid and other assets” and $10.4 million from “Other non-current assets” as of December 31, 2014 to be a reduction in “Long-term debt” on the Consolidated Statement of Financial Condition. Adoption of this standard only resulted in the reclassification of items on the Consolidated Statement of Financial Condition and did not impact results of operations, retained earnings or cash flows in the current or previous interim and annual reporting periods. statements.MSCI INC.
NOTES TO CONSOLIDATED FINANCIAL STATEMENTS
In April 2015,January 2017, the FASB issued Accounting Standards Update No. 2015-05,2017-04, “Intangibles—Intangibles-Goodwill and Other (Topic 350): Simplifying the Test for Goodwill and Other—Internal-Use Software,Impairment,” or ASU 2015-05.2017-04. The amendments in ASU 2015-05 provide guidance F-16
2017-04 simplify the subsequent measurement of goodwill by eliminating Step 2 from the goodwill impairment test. In computing the implied fair value of goodwill under Step 2, an entity had to customers about whetherperform procedures to determine the fair value at the impairment testing date of its assets and liabilities. Instead, under the amendments in ASU 2017-04, an entity performs its annual, or interim, goodwill impairment test by comparing the fair value of a cloud computing arrangement includes a software license. If a cloud computing arrangement includes a software license, then the customer should accountreporting unit with its carrying amount and recognizes an impairment charge for the software license elementamount by which the carrying amount exceeds the reporting unit’s fair value, but not more than the total amount of goodwill allocated to the arrangement consistent with the acquisition of other software licenses. If a cloud computing arrangement does not include a software license, the customer should account for the arrangement as a service contract. The guidance will not change GAAP for a customer’s accounting for service contracts. The new guidancereporting unit. ASU 2017-04 is effective for annual reporting periods, (includingincluding interim periods within those periods)periods, beginning after December 15, 2015,2019, with early adoption permitted. The Company is evaluating the potential impact of the adoption of ASU 2015-05, but does not expect the adoption to have a material effect on its consolidated financial statements. In August 2015, the FASB issued Accounting Standards Update No. 2015-15,“Interest—Imputation of Interest: Presentation and Subsequent Measurement of Debt Issuance Costs Associated with Line-of-Credit Arrangements,” or ASU 2015-15. ASU 2015-15 adds clarity from the SEC’s perspective on the presentation and subsequent measurement of debt issuance costs associated with line-of-credit arrangements. The Company’s adoption of ASU 2015-15 did not have a material impact on its consolidated financial statements.
In September 2015, the FASB issued Accounting Standards Update No. 2015-16,“Business Combinations,” or ASU 2015-16. ASU 2015-16 simplifies the accounting for adjustments made to provisional amounts recognized in a business combination by eliminating the requirement to account for adjustments retrospectively. The amendments in ASU 2015-16 require that the acquirer record, in the same period’s financial statements, the effect on earnings of changes in depreciation, amortization, or other income effects, if any, as a result of the change to the provisional amounts, calculated as if the accounting had been completed at the acquisition date. The new guidance is effective for annual reporting periods (including interim periods within those periods) beginning after December 15, 2015, with early adoption permitted. The Company is evaluating the potential impact of the adoption of ASU 2015-16, but does not expect the adoption to have a material effect on its consolidated financial statements.
In November 2015, the FASB issued Accounting Standards Update No. 2015-17,“Balance Sheet Classification of Deferred Taxes,” or ASU 2015-17. ASU 2015-17 simplifies the presentation of deferred income taxes by classifying current and noncurrent deferred tax assets and liabilities as noncurrent on the Consolidated Statement of Financial Condition. The new guidance is effective for annual reporting periods (including interim periods within those periods) beginning after December 15, 2016, with early adoption permitted. The Company early adopted ASU 2015-17 prospectively for the year ended December 31, 2015. Prior periods have not been changed to reflect these change in classifications, Adoption of this standard only resulted in the reclassification of items on the Consolidated Statement of Financial Condition and did not impact results of operations, retained earnings or cash flows in the current or previous interim and annual reporting periods.
In January 2016, the FASB issued Accounting Standards Update No. 2016-01, “Financial Instruments—Recognition and Measurement of Financial Assets and Financial Liabilities (Subtopic 825-10),”or ASU 2016-01. Changes primarily impact the accounting for equity investments, financial liabilities under the fair value option, and the presentation and disclosure requirements for financial instruments. In addition, the FASB clarified guidance related to the valuation allowance assessment when recognizing deferred tax assets resulting from unrealized losses on available-for-sale debt securities. The new guidance is effective for annual reporting periods (including interim periods within those periods) beginning after December 15, 2017. The adoption of ASU 2016-012017-04 is not expected to have a material effect on the Company’s consolidated financial statements.
MSCI INC.
NOTES TO CONSOLIDATED FINANCIAL STATEMENTS
3. DISPOSITIONS AND DISCONTINUED OPERATIONS
DispositionIn February 2017, the FASB issued Accounting Standards Update No. 2017-07, “Compensation—Retirement Benefits (Topic 715): Improving the Presentation of CFRA
On March 31, 2013, MSCI completedNet Periodic Pension Cost and Net Periodic Postretirement Benefit Cost,” or ASU 2017-07. The FASB issued ASU 2017-07 in order to improve the salepresentation of its CFRA product line. The valuenet periodic pension cost and net periodic postretirement benefit cost. ASU 2017-07 is effective for annual reporting periods, including interim periods within those periods, beginning after December 15, 2017. Entities should apply these amendments retrospectively for the presentation of the disposed assets and liabilitiesservice cost component and the resulting gain on disposal were not material to the Company.
Dispositionother components of ISS
On March 17, 2014, MSCI entered into a definitive agreement to sell ISS. The results of operations from ISSnet periodic pension cost and the CFRA product line are reflected in “Income (loss) from discontinued operations, net of income taxes”periodic postretirement benefit cost in the Consolidated Statements of Income.
The sale of ISS was completedincome statement and prospectively, on April 30, 2014and after the effective date, for $367.4 million. The valuethe capitalization of the assetsservice cost component of net periodic pension cost and liabilitiesnet periodic postretirement benefit in assets. As a result of ISS that were disposed, directly attributable transaction costs and the resulting gain on disposal thatadoption of ASU 2017-07, the Company has been reported in “Income (loss) from discontinued operations, netrestated the Consolidated Statement of income taxes”Income for the year ended December 31, 20142017 by reclassifying $0.6 million of non-service related pension costs from “Operating Expenses” to “Other expense (income).”
In May 2017, the FASB issued Accounting Standards Update No. 2017-09, “Compensation—Stock Compensation (Topic 718), Scope of Modification Accounting,” or ASU 2017-09. The FASB issued ASU 2017-09 in order to reduce the diversity in practice, as well as the cost and complexity when applying the guidance in Topic 718, “Compensation—Stock Compensation,” to a change to the terms or conditions of a share-based payment award. The amendments in ASU 2017-09 provide guidance about which changes to the terms or conditions of a share-based payment award require an entity to apply modification accounting in Topic 718, “Compensation—Stock Compensation.” ASU 2017-09 provides that an entity shall account for the effects of a modification of the terms or conditions of an equity award as an exchange of the original award for a new award, unless the fair value (or calculated value or intrinsic value, if such an alternative measurement method is used), the vesting conditions and the classification of the modified award are the same as follows:the original award immediately before the award is modified. ASU 2017-09 requires reporting organizations to apply the amendments prospectively to an award modified on or after the adoption date. The adoption of ASU 2017-09 did not have a material effect on the Company’s consolidated financial statements. | | | | | | | | Amount (in thousands) | | Cash proceeds | | $ | 367,355 | | Less: Initial working capital adjustments | | | (311 | ) | | | | | | Total proceeds | | | 367,044 | | Less assets sold and liabilities relieved resulting from disposal: | | | | | Cash and cash equivalents | | | (4,544 | ) | Accounts receivable | | | (15,765 | ) | Deferred taxes (current) | | | (3,174 | ) | Prepaid taxes | | | (617 | ) | Prepaid and other assets | | | (4,500 | ) | Property, equipment and leasehold improvements (net of accumulated depreciation and amortization of $4,213) | | | (8,544 | ) | Goodwill | | | (254,233 | ) | Intangible assets (net of accumulated amortization of $50,283) | | | (121,269 | ) | Other non-current assets | | | (1,645 | ) | Accounts payable | | | 574 | | Accrued compensation and related benefits | | | 6,783 | | Other accrued liabilities | | | 4,034 | | Deferred revenue | | | 51,767 | | Deferred taxes (non-current) | | | 59,129 | | Other non-current liabilities | | | 5,576 | | Other comprehensive income including currency translation adjustments and pension and other post-retirement adjustments | | | 4,004 | | | | | | | Net assets sold | | | (282,424 | ) | Less: Transaction costs | | | (5,946 | ) | | | | | | Gain on sale of ISS | | $ | 78,674 | | | | | | |
MSCI INC.
NOTES TO CONSOLIDATED FINANCIAL STATEMENTSIn August 2018, the SEC issued release number 33-10532, “Disclosure Update and Simplification,” to facilitate the disclosure of information to investors and simplify compliance without significantly altering the total mix of information provided to investors. The amendments in this release are effective for annual reporting periods, including interim periods within those periods, beginning after November 5, 2018. As a result of the amendments, the Company will be required to, among other things, present, in the form of a reconciliation either as a separate statement or in the footnotes in interim and annual periods, an analysis of changes in each caption of stockholders’ equity and non-controlling interests, which will need to be accompanied by dividends per share and in the aggregate for its common shares outstanding.
Income (loss) from discontinued operations. Amounts associated with discontinued operations reflected3. REVENUE RECOGNITION
MSCI adopted the new revenue standard set forth under ASC Topic 606, as of January 1, 2018 using the Modified Retrospective Approach and as such, applied the new revenue standard only to contracts that were not F-17
completed at the January 1, 2018 adoption date, while prior reporting periods are not adjusted and continue to be reported in the Consolidated Statements of Income for the years ended December 31, 2015, 2014 and 2013 are as follows: | | | | | | | | | | | | | | | | Years Ended | | | | | December 31,
2015 | | | December 31,
2014 | | | December 31,
2013 | | | | | (in thousands) | | Revenue from discontinued operations | | $ | — | | | $ | 43,122 | | | $ | 122,303 | | | | | | | | | | | | | | | Income (loss) from discontinued operations before provision (benefit) for income taxes | | $ | — | | | $ | 86,230 | | | $ | 32,793 | | Provision for income taxes | | | 6,390 | | | | 1,059 | | | | 10,146 | | | | | | | | | | | | | | | Income (loss) from discontinued operations, net of income taxes | | $ | (6,390 | ) | | $ | 85,171 | | | $ | 22,647 | | | | | | | | | | | | | | |
accordance to our historic accounting policy under Accounting Standards Codification 605 “Revenue Recognition.” The year ended December 31, 2015 reflects thecumulative impact of out-of-period income tax charges associated withadoption on the tax obligations triggered upon the sale of ISS. 4. RECLASSIFICATIONS OUT OF ACCUMULATED OTHER COMPREHENSIVE INCOME (LOSS)
As required by ASC Subtopic 220-10, “Comprehensive Income—Overall,” the following table presents the amounts reclassified from accumulated other comprehensive income (loss) by the respective line item in theCompany’s Consolidated Statement of Income:
Reclassifications Out of Accumulated Other Comprehensive Income (Loss)(1)Financial Condition was as follows (in thousands):
| | | | | | | | | | | | | | | Details about Accumulated Other
Comprehensive Income (Loss) Components | | Amount Reclassified from Accumulated
Other Comprehensive Income (Loss) | | | Affected Line Item in the
Unaudited Condensed
Consolidated Statements of Income | | | | Years Ended | | | | | | | December 31,
2015 | | | December 31,
2014 | | | December 31,
2013 | | | | | | | (in thousands) | | | | Unrealized losses on cash flow hedges | | | | | | | | | | | | | | | Interest rate contracts | | $ | — | | | $ | — | | | $ | (1,364 | ) | | Interest expense | | | | — | | | | — | | | | 524 | | | Income tax benefit | | | | | | | | | | | | | | | | | | $ | — | | | $ | — | | | $ | (840 | ) | | Net of tax | | | | | | | | | | | | | | | | Unrealized gains on available-for-sale securities | | | | | | | | | | | | | | | Short-term investments | | $ | — | | | $ | — | | | $ | 5 | | | | | | | — | | | | — | | | | (2 | ) | | Provision for income taxes | | | | | | | | | | | | | | | | | | $ | — | | | $ | — | | | $ | 3 | | | Net of tax | | | | | | | | | | | | | | | | Defined benefit pension plans | | | | | | | | | | | | | | | Amount recognized as a component of net periodic benefit expense for curtailments and settlements | | $ | (563 | ) | | $ | (104 | ) | | $ | (32 | )(2) | | | | | | 153 | | | | (15 | ) | | | 6 | (3) | | Provision for income taxes | | | | | | | | | | | | | | | | | | $ | (410 | ) | | $ | (119 | | | $ | (26 | )(4) | | Net of tax | | | | | | | | | | | | | | | | Foreign currency translation adjustment | | $ | — | | | $ | 4,184 | | | $ | — | (5) | | | | | | | | | | | | | | | | | | Total reclassifications for the period, net of tax | | $ | (410 | ) | | $ | 4,065 | | | $ | (863 | ) | | | | | | | | | | | | | | | | | |
Selected line items | | As reported at December 31, 2017 | | | Adjustments due to Adoption of ASC Topic 606 | | | Adjusted as of December 31, 2017 | | Statement of Financial Condition | | | | | | | | | | | | | Accounts receivable | | $ | 327,597 | | | $ | 145,803 | | | $ | 473,400 | | Income taxes payable | | $ | 14,828 | | | $ | 4,314 | | | $ | 19,142 | | Other accrued liabilities | | $ | 85,710 | | | $ | 5,128 | | | $ | 90,838 | | Deferred revenue | | $ | 374,365 | | | $ | 120,226 | | | $ | 494,591 | | Retained earnings | | $ | 1,505,204 | | | $ | 16,135 | | | $ | 1,521,339 | |
(1) | Amounts in parentheses indicate expenses or losses moved to the Consolidated Statements of Income. |
(2) | Includes $(186,000) for the year ended December 31, 2014 that was reclassified to “Income (loss) from discontinued operations, net of taxes” as part of the gain on the disposition of ISS. |
Included in the above adjustments is an increase of approximately $135.5 million primarily to accounts receivable and deferred revenue and other accrued liabilities with no impact to retained earnings. Under the new revenue standard, the Company now records an accounts receivable and an associated deferred revenue and other accrued liabilities when it bills the customer. Under the old revenue standard, these amounts were not recorded until the contract service start date. MSCI INC.
NOTES TO CONSOLIDATED FINANCIAL STATEMENTSThe impact of adopting the new revenue standard on the Company’s Consolidated Statement of Income through the date of December 31, 2018 is as follows (in thousands):
(3) | Includes $6,000 for the year ended December 31, 2014 that was reclassified to “Income (loss) from discontinued operations, net of taxes” as part of the gain on the disposition of ISS. |
(4) | Includes $(180,000) for the year ended December 31, 2014 that was reclassified to “Income (loss) from discontinued operations, net of taxes” as part of the gain on the disposition of ISS. |
(5) | This accumulated other comprehensive income component for the year ended December 31, 2014 was reclassified to “Income (loss) from discontinued operations, net of taxes” as part of the gain on the disposition of ISS. |
| | For the Year Ended December 31, 2018 | | Selected line items | | As reported | | | Impact of Change | | | Without Adoption of ASC Topic 606 | | Statement of Income | | | | | | | | | | | | | Operating revenues | | $ | 1,433,984 | | | $ | (6,181 | ) | | $ | 1,427,803 | | Operating income | | $ | 686,898 | | | $ | (6,181 | ) | | $ | 680,717 | | Income before provision for income taxes | | $ | 629,896 | | | $ | (6,181 | ) | | $ | 623,715 | | Provision for income taxes | | $ | 122,011 | | | $ | (1,236 | ) | | $ | 120,775 | | Net income | | $ | 507,885 | | | $ | (4,945 | ) | | $ | 502,940 | | Earnings per basic common share | | $ | 5.83 | | | $ | (0.06 | ) | | $ | 5.77 | | Earnings per diluted common share | | $ | 5.66 | | | $ | (0.06 | ) | | $ | 5.60 | |
5.
The impact of adopting the new revenue standard on the Company’s Consolidated Statement of Financial Condition through the date of December 31, 2018 is as follows (in thousands): | | December 31, 2018 | | Selected line items | | As reported | | | Impact of Change | | | Without Adoption of ASC Topic 606 | | Statement of Financial Condition | | | | | | | | | | | | | Accounts receivable | | $ | 473,433 | | | $ | (148,209 | ) | | $ | 325,224 | | Income taxes payable | | $ | 16,253 | | | $ | (5,550 | ) | | $ | 10,703 | | Other accrued liabilities | | $ | 113,841 | | | $ | (6,078 | ) | | $ | 107,763 | | Deferred revenue | | $ | 537,977 | | | $ | (115,501 | ) | | $ | 422,476 | | Retained earnings | | $ | 1,856,951 | | | $ | (21,080 | ) | | $ | 1,835,871 | |
F-18
The table that follows presents the disaggregated revenues for the periods indicated (in thousands): | | For the Year Ended December 31, 2018 | | | | Segments | | | | | | | | Index | | | Analytics | | | All Other | | | Total | | Product Types | | | | | | | | | | | | | | | | | Recurring subscriptions | | $ | 477,612 | | | $ | 474,334 | | | $ | 114,590 | | | $ | 1,066,536 | | Asset-based fees | | | 336,565 | | | | — | | | | — | | | | 336,565 | | Non-recurring | | | 21,298 | | | | 5,605 | | | | 3,980 | | | | 30,883 | | Total | | $ | 835,475 | | | $ | 479,939 | | | $ | 118,570 | | | $ | 1,433,984 | |
The table that follows presents the change in accounts receivable and deferred revenue between the dates indicated (in thousands): | | December 31, 2018 | | | | Accounts receivable | | | Deferred revenue | | Opening (1/1/2018) | | $ | 473,400 | | | $ | 494,591 | | Closing (12/31/2018) | | | 473,433 | | | | 537,977 | | Increase/(decrease) | | $ | 33 | | | $ | 43,386 | |
The amount of revenue recognized in the period that was included in the opening current deferred revenue, which reflects the contract liability amounts, was $478.8 million. The difference between the opening and closing balances of the Company’s deferred revenue was primarily driven by an increase in billings, partially offset by the amortization of deferred revenue to operating revenues. MSCI had an insignificant long-term deferred revenue balance as of December 31, 2018 reflected as a part of “Other non-current liabilities” on its Consolidated Statement of Financial Condition. The majority of MSCI’s contracts have a duration of one year or less and, accordingly, revenue associated with these performance obligations will be recognized within 12 months. For these contracts, the Company has chosen to use the practical expedient available under the new revenue standard and, as such, has not disclosed either the remaining performance obligation as of the end of the reporting period or when the Company expects to recognize the revenue. The remaining performance obligations for contracts that have a duration of greater than one year is $483.4 million as of December 31, 2018, which is expected to be recognized as follows: Approximately $254.2 million of the remaining performance obligations over the next 12-month period; Approximately $137.9 million of the remaining performance obligations over the second 12-month period; Approximately $56.2 million of the remaining performance obligations over the third 12-month period; and Approximately $35.1 million of the remaining performance obligations in the periods thereafter. 4. EARNINGS PER COMMON SHARE Basic earnings per share (“EPS”) is computed by dividing income available to MSCI common shareholders by the weighted average number of common shares outstanding during the period. Common shares outstanding include common stock and vested restricted stock unit awards where recipients have satisfied either the explicit vesting terms or retirement-eligible requirements. Diluted EPS reflects the assumed conversion of all dilutive securities. There were 3,778, 78,2602,704, 987 and 26,407,398 anti-dilutive securities excluded from the calculation of diluted EPS for the years ended December 31, 2015, 20142018, 2017 and 2013,2016, respectively, because of their anti-dilutive effect. The Company computes EPS using the two-class method and determines whether instruments granted in share-based payment transactions are participating securities. F-19
The following table presents the computation of basic and diluted EPS: | | | | | | | | | | | | | | | | Years Ended | | | (in thousands, except per share data) | | December 31,
2015 | | | December 31
2014 | | | December 31
2013 | | Income from continuing operations, net of income taxes | | $ | 230,038 | | | $ | 198,942 | | | $ | 199,910 | | Income (loss) from discontinued operations, net of income taxes | | | (6,390 | ) | | | 85,171 | | | | 22,647 | | | | | | | | | | | | | | | Net income | | $ | 223,648 | | | $ | 284,113 | | | $ | 222,557 | | Less: Allocations of earnings to unvested restricted stock units(1) | | | — | | | | (368 | ) | | | (633 | ) | | | | | | | | | | | | | | | | | | Earnings available to MSCI common shareholders | | $ | 223,648 | | | $ | 283,745 | | | $ | 221,924 | | | | | | | | | | | | | | | | | | | Basic weighted average common shares outstanding | | | 109,124 | | | | 115,737 | | | | 120,100 | | | | | | | | | | | | | | | Effect of dilutive securities: | | | | | | | | | | | | | Stock options and restricted stock units | | | 802 | | | | 969 | | | | 974 | | | | | | | | | | | | | | | | | | | Diluted weighted average common shares outstanding | | | 109,926 | | | | 116,706 | | | | 121,074 | | | | | | | | | | | | | | | Earnings per basic common share from continuing operations | | $ | 2.11 | | | $ | 1.72 | | | $ | 1.66 | | Earnings per basic common share from discontinued operations | | | (0.06 | ) | | | 0.73 | | | | 0.19 | | | | | | | | | | | | | | | | | | | Earnings per basic common share | | $ | 2.05 | | | $ | 2.45 | | | $ | 1.85 | | | | | | | | | | | | | | | Earnings per diluted common share from continuing operations | | $ | 2.09 | | | $ | 1.70 | | | $ | 1.64 | | Earnings per diluted common share from discontinued operations | | | (0.06 | ) | | | 0.73 | | | | 0.19 | | | | | | | | | | | | | | | | | | | Earnings per diluted common share | | $ | 2.03 | | | $ | 2.43 | | | $ | 1.83 | | | | | | | | | | | | | | |
MSCI INC.
NOTES TO CONSOLIDATED FINANCIAL STATEMENTS
| | Years Ended | | | | December 31, | | | December 31, | | | December 31, | | | | 2018 | | | 2017 | | | 2016 | | (in thousands, except per share data) | | | | | | | | | | | | | Net income | | $ | 507,885 | | | $ | 303,972 | | | $ | 260,855 | | | | | | | | | | | | | | | Basic weighted average common shares outstanding | | | 87,179 | | | | 90,336 | | | | 95,986 | | Effect of dilutive securities: | | | | | | | | | | | | | Stock options and restricted stock units | | | 2,522 | | | | 1,578 | | | | 554 | | Diluted weighted average common shares outstanding | | | 89,701 | | | | 91,914 | | | | 96,540 | | | | | | | | | | | | | | | Earnings per basic common share | | $ | 5.83 | | | $ | 3.36 | | | $ | 2.72 | | | | | | | | | | | | | | | Earnings per diluted common share | | $ | 5.66 | | | $ | 3.31 | | | $ | 2.70 | |
(1) | Restricted stock units granted to employees prior to 2013 and restricted stock units granted to independent directors of the Company prior to April 30, 2015 had a right to participate in all of the earnings of the Company in the computation of basic EPS and, therefore, these restricted stock units were not included as incremental shares in the diluted EPS computation. |
6.5. COMMITMENTS AND CONTINGENCIES
Legal matters. From time to time, the Company is party to various litigation matters incidental to the conduct of its business. The Company is not presently party to any legal proceedings the resolution of which the Company believes would have a material effect on its business, operating results, financial condition or cash flows. Leases.The Company leases facilities under non-cancelable operating lease agreements. The terms of certain lease agreements provide for rental payments on a graduated basis. The Company recognizes rent expense on the straight-line basis over the lease period and has accrued for rent expense incurred but not paid. Rent expense for the years ended December 31, 2015, 20142018, 2017 and 20132016 was $26.5$25.3 million, $27.0$24.2 million and $24.2 million, respectively. Future minimum commitments for the Company’s operating leases in place as of December 31, 20152018 are as follows: | Years Ending December 31, | | Amount | | | Amount | | | | | (in thousands) | | | (in thousands) | | 2016 | | $ | 28,170 | | | 2017 | | | 26,416 | | | 2018 | | | 25,064 | | | 2019 | | | 20,369 | | | $ | 25,868 | | 2020 | | | 17,863 | | | | 24,619 | | 2021 | | | | 23,452 | | 2022 | | | | 21,832 | | 2023 | | | | 21,818 | | Thereafter | | | 148,074 | | | | 107,800 | | | | | | | | Total | | $ | 265,956 | | | $ | 225,389 | | | | | | |
Long-term debt. On June 1, 2010,
Senior Notes. The Company has issued an aggregate of $2.6 billion in senior unsecured notes (collectively, the Company entered into a senior secured credit facility (the “2010 Credit Facility”“Senior Notes”). On March 14, 2011, in the Company completed the repricingfour discrete private offerings described below. F-20
| | | | Principal amount outstanding at | | | Carrying value at | | | Carrying value at | | | Fair Value at | | | Fair Value at | | | | Maturity Date | | December 31, 2018 | | | December 31, 2018 | | | December 31, 2017 | | | December 31, 2018 | | | December 31, 2017 | | | | (in thousands) | | Long-term debt | | | | | | | | | | | | | | | | | | | | | | | 5.25% senior unsecured notes due 2024 | | November 15, 2024 | | $ | 800,000 | | | $ | 793,054 | | | $ | 791,880 | | | $ | 802,576 | | | $ | 847,064 | | 5.75% senior unsecured notes due 2025 | | August 15, 2025 | | | 800,000 | | | | 793,016 | | | | 791,967 | | | | 807,088 | | | | 858,848 | | 4.75% senior unsecured notes due 2026 | | August 1, 2026 | | | 500,000 | | | | 494,916 | | | | 494,246 | | | | 475,520 | | | | 525,185 | | 5.375% senior unsecured notes due 2027 | | May 15, 2027 | | | 500,000 | | | | 494,516 | | | — | | | | 489,745 | | | — | | Total debt | | | | $ | 2,600,000 | | | $ | 2,575,502 | | | $ | 2,078,093 | | | $ | 2,574,929 | | | $ | 2,231,097 | |
The fair market value of the 2010 Credit Facility pursuant to Amendment No. 2Company’s debt obligations is determined in accordance with accounting standards related to the 2010 Credit Facility. On May 4, 2012, the Company amendeddetermination of fair value and restated its 2010 Credit Facility (the credit agreement as so amended and restated, the “Amended and Restated Credit Facility”). The Amended and Restated Credit Facility providedrepresents Level 2 valuations, which are based on one or more quoted prices in markets that are not considered to be active or for the incurrence of a new senior secured five-year Term Loan A Facility in an aggregate amount of $880.0 million (the “2012 Term Loan”) and a $100.0 million senior secured revolving facility (the “2012 Revolving Credit Facility”). The Amended and Restated Credit Facility also amended certain negative covenants, including financial covenants. On December 12, 2013, the Company entered into an agreement that extended the maturity of the Amended and Restated Credit Facility from May 2017 to December 2018 (the “2013 Amended and Restated Credit Facility”).which all significant inputs are observable, either directly or indirectly. The Company also amendedutilizes the amortization schedule of required debt payments under the 2012 Term Loan.market approach and obtains security pricing from a vendor who uses broker quotes and third-party pricing services to determine fair values.
On November 20, 2014, the Company completed its first private offering ofThe $800.0 million aggregate principal amount of 5.25% senior unsecured notes due 2024 (the “2024 Senior Notes”) and also entered into a
MSCI INC.
NOTES TO CONSOLIDATED FINANCIAL STATEMENTS
$200.0 million senior unsecured revolving credit agreement (the “2014 Revolving Credit Agreement”) by and among the Company, as borrower, certain of its subsidiaries, as guarantors (the “subsidiary guarantors”), the lenders party thereto and JPMorgan Chase Bank, N.A., as administrative agent. The Company used the net proceeds from the offering of the 2024 Senior Notes, together with cash on hand, to repay in full its then outstanding term loan indebtedness of $794.8 million, which bore interest at LIBOR plus a margin of 2.25%.
On August 13, 2015, the Company completed its second private offering of $800.0 million aggregate principal amount of 5.75% senior unsecured notes due 2025 (the “2025 Senior Notes”). The Company intends to use the $789.5 million of net proceeds from the offering of the 2025 Senior Notes for general corporate purposes, including, without limitation, repurchases of its common stock.
The 2024 Senior Notes are scheduled to mature and be paid in full on November 20,15, 2024. At any time prior to November 15, 2019, the Company may redeem all or part of the 2024 Senior Notes upon not less than 30 nor more than 60 days’ prior notice at a redemption price equal to the sum of (i) 100% of the principal amount thereof, plus (ii) a make-whole premium as of the date of redemption, plus (iii) accrued and unpaid interest and additional interest, if any, thereon, to the date of redemption. In addition, the Company may redeem all or part of the 2024 Senior Notes, together with accrued and unpaid interest, on or after November 15, 2019, at redemption prices set forth in the indenture governing the 2024 Senior Notes. At any time prior to November 15, 2017, the Company may use the proceeds of certain equity offerings to redeem up to 35% of the
The $800.0 million aggregate principal amount of the 20245.75% senior unsecured notes due 2025 (the “2025 Senior Notes, including any permitted additional notes, at a redemption price equal to 105.25% of the principal amount. The 2014 Revolving Credit Agreement has an initial term of five years that may be extended, at the Company’s request, for two additional one year terms.
The 2025 Senior NotesNotes”) are scheduled to mature and be paid in full on August 15, 2025. At any time prior to August 15, 2020, the Company may redeem all or part of the 2025 Senior Notes upon not less than 30 nor more than 60 days’ prior notice at a redemption price equal to the sum of (i) 100% of the principal amount thereof, plus (ii) a make-whole premium as of the date of redemption, plus (iii) accrued and unpaid interest and additional interest, if any, thereon, to the date of redemption. In addition, the Company may redeem all or part of the 2025 Senior Notes, together with accrued and unpaid interest, on or after August 15, 2020, at redemption prices set forth in the indenture governing the 2025 Senior Notes.
The $500.0 million aggregate principal amount of 4.75% senior unsecured notes due 2026 (the “2026 Senior Notes”) are scheduled to mature and be paid in full on August 1, 2026. At any time prior to August 15, 2018,1, 2021, the Company may redeem all or part of the 2026 Senior Notes upon not less than 30 nor more than 60 days’ prior notice at a redemption price equal to the sum of (i) 100% of the principal amount thereof, plus (ii) a make-whole premium as of the date of redemption, plus (iii) accrued and unpaid interest and additional interest, if any, thereon, to the date of redemption. In addition, the Company may redeem all or part of the 2026 Senior Notes, together with accrued and unpaid interest, on or after August 1, 2021, at redemption prices set forth in the indenture governing the 2026 Senior Notes. At any time prior to August 1, 2019, the Company may use the proceeds of certain equity offerings to redeem up to 35% of the aggregate principal amount of the 20252026 Senior Notes, including any permitted additional notes, at a redemption price equal to 105.75%104.75% of the principal amount.amount plus accrued and unpaid interest, if any, to the redemption date. On May 18, 2018, the Company completed its private offering of $500.0 million aggregate principal amount of 5.375% senior unsecured notes due 2027 (the “2027 Senior Notes”) reflected in the table above. The $495.0 million of net proceeds from the offering of the 2027 Senior Notes were allocated for general corporate purposes, including, without limitation, buybacks of the Company’s common stock and potential acquisitions. F-21
The 2027 Senior Notes are scheduled to mature and be paid in full on May 15, 2027. At any time prior to May 15, 2022, the Company may redeem all or part of the 2027 Senior Notes upon not less than 30 nor more than 60 days’ prior notice at a redemption price equal to the sum of (i) 100% of the principal amount thereof, plus (ii) a make-whole premium as of the date of redemption, plus (iii) accrued and unpaid interest and additional interest, if any, thereon, to the date of redemption. In addition, the Company may redeem all or part of the 2027 Senior Notes, together with accrued and unpaid interest, on or after May 15, 2022, at redemption prices set forth in the indenture governing the 2027 Senior Notes. At any time prior to May 15, 2021, the Company may use the proceeds of certain equity offerings to redeem up to 35% of the aggregate principal amount of the 2027 Senior Notes, including any permitted additional notes, at a redemption price equal to 105.375% of the principal amount plus accrued and unpaid interest, if any, to the redemption date. Interest payments attributable to the 2024 Senior Notes and 2027 Senior Notes are due on May 1515th and November 1515th of each year. The first interest payment was made on May 15, 2015. The Company paid $41.4 million of interest attributable to the 2024 Senior Notes during the year ended December 31, 2015. Interest payments attributable to the 2025 Senior Notes are due on February 1515th and August 1515th of each year. The first interest payment was madeInterest payments attributable to the 2026 Senior Notes are due on February 16, 2016.1st and August 1st of each year. Long-term debt atRevolver. On November 20, 2014, the Company entered into a $200.0 million senior unsecured revolving credit agreement (as amended, the “Revolving Credit Agreement”) with a syndicate of banks. The Revolving Credit Agreement had an initial term of five years with an option to extend for two additional one-year terms. On August 4, 2016, the Company entered into Amendment No. 1 (the “First Amendment”) to the Revolving Credit Agreement. The First Amendment, among other things, (i) increased aggregate commitments available to be borrowed to $220.0 million, (ii) increased the maximum consolidated leverage ratio and (iii) extended the initial term to August 2021 with an option to extend for an additional one-year term. On May 15, 2018, the Company entered into Amendment No. 2 (the “Second Amendment”) to the Revolving Credit Agreement. The Second Amendment, among other things, (i) increased aggregate commitments available to be borrowed to $250.0 million, (ii) extended the term to May 2023 with an option to extend for an additional one-year term and (iii) decreased the applicable rate and applicable fee rate for loans and commitments. At December 31, 20152018, the Revolving Credit Agreement was $1,579.4 million, net of $20.6 million in deferred financing fees. Long-term debt at December 31, 2014 was $788.4 million, net of $11.6 million in deferred financing fees. See Note 2, “Recent Accounting Standards Updates,” for further information on the presentation of debt issuance costs in the Consolidated Statements of Financial Condition.undrawn.
In connection with the closingclosings of the 2024 Senior Notes and 2025 Senior Notes offerings and enteringentry into the 2014 Revolving Credit Agreement and the First and Second Amendments, the Company paid certain fees which, together with the existing fees MSCI INC.
NOTES TO CONSOLIDATED FINANCIAL STATEMENTS
related to prior credit facilities, are being amortized over the life of the 2024 Senior Notes, 2025 Senior Notes and the 2014 Revolving Credit Agreement.their related lives. At December 31, 2015, $23.02018, $26.3 million of the deferred financing fees remain unamortized, $0.6$0.4 million of which is included in “Prepaid and other assets,” $1.8$1.4 million of which is included in “Other non-current assets” and $20.6$24.5 million of which is grouped and presented as part of “Long-term debt” on the Consolidated StatementsStatement of Financial Condition. During the years ended December 31, 2015, 2014 and 2013, the Company amortized $2.1 million, $7.7 million, and $3.3 million of deferred financing fees in interest expense, respectively. There was no unamortized debt discount outstanding as of December 31, 2015 and 2014. Approximately $2.2 million and $1.1 million of debt discount was amortized in interest expense during the years ended December 31, 2014 and 2013, respectively.
At December 31, 2015 and 2014, the fair market value of the Company’s debt obligations were $1,638.0 million and $831.0 million, respectively. The fair market value is determined in accordance with accounting standards related to the determination of fair value and represents Level 2 valuations, which are based on one or more quoted prices in markets that are not considered to be active or for which all significant inputs are observable, either directly or indirectly. The Company utilizes the market approach and obtains security pricing from a vendor who uses broker quotes and third-party pricing services to determine fair values.
Derivatives and Hedging Activities. The Company is exposed to certain risks arising from both its business operations and economic conditions. The Company principally manages its exposures to a wide variety of business and operational risks through management of its core business activities. The Company manages economic risks, including interest rate, liquidity and credit risk primarily by managing the amount, sources, and duration of its debt funding and the use of derivative financial instruments. Specifically, the Company had previously entered into derivative financial instruments to manage exposures that arose from business activities that result in the receipt or payment of future known and uncertain cash amounts, the value of which are determined by interest rates, and may do so again in the future. The Company’s derivative financial instruments were used to manage differences in the amount, timing and duration of the Company’s known or expected cash payments principally related to the Company’s borrowings.
Certain of the Company’s foreign operations expose the Company to fluctuations of foreign exchange rates. These fluctuations may impact the value of the Company’s cash receipts and payments in terms of the Company’s functional currency, the U.S. dollar. The Company enters into derivative financial instruments to protect the value or fix the amount of certain obligations in terms of its functional currency.
Cash Flow Hedges of Interest Rate Risk. As a result of the repayment of the Company’s then-outstanding term loans on May 4, 2012 and March 14, 2011, the Company discontinued prospective hedge accounting on its then-existing interest rate swaps as they no longer met hedge accounting requirements. The Company has not entered into new interest rate swaps to hedge its debt. The Company continued to report the net loss related to the discontinued cash flow hedges in accumulated other comprehensive income (loss) and reclassified this amount into earnings through the contractual term of the swap agreements which ended in August 2013.
Non-designated Hedges of Foreign Exchange Risk. Derivatives not designated as hedges are not speculative and are used to manage the Company’s economic exposure to foreign exchange rate movements but do not meet the strict hedge accounting requirements. Changes in the fair value of derivatives not designated in hedging relationships are recorded directly in earnings. As of December 31, 2015, the Company had outstanding foreign currency forwards with a notional amount of $25.0 million that were not designated as hedges in qualifying hedging relationships.
MSCI INC.
NOTES TO CONSOLIDATED FINANCIAL STATEMENTS
The following table presents the fair values of the Company’s derivative instruments and the location in which they are presented on the Company’s Consolidated Statements of Financial Condition:
| | | | | | | | | | | | | | Consolidated Statements of
Financial Condition Location | | As of | | | (in thousands) | | | December 31, 2015 | | | December 31, 2014 | | Derivatives designated as hedging instruments: | | | | | | | | | | | Asset derivatives: | | | | | | | | | | | Foreign exchange contracts | | Prepaid and other assets | | $ | 640 | | | $ | — | | Liability derivatives: | | | | | | | | | | | Foreign exchange contracts | | Other accrued liabilities | | $ | (2 | ) | | $ | (243 | ) |
The following tables present the effect of the Company’s financial derivatives and the location in which they are presented on the Company’s Consolidated Statements of Financial Condition and Consolidated Statements of Income:
| | | | | | | | | | | | | | | | | | | | | | | | | | | | | | | | | | | | | | | | | | | | | Derivatives in Cash Flow Hedging Relationships | | Amount of Gain or (Loss)
Recognized in Accumulated
Other Comprehensive
Income (Loss) on Derivatives
(Effective Portion) for the
Years Ended
December 31, | | | Location of Gain
or (Loss)
Reclassified
from Accumulated
Other
Comprehensive
Income into
Income
(Effective Portion) | | | Amount of Gain or
(Loss) Reclassified
from Accumulated Other
Comprehensive Income (Loss)
into Income (Effective
Portion) for the
Years Ended
December 31, | | | Location of Gain
or (Loss)
Recognized
in Income on
Derivatives
(Ineffective
Portion and
Amount Excluded
from
Effectiveness
Testing) | | | Amount of Gain
or (Loss) Recognized
in Income
on Derivatives
(Ineffective Portion
and Amount
Excluded from
Effectiveness
Testing) for the
Years Ended
December 31, | | | (in thousands) | | 2015 | | | 2014 | | | 2013 | | | | 2015 | | | 2014 | | | 2013 | | | | 2015 | | | 2014 | | | 2013 | | Interest rate swaps | | $ | — | | | $ | — | | | $ | — | | | | Interest expense | | | $ | — | | | $ | — | | | $ | (1,364 | ) | | | Interest expense | | | $ | — | | | $ | — | | | $ | — | |
| | | | | | | | | | | | | | | Derivatives Not Designated as Hedging
Instruments (in thousands) | | Location of
Gain or (Loss)
Recognized in
Income on
Derivatives | | Amount of Gain or (Loss)
Recognized in Income on
Derivatives for the Years Ended | | | | | December 31,
2015 | | | December 31,
2014 | | | December 31,
2013 | | Foreign exchange contracts | | Other expense
(income) | | $ | 366 | | | $ | (834 | ) | | $ | (139 | ) |
Gain on sale of investment
During the year ended December 31, 2015, MSCI sold an investment accounted for under the cost method and recognized a $6.3 million gain which is included within the “Other expense (income), net” in the Consolidated Statements of Income.
MSCI INC.
NOTES TO CONSOLIDATED FINANCIAL STATEMENTS
7.6. PROPERTY, EQUIPMENT AND LEASEHOLD IMPROVEMENTS
Property, equipment and leasehold improvements at December 31, 20152018 and 20142017 consisted of the following: | | | | | | | | | | As of | | | | | | | As of | | | Estimated | | December 31, | | | December 31, | | Type | | Estimated
Useful Lives | | December 31,
2015 | | December 31,
2014 | | | | | | Useful Lives | | 2018 | | | 2017 | | | | | | | (in thousands) | | | | | (in thousands) | | Computer & related equipment | | 2 to 5 years | | $ | 143,499 | | | $ | 118,537 | | | 2��to 5 years | | $ | 200,414 | | | $ | 200,592 | | Furniture & fixtures | | 7 years | | | 9,870 | | | 9,569 | | | 7 years | | | 12,033 | | | | 10,591 | | Leasehold improvements | | 1 to 21 years | | | 47,579 | | | 49,756 | | | 1 to 21 years | | | 53,429 | | | | 51,128 | | Work-in-process | | — | | | 12,658 | | | 9,020 | | | — | | | 10,506 | | | | 3,406 | | | | | | | | | | | | Subtotal | | | | | 213,606 | | | 186,882 | | | | | | 276,382 | | | | 265,717 | | Accumulated depreciation and amortization | | | | | (114,680 | ) | | (92,808 | ) | | | | | (185,505 | ) | | | (171,280 | ) | | | | | | | | | | | Property, equipment and leasehold improvements, net | | | | $ | 98,926 | | | $ | 94,074 | | | | | $ | 90,877 | | | $ | 94,437 | | | | | | | | | | | |
Depreciation and amortization expense of property, equipment and leasehold improvements was $30.9$31.3 million, $25.7$35.4 million and $20.4$34.3 million for the years ended December 31, 2015, 20142018, 2017 and 2013,2016, respectively. 8.
F-22
7. GOODWILL AND INTANGIBLE ASSETS Goodwill.Goodwill
The change to the Company’s goodwill was as follows: | | | | | | (in thousands) | | Goodwill | | Goodwill at December 31, 2013 | | $ | 1,813,164 | | Changes to goodwill(1) | | | (244,299 | ) | Foreign exchange translation adjustment | | | (3,961 | ) | | | | | | Goodwill at December 31, 2014 | | $ | 1,564,904 | | Changes to goodwill(2) | | | 4,202 | | Foreign exchange translation adjustment | | | (3,485 | ) | | | | | | | | | | | Goodwill at December 31, 2015(3) | | $ | 1,565,621 | | | | | | |
(in thousands) | | Index | | | Analytics | | | All Other | | | Total | | | Goodwill at December 31, 2016 | | $ | 1,202,448 | | | $ | 302,611 | | | $ | 50,791 | | | $ | 1,555,850 | | | Foreign exchange translation adjustment | | | 2,952 | | | | — | | | | 1,819 | | | | 4,771 | | | Goodwill at December 31, 2017 | | $ | 1,205,400 | | | $ | 302,611 | | | $ | 52,610 | | | $ | 1,560,621 | | | Changes to goodwill | | | — | | | | (11,635 | ) | (1) | | — | | | | (11,635 | ) | | Foreign exchange translation adjustment | | | (1,996 | ) | | | — | | | | (1,229 | ) | | | (3,225 | ) | | Goodwill at December 31, 2018 | | $ | 1,203,404 | | | $ | 290,976 | | | $ | 51,381 | | | $ | 1,545,761 | | |
(1) | Changes to goodwill reflectReflects the disposition and addition of goodwill associated with the sale of ISS, which removed $254.2$2.9 million and $8.7 million impact of the acquisition of GMI Ratings, which contributed $9.9 million. See Note 3, “DispositionsFinancial Engineering Associates, Inc. (“FEA”) and Discontinued Operations,” and Note 12, “Acquisitions,” for additional information. |
(2) | Changes to goodwill reflect the addition of $4.2 million of goodwill associated with the acquisition of Insignis.Investor Force Holdings, Inc. (“InvestorForce”) divestitures, respectively. See Note 12, “Acquisitions,”“Divestitures” for additional information.further information regarding the FEA and InvestorForce divestitures. |
(3) | At December 31, 2015, the goodwill assigned to the Index, Analytics and All Other reportable segments was $1,210.4 million, $302.5 million and $52.7 million, respectively. |
Through the year ended December 31, 2018, the Company has never recognized an impairment of goodwill on its consolidated financial statements. Intangible Assets.Assets Amortization expense related to intangible assets for the years ended December 31, 2015, 20142018, 2017 and 2013,2016 was $46.9$54.2 million, $45.9$44.5 million and $44.8$47.0 million, respectively. The amortization expense of acquired intangible assets for the years ended December 31, 2018, 2017 and 2016 was $44.0 million, $39.2 million and $44.6 million, respectively. The amortization expense of internally developed capitalized software for the years ended December 31, 2018, 2017 and 2016 was $10.2 million, $5.4 million and $2.4 million, respectively.During the year ended December 31, 2018, management decided to discontinue the use of the IPD tradename utilized by the Real Estate segment and has rebranded the segment to MSCI INC.Real Estate. As a result, the remaining unamortized value associated with the trade name of $7.9 million was written off. NOTES TO CONSOLIDATED FINANCIAL STATEMENTSF-23
The gross carrying and accumulated amortization amounts related to the Company’s identifiable intangible assets were as follows: | | | | | | | | | | As of | | | | | Estimated
Useful Lives | | As of | | | Estimated | | December 31, | | | December 31, | | | (in thousands) | | December 31,
2015 | | | December 31,
2014(1) | | | | | | Useful Lives | | 2018 | | | 2017 | | | | | | | (in thousands) | | Gross intangible assets: | | | | | | | | | | | | | | | | | Customer relationships | | 5 to 21 years | | $ | 361,746 | | | $ | 360,835 | | | Trademarks/trade names | | 5 to 21.5 years | | | 223,382 | | | | 223,382 | | | Technology/software | | 3 to 8.5 years | | | 199,889 | | | | 193,681 | | | Customer relationships(1) | | | 5 to 21 years | | $ | 356,700 | | | $ | 361,199 | | Trademarks/trade names(1) | | | 5 to 21.5 years | | | 208,320 | | | | 223,382 | | Technology/software(1), (2) | | | 3 to 8.5 years | | | 238,692 | | | | 225,407 | | Proprietary data | | 13 years | | | 28,627 | | | | 28,627 | | | 13 years | | | 28,627 | | | | 28,627 | | Covenant not to compete | | 2 years | | | 1,225 | | | | 900 | | | | | | | | | | | | | Subtotal | | | | | 814,869 | | | | 807,425 | | | | | | 832,339 | | | | 838,615 | | Foreign exchange translation adjustment | | | | | (4,867 | ) | | | (1,588 | ) | | | | | (9,569 | ) | | | (9,167 | ) | | | | | | | | | | | Total gross intangible assets | | | | $ | 810,002 | | | $ | 805,837 | | | | | $ | 822,770 | | | $ | 829,448 | | | | | | | | | | | | Accumulated amortization: | | | | | | | | | | | | | | | | | Customer relationships | | | | $ | (143,325 | ) | | $ | (119,058 | ) | | Trademarks/trade names | | | | | (93,476 | ) | | | (81,545 | ) | | Technology/software | | | | | (175,209 | ) | | | (167,083 | ) | | Customer relationships(1) | | | | | $ | (209,867 | ) | | $ | (189,100 | ) | Trademarks/trade names(1) | | | | | | (123,345 | ) | | | (116,691 | ) | Technology/software(1), (2) | | | | | | (198,974 | ) | | | (193,095 | ) | Proprietary data | | | | | (6,698 | ) | | | (4,589 | ) | | | | | (12,197 | ) | | | (10,352 | ) | Covenant not to compete | | | | | (665 | ) | | | (187 | ) | | | | | | | | | | | | Subtotal | | | | | (419,373 | ) | | | (372,462 | ) | | | | | (544,383 | ) | | | (509,238 | ) | Foreign exchange translation adjustment | | | | | 861 | | | | 253 | | | | | | 2,416 | | | | 1,626 | | | | | | | | | | | | Total accumulated amortization | | | | $ | (418,512 | ) | | $ | (372,209 | ) | | | | $ | (541,967 | ) | | $ | (507,612 | ) | | | | | | | | | | | | Net intangible assets: | | | | | | | | | | | | | | | | | Customer relationships | | | | $ | 218,421 | | | $ | 241,777 | | | | | $ | 146,833 | | | $ | 172,099 | | Trademarks/trade names | | | | | 129,906 | | | | 141,837 | | | | | | 84,975 | | | | 106,691 | | Technology/software | | | | | 24,680 | | | | 26,598 | | | | | | 39,718 | | | | 32,312 | | Proprietary data | | | | | 21,929 | | | | 24,038 | | | | | | 16,430 | | | | 18,275 | | Covenant not to compete | | | | | 560 | | | | 713 | | | | | | | | | | | | | Subtotal | | | | | 395,496 | | | | 434,963 | | | | | | 287,956 | | | | 329,377 | | Foreign exchange translation adjustment | | | | | (4,006 | ) | | | (1,335 | ) | | | | | (7,153 | ) | | | (7,541 | ) | | | | | | | | | | | Total net intangible assets | | | | $ | 391,490 | | | $ | 433,628 | | | | | $ | 280,803 | | | $ | 321,836 | | | | | | | | | | | |
(1) | Intangible assets and the associated accumulated amortization as of December 31, 2014 reflect the disposition and addition of intangible assets associated with the sale of ISS and acquisition of GMI Ratings, respectively. See Note 3, “Dispositions and Discontinued Operations,” and Note 12, “Acquisitions,” for additional information. |
(1) A portion of the change reflects the impact of the InvestorForce divestiture. See Note 12, “Divestitures” for further information regarding the InvestorForce divestiture. MSCI INC.
NOTES TO CONSOLIDATED FINANCIAL STATEMENTS(2) A portion of the change reflects the impact of the FEA divestiture. See Note 12, “Divestitures” for further information regarding the FEA divestiture.
Estimated amortization expense for succeeding years is presented below: Years Ending December 31, | | | Amortization Expense | | | | | | (in thousands) | | For the Years Ending December 31, | | Amortization
Expense | | | | | | (in thousands) | | | 2016 | | $ | 47,965 | | | 2017 | | | 43,097 | | | 2018 | | | 39,863 | | | 2019 | | | 37,853 | | | $ | 47,886 | | 2020 | | | 36,106 | | | | 46,339 | | 2021 | | | | 42,286 | | 2022 | | | | 35,819 | | 2023 | | | | 32,778 | | Thereafter | | | 186,606 | | | | 75,695 | | | | | | | | Total | | $ | 391,490 | | | $ | 280,803 | | | | | | |
9.F-24
8. EMPLOYEE BENEFITS The Company sponsors a 401(k) plan for eligible U.S. employees and defined contribution and defined benefit pension plans that cover substantially all of its non-U.S. employees. For the years ended December 31, 2015, 20142018, 2017 and 2013,2016, costs relating to 401(k), pension and post-retirement benefit expenses were $23.1$22.8 million, $22.2$22.5 million and $18.2$21.6 million, respectively.respectively, which are included in various categories on the Company’s Consolidated Statements of Income. Amounts included in cost“Cost of revenuesrevenues” for the years ended December 31, 2015, 20142018, 2017 and 20132016 were $10.7$10.2 million, $9.9$10.3 million and $8.4$9.5 million, respectively. Amounts included in selling“Selling and marketingmarketing” for the years ended December 31, 2015, 20142018, 2017 and 20132016 were $6.8$6.9 million, $7.2$6.5 million and $5.6$6.7 million, respectively. Amounts included in research“Research and developmentdevelopment” for the years ended December 31, 2015, 20142018, 2017 and 20132016 were $4.0$3.8 million, $3.7$3.8 million and $3.0$4.0 million, respectively. Amounts included in general“General and administrativeadministrative” for the years ended December 31, 2015, 20142018, 2017 and 20132016 were $1.6$1.8 million, $1.3 million and $1.2$1.3 million, respectively. Amounts included in “Other expense (income)” for the years ended December 31, 2018 and 2017 were less than $0.1 million and $0.6 million, respectively. 401(k) and Other Defined Contribution Plans. Eligible employees may participate in the MSCI 401(k) plan (or any other regional defined contribution plan sponsored by MSCI) immediately upon hire. Eligible employees receive 401(k) and other defined contribution plan matching contributions, which are subject to vesting and certain other limitations. The Company’s expenses associated with the 401(k) plan and other defined contribution plans for the years ended December 31, 2015, 20142018, 2017 and 20132016 were $18.4$19.2 million, $19.3$18.6 million and $15.7$17.6 million, respectively. Net Periodic Benefit Expense. Net periodic benefit expense incurred by the Company related to defined benefit pension plans was $4.7$3.6 million, $2.8$3.9 million and $2.5$4.0 million for the years ended December 31, 2015, 20142018, 2017 and 2013,2016, respectively. The Company uses a measurement date of December 31 to calculate obligations under its pension and postretirement plans. As of December 31, 20152018 and 2014,2017, the Company carried a $17.1net liability of $21.3 million and $16.7$22.0 million, respectively, net liability in other“Other non-current liabilitiesliabilities” on itsthe Consolidated Statement of Financial Condition related to its future pension obligations. The fair value of the defined benefit plan assets were $16.4$21.7 million and $14.3$20.6 million at December 31, 20152018 and 2014,2017, respectively. 10.
9. SHAREHOLDERS’ EQUITY (DEFICIT) The followingThis note reflects the share repurchases and related activity as well as share-based compensation activity recognized by the Company, including the amounts recognized in both continuing operations and discontinued operations for all periods referenced.
MSCI INC.
NOTES TO CONSOLIDATED FINANCIAL STATEMENTS
Return of capital.capital On December 13, 2012,October 26, 2016, the Board of Directors approved a stock repurchase program authorizingfor the purchase of up to $300.0$750.0 million worth of shares of MSCI’sthe Company’s common stock beginning immediately and continuing through December 31, 2014 (the “2012(together with the amount then remaining under a previously existing share repurchase program, the “2016 Repurchase Program”). Prior to 2014, the Company repurchased an aggregate of $200.0 million worth of shares through multiple accelerated share repurchase (“ASR”) agreements under the 2012 Repurchase Program. On February 6, 2014, MSCI utilized the remaining $100.0 million repurchase authorization provided by the 2012 Repurchase Program.
On February 4, 2014,May 1, 2018, the Board of Directors approved aauthorized an additional stock repurchase program authorizing the purchase of up to $300.0 million worth of shares of MSCI’s common stock, which was increased to $850.0 million on September 17, 2014 (the “2014 Repurchase Program”). On October 14, 2015, the Company exhausted the $850.0 million share repurchase authorization under the 2014 Repurchase Program. On October 28, 2015, the Board of Directors approved a new stock repurchase program authorizingfor the purchase of up to $1.0 billion worth of shares of MSCI’sthe Company’s common stock (the “2015(together with the $523.1 million of authorization then remaining under the 2016 Repurchase Program, the “2018 Repurchase Program”). Share repurchases made pursuant to the 20152018 Repurchase Program may take place in the open market or in privately negotiated transactions from time to time based on market and other conditions. This authorization may be modified, suspended or terminated by the Board of Directors at any time without prior notice.
On September 18, 2014, as part of the 2014 Repurchase Program, the Company entered into an ASR agreement to initiate share repurchases aggregating $300.0 million (the “September 2014 ASR Agreement”). As a result of the September 2014 ASR Agreement, the Company received approximately 4.5 million shares of MSCI’s common stock on September 19, 2014 and approximately 1.2 million shares of MSCI’s common stock on May 21, 2015 for a combined average price of $52.79 per share.
On June 2, 2015, the Company began purchasing shares of its common stock on the open market in accordance with SEC Rule 10b5-1. Through December 31, 2015, the Company paid $670.8 million to receive approximately 10.7 million shares on the open market as part of both the 2014 Repurchase Program and the 2015 Repurchase Program.
Pursuant to the 2014 Repurchase Program and the 2015 Repurchase Program, as of December 31, 20152018, there was $808.1 million of available authorization remaining under the Company purchased a total of 16.4 million shares for an average purchase price of $59.22 per share.2018 Repurchase Program.
Since the announcement
F-25
The following table provides information with respect to repurchases of the September 2014 $1.0 billion capital return plan and through December 31, 2015, approximately $1.1 billion was returned through share repurchases and cash dividends and a total of $1.4 billion was returnedCompany’s common stock pursuant to shareholders since 2012.open market repurchases: Year Ended | | Average Price Paid Per Share | | | Total Number of Shares Repurchased | | | Dollar Value of Shares Repurchased | | | | (in thousands, except per share data) | | December 31, 2018 | | $ | 148.34 | | | | 6,236 | | | $ | 924,989 | | December 31, 2017 | | $ | 87.96 | | | | 1,556 | | | $ | 136,899 | | December 31, 2016 | | $ | 73.71 | | | | 10,303 | | | $ | 759,427 | |
The following table presents cash dividends declared and distributed per common share for the periods indicated: | | | | | | | | | | | | Dividends
Per Share | | | Amount
(in thousands) | | 2014: | | | | | | | | | Fourth quarter | | $ | 0.18 | | | $ | 20,393 | | | | | | | | | | | | | | 2015: | | | | | | | | | First quarter | | $ | 0.18 | | | $ | 20,411 | | Second quarter | | | 0.18 | | | | 20,442 | | Third quarter | | | 0.22 | | | | 24,152 | | Fourth quarter | | | 0.22 | | | | 22,792 | | | | | | | | | | | Total cash dividends declared and distributed | | $ | 0.80 | | | $ | 87,797 | | | | | | | | | | |
MSCI INC.
NOTES TO CONSOLIDATED FINANCIAL STATEMENTS
| | Dividends | | | | Per Share | | | Declared | | | Distributed | | | Deferred | | 2018 | | (in thousands, except per share data) | | Three Months Ended March 31, | | $ | 0.38 | | | $ | 34,848 | | | $ | 34,900 | | | $ | (52 | ) | Three Months Ended June 30, | | | 0.38 | | | | 34,254 | | | | 33,935 | | | | 319 | | Three Months Ended September 30, | | | 0.58 | | | | 52,264 | | | | 51,764 | | | | 500 | | Three Months Ended December 31, | | | 0.58 | | | | 50,907 | | | | 50,434 | | | | 473 | | Year Ended December 31, | | $ | 1.92 | | | $ | 172,273 | | | $ | 171,033 | | | $ | 1,240 | | 2017 | | | | | | | | | | | | | | | | | Three Months Ended March 31, | | $ | 0.28 | | | $ | 25,769 | | | $ | 25,500 | | | $ | 269 | | Three Months Ended June 30, | | | 0.28 | | | | 25,710 | | | | 25,444 | | | | 266 | | Three Months Ended September 30, | | | 0.38 | | | | 34,768 | | | | 34,403 | | | | 365 | | Three Months Ended December 31, | | | 0.38 | | | | 34,745 | | | | 34,448 | | | | 297 | | Year Ended December 31, | | $ | 1.32 | | | $ | 120,992 | | | $ | 119,795 | | | $ | 1,197 | | 2016 | | | | | | | | | | | | | | | | | Three Months Ended March 31, | | $ | 0.22 | | | $ | 22,046 | | | $ | 21,889 | | | $ | 157 | | Three Months Ended June 30, | | 0.22 | | | | 21,588 | | | | 21,391 | | | | 197 | | Three Months Ended September 30, | | 0.28 | | | | 26,936 | | | | 26,680 | | | | 256 | | Three Months Ended December 31, | | 0.28 | | | | 26,524 | | | | 26,304 | | | | 220 | | Year Ended December 31, | | $ | 1.00 | | | $ | 97,094 | | | $ | 96,264 | | | $ | 830 | |
F-26
Common Stock.Stock The following table presents activity related to shares of common stock issued and repurchased for the periods indicated: | | | | | | | | | | | | | | | | Common
Stock Issued | | | Treasury
Stock | | | Common Stock
Outstanding | | | | | | Balance At December 31, 2012 | | | 124,033,980 | | | | (3,919,394 | ) | | | 120,114,586 | | Common stock issued and exercise of stock options | | | 1,517,381 | | | | — | | | | 1,517,381 | | Shares received for taxes and exercise price of stock awards | | | — | | | | (352,086 | ) | | | (352,086 | ) | Shares received under stock repurchase programs | | | — | | | | (3,197,371 | ) | | | (3,197,371 | ) | Stock issued to Directors and held in Treasury | | | 3,907 | | | | (3,306 | ) | | | 601 | | | | | | | | | | | | | | | Balance At December 31, 2013 | | | 125,555,268 | | | | (7,472,157 | ) | | | 118,083,111 | | Dividend payable/paid | | | 99 | | | | (99 | ) | | | — | | Common stock issued and exercise of stock options | | | 1,076,751 | | | | — | | | | 1,076,751 | | Shares received for taxes and exercise price of stock awards | | | — | | | | (233,163 | ) | | | (233,163 | ) | Shares received under stock repurchase programs | | | — | | | | (6,856,866 | ) | | | (6,856,866 | ) | Stock issued to Directors and held in Treasury | | | 5,272 | | | | (2,636 | ) | | | 2,636 | | | | | | | | | | | | | | | Balance At December 31, 2014 | | | 126,637,390 | | | | (14,564,921 | ) | | | 112,072,469 | | Dividend payable/paid | | | 802 | | | | (385 | ) | | | 417 | | Common stock issued and exercise of stock options | | | 1,558,965 | | | | — | | | | 1,558,965 | | Shares received for taxes and exercise price of stock awards | | | — | | | | (763,558 | ) | | | (763,558 | ) | Shares received under stock repurchase programs | | | — | | | | (11,856,169 | ) | | | (11,856,169 | ) | Stock issued to Directors and held in Treasury | | | 3,032 | | | | (2,008 | ) | | | 1,024 | | | | | | | | | | | | | | | Balance At December 31, 2015 | | | 128,200,189 | | | | (27,187,041 | ) | | | 101,013,148 | | | | | | | | | | | | | | |
| | Common | | | Treasury | | | Common Stock | | | | Stock Issued | | | Stock | | | Outstanding | | Balance At December 31, 2015 | | | 128,200,189 | | | | (27,187,041 | ) | | | 101,013,148 | | Dividend payable/paid | | | 892 | | | | (472 | ) | | | 420 | | Common stock issued and exercise of stock options | | | 788,304 | | | | — | | | | 788,304 | | Shares withheld for tax withholding and exercises | | | — | | | | (219,921 | ) | | | (219,921 | ) | Shares repurchased under stock repurchase programs | | | — | | | | (10,303,047 | ) | | | (10,303,047 | ) | Shares issued to directors | | | 6,959 | | | | (6,273 | ) | | | 686 | | Balance At December 31, 2016 | | | 128,996,344 | | | | (37,716,754 | ) | | | 91,279,590 | | Dividend payable/paid | | | 684 | | | | (528 | ) | | | 156 | | Common stock issued and exercise of stock options | | | 538,448 | | | | — | | | | 538,448 | | Shares withheld for tax withholding and exercises | | | — | | | | (157,667 | ) | | | (157,667 | ) | Shares repurchased under stock repurchase programs | | | — | | | | (1,556,313 | ) | | | (1,556,313 | ) | Shares issued to directors | | | 8,380 | | | | (7,709 | ) | | | 671 | | Balance At December 31, 2017 | | | 129,543,856 | | | | (39,438,971 | ) | | | 90,104,885 | | Dividend payable/paid | | | 734 | | | | (579 | ) | | | 155 | | Common stock issued and exercise of stock options | | | 479,277 | | | | — | | | | 479,277 | | Shares withheld for tax withholding and exercises | | | — | | | | (174,991 | ) | | | (174,991 | ) | Shares repurchased under stock repurchase programs | | | — | | | | (6,235,629 | ) | | | (6,235,629 | ) | Shares issued to directors | | | 6,059 | | | | (5,618 | ) | | | 441 | | Balance At December 31, 2018 | | | 130,029,926 | | | | (45,855,788 | ) | | | 84,174,138 | |
Shared-Based Compensation.Compensation The Company regularly issues share-based compensation to its employees and directors who wereare not employees of the Company. The accounting guidance for share-based compensation requires measurement of compensation cost for share-based awards at fair value and recognition of compensation cost over the service period, net of estimated forfeitures. In February 2016,2019, the Company granted a portion of its employees with awards in the form of RSUs and MSUs. The total number of units granted was 711,329.396,090. The aggregate fair value of the awards was $42.5$50.4 million, of which approximately $9.8$0.2 million had been expensed in the year ended December 31, 20152018 in relation to awards granted to retirement eligibleretirement-eligible employees under the award terms. A portion of the awards granted consisted of RSUs vesting over a three-year period, with one-third vesting on each anniversary of the grant in MSCI INC.
NOTES TO CONSOLIDATED FINANCIAL STATEMENTS
2017, 2018 2020, 2021 and 2019.2022. A smaller portion of the awards granted consisted of MSUs that will time-vest over a three yearthree-year period and a five-year period and are subject to the achievement of the applicable absolute total shareholder return compounded annual growth rate and relative total shareholder return compounded annual growth rate performance metrics measured over a minimum three-year performance period. Theand five-year performance period, may also be extended for an additional period of six months only in the event that both of the performance metrics achieved by the Company are below specified threshold performance levels.
Certain MSU awards were also granted under an equity compensation plan that was approved by the Board, but remains subject to shareholder approval. As a result, these awards are not considered to have been granted in accordance with ASC Subtopic 718-10. If the plan is approved, the fair value of the target number of shares underlying such awards will be determined as of the grant date, which will coincide with shareholder approval of the equity compensation plan. These awards are subject to achievement of the same performance metrics as those for the MSUs granted in February 2016 and will vest at the same time.respectively.
For a small group of awards granted by the Company, all or a portion of the award may be cancelled in certain limited situations, including termination for cause, if employment is terminated before the end of the relevant restriction period. For the remainder of the awards granted by the Company, all or a portion of the award may be cancelledcanceled if employment is terminated for certain reasons before the end of the relevant restriction period for non-retirement-eligible employees. In connection with awards under its equity-based compensation and benefit plans, the Company is authorized to use newly issued shares or certain shares of common stock held in treasury. F-27
The components of share-based compensation expense related to the awards to Company employees and directors who are not employees of the Company of restricted stock units and restricted stock awards (representing shares of common stock) and options to purchase shares of common stock, as applicable, are presented below: | | | | | | | | | | | | | | (in thousands) | | Years Ended | | | | December 31,
2015 | | | December 31,
2014 | | | December 31,
2013 | | | | | | Deferred stock | | $ | 27,549 | | | $ | 25,830 | | | $ | 23,910 | | Stock options | | | (73 | ) | | | 1,201 | | | | 1,643 | | | | | | | | | | | | | | | | | | | Total | | $ | 27,476 | | | $ | 27,031 | | | $ | 25,553 | | | | | | | | | | | | | | |
| | Years Ended | | | | December 31, | | | December 31, | | | December 31, | | (in thousands) | | 2018 | | | 2017 | | | 2016 | | Share-based Awards | | $ | 40,563 | | | $ | 37,921 | | | $ | 32,525 | |
The following table presents the amount of share-based compensation expense by category for the periods indicated: | | | | | | | | | | | | | | (in thousands) | | Years Ended | | | | December 31,
2015 | | | December 31,
2014 | | | December 31,
2013 | | | | | | Cost of revenues | | $ | 6,909 | | | $ | 7,187 | | | $ | 7,490 | | Selling and marketing | | | 6,564 | | | | 7,296 | | | | 5,721 | | Research and development | | | 2,823 | | | | 3,128 | | | | 2,283 | | General and administrative | | | 11,180 | | | | 8,005 | | | | 7,277 | | | | | | | | | | | | | | | | | | | Total share-based compensation expense | | $ | 27,476 | | | $ | 25,616 | | | $ | 22,771 | | | | | | | | | | | | | | |
MSCI INC.
NOTES TO CONSOLIDATED FINANCIAL STATEMENTS
| | Years Ended | | | | December 31, | | | December 31, | | | December 31, | | (in thousands) | | 2018 | | | 2017 | | | 2016 | | Cost of revenues | | $ | 10,334 | | | $ | 9,707 | | | $ | 7,971 | | Selling and marketing | | | 12,851 | | | | 11,355 | | | | 9,526 | | Research and development | | | 4,175 | | | | 3,477 | | | | 2,970 | | General and administrative | | | 13,203 | | | | 13,382 | | | | 12,058 | | Total share-based compensation expense | | $ | 40,563 | | | $ | 37,921 | | | $ | 32,525 | |
There was no share-based compensation expense included in income (loss) from discontinued operations, net of income taxes for the year ended December 31, 2015. The amount included in income (loss) from discontinued operations, net of income taxes for the years ended December 31, 2014 and 2013 was $1.4 million and $2.8 million, respectively.
The tax benefits for share-based compensation expense related to deferred stockRSUs, PSUs and MSUs (together, the “Share-based Awards”) as well as stock options granted to Company employees and to directors who are not employees of the Company were $15.3$8.8 million, $2.8$5.5 million and $2.6$7.4 million for the years ended December 31, 2015, 20142018, 2017 and 2013,2016, respectively. As of December 31, 2015, $14.52018, $24.6 million of compensation cost related to MSCI unvested share-based awards granted to the Company’s employees and to directors who are not employees of the Company had not yet been recognized. The unrecognized compensation cost relating to unvested stock-based awards expected to vest will be recognized primarily over the next one to three years. In connection with awards under its equity-based compensation and benefit plans, the Company is authorized to issue shares of common stock. As of December 31, 2015, 6.72018, 7.0 million shares of common stock were available for future grants under these plans. Deferred StockShare-based Awards. Certain Company employees have been granted deferred stockshare-based awards pursuant to a share-based compensation plan. The plan provides for the deferral of a portion of certain employees’ discretionary compensation with awards made in the form of RSUs, PSUs and restricted stock awards (together, the “Deferred Stock Awards”).Share-based Awards. Recipients of RSUs, restricted stock awards and PSUs granted prior to January 2014 generally have rights to receive dividend equivalents that are not subject to vesting. Recipients of RSUs and PSUs granted in January 2014 and thereafterShare-based Awards generally have rights to receive dividend equivalents that are subject to vesting. The Company reports the target number of PSUs and MSUs granted unless it has determined, based on the actual achievement of performance measures, that an employee will receive a different amount of shares underlying the PSUs and MSUs, in which case the Company reports the amount of shares employees are likely to receive.
F-28
The following table presents activity concerning the Company’s vested and unvested deferred stock awardsShare-based Awards applicable to its employees (share data in thousands) for the period indicated: | | | | | | | | | | Weighted | | For the Year Ended December 31, 2015 | | Number of
Shares | | | Weighted
Average
Grant
Date Fair
Value | | | Vested and unvested deferred stock awards at December 31, 2014(1) | | | 1,213 | | | $ | 37.82 | | | | | | | | | | Average | | | | | | | | | Grant | | | | | Number of | | | Date Fair | | For the Year Ended December 31, 2018 | | | Shares | | | Value | | Vested and unvested Share-based Awards at December 31, 2017 | | | | 1,419 | | | $ | 68.50 | | Granted | | | 634 | | | $ | 55.20 | | | | 332 | | | $ | 117.64 | | Conversion to common stock | | | (640 | ) | | $ | 36.55 | | | | (451 | ) | | $ | 65.40 | | Canceled | | | (132 | ) | | $ | 47.47 | | | | (12 | ) | | $ | 87.17 | | | | | | | | | | Vested and unvested deferred stock awards at December 31, 2015 | | | 1,075 | | | $ | 47.70 | | | | | | | | | | Vested and unvested Share-based Awards at December 31, 2018 (1) | | | | 1,288 | | | $ | 82.09 | |
(1) | As of December 31, 2015, 1,054 restricted stock units and restricted stock awards,2018, 1,261 Share-based Awards, with a weighted average price of $47.60,$81.51, were vested or expected to vest. |
The total fair value of Deferred StockShare-based Awards held by the Company’s employees that converted to MSCI common stock during the years ended December 31, 2015, 20142018, 2017 and 20132016 was $34.1$63.6 million, $24.5$30.3 million and $28.2$39.4 million, respectively. MSCI INC.
NOTES TO CONSOLIDATED FINANCIAL STATEMENTS
The following table presents activity concerning the Company’s unvested deferred stock awardsShare-based Awards related to its employees (share data in thousands): | | | | | | | | | For the Year Ended December 31, 2015 | | Number of
Shares | | | Weighted
Average
Grant
Date Fair
Value | | Unvested deferred stock awards at December 31, 2014 | | | 883 | | | $ | 37.99 | | Granted | | | 499 | | | $ | 55.45 | | Vested | | | (453 | ) | | $ | 37.18 | | Canceled | | | (129 | ) | | $ | 47.81 | | | | | | | | | | | | | | Unvested deferred stock awards at December 31, 2015 | | | 800 | | | $ | 47.83 | | | | | | | | | | | | | | Unvested deferred stock awards expected to vest | | | 779 | | | $ | 47.69 | | | | | | | | | | |
| | | | | | Weighted | | | | | | | | Average | | | | | | | | Grant | | | | Number of | | | Date Fair | | For the Year Ended December 31, 2018 | | Shares | | | Value | | Unvested Share-based Awards at December 31, 2017 | | | 1,166 | | | $ | 69.96 | | Granted | | | 280 | | | $ | 124.66 | | Vested | | | (332 | ) | | $ | 68.41 | | Canceled | | | (12 | ) | | $ | 87.17 | | Unvested Share-based Awards at December 31, 2018 | | | 1,102 | | | $ | 84.14 | | | | | | | | | | | Unvested Share-based Awards expected to vest | | | 1,075 | | | $ | 83.51 | |
Stock Option Awards.Awards. No MSCI stock options were issued during the years ended December 31, 20152018, 2017 and 2014. During the year ended December 31, 2013, the Company awarded stock options to certain of its employees. The award was valued using a Black-Scholes valuation model. The weighted average fair value of MSCI stock options issued by the Company in the year ended December 31, 2013 was $19.18 utilizing the following assumptions: | | | | | | | Assumptions | | Risk free interest rate
| | | 1.87 | % | Expected option life in years
| | | 6.50 | | Expected stock price volatility
| | | 46.07 | % | Expected dividend yield
| | | — | |
The expected stock price volatility assumption was determined using the historical volatility of the Company.2016.
The following table presents activity concerning MSCI stock options granted to the Company’s employees for the year ended December 31, 20152018 (option data and dollar values in thousands, except exercise price): | | | | | | | | | | | | | | | | | For the Year Ended December 31, 2015 | | Number of
Options | | | Weighted
Average
Exercise
Price | | | Weighted
Average
Remaining
Life
(Years) | | | Aggregated
Intrinsic
Value | | Options outstanding at December 31, 2014 | | | 1,487 | | | $ | 22.69 | | | | 3.76 | | | | N/A | | Granted or assumed | | | — | | | $ | — | | | | N/A | | | | N/A | | Forfeited | | | (63 | ) | | $ | 40.14 | | | | N/A | | | | N/A | | Conversion to common stock | | | (939 | ) | | $ | 20.97 | | | | N/A | | | | N/A | | | | | | | | | | | | | | | | | | | | | | | | Options outstanding at December 31, 2015 | | | 485 | | | $ | 23.77 | | | | 2.40 | | | $ | 23,432 | | | | | | | | | | | | | | | | | | | | | | | | Options exercisable at December 31, 2015 | | | 435 | | | $ | 22.29 | | | | 2.68 | | | $ | 21,669 | | | | | | | | | | | | | | | | | | | | | | | | Options vested or expected to vest | | | 485 | | | $ | 23.77 | | | | 2.40 | | | $ | 23,432 | | | | | | | | | | | | | | | | | | |
| | | | | | | | | | Weighted | | | | | | | | | | | | Weighted | | | Average | | | | | | | | Number | | | Average | | | Remaining | | | Aggregated | | | | of | | | Exercise | | | Life | | | Intrinsic | | For the Year Ended December 31, 2018 | | Options | | | Price | | | (Years) | | | Value | | Options outstanding at December 31, 2017 | | | 145 | | | $ | 26.47 | | | | 2.11 | | | $ | 14,519 | | Granted or assumed | | | — | | | $ | — | | | N/A | | | N/A | | Forfeited | | | — | | | $ | — | | | N/A | | | N/A | | Conversion to common stock | | | (33 | ) | | $ | 18.14 | | | N/A | | | N/A | | Options outstanding and exercisable at December 31, 2018 | | | 112 | | | $ | 28.96 | | | 1.28 | | | $ | 13,239 | |
F-29
MSCI INC.
NOTES TO CONSOLIDATED FINANCIAL STATEMENTSAll outstanding stock options as of December 31, 2018 are vested and exercisable.
The following table presents information relating to the Company’s outstanding and exercisable stock options as of December 31, 20152018 (number of options outstanding and aggregate intrinsic value data in thousands): | | | | | | | | | | | | | | | | | As of December 31, 2015 | | Options Outstanding | | | Range of Exercise Prices | | Number
Outstanding | | | Weighted
Average
Exercise
Price | | | Average
Remaining
Life (Years) | | | Aggregate
Intrinsic
Value | | $9.92 to $16.48 | | | 55 | | | $ | 15.54 | | | | 2.80 | | | $ | 3,109 | | $18.00 | | | 134 | | | $ | 18.00 | | | | 1.87 | | | $ | 7,260 | | $20.45 to $24.11 | | | 153 | | | $ | 22.45 | | | | 1.95 | | | $ | 7,581 | | $25.64 to $40.23 | | | 143 | | | $ | 33.75 | | | | 3.23 | | | $ | 5,482 | | | | | | | | | | | | | | | | | | | | | | | | Total | | | 485 | | | | | | | | | | | $ | 23,432 | | | | | | | | | | | | | | | | | | |
The following table presents information relating to the Company’s exercisable stock options as of December 31, 2015 (number of options outstanding and aggregate intrinsic value data in thousands):
As of December 31, 2018 | | | Options Outstanding | | | | | | | | | | Weighted | | | Average | | | | | | | | | | | | | | Average | | | Remaining | | | Aggregate | | | | | | Number | | | Exercise | | | Life | | | Intrinsic | | Range of Exercise Prices | | | Outstanding | | | Price | | | (Years) | | | Value | | $15.18 to $16.48 | | | | 12 | | | $ | 16.48 | | | | 0.15 | | | $ | 1,521 | | $20.45 to $24.11 | | | | 14 | | | $ | 20.45 | | | | 0.65 | | | $ | 1,798 | | $ | 25.64 | | | | 36 | | | $ | 25.64 | | | | 0.96 | | | $ | 4,409 | | $ | 36.70 | | | | 50 | | | $ | 36.70 | | | | 1.95 | | | $ | 5,511 | | Total | | | | 112 | | | | | | | | | | | $ | 13,239 | |
| | | | | | | | | | | | | | | | | As of December 31, 2015 | | Options Exercisable | | | Range of Exercise Prices | | Number
Outstanding | | | Weighted
Average
Exercise
Price | | | Average
Remaining
Life (Years) | | | Aggregate
Intrinsic
Value | | $9.92 to $16.48 | | | 55 | | | $ | 15.54 | | | | 2.80 | | | $ | 3,109 | | $18.00 | | | 134 | | | $ | 18.00 | | | | 1.87 | | | $ | 7,260 | | $20.45 to $24.11 | | | 153 | | | $ | 22.45 | | | | 1.95 | | | $ | 7,581 | | $25.64 to $40.23 | | | 93 | | | $ | 32.18 | | | | 2.31 | | | $ | 3,719 | | | | | | | | | | | | | | | | | | | | | | | | Total | | | 435 | | | | | | | | | | | $ | 21,669 | | | | | | | | | | | | | | | | | | |
The intrinsic value of the stock options exercised by the Company’s employees during the years ended December 31, 2015, 20142018, 2017 and 20132016 was $37.3$4.8 million, $12.8$10.9 million and $13.9$11.3 million, respectively. MSCI INC.
NOTES TO CONSOLIDATED FINANCIAL STATEMENTS
10. RECLASSIFICATIONS OUT OF ACCUMULATED OTHER COMPREHENSIVE INCOME (LOSS) As required by ASC Subtopic 220-10, “Comprehensive Income—Overall,” the following table presents the amounts reclassified from accumulated other comprehensive income (loss) by the respective line item in the Consolidated Statement of Income: Reclassifications Out of Accumulated Other Comprehensive Income (Loss) (1) | | | | | | | | | | | | | | | Details about Accumulated Other | | Amount Reclassified from Accumulated | | | Affected Line Item in the | Comprehensive Income (Loss) Components | | Other Comprehensive Income (Loss) | | | Consolidated Statements of Income | | | Years Ended | | | | | | December 31, | | | December 31, | | | December 31, | | | | | | 2018 | | | 2017 | | | 2016 | | | | | | | | | | (in thousands) | | | | | | | | Defined benefit pension plans | | | | | | | | | | | | | | | Amount recognized as a component of net periodic benefit expense for curtailments and settlements | | $ | (222 | ) | | $ | (281 | ) | | $ | (261 | ) | | | Income Taxes | | 54 | | | 77 | | | 73 | | | Provision for income taxes | Total reclassifications for the period, net of tax | | $ | (168 | ) | | $ | (204 | ) | | $ | (188 | ) | | |
(1) | Amounts in parentheses indicate expenses or losses moved to the Consolidated Statements of Income. |
F-30
11. INCOME TAXES The provision for income taxes (benefits) by taxing jurisdiction consisted of: | | | | | | | | Years Ended | | | | | Years Ended | | | December 31, | | | December 31, | | | December 31, | | | | | December 31,
2015 | | | December 31,
2014 | | | December 31,
2013 | | | 2018 | | | 2017 | | | 2016 | | | | | (in thousands) | | | (in thousands) | | Current | | | | | | | | | | | | | | | | | | | U.S. federal | | $ | 85,540 | | | $ | 84,959 | | | $ | 97,739 | | | $ | 51,316 | | | $ | 133,250 | | | $ | 93,071 | | U.S. state and local | | | 22,108 | | | | 13,929 | | | | 16,820 | | | | 31,680 | | | | 16,312 | | | | 16,363 | | Non U.S. | | | 22,156 | | | | 18,505 | | | | 18,270 | | | | 39,795 | | | | 32,267 | | | | 32,616 | | | | | | | | | | | | | | 122,791 | | | | 181,829 | | | | 142,050 | | | | | | 129,804 | | | | 117,393 | | | | 132,829 | | | | | | | | | | | | | | Deferred | | | | | | | | | | | | | | | | | | | U.S. federal | | | (10,546 | ) | | | (2,606 | ) | | | (14,362 | ) | | | (1,406 | ) | | | (12,502 | ) | | | (13,010 | ) | U.S. state and local | | | 1,460 | | | | (3,356 | ) | | | (3,802 | ) | | | 5,566 | | | | (2,119 | ) | | | (2,235 | ) | Non U.S. | | | (1,202 | ) | | | (2,035 | ) | | | (1,747 | ) | | | (4,940 | ) | | | (4,281 | ) | | | (1,722 | ) | | | | | | | | | | | | | (780 | ) | | | (18,902 | ) | | | (16,967 | ) | | | | | | | | | | | | | | | | | | (10,288 | ) | | | (7,997 | ) | | | (19,911 | ) | | | | | | | | | | | | | | Provision for income taxes from continuing operations | | $ | 119,516 | | | $ | 109,396 | | | $ | 112,918 | | | | | | | | | | | | | | | Provision for income taxes from discontinued operations | | $ | 6,390 | | | $ | 1,059 | | | $ | 10,146 | | | | | | | | | | | | | | Provision for income taxes | | | $ | 122,011 | | | $ | 162,927 | | | $ | 125,083 | |
The following table reconciles the provision to the U.S. federal statutory income tax rate to the effective income tax rate: | | Years Ended | | | | December 31, | | | December 31, | | | December 31, | | | | 2018 | | | 2017 | | | 2016 | | U.S. federal statutory income tax rate | | | 21.00 | % | | | 35.00 | % | | | 35.00 | % | U.S. state and local income taxes, net of U.S. federal income tax benefits | | | 4.66 | % | | | 1.84 | % | | | 2.38 | % | Change in tax rates applicable to non-U.S. earnings | | | (2.20 | %) | | | (7.60 | %) | | | (3.73 | %) | Domestic tax credits and incentives | | | (0.30 | %) | | | (0.24 | %) | | | (0.26 | %) | Net tax charge related to Tax Reform | | | (1.78 | %) | | | 7.40 | % | | | — | % | Valuation allowance | | | (1.41 | %) | | | — | % | | | — | % | Excess Stock Based Compensation | | | (1.14 | %) | | | (1.25 | %) | | | — | % | Other | | | 0.54 | % | | | (0.25 | %) | | | (0.98 | %) | Effective income tax rate | | | 19.37 | % | | | 34.90 | % | | | 32.41 | % |
On December 22, 2017, the U.S. government enacted comprehensive tax legislation commonly referred to as the Tax Cuts and Jobs Act (“Tax Reform”). Given the significance of the legislation, the SEC staff issued Staff Accounting Bulletin No. 118, “Income Tax Accounting Implications of the Tax Cuts and Jobs Act,” (“SAB 118”), which allowed registrants to record provisional amounts during a one year “measurement period” similar to that used when accounting for business combinations. Tax Reform significantly revised the U.S. corporate income tax by, among other things, lowering U.S. corporate income tax rates, implementing a territorial tax system and imposing a one-time tax on deemed repatriation of historic earnings and profits (“E&P”) of foreign subsidiaries (the “Toll Charge”). The provisions of Tax Reform began impacting the Company for the annual reporting periods, including interim periods within those periods, beginning after December 31, 2017 as well as during the three months ended December 31, 2017. The U.S. federal income tax rate reduction was effective as of January 1, 2018. In the year ended December 31, 2017, the Company’s provisional accounting for the effects of Tax Reform resulted in a net charge of $34.5 million in the provision for income taxes for MSCI that primarily included an estimated tax charge of approximately $47.5 million related to the Toll Charge and an estimated tax charge of approximately $16.0 million related to a change in assertion that those profits were permanently reinvested overseas F-31
as of December 31, 2017, partially offset by an estimated tax benefit of approximately $29.0 million related to the revaluation of deferred taxes at the now-lower statutory corporate rate. In the year ended December 31, 2018, the Company finalized the Toll Charge and determined the final impact of Tax Reform, resulting in a net benefit of $11.2 million that included a benefit of $5.7 million on the change to the provisional estimate of the Toll Charge and a benefit of $2.6 million for a reduction in the expected withholding taxes from continuing operations: | | | | | | | | | | | | | | | | Years Ended | | | | | December 31,
2015 | | | December 31,
2014 | | | December 31,
2013 | | U.S. federal statutory income tax rate | | | 35.00 | % | | | 35.00 | % | | | 35.00 | % | U.S. state and local income taxes, net of U.S. federal income tax benefits | | | 4.44 | % | | | 2.72 | % | | | 3.05 | % | Change in tax rates applicable to non-U.S. earnings | | | (2.73 | %) | | | (1.88 | %) | | | (0.93 | %) | Domestic tax credits and incentives | | | (2.62 | %) | | | (0.86 | %) | | | (0.95 | %) | Other | | | 0.10 | % | | | 0.50 | % | | | (0.07 | %) | | | | | | | | | | | | | | | | | | Effective income tax rate | | | 34.19 | % | | | 35.48 | % | | | 36.10 | % | | | | | | | | | | | | | |
MSCI INC.
NOTES TO CONSOLIDATED FINANCIAL STATEMENTS
Switzerland. The Company also recorded a benefit of $2.9 million related to the revaluation of deferred taxes at the lower statutory rate as a result of tax planning. The cumulative net charge of Tax Reform was $23.3 million. Deferred income taxes reflect the net tax effects of temporary differences between the financial reporting and tax bases of assets and liabilities and are measured using the enacted tax rates and laws that will be in effect when such differences are expected to reverse. Significant components of the Company’s deferred tax assets and liabilities as of December 31, 20152018 and 2014,2017, were as follows: | | | | | | As of | | | | | As of | | | December 31, | | | December 31, | | | | | December 31,
2015 | | | December 31,
2014 | | | 2018 | | | 2017 | | | | | (in thousands) | | | (in thousands) | | Deferred tax assets: | | | | | | | | | | | | | Employee compensation and benefit plans | | $ | 23,700 | | | $ | 24,765 | | | $ | 19,698 | | | $ | 19,646 | | Deferred rent | | | 7,485 | | | | 7,229 | | | | 5,392 | | | | 5,308 | | State taxes | | | — | | | | 2,322 | | | Pension | | | 2,030 | | | | 2,494 | | | | 2,466 | | | | 1,520 | | Unearned revenue | | | 1,555 | | | | 1,117 | | | | — | | | | 853 | | Loss carryforwards – current | | | — | | | | 1,667 | | | Loss carryforwards – non-current | | | 33,389 | | | | 34,249 | | | Loss carryforwards - non-current | | | | 2,941 | | | | 18,105 | | Other | | | 678 | | | | 1,979 | | | | — | | | | 1,435 | | | | | | | | | | Subtotal | | | 68,837 | | | | 75,822 | | | | 30,497 | | | | 46,867 | | Less: valuation allowance | | | (21,052 | ) | | | (21,232 | ) | | | (632 | ) | | | (11,575 | ) | | | | | | | | | | Total deferred tax assets | | $ | 47,785 | | | $ | 54,590 | | | $ | 29,865 | | | $ | 35,292 | | | | | | | | | | Deferred tax liabilities: | | | | | | | | | | | | | Intangible assets | | $ | (138,832 | ) | | $ | (154,965 | ) | | $ | (65,538 | ) | | $ | (73,634 | ) | Foreign currency translation | | | (352 | ) | | | (629 | ) | | Unearned revenue | | | | (1,170 | ) | | | — | | Unremitted foreign earnings | | | | (12,872 | ) | | | (16,108 | ) | Property, equipment and leasehold improvements, net | | | (10,358 | ) | | | (10,435 | ) | | | (16,369 | ) | | | (11,564 | ) | Other | | | — | | | | (246 | ) | | | (1,021 | ) | | | — | | | | | | | | | | | Total deferred tax liabilities | | $ | (149,542 | ) | | $ | (166,275 | ) | | $ | (96,970 | ) | | $ | (101,306 | ) | | | | | | | | | | Net deferred tax liabilities | | $ | (101,757 | ) | | $ | (111,685 | ) | | $ | (67,105 | ) | | $ | (66,014 | ) | | | | | | | | |
As presented in
During the table above,year ended December 31, 2018, the Company has certainsold two of its U.S. subsidiaries, InvestorForce and FEA. See Note 12, “Divestitures,” for additional information. As a result of these divestitures, the Company was able to utilize the $42.4 million of capital loss carryforward items.carryover held on the books, against which a full valuation allowance was recorded. The tax value of the capital loss carryforward is $21.1 million which is set to expire in 2019. There is a full valuation allowance against this item. The tax value of the United StatesU.S. portion of the net operating loss carryforwards is $10.2$16.0 million which is subject to an annual limitation on utilization and will begin to expire in 2020.2024. As of December 31, 2018, the tax value of foreign net operating loss carryforwards was $0.6 million with a related valuation allowance of $0.6 million. F-32
The following table presents changes in the Company’s deferred tax asset valuation allowance for the periods indicated: | | Years Ended | | | | December 31, | | | December 31, | | | December 31, | | | | 2018 | | | 2017 | | | 2016 | | | | (in thousands) | | Beginning balance | | $ | 11,575 | | | $ | 17,807 | | | $ | 21,052 | | Additions charged to cost and expenses | | | — | | | | 324 | | | | 1,862 | | Additions charged to other accounts | | | — | | | | — | | | | — | | Deductions | | | (10,943 | ) | | | (6,556 | ) | | | (5,107 | ) | Ending balance | | $ | 632 | | | $ | 11,575 | | | $ | 17,807 | |
The following table presents the components of income before provision for income taxes generated by domestic or foreign operations for the periods indicated: | | | | | | | | Years Ended | | | | | Years Ended | | | December 31, | | | December 31, | | | December 31, | | | | | December 31,
2015 | | | December 31,
2014 | | | December 31,
2013 | | | 2018 | | | 2017 | | | 2016 | | | | | (in thousands) | | | (in thousands) | | Domestic | | $ | 282,764 | | | $ | 269,944 | | | $ | 276,549 | | | $ | 399,000 | | | $ | 283,779 | | | $ | 263,536 | | Foreign(1) | | | 66,790 | | | | 38,394 | | | | 36,279 | | | | 230,896 | | | | 183,120 | | | | 122,402 | | | | | | | | | | | | | Total income before provision for income taxes | | $ | 349,554 | | | $ | 308,338 | | | $ | 312,828 | | | $ | 629,896 | | | $ | 466,899 | | | $ | 385,938 | | | | | | | | | | | | |
(1) | Foreign income before provision for income taxes is defined as income generated from operations located outside the U.S., which includes income from foreign branches of U.S. companies. |
MSCI INC.
NOTES TO CONSOLIDATED FINANCIAL STATEMENTS
Cumulative earnings attributable to foreign subsidiaries were $224.8$289.5 million, $149.1$450.7 million and $188.6$341.6 million for the years ended December 31, 2015, 2014,2018, 2017, and 2013,2016, respectively. No provisionsThe Company has recorded a $16.0 million charge to provision for income taxtaxes related to foreign withholding taxes that could occurwould be payable upon repatriation have been recorded on these earnings whichrepatriation. As of December 31, 2018, the Company intends toasserts that the earnings in its India subsidiary accumulated after January 1, 2018 will be permanently reinvest abroad. At this time, it is not practicable to determine the amount of income taxes payable in the event all such foreign earnings are repatriated.reinvested. The Company regularly assesses the likelihood of additional assessments in each of the taxing jurisdictions in which it files income tax returns. The Company has established unrecognized tax benefits that the Company believes are adequate in relation to the potential for additional assessments. Once established, the Company adjusts unrecognized tax benefits only when more information is available or when an event occurs necessitating a change. As part of the Company’s periodic review of unrecognized tax benefits and based on new information regarding the status of federal and state examinations, the Company’s unrecognized tax benefits wereare remeasured. It is reasonably possible that significant changes in the balance of unrecognized tax benefits may occur within the next 12 months. At this time, however, it is not possible to reasonably estimate the expected change to the total amount of unrecognized tax benefits and the impact on the effective tax rate over the next 12 months. The Company believes the resolution of tax matters will not have a material effect on the Consolidated Statement of Financial Condition of the Company, although a resolution could have a material impact on the Company’s Consolidated Statement of Income for a particular future period and on the Company’s effective tax rate for any period in which such resolution occurs. F-33
The following table presents a reconciliation of the beginning and ending amount of the gross unrecognized tax benefits, excluding interest and penalties, for the years ended December 31, 2015, 20142018, 2017 and 2013:2016: | | | | | | | | | | | | | | | | Years Ended | | | Gross unrecognized tax benefits | | December 31,
2015 | | | December 31,
2014 | | | December 31,
2013 | | | (in thousands) | | | | Beginning balance | | $ | 6,525 | | | $ | 7,089 | | | $ | 6,827 | | Increases based on tax positions related to the current period | | | 536 | | | | 292 | | | | 194 | | Increases based on tax positions related to prior periods | | | 2,131 | | | | 1,969 | | | | 2,690 | | Decreases based on tax positions related to prior periods | | | (500 | ) | | | (346 | ) | | | (2,474 | ) | Increases/ (Decreases) related to settlements with taxing authorities | | | — | | | | (1,652 | ) | | | — | | Increases/(Decreases) related to a lapse of applicable statute of limitations | | | — | | | | (827 | ) | | | (148 | ) | | | | | | | | | | | | | | | | | | Ending balance | | $ | 8,692 | | | $ | 6,525 | | | $ | 7,089 | | | | | | | | | | | | | | |
| | Years Ended | | | | December 31, | | | December 31, | | | December 31, | | Gross unrecognized tax benefits | | 2018 | | | 2017 | | | 2016 | | (in thousands) | | | | | | | | | | | | | Beginning balance | | $ | 10,022 | | | $ | 7,936 | | | $ | 8,692 | | Increases based on tax positions related to the current period | | | 3,928 | | | | 3,389 | | | | 575 | | Increases based on tax positions related to prior periods | | | 1,892 | | | | 519 | | | | 135 | | Decreases based on tax positions related to prior periods | | | (297 | ) | | | (6 | ) | | | (3 | ) | Decreases related to settlements with taxing authorities | | | — | | | | (1,152 | ) | | | (1,463 | ) | Decreases related to a lapse of applicable statute of limitations | | | (1,454 | ) | | | (664 | ) | | | — | | Ending balance | | $ | 14,091 | | | $ | 10,022 | | | $ | 7,936 | |
The total amount of unrecognized tax benefits was $7.8$13.8 million, net of federal benefit of state issues, competent authority and foreign tax credit offsets, as of December 31, 2015,2018, which, if recognized, would favorably affect the effective tax rate in future periods. The Company recognizes the accrual of interest and penalties related to unrecognized tax benefits in the Provision“Provision for Income Taxesincome taxes” in the Consolidated Statement of Income. For the year ended December 31, 2015,2018, the Company recognized $0.3$0.2 million of interest in the Consolidated Statement of Income.Income with respect to unrecognized tax benefits. No significant penalties were recognized in the Consolidated Statement of Income for the year ended December 31, 2015. MSCI INC.
NOTES TO CONSOLIDATED FINANCIAL STATEMENTS
2018. The amount of accrued interest, which includes interest related to uncertain tax positions and accrued income tax expense, recorded on the Consolidated Statement of Financial Condition as of December 31, 2018 was $0.9 million. The Company is under examination by the IRS and other tax authorities in certain jurisdictions, including foreign jurisdictions, such as India, and states in which the Company has significant business operations, such as New York. The tax years currently under examination vary by jurisdiction but include years ranging from 20052006 through 2014.2017. As a result of having previously been a member of the Morgan Stanley consolidated group, the Company may have future settlements with Morgan Stanley related to the ultimate disposition of their New York State and New York City examination relating to the tax years 2007 and 2008 and their IRS examination relating to the tax years 2006 through 2008. The Company does not believe it has any material exposure to the New York State and New York City examinations. Additionally, the Company believes it has adequate reserves for any tax issues that may arise out of the IRS examination relating to the tax years 2006 through 2008 and therefore does not believe any related settlement with Morgan Stanley will have a material impact. 12. ACQUISITIONSDIVESTITURES Divestiture of FEA On April 9, 2018, MSCI completed the FEA divestiture for $21.0 million in cash. The acquisition methodsale included $2.9 million of accounting is based on ASC Subtopic 805-10,“Business Combinations,”goodwill, $2.7 million of fully amortized identifiable intangible assets, $6.1 million of other net assets and uses$1.4 million of transaction costs, which resulted in a gain of $10.6 million included in “Other expense (income)” within the fair value concepts defined in ASC Subtopic 820-10, “Fair Value Measurements and Disclosures,” whichConsolidated Statement of Income. FEA was included as a component of the Analytics segment through the date of divestiture. The results of operations from FEA were not material to the Company. Divestiture of InvestorForce On October 12, 2018, the Company has adopted as required. The total purchase price is allocated tocompleted the net tangible and intangible assets based upon their fair values as of the acquisition dates. The excess of the purchase price over the fair values of the net tangible assets and intangible assets was recorded as goodwill. The allocation of the purchase price was based upon a valuation andInvestorForce divestiture for $62.0 million in cash plus an additional $0.8 million for working capital adjustment which is subject to change, $8.7 million of allocated goodwill, $4.0 million of identifiable intangible assets, net of accumulated amortization, $0.7 million of other net F-34
assets and $2.8 million of transaction costs, which resulted in a gain of approximately $46.6 million included in “Other expense (income)” within the one-year measurement period following the acquisition. MSCI expects to continue to obtain information to assist it in determining the fair valueConsolidated Statement of the net assets acquired at the acquisition date during the measurement period. AcquisitionIncome. InvestorForce was included as a component of Insignis
On October 16, 2015, the Company completed the purchase of Insignis for $6.5 million through its subsidiary InvestorForce. Insignis is a financial data provider, including data on positions, transactions and complex instruments such as exchange-traded futures and options, OTC swaps and foreign exchange spot and forward contracts. Financial results for Insignis will be included within the Analytics segment through the date of divestiture. The results of operations from InvestorForce were not material to the time of acquisition.
As of December 31, 2015, the preliminary purchase price allocations for the Insignis acquisition were $4.2 million for goodwill, $2.2 million for identifiable intangible assets and $0.1 million for assets other than identifiable intangible assets.
Acquisition of GMI Ratings
On August 11, 2014, the Company completed the acquisition of GMI Ratings for $15.5 million in cash through its subsidiary MSCI ESG Research Inc. GMI Ratings is a provider of corporate governance research and ratings on companies worldwide. Clients of GMI Ratings include institutional investors, banks, insurers, auditors, regulators and corporations seeking to incorporate ESG factors into risk assessment and decision-making.
The purchase price allocations for the GMI Ratings acquisition were $9.9 million for goodwill, $3.6 million for identifiable intangible assets, $6.7 million for assets other than identifiable intangible assets and $4.7 million for other liabilities.
MSCI INC.
NOTES TO CONSOLIDATED FINANCIAL STATEMENTSCompany.
13. SEGMENT INFORMATION ASC Subtopic 280-10,“Segment Reporting,” establishes standards for reporting information about operating segments. Operating segments are defined as components of an enterprise about which separate financial information is available that is evaluated regularly by the chief operating decision maker, or CODM, in deciding how to allocate resources and assess performance. MSCI’s Chief Executive Officer and Chief Operating Officer,its President, who are considered to be its CODM, review financial information presented on an operating segment basis for purposes of making operating decisions and assessing financial performance. The CODM measures and evaluates reportable segments based on segment operating revenues as well as Adjusted EBITDA and other measures. The Company excludes the following items from segment Adjusted EBITDA: income (loss) from discontinued operations, net of income taxes, provision for income taxes, other expense (income), net, depreciation and amortization of property, equipment and leasehold improvements, amortization of intangible assets and, at times, certain other transactions or adjustments that the CODM does not consider for the purposes of making decisions to allocate resources among segments or to assess segment performance. Although these amounts are excluded from segment Adjusted EBITDA, they are included in reported consolidated net income and are included in the reconciliation that follows. The Company’s computation of segment Adjusted EBITDA may not be comparable to other similarly titled measures computed by other companies because all companies do not calculate segment Adjusted EBITDA in the same fashion. RevenuesOperating revenues and expenses directly associated with each segment are included in determining its operating results. Other expenses that are not directly attributable to a particular segment are allocated based upon allocation methodologies, including time estimates, revenue, headcount, sales targets, data center consumption and other relevant usage measures. Due to the integrated structure of our business, certain costs incurred by one segment may benefit other segments. A segment may use the content and data produced by another segment without incurring an arm’s lengtharm’s-length intersegment charge.
The CODM does not review any information regarding total assets on an operating segment basis. Operating segments do not record intersegment revenue, and, accordingly, there is none to be reported. The accounting policies for segment reporting are the same as for MSCI as a whole. The Company has four operating segments: Index, Analytics, ESG and Real Estate. The Index operating segment is primarily a provider of investment decision support tools, including equity indexes and equity index benchmarks.indexes. The productsindexes are used in many areas of the investment process, including index-linked product creation and performance benchmarking, as well as portfolio construction and rebalancing and asset allocation, performance benchmarking and attribution, regulatory and client reporting and index-linked investment product creation.allocation. The Analytics operating segment consists of productsoffers risk management, performance attribution and portfolio management content, applications and services used for portfolio construction, risk management and reporting. The products enable institutional investors to monitor, analyze and report on thethat provide clients with an integrated view of risk and return of investments across a variety of asset classes. They are based on proprietary, integrated fundamental multi-factor risk models, value-at-risk methodologies, performance attribution frameworks and asset valuation models. In addition, the Analytics segment includes products that help investors value, model and hedge physical assets and derivatives across a numberan analysis of market, segments, including energycredit, liquidity and commodity assets.counterparty risk across all major asset classes, spanning short, medium and long-term time horizons. Clients access Analytics content through MSCI’s own proprietary applications and application programming interfaces, or through third party applications or directly on their own platforms. The Analytics operating segment also provides various managed services to help clients operate more efficiently as well as address the needs of certain specialized areas of the investment community by providing a reporting service and performance reporting tools to institutional consultants and investors in hedge funds. The ESG operating segment offers products and services that help institutional investors use for assessing risksunderstand how ESG factors can impact the long-term risk of their investments. In addition, MSCI ESG Research data and opportunities arising from environmental, social and governance issues. ESG toolsratings are used in the construction of equity and fixed income indexes to evaluate both individual securitieshelp institutional investors more effectively benchmark ESG investment performance, issue index-based investment products, as well as manage, measure and investment portfolios. report on ESG mandates. F-35
MSCI INC.
NOTES TO CONSOLIDATED FINANCIAL STATEMENTS
The Real Estate operating segment is a provider ofincludes research, reporting, market data and benchmarking offerings that provide real estate performance analysis for funds, investors and managers. Real Estate performance and risk analytics range from enterprise-wide to property-specific analysis. The Real Estate operating segment also provides business intelligence to real estate owners, managers, lendersdevelopers and occupiers. It provides index productsbrokers worldwide. During the year ended December 31, 2016, the Company disposed of the Real Estate occupiers business and offers services that include research, reporting and benchmarking.recorded an immaterial gain on the disposition which was recorded in “Other expense (income),” in the Consolidated Statement of Income. The operating segments of ESG and Real Estate do not individually meet the segment reporting thresholds and have been combined and presented as part of All Other for disclosure purposes. The following table presents operating revenuerevenues by reportable segment for the periods indicated: | | | | | | | | Years Ended | | | | | Years Ended | | | December 31, | | | December 31, | | | December 31, | | | | | December 31,
2015 | | | December 31,
2014 | | | December 31,
2013 | | | 2018 | | | 2017 | | | 2016 | | | | | (in thousands) | | (in thousands) | | Operating revenues | | | | | | | | | | | | | | | | | | | Index | | $ | 558,964 | | | $ | 503,892 | | | $ | 448,414 | | | $ | 835,475 | | | $ | 718,959 | | | $ | 613,551 | | Analytics | | | 433,424 | | | | 414,085 | | | | 397,203 | | | | 479,939 | | | | 458,269 | | | | 448,353 | | All Other | | | 82,625 | | | | 78,703 | | | | 67,747 | | | | 118,570 | | | | 96,944 | | | | 88,765 | | | | | | | | | | | | | Total | | $ | 1,075,013 | | | $ | 996,680 | | | $ | 913,364 | | | $ | 1,433,984 | | | $ | 1,274,172 | | | $ | 1,150,669 | | | | | | | | | | | | |
The following table presents segment profitability and a reconciliation to net income for the periods indicated: | | | | | | | | | | | | | | | | Years Ended | | | | | December 31,
2015 | | | December 31,
2014 | | | December 31,
2013 | | | | | (in thousands) | | Index Adjusted EBITDA | | $ | 392,987 | | | $ | 349,685 | | | $ | 323,558 | | Analytics Adjusted EBITDA | | | 95,468 | | | | 72,173 | | | | 97,806 | | All Other Adjusted EBITDA | | | (6,758 | ) | | | (13,104 | ) | | | (16,216 | ) | | | | | | | | | | | | | | Total operating segment profitability | | | 481,697 | | | | 408,754 | | | | 405,148 | | Lease exit charge | | | — | | | | — | | | | (365 | ) | Amortization of intangible assets | | | 46,910 | | | | 45,877 | | | | 44,798 | | Depreciation and amortization of property, equipment and leasehold improvements | | | 30,889 | | | | 25,711 | | | | 20,384 | | | | | | | | | | | | | | | Operating income | | | 403,898 | | | | 337,166 | | | | 340,331 | | Other expense (income), net | | | 54,344 | | | | 28,828 | | | | 27,503 | | Provision for income taxes | | | 119,516 | | | | 109,396 | | | | 112,918 | | | | | | | | | | | | | | | | | | | Income from continuing operations | | | 230,038 | | | | 198,942 | | | | 199,910 | | Income (loss) from discontinued operations, net of income taxes | | | (6,390 | ) | | | 85,171 | | | | 22,647 | | | | | | | | | | | | | | | Net income | | $ | 223,648 | | | $ | 284,113 | | | $ | 222,557 | | | | | | | | | | | | | | |
MSCI INC.
NOTES TO CONSOLIDATED FINANCIAL STATEMENTS
| | Years Ended | | | | December 31, | | | December 31, | | | December 31, | | | | 2018 | | | 2017 | | | 2016 | | | (in thousands) | | Index Adjusted EBITDA | | $ | 607,853 | | | $ | 522,241 | | | $ | 431,478 | | Analytics Adjusted EBITDA | | | 143,645 | | | | 125,624 | | | | 128,507 | | All Other Adjusted EBITDA | | | 20,935 | | | | 11,892 | | | | 9,472 | | Total operating segment profitability | | | 772,433 | | | | 659,757 | | | | 569,457 | | Amortization of intangible assets | | | 54,189 | | | | 44,547 | | | | 47,033 | | Depreciation and amortization of property, equipment and leasehold improvements | | | 31,346 | | | | 35,440 | | | | 34,320 | | Operating income | | | 686,898 | | | | 579,770 | | | | 488,104 | | Other expense (income), net | | | 57,002 | | | | 112,871 | | | | 102,166 | | Provision for income taxes | | | 122,011 | | | | 162,927 | | | | 125,083 | | Net income | | $ | 507,885 | | | $ | 303,972 | | | $ | 260,855 | |
F-36
Revenue by geography is based on the shipping address of the ultimate customer utilizing the product. The following table presents revenue by geographic area for the periods indicated: | | | | | | | | | | | | | | | | Years Ended | | | (in thousands) | | December 31,
2015 | | | December 31,
2014 | | | December 31,
2013 | | Revenues | | | | | | | | | | | | | Americas: | | | | | | | | | | | | | United States | | $ | 519,429 | | | $ | 471,145 | | | $ | 416,999 | | Other | | | 41,552 | | | | 37,189 | | | | 34,547 | | | | | | | | | | | | | | | | | | | Total Americas | | | 560,981 | | | | 508,334 | | | | 451,546 | | | | | | | | | | | | | | | | | | | Europe, the Middle East and Africa (“EMEA”): | | | | | | | | | | | | | United Kingdom | | | 166,019 | | | | 154,308 | | | | 141,938 | | Other | | | 215,192 | | | | 209,893 | | | | 202,664 | | | | | | | | | | | | | | | | | | | Total EMEA | | | 381,211 | | | | 364,201 | | | | 344,602 | | | | | | | | | | | | | | | | | | | Asia & Australia: | | | | | | | | | | | | | Japan | | | 45,371 | | | | 46,642 | | | | 46,752 | | Other | | | 87,450 | | | | 77,503 | | | | 70,464 | | | | | | | | | | | | | | | | | | | Total Asia & Australia | | | 132,821 | | | | 124,145 | | | | 117,216 | | | | | | | | | | | | | | | | | | | Total | | $ | 1,075,013 | | | $ | 996,680 | | | $ | 913,364 | | | | | | | | | | | | | | |
MSCI INC.
NOTES TO CONSOLIDATED FINANCIAL STATEMENTS
| | Years Ended | | | | December 31, | | | December 31, | | | December 31, | | (in thousands) | | 2018 | | | | 2017 | | | 2016 | | Operating revenues | | | | | | | | | | | | | Americas: | | | | | | | | | | | | | United States | | $ | 662,345 | | | $ | 622,132 | | | $ | 556,777 | | Other | | | 58,065 | | | | 48,139 | | | | 45,185 | | Total Americas | | | 720,410 | | | | 670,271 | | | | 601,962 | | Europe, the Middle East and Africa ("EMEA"): | | | | | | | | | | | | | United Kingdom | | | 214,204 | | | | 193,831 | | | | 175,749 | | Other | | | 293,252 | | | | 250,267 | | | | 229,010 | | Total EMEA | | | 507,456 | | | | 444,098 | | | | 404,759 | | Asia & Australia: | | | | | | | | | | | | | Japan | | | 67,100 | | | | 54,351 | | | | 52,161 | | Other | | | 139,018 | | | | 105,452 | | | | 91,787 | | Total Asia & Australia | | | 206,118 | | | | 159,803 | | | | 143,948 | | Total | | $ | 1,433,984 | | | $ | 1,274,172 | | | $ | 1,150,669 | |
Long-lived assets consist of property, equipment, leasehold improvements, goodwill and intangible assets, net of accumulated depreciation and amortization. The following table presents long-lived assets by geographic area on the dates indicated: | | | | | | | | | | | | As of | | | (in thousands) | | December 31,
2015 | | | December 31,
2014 | | Long-lived assets | | | | | | | | | Americas: | | | | | | | | | United States | | $ | 1,916,689 | | | $ | 1,944,433 | | Other | | | 2,279 | | | | 3,293 | | | | | | | | | | | | | | Total Americas | | | 1,918,968 | | | | 1,947,726 | | | | | | | | | | | | | | EMEA: | | | | | | | | | United Kingdom | | | 110,261 | | | | 120,781 | | Other | | | 16,849 | | | | 13,345 | | | | | | | | | | | | | | Total EMEA | | | 127,110 | | | | 134,126 | | | | | | | | | | | | | | Asia & Australia: | | | | | | | | | Japan | | | 570 | | | | 837 | | Other | | | 9,389 | | | | 9,917 | | | | | | | | | | | | | | Total Asia & Australia | | | 9,959 | | | | 10,754 | | | | | | | | | | | | | | Total | | $ | 2,056,037 | | | $ | 2,092,606 | | | | | | | | | | |
| | As of | | | | December 31, | | | December 31, | | | | 2018 | | | 2017 | | | | (in thousands) | | Long-lived assets | | | | | | | | | Americas: | | | | | | | | | United States | | $ | 1,803,321 | | | $ | 1,847,605 | | Other | | | 6,560 | | | | 1,685 | | Total Americas | | | 1,809,881 | | | | 1,849,290 | | EMEA: | | | | | | | | | United Kingdom | | | 80,039 | | | | 94,782 | | Other | | | 19,369 | | | | 22,394 | | Total EMEA | | | 99,408 | | | | 117,176 | | Asia & Australia: | | | | | | | | | Japan | | | 411 | | | | 432 | | Other | | | 7,741 | | | | 9,996 | | Total Asia & Australia | | | 8,152 | | | | 10,428 | | Total | | $ | 1,917,441 | | | $ | 1,976,894 | |
MSCI INC.
NOTES TO CONSOLIDATED FINANCIAL STATEMENTS
F-37
14. QUARTERLY RESULTS OF OPERATIONS (unaudited): | | | | | | | | | | | | | | | | | | 2018 | | | 2017 | | | | | 2015 | | 2014 | | | First | | | Second | | | Third | | | Fourth | | | First | | | Second | | | Third | | | Fourth | | | | | First
Quarter | | Second
Quarter | | Third
Quarter | | Fourth
Quarter | | First
Quarter | | Second
Quarter | | Third
Quarter | | Fourth
Quarter | | | Quarter | | | Quarter | | | Quarter | | | Quarter | | | Quarter | | | Quarter | | | Quarter | | | Quarter | | | | | (in thousands, except per share data) | | | (in thousands, except per share data) | | Operating revenues | | $ | 262,769 | | | $ | 270,580 | | | $ | 268,771 | | | $ | 272,893 | | | $ | 239,688 | | | $ | 254,226 | | | $ | 251,661 | | | $ | 251,105 | | | $ | 351,316 | | | $ | 363,046 | | | $ | 357,934 | | | $ | 361,688 | | | $ | 301,207 | | | $ | 316,089 | | | $ | 322,097 | | | $ | 334,779 | | | | | | | | | | | | | | | | | | | | | | | | | | | | Cost of revenues | | 69,904 | | | 67,394 | | | 65,593 | | | 64,804 | | | 66,802 | | | 70,212 | | | 69,770 | | | 69,839 | | | | 71,304 | | | | 71,368 | | | | 70,906 | | | | 73,757 | | | | 67,463 | | | | 68,538 | | | | 68,433 | | | | 69,247 | | Selling and marketing | | 41,648 | | | 42,028 | | | 38,809 | | | 39,809 | | | 41,126 | | | 40,506 | | | 41,402 | | | 40,805 | | | | 46,409 | | | | 47,416 | | | | 46,149 | | | | 52,949 | | | | 42,972 | | | | 41,550 | | | | 44,873 | | | | 47,726 | | Research and development | | 23,189 | | | 20,807 | | | 15,548 | | | 17,776 | | | 17,465 | | | 17,374 | | | 19,021 | | | 17,235 | | | | 20,707 | | | | 19,801 | | | | 20,591 | | | | 20,312 | | | | 18,970 | | | | 18,196 | | | | 17,974 | | | | 20,709 | | General and administrative | | 20,377 | | | 22,080 | | | 19,960 | | | 23,590 | | | 17,692 | | | 20,240 | | | 19,516 | | | 18,921 | | | | 26,187 | | | | 24,036 | | | | 24,751 | | | | 24,908 | | | | 20,981 | | | | 21,424 | | | | 22,079 | | | | 23,280 | | Amortization of intangible assets | | 11,702 | | | 11,695 | | | 11,710 | | | 11,803 | | | 11,270 | | | 11,442 | | | 11,574 | | | 11,591 | | | | 11,338 | | | | 19,537 | | | | 11,681 | | | | 11,633 | | | | 11,251 | | | | 11,122 | | | | 10,614 | | | | 11,560 | | Depreciation and amortization of property, equipment and leasehold improvements | | 7,207 | | | 8,065 | | | 8,049 | | | 7,568 | | | 5,828 | | | 5,921 | | | 6,342 | | | 7,620 | | | | 8,205 | | | | 7,377 | | | | 7,453 | | | | 8,311 | | | | 8,838 | | | | 9,159 | | | | 9,325 | | | | 8,118 | | | | | | | | | | | | | | | | | | | | | | | | | | | | Total operating expenses | | 174,027 | | | 172,069 | | | 159,669 | | | 165,350 | | | 160,183 | | | 165,695 | | | 167,625 | | | 166,011 | | | | 184,150 | | | | 189,535 | | | | 181,531 | | | | 191,870 | | | | 170,475 | | | | 169,989 | | | | 173,298 | | | | 180,640 | | | | | | | | | | | | | | | | | | | | | | | | | | | | Operating income | | 88,742 | | | 98,511 | | | 109,102 | | | 107,543 | | | 79,505 | | | 88,531 | | | 84,036 | | | 85,094 | | | | 167,166 | | | | 173,511 | | | | 176,403 | | | | 169,818 | | | | 130,732 | | | | 146,100 | | | | 148,799 | | | | 154,139 | | Interest income | | (204 | ) | | (185 | ) | | (285 | ) | | (492 | ) | | (156 | ) | | (192 | ) | | (277 | ) | | (226 | ) | | | (2,770 | ) | | | (4,281 | ) | | | (6,522 | ) | | | (6,096 | ) | | | (932 | ) | | | (1,310 | ) | | | (1,835 | ) | | | (2,237 | ) | Interest expense(1) | | 11,108 | | | 11,116 | | | 17,267 | | | 22,896 | | | 5,059 | | | 5,366 | | | 5,604 | | | 15,791 | | | Interest expense | | | | 29,560 | | | | 31,761 | | | | 35,902 | | | | 35,891 | | | | 29,024 | | | | 29,027 | | | | 29,020 | | | | 29,027 | | Other expense (income) | | 178 | | | 164 | | | (6,922 | ) | | (297 | ) | | 1,071 | | | (726 | ) | | (1,287 | ) | | (1,199 | ) | | | 938 | | | | (10,292 | ) | | | 177 | | | | (47,266 | ) | | | 1,015 | | | | 872 | | | | 811 | | | | 389 | | | | | | | | | | | | | | | | | | | | | | | | | | | | Other expense (income), net | | 11,082 | | | 11,095 | | | 10,060 | | | 22,107 | | | 5,974 | | | 4,448 | | | 4,040 | | | 14,366 | | | | 27,728 | | | | 17,188 | | | | 29,557 | | | | (17,471 | ) | | | 29,107 | | | | 28,589 | | | | 27,996 | | | | 27,179 | | | | | | | | | | | | | | | | | | | | | | | | | | | | Income from continuing operations before provision for income taxes | | 77,660 | | | 87,416 | | | 99,042 | | | 85,436 | | | 73,531 | | | 84,083 | | | 79,996 | | | 70,728 | | | Income before provision for income taxes | | | | 139,438 | | | | 156,323 | | | | 146,846 | | | | 187,289 | | | | 101,625 | | | | 117,511 | | | | 120,803 | | | | 126,960 | | Provision for income taxes | | 28,036 | | | 31,399 | | | 34,644 | | | 25,437 | | | 26,385 | | | 27,280 | | | 28,272 | | | 27,459 | | | | 24,346 | | | | 39,494 | | | | 23,014 | | | | 35,157 | | | | 28,674 | | | | 36,245 | | | | 35,650 | | | | 62,358 | | | | | | | | | | | | | | | | | | | | | | | | | | | | Income from continuing operations | | 49,624 | | | 56,017 | | | 64,398 | | | 59,999 | | | 47,146 | | | 56,803 | | | 51,724 | | | 43,269 | | | Income (loss) from discontinued operations, net of income taxes | | (5,797 | ) | | | — | | | | — | | | (593 | ) | | 33,253 | | | 50,857 | | | (10 | ) | | 1,071 | | | | | | | | | | | | | | | | | | | | | | | | | | | | | Net income | | $ | 43,827 | | | $ | 56,017 | | | $ | 64,398 | | | $ | 59,406 | | | $ | 80,399 | | | $ | 107,660 | | | $ | 51,714 | | | $ | 44,340 | | | $ | 115,092 | | | $ | 116,829 | | | $ | 123,832 | | | $ | 152,132 | | | $ | 72,951 | | | $ | 81,266 | | | $ | 85,153 | | | $ | 64,602 | | | | | | | | | | | | | | | | | | | | | | | | | | | | | | | | | | | | | | | | | | | | | | | | | | | | | | | | | | | Earnings per basic common share | | | | | | | | | | | | | | | | | | $ | 1.28 | | | $ | 1.31 | | | $ | 1.39 | | | $ | 1.75 | | | $ | 0.80 | | | $ | 0.90 | | | $ | 0.94 | | | $ | 0.72 | | From continuing operations | | $ | 0.44 | | | $ | 0.50 | | | $ | 0.59 | | | $ | 0.59 | | | $ | 0.40 | | | $ | 0.48 | | | $ | 0.44 | | | $ | 0.38 | | | From discontinued operations | | (0.05 | ) | | | — | | | | — | | | (0.01 | ) | | 0.28 | | | 0.44 | | | | — | | | 0.01 | | | | | | | | | | | | | | | | | | | | | | | | | | | | | Earnings per basic common share | | $ | 0.39 | | | $ | 0.50 | | | $ | 0.59 | | | $ | 0.58 | | | $ | 0.68 | | | $ | 0.92 | | | $ | 0.44 | | | $ | 0.39 | | | | | | | | | | | | | | | | | | | | | | | | | | | | | Earnings per diluted common share | | | | | | | | | | | | | | | | | | From continuing operations | | $ | 0.44 | | | $ | 0.50 | | | $ | 0.59 | | | $ | 0.58 | | | $ | 0.40 | | | $ | 0.48 | | | $ | 0.44 | | | $ | 0.38 | | | From discontinued operations | | (0.05 | ) | | | — | | | | — | | | (0.01 | ) | | 0.28 | | | 0.43 | | | | — | | | 0.01 | | | | | | | | | | | | | | | | | | | | | | | | | | | | | | | | | | | | | | | | | | | | | | | | | | | | | | | | | | | | Earnings per diluted common share | | $ | 0.39 | | | $ | 0.50 | | | $ | 0.59 | | | $ | 0.57 | | | $ | 0.68 | | | $ | 0.91 | | | $ | 0.44 | | | $ | 0.39 | | | $ | 1.24 | | | $ | 1.28 | | | $ | 1.36 | | | $ | 1.70 | | | $ | 0.80 | | | $ | 0.89 | | | $ | 0.93 | | | $ | 0.70 | | | | | | | | | | | | | | | | | | | | | | | | | | | | | | | | | | | | | | | | | | | | | | | | | | | | | | | | | | | Weighted average shares outstanding used in computing per share data | | | | | | | | | | | | | | | | | | | | | | | | | | | | | | | | | | | | | | | | | | | | | | | | | Basic | | 112,520 | | | 112,143 | | | 108,773 | | | 102,837 | | | 117,582 | | | 116,702 | | | 116,251 | | | 112,299 | | | | 90,075 | | | | 89,112 | | | | 88,796 | | | | 86,968 | | | | 90,708 | | | | 90,404 | | | | 90,112 | | | | 90,130 | | | | | | | | | | | | | | | | | | | | | | | | | | | | | Diluted | | 113,522 | | | 112,931 | | | 109,440 | | | 103,589 | | | 118,597 | | | 117,664 | | | 117,163 | | | 113,289 | | | | 92,587 | | | | 91,586 | | | | 91,372 | | | | 89,495 | | | | 91,624 | | | | 91,708 | | | | 91,868 | | | | 92,467 | | | | | | | | | | | | | | | | | | | | | | | | | | | |
(1) | Increased interest expense during the fourth quarter of 2014 compared to the first three quarters of 2014 was primarily the result of the debt discount and deferred financing fees written off in connection with the 2024 Senior Notes offering and the 2014 Revolving Facility. |
MSCI INC.
NOTES TO CONSOLIDATED FINANCIAL STATEMENTS
15. SUBSEQUENT EVENTS On February 2, 2016,January 30, 2019, the Board of Directors of the Company declared a quarterly dividend of $0.22$0.58 per share of common stock to be paid on March 11, 201615, 2019 to shareholders of record as of the close of trading on February 19, 2016.22, 2019. Subsequent to the year ended December 31, 20152018 and through February 19, 2016,15, 2019, the Company repurchased an additional 2.60.7 million shares of common stock were repurchasedat an average price of $147.97 per share for a total value of $170.6$102.1 million. EXHIBIT INDEX
| | | | | | | | | | | Exhibit
Number | | Description | | Form | | File No. | | Exhibit
No. | | Filing Date | | | | | | | | 3.1 | | Third Amended and Restated Certificate of Incorporation | | 10-Q | | 001-33812 | | 3.1 | | 5/4/2012 | | | | | | | | 3.2 | | Amended and Restated By-laws | | 10-Q | | 001-33812 | | 3.2 | | 5/4/2012 | | | | | | | | 4.1 | | Form of Senior Indenture | | S-3 | | 333-206232 | | 4.1 | | 8/7/2015 | | | | | | | | 4.2 | | Form of Subordinated Indenture | | S-3 | | 333-206232 | | 4.2 | | 8/7/2015 | | | | | | | | 4.3 | | Form of Common Stock Certificate | | 10-Q | | 001-33812 | | 4.1 | | 5/4/2012 | | | | | | | | 4.4 | | Indenture, dated as of November 20, 2014, among MSCI Inc., each of the Subsidiary Guarantors party thereto and Wells Fargo Bank, National Association, as Trustee | | 8-K | | 001-33812 | | 4.1 | | 11/20/2014 | | | | | | | | 4.5 | | Form of Note for MSCI Inc. 5.250% Senior Notes due November 15, 2024 (included in Exhibit 4.4) | | 8-K | | 001-33812 | | 4.2 | | 11/20/2014 | | | | | | | | 4.6 | | Indenture, dated as of August 13, 2015, among MSCI Inc., each of the Subsidiary Guarantors party thereto and Wells Fargo Bank, National Association, as Trustee | | 8-K | | 001-33812 | | 4.1 | | 8/13/2015 | | | | | | | | 4.7 | | Form of Note for MSCI Inc. 5.750% Senior Notes due August 13, 2025 (included in Exhibit 4.6) | | 8-K | | 001-33812 | | 4.2 | | 8/13/2015 | | | | | | | | 10.1† | | Index License Agreement for Funds, dated as of March 18, 2000, between Morgan Stanley Capital International and Barclays Global Investors, N.A. | | 10-K | | 001-33812 | | 10.1 | | 2/27/2015 | | | | | | | | 10.2† | | Amendment to Index License Agreement for Funds between Morgan Stanley Capital International and Barclays Global Investors, N.A. | | 10-K | | 001-33812 | | 10.2 | | 2/29/2012 | | | | | | | | 10.3† | | Letter Agreement to Amend MSCI-BGI Fund Index License Agreement, dated as of June 21, 2001, between Morgan Stanley Capital International Inc. and Barclays Global Investors, N.A. | | 10-K | | 001-33812 | | 10.3 | | 1/31/2011 | | | | | | | | 10.4† | | Addendum to the Index License Agreement for Funds, dated as of September 18, 2002, between Morgan Stanley Capital International Inc. and Barclays Global Investors, N.A. | | S-1/A | | 333-144975 | | 10.4 | | 9/26/2007 | | | | | | | | 10.5† | | Amendment to the Index License Agreement for Funds, dated as of December 3, 2004, between Morgan Stanley Capital International Inc. and Barclays Global Investors, N.A. | | S-1/A | | 333-144975 | | 10.5 | | 10/26/2007 | | | | | | | | 10.6† | | Amendment to the Index License Agreement for Funds, dated as of May 1, 2005, between Morgan Stanley Capital International Inc. and Barclays Global Investors, N.A. | | S-1/A | | 333-144975 | | 10.6 | | 9/26/2007 |
EX-1
| | | | | | | | | | | Exhibit
Number | | Description | | Form | | File No. | | Exhibit
No. | | Filing Date | | | | | | | | 10.7† | | Amendment to the Index License Agreement for Funds, dated as of July 1, 2006, between Morgan Stanley Capital International Inc. and Barclays Global Investors, N.A. | | S-1/A | | 333-144975 | | 10.7 | | 10/26/2007 | | | | | | | | 10.8 | | Amendment to Index License Agreement for Funds, dated as of June 5, 2007, between Morgan Stanley Capital International Inc. and Barclays Global Investors, N.A. | | 10-K | | 001-33812 | | 10.8 | | 1/31/2011 | | | | | | | | 10.9 | | Amendment to Index License Agreement for Funds, dated as of November 7, 2008, between MSCI Inc. and Barclays Global Investors, N.A. | | 10-K | | 001-33812 | | 10.9 | | 2/29/2012 | | | | | | | | 10.10† | | Amendment to Index License Agreement for Funds, dated as of December 9, 2008, between MSCI Inc. and Barclays Global Investors, N.A. | | 10-Q | | 001-33812 | | 10.2 | | 7/2/2010 | | | | | | | | 10.11 | | Amendment to Index License Agreement for Funds, dated as of April 1, 2009, between MSCI Inc. and Barclays Global Investors, N.A. | | 10-K | | 001-33812 | | 10.11 | | 1/29/2010 | | | | | | | | 10.12† | | Amendment to Index License Agreement for Funds, dated as of May 21, 2009, between MSCI Inc. and Barclays Global Investors, N.A. | | 10-Q | | 001-33812 | | 10.3 | | 7/2/2010 | | | | | | | | 10.13 | | Amendment to Index License Agreement for Funds, dated as of September 30, 2009, between MSCI Inc. and Barclays Global Investors, N.A. | | 10-Q | | 001-33812 | | 10.4 | | 7/2/2010 | | | | | | | | 10.14 | | Amendment to Index License Agreement for Funds, dated as of October 6, 2009, between MSCI Inc. and Barclays Global Investors, N.A. | | 10-K | | 001-33812 | | 10.14 | | 1/29/2010 | | | | | | | | 10.15† | | Amendment to the Index License Agreement for Funds, dated as of October 4, 2011, by and between MSCI Inc. and BlackRock Institutional Trust Company, N.A. (formerly, Barclays Global Investors, N.A.). Replaces in its entirety the Amendment to Index License Agreement for Funds, dated as of October 27, 2009, between MSCI Inc. and Barclays Global Investors, N.A. filed as Exhibit 10.15 to Form 10-K (001-33812) filed with the SEC on February 29, 2012 | | 10-K | | 001-33812 | | 10.15 | | 3/1/2013 | | | | | | | | 10.16 | | Trademark License Agreement, dated as of March 18, 2002, between Morgan Stanley Dean Witter & Co. and Morgan Stanley Capital International Inc. | | S-1 | | 333-144975 | | 10.9 | | 9/26/2007 | | | | | | | | 10.17 | | Amendment No. 1 to Trademark License Agreement, dated July 21, 2008, between Morgan Stanley and MSCI Inc. | | 10-Q | | 001-33812 | | 10.6 | | 10/6/2008 |
EX-2
| | | | | | | | | | | Exhibit
Number | | Description | | Form | | File No. | | Exhibit
No. | | Filing Date | | | | | | | | 10.18 | | Intellectual Property Agreement, dated as of November 20, 2007, between Morgan Stanley and MSCI Inc. | | 10-K | | 001-33812 | | 10.10 | | 2/28/2008 | | | | | | | | 10.19 | | Amendment No. 1 to Intellectual Property Agreement, dated as of July 21, 2008, between Morgan Stanley and MSCI Inc. | | 10-Q | | 001-33812 | | 10.4 | | 10/6/2008 | | | | | | | | 10.20 | | Services Agreement, dated as of November 20, 2007, between Morgan Stanley and MSCI Inc. | | 10-K | | 001-33812 | | 10.11 | | 2/28/2008 | | | | | | | | 10.21 | | Amendment No. 1 to Services Agreement, dated as of July 21, 2008, between Morgan Stanley and MSCI Inc. | | 10-Q | | 001-33812 | | 10.5 | | 10/6/2008 | | | | | | | | 10.22 | | Letter Agreement to Services Agreement, dated as of May 22, 2009, between Morgan Stanley and MSCI Inc. | | 8-K | | 001-33812 | | 10.3 | | 5/22/2009 | | | | | | | | 10.23 | | Tax Sharing Agreement, dated as of November 20, 2007, between Morgan Stanley and MSCI Inc. | | 10-K | | 001-33812 | | 10.12 | | 2/28/2008 | | | | | | | | 10.24 | | Shareholder Agreement, dated as of November 20, 2007, between Morgan Stanley and MSCI Inc. | | 10-K | | 001-33812 | | 10.13 | | 2/28/2008 | | | | | | | | 10.25 | | Amended and Restated Shareholder Agreement, dated as of July 21, 2008, between Morgan Stanley and MSCI Inc. | | 10-Q | | 001-33812 | | 10.3 | | 10/6/2008 | | | | | | | | 10.26 | | Asset Purchase Agreement, dated as of July 22, 2008, between MSCI Inc. and Morgan Stanley | | 10-Q | | 001-33812 | | 10.7 | | 10/6/2008 | | | | | | | | 10.27 | | Separation Agreement, dated as of May 22, 2009, between Morgan Stanley and MSCI Inc. | | 8-K | | 001-33812 | | 10.1 | | 5/22/2009 | | | | | | | | 10.28 | | Employee Matters Agreement, dated as of May 22, 2009, between Morgan Stanley and MSCI Inc. | | 8-K | | 001-33812 | | 10.2 | | 5/22/2009 | | | | | | | | 10.29* | | MSCI Inc. Amended and Restated 2007 Equity Incentive Compensation Plan | | 10-K | | 001-33812 | | 10.30 | | 3/1/2013 | | | | | | | | 10.30* | | MSCI Independent Directors’ Equity Compensation Plan as amended and restated on January 12, 2011 | | 10-K | | 001-33812 | | 10.39 | | 1/31/2011 | | | | | | | | 10.31* | | MSCI Inc. Performance Formula and Incentive Plan | | Proxy | | 001-33812 | | Annex C | | 2/28/2008 | | | | | | | | 10.32* | | MSCI Equity Incentive Compensation Plan 2007 Founders Grant Award Certificate for Stock Options | | 10-K | | 001-33812 | | 10.19 | | 2/28/2008 | | | | | | | | 10.33* | | Form of Award Agreement for Restricted Stock Units for Directors under the MSCI Inc. Independent Directors’ Equity Compensation Plan | | 10-K | | 001-33812 | | 10.34 | | 3/1/2013 |
EX-3
| | | | | | | | | | | Exhibit
Number
| | Description
| | Form
| | File No.
| | Exhibit
No.
| | Filing Date
| | | | | | | 10.34* | | RiskMetrics Group, Inc. 2000 Stock Option Plan | | S-8 | | 333-165888 | | 99.1 | | 6/3/2010 | | | | | | | 10.35* | | RiskMetrics Group, Inc. 2004 Stock Option Plan | | S-8 | | 333-165888 | | 99.2 | | 6/3/2010 | | | | | | | 10.36* | | RiskMetrics Group, Inc. 2007 Omnibus Incentive Compensation Plan | | 10-K | | 001-33812 | | 10.38 | | 3/1/2013 | | | | | | | 10.37* | | Form of Performance Award Agreement for Restricted Stock Units for Named Executive Officers under the MSCI Inc. 2007 Amended and Restated Equity Incentive Compensation Plan | | 10-K | | 001-33812 | | 10.44 | | 1/31/2011 | | | | | | | 10.38* | | Form of Performance Award Agreement for Restricted Stock Units for Employees under the MSCI Inc. 2007 Amended and Restated Equity Incentive Compensation Plan | | 10-K | | 001-33812 | | 10.45 | | 1/31/2011 | | | | | | | 10.39* | | Form of Award Agreement for Restricted Stock Units for Employees under the MSCI Inc. 2007 Amended and Restated Equity Incentive Compensation Plan | | 10-K | | 001-33812 | | 10.46 | | 1/31/2011 | | | | | | | 10.40* | | Form of Award Agreement for Restricted Stock Units for Named Executive Officers under the MSCI Inc. 2007 Amended and Restated Equity Incentive Compensation Plan | | 10-K | | 001-33812 | | 10.47 | | 1/31/2011 | | | | | | | 10.41* | | Form of Performance Award Agreement for Performance Stock Units for Employees under the MSCI Inc. 2007 Amended and Restated Equity Incentive Compensation Plan | | 10-K | | 001-33812 | | 10.50 | | 1/31/2011 | | | | | | | 10.42* | | Form of Performance Award Agreement for Performance Stock Units for Named Executive Officers under the MSCI Inc. 2007 Amended and Restated Equity Incentive Compensation Plan | | 10-K | | 001-33812 | | 10.51 | | 1/31/2011 | | | | | | | 10.43* | | Award Agreement for 2010 Price Vested Stock Option Award for the Chief Executive Officer under the MSCI Inc. 2007 Amended and Restated Equity Incentive Compensation Plan | | 10-K | | 001-33812 | | 10.54 | | 1/31/2011 | | | | | | | 10.44* | | Form of Performance Award Agreement for Performance Stock Units for Executive Officers under the MSCI Inc. 2007 Amended and Restated Equity Incentive Compensation Plan | | 10-K | | 001-33812 | | 10.46 | | 3/1/2013 | | | | | | | 10.45* | | Form of Performance Award Agreement for Performance Stock Units for Executive Officers under the MSCI Inc. 2007 Amended and Restated Equity Incentive Compensation Plan | | 10-K | | 001-33812 | | 10.47 | | 3/1/2013 | | | | | | | 10.46† | | Amendment to Index License Agreement for Funds, dated as of December 15, 2009, between MSCI Inc. and Blackrock Institutional Trust Company, N.A. | | 10-K | | 001-33812 | | 10.57 | | 1/31/2011 |
EX-4
| | | | | | | | | | | Exhibit
Number | | Description | | Form | | File No. | | Exhibit
No. | | Filing Date | | | | | | | | 10.47 | | Amendment to Index License Agreement for Funds, dated as of June 13, 2011, between MSCI Inc. and BlackRock Institutional Trust Company, N.A. | | 10-K | | 001-33812 | | 10.58 | | 2/29/2012 | | | | | | | | 10.48 | | Amendment to Index License Agreement for Funds, dated as of May 20, 2010 | | 10-K | | 001-33812 | | 10.59 | | 1/31/2011 | | | | | | | | 10.49† | | Schedule No. 11043 to the Master Index License Agreement for Index Based Funds, between MSCI Inc. and BlackRock Institutional Trust Company, N.A. (formerly, Barclays Global Investors, N.A.), dated as of September 1, 2010 | | 10-K | | 001-33812 | | 10.60 | | 1/31/2011 | | | | | | | | 10.50† | | Amendment to the Index License Agreement for Funds, dated as of November 19, 2010, between MSCI Inc. and Barclays Global Investors, N.A. | | 10-K | | 001-33812 | | 10.50 | | 2/27/2015 | | | | | | | | 10.51 | | Amendment to the Index License Agreement for Funds, dated as of June 21, 2011, by and between MSCI Inc. and BlackRock Institutional Trust Company, N.A. (formerly known as Barclays Global Investors, N.A.) | | 10-K | | 001-33812 | | 10.62 | | 2/29/2012 | | | | | | | | 10.52† | | Amendment to the Index License Agreement for Funds, dated as of July 1, 2011, by and between MSCI Inc. (formerly, Morgan Stanley Capital International Inc.) and Blackrock Institutional Trust Company, N.A. (formerly, Barclays Global Investors, N.A.) | | 10-K/A | | 001-33812 | | 10.63 | | 7/20/2012 | | | | | | | | 10.53† | | Amendment to the Index License Agreement for Funds, dated as of August 23, 2011, by and between MSCI Inc. and Blackrock Institutional Trust Company, N.A. (formerly, Barclays Global Investors, N.A.) | | 10-K | | 001-33812 | | 10.53 | | 2/27/2015 | | | | | | | | 10.54 | | Amendment to the Index License Agreement for Funds, dated as of October 4, 2011, by and between MSCI Inc. and BlackRock Institutional Trust Company, N.A. (formerly known as Barclays Global Investors, N.A.) | | 10-K | | 001-33812 | | 10.65 | | 2/29/2012 | | | | | | | | 10.55† | | Amendment to the Index License Agreement for Funds, dated as of October 4, 2011, by and between MSCI Inc. and BlackRock Institutional Trust Company, N.A. (formerly, Barclays Global Investors, N.A.) | | 10-K | | 001-33812 | | 10.57 | | 3/1/2013 | | | | | | | | 10.56 | | Amendment to the Index License Agreement for Funds, dated as of December 16, 2011, by and between MSCI Inc. (formerly, Morgan Stanley Capital International, Inc.) and BlackRock Institutional Trust Company, N.A. (formerly, Barclays Global Investors, N.A.) | | 10-K | | 001-33812 | | 10.67 | | 2/29/2012 |
EX-5
| | | | | | | | | | | Exhibit
Number | | Description | | Form | | File No. | | Exhibit
No. | | Filing Date | | | | | | | | 10.57 | | Agreement of Lease dated September 16, 2011, by and between 7 World Trade Center, LLC and MSCI Inc. | | 8-K | | 001-33812 | | 10.1 | | 9/22/2011 | | | | | | | | 10.58* | | Director Deferral Plan | | 10-Q | | 001-33812 | | 10.1 | | 8/5/2011 | | | | | | | | 10.59* | | Offer Letter, executed May 25, 2012, between MSCI Inc. and Robert Qutub | | 8-K | | 001-33812 | | 10.1 | | 5/30/2012 | | | | | | | | 10.60* | | Change of Employment Status and Release Agreement, executed August 2, 2012, between MSCI Inc. and David M. Obstler | | 10-Q | | 001-33812 | | 10.2 | | 8/3/2012 | | | | | | | | 10.61 | | Fixed Dollar Capped Accelerated Share Repurchase Transaction, dated as of December 13, 2012, between MSCI Inc. and Morgan Stanley & Co. LLC | | 10-K | | 001-33812 | | 10.65 | | 3/1/2013 | | | | | | | | 10.62† | | Amendment to the Index License Agreement for Funds, dated as of February 16, 2012, by and between MSCI Inc. (formerly, Morgan Stanley Capital International Inc.) and BlackRock Institutional Trust Company, N.A. (formerly, Barclays Global Investors, N.A.) | | 10-K | | 001-33812 | | 10.66 | | 2/28/2014 | | | | | | | | 10.63† | | Amendment to the Index License Agreement for Funds, dated as of April 9, 2012, by and between MSCI Inc. (formerly, Morgan Stanley Capital International Inc.) and BlackRock Institutional Trust Company, N.A. (formerly, Barclays Global Investors, N.A.) | | 10-K | | 001-33812 | | 10.63 | | 2/27/2015 | | | | | | | | 10.64† | | Amendment to the Index License Agreement for Funds, dated as of June 1, 2012, by and between MSCI Inc. (formerly, Morgan Stanley Capital International Inc.) and BlackRock Institutional Trust Company, N.A. (formerly, Barclays Global Investors, N.A.) | | 10-K | | 001-33812 | | 10.68 | | 3/1/2013 | | | | | | | | 10.65† | | Amendment to the Index License Agreement for Funds, dated as of August 17, 2012, by and between MSCI Inc. (formerly, Morgan Stanley Capital International Inc.) and BlackRock Institutional Trust Company, N.A. (formerly, Barclays Global Investors, N.A.) | | 10-K | | 001-33812 | | 10.69 | | 3/1/2013 | | | | | | | | 10.66† | | Amendment to the Index License Agreement for Funds, dated as of August 20, 2012, by and between MSCI Inc. (formerly, Morgan Stanley Capital International Inc.) and BlackRock Institutional Trust Company, N.A. (formerly, Barclays Global Investors, N.A.) | | 10-K | | 001-33812 | | 10.70 | | 2/28/2014 |
EX-6
| | | | | | | | | | | Exhibit
Number
| | Description
| | Form
| | File No.
| | Exhibit
No.
| | Filing Date
| | | | | | | 10.67† | | Amendment to the Index License Agreement for Funds, dated as of November 6, 2012, by and between MSCI Inc. (formerly, Morgan Stanley Capital International Inc.) and BlackRock Institutional Trust Company, N.A. (formerly, Barclays Global Investors, N.A.) | | 10-K | | 001-33812 | | 10.71 | | 2/28/2014 | | | | | | | 10.68† | | Amendment to the Index License Agreement for Funds, dated as of November 15, 2012, by and between MSCI Inc. (formerly, Morgan Stanley Capital International Inc.) and BlackRock Institutional Trust Company, N.A. (formerly, Barclays Global Investors, N.A.) | | 10-K | | 001-33812 | | 10.72 | | 3/1/2013 | | | | | | | 10.69† | | Amendment to the Index License Agreement for Funds, dated as of February 21, 2013, by and between MSCI Inc. (formerly, Morgan Stanley Capital International Inc.) and BlackRock Institutional Trust Company, N.A. (formerly, Barclays Global Investors, N.A.) | | 10-K | | 001-33812 | | 10.73 | | 2/28/2014 | | | | | | | 10.70† | | Amendment to the Index License Agreement for Funds, dated as of March 20, 2013, by and between MSCI Inc. (formerly, Morgan Stanley Capital International Inc.) and BlackRock Institutional Trust Company, N.A. (formerly, Barclays Global Investors, N.A.) | | 10-K | | 001-33812 | | 10.74 | | 2/28/2014 | | | | | | | 10.71† | | Amendment to the Index License Agreement for Funds, dated as of September 11, 2013, by and between MSCI Inc. (formerly, Morgan Stanley Capital International Inc.) and BlackRock Institutional Trust Company, N.A. (formerly, Barclays Global Investors, N.A.) | | 10-K | | 001-33812 | | 10.71 | | 2/27/2015 | | | | | | | 10.72† | | Amendment to the Index License Agreement for Funds, dated as of December 10, 2013, by and between MSCI Inc. (formerly, Morgan Stanley Capital International Inc.) and BlackRock Institutional Trust Company, N.A. (formerly, Barclays Global Investors, N.A.) | | 10-K | | 001-33812 | | 10.72 | | 2/27/2015 | | | | | | | 10.73† | | Amendment to the Index License Agreement for Funds, dated as of December 16, 2013, by and between MSCI Inc. (formerly, Morgan Stanley Capital International Inc.) and BlackRock Institutional Trust Company, N.A. (formerly, Barclays Global Investors, N.A.) | | 10-K | | 001-33812 | | 10.72 | | 2/27/2015 | | | | | | | 10.74* | | Form of Performance Award Agreement for Performance Stock Units for Executive Officers under the MSCI Inc. 2007 Amended and Restated Equity Incentive Compensation Plan | | 10-K | | 001-33812 | | 10.79 | | 2/28/2014 |
EX-7
| | | | | | | | | | | Exhibit
Number | | Description | | Form | | File No. | | Exhibit
No. | | Filing Date | | | | | | | | 10.75* | | Form of Performance Award Agreement for Performance Stock Units for Chief Executive Officer under the MSCI Inc. 2007 Amended and Restated Equity Incentive Compensation Plan | | 10-K | | 001-33812 | | 10.80 | | 2/28/2014 | | | | | | | | 10.76* | | Form of Performance Award Agreement for Performance Stock Units for Executive Officers under the MSCI Inc. 2007 Amended and Restated Equity Incentive Compensation Plan | | 10-K | | 001-33812 | | 10.81 | | 2/28/2014 | | | | | | | | 10.77* | | Form of Award Agreement for Restricted Stock Units for Executive Officers under the MSCI Inc. 2007 Amended and Restated Equity Incentive Compensation Plan | | 10-K | | 001-33812 | | 10.82 | | 2/28/2014 | | | | | | | | 10.78* | | Form of Award Agreement for Restricted Stock Units for Chief Executive Officer under the MSCI Inc. 2007 Amended and Restated Equity Incentive Compensation Plan | | 10-K | | 001-33812 | | 10.83 | | 2/28/2014 | | | | | | | | 10.79* | | Form of Award Agreement for Restricted Stock Units for Executive Officers under the MSCI Inc. 2007 Amended and Restated Equity Incentive Compensation Plan | | 10-K | | 001-33812 | | 10.84 | | 2/28/2014 | | | | | | | | 10.80* | | Award Agreement for 2013 Non-Qualified Stock Option Award | | 10-K | | 001-33812 | | 10.85 | | 2/28/2014 | | | | | | | | 10.81 | | Fixed Dollar Capped Accelerated Share Repurchase Transaction, dated as of August 1, 2013, between MSCI Inc. and Morgan Stanley & Co. LLC | | 10-Q | | 001-33812 | | 10.1 | | 11/1/2013 | | | | | | | | 10.82† | | Amendment to the Index License Agreement for Funds, dated as of January 23, 2014, by and between MSCI Inc. (formerly, Morgan Stanley Capital International Inc.) and BlackRock Institutional Trust Company, N.A. (formerly, Barclays Global Investors, N.A.) | | 10-K | | 001-33812 | | 10.82 | | 2/27/2015 | | | | | | | | 10.83† | | Amendment to the Index License Agreement for Funds, dated as of January 23, 2014, by and between MSCI Inc. (formerly, Morgan Stanley Capital International Inc.) and BlackRock Institutional Trust Company, N.A. (formerly, Barclays Global Investors, N.A.) | | 10-K | | 001-33812 | | 10.83 | | 2/27/2015 | | | | | | | | 10.84 | | Stock Purchase Agreement, dated as of March 17, 2014, among MSCI Inc., RiskMetrics Group Holdings, LLC and VISS Acquisition Corp. | | 8-K | | 001-33812 | | 2.1 | | 4/20/2014 | | | | | | | | 10.85† | | Letter Agreement to amend the Amendment to the Index License Agreement for Funds, dated as of March 18, 2014, by and between MSCI Inc. (formerly, Morgan Stanley Capital International Inc.) and BlackRock Institutional Trust Company, N.A. (formerly, Barclays Global Investors, N.A.) | | 10-K | | 001-33812 | | 10.85 | | 2/27/2015 |
EX-8
| | | | | | | | | | | Exhibit
Number | | Description | | Form | | File No. | | Exhibit
No. | | Filing Date | | | | | | | | 10.86 | | Letter Agreement regarding a Fixed Dollar Capped Accelerated Share Repurchase Transaction, dated as of February 6, 2014, between MSCI Inc. and Morgan Stanley & Co. LLC | | 10-Q | | 001-33812 | | 10.1 | | 5/2/2014 | | | | | | | | 10.87* | | Form of Award Agreement for Restricted Stock Units for Directors under the MSCI Inc. Independent Directors’ Equity Compensation Plan, as amended | | 10-Q | | 001-33812 | | 10.2 | | 5/2/2014 | | | | | | | | 10.88* | | Summary of Non-Employee Director Compensation | | 10-Q | | 001-33812 | | 10.3 | | 5/2/2014 | | | | | | | | 10.89† | | Amendment to the Index License Agreement for Funds, dated as of July 9, 2014, by and between MSCI Inc. (formerly, Morgan Stanley Capital International Inc.) and BlackRock Fund Advisors (as successor to Barclays Global Investors, N.A.) | | 10-K | | 001-33812 | | 10.89 | | 2/27/2015 | | | | | | | | 10.90† | | Amendment to the Index License Agreement for Funds, dated as of July 16, 2014, by and between MSCI Inc. (formerly, Morgan Stanley Capital International Inc.) and BlackRock Fund Advisors (as successor to Barclays Global Investors, N.A.) | | 10-K | | 001-33812 | | 10.90 | | 2/27/2015 | | | | | | | | 10.91† | | Amendment to the Index License Agreement for Funds, dated as of August 15, 2014, by and between MSCI Inc. (formerly, Morgan Stanley Capital International Inc.) and BlackRock Fund Advisors (as successor to Barclays Global Investors, N.A.) | | 10-K | | 001-33812 | | 10.91 | | 2/27/2015 | | | | | | | | 10.92† | | Amendment to the Index License Agreement for Funds, dated as of September 9, 2014, by and between MSCI Inc. (formerly, Morgan Stanley Capital International Inc.) and BlackRock Fund Advisors (as successor to Barclays Global Investors, N.A.) | | 10-K | | 001-33812 | | 10.92 | | 2/27/2015 | | | | | | | | 10.93† | | Amendment to the Index License Agreement for Funds, dated as of September 17, 2014, by and between MSCI Inc. (formerly, Morgan Stanley Capital International Inc.) and BlackRock Fund Advisors (as successor to Barclays Global Investors, N.A.) | | 10-K | | 001-33812 | | 10.93 | | 2/27/2015 | | | | | | | | 10.94 | | Master and Supplemental Confirmations regarding Accelerated Stock Buyback, dated as of September 18, 2014, between MSCI Inc. and Goldman, Sachs & Co. | | 10-Q | | 001-33812 | | 10.1 | | 10/30/2014 |
EX-9
| | | | | | | | | | | Exhibit
Number | | Description | | Form | | File No. | | Exhibit
No. | | Filing Date | | | | | | | | 10.95† | | Amendment to the Index License Agreement for Funds, dated as of September 22, 2014, by and between MSCI Inc. (formerly, Morgan Stanley Capital International Inc.) and BlackRock Fund Advisors (as successor to Barclays Global Investors, N.A.) | | 10-K | | 001-33812 | | 10.95 | | 2/27/2015 | | | | | 10.96† | | Amendment to the Index License Agreement for Funds, dated as of October 30, 2014, by and between MSCI Inc. (formerly, Morgan Stanley Capital International Inc.) and BlackRock Fund Advisors (as successor to Barclays Global Investors, N.A.) | | Filed Herewith | | | | | | | | 10.97 | | Revolving Credit Agreement, dated as of November 20, 2014, among MSCI Inc., as the Borrower, each of the Subsidiary Guarantors party thereto, JPMorgan Chase Bank, N.A., as the Administrative Agent and L/C Issuer, the Lenders party thereto and J.P. Morgan Securities LLC, as Lead Arranger and Bookrunner | | 8-K | | 001-33812 | | 10.1 | | 11/20/2014 | | | | | | | | 10.98 | | Cooperation Agreement, dated as of January 29, 2015 | | 8-K | | 001-33812 | | 99.1 | | 1/30/2015 | | | | | | | | 10.99* | | Form of Award Agreement for Restricted Stock Units for Executive Officers under the MSCI Inc. 2007 Amended and Restated Equity Incentive Compensation Plan | | 10-K | | 001-33812 | | 10.101 | | 2/27/2015 | | | | | 10.100* | | Form of Annual Performance Award Agreement for Performance Stock Units for Executive Officers under the MSCI Inc. 2007 Amended and Restated Equity Incentive Compensation Plan | | Filed Herewith | | | | | 10.101* | | Form of Award Agreement for Restricted Stock Units for Executive Officers under the MSCI Inc. 2007 Amended and Restated Equity Incentive Compensation Plan | | Filed Herewith | | | | | 10.102†† | | Amendment to the Index License Agreement for Funds, dated as of February 4, 2015, by and between MSCI Inc. (formerly, Morgan Stanley Capital International Inc.) and BlackRock Fund Advisors (as successor to Barclays Global Investors, N.A.) | | Filed Herewith | | | | | 10.103†† | | Amendment to the Index License Agreement for Funds, dated as of February 25, 2015, by and between MSCI Inc. (formerly, Morgan Stanley Capital International Inc.) and BlackRock Fund Advisors (as successor to Barclays Global Investors, N.A.) | | Filed Herewith |
EX-10
| | | | | | | | | | | Exhibit
Number
| | Description
| | Form
| | File No.
| | Exhibit
No.
| | Filing Date
| | | | 10.104†† | | Letter Agreement (to amend the Amendment dated December 10, 2013) to the Index License Agreement for Funds, dated as of March 17, 2015, by and between MSCI Inc. (formerly, Morgan Stanley Capital International Inc.) and BlackRock Institutional Trust Company, N.A. (formerly, Barclays Global Investors, N.A.) | | Filed Herewith | | | | 10.105†† | | Amendment to the Index License Agreement for Funds, dated as of April 20, 2015, by and between MSCI Inc. (formerly, Morgan Stanley Capital International Inc.) and BlackRock Fund Advisors (as successor to Barclays Global Investors, N.A.) | | Filed Herewith | | | | 10.106†† | | Amendment to the Index License Agreement for Funds, dated as of April 20, 2015, by and between MSCI Inc. (formerly, Morgan Stanley Capital International Inc.) and BlackRock Fund Advisors (as successor to Barclays Global Investors, N.A.) | | Filed Herewith | | | | | | | 10.107* | | Form of Award Agreement for Restricted Stock Units for Directors under the MSCI Inc. Independent Directors’ Equity Compensation Plan, as amended | | 10-Q | | 001-33812 | | 10.1 | | 5/1/2015 | | | | | | | 10.108* | | Change of Employment Status and Release Agreement for Roveen Bhansali | | 10-Q | | 001-33812 | | 10.1 | | 5/1/2015 | | | | | | | 10.109* | | MSCI Inc. Change in Control Severance Plan | | 8-K | | 001-33812 | | 10.1 | | 5/29/2015 | | | | 10.110†† | | Amendment (to amend the Amendment dated February 21, 2013) to the Index License Agreement for Funds, dated as of June 1, 2015, by and between MSCI Inc. (formerly, Morgan Stanley Capital International Inc.) and BlackRock Fund Advisors (as successor to Barclays Global Investors, N.A.) | | Filed Herewith | | | | 10.111†† | | Amendment to the Index License Agreement for Funds, dated as of June 1, 2015, by and between MSCI Inc. (formerly, Morgan Stanley Capital International Inc.) and BlackRock Fund Advisors (as successor to Barclays Global Investors, N.A.) | | Filed Herewith | | | | 10.112†† | | Amendment (to amend the Amendment dated November 6, 2012) to the Index License Agreement for Funds, dated as of June 4, 2015, by and between MSCI Inc. (formerly, Morgan Stanley Capital International Inc.) and BlackRock Fund Advisors (as successor to Barclays Global Investors, N.A.) | | Filed Herewith |
EX-11
| | | | | | | | | | | Exhibit
Number
| | Description
| | Form
| | File No.
| | Exhibit
No.
| | Filing Date
| | | | 10.113†† | | Amendment (to amend the Amendments dated January 23, 2014 and April 15, 2014) to the Index License Agreement for Funds, dated as of June 4, 2015, by and between MSCI Inc. (formerly, Morgan Stanley Capital International Inc.) and BlackRock Fund Advisors (as successor to Barclays Global Investors, N.A.) | | Filed Herewith | | | | | | | 10.114* | | Form of Performance Award Agreement for Performance Stock Units for Executive Officers under the MSCI Inc. 2007 Amended and Restated Equity Incentive Compensation Plan | | 10-Q | | 001-33812 | | 10.2 | | 7/31/2015 | | | | | | | 10.115* | | Form of Special Performance Award Agreement for Performance Stock Units under the MSCI Inc. 2007 Amended and Restated Equity Incentive Compensation Plan | | 10-Q | | 001-33812 | | 10.3 | | 7/31/2015 | | | | 10.116†† | | Amendment to the Index License Agreement for Funds, dated as of August 1, 2015, by and between MSCI Inc. (formerly, Morgan Stanley Capital International Inc.) and BlackRock Fund Advisors (as successor to Barclays Global Investors, N.A.) | | Filed Herewith | | | | 10.117†† | | Amendment (to amend the Amendment dated October 4, 2011) to the Index License Agreement for Funds, dated as of August 3, 2015, by and between MSCI Inc. (formerly, Morgan Stanley Capital International Inc.) and BlackRock Fund Advisors (as successor to Barclays Global Investors, N.A.) | | Filed Herewith | | | | 10.118†† | | Amendment (to amend the Amendment dated January 23, 2014) to the Index License Agreement for Funds, dated as of August 3, 2015, by and between MSCI Inc. (formerly, Morgan Stanley Capital International Inc.) and BlackRock Fund Advisors (as successor to Barclays Global Investors, N.A.) | | Filed Herewith | | | | 10.119†† | | Amendment (to amend the Amendment dated August 15, 2014) to the Index License Agreement for Funds, dated as of August 3, 2015, by and between MSCI Inc. (formerly, Morgan Stanley Capital International Inc.) and BlackRock Fund Advisors (as successor to Barclays Global Investors, N.A.) | | Filed Herewith |
EX-12
| | | | | | | | | | | Exhibit
Number
| | Description
| | Form
| | File No.
| | Exhibit
No.
| | Filing Date
| | | | 10.120†† | | Letter Agreement (to amend the Amendment dated August 15, 2014) to the Index License Agreement for Funds, dated as of August 3, 2015, by and between MSCI Inc. (formerly, Morgan Stanley Capital International Inc.) and BlackRock Institutional Trust Company, N.A. (formerly, Barclays Global Investors, N.A.) | | Filed Herewith | | | | 10.121†† | | Letter Agreement (to amend the Amendment dated April 20, 2015) to the Index License Agreement for Funds, dated as of October 9, 2015, by and between MSCI Inc. (formerly, Morgan Stanley Capital International Inc.) and BlackRock Institutional Trust Company, N.A. (formerly, Barclays Global Investors, N.A.) | | Filed Herewith | | | | 10.122†† | | Letter Agreement (to amend the Amendment dated December 10, 2013) to the Index License Agreement for Funds, dated as of December 17, 2015, by and between MSCI Inc. (formerly, Morgan Stanley Capital International Inc.) and BlackRock Institutional Trust Company, N.A. (formerly, Barclays Global Investors, N.A.) | | Filed Herewith | | | | 10.123* | | Transition and Release Agreement, dated as of February 10, 2016, by and between MSCI Inc. and Robert Qutub | | Filed Herewith | | | | | | | 10.124* | | Form of Multi-Year EICP PSU Award Agreement | | 8-K | | 001-33812 | | 10.1 | | 2/12/2016 | | | | | | | 10.125* | | Form of Multi-Year Omnibus PSU Award Agreement | | 8-K | | 001-33812 | | 10.2 | | 2/12/2016 | | | | 10.126 | | Amendment (to amend the Amendment dated January 23, 2014) to the Index License Agreement for Funds, dated as of April 15, 2014, by and between MSCI Inc. (formerly, Morgan Stanley Capital International Inc.) and BlackRock Fund Advisors (as successor to Barclays Global Investors, N.A.) | | Filed Herewith | | | | 21.1 | | Subsidiaries of the Registrant | | Filed Herewith | | | | 23.1 | | Consent of PricewaterhouseCoopers LLP | | Filed Herewith | | | | 23.2 | | Consent of Deloitte & Touche LLP | | Filed Herewith | | | | 24.1 | | Powers of Attorney (included as part of Signature Page) | | Filed Herewith | | | | 31.1 | | Rule 13a-14(a) Certification of Chief Executive Officer | | Filed Herewith |
EX-13
| | | | | | | | | | | Exhibit
Number
| | Description
| | Form
| | File No.
| | Exhibit
No.
| | Filing Date
| | | | 31.2 | | Rule 13a-14(a) Certification of Chief Financial Officer | | Filed Herewith | | | | 32.1 | | Section 1350 Certification of Chief Executive Officer and Chief Financial Officer | | Furnished Herewith | | | | 101.INS | | XBRL Instance Document. | | Filed Herewith | | | | 101.SCH | | XBRL Taxonomy Extension Schema Document. | | Filed Herewith | | | | 101.CAL | | XBRL Taxonomy Extension Calculation Linkbase Document. | | Filed Herewith | | | | 101.LAB | | XBRL Taxonomy Extension Label Linkbase Document. | | Filed Herewith | | | | 101.PRE | | XBRL Taxonomy Extension Presentation Linkbase Document. | | Filed Herewith | | | | 101.DEF | | XBRL Taxonomy Extension Definition Linkbase Document. | | Filed Herewith |
* | Indicates a management compensation plan, contract or arrangement. |
† | Confidential treatment has been granted for a portion of this exhibit. |
†† | Confidential treatment requested. |
EX-14
|
|