The impact of possible cybersecurity incidents;
Cost of capital and capital requirements;
Changes in interpretations or applications of the Tax Cuts and Jobs Act through regulations and guidance that may be issued by the U.S. Department of Treasury;
Possible litigation and legal liability in the course of operations, and the Company’s ability to settle or otherwise resolve such litigation;
Governmental and public policy changes, including, but not limited to, legislative and administrative law and rule implementation or change;
The ability of the Company to produce market-competitive software;
The ability to attract and retain key personnel;
The section entitledimpact of recently issued accounting standards on the Company’s consolidated financial statements; and
Growth in the Company’s sale of third party administrator (“TPA”) services.
Part I, Item 1A of this annual report, “Risk Factors” set forth in this report, discusses these and other important risk factors that may affect our business, results of operations and financial condition. The factors listed above and the factors described under the headingin Part I, Item 1A of this annual report, “Risk Factors”, and similar discussions in our other filings with the Securities and Exchange Commission are not necessarily all of the important factors that could cause actual results to differ materially from those expressed in any of our forward-looking statements. Other unknown or unpredictable factors also could have material adverse effects on our future results. Investors should consider these factors before deciding to make or maintain an investment in our securities. The forward-looking statements included in this annual report on Form 10-K are based on information available to us as of the date of this annual report. We expressly disclaim any intent or obligation to update any forward-looking statements to reflect subsequent events or circumstances.
INTRODUCTION
CorVel is a national provider of workers’ compensation solutions for employers, third party administrators, insurance companies, and government agencies seeking to control costs and promote positive outcomes. The Company applies technology, intelligence, and a human touch to the challenges of risk management so that their clientsits customers can intervene early and often while being connected to the critical intelligence they need to proactively manage risk. CorVel specializes in applying advanced communication and information technology to improve healthcare management for workers’ compensation, group health, autoautomobile and liability insurance claims management. With a technology platform at its core, the Company’s connected solution is delivered by a national team of associates who are committed to helping clientscustomers deliver programs that meet their organization’s performance goals.
The Company’s services include claims management, bill review, preferred provider networks, utilization management, case management, pharmacy services, directed care and Medicare services. CorVel offers its services as a bundled solution (i.e. claims management), as a standalone service, or as add-on services to existing customers. Customers of the Company that do not purchase a bundled solution generally use another provider, use an in-house solution, or choose not to utilize such a service to manage their workers’ compensation costs. When customers purchase several products from CorVel, the pricing of the products sold is generally the same as if the productproducts were sold on an individual basis. Bundled products are generally delivered in the same accounting period.
The Company was incorporated in Delaware in 1987, and its principal executive offices are located at 20101920 Main Street, Suite 600,900, Irvine, California 92614. The Company’s telephone number is 949-851-1473.
INDUSTRY OVERVIEW
Workers’ compensation is a federally mandated, state-legislated insurance program that requires employers to fund medical expenses, lost wages, and other costs resulting from work-related injuries and illnesses. Workers’ compensation benefits and arrangements vary extensively on a state-by-state basis and are often highly complex. State statutes and court decisions control many aspects of the compensation process, including claims handling, impairment or disability evaluation, dispute settlement, benefit amount guidelines, and cost-control strategies.
In addition to the compensation process, cost containment and claims management continue to be significant employer concerns and many look to managed care vendors and third party administrators for cost savings solutions. The Company believes that cost drivers in workers’ compensation include: implementing effective return to workreturn-to-work and transitional duty programs, coordinating medical care, medical cost management, recognizing fraud and abuse, and improving communications with injured workers. CorVel provides solutions using a holistic approach to cost containment and by looking atfor a complete savings solution. Often one of the biggest cost drivers is not recognizing a complex claim at the onset of an injury, often resulting in claims being open longer and resulting in a delayed return to work. CorVel uses an integrated claims model that controls claims costs by advocating medical management at the onset of the injury to decrease administrative costs and to shorten the length of the disability.
Some states have adopted legislation for managed care organizations (MCO)(“MCOs”) in an effort to allow employers to control their worker’s compensation costs. A managed care plan is organized to serve the medical needs of injured workers in an efficient and cost-effective manner by managing the delivery of medical services through appropriate health care professionals. CorVel is registered wherever legislation mandates, where it is beneficial for the Company to obtain a license, or where the MCO ishas an effective utilized mandate. Since MCO legislation varies by state, CorVel’s state offerings vary as well. CorVel continually evaluates new legislation to ensure it is in compliance and can offer appropriate services to its customers and prospects.
FISCAL 20162020 DEVELOPMENTS
Company Stock Repurchase Program
During fiscal 2016,2020, the Company continued to repurchase shares of its common stock under a plan originally approved by the Company’s Board of Directors in 1996. In November 2015, the Company’s Board of Directors increased the number of shares of common stock authorized to be repurchased over the life of the plan by 1,000,000 shares of common stock to 35,000,000 shares of common stock. During fiscal 2016,2020, the Company spent $31.5$66 million to repurchase 893,771822,353 shares of its common stock. Since commencing this program in the fall of 1996, the Company has repurchased 33,886,25936,285,591 shares of its common stock through March 31, 2016,2020, at a cost of $392$532 million. These repurchases were funded primarily from the Company’s operating cash flows. On March 21, 2020, the Company temporarily suspended its stock repurchase program in order to provide the Company maximum flexibility to focus on serving its customers as it navigates through the COVID-19 pandemic. The Company has lifted this temporary suspension and expects to resume its stock repurchase program in the June 2020 quarter.
The Company offers services in two general categories, network solutions and patient management, to assist its customers in managing the increasing medical costs of workers’ compensation, group health and auto insurance, and in monitoring the quality of care provided to claimants. CorVel reduces claims costs by advocating medical management at the onset of an injury to decreasecontrol administrative costs and to shorten the length of the disability. These solutions offer personalized treatment programs that use precise treatment protocols to advocate timely, quality care for injured workers.
Network Solutions Services
CorVel offers a complete medical savings solution for all in-network and out-of-network medical bills including PPO management, specialty networks, medical bill repricing,professional nurse review, true line item review, expert fee negotiations, professional nurse review,specialty networks, PPO management, medical bill repricing, automated adjudication and electronic reimbursement. Each feature focuses on increasing processing efficiencies and maximizing savings opportunities.
Bill Review
Many states have adopted fee schedules, which regulate the maximum allowable fees payable under workers’ compensation for procedures performed by a variety of health treatment providers. Developed in 1989, CorVel’s proprietary bill review and claims management technology automates the review process to provide customers with a faster turnaround time, more efficient bill review and a higher total savings. CorVel’s artificial intelligence engine includes over sixty112 million individual rules, which creates a comprehensive review process that is more efficient than traditional manual bill review processes.
Payors are able to review and approve bills online as well as access savings reports through an online portal, CareMC.CareMC, which is discussed in further detail below. The process is paperless, throughdue to scanning and electronic data interface (“EDI”), while proving to be cost effective and efficient.efficient, which is discussed in further detail below. CorVel’s solutions are fully customizable and can be tailored to meet unique payor requirements.
Bill Review Servicesreview services include:
Repricing
PPO Management
PPOs are groups of hospitals, physicians and other healthcare providers that offer services at pre-negotiated rates to employee groups. The Company believes that PPO networks offer the employer an additional means of managing healthcare costs by reducing the per-unit price of medical services provided to employees. CorVel began offering a proprietary national PPO network in 1992, and today it is comprised of over 750,000 board-certified providers. The Company provides the convenience of a PPO Providerprovider look-up mobile application for use with iPhone, iPadsmart phones and Android.tablets. The application is available to the public and makes it convenient to locate a provider in the CorVel network. Users can search providers based on quality, range of services, and location.
CorVel has a long-term strategy of network development, providing comprehensive networks to our customers and customization of networks to meet the specific needs of our customers. The Company believes that the combination of its national PPO strength and presence and the local PPO developers’ commitment and community involvement enables CorVel to build, support and strengthen its PPO in size, quality, depth of discount, and commitment to service.
The Company has a team of national, regional and local personnel supporting the CorVel network. This team of PPO developers areis responsible for local recruitment, contract negotiations, credentialing and re-credentialing of providers, and working with customers to develop customer specificcustomer-specific provider networks. Each bill review operation has provider relations support staff to address provider grievances and other billing issues.
Providers are selected from criteria based on quality, range of services, price and location. Each provider is thoroughly evaluated and credentialed, then re-credentialed every three years. Through this extensive evaluation process, we are able to provide significant hospital, physician and ancillary medical savings, while maintaining high quality care. Provider network services include a national network for all medical coverages, board-certified physicians, provider credentialing, patient channeling, online PPO look-up, printable directories and driving directions, and Managed Care Organizations (MCO).MCOs.
CERiSSM®
CERiS, CorVel’s enhanced bill review program, allows claim payors to adjust individual line itemperforms a clinical review and comparative analysis of itemized billing statements against national and customer payment standards. The Company’s comprehensive forensic solution reviews charge utilization, appropriateness of charges, on all bills to reasonable and customary levels while removing all error and billing discrepancies with professional review.behavior, to verify proper payment for claims. The enhanced billservices range from hospital itemization review program scrutinizes each hospital line descriptionto make sure the charges are correct, to repricing of claims using multi-variant methods, to code correction and charge as a separate and distinct claimnegotiations for reimbursement. CorVel’s proprietary Universal Chargemaster defines each code and description, enabling its registered nurses to identify errors, duplicate charges, re-bundle exploded charges, correct quantity discrepancies and remove unused supplies.out of network claims.
Professional Review
CorVel’s services offer a complete audit and validation of facility bill accuracy. This solution also includes review of in-network facility bills. The Company’s experienced nurse auditors have clinical backgrounds in all areas of medicine, medical billing and coding to ensure an accurate, consistent and thorough review. If a bill is identified for professional review, the bill image and its associated medical reports are routed within the system to an experienced medical nurse for review and auditing.
Provider Reimbursement
One of the interfaces of CorVel’s bill review service is the automated issuance of provider reimbursements. CorVel’s provider reimbursement service allows the ability to determine dollars spent and bills reviewed and to assist in setting reserves through charts available online. Through the bill review system, CorVel has the capability to provide check writing or provider reimbursement services for its customers. The provider payment check can be added to the bill analysis to produce one combined document.
SymbeoSM
We continue to leverage our Symbeo technologies, which include scanning, optical character recognition, and document management services. We continue to expand our existing office automation service line and all offices are selling scanning and document management. We have added scanning operations to most of the Company’s larger offices around the country, designating them “Capture Centers.” Our scanning service also offers a web interface (www.onlinedocumentcenter.com) providing immediate access to documents and data called the Online Document Center (known as ODC). Secure document review, approval, transaction workflow and archival storage are available at subscription-based pricing.
Additionally, Symbeo provides accounts payable automation that manages the entire accounts payable process. Routing for coding and approvals are configured to customer specific workflows, which automatically routes each invoice to a specific review or approval status.
Pharmacy Services
CorVel provides patients with a full-feature pharmacy program that offers formulary management, discounted prescriptions, drug interaction monitoring, utilization management and eligibility confirmation. Our pharmacy network of nationally recognized pharmacies provides savings off the retail price of prescriptions associated with a workers’ compensation claim. The Company’s pharmacy services program includes preferred access to a national pharmacy network, streamlined processing for pharmacies at point of sale, first fill and next fill programs, mail order and 90-day retail options, out-of-network management, medication review services and clinical modeling.
Directed Care Services
CorVel offers a national directed care network that provides access to specialty medical services, which may be required to support an injured worker’s medical treatment plan. CorVel has contracted with medical imaging, physical therapy, diagnostics and ancillary service networks to offer convenient access, timely appointments and preferred rates for these services. The Company manages the entire coordination of care from appointment scheduling through reimbursement, working to achieve timely recovery and increased savings. The Company has directed care networks for CT and bone scans,MRI, diagnostic imaging, physical and occupational therapy, independent medical evaluations, durable medical equipment and transportation and translation.
The Company offers solutions to help manage the requirements mandated by the Centers for Medicare and Medicaid Services (CMS)(“CMS”). Services include Medicare Set Asides and Agent Reporting Services to help employers comply with new CMS reporting legislation. As an assigned agent, CorVel can provide services for Responsible Reporting Entities (RRE)(known as RREs) such as insurers and employers. As an experienced information-processing provider, CorVel is able to electronically submit files to the CMS in compliance with timelines and reporting requirements.
Clearinghouse Services
CorVel’s proprietary medical review software and claims management technology interfaces with multiple clearinghouses. The Company’s clearinghouse services provide for medical review, conversion of electronic forms to appropriate payment formats, seamless submittalsubmission of bills for payments and rules engines used to help ensure jurisdictional compliance.
Patient Management Services
CorVel offers a unique approach to claims administration and patient management. Patient management services include claims management and all services sold to claims management customers, case management, 24/7 nurse triage, utilization management, vocational rehabilitation, and life care planning. This integrated service model controls claims costs by advocating medical management at the onset of the injury to decrease administrative costs and to shorten the length of the disability. This automated solution offers a personalized treatment program for each injured worker, using precise treatment protocols to meet the changing needs of patients on a frequentan ongoing basis. The Company offers these services on a stand-alone basis or as an integrated component of its medical cost containment services.
Claims Management
CorVel has been a third party administrator (“TPA”)TPA offering claims management services since January 2007. The Company serves customers in the self-insured orand commercially-insured markets. Incidents and injuries are reported through a variety of intake methods that include a 24/7 nurse triage call center, website, mobile applications, toll-free call centers and traditional methods of paper and fax reporting. TheyThe reported incidents and injuries are immediately processed by CorVel’s proprietary rules engine, which provides alerts and recommendations throughout the life of a claim. This technology instantly assigns the claimant an expert claims professional, while simultaneously determining if a claim requires any immediate attention for triage.
Through this service, the Company serves clientscustomers in the self-insured or commercially-insured market through alternative loss funding methods, and provides them with a complete range of services, including claims administration, case management, and medical bill review. In addition to the field investigation and evaluation of claims, the Company also may provide initial loss reporting services for claims, loss mitigation services such as medical bill review, and vocational rehabilitation, administration of trust funds established to pay claims, and risk management information services.
Some of the features of claims management services include: automated first notice of loss, three-point contact within 24 hours, prompt claims investigations, detailed diary notes for each step of the claim, graphical dashboards and claim history scorecards, and litigation management and expert testimony.
Case Management
CorVel’s case management and utilization review services address all aspects of disability management and recovery, including utilization review (pre-certification, concurrent review and discharge planning), early intervention, telephonic, field and catastrophic case management, as well as vocational rehabilitation.
The medical management components of CorVel’s program focus on medical intervention, management and appropriateness. In these cases, the Company’s case managers confer with the attending physician, other providers, the patient and the patient’s family to identify the appropriate rehabilitative treatment and most cost-effective healthcare alternatives. The program is designed to offer the injured party prompt access to appropriate medical providers who will provide quality cost-effective medical care. Case managers may coordinate the services or care required and may arrange for special pricing of the required services.
The Telephonic Case Manager (TCM) continues to impact the direction of the case, focusing on early return to work, maximum medical improvement (MMI) and appropriate duration of disability. Facilitation of appropriate treatment, assertive negotiation with medical providers and directing the care of the injured worker continues to be the Telephonic Case Manager’s role until the closure criteria is met. Utilization review of provider treatment remains ongoing until discharge from treatment.
In the event that a claim may require an onsite referral, a Field Case Manager (FCM)(“FCM”) will be assigned to the claim. Cases can be referred to CorVel based on geographic location and injury type to the most appropriate FCM. Specialized case management services include catastrophic management, life care planning, and vocational rehabilitation services. All FCMs have iPads that provide access to the Company’s proprietary mobile applications, that provideproviding instant access to detailed case information and the ability to enter case notes. An additional feature of our iPad applications is the ability to electronically approve and email signed case management forms and documentation.
24/7 Nurse TriageVirtual Care Platform
Injured workers can call at the time of injury or incident and speak with a registered nurse who specializes in occupational injuries. An assessment is immediately made to recommend self-care, or referral for further medical care if needed. CorVel is able to provide quick and accurate care intervention, often preventing a minor injury from becoming an expensive claim. The 24/7 nurse triage services provide channeling to a preferred network of providers, allows employer access to online case information, comprehensive incident gathering, and healthcare advocacy for injured workers. Additionally, after being screened by a triage nurse, the service offering will now include the ability to connect injured workers with virtual doctor visits via computers and smart mobile devices through CorVel’s new service, Telehealth. Telehealth, which is approved in nearly all states, is integrated into CorVel’s proactive healthcare model as an option for qualified injuries, primarily musculoskeletal. Telehealth preserves the integrity of the patient-physician relationship with confidential, HIPAA compliant transactions, while also channeling injured workers to network providers for physical therapy or prescriptions when needed.
Utilization Management
Utilization Management programs review proposed care to determine appropriateness, frequency, duration and setting. These programs utilize experienced registered nurses, proprietary medical treatment protocols and systems technology to avoid unnecessary treatments and associated costs. Processes in Utilization Management include: injury review, diagnosis and treatment planning;planning, contacting and negotiating provider treatment
requirements; requirements, certifying appropriateness of treatment parameters, and responding to provider requests for additional treatment. Utilization managementManagement services include: prospective review, retrospective review, concurrent review, professional nurse review, second opinion, peer review, precertifications and independent medical evaluation.
Vocational Rehabilitation
CorVel’s Vocational Rehabilitation program is designed for injured workers needing assistance returning to work or retaining employment. This comprehensive suite of services helps employees who are unable to perform previous work functions and who face the possibility of joining the open labor market to seek re-employment. These services are available unbundled on an integrated basis as dictated by the requirement of each case and clientcustomer preference, or by individual statutory requirements. Vocational rehabilitation services includeinclude: ergonomic assessments, rehabilitation plans, transferable skills analysis, labor market services, job seeking skills, resumé development, job analysis and development, job placement, career counseling and expert testimony.
Life Care Planning
Life Care Planning is used to project long-term future needs, services and related costs associated with a catastrophic injury. CorVel’s Life Care Plans summarize extensive amounts of medical data and compile it into a comprehensive report for future care requirements, aiding improved outcomes and timely resolution of claims. The Life Care Plans also provide working guidelines and points of reference for the family of a disabled person. Some of the features of the Company’s Life Care Planning services include: comprehensive documentation, projecting future care requirements, customized reporting, certified documentation and costs specific to local areas.
Disability Management
CorVel’s disability management programs offer a continuum of services for short and long-term disability coverages that advocate an employee’s early return to work. Disability management services includeinclude: absence reporting, disability evaluations, national preferred provider organizations, independent medical examinations, utilization review, medical case management, return to workreturn-to-work coordination and integrated reporting.
Liability Claims Management
CorVel also offers liability claims management services that can be sold as a stand-alone service or part of patient management. The Company’sLiability claims management services includeencompass auto liability, general liability, product liability, personal injury, professional liability and property damage, accidents and weather-related damage. This service includesThese services include claims management, adjusting services, litigation management, claims subrogation, and investigations.
Injury claims are one of the largest components of auto indemnity costs. Effective management of these claims and their associated costs, combined with an optimal healthcare management program, helps CorVel’s customers reduce claim costs. The Company’s auto claims services include national preferred provider organizations, medical bill review, first and third party bill review, first notice of loss, demand packet reviews and reporting and analytics.
SYSTEMS AND TECHNOLOGY
Infrastructure and Data Center
The Company utilizes a Tier III-rated data center as its primary processing site. Redundancy is provided at many levels in power, cooling, and computing resources, with the goal of ensuring maximum uptime and system availability for the Company’s production systems. The Company has fully embraced server virtualization and consolidation techniques to push the fault-tolerance of systems even further. These technologies bring increased availability, speed-to-production and scalability.
Adoption of Imaging Technologies and Paperless Workflow
Utilizing scanning and automated data capture processes allows the Company to process incoming paper and electronic claims documents, including medical bills, with less manual handling, and which has improved the Company’s workflow processes. This has benefited both the Company, in terms of cost-savings,cost savings, and the Company’s customers, in improved savings results. Through the Company’s internetonline portal, www.caremc.com,CareMC (www.caremc.com), customers can review the bills as soon as they are processed and approve a bill for payment, streamlining the customer’s own workflows and expediting the payment process.
Redundancy Center
The Company’s national data center is located near Portland, Oregon. The Company has migrated its redundancy center, from Fort Worth, Texas to Las Vegas, Nevada. The redundancy centerwhich is located in Lone Mountain, Nevada, is the Company’s backup processing site in the event that the Portland data center suffers catastrophic loss. Currently, the Company’s data is continually replicated to Las VegasLone Mountain in near-real time, so that in the event the Portland data center is offline, the redundancy center can be activated with current information quickly. The Las VegasLone Mountain data center also hosts duplicates of the Company’s websites. The Las Vegas systems are maintained and exercised on a continuous basis as they host demonstration and pilot environments that mirror production, with the goal of ensuring their ongoing readiness.
CareMCSM®
CareMC (www.caremc.com) has become theis CorVel’s application platform for all of the Company’s primary service lines and delivers immediate access to customers. CareMCwhich offers customers direct and immediate access to the Company’s primary services.service lines. CareMC allows for electronic communication and reporting between providers, payers, employers and patients. Features of the website include: report an incident/injury, request for service, appointment scheduling, online bill review, claims information management, treatment calendar, medical bill adjudication and automated provider reimbursement.
Through the CareMC, Website, users can:
The CareMC website facilitates healthcare transaction processing. Using artificial intelligence techniques,technology, the website provides situation alerts and event triggers, to facilitate prompt and effective decisions. Users of CareMC can quickly see where event outliers are occurring within the claims management process. If costs exceed pre-determined thresholds or activities fall outside expected timelines, decision-makers, i.e. the customer, can be quickly notified. Large amounts ofThe latest feature within CareMC, the Edge, modernizes claims processing and adapts to the way people need to work. This module facilitates quicker decision making by prioritizing information are consolidatedthat is easily actionable. Seamlessly integrated within the platform, the Edge browses codified data and summarizedprioritizes claims, alerting adjusters to those claims needing attention and what actions need to be taken. The Edge brings forward live, up to the minute claims information on one screen to help customers focus on the critical issues.guide users toward their next action.
Scanning Services
We continue to leverage our scanning technologies which include scanning, optical character recognition and document management services. We continue to expand our existing office automation service line and all offices are selling scanning and document management. We have added scanning operations to most of the Company’s larger offices around the country, designating them “Capture Centers.” Our scanning service also offers a web interface (www.onlinedocumentcenter.com) providing immediate access to documents and data called the Online Document Center (ODC). Secure document review, approval, transaction workflow and archival storage are available at subscription-based pricing.
Claims Processing
We continue to develop our claims system capabilities, which fit well withreflects the Company’s preference for owning and maintaining our own software assets. Integration projects, some already completed, are underway to present more of this claims-centric information available through the CareMC webonline portal. The Company’s goal is to continue to modernize user interfaces, and to streamline the delivery of this information to our customers, givinggive more rapid feedback and puttingput real-time information in the hands of our customers.
INDUSTRY, CUSTOMERS AND MARKETING
CorVel serves a diverse group of customers that include insurers, third party administrators, self-administered employers, government agencies, municipalities, state funds, and numerous other industries. CorVel is able to provide workers’ compensation services to virtually any size employer and in any state or region of the United States. No single customer of the Company represented more than 10% of revenues in fiscal 2014, 2015 and 2016.2020, 2019 or 2018. Many claims management decisions in workers’ compensation are the responsibility of the local claims office of national or regional insurers. The Company’s national branch office network enables the Company to market and offer its services at both a local and national account level. The Company is placinghas placed increasing emphasis on national account marketing. The sales and marketing activities of the Company are conducted primarily by account executives located in key geographic areas.
COMPETITION AND MARKET CONDITIONS
The healthcare cost containment industry is competitive and is subject to economic pressures for cost savings and legislative reforms. CorVel’s primary competitors in the workers’ compensation market include third party administrators, managed care companies,MCOs, large insurance carriers and numerous independent companies. Many of the Company’s competitors are significantly larger and have greater financial and marketing resources than the
Company. Moreover, the Company’s customers may establish the in-house capability of performing the kinds of services offered by the Company. If the Company is unable to compete effectively, it will be difficult to add and retain customers, and the Company’s business, financial condition and results of operations will be materially and adversely affected.
TheThere has been unprecedented acceleration in technology in the past few years have seen acceleration in the technology world, and advancements seem to be progressing at a pace that few, if any, have ever witnessed.years. The proliferation of smart phones and tablet computers allows the Company’s clientscustomers to stay connected at any time, from anywhere. This capability provides immediate access and begins to present business opportunities that were previously predicated on a less connected environment. The Company continues to leverage the new wave of technology in order to connect all of the parties involved in the workers’workers' compensation process in ways that were unimaginable in the past. As with general health, according to the workersNational Council on Compensation Insurance, the workers’ compensation line continues to migrate to being a medical management business, with policymakers, employers, and carriers struggling to manage and control the costs of medical care (Source “National Council on Compensation Insurance”).care. The Company will continue to focus the execution of its strategy to provideon providing industry leading claims management and cost containment solutions to the market.
We are required to be licensed or receive regulatory approval in nearly every state and foreign jurisdiction in which we do business. In addition, most jurisdictions require individuals who engage in claim adjusting and certain other insurance service activities to be personally licensed. These licensing laws and regulations vary from jurisdiction to jurisdiction. In most jurisdictions, licensing laws and regulations generally grant broad discretion to supervisory authorities to adopt and amend regulations and to supervise regulated activities.
GOVERNMENT REGULATIONS
General
Managed healthcare programs for workers’ compensation are subject to various laws and regulations. Both the nature and degree of applicable government regulation vary greatly depending upon the specific activities involved. Generally, parties that actually provide or arrange for the provision of healthcare services, such as the Company, assume
financial risk related to the provision of those services or undertake direct responsibility for making payment or payment decisions for those services. These parties are subject to a number of complex regulatory requirements that govern many aspects of their conduct and operations.
In contrast, the management and information services provided by the Company to its customers typically have not been the subject of regulation by the federal government or the states. Since the managed healthcare field is a rapidly expandingrapidly-expanding and changing industry and the cost of providing healthcare continues to increase, it is possible that the applicable state and federal regulatory frameworks will expand to have a greater impact upon the conduct and operation of the Company’s business.
Under the current workers’ compensation system, employer insurance or self-funded coverage is governed by individual laws in each of the 50 states and by certain federal laws. The management and information services that make up the Company’s managed care program serve markets that have developed largely in response to needs of insurers, employers and large TPAs, and generally have not been mandated by legislation or other government action. On the other hand, the vocational rehabilitation case management marketplace within the workers’ compensation system has been dependent upon the laws and regulations within those states that require the availability of specified rehabilitation services for injured workers. Similarly, the Company’s fee schedule auditing services address market needs created by certain states’ enactment of maximum permissible fee schedules for workers’ compensation services. Changes in individual state regulation of workers’ compensation may create a greater or lesser demand for some or all of the Company’s services or require the Company to develop new or modified services in order to meet the needs of the marketplace and compete effectively in that marketplace.
We are required to be licensed or receive regulatory approval in nearly every state and foreign jurisdiction in which we do business. In addition, most jurisdictions require individuals who engage in claim adjusting and certain other insurance service activities to be personally licensed. These licensing laws and regulations vary from jurisdiction to jurisdiction. In most jurisdictions, licensing laws and regulations generally grant broad discretion to supervisory authorities to adopt and amend regulations and to supervise regulated activities.
Medical Cost Containment Legislation
Historically, governmental strategies to contain medical costs in the workers’ compensation field have been generally limited to legislation on a state-by-state basis. For example, many states have implemented fee schedules that list maximum reimbursement levels for healthcare procedures. In certain states that have not authorized the use of a fee schedule, the Company adjusts bills to the usual and customary levels authorized by the payor. Opportunities for the Company’s services could increase if more states legislate additional cost containment strategies. Conversely, the Company would be materially and adversely affected if states elect to reduce the extent of medical cost containment strategies available to insurance carriers and other payors, or adopt other strategies for cost containment that would not support a demand for the Company’s services.
SHAREHOLDER RIGHTS PLAN
During fiscal 1997, the Company’s Board of Directors approved the adoption of a Shareholdershareholder rights plan (the “Shareholder Rights Plan.Plan”). The Shareholder Rights Plan provides for a dividend distribution to CorVel stockholders of one preferred stock purchase right for each outstanding share of CorVel’s common stock underheld by such stockholder (as used in this section, the “right” or the “rights”), only in the event of certain circumstances.takeover-related events. In April 2002, the Board of Directors of CorVel approved an amendment to the Shareholder Rights Plan to extend the expiration date of the rights to February 10, 2012, set the exercise price of each right at $118, and enable Fidelity Management & Research Company and its affiliates to purchase up to 18% of the shares of common stock of the Company without triggering the stockholder rights, with the limitations under the Shareholder Rights Plan remaining in effect for all other stockholders of the Company. In November 2008, the Company’s Board of Directors approved an amendment to the Shareholder Rights Plan to extend the expiration date of the rights to February 10, 2022, remove the ability of Fidelity Management & Research Company and its affiliates to purchase up to 18% of the shares of common stock of the Company without triggering the stockholder rights, substitute Computershare Trust Company, N.A. as the rights agent and effect certain technical changes to the Shareholder Rights Plan.
The rights are designed to assure that all shareholders receive fair and equal treatment in the event of anya proposed takeover of the Company, and to encourage a potential acquirer to negotiate with the Board of Directors prior to attempting a takeover. The rights haveare not exercisable until the occurrence of certain takeover-related events, at which time they can be exercised at an exercise price of $118 per share of common stock which carries the right, subject to subsequent adjustment. The rights trade with the Company’s common stock and will not be exercisable until the occurrence of certain takeover-related events.stock.
Generally, the Shareholder Rights Plan provides that if a person or group acquires 15% or more of the Company’s common stock without the approval of the Company’s Board of Directors, subject to certain exception,exceptions, the holders of the rights, other than the acquiring person or group, would, under certain circumstances, have the right to purchase additional shares of the Company’s common stock having a market value equal to two times the then-current exercise price of the right.
In addition, if the Company is thereafter merged into another entity, or if 50% or more of the Company’s consolidated assets or earning power are sold, then the right willwould entitle its holder to buy common shares of the acquiring entity having a market value equal to two times the then-current exercise price of the right. The Company’s Board of Directors may exchange or redeem the rights under certain conditions.
EMPLOYEES
As of March 31, 2016,2020, CorVel had 3,5083,824 employees, including nurses, therapists, counselors and other employees. No employees are represented by any collective bargaining unit. Management believes the Company’s relationship with its employees to be good.
AVAILABLE INFORMATION
Copies of our Annual Reports on Form 10-K, Quarterly Reports on Form 10-Q, Current Reports on Form8-K, proxy statements and any amendments to those reports filed or furnished pursuant to Sections 13(a) or 15(d) of the Securities Exchange Act, of 1934, and other filings made with the Securities and Exchange Commission (“SEC”), are available free of charge through our Web sitewebsite (http://www.corvel.com, under the Investor section) as soon as reasonably practicable after such reports are electronically filed with, or furnished to, the SecuritiesSEC. The SEC also maintains a website at www.sec.gov that contains reports, proxy and Exchange Commission. information statements, and other information regarding issuers that file electronically with the SEC.
The inclusion of our Web sitewebsite address and the address of any of our portals, such as www.caremc.com and www.onlinedocumentcenter.com, in this annual report does not include or incorporate by reference into this annual report any information contained on, or accessible through, such Web sites.websites.
Past financial performance is not necessarily a reliable indicator of future performance, and investors in our common stock should not use historical performance to anticipate results or future period trends. Investing in our common stock involves a high degree of risk. Investors should consider carefully the following risk factors, as well as the other information in this annual report and our other filings with the Securities and Exchange Commission,SEC, including our consolidated financial statements and the related notes, before deciding whether to invest or maintain an investment in shares of our common stock. If any of the following risks actually occurs, our business, financial condition, and results of operations would suffer. In this case, the trading price of our common stock would likely decline. The risks described below are not the only ones we face. Additional risks that we currently do not know about or that we currently believe to be immaterial may also may impair our business operations.
If we fail to grow our business internally or through strategic acquisitions we may be unable to execute our business plan, maintain high levels of service or adequately address competitive challenges.
Our strategy is to continue internal growth and, as strategic opportunities arise in the workers’ compensation managed care industry, to consider acquisitions of, or relationships with, other companies in related lines of business. As a result, we are subject to certain growth-related risks, including the risk that we will be unable to retain personnel or acquire other resources necessary to service such growth adequately. Expenses arising from our efforts to increase our market penetration may have a negative impact on operating results. In addition, there can be no assurance that any suitable opportunities for strategic acquisitions or relationships will arise or, if they do arise, that the transactions contemplated could be completed. If such a transaction does occur, there can be no assurance that we will be able to integrate effectively any acquired business. In addition, any such transaction would be subject to various risks associated with the acquisition of businesses, including, but not limited to, the following:
There canfuture be no assurance that we will be able to identify or consummate any future acquisitions or other strategic relationships on favorable terms, or at all, or that any future acquisition or other strategic relationship will not have an adverse impact on our business or results of operations. If suitable opportunities arise, we may finance such transactions, as well as internal growth, through debt or equity financing. There can be no assurance, however, that such debt or equity financing would be available to us on acceptable terms when, and if, suitable strategic opportunities arise.
If we are unable to increase our market share among national and regional insurance carriers and large, self-funded employers, our results may be adversely affected.
Our business strategy and future success depend in part on our ability to capture market share with our cost containment services as national and regional insurance carriers and large, self-funded employers look for ways to achieve cost savings. We cannot assure you that we will successfully market our services to these insurance carriers and employers or that they will not resort to other means to achieve cost savings. Additionally, our ability to capture additional market share may bematerially adversely affected by the decisionCOVID-19 coronavirus pandemic.
The global spread of potential customersthe COVID-19 coronavirus has created significant volatility, uncertainty, unemployment and economic disruption. The extent to perform services internally instead of outsourcingwhich the provision of such services to us. Furthermore,COVID-19 pandemic impacts our business, operations and financial results will depend on numerous evolving factors that we may not be able to demonstrate sufficient cost savingsaccurately predict, including:
the duration and scope of the pandemic;
governmental, business and individuals’ actions that have been and continue to potential or currentbe taken in response to the pandemic;
the impact of the pandemic on economic activity and actions taken in response;
the effect on our customers and customer demand for our services and solutions, that could cause a reduction in revenue;
our ability to sell and provide our services and solutions, including as a result of travel restrictions and employees working from home and widespread unemployment;
the ability of our customers to induce them notpay for our services and solutions;
the impact on our third party vendors;
any closures of our and our customers’ offices and facilities, and
any restrictions on our ability to provide comparable services internallyat a claim site or the location of a claimant whether for purposes of evaluating the claim or delivering services.
The closure of offices or restrictions inhibiting our employees’ ability to accelerate effortstravel or interact with claimants and access claim sites, has disrupted, and could in the future disrupt our ability to provide such services internally.
If competition increases, our growth and profits may decline.
The markets for our network services and patient management services are also fragmentedsolutions to our customers. In addition, widespread unemployment has resulted in fewer doctor visits and competitive. Our competitors include national managed care providers, preferred provider networks, smaller independent providers and insurance companies. Companies that offer one or morefewer workers’ compensation managed care services on a national basis are our primary competitors. We also compete with many smaller vendors who generally provide unbundled services on a local level, particularly companies with an established relationship with a local insurance company adjuster. In addition, several large workers’ compensation insurance carriers offer managed care services for their customers, either by performance of the services in-house or by outsourcing to organizations like ours. If these carriers increase their performance of these services in-house, our business may be adversely affected. In addition, consolidation in the industryand general liability claims. This may result in, carriers performing moreamong other things, lower demand for our services, terminations of suchcustomer contracts, delay in our ability to perform services, in-house.an altering of the mix of services requested by customers and claimants, and other losses of revenue. Customers may also slow down decision making, delay planned work or seek to terminate existing agreements. Any of these events could cause or contribute to the risks and uncertainties enumerated in this report and could materially adversely affect our business, financial condition, results of operations and/or stock price.
Our sequential revenue may not increase and may decline. As a result, we may fail to meet or exceed the expectations of investors or analysts which could cause our common stock price to decline.
Our sequential revenue growth may not increase and may decline in the future as a result of a variety of factors, many of which are outside of our control. If changes in our sequential revenue fall below the expectations of investors or analysts, the price of our common stock could decline substantially. Fluctuations or declines in sequential revenue growth may be due to a number of factors, including, but not limited to, those listed below and identified throughout this “Risk Factors” section: the decline in manufacturing employment, the decline in workers’ compensation claims, the decline in healthcare expenditures, the considerable price competition in a flat-to-declining workers’ compensation market, litigation, the increase in competition, and the changes and the potential changes in state workers’ compensation and automobile-managed care laws which can reduce demand for our services. These factors create an environment where revenue and margin growth is more difficult to attain and where revenue growth is less certain than historically experienced. Additionally, our technology and preferred provider network face competition from companies that have more resources available to them than we do. Also, some customers may handle their managed care services in-house and may reduce the amount of services which are outsourced to managed care companies such as CorVel.us. These factors could cause the market price of our common stock to fluctuate substantially. There can be no assurance that our growth rate in the future, if any, will be at or near historical levels.
In addition, the stock market has in the past experienced price and volume fluctuations that have particularly affected companies in the healthcare and managed care markets resulting in changes in the market price of the stock of many companies, which may not have been directly related to the operating performance of those companies.
Due to the foregoing factors and the other risks discussed in this report, investors should not rely on period-to-period comparisons of our results of operations as an indication of our future performance.
Natural and other disasters may adversely affect our business.
We may be vulnerable to damage from severe weather conditions or natural disasters, including hurricanes, fires, floods, earthquakes, power loss, communications failures, and similar events, including the effects of pandemics, war or acts of terrorism. If a disaster were to occur, our ability to operate our business could be seriously or completely impaired or destroyed. The insurance we maintain may not be adequate to cover our losses resulting from disasters or other business interruptions.
The rapid and widespread transmission of COVID-19 coronavirus beginning in late 2019 impacts us in significant ways. To mitigate the spread of the COVID-19 disease, we implemented travel restrictions and remote working arrangements for most of our employees in order to minimize physical contact. These measures might not fully mitigate COVID-19 risks to our workforce and we could experience unusual levels of absenteeism that might impair operations. The pandemic reduces demand for some products due to delays or cancellations of elective medical procedures, consumer self-isolation, widespread unemployment and business closures, among other reasons. The ongoing impacts of the pandemic might cause a prolonged general economic slowdown or recession in one or more markets, disruptions and volatility in global capital markets and other broad and adverse effects on the economy, business conditions, commercial activity and the healthcare industry. The pandemic might impact our business operation, financial position and results of operation in unpredictable ways that depend on highly-uncertain future developments, such as determining the effectiveness of current or future government actions to address the public health or economic impacts of the pandemic. Any of these risks might have a materially adverse effect on our business operations and our financial position or results of operations.
If we fail to grow our business internally or through strategic acquisitions we may be unable to execute our business plan, maintain high levels of service, or adequately address competitive challenges.
Our strategy is to continue internal growth and, as strategic opportunities arise in the workers’ compensation managed care industry, to consider acquisitions of, or relationships with, other companies in related lines of business. As a result, we are subject to certain growth-related risks, including the risk that we will be unable to retain personnel or acquire other resources necessary to service such growth adequately. Expenses arising from our efforts to increase our market penetration may have a negative impact on operating results. In addition, there can be no assurance that any suitable opportunities for strategic acquisitions or relationships will arise or, if they do arise, that the transactions contemplated could be completed. If such a transaction does occur, there can be no assurance that we will be able to integrate effectively any acquired business. In addition, any such transaction would be subject to various risks associated with the acquisition of businesses, including, but not limited to, the following:
an acquisition may (i) negatively impact our results of operations because it may require incurring large one-time charges, substantial debt or liabilities; (ii) require the amortization or write down of amounts related to deferred compensation, goodwill and other intangible assets; or (iii) cause adverse tax consequences, substantial depreciation or deferred compensation charges;
we may encounter difficulties in assimilating and integrating the business, technologies, products, services, personnel, or operations of companies that are acquired, particularly if key personnel of the acquired company decide not to work for us;
an acquisition may disrupt ongoing business, divert resources, increase expenses, and distract management;
the acquired businesses, products, services, or technologies may not generate sufficient revenue to offset acquisition costs;
we may have to issue equity or debt securities to complete an acquisition, which would dilute the position of stockholders and could adversely affect the market price of our common stock; and
the acquisitions may involve the entry into a geographic or business market in which we have little or no prior experience.
There can be no assurance that we will be able to identify or consummate any future acquisitions or other strategic relationships on favorable terms, or at all, or that any future acquisition or other strategic relationship will not have an adverse impact on our business or results of operations. If suitable opportunities arise, we may finance such transactions, as well as internal growth, through debt or equity financing. There can be no assurance, however, that such debt or equity financing would be available to us on acceptable terms when, and if, suitable strategic opportunities arise.
If we are unable to increase our market share among national and regional insurance carriers and large, self-funded employers, our results may be adversely affected.
Our business strategy and future success depend in part on our ability to capture market share with our cost containment services as national and regional insurance carriers and large, self-funded employers look for ways to achieve cost savings. There can be no assurance that we will successfully market our services to these insurance carriers and employers or that they will not resort to other means to achieve cost savings. Additionally, our ability to capture additional market share may be adversely affected by the decision of potential customers to perform services internally instead of outsourcing the provision of such services to us. Furthermore, we may not be able to demonstrate sufficient cost savings to potential or current customers to induce them not to provide comparable services internally or to accelerate efforts to provide such services internally.
If competition increases, our growth and profits may decline.
The markets for our network services and patient management services are fragmented and competitive. Our competitors include national managed care providers, preferred provider networks, smaller independent providers, and insurance companies. Companies that offer one or more workers’ compensation managed care services on a national basis are our primary competitors. We also compete with many smaller vendors who generally provide unbundled services on a local level, particularly companies with an established relationship with a local insurance company adjuster. In addition, several large workers’ compensation insurance carriers offer managed care services for their customers, either by performance of the services in-house or by outsourcing to organizations like ours. If these carriers increase their performance of these services in-house, our business may be adversely affected. In addition, consolidation in the industry may result in carriers performing more of such services in-house.
A cybersecurity attack or other disruption to our information technology systems could result in the loss, theft, misuse, unauthorized disclosure, or unauthorized access of customer or sensitive company information or could disrupt our operations, which could damage our relationships with customers or employees, expose us to litigation or regulatory proceedings, or harm our reputation, any of which could materially adversely affect our business, financial condition or results of operations.
We rely on information technology to support our business activities. Our business involves the storage and transmission of a significant amount of personal, confidential, or sensitive information, including the personal information of our customers and employees, and our company’s financial, operational and strategic information. As with many businesses, we are subject to numerous data privacy and security risks, which may prevent us from maintaining the privacy of this information, result in the disruption of our business and online systems, and require us to expend significant resources attempting to secure and protect such information and respond to incidents, any of which could materially adversely affect our business, financial condition or results of operations. The loss, theft, misuse, unauthorized disclosure, or unauthorized access of such information could lead to significant reputational or competitive harm, result in litigation or regulatory proceedings, or cause us to incur substantial liabilities, fines, penalties or expenses.
Cybersecurity breaches of any of the systems on which we rely may result from circumvention of security systems, denial-of-service attacks or other cyber-attacks, hacking, “phishing” attacks, computer viruses, ransomware, malware, employee or insider error, malfeasance, social engineering, physical breaches or other actions. According to media reports, the frequency, intensity, and sophistication of cyber-attacks, ransomware attacks, and other data security incidents generally has significantly increased around the globe in recent years. As with many other businesses, we have experienced, and are continually at risk of being subject to, attacks and incidents, including cybersecurity breaches such as computer viruses, unauthorized parties gaining access to our information technology systems and similar incidents. Cybersecurity breaches could cause us, and in some cases, materially, to experience reputational harm, loss of customers, loss and/or delay of revenue, loss of proprietary data, loss of licenses, regulatory actions and scrutiny, sanctions or other statutory penalties, litigation, liability for failure to safeguard customers’ information, financial losses or a drop in our stock price. We have invested in and continue to expend significant resources on information technology and data security tools, measures, processes, initiatives, policies and employee training designed to protect our information technology systems, as well as the personal, confidential or sensitive information stored on or transmitted through those systems, and to ensure an effective response to any cyber-attack or data security incident. These expenditures could have an adverse impact on our financial condition and results of operations, and divert management’s attention from pursuing our strategic objectives. In addition, the cost and operational consequences of implementing, maintaining and enhancing further system protective measures could increase significantly as cybersecurity threats increase, and there can be no assurance that the security measures we employ will effectively prevent cybersecurity breaches or otherwise prevent unauthorized persons from obtaining access to our systems and information.
As these threats evolve, cybersecurity incidents could be more difficult to detect, defend against, and remediate. Cyber-attacks or data incidents could remain undetected for some period, which could potentially result in significant harm to our systems, as well as unauthorized access to the information stored on and transmitted by our systems. Further, despite our security efforts and training, our employees may purposefully or inadvertently cause security breaches that could harm our systems or result in the unauthorized disclosure of or access to information. Any measures we do take to prevent security breaches, whether caused by employees or third parties, could have the potential to harm relationships with our customers or restrict our ability to meet our customers' expectations.
If a cyber-attack or other data incident results in the loss, theft, misuse, unauthorized disclosure, or unauthorized access of personal, confidential, or sensitive information belonging to our customers or employees, it could put us at a competitive disadvantage, result in the deterioration of our customers’ confidence in our services, cause our customers to reconsider their relationship with our company or impose more onerous contractual provisions, cause us to lose our regulatory licenses, and subject us to potential litigation, liability, fines and penalties. For example, we could be subject to regulatory or other actions pursuant to privacy laws. This could result in costly investigations and litigation, civil or criminal penalties, operational changes and negative publicity that could adversely affect our reputation, as well as our results of operations and financial condition.
A cyber-attack or other data security incident could result in the significant and protracted disruption of our business such that:
critical business systems become inoperable or require a significant amount of time or cost to restore;
key personnel are unable to perform their duties or communicate with employees, customers or other third-parties;
it results in the loss, theft, misuse, unauthorized disclosure, or unauthorized access of customer or company information;
we are prevented from accessing information necessary to conduct our business;
we are required to make unanticipated investments in equipment, technology or security measures;
customers cannot access our websites and online systems; or
we become subject to other unanticipated liabilities, costs, or claims.
Any of the foregoing could have a material adverse effect on our business, financial condition and results of operations, and result in harm to our reputation. While we maintain insurance coverage that may, subject to policy terms and conditions, cover certain aspects of the losses and costs associated with cyber-attacks and data incidents, such insurance coverage may be insufficient to cover all losses and would not, in any event, remedy damage to our reputation. In addition, we may face difficulties in recovering any losses from our provider and any losses we recover may be lower than we initially expect.
The market price and trading volume of our common stock may be volatile, which could result in rapid and substantial losses for our stockholders.
The market price of our common stock may be highly volatile and could be subject to wide fluctuations. In addition, the trading volume in our common stock may fluctuate and cause significant price variations to occur. The stock market has in the past experienced price and volume fluctuations that have particularly affected companies in the healthcare and managed care markets resulting in changes in the market price of the stock of many companies, which may not have been directly related to the operating performance of those companies. We cannot assure youThere can be no assurance that the market price of our common stock will not fluctuate or decline significantly in the future.
We cannot assure our stockholders that our stock repurchase program will enhance long-term stockholder value and stock repurchases, if any, could increase the volatility of the price of our common stock and will diminish our cash reserves.
In 1996, our Board of Directors authorized a stock repurchase program and, since then, has periodically increased the number of shares authorized for repurchase under the repurchase program. The most recent increase occurred in November 2015February 2019 and brought the number of shares authorized for repurchase over the life of the program to 35,000,00037,000,000 shares. There is no expiration date for the repurchase program. The timing and actual number of shares repurchased, if any, depend on a variety of factors including the timing of open trading windows, price, corporate and regulatory requirements, and other market conditions. The program may be suspended or discontinued at any time without prior notice. Repurchases pursuant to our stock repurchase program could affect our stock price and increase its volatility. The existence of a stock repurchase program could also cause our stock price to be higher than it would be in the absence of such a program and could potentially reduce the market liquidity for our stock. Additionally, repurchases under our stock repurchase program will diminish our cash reserves, which could strain our liquidity, could impact our ability to pursue possible future strategic opportunities and acquisitions and could result in lower overall returns on our cash balances. There can be no assurance that any further stock repurchases will enhance stockholder value because the market price of our common stock may decline below the levels at which we repurchased shares of stock. Although our stock repurchase program is intended to enhance long-term stockholder value, short-term stock price fluctuations could reduce the program’s effectiveness.
If the referrals for our patient management services decline, our business, financial condition and results of operations would be materially adversely affected.
In some years, we have experienced a general decline in the revenue and operating performance of patient management services. We believe that the performance decline has been due to the following factors: the decrease of the number of workplace injuries that have become longer-term disability cases; increased regional and local competition from providers of managed care services; a possible reduction by insurers on the types of services provided by our patient management business; the closure of offices and continuing consolidation of our patient management operations; and employee turnover, including management personnel, in our patient management business. In the past, these factors have all contributed to the lowering of our long-term outlook for our patient management services. If some or all of these conditions continue, we believe that the performance ofrevenues from our patient management revenuesservices could decrease.
Declines in workers’ compensation claims may materially harm our results of operations.
Within the past few years, as the economylabor market has performed below historical averages which leads to fewer workers on a national levelbecome less labor intensive and could lead tomore service oriented, there are fewer work-related injuries. Additionally, employers are being more proactive to prevent injuries. If declines in workers’ compensation costs occur in many states and persist over the long-term, it would have a material adverse impact on our business, financial condition and results of operations.
We provide an outsource service to payors of workers’ compensation benefits, automobile insurance claims, and auto healthcaregroup health insurance benefits. These payors include insurance companies, TPAs, municipalities, state funds, and self-insured, self-administered employers. If these payors reduce the amount of work they outsource, our results of operations would be materially adversely affected.
The decline in economic activity caused by COVID-19 has already adversely affected, and in future periods, could materially adversely affect our business, results of operations and financial condition. Continued reductions in our customers’ exposure units (such as headcount, payroll, properties, the market values of their assets, and plant, equipment and other asset utilization levels, among other factors) will reduce the amount of claims administration services they need. In addition, with unprecedented levels of unemployment and business closures, the number of newly arising workers’ compensation and general liability claims, which directly impact our fee revenues in our risk management operation, have declined. The decline in economic activity due to COVID-19 has caused some of our customers to become financially less stable, and if this trend continues and customers enter bankruptcy, liquidate their operations or consolidate, our revenues and the collectability of our receivables will be adversely affected.
Healthcare providers are becoming increasingly resistant to the application of certain healthcare cost containment techniques; this may cause revenue from our cost containment operations to decrease.
Healthcare providers have become more active in their efforts to minimize the use of certain cost containment techniques and are engaging in litigation to avoid application of certain cost containment practices. Recent litigation between healthcare providers and insurers has challenged certain insurers’ claims adjudication and reimbursement decisions. Although these lawsuits do not directly involve us or any services we provide, theseThese cases may affect the use by insurers of certain cost containment services that we provide and may result in a decrease in revenue from our cost containment business.
Matters relating to the Tax Cuts and Jobs Act, including future changes in tax laws, rules and regulations, disagreements with taxing authorities and imposition of new taxes, could adversely affect our results of operations and financial condition
On December 22, 2017, the Tax Cuts and Jobs Act was enacted into law. Among numerous provisions included in the new law was the reduction of the corporate federal income tax rate from 35% to 21% effective January 1, 2018. We continue to analyze and assess the impact of the Tax Cuts and Jobs Act and believe that its impact on our business may not be fully known for some time. The final impact may differ, possibly materially, due to, among other things, changes in interpretations, assumptions made by us, the issuance of federal tax regulations and guidance, and actions we may take as a result of the Tax Cuts and Jobs Act. In the absence of guidance on various uncertainties and ambiguities in the application of certain provisions of the Tax Cuts and Jobs Act, we are using what we believe are reasonable interpretations and assumptions in applying the Tax Cuts and Jobs Act, but it is possible that the U.S. Department of Treasury could issue subsequent rules and regulations, or the Internal Revenue Service could issue subsequent guidance or take positions on audit, that differ from our prior interpretations and assumptions, which could have a material adverse effect on our cash, tax assets and liabilities, results of operations, and financial condition.
Our failure to compete successfully could make it difficult for us to add and retain customers and could reduce or impede the growth of our business.
We face competition from PPOs, TPAs, and other managed healthcare companies. We believe that as managed care techniques continue to gain acceptance in the workers’ compensation marketplace, our competitors will increasingly consist of nationally-focused workers’ compensation managed care service companies, insurance companies, HMOs and other significant providers of managed care products. Legislative reform in some states has been considered, but not enacted to permit employers to designate health plans such as HMOs and PPOs to cover workers’ compensation claimants. Because many health plans have the ability to manage medical costs for workers’ compensation claimants, such legislation may intensify competition in the markets served by us. Many of our current and potential competitors are significantly larger and have greater financial and marketing resources than we do, and there can be no assurance that we will continue to maintain our existing customers, maintain our past level of operating performance, or be successful with any new products or in any new geographical markets we may enter.
A breach of security may cause our customers to curtail or stop using our services.
We rely largely on our own security systems, confidentiality procedures, and employee nondisclosure agreements to maintain the privacy and security of our Company’s and our customers’ proprietary information. Accidental or willful security breaches or other unauthorized access by third parties to our information systems, the existence of computer viruses in our data or software, and misappropriation of our proprietary information could expose us to a risk of information loss, litigation, and other possible liabilities which may have a material adverse effect on our business, financial condition, and results of operations. If security measures are breached because of third-party action, employee error, malfeasance, or otherwise, or if design flaws in our software are exposed and exploited, and, as a result, a third party obtains unauthorized access to any customer data, our relationships with our customers and our reputation will be damaged, our business may suffer, and we could incur significant liability. Because techniques used to obtain unauthorized access or to sabotage systems change frequently and generally are not recognized until launched against a target, we may be unable to anticipate these techniques or to implement adequate preventative measures.
Exposure to possible litigation and legal liability may adversely affect our business, financial condition, and results of operations.
We, through our utilization management services, make recommendations concerning the appropriateness of providers’ medical treatment plans offor patients throughout the country, and as a result, could be exposed to claims for adverse medical consequences. We do not grant or deny claims for payment of benefits and we do not believe that we engage in the practice of medicine or the delivery of medical services. There can be no assurance, however, that we will not be subject to claims or litigation related to the authorization or denial of claims for payment of benefits or allegations that we engage in the practice of medicine or the delivery of medical services.
In addition, there can be no assurance that we will not be subject to other litigation that may adversely affect our business, financial condition or results of operations, including but not limited to being joined in litigation brought against our customers in the managed care industry. We maintain professional liability insurance and such other coverages as we believe are reasonable in light of our experience to date. If such insurance is insufficient or unavailable in the future at reasonable cost to protect us from liability, our business, financial condition, or results of operations could be adversely affected.
If lawsuits against us are successful, we may incur significant liabilities.
We provide to insurers and other payors of healthcare costs managed care programs that utilize preferred provider organizations and computerized bill review programs. Health careHealthcare providers have brought, against us and our customers, individual and class action lawsuits challenging such programs. If such lawsuits are successful, we may incur significant liabilities.
We make recommendations about the appropriateness of providers’ proposed medical treatment plans for patients throughout the country. As a result, we could be subject to claims arising from any adverse medical consequences. Although plaintiffs have not, to date, subjected us to any claims or litigation relating to the granting or denial of claims for payment of benefits or allegations that we engage in the practice of medicine or the delivery of medical services, we cannot assure you that plaintiffs will not make such claims in future litigation. We also cannot assure you that our insurance will provide sufficient coverage or that insurance companies will make insurance available at a reasonable cost to protect us from significant future liability.
If the utilization by healthcare payors of early intervention services continues to increase, the revenue from our later-stage network and healthcare management services could be negatively affected.
The performance of early intervention services, including injury occupational healthcare, first notice of loss, and telephonic case management services, often result in a decrease in the average length of, and the total costs associated with, a healthcare claim. By successfully intervening at an early stage in a claim, the need for additional cost containment services for that claim often can be reduced or even eliminated. As healthcare payors continue to increase their utilization of early intervention services, the revenue from our later stage network and healthcare management services will decrease.
An interruption in our ability to access critical data may cause customers to cancel their service and/or may reduce our ability to effectively compete.
Certain aspects of our business are dependent upon our ability to store, retrieve, process, and manage data and to maintain and upgrade our data processing capabilities. Interruption of data processing capabilities for any extended length of time, loss of stored data, programming errors or other system failures could cause customers to cancel their service and could have a material adverse effect on our business, financial condition, and results of operations.
In addition, we expect that a considerable amount of our future growth will depend on our ability to process and manage claims data more efficiently and to provide more meaningful healthcare information to customers and payors of healthcare. There can be no assurance that our current data processing capabilities will be adequate for our future growth, that we will be able to efficiently upgrade our systems to meet future demands, or that we will be able to develop, license or otherwise acquire software to address these market demands as well or as timely as our competitors.
We face competition for staffing, which may increase our labor costs and reduce profitability.
We compete with other healthcare providers in recruiting qualified management and staff personnel for the day-to-day operations of our business, including nurses and other case management professionals. In some markets, the scarcity of nurses and other medical support personnel has become a significant operating issue to healthcare providers. This shortage may require us to enhance wages to recruit and retain qualified nurses and
other healthcare professionals. Our failure to recruit and retain qualified management, nurses, and other healthcare professionals, or to control labor costs could have a material adverse effect on profitability.
The increased costs of professional and general liability insurance may have an adverse effect on our profitability.
The cost of commercial professional and general liability insurance coverage has risen significantly in the past several years, and this trend may continue. In addition, if we were to suffer a material loss, our costs may increase over and above the general increases in the industry. If the costs associated with insuring our business continue to increase, it may adversely affect our business. We believe our current level of insurance coverage is adequate for a company of our size engaged in our business. Additionally, we may have difficulty getting carriers to pay under coverage in certain circumstances.
Sustained increases in the cost of our employee benefits could materially reduce our profitability.
The cost of our current employees’ medical and other benefits substantially affects our profitability. In the past, we have occasionally experienced significant increases in these costs as a result of macro-economic factors beyond our control, including increases in healthcare costs. There can be no assurance that we will succeed in limiting future cost increases, and continued upward pressure in these costs could materially reduce our profitability.
Changes in government regulations could increase our costs of operations and/or reduce the demand for our services.
Many states, including a number of those in which we transact business, have licensing and other regulatory requirements applicable to our business. Approximately half of the states have enacted laws that require licensing of businesses which provide medical review services such as ours. Some of these laws apply to medical review of care covered by workers’ compensation. These laws typically establish minimum standards for qualifications of personnel, confidentiality, internal quality control, and dispute resolution procedures. These regulatory programs may result in increased costs of operation for us, which may have an adverse impact upon our ability to compete with other available alternatives for healthcare cost control. In addition, new laws regulating the operation of managed care provider networks have been adopted by a number of states. These laws may apply to managed care provider networks having contracts with us or to provider networks which we may organize. To the extent we are governed by these regulations, we may be subject to additional licensing requirements, financial and operational oversight and procedural standards for beneficiaries and providers.
Regulation in the healthcare and workers’ compensation fields is constantly evolving. We are unable to predict what additional government initiatives, if any, affecting our business may be promulgated in the future. Our business may be adversely affected by failure to comply with existing laws and regulations, failure to obtain necessary licenses and government approvals, or failure to adapt to new or modified regulatory requirements. Proposals for healthcare legislative reforms are regularly considered at the federal and state levels. To the extent that such proposals affect workers’ compensation, such proposals may adversely affect our business, financial condition, and results of operations.
In addition, changes in workers’ compensation, autoautomobile insurance, and managed health caregroup healthcare laws or regulations may reduce demand for our services, require us to develop new or modified services to meet the demands of the marketplace, or reduce the fees that we may charge for our services.
The introduction of software products incorporating new technologies and the emergence of new industry standards could render our existing software products less competitive, obsolete, or unmarketable.
There can be no assurance that we will be successful in developing and marketing new software products that respond to technological changes or evolving industry standards. If we are unable, for technological or other reasons, to develop and introduce new software products cost-effectively, in a timely manner and in response to changing market conditions or customer requirements, our business, results of operations, and financial condition may be adversely affected.
Developing or implementing new or updated software products and services may take longer and cost more than expected. We rely on a combination of internal development, strategic relationships, licensing and acquisitions to develop our software products and services. The cost of developing new healthcare information
services and technology solutions is inherently difficult to estimate. Our development and implementation of proposed software products and services may take longer than originally expected, require more testing than originally anticipated and require the acquisition of additional personnel and other resources. If we are unable to develop new or updated software products and services cost-effectively on a timely basis and implement them without significant disruptions to the existing systems and processes of our customers, we may lose potential sales and harm our relationships with current or potential customers.
The failure to attract and retain qualified or key personnel may prevent us from effectively developing, marketing, selling, integrating, and supporting our services.
We are dependent, to a substantial extent, upon the continuing efforts and abilities of certain key management personnel. In addition, we face competition for experienced employees with professional expertise in the workers’ compensation managed care area. The loss of key personnel, especially V. Gordon Clemons, Sr., our Chairman, President, and Michael Combs, our Chief Executive Officer and President, or the inability to attract qualified employees, could have a material unfavorableadverse effect on our business, financial condition, and results of operations.
If we lose several customers in a short period, our results may be materially adversely affected.
Our results may decline if we lose several customers during a short period. Most of our customer contracts permit either party to terminate without cause. If several customers terminate, or do not renew or extend their contracts with us, our results could be materially and adversely affected. Many organizations in the insurance industry have consolidated and this could result in the loss of one or more of our customers through a merger or acquisition. Additionally, we could lose customers due to competitive pricing pressures or other reasons.
We are subject to risks associated with acquisitions of intangible assets.
Our acquisition of other businesses may result in significant increases in our intangible assets and goodwill. We regularly evaluate whether events and circumstances have occurred indicating that any portion of our intangible assets and goodwill may not be recoverable. When factors indicate that intangible assets and goodwill should be evaluated for possible impairment, we may be required to reduce the carrying value of these assets. We cannot currently estimate the timing and amount of any such charges.
If we are unable to leverage our information systems to enhance our outcome-driven service model, our results may be adversely affected.
To leverage our knowledge of workplace injuries, treatment protocols, outcomes data, and complex regulatory provisions related to the workers’ compensation market, we must continue to implement and enhance information systems that can analyze our data related to the workers’ compensation industry. We frequently upgrade existing operating systems and are updating other information systems that we rely upon in providing our services and financial reporting. We have detailed implementation schedules for these projects that require extensive involvement from our operational, technological, and financial personnel. Delays or other problems we might encounter in implementing these projects could adversely affect our ability to deliver streamlined patient care and outcome reporting to our customers.
Our Internet-based services are dependent on the development and maintenance of the Internet infrastructure.
The Internet has experienced a variety of outages and other delays as a result of damages to portions of its infrastructure, and it could face outages and delays in the future. These outages and delays could reduce the level of Internet usage, as well as the availability of the Internet to us for delivery of our Internet-based services. In addition, our customers who use our Web-based services depend on Internet service providers, online service providers, and other website operators for access to our website. All of these providers have experienced
significant outages in the past and could experience outages, delays, and other difficulties in the future due to system failures unrelated to our systems. Any significant interruptions in our services or increases in response time could result in a loss of potential or existing users, and, if sustained or repeated, could reduce the attractiveness of our services.
We are sensitive to regional weather conditions that may adversely affect our operations.
Our operations are directly affected in the short term by the weather conditions in certain regions of operation. Therefore our business is sensitive to the weather conditions of these regions. Unusually inclement weather, including significant rain, snow, sleet, freezing rain, or ice can temporarily affect our operations if clientscustomers are forced to close operational centers. Accordingly, our operating results may vary from quarter to quarter, depending on the impact of these weather conditions.
Natural and other disasters may adversely affect our business.
We may be vulnerable to damage from severe weather conditions or natural disasters, including hurricanes, fires, floods, earthquakes, power loss, communications failures and similar events, including the effects of war or acts of terrorism. If a disaster were to occur, our ability to operate our business could be seriously or completely impaired or destroyed. The insurance we maintain may not be adequate to cover our losses resulting from disasters or other business interruptions.Item 1B. Unresolved Staff Comments.
None.
TheIn fiscal 2020, the Company’s principal executive office iswas located in Irvine, California in approximately 13,000 square feet of leased space. That lease expired in June 2020. Starting in June 2020, the Company’s new principal executive office is located in Irvine, California in approximately 16,000 square feet of leased space. The new lease expires in January 2020.2029. The Company leases approximately 8779 branch offices in 43 states, which range in size from 200 square feet up to 94,00059,000 square feet. The lease terms for the branch offices range from monthly to ten10 years and expire at various dates through 2023.2029. The Company owns a 32,000 square foot building located in Milwaukie, Oregon. The Company believes that its facilities are adequate for its current needs and that suitable additional space will be available as required.
The Company is involved in litigation arising in the normalordinary course of business. Management believes that resolution of these matters will not result in any payment that, in the aggregate, would be material to the financial position or results of the operations of the Company.
Item 4. Mine Safety Disclosures.
Not applicable.
PART IIItem 5. Market for Registrant’s Common Equity, Related Stockholder Matters and Issuer Purchases of Equity Securities.
Market Information
The Company’s common stock is traded on the NASDAQ Global Select Market under the symbol CRVL. The quarterly high and low per share sales prices for the Company’s common stock for fiscal years 2015 and 2016 as reported by NASDAQ are set forth below for the periods indicated. These prices represent prices among dealers, do not include retail markups, markdowns or commissions, and may not represent actual transactions.
| High | Low | |||||||
Fiscal Year Ended March 31, 2015: | ||||||||
Quarter Ended June 30, 2014: | $ | 52.63 | $ | 42.18 | ||||
Quarter Ended September 30, 2014: | 47.21 | 28.08 | ||||||
Quarter Ended December 31, 2014: | 38.34 | 31.47 | ||||||
Quarter Ended March 31, 2015: | 37.93 | 31.91 | ||||||
Fiscal Year Ended March 31, 2016: | ||||||||
Quarter Ended June 30, 2015: | $ | 39.29 | $ | 31.13 | ||||
Quarter Ended September 30, 2015: | 34.62 | 29.27 | ||||||
Quarter Ended December 31, 2015: | 46.20 | 30.61 | ||||||
Quarter Ended March 31, 2016: | 46.92 | 38.64 | ||||||
Holders. As of June 3, 2016,8, 2020, there were approximately 1,038886 holders of record of the Company’s common stock according to the information provided by the Company’s transfer agent.
Dividends. The Company has never paid any cash dividends on its common stock and has no current plans to do so in the foreseeable future. The Company intends to retain future earnings, if any, for use in the Company’s business.business and to execute its repurchase program. The payment of any future dividends on its common stock will be determined by the Board of Directors in light of conditions then existing, including the Company’s earnings, financial condition and requirements, restrictions in financing agreements, business conditions and other factors.
Unregistered Sales of Equity Securities.Securities. None.
Issuer Purchases of Equity Securities:Securities.The following table summarizes purchases of the Company’s common stock made by or on behalf of the Company foror any affiliated purchaser in the quarter ended March 31, 2016 pursuant to a publicly announced plan.2020.
| Period | Total Number of Shares Purchased | Average Price Paid Per Share | Total Number of Shares Purchased as Part of Publicly Announced Program | Maximum Number of Shares that may yet be Purchased Under the Program | ||||||||||||
January 1 to January 31, 2016 | 42,569 | $ | 43.42 | 42,569 | 1,182,409 | |||||||||||
February 1 to February 29, 2016 | 41,596 | 43.19 | 41,596 | 1,140,813 | ||||||||||||
March 1 to March 31, 2016 | 27,072 | 40.59 | 27,072 | 1,113,741 | ||||||||||||
|
|
|
|
|
|
|
| |||||||||
Total | 111,237 | $ | 42.65 | 111,237 | 1,113,741 | |||||||||||
|
|
|
|
|
|
|
| |||||||||
Period |
| Total Number of Shares Purchased |
|
| Average Price Paid Per Share |
|
| Total Number of Shares Purchased as Part of Publicly Announced Program |
|
| Maximum Number of Shares that may yet be Purchased Under the Program |
| ||||
January 1 to January 31, 2020 |
|
| 67,818 |
|
| $ | 92.85 |
|
|
| 67,818 |
|
|
| 880,041 |
|
February 1 to February 28, 2020 |
|
| 70,859 |
|
|
| 81.11 |
|
|
| 70,859 |
|
|
| 809,182 |
|
March 1 to March 31, 2020 |
|
| 94,773 |
|
|
| 63.79 |
|
|
| 94,773 |
|
|
| 714,409 |
|
Total |
|
| 233,450 |
|
| $ | 77.49 |
|
|
| 233,450 |
|
|
| 714,409 |
|
In 1996, the Company’s Board of Directors authorized a stock repurchase program initially for up to 100,000 shares of the Company’s common stock. The Company’s Board of Directors has periodically increased the number of shares of common stock authorized for repurchase under the program. In November 2015, theThe Company’s Board of Directors increased the number ofhas authorized up to 37,000,000 shares of common stock authorized to be repurchased over the life of the plan by 1,000,000 shares of common stock to 35,000,000 shares of common stock.program. As of March 31, 2016,2020, the Company has repurchased 33,886,25936,285,591 shares of its common stock over the life of the program. There is no expiration date for the plan.program. On March 21, 2020, the Company temporarily suspended its stock repurchase program in order to provide the Company maximum flexibility to focus on serving its customers as it navigates through the COVID-19 pandemic. The Company has lifted this temporary suspension and expects to resume its stock repurchase program in the June 2020 quarter.
The graph and the table depicted below showsshow a comparison of cumulative total stockholder returns for the Company, the NASDAQ and the NASDAQ HealthHealthcare Services Index over a five year period beginning on March 31, 2011. The data depicted on the graph are as set forth in the chart below the graph.2015. The graph assumes that $100 was invested in the Company’s Common Stock on March 31, 2011,2015, and in each index, and that all dividends were reinvested. No cash dividends have been paid or declared on the Common Stock. Stockholder returns over the indicated period should not be considered indicative of future stockholder returns.

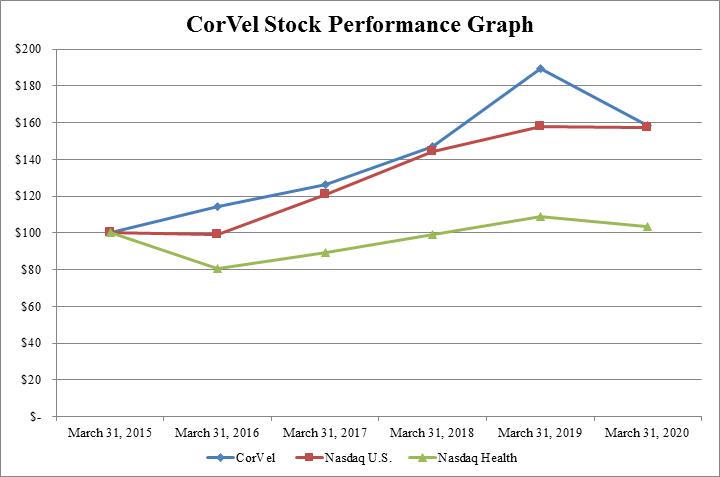
| 2011 | 2012 | 2013 | 2014 | 2015 | 2016 |
| 2015 |
|
| 2016 |
|
| 2017 |
|
| 2018 |
|
| 2019 |
|
| 2020 |
| |||||||||||||||||||||||||
CorVel Corporation | 100.00 | 75.01 | 93.06 | 187.14 | 129.41 | 148.25 |
|
| 100.00 |
|
|
| 114.56 |
|
|
| 126.42 |
|
|
| 146.90 |
|
|
| 189.60 |
|
|
| 158.41 |
| ||||||||||||||||||
U.S. NASDAQ | 100.00 | 111.16 | 117.49 | 150.98 | 176.22 | 175.11 |
|
| 100.00 |
|
|
| 99.37 |
|
|
| 120.63 |
|
|
| 144.13 |
|
|
| 157.71 |
|
|
| 157.12 |
| ||||||||||||||||||
U.S. NASDAQ Healthcare Services | 100.00 | 114.36 | 146.82 | 203.76 | 275.69 | 221.74 |
|
| 100.00 |
|
|
| 80.43 |
|
|
| 89.30 |
|
|
| 98.91 |
|
|
| 108.99 |
|
|
| 103.71 |
| ||||||||||||||||||
Notwithstanding anything to the contrary set forth in any of our previous filings made under the Securities Act of 1933, as amended, or the Securities Exchange Act of 1934, as amended, that might incorporate future filings made by us under those statutes, neither the preceding Stock Performance Graph, nor the information relating to it, is “soliciting material” or is “filed” or is to be incorporated by reference into any such prior filings, nor shall such graph or information be incorporated by reference into any future filings made by us under those statutes.
Item 6. Selected Financial Data.
The selected consolidated financial data of the Company appears in a separate section immediately following the signature pages of this Annual Report on Form 10-K immediately preceding the annual report, and is incorporated herein by this reference.
Item 7. Management’s Discussion and Analysis of Financial Condition and Results of Operations.
“Management’s Discussion and Analysis of Financial Condition and Results of OperationsOperations” appears in a separate section of this annual report immediately following the “Selected Financial Data” section, and is incorporated herein by this reference.
Management’s DiscussionItem 7A. Quantitative and AnalysisQualitative Disclosures About Market Risk.
Market risk represents the risk of Financial Conditionloss that may impact our financial position due to adverse changes in financial market prices and Resultsrates. Our market risk exposure is primarily the result of Operations appearsfluctuations in a separate section of this Annual Reportinterest rates. We do not hold or issue financial instruments for trading purposes.
Interest rate sensitivity
We did not have any outstanding borrowings on Form 10-K and is incorporated herein by this reference.
Asour revolving credit facility as of March 31, 2016, the Company held no market risk sensitive instruments for trading purposes2019, and the Company didour revolving credit facility expired in September 2019. Interest income from cash equivalents is not employ any derivativematerial. We have chosen not to renew our line of credit agreement with a financial instruments, other financial instruments, or derivative commodity instruments to hedge any market risk.institution.
Item 8. Financial Statements and Supplementary Data.
The Company’s consolidated financial statements, as listed under Item 15,15(a)(1), appear in a separate section of this Annual Report on Form 10-Kannual report, and are incorporated herein by this reference. The financial statement schedule is included below under Item 15(a)(2). The Company’s selected quarterly financial data appears in Note 16 to the Company’s consolidated financial statements in a separate section of this annual report, and is incorporated herein by this reference.
Item 9. Changes in and Disagreements with Accountants on Accounting and Financial Disclosure.
None.
Item 9A. Controls and Procedures.
Evaluation of Disclosure Controls and Procedures
Our management, under the supervision and with the participation of our Chief Executive Officer and Chief Financial Officer, has evaluated the effectiveness of our disclosure controls and procedures (as defined in Rules 13a-15(e) and 15d-15(e) under the Exchange Act). Based upon that evaluation, our Chief Executive Officer and Chief Financial Officer concluded that, as of March 31, 2016,2020, our disclosure controls and procedures were effective in ensuring that information required to be disclosed by us in the reports filed or submitted by us under the Exchange Act is (i) recorded, processed, summarized, and reported, within the time periods specified in the Commission’s rules and forms and (ii) accumulated and communicated to our management, including our principal executive and principal accounting officers, or persons performing similar functions, as appropriate to allow timely decisions regarding required disclosure.
Management’s Report on Internal Control over Financial Reporting
Our management is responsible for establishing and maintaining a system of internal control over financial reporting as defined in Rules 13a-15(f) and 15d-15(f) under the Exchange Act. Internal control over financial reporting is designed to provide reasonable assurance regarding the reliability of our financial reporting and preparation of financial statements for external purposes in accordance with accounting principles generally accepted in the United States of America. Internal control over financial reporting includes maintaining records that in reasonable detail accurately and fairly reflect our transactions; providing reasonable assurance that transactions are recorded as necessary for preparation of our financial statements in accordance with accounting principles generally accepted in the United States of America; providing reasonable assurance that our receipts and expenditures are made in accordance with authorizations of our management and directors; and providing reasonable assurance that unauthorized acquisition, use or disposition of our assets that could have a material effect on our financial statements would be prevented or detected on a timely basis.
Management conducted an assessment of the effectiveness of our internal control over financial reporting based on the framework set forth by the Committee of Sponsoring Organizations of the Treadway Commission (“COSO”) in the 2013Internal Control — Control—Integrated Framework (“2013 COSO framework”). Based on this assessment, our management concluded that our internal control over financial reporting was effective as of March 31, 20162020 to provide reasonable assurance regarding the reliability of financial reporting and preparation of financial statements for external reporting purposes in accordance with accounting principles generally accepted in the United States of America.
Our independent registered public accounting firm, Haskell & White LLP, has issued an audit report on the effectiveness of our internal control over financial reporting as of March 31, 20162020 as stated in their report that is included in Part II, Item 8 herein.
Changes to Internal Control over Financial Reporting
During the quarter ended March 31, 2016,2020, there were no changes in our internal control over financial reporting (as defined in Rules 13a-15(f) and 15d-15(f) under the Exchange Act) that have materially affected, or are reasonably likely to materially affect, our internal control over financial reporting.
None.
PART IIIItem 10. Directors, Executive Officers and Corporate Governance.
The information in the sections titled “Proposal One: Election of Directors,” “Corporate Governance, Board Composition and Board Committees,” “Executive Officers of CorVel,” and “Section 16(a) Beneficial Ownership Reporting Compliance”“Information About Our Executive Officers” appearing in the Company’s Definitive Proxy Statement for the 20162020 Annual Meeting of Stockholders is incorporated herein by reference.
The Board of Directors has adopted a code of ethics and business conduct that applies to all of the Company’s employees, officers and directors. The full text of the Company’s code of ethics and business conduct is posted on the Company’s web sitewebsite at www.corvel.com under the “Investor Relations” section.www.corvel.com. The Company intends to disclose future amendments to certain provisions of the Company’s code of ethics and business conduct, or waivers of such provisions, applicable to the Company’s directors and executive officers, at the same location on the Company’s web sitewebsite identified above. The inclusion of the Company’s web sitewebsite address in this annual report does not include or incorporate by reference the information on the Company’s web sitewebsite into this annual report.
Item 11. Executive Compensation.
The information in the sections titled “Executive Compensation,” “Compensation Discussion and Analysis,” “Compensation Committee Interlocks and Insider Participation,” “Compensation Committee Report,” and “Compensation of Directors,” appearing in the Company’s Definitive Proxy Statement for the 20162020 Annual Meeting of Stockholders is incorporated herein by reference.
Item 12. Security Ownership of Certain Beneficial Owners and Management and Related Stockholder Matters.
The information in the sections titled “Security Ownership of Certain Beneficial Owners and Management and Related Stockholder Matter”Matters” and “Equity Compensation Plan Information” appearing in the Company’s Definitive Proxy Statement for the 20162020 Annual Meeting of Stockholders is incorporated herein by reference.
Item 13. Certain Relationships and Related Party Transactions, and Director Independence.
The information in the sections titled “Certain Relationships and Related Person Transactions,” “Proposal One: Election of Directors,” and “Corporate Governance, Board Composition and Board Committees” appearing in the Company’s Definitive Proxy Statement for the 20162020 Annual Meeting of Stockholders is incorporated herein by reference.
Item 14. Principal Accountant Fees and Services.
The information under the captions “Principal Accountant Fees and Services”, “Audit Committee Pre-Approval of Audit and Permissible Non-Audit Services of Independent Auditors”Registered Public Accounting Firm” and “Ratification of Appointment of Independent Auditors”Registered Public Accounting Firm” appearing in the Company’s Definitive Proxy Statement for the 20162020 Annual Meeting of Stockholders is incorporated herein by reference.
PART IVItem 15. Exhibit and Financial Statement Schedules.
(a)(1) Financial Statements:
The Company’s financial statements appear in a separate section of this Annual Report on Form 10-Kannual report, beginning on the pages referenced below:
(a)(2) Financial Statement Schedule:
The Company’s consolidated financial statements, as listed under Item 15(a)(1), appear in a separate section of this Annual Report on Form 10-K.annual report and are incorporated herein by this reference. The Company’s financial statement schedule is as follows:
Schedule II — Valuation and Qualifying Accounts
| Balance at Beginning of Year | Additions Charged to Cost and Expenses | Deductions | Balance at End of Year | |||||||||||||
Allowance for doubtful accounts: | ||||||||||||||||
Fiscal Year Ended March 31, 2016: | $ | 1,645,000 | $ | 1,357,000 | $ | (1,181,000 | ) | $ | 1,821,000 | |||||||
Fiscal Year Ended March 31, 2015: | 1,745,000 | 1,730,000 | (1,830,000 | ) | 1,645,000 | |||||||||||
Fiscal Year Ended March 31, 2014: | 2,295,000 | 1,332,000 | (1,882,000 | ) | 1,745,000 | |||||||||||
|
| Balance at Beginning of Year |
|
| Additions Charged to Cost and Expenses |
|
| Deductions |
|
| Balance at End of Year |
| ||||
Allowance for doubtful accounts: |
|
|
|
|
|
|
|
|
|
|
|
|
|
|
|
|
Fiscal Year Ended March 31, 2020: |
| $ | 5,508,000 |
|
| $ | 1,606,000 |
|
| $ | (1,981,000 | ) |
| $ | 5,133,000 |
|
Fiscal Year Ended March 31, 2019: |
|
| 4,551,000 |
|
|
| 1,875,000 |
|
|
| (918,000 | ) |
|
| 5,508,000 |
|
Fiscal Year Ended March 31, 2018: |
|
| 3,001,000 |
|
|
| 2,559,000 |
|
|
| (1,009,000 | ) |
|
| 4,551,000 |
|
EXHIBITS
Exhibit No. | Title | Method of Filing | ||
3.1 | Amended and Restated Certificate of Incorporation of the Company | Incorporated herein by reference to Exhibit 3.1 to the Company’s Current Report on Form 8-K filed on August 10, 2011. | ||
3.2 | Incorporated herein by reference to Exhibit 3.2 to the Company’s Quarterly Report on Form 10-Q for the quarterly period ended June 30, 2006 filed on August 14, 2006. | |||
3.3 | Incorporated herein by reference to Exhibit 3.1 to the Company’s Current Report on Form 8-K filed on November 24, 2008. | |||
4.1 | Incorporated herein by reference to Exhibit 4.1 to the Company’s Current Report on Form 8-K filed on November 24, 2008. | |||
4.2 | Filed herewith. | |||
10.1* | ||||
Restated Omnibus Incentive Plan (Formerly The Restated 1988 Executive Stock Option Plan) | Incorporated herein by reference to Exhibit | |||
|
|
| ||
10.2* | ||||
Incorporated herein by reference to Exhibit 10.2 to the Company’s Current Report on Form 8-K filed on August 8, 2018, Exhibit 10.2 to the Company’s Quarterly Report onForm 10-Q for the quarterly period ended September 30, 2006 filed on November 9, 2006, Exhibits 10.7, 10.8 and 10.9 to the Company’s Annual Report on Form 10-K for the fiscal year ended March 31, 1994 filed on June 29, 1994, Exhibits 99.2, 99.3, 99.4, 99.5, 99.6, 99.7 and 99.8 to the Company’s Registration Statement on Form S-8 (File No. 333-94440) filed on July 10, 1995, and Exhibits 99.3 and 99.5 to the Company’s Registration Statement on Form S-8 (File No. 333-58455) filed on July 2, 1998. | ||||
10.3* | ||||
Incorporated herein by reference to Exhibit 10.4 to the Company’s Quarterly Report onForm 10-Q for the quarterly period ended September 30, 2015 filed on November 5, 2015. | ||||
10.4 | Fidelity Master Plan for Savings and Investment, and amendments (P) Paper filing | Incorporated herein by reference to Exhibits 10.16 and 10.16A to the Company’s Registration Statement on Form S-1 Registration No.33-40629 initially filed on May 16, 1991. | ||
Exhibit No. | Title | Method of Filing | ||
10.5 | Incorporated herein by reference to Exhibit 4.1 to the Company’s | |||
|
|
| ||
|
|
| ||
| Stock option agreement dated November 10, 2015, between the Company and Richard J. Schweppe, providing performance vesting. | Incorporated herein by reference to Exhibit | |||
|
|
| ||
10.7* | ||||
Incorporated herein by reference to Exhibit | ||||
10.8* | Incorporated herein by reference to Exhibit 10.39 to the Company’s Annual Report on Form 10-K for the fiscal year ended March 31, 2019 filed on June 7, 2019. | |||
10.9*† | Refiled herewith. | |||
10.10*† | Refiled herewith. | |||
10.11*† | Refiled herewith. | |||
10.12*† | Refiled herewith. | |||
10.13*† | Refiled herewith. | |||
10.14*† | Refiled herewith. | |||
10.15*† | Refiled herewith. | |||
10.16*† | Refiled herewith. | |||
10.17*† | Refiled herewith. |
Exhibit No. | Title | Method of Filing | ||
10.18*† | Refiled herewith. | |||
10.19*† | Refiled herewith. | |||
10.20*† | Refiled herewith. | |||
10.21*† | Refiled herewith. | |||
10.22*† | Incorporated herein by reference to Exhibit 10.1 to the Company’s Current Report on Form 8-K/A filed on December 31, 2019. | |||
10.23*† | Incorporated herein by reference to Exhibit 10.2 to the Company’s Current Report on Form 8-K/A filed on December 31, 2019. | |||
10.24*† | Incorporated herein by reference to Exhibit 10.3 to the Company’s Current Report on Form | |||
10.25*† | Incorporated herein by reference to Exhibit 10.4 to the Company’s Current Report on Form 8-K/A filed on December 31, 2019. | |||
10.26*† | Incorporated herein by reference to Exhibit 10.5 to the Company’s Current Report on Form 8-K/A filed on December 31, 2019. | |||
10.27*† | Incorporated herein by reference to Exhibit 10.6 to the Company’s Current Report on Form 8-K/A filed on December 31, 2019. | |||
21.1 | Filed | |||
23.1 | Consent of Independent Registered Public Accounting Firm, Haskell & White LLP. | Filed herewith. | ||
31.1 | Filed herewith. | |||
31.2 | Filed herewith. | |||
32.1 | Furnished herewith. |
Exhibit No. | Title | Method of Filing | ||
32.2 | Furnished herewith. | |||
101.0 | The following materials from CorVel | Furnished herewith. |
* - Denotes management contract or compensatory plan or arrangement. |
† - Certain confidential information contained in this exhibit has been omitted by means of redacting a portion of the text and replacing it with empty brackets indicated by [ ], pursuant to Regulation S-K Item 601(b)(10)(iv) of the Securities Act of 1933, as amended. Certain confidential information has been excluded from the exhibit because it (i) is not material and (ii) would likely cause competitive harm to CorVel if publicly disclosed. An unredacted copy of the exhibit will be provided on a supplemental basis to the SEC upon request.
(P) – Previously filed only in paper.
(b) Exhibits
The exhibits filed as part of this annual report are listed under Item 15(a)-(3) of this Annual Report on Form 10-K.annual report.
(c) Financial Statement Schedule
The Financial Statement SchedulesSchedule required by Regulation S-X and Item 8 of Form 10-K areis listed under Item 15(a)(2) of this Annual Report onannual report.
None.
Pursuant to the requirements of Section 13 or 15 (d) of the Securities Exchange Act of 1934, as amended, the Registrantregistrant has duly caused this annual report to be signed on its behalf by the undersigned thereunto duly authorized.
Corvel Corporation | ||||
By: | / | |||
Michael G. Combs | ||||
Chief Executive Officer and President | ||||
Date: June 10, 20162020
Pursuant to the requirements of the Securities Exchange Act of 1934, as amended, this annual report has been signed below by the following persons on behalf of the Registrantregistrant and in the capacities and on the dates indicated.
Signature | Title | Date | ||
/
| Chairman of the Board | June 10, 2020 | ||
V. Gordon Clemons | ||||
/s/ Michael G. Combs | Chief Executive Officer and President | June 10, 2020 | ||
Michael G. Combs | (Principal Executive Officer) | |||
/
| Chief Financial Officer | June 10, | ||
Brandon T. O’Brien | (Principal Financial Officer) | |||
/ | Vice President, Accounting | June 10, 2020 | ||
Jennifer L. Yoss | (Principal Accounting Officer) | |||
/s/ A | Director | June 10, 2020 | ||
Alan R. Hoops | ||||
/ | Director | June 10, 2020 | ||
Steven J. Hamerslag | ||||
/ | Director | June 10, 2020 | ||
R. Judd Jessup | ||||
/ | Director | June 10, 2020 | ||
Jean H. Macino | ||||
/ | Director | June 10, 2020 | ||
Jeffrey J. Michael | ||||
SELECTED CONSOLIDATED FINANCIAL DATA
The following selected consolidated financial data for each of the five fiscal years ended March 31, 2016,2020 have been derived from the Company’s audited consolidated financial statements. The following data should be read in conjunction with the Company’s Consolidated Financial Statements,consolidated financial statements, the related notes thereto, and Part II, Item 7 of this annual report, “Management’s Discussion and Analysis of Financial Condition and Results of Operations.”Operations”. The following amounts are in thousands, except per share data.data and percentages.
| Fiscal Year Ended March 31, |
| Fiscal Year Ended March 31, |
| |||||||||||||||||||||||||||||||||||||
| 2012 | 2013 | 2014 | 2015 | 2016 |
| 2020 |
|
| 2019 |
|
| 2018 |
|
| 2017 |
|
| 2016 |
| |||||||||||||||||||||
Income Statement Data: |
|
|
|
|
|
|
|
|
|
|
|
|
|
|
|
|
|
|
|
| ||||||||||||||||||||
Revenues | $ | 412,668 | $ | 429,310 | $ | 478,816 | $ | 492,625 | $ | 503,584 |
| $ | 592,225 |
|
| $ | 595,740 |
|
| $ | 558,350 |
|
| $ | 518,686 |
|
| $ | 503,584 |
| ||||||||||
Cost of revenues | 318,826 | 337,650 | 370,335 | 392,656 | 399,040 |
|
| 466,304 |
|
|
| 470,931 |
|
|
| 451,097 |
|
|
| 413,894 |
|
|
| 399,040 |
| |||||||||||||||
|
|
|
|
| ||||||||||||||||||||||||||||||||||||
Gross profit | 93,842 | 91,660 | 108,481 | 99,969 | 104,544 |
|
| 125,921 |
|
|
| 124,809 |
|
|
| 107,253 |
|
|
| 104,792 |
|
|
| 104,544 |
| |||||||||||||||
General and administrative | 50,405 | 47,765 | 51,974 | 54,405 | 58,484 |
|
| 65,210 |
|
|
| 63,296 |
|
|
| 59,350 |
|
|
| 57,243 |
|
|
| 58,484 |
| |||||||||||||||
|
|
|
|
| ||||||||||||||||||||||||||||||||||||
Income before income taxes | 43,437 | 43,895 | 56,507 | 45,564 | 46,060 |
|
| 60,711 |
|
|
| 61,513 |
|
|
| 47,903 |
|
|
| 47,549 |
|
|
| 46,060 |
| |||||||||||||||
Income tax provision | 16,885 | 17,165 | 22,115 | 16,974 | 17,535 |
|
| 13,334 |
|
|
| 14,810 |
|
|
| 12,208 |
|
|
| 18,070 |
|
|
| 17,535 |
| |||||||||||||||
|
|
|
|
| ||||||||||||||||||||||||||||||||||||
Net income | $ | 26,552 | $ | 26,730 | $ | 34,392 | $ | 28,590 | $ | 28,525 |
| $ | 47,377 |
|
| $ | 46,703 |
|
| $ | 35,695 |
|
| $ | 29,479 |
|
| $ | 28,525 |
| ||||||||||
|
|
|
|
| ||||||||||||||||||||||||||||||||||||
Net income per share: |
|
|
|
|
|
|
|
|
|
|
|
|
|
|
|
|
|
|
|
| ||||||||||||||||||||
Basic | $ | 1.16 | $ | 1.20 | $ | 1.63 | $ | 1.38 | $ | 1.44 |
| $ | 2.59 |
|
| $ | 2.48 |
|
| $ | 1.90 |
|
| $ | 1.52 |
|
| $ | 1.44 |
| ||||||||||
|
|
|
|
| ||||||||||||||||||||||||||||||||||||
Diluted | $ | 1.14 | $ | 1.19 | $ | 1.61 | $ | 1.37 | $ | 1.43 |
| $ | 2.55 |
|
| $ | 2.46 |
|
| $ | 1.87 |
|
| $ | 1.51 |
|
| $ | 1.43 |
| ||||||||||
|
|
|
|
| ||||||||||||||||||||||||||||||||||||
Shares used in computing net income per share: | ||||||||||||||||||||||||||||||||||||||||
Weighted average shares used in computing net income per share: |
|
|
|
|
|
|
|
|
|
|
|
|
|
|
|
|
|
|
|
| ||||||||||||||||||||
Basic | 22,952 | 22,256 | 21,104 | 20,669 | 19,826 |
|
| 18,326 |
|
|
| 18,794 |
|
|
| 18,825 |
|
|
| 19,418 |
|
|
| 19,826 |
| |||||||||||||||
Diluted | 23,254 | 22,458 | 21,372 | 20,890 | 20,004 |
|
| 18,602 |
|
|
| 19,008 |
|
|
| 19,042 |
|
|
| 19,570 |
|
|
| 20,004 |
| |||||||||||||||
Return on beginning of year equity | 26.6 | % | 24.2 | % | 30.9 | % | 22.6 | % | 22.3 | % |
|
| 24.3 | % |
|
| 27.3 | % |
|
| 25.7 | % |
|
| 22.3 | % |
|
| 22.3 | % | ||||||||||
Return on beginning of year assets | 16.2 | % | 15.6 | % | 18.9 | % | 13.3 | % | 13.5 | % |
|
| 14.9 | % |
|
| 17.0 | % |
|
| 15.2 | % |
|
| 13.4 | % |
|
| 13.5 | % | ||||||||||
| 2012 | 2013 | 2014 | 2015 | 2016 | ||||||||||||||||||||||||||||||||||||
Balance Sheet Data as of March 31, | ||||||||||||||||||||||||||||||||||||||||
Cash and cash equivalents | $ | 6,597 | $ | 19,822 | $ | 34,866 | $ | 25,516 | $ | 32,779 | ||||||||||||||||||||||||||||||
Accounts receivable, net | 49,334 | 49,105 | 57,229 | 57,537 | 59,747 | |||||||||||||||||||||||||||||||||||
Working capital | 36,485 | 40,145 | 49,120 | 37,959 | 42,693 | |||||||||||||||||||||||||||||||||||
Total assets | 171,882 | 182,382 | 214,481 | 211,573 | 220,269 | |||||||||||||||||||||||||||||||||||
Retained earnings | 275,046 | 301,776 | 336,168 | 364,758 | 393,283 | |||||||||||||||||||||||||||||||||||
Treasury stock | (270,574 | ) | (301,301 | ) | (328,480 | ) | (360,278 | ) | (391,803 | ) | ||||||||||||||||||||||||||||||
Total stockholders’ equity | 110,382 | 111,402 | 126,522 | 127,923 | 131,948 | |||||||||||||||||||||||||||||||||||
|
| 2020 |
|
| 2019 |
|
| 2018 |
|
| 2017 |
|
| 2016 |
| |||||
Balance Sheet Data as of March 31, |
|
|
|
|
|
|
|
|
|
|
|
|
|
|
|
|
|
|
|
|
Cash and cash equivalents |
| $ | 83,223 |
|
| $ | 91,713 |
|
| $ | 55,771 |
|
| $ | 28,611 |
|
| $ | 32,779 |
|
Accounts receivable, net |
|
| 65,767 |
|
|
| 71,336 |
|
|
| 64,940 |
|
|
| 62,841 |
|
|
| 59,747 |
|
Working capital |
|
| 75,302 |
|
|
| 98,574 |
|
|
| 65,328 |
|
|
| 38,816 |
|
|
| 42,693 |
|
Total assets |
|
| 416,260 |
|
|
| 318,018 |
|
|
| 274,004 |
|
|
| 235,383 |
|
|
| 220,269 |
|
Retained earnings |
|
| 552,537 |
|
|
| 505,160 |
|
|
| 458,457 |
|
|
| 422,762 |
|
|
| 393,283 |
|
Treasury stock |
|
| (531,764 | ) |
|
| (466,156 | ) |
|
| (430,989 | ) |
|
| (419,802 | ) |
|
| (391,803 | ) |
Total stockholders’ equity |
|
| 189,711 |
|
|
| 194,805 |
|
|
| 171,176 |
|
|
| 138,646 |
|
|
| 131,948 |
|
MANAGEMENT’S DISCUSSION AND ANALYSIS OF
FINANCIAL CONDITION AND RESULTS OF OPERATIONS
This Management’s Discussion and Analysis of Financial Condition and Results of Operations may include certain forward-looking statements, within the meaning of Section 27A of the Securities Act of 1933, as amended, and Section 21E of the Securities Exchange Act of 1934, as amended, including (without limitation) statements with respect to anticipated future operating and financial performance, including the impact of COVID-19, growth and acquisition opportunities and other similar forecasts and statements of expectation. Words such as “expects,” “anticipates,” “intends,” “plans,” “predicts,” “believes,” “seeks,” “estimates,” “potential,” “continue,” “strive,” “ongoing,” “may,” “will,” “would,” “could,” and “should”“should,” and variations of these words and similar expressions, are intended to identify these forward-looking statements. Forward-looking statements made by the Company and its management are based on estimates, projections, beliefs and assumptions of management at the time of such statements and are not guarantees of future performance.
The Company disclaims any obligations to update or revise any forward-looking statement based on the occurrence of future events, the receipt of new information or otherwise. Actual future performance, outcomes, and results may differ materially from those expressed in forward-looking statements made by the Company and its management as a result of a number of risks, uncertainties and assumptions. Representative examples of these factors include (without limitation) the impact of global pandemics, such as COVID-19; the impact of possible cybersecurity incidents; changes in interpretations or applications of the Tax Cuts and Jobs Act through regulations and guidance that may be issued by the U.S. Department of Treasury; general industry and economic conditions, including a decreasing number of national claims due to a decreasing number of injured workers; cost of capital and capital requirements; existing and possible litigation and legal liability in the course of operations and the Company’s ability to resolve such litigation; cost of capital and capital requirements; competition from other managed care companies; the ability to expand certain areas of the Company’s business; shifts in customer demands; the ability of the Company to produce market-competitive software; changes in operating expenses including employee wages, benefits, and medical inflation; governmental and public policy changes, including but not limited to legislative and administrative law and rule implementation or change; dependence on key personnel; the continued availability of financing in the amounts and at the terms necessary to support the Company’s future business; the impact of recently issued accounting standards on the Company’s consolidated financial statements; growth in the Company’s sale of TPA services and the other risks identified under the headingin Part I, Item 1A of this annual report, “Risk Factors” appearing elsewhere in the report..
Overview
CorVel Corporation is an independent nationwide provider of medical cost containment and managed care services designed to address the escalating medical costs of workers’ compensation benefits, automobile insurance claims, and auto claims.group health insurance benefits. The Company’s services are provided to insurance companies, third-party administrators (“TPA’s”),TPAs, governmental entities, and self-administered employers to assist them in managing the medical costs and monitoring the quality of care associated with healthcare claims.
Network Solutions Services
The Company’s network solutions services are designed to reduce the price paid by its customers for medical services rendered in workers’ compensation cases, autoautomobile insurance policies, and to a lesser extent, group health insurance policies. The network solutions services offered by the Company include automated medical fee auditing, preferred provider management and reimbursement services, retrospective utilization review, facility claim review, professional review, pharmacy services, directed care services, Medicare solutions, clearinghouse services, independent medical examinations, and inpatient medical bill review. Network solutions services also includes revenue from the Company’s directed care network (CareIQ)(known as CareIQ), including imaging, physical therapy, durable medical equipment, and physical therapy.translation and transportation.
Patient Management Services
In addition to its network solutions services, the Company offers a range of patient management services, which involve working on a one-on-one basis with injured employees and their various healthcare professionals, employers and insurance company adjusters. Patient management services include claims management and all services sold to claims management customers, case management, 24/7 nurse triage, utilization management, vocational rehabilitation, and life care planning. The services are designed to monitor the medical necessity and appropriateness of healthcare services provided to workers’ compensation and other healthcare claimants and to
expedite return to work. The Company offers these services on a stand-alone basis, or as an integrated component of its medical cost containment services. Patient management services include the processing of claims for self-insured payors with respect to property and casualty insurance.
The Company’s management is structured geographically with regional vice-presidentsvice presidents who report to the Chief Executive Officer of the Company. Each of these regional vice-presidents isare responsible for all services provided by the Company in his or her particular region and responsible for the operating results of the Company in multiple states. These regional vice presidents have area and district managers who are also responsible for all services provided by the Company in their given area and district.
Business Enterprise Segments
The Company operates in one reportable operating segment, managed care. The Company’s services are delivered to its customers through its local offices in each region and financial information for the Company’s operations follows this service delivery model. All regions provide the Company’s patient management and network solutions services. FASB ASCservices to customers. Financial Accounting Standards Board (“FASB”) Accounting Standard Codification (“ASC”) 280-10,Segment Reporting “Segment Reporting”, establishes standards for the way that public business enterprises report information about operating segments in annual and interim consolidated financial statements. The Company’s internal financial reporting is segmented geographically, as discussed above, and managed on a geographic rather than service line basis, with virtually all of the Company’s operating revenue generated within the United States.
Under FASB ASC 280-10, two or more operating segments may be aggregated into a single operating segment for financial reporting purposes if aggregation is consistent with the objective and basic principles, if the segments have similar economic characteristics, and if the segments are similar in each of the following areas: 1)(i) the nature of products and services; 2)(ii) the nature of the production processes; 3)(iii) the type or class of customer for their products and services; and 4)(iv) the methods used to distribute their products or provide their services. The Company believes each of its regions meet these criteria as each provides similar services and products to similar customers using similar methods of productionsproduction and similar methods to distribute the services and products.distribution.
Because we believe we meet each of the criteria set forth above and each of our regions have similar economic characteristics, we aggregate our results of operations in one reportable operating segment, managed care.
SeasonalityNumber of Working Days
While we are not directly impacted by seasonal shifts, weWe are affected by the change in working days in a given quarter. There are generally fewer working days for our employees to generate revenue in the third fiscal quarter as we experiencedue to employee vacations, inclement weather and holidays.
Summary of Fiscal 20162020 Annual Results
The Company had record revenues of $504$592 million for the fiscal year ended March 31, 2016, an increase2020, a decrease of $11$4 million, or 2.2%1%, compared to $493$596 million for the fiscal year ended March 31, 2015. The increase2019. This decrease was primarily due to growtha 9.7% decrease in the TPA services and network solutions, offsetdriven by a decrease in CERiS andpharmacy bills. This was partially offset by a nominal decrease5.1% increase in case management.patient management services, driven by an increase in TPA services.
During fiscal 2016,2020, the Company’s gross profit increased to $104.5$126 million from $100.0$125 million in fiscal 2015,2019, an increase of $4.6$1 million, or 4.6%1%. ThisThe increase in gross profit was primarily due to cost of revenues increasing at a lower rate than revenues, partially due to a decreasean increase in headcount.margins in higher margin enhanced bill review program services.
During fiscal 2016,2020, the Company’s general and administrative expenses increased to $58.5$65.2 million from $54.4$63.3 million in fiscal 2015,2019, an increase of $4.1$1.9 million, or 7.5%3.0%. TheThis increase was primarily due to an increase in legal and ITmarketing costs.
During fiscal 2020, the Company’s net income before tax decreased to $60.7 million from $61.5 million in fiscal 2019, a decrease of $0.8 million, or 1.3%. The decrease was primarily due to a decrease in revenues, as well as an increase in general and administrative expenses.
During fiscal 2016,2020, the Company’s operating income increasedtax expense decreased to $46.1$13.3 million from $45.6$14.8 million in fiscal 2015, an increase2019, a decrease of $0.5$1.5 million, or 1.1%10.0%. This increaseThe Company’s effective income tax rate was primarily due to the aforementioned increase in revenues22% for fiscal year 2020 and gross profit.24% for fiscal year 2019.
Income tax expense increased by $0.6 million, or 3.3%, from $17.0 million in fiscal 2015 to $17.5 million in fiscal 2016. This increase was primarily due to increase in pre-tax income.
Weighted dilutedDiluted weighted average shares decreased from 20.9were 18.6 million shares in fiscal 2015 to 20.02020 and 19.0 million shares in fiscal 2016,2019, with a decrease of 886,000406,000 shares, or 4.2%2.1%. This decrease was primarily due to the repurchase of 893,771822,353 shares of common stock in fiscal 2016. In November 2015, the Company’s Board of Directors increased the number of shares authorized to be repurchased over the life of the plan to 35,000,000 shares.2020. Since commencing this program in the fall of 1996, the Company has repurchased 33,886,25936,285,591 shares of its common stock through March 31, 2016,2020, at a cost of $392 million.$532 million. These repurchases were funded primarily from the Company’s operating cash flows.
Diluted earnings per share increased from $1.37to $2.55 in fiscal 2015 to $1.432020 from $2.46 in fiscal 2016,2019, an increase of $0.06$0.09 per share, or 4.4%3.7%. The increase in diluted earnings per share was primarily due to an increase in net income and a decrease in diluted weighted average shares.
COVID-19 Pandemic
The economies of the United States and other countries around the world have rapidly contracted as a result of the COVID-19 pandemic. The decreased level of economic activity is leading to, and is likely to continue to lead to, a decline in exposure units and rising unemployment. While the full impact of the COVID-19 pandemic cannot be fully assessed at this time, the Company expects the ongoing global economic slowdown resulting from the COVID-19 pandemic could have a material adverse effect on its business, results of operations, financial condition, and cash flows in one or more future quarters. As a result of the economic contraction from the COVID-19 pandemic, cases received in future quarters could be materially below the March 2020 quarter levels. Additionally, the Company had an 8% reduction in work force that began in the number of shares outstanding of 4.2% due to shares repurchases.March quarter and continued through the June quarter.
Results of Operations
The Company derives its revenues from providing patient management and network solutions services to payors of workers’ compensation benefits, autoautomobile insurance claims, and group health insurance benefits. Patient management services include claims management and all services sold to claims management customers, case management, 24/7 nurse triage, utilization review, medical case management, vocational rehabilitation, and claims processing.life care planning. Network solutions revenuesservices include fee schedule auditing, hospital bill auditing, independent medical examinations, directed care services, diagnostic imaging review services and preferred provider referral services. The percentages of total revenues attributable to patient management and network solutions services for the fiscal years ended March 31, 2014, 2015,2020, 2019 and 20162018 are listed below.
| 2014 | 2015 | 2016 |
| 2020 |
|
| 2019 |
|
| 2018 |
| |||||||||||||
Patient management services | 51.9 | % | 54.5 | % | 55.1 | % |
|
| 65.3 | % |
|
| 61.8 | % |
|
| 56.7 | % | ||||||
Network solutions services | 48.1 | % | 45.5 | % | 44.9 | % |
|
| 34.7 | % |
|
| 38.2 | % |
|
| 43.3 | % | ||||||
|
|
|
|
| 100.0 | % |
|
| 100.0 | % |
|
| 100.0 | % | ||||||||||
| 100.0 | % | 100.0 | % | 100.0 | % | |||||||||||||||||||
|
|
| ||||||||||||||||||||||
As noted in the table above, from fiscal 20142018 to fiscal 2016,2020, the mix of the Company’s revenues moved 3.28.6 percentage points from network solutions services to patient management.management services. This mix shift is primarily due to the Company’s increased focus in the sale of TPA and related services, which are included withwithin patient management services. The Company expects to have more growth in the sale of TPA and related services than in its other services because we areit is focusing more of ourits efforts, in this area and because we believebelieves the opportunities for growth in revenue and gross profits areis better, in this area.
The following table shows the consolidated statements of income statements for the past three fiscal years ended March 31, 2020, 2019 and 2018 and the dollar changes, as well as the percentage changes for each fiscal yearyear. The following amounts are in thousands, except for per share information.data and percentages.
| Fiscal 2014 | Fiscal 2015 | Fiscal 2016 | Amount Change from Fiscal 2014 to 2015 | Amount Change from Fiscal 2015 to 2016 | Percent Change from Fiscal 2014 to 2015 | Percent Change from Fiscal 2015 to 2016 | Fiscal 2020 |
|
| Fiscal 2019 |
|
| Fiscal 2018 |
|
| Amount Change from Fiscal 2019 to 2020 |
|
| Amount Change from Fiscal 2018 to 2019 |
|
| Percent Change from Fiscal 2019 to 2020 |
|
| Percent Change from Fiscal 2018 to 2019 |
| |||||||||||||||||||||||||||||
Revenues | $ | 478,816 | $ | 492,625 | $ | 503,584 | $ | 13,809 | $ | 10,959 | 2.9 | % | 2.2 | % | $ | 592,225 |
|
| $ | 595,740 |
|
| $ | 558,350 |
|
| $ | (3,515 | ) |
| $ | 37,390 |
|
|
| (0.6 | %) |
|
| 6.7 | % | ||||||||||||||
Cost of revenues | 370,335 | 392,656 | 399,040 | 22,321 | 6,384 | 6.0 | 1.6 |
| 466,304 |
|
|
| 470,931 |
|
|
| 451,097 |
|
|
| (4,627 | ) |
|
| 19,834 |
|
|
| (1.0 | ) |
|
| 4.4 |
| |||||||||||||||||||||
|
|
|
|
|
|
| |||||||||||||||||||||||||||||||||||||||||||||||||
Gross profit | 108,481 | 99,969 | 104,544 | (8,512 | ) | 4,575 | (7.8 | ) | 4.6 |
| 125,921 |
|
|
| 124,809 |
|
|
| 107,253 |
|
|
| 1,112 |
|
|
| 17,556 |
|
|
| 0.9 |
|
|
| 16.4 |
| |||||||||||||||||||
General and administrative | 51,974 | 54,405 | 58,484 | 2,431 | 4,079 | 4.7 | 7.5 |
| 65,210 |
|
|
| 63,296 |
|
|
| 59,350 |
|
|
| 1,914 |
|
|
| 3,946 |
|
|
| 3.0 |
|
|
| 6.6 |
| |||||||||||||||||||||
|
|
|
|
|
|
| |||||||||||||||||||||||||||||||||||||||||||||||||
Income before income taxes | 56,507 | 45,564 | 46,060 | (10,943 | ) | 496 | (19.4 | ) | 1.1 |
| 60,711 |
|
|
| 61,513 |
|
|
| 47,903 |
|
|
| (802 | ) |
|
| 13,610 |
|
|
| (1.3 | ) |
|
| 28.4 |
| |||||||||||||||||||
Income tax provision | 22,115 | 16,974 | 17,535 | (5,141 | ) | 561 | (23.2 | ) | 3.3 |
| 13,334 |
|
|
| 14,810 |
|
|
| 12,208 |
|
|
| (1,476 | ) |
|
| 2,602 |
|
|
| (10.0 | ) |
|
| 21.3 |
| |||||||||||||||||||
|
|
|
|
|
|
| |||||||||||||||||||||||||||||||||||||||||||||||||
Net income | $ | 34,392 | $ | 28,590 | $ | 28,525 | ($ | 5,802 | ) | ($ | 65 | ) | (16.9 | %) | (0.2 | %) | $ | 47,377 |
|
| $ | 46,703 |
|
| $ | 35,695 |
|
| $ | 674 |
|
| $ | 11,008 |
|
|
| 1.4 | % |
|
| 30.8 | % | ||||||||||||
|
|
|
|
|
|
| |||||||||||||||||||||||||||||||||||||||||||||||||
Net income per share: |
|
|
|
|
|
|
|
|
|
|
|
|
|
|
|
|
|
|
|
|
|
|
|
|
|
|
| ||||||||||||||||||||||||||||
Basic | $ | 1.63 | $ | 1.38 | $ | 1.44 | $ | (0.25 | ) | $ | 0.06 | (15.3 | %) | 4.3 | % | $ | 2.59 |
|
| $ | 2.48 |
|
| $ | 1.90 |
|
| $ | 0.11 |
|
| $ | 0.58 |
|
|
| 4.4 | % |
|
| 30.5 | % | |||||||||||||
Diluted | $ | 1.61 | $ | 1.37 | $ | 1.43 | $ | (0.24 | ) | $ | 0.06 | (14.9 | %) | 4.4 | % | $ | 2.55 |
|
| $ | 2.46 |
|
| $ | 1.87 |
|
| $ | 0.09 |
|
| $ | 0.59 |
|
|
| 3.7 | % |
|
| 31.6 | % | |||||||||||||
Shares used in net income per share: | |||||||||||||||||||||||||||||||||||||||||||||||||||||||
Weighted average shares used in net income per share: |
|
|
|
|
|
|
|
|
|
|
|
|
|
|
|
|
|
|
|
|
|
|
|
|
|
|
| ||||||||||||||||||||||||||||
Basic | 21,104 | 20,669 | 19,826 | (435 | ) | (843 | ) | (2.1 | %) | (4.1 | %) |
| 18,326 |
|
|
| 18,794 |
|
|
| 18,825 |
|
|
| (468 | ) |
|
| (31 | ) |
|
| (2.5 | %) |
|
| (0.2 | %) | |||||||||||||||||
Diluted | 21,372 | 20,890 | 20,004 | (482 | ) | (886 | ) | (2.3 | %) | (4.2 | %) |
| 18,602 |
|
|
| 19,008 |
|
|
| 19,042 |
|
|
| (406 | ) |
|
| (34 | ) |
|
| (2.1 | %) |
|
| (0.2 | %) | |||||||||||||||||
As previously identified in the section titledPart I, Item 1A of this annual report, “Risk Factors” in this report,Factors,” the Company’s ability to maintain or grow revenues is subject to several risks including, but not limited to, the COVID-19 pandemic, prolonged unemployment, changes in government regulations, exposure to litigation and the ability to add or retain customers. Any of these, or a combination of all of them, could have a material and adverse effect on the Company’s results of operations going forward.
The following table sets forth, for the periods indicated, the percentage of revenues represented by certain items reflected in the Company’s consolidated income statements.statements of income. The Company’s past operating results are not necessarily indicative of future operating results. The percentages for the three fiscal years ended March 31, 2014, 20152020, 2019 and 20162018 are as follows:
| Income Statement Percentages | 2014 | 2015 | 2016 |
| 2020 |
|
| 2019 |
|
| 2018 |
| ||||||||||||
Revenues | 100.0 | % | 100.0 | % | 100.0 | % |
|
| 100.0 | % |
|
| 100.0 | % |
|
| 100.0 | % | ||||||
Cost of revenues | 77.3 | % | 79.7 | % | 79.2 | % |
|
| 78.7 | % |
|
| 79.0 | % |
|
| 80.8 | % | ||||||
|
|
| ||||||||||||||||||||||
Gross profit | 22.7 | % | 20.3 | % | 20.8 | % |
|
| 21.3 | % |
|
| 21.0 | % |
|
| 19.2 | % | ||||||
General and administrative | 10.9 | % | 11.0 | % | 11.6 | % |
|
| 11.0 | % |
|
| 10.6 | % |
|
| 10.6 | % | ||||||
|
|
| ||||||||||||||||||||||
Income before income taxes | 11.8 | % | 9.3 | % | 9.2 | % |
|
| 10.3 | % |
|
| 10.4 | % |
|
| 8.6 | % | ||||||
Income tax provision | 4.6 | % | 3.4 | % | 3.5 | % |
|
| 2.3 | % |
|
| 2.5 | % |
|
| 2.2 | % | ||||||
|
|
| ||||||||||||||||||||||
Net Income | 7.2 | % | 5.9 | % | 5.7 | % | ||||||||||||||||||
|
|
| ||||||||||||||||||||||
Net income |
|
| 8.0 | % |
|
| 7.9 | % |
|
| 6.4 | % | ||||||||||||
Revenue
The Company derives its revenues from providing patient management and network solutions services to payors of workers’ compensation benefits, autoautomobile insurance claims, and group health insurance benefits. Patient management services include claims administration, utilization review, medical case management and vocational rehabilitation. Network solutions revenues include fee schedule auditing, hospital bill auditing, independent medical examinations, diagnostic imaging review services, directed care services and preferred provider referral services.
Change in Revenue
Fiscal 20162020 Compared to Fiscal 20152019
Revenues increased by 2.2%,decreased to $504$592 million in fiscal 2016,2020 from $493$596 million in fiscal 2015,2019, a decrease of $4 million, or 1%. The decrease in revenues was due to a decrease in network solutions services, which decreased to $205 million from $228 million, a decrease of 9.7%. The decrease was due to a 4.9% decrease in the number of pharmacy services bills the Company reviewed during fiscal 2020. The decrease in revenues was offset by an increase in patient management services, which increased to $387 million from $368 million, an increase of $11 million.5.1%. The increase was primarily due to growth in the TPA services within patient management services was due to an increase in customers. Patient management revenues, which include TPA services partially offset by a decrease in case management services to non-TPA customers. The increase in revenues from TPA services was due to a 13% increase in the number of customers, which contributed to a 3.3% increase in the total number of claims opened during the fiscal year.
Fiscal 2019 Compared to Fiscal 2018
Revenues increased by $8.6 million, or 3.2%, from $269to $596 million in fiscal 2015 to $2772019 from $558 million in fiscal 2016. This2018, an increase of $37 million, or 7%. The increase in revenues was due to an increase in patient management services, which increased by 16.4%, from $316 million to $368 million. The increase in patient management services was due to an increase in TPA services partially offset by a decrease in case management services to non-TPA customers. The increase in revenues from TPA services was due to a 7% increase in the number of customers, which contributed to a 7%20% increase in the total number of claims opened during the fiscal year. Network solutions services revenues increased by $2.3decreased to $228 million or 1.0%, from $224$242 million, in fiscal 2015 to $226 million in fiscal 2016.
Fiscal 2015 Compared to Fiscal 2014
Revenues increased by 2.9%, to $493 million in fiscal 2015, from $479 million in fiscal 2014, an increasea decrease of $14 million.6%. The increase was primarily due to growth in the TPA services within patient management due to an increase in customers. Patient management revenues, which include TPA services, increased by $21 million, or 8.5%, from $248 million in fiscal 2014 to $269 million in fiscal 2015. This increase in revenues from TPA servicesdecrease was due to a 5% increase in the number of customers, which contributed to an 11% increase in the total number of claims opened during the fiscal year. Network solutions services revenues decreased by $6.0 million, or 2.6%, from $230 million in fiscal 2014 to $224 million in fiscal 2015, due to a 5%9.2% decrease in the number of pharmacy services bills processed slightly offset by a 2% increase in the revenue per bill.Company reviewed during fiscal 2019.
Cost of Revenue
The Company’s cost of revenues consistconsists of direct expenses, costs directly attributable to the generation of revenue, and field indirect costs which are incurred in the field to support the operations in the field offices which generate the revenue. Direct costs areexpenses primarily include (i) case manager salaries,and bill review analysts,analysts’ salaries, along with related payroll taxes and fringe benefits, and (ii) costs for Independent Medical Examinations (IME)associated with independent medical examinations (known as IME), prescription drugs, and MRI, physical therapy, and durable medical equipment providers. Most of the Company’s revenues are generated in offices which provide both patient management services and network solutions services. The largest of the field indirect costs are (i) manager salaries and bonus,bonuses, (ii) account executive base pay and commissions, (iii) salaries of administrative and clerical support, field systems personnel and PPO network developers, along with related payroll taxes and fringe benefits, and (iv) office rent, and telephone expense.rent. During fiscal 20152020 and 2016,2019, approximately 32%38% and 37%, respectively, of the costs incurred in the field arewere considered field indirect costs, which support both the patient management services and network solutions services operations of the Company’s field operations.
Fiscal 20162020 Compared to Fiscal 20152019
The Company’s cost of revenues decreased to $466 million in fiscal 2020 from $471 million in fiscal 2019, a decrease of $5 million, or 1%. The decrease in cost of revenues was primarily due to revenue decreasing in pharmacy services, therefore causing a decrease in prescription costs.
Fiscal 2019 Compared to Fiscal 2018
The Company’s cost of revenues increased from $393to $471 million in fiscal 2015 to $3992019 from $451 million in fiscal 2016,2018, an increase of 1.6%,$20 million, or $6 million.4%. The increase in cost of revenues was primarily due to the 2.2%revenue increasing in lower margin TPA services. Additionally, there was an increase of $16.1 million in revenues noted above. The increasesalaries, to $229 million in cost of revenues also wasfiscal 2019 from $213 million in fiscal 2018, due to an increase in lower margin patient management TPA services due to competitive pricingheadcount and a decrease in higher margin bill review services. Pharmacy costs increased from $61 million to $64 million due to an increase in revenue in this line of business, which is due to an increase in volume. Additionally, our directfield labor costs increased from $107 million to $113 million due to increased headcount in TPA services.
Fiscal 2015 Compared to Fiscal 2014
The Company’s cost of revenues increased from $370 million in fiscal 2014 to $393 million in fiscal 2015, an increase of 6.0%, or $22 million. The increase in cost of revenues was primarily due to the 2.9% increase in revenues noted above. The cost of revenues increased at a higher rate than revenue due to an increase in lower margin patient management TPA services and a decrease in higher margin bill review services. Pharmacy costs
increased from $59 million to $61 million due to an increase in revenue in this line of business. Additionally, headcount increased which is reflected in our direct labor costs that increased from $99 million to $107 million due to increased services to TPA customers.116 employees.
General and Administrative Expense
During fiscal years 2014, 20152020, 2019, and 2016,2018, approximately 59%53%, 61%54%, and 60%54%, respectively, of general and administrative costs consisted of corporate systems costs, which include the corporate systems support, implementation and training, rules engine development, national information technology (IT)IT strategy and planning, depreciation of the hardware costs in the Company’s corporate offices and backup data center, the Company’s national widenationwide area network, and other systems related costs. The Company includes all IT relatedIT-related costs managed by the corporate office in general and administrative whereas the field IT relatedIT-related costs are included in the cost of revenues. The remaining general and administrative costs consist of national marketing, national sales support, corporate legal, corporate insurance, human resources, accounting, product management, new business development, and other general corporate expenses.
Change in General and Administrative Expense
Fiscal 20162020 Compared to Fiscal 20152019
General and administrative expense increased 7.5%, from $54.4to $65.2 million in fiscal 2015 to $58.52020 from $63.3 million in fiscal 2016. Legal expenses increased $2.12019, an increase of $1.9 million, or 3.0%. The increase in general and administrative expense was primarily due to the settlementan increase in legal expenses of two lawsuits during the last quarter of fiscal 2016. IT expenses increased from $33$1.0 million, in fiscal 2015 to $34 million in fiscal 2016which was primarily due to hardwareresolving customer contract issues and internally developed software depreciation.to a much lesser extent the Company’s July 2019 security incident, and an increase in marketing expenses of $0.7 million.
Fiscal 20152019 Compared to Fiscal 20142018
General and administrative expense increased 4.7% from $52to $63.3 million in fiscal 2014 to $54.42019 from $59.4 million in fiscal 2015. In fiscal 2015,2018, an increase of $3.9 million, or 6.6%. The increase in general and administrative expense was primarily due to an increase in corporate systems costs of $1.9 million and an increase in legal expenses of $1.1 million. This is consistent with the Company increased IT expenses related to a new data center being brought online topercentage of increase system capacity. IT expenses increased from $31 million in fiscal 2014 to $33 million in fiscal 2015.revenues of 6.7%.
Income Tax Provision
Fiscal 20162020 Compared to Fiscal 20152019
The Company’s income tax expense decreased to $13.3 million for fiscal 2020 from $14.8 million for fiscal 2019, a decrease of $1.5 million. The Company’s effective income tax rate was 22% for fiscal year 2020 and 24% for fiscal year 2019. Income before income tax provision decreased to $60.7 million in fiscal 2020 from $61.5 million in fiscal 2019, a decrease of $0.8 million. The decrease in tax rate can also be attributed to an increase of stock options exercised in the current fiscal year.
Fiscal 2019 Compared to Fiscal 2018
The Company’s income tax expense was $17.0$14.8 million for fiscal year 20152019 and $17.5$12.2 million for fiscal year 2016.2018, an increase of $2.6 million. The income tax expense was calculated based on a 37.3%24% tax rate for fiscal year 20152019 and 38.1%25% for fiscal year 2016. The2018. Income before income tax provision increased to $61.5 million in fiscal 2019 from $47.9 million in fiscal 2018, an increase of $0.5$13.6 million.
Fiscal 2020 Compared to Fiscal 2019
The Company’s net income increased to $47.4 million in fiscal 2020 from $46.7 million in fiscal 2019, an increase of $0.7 million, or 1.4%. This increase was primarily due to a 10% decrease in income tax provision.
Fiscal 2019 Compared to Fiscal 2018
The Company’s net income increased to $46.7 million in fiscal 2019 from $35.7 million in fiscal 2018, an increase of $11.0 million, or 30.8%. This increase was primarily due to a 28.4% increase in income before income taxes.
Earnings per Share
Fiscal 2020 Compared to Fiscal 2019
The Company’s diluted earnings per share increased to $2.55 in fiscal 2020 from $2.46 in fiscal 2019, an increase of $0.09. This increase was primarily due to an increase in net income and a decrease in diluted weighted average shares because of shares repurchased under the Company’s stock repurchase program.
Fiscal 2019 Compared to Fiscal 2018
The Company’s diluted earnings per share increased to $2.46 in fiscal 2019 from $1.87 in fiscal 2018, an increase of $0.59. This increase was primarily due to an increase in income before income taxes and a higher tax rate. The income tax provision rates were based upon management’s review of the Company’s estimated annual income tax rate, including state taxes. This effective tax rate differed from the statutory federal tax rate of 35.0% primarily due to state income taxes and certain non-deductible expenses offset by tax credits.
Fiscal 2015 Compared to Fiscal 2014
The Company’s income tax expense was $22 million for fiscal year 2014 and $17 million for fiscal year 2015. The income tax expense was calculated based on a 39% tax rate for fiscal year 2014 and 37.3% for fiscal year 2015. The decrease of $5 million was primarily due to a decrease in income before income taxes. Additionally, the rate decreased during fiscal year 2015 due to review of the state tax filings and the Company’s apportionment. The Company expects the rate to normalize in the next fiscal year. The income tax provision rates were based upon management’s review of the Company’s estimated annual income tax rate, including state taxes. This effective tax rate differed from the statutory federal tax rate of 35.0% primarily due to state income taxes and certain non-deductible expenses offset by tax credits.
Net Income
Fiscal 2016 Compared to Fiscal 2015
The Company’s net income for fiscal years 2015 and 2016 were $28.6 million and $28.5 million, respectively, a decrease of $0.1 million. The Company’s net income was relatively unchanged due to an increase in gross profit, which was offset by an increase in general and administrative expense and an increase in the tax rate.
Fiscal 2015 Compared to Fiscal 2014
The Company’s net income for fiscal years 2014 and 2015 was $34.4 million and $28.6 million, respectively. The Company’s net income in fiscal 2015 decreased due to a decrease in gross profit margin due to an increase in lower margin TPA business.
Earnings per Share
Fiscal 2016 Compared to Fiscal 2015
The Company’s diluted earnings per share for fiscal years 2015 and 2016 were $1.37 and $1.43, respectively, an increase of $0.06. The Company’s earnings per share in fiscal 2016 increased primarily due to a decrease in diluted weighted shares outstanding because of shares repurchased in the Company’s share repurchase program.
Fiscal 2015 Compared to Fiscal 2014
The Company’s diluted earnings per share for fiscal years 2014 and 2015 were $1.61 and $1.37, respectively. The Company’s earnings per share in fiscal 2015 decreased due to a decrease in net income of $5.8 million.
Liquidity and Capital Resources
Introduction
The Company manages its liquidity and financial position in the context of its overall business strategy. The Company continually forecasts and manages its cash, investments, working capital balances and capital structure to meet the short- and long-term obligations of its businesses while seeking to maintain liquidity and financial flexibility. Cash flows generated from operating activities are principally from earnings before non-cash expenses. The risk of decreased operating cash flow from a decline in earnings is partially mitigated by the diversity of the Company’s services, geographies and customers, and the Company has had virtually no interest-bearing debt for the past 2529 years.
The Company has historically funded its operations and capital expenditures primarily from cash flow from operations, and to a lesser extent, stock option exercises. The Company’s net accounts receivables have averaged belowranged from 41 to 43 days of average sales for the past two fiscal years and were at 42 days atended March 31, 2016.2020, 2019 and 2018. The Company expects days sales outstanding (“DSO”)(known as DSO) to remain in the low to mid 40-day range. Property, net of accumulated depreciation, has historically averaged approximately 11% or less of annual revenue. The Company’s historical profit margins and historical ratio of investments in assets used in the business has allowed the Company to generate sufficient cash flow to repurchase $392$532 million of its common stock during the past nineteen23 fiscal years, on inception-to-date net earnings of $393$553 million. The Company repurchases shares during periods of excess liquidity, which has occurred in all 2529 years that the Company has been public. Should the Company have lower income or cash flows, it could reduce or eliminate repurchases under the sharestock repurchase program until earnings and cash flow improves.improved. Working capital increased from $38decreased to $75.3 million to $43 million fromat March 31, 2015 to2020 from $98.6 million at March 31, 2016.2019. This is primarily due to an increase in cash used to repurchase shares of the Company’s common stock and due to an increase in operating lease liabilities due to the adoption of ASC 842 during the fiscal year.
The Company believes that cash from operations and funds from exercises of stock options granted to employees are adequate to fund existing obligations, repurchase shares of the Company’s common stock under its current sharestock repurchase program, introduce new services, and continue to develop healthcare related
healthcare-related businesses for at least the next twelve months. The Company regularly evaluates cash requirements for current operations, commitments, and for capital acquisitions and other strategic transactions. The Company may elect to raise additional funds for these purposes, through debtequity or equitydebt financings or otherwise, as appropriate. AdditionalHowever, additional equity or debt financing may not be available when needed, on terms favorable to usthe Company or at all.
As of March 31, 2016,2020, the Company had $33$83.2 million in cash and cash equivalents, invested primarily in short-term, interest-bearing, highly liquidhighly-liquid, investment-grade securities with maturities of 90 days or less.
InThe Company’s revolving credit facility expired in September 2015,2019, and the Company renewed achose not to renew its line of credit agreement. The line isagreement with a financial institution to provide a revolving credit facility with borrowing capacity of up to $10 million. Borrowings under this agreement, as amended, bear interest, at the Company’s option, at a fixed LIBOR-based rate plus 1.50% or at a fluctuating rate determined by the financial institution to be 1.50% above the daily one-month LIBOR rate. The loan covenants require the Company to maintain the current assets to liabilities ratio of at least 1.25:1, debt to tangible net worth not greater than 1.25:1 and have positive net income. There were no outstanding revolving loans as of March 31, 2016, but letters of credit in the aggregate amount of $4.5 million have been issued separate from the line of credit and therefore do not reduce the amount of borrowings available under the revolving credit facility. The credit agreement expires in September 2016.institution.
The Company believes that the cash balance at March 31, 20162020 along with anticipated internally generatedinternally-generated funds and the credit facility wouldwill be sufficient to meet the Company’s expected cash requirements for at least the next twelve months.
In response to the COVID-19 pandemic, the Company has taken a number of steps to enhance its liquidity including reducing its planned capital expenditures, temporarily suspending share repurchases under its stock repurchase program, reducing its work force, reducing compensation of highly compensated employees, and deferring the payment of certain compensation for certain employees. The Company does not intend to apply for governmental loans to support the Company’s operations, but is continuing to evaluate the CARES Act and is taking advantage of certain aspects of the CARES Act such as the deferral of payroll tax deposits.
Operating Cash Flows
Fiscal 20162020 Compared to Fiscal 20152019
Net cash provided by operating activities was $44increased to $80.8 million in fiscal 2015 and $512020 from $78.6 million in fiscal 2016. This2019, an increase of $2.2 million. The improvement in cash from operating activities was primarily due to the fact thata decrease in the prior year, the Company hadaccounts receivables, offset by a higher prepaid tax balance than the current year. During fiscal 2016, the Company’s prepaid tax is closer to the actual tax liability as compared to fiscal 2015.change in accrued liabilities.
Fiscal 20152019 Compared to Fiscal 20142018
Net cash provided by operating activities was $55increased to $78.6 million in fiscal 2014 and $442019 from $62.2 million in fiscal 2015. Net income decreased by $5.8 million, there2018, an increase of $16.5 million. The improvement in cash from operating activities was also a decrease in accounts and taxes payable. This wasprimarily due to a decreasean $11 million increase in the tax rate, which was partially offset bynet income, along with an increase in accounts receivable.accrued liabilities, primarily in accrued wages, professional services and coupled with the favorable cash impact from an increase in deferred revenue.
Investing Activities
Fiscal 20162020 Compared to Fiscal 20152019
Net cash flow used in investing activities increased to $32.4 million in fiscal 2020 from $15.3 million in fiscal 2019, an increase of $17.1 million. The increase in capital purchases is primarily due to construction improvements of the building the Company purchased in the greater Portland metropolitan area during fiscal 2018, which was placed into service during fiscal 2020.
Fiscal 2019 Compared to Fiscal 2018
Net cash flow used in investing activities decreased from $24to $15.3 million in fiscal 2015 to $172019 from $27.7 million in fiscal 2016.2018, a decrease of $12.4 million. The decrease in net cash flow used in investing activities was due to the Company not having large non-recurring purchases of a decreasebuilding and servers in property additions during fiscal 2016. In fiscal 2015, there was an increase in leasehold improvements and in the amount spent on capitalized hardware related to a new data center being built out to increase our system capacity.2019.
Financing Activities
Fiscal 20152020 Compared to Fiscal 2014
Net cash flow used in investing activities increased from $18 million in fiscal 2014 to $24 million in fiscal 2015. The increase in cash flow used in investing activities was due to an increase in property additions in leasehold improvements and an increase in the amount spent on capitalized hardware related to a new data center being built out to increase our system capacity.
Financing Activities
Fiscal 2016 Compared to Fiscal 20152019
Net cash flow used in financing activities decreased from $29.4increased to $57.0 million in fiscal 2015 to $26.72020 from $27.4 million in fiscal 2016. The decrease in cash flow used in financing activities was due to2019, an increase in proceeds from exercise of stock options.$29.5 million. During fiscal 2016,2020, the Company spent $31.5$66 million to repurchase 893,771822,353 shares of its common stock (at an average price of $35.27$79.78 per share). During fiscal 2015,2019, the Company spent $31.8$35 million to repurchase 845,014582,159 shares of its common stock (at an average price of $37.63$60.41 per share).
If the Company continues to generate cash flow from operating activities, the Company may continue to repurchase shares of its common stock on the open market, if authorized by the Company’s Board of Directors pursuant to the resumption of its stock repurchase program, or seek to identify other businesses to acquire. In November 2015, the Board of Directors increased the number of shares authorized to be repurchased over the life of the stock repurchase program by an additional 1,000,000 shares to 35,000,000 shares. The Company has historically used cash provided by operating activities and from the exercise of stock options to repurchase stock. The Company expects that it may use some of the cash on the balance sheet at March 31, 20162020 to repurchase additional shares of its common stock in the future.
Fiscal 20152019 Compared to Fiscal 20142018
Net cash flow used in financing activities increased from $21.4to $27.4 million in fiscal 2014 to $29.42019 from $7.3 million in fiscal 2015. The increase in cash flow used in financing activities was due to2018, an increase in the purchase of common stock under the Company’s share repurchase program.$20.1 million. During fiscal 2015,2019, the Company spent $31.8$35 million to repurchase 845,014582,159 shares of its common stock (at an average price of $37.63$60.41 per share). During fiscal 2014,2018, the Company spent $27.2$11 million to repurchase 830,460249,245 shares of its common stock (at an average price of $32.73$44.88 per share).
The following table setsets forth our contractual obligations at March 31, 2016,2020, which are primarily future minimum lease payments due under non-cancelable operating leases:
| For the Fiscal Years Ended March 31: |
|
|
|
|
| For the Fiscal Years Ended March 31st, Within: |
| |||||||||||||||||||||||||||||||||
| Total | Less than one year | 1-3 Years | 3-5 Years | More than 5 Years |
| Total |
|
| Less than one year |
|
| 1-3 Years |
|
| 3-5 Years |
|
| More than 5 Years |
| |||||||||||||||||||||
Operating leases | $ | 46,237,000 | $ | 13,458,000 | $ | 17,888,000 | $ | 9,680,000 | $ | 5,211,000 |
| $ | 99,482,000 |
|
| $ | 14,421,000 |
|
| $ | 29,096,000 |
|
| $ | 26,528,000 |
|
| $ | 29,437,000 |
| ||||||||||
Uncertain tax positions | 1,830,000 | 1,830,000 | — | — | — | |||||||||||||||||||||||||||||||||||
Software license | 3,249,000 | 1,083,000 | 2,166,000 | — | — | |||||||||||||||||||||||||||||||||||
|
|
|
|
| ||||||||||||||||||||||||||||||||||||
Software licenses |
|
| 3,790,000 |
|
|
| 1,895,000 |
|
|
| 1,895,000 |
|
|
| — |
|
|
| — |
| ||||||||||||||||||||
Total | $ | 51,316,000 | $ | 16,371,000 | $ | 20,054,000 | $ | 9,680,000 | $ | 5,211,000 |
| $ | 103,272,000 |
|
| $ | 16,316,000 |
|
| $ | 30,991,000 |
|
| $ | 26,528,000 |
|
| $ | 29,437,000 |
| ||||||||||
|
|
|
|
| ||||||||||||||||||||||||||||||||||||
Litigation.
Litigation. The Company is involved in litigation arising in the normalordinary course of business. Management believes that resolution of these matters will not result in any payment that, in the aggregate, would be material to the financial position or results of the operations of the Company.
Inflation.Inflation. The Company experiences pricing pressures in the form of competitive prices. The Company is also impacted by rising costs for certain inflation-sensitive operating expenses such as labor, and employee benefits, and facility leases. However, the Company generally does not believe these impacts are material to its revenues or net income.
Off-Balance Sheet Arrangements
The Company is not a party to off-balance sheet arrangements as defined by the Securities and Exchange Commission.SEC. However, from time to time the Company enters into certain types of contracts that contingently require the Company to indemnify parties against third-party claims. The contracts primarily relate to: (i) certain
contracts to perform services, under which the Company may provide customary indemnification tofor the purchases of such services;services, (ii) certain real estate leases, under which the Company may be required to indemnify property owners for environmental and other liabilities, and other claims arising from the Company’s use of the applicable premises;premises, and (iii) certain agreements with the Company’s officers, directors and employees, under which the Company may be required to indemnify such persons for liabilities arising out of certain actions taken by such persons, acting in their relationship withrespective capacities within the Company.
The terms of such customary obligations vary by contract and in most instances a specific or maximum dollar amount is not explicitly stated therein. Generally, amounts under these contracts cannot be reasonably estimated until a specific claim is asserted. Consequently, no liabilities have been recorded for these obligations on the Company’s balance sheets for any of the periods presented.
Critical Accounting Policies
The SEC defines critical accounting policies as those that require application of management’s most difficult, subjective or complex judgments, often as a result of the need to make estimates about the effect of matters that are inherently uncertain and may change in subsequent periods.
The following is not intended to be a comprehensive list of our accounting policies. OurThe Company’s significant accounting policies are more fully described in Note A1, “Summary of Significant Accounting Policies” in the notes to the Consolidated Financial Statements.our consolidated financial statements. In many cases, the accounting treatment of a particular transaction is specifically dictated by accounting principles generally accepted in the United States of America (“GAAP”), with no need for management’s judgment in their application. There are also areas in which management’s judgment in selecting an available alternative would not produce a materially different result.
We have identified the following accounting policies as critical to us: 1)(i) revenue recognition, 2)(ii) leases, (iii) allowance for uncollectible accounts, 3)(iv) goodwill and long-lived assets, 4)(v) accrual for self-insured costs, 5)(vi) accounting for income taxes, 6)(vii) legal and other contingencies, 7)(viii) share-based compensation, and 8)(ix) software development costs.
Revenue Recognition:Recognition: The Company recognizes revenueadopted ASC 606 using the modified retrospective method for those contracts which were not substantially completed as of the transition date, which was April 1, 2018. The reported results for the fiscal years ended March 31, 2020 and March 31, 2019 reflect the application of the guidance of ASC 606.
Revenue is recognized when therecontrol of the promised services is persuasive evidence of an arrangement, the services have been providedtransferred to the customer,Company’s customers in an amount that reflects the sales price is fixed or determinable, and collectability is reasonably assured. Forconsideration expected to be entitled to in exchange for those services. As the Company completes its performance obligations which are identified below, it has an unconditional right to consideration as outlined in the Company’s services, ascontracts. Generally, the Company’s professional staff performs work, theyaccounts receivable are contractually permittedexpected to bill for fees earnedbe collected in fraction of an hour increments worked or by units of production. The Company recognizes revenue as the time is worked or as units of production are completed, which is when the revenue is earned and realized. Labor costs are recognized as the costs are incurred. The Company derives the majority of its revenue from the sale of Network Solutions and Patient Management services. Network Solutions and Patient Management services may be sold individually or combined with any of the services the Company provides. When a sale combines multiple elements, the Company accounts for multiple element arrangements30 days in accordance with the guidance included in Accounting Standard Codification (“ASC”) 605-25.
Management evaluates agreements with customers in accordance with the provisionunderlying payment terms. For many of the revenue recognition topic that addresses multiple-deliverable revenue arrangements.Company’s services, the Company typically has one performance obligation; however, it also provides the customer with an option to acquire additional services. The multiple-deliverable arrangements entered into consistCompany offers multiple services under its patient management and network solutions service lines. The Company typically provides a menu of bundled managed careofferings from which included various unitsthe customer may choose to purchase. The price of accounting such as Network Solutions,each service is separate and Patient Management which includes claims administration. Such elements are considereddistinct and provides a separate units of accounting due to each element havingand distinct value to the customer. Pricing is generally consistent for each service irrespective of the other services or quantities requested by the customer.
In transactions related to third-party service revenue, which includes pharmacy, directed care services and other services provided by the Company’s integrated network solutions services, the Company is considered the principal, as it directs the third party, controls the specified service, performs program utilization review, directs payment to the provider, accepts the financial risk of loss associated with services rendered and combines the services provided into an integrated solution, as specified within the Company’s customer contracts. The Company has the ability to influence contractual fees with customers and possesses the financial risk of loss in certain contractual obligations. These factors indicate the Company is the principal and, as such, it is required to recognize revenue gross and service partner vendor fees in the cost of revenue in the Company’s consolidated income statements.
Leases: The Company adopted ASC 842 using the modified retrospective method and utilizing the effective date as the date of initial application. The reported results for the fiscal year ended March 31, 2020 reflect the application of the guidance of ASC 842 while the reported results for the fiscal year ended March 31, 2019 and 2018 were prepared under the guidance of ASC 840.
The Company determines if an arrangement includes a lease at inception. Right-of-use assets represent the Company’s right to use an underlying asset for the lease term; and lease liabilities represent the Company’s obligation to make lease payments arising from the lease. Right-of-use assets and lease liabilities are recognized at the commencement date of the lease, renewal date of the lease or significant remodeling of the lease space based on the present value of the remaining future minimum lease payments. Leases with a term greater than one year are recognized on the balance sheet as right-of-use assets and short-term and long-term lease liabilities, as applicable.
Operating lease liabilities and their corresponding right-of-use assets are initially recorded based on the present value of lease payments over the expected remaining lease term. The interest rate implicit in lease contracts is typically not readily determinable. As a result, we utilize our incremental borrowing rate to discount lease payments, which reflects the fixed rate at which we could borrow on a stand-alone basis. The selling price for each unit of accounting is determined using contract price and management estimates. Whencollateralized basis the Company’s customers purchase several products, the pricingamount of the products sold is generally the same as if the product were sold on an individual basis. Revenue is recognized as the work is performed in accordance with our customer contracts. Based upon the nature of the Company’s products, bundled managed care elements are generally deliveredlease payments in the same accounting period.currency, for a similar term, in a similar economic environment. The Company recognizes revenueCompany’s leases may include options to extend or terminate the lease which are included in the lease term when it is reasonably certain that we will exercise any such options. Lease expense for patient management claims administration serviceslease payments is recognized on a straight-line basis over the life of the claim. Based upon prior experience in managing claims, the Company estimates the deferral amount from when the claim is received to when the customer contract expires.
Allowance for Uncollectible Accounts:Accounts: The Company determines its allowance for uncollectible accounts by considering a number of factors, including the length of time trade accounts receivable are past due, the Company’s previous loss history, the customers’ current ability to pay its obligation to the Company, and the condition of the general economy and the industry as a whole. The Company writes off accounts receivable when they become uncollectible.
The Company must make significant management judgments and estimates in determining contractual and bad debt allowances in any accounting period. One significant uncertainty inherent in the Company’s analysis is whether its past experience will be indicative of future periods. Although the Company considers future projections when estimating contractual and bad debt allowances, the Company ultimately makes its decisions based on the best information available to it at that time.the time the decision is made. Adverse changes in general economic conditions or trends in reimbursement amounts for the Company’s services could affect the Company’s contractual and bad debt allowance estimates, collection of accounts receivable, cash flows, and results of operations. No one customer accounted for 10% or more of accounts receivable at March 31, 2015,2020 and 2016.2019.
Goodwill and Long-Lived Assets:Assets: Goodwill arising from business combinations represents the excess of the purchase price over the estimated fair value of the net assets of the acquired business. Pursuant to ASC 350-10 through ASC 350-30, “Goodwill and Other Intangible Assets,” goodwill is tested annually for impairment or more frequently if circumstances indicate the potential for impairment. Also, management tests for impairment of its amortizable intangible assets and long-lived assets annually and whenever events or changes in circumstances indicate that the carrying amount of an asset may not be recoverable. The Company’s impairment analysistest is conducted at a regionalthe company level. The measurement of fair value is based on an evaluation of market capitalization and is further tested using a multiple of earnings approach. In projecting the Company’s cash flows, management considers industry growth rates and trends and cost structure changes. Based on the Company’s tests and reviews, no impairment of its goodwill, intangible assets, or other long-lived assets existed at March 31, 2016.2020 or March 31, 2019. However, future events or changes in current circumstances could affect the recoverability of the carrying value of goodwill and long-lived assets. Should an asset be deemed impaired, an impairment loss would be recognized to the extent the carrying value of the asset exceeded its estimated fair market value.
Accrual for Self-insurance Costs:Costs: The Company accrues for the group medical costs and workers’ compensation costs of its employees based on claims filed and an estimate of claims incurred but not reported as of each balance sheet date. The Company purchases stop loss insurance for large claims. The Company determines its estimated self-insurance reserves based upon historical trends along with outstanding claims information provided by its claims paying agents. However, it is possible that recorded accruals may not be adequate to cover the future payment of claims. Adjustments, if any, to estimated accruals resulting from ultimate claim payments will be reflected in earnings during the periods in which such adjustments are determined. The Company’s self-insured liabilities contain uncertainties because management is required to make assumptions and to apply judgmentjudgments to estimate the ultimate cost to settle reported claims and claims incurred but not reported at the balance sheet date.
The Company does not believe there is a reasonable likelihood that there will be a material change in the estimates or assumptions used to calculate its self-insured liabilities. However, if actual results are not consistent with these estimates or assumptions, the Company may be exposed to losses or gains that could be material.
Accounting for Income Taxes:Taxes: The Company records a tax provision for the anticipated tax consequences of theits reported results of operations. The provision for income taxes is computed using the asset and liability method, under which deferred tax assets and liabilities are recognized for the expected future tax consequences of temporary differences between the financial reporting and tax bases of assets and liabilities, and for operating losses and tax credit carryforwards. Deferred tax assets and liabilities are measured using the currently enactedcurrently-enacted tax rates that apply to taxable income in effect for the years in which those tax assets are expected to be realized or settled. The Company records a valuation allowance, if necessary, to reduce deferred tax assets to the amount that is believed more likely than not to be realized.
The Company recognizes tax benefits from uncertain tax positions only if it is more likely than not that the tax position will be sustained on examination by the taxing authorities, based on the technical merits of the position. The tax benefits recognized in the financial statements from such positions are then measured based on the largest benefit that has a greater than 50% likelihood of being realized upon ultimate settlement.
Management believes it is more likely than not that forecasted income, including income that may be generated as a result of certain tax planning strategies, together with future reversals of existing taxable temporary differences, will be sufficient to fully recover the deferred tax assets. In the event that the Company determines all or part of the net deferred tax assets are not realizable in the future, the Company will make an adjustment to the valuation allowance that would be charged to earnings in the period such determination is made. In addition, the calculation of tax liabilities involves significant judgment in estimating the impact of uncertainties in the application of accounting principles generally accepted in the United States of AmericaGAAP and complex tax laws. Resolution of these uncertainties in a manner inconsistent with management’s expectations could have a material impact on the Company’s financial condition and operating results. The significant assumptions and estimates described above are important contributors to our ultimate effective tax rate in each year.
Legal and Other Contingencies:Contingencies: As discussed in Part I, Item 3 of this Form 10-K under the headingannual report, “Legal Proceedings” and in Note I,10, “Contingencies and Legal Proceedings” in Notes to Consolidated Financial Statements,of our consolidated financial statements, the Company is subject to various legal proceedings and claims that arise in the ordinary course of business. The Company records a liability when it is probable that a loss has been incurred and the amount is reasonably estimable. There is significant judgment required in both the probability determination and as to whether an exposure can be reasonably estimated. In the opinion of management, there was not at least a reasonable possibility the Company may have incurred a material loss, or a material loss in excess of a recorded accrual, with respect to loss contingencies. However, theThe outcome of legal proceedings and claims brought against the Company areis subject to significant uncertainty.
Share-Based Compensation:Compensation: The Company accounts for share-based compensation in accordance with the provisions of ASC Topic 718 “Compensation —– Stock Compensation”. Under ASC 718, share-based compensation cost is measured at the grant date, based on the calculated fair value of the award, and is recognized as an expense over the employee’s requisite service period (generally the vesting period of the equity grant). For the fiscal year ended March 31, 2016,2020, the Company recorded share-based compensation expense of $2,192,000. Share-based compensation expense recognized in fiscal 2016 is based on awards ultimately expected to vest; therefore, it has been reduced for estimated forfeitures. ASC Topic 718 requires forfeitures to be estimated at the time of grant and revised, if necessary, in subsequent periods if actual forfeitures differ from those estimates.$4,485,000.
The Company estimates the fair value of stock options using the Black-Scholes valuation model. Key input assumptions used to estimate the fair value of stock options include the exercise price of the award, the expected option term, the expected volatility of the Company’s stock over the option’s expected term, the risk-free interest rate over the option’s term, and the Company’s expected annual dividend yield. The Company issues performance-based stock options which vest only upon the Company’s achievement of certain earnings per share targets on a calendar year basis, as determined by the Company’s Board of Directors. These options were valued in the same manner as the time-based options. However, the Company only recognizes stock compensation expense to the extent that the targets are determined to be probable of being achieved, which triggers the vesting of the performance options. The Company’s management believes that thethis valuation technique and the approach utilized to develop the underlying assumptions are appropriate in calculating the fair values of the Company’s stock options granted in fiscal 2016.2020. Estimates of fair value are not intended to predict actual future events or the value ultimately realized by persons who receive equity awards.
We doThe Company does not believe there is a reasonable likelihood that there will be a material change in the future estimates or assumptions we use to determine stock-based compensation expense. However, if actual results are not consistent with our estimates or assumptions, we may be exposed to changes in stock-based compensation expense that could be material.
Software Development Costs:Costs: Development costs incurred in the research and development of new software products and enhancements to existing software products for internal use are expensed as incurred until technological feasibility has been established. After technological feasibility is established, any additional external software development costs are capitalized and amortized on a straight-line basis over the estimated
economic life of the related product, which is typically five years. The Company performs an annual review of the estimated economic life and the recoverability of such capitalized software costs. If a determination is made that capitalized amounts are not recoverable based on the estimated cash flows to be generated from the applicable software, any remaining capitalized amounts are written off. Although the Company believes that its approach to estimates and judgments as described herein is reasonable, actual results could differ and the Company may be exposed to increases or decreases in revenue that could be material.
Recently Issued Accounting Standards
On May 28, 2014, the FASB issued ASU 2014-09 regarding ASC Topic 606,Revenue from Contracts with Customers. The standard provides principles for recognizing revenue for the transfer of promised goods or services to customers with the consideration to which the entity expects to be entitled in exchange for those goods or services. In July 2015, the FASB approved a one-year delay of the effective date of this new revenue recognition standard. The guidance will now be effective for our fiscal year beginning April 1, 2018. We are currently evaluating the accounting, transition and disclosure requirements of the standard and cannot currently estimate the financial statement impact of adoption.
On November 20, 2015, the FASB issued ASU 2015-17,Balance Sheet Classification of Deferred Taxes. ASU 2015-17 alters the presentation of deferred tax items on a classified balance sheet requiring companies to unify previously separated current and noncurrent items and present them as a single noncurrent amount. We have elected to early adopt this standard as of March 31st, 2016 and have retrospectively applied the amendments to all periods presented. As a result we reclassified $7,181,000 of current deferred tax assets to non-current deferred tax assets and netted $7,181,000 non-current deferred tax liabilities against our non-current deferred tax assets as of March 31, 2015.
In JanuaryJune 2016, the FASB issued ASU 2016-012016-13 regarding Subtopic 825-10,Financials Instruments — Overall: Recognition and MeasurementsASC Topic 326, “Measurement of Credit Losses on Financial Assets and Financial LiabilitiesInstruments”. The standard addresses certain aspectspronouncement changes the impairment model for most financial assets and will require the use of recognition, measurement, presentation, and disclosure of financial instruments. It requires that most equity investments bean "expected loss" model for instruments measured at fair value, with subsequent changesamortized cost. Under this model, entities will be required to estimate the lifetime expected credit loss on such instruments and record an allowance to offset the amortized cost basis of the financial asset, resulting in fair value recognized ina net income. The guidancepresentation of the amount expected to be collected on the financial asset. Subsequently, the FASB issued an amendment to clarify the implementation dates and items that fall within the scope of this pronouncement. This standard is effective for fiscal years andbeginning after December 15, 2019, including interim periods within those fiscal years. The adoption of this guidance will not have a material impact on our consolidated financial statements.
In January 2017, the FASB issued ASU 2017-04 regarding ASC Topic 350, “Simplifying the Test for Goodwill Impairment”. The pronouncement simplifies the accounting for goodwill impairments by eliminating step two from the goodwill impairment test. Under this guidance, if the carrying amount of a reporting unit exceeds its estimated fair value, an impairment charge shall be recognized in an amount equal to that excess, limited to the total amount of goodwill allocated to that reporting unit. This standard is effective for fiscal years beginning after December 15, 2017. We are currently2019, with early adoption permitted. The adoption of this guidance will not have a material impact on the Company’s consolidated financial statements.
In December 2019, the FASB issued ASU 2019-12, “Simplifying the Accounting for Income Taxes”. The pronouncement simplifies the accounting for income taxes by removing certain exceptions to the general principles in ASC Topic 740, “Income Taxes”. The pronouncement also improves consistent application of and simplify GAAP for other areas of Topic 740 by clarifying and amending existing guidance. This standard is effective for fiscal years beginning after December 15, 2020, with early adoption permitted. The Company is still evaluating the accounting, transition, and disclosure requirements of the standard and cannot currently estimate theimpact this guidance will have on its consolidated financial statement impact of adoption.statements.
In February 2016, the FASB issued ASU No. 2016-02,Leases “Leases”, which sets out the principles for the recognition, measurement, presentation, and disclosure of leases for both parties to a contract (i.e. lessees and lessors). The standard requires lessees to apply a dual approach, classifying leases as either finance or operating leases. This classification will determine whether the lease expense is recognized based on an effective interest method or on a straight-line basis over the term of the lease. A lessee is also required to record a right-of-use asset and a lease liability for all leases with a term of greater than 12 months regardless of their classification. Leases with a term of 12 months or less will be accounted for using an approach that is similar to the existing guidance for operating leases. The new standard requires lessors to account for leases using an approach that is substantially equivalent to existing guidance for sales-type leases, direct financing leases and operating leases. The standard is effective January 1, 2019, with early adoption permitted. The standard is to be applied using a modified retrospective transition method. WeThe Company has adopted this standard as of April 1, 2019. The adoption of this standard did not have a material impact on retained earnings on the consolidated balance sheet and did not have a material impact on the consolidated statements of income. The Company elected the package of practical expedients permitted under the transition guidance within the new standard, which allowed the Company to carry forward the historical assessments of whether contracts are inor contain leases, lease classification, and initial direct costs. The Company implemented internal controls and key system functionality to enable the processpreparation of determiningfinancial information on adoption. Refer to Note 9 of the effect on ouraccompanying consolidated financial position, resultsstatements for a description of operations and cash flows.the impact of this adopted guidance.
On May 28, 2014, the FASB issued ASU 2014-09 regarding ASC Topic 606, “Revenue from Contracts with Customers” (“ASC 606”). This standard provides principles for recognizing revenue for the transfer of promised goods or services to customers with the consideration to which the entity expects to be entitled in exchange for those goods or services. In July 2015, the FASB approved a one-year delay of the effective date of this new revenue recognition standard. The Company has adopted this standard as of April 1, 2018. Refer to Note 2 of the accompanying consolidated financial statements for a description of the impact of the adopted guidance.
In MarchJanuary 2016, the FASB issued ASU 2016-01 regarding Subtopic 825-10, “Financials Instruments — Overall: Recognition and Measurements of Financial Assets and Financial Liabilities”. The standard addresses certain aspects of recognition, measurement, presentation, and disclosure of financial instruments. It requires that most equity investments be measured at fair value, with subsequent changes in fair value recognized in net income. The guidance is effective for fiscal years, and interim periods within those years, beginning after December 15, 2017. The Company adopted this guidance prospectively on April 1, 2018. The adoption of this guidance did not have a material impact on the Company’s consolidated financial statements.
In August 2016, the FASB issued ASU No. 2016-09,Improvements to Employee Share-Based Payment Accounting2016-15, “Statement of Cash Flows”, which simplifies several aspectsreduces diversity in the practice of the accounting for employee share-based paymenthow certain transactions including the accounting for income taxes, forfeitures, and statutory tax withholding requirements, as well as classification onare classified in the statement of cash flows. For public companies, theThe new guidance is effective for annual reporting periods (including interim periods within those periods) beginning after December 15, 2016,2017, with early adoption permitted. We are in the process of evaluating the impact ofThe Company adopted this guidance prospectively on April 1, 2018. The adoption of this guidance did not have a material impact on ourthe Company’s consolidated financial statements.
REPORT OF INDEPENDENT REGISTEREDREGISTERED PUBLIC ACCOUNTING FIRM
To the Board of Directors and Stockholders of CorVel Corporation
Opinions on the Consolidated Financial Statements and Internal Control over Financial Reporting
We have audited the accompanying consolidated balance sheets of CorVel Corporation (the “Company”) as of March 31, 20152020 and 2016, and2019, the related consolidated statements of income, stockholders’ equity, and cash flows for each of the years in the three-year period ended March 31, 2014, 20152020, and 2016. In connection with our audits of the consolidated financial statements, we have also audited therelated notes and financial statement schedule for each of(collectively referred to as the years ended March 31, 2014, 2015 and 2016.“consolidated financial statements”). We also have audited the Company’s internal control over financial reporting as of March 31, 2016,2020, based on criteria established in theInternal Control — Integrated Framework (2013) issued by the Committee of Sponsoring Organizations of the Treadway Commission (COSO)(“COSO”).
In our opinion, the consolidated financial statements referred to above present fairly, in all material respects, the consolidated financial position of the Company as of March 31, 2020 and 2019, and the consolidated results of its operations and its cash flows for each of the years in the three-year period ended March 31, 2020, in conformity with accounting principles generally accepted in the United States of America. Also, in our opinion, the Company maintained, in all material respects, effective internal control over financial reporting as of March 31, 2020, based on criteria established in Internal Control — Integrated Framework (2013) issued by COSO.
Adoption of New Accounting Standard
As described in Notes 1 and 9 to the consolidated financial statements, on April 1, 2019, the Company changed its method of accounting for leases.
Basis for Opinion
The Company’s management is responsible for these consolidated financial statements, for maintaining effective internal control over financial reporting, and for its assessment of the effectiveness of internal control over financial reporting, included in the accompanying Management’s Report on Internal Control over Financial Reporting. Our responsibility is to express an opinion on thesethe Company’s consolidated financial statements and an opinion on the Company’s internal control over financial reporting based on our audits. We are a public accounting firm registered with the Public Company Accounting Oversight Board (United States) (“PCAOB”) and are required to be independent with respect to the Company in accordance with the U.S. federal securities laws and the applicable rules and regulations of the Securities and Exchange Commission and the PCAOB.
We conducted our audits in accordance with the standards of the Public Company Accounting Oversight Board (United States).PCAOB. Those standards require that we plan and perform the audits to obtain reasonable assurance about whether the consolidated financial statements are free of material misstatement, whether due to error or fraud, and whether effective internal control over financial reporting was maintained in all material respects.
REPORT OF INDEPENDENT REGISTERED PUBLIC ACCOUNTING FIRM (Continued)
Our audits of the consolidated financial statements included performing procedures to assess the risks of material misstatement of the consolidated financial statements, whether due to error or fraud, and performing procedures that respond to those risks. Such procedures included examining, on a test basis, evidence supportingregarding the amounts and disclosures in the consolidated financial statements, assessingstatements. Our audits also included evaluating the accounting principles used and significant estimates made by management, andas well as evaluating the overall presentation of the consolidated financial statement presentation.statements. Our audit of internal control over financial reporting included obtaining an understanding of internal control over financial reporting, assessing the risk that a material weakness exists, and testing and evaluating the design and operating effectiveness of internal control based on the assessed risk. Our audits also included performing such other procedures as we considered necessary in the circumstances. We believe that our audits provide a reasonable basis for our opinion.opinions.
Definition and Limitations of Internal Control Over Financial Reporting
A company’s internal control over financial reporting is a process designed to provide reasonable assurance regarding the reliability of financial reporting and the preparation of financial statements for external purposes in accordance with accounting principles generally accepted in the United States of America.accounting principles. A company’s internal control over financial reporting includes those policies and procedures that (1) pertain to the maintenance of records that, in reasonable detail, accurately and fairly reflect the transactions and dispositions of the assets of the company; (2) provide reasonable assurance that transactions are recorded as necessary to permit preparation of financial statements in accordance with accounting principles generally accepted in the United States of America,accounting principles, and that receipts and expenditures of the company are being made only in accordance with authorizations of management and directors of the company; and (3) provide reasonable assurance regarding prevention or timely detection of unauthorized acquisition, use, or disposition of the company’s assets that could have a material effect on the financial statements.
Because of its inherent limitations, internal control over financial reporting may not prevent or detect misstatements. Also, projections of any evaluation of effectiveness to future periods are subject to the risk that controls may become inadequate because of changes in conditions, or that the degree of compliance with the policies or procedures may deteriorate.
In our opinion,Critical Audit Matters
The critical audit matter communicated below is a matter arising from the current period audit of the consolidated financial statements referredthat was communicated or required to above present fairly, in allbe communicated to the audit committee and that: (1) relate to accounts or disclosures that are material respects,to the consolidated financial positionstatements and (2) involved our especially challenging, subjective, or complex judgments. The communication of the Company as of March 31, 2015 and 2016, and the consolidated results of its operations and its cash flows for each of the years ended March 31, 2014, 2015 and 2016,critical audit matter does not alter in conformity with accounting principles generally accepted in the United States of America. Also, inany way our opinion on the financial statement schedule for each of the years ended March 31, 2014, 2015 and 2016, when considered in relation to the basic consolidated financial statements, taken as a whole, presents fairly,and we are not, by communicating the critical audit matter below, providing separate opinions on the critical audit matter or on the accounts or disclosures to which they relate.
REPORT OF INDEPENDENT REGISTERED PUBLIC ACCOUNTING FIRM (Continued)
Revenue Recognition - Refer to Note 2 to the Consolidated Financial Statements
Critical Audit Matter Description:
The Company recognizes revenue upon transfer of control of promised services or products to customers in all material respects,an amount that reflects the information set forth therein. Also, in our opinion,consideration the Company maintained,expects to receive in all material respects, effective
internal control over financial reporting asexchange for those services or products. Certain customer contracts contain provisions that permit the customer to compensate the Company only for services that it chooses to accept, which directly impacts the amount of March 31, 2016, based on criteria established in theInternal Control — Integrated Framework (2013) issuedrevenue recognized by the CommitteeCompany. Significant judgment is exercised by management in determining revenue recognition for these customer contract provisions, including the following:
▪ | Determination of whether a reasonable estimate of the transaction price can be made for related customer contracts. |
▪ | Estimation of the amount of variable consideration to which the Company will be entitled in exchange for transferring the promised services to a customer. |
▪ | Determination of whether the variable consideration should be constrained. |
Given these factors, the related audit effort in evaluating management’s judgments in determining revenue recognition for these customer agreements was extensive and required a high degree of Sponsoring Organizationsauditor judgment.
How the Critical Matter was Addressed in the Audit:
We obtained an understanding, evaluated the design, and tested the operating effectiveness of controls over the Company’s process to estimate the amount of variable consideration to which the Company will be entitled in exchange for transferring the promised services to a customer. Specifically, we tested controls over management’s review of the Treadway Commission (COSO).significant inputs and assumptions used in developing such estimates.
The audit procedures we applied included, among others, evaluating the methodology used, analyzing the significant assumptions discussed above, and testing the accuracy and completeness of key underlying data used in management’s calculations. This included testing inputs to the calculation by comparing historical information to source documents and evaluating the historical accuracy of management’s estimates by comparing such estimates to subsequent actual results.
We also applied the following audit procedures related to the Company’s revenue recognition for these customer contracts:
▪ | We tested the effectiveness of internal controls related to the identification of customer contracts that contain such terms and provisions. |
▪ | We tested the effectiveness of internal controls related to the estimation of variable consideration. |
▪ | We evaluated management’s significant accounting policies related to these customer agreements for reasonableness. |
▪ | For significant customer contracts that contain such terms and provisions, we performed the following procedures: |
REPORT OF INDEPENDENT REGISTERED PUBLIC ACCOUNTING FIRM (Continued)
a) | Obtained and read customer contract source documents for each selection, including any other communications that were part of the customer arrangement. |
b) | Tested management’s identification of significant terms for completeness, including the identification of distinct performance obligations and variable consideration. |
c) | Assessed the terms in the customer contract and evaluated the appropriateness of management’s application of the Company’s accounting policies, along with their use of estimates, in the determination of revenue recognition conclusions. |
▪ | We tested the mathematical accuracy of management’s calculations of revenue and the associated timing of revenue recognized in the consolidated financial statements. |
/s/ HASKELL & WHITE LLP
We have served as the Company’s auditor since 2006.
Irvine, California
June 10, 2016
CONSOLIDATED STATEMENTS OF INCOMEBALANCE SHEETS
| Fiscal Years Ended March 31, | ||||||||||||
| 2014 | 2015 | 2016 | ||||||||||
Revenues | $ | 478,816,000 | $ | 492,625,000 | $ | 503,584,000 | ||||||
Cost of revenues | 370,335,000 | 392,656,000 | 399,040,000 | |||||||||
|
|
|
|
|
| |||||||
Gross profit | 108,481,000 | 99,969,000 | 104,544,000 | |||||||||
General and administrative | 51,974,000 | 54,405,000 | 58,484,000 | |||||||||
|
|
|
|
|
| |||||||
Income before income taxes | 56,507,000 | 45,564,000 | 46,060,000 | |||||||||
Income tax provision | 22,115,000 | 16,974,000 | 17,535,000 | |||||||||
|
|
|
|
|
| |||||||
Net income | $ | 34,392,000 | $ | 28,590,000 | $ | 28,525,000 | ||||||
|
|
|
|
|
| |||||||
Net income per share: | ||||||||||||
Basic | $ | 1.63 | $ | 1.38 | $ | 1.44 | ||||||
|
|
|
|
|
| |||||||
Diluted | $ | 1.61 | $ | 1.37 | $ | 1.43 | ||||||
|
|
|
|
|
| |||||||
Weighted average shares outstanding: | ||||||||||||
Basic | 21,104,000 | 20,669,000 | 19,826,000 | |||||||||
Diluted | 21,372,000 | 20,890,000 | 20,004,000 | |||||||||
|
| March 31, |
| |||||
|
| 2020 |
|
| 2019 |
| ||
ASSETS |
|
|
|
|
|
|
|
|
Current Assets |
|
|
|
|
|
|
|
|
Cash and cash equivalents |
| $ | 83,223,000 |
|
| $ | 91,713,000 |
|
Customer deposits |
|
| 48,991,000 |
|
|
| 45,268,000 |
|
Accounts receivable (less allowance for doubtful accounts of $5,133,000 at March 31, 2020 and $5,508,000 at March 31, 2019) |
|
| 65,767,000 |
|
|
| 71,336,000 |
|
Prepaid expenses and income taxes |
|
| 11,010,000 |
|
|
| 7,176,000 |
|
Total current assets |
|
| 208,991,000 |
|
|
| 215,493,000 |
|
Property and equipment, net |
|
| 75,900,000 |
|
|
| 61,980,000 |
|
Goodwill |
|
| 36,814,000 |
|
|
| 36,814,000 |
|
Other intangible assets, net |
|
| 2,540,000 |
|
|
| 2,975,000 |
|
Right-of-use asset, net (Note 9) |
|
| 90,666,000 |
|
|
| — |
|
Other assets |
|
| 1,349,000 |
|
|
| 756,000 |
|
Total assets |
| $ | 416,260,000 |
|
| $ | 318,018,000 |
|
LIABILITIES AND STOCKHOLDERS' EQUITY |
|
|
|
|
|
|
|
|
Current Liabilities |
|
|
|
|
|
|
|
|
Accounts and income taxes payable |
| $ | 16,363,000 |
|
| $ | 11,478,000 |
|
Accrued liabilities |
|
| 117,326,000 |
|
|
| 105,441,000 |
|
Total current liabilities |
|
| 133,689,000 |
|
|
| 116,919,000 |
|
Deferred income taxes, net |
|
| 7,764,000 |
|
|
| 6,294,000 |
|
Long-term operating lease liabilities (Note 9) |
|
| 85,096,000 |
|
|
| — |
|
Total liabilities |
|
| 226,549,000 |
|
|
| 123,213,000 |
|
Commitments and contingencies (Notes 6, 7, 10, 11 and 13) |
|
|
|
|
|
|
|
|
Stockholders' Equity |
|
|
|
|
|
|
|
|
Common stock, $.0001 par value: 120,000,000 shares authorized at March 31, 2020 and 2019; 54,254,557 shares issued (17,968,966 shares outstanding, net of treasury shares) and 54,021,032 shares issued (18,557,794 shares outstanding, net of treasury shares) at March 31, 2020 and March 31, 2019, respectively |
|
| 3,000 |
|
|
| 3,000 |
|
Paid-in-capital |
|
| 168,935,000 |
|
|
| 155,798,000 |
|
Treasury Stock, at cost (36,285,591 and 35,463,238 shares at March 31, 2020 and 2019, respectively) |
|
| (531,764,000 | ) |
|
| (466,156,000 | ) |
Retained earnings |
|
| 552,537,000 |
|
|
| 505,160,000 |
|
Total stockholders' equity |
|
| 189,711,000 |
|
|
| 194,805,000 |
|
Total liabilities and stockholders' equity |
| $ | 416,260,000 |
|
| $ | 318,018,000 |
|
See accompanying notes to consolidated financial statements.
CONSOLIDATED BALANCE SHEETSSTATEMENTS OF INCOME
| March 31, | ||||||||
| 2015 | 2016 | |||||||
| ASSETS | ||||||||
Current Assets | ||||||||
Cash and cash equivalents | $ | 25,516,000 | $ | 32,779,000 | ||||
Customer deposits | 17,319,000 | 25,649,000 | ||||||
Accounts receivable (less allowance for doubtful accounts of $1,645,000 at March 31, 2015 and $1,821,000 at March 31, 2016) | 57,537,000 | 59,747,000 | ||||||
Prepaid expenses and taxes | 11,675,000 | 4,933,000 | ||||||
|
|
|
| |||||
Total current assets | 112,047,000 | 123,108,000 | ||||||
Property and equipment, net | 56,299,000 | 53,268,000 | ||||||
Goodwill | 36,814,000 | 36,814,000 | ||||||
Other intangible assets, net | 4,736,000 | 4,287,000 | ||||||
Other assets | 1,677,000 | 2,792,000 | ||||||
|
|
|
| |||||
Total assets | $ | 211,573,000 | $ | 220,269,000 | ||||
|
|
|
| |||||
| LIABILITIES AND STOCKHOLDERS’ EQUITY | ||||||||
Current Liabilities | ||||||||
Accounts and taxes payable | $ | 15,770,000 | $ | 13,233,000 | ||||
Accrued liabilities | 58,318,000 | 67,182,000 | ||||||
|
|
|
| |||||
Total current liabilities | 74,088,000 | 80,415,000 | ||||||
Deferred income taxes | 9,562,000 | 7,906,000 | ||||||
|
|
|
| |||||
Total liabilities | 83,650,000 | 88,321,000 | ||||||
|
|
|
| |||||
Commitments and contingencies (Notes E, F, H, I, J and L) | ||||||||
Stockholders’ Equity | ||||||||
Common stock, $.0001 par value: 120,000,000 shares authorized at March 31, 2015 and 2016; 53,243,157 shares issued (20,250,669 shares outstanding, net of Treasury shares) and 53,448,672 shares issued (19,562,413 shares outstanding, net of Treasury shares) at March 31, 2015 and March 31, 2016, respectively | 3,000 | 3,000 | ||||||
Paid-in-capital | 123,440,000 | 130,465,000 | ||||||
Treasury Stock, at cost (32,992,488 and 33,886,259 shares at March 31, 2015 and 2016, respectively) | (360,278,000 | ) | (391,803,000 | ) | ||||
Retained earnings | 364,758,000 | 393,283,000 | ||||||
|
|
|
| |||||
Total stockholders’ equity | 127,923,000 | 131,948,000 | ||||||
|
|
|
| |||||
| $ | 211,573,000 | $ | 220,269,000 | |||||
|
|
|
| |||||
|
| Fiscal Years Ended March 31, |
| |||||||||
|
| 2020 |
|
| 2019 |
|
| 2018 |
| |||
Revenues |
| $ | 592,225,000 |
|
| $ | 595,740,000 |
|
| $ | 558,350,000 |
|
Cost of revenues |
|
| 466,304,000 |
|
|
| 470,931,000 |
|
|
| 451,097,000 |
|
Gross profit |
|
| 125,921,000 |
|
|
| 124,809,000 |
|
|
| 107,253,000 |
|
General and administrative |
|
| 65,210,000 |
|
|
| 63,296,000 |
|
|
| 59,350,000 |
|
Income before income taxes |
|
| 60,711,000 |
|
|
| 61,513,000 |
|
|
| 47,903,000 |
|
Income tax provision |
|
| 13,334,000 |
|
|
| 14,810,000 |
|
|
| 12,208,000 |
|
Net income |
| $ | 47,377,000 |
|
| $ | 46,703,000 |
|
| $ | 35,695,000 |
|
Net income per share: |
|
|
|
|
|
|
|
|
|
|
|
|
Basic |
| $ | 2.59 |
|
| $ | 2.48 |
|
|
| 1.90 |
|
Diluted |
| $ | 2.55 |
|
| $ | 2.46 |
|
|
| 1.87 |
|
Weighted average shares outstanding: |
|
|
|
|
|
|
|
|
|
|
|
|
Basic |
|
| 18,326,000 |
|
|
| 18,794,000 |
|
|
| 18,825,000 |
|
Diluted |
|
| 18,602,000 |
|
|
| 19,008,000 |
|
|
| 19,042,000 |
|
See accompanying notes to consolidated financial statements.
CONSOLIDATED STATEMENTS OF STOCKHOLDERS’ EQUITY
Fiscal Years Ended March 31, 2014, 20152020, 2019 and 20162018
| Common Shares | Stock Amount | Paid-in-Capital | Treasury Shares | Treasury Stock | Retained Earnings | Total Stockholders’ Equity | ||||||||||||||||||||||
Balance – March 31, 2013 | 52,837,262 | $ | 3,000 | $ | 110,924,000 | (31,317,014 | ) | $ | (301,301,000 | ) | $ | 301,776,000 | $ | 111,402,000 | ||||||||||||||
Stock issued under employee stock purchase plan | 8,489 | — | 346,000 | — | — | — | 346,000 | |||||||||||||||||||||
Stock issued under stock option plan, net of shares repurchased | 281,115 | — | 3,386,000 | — | — | — | 3,386,000 | |||||||||||||||||||||
Stock-based compensation expense | — | — | 2,140,000 | — | — | — | 2,140,000 | |||||||||||||||||||||
Income tax benefits from stock option exercises | — | — | 2,035,000 | — | — | — | 2,035,000 | |||||||||||||||||||||
| Purchase of treasury stock | — | — | — | (830,460 | ) | (27,179,000 | ) | — | (27,179,000 | ) | ||||||||||||||||||
| Net income | — | — | — | — | — | 34,392,000 | 34,392,000 | |||||||||||||||||||||
|
|
|
|
|
|
|
|
|
|
|
|
|
| |||||||||||||||
| Balance – March 31, 2014 | 53,126,866 | 3,000 | 118,831,000 | (32,147,474 | ) | (328,480,000 | ) | 336,168,000 | 126,522,000 | |||||||||||||||||||
|
|
|
|
|
|
|
|
|
|
|
|
|
| |||||||||||||||
Stock issued under employee stock purchase plan | 12,299 | — | 400,000 | — | — | — | 400,000 | |||||||||||||||||||||
Stock issued under stock option plan, net of shares repurchased | 103,992 | — | 1,603,000 | — | — | — | 1,603,000 | |||||||||||||||||||||
Stock-based compensation expense | — | — | 2,209,000 | — | — | — | 2,209,000 | |||||||||||||||||||||
Income tax benefits from stock option exercises | — | — | 397,000 | — | — | — | 397,000 | |||||||||||||||||||||
Purchase of treasury stock | — | — | — | (845,014 | ) | (31,798,000 | ) | — | (31,798,000 | ) | ||||||||||||||||||
Net income | — | — | — | — | — | 28,590,000 | 28,590,000 | |||||||||||||||||||||
|
|
|
|
|
|
|
|
|
|
|
|
|
| |||||||||||||||
Balance – March 31, 2015 | 53,243,157 | 3,000 | 123,440,000 | (32,992,488 | ) | (360,278,000 | ) | 364,758,000 | 127,923,000 | |||||||||||||||||||
|
|
|
|
|
|
|
|
|
|
|
|
|
| |||||||||||||||
Stock issued under employee stock purchase plan | 10,975 | — | 371,000 | — | — | — | 371,000 | |||||||||||||||||||||
Stock issued under stock option plan, net of shares repurchased | 194,540 | — | 3,749,000 | — | — | — | 3,749,000 | |||||||||||||||||||||
Stock-based compensation expense | — | — | 2,192,000 | — | — | — | 2,192,000 | |||||||||||||||||||||
Income tax benefits from stock option exercises | — | — | 713,000 | — | — | — | 713,000 | |||||||||||||||||||||
Purchase of treasury stock | — | — | — | (893,771 | ) | (31,525,000 | ) | — | (31,525,000 | ) | ||||||||||||||||||
| Net income | — | — | — | — | — | 28,525,000 | 28,525,000 | |||||||||||||||||||||
|
|
|
|
|
|
|
|
|
|
|
|
|
| |||||||||||||||
Balance – March 31, 2016 | 53,448,672 | $ | 3,000 | $ | 130,465,000 | (33,886,259 | ) | $ | (391,803,000 | ) | $ | 393,283,000 | $ | 131,948,000 | ||||||||||||||
|
|
|
|
|
|
|
|
|
|
|
|
|
| |||||||||||||||
|
| Common Shares |
|
| Stock Amount |
|
| Paid-in-Capital |
|
| Treasury Shares |
|
| Treasury Stock |
|
| Retained Earnings |
|
| Total Stockholders' Equity |
| |||||||
Balance – March 31, 2017 |
|
| 53,569,067 |
|
| $ | 3,000 |
|
| $ | 135,683,000 |
|
|
| (34,631,834 | ) |
| $ | (419,802,000 | ) |
| $ | 422,762,000 |
|
| $ | 138,646,000 |
|
Stock issued under employee stock purchase plan |
|
| 8,976 |
|
|
| — |
|
|
| 458,000 |
|
|
| — |
|
|
| — |
|
|
| — |
|
|
| 458,000 |
|
Stock issued under stock option plan, net of shares repurchased |
|
| 215,943 |
|
|
| — |
|
|
| 3,426,000 |
|
|
| — |
|
|
| — |
|
|
| — |
|
|
| 3,426,000 |
|
Stock-based compensation expense |
|
| — |
|
|
| — |
|
|
| 3,164,000 |
|
|
| — |
|
|
| — |
|
|
| — |
|
|
| 3,164,000 |
|
Purchase of treasury stock |
|
| — |
|
|
| — |
|
|
| — |
|
|
| (249,245 | ) |
|
| (11,187,000 | ) |
|
| — |
|
|
| (11,187,000 | ) |
Adjustment to deferred income taxes for prior year's stock options |
|
| — |
|
|
| — |
|
|
| 974,000 |
|
|
| — |
|
|
| — |
|
|
| — |
|
|
| 974,000 |
|
Net income |
|
| — |
|
|
| — |
|
|
| — |
|
|
| — |
|
|
| — |
|
|
| 35,695,000 |
|
|
| 35,695,000 |
|
Balance – March 31, 2018 |
|
| 53,793,986 |
|
|
| 3,000 |
|
|
| 143,705,000 |
|
|
| (34,881,079 | ) |
|
| (430,989,000 | ) |
|
| 458,457,000 |
|
|
| 171,176,000 |
|
Stock issued under employee stock purchase plan |
|
| 8,271 |
|
|
| — |
|
|
| 503,000 |
|
|
| — |
|
|
| — |
|
|
| — |
|
|
| 503,000 |
|
Stock issued under stock option plan, net of shares repurchased |
|
| 218,775 |
|
|
| — |
|
|
| 7,241,000 |
|
|
| — |
|
|
| — |
|
|
| — |
|
|
| 7,241,000 |
|
Stock-based compensation expense |
|
| — |
|
|
| — |
|
|
| 4,349,000 |
|
|
| — |
|
|
| — |
|
|
| — |
|
|
| 4,349,000 |
|
Purchase of treasury stock |
|
| — |
|
|
| — |
|
|
| — |
|
|
| (582,159 | ) |
|
| (35,167,000 | ) |
|
| — |
|
|
| (35,167,000 | ) |
Net income |
|
| — |
|
|
| — |
|
|
| — |
|
|
| — |
|
|
| — |
|
|
| 46,703,000 |
|
|
| 46,703,000 |
|
Balance – March 31, 2019 |
|
| 54,021,032 |
|
|
| 3,000 |
|
|
| 155,798,000 |
|
|
| (35,463,238 | ) |
|
| (466,156,000 | ) |
|
| 505,160,000 |
|
|
| 194,805,000 |
|
Stock issued under employee stock purchase plan |
|
| 8,451 |
|
|
| — |
|
|
| 505,000 |
|
|
| — |
|
|
| — |
|
|
| — |
|
|
| 505,000 |
|
Stock issued under stock option plan, net of shares repurchased |
|
| 225,074 |
|
|
| — |
|
|
| 8,147,000 |
|
|
| — |
|
|
| — |
|
|
| — |
|
|
| 8,147,000 |
|
Stock-based compensation expense |
|
| — |
|
|
| — |
|
|
| 4,485,000 |
|
|
| — |
|
|
| — |
|
|
| — |
|
|
| 4,485,000 |
|
Purchase of treasury stock |
|
| — |
|
|
| — |
|
|
| — |
|
|
| (822,353 | ) |
|
| (65,608,000 | ) |
|
| — |
|
|
| (65,608,000 | ) |
Net income |
|
| — |
|
|
| — |
|
|
| — |
|
|
| — |
|
|
| — |
|
|
| 47,377,000 |
|
|
| 47,377,000 |
|
Balance – March 31, 2020 |
|
| 54,254,557 |
|
| $ | 3,000 |
|
| $ | 168,935,000 |
|
|
| (36,285,591 | ) |
| $ | (531,764,000 | ) |
| $ | 552,537,000 |
|
| $ | 189,711,000 |
|
See accompanying notes to consolidated financial statements.
CONSOLIDATED STATEMENTS OF CASH FLOWS
| Fiscal Years Ended March 31, |
| Fiscal Years Ended March 31, |
| |||||||||||||||||||||
| 2014 | 2015 | 2016 |
| 2020 |
|
| 2019 |
|
| 2018 |
| |||||||||||||
CASH FLOWS FROM OPERATING ACTIVITIES |
|
|
|
|
|
|
|
|
|
|
|
| ||||||||||||
Net income | $ | 34,392,000 | $ | 28,590,000 | $ | 28,525,000 |
| $ | 47,377,000 |
|
| $ | 46,703,000 |
|
| $ | 35,695,000 |
| ||||||
Adjustments to reconcile net income to net cash provided by operating activities: |
|
|
|
|
|
|
|
|
|
|
|
| ||||||||||||
Depreciation and amortization | 16,411,000 | 17,995,000 | 19,952,000 |
|
| 22,516,000 |
|
|
| 22,984,000 |
|
|
| 21,775,000 |
| |||||||||
Loss on write down or disposal of property or capitalized software | 78,000 | 285,000 | 286,000 | |||||||||||||||||||||
Stock-based compensation expense | 2,140,000 | 2,209,000 | 2,192,000 | |||||||||||||||||||||
Loss on write down or disposal of property, capitalized software or investment |
|
| 149,000 |
|
|
| 306,000 |
|
|
| 1,199,000 |
| ||||||||||||
Stock compensation expense |
|
| 4,485,000 |
|
|
| 4,349,000 |
|
|
| 3,164,000 |
| ||||||||||||
Provision for doubtful accounts | 1,332,000 | 1,730,000 | 1,357,000 |
|
| 1,606,000 |
|
|
| 1,875,000 |
|
|
| 2,559,000 |
| |||||||||
Provision for deferred income taxes | (2,519,000 | ) | 304,000 | (1,656,000 | ) | |||||||||||||||||||
Deferred income taxes |
|
| 1,470,000 |
|
|
| 1,456,000 |
|
|
| (874,000 | ) | ||||||||||||
Changes in operating assets and liabilities: |
|
|
|
|
|
|
|
|
|
|
|
| ||||||||||||
Accounts receivable | (9,456,000 | ) | (2,038,000 | ) | (3,567,000 | ) |
|
| 3,964,000 |
|
|
| (8,271,000 | ) |
|
| (4,658,000 | ) | ||||||
Customer deposits | (6,035,000 | ) | (1,176,000 | ) | (8,331,000 | ) |
|
| (3,723,000 | ) |
|
| (9,772,000 | ) |
|
| (3,025,000 | ) | ||||||
Prepaid expenses and taxes | 1,556,000 | (5,813,000 | ) | 6,742,000 | ||||||||||||||||||||
Prepaid expenses and income taxes |
|
| (3,834,000 | ) |
|
| (66,000 | ) |
|
| (2,166,000 | ) | ||||||||||||
Other assets | 159,000 | (18,000 | ) | (516,000 | ) |
|
| (595,000 | ) |
|
| 145,000 |
|
|
| 545,000 |
| |||||||
Accounts and taxes payable | 2,535,000 | (2,695,000 | ) | (2,537,000 | ) | |||||||||||||||||||
Accounts and income taxes payable |
|
| 1,095,000 |
|
|
| (1,975,000 | ) |
|
| (3,130,000 | ) | ||||||||||||
Accrued liabilities | 14,207,000 | 4,943,000 | 8,864,000 |
|
| 11,885,000 |
|
|
| 20,905,000 |
|
|
| 11,068,000 |
| |||||||||
|
|
| ||||||||||||||||||||||
Operating lease liabilities |
|
| (5,569,000 | ) |
|
| — |
|
|
| — |
| ||||||||||||
Net cash provided by operating activities | 54,800,000 | 44,316,000 | 51,311,000 |
|
| 80,826,000 |
|
|
| 78,639,000 |
|
|
| 62,152,000 |
| |||||||||
|
|
| ||||||||||||||||||||||
CASH FLOWS FROM INVESTING ACTIVITIES |
|
|
|
|
|
|
|
|
|
|
|
| ||||||||||||
Investment in private equity | — | (1,400,000 | ) | (600,000 | ) | |||||||||||||||||||
Purchases of property and equipment | (18,344,000 | ) | (22,868,000 | ) | (16,756,000 | ) |
|
| (32,360,000 | ) |
|
| (15,274,000 | ) |
|
| (27,689,000 | ) | ||||||
|
|
| ||||||||||||||||||||||
Net cash used in investing activities | (18,344,000 | ) | (24,268,000 | ) | (17,356,000 | ) |
|
| (32,360,000 | ) |
|
| (15,274,000 | ) |
|
| (27,689,000 | ) | ||||||
|
|
| ||||||||||||||||||||||
CASH FLOWS FROM FINANCING ACTIVITIES |
|
|
|
|
|
|
|
|
|
|
|
| ||||||||||||
Exercise of employee stock purchase options | 346,000 | 400,000 | 371,000 |
|
| 505,000 |
|
|
| 503,000 |
|
|
| 458,000 |
| |||||||||
Exercise of common stock options | 3,386,000 | 1,603,000 | 3,749,000 |
|
| 8,147,000 |
|
|
| 7,241,000 |
|
|
| 3,426,000 |
| |||||||||
Tax benefits from stock options | 2,035,000 | 397,000 | 713,000 | |||||||||||||||||||||
Purchase of treasury stock | (27,179,000 | ) | (31,798,000 | ) | (31,525,000 | ) |
|
| (65,608,000 | ) |
|
| (35,167,000 | ) |
|
| (11,187,000 | ) | ||||||
|
|
| ||||||||||||||||||||||
Net cash used in financing activities | (21,412,000 | ) | (29,398,000 | ) | (26,692,000 | ) |
|
| (56,956,000 | ) |
|
| (27,423,000 | ) |
|
| (7,303,000 | ) | ||||||
|
|
| ||||||||||||||||||||||
Net increase (decrease) in cash and cash equivalents | 15,044,000 | (9,350,000 | ) | 7,263,000 | ||||||||||||||||||||
Net (decrease) increase in cash and cash equivalents |
|
| (8,490,000 | ) |
|
| 35,942,000 |
|
|
| 27,160,000 |
| ||||||||||||
Cash and cash equivalents at beginning of year | 19,822,000 | 34,866,000 | 25,516,000 |
|
| 91,713,000 |
|
|
| 55,771,000 |
|
|
| 28,611,000 |
| |||||||||
|
|
| ||||||||||||||||||||||
CASH AND CASH EQUIVALENTS AT END OF YEAR | $ | 34,866,000 | $ | 25,516,000 | $ | 32,779,000 |
| $ | 83,223,000 |
|
| $ | 91,713,000 |
|
| $ | 55,771,000 |
| ||||||
|
|
| ||||||||||||||||||||||
Supplemental cash flow information |
|
|
|
|
|
|
|
|
|
|
|
| ||||||||||||
Income taxes paid | $ | 20,791,000 | $ | 19,528,000 | $ | 13,589,000 |
| $ | 15,077,000 |
|
| $ | 12,854,000 |
|
| $ | 16,229,000 |
| ||||||
Accrual of software license purchase | $ | 2,343,000 | $ | — | $ | 3,249,000 |
| $ | 3,790,000 |
|
| $ | — |
|
| $ | 1,746,000 |
| ||||||
Tenant improvement allowance | $ | — | $ | 3,100,000 | $ | — | ||||||||||||||||||
See accompanying notes to consolidated financial statements.
NOTES TO CONSOLIDATED FINANCIAL STATEMENTS
Fiscal Years Ended March 31, 2014, 20152020, 2019 and 20162018
Note A1 — Summary of Significant Accounting Policies
Organization: CorVel Corporation (“CorVel” or “the Company”), incorporated in Delaware in 1987, providesis an independent nationwide provider of medical cost containment and managed care services and programs nationwide that are designed to enable insurance carriers, third party administrators and employers with self-insured programs to administer, manage and controladdress the costescalating medical costs of workers’ compensation benefits, automobile insurance claims, and other healthcaregroup health insurance benefits. The Company provides case management, claims administration,Company’s services are provided to insurance companies, TPAs, governmental entities, and self-administered employers to assist them in managing the medical bill review services to these payors.costs and monitoring the quality of care associated with healthcare claims.
The Company evaluated all subsequent events or transactions through the date of this filing. During the period subsequent to March 31, 2016, through the date of filing this report, the Company repurchased 26,555 shares of common stock for $1.1 million or an average of $42.71 per share. These shares were repurchased under the Company’s ongoing share repurchase program described in Note G.
Basis of Presentation: The consolidated financial statements include the accounts of CorVel and its wholly-owned subsidiaries. Significant intercompany accounts and transactions have been eliminated in consolidation. Certain prior year amounts have been reclassified to conform to fiscal 20162020 presentation. These changes had no impact on previously reportedpreviously-reported results of operations or shareholders’ equity.
The Company evaluated all subsequent events and transactions through the date of this filing.
Use of Estimates: The preparation of financial statements in compliance with accounting principles generally accepted in the United States of AmericaGAAP requires management to make estimates and assumptions that affect the amounts reported in the accompanying consolidated financial statements. Actual results could differ from those estimates. Significant estimates include the values assigned to intangible assets, capitalized software development, the allowance for doubtful accounts, accrual for income taxes, share-based payments related to performance basedperformance-based awards, loss contingencies, estimated lives of claims for claims administration revenue recognition, estimates used in stock options valuations, and accrual for self-insurance reserves.
Cash and Cash Equivalents: Cash and cash equivalents consist of short-term, interest-bearing highly-liquid investment-grade securities with maturities of 90 days or less when purchased. The carrying amounts of the Company’s financial instruments approximate their fair values at March 31, 20152020 and 20162019 due to the short-term nature of those instruments. Customer deposits represent cash that is expected to be returned or applied towards payment within one year through the Company’s provider reimbursement services.
Fair Value of Financial Instruments: The Company applies ASC 820, “Fair Value Measurements and Disclosures,” which defines fair value, establishes a framework for measuring fair value, and provides for disclosures about fair value measurements, with respect to fair value measurements of (a)(i) nonfinancial assets and liabilities that are recognized or disclosed at fair value in the Company’s Consolidated Financial Statementsconsolidated financial statements on a recurring basis (at least annually) and (b)(ii) all financial assets and liabilities. ASC 820 prioritizes the inputs used in measuring fair value into the following hierarchy:
Level 1Quoted market prices in active markets for identical assets or liabilities;
Level 2Observable inputs other than those included in Level 1 (for example, quoted prices for similar assets in active markets or quoted prices for identical assets in inactive markets); and
Level 3Unobservable inputs reflecting management’s own assumptions about the inputs used in estimating the value of the asset.
The carrying amount of the Company’s financial instruments (i.e. cash and cash equivalents, accounts receivable, accounts payable, etc.) are all Level 1, and approximatethe Company believes their respective carrying values approximates their fair values at March 31, 20152020 and 20162019 due to the short-term nature of those instruments. The Company has no Level 2 or Level 3 assets.
CORVEL CORPORATION
NOTES TO CONSOLIDATED FINANCIAL STATEMENTS
Fiscal Years Ended March 31, 2014, 2015 and 2016
Note A — Summary of Significant Accounting Policies (continued)
Investment in Private Equity: During the quarter ended June 30, 2014, the Company’s Board of Director’s approved The Company has made an investment of $2,000,000$2,250,000 into a private equity limited partnership (the “partnership”) that invests in start-up companies. The Company invested $1,400,000 intocompanies primarily in the partnership during the fiscal year ended March 31, 2015 and the remaining $600,000 was invested during the quarter ended June 30, 2015.data analytics industry. The Company accounts for the investment onusing the cost minus impairment method, and will periodically review the investment for possible impairment. There was no impairment recorded on investment for fiscal year ended March 31, 2016.plus or minus any changes resulting from observable price changes in orderly transactions. The investment is recorded in other assets on the accompanying consolidated balance sheets. Management has not identified events or changes in circumstances that may have a significant adverse effect on the fair value of the investment, and in accordance with ASC 825-10-50-16 through 50-19, itIt is not practicable to estimate the fair value of the investment.investment due to the fact that the investment is in a diversified portfolio of companies whose shares are not traded in public markets.
Revenue Recognition: The Company recognizes revenueadopted ASC 606 using the modified retrospective method for those contracts which were not substantially completed as of the transition date, which was April 1, 2018. The reported results for the fiscal years ended March 31, 2020 and 2019 reflect the application of the guidance of ASC 606.
Revenue is recognized when therecontrol of the promised services is persuasive evidence of an arrangement, the services have been providedtransferred to the customer,Company’s customers in an amount that reflects the sales price is fixed or determinable, and collectability is reasonably assured. Forconsideration expected to be entitled to in exchange for those services. As the Company completes its performance obligations which are identified in Note 2, it has an unconditional right to consideration as outlined in the Company’s services, ascontracts. Generally, the Company’s professional staff performs work, theyaccounts receivable are contractually permittedexpected to bill for fees earnedbe collected in fraction of an hour increments worked or by units of production. The Company recognizes revenue as the time is worked or as units of production are completed, which is when the revenue is earned and realized. Labor costs are recognized as the costs are incurred. The Company derives the majority of its revenue from the sale of Network Solutions and Patient Management services. Network Solutions and Patient Management services may be sold individually or combined with any of the services the Company provides. When a sale combines multiple elements, the Company accounts for multiple element arrangements30 days in accordance with the guidance included in ASC 605-25.
Management evaluates agreements with customers in accordance with the provisionunderlying payment terms. For many of the revenue recognition topic that addresses multiple-deliverable revenue arrangements.Company’s services, the Company typically has one performance obligation; however, it also provides the customer with an option to acquire additional services. The multiple-deliverable arrangements entered into consist of bundled managed care which included various units of accounting such asCompany offers multiple services under its patient management and network solutions service lines. The Company typically provides a menu of offerings from which the customer may choose to purchase. The price of each service is separate and patient management which includes claims administration. Such elements are considereddistinct and provides a separate units of accounting due to each element havingand distinct value to the customer on a stand-alone basis. The selling pricecustomer. Pricing is generally consistent for each unitservice irrespective of accounting is determined using contract pricethe other services or quantities requested by the customer.
In transactions related to third-party service revenue, which includes pharmacy, directed care services and management estimates. Whenother services provided by the Company’s customers purchase several productsintegrated network solutions services, the pricingCompany is considered the principal, as it directs the third party, controls the specified service, performs program utilization review, directs payment to the provider, accepts the financial risk of loss associated with services rendered and combines the products sold is generallyservices provided into an integrated solution, as specified within the same as if the product were sold on an individual basis. Revenue is recognized as the work is performed in accordance with ourCompany’s customer contracts. Based uponThe Company has the natureability to influence contractual fees with customers and possesses the financial risk of loss in certain contractual obligations. These factors indicate the Company is the principal and, as such, it is required to recognize revenue gross and service partner vendor fees in the cost of revenue in the Company’s products, bundled managed care elements are generally delivered in the same accounting period. The Company recognizes revenue for patient management claims administration services over the life of the claim. The Company estimates, based upon prior experience in managing claims, the deferral amount from when the claim is received to when the customer contract expires.consolidated income statements.
Accounts Receivable: The majority of the Company’s accounts receivable are due from companies in the property and casualty insurance industries, self-insured employers and governmental entities. Credit is extended based on evaluation of a customer’s financial condition and, generally, collateral is not required. Accounts receivable are generally due within 30 days and are stated at amounts due from customers net of an allowance for doubtful accounts. Those accounts outstanding longer than the contractual payment terms are considered past due. The Company determines its allowance by considering a number of factors, including the length of time trade accounts receivable are past due, the Company’s previous loss history, the customer’s current ability to pay its obligation to the Company, and the condition of the general economy and the industry as a whole. The Company writes off accounts receivable against the reserve when they become uncollectible. Accounts receivable includes $12,357,000,$19,692,000, and $12,066,000$18,434,000 of unbilled receivables at March 31, 20152020 and 2016,2019, respectively. Unbilled receivables represent the revenue for the work performed which has not yet been invoiced to the customer. Unbilled receivables are generally invoiced within the following three months.
CORVEL CORPORATION
NOTES TO CONSOLIDATED FINANCIAL STATEMENTS
Fiscal Years Ended March 31, 2014, 2015 and 2016
Note A — Summary of Significant Accounting Policies (continued)
Concentrations of Credit Risk:Substantially all of the Company’s customers are payors of workers’ compensation benefits and property and casualty insurance, which include insurance companies, third party administrators, self-insured employers and government entities. Receivables are generally due within 30 days. Credit losses relating to customers in the workers’ compensation insurance industry consistently have been within management’s expectations. Virtually all of the Company’s cash is invested at financial institutions in amounts which exceed the FDIC insurance levels. No customer accounted for 10% or more of revenue for either fiscal 2014, 2015,2020, 2019 or 2016.2018. No customer accounted for 10% or more of accounts receivable at either March 31, 20152020 or 2016.2019.
Property and Equipment: Additions to property and equipment are recorded at cost. The Company provides for depreciation on property and equipment using the straight-line method by charges to operations in amounts that allocate the cost of depreciable assets over their estimated lives as follows:
Asset Classification | Building Building Improvements Land Improvements | Estimated Useful Life 40 years 20 years 20 years |
Leasehold Improvements | Shorter of | |
Furniture and Equipment | 5 to | |
Computer Hardware | 2 to | |
Computer Software | 3 to |
The Company accounts for internally developedinternally-developed software costs in accordance with ASC 350-40, “Internal — Use Software”. Capitalized software development costs, intended for internal use, totaled $21,327,000$27,859,000 (net of $61,012,000$109,749,000 in accumulated amortization) and $25,140,000$27,552,000 (net of $69,644,000$99,045,000 in accumulated amortization), as of March 31, 20152020 and 2016,2019, respectively. These costs are included in computer software in property and equipment and are amortized over a period of five years.
Long-Lived Assets: The carrying amount of all long-lived assets is evaluated periodically to determine if adjustment to the depreciation and amortization period or to the unamortized balance is warranted. Such evaluation is based principally on the expected utilization of the long-lived assets and the projected, undiscounted cash flows of the operations in which the long-lived assets are deployed.
Goodwill and Indefinite Lived Long-Lived Assets: The Company accounts for its business combinations in accordance with the Financial Accounting Standards Board (“FASB”) ASC 805-10 through ASC 805-50, “Business Combinations”Combinations,” which (i) requires that the purchase method of accounting be applied to all business combinations and (ii) addresses the criteria for initial recognition of intangible assets and goodwill. In accordance with FASB ASC 350-10 through ASC 350-30, goodwill and other intangible assets with indefinite lives are not amortized but are tested for impairment annually, or more frequently if circumstances indicate the possibility of impairment. If the carrying value of goodwill or an intangible asset exceeds its fair value, an impairment loss shallwill be recognized. Based on the Company’s tests and reviews, no impairment of its goodwill, intangible assets or other long-lived assets existed at March 31, 2016.2020. However, future events or changes in current circumstances could affect the recoverability of the carrying value of goodwill and long-lived assets. Should an asset be deemed impaired, an impairment loss would be recognized to the extent the carrying value of the asset exceeded its estimated fair value. Goodwill amounted to $36,814,000 (net of accumulated amortization of $2,069,000) at March 31, 20152020 and at March 31, 2016.2019.
Cost of revenues:Revenues:Cost of services consists primarily of the compensation and fringe benefits of field personnel, including managers, medical bill analysts, field case managers, telephonic case managers, systems
CORVEL CORPORATION
NOTES TO CONSOLIDATED FINANCIAL STATEMENTS
Fiscal Years Ended March 31, 2014, 2015 and 2016
Note A — Summary of Significant Accounting Policies (continued)
support, administrative support, account managers and account executives, and related facility costs including rent, telephone and office supplies. Historically, the costs associated with these additional personnel and facilities have been the most significant factor driving increases in the Company’s cost of services.
Income Taxes:Taxes: The Company provides for income taxes in accordance with provisions specified in ASC 740, “Accounting for Income Taxes”. Accordingly, deferred income tax assets and liabilities are computed for differences between the financial statement and tax bases of assets and liabilities. These differences will result in taxable or deductible amounts in the future, based on tax laws and rates applicable to the periods in which the differences are expected to affect taxable income. The ultimate realization of deferred tax assets is dependent upon the generation of future taxable income during the periods in which temporary differences become deductible. In making an assessment regarding the probability of realizing a benefit from these deductible differences, management considers the Company’s current and past performance, the market environment in which the Company operates, tax-planning strategies and the length of carry-forward periods for loss carry-forwards, if any. Valuation allowances are established when necessary to reduce deferred tax assets to amounts that are more likely than not to be realized. Further, the Company accrues for income tax issues not yet resolved with federal, state and local tax authorities, when it appears more likely than not that a tax liability has been incurred.
Share-Based Compensation:The Company accounts for share-based compensation in accordance with the provisions of ASC Topic 718 “Compensation —– Stock Compensation”. Under ASC 718, share-based compensation cost is measured at the grant date, based on the calculated fair value of the award, and is recognized as an expense over the employee’s requisite service period (generally the vesting period of the equity grant). Share-basedThe Company issues performance-based stock options which vest only upon the Company’s achievement of certain earnings per share targets on a calendar year basis, as determined by the Company’s Board of Directors. These options were valued in the same manner as the time-based options. However, the Company only recognizes stock compensation expense is based on awards ultimately expected to vest; therefore, it has been reduced for estimated forfeitures. ASC Topic 718 requires forfeituresthe extent that the targets are determined to be estimated atprobable of being achieved, which triggers the timevesting of grant and revised, if necessary, in subsequent periods if actual forfeitures differ from those estimates.the performance options.
Accrual for Self-insurance Costs: The Company self-insures for the group medical costs and workers’ compensation costs of its employees. The Company purchases stop loss insurance for large claims. Management believes that the self-insurance reserves are appropriate; however, actual claims costs may differ from the original estimates requiring adjustments to the reserves. The Company determines its estimated self-insurance reserves based upon historical trends along with outstanding claims information provided by its claims paying agents.
Earnings Per Share:per Share: Earnings per common share-basic is based on the weighted average number of common shares outstanding during the period. Earnings per common shares-diluted is based on the weighted average number of common shares and common share equivalents outstanding during the period. In calculating earnings per share, earnings are the same for the basic and diluted calculations. Weighted average shares outstanding is greater for diluted earnings per share due to the effect of stock options.
The difference between the basic weighted average shares and the diluted weighted average shares for each of the three fiscal years ended March 31, 2014, 2015,2020, 2019 and 20162018 is as follows:
| Fiscal 2014 | Fiscal 2015 | Fiscal 2016 | ||||||||||
Basic weighted shares | 21,104,000 | 20,669,000 | 19,826,000 | |||||||||
Treasury stock impact of stock options | 268,000 | 221,000 | 178,000 | |||||||||
|
|
|
|
|
| |||||||
Diluted weighted shares | 21,372,000 | 20,890,000 | 20,004,000 | |||||||||
|
|
|
|
|
| |||||||
CORVEL CORPORATION
NOTES TO CONSOLIDATED FINANCIAL STATEMENTS
Fiscal Years Ended March 31, 2014, 2015 and 2016
Note A — Summary of Significant Accounting Policies��(continued)
|
| Fiscal 2020 |
|
| Fiscal 2019 |
|
| Fiscal 2018 |
| |||
Basic weighted average shares |
|
| 18,326,000 |
|
|
| 18,794,000 |
|
|
| 18,825,000 |
|
Treasury stock impact of stock options |
|
| 276,000 |
|
|
| 214,000 |
|
|
| 217,000 |
|
Diluted weighted average shares |
|
| 18,602,000 |
|
|
| 19,008,000 |
|
|
| 19,042,000 |
|
Recently Issued Accounting Standards
On May 28, 2014, the FASB issued ASU 2014-09 regarding ASC Topic 606,Revenue from Contracts with Customers. The standard provides principles for recognizing revenue for the transfer of promised goods or services to customers with the consideration to which the entity expects to be entitled in exchange for those goods or services. In July 2015, the FASB approved a one-year delay of the effective date of this new revenue recognition standard. The guidance will now be effective for our fiscal year beginning April 1, 2018. We are currently evaluating the accounting, transition and disclosure requirements of the standard and cannot currently estimate the financial statement impact of adoption.
On November 20, 2015, the FASB issued ASU 2015-17,Balance Sheet Classification of Deferred Taxes. ASU 2015-17 alters the presentation of deferred tax items on a classified balance sheet requiring companies to unify previously separated current and noncurrent items and present them as a single noncurrent amount. We have elected to early adopt this standard as of March 31st, 2016 and have retrospectively applied the amendments to all periods presented. As a result we reclassified $7,181,000 of current deferred tax assets to non-current deferred tax assets and netted $7,181,000 non-current deferred tax liabilities against our non-current deferred tax assets as of March 31, 2015.
In JanuaryJune 2016, the FASB issued ASU 2016-012016-13 regarding Subtopic 825-10,Financials Instruments — Overall: Recognition and MeasurementsASC Topic 326, “Measurement of Credit Losses on Financial Assets and Financial LiabilitiesInstruments”. The standard addresses certain aspectspronouncement changes the impairment model for most financial assets and will require the use of recognition, measurement, presentation, and disclosure of financial instruments. It requires that most equity investments bean "expected loss" model for instruments measured at fair value, with subsequent changesamortized cost. Under this model, entities will be required to estimate the lifetime expected credit loss on such instruments and record an allowance to offset the amortized cost basis of the financial asset, resulting in fair value recognized ina net income. The guidancepresentation of the amount expected to be collected on the financial asset. Subsequently, the FASB issued an amendment to clarify the implementation dates and items that fall within the scope of this pronouncement. This standard is effective for fiscal years andbeginning after December 15, 2019, including interim periods within those fiscal years. The adoption of this guidance will not have a material impact on our consolidated financial statements.
In January 2017, the FASB issued ASU 2017-04 regarding ASC Topic 350, “Simplifying the Test for Goodwill Impairment”. The pronouncement simplifies the accounting for goodwill impairments by eliminating step two from the goodwill impairment test. Under this guidance, if the carrying amount of a reporting unit exceeds its estimated fair value, an impairment charge shall be recognized in an amount equal to that excess, limited to the total amount of goodwill allocated to that reporting unit. This standard is effective for fiscal years beginning after December 15, 2017. We are currently2019, with early adoption permitted. The adoption of this guidance will not have a material impact on the Company’s consolidated financial statements.
In December 2019, the FASB issued ASU 2019-12, “Simplifying the Accounting for Income Taxes”. The pronouncement simplifies the accounting for income taxes by removing certain exceptions to the general principles in ASC Topic 740, “Income Taxes”. The pronouncement also improves consistent application of and simplify GAAP for other areas of Topic 740 by clarifying and amending existing guidance. This standard is effective for fiscal years beginning after December 15, 2020, with early adoption permitted. ��The Company is still evaluating the accounting, transition, and disclosure requirements of the standard and cannot currently estimate theimpact this guidance will have on its consolidated financial statement impact of adoption.statements.
Guidance Adopted
In February 2016, the FASB issued ASU No. 2016-02,Leases “Leases”, which sets out the principles for the recognition, measurement, presentation, and disclosure of leases for both parties to a contract (i.e. lessees and lessors). The standard requires lessees to apply a dual approach, classifying leases as either finance or operating leases. This classification will determine whether the lease expense is recognized based on an effective interest method or on a straight-line basis over the term of the lease. A lessee is also required to record a right-of-use asset and a lease liability for all leases with a term of greater than 12 months regardless of their classification. Leases with a term of 12 months or less will be accounted for using an approach that is similar to the existing guidance for operating leases. The new standard requires lessors to account for leases using an approach that is substantially equivalent to existing guidance for sales-type leases, direct financing leases and operating leases. The standard is effective January 1, 2019, with early adoption permitted. The standard is to be applied using a modified retrospective transition method. WeThe Company has adopted this standard as of April 1, 2019. The adoption of this standard did not have a material impact on retained earnings on the consolidated balance sheet and did not have a material impact on the consolidated statements of income. The Company elected the package of practical expedients permitted under the transition guidance within the new standard, which allowed the Company to carry forward the historical assessments of whether contracts are inor contain leases, lease classification, and initial direct costs. The Company implemented internal controls and key system functionality to enable the processpreparation of determiningfinancial information on adoption. Refer to Note 9 of the effect on ouraccompanying consolidated financial position, resultsstatements for a description of operations and cash flows.the impact of this adopted guidance.
On May 28, 2014, the FASB issued ASU 2014-09 regarding ASC Topic 606, “Revenue from Contracts with Customers” (“ASC 606”). This standard provides principles for recognizing revenue for the transfer of promised goods or services to customers with the consideration to which the entity expects to be entitled in exchange for those goods or services. In July 2015, the FASB approved a one-year delay of the effective date of this new revenue recognition standard. The Company has adopted this standard as of April 1, 2018. Refer to Note 2 of the accompanying consolidated financial statements for a description of the impact of the adopted guidance.
In MarchJanuary 2016, the FASB issued ASU 2016-01 regarding Subtopic 825-10, “Financials Instruments — Overall: Recognition and Measurements of Financial Assets and Financial Liabilities”. The standard addresses certain aspects of recognition, measurement, presentation, and disclosure of financial instruments. It requires that most equity investments be measured at fair value, with subsequent changes in fair value recognized in net income. The guidance is effective for fiscal years, and interim periods within those years, beginning after December 15, 2017. The Company adopted this guidance prospectively on April 1, 2018. The adoption of this guidance did not have a material impact on the Company’s consolidated financial statements.
In August 2016, the FASB issued ASU No. 2016-09,Improvements to Employee Share-Based Payment Accounting2016-15, “Statement of Cash Flows”, which simplifies several aspectsreduces diversity in the practice of the accounting for employee share-based paymenthow certain transactions including the accounting for income taxes, forfeitures, and statutory tax withholding requirements, as well as classification onare classified in the statement of cash flows. For public companies, theThe new guidance is effective for annual reporting periods (including interim periods within those periods) beginning after December 15, 2016,2017, with early adoption permitted. We are in the process of evaluating the impact ofThe Company adopted this guidance prospectively on April 1, 2018. The adoption of this guidance did not have a material impact on ourthe Company’s consolidated financial statements.
CORVEL CORPORATION
NOTES TO CONSOLIDATED FINANCIAL STATEMENTS
Fiscal Years EndedThe Company adopted ASC 606 using the modified retrospective method for those contracts which were not substantially completed as of the transition date, which was April 1, 2018. The reported results for the fiscal years ended March 31, 2014, 20152020 and 2016March 31, 2019 reflect the application of the guidance of ASC 606, while the reports results for the fiscal year ended March 31, 2018 reflect the application of ASC 605. There was no material impact to any of the line items within the Company’s Consolidated Statements of Income or Consolidated Balance Sheets as a result of applying ASC 606 for the fiscal year ended March 31, 2019.
Revenue from Contracts with Customers
Revenue is recognized when control of the promised services is transferred to the Company’s customers in an amount that reflects the consideration the Company expects to be entitled to in exchange for those services. As the Company completes its performance obligations which are identified below, it has an unconditional right to consideration as outlined in the Company’s contracts. Generally, the Company’s accounts receivable are expected to be collected in 30 days in accordance with the underlying payment terms.
The Company generates revenue through its patient management and network solutions service lines. The Company operates in one reportable operating segment, managed care.
Patient Management Service Line
The patient management service line provides services primarily related to workers’ compensation claims management and case management. This service line also includes additional services such as accident and health claims programs. Each claim referred by the customer is considered an additional optional purchase of claims management services under the agreement with the customer. The transaction price is readily available from the contract and is fixed for each service. Revenue is recognized over time as services are provided as the performance obligations are satisfied through the effort expended to research, investigate, evaluate, document, and report the claim and control of these services is transferred to the customer. Revenue is recognized based on historical claim closure rates and claim type applied utilizing a portfolio approach based on time elapsed for these claims, generally between three and fifteen months. The Company believes this approach reasonably reflects the transfer of the claims management services to its customer.
The Company’s obligation to manage claims and cases under the patient management service line can range from less than one year to multi-year contracts. They are generally one year under the terms of the contract; however, many of these contracts contain auto-renewal provisions and the Company’s customer relationships can span multiple years. Under certain claims management agreements, the Company receives consideration from a customer at contract inception prior to transferring services to the customer, however, the Company would begin performing services immediately. The period between a customer’s payment of consideration and the completion of the promised services is generally less than one year. There is no difference between the amount of promised consideration and the cash selling price of the promised services. The fee is billed upfront by the Company in order to provide customers with simplified and predictable ways of purchasing the Company’s services.
The patient management service line also offers the services of case managers who provide administration services by proactively managing medical treatment for claimants while facilitating an understanding of and participation in their rehabilitation process. Revenue for case management services is recognized over time as the performance obligations are satisfied through the effort expended to manage the medical treatment for claimants and control of these services is transferred to the customer. Case management services are generally billed based on time incurred, are considered variable consideration, and revenue is recognized at the amount in which the Company has the right to invoice for services performed. The Company believes this approach reasonably reflects the transfer of the case management service to the customer.
Network Solutions Service Line
The network solutions service line consists primarily of medical bill review and third-party services. Medical bill review services provide an analysis of medical charges for customers’ claims to identify opportunities for savings. Medical bill review services revenues are recognized at a point in time when control of the service is transferred to the customer. Revenue is recognized based upon the transfer of the results of the medical bill review service to the customer as this is the most accurate depiction of the transfer of the service to the customer. Medical bill review revenues are variable, generally based on performance metrics set forth in the underlying contracts. Each period, the Company bases its estimates on a contract-by-contract basis. The Company makes its best estimate of amounts the Company has earned and expects to be collected using historical averages and other factors to project such revenues. Variable consideration is recognized when the Company concludes that it is probable that a significant revenue reversal will not occur in future periods.
Third-party services revenue includes pharmacy, directed care services and other services, and includes amounts received from customers compensating the Company for certain third-party costs associated with providing its integrated network solutions services. The Company is considered the principal in these transactions as it directs the third party, controls the specified service, performs program utilization review, directs payment to the provider, accepts the financial risk of loss associated with services rendered and combines the services provided into an integrated solution, as specified within the Company’s customer contracts. The Company has the ability to influence contractual fees with customers and possesses the financial risk of loss in certain contractual obligations. These factors indicate the Company is the principal and, as such, it is required to recognize revenue gross and service partner vendor fees in the operating expense in the Company’s consolidated statements of income.
The following table presents revenues disaggregated by service line for the fiscal years ended March 31, 2020 and 2019:
|
| 2020 |
|
| 2019 |
| ||
Patient management services |
| $ | 386,814,000 |
|
| $ | 368,198,000 |
|
Network solutions services |
|
| 205,411,000 |
|
|
| 227,542,000 |
|
Total services |
| $ | 592,225,000 |
|
| $ | 595,740,000 |
|
Arrangements with Multiple Performance Obligations
For many of the Company’s services, the Company typically has one performance obligation; however, the Company also provides the customer with an option to acquire additional services. The Company offers multiple services under its patient management and network solutions service lines. The Company typically provides a menu of offerings from which the customer may choose to purchase. The price of each service is separate and distinct and provides a separate and distinct value to the customer. Pricing is generally consistent for each service irrespective of the other services or quantities requested by the customer.
Contract Balances
The timing of revenue recognition, billings and cash collections results in billed accounts receivables, unbilled receivables, and contract liabilities (reported as deferred revenues) on the Company’s consolidated balance sheets. Unbilled receivables are due to the Company unconditionally for services already rendered except for physical invoicing and the passage of time. Invoicing requirements vary by customer contract but substantially all unbilled revenues are billed within one year.
|
| March 31, 2020 |
|
| March 31, 2019 |
| ||
Billed receivables |
| $ | 51,208,000 |
|
| $ | 58,410,000 |
|
Allowance for doubtful accounts |
|
| (5,133,000 | ) |
|
| (5,508,000 | ) |
Unbilled receivables |
|
| 19,692,000 |
|
|
| 18,434,000 |
|
Accounts receivable, net |
| $ | 65,767,000 |
|
| $ | 71,336,000 |
|
When the Company receives consideration from a customer prior to transferring services to the customer under the terms of certain claims management agreements, it records deferred revenues on the Company’s consolidated balance sheets, which represents a contract liability.
Certain services, such as claims management, are provided under fixed-fee service agreements and require the Company to manage claims over a contract period, typically for one year with the option for auto renewal, with the fixed fee renewing on the anniversary date of such contracts. The Company recognizes deferred revenues as revenues when it performs services and transfers control of the services to the customer and satisfies the performance obligation which it determines utilizing a portfolio approach. For all fixed fee service agreements, revenues are recognized over the expected service periods by type of claim.
The table below presents the deferred revenues balance and the significant activity affecting deferred revenues during the fiscal year ended March 31, 2020:
|
| March 31, 2020 |
| |
Beginning balance at April 1, 2019 (Note 5) |
| $ | 16,900,000 |
|
Additions |
|
| 29,281,000 |
|
Revenue recognized from beginning of period |
|
| (8,482,000 | ) |
Revenue recognized from additions |
|
| (20,054,000 | ) |
Ending balance at March 31, 2020 (Note 5) |
| $ | 17,645,000 |
|
Remaining Performance Obligations
As of March 31, 2020, the Company had $17.6 million of remaining performance obligations related to claims and non-claims services for which the price is fixed. Remaining performance obligations consist of deferred revenues. The Company expects to recognize approximately 97% of its remaining performance obligations as revenues within one year and the remaining balance thereafter. See the discussion below regarding the practical expedients elected for the disclosure of remaining performance obligations.
Costs to Obtain a Contract
The Company has an internal sales force compensation program where remuneration is based solely on the revenues recognized in the period and does not represent an incremental cost to the Company which provides a future benefit expected to be longer than one year and would meet the criteria to be capitalized and presented as unbilled receivables on the Company’s consolidated balance sheets.
Practical Expedients Elected
As a practical expedient, the Company does not adjust the consideration in a contract for the effects of a significant financing component. It expects, at contract inception, that the period between a customer’s payment of consideration and the transfer of promised services to the customer will be one year or less.
For patient management services that are billed on a time-and-expense incurred or per unit basis and for which revenue is recognized over time, the Company recognizes revenue at the amount to which it has the right to invoice for services performed.
The Company does not disclose the value of remaining performance obligations for (i) contracts for which it recognizes revenue at the amount to which it has the right to invoice for services performed, and (ii) contracts with variable consideration allocated entirely to a single performance obligation.
Note B3 — Stock Options and Stock-Based Compensation
Under the Company’s Restated Omnibus Incentive Plan (Formerly The(formerly the Restated 1988 Executive Stock Option Plan) (“the Plan”) as in effect at March 31, 2016,2020, options exercisable for up to 19,365,00019,865,000 shares of the Company’s common stock may be granted over the life of the Plan to key employees, non-employee directors, and consultants at exercise prices not less than the fair market value of the common stock aton the date of grant. Options granted under the Plan are non-statutory stock options and generally vest 25% one year from the date of grant, andwith the remaining 75% vesting ratably each month for the next 36 months. The options granted to employees and the boardCompany’s Board of directorsDirectors expire at the end of five years and ten years from date of grant, respectively. All options granted in fiscal 2020 and 2019 were granted with an exercise price equal to the fair value of the Company’s common stock on the grant date.
The Company records compensation expense for employee stock options based on the estimated fair value of the options on the date of grant using the Black-Scholes option-pricing model with the assumptions included in the table below. The Company uses historical data, among other factors, to estimate the expected volatility, the expected option life,dividend yield, and the expected forfeiture rate.option life. Upon adoption of ASU 2016-09, the Company accounts for forfeitures as they occur, rather than estimate expected forfeitures. The risk-free rate is based on the interest rate paid on a U.S. Treasury issue with a term similar to the estimated life of the option. During fiscal 2016, based upon the historical experience of option cancellations, the Company has an estimated annualized forfeiture rate of 12.2%. Forfeiture rates will be adjusted over the requisite service period when actual forfeitures differ, or are expected to differ, from the estimate.
The fair value of each grant is estimated on the date of grant using the Black-Scholes option-pricing model. The following weighted average assumptions were used for the fiscal years ended March 31, 2014, 20152020, 2019 and 2016:2018:
| Fiscal 2014 | Fiscal 2015 | Fiscal 2016 |
| Fiscal 2020 |
|
| Fiscal 2019 |
|
| Fiscal 2018 |
| |||||||||||||
Expected volatility | 47% | 45% | 43% |
|
| 33 | % |
|
| 34 | % |
|
| 40 | % | |||||||||
Risk free interest rate | 0.7% to 1.5% | 1.3% to 1.7% | 1.25% to 1.65% |
| 1.42% to 2.33% |
|
| 2.46% to 2.96% |
|
| 1.88% to 2.56% |
| ||||||||||||
Dividend yield | 0.0% | 0.0% | 0.0% |
|
| 0.0 | % |
|
| 0.0 | % |
|
| 0.0 | % | |||||||||
Weighted average option life | 4.4 to 4.5 years | 4.4 to 4.5 years | 4.4 to 4.5 years |
| 4.4 to 4.5 years |
|
| 4.4 to 4.5 years |
|
| 4.4 to 4.5 years |
| ||||||||||||
For the fiscal years ended March 31, 2014, 20152020, 2019 and 2016,2018, the Company recorded share-based compensation expense of $2,140,000, $2,209,000,$4,485,000, $4,349,000, and $2,192,000,$3,164,000, respectively. The table below shows the amounts recognized in the financial statements for the fiscal years ended March 31, 2014, 20152020, 2019 and 2016.2018.
| Fiscal 2014 | Fiscal 2015 | Fiscal 2016 | ||||||||||
Cost of revenue | $ | 672,000 | $ | 1,021,000 | $ | 1,288,000 | ||||||
General and administrative | 1,468,000 | 1,188,000 | 904,000 | |||||||||
|
|
|
|
|
| |||||||
Total cost of stock-based compensation included in income before income tax | 2,140,000 | 2,209,000 | 2,192,000 | |||||||||
Amount of income tax benefit recognized | 835,000 | 862,000 | 852,000 | |||||||||
|
|
|
|
|
| |||||||
Amount charged to net income | $ | 1,305,000 | $ | 1,347,000 | $ | 1,340,000 | ||||||
|
|
|
|
|
| |||||||
Effect on basic earnings per share | $ | 0.06 | $ | 0.07 | $ | 0.07 | ||||||
|
|
|
|
|
| |||||||
Effect on diluted earnings per share | $ | 0.06 | $ | 0.06 | $ | 0.07 | ||||||
|
|
|
|
|
| |||||||
CORVEL CORPORATION
NOTES TO CONSOLIDATED FINANCIAL STATEMENTS
Fiscal Years Ended March 31, 2014, 2015 and 2016
Note B — Stock Options and Stock-Based Compensation (continued)
|
| Fiscal 2020 |
|
| Fiscal 2019 |
|
| Fiscal 2018 |
| |||
Cost of revenue |
| $ | 2,028,000 |
|
| $ | 1,896,000 |
|
| $ | 1,749,000 |
|
General and administrative |
|
| 2,457,000 |
|
|
| 2,453,000 |
|
|
| 1,415,000 |
|
Total cost of stock-based compensation included in income before income taxes |
|
| 4,485,000 |
|
|
| 4,349,000 |
|
|
| 3,164,000 |
|
Amount of income tax benefit recognized |
|
| 985,000 |
|
|
| 1,048,000 |
|
|
| 1,105,000 |
|
Amount charged to net income |
| $ | 3,500,000 |
|
| $ | 3,301,000 |
|
| $ | 2,059,000 |
|
Effect on basic earnings per share |
| $ | 0.19 |
|
| $ | 0.18 |
|
| $ | 0.11 |
|
Effect on diluted earnings per share |
| $ | 0.19 |
|
| $ | 0.17 |
|
| $ | 0.11 |
|
All options granted in the three fiscal years ended March 31, 2014, 2015, and 2016 were granted at fair value and are non-statutory stock options. SummarizedThe following table summarizes information for all stock options for the past three fiscal years follows:March 31, 2020, 2019 and 2018:
| Fiscal 2020 |
|
| Fiscal 2019 |
|
| Fiscal 2018 |
| ||||||||||||||||
| Fiscal 2014 | Fiscal 2015 | Fiscal 2016 | ||||||||||||||||||||||
Options outstanding – beginning of the year | 1,100,952 | 1,115,984 | 1,163,179 | |||||||||||||||||||||
Options outstanding – beginning of fiscal year |
|
| 1,058,411 |
|
|
| 1,064,439 |
|
|
| 1,143,928 |
| ||||||||||||
Options granted | 441,550 | 241,625 | 276,275 |
|
| 271,575 |
|
|
| 290,300 |
|
|
| 334,200 |
| |||||||||
Options exercised | (310,729 | ) | (111,758 | ) | (200,753 | ) |
|
| (235,932 | ) |
|
| (250,604 | ) |
|
| (314,846 | ) | ||||||
Options cancelled/forfeited | (115,789 | ) | (82,672 | ) | (123,236 | ) |
|
| (64,951 | ) |
|
| (45,724 | ) |
|
| (98,843 | ) | ||||||
|
|
| ||||||||||||||||||||||
Options outstanding – end of year | 1,115,984 | 1,163,179 | 1,115,465 | |||||||||||||||||||||
|
|
| ||||||||||||||||||||||
During the year, weighted average exercise price of: | ||||||||||||||||||||||||
Options outstanding – end of fiscal year |
|
| 1,029,103 |
|
|
| 1,058,411 |
|
|
| 1,064,439 |
| ||||||||||||
During the fiscal year, weighted average exercise price of: |
|
|
|
|
|
|
|
|
|
|
|
| ||||||||||||
Options granted | $ | 33.06 | $ | 37.64 | $ | 35.51 |
| $ | 79.49 |
|
| $ | 57.27 |
|
| $ | 52.57 |
| ||||||
Options exercised | $ | 15.31 | $ | 17.27 | $ | 19.75 |
| $ | 38.34 |
|
| $ | 36.44 |
|
| $ | 27.59 |
| ||||||
Options cancelled/forfeited | $ | 23.33 | $ | 32.31 | $ | 33.44 |
| $ | 59.87 |
|
| $ | 36.71 |
|
| $ | 35.59 |
| ||||||
At the end of the year: | ||||||||||||||||||||||||
At the end of fiscal year: |
|
|
|
|
|
|
|
|
|
|
|
| ||||||||||||
Price range of outstanding options | $ | 7.78-$45.55 | $ | 7.78-$45.55 | $ | 9.05-$45.55 |
| $20.08-$88.22 |
|
| $12.71-$62.31 |
|
| $12.71-$57.75 |
| |||||||||
Weighted average exercise price per share | $ | 24.80 | $ | 27.65 | $ | 30.36 |
| $ | 54.87 |
|
| $ | 45.17 |
|
| $ | 39.45 |
| ||||||
Options available for future grants | 959,295 | 800,342 | 650,345 |
|
| 316,691 |
|
|
| 523,415 |
|
|
| 260,961 |
| |||||||||
Exercisable options | 430,294 | 559,168 | 529,691 |
|
| 468,107 |
|
|
| 440,386 |
|
|
| 445,387 |
| |||||||||
The following table summarizes the status of stock options outstanding and exercisable at March 31, 2016:2020:
Range of Exercise Prices | Number of Outstanding Options | Weighted Average Remaining Contractual Life | Outstanding Options – Weighted Average Exercise Price | Exercisable Options – Number of Exercisable Options | Exercisable Options – Weighted Average Exercise Price | |||||||||||||||
$9.05 to $23.10 | 394,458 | 2.74 | $ | 19.94 | 326,460 | $ | 19.34 | |||||||||||||
$23.11 to $34.78 | 456,246 | 3.72 | 32.70 | 117,986 | 27.71 | |||||||||||||||
$34.79 to $44.86 | 209,039 | 3.75 | 40.88 | 56,191 | 40.98 | |||||||||||||||
$44.87 to $45.55 | 55,722 | 2.85 | 45.55 | 29,054 | 45.55 | |||||||||||||||
|
|
|
|
|
|
|
|
|
| |||||||||||
Total | 1,115,465 | 3.33 | $ | 30.36 | 529,691 | $ | 24.93 | |||||||||||||
|
|
|
|
|
|
|
|
|
| |||||||||||
CORVEL CORPORATION
NOTES TO CONSOLIDATED FINANCIAL STATEMENTS
Fiscal Years Ended March 31, 2014, 2015 and 2016
Note B — Stock Options and Stock-Based Compensation (continued)
Range of Exercise Prices |
| Number of Outstanding Options |
|
| Weighted Average Remaining Contractual Life |
|
| Outstanding Options – Weighted Average Exercise Price |
|
| Exercisable Options – Number of Exercisable Options |
|
| Exercisable Options – Weighted Average Exercise Price |
| |||||
$20.08 to $43.32 |
|
| 264,782 |
|
|
| 2.19 |
|
| $ | 31.41 |
|
|
| 247,798 |
|
| $ | 30.91 |
|
$43.33 to $57.75 |
|
| 363,979 |
|
|
| 2.91 |
|
|
| 52.58 |
|
|
| 185,609 |
|
|
| 51.83 |
|
$57.76 to $77.93 |
|
| 323,392 |
|
|
| 4.04 |
|
|
| 68.83 |
|
|
| 34,700 |
|
|
| 59.89 |
|
$77.94 to $88.22 |
|
| 76,950 |
|
|
| 5.50 |
|
|
| 87.76 |
|
|
| — |
|
|
| — |
|
Total |
|
| 1,029,103 |
|
|
| 3.28 |
|
| $ | 54.87 |
|
|
| 468,107 |
|
| $ | 41.35 |
|
A summary ofThe following table summarizes the status forof all outstanding options at March 31, 2016,2020, and changes during the fiscal year then ended is presented in the table below:ended:
| Number of Options |
|
| Weighted Average Exercise Price per Share |
|
| Weighted Average Remaining Contractual Life (Years) |
|
| Aggregate Intrinsic Value as of March 31, 2020 |
| |||||||||||||||||||||
| Number of Options | Weighted Average Exercise Price per Share | Weighted Average Remaining Contractual Life (Years) | Aggregate Intrinsic Value as of March 31, 2016 | |||||||||||||||||||||||||||||
Options outstanding, March 31, 2015 | 1,163,179 | $ | 27.65 | |||||||||||||||||||||||||||||
Options outstanding, March 31, 2019 |
|
| 1,058,411 |
|
| $ | 45.17 |
|
|
|
|
|
|
|
|
| ||||||||||||||||
Granted | 276,275 | 35.51 |
|
| 271,575 |
|
|
| 79.49 |
|
|
|
|
|
|
|
|
| ||||||||||||||
Exercised | (200,753 | ) | 19.75 |
|
| (235,932 | ) |
|
| 38.34 |
|
|
|
|
|
|
|
|
| |||||||||||||
Cancelled – forfeited | (115,300 | ) | 33.79 |
|
| (60,466 | ) |
|
| 61.23 |
|
|
|
|
|
|
|
|
| |||||||||||||
Cancelled – expired | (7,936 | ) | 30.10 |
|
| (4,485 | ) |
|
| 41.63 |
|
|
|
|
|
|
|
|
| |||||||||||||
|
| |||||||||||||||||||||||||||||||
Options outstanding, March 31, 2016 | 1,115,465 | $ | 30.36 | 3.33 | $ | 10,862,335 | ||||||||||||||||||||||||||
|
|
|
| |||||||||||||||||||||||||||||
Options outstanding, March 31, 2020 |
|
| 1,029,103 |
|
| $ | 54.87 |
|
|
| 3.28 |
|
| $ | 7,345,665 |
| ||||||||||||||||
Options vested and expected to vest | 984,006 | $ | 29.63 | 3.21 | $ | 10,337,930 |
|
| 877,664 |
|
| $ | 48.41 |
|
|
| 2.91 |
|
| $ | 4,465,053 |
| ||||||||||
|
|
|
| |||||||||||||||||||||||||||||
Ending exercisable | 529,691 | $ | 24.93 | 2.66 | $ | 7,969,066 |
|
| 468,107 |
|
| $ | 41.35 |
|
|
| 2.42 |
|
| $ | 6,589,011 |
| ||||||||||
|
|
|
| |||||||||||||||||||||||||||||
The weighted average fair value of options granted during fiscal 2014, 2015,2020, 2019 and 20162018 was $13.96, $15.00,$22.99, $19.83, and $13.68,$19.24, respectively. The total intrinsic value of options exercised during fiscal years 2014, 2015,2020, 2019 and 2016 were $7,726,000, $2,455,000,2018 was $10,281,000, $5,817,000, and $3,581,000$7,780,000 respectively.
Included in the above-noted stock option grants and stock compensation expense are performance-based stock options pursuant to which vesting occursvest only upon the Company achievingCompany’s achievement of certain earnings per share targets on a calendar year basis, as determined by the Company’s boardBoard of directors. TheDirectors. These options were valued in the same manner as the time-vestingtime-based options. However, the Company only recognizes stock compensation expense to the extent that the targets are determined to be probable of being achieved, which allowtriggers the vesting of the performance options to vest.options. During the fiscal years ended March 31, 2014, 2015,2020, 2019 and 2016,2018, the Company recognized stock compensation expense for performance-based options in the amount of $630,000, $211,000,$1,625,000, $1,631,000, and $28,000,$649,000, respectively.
The Company received $3,386,000, $1,603,000,$8,147,000, $7,241,000, and $3,749,000$3,426,000 of cash receipts from the exercise of stock options during fiscal 2014, 2015,2020, 2019 and 2016,2018, respectively. As of March 31, 2016, $4,425,0002020, $6,054,000 of total unrecognized compensation costs related to stock options is expected to be recognized over a weighted average period of 3 years.
Note C4 — Property and Equipment
Property and equipment, net consisted of the following at March 31, 20152020 and 2016:2019:
| 2015 | 2016 | |||||||
Computer software | $ | 101,955,000 | $ | 114,883,000 | ||||
Office equipment and computers | 64,462,000 | 60,061,000 | ||||||
Leasehold improvements | 8,594,000 | 9,060,000 | ||||||
|
|
|
| |||||
| 175,011,000 | 184,004,000 | |||||||
Less: accumulated depreciation and amortization | (118,712,000 | ) | (130,736,000 | ) | ||||
|
|
|
| |||||
| $ | 56,299,000 | $ | 53,268,000 | |||||
|
|
|
| |||||
CORVEL CORPORATION
NOTES TO CONSOLIDATED FINANCIAL STATEMENTS
Fiscal Years Ended March 31, 2014, 2015 and 2016
Note C — Property and Equipment (continued)
|
| 2020 |
|
| 2019 |
| ||
Computer software |
| $ | 150,780,000 |
|
| $ | 152,885,000 |
|
Office equipment and computers |
|
| 66,398,000 |
|
|
| 68,006,000 |
|
Land, building and improvements |
|
| 11,048,000 |
|
|
| 5,843,000 |
|
Leasehold improvements |
|
| 14,962,000 |
|
|
| 13,539,000 |
|
|
|
| 243,188,000 |
|
|
| 240,273,000 |
|
Less: accumulated depreciation and amortization |
|
| (167,288,000 | ) |
|
| (178,293,000 | ) |
|
| $ | 75,900,000 |
|
| $ | 61,980,000 |
|
Depreciation expense totaled $17,538,000$22,081,000, $22,544,000 and $19,502,000$21,338,000 for the fiscal years ended March 31, 20152020, 2019 and 2016,2018, respectively. During fiscal 2020, the Company has occupied the building that was purchased in fiscal 2018.
Note D5 — Accounts and Income Taxes Payable and Accrued Liabilities
Accounts and income taxes payable consisted of the following at March 31, 20152020 and 2016:2019:
| 2015 | 2016 |
| 2020 |
|
| 2019 |
| |||||||||
Accounts payable | $ | 13,578,000 | $ | 11,191,000 |
| $ | 15,145,000 |
|
| $ | 9,925,000 |
| ||||
Income taxes payable and uncertain tax positions | 2,192,000 | 2,042,000 | ||||||||||||||
Uncertain tax positions |
|
| 1,218,000 |
|
|
| 1,553,000 |
| ||||||||
|
|
| $ | 16,363,000 |
|
| $ | 11,478,000 |
| |||||||
| $ | 15,770,000 | $ | 13,233,000 | |||||||||||||
|
| |||||||||||||||
Accrued liabilities consisted of the following at March 31, 20152020 and 2016:2019:
| 2015 | 2016 |
| 2020 |
|
| 2019 |
| |||||||||
Payroll, payroll taxes and employee benefits | $ | 17,774,000 | $ | 18,003,000 |
| $ | 26,024,000 |
|
| $ | 23,647,000 |
| ||||
Customer deposits | 17,760,000 | 25,649,000 |
|
| 48,991,000 |
|
|
| 45,268,000 |
| ||||||
Accrued professional service fees | 5,308,000 | 4,692,000 |
|
| 5,919,000 |
|
|
| 8,377,000 |
| ||||||
Self-insurance accruals | 3,305,000 | 3,095,000 |
|
| 3,248,000 |
|
|
| 3,523,000 |
| ||||||
Deferred revenue | 7,294,000 | 7,821,000 |
|
| 17,645,000 |
|
|
| 16,900,000 |
| ||||||
Accrued rent | 5,608,000 | 4,907,000 | ||||||||||||||
Operating lease liabilities |
|
| 13,223,000 |
|
|
| 5,708,000 |
| ||||||||
Other | 1,269,000 | 3,015,000 |
|
| 2,276,000 |
|
|
| 2,018,000 |
| ||||||
|
|
| $ | 117,326,000 |
|
| $ | 105,441,000 |
| |||||||
| $ | 58,318,000 | $ | 67,182,000 | |||||||||||||
|
| |||||||||||||||
Note E6 — Income Taxes
The income tax provision consisted of the following for the three fiscal years ended March 31, 2014, 20152020, 2019 and 2016:2018:
| 2014 | 2015 | 2016 | ||||||||||
Current – Federal | $ | 21,978,000 | $ | 16,534,000 | $ | 16,600,000 | ||||||
Current – State | 2,656,000 | 136,000 | 2,591,000 | |||||||||
|
|
|
|
|
| |||||||
Subtotal | 24,634,000 | 16,670,000 | 19,191,000 | |||||||||
|
|
|
|
|
| |||||||
Deferred – Federal | (2,367,000 | ) | 312,000 | (1,679,000 | ) | |||||||
Deferred – State | (152,000 | ) | (8,000 | ) | 23,000 | |||||||
|
|
|
|
|
| |||||||
Subtotal | (2,519,000 | ) | 304,000 | (1,656,000 | ) | |||||||
|
|
|
|
|
| |||||||
| $ | 22,115,000 | $ | 16,974,000 | $ | 17,535,000 | |||||||
|
|
|
|
|
| |||||||
CORVEL CORPORATION
NOTES TO CONSOLIDATED FINANCIAL STATEMENTS
Fiscal Years Ended March 31, 2014, 2015 and 2016
Note E — Income Taxes (continued)
|
| 2020 |
|
| 2019 |
|
| 2018 |
| |||
Current — Federal |
| $ | 9,212,000 |
|
| $ | 10,233,000 |
|
| $ | 11,177,000 |
|
Current — State |
|
| 2,652,000 |
|
|
| 3,121,000 |
|
|
| 1,905,000 |
|
Subtotal |
|
| 11,864,000 |
|
|
| 13,354,000 |
|
|
| 13,082,000 |
|
Deferred — Federal |
|
| 1,418,000 |
|
|
| 941,000 |
|
|
| (955,000 | ) |
Deferred — State |
|
| 52,000 |
|
|
| 515,000 |
|
|
| 81,000 |
|
Subtotal |
|
| 1,470,000 |
|
|
| 1,456,000 |
|
|
| (874,000 | ) |
|
| $ | 13,334,000 |
|
| $ | 14,810,000 |
|
| $ | 12,208,000 |
|
The following is a reconciliation of the income tax provision from the statutory federal income tax rate to the effective rate for the three fiscal years ended March 31, 2014, 20152020, 2019 and 2016:2018:
| 2020 |
|
| 2019 |
|
| 2018 |
| ||||||||||||||||
| 2014 | 2015 | 2016 | ||||||||||||||||||||||
Income taxes at federal statutory rate (35%) | $ | 20,633,000 | $ | 15,947,000 | $ | 16,121,000 | ||||||||||||||||||
Income taxes at federal statutory rate |
| $ | 12,749,000 |
|
| $ | 12,918,000 |
|
| $ | 15,112,000 |
| ||||||||||||
State income taxes, net of federal benefit | 1,826,000 | 1,535,000 | 1,704,000 |
|
| 2,243,000 |
|
|
| 2,848,000 |
|
|
| 1,645,000 |
| |||||||||
Uncertain tax positions | (245,000 | ) | 1,346,000 | 78,000 |
|
| (263,000 | ) |
|
| (175,000 | ) |
|
| (464,000 | ) | ||||||||
Permanent items and tax credits |
|
| (1,632,000 | ) |
|
| (666,000 | ) |
|
| (1,364,000 | ) | ||||||||||||
Adjustments to returns as filed | (293,000 | ) | (1,978,000 | ) | (232,000 | ) |
|
| 110,000 |
|
|
| 131,000 |
|
|
| 138,000 |
| ||||||
Other | 194,000 | 124,000 | (136,000 | ) | ||||||||||||||||||||
Valuation allowance |
|
| 127,000 |
|
|
| 317,000 |
|
|
| 236,000 |
| ||||||||||||
Impact of tax reform |
|
| — |
|
|
| (563,000 | ) |
|
| (3,095,000 | ) | ||||||||||||
|
|
|
| $ | 13,334,000 |
|
| $ | 14,810,000 |
|
| $ | 12,208,000 |
| ||||||||||
| $ | 22,115,000 | $ | 16,974,000 | $ | 17,535,000 | |||||||||||||||||||
|
|
| ||||||||||||||||||||||
Income taxes paid totaled $20,791,000, $19,528,000, and $13,589,000 for the fiscal years ended March 31, 2014, 2015, and 2016, respectively.
Deferred tax assets and liabilities at March 31, 20152020 and 2016 are:2019 are, as follows:
| 2020 |
|
| 2019 |
| |||||||||||
| 2015 | 2016 | |||||||||||||||
Deferred income tax assets: | ||||||||||||||||
Deferred tax assets: |
|
|
|
|
|
|
|
| ||||||||
Accrued liabilities not currently deductible | $ | 7,547,000 | $ | 9,656,000 |
| $ | 5,640,000 |
|
| $ | 6,277,000 |
| ||||
Allowance for doubtful accounts | 631,000 | 696,000 |
|
| 1,293,000 |
|
|
| 1,422,000 |
| ||||||
Stock-based compensation | 1,044,000 | 1,245,000 |
|
| 2,058,000 |
|
|
| 1,833,000 |
| ||||||
Accrued rent | 2,152,000 | 1,875,000 |
|
| — |
|
|
| 1,474,000 |
| ||||||
Deferred lease liability |
|
| 24,765,000 |
|
|
| — |
| ||||||||
Other | 830,000 | 762,000 |
|
| 938,000 |
|
|
| 1,123,000 |
| ||||||
|
| |||||||||||||||
Deferred assets | 12,204,000 | 14,234,000 | ||||||||||||||
|
| |||||||||||||||
Deferred income tax liabilities: | ||||||||||||||||
Deferred tax assets |
|
| 34,694,000 |
|
|
| 12,129,000 |
| ||||||||
Deferred tax liabilities: |
|
|
|
|
|
|
|
| ||||||||
Excess of book over tax basis of fixed assets | (15,985,000 | ) | (16,151,000 | ) |
|
| (13,024,000 | ) |
|
| (10,836,000 | ) | ||||
Intangible assets | (5,217,000 | ) | (5,555,000 | ) |
|
| (4,507,000 | ) |
|
| (4,438,000 | ) | ||||
Right-of-use asset |
|
| (22,837,000 | ) |
|
| — |
| ||||||||
Accrued revenue |
|
| (1,143,000 | ) |
|
| (2,354,000 | ) | ||||||||
Other | (564,000 | ) | (434,000 | ) |
|
| (267,000 | ) |
|
| (242,000 | ) | ||||
|
| |||||||||||||||
Deferred liabilities | (21,766,000 | ) | (22,140,000 | ) | ||||||||||||
|
| |||||||||||||||
Total deferred tax liabilities |
|
| (41,778,000 | ) |
|
| (17,870,000 | ) | ||||||||
Valuation allowance |
|
| (680,000 | ) |
|
| (553,000 | ) | ||||||||
Deferred tax liabilities |
|
| (42,458,000 | ) |
|
| (18,423,000 | ) | ||||||||
Net deferred tax liability | $ | (9,562,000 | ) | $ | (7,906,000 | ) |
| $ | (7,764,000 | ) |
| $ | (6,294,000 | ) | ||
|
| |||||||||||||||
Prepaid expenses and income taxes include $5,758,000$3,870,000 and $301,000$1,160,000 at March 31, 20152020 and 2016, respectively,2019, respectively. Accounts and income taxes payable include $0 at March 31, 2020 and $73,000 for March 31, 2019, for income taxes due in the first quarter of the succeedingfollowing fiscal year.
A reconciliation of the financial statement recognition and measurement of unrecognizeduncertain tax positions during the current fiscal year is as follows:
Balance as of March 31, 2015 | $ | 1,989,000 | ||
Additions based on tax positions related to the current year | 337,000 | |||
Additions for tax positions of prior years | — | |||
Reductions for tax positions related to the current year | (229,000 | ) | ||
Reductions for tax positions of prior years | (267,000 | ) | ||
|
| |||
Balance as of March 31, 2016 | $ | 1,830,000 | ||
|
|
CORVEL CORPORATION
NOTES TO CONSOLIDATED FINANCIAL STATEMENTS
Fiscal Years Ended March 31, 2014, 2015 and 2016
Note E — Income Taxes (continued)
Balance as of March 31, 2019 |
| $ | 1,264,000 |
|
Additions based on tax positions related to the current year |
|
| 62,000 |
|
Additions for tax positions of prior years |
|
| 30,000 |
|
Reductions for tax positions related to the current year |
|
| — |
|
Reductions for tax positions of prior years |
|
| (344,000 | ) |
Balance as of March 31, 2020 |
| $ | 1,012,000 |
|
The Company recognizes interest and penalties related to uncertain tax positions in income tax expense. During the fiscal years ended March 31, 2014, 20152020, 2019 and 2016,2018, the Company recognized approximately ($173,000)$(10,000), $57,000$22,000 and $72,000$(53,000) in interest and penalties, respectively. As of March 31, 2014, 20152020, 2019 and 2016,2018, accrued interest and penalties related to uncertain tax positions were $83,000, $140,000$206,000, $216,000 and $212,000,$194,000, respectively.
The tax fiscal years 2012-2015from 2016-2019 remain open to examination by the major taxing jurisdictions to which the Company is subject.
On December 22, 2017, the Tax Cuts and Jobs Act was enacted into law. Among numerous provisions included in the new law was the reduction of the corporate federal income tax rate from 35% to 21% effective January 1, 2018. The Company continues to analyze and assess the impact of the Tax Cuts and Jobs Act and believes certain aspects of its impact on the Company’s business may not be fully known for some time. The final impact may differ, possibly materially, due to, among other things, changes in interpretations, assumptions made by the Company, the issuance of federal tax regulations and guidance, and actions the Company may take as a result of the Tax Cuts and Jobs Act. In the absence of guidance on various uncertainties and ambiguities in the application of certain provisions of the Tax Cuts and Jobs Act, the Company is using what it believes are reasonable interpretations and assumptions in applying the Tax Cuts and Jobs Act, but it is possible that the U.S. Department of Treasury could issue subsequent rules and regulations, or the Internal Revenue Service could issue subsequent guidance or take positions on audit, that differ from the Company’s prior interpretations and assumptions, which could have a material, adverse effect on the Company’s cash, tax assets and liabilities, results of operations, and financial condition.
On March 27, 2020, the Coronavirus Aid, Relief, and Economic Security Act (the “CARES Act”) was enacted into law. The Company does not intend to apply for governmental loans from the CARES Act or any other governmental programs to support the
Company’s operations. The Company is taking advantage of certain aspects of the CARES Act such as the deferral of payroll tax deposits and continuing to evaluate the other provisions of the CARES Act.
Note F7 — Employee Stock Purchase Plan
The Company maintains an Employee Stock Purchase Plan (“ESPP”(as amended, “ESPP”) which allows employees of the Company and its subsidiaries to purchase shares of common stock on the last day of two six-month purchase periods (i.e. March 31 and September 30) at a purchase price which is 95% of the closing sale price of shares as quoted on NASDAQ on the last day of such purchase period. Employees are allowed to contribute up to 20% of their gross pay. A maximum of 2,850,000 shares has been authorized for issuance under the ESPP, as amended.ESPP. As of March 31, 2016, 2,450,2712020, 2,486,565 shares had been issued pursuant to the ESPP. Summarized ESPP information is as follows:
| 2014 | 2015 | 2016 |
| 2020 |
|
| 2019 |
|
| 2018 |
| |||||||||||||
Employee contributions | $ | 346,000 | $ | 400,000 | $ | 371,000 |
| $ | 505,000 |
|
| $ | 503,000 |
|
| $ | 458,000 |
| ||||||
Shares acquired | 8,489 | 12,299 | 10,975 |
|
| 8,451 |
|
|
| 8,271 |
|
|
| 8,976 |
| |||||||||
Average purchase price | $ | 40.71 | $ | 32.52 | $ | 33.81 |
| $ | 59.70 |
|
| $ | 59.55 |
|
| $ | 49.78 |
| ||||||
Note G8 — Treasury Stock
During each of the fiscal years in the three fiscal year periodyears ended March 31, 2016,2020, the Company continued to repurchase shares of its common stock under a planprogram originally approved by the Company’s Board of Directors in 1996. Including a 1,000,000 share expansion authorized in November 2015, theThe total number of shares of common stock authorized to be repurchased over the life of the planprogram is 35,000,00037,000,000 shares of common stock. On March 21, 2020, the Company temporarily suspended its stock repurchase program in order to provide the Company maximum flexibility to focus on serving its customers as it navigates through the COVID-19 pandemic. The Company has lifted this temporary suspension and expects to resume its stock repurchase program in the June 2020 quarter. Purchases may be made from time to time depending on market conditions and other relevant factors. The share repurchases for the fiscal years ended March 31, 2014, 20152020, 2019 and 20162018 and cumulatively since inception of the authorization, are as follows:
| 2014 | 2015 | 2016 | Cumulative | |||||||||||||
Shares repurchased | 830,460 | 845,014 | 893,771 | 33,886,000 | ||||||||||||
Cost | $ | 27,179,000 | $ | 31,798,000 | $ | 31,525,000 | $ | 391,803,000 | ||||||||
Average price | $ | 32.73 | $ | 37.63 | $ | 35.27 | $ | 11.56 | ||||||||
During the period subsequent to March 31, 2016, through the date of filing this report, the Company repurchased 26,555 shares for $1.1 million or an average of $42.71 per share. The repurchased shares were recorded as treasury stock, at cost, and are available for general corporate purposes. The repurchases were primarily financed from cash generated from operations and from the cash proceeds from the exercise of stock options.
CORVEL CORPORATION
NOTES TO CONSOLIDATED FINANCIAL STATEMENTS
Fiscal Years Ended March 31, 2014, 2015 and 2016
|
| 2020 |
|
| 2019 |
|
| 2018 |
|
| Cumulative |
| ||||
Shares repurchased |
|
| 822,353 |
|
|
| 582,159 |
|
|
| 249,245 |
|
|
| 36,285,591 |
|
Cost |
| $ | 65,608,000 |
|
| $ | 35,167,000 |
|
| $ | 11,187,000 |
|
| $ | 531,763,000 |
|
Average price |
| $ | 79.78 |
|
| $ | 60.41 |
|
| $ | 44.88 |
|
| $ | 14.65 |
|
Note H — Commitments9 – Leases
The Company determines if an arrangement is, or contains, a lease at contract inception. These lease agreements have remaining lease terms of 1 to 15 years. The Company recognizes a right-of-use (“ROU”) asset and a lease liability at the lease commencement date. The lease liability is initially measured at the present value of the unpaid lease payments as of the lease commencement date. Key estimates and judgments include how the Company determines (1) the discount rate it uses to discount the unpaid lease payments to present value, (2) the lease term, and (3) lease payments.
ASC 842 requires a lessee to discount its unpaid lease payments using the interest rate implicit in the lease or, if that rate cannot be readily determined, its incremental borrowing rate. Generally, the Company cannot determine the interest rate implicit in the lease because it does not have access to the lessor's estimated residual value or the amount of the lessor's deferred initial direct costs. Therefore, the Company generally uses its incremental borrowing rate as the discount rate for the lease. The Company's incremental borrowing rate for a lease is the rate of interest it would have to pay on a collateralized basis to borrow an amount equal to the lease payments under similar terms. Because the Company does not generally borrow on a collateralized basis, it uses quoted interest rates obtained from financial institutions as an input to derive an appropriate incremental borrowing rate, adjusted for the amount of the lease payments, the lease term, and the effect on that rate of designating specific collateral with a value equal to the unpaid lease payments for that lease.
The Company’s lease agreements may include options to extend the lease following the initial term. In most instances, the Company has determined that it is reasonably certain to exercise the option to renew; accordingly, these options are considered in determining the initial lease term. The Company has elected the practical expedient of hindsight in determining the option to renew.
For lease agreements entered into or reassessed after the adoption of ASC 842, the Company has elected the practical expedient to account for the lease and non-lease components as a single lease component. Therefore, for those leases, office facilities under non-cancelable operating leases. Somethe lease payments used to measure the lease liability include all of the fixed consideration in the contract.
Variable lease payments associated with the Company’s leases are recognized upon occurrence of the event, activity, or circumstance in the lease agreement on which those payments are assessed.
Leases with an initial term of 12 months or less are not recorded on the balance sheet. The Company recognizes lease expense for these leases contain escalation clauses. Future minimum rental commitments underon a straight-line basis over the lease term.
The components of lease expenses are as follows:
|
| March 31, 2020 |
| |
Operating lease expense |
| $ | 14,992,000 |
|
Short-term lease expense |
|
| 323,000 |
|
Variable lease expense |
|
| 124,000 |
|
Total lease expenses |
| $ | 15,439,000 |
|
The following table presents the lease related assets and liabilities recorded on the Company’s consolidated balance sheets related to its operating leases:
|
| March 31, 2020 |
| |
Right-of-use asset, net |
| $ | 90,666,000 |
|
Short-term lease liability |
| $ | 13,223,000 |
|
Long-term lease liability |
|
| 85,096,000 |
|
Total lease liabilities |
| $ | 98,319,000 |
|
Weighted average remaining lease term |
| 8.27 years |
| |
Weighted average discount rate |
|
| 4.0 | % |
Supplemental cash flow information related to operating leases at March 31, 2016 are $13,458,000 infor fiscal 2017, $10,335,000 in fiscal 2018, $7,553,000 in fiscal 2019, $5,363,000 in fiscal 2020, $4,317,000 in fiscal 2021, $5,211,000 thereafter, and $46,237,000 in the aggregate. Total rental expense of $13,890,000, $15,297,000, and $14,405,000 was charged to operations for the fiscal yearsyear ended March 31, 2014, 2015,2020 were as follows:
Cash paid for amounts included in the measurement of operating lease liabilities |
| $ | 14,992,000 |
|
Operating lease liabilities arising from obtaining ROU assets |
| $ | 110,606,000 |
|
Reductions to ROU assets resulting from reductions to operating lease liabilities |
| $ | 8,354,000 |
|
As of March 31, 2020, maturities of operating lease liabilities for each of the next five years and 2016, respectively.thereafter are as follows:
2021 |
| $ | 14,971,000 |
|
2022 |
|
| 14,282,000 |
|
2023 |
|
| 14,361,000 |
|
2024 |
|
| 12,924,000 |
|
2025 |
|
| 12,360,000 |
|
Thereafter |
|
| 47,908,000 |
|
Total lease payments |
|
| 116,806,000 |
|
Less interest |
|
| (18,487,000 | ) |
Total lease liabilities |
| $ | 98,319,000 |
|
As of March 31, 2020, the Company has approximately $4.4 million of additional operating lease commitments that have not yet commenced. These leases commence in 2020 and have lease terms between 2 years and 11 years.
Note I10 — Contingencies and Legal Proceedings
The Company is involved in litigation arising in the normalordinary course of business. Management believes that resolution of these matters will not result in any payment that, in the aggregate, would be material to the consolidated financial position or results of the operations of the Company.
Note J11 — Retirement Savings Plan
The Company maintains a retirement savings plan for its employees, which is a qualified plan under Section 401(k) of the Internal Revenue Code. Full-time employees that meet certain requirements are eligible to participate in the plan. Employer contributions are made annually, primarily at the discretion of the Company’s Board of Directors. Contributions of $338,000, $443,000$829,000, $777,000 and $392,000$557,000 were charged to operations for the fiscal years ended March 31, 2014, 2015,2020, 2019 and 2016,2018, respectively.
Note K12 — Shareholder Rights Plan
During fiscal 1997, the Company’s Board of Directors approved the adoption of aits Shareholder Rights Plan. The Shareholder Rights Plan provides for a dividend distribution to CorVel stockholdersthe Company’s shareholders of one preferred stock purchase right for each outstanding share of CorVel’sthe Company’s common stock underheld by such shareholder (as used in this Note 12, the “right” or the “rights”), only in the event of certain circumstances.takeover-related events. In April 2002, the Company’s Board of Directors of CorVel approved an amendment to the Shareholder Rights Plan to extend the expiration date of the rights to February 10, 2012, set the exercise price of each right at $118, and enable Fidelity Management & Research Company and its affiliates to purchase up to 18% of the shares of common stock of the Company without triggering the stockholder rights, with the limitations under the Shareholder Rights Plan remaining in effect for all other stockholders of the Company. In November 2008, the Company’s Board of Directors approved an amendment to the Shareholder Rights Plan to extend the expiration date of the rights to February 10, 2022, remove the ability of Fidelity Management & Research Company and its affiliates to purchase up to 18% of the shares of common stock of the Company without triggering the stockholder rights, substitute Computershare Trust Company, N.A. as the rights agent and effect certain technical changes to the Shareholder Rights Plan.
Generally, the Shareholder Rights Plan provides that if a person or group acquires 15% or more of the Company’s common stock without the approval of the Company’s Board of Directors, subject to certain exceptions, the holders of the rights, other than the acquiring person or group, would, under certain circumstances, have the right to purchase additional shares of the Company’s common stock having a market value equal to two times the then-current exercise price of the right.
In addition, if the Company is thereafter merged into another entity, or if 50% or more of the Company’s consolidated assets or earning power are sold, then the right willwould entitle its holder to buy common shares of the acquiring entity having a market value equal to two times the then-current exercise price of the right. The Company’s Board of Directors may exchange or redeem the rights under certain conditions.
CORVEL CORPORATION
NOTES TO CONSOLIDATED FINANCIAL STATEMENTS
Fiscal Years Ended March 31, 2014, 2015 and 2016
Note L13 — Line of Credit
InThe Company’s revolving credit facility expired in September 2015,2019, and the Company renewed achose not to renew its line of credit agreement. The line isagreement with a financial institution to provide a revolving credit facility with borrowing capacity of up to $10 million. Borrowings under this agreement, as amended, bear interest, at the Company’s option, at a fixed LIBOR-based rate plus 1.50% or at a fluctuating rate determined by the financial institution to be 1.50% above the daily one-month LIBOR rate. The loan covenants require the Company to maintain the current assets to liabilities ratio of at least 1.25:1, debt to tangible net worth not greater than 1.25:1 and have positive net income. There were no outstanding revolving loans as of March 31, 2016, but letters of credit in the aggregate amount of $4.5 million have been issued separate from the line of credit and therefore do not reduce the amount of borrowings available under the revolving credit facility. The credit agreement expires in September 2016.institution.
Note M — Quarterly Results (Unaudited)
The following is a summary of unaudited quarterly results of operations for each of the quarters in the two fiscal years ended March 31, 2015 and 2016:
| Revenues | Gross Profit | Net Income | Net Income per Basic Common Share | Net Income per Diluted Common Share | ||||||||||||||||
Fiscal Year Ended March 31, 2015: | ||||||||||||||||||||
First Quarter | $ | 124,364,000 | $ | 27,700,000 | $ | 8,299,000 | $ | 0.40 | $ | 0.39 | ||||||||||
Second Quarter | 123,714,000 | 25,467,000 | 7,883,000 | 0.38 | 0.37 | |||||||||||||||
Third Quarter | 122,352,000 | 24,128,000 | 6,832,000 | 0.33 | 0.33 | |||||||||||||||
Fourth Quarter | 122,195,000 | 22,674,000 | 5,576,000 | 0.27 | 0.27 | |||||||||||||||
Fiscal Year Ended March 31, 2016: | ||||||||||||||||||||
First Quarter | $ | 126,939,000 | $ | 26,183,000 | $ | 6,900,000 | $ | 0.34 | $ | 0.34 | ||||||||||
Second Quarter | 124,460,000 | 26,684,000 | 8,267,000 | 0.42 | 0.41 | |||||||||||||||
Third Quarter | 123,891,000 | 25,232,000 | 6,691,000 | 0.34 | 0.34 | |||||||||||||||
Fourth Quarter | 128,294,000 | 26,445,000 | 6,667,000 | 0.34 | 0.34 | |||||||||||||||
Note N14 — Segment Reporting
The Company derives the majority of its revenues from providing patient management and network solutions services to payors of workers’ compensation benefits, automobile insurance claims and group health insurance benefits. Patient management services include claims administration, utilization review, medical case management, and vocational rehabilitation. Network solutions revenuesservices include fee schedule auditing, hospital bill auditing, coordination of independent medical examinations, diagnostic imaging review services and preferred provider referral services. The percentages of revenues attributable to patient management and network solutions services for the fiscal years ended March 31, 2014, 2015,2020, 2019 and 20162018 are listed below.
| 2014 | 2015 | 2016 | ||||||||||
Patient management services | 51.9 | % | 54.5 | % | 55.1 | % | ||||||
Network solutions services | 48.1 | % | 45.5 | % | 44.9 | % | ||||||
|
|
|
|
|
| |||||||
| 100.0 | % | 100.0 | % | 100.0 | % | |||||||
|
|
|
|
|
| |||||||
CORVEL CORPORATION
NOTES TO CONSOLIDATED FINANCIAL STATEMENTS
Fiscal Years Ended March 31, 2014, 2015 and 2016
Note N — Segment Reporting (continued)
|
| 2020 |
|
| 2019 |
|
| 2018 |
| |||
Patient management services |
|
| 65.3 | % |
|
| 61.8 | % |
|
| 56.7 | % |
Network solutions services |
|
| 34.7 | % |
|
| 38.2 | % |
|
| 43.3 | % |
|
|
| 100.0 | % |
|
| 100.0 | % |
|
| 100.0 | % |
The Company’s management is structured geographically with regional vice-presidentsvice presidents who report to the Chief Executive Officer of the Company. Each of these regional vice-presidents isare responsible for all services provided by the Company in his or her particular region and responsible for the operating results of the Company in multiple states. These regional vice-presidentsvice presidents have area and district managers who are also responsible for all services provided by the Company in their given area and district.
Under FASB ASC 280-10, two or more operating segments may be aggregated into a single operating segment for financial reporting purposes if aggregation is consistent with the objective and basic principles, if the segments have similar economic characteristics, and if the segments are similar in each of the following areas: 1)(i) the nature of products and services; 2)services, (ii) the nature of the production processes; 3)processes, (iii) the type or class of customer for their products and services;services, and 4)(iv) the methods used to distribute their products or provide their services. The Company believes each of the Company’s regions meet these criteria as they provide similar managed care services to similar customers using similar methods of productionsproduction and similar methods to distribute their services.distribution. All of the Company’s regions perform both patient management and network solutions services.
Because the Company believes it meets each of the criteria set forth above and each of the Company’s regions has similar economic characteristics, the Company aggregates its results of operations in one reportable operating segment.
Note O15 — Other Intangible Assets
Other intangible assets consistconsisted of the following at March 31, 2015:2020:
Item | Life | Cost | Fiscal 2015 Amortization Expense | Accumulated Amortization at March 31, 2015 | Cost, Net of Accumulated Amortization at March 31, 2015 |
| Life |
| Cost |
|
| Fiscal 2020 Amortization Expense |
|
| Accumulated Amortization at March 31, 2020 |
|
| Cost, Net of Accumulated Amortization at March 31, 2020 |
| |||||||||||||||||
Covenant Not to Compete | 5 years | $ | 775,000 | $ | 20,000 | $ | 762,000 | $ | 13,000 |
| 5 years |
| $ | 775,000 |
|
| $ | — |
|
| $ | 775,000 |
|
| $ | — |
| |||||||||
Customer relationships | 18-20 years | 7,922,000 | 423,000 | 3,299,000 | 4,623,000 | |||||||||||||||||||||||||||||||
TPA Licenses | 15 years | 204,000 | 14,000 | 104,000 | 100,000 | |||||||||||||||||||||||||||||||
|
|
|
| |||||||||||||||||||||||||||||||||
Customer Relationships |
| 18-20 years |
|
| 7,922,000 |
|
|
| 421,000 |
|
|
| 5,414,000 |
|
|
| 2,508,000 |
| ||||||||||||||||||
Third Party Administrator Licenses |
| 15 years |
|
| 204,000 |
|
|
| 14,000 |
|
|
| 172,000 |
|
|
| 32,000 |
| ||||||||||||||||||
Total | $ | 8,901,000 | $ | 457,000 | $ | 4,165,000 | $ | 4,736,000 |
|
|
| $ | 8,901,000 |
|
| $ | 435,000 |
|
| $ | 6,361,000 |
|
| $ | 2,540,000 |
| ||||||||||
|
|
|
| |||||||||||||||||||||||||||||||||
Other intangible assets consistconsisted of the following at March 31, 2016:2019:
| Item | Life | Cost | Fiscal 2016 Amortization Expense | Accumulated Amortization at March 31, 2016 | Cost, Net of Accumulated Amortization at March 31, 2016 |
| Life |
| Cost |
|
| Fiscal 2019 Amortization Expense |
|
| Accumulated Amortization at March 31, 2019 |
|
| Cost, Net of Accumulated Amortization at March 31, 2019 |
| |||||||||||||||||
Covenant Not to Compete | 5 years | $ | 775,000 | $ | 13,000 | $ | 775,000 | $ | — |
| 5 years |
| $ | 775,000 |
|
| $ | — |
|
| $ | 775,000 |
|
| $ | — |
| |||||||||
Customer Relationships | 18-20 years | 7,922,000 | 423,000 | 3,721,000 | 4,201,000 |
| 18-20 years |
|
| 7,922,000 |
|
|
| 426,000 |
|
|
| 4,993,000 |
|
|
| 2,929,000 |
| |||||||||||||
TPA Licenses | 15 years | 204,000 | 14,000 | 118,000 | 86,000 | |||||||||||||||||||||||||||||||
|
|
|
| |||||||||||||||||||||||||||||||||
Third Party Administrator Licenses |
| 15 years |
|
| 204,000 |
|
|
| 14,000 |
|
|
| 158,000 |
|
|
| 46,000 |
| ||||||||||||||||||
Total | $ | 8,901,000 | $ | 450,000 | $ | 4,614,000 | $ | 4,287,000 |
|
|
| $ | 8,901,000 |
|
| $ | 440,000 |
|
| $ | 5,926,000 |
|
| $ | 2,975,000 |
| ||||||||||
|
|
|
| |||||||||||||||||||||||||||||||||
Amortization expense for the next five fiscal years is expected to be $437,000 in fiscal 2017, $437,000 in fiscal 2018, $437,000 in fiscal 2019, $437,000 in fiscal 2020, $437,000$435,000 in fiscal 2021, $434,000 in fiscal 2022, $425,000 in fiscal 2023, $423,000 in fiscal 2024, $384,000 in fiscal 2025, and $2,110,000$439,000 thereafter.
Note 16 — Quarterly Results (Unaudited)
EXHIBIT INDEXThe following is a summary of unaudited quarterly results of operations for each of the quarters in the fiscal years ended March 31, 2020 and 2019:
|
| |
EXHIBIT INDEX (continued)
|
| |
EXHIBIT INDEX (continued)
|
| |
EXHIBIT INDEX (continued)
|
| |
|
| Revenues |
|
| Gross Profit |
|
| Net Income |
|
| Net Income per Basic Common Share |
|
| Net Income per Diluted Common Share |
| |||||
Fiscal Year Ended March 31, 2020: |
|
|
|
|
|
|
|
|
|
|
|
|
|
|
|
|
|
|
|
|
First Quarter |
| $ | 150,139,000 |
|
| $ | 33,134,000 |
|
| $ | 13,407,000 |
|
| $ | 0.72 |
|
| $ | 0.71 |
|
Second Quarter |
|
| 146,970,000 |
|
|
| 32,843,000 |
|
|
| 12,871,000 |
|
|
| 0.70 |
|
|
| 0.69 |
|
Third Quarter |
|
| 148,092,000 |
|
|
| 29,253,000 |
|
|
| 9,352,000 |
|
|
| 0.51 |
|
|
| 0.50 |
|
Fourth Quarter |
|
| 147,024,000 |
|
|
| 30,691,000 |
|
|
| 11,747,000 |
|
|
| 0.65 |
|
|
| 0.64 |
|
Fiscal Year Ended March 31, 2019: |
|
|
|
|
|
|
|
|
|
|
|
|
|
|
|
|
|
|
|
|
First Quarter |
| $ | 150,398,000 |
|
| $ | 31,353,000 |
|
| $ | 11,778,000 |
|
| $ | 0.62 |
|
| $ | 0.62 |
|
Second Quarter |
|
| 148,176,000 |
|
|
| 31,490,000 |
|
|
| 12,789,000 |
|
|
| 0.68 |
|
|
| 0.67 |
|
Third Quarter |
|
| 146,082,000 |
|
|
| 29,354,000 |
|
|
| 10,298,000 |
|
|
| 0.55 |
|
|
| 0.54 |
|
Fourth Quarter |
|
| 151,084,000 |
|
|
| 32,612,000 |
|
|
| 11,838,000 |
|
|
| 0.64 |
|
|
| 0.63 |
|
7067