UNITED STATES

SECURITIES AND EXCHANGE COMMISSION

Washington, D.C. 20549

Form 10-K

(Mark One)

xANNUAL REPORT PURSUANT TO SECTION 13 OR 15(d) OF THE SECURITIES EXCHANGE ACT OF 1934

For the fiscal year ended January 30, 2016

28, 2017

or

¨TRANSITION REPORT PURSUANT TO SECTION 13 OR 15(d) OF THE SECURITIES EXCHANGE ACT OF 1934

For the transition period from              to             

Commission file number 0-30877

Marvell Technology Group Ltd.

(Exact name of registrant as specified in its charter)

Bermuda 77-0481679
(State or other jurisdiction of
incorporation or organization)
 
(I.R.S. Employer
Identification No.)

Canon’s Court, 22 Victoria Street, Hamilton HM 12, Bermuda

(Address of principal executive offices)

(441) 296-6395

(Registrant’s telephone number, including area code)

Securities registered pursuant to Section 12(b) of the Act:

Title of each class


Name of each exchange on which registered

Common shares, $0.002 par value per share

 The NASDAQ Stock Market LLC

Securities registered pursuant to Section 12(g) of the Act:

None

Indicate by check mark if the registrant is a well-known seasoned issuer, as defined in Rule 405 of the Securities Act.    Yes  ¨    No  x

Indicate by check mark if the registrant is not required to file reports pursuant to Section 13 or Section 15(d) of the Act.    Yes  ¨    No  x

Indicate by check mark whether the registrant (1) has filed all reports required to be filed by Section 13 or 15(d) of the Securities Exchange Act of 1934 during the preceding 12 months (or for such shorter period that the registrant was required to file such reports), and (2) has been subject to such filing requirements for the past 90 days.    Yes  x    No  ¨    No  x

Indicate by check mark whether the registrant has submitted electronically and posted on its corporate Web site, if any, every Interactive Data File required to be submitted and posted pursuant to Rule 405 of Regulation S-T (§232.405 of this chapter) during the preceding 12 months (or for such shorter period that the registrant was required to submit and post such files).    Yes  x    No  ¨

Indicate by check mark if disclosure of delinquent filers pursuant to Item 405 of Regulation S-K (§229.405 of this chapter) is not contained herein, and will not be contained, to the best of the registrant’s knowledge, in definitive proxy or information statements incorporated by reference in Part III of this Form 10-K or any amendment to this Form 10-K.    x

Indicate by check mark whether the registrant is a large accelerated filer, an accelerated filer, a non-accelerated filer, or a smaller reporting company. See the definitions of “large accelerated filer,” “accelerated filer” and “smaller reporting company” in Rule 12b-2 of the Exchange Act. (Check one):

Large accelerated filer   x
 
Accelerated filer   ¨
 
Non-accelerated filer  ¨    
  
Smaller reporting company  ¨
  
(Do not check if a smaller

reporting company)


Indicate by check mark whether the registrant is a shell company (as defined in Rule 12b-2 of the Exchange Act).    Yes  ¨    No  x

The aggregate market value of the registrant’s common shares held by non-affiliates of the registrant was approximately $4,380 million$3,844,207,456 based upon the closing price of $12.44$11.75 per share on the NASDAQ Global Select Market on July 31, 201529, 2016 (the last business day of the registrant’s most recently completed second quarter). Common shares held by each director and executive officer of the registrant, as well as shares held by each holder of more than 5% of the common shares known to the registrant (based on Schedule 13G filings), have been excluded for purposes of the foregoing calculation.

As of July 11, 2016,March 22, 2017, there were 511.2502.4 million common shares of the registrant outstanding.

DOCUMENTS INCORPORATED BY REFERENCE

None

Portions of Part III of this Form 10-K are incorporated by reference from the registrant’s definitive proxy statement for its 2017 annual general meeting of shareholders, which proxy statement will be filed with the Securities and Exchange Commission within 120 days after the end of the fiscal year covered by this Form 10-K.

TRADEMARKS


Marvell®, Alaska®, ARMADA® Avanta®, Avastar®, Kirkwood®, Link Street®, Prestera®, Xelerated® and Yukon® are registered trademarks of Marvell International Ltd. and/or its affiliates. Any other trademarks or trade names mentioned are the property of their respective owners.


TABLE OF CONTENTS

  Page
  Page 
Item 1.
Item 1A.
Item 1B.
Item 2.
Item 3.
Item 4.
 

Item 1.

Business

2

Item 1A.

Risk Factors

12

Item 1B.

Unresolved Staff Comments

31

Item 2.

Properties

32

Item 3.

Legal Proceedings

32

Item 4.

Mine Safety Disclosures

32
PART II

Item 5.

33

Item 6.

36

Item 7.

37

Item 7A.

55

Item 8.

57

Item 9.

Item 9A.
Item 9B.
  110

Item 9A.

Controls and Procedures

110

Item 9B.

Other Information

115
PART III

Item 10.

118

Item 11.

122

Item 12.

154

Item 13.

157

Item 14.

  159
PART IV

Item 15.

 161

162

EXPLANATORY NOTE

As previously reported, we were unable to timely file our Quarterly Reports on Form 10-Q for the second and third quarters of fiscal 2016 ended August 1, 2015 and October 31, 2016, respectively, and our Annual Report on Form 10-K for the fiscal year ended January 30, 2016, as a result of the resignation of our independent registered public accounting firm and an Audit Committee investigation as described herein. As previously reported and further set forth herein, we retained Deloitte & Touche LLP as our independent registered public accounting firm and the Audit Committee subsequently completed its investigation. This Form 10-K is being filed concurrently with our Quarterly Reports on Form 10-Q for the periods ended August 1, 2015 and October 31, 2015, respectively.


MARVELL TECHNOLOGY GROUP LTD.

Forward-Looking Statements

This Annual Report on Form 10-K contains forward-looking statements within the meaning of Section 27A of the Securities Act of 1933, as amended (the “Securities Act”), and Section 21E of the Securities Exchange Act of 1934, as amended (the “Exchange Act”), which are subject to the “safe harbor” created by those sections. These statements involve known and unknown risks, uncertainties and other factors, which may cause our actual results to differ materially from those implied by the forward-looking statements. Words such as “anticipates,” “expects,” “intends,” “plans,” “projects,” “believes,” “seeks,” “estimates,” “may,” “can,” “will,” “would” and similar expressions identify such forward-looking statements.

Forward-looking statements are subject to risks and uncertainties that could cause actual results to differ materially from those indicated in the forward-looking statements. Factors that could cause actual results to differ materially from those predicted include, but are not limited to:

our dependence upon the hard disk drive and wireless markets, which are highly cyclical and intensely competitive;

the outcome of pending or future litigation and legal proceedings;

our dependence on a small number of customers;

our ability and the ability of our customers to successfully compete in the markets in which we serve;

our reliance on independent foundries and subcontractors for the manufacture, assembly and testing of our products;

our ability and our customers’ ability to develop new and enhanced products and the adoption of those products in the market;

decreases in our gross margin and results of operations in the future due to a number of factors;

our ability to estimate customer demand and future sales accurately;

our ability to scale our operations in response to changes in demand for existing or new products and services;

the impact of international conflict and continued economic volatility in either domestic or foreign markets;

the effects of transitioning to smaller geometry process technologies;

the risks associated with manufacturing and selling a majority of our products and our customers’ products outside of the United States;

the impact of any change in our application of the United States federal income tax laws and the loss of any beneficial tax treatment that we currently enjoy;

the effects of any potential acquisitions or investments;

our ability to protect our intellectual property;

our ability to regain compliance with our NASDAQ listing qualifications;

the impact and costs associated with changes in international financial and regulatory conditions; and

our maintenance of an effective system of internal controls.


our ability to successfully restructure our operations within our anticipated timeframe announced in November 2016 and with our anticipated amounts of costs and savings;
our dependence upon the hard disk drive market, which is highly cyclical and intensely competitive;
the outcome of pending or future litigation and legal proceedings;
our dependence on a small number of customers;
severe financial hardship or bankruptcy of one or more of our major customers;
our ability and the ability of our customers to successfully compete in the markets in which we serve;
our reliance on independent foundries and subcontractors for the manufacture, assembly and testing of our products;
our ability and our customers’ ability to develop new and enhanced products and the adoption of those products in the market;
decreases in our gross margin and results of operations in the future due to a number of factors;
our ability to estimate customer demand and future sales accurately;
our ability to scale our operations in response to changes in demand for existing or new products and services;
the impact of international conflict and continued economic volatility in either domestic or foreign markets;
the effects of transitioning to smaller geometry process technologies;
the risks associated with manufacturing and selling a majority of our products and our customers’ products outside of the United States;
risks associated with acquisition and consolidation activity in the semiconductor industry;
the impact of any change in our application of the United States federal income tax laws and the loss of any beneficial tax treatment that we currently enjoy;
the effects of any potential acquisitions or investments;
our ability to protect our intellectual property;
the impact and costs associated with changes in international financial and regulatory conditions; and
our maintenance of an effective system of internal controls.

Additional factors that could cause actual results to differ materially include the risks discussed in Part I, Item 1A, “Risk Factors” and Part II, Item 7, “Management’s Discussion and Analysis of Financial Condition and Results of Operations.” These forward-looking statements speak only as of the date hereof. Unless required by law, we undertake no obligation to update publicly any forward-looking statements.


1


PART I


Item 1.Business

Overview

We are a fabless semiconductor provider of high-performance application-specific standard products. Our core strength of expertise is the development of complex System-on-a-Chip (“SoC”) and System-in-a-Package (“SiP”) devices, leveraging our extensive technology portfolio of intellectual property in the areas of analog, mixed-signal, digital signal processing, and embedded and standalone integrated circuits. The majority of our product portfolio leverages embedded central processing unit technology. We also develop platforms that we define as integrated hardware platforms along with software that incorporates digital computing technologies designed and configured to provide an optimized computing solution. Our broad product portfolio includes devices for data storage, enterprise-class Ethernet data switching, Ethernet physical-layer transceivers (“PHY”), wireless connectivity, Internet-of-Things (“IoT”) devicesnetworking and multimedia solutions.connectivity. We were incorporated in Bermuda in January 1995.

Our registered and mailing address is Canon’s Court, 22 Victoria Street, Hamilton HM 12, Bermuda, and our telephone number there is (441) 296-6395. The address of our U.S. operating subsidiary is Marvell Semiconductor, Inc., 5488 Marvell Lane, Santa Clara, California 95054, and our telephone number there is (408) 222-2500. We also have operations in many countries, including China, India, Israel, Italy, Japan, Malaysia, Singapore, South Korea, Spain, SwitzerlandTaiwan and Taiwan.Vietnam. Our fiscal year ends on the Saturday nearest January 31. For example, the fiscal year ended January 30, 2016 is referred to as fiscal 2016.

Available Information

Our website address is located at www.marvell.com. The information contained inon our website does not form any part of this Annual Report on Form 10-K. However, we10-K and is not incorporated by reference herein. We make available free of charge through our website our annual reports on Form 10-K, our quarterly reports on Form 10-Q, our current reports on Form 8-K and amendments to those reports filed or furnished pursuant to Section 13(a) or 15(d) of the Securities Exchange Act of 1934, as amended (the “Exchange Act”), as soon as reasonably practicable after we electronically file this material with, or furnish it to, the U.S. Securities and Exchange Commission (“SEC”).

Our Markets and Products


Over the last several years, we have transitioned from a supplier of stand-alone semiconductor components to a supplier of fully integrated platform solutions. Our platform solutions contain multiple intellectual property components in integrated hardware, along with software that incorporates digital, analog and mixed-signal computing and communication technologies, designed and configured to provide an optimized solution compared to individual components.solution. Our solutions have become increasingly integrated, with more and more components resulting in an all-in-one solution for a given customer’s end product. The demand for such highly integrated platform solutions is generally driven by technological changes and anticipation of the future needs of device manufacturers and end users, as well as,including enterprises, campus and service provider networks and, to an increasing extent, service providers, including cellular network carriers and Internet-based applicationsdata center providers.

A device manufacturer may require high-definition graphics processing, high-definition video and audio, and power management. These platforms will often cross multipletechnologies leveraged from one end market product into products for other end markets, integrating components and technologies traditionally associated with one end market with components and technologies from another end market. For example, we may integrate an applications processor, traditionally associated with the mobile and wireless end market, with software and other components in an end user product targeting the home cloud. Therefore, it has become critical that our products across multiple end markets work together seamlessly.

The integration of these various technologies onto a single piece of silicon is referred to as SoC. The development of SoCs became in high demand over the past decade, with strong market presence in networking

and cloud infrastructure, storage, multimedia and custom specific product solutions. We believe the development of SoCs will continue to grow as more complex chips can be delivered to the different end markets in the years to come.


In addition, software has become increasingly important to our business over the last several years and we expectbelieve software towill become even more relevant as the market expects hardware and software to be delivered as aan integrated solution offering. On-chip software, which acts as the “driver” for the functionality of the chip, has always been a critical part of our business. However, the software and application-level software that we deliver with our chipproducts has become significantly more complex as the range of uses and the needs in application-level software havehas increased. For example, a chipsolution that we develop for storage or networking can contain software that already has a range of functionalities included, or itbuilt in. Alternatively, our solution can offer abilities thatallow our customers to deploy in their operative systemsystems on top of our chip, as well as deploying indeploy their application software on top of it.

The products that we developour SoC.


Our current product offerings are targeted for several key end markets and applications:primarily in three broad product groups: storage, networking and cloud infrastructure, wireless connectivity, multimedia and IoT.connectivity. In storage, we are a market leader in data storage controller solutions spanning consumer, mobile, desktop and enterprise markets. Our storage solutions enable customers to engineer high-volume products for hard disk drives and solid state drives. In IoT, we develop flexibleOur networking products address end markets in cloud, enterprise, small and cost-effective platforms that enable original equipment manufacturers (“OEM”)medium business and original design manufacturers (“ODM”) to quicklyservice provider networks. Our connectivity products address end markets in consumer, enterprise, desktop, service provider networks and cost-effectively reach the market with new, innovative products in this rapidly growing space. We provide a range of silicon and software solutions that enable applications such as wearables, home automation, home security, smart appliances and automotive. For networking and cloud infrastructure, our products and solutions are designed for reliability and resiliency. From robust enterprise networking applications to consumer and small business solutions, our cloud services products power every point in the cloud and networking ecosystem. Our storage, networking multimedia, wirelessand connectivity and video processing products power cutting-edge consumernetworks and digital entertainmentdata centers around the world. The networking & connectivity product groups were previously referred to as smart networked devices empowering consumers to manage and consume content at home or onsolutions.


2


In connection with the go.

AllNovember 2016 announcement of our products are built on the foundation of innovation,plan to restructure our operations to refocus our research and development, increase operational efficiency and improve profitability, we also plan to divest certain businesses and we continuebegan an active program to develop newlocate buyers for several businesses. As of January 28, 2017, two of these businesses were classified as discontinued operations. As required, we retrospectively recast our consolidated statements of operations and cutting-edge technologybalance sheets for all periods presented to enablereflect these businesses as discontinued operations. Unless noted otherwise, the following discussion refers to our customers’ applications. In fiscal 2016, we developed two technologies that have the potential to revolutionize integrated circuit design by decreasing the cost, complexity, power and form factor of next-generation systems and chips. Our Final-Level Cache (“FLCTM”) architecture redefines the main memory hierarchy by substantially reducing the amount of dynamic random access memory needed in a system. Our Modular Chip (“MoChi TM”) technology enables the building of virtual SoCs by connecting together a set of MoChi TM in a modular fashion to implement a final product. Both FLC TM and MoChi TM technologies may become integral parts of our product evolution in the future.

Our current product offerings are primarily in three broad end markets: storage, networking, and mobile and wireless.continuing operations. Our net revenue by end marketproduct group for the last three fiscal years is as follows:

   Year Ended 
   January 30,
2016
      January 31,
2015
      February 1,
2014
     
   (in millions, except for percentages) 

Storage

  $1,201     44 $1,745     47 $1,682     49

Mobile and Wireless

   786     29  1,072     29  839     25

Networking

   552     20  675     18  670     20

Other

   187     7  215     6  213     6


Total

  $2,726     $3,707     $3,404    


 Year Ended
 January 28, 2017   January 30, 2016   January 31, 2015  
 (in millions, except for percentages)
Storage$1,158
 50% $1,201
 45% $1,745
 48%
Networking590
 25% 532
 20% 661
 18%
Connectivity318
 14% 441
 17% 530
 15%
Other252
 11% 475
 18% 701
 19%
Total$2,318
   $2,649
   $3,637
  
Storage

Hard Disk Drive Controllers

Hard disk drive (“HDD”("HDD") controllers provide high-performance input/output (“I/O”)(I/O) interface control between the HDD and the host system. We support a variety of host system interfaces, including serial advanced technology attachment (“SATA”), statistical analysis system (“SAS”), peripheral component interconnect express (“PCIe”)SATA (Serial Advanced Technology Attachment) and universal serial bus (“USB”)SAS (Serial Attached SCSI), which supportssupport the complete range of enterprise, desktop and mobile HDDs.

We are a leading HDD controller supplier and currently supply products to all of the major hard drive manufacturers.

Our HDD controllers with advanced 1 terabyte-per-platter technology for mobile HDDs provide a technological advantage that enablesenable a higher level of data storage on smaller form factors and higher volumetric densities.

Our advanced HDD controller SoCs are designed incorporating the latest Marvell IPs using leading advanced semiconductor process nodes, including Taiwan Semiconductor Manufacturing Company’s (“TSMC”) 16nm FinFet Compact (“FFC”) process node, resulting in the smallest die size, lowest power dissipation and highest performance.

nodes.

We provide advanced Hybrid HDD controller solutions based on our solid state drive (“SSD”) forward flash based concepts utilizing our SSD controller SoCs and Marvell’s differentiated and patented FLC and MoChiTM technologies. Our Hybrid SSDs provide SSD like performance with HDD cost structures.

Our Hybrid HDD solutions incorporate hardware accelerated advanced caching algorithms and are supported by our full turnkey (“FTK”) software system solutions.

Solid-State Drive Controllers

Our SSDsolid-state- drive ("SSD") controller SoCs are targeted at the fast growing market for flash-based storage systems, for the cloud, enterprise, consumer and mobile computing markets, as well as for smartphones and tablets.markets. We support a variety of host system interfaces, including SAS, SATA, PCIe,peripheral component interconnect express ("PCIe"), and non-volatile memory express (“NVMe”("NVMe") and emerging mobile standards.

.

We are a leading supplier of SSD controllers across a range of customers and market segments.

Our advanced SSD controller SoCs are designed incorporatingincorporate the latest Marvell technology using leading advanced process nodes, including TSMC’s 16nm FFC process node, resulting to the smallest die size, lowest power dissipation and leading performance.

nodes.

Our SSD controllers are complemented by our fully featured softwareSDK (software development kitkit) and FTK (Full Turnkey software solutions. We are currently in production using our controllers and FTKs with a number of customers.

)

We are also designing future SSD controllers incorporating our differentiated and patented FLC and MoChiTM technologies.

HDD Components

In fiscal 2016,2017, Marvell re-entered the HDD preamps and motor combo drivers business. We are working with a number of customers in developing and qualifying our components.

Enterprise Storage Solutions

We develop software enabledsoftware-enabled silicon solutions for enterprise, data centers and cloud computing businesses. The solutions include SATA port multipliers, bridges, SATA, SAS and NVMe redundant array of independent disksdisk controllers and converged storage processors.

Networking

Ethernet Solutions

Ethernet connectivity is pervasive throughout networking infrastructures built for enterprise, small and medium business, home office, service provider and data centers. Our Ethernet solutions address a wide variety of end-customer products for those market spaces, from small, cost-effective appliances to large, high-performance modular solutions.
Our Ethernet products include:

a

3


A broad selection of Ethernet Switchesswitches with market optimized advancedmarket-optimized innovative features, such as audio video bridgingadvanced tunneling and network traffic management,routing, high throughput forwarding and packet processing that make networks more effective at delivering content, and rangecontent. Our Ethernet switch product portfolio ranges from low-power, five portfive-port switches to highly integrated, multi terabitmulti-terabit Ethernet SoC devices that can be interconnected to form massive network solutions;

aA broad selection of Ethernet Transceiversphysical-layer transceivers for both fiber and copper interconnect with advanced power management, link security and time synchronization features that complement our Ethernet Switchswitch and Embedded Communication Processors;embedded communication processors; and

aA family of single-chip network interface devices offered in ultra-small form factor with low-power consumption and targeted for client-server network interface cards.

Embedded Communication Processors

Our range of SoC-embedded communication processors provide multi-processor architecturesmulti-core ARM processor architecture optimized to consume low power while simultaneously delivering high-performance per watt. They provide a combination of I/O peripherals, including Ethernet, SATA, SAS, PCIe and USBuniversal serial bus and are ideally suited tofor a range of end-customer networking applications, such as home gateways, networked storage, point-of-service terminals,control plane applications, routers, switches and wireless applicationaccess points and base stations.

Network Processors

Our family of Network Processors offers high-performance-per-watt programmable solutions ideally suited to applications where flexible functionality for differentiated, value-add solutions and enhanced quality of service are essential, such as in carrier Ethernet access, aggregation, mobile backhaul, transport and mobile cloud platforms. They also offer 1G through 100G Ethernet connectivity into a multi-hundred gigabit Ethernet pipeline that has deterministic performance and ideally suited for software-defined networking.

Mobile and Wireless

Communications and Applications Processors

We offer “thin modems,” highly optimized multi-mode baseband modem devices without an application processor. In September 2015, we announced a significant restructuring of our mobile platform business in order to focus research and development on more profitable opportunities and align our expenses with corporate targets. As a result, we have discontinued the development and marketing of our communications and applications processors targeted for mobile handsets.

Connectivity

We offer a varietybroad portfolio of connectivity solutions, including Wi-Fi, and Wi-Fi/Bluetooth global positioning system (“GPS”) and ZigBee.integrated SOCs. These products are integrated into a wide variety of end devices, such as enterprise access points, home gateways, multimedia devices, gaming, devices, printers, enterprise solutions, video dongles tablets, in-carautomotive infotainment and telematics units, and smart appliances.industrial devices. Our products are well positionedwell-positioned to deliver low-power and high-performance functionality with cutting-edge technologies, and to lead the latest technologies that follow evolutionfast-paced developments of IEEE 802.11standards. We have a broad wirelessWi-Fi 802.11 and Bluetooth standards. Our connectivity product portfolio that includes a single stream 1x1, as well as multi-stream 2x2 and 4x4 multiple input multiple output (“MIMO”) devices,devices. We deliver both the radio control and we are developing

��

5


8x8 MIMO 802.11ax solutions. Asprocessing as well as the RF components for a result of the restructuring of our mobile platform business announced in September 2015, our connectivity solutions are no longer being targeted for mobile phones.

Mobile Computing

We offer high-performance applications processors that are designed to deliver advanced integration, excellent multimedia performance and superior power consumption savings for mobile computing products. These products have been incorporated into tablets, notebooks, eReaders, gaming devices, scanners and educational devices.

Other Technologies

We incorporate a variety of other technologies into our platforms, depending on the needs of our customers and their end products, including power management, GPS, radio frequency (“RF”) and memory. As a result of the restructuring of our mobile platform business announced in September 2015, we have also discontinued development and marketing of our power management, GPS, RF and memory into mobile platform designs.

complete customer solution.

Other Products

Printing Solutions

& Custom ASIC

Our printer SoC products power many of today’s laser and ink printers and multi-function peripherals. These SoCs include a family of printer-specific standard products as well as full-custom printerapplication-specific integrated circuits.

Smart Home Products

Communications and Application Processors
While we exited the mobile market in September 2015, several customers continue to ship our LTE communications processors. Our smart home products are designed to enable the next generationseparate line of connected consumer platforms,application processors is targeted for non-mobile applications and to enhance the eco-friendly “Connected Lifestyle” throughout the home,deliver leading-edge performance for today’s embedded and include platforms for set-top boxes, video dongles such as Google Chromecast and smart appliances.

Internet of Things solutions.

Financial Information about Segments and Geographic Areas

We have determined that we operate in one reportable business segment: the design, development and sale of integrated circuits. For information regarding our revenue by geographic area, and property and equipment by geographic area, please see “Note 13 — Segment and Geographic Information” in our Notes to the Consolidated Financial Statements set forth in Part II, Item 8 of this Annual Report on Form 10-K.

See “Risk Factors” under Item 1A of this Annual Report on Form 10-K for a discussion of the risks associated with our international operations.    

Customers, Sales and Marketing

As a fabless semiconductor company, our

Our target customers are OEMsoriginal equipment manufacturers and ODMs,original design manufacturers, both of which design and manufacture end market devices. Our sales force is strategically aligned along key customer lines in order to offer fully integrated platforms to our customers. In this way, we believe we can more effectively offer a broader set of content into our key customers’ end products, without having multiple product groups separately engage the same customer. We complement and support our direct sales force with manufacturers’ representatives for our products in North America, Europe and Asia. In addition, we have distributors who support our sales and marketing activities in the United States, Europe and Asia. We also use third-party logistics providers who maintain warehouses in close proximity to our customers’ facilities. We expect that a significant percentage of our sales will continue to come from direct sales to key customers.

We use field application engineers to provide technical support and assistance to existing and potential customers in designing, testing and qualifying systems designs that incorporate our products. We believe that superior field applications engineering support plays a pivotal role in building long-term relationships with

customers by improving our customers’ time-to-market, maintaining a high level of customer satisfaction and encouraging customers to use our next-generation products. Our marketing team works in conjunction with our field sales and application engineering force, and is organized around our product applications and end markets.

groups.


4


Historically, a relatively small number of customers have accounted for a significant portion of our net revenue. Net revenue attributable to significant customers whose revenues as a percentage of net revenue was 10% or greater of total net revenues is presented in the following table:

    Year Ended 
   January 30,
2016
  January 31,
2015
  February 1,
2014
 

End Customer:


Western Digital

   18  20  24

Seagate

   13  13  12

Distributor:


Wintech

   *  11  *

*Less than 10% of net revenue

 Year Ended
 
January 28,
2017
 
January 30,
2016
 
January 31,
2015
Customer:     
Western Digital*21% 19% 20%
Toshiba13% **%
 **%
Seagate9% 14% 13%
Wintech10% **%
 11%
      
* The percentage of net revenues reported for Western Digital for fiscal year 2017 includes net revenue of HGST and SanDisk that became subsidiaries of Western Digital in late fiscal 2016.
** Less than 10% of net revenue
A significant number of our products are being incorporated into consumer electronics products, including gaming devices and personal computers, which are subject to significant seasonality and fluctuations in demand. HolidaySeasonality, including holiday and back to school buying trends, may at times negatively impact our results in the first and fourth quarter, and positively impact our results in the second and third quarter of our fiscal years. In addition, the timing of new product introductions by our customers may cause variations in our quarterly revenues, which may not be indicative of future trends.

Inventory and Working Capital

We place firm orders for products with our suppliers generally up to 16 weeks prior to the anticipated delivery date and typically prior to an order for the product. These lead times typically change based on the current capacity at the foundries. We often maintain substantial inventories of our products because the semiconductor industry is characterized by short lead time orders and quick delivery schedules. In addition, increased use of “hubs” managed by third-party logistics providers has resulted in a higher number of inventory locations and higher overall inventory levels.

Backlog

We do not believe that backlog is a meaningful or reliable indicator for future demand, due to the following:

an industry practice that allows customers to cancel or change orders prior to the scheduled shipment dates;

an increasing portion of our revenue comes from products shipped to customers using third-party logistics providers, or “hubs” wherein the product can be pulled at any time by the customer and is therefore never reflected in backlog; and

scheduled future shipments include shipments to distributors for which we do not recognize revenue until the products are sold to end customers.

Research and Development

We believe that our future success depends on our ability to introduce improvements to our existing products and to develop new products that deliver cost-effective solutions for both existing and new markets. Our research and development efforts are directed largely to the development of high-performance analog, mixed-signal, digital signal processing and embedded microprocessor integrated circuits with the smallest die size and

lowest power. We devote a significant portion of our resources to expanding our product portfolio based on a broad intellectual property portfolio with designs that enable high-performance, reliable communications over a variety of physical transmission media. We are also focused on incorporating functions currently provided by stand-alone integrated circuits into our integrated platform solutions to reduce our customers’ overall system costs.

We have assembled a core team of engineers who have extensive experience in the areas of mixed-signal circuit design, digital signal processing, embedded microprocessors, complementary metal oxide semiconductor (“CMOS”) technology and system-level architectures. We have invested and will continue to invest a significant amount of funds for research and development. Our research and development expense was $1.1$0.8 billion, $1.2$1.0 billion and $1.2$1.1 billion in fiscal 2017, 2016 and 2015, respectively. See our discussion of research and 2014, respectively.

development expenses in Item 7, Management’s Discussion and Analysis of Financial Condition and Results of Operations, of this Annual Report on Form 10-K for further information.

Manufacturing


5


Integrated Circuit Fabrication

The vast majority of our integrated circuits are fabricated using widely available CMOS processes, which provide greater flexibility to engage independent foundries to manufacture integrated circuits at lower costs. By outsourcing manufacturing, we are able to avoid the cost associated with owning and operating our own manufacturing facility. This allows us to focus our efforts on the design and marketing of our products. We currently outsource a large percentage of our integrated circuit manufacturing to Taiwan Semiconductor Manufacturing Company. We also utilize United Microelectronics Corporation, with the remaining manufacturing outsourced to other foundries located primarily in Asia. We work closely with our foundry partners to forecast on a monthly basis our manufacturing capacity requirements. We closely monitor foundry production to ensure consistent overall quality, reliability and yield levels. Our integrated circuits are currently fabricated in several advanced manufacturing processes up to and including 28 nanometer.processes. Because finer manufacturing processes lead to enhanced performance, smaller silicon chip size and lower power requirements, we continually evaluate the benefits and feasibility of migrating to smaller geometry process technology in order to reduce cost and improve performance.

Assembly and Test

We outsource all product packaging and testing requirements for our products in production to several assembly and test subcontractors primarily located in China, Korea, Singapore and Taiwan.

Environmental Management

We believe that our products comply with the current Restriction of Hazardous Substances Directive, the European legislation that restricts the use of a number of substances, including lead, and the Regulation, Evaluation and Authorization of Chemicals SVHC Substances Directive. In addition, each of our manufacturing subcontractors complies with ISO 14001:2004, the international standard related to environmental management. We are also working to establish a “conflict-free” supply chain, including ethical sourcing of certain minerals for our products.

Intellectual Property

Our future revenue growth and overall success depend in large part on our ability to protect our intellectual property. We rely on a combination of patents, copyrights, trademarks, trade secret laws, contractual provisions, confidentiality agreements and licenses to protect our intellectual property. As of January 30, 2016,28, 2017, we have been issued and/or have acquired over 6,200 U.S. patents and over 1,700 foreign patents with expiration dates ranging from 2016 to 2036. We also have more than 5,200approximately 8,700 U.S. and foreign pendingpatents issued and approximately 2,000 U.S. and foreign patent applications pending on various aspects of our technology. While we believe the duration of of our patents generally covers the expected lives of our products, our patents may not collectively or individually cover every feature on innovation in our product. In addition, our efforts may not be sufficient to protect our intellectual property from misappropriation or infringement. See “Risk Factors” under Item 1A of this Annual Report on Form 10-K for a discussion of the risks associated with our patents and intellectual property, including the risk that our patents

may be invalidated, the risk that third parties may copy or otherwise obtain and use our products and technology without authorization, and the risks involved with operating in foreign countries where the laws are not as protective of our intellectual property as in the United States.

property.

We have expended and will continue to expend considerable resources in establishing a patent position designed to protect our intellectual property. While our ability to compete is enhanced by our ability to protect our intellectual property, we believe that in view of the rapid pace of technological change, the combination of the technical experience and innovative skills of our employees may be as important to our business as the legal protection of our patents and other proprietary information.

From time to time, we may desire or be required to renew or to obtain licenses from third parties in order to further develop and effectively market commercially viable products or in connection with a pending or future claim or action asserted against us. We cannot be sure that any necessary licenses will be available or will be available on commercially reasonable terms.

The integrated circuit industry is characterized by vigorous pursuit and protection of intellectual property rights, which has resulted in significant and often time consuming and expensive litigation. From time to time, we receive, and may continue to receive in the future, notices that claim we have infringed upon, misappropriated or misused the proprietary rights of other parties. For instance, we have had a dispute with Dr. Sehat Sutardja, our former Chief Executive Officer and a current member of our board of directors, related to his stated belief of ownership of certain patent rights related to the Final-Level Cache invention and his later assignment of associated patent applications to Marvell. Our Audit Committee investigated this claim and concluded that the FLC invention was owned by the Company.

In addition, we have in the past and may in the future be sued by other parties who claim that we have infringed their patents or misappropriated or misused their trade secrets, or who may seek to invalidate one or more of our patents. Although we defend these claims vigorously, it is possible that we will not prevail in pending or future lawsuits. Furthermore, we may need to engage in litigation in the future to enforce our intellectual property rights or the rights of our customers, to protect our trade secrets or to determine the validity and scope of proprietary rights of others, including our customers. All such litigation, even if not valid or successfully asserted, could result in significant costs and a diversion of management and personnel resources, which could materially and adversely affect our business, financial condition and results of operations. See “Risk Factors” under Item 1A of this Annual Report on Form 10-K and “Note 10 — Commitments and Contingencies” in our Notes to the Consolidated Financial Statements set forth in Part II, Item 8, of this Annual Report on Form 10-K for further discussion of the risks associated with patent litigation matters.

Competition

The markets for our products, particularly in the mobilenetworking and wireless end market,connectivity, are intensely competitive, and are characterized by rapid technological change, evolving industry standards, frequent new product introductions short product life cycles and pricing pressures imposed by high-volume customers and competitors, particularly in the product markets that we are targeting.

6


pressures. Competition has intensified as a result of the increasing demand for higher levels of performance and integration and smaller process geometries, and wegeometries. We expect competition to intensify as current competitors continue to strengthen the depth and breadth of their product offerings, and new competitors enter our markets. In addition, we expect competitive pressure from our customers to increase as they may continue to increase the vertical nature of their businesseither through in-house development or by developing their own in-house solutions.

acquiring existing technology. We believe that our ability to compete successfully in the rapidly evolving markets for our products depends on a number of factors, including, the:

but not limited to:

The performance, features, quality and price of our products;

The timing and success of new product introductions by us, our customers and our competitors;

emergence, andEmergence, rate of adoption and acceptance of new industry standards;

Our ability to obtain adequate foundry capacity;capacity with the appropriate technological capability; and

The number and nature of our competitors in a given market.

Our major competitors by end market are as follows:

Mobile and Wireless

Storage

Networking

Broadcom Limited

Broadcom LimitedBroadcom Limited

MediaTek, Inc.

Cavium, Inc.

QUALCOMM Incorporated

NXP Semiconductors

Spreadtrum Communications, Inc.

Intel Corporation

for our products include Broadcom Limited, Cavium, Inc., MediaTek, Inc., QUALCOMM, Inc., Quantenna Communications Inc. and Silicon Motion Technology Corporation. We expect increased competition in the future from emerging or established companies, or alliances among competitors, customers or other third parties, any of which could acquire significant market share. Although we believe we will be able to successfully compete with existing and potential competitors, some of these current and potential competitors may have advantages over us that allow them to compete effectively against us. Our current or future competitors could also introduce products that are priced lower, provide superior performance or are based on new or emerging technologies. Furthermore, some of our customers have already developed, or in the future may develop, technologies that could compete directly with our products. See “Risk Factors” under Item 1A of this Annual Report on Form 10-K for furthera discussion of competitive risks associated with our business.

Historically, average unit selling prices in the integrated circuit industry in general, and for our products in particular, have decreased over the life of a particular product. We expect that the average unit selling prices of our products will continue to be subject to significant pricing pressures. In order to offset expected declines in the selling prices of our products, we will need to continue to introduce innovative new products and reduce the cost of our products. To accomplish this, we intend to continue to implement design changes that lower the cost of manufacturing, and assemblingassembly and testing of our products. We may also enter into long-term, strategic arrangements with foundry partners to secure wafer capacity at reduced prices, by negotiating reduced charges from our foundries. Because we do not operate our own manufacturing, assembly or testing facilities, we may not be able to reduce our costs as rapidly as companies that operate their own facilities. See “Risk Factors” under Item 1A of this Annual Report on Form 10-K for furthera discussion of pricing risks.

Employees

As of January 30, 2016,28, 2017, we had a total of 5,4374,617 employees.

Executive Officers of the Registrant

The following table shows information about our executive officers as of July 12, 2016:

Name

Item 1A.

Age

Position(s)

Richard S. Hill

64Chairman of the Board and Interim Principal Executive Officer

Matthew J. Murphy

43President and Chief Executive Officer

Dr. Pantelis Alexopoulos

67Executive Vice President, Storage Business Group

David P. Eichler

67Interim Chief Financial Officer

Mitchell Gaynor

56Executive Vice President, Chief Legal Officer and Secretary

Chris Koopmans

39Executive Vice President, Marketing and Sales

Andy Micallef

51Chief Operations Officer

Maya Strelar-Migotti

59Executive Vice President, Smart Networked Devices and Solutions Business Group

Dr. Zining Wu

44Chief Technology OfficerRisk Factors

Richard S. Hill has served as our Chairman of the Board of Directors since May 2016 and our Interim Principal Executive Officer since July 2016. Mr. Hill has served as a member of the Board of Directors of Tessera Technologies since August 2012 and as Chairman of the Board since March 2013. Mr. Hill also served as Tessera’s Interim Chief Executive Officer from April 15, 2013 until May 29, 2013. Mr. Hill previously served as the Chairman and Chief Executive Officer and member of the board of directors of Novellus Systems Inc. until its acquisition by Lam Research Corporation in June 2012. Before joining Novellus in 1993, Mr. Hill spent 12 years with Tektronix Corporation, a leading designer and manufacturer of test and measurement devices. Presently, Mr. Hill is a member of the Boards of Directors of Autodesk, Inc., Arrow Electronics, Inc., Cabot Microelectronics Corporation, and Yahoo, Inc. Mr. Hill received a Bachelor of Science in Bioengineering from the University of Illinois in Chicago and a Master of Business Administration from Syracuse University. Mr. Hill brings to the board extensive expertise in executive management and engineering for technology companies, as well as considerable directorial and governance experience developed through his service on the boards of directors of several public companies, to his role as Chairman of the Board.

Matthew J. Murphyhas served as President and Chief Executive Officer since July 11, 2016. Mr. Murphy joined Marvell from Maxim Integrated, where he spent 22 years with increasing responsibilities in sales and business unit leadership roles. Most recently, he was Executive Vice President, Business Units, Sales & Marketing. In this capacity he had company-wide profit and loss responsibility, leading all product development, sales and field applications, marketing, and central engineering. From 2011 to 2015, he was Senior Vice President of the Communications and Automotive Solutions Group, leading the team that developed differentiated solutions for those markets. From 2006 to 2011, he was Vice President, Worldwide Sales & Marketing during a time when Maxim’s sales expanded significantly. Prior to 2006, he served in a variety of business unit management and customer operations roles. Mr. Murphy holds a Bachelor of Arts in English from Franklin & Marshall College and is a graduate of the 2010 Stanford Executive Program.

Dr. Pantelis Alexopouloshas served as Senior Vice President of the Storage Business Group at Marvell since August 2015 and was promoted to Executive Vice President in April 2016. He served as the Company’s Co-Interim Chief Executive Officer from April 2016 through July 2016. Dr. Alexopoulos joined Marvell from the Agency for Science, Technology and Research (“A*STAR”), located in Singapore, where he served as Executive Director of the Data Storage Institute from February 2010 to July 2015. Prior to his tenure at A*STAR, Dr. Alexopoulos held senior executive management roles at major storage companies TDK Fujitsu Philippines Corporation, Seagate and Maxtor. Dr. Alexopoulos holds a Ph.D. in Materials Science and Engineering from Cornell University, a Master of Science degree in Materials Science and Engineering from the University of Utah, and a Bachelor of Science degree in Physics from Aristotle University of Thessaloniki.

David P. Eichler has served as Interim Chief Financial Officer since October 2015. Mr. Eichler brings to us more than 20 years of Chief Financial Officer and senior-level finance executive leadership, as well as broad operational experience with leading public and private high-growth and transition companies in the high-tech sector. Mr. Eichler has served as Chief Financial Officer for a variety of semiconductor, software and electronics companies during his career including Catalyst Semiconductor, Phoenix Technologies, Intellisync, Inc., Alliance Semiconductor and Hyundai Electronics. His diverse skill set includes extensive experience with financings, restructuring, merger and acquisition transactions, strategic planning, public company reporting and governance as well as international operations. In addition, Mr. Eichler has held director-level positions for several private companies. Mr. Eichler holds a Master of Business Administration in finance from the University of California, Los Angeles and a Bachelor of Science in Business Administration and Accounting from Northeastern University.

Mitchell Gaynorhas served as Executive Vice President, Chief Legal Officer and Secretary since May 2016. From 2004 through 2015, Mr. Gaynor held a variety of senior legal roles at Juniper Networks, Inc., most recently as Executive Vice President, General Counsel, and Secretary. Previous to Juniper, he served as General Counsel at Portal Software, Inc. from 1999-2004 and as General Counsel and other senior legal roles at Sybase, Inc. from 1993-1999. Mr. Gaynor started his legal career at Brobeck, Phleger and Harrison, LLP in 1984. Mr. Gaynor

holds a Juris Doctor degree from the University of California, Hastings College of the Law and a Bachelor of Arts degree in history from the University of California, Berkeley.

Chris Koopmanshas served as Executive Vice President, Marketing and Sales, since June 2016. Mr. Koopmans joined us from Citrix Systems, Inc., where he was Vice President and General Manager of Service Provider Platforms since 2012. Prior to Citrix, Mr. Koopmans was a founding team member at Bytemobile, Inc., a leading provider of mobile video and web optimization and traffic management solutions. At Bytemobile, he served in a variety of senior leadership roles and ultimately as Chief Operating Officer until the company was acquired by Citrix in 2012. Mr. Koopmans holds a Bachelor of Science in Electrical and Computer Engineering from the University of Illinois, Urbana-Champaign and was awarded a National Science Foundation fellowship to pursue studies toward his Ph.D. prior to leaving to join Bytemobile in 2000.

Andy Micallefhas served as Chief Operations Officer since June 2016. He joined us from Intersil Corporation where he was Senior Vice President of Operations since January 2015. Prior to Intersil, Mr. Micallef was Vice President of Operations at Audience, Inc. from 2010 to 2015, Executive Vice President of Operations at LSI Corporation from 2007 to 2010, and Executive Vice President of Global Operations at Agere Systems from 2005-2007. Mr. Micallef holds a Bachelor of Science degree in Mechanical Engineering from the University of Notre Dame, a Master of Science degree in Mechanical Engineering and a Master of Business Administration from the University of Michigan.

Maya Strelar-Migotti has served as Senior Vice President, Smart Networked Devices and Solutions Business Group since August 2015 and was promoted to Executive Vice President in April 2016. She served as the Company’s Co-Interim Chief Executive Officer from April 2016 through July 2016. For 15 years prior to joining Marvell, Ms. Strelar-Migotti held a number of senior executive roles within Ericsson and has managed organizations and customer programs in North America, Europe, China and India. From June 2009 until August 2015, Ms. Strelar-Migotti was Head of the Ericsson Silicon Valley Site, and Vice President of the IP and Broadband Development Organization in Ericsson. Ms. Strelar-Migotti holds a Bachelor of Science degree in Electrical Engineering and Telecommunications and Informatics from the University of Zagreb Croatia and has completed executive training at New York’s Columbia University.

Dr. Zining Wu has served as our Chief Technology Officer since January 2014. From August 2008 to January 2014, Dr. Wu served as MSI’s Vice President, Data Storage Technology. Prior to August 2008, Dr. Wu worked as an engineer and in various managerial roles in MSI’s Storage group since July 1999. Dr. Wu holds a Bachelor of Science degree in Electronic Engineering from Tsinghua University in Beijing, China, and a Master of Science degree and Ph.D. in Electrical Engineering from Stanford University. Dr. Wu holds over 280 U.S. patents and has published eight technical papers and a book related to data storage technology.

Item 1A.Risk Factors

Investing in our common shares involves a high degree of risk. You should carefully consider the risks and uncertainties described below and all information contained in this report before you decide to purchase our common shares. Many of these risks and uncertainties are beyond our control, including business cycles and seasonal trends of the computing, semiconductor and related industries and end markets. If any of the possible adverse events described below actually occurs, we may be unable to conduct our business as currently planned and our financial condition and operating results could be harmed. In addition, the trading price of our common shares could decline due to the occurrence of any of these risks, and you could lose all or part of your investment.

Factors That May Affect Future Results

Our financial condition and results of operations may vary from quarter to quarter, which may cause the price of our common shares to decline.

Our quarterly results of operations have fluctuated in the past and could do so in the future. Because our results of operations are difficult to predict, you should not rely on quarterly comparisons of our results of operations as an indication of our future performance.

Fluctuations in our results of operations may be due to a number of factors, including, but not limited to, those listed below and those identified throughout this “Risk Factors” section:

changes in general economic and political conditions and specific conditions in the end markets we address, including the continuing volatility in the technology sector and semiconductor industry;

the highly competitive nature of the end markets we serve, particularly within the semiconductor industry;

our dependence on a few customers for a significant portion of our revenue;

severe financial hardship or bankruptcy of one or more of our major customers;
our ability to maintain a competitive cost structure for our manufacturing and assembly and test processes and our reliance on third parties to produce our products;
our ability to successfully restructure our operations within our anticipated timeframe announced in November 2016 and with our anticipated savings;

7


the effects of any potential acquisitions, divestitures or significant investments;
any current and future litigation that could result in substantial costs and a diversion of management’s attention and resources that are needed to successfully maintain and grow our business;

our dependence on a few customers for a significant portion of our revenue;

our ability to maintain a competitive cost structure for our manufacturing and assembly and test processes and our reliance on third parties to produce our products;

cancellations, rescheduling or deferrals of significant customer orders or shipments, as well as the ability of our customers to manage inventory;

gain or loss of a design win or key customer;

seasonality in sales of consumer devices in which our products are incorporated;

failure to qualify our products or our suppliers’ manufacturing lines;

our ability to develop and introduce new and enhanced products in a timely and effective manner, as well as our ability to anticipate and adapt to changes in technology;

failure to protect our intellectual property;

impact of a significant natural disaster, including earthquakes, floods and tsunamis, particularly in certain regions in which we operate or own buildings, such as Santa Clara, California and where our third party suppliers operate, such as Taiwan and elsewhere in the Pacific Rim; and

our ability to attract and retain a highly skilled workforce, especially managerial, engineering, sales and marketing personnel.

Due to fluctuations in our quarterly results of operations and other factors, the price at which our common shares will trade is likely to continue to be highly volatile. From February 2, 2014 through January 30, 2016,During fiscal 2017, our common shares traded as low as $7.40$8.32 and as high as $16.78$15.45 per share. Accordingly, you may not be able to resell your common shares at or above the price you paid. In future periods, our stock price could decline if, amongst other factors, our revenues or operating results are below our estimates or the estimates or expectations of securities analysts and investors. As a result of stock price volatility, we may be subject to securities class action litigation. Any litigation could result in substantial costs and a diversion of management’s attention and resources that are needed to successfully maintain and grow our business.


If we fail to appropriately scale our operations in response to changes in demand for our existing products or to the demand for new products requested by our customers, including efforts such as our restructuring announced in November 2016, our business and profitability could be materially and adversely affected.
To achieve our business objectives, it may be necessary from time to time for us to expand or contract our operations. For example, in November 2016, we announced a plan to restructure our operations to refocus our research and development, increase operational efficiency and improve profitability. We expect that the restructuring actions, which include discontinuing investment in specific research and development programs, streamlining engineering processes, and consolidating research and development sites, will eliminate approximately 900 positions worldwide. In addition, we are in the process of divesting certain businesses. These actions are expected to be fully executed by the end of October 2017.
Our ability to scale our workforce and operations in a sufficiently timely manner to respond effectively to changes in demand for our existing products, or to the demand for new products requested by our customers, is critical to our future success. While we expect to realize efficiencies from these actions, these activities might not produce the full efficiency and cost reduction benefits we expect. Further, such benefits might be realized later than expected, and the ongoing costs of implementing these measures might be greater than anticipated. If these measures are not successful or sustainable, we might undertake additional realignment and cost reduction efforts, which could result in future charges. In the event that we are unable to execute on our restructuring plan to the extent currently anticipated, our ability to meet competitive challenges or exploit key market opportunities could be materially and adversely affected.

Any potential future acquisitions, strategic investments, divestitures, mergers or joint ventures may subject us to significant risks, any of which could harm our business.

Our long-term strategy may include identifying and acquiring, investing in or merging with suitable candidates on acceptable terms, or divesting of certain business lines or activities. In particular, over time, we may acquire, make investments in, or merge with providers of product offerings that complement our business or may terminate such activities. Mergers, acquisitions and divestitures include a number of risks and present financial, managerial and operational challenges, including but not limited to:


8


diversion of management attention from running our existing business;

increased expenses, including but not limited to legal, administrative and compensation expenses related to newly hired or terminated employees;

increased costs to integrate or, in the case of a divestiture, separate the technology, personnel, customer base and business practices of the acquired or divested business or assets;

potential exposure to material liabilities not discovered in the due diligence process;

potential adverse effects on reported operating results due to possible write-down of goodwill and other intangible assets associated with acquisitions;

potential damage to customer relationships or loss of synergies in the case of divestitures; and

unavailability of acquisition financing on reasonable terms or at all.

Any acquired business, technology, service or product could significantly under-perform relative to our expectations and may not achieve the benefits we expect from possible acquisitions. Given that our resources are limited, our decision to pursue a transaction has opportunity costs; accordingly, if we pursue a particular transaction, we may need to forgo the prospect of entering into other transactions that could help us achieve our strategic objectives.

When we decide to sell assets or a business, we may have difficulty selling on acceptable terms in a timely manner. These circumstances could delay the achievement of our strategic objectives or cause us to incur additional expense, or we may sell a business at a price or on terms that are less favorable than we had anticipated, resulting in a loss on the transaction.

If we do enter into agreements with respect to acquisitions, divestitures, or other transactions, we may fail to complete them due to factors such as:

failure to obtain regulatory or other approvals;

IP disputes or other litigation; or

difficulties obtaining financing for the transaction.

For all these reasons, our pursuit of an acquisition, investment, divestiture, merger or joint venture could cause our actual results to differ materially from those anticipated.

We operate in intensely competitive markets, and our failure to compete effectively would harm our results of operations.


The semiconductor industry, and specifically the data storage, networking mobile and wireless communicationsconnectivity markets, are extremely competitive, and we expect competition to intensify as current competitors expand their product offerings and new competitors enter the market. This has especially intensified

as semiconductor companies have begun to offer more integrated platforms. We expect competition to continue to increase as industry standards continue to evolve and become better known, and others realize the market potential of this trend to platform integration.competitive. We currently compete with a number of large domestic and international companies in the business of designing integrated circuits and related applications, some of which have greater financial, technical and management resources than us. Our efforts to introduce new products into markets with entrenched competitors will expose us to additional competitive pressures. For example, we are facing, and expect we will continue to face, significant competition in the networking market. Additionally, customer expectations and requirements have been evolving rapidly. For example, customers now expect us to provide turnkey solutions.solutions and commit to future roadmaps that have technical risks. Some of our competitors may be better situated to meet changing customer needs. Asneeds and secure design wins. Increasing competition in the markets in which we operate continues to increase,may negatively impact our revenues and gross margins may decline.margins. For example, competitors with greater financial resources may be able to offer lower prices than us, or they may offer additional products, services or other incentives that we may not be able to match. In addition, many of our competitors operate and maintain their own fabrication facilities and have longer operating histories, greater name recognition, larger customer bases, and greater sales, marketing and distribution resources than we do. Furthermore, our current and potential competitors in the data communication and wireless markets have established or may establish financial and strategic relationships among themselves or with existing or potential customers or other third parties to increase the ability of their products to address the needs of customers. Accordingly, new competitors or alliances among these competitors may acquire significant market share, which would harm our business. While we continue to pursue similar strategic relationships, and currently have significant financial and technical resources, we cannot ensureassure you that we will be able to continue to


9


compete successfully against existing or new competitors, which would harm our results of operations.

As the technology inflections happen, our competitors may get ahead of us and negatively impact our market share.


In addition, the semiconductor providers haveindustry has experienced increased consolidation over the past several years. For example, Avago Technologies Limited (which has renamed itself as(now Broadcom Limited (“Broadcom”)) acquired Broadcom Corporation in February 2016 and LSI Corporation in May 2014, and2014; Intel acquired Altera Corporation in December 2015; and NXP Semiconductors acquired Freescale Semiconductor, Ltd., each in December 2015. These transactions and other pending transactions may further consolidate competition in our industry. Consolidation among our competitors could lead to a changing competitive landscape, capabilities and market share, which could put us at a competitive disadvantage and harm our results of operations.

A significant portion of our business is dependent on the HDD industry, which is highly cyclical, experiences rapid technological change, is subject to industry consolidation and is facing increased competition from alternative technologies.


The HDD industry is intensely competitive and the technology changesinflections are happening rapidly. This industry has historically been cyclical, with periods of increased demand and rapid growth followed by periods of oversupply and subsequent contraction. These cycles may affect us because some of our largest customers are participantsparticipate in this industry. For example, in fiscal 2016, our revenue was negatively affected by a meaningful decline in overall HDD unit demand.


HDD manufacturers tend to order more components than they may need during growth periods, and sharply reduce orders for components during periods of contraction. Rapid technological changes in the HDD industry often result in shifts in market share among the industry’s participants. If the HDD manufacturers using our products do not retain or increase their market share, our sales may decrease.


In addition, the HDD industry has experienced consolidation in the past. For example, Western Digital completed the acquisition of Hitachi’s HDD unit in March 2012, Seagate Technology PLC (“Seagate”) completed the acquisition of Samsung’s HDD unit in December 2011 and Toshiba acquired the HDD operations of Fujitsu during fiscal 2010.significant consolidation. Consolidation among our customers could lead to changing demand for our products, replacement of our products by the merged entity with those of our competitors and cancellation of orders, each of which could harm our results of operations. If we are unable to leverage our technology and customer relationships, we may not capitalize on the increased opportunities for our products within the combined company.


Furthermore, future changes in the nature of information storage products and personal computing devices could reduce demand for traditional HDDs. For example, products using alternative technologies, such as SSD and other storage technologies could becomeare a source of competition to manufacturers of HDDs. Although we offer SSD controllers, leveraging our technology in hard drives, we cannot ensure wethat our overall business will not be able to maintain significant market shareadversely affected if demand for traditional HDDs decreases. Additionally, we depend on a few customers for our SSD controllers and as such, the loss of any SSD controller customer or a significant reduction in sales we make to them (for example, as a result of a significant drop in market share) may harm our financial condition and results of operations.

Unlike in the HDD industry, SSD customers may develop their own controllers, which could pose a challenge to our market share in the SSD space.

Our sales are concentrated in a few customers, and iflarge customers. If we lose or experience a significant reduction in sales to any of these key customers, or if any of these key customers experience a significant decline in market share, or if any of these customers experience significant financial difficulties, our revenues may decrease substantially.

substantially and our results of operations and financial condition may be harmed.

We receive a significant amount of our revenues from a limited number of customers. Net revenue from our two largest customers represented 31%34% and 33% of our net revenue for the year ended January 30, 2016.fiscal 2017 and fiscal 2016, respectively. Sales to our largest customers have fluctuated significantly from period to period and year to year and will likely continue to fluctuate in the future, primarily due to the timing and number of design wins with each customer, natural disasters that may divert a customer’s operations, as well as the continued diversification of our customer base as we expand into new markets, and will likely continue to fluctuate in the future.natural disasters or other issues that may divert a customer’s operations. The loss of any of our large customers or a significant reduction in sales we make to them would likely harm our financial condition and results of operations. To the extent one or more of our large customers experience significant financial difficulty, bankruptcy or insolvency, this could have a material adverse effect on our sales and our ability to collect on receivables, which could harm our financial condition and results of operations. For example, Toshiba Corporation has recently announced significant financial difficulties not directly related to their semiconductor business but which may have an adverse effect on its overall financial condition or result in a divestiture of the semiconductor portion of its business that purchases our products.

Our operating results in the foreseeable future will continue to depend on sales to a relatively small number of customers, as well as the ability of these customers to sell products that incorporate our products. In the future, these customers may decide not to purchase our products at all, purchase fewer products than they did in the past, or alter their purchasing patterns in some other way, particularly because:


10


a significant portion of our sales are made on a purchase order basis, which permitsallows our customers to cancel, change or delay product purchase commitments with relatively short notice to us;


customers may purchase integrated circuits from our competitors;


customers may discontinue sales or lose market share in the markets for which they purchase our products (for example, a significant customer of our SSD products has recently seen a significant drop in its market share);

products;


customers may develop their own solutions or acquire fully developed solutions from third-parties (for example, in September 2014, Seagate acquired the SSD business from Broadcom); or

third-parties;


customers may be subject to severe business disruptions.

We have been named as a party to several legal proceedings and may be named in additional ones in the future, including litigation involving our patents and other intellectual property, which could subject us to liability, require us to indemnify our customers, require us to obtain or renew licenses, or to stop selling our products or force us to redesign our products.

We have been named as a party to several lawsuits, government inquiries or investigations and other legal proceedings (referred to as “litigation”), and we may be named in additional ones in the future. Please see “Note 10 — Commitments and Contingencies” of our Notes to the Consolidated Financial Statements set forth in Part II, Item 8 of this Annual Report on Form 10-K (“Note 10”) for a more detailed description of a number of the litigation matters we are currently engaged in. In particular, litigation involving patents and other intellectual property is widespread in the high-technology industry and is particularly prevalent in the semiconductor industry, where a number of companies and other entities aggressively bring numerous infringement claims to assert their patent portfolios. The amount of damages alleged in intellectual property infringement claims can often be very significant. For example, the settlement of a lawsuit with Carnegie Mellon University resulted in a payment by us of $750 million as described further in Note 10.

From time to time our subsidiaries and customers receive, and may continue to receive in the future, standards-based infringement claims, as well as claims against us and our subsidiaries’ proprietary technologies, particularly those related to storage technology, microprocessors and other circuit components. Our subsidiaries and customers could face claims of infringement for certain patent licenses that have not been renewed. These claims could result in litigation and/or claims for indemnification, which, in turn, could subject us to significant liability for damages, attorneys’ fees and costs. Any potential intellectual property litigation also could force us to do one or more of the following:

stop selling, offering for sale, making, having made or exporting products or using technology that contains the allegedly infringing intellectual property;

limit or restrict the type of work that employees involved in such litigation may perform for us;

pay substantial damages and/or license fees and/or royalties to the party claiming infringement or other license violations that could adversely impact our liquidity or operating results;

attempt to obtain or renew licenses to the relevant intellectual property, which licenses may not be available on reasonable terms or at all; and

attempt to redesign those products that contain the allegedly infringing intellectual property.

Under certain circumstances, we have contractual and other legal obligations to indemnify and to incur legal expenses for current and former directors and officers. Additionally, from time to time, we have agreed to indemnify select customers for claims made against our products, where such claims allege infringement of third-party intellectual property rights,disruptions, including, but not limited to, patents, registered trademarks and/those driven by financial instability; or copyrights. If we are required


customers may consolidate (for example, Western Digital acquired SanDisk in 2017, and Toshiba Corporation has announced an intent to makesell a significant payment under anyportion of its semiconductor business), which could lead to changing demand for our products, replacement of our indemnification obligations, our results of operations may be harmed.

The ultimate outcome of litigation could have a material adverse effect on our business andproducts by the trading price for our securities. Litigation may be time consuming, expensive, and disruptive to normal business operations, and the outcome of litigation is difficult to predict. Litigation, regardless of the outcome, may result in significant expenditures, diversionmerged entity with those of our management’s timecompetitors and attention from the operationcancellation of our business, damage to our reputation or relationship with third parties, which could materially and adversely affect our business, financial condition, results of operations, cash flows and our stock price.

We identified material weaknesses in our internal controls over financial reporting, and we may be unable to develop, implement and maintain effective internal controls in future periods.

The Sarbanes-Oxley Act of 2002 and SEC rules require that management report annually on the effectiveness of our internal control over financial reporting and our disclosure controls and procedures. Among other things, management must conduct an assessment of our internal control over financial reporting to allow management to report on the effectiveness of our internal control over financial reporting, as required by Section 404 of the Sarbanes-Oxley Act. Based on management’s assessment, we concluded that our internal controls over financial reporting were not effective as of January 30, 2016. The specific material weaknesses are described in Part II — Item 9A. “Controls and Procedures” of this Form 10-K in “Management’s Report on Internal Control over Financial Reporting.” A material weakness is a deficiency, or a combination of deficiencies, in internal control over financial reporting such that there is a reasonable possibility that a material misstatement of our annual or interim consolidated financial statements would not be prevented or detected on a timely basis. As with any material weakness, if our remedial measures are insufficient to address the material weaknesses, or if additional material weaknesses or significant deficiencies in our internal control over financial reporting are discovered or occur in the future, our consolidated financial statements may contain material misstatements. Any material misstatements could result in a restatement of our consolidated financial statements, cause us to fail to meet our reporting obligations or cause investors to lose confidence in our reported financial information, leading to a decline in our stock price.

Even when we have remediated our material weaknesses, any control system, no matter how well designed and operated, can provide only reasonable, not absolute, assurance that the control system’s objectives will be met. Because of its inherent limitations, internal control over financial reporting will not necessarily prevent all error and all fraud. Controls can also be circumvented by the individual acts of some persons, by collusion of two or more people, or by management override of the controls. orders.


In addition, we may modify the designif regulatory activity, such as enforcement of U.S. export control and operating effectiveness of our internal controls, which could affect the overall effectiveness or evaluation of the control system in the future by us or our independent registered public accounting firm. We cannot ensure that any design will succeed in achieving its stated goals under all potential future conditions, as controls may become inadequate duesanctions laws, were to changes in conditions or deterioration in the degree of compliance. Any failure to maintain an effective system of internal control over financial reporting couldmaterially limit our ability to provide reliable financial reports, ormakes sales to detect and prevent fraud, which would harm our business.

Matters relating to or arising from our Audit Committee investigation, including regulatory proceedings, litigation matters and potential additional expenses, may adversely affect our business and results of operations.

As previously disclosed in our public filings, the Audit Committeeany of our Board of Directors has recently completed an investigation that generally included a review of certain revenue recognized in the first and second quarters of fiscal 2016 and the fourth quarter of fiscal 2015, including transactions that would have, in the normal course of events and but for action by certain Marvell employees, been completed and recognized in a subsequent quarter (referred to internally as “pull-ins”); the accrual of a litigation reserve in the second quarter of fiscal 2016, and the stated belief by our former Chairman and Chief Executive Officer of ownership of certain patent rights related to the Final-Level Cache invention and his later assignment of associated patent applications to Marvell. In addition, we are also the subject of investigations by the Securities and Exchange Commission and the U.S. Attorney related to these matters. We are fully cooperating with the SEC and the U.S. Attorney with respect to those investigations.

To date, we have incurred significant expenses related to legal, accounting, and other professional services in connection with the investigations and related matters, and may continue to incur significant additional expenses with regard to these matters and related remediation efforts. The expenses incurred, and expected to be incurred, on the investigations, the impact of our delay in meeting our periodic reports on the confidence of investors, employees and customers, and the diversion of the attention of the management team that has occurred, and is expected to continue, has adversely affected, and could continue to adversely affect, our business, financial condition and results of operations or cash flows. As a result of the delay in filing of our periodic reports, we are not eligible to use a registration statement on Form S-3, and will not be eligible to use that form until we have timely filed all periodic reports required by the SEC for one year, which may make it more difficult, costly or time consuming for us to raise capital if we should choose to do so.

As a result of the matters reported above, we are exposed to greater risks associated with litigation, regulatory proceedings and government enforcement actions. In addition, securities class actions or other lawsuits have been filed against us, our directors and officers (see also,“We are subject to pending securities class action and shareholder derivative legal proceedings”below). Any future such investigations or additional lawsuits may adversely affect our business, financial condition, results of operations and cash flows.

We are subject to pending securities class action and shareholder derivative legal proceedings.

Several securities class action lawsuits were filed against us following our September 11, 2015 announcement of an independent audit committee investigation of certain accounting and internal control matters in the second quarter of fiscal 2016 and our subsequent delinquency in filing our periodic financial reports. We also have been named as a nominal defendant in a shareholder derivative lawsuit filed in fiscal 2016 concerning our announcement of the audit committee investigation. No specific amounts of damages have been alleged in the class action lawsuits and, by the nature of the lawsuits, no damages will be alleged against Marvell in the derivative lawsuit.

We will continue to incur legal fees in connection with these pending cases, including expenses for the reimbursement of legal fees of present and former officers and directors under indemnification obligations. The expense of continuing to defend such litigation may be significant. We intend to defend these lawsuits vigorously, however there can be no assurance that we will be successful in any defense. If any of the lawsuits related to our audit committee investigation are adversely decided, we may be liable for significant damages directly or under our indemnification obligations, which could adversely affect our business, results of operations and cash flows. Further, the amount of time that will be required to resolve these lawsuits is unpredictable and these actions may divert management’s attention from the day-to-day operations of our business, which could adversely affect our business, results of operations and cash flows.

Our indemnification obligations and limitations of our director and officer liability insurance may have a material adverse effect on our financial condition, results of operations and cash flows.

Under Bermuda law, our articles of association and bye-laws and certain indemnification agreements to which we are a party, we have an obligation to indemnify, or we have otherwise agreed to indemnify, certain of our current and former directors and officers with respect to current and future investigations and litigation, including the matters discussed in Part I — Item 3, “Legal Proceedings.” In connection with some of these pending matters, we are required to, or we have otherwise agreed to, advance, and have advanced, legal fees and related expenses to certain of our current and former directors and officers and expect to continue to do so while these matters are pending. Certain of these obligations may not be “covered matters” under our directors’ and officers’ liability insurance, or there may be insufficient coverage available. Further, in the event the directors and officers are ultimately determined to not be entitled to indemnification, we may not be able to recover the amounts we previously advanced to them.

In addition, we have incurred significant expenses in connection with the Audit Committee’s independent investigation, the pending government investigations, and the shareholder litigation. We cannot provide any assurances that pending claims, or claims yet to arise, including the cost of fees, penalties or other expenses will not exceed the limits of our insurance policies, that such claims are covered by the terms of our insurance policies or that our insurance carrier will be able to cover our claims. Additionally, to the extent there is coverage of these claims, the insurers also may seek to deny or limit coverage in some or all of these matters. Furthermore, the insurers could become insolvent and unable to fulfill their obligation to defend, pay or reimburse us for insured claims. Accordingly, we cannot be sure that claims will not arise that are in excess of the limits of our insurance or that are not covered by the terms of our insurance policy. Due to these coverage limitations, we may incur significant unreimbursed costs to satisfy our indemnification obligations, which may have a material adverse effect on our business, financial condition, results of operations or cash flows.

We rely on independent foundries and subcontractors for the manufacture, assembly and testing of our integrated circuit products, and the failure of any of these third-party vendors to deliver products or otherwise perform as requested could damage our relationships with our customers, decrease our sales and limit our ability to grow our business.

We do not have our own manufacturing or assembly facilities and have very limited in-house testing facilities. Therefore, we currently rely on several third-party foundries to produce our integrated circuit products. We also currently rely on several third-party assembly and test subcontractors to assemble, package and test our products. This exposes us to a variety of risks, including the following:

Regional Concentration

Substantially all of our products are manufactured by third-party foundries located in Taiwan, and other sources are located in China and Singapore. In addition, substantially all of our third-party assembly and testing facilities are located in China, Singapore and Taiwan. Because of the geographic concentration of these third-party foundries, as well as our assembly and test subcontractors, we are exposed to the risk that their operations may be disrupted by regional disasters including, for example, earthquakes (particularly in Taiwan and elsewhere

in the Pacific Rim close to fault lines), tsunamis or typhoons, or by political, social or economic instability. In the case of such an event, our revenues, cost of goods sold and results of operations would be negatively impacted. In addition, there are limited numbers of alternative foundries and identifying and implementing alternative manufacturing facilities would be time consuming. As a result, if we needed to implement alternate manufacturing facilities, we could experience significant expenses and delays in product shipments, which could harm our results of operations.

No Guarantee of Capacity or Supply

The ability of each foundry to provide us with semiconductor devices is limited by its available capacityoperations, reputation and existing obligations. When demand is strong, availability of foundry capacity may be constrained or not available, and with limited exceptions, our vendors are not obligated to perform services or supply products to us for any specific period, in any specific quantities, or at any specific price, except as may be provided in a particular purchase order. We place our orders on the basis of our customers’ purchase orders or our forecast of customer demand, and the foundries can allocate capacity to the production of other companies’ products and reduce deliveries to us on short notice. It is possible that foundry customers that are larger and better financed than we are or that have long-term agreements with our main foundries may induce our foundries to reallocate capacity to those customers. This reallocation could impair our ability to secure the supply of components that we need. In particular, as we and others in our industry transition to smaller geometries, our manufacturing partners may be supply constrained or may charge premiums for these advanced technologies, which may harm our business or results of operations. See also, “We may experience difficulties in transitioning to smaller geometry process technologies or in achieving higher levels of design integration, which may result in reduced manufacturing yields, delays in product deliveries and increased expenses.” Moreover, if any of our third-party foundry suppliers are unable to secure necessary raw materials from their suppliers, lose benefits under material agreements, experience power outages, lack sufficient capacity to manufacture our products, encounter financial difficulties or suffer any other disruption or reduction in efficiency, we may encounter supply delays or disruptions, which could harm our business or results of operations.

Despite our strategy to move to multiple sources, most of our products are not manufactured at more than one foundry at any given time, and our products typically are designed to be manufactured in a specific process at only one of these foundries. Accordingly, if one of our foundries is unable to provide us with components as needed, it would be difficult for us to transition the manufacture of our products to other foundries, and we could experience significant delays in securing sufficient supplies of those components. This could result in a material decline in our revenues, net income and cash flow.

In order to secure sufficient foundry capacity when demand is high and to mitigate the risks described in the foregoing paragraph, we may enter into various arrangements with suppliers that could be costly and harm our results of operations, such as non-refundable deposits with or loans to foundries in exchange for capacity commitments, or contracts that commit us to purchase specified quantities of integrated circuits over extended periods. We may not be able to make any such arrangement in a timely fashion or at all, and any arrangements may be costly, reduce our financial flexibility, and not be on terms favorable to us. Moreover, if we are able to secure foundry capacity, we may be obligated to use all of that capacity or incur penalties. These penalties may be expensive and could harm our financial results.

Uncertain Yields and Quality

The fabrication of integrated circuits is a complex and technically demanding process. Our foundries have from time to time experienced manufacturing defects and reduced manufacturing yields, which are difficult to detect at an early stage of the manufacturing process and may be time consuming and expensive to correct. Changes in manufacturing processes or the inadvertent use of defective or contaminated materials by our foundries could result in lower than anticipated manufacturing yields or unacceptable performance. In addition, we may face lower manufacturing yields and reduced quality in the process of ramping up and diversifying our manufacturing partners. Poor yields from our foundries, or defects, integration issues or other performance

problems with our products could cause us significant customer relations and business reputation problems, harm our financial performance and result in financial or other damages to our customers. Our customers could also seek damages in connection with product liability claims, which would likely be time consuming and costly to defend. In addition, defects could result in significant costs. See also, “Costs related to defective products could have a material adverse effect on us.”

To the extent that we rely on outside suppliers to manufacture or assemble and test our products, we may have a reduced ability to directly control product delivery schedules and quality assurance, which could result in product shortages or quality assurance problems that could delay shipments or increase costs.

Commodity Prices

We are also subject to risk from fluctuating market prices of certain commodity raw materials including, but not limited to, gold and copper, that are incorporated into our end products or used by our suppliers to manufacture our end products. Supplies for such commodities may from time to time become restricted, or general market factors and conditions may affect pricing of such commodities.

condition.


If we are unable to develop and introduce new and enhanced products that achieve market acceptance in a timely and cost-effective manner, our results of operations and competitive position will be harmed.


Our future success will depend on our ability in a timely and cost-effective manner, to develop and introduce new products and enhancements to our existing products.products in a timely and cost-effective manner. We sell products in markets that are characterized by rapid technological change, evolving industry standards, frequent new product introductions, short product life cycles and increasing demand for higher levels of integration and smaller process geometries. In addition, the development of new silicon devices is highly complex, and due to supply chain cross-dependencies and other issues, we may experience delays in completing the development, production and introduction of our new products. For example, we believe the success of FLCTM technology may be an important factor in the future growth of the company. If FLCTM technology fails to function in actual product development at the level required for market acceptance, or if our customers do not readily embrace the technology as quickly as we would anticipate, our future results may be impacted. No revenue was derived from FLCTM related products in fiscal 2016 and we anticipate no revenue in fiscal 2017 as these products are still in development. See also, “We may be unable to protect our intellectual property, which would negatively affect our ability to compete.”


Our ability to adapt to changes and to anticipate future standards, and the rate of adoption and acceptance of those standards, will be a significant factor in maintaining or improving our competitive position and prospects for growth. We may also have to incur substantial unanticipated costs to comply with these new standards. Our success will also depend on the ability of our customers to develop new products and enhance existing products for the markets they serve and to introduce and promote those products successfully and in a timely manner. Even if we and our customers introduce new and enhanced products to the market, those products may not achieve market acceptance.


Our gross margin and results of operations may be adversely affected in the future by a number of factors, including decreases in average selling prices of products over time and shifts in our product mix.


The products we develop and sell are primarily used for high-volume applications. As a result, the prices of those products have historically decreased rapidly. In addition, our more recently introduced products tend to have higher associated costs because of initial overall development and production expenses. Therefore, over time, we may not be able to maintain or improve our gross margins. Our financial results could suffer if we are unable to offset any reductions in our average selling prices by other cost reductions through efficiencies, introduction of higher margin products and other means.


To attract new customers or retain existing customers, we may offer certain price concessions to certain customers, which could cause our average selling prices and gross margins to decline. In the past, we have reduced the average selling prices of our products in anticipation of future competitive pricing pressures, new product introductions by us or by our competitors and other factors. We expect that we will continue to have to reduce prices of existing products in the future. Moreover, because of the wide price differences across the markets we serve, the mix and types of performance capabilities of our products sold may affect the average selling prices of our products and have a substantial impact on our revenue and gross margin. We may enter new markets in which a significant amount of competition exists, and this may require us to sell our products with lower gross margins than we earn in our established businesses. If we are successful in growing revenue in these markets, our overall gross margin may decline. Fluctuations in the mix and types of our products may also affect the extent to which we are able to recover the fixed costs and investments associated with a particular product, and as a result may harm our financial results.


11


Additionally, because we do not operate our own manufacturing, assembly or testing facilities, we may not be able to reduce our costs as rapidly as companies that operate their own facilities and our costs may even increase, which could also reduce our gross margins.


We rely on independent foundries and subcontractors for the manufacture, assembly and testing of our integrated circuit products, and the failure of any of these third-party vendors to deliver products or otherwise perform as requested could damage our relationships with our customers, decrease our sales and limit our ability to grow our business.

We do not have our own manufacturing or assembly facilities and have very limited in-house testing facilities. Therefore, we currently rely on several third-party foundries to produce our integrated circuit products. We also currently rely on several third-party assembly and test subcontractors to assemble, package and test our products. This exposes us to a variety of risks, including the following:

Regional Concentration

Substantially all of our products are manufactured by third-party foundries located in Taiwan, and other sources are located in China and Singapore. In addition, substantially all of our third-party assembly and testing facilities are located in China, Singapore and Taiwan. Because of the geographic concentration of these third-party foundries, as well as our assembly and test subcontractors, we are exposed to the risk that their operations may be disrupted by regional disasters including, for example, earthquakes (particularly in Taiwan and elsewhere in the Pacific Rim close to fault lines), tsunamis or typhoons, or by political, social or economic instability. In the case of such an event, our revenues, cost of goods sold and results of operations would be negatively impacted. In addition, there are limited numbers of alternative foundries and identifying and implementing alternative manufacturing facilities would be time consuming. As a result, if we needed to implement alternate manufacturing facilities, we could experience significant expenses and delays in product shipments, which could harm our results of operations.

No Guarantee of Capacity or Supply

The ability of each foundry to provide us with semiconductor devices is limited by its available capacity and existing obligations. When demand is strong, availability of foundry capacity may be constrained or not available, and with limited exceptions, our vendors are not obligated to perform services or supply products to us for any specific period, in any specific quantities, or at any specific price, except as may be provided in a particular purchase order. We place our orders on the basis of our customers’ purchase orders or our forecast of customer demand, and the foundries can allocate capacity to the production of other companies’ products and reduce deliveries to us on short notice. It is possible that foundry customers that are larger and better financed than we are or that have long-term agreements with our main foundries may induce our foundries to reallocate capacity to those customers. This reallocation could impair our ability to secure the supply of components that we need. In particular, as we and others in our industry transition to smaller geometries, our manufacturing partners may be supply constrained or may charge premiums for these advanced technologies, which may harm our business or results of operations. See also, “We may experience difficulties in transitioning to smaller geometry process technologies or in achieving higher levels of design integration, which may result in reduced manufacturing yields, delays in product deliveries and increased expenses.” Moreover, if any of our third-party foundry suppliers are unable to secure necessary raw materials from their suppliers, lose benefits under material agreements, experience power outages, lack sufficient capacity to manufacture our products, encounter financial difficulties or suffer any other disruption or reduction in efficiency, we may encounter supply delays or disruptions, which could harm our business or results of operations.

While we attempt to create multiple sources for our products, most of our products are not manufactured at more than one foundry at any given time, and our products typically are designed to be manufactured in a specific process at only one of these foundries. Accordingly, if one of our foundries is unable to provide us with components as needed, it would be difficult for us to transition the manufacture of our products to other foundries, and we could experience significant delays in securing sufficient supplies of those components. This could result in a material decline in our revenues, net income and cash flow.

In order to secure sufficient foundry capacity when demand is high and to mitigate the risks described in the foregoing paragraph, we may enter into various arrangements with suppliers that could be costly and harm our results of operations, such as nonrefundable deposits with or loans to foundries in exchange for capacity commitments, or contracts that commit us to purchase specified quantities of integrated circuits over extended periods. We may not be able to make any such arrangement in a timely fashion or at all, and any arrangements may be costly, reduce our financial flexibility, and not be on terms favorable to

12


us. Moreover, if we are able to secure foundry capacity, we may be obligated to use all of that capacity or incur penalties. These penalties may be expensive and could harm our financial results.

Uncertain Yields and Quality

The fabrication of integrated circuits is a complex and technically demanding process. Our technology is transitioning from planar to FINFET transistors which is a new technology. This transition may result in longer qualification cycles and lower yields. Our foundries have from time to time experienced manufacturing defects and lower manufacturing yields, which are difficult to detect at an early stage of the manufacturing process and may be time consuming and expensive to correct. Changes in manufacturing processes or the inadvertent use of defective or contaminated materials by our foundries could result in lower than anticipated manufacturing yields or unacceptable performance. In addition, we may face lower manufacturing yields and reduced quality in the process of ramping up and diversifying our manufacturing partners. Poor yields from our foundries, or defects, integration issues or other performance problems with our products could cause us significant customer relations and business reputation problems, harm our financial performance and result in financial or other damages to our customers. Our customers could also seek damages in connection with product liability claims, which would likely be time consuming and costly to defend. In addition, defects could result in significant costs. See also, “Costs related to defective products could have a material adverse effect on us.

To the extent that we rely on outside suppliers to manufacture or assemble and test our products, we may have a reduced ability to directly control product delivery schedules and quality assurance, which could result in product shortages or quality assurance problems that could delay shipments or increase costs.

Commodity Prices

We are also subject to risk from fluctuating market prices of certain commodity raw materials, including gold and copper, which are incorporated into our end products or used by our suppliers to manufacture our end products. Supplies for such commodities may from time to time become restricted, or general market factors and conditions may affect pricing of such commodities.

We may experience difficulties in transitioning to smaller geometry process technologies or in achieving higher levels of design integration, which may result in reduced manufacturing yields, delays in product deliveries and increased expenses.

In order to remain competitive, we expect to continue to transition our semiconductor products to increasingly smaller line width geometries. This transition requires us to modify the manufacturing processes for our products and to redesign some products. We periodically evaluate the benefits, on a product-by-product basis, of migrating to smaller geometry process technologies to reduce our costs. In the past, we have experienced some difficulties in shifting to smaller geometry process technologies or new manufacturing processes, which resulted in reduced manufacturing yields, delays in product deliveries and increased expenses. We may face similar difficulties, delays and expenses as we continue to transition our products to smaller geometry processes.

We are dependent on our relationships with our foundry subcontractors to transition to smaller geometry processes successfully. We cannot ensure that the foundries we use will be able to effectively manage the transition or that we will be able to maintain our existing foundry relationships or develop new ones. If we or any of our foundry subcontractors experience significant delays in this transition or fail to efficiently implement this transition, we could experience reduced manufacturing yields, delays in product deliveries and increased expenses, all of which could harm our relationships with our customers and our results of operations.

As smaller geometry processes become more prevalent, we expect to continue to integrate greater levels of functionality, as well as customer and third-party intellectual property, into our products. However, we may not be able to achieve higher levels of design integration or deliver new integrated products on a timely basis, if at all. Moreover, even if we are able to achieve higher levels of design integration, such integration may have a short-term adverse impact on our results of operations, as we may reduce our revenue by integrating the functionality of multiple chips into a single chip.

Costs related to defective products could have a material adverse effect on us.


13


From time to time, we have experienced hardware and software defects and bugs associated with the introduction of our highly complex products. Despite our testing procedures, we cannot ensure that errors will not be found in new products or releases after commencement of commercial shipments in the future. Such errors could result in:

loss of or delay in market acceptance of our products;
material recall and replacement costs;
delay in revenue recognition or loss of revenues;
writing down the inventory of defective products;
the diversion of the attention of our engineering personnel from product development efforts;
our having to defend against litigation related to defective products or related property damage or personal injury; and
damage to our reputation in the industry that could adversely affect our relationships with our customers.

In addition, the process of identifying a recalled product in devices that have been widely distributed may be lengthy and require significant resources. We may have difficulty identifying the end customers of the defective products in the field, which may cause us to incur significant replacement costs, contract damage claims from our customers and further reputational harm. Any of these problems could materially and adversely affect our results of operations.

We have recently experienced a significant transition at the executive management level. If our new executive team is unable to engage and align mid-management or attract and retain the key talent needed for us to timely achieve our business objectives, our business and results of operations could be harmed.

In April 2016, our co-founders, Dr. Sehat Sutardja and Ms. Weili Dai, left the company. Shortly thereafter, our board of directors was reconstituted in connection with our agreement with Starboard Value LLC and the company’s executive management team subsequently went through a significant transition, including the hiring of a new President and CEO, Chief Financial Officer, Chief Accounting Officer and Controller, Chief Operations Officer, Chief Legal Officer, Chief Human Resources Officer, Executive Vice President of Worldwide Sales and Marketing and appointment of new leaders for our storage, and networking and connectivity groups, and our corporate development organization. At the time of the filing of this Annual Report on Form 10-K, the longest tenured member of our executive team has been employed by the company for approximately ten months. While the individual members of our executive management team each have significant industry-related experience, they previously have not worked together as a group and it will take time for them to become an integrated management team. Delays in the integration of our management team could affect our ability to implement our business strategy, which could have a material adverse effect on our business and results of operations.

In addition, the marketplace for senior executive management candidates is very competitive and limited, particularly in the Silicon Valley where our U.S. operations are based. Our growth may be adversely impacted if we are unable to attract and retain such key employees. Turnover of senior management can adversely impact our stock price, our results of operations and our client relationships, and has made recruiting for future management positions more difficult.Competition for senior leadership may increase our compensation expenses, which may negatively affect our profitability.

We depend on highly skilled engineering and sales and marketing personnel to support our business operations. If we are unable to retain our current personnel or attract additional qualified personnel, our ability to develop and successfully market our products could be harmed.

We believe our future success will depend in large part upon our ability to attract and retain highly skilled managerial, engineering, sales and marketing personnel. The competition for qualified technical personnel with significant experience in the design, development, manufacturing, marketing and sales of integrated circuits is intense, both in the Silicon Valley where our U.S. operations are based and in global markets in which we operate. Our inability to attract qualified personnel, including hardware and software engineers and sales and marketing personnel, could delay the development and introduction of, and harm our ability to sell, our products. We typically do not enter into employment agreements with any of our key technical personnel and the loss of such personnel could harm our business, as their knowledge of our business and industry would be extremely difficult to replace. In addition, the impact on employee morale experienced in connection with our recent restructuring efforts, which eliminated approximately 900 jobs worldwide, could make it more difficult for us to add to our workforce when needed due to speculation regarding our future restructuring activities.


14


In addition, if recently introduced federal legislation relating to proposed changes to the H-1B and other visa programs is approved, such changes could negatively impact our ability to recruit and retain certain highly skilled technical personnel to support our product development teams, which could potentially increase our costs and harm our business and results of operations.

We rely upon the performance of our information technology systems to process, transmit, store and protect electronic information, and the failure of or security breaches of any critical information technology system may result in serious harm to our reputation, business, results of operations and/or financial condition.

We depend heavily on our technology infrastructure and maintain and rely upon certain critical information systems for the effective operation of our business. We routinely collect and store sensitive data in our information systems, including intellectual property and other proprietary information about our business and that of our customers, suppliers and business partners. These information technology systems are subject to damage or interruption from a number of potential sources, including but not limited to natural disasters, viruses, destructive or inadequate code, malware, power failures, cyber-attacks, internal malfeasance or other events. We have implemented processes for systems under our control intended to mitigate risks; however, we can provide no guarantee that those risk mitigation measures will be effective. Given the frequency of cyber-attacks and resulting breaches reported by other businesses and governments, it is likely we will experience one or more breaches of some extent in the future. We may incur significant costs in order to implement, maintain and/or update security systems we feel are necessary to protect our information systems, or we may miscalculate the level of investment necessary to protect our systems adequately. To the extent that any system failure, accident or security breach results in material disruptions or interruptions to our operations or the theft, loss or disclosure of, or damage to our data or confidential information, including our intellectual property, our reputation, business, results of operations and/or financial condition could be materially adversely affected.

We may be unable to protect our intellectual property, which would negatively affect our ability to compete.

We believe one of our key competitive advantages results from the collection of proprietary technologies we have developed and acquired since our inception, and the protection of our intellectual property rights is, and will continue to be, important to the success of our business. If we fail to protect these intellectual property rights, competitors could sell products based on technology that we have developed, which could harm our competitive position and decrease our revenues.

We rely on a combination of patents, copyrights, trademarks, trade secret laws, contractual provisions, confidentiality agreements, licenses and other methods, to protect our proprietary technologies. We also enter into confidentiality or license agreements with our employees, consultants and business partners, and control access to and distribution of our documentation and other proprietary information. Notwithstanding these agreements, we have experienced disputes with employees regarding ownership of intellectual property in the past. For instance, we have had a dispute with Dr. Sehat Sutardja, our former Chief Executive Officer and a former member of our board of directors, related to his stated belief of ownership of certain patent rights related to the Final-Level Cache invention and his later assignment of associated patent rights to Marvell. Our Audit Committee investigated this claim and concluded that the FLC invention was owned by the Company. To the extent that any third party has a claim to ownership of any relevant technologies used in our products, we may not be able to recognize the full revenue stream from such relevant technologies.

We have been issued a significant number of U.S. and foreign patents and have a significant number of pending U.S. and foreign patent applications. However, a patent may not be issued as a result of any applications or, if issued, claims allowed may not be sufficiently broad to protect our technology. In addition, it is possible that existing or future patents may be challenged, invalidated or circumvented. We may also be required to license some of our patents to others including competitors as a result of our participation in and contribution to development of industry standards. Despite our efforts, unauthorized parties may attempt to copy or otherwise obtain and use our products or proprietary technology. Monitoring unauthorized use of our technology is difficult, and the steps that we have taken may not prevent unauthorized use of our technology, particularly in jurisdictions where the laws may not protect our proprietary rights as fully as in the United States or other developed countries. If our patents do not adequately protect our technology, our competitors may be able to offer products similar to ours, which would adversely impact our business and results of operations.

Certain of our software, as well as that of our customers, may be derived from so-called “open source” software that is generally made available to the public by its authors and/or other third parties. Open source software is made available under licenses that impose certain obligations on us in the event we were to distribute derivative works of the open source software. These obligations may require us to make source code for the derivative works available to the public and/or license such

15


derivative works under a particular type of license, rather than the forms of license we customarily use to protect our intellectual property. While we believe we have complied with our obligations under the various applicable licenses for open source software, in the event that the copyright holder of any open source software were to successfully establish in court that we had not complied with the terms of a license for a particular work, we could be required to release the source code of that work to the public and/or stop distribution of that work if the license is terminated which could adversely impact our business and results of operations.

We are subject to order and shipment uncertainties, and ifuncertainties. If we are unable to accurately predict customer demand, we may hold excess or obsolete inventory, which would reduce our gross margin; conversely,margin. Conversely, we may have insufficient inventory, which would result in lost revenue opportunities and potentially inpotential loss of market share andas well as damaged customer relationships.


We typically sell products pursuant to purchase orders rather than long-term purchase commitments. Customers can generally cancel or defer purchase orders on short notice without incurring a significant penalty. Due to their inability to predict demand or other reasons, some of our customers may accumulate excess inventories and, as a consequence, defer purchase of our products. We cannot accurately predict what or how many products our customers will need in the future. Anticipating demand is difficult because our customers face unpredictable demand for their own products and are increasingly focused more on cash preservation and tighter inventory management. In addition, as an increasing number of our chips are being incorporated into consumer products, we anticipate greater fluctuations in demand for our products, which makes it more difficult to forecast customer demand.

We place orders with our suppliers based on forecasts of customer demand and, in some instances, may establish buffer inventories to accommodate anticipated demand. Our forecasts are based on multiple assumptions, each of which may introduce error into our estimates. For example, our ability to accurately forecast customer demand may be impaired by the delays inherent in our customer’s product development processes, which may include extensive qualification and testing of components included in their products, including ours. In many cases, they design their products to use components from multiple suppliers. This creates the risk that our customers may decide to cancel or change product plans for products incorporating our integrated circuits prior to completion, which makes it even more difficult to forecast customer demand.


Our products are incorporated into complex devices and systems, which may create supply chain cross-dependencies. For example, in fiscal 2012, many areas of Thailand sustained massive damage from flooding, which disrupted the global supply chain for HDDs. Due to cross dependencies, any supply chain disruptions could negatively impact the demand for our products in the short term. We have a limited ability to predict the timing of a supply chain correction. In addition, the market share of our customers could be adversely impacted on a long-term basis due to any continued supply chain disruption, which could negatively affect our results of operations.


If we overestimate customer demand, our excess or obsolete inventory may increase significantly, which would reduce our gross margin and adversely affect our financial results. The risk of obsolescence and/or excess inventory is heightened for devices designed for consumer electronics due to the rapidly changing market for these types of products. Conversely, if we underestimate customer demand or if insufficient manufacturing capacity is available, we would miss revenue opportunities and potentially lose market share and damage our

customer relationships. In addition, any future significant cancellations or deferrals of product orders or the return of previously sold products could materially and adversely affect our profit margins, increase product obsolescence and restrict our ability to fund our operations.

A portion


We rely on third-party distributors and manufacturers’ representatives and the failure of these distributors and manufacturers’ representatives to perform as expected could reduce our inventory is held by, and net revenues are derived from, sales through third-party logistics providers, whereby revenues are recognized when product is pulled from stock by the end customer. future sales.

From time to time, our customers will take early delivery of product at the end of a fiscal quarter that was scheduled for delivery in the following fiscal quarter, which we internally referenter into relationships with distributors and manufacturers’ representatives to as “pull-ins” if the early delivery was requested by Marvell.Variation in timing of large orders and our ability to effectively manage required inventory levels may be impacted by such arrangements, including increased expenses associated with excess or obsolete inventory and volatility in timing of revenues recognized period to period. Our operating results under these arrangements may vary significantly from quarter to quarter based on fluctuations in demand and our ability to deliver on forecasted customer orders. Beginning in fiscal 2017, our policy is not to engage in pull-in transactions and we therefore do not expect them to have any meaningful impact on our net revenue in future periods.

If we fail to appropriately scale our operations in response to changes in demand for our existing products or to the demand for new products requested by our customers, our business and profitability could be materially and adversely affected.

To achieve our business objectives, it may be necessary from time to time for us to expand or contract our operations. In the future, we may not be able to scale our workforce and operations in a sufficiently timely manner to respond effectively to changes in demand for our existing products or to the demand for new products requested by our customers. In that event, we may be unable to meet competitive challenges or exploit potential market opportunities, and our current or future business could be materially and adversely affected. Conversely, if we expand our operations and workforce too rapidly in anticipation of increased demand forsell our products, and such demand does not materialize at the pace at which we expected, the rate of increase in our costs and operating expenses may exceed the rate of increase in our revenue, which would adversely affect our results of operations. In addition, if such demand does not materialize at the pace which we expect, we may be required to scale down our business through expense and headcount reductions as well as facility consolidations or closures that could result in restructuring charges that would materially and adversely affect our results of operations. Because many of our expenses are fixed in the short-term or are incurred in advance of anticipated sales, we may not be able to decrease our expenses in a timely manner to offset any decrease in customer demand. If customer demand does not occur as anticipated, our profitability could be adversely affected due to our higher expense levels.

To implement our current business and product plans, we will need to continue to evolve, train, manage and motivate our workforce. All of these endeavors will require substantial management effort. Although we have an enterprise resource planning system to help us improve our planning and management processes, we anticipate that we will also need to continue to implement and improve a variety of new and upgraded operational and financial systems, as well as additional procedures and other internal management systems. These systems can be time consuming and expensive to implement, increase management responsibilities and divert management attention. If we are unable to effectively managepredict the extent to which these partners will be successful in marketing and selling our expanding operations, we may be unable to scale our business quickly enough to meet competitive challenges or exploit potential market opportunities, or conversely, we may scale our business too quickly and the rate of increase in our costs and expenses may exceed the rate of increase in our revenue, either of which would materially and adversely affect our results of operations.

Our business, financial condition and results of operations may be adversely impacted by global economic conditions, which may cause a decline in the market priceproducts. Moreover, many of our common shares.

We operatedistributors and manufacturers’ representatives also market and sell competing products, and may terminate their relationships with us at any time. Our future performance will also depend, in the semiconductor industry, which is cyclicalpart, on our ability to attract additional distributors or manufacturers’ representatives that will be able to market and subject to rapid change and evolving industry standards. From time to time, this industry has experienced significant demand downturns. These downturns are characterized by decreasessupport our products effectively, especially in product demand, excess customer inventories and sometimes accelerated erosion of prices, including as a result of volatile global economic conditions. These factors could

cause substantial fluctuations in our net revenue, gross margin, cash flows and results of operations. In addition, during these downturns some competitors may become more aggressive in their pricing practices, which would adversely impact our gross margin. Any downturns in the current environment may be severe and prolonged, and any failure of the markets in which we operate to fully recover from downturns could seriously impacthave not previously distributed our revenue and harmproducts. If we cannot retain or attract quality distributors or manufacturers’ representatives, our business, financial condition and results of operations. The semiconductor industry is also subject to periodic increases in demand and supply constraints, which may affect our ability to ship products. Accordingly, our results of operations may vary significantly as a result of the general conditions in the semiconductor industry, which could cause fluctuations in our stock price.

We cannot predict the timing, strength or duration of any economic slowdown or recovery or the impact of any such events on our vendors, customers or us. If the economy or markets in which we operate deteriorate from current levels, our business, financial conditionsales and results of operations will likely be materially and adversely affected. Additionally, the combination of lengthy product development coupled with challenging macroeconomic conditions could adversely impact our results of operations.

We may experience difficulties in transitioning to smaller geometry process technologies or in achieving higher levels of design integration, which may result in reduced manufacturing yields, delays in product deliveries and increased expenses.

In order to remain competitive, we expect to continue to transition our semiconductor products to increasingly smaller line width geometries. This transition requires us to modify the manufacturing processes for our products and to redesign some products. We periodically evaluate the benefits, on a product-by-product basis, of migrating to smaller geometry process technologies to reduce our costs. In the past, we have experienced some difficulties in shifting to smaller geometry process technologies or new manufacturing processes, which resulted in reduced manufacturing yields, delays in product deliveries and increased expenses. We may face similar difficulties, delays and expenses as we continue to transition our products to smaller geometry processes. We are dependent on our relationships with our foundry subcontractors to transition to smaller geometry processes successfully. We cannot ensure that the foundries that we use will be able to effectively manage the transition or that we will be able to maintain our existing foundry relationships or develop new ones. If we or any of our foundry subcontractors experience significant delays in this transition or fail to efficiently implement this transition, we could experience reduced manufacturing yields, delays in product deliveries and increased expenses, all of which could harm our relationships with our customers and our results of operations. As smaller geometry processes become more prevalent, we expect to continue to integrate greater levels of functionality, as well as customer and third-party intellectual property, into our products. However, we may not be able to achieve higher levels of design integration or deliver new integrated products on a timely basis, if at all. Moreover, even if we are able to achieve higher levels of design integration, such integration may have a short-term adverse impact on our results of operations, as we may reduce our revenue by integrating the functionality of multiple chips into a single chip.

We are exposed to potential impairment charges on certain assets.

We had approximately $2.0 billion of goodwill and $18.0 million of acquired intangible assets, net on our consolidated balance sheet as of January 30, 2016. Under generally accepted accounting principles in the United States, we are required to review our intangible assets including goodwill for impairment whenever events or changes in circumstances indicate that the carrying value of these assets may not be recoverable. We perform an assessment of goodwill for impairment annually on the last business day of our fiscal fourth quarter and whenever events or changes in circumstances indicate the carrying amount of goodwill may not be recoverable. We have identified that our business operates as a single operating segment with two components (Storage, and Smart Networked Devices and Solutions), which we have concluded can be aggregated into a single reporting unit for purposes of testing goodwill impairment. The fair value of the reporting unit is determined by taking our market capitalization as determined through quoted market prices and as adjusted for a control premium and other relevant factors. If our fair value declines to below our carrying value, we could incur significant goodwill

impairment charges, which could negatively impact our financial results. If in the future a change in our organizational structure results in more than one reporting unit, we will be required to allocate our goodwill and perform an assessment of goodwill for impairment in each reporting unit. As a result, we may have an impairment of goodwill in one of our reporting units.

In addition, from time to time, we have made investments in private companies. If the companies that we invest in are unable to execute their plans and succeed in their respective markets, we may not benefit from such investments, and we could potentially lose the amounts we invest. We evaluate our investment portfolio on a regular basis to determine if impairments have occurred. If the operations of any businesses that we have acquired declines significantly, we could incur significant intangible asset impairment charges. Impairment charges could have a material impact on our results of operations in any period.

We depend on key personnel to manage our business, and if we are unable to retain our current personnel or attract additional qualified personnel, our ability to develop and successfully market our products could be harmed.


We have undergone significant management changes, which could affect our implementation of our business strategy.

We believe our future success will depend in large part upon our abilityface additional risks due to attract and retain highly skilled managerial, engineering, sales and marketing personnel. The competition for qualified technical personnel with significant experience in the design, development, manufacturing, marketing and sales of integrated circuits is intense, and the inability to attract qualified personnel, including hardware and software engineers and sales and marketing personnel could delay the development and introduction of and harm our ability to sell our products. Additionally, we typically do not enter into employment agreements with any of our key technical personnel and the loss of such personnel could harm our business, as their knowledge of our business and industry would be extremely difficult to replace.

In recent years, we have experienced significant senior management turnover, including the departure of our Chief Executive Officer, Sehat Sutardja, and our President, Weili Dai, as officers and employees of the Company, effective April 1, 2016, and the retirement of our former Chief Financial Officer in May 2015. Our board of directors recently appointed our new President and Chief Executive Officer who will assume his duties as the Company’s principal executive officer immediately following the filing of our Quarterly Report on Form 10-Q for the second fiscal quarter of 2017, and is conducting a formal search to identify a new, permanent Chief Financial Officer. In addition, our board of directors has designated our Chairman of the Board, Richard S. Hill, as the Company’s Interim Principal Executive Officer until we file our Quarterly Report on Form 10-Q for the second fiscal quarter of 2017.

The marketplace for such key employees is very competitive and limited. Our growth may be adversely impacted if we are unable to attract and retain key employees. In addition, turnover of senior management can adversely impact our stock price, our results of operations and our client relationships and has made recruiting for future management positions more difficult. We have recently added a number of new executive officers in addition to our President and Chief Executive Officer, including our new Executive Vice President, Marketing and Sales, our Executive Vice President and Chief Legal Officer, our Chief Operations Officer and our Senior Vice President of Finance. Although the individual members of our senior management team have significant experience, they, and the Chief Financial Officer we hire, previously have not worked together as a group, and it will take time for them to become an integrated management team. Delays in the integration of our management team could affect our ability to implement our business strategy, which could have a material adverse effect on our business and results of operations.

As a resultextent of our global operations we face additional risks, which may harm our results of operations, becausesince a majority of our products, and those of our customers’ productscustomers, are manufactured and sold outside of the United States.

The occurrence of any or a combination of the additional risks described below would significantly and negatively impact our business and results of operations.


16


A substantial portion of our business is conducted outside of the United States and, as a result, we are subject to foreign business, political and economic risks. All of our products are manufactured outside of the United States. Our current qualified integrated circuit foundries are located in the same region within Taiwan, and our primary assembly and test subcontractors are located in the Pacific Rim region. In addition, many of our customers are located outside of the United States, primarily in Asia, which further exposes us to foreign risks. Sales shipped to customers with operations in Asia represented approximately 94% of our net revenue in fiscal 2017 and 96% of our net revenue in each of fiscal 2016 and 2015 and 95% of our net revenue in fiscal 2014.

2016.


We also have substantial operations outside of the United States. These operations are directly influenced by the political and economic conditions of the region in which they are located and, with respect to Israel, possible military hostilities such as the recent turmoil inperiodically affecting the region that could affect our operations there. We anticipate that our manufacturing, assembly, testing and sales outside of the United States will continue to account for a substantial portion of our operations and revenue in future periods.

Accordingly, we are subject to risks associated with international operations, including:


political, social and economic instability, including wars, terrorism, political unrest, boycotts, curtailment of trade and other business restrictions;


volatile global economic conditions, including downturns in which some competitors may become more aggressive in their pricing practices, which would adversely impact our gross margin;

compliance with domestic and foreign export and import regulations, including pending changes thereto, and difficulties in obtaining and complying with domestic and foreign export, import and other governmental approvals, permits and licenses;


local laws and practices that favor local companies, including business practices thatin which we are prohibited from engaging in by the Foreign Corrupt Practices Act and other anti-corruption laws and regulations;


difficulties in staffing and managing foreign operations;


natural disasters, including earthquakes, tsunamis and floods;


trade restrictions, higher tariffs, or higher tariffs;

changes in cross border taxation, particularly in light of the prospect of changes in U.S. international trade policies following the recent U.S. presidential election;


transportation delays;


difficulties of managing distributors;


less effective protection of intellectual property than is afforded to us in the United States or other developed countries;


inadequate local infrastructure; and


exposure to local banking, currency control and other financial-related risks.


As a result of having global operations, the sudden disruption of the supply chain and/or disruption of the manufacture of our customer’s products caused by events outside of our control could impact our results of operations by impairing our ability to timely and efficiently deliver our products. For example, during fiscal 2012, the earthquake and tsunami that affected Japan disrupted the global supply chain for certain components important to our products, and the flooding in Thailand affected the supply chain and manufacturing of the products for a number of our customers.


Moreover, the international nature of our business subjects us to risk associated with the fluctuation of the U.S. dollar versus foreign currencies. Decreases in the value of the U.S. dollar versus currencies in jurisdictions where we have large fixed costs, or where our third-party manufacturers have significant costcosts, will increase the cost of such operations which could harm our results of operations. For example,

17


We must comply with a variety of existing and future laws and regulations that could impose substantial costs on us and may adversely affect our business.

We are subject to various state, federal and international laws and regulations governing the environment, including restricting the presence of certain substances in electronic products and making producers of those products financially responsible for the collection, treatment, recycling and disposal of those products. In addition, we are also subject to various industry requirements restricting the presence of certain substances in electronic products. Although our management systems are designed to maintain compliance, we cannot assure you that we have large fixed costsbeen or will be at all times in Israel, which will become greater ifcomplete compliance with such laws and regulations. If we violate or fail to comply with any of them, a range of consequences could result, including fines, import/export restrictions, sales limitations, criminal and civil liabilities or other sanctions.

We and our customers are also subject to various import and export laws and regulations. Government export regulations apply to the U.S. dollar declinesencryption or other features contained in value versus the Israeli shekel. On the other hand, substantially allsome of our sales have been denominatedproducts. If we fail to continue to receive licenses or otherwise comply with these regulations, we may be unable to manufacture the affected products at foreign foundries or ship these products to certain customers, or we may incur penalties or fines.

We are also subject to the “conflict mineral rules” promulgated by the SEC, which impose disclosure requirements on us regarding the use of conflict minerals mined from the Democratic Republic of Congo and adjoining countries in U.S. dollars.

Costs relatedour products and the procedures our manufacturer’s use to defectiveprevent the sourcing of such conflict minerals. The ongoing implementation of these requirements could affect the sourcing, availability and pricing of minerals used in the manufacture of semiconductor devices, including our products could have. As a material adverse effect on us.

We have experienced, from time to time, hardwareresult, there may only be a limited pool of suppliers who provide conflict-free metals, and software defects and bugs associated with the introduction of our highly complex products. Despite our testing procedures, we cannot ensureassure you that errorswe will not be foundable to obtain products in new productssufficient quantities or releases after commencement of commercial shipments in the future,at competitive prices, which could result in loss of or delay in market acceptance of our products, material recall and replacement costs, delay in revenue recognition or loss of revenues, writing down the inventory of defective products, the diversion of the attention of our engineering personnel from product development efforts, our having to defend against litigation related to defective products or related property damage or personal injury, and damage to our reputation in the industry that could adversely affect our relationships with our customers. In addition, the process of identifying a recalledoperations and product in devices that have been widely distributed may be lengthy and require significant resources and we may have difficulty identifying the end customers of the defective products in the field, which may cause us to incur significant replacement costs, contract damage claims from our customers and further reputational harm. Any of these problems could materially adversely affect our results of operations.

Any potential future acquisitions, strategic investments, divestitures, mergers or joint ventures may subject us to significant risks, any of which could harm our business.

Our long-term strategy may include identifying and acquiring, investing in or merging with suitable candidates on acceptable terms, or divesting of certain business lines or activities. In particular, over time, we may acquire, make investments in, or merge with providers of product offerings that complement our business or may terminate such activities. Mergers, acquisitions and divestitures include a number of risks and present financial, managerial and operational challenges, including but not limited to:

diversion of management attention from running our existing business;

possible material weaknesses in internal control over financial reporting;

increased expenses including legal, administrative and compensation expenses related to newly hired or terminated employees;

increased costs to integrate or, in the case of a divestiture, separate the technology, personnel, customer base and business practices of the acquired or divested business or assets;

potential exposure to material liabilities not discovered in the due diligence process;

potential adverse effects on reported operating results due to possible write-down of goodwill and other intangible assets associated with acquisitions;

potential damage to customer relationships or loss of synergies in the case of divestitures; and

unavailability of acquisition financing or unavailability of such financing on reasonable terms.

Any acquired business, technology, service or product could significantly under-perform relative to our expectations, and may not achieve the benefits we expect from possible acquisitions. For all these reasons, our pursuit of an acquisition, investment, divestiture, merger or joint venture could cause its actual results to differ materially from those anticipated.

We rely on third-party distributors and manufacturers’ representatives and the failure of these distributors and manufacturers’ representatives to perform as expected could reduce our future sales.

From time to time, we enter into relationships with distributors and manufacturers’ representatives to sell our products, andmargins. Additionally, if we are unable to predictsufficiently source conflict-free metals, we may face difficulties in satisfying customers who may require that the extent toproducts they purchase from us are conflict-free, which these partners will be successful in marketing and selling our products. Moreover, many of our distributors and manufacturers’ representatives also market and sell competing products, and may terminate their relationships with us at any time. Our future performance will also depend, in part, on our ability to attract additional distributors or manufacturers’ representatives that will be able

to market and support our products effectively, especially in markets in which we have not previously distributed our products. If we cannot retain or attract quality distributors or manufacturers’ representatives,harm our sales and resultsoperating results.


The costs of operations will be harmed.

complying (including the costs of any investigations, auditing and monitoring) with these laws could adversely affect our current or future business. In addition, future regulations may become more stringent or costly and our compliance costs and potential liabilities could increase, which may harm our current or future business.


Changes in existing taxation benefits, rules or practices may adversely affect our financial results.


Changes in existing taxation benefits, rules or practices may also have a significant effect on our reported results. For example, both the U.S. Congress and the G-20 (Group of Twenty Finance Ministers and Central Bank Governors) may consider legislation affecting the taxation of foreign corporations and such legislation if enacted might adversely affect our future tax liabilities and have a material impact on our results of operations. Furthermore, in prior years, we have entered into agreements in certain foreign jurisdictions that if certain criteria are met, the foreign jurisdiction will provide a more favorable tax rate than their current statutory rate. For example, we have obtained an undertaking from the Minister of Finance of Bermuda that in the event Bermuda enacts legislation imposing tax computed on profits, income, or capital asset, gain or appreciation, then the imposition of any such taxes will not apply to us until March 31, 2035. Additionally, our Singapore subsidiary qualified for Pioneer status until it expired in June 2014. However, we re-negotiated with the Singapore government and in fiscal 2015, they extended the Development and Expansion Incentive (“DEI”) until June 2019. Furthermore, under the Israeli Encouragement law of “approved or benefited enterprise,” two branches of our subsidiary in Israel, Marvell Israel (M.I.S.L) Ltd., are entitled to, and have certain existing programs that qualify as, approved and benefited tax programs that include reduced tax rates and exemption of certain income through fiscal 2027. Our subsidiary in Switzerland also had tax incentives on revenues from research and design, and wafer supply trading activities, which expired at the end of fiscal 2016. Moreover, receipt of past and future benefits under tax agreements may depend on our ability to fulfill commitments regarding employment of personnel or performance of specified activities in the applicable jurisdiction. Changes in our business plans, including divestitures, could result in termination of an agreement or loss of benefits thereunder. If any of our tax agreements in any of these foreign jurisdictions were terminated, our results of operations would be harmed.


The Organization for Economic Cooperation and Development has been working on a Base Erosion and Profit Sharing Project, and issued in 2015, and is expected to continue to issue, guidelines and proposals that may change various aspects of the existing framework under which our tax obligations are determined in some of the countries in which we do business. The European Commission has also conducted investigations in multiple countries focusing on whether local country tax rulings or tax legislation provides preferential tax treatment that violates European Union state aid rules and concluded that certain countries, including Ireland and Belgium, have provided illegal state aid in certain cases. We can provide no assurance that

18


additional investigations would not have an adverse impact on some of our operations in countries in which future investigations may be conducted.

In addition, the current U.S. administration and key members of Congress have made public statements indicating that tax reform is a priority. Certain changes to U.S. tax laws, including reduction of the U.S. corporate tax rate, expansion of the U.S. tax base by eliminating certain deductions, implementation of a territorial tax system, and addition of a border adjustment mechanism, could have material consequences on the amount of tax we pay in the U.S. and thereby on our financial position and results of operations.

During fiscal 2016 and continuing into fiscal 2017, we identified material weaknesses in our internal controls over financial reporting. If we are unable to develop, implement and maintain effective internal controls in future periods, our consolidated financial statements could contain material misstatements which would cause us to issue a restatement thereof. A restatement of our consolidated financial statements could cause our investors to lose confidence in our reported financial information and lead to a decline in our stock price.

The Sarbanes-Oxley Act of 2002 and SEC rules require that management report annually on the effectiveness of our internal control over financial reporting and our disclosure controls and procedures. Among other things, management must conduct an assessment of internal control over financial reporting to allow management to report on the effectiveness of our internal control over financial reporting, as required by Section 404 of the Sarbanes-Oxley Act. Based on management’s assessment, we concluded that our internal controls over financial reporting were not effective as of January 28, 2017. The specific material weaknesses are described in Item 9A of this Annual Report on Form 10-K. A material weakness is a deficiency, or a combination of deficiencies, in internal control over financial reporting, such that there is a reasonable possibility that a material misstatement of our annual or interim consolidated financial statements would not be prevented or detected. As with any material weakness, if our remedial measures are insufficient to address the material weaknesses, or if additional material weaknesses or significant deficiencies in our internal control over financial reporting are discovered or occur in the future, our consolidated financial statements may contain material misstatements. Any material misstatements could result in a restatement of our consolidated financial statements, cause us to fail to meet our reporting obligations or cause investors to lose confidence in our reported financial information, leading to a decline in our stock price.

Even when we have remediated our material weaknesses, any control system, no matter how well designed and operated, can provide only reasonable, not absolute, assurance that the control system’s objectives will be met. Because of its inherent limitations, internal control over financial reporting will not necessarily prevent all error and all fraud. Controls can also be circumvented by the individual acts of some persons, by collusion of two or more people, or by management override of the controls. In addition, we may modify the design and operating effectiveness of our internal controls, which could affect the overall effectiveness or evaluation of the control system in the future by us or our independent registered public accounting firm. We cannot ensure that any design will succeed in achieving its stated goals under all potential future conditions, as controls may become inadequate due to changes in conditions or deterioration in the degree of compliance. Any failure to maintain an effective system of internal control over financial reporting could limit our ability to provide reliable financial reports, or to detect and prevent fraud, which would harm our business.

Matters relating to or arising from our Audit Committee investigation, including regulatory proceedings, litigation matters and potential additional expenses, may adversely affect our business and results of operations.

As previously disclosed in our public filings, the Audit Committee of our Board of Directors completed an investigation that generally included a review of certain revenue recognized in the first and second quarters of fiscal 2016 and the fourth quarter of fiscal 2015, including transactions that would have, in the normal course of events and but for action by certain Marvell employees, been completed and recognized in a subsequent quarter (referred to internally as “pull-ins”), the accrual of a litigation reserve in the second quarter of fiscal 2016, and the stated belief by Marvell’s former Chairman and Chief Executive Officer of ownership of certain patent rights related to the Final-Level Cache invention and his later assignment of associated patent rights to Marvell. In addition, we are also the subject of investigations by the Securities and Exchange Commission and the U.S. Attorney related to these matters. We are fully cooperating with the SEC and the U.S. Attorney with respect to those investigations.

To date, we have incurred significant expenses related to legal, accounting, and other professional services in connection with the investigations and related matters, and may continue to incur significant additional expenses with regard to these matters and related remediation efforts. The expenses incurred, and expected to be incurred, on the investigations, the impact of our delay in fiscal 2016 and the beginning of fiscal 2017 in meeting our periodic reports on the confidence of investors,

19


employees and customers, and the diversion of the attention of the management team that has occurred, and is expected to continue, has adversely affected, and could continue to adversely affect, our business, financial condition and results of operations or cash flows. As a result of the delay in filing of our periodic reports, we are not eligible to use a registration statement on Form S-3, and will not be eligible to use that form until we have timely filed all periodic reports required by the SEC for the twelve months preceding the filing of such registration statements, which may make it more difficult, costly or time consuming for us to raise capital if we should choose to do so.

As a result of the matter reported above, we are exposed to greater risks associated with litigation, regulatory proceedings and government enforcement actions. In addition, securities class actions or other lawsuits have been filed against us, our directors and officers. Any future such investigations or additional lawsuits may adversely affect our business, financial condition, results of operations and cash flows.
We have been named as a party to several legal proceedings and may be named in additional ones in the future, including litigation involving our patents and other intellectual property, which could subject us to liability, require us to indemnify our customers, require us to obtain or renew licenses, require us to stop selling our products or force us to redesign our products.

We have been named as a party to several lawsuits, government inquiries or investigations and other legal proceedings (referred to as “litigation”), and we may be named in additional ones in the future. Please see “Note 10 - Commitments and Contingencies” of our Notes to the Consolidated Financial Statements set forth in Part II, Item 8 of this Annual Report on Form 10-K for a more detailed description of a number of the litigation matters in which we are currently engaged. In particular, litigation involving patents and other intellectual property is widespread in the high-technology industry and is particularly prevalent in the semiconductor industry, where a number of companies and other entities aggressively bring numerous infringement claims to assert their patent portfolios. The amount of damages alleged in intellectual property infringement claims can often be very significant. See also, “We may be unable to protect our intellectual property, which would negatively affect our ability to compete.”

From time to time, our subsidiaries and customers receive, and may continue to receive in the future, standards-based infringement claims, as well as claims against us and our subsidiaries’ proprietary technologies. Our subsidiaries and customers could face claims of infringement for certain patent licenses that have not been renewed. These claims could result in litigation and/or claims for indemnification, which, in turn, could subject us to significant liability for damages, attorneys’ fees and costs. Any potential intellectual property litigation also could force us to do one or more of the following:

stop selling, offering for sale, making, having made or exporting products or using technology that contains the allegedly infringing intellectual property;

limit or restrict the type of work that employees involved in such litigation may perform for us;

pay substantial damages and/or license fees and/or royalties to the party claiming infringement or other license violations that could adversely impact our liquidity or operating results;

attempt to obtain or renew licenses to the relevant intellectual property, which licenses may not be available on reasonable terms or at all; and

attempt to redesign those products that contain the allegedly infringing intellectual property.

Under certain circumstances, we have contractual and other legal obligations to indemnify and to incur legal expenses for current and former directors and officers. Additionally, from time to time, we have agreed to indemnify select customers for claims alleging infringement of third-party intellectual property rights, including, but not limited to, patents, registered trademarks and/or copyrights. If we are required to make a significant payment under any of our indemnification obligations, our results of operations may be harmed.

Several securities class action lawsuits were filed against us following our September 11, 2015 announcement of an independent audit committee investigation of certain accounting and internal control matters in the second quarter of fiscal 2016 and our subsequent delinquency in filing our periodic financial reports.


20


The ultimate outcome of litigation could have a material adverse effect on our business and the trading price for our securities. Litigation may be time consuming, expensive, and disruptive to normal business operations, and the outcome of litigation is difficult to predict. Litigation, regardless of the outcome, may result in significant expenditures, diversion of our management’s time and attention from the operation of our business and damage to our reputation or relationship with third parties, which could materially and adversely affect our business, financial condition, results of operations, cash flows and stock price.

Our indemnification obligations and limitations of our director and officer liability insurance may have a material adverse effect on our financial condition, results of operations and cash flows.

Under Bermuda law, our articles of association and bye-laws and certain indemnification agreements to which we are a party, we have an obligation to indemnify, or we have otherwise agreed to indemnify, certain of our current and former directors and officers with respect to current and future investigations and litigation, including the matters discussed in Part I-Item 3, “Legal Proceedings” of this Annual Report on Form 10-K. In connection with some of these pending matters, we are required to, or we have otherwise agreed to, advance, and have advanced, legal fees and related expenses to certain of our current and former directors and officers and expect to continue to do so while these matters are pending. Certain of these obligations may not be “covered matters” under our directors’ and officers’ liability insurance, or there may be insufficient coverage available. Further, in the event the directors and officers are ultimately determined not to be entitled to indemnification, we may not be able to recover the amounts we previously advanced to them.

In addition, we have incurred significant expenses in connection with the Audit Committee’s independent investigation, the pending government investigations, and shareholder litigation. We cannot provide any assurances that pending claims, or claims yet to arise, including the cost of fees, penalties or other expenses, will not exceed the limits of our insurance policies, that such claims are covered by the terms of our insurance policies or that our insurance carrier will be able to cover our claims. Additionally, to the extent there is coverage of these claims, the insurers also may seek to deny or limit coverage in some or all of these matters. Furthermore, the insurers could become insolvent and unable to fulfill their obligation to defend, pay or reimburse us for insured claims. Accordingly, we cannot be sure that claims will not arise that are in excess of the limits of our insurance or that are not covered by the terms of our insurance policy. Due to these coverage limitations, we may incur significant unreimbursed costs to satisfy our indemnification obligations, which may have a material adverse effect on our financial condition, results of operations or cash flows.

We are exposed to potential impairment charges on certain assets.

We had approximately $2.0 billion of goodwill on our consolidated balance sheet as of January 28, 2017. Under generally accepted accounting principles in the United States, we are required to review our intangible assets including goodwill for impairment whenever events or changes in circumstances indicate that the carrying value of these assets may not be recoverable. We perform an assessment of goodwill for impairment annually on the last business day of our fiscal fourth quarter and whenever events or changes in circumstances indicate the carrying amount of goodwill may not be recoverable.

We have identified that our business operates as a single operating segment with two components (Storage, and Networking & Connectivity), which we have concluded can be aggregated into a single reporting unit for purposes of testing goodwill impairment. As part of our restructuring announced in November 2016, our former Smart Networked Devices and Solutions component was renamed to Networking & Connectivity. The fair value of the reporting unit is determined by taking our market capitalization as determined through quoted market prices and as adjusted for a control premium and other relevant factors. If our fair value declines to below our carrying value, we could incur significant goodwill impairment charges, which could negatively impact our financial results. If in the future a change in our organizational structure results in more than one reporting unit, we will be required to allocate our goodwill and perform an assessment of goodwill for impairment in each reporting unit. As a result, we could have an impairment of goodwill in one or more of such future reporting units.

In addition, from time to time, we have made investments in private companies. If the companies that we invest in are unable to execute their plans and succeed in their respective markets, we may not benefit from such investments, and we could potentially lose the amounts we invest. We evaluate our investment portfolio on a regular basis to determine if impairments have occurred. If the operations of any businesses that we have acquired declines significantly, we could incur significant intangible asset impairment charges. Impairment charges could have a material impact on our results of operations in any period.


21


If we were classified as a passive foreign investment company, there would be adverse tax consequences to U.S. holders of our ordinary shares.


If we were classified as a “passive foreign investment company” or “PFIC” under section 1297 of the Internal Revenue Code of 1986, as amended or the Code,(the “Code”), for any taxable year during which a U.S. holder holds ordinary shares, such U.S. holder generally would be taxed at ordinary income tax rates on any gain realized on the sale or exchange of the ordinary shares and on any “excess distributions” (including constructive distributions) received on the ordinary shares. Such U.S. holder could also be subject to a special interest charge with respect to any such gain or excess distribution.


We would be classified as a PFIC for U.S. federal income tax purposes in any taxable year in which either (i) at least 75% of our gross income is passive income or (ii) on average, the percentage of our assets that produce passive income or are held for the production of passive income is at least 50% (determined on an average gross value basis). We were not classified as a PFIC for fiscal year 2016 or in any prior taxable year. Whether we will, in fact, be classified as a PFIC for any subsequent taxable year depends on our assets and income over the course of the relevant taxable year and, as a result, cannot be predicted with certainty. In particular, because the total value of our assets for purposes of the asset test will be calculated based upon the market price of our ordinary shares, a significant and sustained decline in the market price of our ordinary shares and corresponding market capitalization relative to our passive assets could result in our being classified as a PFIC. There can be no assurance that we will not be classified as a PFIC in the future or the Internal Revenue Service will not challenge our determination concerning PFIC status for any prior period.

We rely upon the performance of our information technology systems to process, transmit, store and protect electronic information, and the failure of or security breaches of any critical information technology system may result in serious harm to our reputation, business, results of operations and/or financial condition.

We are heavily dependent on our technology infrastructure and maintain and rely upon certain critical information systems for the effective operation of our business. We routinely collect and store sensitive data in our information systems, including intellectual property and other proprietary information about our business and that of our customers, suppliers and business partners. These information technology systems are subject to damage or interruption from a number of potential sources including natural disasters, viruses, destructive or inadequate code, malware, power failures, cyber-attacks, and other events. We have implemented processes for systems under our control intended to mitigate risks, however, there can be no guarantee that they will be effective in mitigating those risks. Given the frequency of cyber attacks and resulting breaches reported by other businesses and governments, it is likely we will experience one or more breaches of some extent in the future. We may incur significant costs in order to implement, maintain and/or update security systems that we feel are necessary to protect our information systems or we may miscalculate the level of investment necessary to protect our systems adequately. To the extent that any system failure, accident or security breach results in disruptions or interruptions to our operations or the theft, loss or disclosure of, or damage to our data or confidential information, including our intellectual property, our reputation, business, results of operations and/or financial condition could be materially adversely affected.

We may be unable to protect our intellectual property, which would negatively affect our ability to compete.

We believe one of our key competitive advantages results from our collection of proprietary technologies that we have developed and acquired since our inception. If we fail to protect these intellectual property rights, competitors could sell products based on technology that we have developed that could harm our competitive position and decrease our revenues. We believe that the protection of our intellectual property rights is and will continue to be important to the success of our business. We rely on a combination of patents, copyrights, trademarks, trade secret laws, contractual provisions, confidentiality agreements, licenses and other methods, to protect our proprietary technologies. We also enter into confidentiality or license agreements with our employees, consultants and business partners, and control access to and distribution of our documentation and other proprietary information. Notwithstanding these agreements, we have experienced disputes with employees regarding ownership of intellectual property in the past and we currently have a disagreement with our former Chief Executive Officer, Dr. Sehat Sutardja, regarding his claim to ownership of the Final-Level Cache intellectual property. To the extent that any third party has a claim to ownership of any relevant technologies used in our products, we may not be able to recognize the full revenue stream from such relevant technologies.

We have been issued a significant number of U.S. and foreign patents and have a significant number of pending U.S. and foreign patent applications. However, a patent may not be issued as a result of any applications or, if issued, claims allowed may not be sufficiently broad to protect our technology. In addition, it is possible that existing or future patents may be challenged, invalidated or circumvented. Despite our efforts, unauthorized parties may attempt to copy or otherwise obtain and use our products or proprietary technology. Monitoring unauthorized use of our technology is difficult, and the steps that we have taken may not prevent unauthorized use of our technology, particularly in foreign countries where the laws may not protect our proprietary rights as fully as in the United States. If our patents do not adequately protect our technology, our competitors may be able to offer products similar to ours, which would adversely impact our business and results of operations.

Certain of our software (as well as that of our customers) may be derived from so-called “open source” software that is generally made available to the public by its authors and/or other third parties. Open source software is made available under licenses that impose certain obligations on us in the event we were to distribute derivative works of the open source software. These obligations may require us to make source code for the derivative works available to the public, and/or license such derivative works under a particular type of license, rather than the forms of license customarily used to protect our intellectual property. While we believe we have complied with our obligations under the various applicable licenses for open source software, in the event that

the copyright holder of any open source software were to successfully establish in court that we had not complied with the terms of a license for a particular work, we could be required to release the source code of that work to the public and/or stop distribution of that work if the license is terminated.

There can be no assurance that we will continue to declare cash dividends at all or in any particular amount, and statutory requirements under Bermuda Law, as well as ongoing litigation, may require us to defer payment of declared dividends.

In May 2012, we announced the declaration of our first quarterly cash dividend. Future payment of a regular quarterly cash dividend on our common shares will be subject to, among other things, the best interests of our company, our results of operations, cash balances and future cash requirements, financial condition, statutory requirements under Bermuda law and other factors that the board of directors may deem relevant. Our dividend payments may change from time to time, and we cannot provide assurance that we will continue to declare dividends at all or in any particular amounts. In addition, developments in ongoing litigation could affect our ability to make a dividend payment on a declared payment date until such time as we can meet statutory requirements under Bermuda law. A reduction in, a delay of, or elimination of our dividend payments could have a negative effect on our share price.

We must comply with a variety of existing and future laws and regulations that could impose substantial costs on us and may adversely affect our business.

We are subject to various state, federal and international laws and regulations governing the environment, including restricting the presence of certain substances in electronic products and making producers of those products financially responsible for the collection, treatment, recycling and disposal of those products. In addition, we are also subject to various industry requirements restricting the presence of certain substances in electronic products. Although our management systems are designed to maintain compliance, we cannot assure you that we have been or will be at all times in complete compliance with such laws and regulations. If we violate or fail to comply with any of them, a range of consequences could result, including fines, import/export restrictions, sales limitations, criminal and civil liabilities or other sanctions.

We and our customers are also subject to various import and export laws and regulations. Government export regulations apply to the encryption or other features contained in some of our products. If we fail to continue to receive licenses or otherwise comply with these regulations, we may be unable to manufacture the affected products at foreign foundries or ship these products to certain customers, or we may incur penalties or fines.

We are also subject to the “conflict mineral rules” promulgated by the SEC, which impose disclosure requirements on us regarding the use of conflict minerals mined from the Democratic Republic of Congo and adjoining countries in our products and the procedures our manufacturer’s use to prevent the sourcing of such conflict minerals. The ongoing implementation of these requirements could affect the sourcing, availability and pricing of minerals used in the manufacture of semiconductor devices, including our products. As a result, there may only be a limited pool of suppliers who provide conflict-free metals, and we cannot assure you that we will be able to obtain products in sufficient quantities or at competitive prices, which could adversely affect our operations and product margins. Additionally, if we are unable to sufficiently source conflict-free metals, we may face difficulties in satisfying customers who may require that the products they purchase from us are conflict-free, which may harm our sales and operating results.

The costs of complying (including the costs of any investigations, auditing and monitoring) with these laws could adversely affect our current or future business. In addition, future regulations may become more stringent or costly and our compliance costs and potential liabilities could increase, which may harm our current or future business.

We are subject to the risks of owning real property.

Our buildings in Santa Clara, California; Singapore; Etoy, Switzerland; and Shanghai, China subject us to the risks of owning real property, which include, but not limited to:

the possibility of environmental contamination and the costs associated with fixing any environmental problems;


adverse changes in the value of these properties, due to interest rate changes, changes in the neighborhood in which the property is located, or other factors;

the possible need for structural improvements in order to comply with zoning, seismic and other legal or regulatory requirements;

the potential disruption of our business and operations arising from or connected with a relocation due to moving to or renovating the facility;

increased cash commitments for improvements to the buildings or the property or both;

increased operating expenses for the buildings or the property or both;

possible disputes with tenants or other third parties related to the buildings or the property or both;

failure to achieve expected cost savings due to extended non-occupancy of a vacated property intended to be leased; and

the risk of financial loss in excess of amounts covered by insurance, or uninsured risks, such as the loss caused by damage to the buildings as a result of earthquakes, floods and or other natural disasters.

Additionally, the second surety bond, issued in connection with the patent litigation action with CMU, and commitment from the sureties are secured by our campus located in Santa Clara, California.

As we carry only limited insurance coverage, any incurred liability resulting from uncovered claims could adversely affect our financial condition and results of operations.


Our insurance policies may not be adequate to fully offset losses from covered incidents, and we do not have coverage for certain losses. For example, there is very limited coverage available with respect to the services provided by our third-party foundries and assembly and test subcontractors. In the event of a natural disaster (such as an earthquake or tsunami), political or military turmoil, widespread health issues or other significant disruptions to their operations, insurance may not adequately protect us from this exposure. We believe our existing insurance coverage is consistent with common practice, economic considerations and availability considerations. If our insurance coverage is insufficient to protect us against unforeseen catastrophic losses, any uncovered losses could adversely affect our financial condition and results of operations.


We haveare subject to the risks of owning real property.

Our buildings in Santa Clara, California; Singapore; Etoy, Switzerland; and Shanghai, China subject us to the risks of owning real property, which include, but are not beenlimited to:

the possibility of environmental contamination and the costs associated with remediating any environmental problems;

adverse changes in compliancethe value of these properties due to interest rate changes, changes in the neighborhood in which the property is located, or other factors;

the possible need for structural improvements in order to comply with zoning, seismic and other legal or regulatory requirements;

the reporting requirementspotential disruption of our business and operations arising from or connected with a relocation due to moving to or renovating the Securities Exchange Actfacility;

increased cash commitments for improvements to the buildings or the property, or both;

increased operating expenses for the buildings or the property, or both;

possible disputes with tenants or other third parties related to the buildings or the property, or both;

failure to achieve expected cost savings due to extended non-occupancy of 1934,a vacated property intended to be leased; and


22


the risk of financial loss in excess of amounts covered by insurance, or uninsured risks, such as amended (the “Exchange Act”) and Nasdaq’s requirements for continued listing and,the loss caused by damage to the buildings as a result our common shares may be delisted and suspended from trading on the Nasdaq Global Select Market.

We have been delinquent in the filing of our periodic financial reports with the SEC and, as a result, we are not in compliance with the Nasdaq rule that requires the timely filing of our periodic financial reports with the SEC. On September 14, 2015, Nasdaq notified us that due to our delay in filing with the SEC our Quarterly Report on Form 10-Q for the quarter ended August 1, 2015, our common shares would be delisted unless we timely requested a hearing before a Nasdaq Listings Qualification Panel (a “Hearings Panel”). We timely requested such a hearing, which was held on April 14, 2016. At the hearing, we presented a plan to regain compliance with the rule and requested an extension of time for the filing of our delayed reports, and on May 3, 2016, the Hearings Panel granted Marvell an extension of time to September 6, 2016, to regain compliance with our continued listing requirements. After filing this Form 10-K with the SEC, we will continue to be delinquent in our filings with the SEC due to our delay in filing a Form 10-Q for the quarter ended April 30, 2016. earthquakes, floods and/or other natural disasters.


There can

be no assurance that we will be successfulcontinue to declare cash dividends or effect share repurchases in regaining compliance withany particular amount or at all, and statutory requirements under Bermuda Law, may require us to defer payment of declared dividends or suspend share repurchases.


In May 2012, we announced the listing ruledeclaration of our first quarterly cash dividend. In November 2016, we announced that our board of directors had authorized a $1 billion share repurchase program and our intention to repurchase approximately $500 million worth of shares during the extension period. Ifperiod from November 2016 to October 2017. Future payment of a regular quarterly cash dividend on our common shares are delisted, there can no assurance whether or when it would againand future share repurchases will be listed for trading on Nasdaq or anysubject to, among other exchange. If our common shares are delisted,things: the market pricebest interests of our shares will likely decline and become more volatile,company and our shareholdersshareholders; our results of operations, cash balances and future cash requirements; financial condition; developments in ongoing litigation; statutory requirements under Bermuda law; market conditions; and other factors that the board of directors may finddeem relevant. Our dividend payments or share repurchases may change from time to time, and we cannot provide assurance that their abilitywe will continue to tradedeclare dividends or repurchase shares in any particular amounts or at all. A reduction in, a delay of, or elimination of our stock will be adversely affected. A delisting from Nasdaq may alsodividend payments or share repurchases could have othera negative implications, including the potential loss of confidence by customers and employees, the loss of institutional investor interest and fewer business development opportunities.

effect on our share price.


We are incorporated in Bermuda, and, as a result, it may not be possible for our shareholders to enforce civil liability provisions of the securities laws of the United States. In addition, our Bye-Laws contain a waiver of claims or rights of action by our shareholders against our officers and directors, which will severely limit our shareholders’ right to assert a claim against our officers and directors under Bermuda law.


We are organized under the laws of Bermuda. As a result, it may not be possible for our shareholders to affect service of process within the United States upon us, or to enforce against us in U.S. courts judgments based on the civil liability provisions of the securities laws of the United States. There is significant doubt as to whether the courts of Bermuda would recognize or enforce judgments of U.S. courts obtained against us or our directors or officers based on the civil liability provisions of the securities laws of the United States or any state, or hear actions brought in Bermuda against us or those persons based on those laws. The United States and Bermuda do not currently have a treaty providing for the reciprocal recognition and enforcement of judgments in civil and commercial matters. Therefore, a final judgment for the payment of money rendered by any federal or state court in the United States based on civil liability, whether or not based solely on U.S. federal or state securities laws, would not be automatically enforceable in Bermuda.


Our Bye-Laws contain a broad waiver by our shareholders of any claim or right of action, both individually and on our behalf, against any of our officers and directors. The waiver applies to any action taken by an officer or director, or the failure of an officer or director to take any action, in the performance of his or her duties with or for us, other than with respect to any matter involving any fraud or dishonesty on the part of the officer or director or to any matter arising under U.S. federal securities laws. This waiver will limit the rights of our shareholders to assert claims against our officers and directors unless the act complained of involves fraud or dishonesty or arises as a result of a breach of U.S. federal securities laws. Therefore, so long as acts of business judgment do not involve fraud or dishonesty or arise as a result of a breach of U.S. federal securities laws, they will not be subject to shareholder claims under Bermuda law. For example, shareholders will not have claims against officers and directors for a breach of trust, unless the breach rises to the level of fraud or dishonesty, or arises as a result of a breach of U.S. federal securities laws.


Our Bye-Laws contain provisions that could delay or prevent a change in corporate control, even if the change in corporate control would benefit our shareholders.


Our Bye-Laws contain change in corporate control provisions, which include:

include authorizing the issuance of preferred shares without shareholder approval; and

a shareholder vote requiring the approval 662/3% of votes cast in person or by proxy to approve any business combination in the event the action is not approved by at least 662/3% of the directors holding office at the date of the Board meeting to approve the action.

These foregoing provisionsapproval. This provision could make it more difficult for a third party to acquire us, even if doing so would be a benefit to our shareholders.


Item 1B.Unresolved Staff Comments

None.

Item 2.Properties


23


The following table presents the approximate square footage of our significant owned and leased facilities as of January 30, 2016:

28, 2017:
    (Square feet)
Locations Primary Use Owned Facilities Leased Facilities (1)
United States Headquarters in Santa Clara, California: Research and design, sales and marketing, administration and operations 993,000
 230,000
China Research and design, and sales and marketing 115,000
 227,000
Singapore Operations, and research and design 340,000
 
Switzerland Research and design 26,000
 
Israel Research and design 
 345,000
  Total 1,474,000
 802,000

(1)
Lease terms expire in various years from 2016 through 2021.

(1)Lease terms expire in various years from 2017 through 2025.
We also lease smaller facilities in Canada, Denmark, Germany, Hong Kong, India, Indonesia, Italy, Japan, Malaysia, South Korea, Spain, Taiwan, The Netherlands and Taiwan,Vietnam, which are occupied by administrative, sales, design and field application personnel. Based upon our estimates of future hiring, we believe that our current facilities in most locations will be adequate to meet our requirements at least through the next fiscal year.

Item 3.Legal Proceedings

The information set forth under “Note 10 — Commitments and Contingencies” in our Notes to the Consolidated Financial Statements set forth in Part II, Item 8 of this Annual Report on Form 10-K is incorporated herein by reference. For additional discussion of certain risks associated with legal proceedings, please see Part I, Item 1A, “Risk Factors” above.

Item 4.Mine Safety Disclosures

Not Applicable.


24


PART II

Item 5.Market for Registrant’s Common Equity, Related Shareholder Matters and Issuer Purchases of Equity Securities

Market Information

Our common shares are traded on the NASDAQ Global Select Market under the symbol “MRVL.” Our common shares began trading on June 27, 2000, upon completion of our initial public offering. For fiscal 20162017 and fiscal 2015,2016, the following table shows for the periods indicated the high and low sales prices for our common shares on the NASDAQ Global Select Market.

   Fiscal 2016   Fiscal 2015 
   High   Low   High   Low 

First Quarter

  $16.78    $13.71    $16.65    $14.33  

Second Quarter

  $14.73    $11.95    $16.09    $13.10  

Third Quarter

  $13.35    $7.55    $14.25    $11.65  

Fourth Quarter

  $9.62    $7.40    $16.19    $12.76  

  Fiscal 2017 Fiscal 2016
  High Low High Low
First Quarter $11.00
 $8.32
 $16.78
 $13.71
Second Quarter $12.05
 $9.05
 $14.73
 $11.95
Third Quarter $13.61
 $11.27
 $13.35
 $7.55
Fourth Quarter $15.45
 $12.30
 $9.62
 $7.40
As of July 11, 2016,March 22, 2017, the approximate number of record holders of our common shares was 131130 (not including beneficial owners of stock held in street name).

Stock Price Performance Graph

This performance graph shall not be deemed “filed” for purposes of Section 18 of the Exchange Act or incorporated by reference into any filings under the Securities Act or the Exchange Act, except as shall be expressly set forth by specific reference in such filing.

The graph below compares the cumulative total shareholder return of our common shares with the cumulative total return of the S&P 500 Index and the Philadelphia Semiconductor Index since January 29, 201128, 2012 through January 30, 2016.28, 2017. The graph compares a $100 investment on January 29, 201128, 2012 in our common shareshares with a $100 investment on January 31, 201129, 2012 in each index and assumes that any dividends were reinvested. Shareholder returns over the indicated periods should not be considered indicative of future stock prices or shareholder returns.

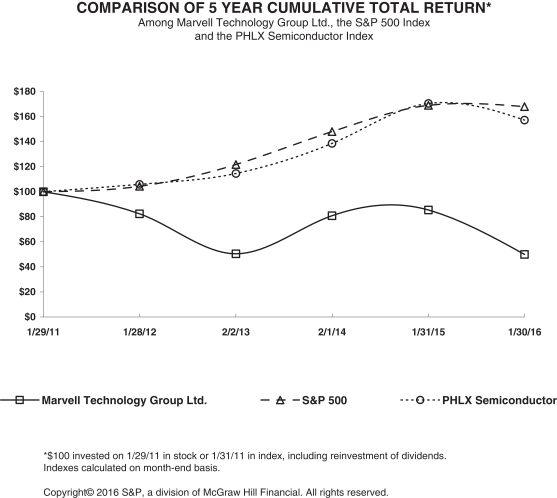
   1/29/11   1/28/12   2/2/13   2/1/14   1/31/15   1/30/16 

Marvell Technology Group Ltd.

   100.00     82.41     50.49     80.94     85.34     49.83  

S&P 500

   100.00     104.22     121.71     147.89     168.93     167.81  

PHLX Semiconductor

   100.00     105.96     114.50     138.52     170.56     157.20  


25


 1/28/2012 2/2/2013 2/1/2014 1/31/2015 1/30/2016 1/28/2017
Marvell Technology Group Ltd.100.00
 61.27
 98.21
 103.56
 60.46
 105.26
S&P 500100.00
 116.78
 141.91
 162.09
 161.01
 193.28
PHLX Semiconductor100.00
 107.03
 128.87
 160.17
 148.48
 216.97
Dividends

Our board of directors declared quarterly cash dividends of $0.06 per share payable to holders of our common shares in each quarter of fiscal 2017, 2016 fiscal 2015, and fiscal 2014.2015. As a result, we paid total cash dividends of $122.3 million in fiscal 2017, and $122.8 million in both fiscal 2016 and 2015, and $119.4 million in fiscal 2014.

2015.

Future payment of a regular quarterly cash dividend on the Company’s common shares will be subject to, among other things, the best interests of the Company and its shareholders, the Company’s results of operations, cash balances and future cash requirements, financial condition, developments in ongoing litigation, statutory requirements under Bermuda law and other factors that the Company’s board of directors may deem relevant. The Company’s dividend payments may change from time to time, and we cannot provide assurance that we will continue to declare dividends at all or in any particular amounts. In addition, developments in ongoing litigation could affect the Company’s ability to make a dividend payment on a declared payment date until such time as the Company can meet statutory requirements under Bermuda law.

Recent Sales of Unregistered Securities

None.

Issuer Purchases of Equity Securities

There were no common shares repurchased

The following table presents details of our share repurchases during the three months ended January 30, 2016.

In August 2010,28, 2017 (in thousands, except per share data):

Period (1) Total Number of Shares Purchased Average Price Paid per Share Total Number of Shares Purchased as Part of Publicly Announced Plans or Programs Approximated Dollar Value of Shares that May Yet Be Purchased Under the Plans or Programs (2)
October 30 - November 26 821,263
 $12.86
 821,263
 $1,000,000
November 27 - December 24 4,112,294
 $14.30
 4,112,294
 $941,211
December 25 - January 28 4,007,739
 $14.27
 4,007,739
 $884,032
Total 8,941,296
 $14.15
 8,941,296
 $884,032
         

(1) The monthly periods presented above for the three months ended January 28, 2017 are based on our boardfiscal accounting periods which follow a quarterly 4-4-5 week fiscal accounting period.

(2) On November 17, 2016, the Company announced that its Board of directors initiallyDirectors authorized our currenta $1 billion share repurchase plan. The newly authorized stock repurchase program toreplaces in its entirety the prior $3.25 billion stock repurchase up to $500program, which had approximately $115 million of our outstanding common shares. Our boardrepurchase authority remaining as of directors authorized an additional $1.5 billion in fiscal 2012, $1.0 billion in fiscal 2013 and $250 million in fiscal 2015 to be used to repurchase our common shares under the share repurchase program for a total available under the program of $3.25 billion.November 17, 2016. We intend to effect share repurchases in accordance with the conditions of Rule 10b-18 under the Exchange Act, but may also make repurchases in the open market outside of Rule 10b-18 or in privately negotiated transactions. The share repurchase program will be subject to market conditions and other factors and does not obligate us to repurchase any dollar amount or number of our common shares and the repurchase program may be extended, modified, suspended or discontinued at any time.

As

From August 2010 when our Board of Directors initially authorized a share repurchase program through January 30, 2016,28, 2017, a total 241.6254.9 million shares have been repurchased to date under the Company’s share repurchase program for a total $3.1$3.3 billion in cash and $182.6$884.0 million was available for future share repurchases. TheSubsequent to the end of the quarter through March 15, 2017, the Company has made norepurchased an additional 2.7 million of its common shares for $43.7 million at an average price per share repurchases since August 24, 2015.

of $15.91.


Item 6.Selected Financial Data

The following selected consolidated financial data should be read together with Part II, Item 7, “Management’s Discussion and Analysis of Financial Condition and Results of Operations” and Part II, Item 8, “Financial Statements and

26


Supplementary Data” contained elsewhere in this Annual Report on Form 10-K.

  January 30,  January 31,  February 1,  February 2,  January 28, 
  2016 (1)  2015 (2)  2014 (3)  2013 (4)  2012 (5) 
  (in thousands, except per share amounts and number of employees) 

Consolidated Statements of Operations Data:


Net revenue

 $2,725,828   $3,706,963   $3,404,400   $3,168,630   $3,393,040  

Cost of goods sold

 $1,494,736   $1,843,706   $1,663,730   $1,493,497   $1,465,805  

Research and development

 $1,054,257   $1,158,810   $1,153,999   $1,057,398   $1,012,950  

Operating income (loss)

 $(816,739 $408,819   $280,691   $294,657   $604,146  

Net income (loss)

 $(811,400 $435,346   $315,320   $306,585   $615,091  


Net income (loss) per share:


Basic

 $(1.59 $0.85   $0.64   $0.55   $1.01  

Diluted

 $(1.59 $0.84   $0.63   $0.54   $0.99  

Weighted average shares:


Basic

  510,945    511,089    496,518    555,310    607,857  

Diluted

  510,945    520,760    504,413    563,123    623,268  

Consolidated Balance Sheet Data:


Cash, cash equivalents and short-term investments

 $2,282,749   $2,529,555   $1,969,405   $1,918,990   $2,246,498  

Working capital

 $1,692,841   $2,706,644   $2,187,914   $1,977,458   $2,489,407  

Total assets

 $5,442,127   $5,884,387   $5,451,010   $5,261,764   $5,767,619  

Total shareholders’ equity

 $4,140,123   $5,146,089   $4,675,910   $4,484,595   $5,014,018  

Other Data:


Cash dividends declared per share

 $0.24   $0.24   $0.24   $0.18   $—    

Number of employees

  5,437    7,163    7,355    7,259    6,970  

In connection with the November 2016 announcement of our plan to restructure our operations to refocus our research and development, increase operational efficiency and improve profitability, we also plan to divest certain businesses and we began an active program to locate buyers for several businesses. As of January 28, 2017, two of these businesses were classified as discontinued operations. As required we retrospectively recast our consolidated statements of operations and balance sheets for all periods presented to reflect these businesses as discontinued operations.
 
January 28,
2017 (1)
 
January 30,
2016 (2)
 
January 31,
2015
 
February 1,
2014
 
February 2,
2013
 (in thousands, except per share amounts and number of employees)
Consolidated Statements of Operations Data:         
Net revenue$2,317,674
 $2,649,216
 $3,637,206
 $3,340,717
 $3,155,165
Cost of goods sold$1,029,527
 $1,442,517
 $1,799,425
 $1,613,673
 $1,482,563
Research and development$831,398
 $994,733
 $1,091,547
 $1,080,228
 $991,950
Operating income (loss)$99,994
 $(775,505) $456,376
 $348,615
 $365,136
Income (loss) from continuing operations$43,994
 $(769,155) $483,787
 $384,170
 $377,861
Loss from discontinued operations, net of tax$(22,843) $(42,245) $(48,441) $(68,850) $(71,276)
Net Income (loss)$21,151
 $(811,400) $435,346
 $315,320
 $306,585
Income (loss) from continuing operations per share:         
     Basic$0.09
 $(1.51) $0.95
 $0.77
 $0.68
     Diluted$0.09
 $(1.51) $0.93
 $0.76
 $0.67
Loss from discontinued operations per share:         
     Basic$(0.05) $(0.08) $(0.10) $(0.13) $(0.13)
     Diluted$(0.05) $(0.08) $(0.09) $(0.13) $(0.13)
Net income (loss) per share:         
     Basic$0.04
 $(1.59) $0.85
 $0.64
 $0.55
     Diluted$0.04
 $(1.59) $0.84
 $0.63
 $0.54
Weighted average shares:         
     Basic509,738
 510,945
 511,089
 496,518
 555,310
     Diluted517,513
 510,945
 520,760
 504,413
 563,123
Consolidated Balance Sheet Data:         
Cash, cash equivalents and short-term investments$1,668,360
 $2,282,749
 $2,529,555
 $1,969,405
 $1,918,990
Working capital$1,783,914
 $1,728,877
 $2,746,904
 $2,232,081
 $2,025,739
Total assets$4,648,650
 $5,442,127
 $5,884,387
 $5,451,010
 $5,261,764
Total shareholders’ equity$4,027,651
 $4,140,123
 $5,146,089
 $4,675,910
 $4,484,595
Other Data:         
Cash dividends declared per share$0.24
 $0.24
 $0.24
 $0.24
 $0.18
Number of employees4,617
 5,437
 7,163
 7,355
 7,259

(1)Fiscal 2017 includes $105.2 million of restructuring and other related charges that include $52.6 million for impairment of certain equipment, technology licenses and to fully impair a nonrefundable deposit due to the non-utilization of the related contract. Fiscal 2017 also included $68.0 million of tax expense related to restructuring actions taken.
(2)Fiscal 2016 includes $751.4 million of charges for litigation matters recognized by the Company including a charge of $736.0 million charge related to the $750 million settlement reached with CMU, (see “Note 15 —Subsequent Events” in the Notes to the Consolidated Financial Statements set forth in Part II, Item 8 of this Annual Report on Form 10-K) andas well as certain other pending litigation,litigation. In addition, fiscal 2016 included $63.5 million of restructuring and other related charges that include $8.0 million for impairment of certain equipment and technology licenses, and $8.0 million for the write down of inventory due to the restructuring of the mobile platform business, a charge for a cash payment authorized by our Board of Directors of $15.4 million to Dr. Sehat Sutardja (see “Note 14 — Related Party Transactions” in the Notes to the Consolidated Financial Statements set forth in Part II, Item 8 of this Annual Report on Form 10-K) and $11.4 million of costs for the surety bonds related to the litigation with CMU.

27


$15.4 million to our former CEO Dr. Sehat Sutardja and $11.4 million of costs for the surety bonds related to the litigation with CMU.

(2)Fiscal 2015 includes $13.8 million of restructuring and other related charges that include $3.4 million for the write-off of in-process research and development (“IPR&D”), and $3.2 million related to a loss from a contract termination, an $8.8 million gain from the sale of an investment, and $7.3 million of costs for the surety bonds related to the litigation with CMU.
(3)Fiscal 2014 includes $14.7 million for litigation settlements, an $8.1 million charge for the impairment of an intangible asset, a $7.0 million gain from the sale of a business, and $4.7 million of restructuring and other related charges. The litigation settlements do not relate to our litigation with CMU.
(4)Fiscal 2013 includes $5.7 million for an expense related to an ongoing litigation matter and $4.9 million for expenses related to acquisitions in prior fiscal years.
(5)Fiscal 2012 includes $6.7 million for litigation settlements and assessments of payroll taxes on employee benefits in certain jurisdictions.

Item 7.Management’s Discussion and Analysis of Financial Condition and Results of Operations


The following discussion of our financial condition and results of operations should be read in conjunction with the financial statements and related notes included in this Annual Report on Form 10-K. This discussion may contain forward-looking statements based upon current expectations that involve risks and uncertainties, including those discussed under Part I, Item 1A, “Risk Factors.” These risks and uncertainties may cause actual results to differ materially from those discussed in the forward-looking statements.

We are a fabless semiconductor provider of high-performance application-specific standard products. Our core strength of expertise is the development of complex SoC and SiP devices, leveraging our extensive technology portfolio of intellectual property in the areas of analog, mixed-signal, digital signal processing, and embedded and standalone integrated circuits. The majority of our product portfolio leverages embedded central processing unit technology. We also develop platforms that we define as integrated hardware along with software that incorporates digital computing technologies designed and configured to provide an optimized computing solution. Our broad product portfolio includes devices for data storage, enterprise-class Ethernet data switching, Ethernet PHY, wireless connectivity, IoT devices and multimedia solutions. Our products serve diverse applications used in carrier, metropolitan, enterprise and PC-client data communications and storage systems. Additionally, we serve the consumer electronics market for the convergence of voice, video and data applications. As a fabless integrated circuit company, we rely on independent, third-party contractors to perform manufacturing, assembly and test functions. This approach allows us to focus on designing, developing and marketing our products, and significantly reduces the amount of capital we need to invest in manufacturing products.


Overview

Fiscal 2016 was a challenging year for Marvell as increasing competitive dynamics in the handset market were compounded by softer demand conditions in PC and enterprise networking markets.

Net revenue in fiscal 20162017 was $2.7$2.3 billion and was 27%13% lower than net revenue of $3.7$2.6 billion in fiscal 2015. Revenues declined2016. The decline was primarily due to a 47% decrease in allsales of our end markets, led byother products and a 31%28% decrease in storage product sales and a 27% decline inof our mobile and wireless sales, givenconnectivity products. These decreases were primarily driven by the downsizingpreviously announced restructuring of the mobile handset business and continued challenges in the PC and networking markets. We are focused on our core technologies to improve our position and growth potential in our target markets of storage, networking and wireless connectivity.

platform business.

Restructuring. In the storage market, fiscalNovember 2016, was a challenging year for both our HDD and SSD businesses. In HDD, our revenue was negatively affected by a meaningful decline in overall HDD unit demand throughout the year. Although we believe our overall HDD market share did not change appreciably in fiscal 2016, our dependence on mobile HDDs was detrimental to our revenue growth. In SSDs, our sales were negatively affected by a decline in demand from one of our major SSD customers due to a supply chain change at one of its large PC customers. We continue to invest in comprehensive solutions that build upon our leading market position in the storage market.

In the mobile market, the competitive environment in the mobile baseband market continued to intensify in fiscal 2016, placing tremendous pressure on market prices for handset SoCs and platforms. Given the deteriorating margins in this business, we announced a significant restructuring plan intended to refocus our research and development, increase operational efficiency and improve profitability. During fiscal 2017 we recorded restructuring and other related charges of our mobile platform business in September 2015.

$105.2 million. In the wireless connectivity market, we continue to gain momentum in enterprise routers, gaming consoles, and set top box/streaming devicesconnection with our new generationrestructuring plan, we also plan to divest certain businesses and we began an active program to locate buyers for several businesses. As of WiFi solutions. We believeJanuary 28, 2017, two of these businesses have been classified as discontinued operations and we have retrospectively recast our consolidated financial statements for all periods presented to reflect these businesses as discontinued operations. These actions are expected to lower annual operating expenses to the increased bandwidth$820 million to $830 million range. Unless noted otherwise, our discussion under Part II, Item 7, Management’s Discussion and Analysis of Financial Condition and Results of Operations refers to our solutions will enable a significant upgrade cycle in enterprise, service provider and retail routers.

continuing operations.

In the networking market, sales of our networking solutions declined from fiscal 2016 mainly due to continued soft demand for our networking products. In fiscal 2016, we focused our engineering and marketing efforts on our core networking technologies for Ethernet switches and PHYs, and embedded networking processors. We believe these efforts will allow us to achieve design wins in enterprise, cloud/datacenter and service provider markets.

Capital Return Program.We believe our financial position is strong and we remain committed to deliver shareholder value through our share repurchase and dividend programs.

We previously announced our intention to repurchase shares of our common stock up to $1 billion, of which we intend to repurchase $500 million from November 2016 through October 2017. In the fourth quarter of fiscal 2017, we repurchased 8.9 million shares of our common stock for $126.5 million. Including these stock repurchases, we returned $303.9 million to stockholders in fiscal 2017, including $181.6 million through repurchases of common stock and $122.3 million of cash dividends.

Our cash, cash equivalents and short-term investments were $2.3$1.7 billion at January 30, 2016 (prior to giving effect to the settlement with CMU).

28, 2017. We generatedused cash flow from operations of $205.4$358.4 million duringthrough the fourth quarter of fiscal 2016.

We paid cash dividends of $0.24 per share for a total of $122.82017, primarily due to the $750 million in fiscal 2016 and subsequently, we announced a dividend of $0.06 per share in March 2016settlement with CMU that was fully paid in April 2016 and a dividend of $0.06 per share in May 2016 that was paid in July 2016.

We repurchased 19.7 million of our common shares for $260.9 million in fiscal 2016. The Company has made no share repurchases since August 24, 2015.


We believe that our existing cash, cash equivalents and short-term investments, together with cash generated from operations, exercise of employee stock options and purchases under our employee stock purchase plan will be sufficient to cover our working capital needs, capital expenditures, investment requirements, any declared dividends and commitments for at least the next 12 months, as well as payment of $750 million related to our settlement of the patent litigation with CMU.

Significant Customers

In connection with the patent litigation action with CMU, we reached settlement with CMU in February 2016 and have agreed to pay an aggregate of $750 million (see “Note 10 — Commitments and Contingencies” and “Note 15 — Subsequent Events” in the Notes to the Consolidated Financial Statements set forth in Part II, Item 8 of this Annual Report on Form 10-K for further discussion of this matter including the charge we recorded in fiscal 2016 and other patent litigation matters).

A significant number of our products are being incorporated into consumer electronics products, including gaming devices and personal computers, which are subject to significant seasonality and fluctuations in demand. Holiday and back to school buying trends may at times negatively impact our results in the first and fourth quarter, and positively impact our results in the second and third quarter of our fiscal years. In addition, consumer electronics sales are heavily dependent on new product launch timelines and product refreshes. For example, our sales of wireless connectivity products may increase significantly during a period when one of our customers launches a new gaming console, and these sales may taper significantly after the initial launch period.

Historically, a relatively small number of customers have accounted for a significant portion of our net revenue. Net revenue from one customer was 18%, 20%See the table in our discussion of “Customers, Sales and 24%Marketing” in Item 1 of this Annual Report on Form 10-K for fiscal 2016, 2015 and 2014, respectively. Net revenue from a second customer was 13%, 13% and 12% for fiscal 2016, 2015 and 2014, respectively. We had net revenue from one distributor representing 11% for fiscal 2015. No distributors accounted for 10% or greater of total net revenue in fiscal 2014 or fiscal 2016.further information. We continuously monitor the creditworthiness of our distributors and believe these distributors’ sales to diverse end customers and geographies further serve to mitigate our exposure to credit risk.

Most of our sales are made to customers located outside of the United States, primarily in Asia. Sales shipped to customers with operations in Asia represented approximately 94% of our net revenues in fiscal 2017, and 96% of our net revenuesrevenue in each of fiscal 2016 and 2015, and 95% of our net revenue for fiscal 2014.2015. Because many manufacturers and manufacturing subcontractors of our customers are located in Asia, we expect that most of our net revenue will continue to be represented by sales to our customers in that region.

A relatively large portion of our sales have historically been made on the basis of purchase orders rather than long-term agreements. In addition, the development process for our products is long, which may cause us to experience a delay between the time we incur expenses and the time revenue is generated from these expenditures. We anticipate that the rate of new orders may vary significantly from quarter to quarter.

Consequently, if anticipated sales and shipments in any quarter do not occur when expected, expenses and inventory levels could be disproportionately high, and our operating results for that quarter and future quarters may be adversely affected.

Critical Accounting Policies and Estimates

The preparation of consolidated financial statements in conformity with generally accepted accounting principles in the United States (“GAAP”) requires management to make estimates, judgments and assumptions that affect the reported amounts of assets, liabilities, revenues and expenses, and related disclosure of contingent assets and liabilities. On an ongoing basis, we

28


evaluate our estimates, including those related to performance-based compensation, revenue recognition, provisions for sales returns and allowances, share-based compensation, income taxes, inventory excess and obsolescence, investment fair values, goodwill and other intangible assets, restructuring, income taxes, litigation and other contingencies. In addition, we use assumptions when employing the Monte Carlo simulation and Black-Scholes valuation models to calculate the fair value of share-based awards granted. We base our estimates of the carrying value of certain assets and liabilities on historical experience and on various other assumptions that are believed to be reasonable under the circumstances when these carrying values are not readily available from other sources. Actual results could differ from these estimates, and such differences could affect the results of operations reported in future periods. We believe the following critical accounting policies affect our more significant judgments and estimates used in the preparation of our consolidated financial statements.

Revenue Recognition.    We recognize revenue when there is persuasive evidence of an arrangement, delivery has occurred, the fee is fixed or determinable, and collection is reasonably assured. If we grant extended payment terms greater than our standard terms for a customer such that collectability is not assured, the revenue and the corresponding cost of goods sold are deferred upon shipment and will be recognized when the payment becomes due provided all other revenue recognition criteria have been satisfied. Additional review and approval by management is required for any transaction with extended payment terms that exceed 90 days to determine proper revenue recognition, which may be subject to management judgment.

Product revenue is generally recognized upon shipment of product to customers, net of accruals for estimated sales returns and rebates. However, some of our sales are made through distributors under agreements allowing for price protection and limited rights of stock rotation on product unsold by the distributors. Although title passes to the distributor upon shipment, terms and payment by our distributors is not contingent on resale of the product, productproduct. Product revenue on sales made through distributors with price protection and stock rotation rights areis deferred until the distributors sell the product to end customers. Deferred revenue less the related cost of the inventories is reported as deferred income. We do not believe that there is any significant exposure related to impairment of deferred cost of sales, as our historical returns have been minimal and inventory turnover for our distributors generally ranges from 60 to 90 days. Our sales to direct customers are made primarily pursuant to standard purchase orders for delivery of products.

A portion of our net revenue is derived from sales through third-party logistics providers who maintain warehouses in close proximity to our customer’s facilities. Revenue from sales through these third-party logistics providers is not recognized until the product is pulled from stock by the customer.

The provision for estimated sales returns and allowances on product sales is recorded in the same period the related revenues are recorded. These estimates are based on historical sales returns, analysis of credit memo data and other known factors. In addition, payments to our customers, in cases where products with potential quality issues are not returned to us and the related quality issue can otherwise not be verified, or where the amount of the payment is not sufficiently supported by the fair value of the quality issue, may be recorded as a reduction of revenue. Actual returns could differ from these estimates. We account for rebates by recording reductions to revenue in the same period that the related revenue is recorded. The amount of these reductions is based upon the terms agreed to with the customers.

Share-Based Compensation.    We measure ourshare-basedour share-based compensation at the grant date, based on the fair value of the award, and recognize expense over the requisite service period. We amortize share-based compensation expense for time-based awards under the straight-line attribution method over the vesting period,period. Share-based compensation expense for performance-based awards is recognized when it becomes probable that the performance conditions will be met. Once it becomes probable that a performance-based award will vest, we recognize compensation expense equal to the number of shares expected to vest multiplied by the fair value of the award at the grant date, which is generally four years for annual grants to employees and five years for new hire grants. Performance-based awards are amortized using the accelerated method. In the case of performance-based awards based on total shareholder return (“TSR”), share-based compensation expense is amortized over the requisite service period. For stock purchase rights under the stock purchase plan, the Company amortizes share-based compensation expense ratably over the two-year offering period.

We estimate the fair value of time-based stock option and stock purchase awards on the date of grant using the Black Scholes option-pricing model. The fair value of market-based stock optionTSR awards is estimated on the date of grant using a Monte Carlo simulation model.model since the award is indexed to the price of our common stock as set forth under the terms of the award. The value of the portion of the awards that is ultimately expected to vest is recognized as expense over the requisite service periods. The Black-Scholes and Monte Carlo models incorporate various highly subjective assumptions including expected term of awards, expected future stock price volatility, expected dividend yield and risk-free interest rate.

In developing estimates used to calculate assumptions, we establish the expected term for employee stock options, as well as expected forfeiture rates, based on the historical settlement experience and after giving consideration to vesting schedules. Assumptions for stock option exercises and pre-vesting terminations of stock options were stratified by two employee groups and one employee/non-employee group with sufficiently distinct behavior patterns. Expected volatility was developed based on an equally weighted combination of historical stock price volatility and implied volatility derived from traded options on our stock in the marketplace. The expected dividend yield is calculated by dividing annualized dividend payments by the closing stock price on the grant date of the option.


29


The fair value of each restricted stock unit is estimated based on the market price of the Company’s common shares on the date of grant less the expected dividend yield. Additionally, for certain of our performance-based awards, we must make subjective assumptions regarding the likelihood that the related performance metrics will be met. These assumptions are based on various revenue and operating performance criteria. Changes in our actual performance could cause a significant adjustment in future periods for these performance-based awards.

Share-based compensation expense is recorded net of estimated forfeitures such that expense is recorded only for those share-based awards that are expected to vest. Previously recognized expense is reversed for the portion of awards forfeited prior to vesting as and when forfeitures occurred. Forfeitures are estimated at the time of grant and revised, if necessary, in subsequent periods if actual forfeitures differ from initial estimates. Assumptions for forfeitures are stratified by employee groups with sufficiently distinct behavior patterns. Changes in the estimated forfeiture rate can have a significant effect on reported share-based compensation expense, as the effect of adjusting the rate for all expense amortization is recognized in the period the forfeiture estimate is changed. If the actual forfeiture rate is higher than the estimated forfeiture rate, then an adjustment will be made to increase the estimated forfeiture rate, which will result in a decrease to the expense recognized in the financial statements. If the actual forfeiture rate is lower than the estimated forfeiture rate, then an adjustment will be made to lower the estimated forfeiture rate, which will result in an increase to the expense recognized in the financial statements. The expense we recognize in future periods could be affected by changes in the estimated forfeiture rate and may differ significantly from amounts recognized in the current period and/or our forecasts.

Accounting for Income Taxes.    We estimate our income taxes in each of the jurisdictions in which we operate. This process involves estimating our actual tax exposure together with assessing temporary differences resulting from the differing treatment of certain items for tax return and financial statement purposes. These differences result in deferred tax assets and liabilities, which are included withinin our consolidated balance sheets.

We recognize income taxes using an asset and liability approach. This approach requires the recognition of taxes payable or refundable for the current year, and deferred tax liabilities and assets for the future tax consequences of events that have been recognized in our consolidated financial statements or tax returns. The measurement of current and deferred taxes is based on provisions of the enacted tax law and the effects of future changes in tax laws or rates are not anticipated.

Evaluating the need for an amount of a valuation allowance for deferred tax assets often requires judgment and analysis of all the positive and negative evidence available, including cumulative losses in recent years and projected future taxable income, to determine whether all or some portion of the deferred tax assets will not be

realized. Using available evidence and judgment, we establish a valuation allowance for deferred tax assets, when it is determined that it is more likely than not that they will not be realized. Valuation allowances have been provided primarily against the U.S. research and development credits. Valuation allowances have also been provided against certain acquired operating losses and the deferred tax assets of a foreign subsidiary.subsidiaries. A change in the assessment of the realization of deferred tax assets may materially impact our tax provision in the period in which a change of assessment occurs.

As a multinational corporation, we conduct our business in many countries and are subject to taxation in many jurisdictions. The taxation of our business is subject to the application of various and sometimes conflicting tax laws and regulations as well as multinational tax conventions. Our effective tax rate is highly dependent upon the geographic distribution of our worldwide earnings or losses, the tax regulations and tax holidays in each geographic region, the availability of tax credits and carryforwards, and the effectiveness of our tax planning strategies. The application of tax laws and regulations is subject to legal and factual interpretation, judgment and uncertainty. Tax laws themselves are subject to change as a result of changes in fiscal policy, changes in legislation, and the evolution of regulations and court rulings. Consequently, taxing authorities may impose tax assessments or judgments against us that could materially impact our tax liability and/or our effective income tax rate.

We are subject to income tax audits by the respective tax authorities in all of the jurisdictions in which we operate. We recognize the effect of income tax positions only if these positions are more likely than not of being sustained. Recognized income tax positions are measured at the largest amount that is more than 50% likely of being realized. Changes in recognition or measurement are reflected in the period in which the change in judgment occurs. We record interest and penalties related to unrecognized tax benefits in income tax expense. The calculation of our tax liabilities involves the inherent uncertainty associated with the application of GAAP and complex tax laws. We believe we have adequately provided for in our financial statements additional taxes that we estimate may be required to be paid as a result of such examinations. While we believe that we have adequately provided for all tax positions, amounts asserted by tax authorities could be greater or less than our accrued position. These tax liabilities, including the interest and penalties, are released pursuant to a settlement with tax authorities, completion of audit or expiration of various statutes of limitation. The material jurisdictions in which we may be subject to potential examination by tax authorities throughout the world include China, Israel, Singapore, Switzerland and the United States.


30


The recognition and measurement of current taxes payable or refundable, and deferred tax assets and liabilities require that we make certain estimates and judgments. Changes to these estimates or a change in judgment may have a material impact on our tax provision in a future period.

Inventories.    We value our inventory at the lower of cost or market, cost being determined under the first-in, first-out method. We regularly review inventory quantities on hand and record a reduction to the total carrying value of our inventory for any difference between cost and estimated market value of inventory that is determined to be excess, obsolete or unsellable inventory based primarily on our estimated forecast of product demand and production requirements. The estimate of future demand is compared to our inventory levels, including open purchase commitments, to determine the amount, if any, of obsolete or excess inventory. Demand for our products can fluctuate significantly from period to period. A significant decrease in demand could result in an increase in the amount of excess inventory on hand. In addition, our industry is characterized by rapid technological change, frequent new product development and rapid product obsolescence that could result in an increase in the amount of obsolete inventory quantities on hand. Additionally, our estimates of future product demand may prove to be inaccurate, in which case we may have understated or overstated the reduction to the total carrying value of our inventory for excess and obsolete inventory. In the future, if our inventory is determined to be overvalued, we would be required to recognize such costs in our cost of goods sold at the time of such determination. Likewise, if our inventory is determined to be undervalued, we may have over-reported our cost of goods sold in previous periods and would be required to recognize additional gross margin at the time the related inventory is sold. Therefore, although we make every effort to ensure the accuracy of our forecasts of

future product demand, any significant unanticipated changes in demand or technological developments could have a significant impact on the value of our inventory and our results of operations.

Long-lived Assets and Intangible Assets.    We assess the impairment of long-lived assets and intangible assets whenever events or changes in circumstances indicate that the carrying value of such assets may not be recoverable. Circumstances which could trigger a review include, but are not limited to the following:

significant decreases in the market price of the asset;

significant adverse changes in the business climate or legal factors;

accumulation of costs significantly in excess of the amount originally expected for the acquisition or construction of the asset;

current period cash flow or operating losses combined with a history of losses or a forecast of continuing losses associated with the use of the asset; and

current expectation that the asset will more likely than not be sold or disposed of significantly before the end of its estimated useful life.

Whenever events or changes in circumstances suggest that the carrying amount of long-lived assets and intangible assets may not be recoverable, we estimate the future cash flows expected to be generated by the asset from its use or eventual disposition. If the sum of the expected future cash flows is less than the carrying amount of those assets, we recognize an impairment loss based on the excess of the carrying amount over the fair value of the assets. Significant management judgment is required in the forecasts of future operating results that are used in the discounted cash flow method of valuation.

As of January 30, 2016, we had a total of $18.0 million in acquired intangible assets. In fiscal 2016, we recorded charges of $0.3 million to write off core technology due to our decision to discontinue the related development project and $0.3 million to write off a trade name that we no longer intend to market. In fiscal 2015, we recorded a charge of $3.4 million to write off IPR&D related to a project that was discontinued. In fiscal 2014, we recorded a charge of $8.1 million for the impairment of an acquired intangible asset.

Goodwill.    We record goodwill when the consideration paid for a business acquisition exceeds the fair value of net tangible and intangible assets acquired. We review goodwill for impairment annually on the last business day of our fiscal fourth quarter and whenever events or changes in circumstances indicate the carrying amount of goodwill may not be recoverable. We have identified that our business operates as a single operating segment which can further be divided into two components; Storage, and Smart Networked Devices and Solutions.Networking & Connectivity. Management concluded that goodwill is recoverable from these two components working jointly due to a fact pattern demonstrating significant sharing of assets, corporate resources, and benefits from common research and development. The two components also exhibit similar economic characteristics. Accordingly, management concluded that these two components should be aggregated into a single reporting unit for purposes of testing goodwill impairment. As part of our restructuring announced in November 2016, our former Smart Networked Devices and Solutions component was renamed to Networking & Connectivity.

When testing goodwill for impairment, we first assess qualitative factors to determine whether it is more likely than not that the fair value of a reporting unit is less than its carrying value. Factors we consider important which could trigger a goodwill impairment review include;

significant underperformance relative to historical or projected future operating results;

significant changes in the manner of our use of the acquired assets or the strategy for our overall business;

significant negative industry or economic trends;

a significant decline in our stock price for a sustained period; and


31


a significant change in our market capitalization relative to our net book value.

If we conclude that it is more likely than not that the fair value of a reporting unit is less than its carrying amount or if we note multiple qualitative factors indicating potential impairment, then a two-step quantitative impairment test is performed. The first step requires comparing the fair value of the reporting unit to its net book value, including goodwill. A potential impairment exists if the fair value of the reporting unit is lower than its net book value. Determining the fair value of a reporting unit involves the use of significant estimates and assumptions. Our goodwill impairment test uses a weighting of the income method and the market method to estimate a reporting unit’s fair value. The income method is based on a discounted future cash flow approach that uses the following assumptions and inputs: revenue based on assumed market segment growth rates and our assumed market segment share, estimated costs, and appropriate discount rates based on our weighted average cost of capital as determined by considering the observable weighted average cost of capital of comparable companies. The market method is based on quoted prices of our shares as well as an implied control premium (the excess of the reporting unit’s fair value over Marvell’s market capitalization). We evaluate the control premium by comparing it to observable control premiums from recent comparablemarket acquisition transactions.

The second step of the process is only performed if a potential impairment exists, and it involves determining the implied fair value of the reporting unit’s goodwill and comparing it to the carrying value of goodwill. If the carrying value of goodwill were to exceed its implied fair value, then the Company will record a charge for the amount of impairment in the fiscal quarter in which the determination is made.

On

In connection with the last day of the third quarter of fiscal 2016, the Company performed an impairment assessment for testing goodwill due to certain events and circumstances management considered could be factors that could trigger a goodwill impairment. These factors included the Federal Circuit panel’s decision in August 2015 related to the CMU litigation (see “Note 10 — Commitments and Contingencies” in the Notes to the Consolidated Financial Statements set forth in Part II, Item 8 of this Annual Report on Form 10-K), the Company’s decision to significantly restructure its mobile platform businessrestructuring plan we announced in September 2015November 2016 (see “Note 8 - Restructuring and Other Related Charges”), our Board of Directors approved a plan to sell certain businesses that are classified and reported in the Notesconsolidated statement of operations as discontinued operations. As a result, goodwill was allocated to these businesses based on relative fair value since each represents a portion of our reporting unit. We obtained an independent valuation to determine the Consolidated Financial Statements set forth in Part II, Item 8fair value of this Annual Report on Form 10-K)these businesses for purposes of allocating the goodwill and to complete a significant declinestep one assessment for goodwill impairment of our continuing operations. Although we engaged an independent valuation specialist to provide the fair value calculations, management provided the necessary estimates used in the Company’s stock price during fiscal 2016. Our goodwill impairment analysis did not resultspecialists calculations. Significant management judgment is required in any impairment charges. The excessdetermining the estimations of fair value over carrying amountfuture cash flows, which is dependent on internal forecasts, the long-term rate of growth for our reporting unit approximated 36%business, the life over which cash flows will occur, and the weighted average cost of its carrying amount. Our annual goodwill impairment analysis, which we performed ascapital. Management assumes full responsibility for the valuation results and the accuracy and completeness of the underlying financial data and corresponding assumptions.
As of the last day of the fourth quarter of fiscal 2016, also did not result in any2017, we performed our annual impairment charges sinceassessment for testing goodwill. A step one assessment was performed due to the excessallocation of our goodwill to certain businesses that we classified and reported as discontinued operations. Based on the independent valuation we obtained, we determined there was no impairment as the fair value oversignificantly exceeded the Company’s carrying amount for our reporting unit approximated 41% of its carrying amount.

value.

Litigation Costs.Legal Contingencies.    From time to time, we are involved in legal actions or other third-party assertions arising in the ordinary course of business. There can be no assurance these actions or other third-party assertions will be resolved without costly litigation, in a manner that does not adversely impact our financial position, results of operations or cash flows or without requiring royalty payments in the future, which may adversely impact gross margins. We record a liability when it is probable that a loss has been incurred and the amount can be reasonably estimated. In determining the probability of a loss and consequently, determining a reasonable estimate, management is required to use significant judgment. Given the uncertainties associated with any litigation, the actual outcome can be different than our estimates and could adversely affect our results of operations, financial position and cash flows.

Results of Operations

- Continuing Operations

The following table sets forth information derived from our consolidated statements of operations expressed as a percentage of net revenue:

   Year Ended 
   January 30,
2016
  January 31,
2015
  February 1,
2014
 

Net revenue

   100.0  100.0  100.0

Operating costs and expenses:


Cost of goods sold

   54.8    49.7    48.9  

Research and development

   38.7    31.2    33.9  

Selling and marketing

   4.7    3.9    4.5  

General and administrative

   5.4    3.4    3.1  

Carnegie Mellon University litigation settlement

   24.0    —      —    

Restructuring and other related charges

   2.0    0.3    0.1  

Amortization and write-off of acquired intangible assets

   0.4    0.5    1.3  


Total operating costs and expenses

   130.0    89.0    91.8  


Operating income (loss)

   (30.0  11.0    8.2  

Interest and other income, net

   0.7    0.6    0.7  


Income (loss) before income taxes

   (29.3  11.6    8.9  

Provision (benefit) for income taxes

   0.5    (0.1  (0.3


Net income (loss)

   (29.8)%   11.7  9.2


32


 Year Ended
 
January 28,
2017
 
January 30,
2016
 
January 31,
2015
Net revenue100.0% 100.0 % 100.0 %
Operating costs and expenses:     
Cost of goods sold44.4
 54.5
 49.5
Research and development35.9
 37.5

30.0
Selling and marketing5.0
 4.7

3.8
General and administrative5.5
 5.5

3.4
Carnegie Mellon University litigation settlement
 24.7
 
Restructuring and other related charges4.5
 2.0
 0.3
Amortization and write-off of acquired intangible assets0.3
 0.4

0.4
Total operating costs and expenses95.6
 129.3
 87.4
Operating income (loss) from continuing operations4.4
 (29.3) 12.6
Interest and other income, net0.7
 0.7

0.6
Income (loss) from continuing operations before income taxes5.1
 (28.6) 13.2
Provision (benefit) for income taxes3.2
 0.4
 (0.1)
Income (loss) from continuing operations1.9% (29.0)% 13.3 %
Years Ended January 28, 2017 and January 30, 2016
Net Revenue
 Year Ended  
 
January 28,
2017
 
January 30,
2016
 
% Change
in 2017
 (in thousands, except percentage)
Net revenue$2,317,674
 $2,649,216
 (12.5)%

Our net revenue for fiscal 2017 decreased by $331.5 million compared to net revenue for fiscal 2016. This decrease was primarily due to decreased sales of our other products, which were down 47%, and decreased sales of our connectivity products, which were down by 28%. These decreases were driven by the previously announced restructuring of our mobile handset platform business. In addition, revenue from our storage products was down by 4%, mainly due to a decrease in sales of HDD products, offset by strong growth in sales of SSD product. These declines were partially offset by sales growth of 11% in our networking products, driven by the introduction of new products and increased sales to the enterprise and campus markets. Unit shipments were 22% lower and weighted average selling prices increased 12% compared to fiscal 2016, for an overall decline of 13%.

Prior to fiscal 2017, our customers agreed from time to time to take shipments in an earlier fiscal quarter than the fiscal quarter they originally requested delivery. When such agreement would not have occurred but for the request made by Marvell, we refer to such transactions internally as “pull-ins.” Beginning in fiscal 2017, our policy is not to engage in pull-in transactions and, as a result, there were no such transactions in fiscal 2017.
Cost of Goods Sold
 Year Ended  
 
January 28,
2017
 
January 30,
2016
 
% Change
in 2017
 (in thousands, except percentages)
Cost of goods sold$1,029,527
 $1,442,517
 (28.6)%
% of net revenue44.4% 54.5%  
The cost of goods sold as a percentage of net revenue was lower for fiscal 2017 due to the $81.3 million CMU settlement included in cost of goods sold in 2016, a reduction in sales of lower margin mobile platform related product and lower material and manufacturing costs. Our cost of goods sold as a percentage of net revenue may fluctuate in future periods due to, among other things: changes in the mix of products sold; the timing of production ramps of new products; increased pricing pressures

33


from our customers and competitors; charges for obsolete or potentially excess inventory; changes in the costs charged by our foundry, assembly and test subcontractors; product warranty costs; changes in commodity prices such as gold; and the margin profiles of our new product introductions.
Share-Based Compensation Expense
 Year Ended
 
January 28,
2017
 
January 30,
2016
 (in thousands)
Continuing operations:   
      Cost of goods sold$8,334
 $7,787
      Research and development78,136
 92,054
      Selling and marketing10,243
 10,242
      General and administrative8,047
 15,878
Share-based compensation - continuing operations104,760
 125,961
Discontinued operations:   
      Cost of goods sold187
 129
      Research and development8,306
 6,738
      Selling and marketing649
 864
      General and administrative68
 87
Share-based compensation - discontinued operations9,210
 7,818
Total share-based compensation$113,970
 $133,779
Share-based compensation expense for continuing operations decreased by $21.2 million in fiscal 2017 compared to fiscal 2016. The decrease was mainly due to lower headcount from the previously announced restructuring of the mobile platform business, as well as from the restructuring announced in November 2016. The cancellation of equity awards related to certain members of our executive management who departed in April 2016 also reduced the expense. These decreases were partially offset by the effect from the acceleration of expense caused by the cancellation of the June 2016 ESPP purchase because the Company was not eligible to issue shares of its common stock due to the delay in the timely filing of its periodic reports with the SEC (see “Note 12 - Shareholder's Equity” in the Notes to the Consolidated Financial Statements set forth in Part II, Item 8 of this Annual Report on Form 10-K).
Restructuring and Other Related Charges
 Year Ended
 
January 28,
2017
 
January 30,
2016
 (in thousands)
Cost of goods sold$
 $10,292
Restructuring and other related charges105,186
 53,251
 $105,186
 $63,543

We recorded total restructuring charges and other related charges of $105.2 million in fiscal 2017, which primarily arose from activities related the restructuring plan we announced in November 2016 to restructure our operations to refocus our research and development, increase operational efficiency and improve profitability. The Company recorded charges of $98.7 million, including severance benefits of $41.0 million, the impairment of a $45.0 million nonrefundable deposit due to the non-utilization of the related contract, $5.4 million for the impairment of equipment and technology licenses, and other exit-related costs of $7.3 million associated with the closure of facilities and contract termination penalties. In addition, the Company recorded $6.5 million related to previous fiscal 2016 restructuring actions, which included the write-off of mobile-related equipment that was previously held-for-sale and the remaining lease obligation for certain floors in one of its Israel facilities that were vacated in fiscal 2017. See “Note 8 - Restructuring and Other Related Charges” in the Notes to the Consolidated Financial Statements set forth in Part II, Item 8 of this Annual Report on Form 10-K for further information.

As a result of the restructuring plan announced in November 2016, we expect to lower annual operating expenses to approximately $820 million to $830 million.

34


Research and Development
 Year Ended  
 
January 28,
2017
 
January 30,
2016
 
% Change
in 2017
 (in thousands, except percentages)
Research and development$831,398
 $994,733
 (16.4)%
% of net revenue35.9% 37.5%  
Research and development expense decreased by $163.3 million in fiscal 2017 compared to fiscal 2016. The decrease was primarily attributable to $91.6 million of lower personnel-related costs, lower costs related to project spending and facility maintenance services of $44.0 million, and a reduction in depreciation and amortization expense of $9.4 million. These reductions were driven by the restructuring of our mobile platform business as well as the restructuring actions announced in November 2016.
Selling and Marketing
 Year Ended  
 
January 28,
2017
 
January 30,
2016
 
% Change
in 2017
 (in thousands, except percentages)
Selling and marketing$115,817
 $124,096
 (6.7)%
% of net revenue5.0% 4.7%  
Selling and marketing expense decreased by $8.3 million in fiscal 2017 compared to fiscal 2016. The decrease was primarily attributable to decreases of $7.2 million of marketing communications expenses.
General and Administrative
 Year Ended  
 
January 28,
2017
 
January 30,
2016
 
% Change
in 2017
 (in thousands, except percentages)
General and administrative$127,376
 $145,359
 (12.4)%
% of net revenue5.5% 5.5%  
General and administrative expense decreased by $18.0 million in fiscal 2017 compared to fiscal 2016. The decrease was due to $7.1 million of lower charges for various litigation matters and $11.4 million of lower costs for the surety bonds related to the litigation with CMU. The decrease also included a $9.2 million decrease in legal expenses related to legal services. In addition, the decrease reflected the effect of a $15.4 million charge for a cash payment relating to a tax matter to our former Chief Executive Officer approved by the Company’s Executive Compensation Committee and included in fiscal 2016 that was not included in fiscal 2017. These decreases were partially offset by $22.1 million of other higher professional fees.
Carnegie Mellon University Litigation Settlement
 Year Ended  
 
January 28,
2017
 
January 30,
2016
 
% Change
in 2017
 (in thousands, except percentages)
Litigation settlement with Carnegie Mellon University$
 $654,667
 (100.0)%
% of net revenue% 24.7%  

In connection with the settlement agreement with CMU for $750 million (see “Note 10 – Commitments and Contingencies” and “Note 15 – Carnegie Mellon University Settlement” in the Notes to the Consolidated Financial Statements set forth in Part II, Item 8 of this Annual Report on Form 10-K), $654.7 million of the settlement allocated to the mutual release of claims and covenant not to sue was recorded in operating expenses in fiscal 2016. Of the remaining $95.3 million, $81.3 million was recorded in cost of goods sold in fiscal 2016. The remaining $14.0 million will be recognized in cost of goods sold over the remaining term of the license from February 2016 through April 2018.

35


Amortization and Write-Off of Acquired Intangible Assets
 Year Ended  
 
January 28,
2017
 
January 30,
2016
 
% Change
in 2017
 (in thousands, except percentages)
Amortization and write-off of acquired intangible assets$8,376
 $10,098
 (17.1)%
% of net revenue0.3% 0.4%  
Amortization and write-off of acquired intangible assets decreased by $1.7 million in fiscal 2017 compared to fiscal 2016. The decrease was primarily due to lower amortization expense as certain intangible assets became fully amortized.
Interest and Other Income, net
 Year Ended  
 
January 28,
2017
 
January 30,
2016
 
% Change
in 2017
 (in thousands, except percentages)
Interest and other income, net$17,022
 $17,685
 (3.7)%
% of net revenue0.7% 0.7%  
Interest and other income, net, decreased by $0.7 million in fiscal 2017 compared to fiscal 2016. The decrease in fiscal 2017 reflects lower foreign currency gains from the revaluation of our foreign currency denominated tax liabilities combined with a decrease in interest income. The decrease in interest income was mainly due to overall lower average cash and investment balances offset by effects of higher interest rates.
Provision for Income Taxes
 Year Ended  
 
January 28,
2017
 January 30,
2016
 
% Change
in 2017
 (in thousands, except percentages)
Provision for income taxes$73,022
 $11,335
 544.2%

The increase in income tax expense for fiscal 2017 compared to fiscal 2016 was primarily due to approximately $66.9 million of tax expense related to restructuring actions taken in the fourth quarter of fiscal 2017. This consisted of $50.1 million of foreign withholding taxes on undistributed earnings of certain subsidiaries that were no longer considered to be indefinitely reinvested as a result of these restructuring actions and $16.8 million of additional foreign tax expense which also arises as a result of such restructuring. These tax expenses attributable to our global restructuring would not be expected to recur in the future.

Our provision for incomes taxes may be affected by changes in the geographic mix of earnings with different applicable tax rates, changes in the realizability of deferred tax assets and liabilities, accruals related to contingent tax liabilities and period-to-period changes in such accruals, the results of income tax audits, the expiration of statutes of limitations, the implementation of tax planning strategies, tax rulings, court decisions, settlements with tax authorities and changes in tax laws. Additionally, please see the information in "Item 1A: Risk Factors" under the caption "Changes in existing taxation benefits, rules or practices may adversely affect our financial results.

Years Ended January 30, 2016 and January 31, 2015

Net Revenue

   Year Ended     
   January 30,
2016
   January 31,
2015
   % Change
in 2016
 
   (in thousands, except percentage) 

Net revenue

  $2,725,828    $3,706,963     (26.5)% 

Net revenue is gross revenue, net of accruals for estimated sales returns and rebates.

 Year Ended  
 January 30,
2016
 January 31,
2015
 
% Change
in 2016
 (in thousands, except percentage)
Net revenue$2,649,216
 $3,637,206
 (27.2)%


36


Our net revenue for fiscal 2016 decreased by $981.1$988.0 million compared to net revenue for fiscal 2015. The decrease was due to overall lower sales of products to customers in all of our endproduct groups given the downsizing of the mobile handset business and continued challenges in the computing and consumer markets. The decrease in net revenue was further affectedSales of our storage products decreased by lower31%, sales of our other products for the storage market due to weaker than expected demand from customers in general, as economic conditions weakened overall in the semiconductor industry.decreased by 32%, sales of our networking products decreased by 20% and sales of our connectivity products decreased by 17%. Unit shipments were 18% lower combined with a 10% decline in average selling prices in fiscal 2016 compared to fiscal 2015, which resulted in an overall decline of 27%.

From


Prior to fiscal 2017, our customers agreed from time to time our customers agreed to take shipments in an earlier fiscal quarter than the fiscal quarter they originally requested delivery. When such agreement would not have occurred but for the request made by Marvell, we refer to such transactions internally as “pull-ins.” Pull-in sales increased compared to historical levels beginning in the fourth quarter of fiscal 2015 and returned to historical levels in the third quarter of fiscal 2016. Net revenue in fiscal 2016 related to pull-in sales for shipments taken early by our customers were approximately 9% and 11% of net revenue in the first and second quarters of fiscal 2016, respectively, and declined to less than 1% of net revenue in both the third and fourth quarters of fiscal 2016. This compares to net revenue in fiscal 2015 related to pull-in sales for shipments taken early by our customers, which were less than 1% in each of the first and second quartersquarter of fiscal 2015, 1% in both the second and third quarter of fiscal 2015, and increased to 3% in the fourth quarter of fiscal 2015. Customer concessions related to these pull-in transactions, if any, were

recorded in the same period in which the revenue was recognized. Beginning in fiscal 2017, our policy is not to engage in pull-in transactions and we therefore do not expect them to have any meaningful impact on our net revenue in future periods.

transactions.

Cost of Goods Sold

   Year Ended    
   January 30,
2016
  January 31,
2015
  % Change
in 2016
 
   (in thousands, except percentages) 

Cost of goods sold

  $1,494,736   $1,843,706    (18.9)% 

% of net revenue

   54.8  49.7 

 Year Ended  
 
January 30,
2016
 January 31,
2015
 
% Change
in 2016
 (in thousands, except percentages)
Cost of goods sold$1,442,517
 $1,799,425
 (19.8)%
% of net revenue54.5% 49.5%  
Cost of goods sold as a percentage of net revenue was higher in fiscal 2016 due to a shift in the mix of our revenue, particularly in the first half of fiscal 2016, towards our then mobile and wireless products which havehad a higher average cost of goods sold as a percentage of revenue. In addition, cost of goods sold in fiscal 2016 includes higher inventory write downs due to lower than expected demand for our mobile related products. Cost of goods sold in fiscal 2016 also includes a $81.3 million charge for the litigation settlement with CMU. For further discussion related toCMU as described under the section “Litigation settlement with CMU (see ”Note 10 — Commitments and Contingencies” and “Note 15 — Subsequent Events” in the Notes to the Consolidated Financial Statements set forth in Part II, Item 8 of this Annual Report on Form 10-K). Our cost of goods sold as a percentage of net revenue may fluctuate in future periods due to, among other things, changes in the mix of products sold; the timing of production ramps of new products; increased pricing pressures from our customers and competitors, particularly in the consumer product markets that we are targeting; charges for obsolete or potentially excess inventory; changes in the costs charged by our foundry; assembly and test subcontractors; product warranty costs; changes in commodity prices such as gold; and the margin profiles of our new product introductions.

Carnegie Mellon University.”

Share-Based Compensation Expense

   Year Ended 
   January 30,
2016
   January 31,
2015
 
   (in thousands) 

Cost of goods sold

  $7,916    $7,972  

Research and development

   98,792     94,432  

Selling and marketing

   11,106     11,469  

General and administrative

   15,965     23,373  


  $133,779    $137,246  


 Year Ended
 
January 30,
2016
 January 31,
2015
 (in thousands)
Continuing operations:   
     Cost of goods sold$7,787
 $7,972
     Research and development92,054
 89,131
     Selling and marketing10,242
 10,623
     General and administrative15,878
 23,292
Share-based compensation - continuing operations125,961
 131,018
Discontinued operations:   
      Cost of goods sold129
 
      Research and development6,738
 5,301
      Selling and marketing864
 846
      General and administrative87
 81
Share-based compensation - discontinued operations7,818
 6,228
Total share-based compensation$133,779
 $137,246
Share-based compensation expense for continuing operations decreased by $3.5$5.1 million in fiscal 2016 compared to fiscal 2015. The decrease iswas mainly the result of the reversal of previously recognized expenses associated with unvested equity

37


awards that were cancelled as a result of the termination of employees affected by the restructuring of our mobile platform business. Share-based compensation expense was also lower since the financial goals related to performance-based equity awards granted in fiscal 2016 to our executive officers were not achieved and the related share-based compensation expense was adjusted accordingly. These decreases were partially offset by higher share-based compensation expense in fiscal 2016 from more restricted stock awards than in fiscal 2015.

Restructuring and Other Related Charges

 Year Ended
 
January 30,
2016
 January 31,
2015
 (in thousands)
Cost of goods sold$10,292
 $
Restructuring and other related charges53,251
 10,438
Write-off of acquired intangible assets
 3,386
 $63,543
 $13,824

We recorded a total of $63.5 million in fiscal 2016 in connection with restructuring and other related charges. The charges were primarily related to the restructuring of our mobile platform business announced in September 2015 and includeincluded severance, other exit-related costs, the impairment of certain equipment and other assets, as well as the write down of inventory. In addition, we incurred additional charges in connection with our ongoing effort to streamline our business. See “Note 8 — Restructuring and Other Related Charges” in the Notes to the Consolidated Financial Statements set forth in Part II, Item 8 of this Annual Report on Form 10-K for further information.

As a result of the restructuring of our mobile platform business, we expect foreseeable future savings in operating costs of approximately 5% to 10%. These savings will be partially offset by increased investment in research and development as we continue to focus our effort on high growth markets in storage, networking, wireless connectivity and multimedia.

Research and Development

   Year Ended    
   January 30,
2016
  January 31,
2015
  % Change
in 2016
 
   (in thousands, except percentages) 

Research and development

  $1,054,257   $1,158,810    (9.0)% 

% of net revenue

   38.7  31.2 

 Year Ended  
 
January 30,
2016
 January 31,
2015
 
% Change
in 2016
 (in thousands, except percentages)
Research and development$994,733
 $1,091,547
 (8.9)%
% of net revenue37.5% 30.0%  
Research and development expense decreased by $104.6$96.8 million in fiscal 2016 compared to fiscal 2015. The decrease was primarily attributable to $85.5$79.8 million of lower personnel-related costs primarily associated with headcount reductions in Israel and certain other locations in connection with our efforts to streamline our operations in the fiscal 2015 and in the first half of fiscal 2016. In addition, we had a reduction in depreciation and amortization expense of $9.3$6.8 million, lower costs for professional services of $9.4$8.6 million and lower costs for third-party vendors of $5.1 million.

Selling and Marketing

   Year Ended    
   January 30,
2016
  January 31,
2015
  % Change
in 2016
 
   (in thousands, except percentages) 

Selling and marketing

  $128,780   $143,952    (10.5)% 

% of net revenue

   4.7  3.9 

 Year Ended  
 
January 30,
2016
 January 31,
2015
 
% Change
in 2016
 (in thousands, except percentages)
Selling and marketing$124,096
 $139,627
 (11.1)%
% of net revenue4.7% 3.8%  
Selling and marketing expense decreased by $15.2$15.5 million in fiscal 2016 compared to fiscal 2015. The decrease was primarily attributable to lower personnel-related costs of $7.7$6.9 million due to lower headcount. The decrease also reflected decreasesa decrease of $4.0 million of marketing communications expenses and $0.4 million from lower sales commissions due to lower commissionable sales.

expenses.

General and Administrative

   Year Ended    
   January 30,
2016
  January 31,
2015
  % Change
in 2016
 
   (in thousands, except percentages) 

General and administrative

  $146,128   $124,841    17.1

% of net revenue

   5.4  3.4 

 Year Ended  
 
January 30,
2016
 January 31,
2015
 
% Change
in 2016
 (in thousands, except percentages)
General and administrative$145,359
 $124,046
 17.2%
% of net revenue5.5% 3.4%  

38


General and administrative expense increased by $21.3 million in fiscal 2016 compared to fiscal 2015. The increase was primarily attributable to a charge for a cash payment authorized by our Board of Directors of $15.4 million to our former Chief Executive Officer, (see “Note 14 — Related Party Transactions” in the Notes to the Consolidated Financial Statements set forth in Part II, Item 8 of this Annual Report on Form 10-K), higher legal expenses of $7.7 million mainly associated with certain accounting and internal control matters that are the subject of investigations by the Securities and Exchange Commission and the U.S. Attorney, and which were also investigated by the Company’s Audit Committee and $4.2 million of higher costs for the surety bond related to CMU. These increases were partially offset by $7.9$7.8 million of lower personnel-related costs due to lower headcount and lower share-based compensation expenses related to the performance-based equity awards granted to our executive officers in fiscal 2016 for which financial goals were not achieved (see “Note 12 — Shareholder’s Equity” in the Notes to the Consolidated Financial Statements set forth in Part II, Item 8 of this Annual Report on Form 10-K).

achieved.

Carnegie Mellon University Litigation Settlement

   Year Ended    
   January 30,
2016
  January 31,
2015
  % Change
in 2016
 
   (in thousands, except percentages) 
Litigation settlement with Carnegie Mellon University  $654,667   $    —      100.0

% of net revenue

   24.0  —   

 Year Ended  
 January 30,
2016
 
January 31,
2015
 
% Change
in 2016
 (in thousands, except percentages)
Litigation settlement with Carnegie Mellon University$654,667
 $
 100.0%
% of net revenue24.7% %  
In connection with the settlement agreement with CMU for $750 million, (see “Note 10 — Commitments and Contingencies” and “Note 15 — Subsequent Events” in the Notes to the Consolidated Financial Statements set forth in Part II, Item 8 of this Annual Report on Form 10-K), $654.7 million of the settlement allocated to the mutual release of claims and covenant not to sue was recorded in operating expenses. Of the remaining $95.3 million, $81.3 million was recorded in cost of goods sold for fiscal 2016. The remaining $14.0 million will be recognized in cost of goods sold over the remaining term of the license through April 2018.

Amortization and Write-Off of Acquired Intangible Assets

   Year Ended    
   January 30,
2016
  January 31,
2015
  % Change
in 2016
 
   (in thousands, except percentages) 

Amortization and write-off of acquired intangible assets

  $10,748   $16,397    (34.5)% 

% of net revenue

   0.4  0.5 

 Year Ended  
 January 30,
2016
 January 31,
2015
 
% Change
in 2016
 (in thousands, except percentages)
Amortization and write-off of acquired intangible assets$10,098
 $15,747
 (35.9)%
% of net revenue0.4% 0.4%  
Amortization and write-off of acquired intangible assets decreased by $5.6 million in fiscal 2016 compared to fiscal 2015. The decrease was due to lower amortization expense as certain intangible assets became fully amortized. In addition, fiscal 2016 included charges of $0.3 million to write off a trade name and $0.3 million to write off core technology, compared to a $3.4 million write-off of IPR&D upon our decision to discontinue the related project in fiscal 2015.

Interest and Other Income, net

 Year Ended  
 
January 30,
2016
 January 31,
2015
 
% Change
in 2016
 (in thousands, except percentages)
Interest and other income, net$17,685
 $23,334
 (24.2)%
% of net revenue0.7% 0.6%  

Interest and other income, net, decreased by $5.6 million in fiscal 2016 compared to fiscal 2015. The decrease was mainly due to a $3.0 million loss due to the write-off of an equity investment and a $1.2 million impairment loss on our auction rate securities, compared to an $8.8 million gain from the sale of an investment in fiscal 2015. The decrease was partially offset by the recognition of foreign currency gains, which were $4.8 million higher in fiscal 2016 compared to fiscal 2015 due to revaluation of our foreign currency denominated tax liabilities and releases of previously accumulated liabilities, and the increase in interest income from higher rate of return as well as higher average cash and investment balances.

Provision (Benefit)(benefit) for Income Taxes

   Year Ended    
   January 30,
2016
  January 31,
2015
  % Change
in 2016
 
   (in thousands, except percentages) 

Provision (benefit) for income taxes

  $12,346   $(3,193  (486.7)% 

% of net revenue

   0.5  (0.1)%  

We had an effective tax rate of (1.5)%


39


 Year Ended  
 
January 30,
2016
 January 31,
2015
 
% Change
in 2016
 (in thousands, except percentages)
Provision (benefit) for income taxes$11,335
 $(4,077) (378.0)%
The increase in fiscal 2016 compared to an effective tax rate of (0.7)% in fiscal 2015. The income tax expense for fiscal 2016 includes current incomecompared to fiscal 2015 was primarily due to the recognition of $7.5 million of valuation allowance against certain non-U.S. deferred tax liability of $14.5 million,assets that will not be realized in the foreseeable future and an additional tax provision of $3.1 million related to a $15.4 million payment to the Company’sour former Chief Executive Officer (see “Note 14 — Related Party Transactions” in the Notes to the Consolidated Financial Statement set forth in Part II, Item 8 of this Annual Report on Form 10-K) and a $6.1 million reduction in net deferred tax assets that was primarily caused by the recognition of a valuation allowance against certain non-U.S. loss carryforwards that will not be realized in the foreseeable future. These expenses were offset by a net reduction in unrecognized tax benefits of $11.6 million that arose from the release of $20.6 million due to the settlement of a tax audit in a non-U.S. jurisdiction and the expiration of statutes of limitation in non-U.S. jurisdictions, net of a $9.0 million increase in current unrecognized tax benefits.

Years Ended January 31, 2015 and February 1, 2014

Net Revenue

   Year Ended     
   January 31,
2015
   February 1,
2014
   % Change
in 2015
 
   (in thousands, except percentage) 

Net revenue

  $3,706,963    $3,404,400     8.9

Our net revenue for fiscal 2015 increased by $302.6 million compared to net revenue for fiscal 2014. The increase was led by sales of our mobile and wireless products, particularly in the first half of fiscal 2015, where we saw strong growth from multiple customers who launched their 4G LTE smartphones based on our solutions. In the storage market, we saw higher HDD revenue, which was mostly driven by continued growth for our 500 gigabyte per platter products and increased demand for our products used in enterprise drives at a top North America based HDD customer. Our networking revenue was up 1% in fiscal 2015 over fiscal 2014 due to higher

demand for enterprise switches and routers. Unit shipments were 18% higher while average selling prices declined 7% in fiscal 2015 compared to fiscal 2014, which resulted in an overall increase of 9%.

Cost of Goods Sold

   Year Ended    
   January 31,
2015
  February 1,
2014
  % Change
in 2015
 
   (in thousands, except percentages) 

Cost of goods sold

  $1,843,706   $1,663,730    10.8

% of net revenue

   49.7  48.9 

Cost of goods sold as a percentage of net revenue was higher in fiscal 2015 due to a shift in the mix of our revenue, particularly in the first half of fiscal 2015, towards our mobile and wireless products which have a higher average cost of goods sold as a percentage of revenue. In addition, we also had higher inventory write downs and increased royalty expense in fiscal 2015 compared to fiscal 2014.

Share-Based Compensation Expense

   Year Ended 
   January 31,
2015
   February 1,
2014
 
   (in thousands) 

Cost of goods sold

  $7,972    $8,863  

Research and development

   94,432     109,432  

Selling and marketing

   11,469     13,940  

General and administrative

   23,373     23,638  


  $137,246    $155,873  


Share-based compensation expense decreased by $18.6 million in fiscal 2015 compared to fiscal 2014. The decrease was primarily due to lower expense related to the employee stock purchase plan. In addition, the reversal of previously recognized expense associated with unvested equity awards that were cancelled as a result of the resignation in February 2014 of our former Chief Technology Officer reduced the fiscal 2015 share-based compensation expense. These decreases were partially offset by new grants of performance-based awards in fiscal 2015 to members of senior management and to our executive officers.

Restructuring and Other Related Charges

   Year Ended 
   January 31,
2015
   February 1,
2014
 
   (in thousands) 

Restructuring and other related charges

  $10,438    $4,732  

Write-off of acquired intangible assets

   3,386     —    


  $13,824    $4,732  


We recorded a total $13.8 million restructuring and other related charges in fiscal 2015, which included severance costs and other exit-related costs, primarily associated with facility closures. In addition, the charge included $3.4 million to write off an acquired intangible asset. The fiscal 2014 restructuring charge primarily related to the closure of two sites for a total cost of $4.7 million for severance and other exit-related costs. See

“Note 8 — Restructuring and Other Related Charges” in the Notes to the Consolidated Financial Statements set forth in Part II, Item 8 of this Annual Report on Form 10-K for a more complete discussion of these restructuring charges.

Research and Development

   Year Ended    
   January 31,
2015
  February 1,
2014
  % Change
in 2015
 
   (in thousands, except percentages) 

Research and development

  $1,158,810   $1,153,999    0.4

% of net revenue

   31.2  33.9 

Research and development expense increased by $4.8 million in fiscal 2015 compared to fiscal 2014. The increase was primarily attributable to $27.5 million of higher personnel-related costs primarily associated with an increase in incentive compensation expense that were partially offset by lower share-based compensation. In addition, we had $3.8 million of higher depreciation and amortization expenses. These increases were offset by $26.5 million of lower costs primarily for non-recurring engineering services due to higher reimbursement from our customers combined with efforts to closely monitor research and development spending to improve efficiencies.

Selling and Marketing

   Year Ended    
   January 31,
2015
  February 1,
2014
  % Change
in 2015
 
   (in thousands, except percentages) 

Selling and marketing

  $143,952   $151,903    (5.2)% 

% of net revenue

   3.9  4.5 

Selling and marketing expense decreased by $8.0 million in fiscal 2015 compared to fiscal 2014. The decrease was primarily attributable to lower personnel-related costs of $9.7 million due to lower headcount, which was partially offset by slightly higher marketing advertisement activities.

General and Administrative

   Year Ended    
   January 31,
2015
  February 1,
2014
  % Change
in 2015
 
   (in thousands, except percentages) 

General and administrative

  $124,841   $105,420    18.4

% of net revenue

   3.4  3.1 

General and administrative expense increased by $19.4 million in fiscal 2015 compared to fiscal 2014. The increase was primarily attributable to higher legal expenses of $8.3 million for ongoing litigation matters and costs of $7.2 million associated with the surety bond to appeal the CMU judgment. Higher incentive compensation expenses of $5.0 million in fiscal 2015 also contributed to the increase in general and administrative expense.

Amortization and Write-Off of Acquired Intangible Assets

   Year Ended    
   January 31,
2015
  February 1,
2014
  % Change
in 2015
 
   (in thousands, except percentages) 

Amortization and write-off of acquired intangible assets

  $16,397   $43,925    (62.7)% 

% of net revenue

   0.5  1.3 

Amortization and write-off of acquired intangible assets decreased by $27.5 million in fiscal 2015 compared to fiscal 2014. The decrease was due to a reduction in amortization expense as certain intangible assets became fully amortized. In addition, fiscal 2015 included a $3.4 million write-off of IPR&D upon our decision to discontinue the related project compared to a write-off of $8.1 million for the impairment of an acquired intangible asset in fiscal 2014.

Interest and Other Income, net

   Year Ended    
   January 31,
2015
  February 1,
2014
  % Change
in 2015
 
   (in thousands, except percentages) 

Interest and other income, net

  $23,334   $25,566    (8.7)% 

% of net revenue

   0.6  0.7 

Interest and other income, net, decreased by $2.2 million in fiscal 2015 compared to fiscal 2014. The decrease was primarily due to the recognition of foreign currency gains, which were $6.9 million lower in fiscal 2015 compared to fiscal 2014. Although the U.S. dollar strengthened over certain foreign currencies in which we had exposures during fiscal 2015, most of our foreign currency gains arose from the revaluation of our foreign currency denominated tax liabilities that were lower in fiscal 2015 compared to fiscal 2014. The decrease in foreign currency gains was partially offset by an increase in interest income from higher average cash and investment balances combined with an increase in other income. Other income included an $8.8 million gain from the sale of an investment in fiscal 2015 compared to a $7.0 million gain from the sale of a business in fiscal 2014.

Benefit for Income Taxes

   Year Ended    
   January 31,
2015
  February 1,
2014
  % Change
in 2015
 
   (in thousands, except percentages) 

Benefit for income taxes

  $(3,193 $(9,063  (64.8)% 

% of net revenue

   (0.1)%   (0.3)%  

We had income tax benefits of 0.7% in fiscal 2015 compared to 3.0% in fiscal 2014. The income tax benefit for fiscal 2015 included the current income tax liability of $17.4 million, plus a $7.4 million increase in current unrecognized tax benefits in non-U.S. jurisdictions. These charges were offset by a reduction in unrecognized tax benefits that arose from the release of $16.4 million due to the expiration of statutes of limitation and a $12.9 million increase in net deferred tax assets. The increase in net deferred tax assets was mostly due to an increase in the Singapore deferred tax assets since we re-negotiated with the Singapore government and in fiscal 2015, they extended the DEI until June 2019. See “Note 9 — Income Taxes” in our Notes to the Consolidated Financial Statements set forth in Part II, Item 8 of this Annual Report on Form 10-K for further information.

Officer.


Liquidity and Capital Resources

Our principal source of liquidity as of January 30, 201628, 2017 consisted of approximately $2.3$1.7 billion of cash, cash equivalents and short-term investments, (prior to giving effect to the settlement with CMU), of which approximately $830$970 million was held by foreign subsidiaries (outside Bermuda). Approximately $620 million of this amount held by foreign subsidiaries is related to undistributed earnings which have been indefinitely reinvested outside of Bermuda. These funds are primarily held in China, Israel Singapore,and the United States and Switzerland.States. We have plans to use such amounts to fund various activities outside of Bermuda, including working capital requirements, capital expenditures for expansion, funding of future acquisitions or other financing

activities. If such funds were needed by the parent company in Bermuda or if the amounts were otherwise no longer considered indefinitely reinvested, we would incur a tax expense of approximately $200$190 million.

In addition, as described under “Provision for Income Taxes” above, we accrued deferred taxes of approximately $50.1 million on undistributed earnings of certain subsidiaries that were no longer considered to be indefinitely reinvested due to restructuring actions taken in the fourth quarter of fiscal year 2017.

We believe that our existing cash, cash equivalents and short-term investments, together with cash generated from operations, exercise of employee stock options and purchases under our employee stock purchase plan will be sufficient to cover our working capital needs, capital expenditures, investment requirements and any declared dividends, repurchase of our common stock and commitments for at least the next 12 months, as well as payment of $750 million related to our settlement of the patent litigation with CMU.months. Our capital requirements will depend on many factors, including our rate of sales growth, market acceptance of our products, costs of securing access to adequate manufacturing capacity, the timing and extent of research and development projects and increases in operating expenses, which are all subject to uncertainty. In addition, we are named as defendants toin several litigation actions and an unfavorable outcome in any current litigation could have a material adverse effect on our liquidity, cash flows and results of operations.

On March 16, 2016, we announced that our board of directors declared a cash dividend of $0.06 per share that was paid on April 22, 2016 to shareholders of record as of March 29, 2016 and, on May 18, 2016, we announced that our board of directors declared a cash dividend of $0.06 per share that was paid on July 12, 2016 to shareholders of record as of June 14, 2016.

Future payment of a regular quarterly cash dividend on our common shares will be subject to, among other things, the best interests of the Company and our shareholders, our results of operations, cash balances and future cash requirements, financial condition, statutory requirements under Bermuda law and other factors that our board of directors may deem relevant. Our dividend payments may change from time to time, and we cannot provide assurance that we will continue to declare dividends at all or in any particular amounts. In addition, developments in ongoing litigation could affect the our ability to make a dividend payment on a declared payment date until such time as we can meet statutory requirements under Bermuda law.

Net Cash Provided by Operating Activities

Net cash provided by operating activities was $205.4 million for fiscal 2016 compared to $728.9 million for fiscal 2015 and $448.0 million for fiscal 2014. The cash inflows from operations for fiscal 2016 were primarily due to $811.4 million of net loss adjusted for $282.6 million of non-cash items and working capital changes of $734.2 million. The change in working capital was primarily driven by a decrease in accounts receivable due to improved collections and a decrease in inventories, combined with an increase in accrued liabilities and the accrued litigation settlement with CMU. The positive effect on working capital was partially offset by decreases in accounts payable due to the timing of payments and accrued compensation primarily due to lower annual incentive compensation in fiscal 2016 compared to fiscal 2015, as well as an increase in prepaid expenses and other assets due to a deposit paid in connection with a foundry agreement executed in October 2015.

The cash inflows from operations for fiscal 2015 were primarily due to $435.3 million of net income adjusted for $238.2 million of non-cash items and working capital changes of $55.4 million. The positive impact on working capital was primarily driven by a decrease in accounts receivable due to improved collections and a decrease in inventories, combined with an increase in accrued employee compensation as a result of higher incentive compensation.

The cash inflows from operations for fiscal 2014 were primarily due to $315.3 million of net income adjusted for $307.7 million of non-cash items less working capital changes of $175.0 million. The negative change in working capital for fiscal 2014 was primarily driven by an increase in accounts receivable from higher revenue levels and higher inventories due to the ramp up of new products.

Net Cash Provided by and (Used in) Investing Activities

Net cash provided by investing activities was $201.7 million for fiscal 2016 compared to $368.9 million used in investing activities for fiscal 2015 and net cash provided by investing activities of $74.8 million for fiscal

2014. For fiscal 2016, net cash provided by investing activities was primarily generated from the sales and maturities of available-for-sale securities of $1.3 billion less purchases of available-for-sale securities of $1.1 billion, which were also partially offset by payments of $37.3 million for the purchase of property and equipment, and $8.2 million for the purchase of technology licenses.

For fiscal 2015, net cash used in investing activities was primarily due to purchases of available-for-sale securities of $1.1 billion, offset by the sales and maturities of available-for-sale securities of $826.3 million. In addition, we paid $63.0 million for the purchase of property and equipment, and $16.4 million for the purchase of technology licenses.

For fiscal 2014, net cash provided by investing activities was primarily generated from the sale and maturities of available-for-sale securities of $995.0 million less purchases of available-for-sale securities of $837.9 million. The net cash inflow from available-for-sale securities in fiscal 2014 was partially offset by the purchases of $66.6 million of property and equipment, and $17.6 million of IP licenses.

Net Cash Used in Financing Activities

Net cash used in financing activities was $339.8 million for fiscal 2016 compared to $114.8 million for fiscal 2015 and $309.0 million for fiscal 2014. For fiscal 2016, net cash used in financing activities was primarily attributable to payments for repurchases under our share repurchase program of our common shares in the open market for $260.9 million and for our quarterly cash dividends of $122.8 million. The cash outflow was partially offset by net proceeds of $56.4 million from the issuance of our common shares under our share-based plans less the minimum tax withholding on behalf of employees for net share settlements.

For fiscal 2015, net cash used in financing activities was primarily attributable to payments of our quarterly cash dividends of $122.8 million and repurchases under our share repurchase program of our common shares in the open market for $65.0 million. The cash outflow was partially offset by net proceeds of $85.9 million from the issuance of our common shares under our share-based plans less the minimum tax withholding on behalf of employees for net share settlements.

For fiscal 2014, net cash used in financing activities was primarily attributable to repurchases under our share repurchase program of $376.3 million and payment of our quarterly cash dividends of $119.4 million in fiscal 2014. The cash outflow was partially offset by net proceeds of $194.1 million from the issuance of our common shares under our share-based plans less the minimum tax withholding paid on behalf of employees for net share settlements.

Off-Balance Sheet Arrangements

As part of our ongoing business, we do not participate in transactions that generate relationships with unconsolidated entities of financial partnerships, such as entities often referred to as structured finance or special purpose entities (“SPEs”), which would have been established for the purpose of facilitating off-balance sheet arrangements or other contractually narrow or limited purposes. As of January 30, 2016, we were not involved in any unconsolidated SPE transactions.

In the CMU litigation, in order to stay the execution of the final judgment pending its appeal, we filed a supersedeas bond for $1.54 billion with the District Court. The bond was issued by a consortium of sureties authorized by the U.S. Treasury. If the judgment is affirmed after the completion of all appellate proceedings, and we do not thereafter fully satisfy the judgment within thirty days, the sureties are obligated under the bond to make payment to CMU. In support of the bond, we entered into separate indemnity agreements with each of the sureties to indemnify the sureties from all costs and payments made under the bond. The indemnity agreements did not require collateral to be posted at the time of the issuance of the bond. Therefore no cash is considered restricted as of the date of this filing. However, the indemnity agreements provide that each of the sureties have

the right to demand to be placed in funds or call for collateral under pre-defined events. See also “Note 10 — Commitments and Contingencies” in the Notes to the Consolidated Financial Statements set forth in Part II, Item 8 of this Annual Report on Form 10-K for a further discussion of this matter.

On November 14, 2014, we filed a second surety bond for $216 million and filed a commitment letter from the sureties to issue up to an additional $95 million in bonding under certain conditions. The second bond and commitment were secured by our campus located in Santa Clara, California, which has a carrying value of $133.0 million at January 30, 2016.

In connection with the settlement that was reached with CMU for a total $750 million in February 2016, the primary supersedeas bond that the Company entered into was reduced to $439 million and the secondary bond was adjusted to $311 million and both were discharged pursuant to an order releasing supersedeas bonds on April 21, 2016. For additional information, see CMU litigation and “Surety Bonds” in “Note 10 — Commitments and Contingencies” in the Notes to the Consolidated Financial Statements set forth in Part II, Item 8 of this Annual Report on Form 10-K.

Contractual Obligations and Commitments

Under our manufacturing relationships with our foundry partners, cancellation of outstanding purchase orders is allowed but requires repayment of all expenses incurred through the date of cancellation. As of January 30, 2016, these foundries had incurred approximately $136.8 million of manufacturing costs and expenses relating to our outstanding purchase orders.

The following table summarizes our contractual obligations as of January 30, 2016 and the effect that such obligations are expected to have on our liquidity and cash flow in future periods (in thousands):

   Payment Obligations by Fiscal Year 
   2017   2018   2019   2020   2021   Thereafter   Total 

Contractual obligations:


Facilities operating leases, net

  $19,579    $13,909    $10,182    $4,080    $2,939    $4,946    $55,635  

Computer-aided design software

   43,717     21,770     14,225     10,200     —       —       89,912  

Purchase commitments to foundries

   136,848     —       —       —       —       —       136,848  

Capital purchase obligations

   29,946     —       —       —       —       —       29,946  

Technology license obligations

   14,769     12,630     —       —       —       —       27,399  

Carnegie Mellon University litigation settlement

   750,000     —       —       —       —       —       750,000  

Other non-current obligations (1)

   —       4,732     2,175     2,000     —       4,298     13,205  


Total contractual cash obligations

  $994,859    $53,041    $26,582    $16,280    $2,939    $9,244    $1,102,945  


(1)Amounts represent anticipated future cash payments, including anticipated interest payments not recorded in the consolidated balance sheet.

In addition to the above commitments and contingencies, as of January 30, 2016, we have $27.8 million of unrecognized tax benefits as liabilities. We also have a liability for potential interest and penalties of $26.4 million as of January 30, 2016. During the next 12 months, it is reasonably possible that the amount of unrecognized tax benefits could increase or decrease significantly due to changes in tax law jurisdictions, new tax audits and changes in the U.S. dollar as compared to foreign currencies within the next 12 months. Excluding these factors, uncertain tax positions may decrease by as much as $16.2 million from the lapse of the statutes of limitation in various jurisdictions during the next 12 months.

Prospective Capital Needs

To the extent that our existing cash, cash equivalents and short-term investments and cash generated by operations are insufficient to fund our future activities, we may need to raise additional funds through public or

private debt or equity financing. We may also enter into additional acquisitions of businesses, purchase assets or enter into other strategic arrangements in the future, which could also require us to seek debt or equity financing. Additional equity financing or convertible debt financing may be dilutive to our current shareholders. If we elect to raise additional funds, we may not be able to obtain such funds on a timely basis or on acceptable terms, if at all. If we raise additional funds by issuing additional equity or convertible debt securities, the ownership percentages of existing shareholders would be reduced. In addition, the equity or debt securities that we issue may have rights, preferences or privileges senior to our common shares.


Future payment of a regular quarterly cash dividend on our common shares and our planned repurchases of common stock will be subject to, among other things, the best interests of the Company and our shareholders, our results of operations, cash balances and future cash requirements, financial condition, developments in ongoing litigation, statutory requirements under Bermuda law, market conditions and other factors that our board of directors may deem relevant. Our dividend payments and repurchases of common stock may change from time to time, and we cannot provide assurance that we will continue to declare dividends at all or in any particular amounts.

Cash Flows from Operating Activities
Net cash used in operating activities was $358.4 million for fiscal 2017 compared to net cash provided by operating activities of $205.4 million and $728.9 million for fiscal 2016 and fiscal 2015, respectively. The cash outflows from operations for fiscal 2017 were primarily due to $21.2 million of net income adjusted for $329.6 million of non-cash items, offset by a net decrease in working capital of $709.2 million. The cash outflow from working capital for fiscal 2017 was primarily driven by the decrease in the CMU accrued litigation settlement that was fully paid in the first quarter of fiscal 2017. The negative effect on working capital was partially offset by an increase in accrued liabilities and other non-current liabilities primarily due to an increase in income taxes for fiscal 2017 combined with a decrease in inventories.
The cash inflows from operations for fiscal 2016 were primarily due to $811.4 million of net loss adjusted for $282.6 million of non-cash items and a net increase in working capital of $734.2 million. The cash inflow from working capital was

40


primarily driven by a decrease in accounts receivable due to improved collections and a decrease in inventories, combined with an increase in accrued liabilities and the accrued litigation settlement with CMU. The net increase in working capital was partially offset by decreases in accounts payable due to the timing of payments and accrued compensation primarily due to lower annual incentive compensation in fiscal 2016 compared to fiscal 2015, as well as an increase in prepaid expenses and other assets due to a deposit paid in connection with a foundry agreement executed in October 2015.
The cash inflows from operations for fiscal 2015 were primarily due to $435.3 million of net income adjusted for $238.2 million of non-cash items and a net increase in working capital changes of $55.4 million. The cash inflow from working capital was primarily driven by a decrease in accounts receivable due to improved collections and a decrease in inventories, combined with an increase in accrued employee compensation as a result of higher incentive compensation.
Cash Flows from Investing Activities
Net cash provided by investing activities was $161.6 million for fiscal 2017 compared to $201.7 million provided by investing activities for fiscal 2016 and net cash used in investing activities of $368.9 million for fiscal 2015. For fiscal 2017, net cash provided by investing activities was primarily generated from the sales and maturities of available-for-sale securities of $856.3 million less purchases of available-for-sale securities of $489.9 million, which were also partially offset by payments of $150.0 million for net purchases of time deposits, $44.5 million for purchases of property and equipment and $10.3 million for the purchase of technology licenses.
For fiscal 2016, net cash provided by investing activities was primarily generated from the sales and maturities of available-for-sale securities of $1.3 billion less purchases of available-for-sale securities of $1.1 billion, which were partially offset by payments of $37.3 million for the purchase of property and equipment, and $8.2 million for the purchase of technology licenses.
For fiscal 2015, net cash used in investing activities was primarily due to purchases of available-for-sale securities of $1.1 billion, offset by the sales and maturities of available-for-sale securities of $826.3 million. In addition, we paid $63.0 million for the purchase of property and equipment, and $16.4 million for the purchase of technology licenses.
Cash Flows from Financing Activities
Net cash used in financing activities was $267.2 million for fiscal 2017 compared to $339.8 million for fiscal 2016 and $114.8 million for fiscal 2015. For fiscal 2017, net cash used in financing activities was primarily attributable to payments for repurchases under our share repurchase program of our common shares in the open market for $181.6 million and for our quarterly cash dividends of $122.3 million. The cash outflow was partially offset by net proceeds of $57.5 million from the issuance of our common shares under our share-based plans less the minimum tax withholding on behalf of employees for net share settlements.
For fiscal 2016, net cash used in financing activities was primarily attributable to payments for repurchases under our share repurchase program of our common shares in the open market for $260.9 million and for our quarterly cash dividends of $122.8 million. The cash outflow was partially offset by net proceeds of $56.4 million from the issuance of our common shares under our share-based plans less the minimum tax withholding on behalf of employees for net share settlements.
For fiscal 2015, net cash used in financing activities was primarily attributable to payments of our quarterly cash dividends of $122.8 million and repurchases under our share repurchase program of our common shares in the open market for $65.0 million. The cash outflow was partially offset by net proceeds of $85.9 million from the issuance of our common shares under our share-based plans less the minimum tax withholding on behalf of employees for net share settlements.
Off-Balance Sheet Arrangements
As part of our ongoing business, we do not participate in transactions that generate relationships with unconsolidated entities of financial partnerships, such as entities often referred to as structured finance or special purpose entities (“SPEs”), which would have been established for the purpose of facilitating off-balance sheet arrangements or other contractually narrow or limited purposes. As of January 28, 2017, we were not involved in any unconsolidated SPE transactions.
Contractual Obligations and Commitments
Under our manufacturing relationships with our foundry partners, cancellation of outstanding purchase orders is allowed but requires repayment of all expenses incurred through the date of cancellation. As of January 28, 2017, these foundries had incurred approximately $208.8 million of manufacturing costs and expenses relating to our outstanding purchase orders.
The following table summarizes our contractual obligations as of January 28, 2017 and the effect that such obligations are expected to have on our liquidity and cash flow in future periods (in thousands):

41


 Payment Obligations by Fiscal Year
 2018 2019 2020 2021 2022 Thereafter Total
Contractual obligations:             
Facilities operating leases, net$15,397
 $12,779
 $6,508
 $3,767
 $610
 $2,147
 $41,208
Computer-aided design software21,770
 14,225
 10,200


 46,195
Purchase commitments to foundries208,817


 208,817
Capital purchase obligations10,930


 10,930
Technology license obligations23,180
 7,025
 7,025


 37,230
Other non-current obligations (1)
 3,185
 2,000
 
 
 4,076
 9,261
Total contractual cash obligations$280,094
 $37,214
 $25,733
 $3,767
 $610
 $6,223
 $353,641
(1)Amounts represent anticipated future cash payments, including anticipated interest payments not recorded in the consolidated balance sheet.
In addition to the above commitments and contingencies, as of January 28, 2017, we have $16.3 million of unrecognized tax benefits as liabilities. We also have a liability for potential interest and penalties of $21.6 million as of January 30, 2016. It is reasonably possible that the amount of unrecognized tax benefits could increase or decrease significantly due to changes in tax law in various jurisdictions, new tax audits and changes in the U.S. dollar as compared to foreign currencies within the next 12 months. Excluding these factors, uncertain tax positions may decrease by as much as $9.5 million from the lapse of statutes of limitation in various jurisdictions during the next 12 months. Government tax authorities from several non-U.S. jurisdictions are also examining our tax returns. We believe that we have adequately provided for any reasonably foreseeable outcomes related to these tax audits and that any settlement will not have a material effect on our results at this time.
Recent Accounting Pronouncements

Please see “Note 1 — The Company and its Significant Accounting Policies — Recent Accounting Pronouncements” for further details in our Notes to the Consolidated Financial Statements set forth in Part II, Item 8 of this Annual Report on Form 10-K.

Related Party Transactions

Please see “Note 14 — Related Party Transactions” for further details in our Notes to the Consolidated Financial Statements set forth in Part II, Item 8 of this Annual Report on Form 10-K.


Item 7A.Quantitative and Qualitative Disclosures About Market Risk


Interest Rate Risk. Our interest rate risk relates primarily to our fixed income short-term investment portfolio as we did not have any outstanding debt as of January 30, 2016.28, 2017. We maintain an investment policy that requires minimum credit ratings, diversification of credit risk and limits the long-term interest rate risk by requiring effective maturities of generally less than five years. We invest our excess cash primarily in highly liquid debt instruments of the U.S. government and its agencies, time deposits, money market mutual funds, asset backed securities, corporate debt securities and municipal debt securities. These investmentssecurities that are classified as available-for-sale and consequently,time deposits. These investments are recorded on our consolidated balance sheets at fair market value with their related unrealized gain or loss reflected as a component of accumulated other comprehensive income (loss) in the consolidated statementsstatement of shareholders’ equity. Investments in both fixed rate and floating rate interest earning securities carry a degree of interest rate risk. Fixed rate securities may have their fair market value adversely impacted due to a rise in interest rates, while floating rate securities may produce less income than predicted if interest rates fall.

To provide an assessment of the interest rate risk associated with our investment portfolio, we performed a sensitivity analysis to determine the impact that an adverse change in interest rates would have on the value of the investment portfolio.portfolio, excluding time deposits. Based on investment positions as of January 30, 2016,28, 2017, a hypothetical 100 basis point increase in interest rates across all maturities would result in a $11.3$6.4 million decline in the fair market value of the portfolio. Due to our positive cash flow from operations, the relatively short-term nature of our investment portfolio and our ability to hold investments to maturity, such change in fair market value would likely not resulthave resulted in any significant cash flow impact.

As of January 30, 2016,28, 2017, our investment portfolio included auction rate securities with an aggregate$5.0 million in par value of $12.5 millionan auction rate security classified as a long-term investments.investment. Although these auction rate securities havethe security has continued to pay interest, and the underlying collateral has not deteriorated, there is currently limited trading volume. The Company uses a discounted cash flow model toTo estimate the fair value of the auction rate securitiessecurity, we use a discounted cash flow model based on its estimated timing and amount of future interest and principal payments. In developing the discounted cash flow model, the Company considerswe consider the credit quality and liquidity of the underlying securities and related issuer, the collateralization of underlying security investments and other considerations. The fair value of the auction rate securities as of January 30, 2016 was $1.2 million less than the par value and is included

42


We made a determination in long-term investments.

In January 2016 the Company determined these auction rate securities would more likely than not be sold as part of a general requirement to raise liquidity. Based upon the shortened time horizon for holding these auction rate securities and the continuation of an illiquid market, the Company doesthat we did not expect to recover the par value of certain auction rate securities and consider any impairment of the securities to be other-than-temporary. There has been no change in circumstances since January 2016 based upon the current time horizon for holding the remaining security and considers the continuation of an illiquid market. Based on our assessment of fair value as of January 28, 2017, we determined there was no further impairment of the remaining auction rate security.

During fiscal 2017, the Company sold auction rate securities with an aggregate par value of $7.5 million for total net proceeds of $6.9 million. The carrying value of these auction rate securities to be other-than-temporary. Aswas $6.7 million and resulted in a result, an impairment chargenet gain of $1.2$0.2 million was recorded in interest and other income, net, in the consolidated statements of operations.

Investment Risk.    We invest in equity instruments of privately-held companies for strategic purposes. We account for these investments under the cost method when we do not have the ability to exercise significant influence or control over the operations of these companies and under the equity method when we have the ability to exercise significant influence, but do not have control. The carrying value of these equity investments was $5.8 million atyear ended January 30, 2016, and was included in other non-current assets in our consolidated balance sheets. We monitor these investments for impairment and make appropriate reductions in carrying value when an impairment is deemed to be other-than-temporary.

28, 2017.


Foreign Currency Exchange Risk. All of our sales and the majority of our expenses are denominated in U.S. dollars. Since we operate in many countries, we pay certain payroll and other operating expenses in local currencies and these expenses may be higher or lower in U.S. dollar terms. Furthermore, our operations in Israel and China represent a large portion of our total foreign currency exposure. Additionally, we may hold certain assets and liabilities, including potential tax liabilities, in local currency on our consolidated balance sheet. These tax liabilities would be settled in local currency. Therefore, foreign exchange gains and losses from remeasuring the tax liabilities are recorded to interest and other income, net. The related effects of foreign exchange fluctuations on local currency expenses are recorded to operating expenses. There is also a risk that our customers may be negatively impacted in their ability to purchase our products priced in U.S. dollars when there has been significant volatility in foreign currency exchange rates.


We engage in hedging transactions to help mitigate some of the volatility to forecasted cash flows due to changes in foreign exchange rates and, in particular, hedge a portion of the forecasted expenses denominated in Israeli shekel and on occasion Chinese yuan. We enter into certain short-term forward exchange contracts, typically less than 12 months in duration, to hedge exposures for expenses denominated in foreign currencies when the currency exposure is significant and there is a high certainty of the underlying cash flow. We do not enter into derivative financial instruments for trading or speculative purposes. We may choose not to hedge certain foreign exchange exposures due to immateriality, offsetting exposures, prohibitive economic cost of hedging a particular currency, and limited availability of appropriate hedging instruments. To the extent our foreign currency hedges are effective, the results of the hedge activities offset the underlying expense within the operating expense. Financial instruments not designated as hedges or hedges deemed ineffective are recorded in interest and other income, net. We do not hedge our tax liabilities denominated in local currency on our consolidated balance sheet as the timing of these tax liabilities becoming cash flows is not deemed to be certain.


To provide an assessment of the foreign currency exchange risk associated with our foreign currency exposures within operating expense, we performed a sensitivity analysis to determine the impact that an adverse change in exchange rates would have on our financial statements. If the U.S. dollar weakened by 10%, our operating expense could increase by 4.8%less than 4%. We expect our hedges of foreign currency exposures to be highly effective and offset a significant portion of the short-term impact of changes in exchange rates on the hedged portion of our exposures.


43


Item 8.Financial Statements and Supplementary Data

INDEX

 Page

58

60

61

62

63

64

65

109


44


REPORT OF INDEPENDENT REGISTERED PUBLIC ACCOUNTING FIRM


To the Board of Directors and Shareholders of Marvell Technology Group Ltd.

Santa Clara, California


We have audited the accompanying consolidated balance sheetsheets of Marvell Technology Group Ltd. and subsidiaries (the “Company”"Company") as of January 28, 2017 and January 30, 2016, and the related consolidated statements of operations, comprehensive income (loss), shareholders’shareholders' equity, and cash flowflows for the yearyears then ended. Our auditaudits also included the financial statement schedule listed in the Index at Item 15. These financial statements and financial statement schedule are the responsibility of the Company’sCompany's management. Our responsibility is to express an opinion on thethese financial statements and financial statement schedule based on our audit.

audits.


We conducted our auditaudits in accordance with the standards of the Public Company Accounting Oversight Board (United States). Those standards require that we plan and perform the audit to obtain reasonable assurance about whether the financial statements are free of material misstatement. An audit includes examining, on a test basis, evidence supporting the amounts and disclosures in the financial statements. An audit also includes assessing the accounting principles used and significant estimates made by management, as well as evaluating the overall financial statement presentation. We believe that our audit providesaudits provide a reasonable basis for our opinion.


In our opinion, such consolidated financial statements present fairly, in all material respects, the financial position of Marvell Technology Group Ltd. and subsidiaries as of January 28, 2017 and January 30, 2016, and the results of their operations and their cash flows for the yearyears then ended in conformity with accounting principles generally accepted in the United States of America. Also, in our opinion, such financial statement schedule, when considered in relation to the basic consolidated financial statements taken as a whole, presentpresents fairly, in all material respects, the information set forth therein.


We have also audited, in accordance with the standards of the Public Company Accounting Oversight Board (United States), the Company’sCompany's internal control over financial reporting as of January 30, 2016,28, 2017, based on the criteria established in Internal Control — IntegratedControl-Integrated Framework (2013) issued by the Committee of Sponsoring Organizations of the Treadway Commission and our report dated July 21, 2016,March 27, 2017 expressed an adverse opinion on the Company’s internal control over financial reporting because of material weaknesses.

/s/ Deloitte & Touche LLP

San Jose, California

July 21, 2016


/s/ Deloitte & Touche LLP
San Jose, California
March 27, 2017

45


REPORT OF INDEPENDENT REGISTERED PUBLIC ACCOUNTING FIRM

To the Board of Directors and Shareholders of Marvell Technology Group Ltd.


In our opinion, the accompanying consolidated financial statements listed inof operations, of comprehensive income (loss), of shareholders’ equity and of cash flows for the index appearing under Item 15(a)(1)year ended January 31, 2015 present fairly, in all material respects, the financial positionresults of operations and cash flows of Marvell Technology Group Ltd. and its subsidiaries at January 31, 2015, andfor the results of their operations and their cash flows for each of the two years in the periodyear ended January 31, 2015, in conformity with accounting principles generally accepted in the United States of America. In addition, in our opinion, the financial statement schedule listed in the index appearing under Item 15(a)(2) for the year ended January 31, 2015 presents fairly, in all material respects, the information set forth therein when read in conjunction with the related consolidated financial statements. These financial statements and financial statement schedule are the responsibility of the Company’sCompany's management. Our responsibility is to express an opinion on these financial statements and financial statement schedule based on our audits.audit. We conducted our auditsaudit of these financial statements in accordance with the standards of the Public Company Accounting Oversight Board (United States). Those standards require that we plan and perform the audit to obtain reasonable assurance about whether the financial statements are free of material misstatement. An audit includes examining, on a test basis, evidence supporting the amounts and disclosures in the financial statements, assessing the accounting principles used and significant estimates made by management, and evaluating the overall financial statement presentation. We believe that our audits provideaudit provides a reasonable basis for our opinion.

/s/ PricewaterhouseCoopers LLP

San Jose, California

March 26, 2015


/s/ PricewaterhouseCoopers LLP
San Jose, California
March 26, 2015, except for the effects of discontinued operations
discussed in Note 2 to the consolidated financial statements,
as to which the date is March 27, 2017

46


Table of Contents

MARVELL TECHNOLOGY GROUP LTD.


CONSOLIDATED BALANCE SHEETS

(In thousands, except par value per share)

   January 30,
2016
  January 31,
2015
 
ASSETS   

Current assets:


Cash and cash equivalents

  $1,278,180   $1,210,977  

Short-term investments

   1,004,569    1,318,578  

Accounts receivable, net of provision for sales returns and allowances of $2,762 and $2,112 in fiscal 2016 and 2015, respectively

   323,300    420,955  

Inventories

   210,017    308,162  

Prepaid expenses and other current assets

   102,560    68,140  

Deferred income taxes

   —      17,228  


Total current assets

   2,918,626    3,344,040  

Property and equipment, net

   299,540    340,639  

Long-term investments

   11,296    10,226  

Goodwill

   2,029,945    2,029,945  

Acquired intangible assets, net

   18,010    30,698  

Other non-current assets

   164,710    128,839  


Total assets

  $5,442,127   $5,884,387  


LIABILITIES AND SHAREHOLDERS’ EQUITY   

Current liabilities:


Accounts payable

  $180,372   $282,899  

Accrued liabilities

   132,060    131,388  

Carnegie Mellon University accrued litigation settlement

   736,000    —    

Accrued employee compensation

   121,631    154,969  

Deferred income

   55,722    68,120  


Total current liabilities

   1,225,785    637,376  

Non-current income taxes payable

   49,256    68,729  

Other non-current liabilities

   26,963    32,193  


Total liabilities

   1,302,004    738,298  


Commitments and contingencies (Note 10)


Shareholders’ equity:


Preferred stock, $0.002 par value; 8,000 shares authorized; no shares issued and outstanding

   —      —    

Common stock, $0.002 par value; 992,000 shares authorized; 507,572 and 515,037 shares issued and outstanding in fiscal 2016 and 2015, respectively

   1,015    1,030  

Additional paid-in capital

   3,028,921    3,099,548  

Accumulated other comprehensive income (loss)

   (795  308  

Retained earnings

   1,110,982    2,045,203  


Total shareholders’ equity

   4,140,123    5,146,089  


Total liabilities and shareholders’ equity

  $5,442,127   $5,884,387  


 January 28,
2017
 January 30,
2016
ASSETS   
Current assets:   
Cash and cash equivalents$814,092
 $1,278,180
Short-term investments854,268
 1,004,569
Accounts receivable, net of provision for sales returns and allowances of $1,384 and $2,762 in fiscal 2017 and 2016, respectively335,384
 323,300
Inventories171,969
 200,958
Prepaid expenses and other current assets58,771
 102,560
Assets held for sale45,846
 45,095
Total current assets2,280,330
 2,954,662
Property and equipment, net243,397
 296,778
Long-term investments4,615
 11,296
Goodwill2,003,413
 2,003,413
Acquired intangible assets, net3,571
 11,947
Other non-current assets113,324
 164,031
Total assets$4,648,650
 $5,442,127
LIABILITIES AND SHAREHOLDERS’ EQUITY   
Current liabilities:   
Accounts payable$143,484
 $180,372
Accrued liabilities143,491
 132,060
Carnegie Mellon University accrued litigation settlement
 736,000
Accrued employee compensation139,647
 121,631
Deferred income68,124
 53,973
Current liabilities held for sale1,670
 1,749
Total current liabilities496,416
 1,225,785
Non-current income taxes payable60,646
 49,256
Other non-current liabilities63,937
 26,963
Total liabilities620,999
 1,302,004
Commitments and contingencies (Note 10)
 
Shareholders’ equity:   
Preferred stock, $0.002 par value; 8,000 shares authorized; no shares issued and outstanding
 
Common stock, $0.002 par value; 992,000 shares authorized; 506,095 and 507,572 shares issued and outstanding in fiscal 2017 and 2016, respectively1,012
 1,015
Additional paid-in capital3,016,775
 3,028,921
Accumulated other comprehensive income (loss)23
 (795)
Retained earnings1,009,841
 1,110,982
Total shareholders’ equity4,027,651
 4,140,123
Total liabilities and shareholders’ equity$4,648,650
 $5,442,127
See accompanying Notes to Consolidated Financial Statements.


47


Table of Contents

MARVELL TECHNOLOGY GROUP LTD.


CONSOLIDATED STATEMENTS OF OPERATIONS

(In thousands, except per share amounts)

   Year Ended 
   January 30,
2016
  January 31,
2015
  February 1,
2014
 

Net revenue

  $2,725,828   $3,706,963   $3,404,400  

Operating costs and expenses:


Cost of goods sold

   1,494,736    1,843,706    1,663,730  

Research and development

   1,054,257    1,158,810    1,153,999  

Selling and marketing

   128,780    143,952    151,903  

General and administrative

   146,128    124,841    105,420  

Carnegie Mellon University litigation settlement

   654,667    —      —    

Restructuring and other related charges

   53,251    10,438    4,732  

Amortization and write-off of acquired intangible assets

   10,748    16,397    43,925  


Total operating costs and expenses

   3,542,567    3,298,144    3,123,709  


Operating income (loss)

   (816,739  408,819    280,691  

Interest and other income, net

   17,685    23,334    25,566  


Income (loss) before income taxes

   (799,054  432,153    306,257  

Provision (benefit) for income taxes

   12,346    (3,193  (9,063


Net income (loss)

  $(811,400 $435,346   $315,320  


Net income (loss) per share:


Basic

  $(1.59 $0.85   $0.64  


Diluted

  $(1.59 $0.84   $0.63  


Weighted average shares:


Basic

   510,945    511,089    496,518  


Diluted

   510,945    520,760    504,413  


Cash dividends declared per share

  $0.24   $0.24   $0.24  


 Year Ended
 January 28,
2017
 January 30,
2016
 January 31,
2015
Net revenue$2,317,674
 $2,649,216
 $3,637,206
Operating costs and expenses:     
Cost of goods sold1,029,527
 1,442,517
 1,799,425
Research and development831,398
 994,733
 1,091,547
Selling and marketing115,817
 124,096
 139,627
General and administrative127,376
 145,359
 124,046
Carnegie Mellon University litigation settlement
 654,667
 
Restructuring and other related charges105,186
 53,251
 10,438
Amortization and write-off of acquired intangible assets8,376
 10,098
 15,747
Total operating costs and expenses2,217,680
 3,424,721
 3,180,830
Operating income (loss)99,994
 (775,505) 456,376
Interest and other income, net17,022
 17,685
 23,334
Income (loss) from continuing operations before income taxes117,016
 (757,820) 479,710
Provision (benefit) for income taxes73,022
 11,335
 (4,077)
Income (loss) from continuing operations$43,994
 $(769,155) $483,787
Loss from discontinued operations, net of tax(22,843) (42,245) (48,441)
Net Income (loss)$21,151
 $(811,400) $435,346
Net income (loss) per share - Basic:     
Continuing operations$0.09
 $(1.51) $0.95
Discontinued operations$(0.05) $(0.08) $(0.10)
Net Income (loss) per share basic$0.04
 $(1.59) $0.85
Net income (loss) per share - Diluted:     
Continuing operations$0.09
 $(1.51) $0.93
       Discontinued operations$(0.05) $(0.08) $(0.09)
Net Income (loss) per share diluted$0.04
 $(1.59) $0.84
Weighted average shares:     
Basic509,738
 510,945
 511,089
Diluted517,513
 510,945
 520,760
Cash dividends declared per share$0.24
 $0.24
 $0.24
See accompanying Notes to Consolidated Financial Statements.


48


Table of Contents

MARVELL TECHNOLOGY GROUP LTD.


CONSOLIDATED STATEMENTS OF COMPREHENSIVE INCOME (LOSS)

(In thousands)

   Year Ended 
   January 30,
2016
  January 31,
2015
  February 1,
2014
 

Net income (loss)

  $(811,400 $435,346   $315,320  

Other comprehensive income (loss), net of tax:


Net change in unrealized gain (loss) on marketable securities

   (4,424  1,234    (208

Net change in unrealized gain (loss) on auction rate securities

   2,274    597    (190

Net change in unrealized gain (loss) on cash flow hedges

   1,047    (2,120  (153


Other comprehensive loss, net of tax

   (1,103  (289  (551


Comprehensive income (loss), net of tax

  $(812,503 $435,057   $314,769  


 Year Ended
 January 28,
2017
 January 30,
2016
 January 31,
2015
Net income (loss)$21,151
 $(811,400) $435,346
Other comprehensive income (loss), net of tax:     
Net change in unrealized gain (loss) on marketable securities(145) (4,424) 1,234
Net change in unrealized loss on auction rate securities
 2,274
 597
Net change in unrealized gain (loss) on cash flow hedges963
 1,047
 (2,120)
Other comprehensive income (loss), net of tax818
 (1,103) (289)
Comprehensive income (loss), net of tax$21,969
 $(812,503) $435,057
See accompanying Notes to Consolidated Financial Statements.


49


Table of Contents

MARVELL TECHNOLOGY GROUP LTD.


CONSOLIDATED STATEMENTS OF SHAREHOLDERS’ EQUITY

(In thousands except per share amounts)


Common Stock

  Additional
Paid-in

Capital
  Accumulated
Other
Comprehensive

Income (Loss)
  Retained
Earnings
  Total 
 Shares  Amount     

Balance at February 2, 2013

  508,338   $1,017   $2,945,643   $1,148   $1,536,787   $4,484,595  

Shares issued pursuant to stock options and awards

  18,503    37    133,262    —      —      133,299  

Issuance of common stock under the employee stock purchase plan

  9,701    19    71,644    —      —      71,663  

Cancellation of restricted stock units for net share settlement

  (1,024  (2  (10,870   —      (10,872

Share-based compensation

  —      —      156,126    —      —      156,126  

Tax deficiency from employee stock transactions

  —      —      (88  —      —      (88

Repurchase of common stock

  (33,113  (66  (354,067  —      —      (354,133

Cash dividends declared and paid (cumulatively $0.24 per share)

  —      —      —      —      (119,449  (119,449

Net income

  —      —      —      —      315,320    315,320  

Other comprehensive loss

  —      —      —      (551  —      (551


Balance at February 1, 2014

  502,405    1,005    2,941,650    597    1,732,658    4,675,910  

Shares issued pursuant to stock options and awards

  9,673    19    38,020    —      —      38,039  

Issuance of common stock under the employee stock purchase plan

  9,690    19    74,299    —      —      74,318  

Cancellation of restricted stock units for net share settlement

  (1,661  (3  (26,491   —      (26,494

Share-based compensation

  —      —      137,001    —      —      137,001  

Tax benefit from employee stock transactions

  —      —      21    —      —      21  

Repurchase of common stock

  (5,070  (10  (64,952  —      —      (64,962

Cash dividends declared and paid (cumulatively $0.24 per share)

  —      —      —      —      (122,801  (122,801

Net income

  —      —      —      —      435,346    435,346  

Other comprehensive loss

  —      —      —      (289  —      (289


Balance at January 31, 2015

  515,037    1,030    3,099,548    308    2,045,203    5,146,089  

Shares issued pursuant to stock options and awards

  8,022    16    21,763    —      —      21,779  

Issuance of common stock under the employee stock purchase plan

  5,890    11    58,927    —      —      58,938  

Cancellation of restricted stock units for net share settlement

  (1,677  (3  (24,355  —      —      (24,358

Share-based compensation

  —      —      133,766    —      —      133,766  

Tax benefit from employee stock transactions

  —      —      108    —      —      108  

Repurchase of common stock

  (19,700  (39  (260,836  —      —      (260,875

Cash dividends declared and paid (cumulatively $0.24 per share)

  —      —      —      —      (122,821  (122,821

Net loss

  —      —      —      —      (811,400  (811,400

Other comprehensive loss

  —      —      —      (1,103  —      (1,103


Balance at January 30, 2016

  507,572   $1,015   $3,028,921   $(795 $1,110,982   $4,140,123  


Common Stock
 
Additional
Paid-in
Capital
 
Accumulated
Other
Comprehensive
Income (Loss)
 
Retained
Earnings
 Total
Shares Amount 
Balance at February 1, 2014502,405
 $1,005
 $2,941,650
 $597
 $1,732,658
 $4,675,910
Shares issued pursuant to stock options and awards9,673
 19
 38,020
 
 
 38,039
Issuance of common stock under the employee stock purchase plan9,690
 19
 74,299
 
 
 74,318
Cancellation of restricted stock units for net share settlement(1,661) (3) (26,491)   
 (26,494)
Share-based compensation
 
 137,001
 
 
 137,001
Tax benefit from employee stock transactions
 
 21
 
 
 21
Repurchase of common stock(5,070) (10) (64,952) 
 
 (64,962)
Cash dividends declared and paid (cumulatively $0.24 per share)


 (122,801) (122,801)
Net income


 435,346
 435,346
Other comprehensive loss
 
 
 (289) 
 (289)
Balance at January 31, 2015515,037
 1,030
 3,099,548
 308
 2,045,203
 5,146,089
Shares issued pursuant to stock options and awards8,022
 16
 21,763
 
 
 21,779
Issuance of common stock under the employee stock purchase plan5,890
 11
 58,927
 
 
 58,938
Cancellation of restricted stock units for net share settlement(1,677) (3) (24,355)   
 (24,358)
Share-based compensation
 
 133,766
 
 
 133,766
Tax benefit from employee stock transactions
 
 108
 
 
 108
Repurchase of common stock(19,700) (39) (260,836) 
 
 (260,875)
Cash dividends declared and paid (cumulatively $0.24 per share)


 (122,821) (122,821)
Net loss


 (811,400) (811,400)
Other comprehensive loss
 
 
 (1,103) 
 (1,103)
Balance at January 30, 2016507,572
 1,015
 3,028,921
 (795) 1,110,982
 4,140,123
Shares issued pursuant to stock options and awards11,203
 22
 57,509
 
 
 57,531
Issuance of common stock under the employee stock purchase plan2,276
 5
 16,683
 
 
 16,688
Cancellation of restricted stock units for net share settlement(1,653) (3) (16,679) 
 
 (16,682)
Share-based compensation
 
 113,402
 
 
 113,402
Tax deficiency from employee stock transactions
 
 (24) 
 
 (24)
Repurchase of common stock(13,303) (27) (183,037) 
 
 (183,064)
Cash dividends declared and paid (cumulatively $0.24 per share)


 (122,292) (122,292)
Net income


 21,151
 21,151
Other comprehensive income
 
 
 818
 
 818
Balance at January 28, 2017506,095
 $1,012
 $3,016,775
 $23
 $1,009,841
 $4,027,651
See accompanying Notes to Consolidated Financial Statements.


50


Table of Contents

MARVELL TECHNOLOGY GROUP LTD.


CONSOLIDATED STATEMENTS OF CASH FLOWS

(In thousands)

   Year Ended 
   January 30,
2016
  January 31,
2015
  February 1,
2014
 

Cash flows from operating activities:


Net income (loss)

  $(811,400 $435,346   $315,320  

Adjustments to reconcile net income (loss) to net cash provided by operating activities:


Depreciation and amortization

   100,176    106,248    102,752  

Share-based compensation

   133,779    137,246    155,873  

Amortization and write-off of acquired intangible assets

   12,688    18,337    44,006  

Gain on sale of business

   —      —      (6,975

Non-cash restructuring and other related charges

   16,032    17    61  

Loss (gain) from investments in privately-held companies

   3,503    (8,829  1,500  

Amortization (accretion) of premium /discount on available-for-sale securities

   8,112    (3,582  7,916  

Other non-cash expense (income), net

   2,196    1,765    (1,299

Excess tax benefits from share-based compensation

   (26  (145  (20

Deferred income tax

   6,096    (12,913  3,919  

Changes in assets and liabilities, net of assets acquired and liabilities assumed in acquisitions:


Accounts receivable

   97,655    34,165    (123,258

Inventories

   90,586    39,454    (97,188

Prepaid expenses and other assets

   (23,209  5,788    19,458  

Accounts payable

   (105,898  (43,871  39,791  

Accrued liabilities and other non-current liabilities

   (15,202  (30,024  (9,627

Carnegie Mellon University accrued litigation settlement

   736,000    —      —    

Accrued employee compensation

   (33,338  43,561    (5,787

Deferred income

   (12,398  6,373    1,597  


Net cash provided by operating activities

   205,352    728,936    448,039  


Cash flows from investing activities:


Purchases of available-for-sale securities

   (1,056,045  (1,128,319  (837,892

Sales of available-for-sale securities

   991,657    534,908    588,712  

Maturities of available-for-sale securities

   311,843    291,402    406,327  

Investments in privately-held companies

   (41  (701  (1,869

Proceeds from sale of an investment in a privately-held company

   —      13,220    —    

Cash paid for acquisitions, net

   —      —      (2,551

Proceeds from sale of business

   —      —      6,306  

Purchases of technology licenses

   (8,236  (16,424  (17,647

Purchases of property and equipment

   (37,255  (63,030  (66,593

Purchases of equipment previously leased

   (10,240  —      —    

Proceeds from equipment held for sale

   10,007    —      —    


Net cash provided by (used in) investing activities

   201,690    (368,944  74,793  


Cash flows from financing activities:


Repurchase of common stock

   (260,875  (64,962  (376,285

Proceeds from employee stock plans

   80,717    112,357    204,962  

Minimum tax withholding paid on behalf of employees for net share settlement

   (24,358  (26,494  (10,872

Dividend payments to shareholders

   (122,821  (122,801  (119,449

Payments on technology license obligations

   (12,528  (13,010  (7,411

Excess tax benefits from share-based compensation

   26    145    20  


Net cash used in financing activities

   (339,839  (114,765  (309,035


Net increase in cash and cash equivalents

   67,203    245,227    213,797  

Cash and cash equivalents at beginning of the year

   1,210,977    965,750    751,953  


Cash and cash equivalents at end of the year

  $1,278,180   $1,210,977   $965,750  


 Year Ended
 January 28,
2017
 January 30,
2016
 January 31,
2015
Cash flows from operating activities:     
Net income (loss)$21,151
 $(811,400) $435,346
Adjustments to reconcile net income (loss) to net cash provided by (used in) operating activities:     
Depreciation and amortization107,851
 100,176
 106,248
Share-based compensation113,970
 133,779
 137,246
Amortization and write-off of acquired intangible assets10,641
 12,688
 18,337
Restructuring and other related charges52,581
 16,032
 17
Loss (gain) from investments in privately-held companies
 3,503
 (8,829)
Amortization (accretion) of premium /discount on available-for-sale securities3,319
 8,112
 (3,582)
Other non-cash expense (income), net(3,312) 2,196
 1,765
Excess tax benefits from share-based compensation(37) (26) (145)
Deferred income tax44,637
 6,096
 (12,913)
Changes in assets and liabilities, net of assets acquired and liabilities assumed in acquisitions:     
Accounts receivable(12,084) 97,655
 34,165
Inventories29,325
 90,586
 39,454
Prepaid expenses and other assets1,825
 (23,209) 5,788
Accounts payable(28,153) (105,898) (43,871)
Accrued liabilities and other non-current liabilities3,763
 (15,202) (30,024)
Carnegie Mellon University accrued litigation settlement(736,000) 736,000
 
Accrued employee compensation18,016
 (33,338) 43,561
Deferred income14,072
 (12,398) 6,373
Net cash provided by (used in) operating activities(358,435) 205,352
 728,936
Cash flows from investing activities:     
Purchases of available-for-sale securities(489,856) (1,056,045) (1,128,319)
Sales of available-for-sale securities616,697
 991,657
 534,908
Maturities of available-for-sale securities239,557
 311,843
 291,402
Distributions from (investments in) privately-held companies16
 (41) (701)
Purchases of time deposits(275,000) 
 
Maturities of time deposits125,000
 
 
Proceeds from sale of an investment in a privately-held company
 
 13,220
Purchases of technology licenses(10,309) (8,236) (16,424)
Purchases of property and equipment(44,510) (37,255) (63,030)
Purchases of equipment previously leased
 (10,240) 
Proceeds from equipment held for sale
 10,007
 
Net cash provided by (used in) investing activities161,595
 201,690
 (368,944)
Cash flows from financing activities:     
Repurchase of common stock(181,564) (260,875) (64,962)
Proceeds from employee stock plans74,219
 80,717
 112,357
Minimum tax withholding paid on behalf of employees for net share settlement(16,683) (24,358) (26,494)
Dividend payments to shareholders(122,292) (122,821) (122,801)
Payments on technology license obligations(20,965) (12,528) (13,010)
Excess tax benefits from share-based compensation37
 26
 145
Net cash used in financing activities(267,248) (339,839) (114,765)
Net increase (decrease) in cash and cash equivalents(464,088) 67,203
 245,227
Cash and cash equivalents at beginning of the year1,278,180
 1,210,977
 965,750
Cash and cash equivalents at end of the year$814,092
 $1,278,180
 $1,210,977
See accompanying Notes to Consolidated Financial Statements.


51


Table of Contents
MARVELL TECHNOLOGY GROUP LTD.

NOTES TO CONSOLIDATED FINANCIAL STATEMENTS


Note 1 — The Company and its Significant Accounting Policies

The Company

Marvell Technology Group Ltd., a Bermuda exempted company, and its subsidiaries (the “Company”), is a fabless semiconductor provider of high-performance application-specific standard products. The Company’s core strength of expertise is the development of complex System-on-a-Chip and System-in-a-Package devices, leveraging its extensive technology portfolio of intellectual property in the areas of analog, mixed-signal, digital signal processing, and embedded and stand-alonestandalone integrated circuits. The majority of the Company’s product portfolio leverages embedded central processing unit technology. The Company also develops platforms that it defines as integrated hardware along with software that incorporates digital computing technologies designed and configured to provide an optimized computing solution. The Company’s broad product portfolio includes devices for data storage, enterprise-class Ethernet data switching, Ethernet physical-layer transceivers, wireless connectivity, Internet-of-Things devicesnetworking and multimedia solutions.

connectivity.

Basis of Presentation

The Company’s fiscal year is the 52- or 53-week period ending on the Saturday closest to January 31. InAccordingly, every fifth or sixth fiscal year will have a 52-week year, each fiscal quarter consists of 13 weeks.53-week period. The additional week in a 53-week year is added to the fourth quarter, making such quarter consist of 14 weeks. Fiscal 2017, 2016 2015 and 20142015 each had a 52-week period.

The next 53-week year will be fiscal 2018.

Discontinued Operations
In connection with the plan the Company announced in November 2016 to restructure its operations to refocus its research and development, increase operational efficiency and improve profitability, it also planned to divest certain businesses and it began an active program to locate buyers for several businesses. As of January 28, 2017, two of these businesses have been classified as discontinued operations (see "Note 2 - Discontinued Operations"). As required, the Company has retrospectively recast its consolidated statements of operations and balance sheets for all periods presented to reflect these businesses as discontinued operations. The cash flows of these discontinued operations were not material for any period presented and we have not segregated the cash flows of these businesses in the consolidated statements of cash flows. Management was also required to make certain assumptions and apply judgment to determine historical expenses related to the discontinued operations presented in prior periods. Unless noted otherwise, discussion in the Notes to Consolidated Financial Statements refers to the Company’s continuing operations.
Use of Estimates

The preparation of consolidated financial statements in conformity with accounting principles generally accepted accounting principles in the United States (“GAAP”("GAAP") requires management to make estimates, judgments and assumptions that affect the reported amounts of assets, liabilities, revenues and expenses, and related disclosure of contingent assets and liabilities. On an ongoing basis, the Company evaluates its estimates, including those related to performance-based compensation, revenue recognition, provisions for sales returns and allowances, inventory excess and obsolescence, investment fair values, goodwill and other intangible assets, restructuring, income taxes, litigation and other contingencies. In addition, the Company uses assumptions when employing the Monte Carlo simulation and Black-Scholes valuation models to calculate the fair value of share-based awards that are granted. Actual results could differ from these estimates, and such differences could affect the results of operations reported in future periods.

Principles of Consolidation

The consolidated financial statements include the accounts of the Company and its wholly-owned subsidiaries. All intercompany accounts and transactions have been eliminated. The functional currency of the Company and its subsidiaries is the U.S. dollar.

Cash and Cash Equivalents

The Company considers all highly liquid investments with aan original maturity of three months or less from the date of purchase to be cash equivalents. Cash and cash equivalents consist of cash on deposit with banks, time deposits, U.S. government and agency debt, municipal debt securities, corporate debt securities and money market funds.

MARVELL TECHNOLOGY GROUP LTD.

NOTES TO CONSOLIDATED FINANCIAL STATEMENTS — (Continued)

Investments

The Company’s marketable investments are classified as available-for-sale and are reported at fair value. The Company determines any realized gains or losses on the sale of available-for-sale securities on a specific identification method, and such gains and losses are recorded as a component of interest and other income, net. Unrealized gains and losses of the available-for-sale securities are excluded from earnings and reported as a component of accumulated other comprehensive income. Time

52


MARVELL TECHNOLOGY GROUP LTD.
NOTES TO CONSOLIDATED FINANCIAL STATEMENTS — (Continued)

deposits with maturities greater than 90 days, but less than one year are classified in short-term investments as held-to-maturity since the Company has both the intent and ability to hold them to maturity.
In general, investments with original maturities of greater than 90 days and remaining maturities of less than one year are classified as short-term investments. Investments with maturities beyond one year may also be classified as short-term based on their highly liquid nature and can be sold to fund current operations.
The Company also has equity investments in privately-held companies. If the Company has the ability to exercise significant influence over the investee, but not control, or if the investee is a partnership type investment, the Company accounts for the investments under the equity method. If the Company does not have the ability to exercise significant influence over the operations of the investee, the Company accounts for the investment under the cost method. Investments in privately-held companies are included in other non-current assets.
Impairment of Investments
The Company performs a periodic review of its available-for-sale securities to determine whether an other-than-temporary impairment has occurred. Generally, for an individual security that has been in an unrealized loss position for an extended period of time, the Company evaluates whether an impairment charge should be recognized. Its evaluation is based on specific facts and circumstances at the time of assessment, including general market conditions, and the duration and extent to which the fair value is below cost. If the fair value of a debt security is less than its amortized cost, then an other-than-temporary impairment for the difference is recognized if:


the Company has the intent to sell the security;

it is more likely than not that the Company will be required to sell the security before recovery of its amortized cost base; or

a credit loss exists insofar as the Company does not expect to recover the entire recognized amortized cost of the security.

In general, investments with original maturities of greater than 90 days and remaining maturities of less than one year are classified as short-term investments. Investments with maturities beyond one year may also be classified as short-term based on their highly liquid nature and can be sold to fund for current operations.

The Company also has equity investments in privately-held companies. If the Company has the ability to exercise significant influence over the investee, but not control, or if the investee is a partnership type investment, the Company accounts for the investments under the equity method. If the Company does not have the ability to exercise significant influence over the operations of the investee, the Company accounts for the investment under the cost method. Investments in privately-held companies are included in other non-current assets.

Impairment of Investments

If a debt security’s market value is below amortized cost and the Company either intends to sell the security or it is more likely than not that the Company will be required to sell the security before its anticipated recovery, the Company records an other-than-temporary impairment charge to interest and other income, net in the consolidated statements of operations.

Investments in privately-held companies are subject to a periodic impairment review. Investments are considered impaired when the fair value is below the investment’s cost basis and the decline in value is judged to be other-than-temporary. This assessment is based on a qualitative and quantitative analysis, including, but not limited to, the investee’s revenue and earnings trends, available cash and liquidity, and the status of the investee’s products and the related market for such products.

Derivative Financial Instruments

The Company accounts for its derivative instruments as either assets or liabilities and carries them at fair value. For derivative instruments that hedge the exposure to variability in expected future cash flows and are

MARVELL TECHNOLOGY GROUP LTD.

NOTES TO CONSOLIDATED FINANCIAL STATEMENTS — (Continued)

designated as cash flow hedges, the effective portion of the gain or loss on the derivative instrument is reported as a component of accumulated other comprehensive income in the consolidated statements of shareholders’ equity and reclassified into earnings in the same period or periods during which the hedged transaction affects earnings. The ineffective portion of the gain or loss on the derivative instrument is recognized in current earnings. To receive hedge accounting treatment, cash flow hedges must be highly effective in offsetting changes to expected future cash flows on hedged transactions. Derivatives that are not designated as hedges must be adjusted to fair value through earnings.

Concentration of Credit Risk and Significant Customers

Financial instruments that potentially subject the Company to a significant concentration of credit risk consist principally of cash equivalents, short-term investments and accounts receivable. Cash, cash equivalents and short-term investments balances are maintained with high-quality financial institutions, the composition and maturities of which are regularly monitored by management. The Company believes that the concentration of credit risk in its trade receivables, which consists of a customer base located primarily in the Asia Pacific Region, is substantially mitigated by the Company’s credit evaluation process, relatively short collection terms and the high level of credit worthiness of its customers. The Company performs ongoing credit evaluations of its customers’ financial conditions and limits the amount of credit extended when deemed necessary based upon payment history and the customer’s current credit worthiness, but generally requires no collateral. The Company regularly reviews the allowance for bad debt and doubtful accounts by considering factors such as historical experience, credit quality, age of the accounts receivable balances and current economic conditions that may affect a customer’s ability to pay.


53


MARVELL TECHNOLOGY GROUP LTD.
NOTES TO CONSOLIDATED FINANCIAL STATEMENTS — (Continued)

The Company’s accounts receivable was concentrated with three customers at January 28, 2017, who represented 14%, 13%, and 11% of gross accounts receivable, respectively, compared with two customers at January 30, 2016, who represented 13% and 11% of gross accounts receivable, respectively, compared with two customers at January 31, 2015, who represented 15% and 14% of gross accounts receivable, respectively.

Historically, a relatively small number of customers have accounted for a significant portion of the Company’sour net revenue. Net revenue from one customer was 18%, 20% and 24% for fiscal 2016, 2015 and 2014, respectively. Net revenue fromattributable to significant customers whose revenues as a second customer was 13% in eachpercentage of fiscal 2016 and 2015, and 12% in fiscal 2014.

The Company also had net revenue from one distributor representing 11% for fiscal 2015. No distributors accounted forwas 10% or greater of total net revenuerevenues is presented in either fiscal 2016 or fiscal 2014. the following table:

 Year Ended
 January 28,
2017
 January 30,
2016
 January 31,
2015
Customer:     
Western Digital*21% 19% 20%
Toshiba13% **%
 **%
Seagate9% 14% 13%
Wintech10% **%
 11%
      
* The percentage of net revenues reported for Western Digital for fiscal year 2017 includes net revenue of HGST and SanDisk that became subsidiaries of Western Digital in late fiscal 2016.
** Less than 10% of net revenue
The Company continuously monitors the creditworthiness of its distributors and believes these distributors’ sales to diverse end customers and to diverse geographies further serve to mitigate the Company’s exposure to credit risk.

Inventories

Inventory is stated at the lower of cost or market, cost being determined under the first-in, first-out method. The total carrying value of the Company’s inventory is reduced for any difference between cost and estimated market value of inventory that is determined to be excess, obsolete or unsellable inventory based upon assumptions about future demand and market conditions. If actual future demand for the Company’s products is less than currently forecasted, the Company may be required to write inventory down below the current carrying value. Once the carrying value of inventory is reduced, it is maintained until the product to which it relates to is sold or otherwise disposed of. Inventoriable shipping and handling costs are classified as a component of cost of goods sold in the consolidated statements of operations.

MARVELL TECHNOLOGY GROUP LTD.

NOTES TO CONSOLIDATED FINANCIAL STATEMENTS — (Continued)

Property and Equipment, Net

Property and equipment, net, are stated at cost less accumulated depreciation. Depreciation is computed using the straight-line method over the estimated useful lives of the assets, which ranges from 3 to 7 years for machinery and equipment, and 3 to 4 years for computer software, and furniture and fixtures. Buildings are depreciated over an estimated useful life of 30 years and building improvements are depreciated over estimated useful lives of 15 years. Leasehold improvements are depreciated over the shorter of the remaining lease term or the estimated useful life of the asset.

Goodwill

Goodwill is recorded when the consideration paid for a business acquisition exceeds the fair value of net tangible and intangible assets acquired. Goodwill is measured and tested for impairment annually on the last business day of the fiscal fourth quarter and whenever events or changes in circumstances indicate the carrying amount of goodwill may not be recoverable. The Company first assesses qualitative factors to determine whether it is more likely than not that the fair value of a reporting unit is less than its carrying amount.

If the Company concludes that it is more likely than not that the fair value of a reporting unit is less than its carrying amount or if the Company notes multiple qualitative factors indicating potential impairment, then a two-step quantitative impairment test is performed. The first step requires comparing the fair value of the reporting unit to its net book value, including goodwill. The Company has identified that its business operates as a single operating segment with two components (Storage, and Smart Networked Devices and Solutions)Networking & Connectivity), which it has concluded can be aggregated into a single reporting unit for purposes of testing goodwill impairment. As part of a restructuring announced in November 2016 (see “Note 8 - Restructuring and Other Related Charges”), the former Smart Networked Devices and Solutions component was renamed to Networking & Connectivity. A potential impairment exists if the fair value of the reporting unit is lower than its net book value. The second step of the process is only performed if a potential impairment exists, and it involves determining the implied fair value of the reporting unit’s goodwill and comparing it to the carrying value of goodwill. If the carrying value of goodwill were to exceed

54


MARVELL TECHNOLOGY GROUP LTD.
NOTES TO CONSOLIDATED FINANCIAL STATEMENTS — (Continued)

its implied fair value, then the Company would record an impairment loss for the difference in the fiscal quarter in which the determination is made.

Long-Lived Assets and Intangible Assets

The Company assesses the impairment of long-lived assets and intangible assets whenever events or changes in circumstances indicate that the carrying amount of long-lived assets may not be recoverable. The Company estimates the future cash flows, undiscounted and without interest charges, expected to be generated by the assets from its use or eventual disposition. If the sum of the expected undiscounted future cash flows is less than the carrying amount of those assets, the Company recognizes an impairment loss based on the excess of the carrying amount over the fair value of the assets. Please see “Note 7 — Goodwill and Acquired Intangible Assets, Net” for further details regarding impairment of acquisition-related identified intangible assets.

Acquisition-related identified intangible assets are amortized on a straight-line basis over their estimated economic lives. In-process research and development (“IPR&D”) is not amortized until the completion of the related development.

Foreign Currency Transactions

The functional currency of all of the Company’s non-U.S. operations is the U.S. dollar. Monetary accounts maintained in currencies other than the U.S. dollar are re-measured using the foreign exchange rate at the balance sheet date. Operational accounts and nonmonetary balance sheet accounts are measured and recorded at the exchange rate in effect at the date of the transaction. The effects of foreign currency re-measurement are reported in current operations.

MARVELL TECHNOLOGY GROUP LTD.

NOTES TO CONSOLIDATED FINANCIAL STATEMENTS — (Continued)

Revenue Recognition

The Company recognizes revenue when there is persuasive evidence of an arrangement, delivery has occurred, the fee is fixed or determinable, and collection is reasonably assured.

If the Company grants extended payment terms greater than its standard terms for a customer such that collectability is not assured, the revenue is deferred upon shipment and will be recognized when the payment becomes due provided all other revenue recognition criteria have been satisfied.

Product revenue is generally recognized upon shipment of product to customers, net of accruals for estimated sales returns and rebates. However, some of the Company’s sales are made through distributors under agreements allowing for price protection and limited rights of stock rotation on products unsold by the distributors. Although title passes to the distributor upon shipment, terms and payment by the Company’s distributors is not contingent on resale of the product, productproduct. Product revenue on sales made through distributors with price protection and stock rotation rights are deferred until the distributors sell the product to end customers. Deferred revenue less the related cost of the inventories is reported as deferred income. The Company does not believe that there is any significant exposure related to impairment of deferred cost of sales, as its historical returns have been minimal and inventory turnover for its distributors generally ranges from 60 to 90 days. The Company’s sales to direct customers are made primarily pursuant to standard purchase orders for delivery of products.

A portion of the Company’s net revenue is derived from sales through third-party logistics providers, who maintain warehouses in close proximity to the customer’s facilities. Revenue from sales through these third-party logistics providers is not recognized until the product is pulled from stock by the end customer.

The provision for estimated sales returns on product sales is recorded in the same period the related revenues are recorded. These estimates are based on historical returns, analysis of credit memo data and other known factors. Actual returns could differ from these estimates. The Company accounts for rebates by recording reductions to revenue for rebates in the same period that the related revenue is recorded. The amount of these reductions is based upon the terms agreed to with the customer.

Advertising Expense

Advertising costs are expensed as incurred. The Company recorded $0.5 million, $5.1 million $5.6 million and $0.3$5.6 million of advertising costs for fiscal 2017, 2016 2015 and 2014,2015, respectively, included in selling and marketing expenses in the consolidated statement of operations.

Share-Based Compensation

Share-based compensation is measured at the grant date, based on the fair value of the award, and is recognized as expense over the requisite service period. The Company amortizes share-based compensation expense for time-based awards under the straight-line attribution method over the vesting period, which is generally four years for annual grants to employees and five years for new hire grants.period. Share-based compensation expense for performance-based awards is recognized when it becomes probable that the performance conditions will be met. Once it becomes probable that a performance-based award will vest, the Company recognizes compensation expense equal to the number of shares expected to vest multiplied by the fair value of the award at the grant date, which is amortized using the accelerated method. In the case of performance-based awards based on total shareholder return (“TSR”), share-based compensation expense is amortized over the

55


MARVELL TECHNOLOGY GROUP LTD.
NOTES TO CONSOLIDATED FINANCIAL STATEMENTS — (Continued)

requisite service period. For stock purchase rights under the stock purchase plan, the Company amortizes share-based compensation expense ratably over the two-year offering period.

The Company estimates the fair value of time-based stock option and stock purchase awards on the date of grant using the Black Scholes option-pricing model. The fair value of market-based stock optionTSR awards is estimated on the date of grant using a Monte Carlo simulation model.model since the award is indexed to the price of the Company’s common stock as set forth under the terms of the award. The value of the portion of the awards that

MARVELL TECHNOLOGY GROUP LTD.

NOTES TO CONSOLIDATED FINANCIAL STATEMENTS — (Continued)

is ultimately expected to vest is recognized as expense over the requisite service periods. The Black Scholes and Monte Carlo models incorporate various highly subjective assumptions including expected term of awards, expected future stock price volatility, expected dividend yield and risk-free interest rate.

In developing estimates used to calculate assumptions, the Company establishes the expected term for employee stock options, as well as expected forfeiture rates, based on the historical settlement experience and after giving consideration to vesting schedules. Assumptions for stock option exercises and pre-vesting terminations of stock options are stratified by two employee groups and one employee/non-employee group with sufficiently distinct behavior patterns. Expected volatility was developed based on equally weighted combination of historical stock price volatility and implied volatility derived from traded options on the Company’s stock in the marketplace. The expected dividend yield is calculated by dividing annualized dividend payments by the closing stock price on the grant date of the option.

The fair value of each restricted stock unit is estimated based on the market price of the Company’s common shares on the date of grant less the expected dividend yield.
Forfeitures are estimated at the time of grant and revised, if necessary, in subsequent periods if actual forfeitures differ from initial estimates. Share-based compensation expense for time-based and performance-based awards is recorded net of estimated forfeitures such that expense is recorded only for those share-based awards that are expected to vest. Previously recognized expense is reversed for the portion of awards forfeited prior to vesting as and when forfeitures occurred.

The fair value of each restricted stock unit is estimated based on the market price of the Company’s common shares on the date of grant less the expected dividend yield.

Comprehensive Income (Loss)

Comprehensive income (loss) is comprised of net income and unrealized gains and losses, net of tax, on available-for-sale securities, auction rate securities and cash flow hedges. Accumulated other comprehensive income (loss), as presented on the accompanying consolidated balance sheets, consists of net unrealized gains and losses on available-for-sale securities, auction rate securities and cash flow hedges, net of tax.

Accounting for Income Taxes

The Company recognizes income taxes using an asset and liability approach. This approach requires the recognition of taxes payable or refundable for the current year, and deferred tax liabilities and assets for the future tax consequences of events that have been recognized in the Company’s consolidated financial statements or tax returns. The measurement of current and deferred taxes is based on provisions of the enacted tax law and the effects of future changes in tax laws or rates are not anticipated.

Using available evidence and judgment, the Company establishes a valuation allowance for deferred tax assets, when it is determined that it is more likely than not that they will not be realized. Valuation allowances have been provided primarily against the U.S. research and development credits. Valuation allowances have also been provided against certain acquired operating losses and the deferred tax assets of a foreign subsidiary.subsidiaries. A change in the assessment of the realization of deferred tax assets may materially impact the Company’s tax provision in the period in which a change of assessment occurs.

The Company is subject to income tax audits by the respective tax authorities in each jurisdiction in which the Company operates. The Company recognizes the effect of income tax positions only if these positions are

MARVELL TECHNOLOGY GROUP LTD.

NOTES TO CONSOLIDATED FINANCIAL STATEMENTS — (Continued)

more likely than not of being sustained. Recognized income tax positions are measured at the largest amount that is more than 50% likely of being realized. Changes in recognition or measurement are reflected in the period in which the change in judgment occurs. The Company records interest and penalties related to unrecognized tax benefits in income tax expense.

Warranty

The Company’s products are generally subject to warranty, which provides for the estimated future costs of repair or replacement upon shipment of the product. The Company’s products carry a standard 90-day warranty, with certain exceptions in which the warranty period can extend to more than one year based on contractual agreements. The warranty accrual is primarily estimated based on historical claims compared to historical revenues and assumes that the Company will have to replace products subject to a claim. From time to time, the Company becomes aware of specific warranty situations, and it records specific accruals to cover these exposures. Warranty expenses were not material in fiscal 2017, 2016 2015 and 2014.

2015.

Recent Accounting Pronouncements


56


MARVELL TECHNOLOGY GROUP LTD.
NOTES TO CONSOLIDATED FINANCIAL STATEMENTS — (Continued)

Accounting Pronouncements Recently Adopted

In April 2014,2015, the Financial Accounting Standards Board (“FASB”("FASB") issued an amendmentnew guidance to its guidance regardinghelp entities evaluate the reporting requirements of discontinued operations,accounting for fees paid by a customer in a cloud computing arrangement, which was effective for the Company adopted beginning in the first quarter of fiscal 2016. Under2017. The guidance provides a basis for evaluating whether a cloud computing arrangement includes a software license and whether the amendedlicense arrangement should be accounted for as an intangible asset. This guidance a discontinued operation is defined as a disposal of a component or group of components that is disposed of or is classified as heldalso strikes from previous authoritative guidance, the use by analogy to the accounting for sale and represents a strategic shift that has (or will have) a major effect on an entity’s operations and financial results. As a result,capital leases, which the Company has adopted and will applypreviously applied in the accounting for certain of its technology license agreements. As such, the Company accounts for new agreements under the new guidance by determining if capitalization as an asset is appropriate or if the arrangement should be treated as a subscription with expense recognized in the period when service is received. Similarly, the Company will re-evaluate the accounting for any future dispositions that meet the criteria of a discontinued operation under the amendment.

In November 2015, the FASB issued a new standardrenewals to simplify the presentation of deferred income taxes. Previous guidance required deferred tax assets and liabilities to be separately presented as current and non-current amounts on the consolidated balance sheet. The new standard will require that deferred tax assets and liabilities be classified and presented on the consolidated balance sheet as non-current. The guidance is effective for annual and interim reporting periods beginning after December 15, 2016, and may be applied either prospectively or retrospectively, although early adoption is permitted. The Company early adoptedexisting license agreements in accordance with the new guidance at the beginning of its fourth quarter of fiscal 2016 and accordingly, it has classified all deferred tax assets and liabilities, together with the corresponding valuation allowance, as noncurrent on the consolidated balance sheet. The Company has applied this standard prospectively and did not retrospectively adjust any prior periods. Adoption had no impact on the Company’s consolidated results of operations and it had no material impact on working capital.

they occur.


Accounting Pronouncements Not Yet Effective


In May 2014, the FASB issued a new standard on the recognition of revenue from contracts with customers, which will supersede nearly all existing revenue recognition guidance under GAAP. Under theThe new standard recognition ofwill require an entity to recognize revenue occurs when a customer obtains controlfrom the transfer of promised goods or services to customers in an amount that reflects the consideration to which the entity expects to be entitled in exchange for those goods or services. AdditionalThe guidance addresses, in particular, contracts with more than one performance obligation, as well as the accounting for some costs to obtain or fulfill a contract with a customer, and provides for additional disclosures regarding the nature, amount, timing, and uncertainty of revenuewith respect to revenues and cash flows arising from contracts with customers, and assets recognized from costs incurredcustomers. Public entities are required to obtain or fulfillapply the amendments on either a contract will also be required. The FASB subsequently issued an update to this standard in August 2015, which provides deferral of the effective date by one year. The standard is now effective for the Company’s first quarter of fiscal 2019 and

MARVELL TECHNOLOGY GROUP LTD.

NOTES TO CONSOLIDATED FINANCIAL STATEMENTS — (Continued)

allows for either full retrospective or modified retrospective adoption. Early adoption is permitted only as ofbasis for annual reporting periods beginning after December 15, 20162017 and includingfor interim reporting periods within such reporting period.

those annual periods. This update will be effective for the Company beginning in the first quarter of fiscal year 2019. Early adoption is not permitted. The FASBCompany plans to adopt the standard retrospectively with the cumulative effect of initially applying it recognized at the date of initial application under the full retrospective approach.


The Company’s initial assessment has since issued additional updates of its new standard onidentified a change in revenue recognition issued in May 2014. In March 2016, an amendment was issuedtiming on our component sales made to clarify the implementation guidance on principal versus agent consideration.distributors. The guidance requires entities to determine whether the nature of its promise to provide goods or services to a customer is performed in a principal or agent capacity andCompany expects to recognize revenue when the Company delivers to the distributor rather than deferring recognition until the distributor sells the components. Other changes may be identified as the Company completes the assessment phase of its revenue project. On the date of initial application, the Company will remove the deferred net revenue on component sales made to distributors through a cumulative adjustment to retained earnings. The Company expects the revenue and corresponding cost of goods sold deferral to be offset by the acceleration of revenue recognition as control of the product transfers to our customer.

To date, the Company has completed the assessment phase of its revenue project and has begun the next phase for the design and development of its systems and processes to enable compliance with the new standards. It expects to complete this phase in its second quarter of fiscal 2018 ending July 29, 2017. Currently, the Company has determined to apply the amendments on a gross or net manner based onfull retrospective basis, although it may decide to change at a later date. The Company will continue to track relevant elements and finalize its principal/agent designation. In April 2016, amendments were issued to clarify the identificationevaluation of performance obligations and the licensing implementation guidance in the initial standard. Amendments were issued in May 2016 relatedany changes to its guidance on assessing collectability, presentation of sales tax, noncash consideration,accounting policies and completed contracts and contract modification at transition, which reduce the potential for diversity in practice, and the cost and complexity of application at transition and on an ongoing basis. The Company has been evaluating the effects of the new guidance and has not yet selected a transition method nor has it determined the potential effects of adoption on its consolidated financial statements.

In April 2015, the FASB issued new guidance to help entities evaluate the accounting for fees paid by a customer in a cloud computing arrangement. The guidance provides a basis for evaluating whether a cloud computing arrangement includes a software license or whether the arrangement should be accounted for as a service contract. The guidance is effective for annual and interim reporting periods beginning after December 15, 2015. The newly issued guidance also strikes from previous authoritative guidance, the use by analogy to the accounting for capital leases, which the Company applied in the accounting for certain of its technology license agreements. The Company is currently evaluating the effect this new guidance will have on its consolidated financial statements.

disclosures.


In July 2015, the FASB issued an amendment to its guidance regarding the subsequent measurement of inventory. Currently, inventory is measured at the lower of cost or market. Market could be replacement cost, net realizable value or net realizable value less an approximately normal profit margin. Under this amended guidance, inventory is to be measured at the lower of cost and net realizable value. Net realizable value is the estimated selling prices in the ordinary course of business, less reasonably predictable costs of completion, disposal and transportation. This amendment applies to inventories for which cost is determined by methods other than last-in first-out and the retail inventory method. This standard is effective for annual and interim reporting periods beginning after December 15, 2016. The Company is currently evaluatingdoes not expect the effectadoption of this new guidanceaccounting standard in the first quarter of fiscal 2018 will have a material effect on its consolidated financial statements.


In January 2016, the FASB issued new guidance which requires entities to measure all investments in equity securities at fair value with changes recognized through net income. This requirement does not apply to investments that qualify for the equity method of accounting, investments that result in consolidation of the investee, or investments for which the entity meets a practicability exception to fair value measurement. The new guidance also changes certain disclosure requirements for financial instruments. This standard is effective for annual and interim reporting periods beginning after December 15, 2017. The Company is currently evaluating the effect this new guidance will have on its consolidated financial statements.

In March 2016, the FASB issued an amendment to its guidance on the effects of derivative contract novations on existing hedge accounting relationships. The new guidance clarifies that a change in the counterparty to a designated hedging instrument, in and of itself, does not require the de-designation of that hedging relationship, provided that all other hedge accounting criteria continue to be met. The guidance is effective for annual and interim reporting periods beginning after December 15, 2016. The Company is currently evaluating the effect this new guidance will have on its consolidated financial statements.

MARVELL TECHNOLOGY GROUP LTD.

NOTES TO CONSOLIDATED FINANCIAL STATEMENTS — (Continued)

In MarchFebruary 2016, the FASB issued a new standard on the accounting for leases, which requires a lessee to record a right-of-use asset and a corresponding lease liability on the balance sheet for all leases with terms longer than twelve months. The standard also expands the required quantitative and qualitative disclosures surrounding lease arrangements. The standard is effective for annual and interim reporting periods beginning after December 15, 2018. The Company is currently evaluating the effect this new guidance will have on its consolidated financial statements.

In March 2016, the FASB issued an amendment to its guidance for investments that eliminates the requirement to retrospectively apply the equity method in previous periods when an investor initially obtains significant influence over an investee. Under the amended guidance, the investor should apply the equity method prospectively from the date the investment qualifies for the equity method. The guidance is effective for annual and interim reporting periods beginning after December 15, 2016. The Company is currently evaluating the effect this new guidance will have on its consolidated financial statements.


In March 2016, the FASB issued new guidance which simplifies several aspects of the accounting for share-based payment award transactions, including the accounting for income taxes, forfeitures and statutory tax withholding requirements, as well as classification in the statement of cash flows. The guidance is effective for annual and interim reporting periods

57


MARVELL TECHNOLOGY GROUP LTD.
NOTES TO CONSOLIDATED FINANCIAL STATEMENTS — (Continued)

beginning after December 15, 2016. The Company is currently evaluatingdoes not expect the effectadoption of this new guidance willaccounting standard to have a material effect on its consolidated financial statements.

statements since the Company will continue to account for forfeitures based on an estimated forfeiture rate. 


In June 2016, the FASB issued a new standard requiring financial assets measured at amortized cost be presented at the net amount expected to be collected, through an allowance for credit losses that is deducted from the amortized cost basis. The standard eliminates the probable initial recognition in current GAAP and reflects an entity’s current estimate of all expected credit losses. The measurement of expected credit losses is based upon historical experience, current conditions, and reasonable and supportable forecasts that affect the collectability of the financial assets. The standard is effective for annual and interim reporting periods beginning after December 15, 2019. The Company is currently evaluating the effect this new guidance will have on its consolidated financial statements

Note 2 — Divestiture

statements.


In August 2016, the FASB issued an accounting standards update to add or clarify guidance on the classification of certain cash receipts and cash payments in the statement of cash flows. The amendments in the update provide guidance on eight specific cash flow issues, and is effective for annual and interim periods beginning after December 15, 2017. Early adoption is permitted, including adoption in an interim period. The amendments to the guidance should be applied using a retrospective transition method for each period presented and if it is impracticable to apply all of the amendments retrospectively for some of the issues, the amendments for those issues would be applied prospectively as of the earliest date practicable. The Company is evaluating the effect this new guidance will have on its consolidated statement of cash flows.

In October 2016, the FASB issued new guidance which simplifies the accounting for the income tax effects of intra-entity transfers and will require companies to recognize the income tax effects of intra-entity transfers of assets other than inventory when the transfer occurs. Previous guidance required companies to defer the income tax effects of intra-entity transfers of assets until the asset had no divestitures in fiscal 2016 and 2015.

During fiscal 2014, the Company exited one of its businesses andbeen sold certain assets to an unrelated thirdoutside party or otherwise recognized. The guidance is effective for annual and interim periods beginning after December 15, 2017. Early adoption is permitted, including adoption in an interim period. The Company is evaluating the effect this new guidance will have on its consolidated financial statements.


In November 2016, the FASB issued new guidance which requires entities to include in their cash and cash-equivalent balances in the statement of cash flows those amounts that are deemed to be restricted cash and restricted cash equivalents. As a result, companies will no longer present transfers between cash and cash equivalents, and restricted cash and restricted cash equivalents in the statement of cash flows. The guidance is effective for annual and interim periods beginning after December 15, 2017. Early adoption is permitted, including adoption in an interim period. The Company is evaluating the effect this new guidance will have on its consolidated financial statements.

In January 2017, the FASB issued an accounting standards update which revises the definition of a business. The amendments provide a more robust framework for determining when a set of assets and activities is a business and is intended to help companies evaluate whether transactions should be accounted for as partacquisitions (or disposals) of cost reduction efforts related to restructuring actionsassets or businesses. The guidance is effective for annual and interim periods beginning after December 15, 2018. Early adoption is permitted for certain transactions as specifically described in fiscal 2014 (see “Note 8 — Restructuring and Other Related Charges”the guidance. The Company is evaluating the effect this new guidance will have on its consolidated financial statements.

In January 2017, the FASB issued an accounting standards update which simplifies the accounting for further information). The transaction primarily includedgoodwill impairment by eliminating Step 2 of the salegoodwill impairment test, which required a hypothetical purchase price allocation. Instead, an entity shall perform its annual or interim, goodwill impairment test by comparing the fair value of intellectual property and equipmenta reporting unit with its carrying amount. Goodwill impairment will now be measured as the amount by which a reporting unit’s carrying value of $0.1 million. The Company also wrote off $2.6 millionexceeds its fair value, but not in an amount to exceed the carrying amount of goodwill allocated to the business basedreporting unit. This guidance will be effective for annual or any interim goodwill impairment tests in fiscal years beginning after December 15, 2019, with early adoption permitted for interim or annual goodwill impairment tests performed on testing dates after January 31, 2017. The Company’s current year step one test outcomes indicated that the adoption of this pronouncement is not expected to have a material effect on the relative fair valuesCompany’s consolidated financial statements.

Note 2 — Discontinued Operations

In July 2016, the Company hired a new President and Chief Executive Officer who immediately initiated a review of the businessCompany’s businesses in order to assess the market position and potential returns of each business. The outcome of this process was to align the Company’s remaining reporting unit. The buyer also hiredcore competencies to ensure it is investing in areas that are most likely to provide the former employees of the business. As part of the transaction, the Company received a license to the intellectual property it sold. It also entered into a separate support services agreement with the buyer to cover an 18-month period. As a result of the sale of this business, the Company recorded a gain of $7.0 million, which is included in interest and other income, net, in the consolidated statement of operations.

best long-


58


MARVELL TECHNOLOGY GROUP LTD.

NOTES TO CONSOLIDATED FINANCIAL STATEMENTS — (Continued)


term returns. The Company identified several businesses that it believes no longer fit with its core competencies and long-term goals to focus on the storage, networking and connectivity markets.

After the business review had been completed, the Company assessed its overall resource requirements in terms of direct costs and indirect costs. In November 2016, the Company announced a plan to restructure its operations to refocus its research and development, increase operational efficiency and improve profitability. The Company expects that the restructuring actions, which include discontinuing investment in specific research and development programs, streamlining engineering processes, and consolidating research and development sites, will eliminate approximately 900 positions worldwide. In addition, the Company plans to divest certain businesses with approximately $60 million in operating expenses and $100 million in revenue based on a first half of fiscal 2017 annualized run rate.

As part of the above actions, the Company began an active program to locate buyers for several businesses. The Company concluded that the divestitures of these businesses represented a strategic shift that has a major effect on the Company’s operations and financial results. These businesses were deemed not to align with the Company’s core business. As of January 28, 2017, the Company believes two of these businesses will be sold within the next twelve months. The Company has entered into an agreement with a buyer for one of the businesses and is actively seeking a buyer for another business, which it believes is probable and, therefore, the Company expects the sale of these two businesses to be completed within the next twelve months. The Company continues its effort to sell a third business. However, at this time, management does not believe the sale will be completed within the next twelve months. As a result, the Company has classified the two above-mentioned businesses as discontinued operations, and has reclassified its statement of operations and balance sheets for all periods presented in its consolidated financial statements to report the effect of these discontinued operations.

The following table presents a reconciliation of the carrying amounts of major classes of assets and liabilities of the discontinued operations to the total assets and liabilities of the disposal group classified as held for sale that are presented separately in the consolidated balance sheets (in thousands):

 January 28, 2017 January 30, 2016
Current assets held for sale:   
Inventory$8,154
 $9,059
Property and equipment, net2,898
 2,762
Goodwill26,532
 26,532
Acquired intangible assets, net3,799
 6,063
Other1,490
 679
Current assets held for sale for discontinued operations42,873
 45,095
Other assets held for sale   
       Property and equipment, net2,973
 
Total assets of the disposal group classified as held for sale$45,846
 $45,095
Current liabilities held for sale:   
Deferred Income$1,670
 $1,749
Total liabilities of the disposal group classified as held for sale$1,670
 $1,749

The following table presents a reconciliation of the major financial lines constituting the results of operations for discontinued operations to the net loss from discontinued operations presented separately in the consolidated statement of operations (in thousands):


59


MARVELL TECHNOLOGY GROUP LTD.
NOTES TO CONSOLIDATED FINANCIAL STATEMENTS — (Continued)

 Year Ended
 January 28, 2017 January 30, 2016 January 31, 2015
Net Revenue$98,755
 $76,612
 $69,757
Operating costs and expenses:     
     Cost of goods sold60,799
 52,219
 44,281
     Research and development53,784
 59,524
 67,263
     Selling and marketing4,750
 4,684
 4,325
     General and administrative963
 769
 795
     Amortization of acquired intangible assets325
 650
 650
          Total operating costs and expenses120,621
 117,846
 117,314
Loss from discontinued operations before income taxes(21,866) (41,234) (47,557)
Provision for income taxes977
 1,011
 884
Net loss from discontinued operations$(22,843) $(42,245) $(48,441)

The Company has elected not to separately report discontinued operations in its consolidated statement of cash flows since its effect is not material. Non-cash operating amounts reported for discontinued operations include share-based compensation expense of $9.2 million, $7.8 million and $6.2 million in fiscal 2017, 2016 and 2015, respectively. Depreciation, amortization and capital expenditures are not material and there were no other material non-cash investing amounts related to the cash flows from discontinued operations. Due to the Company's transfer pricing arrangements, the Company generates income in most jurisdictions in which it operates, regardless if there is a loss on a consolidated basis. As such, the Company has reflected tax expense of $1.0 million, $1.0 million, and $0.9 million for fiscal years 2017, 2016, and 2015, respectively, attributable to discontinued operations.

Note 3 — Investments

The following tables summarize the Company’s investments (in thousands):

   January 30, 2016 
   Amortized
Cost
   Gross
Unrealized
Gains
   Gross
Unrealized
Losses
  Estimated
Fair Value
 

Short-term investments:


Available-for-sale:


Corporate debt securities

  $558,337    $766    $(1,282 $557,821  

U.S. government and agency debt

   317,595     64     (254  317,405  

Asset backed securities

   76,711     81     (56  76,736  

Foreign government and agency debt

   21,370     2     (14  21,358  

Municipal debt securities

   31,211     45     (7  31,249  


Total short-term investments

   1,005,224     958     (1,613  1,004,569  

Long-term investments:


Available-for-sale:


Auction rate securities

   11,296     —       —      11,296  


Total long-term investments

   11,296     —       —      11,296  


Total investments

  $1,016,520    $958    $(1,613 $1,015,865  


   January 31, 2015 
   Amortized
Cost
   Gross
Unrealized
Gains
   Gross
Unrealized
Losses
  Estimated
Fair Value
 

Short-term investments:


Available-for-sale:


Corporate debt securities

  $983,008    $3,872    $(563 $986,317  

U.S. government and agency debt

   178,898     265     (7  179,156  

Asset backed securities

   91,432     108     (9  91,531  

Foreign government and agency debt

   28,051     61     (2  28,110  

Municipal debt securities

   33,421     47     (4  33,464  


Total short-term investments

   1,314,810     4,353     (585  1,318,578  

Long-term investments:


Available-for-sale:


Auction rate securities

   12,500     —       (2,274  10,226  


Total long-term investments

   12,500     —       (2,274  10,226  


Total investments

  $1,327,310    $4,353    $(2,859 $1,328,804  


 January 28, 2017
 
Amortized
Cost
 
Gross
Unrealized
Gains
 
Gross
Unrealized
Losses
 
Estimated
Fair Value
Short-term investments:       
Available-for-sale:       
Corporate debt securities$432,603
 $281
 $(776) $432,108
U.S. government and agency debt185,584
 86
 (283) 185,387
Asset backed securities45,541
 33
 (47) 45,527
Foreign government and agency debt13,425
 
 (50) 13,375
Municipal debt securities27,916
 4
 (49) 27,871
Held-to-Maturity:       
Time deposits150,000
 
 
 150,000
Total short-term investments855,069
 404
 (1,205) 854,268
Long-term investments:       
Available-for-sale:       
Auction rate securities4,615
 
 
 4,615
Total long-term investments4,615
 
 
 4,615
Total investments$859,684
 $404
 $(1,205) $858,883

60


MARVELL TECHNOLOGY GROUP LTD.
NOTES TO CONSOLIDATED FINANCIAL STATEMENTS — (Continued)

 January 30, 2016
 
Amortized
Cost
 
Gross
Unrealized
Gains
 
Gross
Unrealized
Losses
 
Estimated
Fair Value
Short-term investments:       
Available-for-sale:       
Corporate debt securities$558,337
 $766
 $(1,282) $557,821
U.S. government and agency debt317,595
 64
 (254) 317,405
Asset backed securities76,711
 81
 (56) 76,736
Foreign government and agency debt21,370
 2
 (14) 21,358
Municipal debt securities31,211
 45
 (7) 31,249
Total short-term investments1,005,224
 958
 (1,613) 1,004,569
Long-term investments:       
Available-for-sale:       
Auction rate securities11,296
 
 
 11,296
Total long-term investments11,296
 
 
 11,296
Total investments$1,016,520
 $958
 $(1,613) $1,015,865
As of January 30, 2016,28, 2017, the Company’s investment portfolio included auction rate securities with an aggregate par value of $12.5$5 million. Although these auction rate securities have continued to pay interest and the underlying collateral has not deteriorated, there is currently limited trading volume in the securities.volume. The Company uses a discounted cash flow model to estimate the fair value of the auction rate securities based on its estimated timing and amount of future interest and principal payments. In developing the discounted cash flow model, the Company considers the credit quality and liquidity of the underlying securities and related issuer, the collateralization of underlying security investments and other considerations. The fair value of the auction rate securities as of January 30, 201628, 2017 was $1.2$0.4 million less than the par value and is included in long-term investments.

MARVELL TECHNOLOGY GROUP LTD.

NOTES TO CONSOLIDATED FINANCIAL STATEMENTS — (Continued)

In

The Company made a determination in January 2016 that it did not expect to recover the Company determinedpar value of these auction rate securities would more likely than notand considers any impairment of these securities to be sold as part of a general requirement to raise liquidity. Basedother-than-temporary. There has been no change in circumstances since January 2016 based upon the shortenedcurrent time horizon for holding these auction rate securities and the continuation of an illiquid market,market. Based on the Company's assessment of fair value as of January 28, 2017, the Company does not expect to recover the par value of the securities and considers thedetermined there was no further impairment of these auction rate securities.
During fiscal 2017, the Company sold auction rate securities to be other-than-temporary. Aswith an aggregate par value of $7.5 million for total net proceeds of $6.9 million. The carrying value of these auction rate securities was $6.7 million and resulted in a result, an impairment lossnet gain of $1.2$0.2 million was recorded in interest and other income, net, in the consolidated statements of operations.

year ended January 28, 2017.

Gross realized gains and gross realized losses on sales of available-for-sale securities are presented in the following table (in thousands):

   Year Ended 
   January 30,
2016
  January 31,
2015
  February 1,
2014
 

Gross realized gains

  $1,654   $1,618   $1,567  

Gross realized losses

   (1,923  (169  (268

Impairment loss

   (1,204  —      —    


Total net realized gains (losses)

  $(1,473 $1,449   $1,299  


 Year Ended
 January 28,
2017
 January 30,
2016
 January 31,
2015
Gross realized gains$2,047
 $1,654
 $1,618
Gross realized losses(547) (1,923) (169)
Impairment loss
 (1,204) 
Total net realized gains (losses)$1,500
 $(1,473) $1,449
The contractual maturities of available-for-sale securities are presented in the following table (in thousands):

   January 30, 2016   January 31, 2015 
   Amortized
Cost
   Estimated
Fair Value
   Amortized
Cost
   Estimated
Fair Value
 

Due in one year or less

  $304,117    $304,035    $361,108    $361,396  

Due between one and five years

   689,847     689,279     950,702     954,151  

Due over five years

   22,556     22,551     15,500     13,257  


  $1,016,520    $1,015,865    $1,327,310    $1,328,804  


 January 28, 2017 January 30, 2016
 
Amortized
Cost
 
Estimated
Fair Value
 
Amortized
Cost
 
Estimated
Fair Value
Due in one year or less$423,151
 $423,058
 $304,117
 $304,035
Due between one and five years423,669
 422,995
 689,847
 689,279
Due over five years12,864
 12,830
 22,556
 22,551
 $859,684
 $858,883
 $1,016,520
 $1,015,865

61


MARVELL TECHNOLOGY GROUP LTD.
NOTES TO CONSOLIDATED FINANCIAL STATEMENTS — (Continued)

For individual securities that have been in a continuous unrealized loss position, the fair value and gross unrealized loss for these securities aggregated by investment category and length of time in an unrealized position are presented in the following tables (in thousands):

   January 30, 2016 
   Less than 12 months  12 months or more  Total 
   Fair
Value
   Unrealized
Loss
  Fair
Value
   Unrealized
Loss
  Fair
Value
   Unrealized
Loss
 

Corporate debt securities

  $283,138    $(1,237 $14,383    $(45 $297,521    $(1,282

U.S. government and agency debt

   263,325     (254  —       —      263,325     (254

Asset backed securities

   46,646     (56  —       —      46,646     (56

Foreign government and agency debt

   16,458     (14  —       —      16,458     (14

Municipal debt securities

   2,943     (5  1,571     (2  4,514     (7


Total securities

  $612,510    $(1,566 $15,954    $(47 $628,464    $(1,613


MARVELL TECHNOLOGY GROUP LTD.

NOTES TO CONSOLIDATED FINANCIAL STATEMENTS — (Continued)

   January 31, 2015 
   Less than 12 months  12 months or more  Total 
   Fair
Value
   Unrealized
Loss
  Fair
Value
   Unrealized
Loss
  Fair
Value
   Unrealized
Loss
 

Corporate debt securities

  $243,699    $(558 $2,005    $(5 $245,704    $(563

U.S. government and agency debt

   32,165     (7  —       —      32,165     (7

Asset backed securities

   25,053     (9  —       —      25,053     (9

Foreign government and agency debt

   2,999     (2  —       —      2,999     (2

Municipal debt securities

   2,845     (4  —       —      2,845     (4

Auction rate securities

   —       —      10,226     (2,274  10,226     (2,274


Total securities

  $306,761    $(580 $12,231    $(2,279 $318,992    $(2,859


 January 28, 2017
 Less than 12 months 12 months or more Total
 
Fair
Value
 
Unrealized
Loss
 
Fair
Value
 
Unrealized
Loss
 
Fair
Value
 
Unrealized
Loss
Corporate debt securities$199,382
 $(751) $16,063
 $(25) $215,445
 $(776)
U.S. government and agency debt94,064
 (283) 
 
 94,064
 (283)
Asset backed securities16,754
 (47) 
 
 16,754
 (47)
Foreign government and agency debt11,875
 (48) 1,499
 (2) 13,374
 (50)
Municipal debt securities17,450
 (47) 1,248
 (2) 18,698
 (49)
Total securities$339,525
 $(1,176) $18,810
 $(29) $358,335
 $(1,205)
 January 30, 2016
 Less than 12 months 12 months or more Total
 
Fair
Value
 
Unrealized
Loss
 
Fair
Value
 
Unrealized
Loss
 
Fair
Value
 
Unrealized
Loss
Corporate debt securities$283,138
 $(1,237) $14,383
 $(45) $297,521
 $(1,282)
U.S. government and agency debt263,325
 (254) 
 
 263,325
 (254)
Asset backed securities46,646
 (56) 
 
 46,646
 (56)
Foreign government and agency debt16,458
 (14) 
 
 16,458
 (14)
Municipal debt securities2,943
 (5) 1,571
 (2) 4,514
 (7)
Total securities$612,510
 $(1,566) $15,954
 $(47) $628,464
 $(1,613)
Note 4 — Supplemental Financial Information (in thousands)

Consolidated Balance Sheets

   January 30,
2016
   January 31,
2015
 

Cash and cash equivalents:


Cash

  $669,312    $864,680  

Cash equivalents:


Time deposits

   209,405     213,012  

U.S. government and agency debt

   184,374     —    

Corporate debt securities

   54,689     21,999  

Money market funds

   160,400     111,286  


Cash and cash equivalents

  $1,278,180    $1,210,977  


   January 30,
2016
   January 31,
2015
 

Provision for sales returns and allowances:


Sales returns

  $1,873    $899  

Doubtful accounts

   889     1,213  


  $2,762    $2,112  


   January 30,
2016
   January 31,
2015
 

Inventories:


Work-in-process

  $131,471    $183,869  

Finished goods

   78,546     124,293  


Inventories

  $210,017    $308,162  


 January 28,
2017
 January 30,
2016
Cash and cash equivalents:   
Cash$651,953
 $669,312
Cash equivalents:   
Time deposits67,000
 209,405
U.S. government and agency debt17,497
 184,374
Money market funds36,122
 160,400
Corporate debt securities31,280
 54,689
Municipal debt securities8,740
 
Foreign government and agency debt1,500
 
Cash and cash equivalents$814,092
 $1,278,180
 January 28,
2017
 January 30,
2016
Provision for sales returns and allowances:   
Sales returns$470
 $1,873
Doubtful accounts914
 889
 $1,384
 $2,762


62


MARVELL TECHNOLOGY GROUP LTD.

NOTES TO CONSOLIDATED FINANCIAL STATEMENTS — (Continued)

   January 30,
2016
   January 31,
2015
 

Property and equipment, net:


Machinery and equipment

  $578,627    $601,961  

Buildings

   144,320     144,320  

Computer software

   102,928     99,312  

Land

   53,373     53,373  

Building improvements

   49,927     49,753  

Leasehold improvements

   50,192     51,434  

Furniture and fixtures

   27,119     27,883  

Construction in progress

   1,353     6,167  


   1,007,839     1,034,203  

Less: Accumulated depreciation

   (708,299   (693,564


Property and equipment, net

  $299,540    $340,639  


 January 28,
2017
 January 30,
2016
Inventories:   
Work-in-process$110,083
 $125,800
Finished goods61,886
 75,158
Inventories$171,969
 $200,958

Inventory held by third-party logistics providers is recorded as consigned inventory on the Company’s consolidated balance sheet. The amount of inventory held at third-party logistics providers was $26.5 million and $21.0 million at January 28, 2017 and January 30, 2016, respectively.

 January 28,
2017
 January 30,
2016
Property and equipment, net:   
Machinery and equipment$578,248
 $575,954
Buildings and building improvements194,290
 194,247
Computer software99,186
 102,840
Land53,373
 53,373
Leasehold improvements49,004
 50,192
Furniture and fixtures23,903
 27,118
Construction in progress11,240
 1,353
 1,009,244
 1,005,077
Less: Accumulated depreciation(765,847) (708,299)
Property and equipment, net$243,397
 $296,778
The Company recorded depreciation expense of $82.4 million, $73.8 million $78.3 million and $77.2$78.3 million for fiscal 2017, 2016 and 2015, and 2014, respectively.

   January 30,
2016
   January 31,
2015
 

Other non-current assets:


Technology and other licenses

  $48,770    $61,217  

Deferred tax assets

   34,505     22,273  

Investments in privately-held companies

   5,804     9,267  

Prepaid land use rights

   13,123     13,432  

Deposits

   51,512     7,903  

Other

   10,996     14,747  


Other non-current assets

  $164,710    $128,839  


 January 28,
2017
 January 30,
2016
Other non-current assets:   
Technology and other licenses$53,254
 $48,091
Deferred tax assets26,608
 34,505
Investments in privately-held companies5,787
 5,804
Prepaid land use rights12,810
 13,123
Deposits3,756
 51,512
Other11,109
 10,996
Other non-current assets$113,324
 $164,031
Amortization of technology and other licenses was $25.5 million, $26.4 million $27.9 million and $25.6$27.9 million in fiscal 2016, 2015 and 2014, respectively. During fiscal2017, 2016 and fiscal 2014,2015, respectively. In connection with its restructuring plan announced in November 2016, the Company recorded the impairment of a charge$45.0 million nonrefundable deposit due to non-utilization of $3.5 and $1.5 million, respectively, to write down investments in privately-held companies that were considered to be impaired. There were no such charges recordedthe related contract in fiscal 2015.

   January 30,
2016
   January 31,
2015
 

Accrued liabilities:


Accrued rebates

  $41,320    $39,105  

Accrued royalties

   16,217     24,680  

Technology license obligations

   17,985     14,428  

Accrued legal expense

   9,761     8,327  

Accrued litigation

   3,830     1,700  

Other

   42,947     43,148  


Accrued liabilities

  $132,060    $131,388  


2017.


63


MARVELL TECHNOLOGY GROUP LTD.

NOTES TO CONSOLIDATED FINANCIAL STATEMENTS — (Continued)

   January 30,
2016
   January 31,
2015
 

Deferred income:


Net deferred revenue

  $77,935    $98,444  

Deferred cost of goods sold

   (22,213   (30,324


Deferred income

  $55,722    $68,120  


   January 30,
2016
   January 31,
2015
 

Other non-current liabilities:


Technology license obligations

  $12,461    $16,468  

Long-term accrued employee compensation

   6,078     4,610  

Other

   8,424     11,115  


Other non-current liabilities

  $26,963    $32,193  


 January 28,
2017
 January 30,
2016
Accrued liabilities:   
Accrued rebates$26,095
 $41,320
Restructuring liability23,150
 3,842
Accrued royalties17,349
 16,217
Technology license obligations21,905
 17,985
Accrued legal expense5,127
 9,761
Other49,865
 42,935
Accrued liabilities$143,491
 $132,060
 January 28,
2017
 January 30,
2016
Deferred income:   
Net deferred revenue$93,148
 $75,541
Deferred cost of goods sold(25,024) (21,568)
Deferred income$68,124
 $53,973
 January 28,
2017
 January 30,
2016
Other non-current liabilities:   
Technology license obligations$14,949
 $12,461
Long-term accrued employee compensation4,075
 6,078
Deferred tax liabilities38,777
 1,098
Other6,136
 7,326
Other non-current liabilities$63,937
 $26,963
Accumulated other comprehensive income (loss):

The changes in accumulated other comprehensive income (loss) by components are presented in the following tables (in thousands):

   Unrealized
Gain
(Loss) on
Marketable
Securities
  Unrealized
Gain
(Loss) on
Auction
Rate
Securities
  Unrealized
Gain
(Loss) on
Cash Flow
Hedges
  Total 

Balance at February 1, 2014

  $2,534   $(2,871 $934   $597  

Other comprehensive income (loss) before reclassifications

   2,479    85    (2,338  226  

Amounts reclassified from accumulated other comprehensive income

   (1,245  512    218    (515


Net current-period other comprehensive income (loss), net of tax

   1,234    597    (2,120  (289


Balance at January 31, 2015

   3,768    (2,274  (1,186  308  

Other comprehensive income (loss) before reclassifications

   (3,838  —      1,111    (2,727

Amounts reclassified from accumulated other comprehensive income

   (586  2,274    (64  1,624  


Net current-period other comprehensive income (loss), net of tax

   (4,424  2,274    1,047    (1,103


Balance at January 30, 2016

  $(656 $—     $(139 $(795


MARVELL TECHNOLOGY GROUP LTD.

NOTES TO CONSOLIDATED FINANCIAL STATEMENTS — (Continued)

 
Unrealized
Gain
(Loss) on
Marketable
Securities
 
Unrealized
Loss on
Auction
Rate
Securities
 
Unrealized
Gain
(Loss) on
Cash Flow
Hedges
 Total
Balance at January 31, 2015$3,768
 $(2,274) $(1,186) $308
Other comprehensive income (loss) before reclassifications(3,838) 
 1,111
 (2,727)
Amounts reclassified from accumulated other comprehensive income (loss)(586) 2,274
 (64) 1,624
Net current-period other comprehensive income (loss), net of tax(4,424) 2,274
 1,047
 (1,103)
Balance at January 30, 2016(656) 
 (139) (795)
Other comprehensive income before reclassifications1,766
 
 1,496
 3,262
Amounts reclassified from accumulated other comprehensive income(1,911) 
 (533) (2,444)
Net current-period other comprehensive income (loss), net of tax(145) 
 963
 818
Balance at January 28, 2017$(801) $
 $824
 $23
The amounts reclassified from accumulated other comprehensive income (loss) by components are presented in the following table (in thousands):

   Year Ended 

Affected Line Item in the
Statement of Operations

  January 30,
2016
  January 31,
2015
  February 1,
2014
 

Interest and other income, net:


Available-for-sale securities:


Marketable securities

  $586   $1,245   $1,139  

Auction rate securities

   (2,274  (512  —    

Operating costs and expenses:


Cash flow hedges:


Research and development

   48    (198  3,329  

Selling and marketing

   (1  (8  266  

General and administrative

   17    (12  24  


Total

  $(1,624 $515   $4,758  


Consolidated Statements of Operations

   Year Ended 
   January 30,
2016
  January 31,
2015
  February 1,
2014
 

Interest and other income, net:


Interest income

  $15,982   $11,370   $9,379  

Net realized gain (loss) on investments

   (1,473  1,449    1,299  

Currency translation gain

   6,655    1,871    8,739  

Other income (loss)

   (2,773  9,811    8,025  

Interest expense

   (706  (1,167  (1,876


  $17,685   $23,334   $25,566  


Consolidated Statements of Cash Flows

   Year Ended 
   January 30,
2016
   January 31,
2015
   February 1,
2014
 

Supplemental cash flow information:


Cash paid for interest

  $703    $1,167    $1,873  


Cash paid for income taxes, net

  $13,363    $15,727    $9,385  


Non-Cash Investing and Financing Activities:


Unsettled trades of available-for-sale securities

  $53,749    $—     $—   


Purchase of intellectual property under license obligations

  $13,800    $—     $8,900  


Unpaid purchase of property and equipment at end of year

  $9,069    $7,083    $7,285  


64


MARVELL TECHNOLOGY GROUP LTD.

NOTES TO CONSOLIDATED FINANCIAL STATEMENTS — (Continued)


 Year Ended
Affected Line Item in the Statement of OperationsJanuary 28,
2017
 January 30,
2016
 January 31,
2015
Interest and other income, net:     
Available-for-sale securities:     
Marketable securities$1,911
 $586
 $1,245
Auction rate securities
 (2,274) (512)
Operating costs and expenses:     
Cash flow hedges:     
Research and development467
 48
 (198)
Selling and marketing10
 (1) (8)
General and administrative56
 17
 (12)
Total$2,444
 $(1,624) $515
Consolidated Statements of Operations
 Year Ended
 January 28,
2017
 January 30,
2016
 January 31,
2015
Interest and other income, net:     
Interest income$13,198
 $15,982
 $11,370
Net realized gain (loss) on investments1,500
 (1,473) 1,449
Currency translation gain1,746
 6,655
 1,871
Other income (loss)946
 (2,773) 9,811
Interest expense(368) (706) (1,167)
 $17,022
 $17,685
 $23,334
Consolidated Statements of Cash Flows
 Year Ended
 January 28,
2017
 January 30,
2016
 January 31,
2015
Supplemental cash flow information:     
Cash paid for interest$363
 $703
 $1,167
Cash paid for income taxes, net$17,032
 $13,363
 $15,727
Non-Cash Investing and Financing Activities:     
Purchase of intellectual property under license obligations$27,081
 $13,800
 $
Unsettled trade receivable of available-for-sale securities$7,742
 $53,749
 $
Unsettled trade payable of available-for-sale securities$15,371
 $
 $
Unpaid purchase of property and equipment at end of year$2,547
 $9,069
 $7,083
Unpaid repurchases of our common shares$1,499
 $
 $

Net income (loss) per share

The Company reports both basic net income (loss) per share, which is based on the weighted average number of common shares outstanding during the period, and diluted net income (loss) per share, which is based on the weighted average number of common shares outstanding and potentially dilutive shares outstanding during the period. The computations of basic and diluted net income (loss) per share are presented in the following table (in thousands, except per share amounts):

   Year Ended 
   January 30,
2016
  January 31,
2015
   February 1,
2014
 

Numerator:


Net income (loss)

  $(811,400 $435,346    $315,320  


Denominator:


Weighted average shares — basic

   510,945    511,089     496,518  

Effect of dilutive securities:


Share-based awards

   —      9,671     7,895  


Weighted average shares — diluted

   510,945    520,760     504,413  


Net income (loss) per share:


Basic

  $(1.59 $0.85    $0.64  

Diluted

  $(1.59 $0.84    $0.63  


65


MARVELL TECHNOLOGY GROUP LTD.
NOTES TO CONSOLIDATED FINANCIAL STATEMENTS — (Continued)

 Year Ended
 January 28,
2017
 January 30,
2016
 January 31,
2015
Numerator:     
Income (loss) from continuing operations$43,994
 $(769,155) $483,787
Loss from discontinued operations(22,843) (42,245) (48,441)
Net income (loss)$21,151
 $(811,400) $435,346
Denominator:     
Weighted average shares — basic509,738
 510,945
 511,089
Effect of dilutive securities:     
Share-based awards7,775
 
 9,671
Weighted average shares — diluted517,513
 510,945
 520,760
Income (loss) from continuing operations per share:     
     Basic$0.09
 $(1.51) $0.95
     Diluted$0.09
 $(1.51) $0.93
Loss from discontinued operations per share:     
     Basic$(0.05) $(0.08) $(0.10)
     Diluted$(0.05) $(0.08) $(0.09)
Net income (loss) per share:     
     Basic$0.04
 $(1.59) $0.85
     Diluted$0.04
 $(1.59) $0.84
Potential dilutive securities include dilutive common shares from share-based awards attributable to the assumed exercise of stock options, restricted stock units and employee stock purchase plan shares using the treasury stock method. Under the treasury stock method, potential common shares outstanding are not included in the computation of diluted net income per share, if their effect is anti-dilutive.

Anti-dilutive potential shares are presented in the following table (in thousands):

   Year Ended 
   January 30,
2016
   January 31,
2015
   February 1,
2014
 

Weighted average shares outstanding:


Share-based awards

   64,420     35,636     40,504  


Anti-dilutive potential shares from share-based awards are excluded from the calculation of diluted earnings per share for the year ended January 30, 2016 due to the net loss reported in that period.

 Year Ended
 January 28, 2017 January 30, 2016 January 31, 2015
Weighted average shares outstanding:     
Share-based awards22,642
 64,420
 35,636

Anti-dilutive potential shares from share-based awards are excluded from the calculation of diluted earnings per share for all other periods reported above because either their exercise price exceeded the average market price during the period or the share-based awards were determined to be anti-dilutive based on applying the treasury stock method.

Anti-dilutive potential shares from share-based awards are also excluded from the calculation of diluted earnings per share for the year ended January 30, 2016 due to the net loss reported in fiscal 2016.

Note 5 — Derivative Financial Instruments

The Company manages some of its foreign currency exchange rate risk through the purchase of foreign currency exchange contracts that hedge against the short-term effect of currency fluctuations. The Company’s policy is to enter into foreign currency forward contracts with maturities less than 12 months that mitigate the effect of rate fluctuations on certain local currency denominated operating expenses. All derivative instruments are recorded at fair value in either prepaid expenses and other current assets or accrued liabilities. The Company reports cash flows from derivative instruments in cash flows from operating activities. The Company uses quoted prices to value its derivative instruments.

MARVELL TECHNOLOGY GROUP LTD.

NOTES TO CONSOLIDATED FINANCIAL STATEMENTS — (Continued)


The notional amounts of outstanding forward contracts were as follows (in thousands):

   Buy Contracts 
   January 30,
2016
   January 31,
2015
 

Israeli shekel

  $19,082    $51,326  


66


MARVELL TECHNOLOGY GROUP LTD.
NOTES TO CONSOLIDATED FINANCIAL STATEMENTS — (Continued)

 Buy Contracts
 January 28,
2017
 January 30,
2016
Israeli shekel$63,523
 $19,082
Cash Flow Hedges. The Company designates and documents its foreign currency forward exchange contracts as cash flow hedges for certain operating expenses. The Company evaluates and calculates the effectiveness of each hedge at least quarterly. The effective change is recorded in accumulated other comprehensive income and is subsequently reclassified to operating expense when the hedged expense is recognized. Ineffectiveness is recorded in interest and other income, net.

Other Foreign Currency Forward Contracts. The Company may enter into foreign currency forward exchange contracts to hedge certain assets and liabilities denominated in various foreign currencies that it does not designate as hedges for accounting purposes. The maturities of these contracts are generally less than 12 months. Gains or losses arising from the remeasurement of these contracts to fair value each period are recorded in interest and other income, net.

The fair value of foreign currency exchange contracts was not significant as of any period presented.

The following table provides information about gains (losses) associated with our derivative financial instruments (in thousands):


Location of Gains (Losses)
in Statement of Operations

  Amount of Gains (Losses) in Statement
of Operations for the Year Ended
 
     January 30,
2016
  January 31,
2015
  February 1,
2014
 

Derivatives designated as cash flow hedges:


Forward contracts:

  Research and development  $(390 $(1,930 $3,099  
  Selling and marketing   (5  (24  23  
  General and administrative   (26  (157  246  


    $(421 $(2,111 $3,368  


Location of Gains (Losses)
in Statement of Operations
 
Amount of Gains (Losses) in Statement
of Operations for the Year Ended
 January 28,
2017
 January 30,
2016
 January 31,
2015
Derivatives designated as cash flow hedges:       
Forward contracts:Research and development $737
 $(390) $(1,930)
 Selling and marketing 15
 (5) (24)
 General and administrative 86
 (26) (157)
   $838
 $(421) $(2,111)
The portion of gains (losses) excluded from the assessment of hedge effectiveness are included in interest and other income, net, and these amounts were $0.1$(0.3) million, $0.2$(0.1) million and $0.5$0.2 million in fiscal 2017, 2016 2015 and 2014,2015, respectively. In addition, realized losses from forward contracts that are not designated as hedging instruments that are included in interest and other income, net, were not material in fiscal 2017, 2016 2015 and 2014.2015. The Company also reports hedge ineffectiveness from derivative financial instruments in current earnings, which were not material in fiscal 2017, 2016 2015 and 2014.2015. No cash flow hedges were terminated as a result of forecasted transactions that did not occur.

Note 6 — Fair Value Measurements

Fair value is an exit price representing the amount that would be received in the sale of an asset or paid to transfer a liability in an orderly transaction between market participants. As such, fair value is a market-based measurement that should be determined based on assumptions that market participants would use in pricing an

MARVELL TECHNOLOGY GROUP LTD.

NOTES TO CONSOLIDATED FINANCIAL STATEMENTS — (Continued)

asset or a liability. As a basis for considering such assumptions, the accounting guidance establishes a three-tier value hierarchy, which prioritizes the inputs used in the valuation methodologies in measuring fair value:

Level 1 — Observable inputs that reflect quoted prices for identical assets or liabilities in active markets.

Level 2 — Other inputs that are directly or indirectly observable in the marketplace.

Level 3 — Unobservable inputs that are supported by little or no market activity.

The fair value hierarchy also requires an entity to maximize the use of observable inputs and minimize the use of unobservable inputs when measuring fair value.

The Company’s Level 1 assets include institutional money-market funds that are classified as cash equivalents and marketable investments in U.S. government and agency debt, which are valued primarily using quoted market prices. The Company’s Level 2 assets include its marketable investments in time deposits, corporate debt securities, foreign government and agency debt, municipal debt securities and asset backbacked securities as the market inputs used to value these instruments consist of market yields, reported trades and broker/dealer quotes, which are corroborated with observable market data. In addition, foreign currency forward contracts, and the severance pay fund are classified as Level 2 assets as the valuation inputs are based on quoted prices and market observable data of similar instruments. The Company’s investments in auction rate securities are

67


MARVELL TECHNOLOGY GROUP LTD.
NOTES TO CONSOLIDATED FINANCIAL STATEMENTS — (Continued)

classified as Level 3 assets because there are currently no active markets for the auction rate securities and consequently the Company is unable to obtain independent valuations from market sources. TheTherefore, the auction rate securities are valued using a discounted cash flow model. Some of the inputs to the discounted cash flow model are unobservable in the market. The total amount of assets measured using Level 3 valuation methodologies represented 0.2% of total assets as of January 30, 2016.

MARVELL TECHNOLOGY GROUP LTD.

NOTES TO CONSOLIDATED FINANCIAL STATEMENTS — (Continued)

The tables below set forth, by level, the Company’s financial assets and liabilities that were accounted forare measured at fair value as of January 30, 2016 and January 31, 2015.on a recurring basis. The tables do not include assets and liabilities that are measured at historical cost or any basis other than fair value (in thousands):

   Fair Value Measurements at January 30, 2016 
    Level 1   Level 2   Level 3   Total 

Items measured at fair value on a recurring basis:


Assets


Cash equivalents:


Money market funds

  $160,400    $—      $—      $160,400  

Time deposits

   —       209,405     —       209,405  

U.S. government and agency debt

   184,374     —       —       184,374  

Corporate debt securities

   —       54,689     —       54,689  

Short-term investments:


U.S. government and agency debt

   317,405     —       —       317,405  

Corporate debt securities

   —       557,821     —       557,821  

Asset backed securities

   —       76,736     —       76,736  

Foreign government and agency debt

   —       21,358     —       21,358  

Municipal debt securities

   —       31,249     —       31,249  

Prepaid expenses and other current assets:


Foreign currency forward contracts

   —       30     —       30  

Long-term investments:


Auction rate securities

   —       —       11,296     11,296  

Other non-current assets:


Severance pay fund

   —       678     —       678  


Total assets

  $662,179    $951,966    $11,296    $1,625,441  


Liabilities


Accrued liabilities:


Foreign currency forward contracts

  $—      $195    $—      $195  


 Fair Value Measurements at January 28, 2017
 Level 1 Level 2 Level 3 Total
Items measured at fair value on a recurring basis:       
Assets       
Cash equivalents:       
Money market funds$36,122
 $
 $
 $36,122
Time deposits
 67,000
 
 67,000
U.S. government and agency debt17,497
 
 
 17,497
Corporate debt securities
 31,280
 
 31,280
Foreign government and agency debt
 1,500
 
 1,500
Municipal debt securities
 8,740
 
 8,740
Short-term investments:       
U.S. government and agency debt185,387
 
 
 185,387
Corporate debt securities
 432,108
 
 432,108
Asset backed securities
 45,527
 
 45,527
Foreign government and agency debt
 13,375
 
 13,375
Municipal debt securities
 27,871
 
 27,871
Time deposits
 150,000
 
 150,000
Prepaid expenses and other current assets:       
Foreign currency forward contracts
 735
 
 735
Long-term investments:       
Auction rate securities
 
 4,615
 4,615
Other non-current assets:       
Severance pay fund
 736
 
 736
Total assets$239,006
 $778,872
 $4,615
 $1,022,493
Liabilities       
Accrued liabilities:       
Foreign currency forward contracts$
 $58
 $
 $58

68


MARVELL TECHNOLOGY GROUP LTD.

NOTES TO CONSOLIDATED FINANCIAL STATEMENTS — (Continued)

   Fair Value Measurements at January 31, 2015 
    Level 1   Level 2   Level 3   Total 

Items measured at fair value on a recurring basis:


Assets


Cash equivalents:


Money market funds

  $111,286    $—      $—      $111,286  

Time deposits

   —       213,012     —       213,012  

Corporate debt securities

   —       21,999     —       21,999  

Short-term investments:


U.S. government and agency debt

   179,156     —       —       179,156  

Corporate debt securities

   —       986,317     —       986,317  

Asset backed securities

   —       91,531     —       91,531  

Foreign government and agency debt

   —       28,110     —       28,110  

Municipal debt securities

   —       33,464     —       33,464  

Prepaid expenses and other current assets:


Foreign currency forward contracts

   —       124     —       124  

Long-term investments:


Auction rate securities

   —       —       10,226     10,226  

Other non-current assets:


Severance pay fund

   —       1,758     —       1,758  


Total assets

  $290,442    $1,376,315    $10,226    $1,676,983  


Liabilities


Accrued liabilities:


Foreign currency forward contracts

  $—      $1,379    $—      $1,379  


In connection with the early buyout option under an operating lease for corporate equipment in March 2015 (see “Note 8 — Restructuring and Other Charges”), the Company had an asset that it measured and recorded at fair value on a non-recurring basis. Such corporate equipment had a fair value of $9.3 million as of August 1, 2015, the end of the second quarter of fiscal 2016. The corporate equipment was sold in October 2015, prior to the end of the third quarter of fiscal 2016.


 Fair Value Measurements at January 30, 2016
 Level 1 Level 2 Level 3 Total
Items measured at fair value on a recurring basis:       
Assets       
Cash equivalents:       
Money market funds$160,400
 $
 $
 $160,400
Time deposits
 209,405
 
 209,405
U.S. government and agency debt184,374
 
 
 184,374
Corporate debt securities
 54,689
 
 54,689
Short-term investments:       
U.S. government and agency debt317,405
 
 
 317,405
Corporate debt securities
 557,821
 
 557,821
Asset backed securities
 76,736
 
 76,736
Foreign government and agency debt
 21,358
 
 21,358
Municipal debt securities
 31,249
 
 31,249
Prepaid expenses and other current assets:       
Foreign currency forward contracts
 30
 
 30
Long-term investments:       
Auction rate securities
 
 11,296
 11,296
Other non-current assets:       
Severance pay fund
 678
 
 678
Total assets$662,179
 $951,966
 $11,296
 $1,625,441
Liabilities       
Accrued liabilities:       
Foreign currency forward contracts$
 $195
 $
 $195
The following table summarizes the change in fair values for Level 3 assets for the years ended January 28, 2017 and January 30, 2016 and January 31, 2015 (in thousands):

   Level 3 

Changes in fair value during the year (pre-tax):


Balance at February 1, 2014

  $16,279  

Sales, redemption and settlement

   (3,650

Transfer out

   (3,000

Unrealized gain included in accumulated other comprehensive income

   597  


Balance at January 31, 2015

   10,226  

Impairment loss

   (1,204

Unrealized gain included in accumulated other comprehensive income

   2,274  


Balance at January 30, 2016

  $11,296  


In November 2014, the Company received notification by the issuer

 Level 3
Changes in fair value during the year (pre-tax): 
Balance at January 31, 2015$10,226
Impairment loss(1,204)
Unrealized gain included in accumulated other comprehensive income2,274
Balance at January 30, 201611,296
Sales, redemption and settlement(6,681)
Unrealized gain included in accumulated other comprehensive income
Balance at January 28, 2017$4,615
There were no transfers of a mandatory full call of an auction rate security to be redeemed at par value and as a result, the security was classified within Level 2 based on the issuer’s quoted price. Subsequently, the auction rate security was fully redeemed at par value before the end ofassets between levels in either fiscal 2015.

MARVELL TECHNOLOGY GROUP LTD.

NOTES TO CONSOLIDATED FINANCIAL STATEMENTS — (Continued)

2017 or 2016.


Note 7 — Goodwill and Acquired Intangible Assets, Net

Goodwill

There was no activity for acquisitions or divestitures recorded to goodwill in fiscal 20162017 and 20152016 due to business combinations.

The Company has identified that its business operates as a single operating segment with two components that it has concluded can be aggregated into a single reporting unit. In connection with the restructuring plan the Company announced in November 2016 (see “Note 8 - Restructuring and Other Related Charges”), its Board of Directors approved a plan to sell certain businesses that are classified and reported in the consolidated statement of operations as discontinued operations. As a result, goodwill was allocated to these businesses based on relative fair value since each represents a portion of the Company’s

69


MARVELL TECHNOLOGY GROUP LTD.
NOTES TO CONSOLIDATED FINANCIAL STATEMENTS — (Continued)

reporting unit for which it(see "Note 2 - Discontinued Operations"). The Company obtained an independent valuation to determine the fair value of these businesses for purposes of allocating the goodwill and to complete a step onean assessment for goodwill impairment. Inimpairment of the third quarter of fiscal 2016,Company’s continuing operations. Although the Company performedengaged an impairment assessment for testing goodwill dueindependent valuation specialist to certain events and circumstancesprovide the fair value calculations, management considered could be indicators of potential impairment, which included the U.S. Court of Appealsassumed full responsibility for the Federal Circuit (“Federal Circuit”) panel’s decision in August 2015 related tovaluation results, and the CMU litigation (see “Note 10 —Commitmentsaccuracy and Contingencies”),completeness of the Company’s decision to significantly restructure its mobile platform business announced in September 2015 (see “Note 8 — Restructuringunderlying financial data and Other Related Charges”) and a significant decline in the Company’s stock price during fiscal 2016. As a result, the Company concluded there was no impairment of its goodwill.corresponding assumptions. The Company’s annual test for goodwill impairment as of the last day of the fourth quarter of fiscal 2016, also2017 did not result in any impairment charges since the excess of fair value over carrying amount for our reporting unit approximated 41% of its carrying amount.

charge.

Acquired Intangible Assets, Net

The carrying amounts of acquired intangible assets are as follows (in thousands):

     January 30, 2016  January 31, 2015 
  Range of
Useful Lives
  Gross
Carrying
Amounts
  Accumulated
Amortization
and
Write-Offs
  Net
Carrying
Amounts
  Gross
Carrying
Amounts
  Accumulated
Amortization
and
Write-Offs
  Net
Carrying
Amounts
 

Purchased and core technology

  4 - 8 years   $35,498   $(21,910 $13,588   $36,348   $(16,107 $20,241  

Trade names

  5 years    —      —      —      1,300    (828  472  

Customer intangibles

  5 - 7 years    28,600    (24,178  4,422    28,600    (18,615  9,985  


Total acquired intangible assets, net

  $64,098   $(46,088 $18,010   $66,248   $(35,550 $30,698  


   January 28, 2017 January 30, 2016
 
Range of
Useful Lives
 
Gross
Carrying
Amounts
 
Accumulated
Amortization
and
Write-Offs
 
Net
Carrying
Amounts
 
Gross
Carrying
Amounts
 
Accumulated
Amortization
and
Write-Offs
 
Net
Carrying
Amounts
Purchased and core technology4 - 8 years $25,798
 $(22,227) $3,571
 $25,798
 $(17,950) $7,848
Customer intangibles5 - 7 years 24,700
 (24,700) 
 24,700
 (20,601) 4,099
Total acquired intangible assets from continuing operations, net  $50,498
 $(46,927) $3,571
 $50,498
 $(38,551) $11,947
Intangible assets, along with the related accumulated amortization, are removed from the table above at the end of the fiscal year they become fully amortized. In fiscal 2016, the Company recorded charges of $0.3 million to write off core technology due to its decision to discontinue the related development project and $0.3 million to write off a trade name that it no longer intends to market. The Company recorded charges of $3.4 million to write off IPR&D in fiscal 2015 upon the Company’s decision to discontinue the related project and $8.1 million in fiscal 2014 for the impairment of an acquired intangible asset.project. These impairment charges are included in amortization and write-off of acquired intangible assets in the consolidated statements of operations.

MARVELL TECHNOLOGY GROUP LTD.

NOTES TO CONSOLIDATED FINANCIAL STATEMENTS — (Continued)

Based on the identified intangible assets recorded at January 30, 2016,28, 2017, the future amortization expense of identified intangibles excluding IPR&D for the next five fiscal years is as follows (in thousands):

Fiscal Year


2017

  $10,642  

2018

   5,508  

2019

   1,860  

2020 and thereafter

   —    


  $18,010  


Fiscal Year 
2018$3,571
2019 and thereafter
 $3,571
Note 8 — Restructuring and Other Related Charges

The following table provides a summary of restructuring and other related charges as presented in the Consolidated Statements of Operations (in thousands):

   Year Ended 
   January 30,
2016
   January 31,
2015
   February 1,
2014
 

Cost of goods sold

  $10,292    $—      $—    

Restructuring and other related charges

   53,251     10,438     4,732  

Write-off of acquired intangible assets

   —       3,386     —    


  $63,543    $13,824    $4,732  


   Year Ended 
   January 30,
2016
   January 31,
2015
   February 1,
2014
 

Severance and related costs

  $43,926    $5,181    $2,786  

Facilities and related costs

   1,407     1,924     1,672  

Loss on early contract termination

   1,644     3,230     —    

Other exit-related costs

   534     86     213  


   47,511     10,421     4,671  

Impairment and write-off of assets:


Inventory

   8,046     —       —    

Technology licenses

   1,250     —       —    

Equipment and other

   6,736     17     61  

Acquired intangible asset

   —       3,386     —    


  $63,543    $13,824    $4,732  


 Year Ended
 January 28,
2017
 January 30,
2016
 January 31,
2015
Cost of goods sold$
 $10,292
 $
Restructuring and other related charges105,186
 53,251
 10,438
Write-off of acquired intangible assets
 
 3,386
 $105,186
 $63,543
 $13,824

The following table presents details of charges recorded by the Company related to the restructuring actions described below (in thousands):

70


MARVELL TECHNOLOGY GROUP LTD.
NOTES TO CONSOLIDATED FINANCIAL STATEMENTS — (Continued)

 Year Ended
 January 28,
2017
 January 30,
2016
 January 31,
2015
Severance and related costs$41,035
 $43,926
 $5,181
Facilities and related costs6,587
 1,407
 1,924
Loss on early contract termination
 1,644
 3,230
Other exit-related costs5,452
 534
 86
 53,074
 47,511
 10,421
Release of reserves:     
Severance(86) 
 
Other exit-related costs(383) 
 
      
Impairment and write-off of assets:     
Prepaid deposit45,000
 
 
Inventory
 8,046
 
Technology licenses629
 1,250
 
Equipment and other6,952
 6,736
 17
Acquired intangible asset
 
 3,386
 $105,186
 $63,543
 $13,824
Fiscal 2017.   The Company recorded $105.2 million of restructuring and other related charges in fiscal 2017 as described in the following paragraphs:
In November 2016, the Company announced a plan to restructure its operations to refocus its research and development, increase operational efficiency and improve profitability (see "Note 2 - Discontinued Operations"). The Company expects that the restructuring actions, which include discontinuing investment in specific research and development programs, streamlining engineering processes, and consolidating research and development sites, will eliminate approximately 900 positions worldwide. In addition, the Company plans to divest certain businesses (see “Note 3 - Discontinued Operations”). These actions began immediately following the announcement and are expected to be fully executed by the end of October 2017. As a result of these actions, the Company expects to incur charges of $90 million to $110 million through fiscal 2017, including cash charges of $35 million to $50 million. Restructuring and restructuring-related charges include an estimate of severance, asset impairment, lease termination fees and other costs.
The Company recorded restructuring and other related charges of $98.7 million in fiscal 2017 related to this restructuring plan announced in November 2016. The charges included $41.0 million of severance benefits, $5.5 million of other exit-related costs primarily related to contract cancellation penalties, $1.9 million of costs related to closing certain facilities, $45.0 million to fully impair a nonrefundable deposit due to the non-utilization of the related contract, and $5.4 million for the impairment of equipment and technology licenses. The Company is on track to complete activities related to this restructuring plan and expects to incur additional charges in fiscal 2018 since facilities related to the closure of certain operations have yet to be vacated and certain additional actions related to this restructuring plan have yet to occur. Estimated remaining costs are expected to be approximately $10 million to $15 million, which is in line with the Company's original estimated amount.
In connection with the restructuring of its mobile platform business in September 2015, substantially all of the remaining activities expected to be completed in the first half of fiscal 2017 were completed. As a result, the Company recorded a charge of $1.9 million in fiscal 2017, which included $2.2 million primarily for the write off of all remaining mobile-related equipment that was previously classified as held for sale that was offset by a net credit of $0.3 million, mainly due to the release of a reserve related to the loss on contract termination previously recognized in fiscal 2016. Total cumulative charges recorded through the end of fiscal 2017 related to this restructuring action were $46.4 million, which included $28.1 million of severance benefits, a $1.3 million loss on early contract termination, $8.8 million for impairment of technology licenses and certain equipment, $0.2 million related to facility closures and an $8.0 million write down of inventory. The total cumulative charges were lower than the original estimate of $100 million to $130 million primarily due to the Company’s decision to retain approximately 140 mobile employees to support the remaining mobile business than it originally anticipated and certain equipment planned for disposal was subsequently determined to have alternative use. The Company also offered retention bonuses to another 128 mobile employees to remain through the ramp down of certain operations. Their benefit packages were recognized ratably over the employees’ remaining service periods through the first half of fiscal 2017.


71


MARVELL TECHNOLOGY GROUP LTD.
NOTES TO CONSOLIDATED FINANCIAL STATEMENTS — (Continued)

In addition to the restructuring actions described in the preceding paragraph, the Company recorded charges of $4.6 million in the fiscal 2017, primarily for the remaining lease obligation, net of sublease income, upon vacating certain floors in one of its Israel facilities and ongoing operating expenses of vacated facilities related to restructuring actions in previous years.
Fiscal 2016.The Company recorded $63.5 million of restructuring and other related charges in fiscal 2016 as described in the following paragraphs.

In September 2015, the Company announced a significant restructuring of its mobile platform business in order to focus the mobile product line on more profitable opportunities and align its expenses with corporate targets. The Company began implementingimplemented actions to significantly downsize the mobile platform organization to refocus its technology to other emerging opportunities, but it will continue its commitment to wireless connectivity such as WiFi and other wireless standards.opportunities. As a result of these actions, the Company recorded restructuring and other related charges of $44.4 million in fiscal 2016 related to this restructuring. The charge

MARVELL TECHNOLOGY GROUP LTD.

NOTES TO CONSOLIDATED FINANCIAL STATEMENTS — (Continued)

primarily included severance benefits for 825 employees who were notified of their termination, a loss on early contract termination, the impairment of technology licenses and certain equipment, and the write down of inventory. Substantially all of the affected employees departed by the end of fiscal 2016.

The Company expects to complete remaining actions, including the finalization of certain additional related activities within the first half of fiscal 2017 and will incur additional charges of approximately $5 million. As a result, total restructuring and other related charges will be lower than the original estimate of $100 million to $130 million primarily due to the Company’s decision to retain approximately 140 more mobile employees to support the remaining mobile business than it originally anticipated and certain equipment planned for disposal was subsequently determined to have alternative use. The Company also decided to offer retention bonuses to another 128 mobile employees to remain through the ramp down of certain operations. Their benefit packages are recognized ratably over the employees’ remaining service periods through the first half of fiscal 2017.

In May 2015, the Company decided to further reduce its research and development operations in Israel and close certain other design centers, primarily located in Europe and the U.S. in connection with its ongoing effort to streamline its business. As a result, the Company recorded a total $16.3 million charge in fiscal 2016 comprised of $15.1 million for severance related to the termination of 358 employees who were notified of their termination and $1.2 million for a lease obligation related to a facility that the Company vacated in July 2015. Substantially all of the activities associated with these actions were completed and all affected employees departed before the end of fiscal 2016.

In March 2015, the Company exercised the early buyout option under an existing operating lease for corporate equipment that it planned to sell as part of a cost reduction action. The Company actively sought a buyer and classified the equipment as held for sale within prepaid and current assets on the consolidated balance sheet. It also ceased depreciation on the asset and recorded impairment charges of $1.4 million through the second quarter ended August 1, 2015. In October 2015, the Company sold the corporate equipment for net proceeds of $9.3 million, which approximated the carrying value and resulted in no gain or loss recognized upon the sale of the asset.

In addition to the restructuring actions described in the preceding paragraphs, the Company recorded $1.4 million of additional charges primarily associated with ongoing operating expenses of vacated facilities related to restructuring actions in previous fiscal years and maintenance costs for the corporate equipment sold in October 2015.

Fiscal 2015.The Company decided to streamline its operations, primarily in Israel, to align with its overall strategic plan, and to discontinue the development of a product it originally acquired in a business combination. As a result, the Company recorded $13.8 million of restructuring and other related charges in fiscal 2015. Facilities and related costs primarily included a charge for a portion of the lease obligation related to vacating the floors the Company no longer planned to occupy in one of its Israel facilities. The write-off of an acquired intangible asset in fiscal 2015 was due to the Company’s decision to discontinue the related project. These actions were substantially completed by the end of fiscal 2015. In addition, the Company decided to exercise an early buy out option to acquire an asset under an existing operating lease agreement, and recorded a $3.2 million loss from the termination of the agreement in fiscal 2015.

Fiscal 2014.    The Company recorded $4.7 million of restructuring and other related charges in fiscal 2014 in connection with its decision to close two sites. As a result, the Company incurred severance and exit-related costs in connection with vacating the facilities, in addition to the write-off of equipment. All activities were substantially completed by the end of fiscal 2014.

MARVELL TECHNOLOGY GROUP LTD.

NOTES TO CONSOLIDATED FINANCIAL STATEMENTS — (Continued)

The following table sets forth a reconciliation of the beginning and ending restructuring liability balances by each major type of costs associated with the restructuring charges (in thousands):

   Severance
and Related
Costs
  Facilities
and Related
Costs
  Other
Exit-Related
Costs
  Total 

Balance at February 1, 2014

  $51   $2,383   $19   $2,453  

Restructuring charges

   5,181    1,924    3,316    10,421  

Net cash payments

   (5,232  (2,968  (105  (8,305


Balance at January 31, 2015

   —      1,339    3,230    4,569  

Restructuring charges

   43,926    1,407    2,178    47,511  

Net cash payments

   (42,741  (1,597  (3,764  (48,102

Exchange rate adjustment

   (30  (106  —      (136


Balance at January 30, 2016

  $1,155   $1,043   $1,644   $3,842  


72


MARVELL TECHNOLOGY GROUP LTD.
NOTES TO CONSOLIDATED FINANCIAL STATEMENTS — (Continued)

 November 2016 Restructuring Mobile & Other Prior Restructuring  
 Severance and related costs Facilities and related costs Other exit-related costs Severance and related costs Facilities and related costs Other exit-related costs Total
Balance at January 31, 2015$
 $
 $
 $
 $1,339
 $3,230
 $4,569
   Cost reduction charges
 
 
 43,926
 1,407
 2,178
 47,511
   Cash payments
 
 
 (42,741) (1,567) (3,764) (48,072)
   Exchange rate adjustment
 
 
 (30) (106) 
 (136)
Balance at January 30, 2016
 
 
 1,155
 1,043
 1,644
 3,842
   Cost reduction charges41,020
 1,872
 5,452
 15
 4,715
 
 53,074
   Cash payments(24,065) (110) (829) (1,082) (5,112) (1,261) (32,459)
   Release of reserves
 
 
 (86) 
 (383) (469)
   Exchange rate adjustment45
 1
 2
 (2) 65
 
 111
Balance at January 28, 201717,000
 1,763
 4,625
 
 711
 
 24,099
Less: non-current portion
 (949) 


 (949)
Current portion$17,000
 $814
 $4,625
 $
 $711
 $
 $23,150

During fiscal 2016,2017, the Company paid severance and related benefit costs to a total of 1,191approximately 500 employees who departed in fiscal 20162017 as part of the restructuring actions described above. The remaining severance represents termination benefits determined to have been established under a substantive ongoing benefit arrangement for which payment was considered probable due to the timing of notification to certain additional employee groups after the end of fiscal 2017 and is expected to be paid within the first half of fiscal 2017.2018. The balance at January 30, 201628, 2017 for facility and related costs includes remaining payments under lease obligations related to vacated space that are expected to be paid through fiscal 2018.2019. Other exit-related costs are expected to be paid in the first quarter of fiscal 2017.

2018.

Note 9 — Income Taxes

The U.S. and non-U.S. components of income (loss) before income taxes of continuing operations consist of the following (in thousands):

   Year Ended 
   January 30,
2016
  January 31,
2015
   February 1,
2014
 

U.S. operations

  $33,787   $31,942    $31,339  

Non-U.S. operations

   (832,841  400,211     274,918  


  $(799,054 $432,153    $306,257  


 Year Ended
 January 28,
2017
 January 30,
2016
 January 31,
2015
U.S. operations$30,889
 $32,433
 $30,607
Non-U.S. operations86,127
 (790,253) 449,103
 $117,016
 $(757,820) $479,710
The provision (benefit) for income taxes consists of the following (in thousands):

   Year Ended 
   January 30,
2016
   January 31,
2015
   February 1,
2014
 

Current income tax provision (benefit):


Federal

  $10,756    $9,096    $5,774  

State

   83     (161   73  

Foreign

   (4,589   785     (18,829


Total current income tax provision (benefit)

   6,250     9,720     (12,982


Deferred income tax provision (benefit):


Federal

   (4,355   (1,775   317  

State

   580     16     32  

Foreign

   9,871     (11,154   3,570  


Total deferred income tax provision (benefit)

   6,096     (12,913   3,919  


Total provision (benefit) for income taxes

  $12,346    $(3,193  $(9,063


73


MARVELL TECHNOLOGY GROUP LTD.

NOTES TO CONSOLIDATED FINANCIAL STATEMENTS — (Continued)

The income tax expense for fiscal 2016 includes current income tax liability of $14.5 million, an additional tax provision of $3.1 million related to a $15.4 million payment to the Company’s former Chief Executive Officer (see “Note 14 — Related Party Transactions”) and a $6.1 million reduction in net deferred tax assets that was primarily caused by the recognition of a valuation allowance against certain non-U.S. loss carryforwards that will not be realized in the foreseeable future. These expenses were offset by a net reduction in unrecognized tax benefits of $11.6 million that arose from the release of $20.6 million due to the settlement of an audit in a non-U.S. jurisdiction and the expiration of statutes of limitation in non-U.S. jurisdictions, net of a $9.0 million increase in current unrecognized tax benefits. The income tax benefit for fiscal 2015 includes the current income tax liability of $17.4 million plus a $7.4 million increase in current unrecognized tax benefit. These charges were offset by a reduction in unrecognized tax benefits that arose from the release of $16.4 million due to the expiration of statutes of limitation in non-U.S. jurisdictions and a $12.9 million increase in net deferred tax assets. The income tax benefit for fiscal 2014 included the current income tax liability of $13.2 million plus a $9.1 million increase in current unrecognized tax benefit which were offset by a reduction in unrecognized tax benefits that arose from the release of $31.8 million due to the expiration of statutes of limitation and the settlement of a tax audit in non-U.S. jurisdictions.


 Year Ended
 January 28,
2017
 January 30,
2016
 January 31,
2015
Current income tax provision (benefit):     
Federal$8,289
 $10,482
 $8,826
State180
 83
 (161)
Foreign19,916
 (5,326) 171
Total current income tax provision (benefit)28,385
 5,239
 8,836
Deferred income tax provision (benefit):     
Federal(5,062) (4,355) (1,775)
State(12) 580
 16
Foreign49,711
 9,871
 (11,154)
Total deferred income tax provision (benefit)44,637
 6,096
 (12,913)
Total provision (benefit) for income taxes$73,022
 $11,335
 $(4,077)

Deferred tax assets consist of the following (in thousands):

   January 30,
2016
   January 31,
2015
 

Deferred tax assets:


Federal and California research and other tax credits

  $414,662    $382,726  

Reserves and accruals

   35,200     35,538  

Share-based compensation

   4,476     4,502  

Net operating losses

   11,055     10,740  


Gross deferred tax assets

   465,393     433,506  

Valuation allowance

   (424,914   (382,796


Total deferred tax assets

   40,479     50,710  

Total deferred tax liabilities

   (7,073   (11,209


Net deferred tax assets

  $33,406    $39,501  


 January 28,
2017
 January 30,
2016
Deferred tax assets:   
Federal and California research and other tax credits$450,503
 $414,662
Reserves and accruals35,887
 35,200
Share-based compensation3,733
 4,476
Net operating losses5,361
 11,055
Gross deferred tax assets495,484
 465,393
Valuation allowance(456,541) (424,914)
Total deferred tax assets38,943
 40,479
Total deferred tax liabilities(51,112) (7,073)
Net deferred tax assets (liabilities)$(12,169) $33,406
As presented in the consolidated balance sheets as of January 30, 201628, 2017 and January 31, 2015,30, 2016, and in the table above, unrecognized tax benefits have been offset by deferred tax assets for certain net operating losses that are available to be used in the amount of $7.5 million and $6.3 million, and $4.2 million, respectively.

During fiscal 2016, deferred tax assets, net of a corresponding valuation allowance, decreased $6.1 million from the end of fiscal 2015, primarily due to a valuation allowance that was recorded against deferred tax assets in Israel. As of January 30, 2016 and January 31, 2015, the Company had $34.5 million and $22.3 million of deferred tax assets, respectively, classified as non-current included in other non-current assets on the consolidated balance sheet.

At the end of fiscal 2016,2017, the Company recorded a valuation allowance of $424.9$456.5 million which is an increase of $42.1$31.6 million from fiscal 2015.2016. The Company provided a full valuation allowance against its federal and various state research credits which it earns in excess of its current year tax liabilities, as well as a portion against its net operating loss carryforwards in the U.S. federal and California.California jurisdictions. Based on the available objectiveobjectively verifiable positive and negative evidence, the Company determined that it is more likely than not that these research credits and net operating losses will not be realized.realized in the future. The Company also provided a full valuation allowance against the deferred tax assets of a portion of its operations in Israel, which has cumulative losses in recent years and is not projecting sufficient future taxable income.

MARVELL TECHNOLOGY GROUP LTD.

NOTES TO CONSOLIDATED FINANCIAL STATEMENTS — (Continued)

income to realize the benefit of its deferred tax assets.

As of January 30, 2016,28, 2017, the Company had net operating loss carryforwards available to offset future taxable income of approximately $90.8$82.7 million, $1.6$1.4 million and $6.3 million for foreign, U.S. federal and state of California purposes, respectively. The federal carryforwards will expire in various fiscal years between 2022 and 2028, and the California carryforwards will expire at various fiscal years between 2018 and 2033, if not utilized before these years. The majority of the Company’s non-U.S. losses carry forward indefinitely. For U.S. federal income tax return purposes, the Company had research tax credit carryforwards of approximately $248.6$268.5 million that expire through fiscal 2036.2037. As of January 30, 2016,28, 2017, the Company had unused California research and tax credit carryforwards of approximately $260.6$279.4 million, which can be carryforwardcarried forward indefinitely. Included in the U.S. federal and California carryforward amounts are $59.8$63.0 million and $57.7$60.0 million, respectively, that are attributable to excess tax benefits from stock options. Upon realization, the benefit associated with these credits will increase additional paid-in capital. The Company also has research and investment tax credit carryforwards of approximately $21.6$24.3 million in other U.S. states that expire through fiscal 20312032 due to the statutes of limitation.


74


MARVELL TECHNOLOGY GROUP LTD.
NOTES TO CONSOLIDATED FINANCIAL STATEMENTS — (Continued)

The Company consists of a Bermuda parent holding company with various foreign and U.S. subsidiaries. The applicable statutory rate in Bermuda is zero for the Company for fiscal 2017, 2016, 2015 and 2014.2015. For purposes of the reconciliation between the provision (benefit) for income taxes at the statutory rate and the effective tax rate, a notional U.S. 35% rate is applied as follows:

   Year Ended 
   January 30,
2016
  January 31,
2015
  February 1,
2014
 

Provision at U.S. notional statutory rate

   35.0  35.0  35.0

Non-deductible share-based compensation

   (5.9  11.2    19.4  

Difference in U.S. and non-U.S. tax rates

   (31.3  (46.0  (55.8

Benefits from utilization of general business credits

   5.0    (12.0  (14.1

Change in valuation allowance

   (4.0  10.5    11.9  

Other

   (0.3  0.6    0.6  


Effective tax rate

   (1.5)%   (0.7)%   (3.0)% 


 Year Ended
 January 28,
2017
 January 30,
2016
 January 31,
2015
Provision at U.S. notional statutory rate35.0 % 35.0 % 35.0 %
Difference in U.S. and non-U.S. tax rates(23.7) (37.1) (35.1)
Benefits from utilization of general business credits(35.8) 5.2
 (10.8)
Change in valuation allowance30.6
 (4.3) 9.5
Withholding taxes42.8
 
 
Tax effects of global restructuring14.3
 
 
Other(0.8) (0.3) 0.5
Effective tax rate62.4 % (1.5)% (0.9)%
The following table reflects changes in the unrecognized tax benefits (in thousands):

   Year Ended 
   January 30,
2016
  January 31,
2015
  February 1,
2014
 

Unrecognized tax benefits as of the beginning of the period

  $ 45,197   $51,682   $79,031  

Increases related to prior year tax positions

   304    976    499  

Decreases related to prior year tax positions

   (4,334  (386  (111

Increases related to current year tax positions

   4,237    5,356    2,666  

Settlements

   (704  —      (7,423

Lapse in the statute of limitations

   (9,739  (10,691  (13,969

Foreign exchange gain

   (5,822  (1,740  (9,011


Gross amounts of unrecognized tax benefits as of the end of the period

  $29,139   $45,197   $51,682  


 Year Ended
 January 28,
2017
 January 30,
2016
 January 31,
2015
Unrecognized tax benefits as of the beginning of the period$29,139
 $45,197
 $51,682
Increases related to prior year tax positions2,080
 304
 976
Decreases related to prior year tax positions
 (4,334) (386)
Increases related to current year tax positions2,363
 4,237
 5,356
Settlements
 (704) 
Lapse in the statute of limitations(6,576) (9,739) (10,691)
Foreign exchange gain(3,213) (5,822) (1,740)
Gross amounts of unrecognized tax benefits as of the end of the period$23,793
 $29,139
 $45,197
Included in the balances as of January 30, 201628, 2017 is $27.8$23.4 million of unrecognized tax benefit that would affect the effective income tax rate if recognized. Also, $6.3$7.5 million and $4.2$6.3 million of the gross unrecognized tax benefits presented in the table above are offset against deferred tax assets in the consolidated balance sheets as of January 28, 2017 and January 30, 2016, and January 31, 2015, respectively.

MARVELL TECHNOLOGY GROUP LTD.

NOTES TO CONSOLIDATED FINANCIAL STATEMENTS — (Continued)

The amounts in the table above do not include the related interest and penalties. The amount of interest and penalties accrued was approximately $21.6 million as of January 28, 2017, $26.4 million as of January 30, 2016, and $27.7 million as of January 31, 2015. The Company’s policy is to recognize these interest and penalties as a component of income tax expense. The amount of interest and penalties accrued was approximately $26.4 million as of January 30, 2016, $27.7 million as of January 31, 2015 and $29.6 million as of February 1, 2014. The consolidated statements of operations for fiscal 2017, 2016, and 2015 and 2014 included $2.7 million, $4.6 million, $3.8 million and $6.2$3.8 million, respectively, of interest and penalties related to the unrecognized tax benefits.

The Company is subject to income tax audits by the respective tax authorities in all of the jurisdictions in which it operates. The examination of tax liabilities in each of these jurisdictions requires the interpretation and application of complex and sometimes uncertain tax laws and regulations. As of January 30, 2016,28, 2017, the material jurisdictions that are subject to examination include China, Israel, Singapore, Switzerland and the United States for the Company’s fiscal years 20052006 through 2015.2016. As of January 30, 2016,28, 2017, several of the Company’s non-U.S. entities are under examination for fiscal years encompassing 2006 through 2015.2016. The Company is also under examination by the stateState of California for fiscal year 2013 and 2014.

For fiscal 2017,2018, the Company will continue to review its tax positions and provide for or reverse unrecognized tax benefits as issues arise. During the next 12 months, it is reasonably possible that the amount of unrecognized tax benefits could increase or decrease significantly due to changes in tax law in various jurisdictions, new tax audits and changes in the U.S. dollar as compared to foreign currencies within the next 12 months. Excluding these factors, uncertain tax positions may decrease by as much as $16.2$9.5 million from the lapse of the statutes of limitation in various jurisdictions during the next 12 months.


75


MARVELL TECHNOLOGY GROUP LTD.
NOTES TO CONSOLIDATED FINANCIAL STATEMENTS — (Continued)

The Singapore Economic Development Board (“EDB”) initially granted a 10-year Pioneer Status in July 1999 to the Company’s Singapore subsidiary. In October 2004, the Company’s subsidiary in Singapore was granted a second incentive known as the Develop and Expansion Incentive (“DEI”), and in June 2006, the EDB agreed to extend the Pioneer status for 15 years to June 2014. The Company re-negotiated with the Singapore government and in fiscal 2015, they extended the DEI tax credits to the Company until June 2019. In order to retain these tax benefits in Singapore, the Company must meet certain operating conditions relating to, among other things, maintenance of a regional headquarters function, and research and development activities in Singapore. In fiscal 2017, 2016 2015 and 20142015 tax savings associated with these tax holidays were approximately $0.9 million, $5.3 million $0.1 million and $3.7$0.1 million, respectively, which if paid would impact the Company’s earnings per share by $0.01 per share in fiscal 2016, and 2014, and less than $0.01 per share in fiscal 2017 and 2015.

Under the Israeli Encouragement law of “approved or benefited enterprise,” two branches of Marvell Israel (M.I.S.L.)(M.I.S.L) Ltd., the GTL branch and the cellular branch (formerly Marvell DSPC), are entitled to approved and benefited tax programs that include reduced tax rates and exemption of certain income, subject to various operating and other conditions. Income from the approved or benefited enterprises, with the exception of capital gains, is eligible up to fiscal 2027. For fiscal 2014, the benefit associated with these approved or benefited enterprise programs was $2.2 million, which provided earnings per share of $0.01 per share in fiscal 2014. There was no such benefit in fiscal 2017, 2016 and fiscal 2015.

During fiscal 2007, each of the Swiss Federal Department of Economy and the Vaud Cantonal Tax Administration granted the Company’s subsidiary in Switzerland a 10 year tax holiday on revenues from research and design wafer supply trading activities, which commenced in February 2007 and expired at the end of fiscal 2016. The fiscal 2016, 2015 and 20142015 tax savings associated with this tax holiday was approximately $3.7 million $4.5 million and $5.1$4.5 million, respectively, which provided earnings per share of $0.01 per share in fiscal 2016 and 2015, and less than $0.01 per share2015. No tax savings was recognized in fiscal 2014.

MARVELL TECHNOLOGY GROUP LTD.

NOTES TO CONSOLIDATED FINANCIAL STATEMENTS — (Continued)

2017 due to expiration of the tax holiday.

As a result of restructuring actions taken in the fourth quarter of fiscal 2017, the Company recognized tax expense of $66.9 million, $50.1 million of this amount was attributable to foreign withholding taxes on undistributed earnings of certain subsidiaries that are no longer considered to be indefinitely reinvested. $16.8 million is attributable to foreign taxes associated with such restructuring actions.
The Company’s principal source of liquidity as of January 30, 201628, 2017 consisted of approximately $2.3$1.7 billion of cash, cash equivalents and short-term investments, of which approximately $830$970 million was held by foreign subsidiaries (outside Bermuda). Approximately $620 million of this amount held by foreign subsidiaries is related to undistributed earnings which have been indefinitely reinvested outside of Bermuda. These funds are primarily held in China, Israel Singapore,and the United States and Switzerland. The CompanyStates. We have plans to use such amounts to fund various activities outside of Bermuda, including working capital requirements, capital expenditures for expansion, funding of future acquisitions or other financing activities. If such funds were needed by the parent company in Bermuda or if the amounts were otherwise no longer considered indefinitely reinvested, the Companywe would incur a tax expense of approximately $200$190 million.


Note 10 — Commitments and Contingencies

Warranty Obligations

The Company’s products carry a standard 90-day warranty with certain exceptions in which the warranty period can extend to more than one year based on contractual agreements. The Company’s warranty expense has not been significant in the periods presented.

Lease Commitments

The Company leases some of its facilities, equipment and computer aided design software under non-cancelable operating leases. Rent expense, net of sublease income for fiscal 2017, 2016, 2015, and 20142015 was approximately $23.7 million, $23.8 million $26.1 million and $25.8$26.1 million, respectively. The Company also purchases certain intellectual property under technology license obligations. Future minimum lease payments, net of estimated sublease income, and payments under technology license obligations as of January 30, 2016,28, 2017, are presented in the following tables (in thousands):

Fiscal Year

  Minimum
Operating
Leases
Payments
 

2017

  $63,296  

2018

   35,679  

2019

   24,407  

2020

   14,280  

2021

   2,939  

Thereafter

   4,946  


Total future minimum lease payments

  $145,547  


Fiscal Year

  Technology
License
Obligations
 

2017

  $14,769  

2018

   12,630  

2019 and thereafter

   —    


Total future minimum lease payments

  $27,399  

Less: amount representing interest

   (580


Present value of future minimum payments

   26,819  

Less: current portion

   (14,358


Non-current portion

  $12,461  


76


MARVELL TECHNOLOGY GROUP LTD.

NOTES TO CONSOLIDATED FINANCIAL STATEMENTS — (Continued)


Fiscal Year
Minimum
Operating
Leases
Payments
2018$37,167
201927,004
202016,708
20213,767
2022610
Thereafter2,147
Total future minimum lease payments$87,403
Fiscal Year
Technology
License
Obligations
2018$23,180
20197,025
2020 and thereafter7,025
Total future minimum lease payments$37,230
Less: amount representing interest(170)
Present value of future minimum payments37,060
Less: current portion(22,111)
Non-current portion$14,949
Technology license obligations include the liabilities under the subscription agreements for technology licenses between the Company and various vendors.

Purchase Commitments

Under the Company’s manufacturing relationships with its foundry partners, cancellation of all outstanding purchase orders is allowed but requires payment of all costs and expenses incurred through the date of cancellation. As of January 30, 2016,28, 2017, these foundries had incurred approximately $136.8$208.8 million of manufacturing costs and expenses relating to the Company’s outstanding purchase orders.

Intellectual Property Indemnification

The Company has agreed to indemnify certain customers for claims made against the Company’s products where such claims allege infringement of third-party intellectual property rights, including, but not limited to, patents, registered trademarks, and/or copyrights. Under the aforementioned indemnification clauses, the Company may be obligated to defend the customer and pay for the damages awarded against the customer under an infringement claim as well as the customer’s attorneys’ fees and costs.costs under an infringement claim. The Company’s indemnification obligations generally do not expire after termination or expiration of the agreement containing the indemnification obligation. Generally, there are limits on and exceptions to the Company’s potential liability for indemnification. Although historically the Company has not made significant payments under these indemnification obligations, the Company cannot estimate the amount of potential future payments, if any, that it might be required to make as a result of these agreements. The maximum potential amount of any future payments that the Company could be required to make under these indemnification obligations could be significant.

Contingencies

The Company and certain of its subsidiaries are currently parties to various legal proceedings, including those noted in this section. The legal proceedings and claims described below could result in substantial costs and could divert the attention and resources of the Company’s management. The Company is also engaged in other legal proceedings and claims not described below, which arise in the ordinary course of its business. The Company is currently unable to predict the final outcome of these lawsuits and therefore cannot determine the likelihood of loss or estimate a range of possible loss, except with respect to amounts where it has determined a loss is both probable and estimable and has made an accrual. Litigation is subject to inherent uncertainties and unfavorable rulings could occur. An unfavorable ruling in litigation, particularly patent litigation, could require the Company to pay damages, one-time license fees or ongoing royalty payments, and could prevent the Company from manufacturing or selling some of its products or limit or restrict the type of work that employees involved in such litigation may perform for the Company, any of which could adversely affect financial results in future periods. The Company believes that its products do not infringe valid and enforceable claims and it will continue to vigorously defend against the allegations in these matters. However, thereThere can

77


MARVELL TECHNOLOGY GROUP LTD.
NOTES TO CONSOLIDATED FINANCIAL STATEMENTS — (Continued)

be no assurance that these matters will be resolved in a manner that is not adverse to the Company’s business, financial condition, results of operations or cash flows.

As of January 30, 2016, the Company has an accrued litigation balance of $739.8 million related to certain legal proceedings described below. Unless otherwise stated, the Company is currently unable to predict the final outcome of these lawsuits and therefore cannot determine the likelihood of loss or estimate a range of possible loss.


Carnegie Mellon University Litigation.On March 6, 2009, CMU filed a complaint in the U.S. District Court for the Western District of Pennsylvania (“W.D. of Pennsylvania”). CMU has asserted U.S. Patent Nos. 6,201,839 and 6,438,180 (collectively, the “CMU patents in suit”), which relate to read-channel integrated circuit

MARVELL TECHNOLOGY GROUP LTD.

NOTES TO CONSOLIDATED FINANCIAL STATEMENTS — (Continued)

devices and the hard disk drive (“HDD”) incorporating such devices. A jury trial began on November 26, 2012. On December 26, 2012, a jury delivered a verdict that found the CMU patents in suit were literally and willfully infringed and valid, and awarded past damages in the amount of $1.17 billion. Based on post-trial motions and decisions, the W.D. of Pennsylvania calculated the damages including enhancement to total approximately $1.54 billion, and held that, under its decision, CMU is entitled to post judgment interest and an ongoing royalty. On May 7, 2014, the W.D. of Pennsylvania entered final judgment, from which the Company filed a notice of appeal on May 14, 2014. On August 4, 2015, the W.D. of PennsylvaniaFederal Circuit in a three-judge panel issued an opinion affirming in part, reversing in part, and vacating and remanding in part. On February 16, 2016, the Company and CMU entered into a Settlement Agreement and Patent License pursuant to which the Company has agreed to pay an aggregate of $750 million, without any ongoing royalty payments, to CMU and the parties have agreed to mutually acceptable release, license and covenant not to sue provisions. Please see “Note 15 — Subsequent Events”Carnegie Mellon University Settlement” for additional information on the effect of the settlement in the Company’s consolidated financial statements for fiscal 2016. The Company expects the action to be finally dismissed in the third quarter of fiscal 2017, approximately 6 months after payment of the full amount of the settlement payment.2017. In connection with the settlement, the primary supersedeas bond that the Company entered into in connection with this litigation was reduced to $439 million and the secondary bond, which is secured, was adjusted to $311 million. All of the Company’s obligations under both bonds were discharged pursuant to an order releasing supersedeas bonds on April 21, 2016. Any bond specific indemnity agreement will be terminated and released upon final dismissal of the action.

USEI Litigation.On October 9, 2009, U.S. Ethernet Innovations, LLC (“USEI”) filed a complaint in the U.S. District Court for the Eastern District of Texas (“E.D. of Texas”), in which USEI accused a number of system manufacturers, including the Company’s customers, of patent infringement (the “USEI litigation”). Specifically, USEI asserted that these customers infringe U.S. Patent Nos. 5,307,459, 5,434,872, 5,732,094 and 5,299,313, which relate to Ethernet technologies. The complaint seeks unspecified damages and an injunction.

On May 4, 2010, MSI filed a motion to intervene in the USEI litigation, which was granted on May 19, 2010. On July 13, 2010, the E.D. of Texas issued an order granting the defendants’ motion to transfer the action to the U.S. District Court for the Northern District of California (“N.D. of California”); the case was formally transferred on August 23, 2010. On September 14, 2011, USEI withdrew its allegations against MSI for the ‘459 patent. The N.D. of California issued a first claim construction ruling on January 31, 2012 and a supplemental claim construction ruling on August 29, 2012. On August 16, 2013, the N.D. of California granted defendants’ summary judgment motion to preclude the plaintiff from recovering certain pre-suit damages. On November 7, 2014, on summary judgment, the N.D. of California found that all the patents-in-suit were either invalid or not infringed. On December 1, 2014, the N.D. of California entered a judgment in favor of defendants and awarded defendants’ costs. On December 29, 2014, USEI filed a motion to alter or amend the N.D. of California’s summary judgment order, which the N.D. of California denied on March 31, 2015. On April 24, 2015, USEI filed its notice of appeal. On April 25,18, 2016, the Federal Circuit affirmed the N.D. of California’s judgment in favor of MSI. On June 29, 2016, the Federal Circuit denied USEI’s petition for rehearing.

Azure Networks Litigation.    On March 22, 2011, Azure Networks, LLC (“Azure”) and Tri-County Excelsior Foundation filed suit in the E.D. of Texas against MSI and eight other companies. The Complaint asserts U.S. Patent No. 7,756,129 against MSI’s Bluetooth products. MSI filed its answer and counterclaims on July 20, 2011. On November 2, 2012, MSI and the other defendants filed a motion for summary judgment of invalidity, which was denied. A claim construction hearing was held on December 20, 2012. On January 15, 2013, the magistrate judge issued a claim construction ruling. On May 20, 2013, the E.D. of Texas issued an order denying plaintiff’s motion for reconsideration and adopted the magistrate judge’s claim construction ruling. On May 30, 2013, the E.D. of Texas entered a judgment of non-infringement. On June 24, 2013, Azure appealed.

MARVELL TECHNOLOGY GROUP LTD.

NOTES TO CONSOLIDATED FINANCIAL STATEMENTS — (Continued)

On November 6, 2014, the Federal Circuit issued an order vacating the judgment of non-infringement and remanding for further proceedings. MSI filed a petition for writ of certiorari to the United States Supreme Court on February 4, 2015. On February 10, 2015, the E.D. of Texas stayed all proceedings pending the Supreme Court’s ruling on the Company’s petition. On April 20, 2015, the United States Supreme Court granted MSI’s petition, vacating the Federal Circuit’s judgment and remanding the case for further consideration. The case was dismissed with prejudice on October 14, 2015 with no significant impact on the Company’s consolidated financial statements.

On January 13, 2015, Azure filed a second suit against MSI in the E.D. of Texas, alleging infringement of U.S. Patent Nos. 8,582,570; 8,582,571; 8,588,196; 8,588,231; 8,589,599; 8,675,590; 8,683,092; 8,700,815; 8,732,347; and 8,732,361, purportedly related to certain Wi-Fi and near field communication (“NFC”) technologies. The complaint seeks unspecified damages. On April 6, 2015, MSI filed an amended answer and counterclaims. The case was dismissed with prejudice on January 4, 2016 with no significant impact on the Company’s consolidated financial statements.

prejudice.


France Telecom Litigation.    On June 26, 2012, France Telecom S.A. filed a complaint against MSI in the U.S. District Court for the Southern District of New York. The complaint asserts U.S. Patent No. 5,446,747 against MSI’s communications processors and thin modems. The complaint sought unspecified damages as well as injunctive relief. MSI answered the complaint on July 18, 2012 and August 1, 2012. On July 30, 2012, MSI filed a motion to transfer the lawsuit to the N.D. of California. On September 17, 2012, the Court granted MSI’s motion and transferred the case to the N.D. of California. A claim construction hearing was held on December 13, 2013. On April 14, 2014, the Court denied MSI’s motion for summary judgment of invalidity, and granted MSI’s summary judgment motion concerning certain damages preclusion. A jury trial began on September 17, 2014. On September 30, 2014, a jury delivered a verdict that found the patent in suit was literally, but not willfully, infringed and valid, and awarded damages. The award did not have a significant impact on the Company’s consolidated financial statements. A hearing for post-trial motions and non-jury issues took place on January 14, 2015. On March 2, 2015, the N.D. of California issued an order on post-trial briefs finding no direct infringement by Marvell as a matter of law and entered judgment in favor of Marvell. On March 30, 2015, France Telecom filed a notice of appeal. On April 10, 2015, MSI filed a notice of cross appeal. On July 15, 2015, the Federal Circuit granted the parties’ joint stipulation to dismiss both parties’ appeals.

Vantage Point Technology Patent Litigation.    On November 21, 2013, Vantage Point Technology, Inc. (“VPT”) filed suit against a third-party defendant in the E.D. of Texas for patent infringement relating to processor technology. On February 3, 2014, VPT filed an amended complaint against the third party and added MSI as an additional defendant. The complaint sought unspecified damages. On December 8, 2014, the case was transferred to the N.D. of California. The case was dismissed with prejudice in March, 2015 with no significant impact on the Company’s consolidated financial statements.

Bandspeed Litigation.    On May 9, 2014, Bandspeed, Inc. filed suit against MSI in the U.S. District Court for the Western District of Texas, alleging infringement of U.S. Patent Nos. 7,027,418; 7,570,614; 7,477,624; 7,903,608; and 8,542,643, purportedly related to certain Bluetooth technology. The complaint sought unspecified damages. On February 13, 2015, Bandspeed amended its complaint and added allegations of infringement of U.S. Patent No. 8,873,500. On April 29, 2015, the parties filed a joint motion to dismiss the case with prejudice. The case was dismissed with prejudice on May 7, 2015 with no significant impact on the Company’s consolidated financial statements.

NXP Litigation.    On January 22, 2015, NXP Semiconductors N.V. filed suit against MSI in the N.D. of California, alleging infringement of U.S. Patent Nos. 5,939,791; 7,039,133; 8,185,050; and 8,203,432,

MARVELL TECHNOLOGY GROUP LTD.

NOTES TO CONSOLIDATED FINANCIAL STATEMENTS — (Continued)

purportedly related to certain NFC technology. The complaint sought unspecified damages. MSI filed its response and counterclaims on February 26, 2015. Marvell International Limited (“MIL”) also filed counterclaims against NXP Semiconductors U.S.A. (“NXP USA”), alleging infringement of U.S. Patent Nos. 7,047,393; 7,555,065; and 7,302,600. On February 2, 2015, MIL filed suit against NXP USA in the U.S. District Court for the Central District of California, alleging patent infringement of U.S. Patent Nos. 8,171,309; 7,957,777; 7,454,634; and 6,903,448, related to certain NFC and automotive technologies. On April 15, 2015, the parties filed stipulations to dismiss without prejudice their claims and counterclaims in both cases.

Paone Litigation.    On February 6, 2015, Luciano F. Paone filed suit against MSI in the U.S. District Court for the Eastern District of New York, alleging infringement of U.S. Patent No. 6,259,789, purportedly related to certain encryption technology. The complaint seeks unspecified damages. MSI filed its response on May 22, 2015. The case was dismissed with prejudice on December 31, 2015 with no significant impact on the Company’s consolidated financial statements.

Innovatio Litigation.On March 16, 2015, Innovatio IP Ventures, LLC filed suit against MSI in the U.S. District Court for the Northern District of Illinois, alleging infringement of U.S. Patent Nos. 6,697,415; 5,844,893; 5,740,366; 7,916,747; 6,665,536; 7,013,138; 7,107,052; 5,546,397; 7,710,907; 7,710,935; 6,714,559; 7,457,646; and 6,374,311, purportedly related to certain wireless technology. The complaint seekssought unspecified damages.

Visual Memory Litigation. On May 8, 2015, Visual Memory LLC (“Visual Memory”) filed suit against MSI inOctober 11, 2016, the District of Delaware, alleging infringement of U.S. Patent Nos. 5,654,932 and 6,026,027, purportedly related to certain memory technology. The complaint seeks unspecified damages. The case was dismissed with prejudice on September 4, 2015, with no significant impact on the Company’s consolidated financial statements.prejudice.


Luna Litigation and Consolidated Cases.On September 11, 2015, Daniel Luna filed an action asserting putative class action claims on behalf of the Company’s shareholders in the United States District Court for the Southern District of New York (“S.D. of New York”). This action was consolidated with two additional, nearly identical complaints subsequently filed by Philip Limbacher and Jim Farno. The complaints asserted violations of federal securities laws based on allegations that the Company and certain of its officers and directors (Sehat Sutardja, Michael Rashkin, and Sukhi Nagesh) made, caused to be made, or failed to correct false and/or misleading statements in the Company’s press releases and public filings. The complaints request damages in unspecified amounts, costs and fees of bringing the action, and other unspecified relief.


On November 18, 2015, the S.D. of New York granted the Company’s motion to transfer the consolidated cases to the N.D. of California. On December 21, 2015, the N.D. of California granted the Company’s motion to deem the consolidated cases related to theSaratogalitigation, discussed below. On February 8, 2016, the N.D. of California granted an unopposed motion to appoint Plumbers and Pipefitters National Pension Fund as Lead Plaintiff. On March 19, 2016, Lead Plaintiff filed a consolidated amended complaint. On April 29, 2016, Marvell and each of the individual defendants each filed motions to dismiss; Lead Plaintiff’s oppositions were filed on June 10, 2016; and defendants’ replies are due by July 15, 2016.dismiss. The hearing on the motions to dismiss took place on July 29, 2016 and the court took the matter under submission. On October 12, 2016, the Court granted Defendants’ motions to dismiss with leave to amend and granted lead plaintiff 30 days to file an amended complaint. The parties agreed that the plaintiffs shall file and serve an amended complaint by November 28, 2016. Plaintiffs filed and served the amended complaint on November 28, 2016. The Initial Case Management Conference took place on January 12, 2017. Marvell and co-defendants filed separate Motions to Dismiss on January 17, 2017. A further Case Management Conference and a hearing on defendants' Motions to Dismiss are both set for May 4, 2017. Trial is set for July 29, 2016.

March 5, 2018.

Saratoga Litigation. On October 16, 2015, Saratoga Advantage Trust Technology & Communications Portfolio (“Saratoga”) filed an action asserting shareholder derivative claims ostensibly on behalf of the Company in the Superior Court of the State of California, County of Santa Clara. The complaint names eight current or former officers and/or directors (Sehat Sutardja, Weili Dai, Juergen Gromer, Arturo Krueger, John Kassakian, Randhir Thakur, Michael Rashkin, and Sukhi Nagesh) as defendants and asserts various California

MARVELL TECHNOLOGY GROUP LTD.

NOTES TO CONSOLIDATED FINANCIAL STATEMENTS — (Continued)

state law causes of action based on allegations that the Company and the named officers and directors made, caused to be made, or failed to correct false and/or misleading statements in the Company’s press releases and public filings, leading to the filing of securities class actions that allegedly damaged the Company. The Company was named as a nominal defendant. The complaint requestsrequested damages and restitution in unspecified amounts, equitable and/or


78


MARVELL TECHNOLOGY GROUP LTD.
NOTES TO CONSOLIDATED FINANCIAL STATEMENTS — (Continued)

injunctive relief, costs and fees of bringing the action, and other unspecified relief.

On October 23, 2015, the Company removed the action to the N.D. of California. On December 21, 2015, the N.D. of California denied Saratoga’s motion to remand. On December 21, 2015, the N.D. of California granted the Company’s motion to deem the action related to the consolidatedLunaactions, discussed above. On January 22,September 15, 2016, the Company filed a motion to dismiss the complaint; on February 19, 2016, Saratoga filed an opposition; and on March 4, 2016, the Company filed a reply. On March 25, 2016, the District Court held a hearing on the motion and took the matter under submission. To the Company’s knowledge, none of the individual defendants has yet been served.

case was dismissed with prejudice.

Surety Bonds

On May 14, 2014, the Company filed a Notice of Appeal to appeal the final judgment issued by the W.D of Pennsylvania in the CMU litigation. In order to stay the execution of the final judgment pending its appeal, the Company filed a supersedeas bond for $1.54 billion with the W.D. of Pennsylvania in the event the Company did not fully satisfy a final judgment as affirmed after the completion of all appellate proceedings. The bond was issued by a consortium of sureties authorized by the U.S. Treasury. In support of the bond, the Company entered into separate indemnity agreements with each of the sureties to indemnify the sureties from all costs and payments made under the bond. The indemnity agreements did not require collateral to be posted at the time of the issuance of the bond. Therefore no cash is considered restricted as of the date of this filing. However, the indemnity agreements provideprovided that each of the sureties havehad the right to demand to be placed in funds or call for collateral under pre-defined events.

On November 14, 2014, the Company filed a second surety bond for $216 million and filed a commitment letter from the sureties to issue up to an additional $95 million in bonding under certain conditions. The second bond and commitment arewere secured by the Company’s campus located in Santa Clara, California which haswith a carrying value of $133.0$126.7 million at January 30, 2016.

28, 2017.

In connection with the settlement that was reached with CMU, for a total $750 million in February 2016, the primary supersedeas bond that the Company entered into was reduced to $439 million and the secondary bond was adjusted to $311 million and both were discharged pursuant to an order releasing supersedeas bonds on April 21, 2016. The underlying indemnity agreements will terminate upon the final dismissal of the case in the third quarter of fiscal 2017. For additional information, see CMU litigation under “Contingencies” above.

Indemnities, Commitments and Guarantees

During its normal course of business, the Company has made certain indemnities, commitments and guarantees under which it may be required to make payments in relation to certain transactions. These indemnities may include intellectual property indemnities to the Company’s customers in connection with the sales of its products, indemnities for liabilities associated with the infringement of other parties’ technology based upon the Company’s products, indemnities for general commercial obligations, indemnities to various lessors in connection with facility leases for certain claims arising from such facility or lease, and indemnities to directors and officers of the Company to the maximum extent permitted under the laws of Bermuda. In addition, the Company has contractual commitments to various customers, which could require the Company to incur

MARVELL TECHNOLOGY GROUP LTD.

NOTES TO CONSOLIDATED FINANCIAL STATEMENTS — (Continued)

costs to repair an epidemic defect with respect to its products outside of the normal warranty period if such defect were to occur. The duration of these indemnities, commitments and guarantees varies, and in certain cases, is indefinite. Some of these indemnities, commitments and guarantees do not provide for any limitation of the maximum potential future payments that the Company could be obligated to make. In general, the Company does not record any liability for these indemnities, commitments and guarantees in the accompanying consolidated balance sheets as the amounts cannot be reasonably estimated and are not considered probable. The Company does, however, accrue for losses for any known contingent liability, including those that may arise from indemnification provisions, when future payment is probable.

Note 11 — Benefit Plans

The Company sponsors a 401(k) savings and investment plan that allows eligible U.S. employees to participate by making pre-tax contributions to the 401(k) plan ranging from 1% to 50% of eligible earnings subject to a required annual limit. The Company matches 100% of the employeefirst 4% of the employee’s contribution and 50% of the next 2%, up to $500 per eligible employee per quarter. The participant must be employed by the Company on the last day of the calendar quarter to qualify for the match. At the end of the calendar year, the eligible employees receive a true-up match equal to the accumulated employee contribution for the calendar year up to $2,000.$3,000 maximum contribution. The Company made matching contributions to employees of $4.5 million in fiscal 2017, $4.9 million in fiscal 2016 and $5.1 million in each of fiscal 2015 and 2014.2015. As of January 30, 2016,28, 2017, the 401(k) plan offers a variety of investment alternatives, representing different asset classes. Employees may not invest in the Company’s common shares through the 401(k) plan.

The Company also has voluntary defined contribution plans in various non-U.S. locations. In connection with these plans, the Company made contributions on behalf of employees totaling $11.8 million, $14.5 million $18.5 million and $20.5$18.5 million during fiscal 2017, 2016 2015 and 2014,2015, respectively. The Company also maintains a limited number of defined benefit plans for certain non-U.S. locations. Total costs under these plans were $0.1 million, $1.5 million in fiscal 2016, and $0.1 million in each of fiscal 2017, 2016 and 2015, and 2014.

respectively.

Note 12 — Shareholders’ Equity

Common and Preferred Stock


79


MARVELL TECHNOLOGY GROUP LTD.
NOTES TO CONSOLIDATED FINANCIAL STATEMENTS — (Continued)

As of January 30, 2016,28, 2017, the Company is authorized to issue 992.0 million shares of $0.002 par value common stock and 8.08 million shares of $0.002 par value preferred stock. As of January 30, 201628, 2017 and January 31, 2015,30, 2016, no shares of preferred stock were outstanding.

1995 Stock Option Plan


In April 1995, the Company adopted the 1995 Stock Option Plan (the “Option Plan”). The Option Plan, as amended from time to time, had 383.4 million common shares reserved for issuance thereunder as of January 30, 2016.28, 2017. Options granted under the Option Plan generally have a term of 10 years and generally must be issued at prices equal to the fair market value of the stock on the date of grant. Incentive stock options granted to shareholders who own greater than 10% of the outstanding stock at the time of the grant may not have a term exceeding five years and these options must be issued at prices of at least 110% of the fair market value of the stock on the date of grant. Equity awards to new hires under the Option Plan generally vest 20% one year after the vesting commencement date and the remaining shares vest one-sixtieth per month over the remaining 48 months. Other equity awards generally vest annually in four equal installments.

The Company can also grant stock awards, which may be subject to vesting. Further, the Company can grant restricted stock unit (“RSU”) awards. RSU awards are denominated in shares of stock, but may be settled in cash or shares upon vesting, as determined by the Company at the time of grant.

MARVELL TECHNOLOGY GROUP LTD.

NOTES TO CONSOLIDATED FINANCIAL STATEMENTS — (Continued)

Awards under the Option Plan generally vest over 2 to 5 years.


As of January 30, 2016,28, 2017, approximately 91.498.6 million shares remained available for future issuance under the Option Plan.


Fiscal 2017. In August 2016, the Company granted performance-based equity awards to each of its executive officers who then joined the Company. The Company also granted performance-based equity awards to an additional four executive officers who later joined the Company in September, November and December of 2016. These equity awards include RSU’s which vest based on the achievement of certain financial goals (“Financial Performance RSU”). The Financial Performance RSUs will be earned on the achievement of certain financial operating metrics to be measured as of the end of fiscal 2018 and will vest on the third anniversary of the respective vesting commencement dates. Shares granted under these Financial Performance RSUs (based on 100% expected achievement) are reported in the table presented below as “Performance-Based.” The executive officers were also granted equity awards which shall vest based on total shareholder return (each a “Total Shareholder Return Award”). The Total Shareholder Return Awards will vest on the third anniversary of the respective vesting commencement dates based on the achievement of performance objectives relating to relative total shareholder return of the Company’s common shares as compared to that of comparable companies of the Philadelphia Semiconductor Sector Index over a performance period defined in the award. These Total Shareholder Return Awards are reported in the table presented below as “Market-Based.”
Fiscal 2016.    In April 2015, the Company granted performance-based equity awards to each of its executive officers, which arewere based on their achievement of certain performance goals for a new performance period beginning in fiscal 2016. These equity awards includeincluded RSUs which would vest based on the achievement of certain financial goals (each a “Financial Performance RSU”), and performance awards for which a portion shallwould vest based on the achievement of individual strategic objectives (each a “Strategic Objective Award”) and a portion shallwould vest based on total shareholder return (each a “Total Shareholder Return Award”). These awards are reported as “Performance-Based,” except for the Total Shareholder Return Award which is reported as “Market-Based.” The Financial Performance RSUs willwould be earned based on the achievement of revenue and modified non-GAAP operating income that have been established at “threshold,” “target” and “maximum” levels and willthat would vest on the first anniversary of the vest commencement date. The Strategic Objective Awards willwould also vest on the first anniversary of the commencement date at the target level based on the achievement of individual strategic goals and, with respect to a portion of each Strategic Objective Award, the further achievement of either the revenue or modified non-GAAP operating income objective established for the Financial Performance RSU. The Total Shareholder Return Awards willwould vest on the second anniversary of the commencement date based on the Company’s stock price performance in comparison to the Philadelphia Semiconductor Sector Index. Share-based compensation for the Total Shareholder Return Award is measured using the Monte Carlo valuation method since the award is indexed to the price of the Company’s common stock as set forth under the terms of the award.

Fiscal 2015.    In April 2014, the Company granted performance-based equity awards to each of ourits executive officers which arewere based on their achievement of certain performance goals in fiscal 2015 and 2016. These equity awards includeincluded RSUs which would vest based on financial performance criteria (“Financial Performance RSU”) and restricted stock units which vest based on both financial performance criteria and individual strategic goals (“Strategic Performance Award”). The Financial Performance RSUs willwould be earned based on the achievement of revenue and modified non-GAAP operating income that have been established at “threshold,” “target” and “maximum” levels. Each Financial Performance RSU willwould vest 50% on the first anniversary of the commencement date based on achievement of fiscal 2015 financial performance criteria and 50% on the second anniversary of the vesting commencement date based on the achievement of fiscal 2016 financial performance criteria. The Strategic Performance Awards willwould vest based on achievement at the threshold level of either the revenue or modified non-GAAP operating income objective established for the Financial Performance RSU, in addition to the achievement of additional individual strategic goals. Each Strategic Performance Award willwould vest 50% on the first anniversary of the

80


MARVELL TECHNOLOGY GROUP LTD.
NOTES TO CONSOLIDATED FINANCIAL STATEMENTS — (Continued)

commencement date based on achievement of fiscal 2015 individual strategic goals and 50% on second anniversary date based on the achievement of the fiscal 2016 individual strategic goals.

In June 2014, the Company granted performance-based RSU (“PSUs”) to certain members of senior management. Pursuant to the PSUs, each eligible employee iswas entitled to vest in a certain number of shares based on such employee’s achievement of individual financial and strategic performance goals for fiscal 2015, including, for example, net revenue and operating expense targets, and other individual strategic milestones. The actual number of shares that would vest for each eligible employee iswas based on the achievement of such performance goals determined at the end of fiscal 2015 and would vest over two years, with 50% vesting on April 1, 2015 and 50% vesting on April 1, 2016.

2007 Directors’ Stock Incentive Plan

Outside Director Equity Compensation Policy
In October 2007,September 2016, the Company adoptedCompany’s Board of Directors approved the termination of the 2007 Directors’ Stock Incentive Plan, (“2007 Director Plan”) for which shareholdersthat was initially adopted in October 2007 and it approved a totalnew Outside Director Equity Compensation Policy, which governs the granting of 750,000 common shares that could be issuedequity awards to non-employee directors under the plan to all eligible

MARVELL TECHNOLOGY GROUP LTD.

NOTES TO CONSOLIDATED FINANCIAL STATEMENTS — (Continued)

outside directors. Beginning in fiscal 2015, each outside director is eligible to receive equity awards under the 2007 DirectorOption Plan. Upon election or appointment atAt the annual general meeting of shareholders held in June 2015, the shareholders approved an amendment to the Option Plan to enable a full range of awards to be granted to non-employee directors. Under the newly adopted Outside Director Compensation Policy, each outside director upon election or appointment at an annual meeting of shareholders will be granted an RSU award under the 1995 Stock Option Plan for a number of shares with an aggregate fair market value equal to $220,000 immediately following eachon the grant date. In no event shall an outside director be awarded an annual general meeting of shareholders.RSU award for more than 20,000 shares. The RSU award vests 100% on the earlier of the date of the next annual general meeting of shareholders or the one-year anniversary of the date of grant. An outside director who is elected or appointed after an annual general meeting of shareholders will receive a pro rata RSU award based on the number of quarters completed since the prior annual general meeting of shareholders. In no event shall any outside director be awarded in any calendar year an annual RSU award under the 2007 Director Plan for more than 20,000 shares.

In fiscal 2014, each outside director who was appointed at the annual general meeting of shareholders was granted an option to purchase a number of common shares with an aggregate grant date fair value equal to $110,000 immediately following the annual general meeting of shareholders. In addition, each outside director who was elected or appointed at the annual general meeting of shareholders was granted an RSU award for a number of shares with an aggregate fair market value equal to $110,000 immediately following each annual general meeting. The option awards, which have a term of 10 years, and the RSU awards each vest 100% on the earlier of the date of the next annual general meeting of shareholders or the one-year anniversary of the date of grant. An outside director elected or appointed after an annual general meeting of shareholders would receive a pro rata stock option award and RSU award based on the number of quarters completed since the previous annual general meeting of shareholders. In no event would any outside director be awarded in any calendar year an annual option award or annual RSU award under the 2007 Director Plan for more than 25,000 shares and 10,000 shares, respectively. As of January 30, 2016, approximately 77,952 shares remained available for future issuance under the 2007 Directors’ Plan.

2000 Employee Stock Purchase Plan

Under the 2000 Employee Stock Purchase Plan, as amended and restated on October 31, 2011 (the “ESPP”), participants purchase the Company’s stock using payroll deductions, which may not exceed 15% of their total cash compensation. Pursuant to the terms of the current ESPP, the “look-back” period for the stock purchase price is 24 months. Offering and purchase periods begin on December 8 and June 8 of each year. Participants enrolled in a 24-month offering period will continue in that offering period until the earlier of the end of the offering period or the reset of the offering period. A reset occurs if the fair market value of the Company’s common shares on any purchase date is less than it was on the first day of the offering period. Participants in a 24-month offering period will be granted the right to purchase common shares at a price per share that is 85% of the lesser of the fair market value of the shares at (i) the participant’s entry date into the two-year offering period or (ii) the end of each six-month purchase period within the offering period.

Under the ESPP, a total of 2.3 million shares were issued in fiscal 2017 at a weighted-average price of $7.33 per share, a total of 5.9 million shares were issued in fiscal 2016 at a weighted-average price of $10.00 per share and a total of 9.7 million shares were issued in fiscal 2015 at a weighted-average price of $7.67 per share and a total of 9.7 million shares were issued in fiscal 2014 at a weighted-average price of $7.39 per share. As of January 30, 2016,28, 2017, there was $47.4$16.2 million of unamortized compensation cost related to the ESPP.

As of January 30, 2016,28, 2017, approximately 16.629.5 million shares remained available for future issuance under the ESPP.

MARVELL TECHNOLOGY GROUP LTD.

NOTES TO CONSOLIDATED FINANCIAL STATEMENTS — (Continued)

Option Plan and Stock Award Activity

Stock option activity under the Company’s stock option and stock incentive plans is included in the following table (in thousands, except for per share amounts):

  Time-Based Options  Market-Based Options  Total 
  Number of
Shares
  Weighted
Average
Exercise
Price
  Number of
Shares
  Weighted
Average
Exercise
Price
  Number of
Shares
  Weighted
Average
Exercise
Price
 

Balance at February 2, 2013

  49,637   $13.28    2,759   $15.43    52,396   $13.39  

Granted

  18,922   $10.82    —      —      18,922   $10.82  

Exercised

  (15,482 $9.40    —      —      (15,482 $9.40  

Canceled/Forfeited

  (3,921 $15.15    (136 $15.43    (4,057 $15.16  


Balance at February 1, 2014

  49,156   $13.40    2,623   $15.43    51,779   $13.51  

Granted

  6,365   $15.33    —      —      6,365   $15.33  

Exercised

  (3,732 $10.19    —      —      (3,732 $10.19  

Canceled/Forfeited

  (4,649 $14.66    (391 $15.43    (5,040 $14.72  


Balance at January 31, 2015

  47,140   $13.79    2,232   $15.43    49,372   $13.88  

Granted

  6,170   $14.13    —      —      6,170   $14.13  

Exercised

  (2,225 $9.79    —      —      (2,225 $9.79  

Canceled/Forfeited

  (10,211 $15.68    (76 $15.43    (10,287 $15.68  


Balance at January 30, 2016

  40,874   $13.59    2,156   $15.43    43,030   $13.68  


Vested or expected to vest at January 30, 2016

  38,773   $13.58      


81


MARVELL TECHNOLOGY GROUP LTD.
NOTES TO CONSOLIDATED FINANCIAL STATEMENTS — (Continued)

 Time-Based Options Market-Based Options Total
 
Number of
Shares
 
Weighted
Average
Exercise
Price
 
Number of
Shares
 
Weighted
Average
Exercise
Price
 
Number of
Shares
 
Weighted
Average
Exercise
Price
Balance at February 1, 201449,156
 $13.40
 2,623
 $15.43
 51,779
 $13.51
Granted6,365
 $15.33
 
 
 6,365
 $15.33
Exercised(3,732) $10.19
 
 
 (3,732) $10.19
Canceled/Forfeited(4,649) $14.66
 (391) $15.43
 (5,040) $14.72
Balance at January 31, 201547,140
 $13.79
 2,232
 $15.43
 49,372
 $13.88
Granted6,170
 $14.13
 
 
 6,170
 $14.13
Exercised(2,225) $9.79
 
 
 (2,225) $9.79
Canceled/Forfeited(10,211) $15.68
 (76) $15.43
 (10,287) $15.68
Balance at January 30, 201640,874
 $13.59
 2,156
 $15.43
 43,030
 $13.68
Granted2,104
 $9.99
 
 
 2,104
 $9.99
Exercised(5,558) $10.35
 
 
 (5,558) $10.35
Canceled/Forfeited(12,324) $16.44
 (2,156) $15.43
 (14,480) $16.29
Balance at January 28, 201725,096
 $12.61
 
   25,096
 $12.61
Vested or expected to vest at January 28, 201724,253
 $12.57
        
For time-based stock options vested and expected to vest at January 30, 2016,28, 2017, the aggregate intrinsic value was $6.7$68.0 million. For time-based stock options exercisable at January 30, 2016,28, 2017, the aggregate intrinsic value was $6.6$45.7 million. The aggregate intrinsic value of stock options exercised during fiscal 2017, 2016 and 2015 and 2014 was $19.8 million, $9.7 million and $19.3 million, and $51.1 million, respectively. There was no aggregate intrinsic value forThe market-based stock options at January 30,automatically expired in April 2016 andsince the weighted average remaining contractual termmarket price conditions were not met within the required five years from date of market-based stock options vested and expected to reach the end of the vesting period at January 30, 2016 was 5.2 years.grant. The Company’s closing stock price of $8.85$15.09 as reported on the NASDAQ Global Select Market as of January 29, 201627, 2017 was used to calculate the aggregate intrinsic value for all in-the-money options.

As of January 30, 2016, outstanding

Outstanding options and exercisable options information by range of exercise prices as of January 28, 2017 was as follows:

   Outstanding Options   Exercisable Options 

Range of

Exercise Prices

  Number of
Shares
(in Thousands)
   Weighted
Average
Remaining
Contractual Term
(in Years)
   Weighted
Average
Exercise Price
   Number of
Shares
(in Thousands)
   Weighted
Average
Exercise Price
 

$  5.70

  $  9.49   3,673     3.38    $7.04     3,386    $6.89  

$10.31

  $10.76   11,574     7.09    $10.76     3,570    $10.76  

$10.80

  $14.35   9,275     6.60    $13.25     3,661    $12.06  

$14.45

  $15.43   9,842     6.07    $15.16     4,843    $15.26  

$15.43

  $34.38   8,666     3.80    $19.18     5,763    $20.85  


Total

     43,030     5.77    $13.68     21,223    $14.13  


MARVELL TECHNOLOGY GROUP LTD.

NOTES TO CONSOLIDATED FINANCIAL STATEMENTS — (Continued)

  Outstanding Options Exercisable Options
Range of
Exercise Prices
 
Number of
Shares
(in Thousands)
 
Weighted
Average
Remaining
Contractual Term
(in Years)
 
Weighted
Average
Exercise Price
 
Number of
Shares
(in Thousands)
 
Weighted
Average
Exercise Price
$5.70
 $10.47
 3,842
 4.84 $8.11
 2,214
 $6.94
$10.76
 $10.76
 7,004
 6.16 $10.76
 4,344
 $10.76
$10.80
 $14.35
 6,047
 5.79 $13.13
 2,630
 $11.72
$14.45
 $15.87
 5,540
 5.82 $15.40
 2,385
 $15.24
$15.91
 $21.62
 2,663
 1.19 $16.95
 2,599
 $16.96
Total   25,096
 5.27 $12.61
 14,172
 $12.23
As of January 30, 2016,28, 2017, the unamortized compensation expense for time-based stock options was $38.2 million and market-based stock options were fully amortized in fiscal 2014.$15.5 million. The unamortized compensation expense for time-based options will be amortized on a straight-line basis and is expected to be recognized over a weighted-average period of 1.91.4 years.

Activity related to the non-vested portion of the restricted stock units is included in the following table (in thousands, except for share prices):

  Time-Based  Performance-Based  Market-Based  Total 
  Number of
Shares
  Weighted
Average
Grant Date
Fair Value
  Number of
Shares
  Weighted
Average
Grant Date
Fair Value
  Number of
Shares
  Weighted
Average
Grant Date
Fair Value
  Number of
Shares
  Weighted
Average
Grant Date
Fair Value
 

Balance at February 2, 2013

  12,739   $15.78        12,739   $15.78  

Granted

  3,728   $10.79    100   $10.52      3,828   $10.78  

Vested

  (3,925 $16.19    —      —        (3,925 $16.19  

Canceled/Forfeited

  (1,288 $14.39    —      —        (1,288 $14.39  


Balance at February 1, 2014

  11,254   $14.14    100   $10.52      11,354   $14.11  

Granted

  5,534   $15.20    1,277 *  $14.98      6,811   $15.16  

Vested

  (5,938 $13.96    (3 $10.52      (5,941 $13.96  

Canceled/Forfeited

  (1,102 $14.32    (120 $11.23      (1,222 $14.02  


Balance at January 31, 2015

  9,748   $14.84    1,254   $14.99      11,002   $14.85  

Granted

  5,689   $12.88    669 *  $14.08    407 *  $12.24    6,765   $12.96  

Vested

  (5,139 $15.06    (658 $15.15    —      —      (5,797 $15.07  

Canceled/Forfeited

  (1,955 $13.99    (288 $14.39    (54 $12.24    (2,297 $14.00  


Balance at January 30, 2016

  8,343   $13.57    977   $14.43    353     9,673   $13.61  


82


MARVELL TECHNOLOGY GROUP LTD.
NOTES TO CONSOLIDATED FINANCIAL STATEMENTS — (Continued)

 Time-Based Performance-Based Market-Based Total
 
Number of
Shares
 
Weighted
Average
Grant Date
Fair Value
 
Number  of
Shares
  
Weighted
Average
Grant Date
Fair Value
 
Number of
Shares
 
Weighted
Average
Grant Date
Fair Value
 
Number of
Shares
 
Weighted
Average
Grant Date
Fair Value
Balance at February 1, 201411,254
 $14.14
 100
  $10.52
     11,354
 $14.11
Granted5,534
 $15.20
 1,277
* $14.98
     6,811
 $15.16
Vested(5,938) $13.96
 (3)  $10.52
     (5,941) $13.96
Canceled/Forfeited(1,102) $14.32
 (120)  $11.23
     (1,222) $14.02
Balance at January 31, 20159,748
 $14.84
 1,254
  $14.99
     11,002
 $14.85
Granted5,689
 $12.88
 669
* $14.08
 407
 $12.24
 6,765
 $12.96
Vested(5,139) $15.06
 (658)  $15.15
 
 $
 (5,797) $15.07
Canceled/Forfeited(1,955) $13.99
 (288)  $14.39
 (54) $12.24
 (2,297) $14.00
Balance at January 30, 20168,343
 $13.57
 977
  $14.43
 353
 $12.24
 9,673
 $13.61
Granted9,139
 $9.83
 366
* $13.91
 612
*$11.94
 10,117
 $10.11
Vested(5,490) $13.95
 (155)  $14.15
 
 
 (5,645) $13.95
Canceled/Forfeited(2,067) $10.69
 (875)  $14.45
 (406) $12.39
 (3,348) $11.88
Balance at January 28, 20179,925
 $10.52
 313
  $13.91
 559
 $11.80
 10,797
 $10.69
*Amounts represent the target number of restricted stock units at grant date. For awards granted to our executive officers, up to 200% of the target restricted stock units may vest if the maximum level for financial and strategicperformance goals is achieved.

In connection with the performance-based equity awards granted in fiscal 2016 to each of the Company’s executive officers, a total of 33,616 shares vested on April 1, 2016 based on achieving certain individual strategic goals as evaluated by the Executive Compensation Committee of the Company’s Board of Directors. No shares vested for the achievement of financial performance goals since the financial performance criteria were below the threshold level. The amount of canceled shares reported in the table above includes the unvested shares that were not earned.

In connection with the performance-based equity awards granted in fiscal 2015 to each of the Company’s executive officers, a total of 478,001 shares vested on April 1, 2015 in connection with the first performance period completed at the end of fiscal 2015. Of this amount, an additional 107,954 shares are included as granted in the table above for fiscal 2015 since each executive officer achieved greater than their target shares for one of the financial performance goals. The amount of canceled shares reported in the table above includes the portion of unvested shares that were not earned since performance objectives for each executive officer’s other financial and strategic performance goals were not fully achieved. No shares will be issued in connection with the second performance period since the financial and strategic performance goals for fiscal 2016 were not achieved.

MARVELL TECHNOLOGY GROUP LTD.

NOTES TO CONSOLIDATED FINANCIAL STATEMENTS — (Continued)

In connection with the PSUs granted in fiscal 2015 to certain members of senior management, final evaluation for each individual’s achievement of their performance was measured in the first quarter of fiscal 2016. As a result, a total of 360,723 shares vested on April 1, 2015 and are included in the above table. There was no material adjustment to share-based compensation expense related to these performance-based restricted stock units in fiscal 2016. The amount of canceled shares reported in the table above includes the portion of unvested shares that were not earned since certain performance achievements were not fully achieved.

The aggregate intrinsic value of restricted stock units expected to vest as of January 30, 201628, 2017 was $81.7$152.4 million. The number of restricted stock units that are expected to vest is 9.210.1 million shares.

As of January 30, 2016,28, 2017, unamortized compensation expense related to restricted stock units was $53.2$64.2 million. The unamortized compensation expense for restricted stock units will be amortized on a straight-line basis and is expected to be recognized over a weighted-average period of 1.01.4 years.

Share-Based Compensation

The following table presents details of share-based compensation expenses by functional line item (in thousands):

   Year Ended 
   January 30,
2016
   January 31,
2015
   February 1,
2014
 

Cost of goods sold

  $7,916    $7,972    $8,863  

Research and development

   98,792     94,432     109,432  

Selling and marketing

   11,106     11,469     13,940  

General and administrative

   15,965     23,373     23,638  


  $133,779    $137,246    $155,873  


83


MARVELL TECHNOLOGY GROUP LTD.
NOTES TO CONSOLIDATED FINANCIAL STATEMENTS — (Continued)

 Year Ended
 January 28,
2017
 January 30,
2016
 January 31,
2015
Continuing operations:     
     Cost of goods sold$8,334
 $7,787
 $7,972
     Research and development78,136
 92,054
 89,131
     Selling and marketing10,243
 10,242
 10,623
     General and administrative8,047
 15,878
 23,292
Share-based compensation - continuing operations$104,760
 $125,961
 $131,018
Discontinued operations:     
      Cost of goods sold187
 129
 
      Research and development8,306
 6,738
 5,301
      Selling and marketing649
 864
 846
      General and administrative68
 87
 81
Share-based compensation - discontinued operations9,210
 7,818
 6,228
Total share-based compensation$113,970
 $133,779
 $137,246

Share-based compensation capitalized in inventory was $0.9 million at January 28, 2017 and $1.5 million at both January 30, 2016 $1.5 million atand January 31, 2015, and $1.7 million at February 1, 2014.

2015.

Upon the termination of certain members of our executive management in April 2016, it was determined that the vesting in certain of their unvested stock awards was notno longer probable. As a result, the Company recorded a reversal of the previously recognized related share-based compensation expense in the first quarter of fiscal 2017.

Valuation Assumptions

The expected volatility for awards granted during fiscal 2017, 2016 2015, and 20142015 was based on an equally weighted combination of historical stock price volatility and implied volatility derived from traded options on the Company’s stock in the marketplace. The Company believes that the combination of historical volatility and implied volatility provides a better estimate of future stock price volatility.

The expected dividend yield is calculated by dividing the current annualized dividend by the closing stock price on the date of grant of the option.

MARVELL TECHNOLOGY GROUP LTD.

NOTES TO CONSOLIDATED FINANCIAL STATEMENTS — (Continued)

The following weighted average assumptions were used for each respective period to calculate the fair value of each time-based stock option award on the date of grant using the Black-Scholes option pricing model and of each market-based stock option award using a Monte Carlo simulation model:

   Year Ended 
   January 30,
2016
  January 31,
2015
  February 1,
2014
 

Time-based Stock Options:


Weighted average fair value

  $3.93   $4.35   $3.43  

Expected volatility

   34  35  45

Expected term (in years)

   5.4    5.0    5.0  

Risk-free interest rate

   1.6  1.6  0.8

Expected dividend yield

   1.8  1.6  2.4

 Year Ended
 January 28,
2017
 January 30,
2016
 January 31,
2015
Time-based Stock Options:     
Weighted average fair value$2.92
 $3.93
 $4.35
Expected volatility40% 34% 35%
Expected term (in years)5.2
 5.4
 5.0
Risk-free interest rate1.3% 1.6% 1.6%
Expected dividend yield2.5% 1.8% 1.6%
There have been no market-based stock option grants since fiscal 2012, when the Company issued 3.1 million stock options with a market-based condition for a group of senior employees. The market price conditions were not met within the five years from date of grant and these stock options automatically expired in April 2016.
The following weighted-average assumptions were used for each respective period to calculate the fair value of each market-based stock option award was estimatedcommon shares to be issued under the ESPP on the date of grant using athe Black-Scholes option pricing model:

84


MARVELL TECHNOLOGY GROUP LTD.
NOTES TO CONSOLIDATED FINANCIAL STATEMENTS — (Continued)

 Year Ended
 January 28,
2017
 January 30,
2016
 January 31,
2015
Employee Stock Purchase Plan:     
Estimated fair value$3.83
 $3.24
 $4.10
Expected volatility39% 41% 30%
Expected term (in years)1.2
 1.3
 1.3
Risk-free interest rate0.7% 0.6% 0.3%
Expected dividend yield1.9% 2.4% 1.6%
The following weighted-average assumptions were used for each respective period to calculate the fair value of common shares to be issued under Total Shareholder Return performance awards on the date of grant using the Monte Carlo simulation model that uses assumptions as then determined, including the same volatility applied to the Company’s time-based options that were granted in the same period. Because a Monte Carlo simulation model incorporates ranges of assumptions for inputs, those ranges are disclosed where applicable. The Company uses historical data to estimate employee termination within the valuation model. The expected term was 2.66 years for market-based stock options granted in fiscal 2012 and was derived from the output of the valuation model and represents the period of time that options granted are expected to be outstanding.

   Year Ended 
   January 30,
2016
  January 31,
2015
  February 1,
2014
 

Employee Stock Purchase Plan:


Estimated fair value

  $3.24   $4.10   $3.65  

Expected volatility

   41  30  37

Expected term (in years)

   1.3    1.3    1.3  

Risk-free interest rate

   0.6  0.3  0.2

Expected dividend yield

   2.4  1.6  2.0

Year Ended
January 30,
2016

Total Shareholder Return Awards:

Expected term (in years)

2.0

Expected volatility

27

Average correlation coefficient of peer companies

0.4

Risk-free interest rate

0.5

Expected dividend yield

1.7

pricing model:

 Year Ended
 January 28,
2017
January 30,
2016
Total Shareholder Return Awards:  
Expected term (in years)2.9
2.0
Expected volatility36%27%
Average correlation coefficient of peer companies0.5
0.4
Risk-free interest rate0.9%0.5%
Expected dividend yield2.1%1.7%
The correlation coefficients are calculated based upon the price data used to calculate the historical volatilities and is used to model the way in which each entity tends to move in relation to its peers.

MARVELL TECHNOLOGY GROUP LTD.

NOTES TO CONSOLIDATED FINANCIAL STATEMENTS — (Continued)

Share Repurchase Program

The Company’s board

On November 17, 2016, the Company announced that its Board of directors initiallyDirectors authorized its currenta $1.0 billion share repurchase plan. The current stock repurchase program toreplaced in its entirety the prior $3.25 billion stock repurchase up to $500program, which had approximately $115.0 million of its outstanding common shares in August 2010. Since then, the Company’s boardrepurchase authority remaining as of directors has authorized an additional $2.75 billion for a total available under the program of $3.25 billion to be used to repurchase its common shares.November 27, 2016. The Company intends to effect share repurchases in accordance with the conditions of Rule 10b-18 under the Exchange Act but may also make repurchases in the open market outside of Rule 10b-18 or in privately negotiated transactions. The share repurchase program will be subject to market conditions and other factors, and does not obligate the Company to repurchase any dollar amount or number of its common shares and the repurchase program may be extended, modified, suspended or discontinued at any time.

The Company repurchased 13.3 million of its common shares for $183.1 million, 19.7 million of its common shares for $260.9 million and 5.1 million of its common shares for $65.0 million and 33.1 million of its common shares for $354.1 million in cash during fiscal 2017, 2016 2015 and 2014,2015, respectively. All of the repurchased shares were retired immediately after the repurchases were completed. The Company records all repurchases, as well as investment purchases and sales, based on their trade date. AsFrom August 2010 when the Company’s Board of Directors initially authorized a share repurchase program through January 30, 2016,28, 2017, a total of 241.6254.9 million shares have been repurchased to date under the Company’s share repurchase program for a total $3.1$3.3 billion in cash and there was $182.6$884.0 million remaining available for future share repurchases. The
Subsequent to the year ended January 28, 2017 through March 15, 2017, the Company has made no subsequentrepurchased an additional 2.7 million of its common shares for $43.7 million at an average price per share repurchases since its third quarter of fiscal 2016.

$15.91.

Dividends

   Year Ended 
   January 30,
2016
   January 31,
2015
   February 1,
2014
 

Cash dividend per share

  $0.24    $0.24    $0.24  


Total payment to shareholders (in thousands)

  $122,821    $122,801    $119,449  


On March 16, 2016,2017, the Company announced that its board of directors declared a cash dividend of $0.06 per share that was paidpayable on April 22, 201620, 2017 to shareholders of record as of March 29, 2016 and on May 18, 2016, it announced that its board of directors declared a cash dividend of $0.06 per share that was paid on July 12, 2016 to shareholders of record as of June 14, 2016.

April 4, 2017.

Note 13 — Segment and Geographic Information

The Company operates in one reportable segment — the design, development and sale of integrated circuits. The chief executive officer was identified as the chief operating decision maker (“CODM”) for the years ended January 28, 2017, January 30, 2016 and January 31, 2015 and February 1, 2014.2015. The Company’s CODM is ultimately responsible and actively involved in the allocation of resources and the assessment of the Company’s performance. The fact that the Company operates in only one reportable segment is based on the following:


85


MARVELL TECHNOLOGY GROUP LTD.
NOTES TO CONSOLIDATED FINANCIAL STATEMENTS — (Continued)

The Company uses a highly-integrated approach in developing its products in that discrete technologies developed by the Company are frequently integrated across many of its products. Substantially all of the Company’s integrated circuits are manufactured under similar manufacturing processes.

The Company’s organizational structure is based along functional lines. Each of the functional department heads reports directly to the CODM. Shared resources in the Company also report directly to the CODM or to a direct report of the CODM.

MARVELL TECHNOLOGY GROUP LTD.

NOTES TO CONSOLIDATED FINANCIAL STATEMENTS — (Continued)

The assessments of performance across the Company, including assessment of the Company’s incentive compensation plan, are based largely on operational performance and consolidated financial performance.

The decisions on allocation of resources and other operational decisions are made by the CODM based on his hands-ondirect involvement with the Company’s operations and product development.

The following tables present net revenue and long-lived asset information based on geographic region. Net revenue is based on the destination of the shipments and long-lived assets are based on the physical location of the assets (in thousands):

   Year Ended 
    January 30,
2016
   January 31,
2015
   February 1,
2014
 

Net Revenue:


United States

  $42,854    $62,333    $68,321  

China

   1,569,147     2,214,876     1,869,381  

Thailand

   189,299     294,706     353,363  

Malaysia

   302,953     377,903     352,756  

Philippines

   211,602     254,381     257,899  

Others

   409,973     502,764     502,680  


  $2,725,828    $3,706,963    $3,404,400  


    January 30,
2016
   January 31,
2015
 

Property and equipment, net:


Bermuda

  $3,093    $3,358  

China

   22,917     25,910  

Israel

   15,069     26,728  

Singapore

   69,241     79,216  

United States

   173,537     186,321  

Others

   15,683     19,106  


  $299,540    $340,639  


The following table presents net revenue by end market (in thousands):

   Year Ended 
    January 30,
2016
   January 31,
2015
   February 1,
2014
 

Net Revenue by End Market


Storage

  $1,201,378    $1,744,656    $1,681,953  

Mobile and Wireless

   786,239     1,071,777     839,407  

Networking

   551,743     674,701     670,249  

Other

   186,468     215,829     212,791  


  $2,725,828    $3,706,963    $3,404,400  


 Year Ended
 January 28,
2017
 January 30,
2016
 January 31,
2015
Net Revenue:     
United States$51,416
 $60,119
 $61,470
China1,239,931
 1,509,244
 2,171,299
Thailand113,778
 189,299
 294,706
Malaysia286,267
 302,953
 377,903
Philippines283,345
 211,602
 254,381
Others342,937
 375,999
 477,447
 $2,317,674
 $2,649,216
 $3,637,206
 January 28,
2017
 January 30,
2016
Property and equipment, net:   
China$16,484
 $22,294
Israel12,133
 15,069
Singapore54,054
 68,212
United States147,552
 173,158
Others13,174
 18,045
 $243,397
 $296,778

Note 14 — Related Party Transactions

MIL


The Company, through one of its subsidiaries, is a party to a technology license agreementagreements with each of VeriSilicon Holdings Co., Ltd. ("VeriSilicon") and Vivante Corporation (“VeriSilicon”Vivante”). MIL assumed the technology license agreement betweenPursuant to its agreements with VeriSilicon, and UTStarcom, Inc. after the Company’s acquisition of the semiconductor business of UTStarcom in December 2005. MILwhich has subsequently entered into various addendabeen amended from time to the agreement for additional technology beyond the scope of the original agreement. In

MARVELL TECHNOLOGY GROUP LTD.

NOTES TO CONSOLIDATED FINANCIAL STATEMENTS — (Continued)

addition, in September 2010, MIL entered intotime, and a services agreement with VeriSilicon, pursuant to which VeriSilicon has agreed to provide design support services to MIL. Under the services agreement, VeriSilicon helped on three projects for MIL during fiscal 2013. In connection with all of its transactions with VeriSilicon, MILCompany paid $1.5 million, $1.8 million $3.7 million and $2.0$3.7 million to VeriSilicon during fiscal 2017, 2016 2015 and 2014,2015, respectively. As of January 30, 2016,28, 2017, the Company had $0.3$0.1 million of liability to VeriSilicon. Weili Dai’s brother (and Dr. Sehat Sutardja’s brother-in-law) Wayne Dai, is the Chairman, PresidentPursuant to its agreements with Vivante, which has been amended from time to time, and Chief Executive Officer of VeriSilicon. Ms. Dai and Dr. Sutardja are also shareholders of VeriSilicon. Ms. Dai was the President ofa services agreement with Vivante, the Company paid $3.5 million, $4.0 million and Dr. Sehat Sutardja was$9.1 million to Vivante during fiscal 2017, 2016 and 2015, respectively. As of January 28, 2017, the Company’s Chief Executive Officer until their departuresCompany had no liability to Vivante. VeriSilicon acquired Vivante in April 2016 (see “Note 15 — Subsequent Events”), and continue to serve as members of the Company’s Board of Directors.late 2016. Dr. Sehat Sutardja and Ms. Weili Dai, the Company’s former Chairman and Chief Executive Officer and President and a director of the Company, respectively, and currently greater than 10% shareholder of the Company, are husband and wife.

In December 2009, MIL entered into a technology license agreement with Vivante Corporation (“Vivante”) that provides for the license Ms. Dai’s brothers (and Dr. Sutardja’s brothers-in-law) Wayne Dai and Weijin Dai are executive officers and board members of graphics technology and associated services. This agreement restates, expands and succeeds previous agreements between the parties for the same technology. In December 2012, the parties renewed this technology license agreement for another three years. The total amount of the license fee was approximately $13.0 million (to be paid over three years) and ten percent for support fees (to be paid over three years). In February 2012, the parties entered into a separate services agreement, pursuant to which Vivante agreed to provide support services to MIL. In connection with all of its transactions with Vivante, MIL paid $4.0 million, $9.1 million and $6.9 million to Vivante during fiscal 2016, 2015 and 2014, respectively. As of January 30, 2016, the Company had $1.5 million of liability to Vivante. As a result of their ownership of and control of Estopia LLC and their existing shareholdings,VeriSilicon. Dr. Sutardja and Ms. Dai are now directshareholders (directly and indirect shareholders ofindirectly) in VeriSilicon. In addition, as a result of the acquisition of Vivante by VeriSilicon in late 2015, Ms. Dai’s brother Weijin Dai, who was the Chief Executive Officer and member of the board of directors of Vivante is now an executive officer and board member of VeriSilicon. Dr. Sutardja, who was Chairman of the board of directors of Vivante, is not on the board of directors of VeriSilicon.


In February 2015, the Executive Compensation Committee (“Committee”) of the Company’s Board of Directors approved a cash payment of approximately $15.4 million to Dr. Sehat Sutardja. The U.S. Court of Federal Claims ruled against Dr. Sutardja in his legal challenge with the Internal Revenue Service and the California Franchise Tax Board related to the tax

86


MARVELL TECHNOLOGY GROUP LTD.
NOTES TO CONSOLIDATED FINANCIAL STATEMENTS — (Continued)

treatment of several stock options granted in fiscal 2004. After discussing and evaluating the alternatives to a continuing legal challenge of the court’s determination, the likelihood of success of further appeal by Dr. Sutardja and the potential negative impact on the Company of a continuation of the case regardless of the outcome, the Committee determined to provide Dr. Sutardja with relief from the financial effects of the penalty taxes. Accordingly, the Committee approved the cash payment to Dr. Sutardja equal to the amount of his penalty taxes owed under the Tax Codes, plus accrued interest owed with respect to such liabilities, all grossed-up for income taxes that will be owed by Dr. Sutardja on receipt of such cash payment. The Company recorded the payment in general and administrative expense in fiscal 2016. A payment of $8.4 million was made to Dr. Sutardja in fiscal 2016 representing reimbursement for the U.S. federal tax portion. As of January 30, 2016,28, 2017, the Company had a remaining $7.0 million liability to Dr. Sutardja.

Sutardja with respect to the California tax portion.


Note 15 — Subsequent Events

In April 2016, the employment of Dr. Sehat Sutardja as Chief Executive Officer and Weili Dai as President was terminated by the Company’s Board of Directors. Dr. Sutardja and Ms. Dai remain on the Board of Directors at this time. The Board of Directors then formed an Interim Office of the Chief Executive and appointed Maya Strelar-Migotti, Executive Vice President of the Smart Networked Devices and Solutions Business Group, and Dr. Pantelis Alexopoulos, Executive Vice President of the Storage Business Group, as Interim Co-Chief Executive Officers, each having the authority to exercise all powers of the Chief Executive Officer. In June 2016, the Board of Directors appointed Matthew J. Murphy to serve as the Company’s President and Chief Executive

MARVELL TECHNOLOGY GROUP LTD.

NOTES TO CONSOLIDATED FINANCIAL STATEMENTS — (Continued)

Officer, effective July 11, 2016. Upon the commencement of Mr. Murphy’s employment, Ms. Strelar-Migotti and Dr. Alexopoulos returned to their roles as Executive Vice Presidents of the Company. The Board subsequently appointed Richard S. Hill, the Chairman of the Board, as the Company’s Interim Principal Executive Officer, to serve in that capacity until the Company files its Quarterly Report on Form 10-Q for the second quarter of fiscal 2017 (“Q217 Form 10-Q”). Mr. Murphy will assume the role of the Company’s principal executive officer immediately following the filing of the Q217 Form 10-Q. Mr. Murphy also joined the Board of Directors on July 11, 2016.

Also in April 2016, the Company announced that it entered into an agreement with Starboard Value LP (“Starboard”), regarding the composition of its Board of Directors. Under the terms of the agreement, the Company elected Peter A. Feld, Richard S. Hill, Oleg Khaykin, Michael Strachan and Robert Switz to serve on its board. Mr. Hill replaced Dr. Sutardja as the Chairman of the Board in May 2016. The agreement specifies that the Board will recommend and the Company will support and solicit proxies only for the election at the 2016 annual general meeting of Messrs. Feld, Hill, Khaykin, Murphy, Strachan and Switz and the four independent directors serving on the Board immediately prior to the execution of the agreement, Dr. Gromer, Dr. Kassakian, Mr. Krueger and Dr. Thakur.

Carnegie Mellon University Settlement

In February 2016, the Company and CMU settled their patent infringement lawsuit pursuant to a court-ordered mediation and entered into a Settlement Agreement and Patent License (the “Agreement”). The parties agreed to mutual release of claims, license and covenant not to sue provisions for which the Company will paypaid an aggregate of $750 million to CMU.CMU in fiscal 2017. See CMU litigation under “Note 10 - Commitments and Contingencies” for further information about the lawsuit.

The Agreement was accounted for as a multiple-element arrangement and accordingly, a valuation was completed to determine the estimated fair value of each identifiable element. As a result, the Company allocated $654.7 million to the mutual release of claims and covenant not to sue provisions; $81.3 million to the licensing of intellectual property in fiscal 2016; and the remaining $14.0 million representing the future use of the license through April 2018.

The $654.7 million for the mutual release of claims and covenant not to sue was recorded in fiscal 2016 as a settlement charge in operating expenses since there is no future benefit. The $81.3 million license fee was recorded in fiscal 2016 as a charge in cost of goods sold for past use of the license. The $14.0 million representing the future use of the license, willis to be recognized in cost of goods sold over the remaining term of the license from February 2016 through April 2018.

Accordingly, the Company recorded $6.2 million to cost of goods sold in fiscal 2017.


87


MARVELL TECHNOLOGY GROUP LTD.
NOTES TO CONSOLIDATED FINANCIAL STATEMENTS — (Continued)

Note 16 — Changes in the Company's Organization

In April 2016, the employment of Dr. Sehat Sutardja as Chief Executive Officer and Ms. Weili Dai as President was terminated by the Company’s Board of Directors. The Company considers its existing cash, cash equivalents and short-term investments to be sufficient to cover paymentBoard of Directors then formed an Interim Office of the $750 million settlement,Chief Executive and inappointed Maya Strelar-Migotti, Executive Vice President of the Smart Networked Devices and Solutions Business Group, and Dr. Pantelis Alexopoulos, Executive Vice President of the Storage Business Group, as Interim Co-Chief Executive Officers.

In April 2016, the Company completed full paymentannounced that it entered into an agreement with Starboard Value LP (“Starboard”), regarding the composition of its Board of Directors. Under the terms of the $750 millionagreement, the Company elected Peter A. Feld, Richard S. Hill, Oleg Khaykin, Michael Strachan and Robert Switz to CMU.

serve on its board. The agreement specifies that the Board would recommend and the Company would support and solicit proxies only for the election at the 2016 annual general meeting of Messrs. Feld, Hill, Khaykin, Strachan and Switz, the four independent directors serving on the Board immediately prior to the execution of the agreement, Dr. Juergen Gromer, Dr. John G. Kassakian, Arturo Krueger and Dr. Randhir Thakur, and Matthew J. Murphy, who joined the Company in July 2016 after the Board of Directors appointed him to serve as the Company’s President and Chief Executive Officer in June 2016.


Upon the commencement of Mr. Murphy’s employment, the Board subsequently appointed Richard S. Hill, the Chairman of the Board, as the Company’s Interim Principal Executive Officer, to serve in that capacity until the Company filed its Quarterly Report on Form 10-Q for the second quarter of fiscal 2017 (“Q217 Form 10-Q”). Mr. Murphy assumed the role of the Company’s principal executive officer immediately following the filing of the Q217 Form 10-Q.

In August 2016, the Company announced the appointment of Jean Hu as Chief Financial Officer effective August 22, 2016. David P. Eichler, the Company’s Interim Chief Financial Officer and principal financial officer, ceased serving as the Company’s principal financial officer upon Ms. Hu’s appointment as Chief Financial Officer. In September 2016, the Company announced the departure of Dr. Zining Wu as the Company’s Chief Technical Officer. In October 2016, the Company announced the appointment of David Caron as Chief Accounting Officer and Controller. 

MARVELL TECHNOLOGY GROUP LTD.At the Company’s Annual General Meeting of Shareholders held on November 8, 2016 (the “Annual Meeting”), shareholders whose shares were present either in person or by proxy voted upon the election of directors to the Board of Directors. The shareholders elected the following directors to serve until the next annual general meeting of shareholders: Peter Feld; Richard Hill; Oleg Khaykin; Matthew Murphy; Michael Strachan; Robert Switz; and Randhir Thakur. Immediately following the Annual Meeting, the terms of directors Dr. Sehat Sutardja, Weili Dai, Dr. Juergen Groemer, Dr. John Kassakian and Arturo Krueger expired. On November 15, 2016, the Board of Directors appointed Dr. Thakur to serve on the Audit Committee of the Board of Directors, effective immediately

. In December 2016, the Board of Directors appointed Tudor Brown as a member of the Board of Directors and the Executive Compensation Committee. In January 2017, Ms. Strelar-Migotti left the Company.


SUPPLEMENTARY DATA

(Unaudited)

The following table presents the unaudited consolidated statements of operations data for each of the eight quarters in the period ended January 30, 2016. 28, 2017. In connection with the Company’s announcement in November 2016 to restructure its operations to refocus its research and development, increase operational efficiency and improve profitability, it also plans to divest certain businesses and it began an active program to locate buyers for several businesses. As of January 28, 2017, two of these businesses were classified as discontinued operations. As required, the Company retrospectively recast its consolidated statements of operations and balance sheets for all period presented to reflect these business as discontinued operations.
In management’s opinion, this information has been presented on the same basis as the audited consolidated financial statements included in a separate section of this Annual Report on Form 10-K, and all necessary adjustments, consisting only of normal recurring adjustments, have been included in the amounts below to fairly state the unaudited quarterly results when read in conjunction with the audited consolidated financial statements and related notes. The operating results for any period should not be considered indicative of results to be expected in any future period. The Company expects the quarterly operating results to fluctuate in future periods due to a variety of reasons, including those discussed in Part I, Item 1A, “Risk Factors.”

   Fiscal 2016 
   First
Quarter (1)
   Second
Quarter (2)
  Third
Quarter (3)
  Fourth
Quarter (4)
 
   (In thousands, except per share amounts) 

Net revenue

  $724,288    $710,492   $674,890   $616,158  

Gross profit

  $373,135    $248,773   $295,636   $313,548  

Net income (loss)

  $14,090    $(771,940 $(57,750 $4,200  

Net income (loss) per share:


Basic

  $0.03    $(1.49 $(0.11 $0.01  

Diluted

  $0.03    $(1.49 $(0.11 $0.01  
   Fiscal 2015 
   First
Quarter (5)
   Second
Quarter (6)
  Third
Quarter (7)
  Fourth
Quarter (8)
 
   (In thousands, except per share amounts) 

Net revenue

  $957,830    $961,545   $930,136   $857,452  

Gross profit

  $463,970    $483,804   $475,162   $440,321  

Net income

  $99,479    $138,870   $115,304   $81,693  

Net income per share:


Basic

  $0.20    $0.27   $0.22   $0.16  

Diluted

  $0.19    $0.27   $0.22   $0.16  


88


Table of Contents

MARVELL TECHNOLOGY GROUP LTD.

 Fiscal 2017
 
First
Quarter 
 
Second
Quarter
 
Third
Quarter 
 
Fourth
Quarter (2)
 (In thousands, except per share amounts)
Net revenue$519,383
 $600,799
 $626,092
 $571,400
Gross profit (1)
$275,029
 $327,822
 $357,779
 $327,517
Income (loss) from continuing operations$(13,271) $56,688
 $77,454
 $(76,877)
Loss from discontinued operations$(9,408) $(5,383) $(4,838) $(3,214)
Net income (loss)$(22,679) $51,305
 $72,616
 $(80,091)
Income (loss) per share from continuing operations:       
       Basic$(0.03) $0.11
 $0.15
 $(0.15)
       Diluted$(0.03) $0.11
 $0.15
 $(0.15)
Loss per share from discontinued operations:       
       Basic$(0.01) $(0.01) $(0.01) $(0.01)
       Diluted$(0.01) $(0.01) $(0.01) $(0.01)
Net income (loss) per share:       
Basic$(0.04) $0.10
 $0.14
 $(0.16)
Diluted$(0.04) $0.10
 $0.14
 $(0.16)
 Fiscal 2016
 
First
Quarter (3)
 
Second
Quarter (4)
 
Third
Quarter (5)
 
Fourth
Quarter
 (In thousands, except per share amounts)
Net revenue$709,563
 $687,923
 $649,217
 $602,513
Gross profit (1)
$368,427
 $241,920
 $286,127
 $310,225
Income (loss) from continuing operations$27,112
 $(761,484) $(51,956) $17,173
Loss from discontinued operations$(13,022) $(10,456) $(5,794) $(12,973)
Net income$14,090
 $(771,940) $(57,750) $4,200
Income (loss) per share from continuing operations:       
       Basic$0.06
 $(1.47) $(0.10) $0.03
       Diluted$0.06
 $(1.47) $(0.10) $0.03
Loss per share from discontinued operations:       
       Basic$(0.03) $(0.02) $(0.01) $(0.02)
       Diluted$(0.03) $(0.02) $(0.01) $(0.02)
Net income (loss) per share:       
Basic$0.03
 $(1.49) $(0.11) $0.01
Diluted$0.03
 $(1.49) $(0.11) $0.01

(1)Gross profit as presented in the tables above is calculated as net revenue less cost of goods sold.
(2)The fourth quarter of fiscal 2017 includes $98.9 million of restructuring and other related charges that include $50.5 million for impairment of certain equipment, technology licenses and to fully impair a nonrefundable deposit due to non-utilization of the related contract and $68.0 million of tax expense related to restructuring actions taken.
(3)The first quarter of fiscal 2016 includes a charge for a cash payment authorized by our Board of Directors of $15.4 million to Dr. Sehat Sutardja (see “Note 14 — Related Party Transactions” in the Notes to the Consolidated Financial Statements) and $2.9 million of costs for the surety bonds related to the litigation with CMU.
(2)
(4)The second quarter of fiscal 2016 includes a $745.6 million charge for litigation matters recognized by the Company including the settlement reached with CMU (see “Note 15 — Subsequent Events” in the Notes to the Consolidated Financial Statements) and certain other pending litigation, $13.0 million of restructuring and other related charges, and $2.7 million of costs for the surety bonds related to the litigation with CMU.
(3)
(5)The third quarter of fiscal 2016 includes $45.5 million of restructuring and other related charges that include $8.0 million for the write down of inventory and $6.2 million for the impairment of equipment and other assets due to the restructuring of the mobile platform business, and $2.9 million of costs for the surety bonds related to the litigation with CMU.

89


(4)The fourth quarter of fiscal 2016 includes $4.4 million of restructuring and other related charges, $3.8 million related to the settlement of litigation matters including a charge for the settlement reached with CMU (see “Note 15 — Subsequent Events” in the Notes to the Consolidated Financial Statements) and $2.9 million of costs for the surety bonds related to the litigation with CMU.
(5)The first quarter of fiscal 2015 includes $8.5 million of restructuring and other exit-related costs that includes a $3.4 million write-off of IPR&D.
(6)The second quarter of fiscal 2015 includes an $8.8 million gain from the sale of an investment and $2.2 million of costs for the surety bonds related to the litigation with CMU.
(7)The third quarter of fiscal 2015 includes $2.3 million of costs for the surety bonds related to the litigation with CMU.
(8)The fourth quarter of fiscal 2015 includes $3.4 million of restructuring and other exit-related costs, and $2.8 million of costs for the surety bonds related to the litigation with CMU.

Item 9.Changes in and Disagreements with Accountants on Accounting and Financial Disclosure

On October 20, 2015, PricewaterhouseCoopers LLP (“PwC”) advised our Audit Committee of PwC’s resignation as the Company’s independent registered public accounting firm, effective on that date. The Audit Committee did not request, recommend or approve the resignation of PwC.

PwC’s audit reports on the Company’s consolidated financial statements as of and for the fiscal years ended January 31, 2015 and February 1, 2014 did not contain an adverse opinion or a disclaimer of opinion and were not qualified or modified as to uncertainty, audit scope or accounting principle.

During the two most recent fiscal years and the subsequent interim period through the date of PwC’s resignation, there were (1) no disagreements with PwC on any matter of accounting principles or practices, financial statement disclosure, or auditing scope or procedure which, if not resolved to the satisfaction of PwC, would have caused PwC to make reference to the subject matter of the disagreements in its reports on the financial statements for such years and (2) no “reportable events” (as defined in Item 304(a)(1)(v) of Regulation S-K) except as described below.

PwC advised the Company that it would need to expand the scope of the 2016 audit in the following areas: (1) the Company’s entity level controls, including whether senior management’s operating style resulted in an open flow of information and communication to set an appropriate tone for an effective control environment, (2) the Company’s process and controls over establishment of significant and judgmental reserves, including reserves for litigation and royalties, (3) the Company’s process and controls over identification, communication and approval of related party transactions, including assignment of intellectual property rights and (4) the adequacy of financial reporting resources, including sufficient personnel with appropriate knowledge, expertise and training commensurate with the Company’s corporate structure and financial reporting requirements. Due to its resignation, PwC did not undertake to expand the scope of the audit.

As of the date of resignation, PwC had not advised the Company that disclosures should be made or action should be taken to prevent future reliance on a previously issued audit report or completed interim review related to previously issued financial statements.

PwC has discussed these matters with the Audit Committee. The Company has authorized PwC to respond fully to any inquiries from any successor accountant concerning such matters.

None.

Item 9A.Controls and Procedures

Changes in Internal Control Over Financial Reporting

During the quarter ended January 30, 2016, the only change in our internal control over financial reporting that materially affected or was reasonably likely to materially affect our internal control over financial reporting was the hiring of a new Corporate Controller in December 2015, who later accepted a Chief Financial Officer position with another company effective June 1, 2016.

Audit Committee Investigation


As reported in the Current Report on Form 8-K filed by the Company with the SEC on March 1, 2016, and disclosed in our Quarterly Reports on Form 10-Q for the quarters ended August 1, 2015 and October 31, 2015, our Annual Report on Form 10-K for the fiscal year ended January 30, 2016 and our Quarterly Reports on Form 10-Q for the quarters ended April 30, 2016, July 30, 2016 and October 29, 2016, the Audit Committee (the “Audit Committee”) of the Company’s Board of Directors completed and made its findings with respect to an internal investigation (the “Audit Committee Investigation”). This investigation generally included a review of certain revenue recognized in the first and second quarters of fiscal 2016 and the fourth quarter of fiscal 2015, including transactions that would have, in the normal course of events and but for action by Marvell employees, been completed and recognized in a subsequent quarter (referred to internally as “pull-ins”), the accrual of a litigation reserve in the second quarter of fiscal 2016, and stated belief by the Company’sMarvell’s former Chief Executive Officer and Chairman of ownership of certain patent rights related to the Final-Level

Cache invention. The Audit Committee also reviewed disclosure concerning the foregoing matters and related circumstances, and whether senior management’s operating style during the relevant periods resulted in an open flow of information and communication to set an appropriate “tone at the top” for an effective control environment.


The Audit Committee identified no fraudulent activity in the course of this investigation. The Audit Committee’s key conclusions regarding this investigation included the following:


(a)revenue related to pull-in transactions during the subject periods was for most such transactions properly recognized in accordance with Marvell’s revenue recognition policy and generally accepted accounting principles, though for certain transactions Marvell’s internal controls were not fully followed and revenue from certain pull-in and distributor transactions was recognized prematurely based on certain provisions of the revenue recognition policy in place at the time;


(b)Marvell’s public disclosures for such periods related to revenue properly including pull-in transactions were not misleading;


(c)while Marvell’s former Chief Executive Officer and Chairman stated his belief that he had a good faith claim to ownership of the Final-Level Cache invention, the invention was owned by Marvell during all periods in which company resources related to such invention were deployed and, as a result, there were no errors in accounting related to the Final-Level Cache invention, and the disclosures relating to such invention contained in Marvell’s Form 10-Q for the first quarter of fiscal 2016 were not misleading; and


(d)while Marvell lacked a well-structured process to establish significant and judgmental reserves associated with litigation and royalties, there was no contemporaneous evidence that the increase in the reserve ultimately recorded in Marvell’s books and records for the second quarter of fiscal 2016 was not reasonable or appropriate.


The Audit Committee investigation also found certain “tone at the top” issues, including significant pressure on sales and finance personnel to meet revenue targets and the failure by Marvell’s former Chief Executive Officer and Chairman and by legal counsel to raise to the appropriate level at the appropriate times the initial assertion of Marvell’s former Chief Executive Officer and Chairman that he owned the Final-Level Cache invention, the patent applicationsrights for which he later assigned to Marvell.


Audit Committee Review of Certain Transactions

As noted above, the Audit Committee’s investigation included a review of pull-in transactions - transactions that would have, in the normal course of events and but for action by certain Marvell employees, been completed and recognized in a subsequent quarter (“Pull-In Transactions”). In the course of its investigation, the Audit Committee also identified certain transactions (the “Extended Payment Terms Transactions”) for which revenue was recognized prematurely based on certain provisions of the Company’s revenue recognition policy (the “Policy”) in effect at the time, namely, the provision of the Policy

90


that called for deferral of revenues associated with transactions having payment terms of 90 days or more (the “Deferral Provision”). Some of the Extended Payment Terms Transactions were also Pull-In Transactions, and some were not.

At the end of its investigation, the Audit Committee made certain conclusions described above regarding those Pull-In Transactions that the Audit Committee was able to confirm had been properly recognized as revenue in the periods originally recorded. With respect to the Extended Payment Terms Transactions, additional review was determined to be necessary. The additional review was then performed and the Company concluded that, as described below, application of the Deferral Provision to defer revenues on the Extended Payment Terms Transactions would have been inconsistent with U.S. Generally Accepted Accounting Principles (“GAAP”) and that the Extended Payment Terms Transactions were properly recognized in the periods originally recorded.

When coming to that conclusion, the Company re-evaluated the Extended Payment Terms Transactions based on GAAP, as opposed to the Policy, and the applicable facts and a number of considerations including, but not limited to, the following:

the Company’s policies establishing credit limits for each customer;

the Company has a history of collecting under the original terms of customer agreements with similar payment terms (i.e., contract terms, including payment, are historically not renegotiated or modified subsequent to sale);

the Company does not have a history of granting customer refunds;

the Company’s historical bad debt experience has been immaterial;

the Company’s end-customers have no return or exchange rights; and

the Company does not have a history of accepting product returns or exchanges from its end-customers.

The aggregate amount of revenue recognized from the Extended Payment Terms Transactions was:

(i)approximately $46 million recorded and properly recognized in accordance with GAAP in the fourth quarter of fiscal 2015, representing approximately 5.4% and 1.3% of net revenues for the fourth quarter and fiscal year of 2015, respectively (which according to the Deferral Provision of the Policy would have been recognized in Q1 of 2016), and

(ii)approximately $17 million recorded and properly recognized in accordance with GAAP in the first quarter of fiscal 2016, representing approximately 2.4% and 0.63% of net revenues for the first quarter and fiscal year of 2016, respectively (which according to the Deferral Provision of the Policy would have been recognized in Q2 of fiscal 2016).

With respect to the Deferral Provision not being consistent with GAAP, we took into account the deferral provision matter, including its specific application by finance and accounting personnel, together with other control deficiencies, as part of our determination that the Company had material weaknesses related to “Entity Level Controls,” “Sufficiency of Accounting and Finance Department Resources” and “Revenue Recognition” as described on page 112 of our Annual Report on Form 10-K for the fiscal year ended January 30, 2016.

Management’s Evaluation of Disclosure Controls and Procedures


Management, with the participation of our principal executive officer and principal financial officer, has evaluated the effectiveness of our disclosure controls and procedures (as defined in Rule 13a-15(e) of the Exchange Act) as of January 30, 2016.28, 2017. Disclosure controls and procedures are designed to ensure that information required to be disclosed in the reports we file or submit under the Exchange Act is recorded, processed, summarized and reported within the time periods specified in the rules and forms of the SEC and that such information is accumulated and communicated to management, including our principal executive officer and principal financial officer, as appropriate, to allow timely decisions regarding required disclosure. Based on this evaluation, our principal executive officer and principal financial officer concluded that our disclosure controls and procedures were not effective as of January 30, 201628, 2017 due to ensure that information required to be disclosed by us in reports that we file or submit under the Exchange Act is recorded, processed, summarized and reported within the time periods specified in Securities and Exchange Commission rules and forms and is accumulated and communicated to our management, including our principal executive officer and principal financial officer, as appropriate to allow timely decisions regarding required disclosures.

material weaknesses described below.


Notwithstanding the material weaknesses in our internal controls over financial reporting as of January 30, 2016,28, 2017, management has concluded that the consolidated financial statements included in this Form 10-K present fairly, in all material

91


respects, our financial position, results of operations and cash flows for the periods presented in conformity with accounting principles generally accepted in the United States.


Management’s Report on Internal Control Over Financial Reporting


Management is responsible for establishing and maintaining adequate internal control over financial reporting as defined in Rule 13a-15(f) of the Exchange Act. Our internalInternal control over financial reporting isconsists of policies and procedures that: (1) pertain to the maintenance of records that, in reasonable detail, accurately and fairly reflect the transactions and dispositions of the assets of the Company; (2) are designed and operated to provide reasonable assurance regarding the reliability of our financial reporting and our process for the preparation of financial statements for external purposes in accordance with generally accepted accounting principles.principles and that receipts and expenditures of the Company are being made only in accordance with authorizations of management and directors of the Company; and (3) provide reasonable assurance regarding prevention or timely detection of unauthorized acquisition, use or disposition of the Company’s assets that could have a material effect on the financial statements.

Our internal control over financial reporting is designed by, and under the supervision of the principal executive officer and principal financial officer and effected by the Company’s Board of Directors, management, and others. Because of its inherent limitations, internal control over financial reporting may not prevent or detect misstatements. Also, projections of any evaluation of effectiveness to future periods are subject to the risk that controls may become inadequate because of changes in conditions, or that the degree of compliance with the policies or procedures may deteriorate.


Management has evaluated the effectiveness of our internal control over financial reporting as of January 30, 201628, 2017 using the criteria set forth in theInternal Control - Integrated Framework (2013)issued by the Committee of Sponsoring Organizations of the Treadway Commission (“COSO”). A material weakness is a deficiency, or a combination of deficiencies, in internal control over financial reporting, such that there is a reasonable possibility that a material misstatement of the company’s annual or interim financial statements will not be prevented or detected on a timely basis. In connection with management’s assessment of our internal control over financial reporting described above, management has identified the following deficiencies that constituted individually, or in the aggregate, material weaknesses in our internal control over financial reporting as of January 30, 2016.28, 2017.


Entity Level Controls— The control environment, risk assessment, control activities, information and communication, and monitoring controls were not effective. These controls are the responsibility of senior management, who sets the tone of the organization, influences the control consciousness of employees, and is the foundation for internal control over financial reporting. As noted above, the Audit Committee investigation identified certain “tone at the top” issues that contributed to an ineffective control environment and to the deficiencies aggregating to the material weaknesses set forth below. The Company’s entity level controls related to assessing risk and communication of information, including the reporting of information to management and the Board of Directors, did not operate effectively as they relied upon information derived from processes where applicable controls were not fully followed.

Sufficiency of Accounting and Finance Department Resources — - The Company had insufficient finance and accounting department resources with appropriate knowledge, expertise and training commensurate with the Company’s corporate structure and financial reporting requirements to effectively assess risk, and design, operate and oversee effective internal controls over financial reporting. The Company has experienced significant turnover at the senior financial management level. TheThis lack of certain appropriate resources in the Company’s accounting and finance departments contributed to an ineffective control environment. This lack of resources resulted in inconsistent expectations around the preparation, review and maintenance of documentation critical to the design and consistent execution of internal controls as well as a lack of segregation of duties in certain controls. Further, the lack of appropriate resources resulted in controls that relied upon information that did not have sufficiently precise controls around accuracy and completeness of that information and was therefore not reliable. These factors contributed to deficiencies in the Company’s financial reporting process over (i) the establishment of significant and judgmental reserves, which included reserves for litigation and royalties, (ii) the Company’s process and controls over identification, communication and approval of related party transactions, and (iii)due to a lack of precision in the review controls over certain information and assumptions impacting various financial reporting areas including those items that are nonrecurring in nature and monitoringtherefore bear a greater degree of complexity given their infrequency. Additionally, they contributed to deficiencies in the Company’s termsability to identify, assess and conditions formonitor the appropriate accounting treatment of certain contractual arrangements to verify that all critical contract terms were communicated to accounting and finance for assessment.arrangements.


Revenue Recognition — - The Company’s internal controls to identify, accumulate and assess the accounting impact of certain concessions or side agreements on whether the Company’s revenue recognition criteria had been met were in certain instances not fully followed or were not effective. As noted above, the Audit Committee identified certain “tone at the top” issues, due to which theThe Company’s controls were not effective to ensure (i) consistent standards in the level of documentation of agreements required to support accurate recording of revenue transactions, and (ii) that such documentation is retained, completed,complete, and independently reviewed to ensure certain terms impacting revenue recognition were accurately reflected in the Company’s books and records.

Process to Identify Contingencies, Including Those Related to the Company’s Intellectual Property —The Company’s internal controls over contingencies were not effective as the Company lacked a well-structured process, including granting appropriate authority to senior legal management, to ensure the identification of actual and potential claims, and the assessment of probability of loss related to them. The Company also lacked a well-structured process to ensure the timely assignment to the Company of intellectual property.


Because of these material weaknesses, management has concluded that we did not maintain effective internal control over financial reporting as of January 30, 2016.

28, 2017.


The effectiveness of our internal control over financial reporting as of January 30, 201628, 2017 has been audited by Deloitte & Touche LLP, our independent registered public accounting firm, as stated in its report which is included elsewhere herein.

Remediation Efforts


92


Changes to Address Material Weaknesses

OurInternal Control over Financial Reporting


During the fiscal year ended January 28, 2017, management has worked, and continues to work, to strengthen our internal control over financial reporting. We are committed to ensuring that such controls are designed and operating effectively. Since identifying the material weaknesses in our internal control over financial reporting, we have developed and subsequent to year end implemented remediation plans to address these control failures. Ourcomplete the following activities to remediate previously identified material weaknesses:

Made significant changes to our executive management team and Board of Directors and management take internalthat have improved our entity level controls, over financial reporting and the integrity of the Company’s financial statements seriously and believe that the remediation steps described below, including with respect to personnel changes, were and are essential steps to maintaining strong and effective internal controls over financial reporting and a strong internal control environment.

The Company has taken significant steps to address the material weaknesses set forth above. The Company believes that making the following changes are critical steps toward addressing theour “tone at the top” concerns that contributed to the material weaknesses it has identified.

The following steps are among the measures that have been implemented or will be implemented as soon as practicable after the date of this filing:

Entity Level Controls

top.”

By unanimous action of the Board of Directors, we appointed five new independent directors to our Board of Directors. Two of the new members of the Board have significant finance and accounting experience, have been appointed to the Audit Committee, and have been determined by the Board of Directors to be “audit committee financial experts” as defined in rules promulgated by the SEC.


Replaced certain senior managers and executives, including the Company’s former CEO and former President.

We

In May 2016, appointed five new independent directors to our Board of Directors, two of whom were appointed to the Audit Committee and have been determined by the Board of Directors to be “audit committee financial experts” as defined in rules promulgated by the SEC. Concurrently, we appointed a new Chairman of our Board of Directors.

In May 2016, appointed a new Executive Vice President and Chief Legal Officer and Secretary of the Company who is designated an executive officer of the Company and who communicates directly with the Company’s Board of Directors on matters of compliance, litigation and other relevant matters.

In June 2016, appointed a new Chief Executive Officer who has provided strong leadership to the Company and established open lines of communication with his internal business unit leaders and external partners.

In August 2016, appointed a new Chief Financial Officer who has brought expertise and leadership to the Company and our finance team, and has established open lines of communication with internal business unit leaders and the finance and accounting team world-wide.

In October 2016, appointed a new Controller and Chief Accounting Officer who has brought additional technical expertise to our finance and accounting function and supports the Company’s substantial efforts to design, operate and oversee effective internal controls over financial reporting (including hiring of additional resources within our global accounting organization).

Hired a new ChairmanSenior Vice President of our BoardFinance and Assistant Corporate Controller to increase the depth and breadth of Directors.

We recently appointed a new Chief Executive Officer who we expect will provide strong leadership toknowledge and expertise commensurate with the CompanyCompany’s corporate structure and establish open lines of communication with his internal business unit leaders and external partners.

financial reporting requirements.

We are actively engaged in a search for a new, permanent Chief Financial Officer who we expect will bring expertise and leadership to the Company and our finance team and establish open lines of communication with his or her internal business unit leaders and the finance and accounting team world-wide.


We conductedConducted a training program for our executives, vice presidents and associate vice presidents, led by our executive management team, to enhance awareness and understanding of the Company’s Code of Conduct and Ethics Policy and the importance of financial reporting integrity. We are developingintegrity, and planning to implementdeveloped and implemented a similar program for finance, operations and sales personnel and others involved in the sales process.

Training of new personnel is ongoing.

In accordance

Redesigned our controls over obtaining background checks to include hiring of employees with changes to the Audit Committee Charter approved by the Board on September 23, 2015, the Audit Committee now approves futurea title of Vice President or higher in our foreign operations.

Redesigned our process for approving earnings guidance in accordanceto incorporate approval from our Audit Committee.

Redesigned our process for approving compensation arrangements for any employee with the Company’s normal earnings cycle.

In accordance with changes to the Executive Compensation Committee Charter approved by the Board on September 23, 2015, the Executive Compensation Committee now reviews and approves the compensation arrangements of any employees with a title of Associate Vice President or higher reporting directly to the Chief Executive Officer, including, but not limited to, those designated as executive officers. As a result, we now require approval from the Executive Compensation Committee (a committee of our Board of Directors). We believe this provides more transparent monitoring of performance of, and incentives offered to, senior management that may influence “tone at the top.”

Sufficiency


Adopted an updated patent disclosure and assignment policy that includes augmented procedures for review of Accountingclaims of individual ownership and Finance Department Resources

enhanced processes with respect to patent disclosure and assignment.

We are actively engaged in a search for a new Chief Financial Officer who we expect will provide strong leadership

Management reports to the Audit Committee on the methodologies used and basis of estimates for the establishment of significant and judgmental reserves, including litigation and royalties.


93


Revised our revenue recognition policy to prohibit Company-initiated “pull-in” transactions. For fiscal 2017, “pull ins” had no meaningful effect on our revenue.

In the fourth quarter of fiscal 2017, the Company and, in particular,implemented the following additional changes to its internal control over financial reporting to remediate its material weaknesses:

Redesigned our controls over updates to our financerelated party list and accounting function, and establish open linesreceipt of communication with his or her staff and internal business partners.

We have hired a new Senior Vice Presidentcertifications used by our executive officers in support of Finance and a new Assistant Controller to increase the depth and breadth of knowledge and expertise commensurateour periodic filings with the Company’s corporate structureSEC.


Prepared and financial reporting requirements. These new finance team members will supportthen communicated to the Board of Directors an entity risk management assessment that incorporated feedback from personnel throughout the Company’s substantial effortsorganization to design, operateassist the Board in their oversight and oversee effectivemonitoring of the Company’s business operations.

Redesigned our internal controls over financial reporting.

litigation contingencies and regulatory compliance, including incorporating feedback from both legal and accounting personnel.

We are actively engaged in a search for

Hired a new Chief Accounting OfficerDirector of Revenue who has brought expertise related to revenue accounting and Controller who we expect will bring additional technical expertisethe business processes required to our finance and accounting function and will supportensure revenue is properly recognized in accordance with U.S. GAAP.

Revised the Company’s substantial effortsrevenue recognition policy to design, operate and oversee effective internal controls over financial reporting.

ensure it complies with GAAP in all material respects.


We continue to enhance the Company’s finance and accounting department staff, in terms of both number and competency of personnel, particularly in the area of revenue recognition and technical accounting. We expect ourOur new senior finance and accounting team to contributemembers are contributing their substantial experience and abilities to raise the level of expertise across the finance and accounting teams.

functions.

The Audit Committee directed our Interim Chief Financial Officer, in coordination with our new Chief Legal Officer, to undertake a comprehensive review of the procedures to be followed by the Company for establishing significant and judgmental reserves, including reserves for litigation and royalties. As a result, a more comprehensive policy has been established and will be adhered to going forward. In addition, management will continue to report to the Audit Committee the methodologies used and basis of estimates for the establishment of significant and judgmental reserves.


We are in the process of developing a roles and responsibilities matrix for our key accounting and operations personnel to incorporate segregation of duties considerations. We expect our incomingrecently hired senior finance personnel to contribute their significant expertise to this process.

Revenue Recognition

We have revised our revenue recognition policy

The Audit Committee has directed management to prohibit Company-initiated “pull-in” transactions. For fiscal 2017, “pull-ins” will have no meaningful effect on our revenue.

identify additional resources and develop a detailed plan and timetable for executing and monitoring the identification, implementation and completion of remedial measures related to the identified material weaknesses.


As noted above, we conducted a training program for our executive officers, vice presidents and associate vice presidents, led by our executive management team, to enhance awareness and understandingresult of the Company’s Code of Conduct above activities, management determined that the material weaknesses related to “Entity Level Controls” and Ethics Policy and the importance of financial reporting integrity. We are developing and planning to implement a similar program for finance, operations and sales personnel and others involved in the sales process.

Process to Identify Contingencies, Including Those Related to the Company’s Intellectual Property.Property”

were remediated as of January 28, 2017.


Our management has worked, and continues to work, to strengthen our internal control over financial reporting. We are committed to ensuring that such controls are designed and operating effectively. The remaining material weaknesses will not be considered remediated until the applicable remedial controls operate for a sufficient period of time and management has concluded, through testing, that these controls are operating effectively.

Our Board of Directors and management take internal controls over financial reporting and the integrity of the Company’s financial statements seriously and believe that the steps taken to remediate material weaknesses were and are essential steps to maintaining strong and effective internal controls over financial reporting and a strong internal control environment.

The Audit Committee directed the Company to hire a Chief Legal Officer, such position having the authority of an executive officer (as defined in SEC rules) and to be deemed as such. The Company has hired a new Executive Vice President and Chief Legal Officer to fill this role.

The Audit Committee directed the Interim CFO, in coordination with the Chief Legal Officer, to undertake a comprehensive review of the procedures to be followed by the Company for establishing significant and judgmental reserves, including reserves for litigation and royalties. As a result, a more comprehensive policy has been established and will be adhered to going forward. In addition, management will continue to report tomonitor management’s remediation activities until the Audit Committee the methodologies used and basis of estimates for the establishment of significant and judgmental reserves.

We are in the process of adopting an updated patent disclosure and assignment policy that includes augmented procedures for review of claims of individual ownership and enhanced processes with respect to patent disclosure and assignment. We expect our new Chief Legal Officer to contribute his significant experience to this process.

The Audit Committee has directed management to develop a detailed plan and timetable for the completion of the implementation of the foregoing remedial measures and will monitor their implementation.identified material weaknesses have been fully remediated. In addition, under the direction of the Audit Committee, management will continuecontinues to review and make necessary changes to the overall design of our internal control environment, as well as to our policies and procedures, in order to improve the overall effectiveness of internal control over financial reporting.

Aside from above remediations, we reconstituted


Except as noted in the memberships and chairmanships ofpreceding paragraphs, no other change in the audit committee, the executive compensation committee and the nominating and governance committee.

We are committed to maintaining a strong internal control environment, and believe that these remediation actions represent significant improvements in our controls. Additional remediation measures continue to be considered and will be implemented as appropriate. We will continue to assess the effectiveness of our remediation efforts in connection with our evaluations ofCompany's internal control over financial reporting (as defined in Rule 13a-15(f) under the Securities Exchange Act of 1934) occurred during the fiscal quarter ended January 28, 2017, that has materially affected, or is reasonably likely to materially affect, the Company's internal control over financial reporting.


94


Inherent Limitations on Effectiveness of Controls


Our management, including our principal executive officer and our principal financial officer, does not expect that our disclosure controls or our internal control over financial reporting will prevent or detect all error and all fraud. A control system, no matter how well designed and operated, can provide only reasonable, not absolute, assurance that the control system’s objectives will be met. The design of a control system must reflect the fact that there are resource constraints and the benefits of controls must be considered relative to their costs. Further, because of the inherent limitations in all control systems, no evaluation of controls can provide absolute assurance that misstatements due to error or fraud will not occur or that all control issues and instances of fraud, if any, have been detected. The design of any system of controls is based in part on certain assumptions about the likelihood of future events and there can be no assurance that any design will succeed in achieving its stated goals under all potential future conditions. Projections of any evaluation of the effectiveness of controls to future periods are subject to risks. Over time, controls may become inadequate because of changes in conditions or deterioration in the degree of compliance with policies or procedures.

Item 9B.Other Information

None


95


REPORT OF INDEPENDENT REGISTERED PUBLIC ACCOUNTING FIRM

To the Board of Directors and Shareholders of

Marvell Technology Group Ltd.

Santa Clara, California


We have audited Marvell Technology Group Ltd.’s and subsidiaries’ (the “Company’s”)the internal control over financial reporting of Marvell Technology Group Ltd. and subsidiaries (the "Company") as of January 30, 2016,28, 2017, based on criteria established in Internal Control - Integrated Framework (2013) issued by the Committee of Sponsoring Organizations of the Treadway Commission. The Company’sCompany's management is responsible for maintaining effective internal control over financial reporting and for its assessment of the effectiveness of internal control over financial reporting, included in the accompanying Management’s Report on Internal Control Overover Financial reporting.Reporting. Our responsibility is to express an opinion on the Company’sCompany's internal control over financial reporting based on our audit.

We conducted our audit in accordance with the standards of the Public Company Accounting Oversight Board (United States). Those standards require that we plan and perform the audit to obtain reasonable assurance about whether effective internal control over financial reporting was maintained in all material respects. Our audit included obtaining an understanding of internal control over financial reporting, assessing the risk that a material weakness exists, testing and evaluating the design and operating effectiveness of internal control based on that risk, and performing such other procedures as we considered necessary in the circumstances. We believe that our audit provides a reasonable basis for our opinion.

A company’scompany's internal control over financial reporting is a process designed by, or under the supervision of, the company’scompany's principal executive and principal financial officers, or persons performing similar functions, and effected by the company’scompany's board of directors, management, and other personnel to provide reasonable assurance regarding the reliability of financial reporting and the preparation of financial statements for external purposes in accordance with generally accepted accounting principles. A company’scompany's internal control over financial reporting includes those policies and procedures that (1) pertain to the maintenance of records that, in reasonable detail, accurately and fairly reflect the transactions and dispositions of the assets of the company; (2) provide reasonable assurance that transactions are recorded as necessary to permit preparation of financial statements in accordance with generally accepted accounting principles, and that receipts and expenditures of the company are being made only in accordance with authorizations of management and directors of the company; and (3) provide reasonable assurance regarding prevention or timely detection of unauthorized acquisition, use, or disposition of the company’scompany's assets that could have a material effect on the financial statements.

Because of the inherent limitations of internal control over financial reporting, including the possibility of collusion or improper management override of controls, material misstatements due to error or fraud may not be prevented or detected on a timely basis. Also, projections of any evaluation of the effectiveness of the internal control over financial reporting to future periods are subject to the risk that the controls may become inadequate because of changes in conditions, or that the degree of compliance with the policies or procedures may deteriorate.

A material weakness is a deficiency, or a combination of deficiencies, in internal control over financial reporting, such that there is a reasonable possibility that a material misstatement of the company’s annual or interim financial statements will not be prevented or detected on a timely basis.

The Company’s entity level controls were not effective due to certain “tone at the top” issues which contributed to an ineffective control environment and to deficiencies aggregating to additionalfollowing material weaknesses noted herein. Thehave been identified and included in management's assessment: the Company did not have sufficient accounting and finance department resources to effectively assess risk, and design, operate and oversee effective internal controls over financial reporting, which contributed to the failure in the effectiveness of certain controls. In addition,controls, and the Company’s controls related to revenue recognition and contingencies, including those related to the Company’s intellectual property, were not effective.

These material weaknesses were considered in determining the nature, timing, and extent of audit tests applied in our audit of the consolidated financial statements and financial statement schedule as of and for the year ended January 28, 2017, of the Company and this report does not affect our report on such financial statements and financial statement schedule.
In our opinion, because of the effect of the material weaknesses identified above on the achievement of the objectives of the control criteria, the Company has not maintained effective internal control over financial reporting as of January 30, 2016,28, 2017, based on the criteria established in Internal Control - Integrated Framework (2013) issued by the Committee of Sponsoring Organizations of the Treadway Commission.

We have also audited, in accordance with the standards of the Public Company Accounting Oversight Board (United States), the consolidated financial statements and financial statement schedule as of and for the year ended January 30, 2016,28, 2017, of the Company and our report dated July 21, 2016March 27, 2017 expressed an unqualified opinion on those financial statements.

/s/ Deloitte & Touche LLP

San Jose, California

July 21, 2016

statements and financial statement schedule.


96


/s/ Deloitte & Touche LLP
San Jose, California
March 27, 2017

97


PART III

Item 10.Directors, Executive Officers and Corporate Governance

Board

The information required by Items 401 and 407(c)(3) of Directors

The following table shows information aboutRegulation S-K with respect to our board of directors, as of July 12,2016:

Name

Age

Position(s)

Richard S. Hill

64Chairman of the Board of Directors, Interim Principal Executive Officer

Mathew J. Murphy

43Director, President and Chief Executive Officer

Weili Dai

54Director

Peter A. Feld

37Director

Juergen Gromer, Ph.D

71Director

John G. Kassakian, Sc.D.

73Director

Oleg Khaykin

51Director

Arturo Krueger

76Director

Michael Strachan

67Director

Dr. Sehat Sutardja

54Director

Robert E. Switz

69Director

Dr. Randhir Thakur

53Director

Richard S. Hill has served as our Chairman of the Board of Directors since May 2016 and our Interim Principal Executive Officer since July 2016. Mr. Hill has served as a member of the Board of Directors of Tessera Technologies since August 2012 and as Chairman of the Board since March 2013. Mr. Hill also served as Tessera’s Interim Chief Executive Officer from April 15, 2013 until May 29, 2013. Mr. Hill previously served as the Chairman and Chief Executive Officer and member of the board of directors of Novellus Systems Inc. until its acquisition by Lam Research Corporation in June 2012. Before joining Novellus in 1993, Mr. Hill spent 12 years with Tektronix Corporation, a leading designer and manufacturer of test and measurement devices. Presently, Mr. Hill is a member of the Boards of Directors of Autodesk, Inc., Arrow Electronics, Inc., Cabot Microelectronics Corporation, and Yahoo, Inc. Mr. Hill received a Bachelor of Science in Bioengineering from the University of Illinois in Chicago and a Master of Business Administration from Syracuse University. Mr. Hill brings to the board extensive expertise indirector nominees, executive management and engineering for technology companies, as well as considerable directorial and governance experience developed through his service on the boards of directors of several public companies, to his role as Chairman of the Board.

Matthew J. Murphyhas served as our President and Chief Executive Officer and a director since July 11, 2016. Mr. Murphy joined Marvell from Maxim Integrated, where he spent 22 years with increasing responsibilities in sales and business unit leadership. Most recently, he was Executive Vice President, Business Units, Sales & Marketing. In that capacity, he had company-wide profit and loss responsibility, leading all product development, sales and field applications, marketing, and central engineering. From 2011 to 2015, he was Senior Vice President of the Communications and Automotive Solutions Group, leading the team that developed differentiated solutions for those markets. From 2006 to 2011, he was Vice President, Worldwide Sales & Marketing during a time when Maxim’s sales expanded significantly. Prior to 2006, he served in a variety of business unit management and customer operations roles. Mr. Murphy holds a Bachelor of Arts in English from Franklin & Marshall College and is a graduate of the 2010 Stanford Executive Program. Mr. Murphy brings to the board both extensive industry knowledge, and, as a result of his day-to-day involvement in Marvell’s business, insight and information related to the Company’s strategy, financial condition, operations, competitive position and business.

Ms. Weili Dai, one of our co-founders, has served as a director since December 2014. Ms. Dai also served as our President from July 2013 until April 2016. Prior to her appointment as President, Ms. Dai served as a Vice President of Marvell Semiconductor, Inc. (“MSI”) from 2008 to July 2013, including the position of General

Manager of the Communications & Consumer Business of MSI since September 2011 and General Manager of the Communications and Computing Business Unit of MSI from March 2009 to September 2011. From April 2006 to May 2007, Ms. Dai served as Chief Operating Officer, Executive Vice President and a member of the Board of Directors of the Company. Ms. Dai holds a Bachelor of Science degree in Computer Science from the University of California at Berkeley. Ms. Dai is the wife of Dr. Sutardja. Ms. Dai is the only woman co-founder of a global semiconductor company, and is widely considered a technology visionary in the industry and a role model for women in technology. Newsweek named Ms. Dai one of the “150 Women Who Shake the World” and Forbes Magazine has listed Ms. Dai as one of the “World’s 100 Most Powerful Women.” The Global Semiconductor Alliance (GSA) recognized Ms. Dai and Mr. Sutardja with the 2013 Dr. Morris Chang Exemplary Leadership Award. She has also been profiled by CNN International for the Leading Women Series: Leading the Female Tech Charge, Leading Women Principles Fair and Care, Educating for Future Success, and Leading Women Inspire Others. Ms. Dai brings to the board her extensive knowledge of Marvell’s business and her expertise in the semiconductor industry.

Peter A. Feld has served as a director since May 2016. Mr. Feld has been a Managing Member and the Head of Research of Starboard Value LP (an investment fund) since 2011. Prior to joining Starboard, Mr. Feld served as a Managing Director of Ramius LLC and a Portfolio Manager of Ramius Value and Opportunity Master Fund Ltd. from November 2008 to April 2011. He currently serves as a director of The Brink’s Company, a provider of security-related services, and Insperity, Inc., a provider of human resources and business performance solutions. During the past five years, Mr. Feld has also served as a director of Darden Restaurants, Inc., Tessera Technologies, Inc., Integrated Device Technology, Inc., Unwired Planet, Inc. and Sea Change International, Inc. Mr. Feld received a Bachelor of Arts in economics from Tufts University. Mr. Feld brings to the board his extensive knowledge of the capital marketsofficers and corporate governance practices as a resultis incorporated by reference herein to the information set forth under the captions “Board of his investmentDirectors and private equity background.

Dr. Juergen Gromer has served as a director since October 2007. Dr. Gromer is the retired President of Tyco Electronics Ltd., an electronics company, a position he held from April 1999 until December 31, 2007. Dr. Gromer formerly held senior management positions from 1983 to 1998 at AMP Incorporated (acquired by Tyco International in April 1999), including Senior Vice President of Worldwide Sales and Services, PresidentCommittees of the Global Automotive Division, Vice PresidentBoard” and "Executive Officers" in our definitive proxy statement in connection with our 2017 annual general meeting of Central and Eastern Europe and General Manager of AMP Germany. Dr. Gromer also serves on the boards of TE Connectivity Ltd., (formerly Tyco Electronics Ltd) and WABCO Holdings Inc., and previously served as a director of RWE Rhein Ruhr from 2000shareholders to 2009. Dr. Gromer is also Chairman of the Board of the Society of Economic Development of the District Bergstrasse/Hessen and a director of the Board of the American Chamber of Commerce in Germany. Dr. Gromer received his undergraduate degree and Ph.D. in Physics from the University of Stuttgart, Germany. Dr. Gromer brings considerable directorial, financial, governance and global leadership experience to our board of directors.

Dr. John G. Kassakian has served as a director since July 2008. Dr. Kassakian has been a member of the faculty of Electrical Engineering and Computer Science at the Massachusetts Institute of Technology (“MIT”) since 1973 and has served as Director of the MIT Laboratory for Electromagnetic and Electronic Systems from 1991 to 2009. Dr. Kassakian is the founding President of the IEEE Power Electronics Society, a member of the National Academy of Engineering, and is the recipient of the IEEE Centennial Medal, the IEEE William E. Newell Award, the IEEE Power Electronics Society’s Distinguished Service Award and the IEEE Millennium Medal. Dr. Kassakian holds S.B., S.M., E.E. and Sc.D. degrees from MIT. Dr. Kassakian brings to the board his extensive expertise in the semiconductor field and academic experience related to the technology sector.

Oleg Khaykin has served as a director since May 2016. Mr. Khaykin has served as the President and Chief Executive Officer and a member of the board of directors of Viavi Solutions, a provider of network and service enablement solutions, since February 2016. Prior to joining Viavi, Mr. Khaykin was a Senior Advisor at Silver Lake Partners. From March 2008 to January 2015, he was President and Chief Executive Officer and a member of the board of directors of International Rectifier, a maker of power semiconductors, which was acquired by Infineon Technology AG. Before joining International Rectifier, Mr. Khaykin served most recently as the Chief

Operating Officer of Amkor Technology, Inc., a provider of semiconductor assembly and test services. Mr. Khaykin was previously a member of the board of directors of Zarlink Semiconductor Inc. Mr. Khaykin received a Bachelor of Science in Electrical Engineering from Carnegie-Mellon, and a Master of Business Administration from Northwestern University’s J.L. Kellogg Graduate School of Management. Mr. Khaykin brings to the board his extensive experience in the semiconductor industry combined with significant executive management experience.

Arturo Krueger has served as a director since August 2005 and served as our lead independent director from April 2009 to May 2016. Mr. Krueger has more than 40 years of experience in the international semiconductor industry. From 1966 to 2001, Mr. Krueger served in a number of roles at Motorola, starting as Systems Engineer and then moving into international Design and R&D Management, Marketing and Operations. Starting in 1996 Mr. Krueger served as the director of the sector wide “Advanced Architectural and Design Automation Lab.” Prior to his retirement in February 2001, Mr. Krueger was promoted to Corporate Vice President and General Manager of Motorola Corporation’s Semiconductor Products Sector for Europe, Middle East and Africa. Since his retirement in February 2001, Mr. Krueger has been a consultant to automobile manufacturers and to semiconductor companies serving the automotive and telecommunication markets. He currently serves on the board of QuickLogic Corporation, a semiconductor company. Mr. Krueger holds a Master of Science in Electrical Engineering from the Institute of Technology in Switzerland and has studied Advanced Computer Science at the University of Minnesota. Mr. Krueger brings to the board a deep understanding of the semiconductor industry and microelectronic systems design and architectures, as well as considerable directorial and governance experience.

Michael Strachanhas served as a director since May 2016. From March 2009 to May 2014, he was a director at LSI Logic, including Chairman of the Audit Committee for most of that time. Mr. Strachan retired from Ernst & Young LLP in December 2008. From July 2007 until December 2008, he was a member of Ernst & Young’s America’s Executive Board, which oversaw the firm’s strategic initiatives in North and South America. From July 2006 to December 2008, he was a member of Ernst & Young’s U.S. Executive Board, which oversaw partnership matters in the U.S. for the firm. From July 2000 through December 2008, he was Vice Chairman and Area Managing Partner for Ernst & Young offices between San Jose, California and Seattle, Washington, and was responsible for oversight of the firm’s operations in that area. He began his career at Ernst & Young in 1976. Mr. Strachan holds a Bachelor of Science in Accounting from Northern Illinois University. Mr. Strachan brings to the board deep expertise relating to finance and accounting matters and extensive business management, governance and leadership experience.

Dr. Sehat Sutardja, one of our co-founders, has served as a director since the company’s inception in February 1995. Dr. Sutardja served as Chief Executive Officer and President from February 1995 to July 2013 and served as Chief Executive Officer from July 2013 to April 2016. He also served as Co-Chairman of the Board of Directors from 1995 until 2003 and as Chairman of the Board from 2003 until May 2016. Dr. Sutardja is widely regarded as one of the pioneers of the modern semiconductor age. His breakthrough designs and guiding vision have revolutionized numerous industry segments, from data storage to the high-performance, low-power chips now driving the growing global markets for mobile computing and telephony. He has been awarded more than 440 patents and has been named a Fellow of IEEE. In 2006, Dr. Sutardja was recognized as the Inventor of the Year by the Silicon Valley Intellectual Property Law Association. In 2012, Dr. Sutardja, was awarded the Indonesian Diaspora Lifetime Achievement Award for Global Pioneering and Innovation , presented by the Embassy of the Republic of Indonesia. The Global Semiconductor Alliance (GSA) recognized Dr. Sutardja and Ms. Dai with 2013 Dr. Morris Chang Exemplary Leadership Award. Dr. Sutardja holds a Master of Science and Ph.D. in Electrical Engineering and Computer Science from the University of California at Berkeley and a Bachelor of Science in Electrical Engineering from Iowa State University. Dr. Sutardja is the husband of Ms. Weili Dai. Mr. Sutardja brings to the board his extensive experience with technological innovation, his knowledge of Marvell’s technology and business and his expertise in the semiconductor industry.

Robert E. Switz has served as a director since May 2016. Mr. Switz has served as the Chairman of the Board of Micron Technology, Inc. since 2012. He was the Chairman, President and Chief Executive Officer of ADC

Telecommunications, Inc., (“ADC”), a supplier of network infrastructure products and services from August 2003 until December 2010, when Tyco Electronics Ltd. acquired ADC. Mr. Switz joined ADC in 1994 and throughout his career therebe held numerous leadership positions. Prior to ADC, Mr. Switz spent six years at Burr-Brown Corporation, most recently as Chief Financial Officer, Vice President of European Operations and Director of the Systems and Ventures Business. Mr. Switz serves on the Board of Directors of Gigamon Inc., and previously served as a director of GT Advanced Technologies and as lead independent director of Broadcom Corporation until its merger with Avago Technologies Limited. Mr. Switz received a Bachelor of Science in Business Administration from Quinnipiac University and a Master of Business Administration in Finance from the University of Bridgeport. Mr. Switz brings to the board his extensive global operations, financial and general management experience and expertise, as well as considerable directorial and governance experience developed through his service on the boards of directors of several public companies.

Dr. Randhir Thakur has served as a director since June 2012. He was executive vice president and general manager of the Silicon Systems Group at Applied Materials, Inc.15, 2017 (the “2017 Proxy Statement”), which comprisedwill be filed with the entire portfolio of semiconductor manufacturing systems at Applied Materials. After rejoining Applied Materials in May 2008, Dr. Thakur served in various executive positions, including senior vice president and general manager of the Display and Thin Film Solar group. From 2005 to May 2008, Dr. Thakur worked at SanDisk Corporation, a supplier of innovative flash memory data storage products, where he served as executive vice president of Technology and Fab Operations and head of Worldwide Operations. From 2000 to 2005, Dr. Thakur held a number of roles within various semiconductor product groups at Applied Materials, including group vice president and general manager of Front End Products. Dr. Thakur holds close to 300 patents and has published moreSEC no later than 200 papers. Dr. Thakur holds a Bachelor of Science with honors in Electronics and Telecommunications Engineering from the National Institute of Technology, Kurukshetra, India, a Master of Science in Electrical Engineering from the University of Saskatchewan, Canada and a Ph.D. in Electrical Engineering from the University of Oklahoma. Dr. Thakur brings to the board a wealth of experience in the semiconductor and consumer electronics industry.

Except as noted above, there are no family relationships among any of our directors and executive officers.

120 days after January 28, 2017.

Section 16(a) Beneficial Ownership Reporting Compliance

Pursuant to Section 16(a)

The information required by Item 405 of the Exchange Act and the rules promulgated thereunder, our officers and directors and persons who beneficially own more than 10% of our shares are required to file with the SEC and furnish to us reports of ownership and change in ownership with respect to all our equity securities.

Based solely on our review of the copies of such reports receivedRegulation S-K is incorporated by us during or with respectreference herein to the fiscal year ended January 30, 2016, and representations from such reporting persons, we believe thatinformation set forth under the caption “Section 16(a) Beneficial Ownership Reporting Compliance” in our officers, directors and 10% shareholders complied with all Section 16(a) filing requirements applicable to such individuals.

2017 Proxy Statement.

Code of Ethics

We have adopted a Code of Ethics and Business Conduct for Employees, Officers and Directors that applies to all of our directors, officers (including our Chief Executive Officer (our principal executive officer), Chief Financial Officer (our principal financial and accounting officer), Corporate Controller (our chief accounting officer) and any person performing similar functions) and employees. This Code of Ethics was most recently amended as of August 29, 2013. We will disclose future amendments to or waivers from our Code of Ethics and Business Conduct for Employees, Officers and Directors on our website or in a Current Reportreport on Form 8-K filed with the SEC within four business days following the date of such amendment or waiver. Our Code of Ethics and Business Conduct for Employees, Officers and Directors is available on our website (www.marvell.com) in the Corporate Governance section of our Investor Relations webpage.www.marvell.com. None of the material on our website is part of thisour Annual Report on Form 10-K or is incorporated by reference herein.

Director Nomination Process

As

Committees of the date of this report, there have been no material changes to the procedures by which shareholders may recommend nominees to our Board as described in the section entitled “Nominations for Election of Directors” in the Company’s Definitive Proxy Statement filed with the SEC on May 19, 2015.

Audit Committee

Our Board of Directors has a standing

The information required by Items 407(d)(4) and (d)(5) of Regulation S-K concerning our Audit Committee established in accordance with Section 3(a)(58)(a) of the Exchange Act. In fiscal 2016, the Audit Committee membership was as follows: Dr. Juergen Gromer (Chairman), Mr. Arturo Krueger, Dr. John G. Kassakian and Dr. Randhir Thakur. On May 1, 2016, the Audit Committee’s membership was reconstituted as follows: Robert Switz (Chairman), Dr. Gromer and Dr. Kassakian. On May 17, 2016, following his appointment to the board of directors, Michael Strachan was added to the Audit Committee. Our board of directors has determined that each member of the Audit Committee currently and during fiscal 2016 met the applicable independence, experience and other requirements of the Exchange Act, Nasdaq and the SEC. Our board of directors has determined that each of Mr. Switz and Mr. Strachan is an “auditaudit committee financial expert” as definedexpert is incorporated by applicable Nasdaq and SEC rules.

Regulatory Matters

Between 2005 and 2010, the SEC reviewed the option-granting practices of more than 100 companies. In June 2008, Marvell and Ms. Dai, our former President, reached a settlement with the SEC concluding the SEC’s investigation into Marvell’s stock option granting practices. Neither Ms. Dai nor Marvell admitted or denied any of the SEC’s allegations or findings. Pursuant to the settlement, Marvell and Ms. Dai agreed to comply with the federal securities laws and pay financial penalties. Ms. Dai also agreed that, until June 17, 2013, she would not serve as an officer or director of any issuer that has a class of securities registered pursuant to Section 12 of the Exchange Act or that is required to be file reports pursuant to Section 15(d) of the Exchange Act.

Executive Officers

Reference is madereference herein to the information set forth in Part I, Item 1 of this Annual Report on Form10-K under the caption “Executive Officers“Board of the Registrant.”

Item 11.Executive Compensation

Compensation DiscussionDirectors and Analysis

This Compensation Discussion and Analysis provides information regarding compensation paid to our named executive officers during fiscal 2016, which ran from February 2, 2015 until January 30, 2016. During fiscal 2016, the named executive officers were:

Dr. Sehat Sutardja, our former ChairmanCommittees of the Board (to May 1, 2016) and former Chief Executive Officer (to April 1, 2016);

Ms. Weili Dai, our former President (to April 1, 2016);

Dr. Zining Wu, our Chief Technology Officer;

Mr. David P. Eichler, our Interim Chief Financial Officer (from October 16, 2015);

Mr. Sukhi Nagesh, our former Interim Chief Financial Officer (from May 22, 2015 to October 7, 2015) and former Senior Vice President of Corporate Development and Strategy, Financial Planning and Analysis and Investor Relations (from October 7, 2015 to January 15, 2016); and

Mr. Michael Rashkin, our former Chief Financial Officer (retired May 22, 2015).

Our named executive officers were the only officers with the responsibility level and business impact in fiscal 2016 to qualify as executive officers under SEC rules.

Executive Summary

Our Business

We are a fabless semiconductor provider of high-performance application-specific standard products. Our core strength of expertise is the development of complex System-on-a-Chip and System-in-a-Package devices, leveraging our extensive technology portfolio of intellectual property in the areas of analog, mixed-signal, digital signal processing, and embedded and standalone integrated circuits. The majority- Committees of our product portfolio leverages embedded central processing unit technology. We also develop platforms that we define as integrated hardware along with software that incorporates digital computing technologies designed and configured to provide an optimized computing solution. Our broad product portfolio includes devices for data storage, enterprise-class Ethernet data switching, Ethernet physical-layer transceivers, wireless connectivity, Internet-of-Things devices and multimedia solutions.

Fiscal 2016 Business Highlights

Fiscal 2016 was a challenging year for the Company as increasing competitive dynamics in the handset market were compounded by softer demand conditions in PC and enterprise networking markets. As a result:

Net revenue in fiscal 2016 was $2.7 billion and was 27% lower than net revenueBoard of $3.7 billion in fiscal 2015.

Revenues declined in all of our end markets, led by a 31% decrease in storage product sales, and a 27% declineDirectors” in our mobile and wireless sales.

2017 Proxy Statement.

However, our financial position and our commitment to shareholder value remained strong, as illustrated by the following:

Our cash, cash equivalents and short-term investments were $2.3 billion at January 30, 2016 (prior to giving effect to the settlement with CMU).


We generated cash flow from operations of $205.4 million during fiscal 2016.

We paid cash dividends of $0.24 per share for a total of $122.8 million in fiscal 2016.

Subsequently, in March 2016, we announced a dividend of $0.06 per share that was paid in April 2016 and announced a dividend in May 2016 of $0.06 per share that was paid in July 2016.

Finally, we repurchased 19.7 million of our common shares for $260.9 million in fiscal 2016.

Actions Taken in Consideration of “Say on Pay” Vote

At the 2015 annual general meeting of shareholders, we received support from approximately 44% of shareholders voting on the proposal for our fiscal 2015 named executive officer compensation program (“Say on Pay”). We take shareholder feedback very seriously and have taken a number of significant actions in response to this Say on Pay vote result, including extensive shareholder outreach during fiscal 2016 and changes to our fiscal 2016 named executive officer compensation programs

Shareholder feedback, company performance and market practice were all key considerations in identifying and implementing changes to the named executive officer compensation programs for fiscal 2016.

Key Fiscal 2016 Actions

Relevant Section(s) for Further Details

Introduction of Relative TSR Metric to the Long-term Incentive PlanSee “Fiscal 2016 Long-Term Incentive Awards (Equity)” under “Key Elements of Compensation for Fiscal 2015”
A portion of the fiscal 2016 performance-based equity awards to named executive officers will vest based on our relative TSR performance (as defined below) versus the 2016 peer group over a two-year performance period.
Peer Group ChangesItem 11.See “Fiscal 2016 Peer Group”
To ensure a continued robust peer group and in consideration of our positioning relative to the median company size, the ECC determined to add three new companies to our peer group for fiscal 2016

Shareholder Outreach

Following the 2015 Say on Pay vote, we reached out to major institutional shareholders to gather detailed shareholder feedback, in particular regarding rationale for Say on Pay voting decisions.

Additional shareholder outreach was conducted during fiscal 2016 to ensure understanding of current governance issues of particular interest to our shareholders in preparation for fiscal 2017 compensation decisions.

Executive Compensation

Additionally, we continue to maintain good governance pay practices described in more detail elsewhere in this Compensation Discussion

The information required by Items 402, 407(e)(4) and Analysis and this Annual Report, including stock ownership guidelines, a policy concerning recoupment407(e)(5) of CEO and CFO bonuses following restatements, no gross up provisions, effective risk management, maintenance of 162(m) of the Internal Revenue Code of 1986, as amended (the “Code”) eligible plans, and anti-hedging provisions in our insider trading policy.

We hold advisory votes to approve named executive officer compensation on an annual basis. When making future compensation decisions, the Executive Compensation Committee (“ECC” or the “Committee”) will consider the results from the prior year’s advisory vote on named executive officer compensation, as well as feedback from shareholders throughout the course of such year. We will continue to proactively review our named executive officer compensation program and take actions to ensure that executive payRegulation S-K is aligned with company performance.

CEO Pay Alignment with Company Performance

A key element of our executive compensation program, including our CEO’s compensation, is the explicit link between compensation and both overall business results and individual performance, as discussed more generally below under “Compensation Philosophy.” We made the following key decisions relating to fiscal 2016 compensation of our CEO:

No annual incentive plan payout based on fiscal 2016 financial performance; and

No vesting of performance-based equity awards that are subject to fiscal 2016 financial or strategic performance;

The relationship between our CEO’s target pay opportunity, realizable pay, and company performance as measuredincorporated by TSR (each as defined below) further illustrates the alignment of our CEO’s compensation with business performance, and our emphasis on shareholder value creation. While most of the required compensation disclosures discuss pay opportunities (i.e., the awards thatmay be earned), realizable pay considers actual compensation that was earned or could be earned based on performance.

Target pay opportunity for a given fiscal year means the sum of the salary and target cash bonus opportunity in that fiscal year, plus the grant date fair value of all equity awards (stock options and restricted stock units) granted during the fiscal year. Does not include “all other compensation” as defined for Summary Compensation Table purposes;

Realizable pay for a given fiscal year means the sum of salary and actual cash bonus paid for that fiscal year, plus the current (2016 fiscal year-end) realizable value of equity granted in that fiscal year. The current realizable value of equity is calculated as the “in the money” value of stock options assuming that any vested stock options remain unexercised, plus the market value of restricted stock units, assuming that shares underlying any vested restricted stock units are still held by the CEO. For equity awards with performance-based vesting the target number of shares are included for periods in respect of fiscal years that have not been completed and the actual number of shares that vested are included for completed performance periods. Does not include “all other compensation” as defined for Summary Compensation Table purposes; and

Total shareholder return is the increase in company stock price plus reinvested dividends, measured from the start of each fiscal year from fiscal 2012 through 2016 fiscal year end.

The following graph shows the target pay opportunity and realizable pay of our CEO, Dr. Sutardja, for each fiscal year since fiscal 2012, and the strong correlation of his realizable pay with total shareholder return.

    FY2012  FY2013  FY2014  FY2015  FY2016 

Dr. Sutardja Target Pay Opportunity

(as determined in each fiscal year)

  $13,324,040   $13,916,750   $8,385,200   $9,143,158   $9,523,128  

Dr. Sutardja Realizable Pay

(including realizable equity values at FYE 2016)

  $963,076   $2,620,000   $2,620,000   $4,696,697   $2,555,563  

Total Shareholder Return

(measured through FYE 2016)

   -12.8  -11.4  0.5  -21.5  -41.6

The chart clearly shows the impact of company performance on Dr. Sutardja’s realizable pay, particularly in comparisonreference herein to the target pay opportunity. The strong emphasis on performance-based pay in the CEO’s total compensation program, further enhanced by the reintroduction of relative total shareholder return as a metric for equity award vesting in fiscal 2016, ensures that the CEO’s realizable pay changes over time, with the difference between the pay opportunity and realizable pay reflecting achievement of incentive plan goals and company stock price performance.

Fiscal 2016 Named Executive Officer Compensation Determination

Compensation Philosophy

The ECC oversees the development and administration of our executive compensation program, including the underlying philosophy and related policies. Our primary business objective is to create long-term value for our shareholders. To achieve this objective, our executive compensation program is intended to achieve five primary objectives:

Market Competitive: Provide a market-competitive level of total compensation opportunity that reflects the individual executive’s role and ability to impact business performance;

Performance-Based: Establish an explicit link between compensation and both overall business results and individual performance;

Long-Term Focused: Promote a long-term focus for our named executive officers through incentive compensation that vests over multiple years;

Aligned with Shareholders: Align the interests and objectives of our named executive officers and employees with furthering our growth and creating shareholder value through distribution of equity; and

Equity Stake: Distribute equity to key employees to allow them to participate in the creation of shareholder value.

The ECC believes that both the elements and level of fiscal 2016 compensation for our named executive officers were consistent with the five primary objectives contained in our compensation philosophy as well as the overall goal of emphasizing sustained share price growth. In particular, the ECC believes that the structure and level of our fiscal 2016 compensation for our named executive officers was linked to our business performance.

Fiscal 2016 Peer Group

During fiscal 2015, the ECC reviewed the existing peer group for alignment with companies that are similar in revenue, industry segment and/or which compete with us for talent. The ECC utilized competitive market compensation data based on the practices of the revised peer group to guide fiscal 2016 pay decisions.

Peer Group for Fiscal 2016

Description of Fiscal 2016 Peer Group

Company

Status for Fiscal
2016 Peer Group

•    

Consists of semiconductor companies and other similarly-sized companies in the technology industry the ECC believed to be generally comparable to us in terms of revenue, EBITDA margin, market value and/or that Marvell competes with for executive talent. In making changes to the peer group for fiscal 2016, the ECC also gave consideration to feedback from institutional shareholders and shareholder advisory groups.

Adobe Systems Incorporated

Remained Peer

Advanced Micro Devices, Inc.

Remained Peer

Altera Corporation

Remained Peer

Analog Devices, Inc.

Remained Peer

Broadcom Corporation

Remained Peer

Juniper Networks Inc.

Remained Peer

NetApp, Inc.

Remained Peer

NVIDIA Corporation

Remained Peer

Xilinx, Inc.

Remained Peer

Cadence Design Systems Inc.

AddedChanges from Fiscal 2015 Peer Group

Freescale Semiconductor Ltd.

Synopsys Inc.

LSI Corporation

Added

Added

Removed

•    

LSI Corporation was removed from the peer group because it was acquired by Avago Technologies.

•    

Three new peer companies were added, increasing the robustness of the comparative group for benchmarking purposes.

•    

In response to feedback from shareholder advisory groups, the ECC ensured that the new peer companies helped to balance the size of existing peer companies and reflect Marvell’s current size.

The Determination Process

After establishing our guiding principles and amending the peer group as outlined above, the ECC then determined the amount of each compensation element for the named executive officers in a two-step process, as follows:

Work Step

Description

1.  Evaluate each element of compensation separately

Ensure that each component of compensation meets the desired objectives for that element (i.e., base salary, target annual incentive opportunity and equity awards).

2.  Review the value of the total compensation package to ensure consistency and appropriateness

Ensure that:

•      In aggregate, the total value of the compensation package is reasonable when compared against the peer group; and

•      Compensation is consistent with market practices and all decisions are based on the judgment of the members of the ECC.

As a starting point, the ECC reviewed competitive compensation market data collected and analyzed by Mercer, the ECC’s compensation consultant, from the compensation peer group described above. The compensation data represented the most recently available data at the end of fiscal year 2015.

Key Elements of Compensation for Fiscal 2016

The tables and commentary in this section primarily relate to the fiscal 2016 compensation for the three named executive officers that served throughout fiscal 2016, namely Dr. Sutardja, Ms. Dai, and Dr. Wu. Fiscal 2016 compensation information for the individuals that each served in the role of Chief Financial Officer for a portion of fiscal 2016 is covered separately at the end of this section under “Fiscal 2016 Chief Financial Officer Compensation.”

Fiscal 2016 Salaries

Base salaries for Dr. Sutardja, Ms. Dai, and Dr. Wu were adjusted to $980,000, $650,000 and $435,000, respectively, to reflect their then current roles and responsibilities within the organization. The new salaries were effective April 1, 2015, consistent with effective dates for salary increases to the broader employee population. The increases occurred during fiscal 2016, in part, because no changes had been made to their salaries during fiscal 2014 or fiscal 2015.

Details about named executive officer compensation relative to the peer group companies are provided in the section “Total Compensation Value and Competitive Positioning” below.

Executive

  Fiscal 2016 Base
Salary
   Fiscal 2015 Base
Salary
   Fiscal 2016%
Increase
 

Dr. Sehat Sutardja

  $980,000    $850,000     15.3

Ms. Weili Dai

  $650,000    $560,000     16.1

Dr. Zining Wu

  $435,000    $400,000     8.7

Fiscal 2016 Annual Incentive Plan (Cash)

For the fiscal 2016 annual incentive plan, the ECC established the following threshold, target and maximum amount of awards payable, expressed as a percentage of base salary, for each of our named executive officers:

   Fiscal 2016 Annual Incentive Opportunity
Expressed as a Percentage of Base Salary1
 

Executive

  Below
Threshold
  Threshold
Performance
  Target
Performance
  Maximum
Performance
 

Dr. Sehat Sutardja

   0  67.5  112.5  202.5

Ms. Weili Dai

   0  36  60  108

Dr. Zining Wu

   0  22.5  37.5  67.5

(1)Annual incentive payout is calculated using a straight line interpolation for performance between threshold and target or between target and maximum.

Mr. Nagesh and Mr. Eichler were not participants in the fiscal 2016 Section 162(m) annual incentive plan as they were not named executive officers at the time the plan goals were determined by the ECC. Mr. Rashkin retired during fiscal 2016. Therefore, Mr. Rashkin, Mr. Nagesh and Mr. Eichler were not eligible to receive any cash incentive payout for fiscal 2016.

The fiscal 2016 annual incentive plan for our named executive officers was 80% based on a combination of equally weighed revenue and modified non-GAAP operating income goals reflecting significant year-over-year growth targets. Growth in revenue and operating income are considered by the Board to be key drivers of the success of the company. The funding amount varied based on the achievement of goals at threshold, target and maximum levels. The remaining 20% of the plan was subject to the achievement of at least one of the threshold Company financial performance metrics described above, and then based on individual strategic goals, included in fiscal 2016 to account for differences between executives. The funding formula was based on a pre-established, objective formula, and the fiscal 2016 annual incentive plan was intended to qualify under Section 162(m) of the Code.

The following table presents the fiscal 2016 annual incentive plan goals established by the ECC at threshold, target and maximum performance levels and actual fiscal 2016 performance for each of these metrics. Each of the financial metrics was tied to the annual operating plan approved by the board of directors in April 2015.

     Level of Performance Achievement
(in millions)
  Actual Fiscal 2016
Performance

(in millions)
 

Performance Metric

 Weighting    Threshold      Target      Maximum    

Revenue

  40 $3,000   $3,400   $3,869   $2,726          

Modified Non-GAAP Operating Income (1)

  40 $310   $460   $585   $194          

Strategic Goals

  20  


Varies by individual but
subject to threshold financial
performance metrics; see
below for details


Threshold Company
financial performance
metrics not achieved


(1)For purposes of the 2016 annual incentive plan, non-GAAP operating income is defined as GAAP operating income less (i) share-based compensation, (ii) amortization of acquisition-related intangible assets and acquisition-related costs, (iii) restructuring and other exit-related costs, and (iv) litigation settlement costs removed for non-GAAP purposes in our quarterly earnings releases, except with respect to the litigation with Carnegie Mellon University (the “CMU litigation”). Modified non-GAAP operating income excludes amounts paid or accrued in respect of final judgments or settlements related to the CMU litigation, regardless of whether these amounts are excluded from non-GAAP operating income in our quarterly earnings releases.

The individual strategic goals identified for each executive officer included a mix of financial and operational as well as quantitative and qualitative factors. For fiscal 2016, these included, but were not limited to: execution of the strategic plan; cost management, expense and pricing related goals; and product and technology development goals. The strategic goals and weightings approved by the Committee were tailored to the specific roles and responsibilities of each named executive officer. The ECC initially determined what categories of individual strategic goals would be appropriate for the executive officers, and then suggested specific goals for each individual. The individual executive officers proposed additional goals based on the needs of their internal constituents. Following discussion without the executive officers present, the ECC then approved the final individual strategic goals.

Payout of the portion of annual incentive plan subject to individual strategic goals is subject to achievement of the “Threshold” Company financial performance metric for either of the revenue or modified non-GAAP operating income performance metrics described above. Achievement of either threshold Company financial performance metric allows for full payout under this portion of the performance awards, but subject to the ECC applying negative discretion based on actual achievement of individual strategic goals to determine the actual payout.

Fiscal 2016 performance was such that both revenue and modified non-GAAP operating income actually achieved were below the threshold goals established by the ECC and, therefore, the named executive officers did not received any payoutsset forth under the fiscal 2016 annual incentive plan.

Executive

 Fiscal 2016
Base Salary
  Fiscal 2016
Incentive
Opportunity at
Target

(% of Base Salary)
  Actual Fiscal 2016 Annual
Incentive Payout

(% of Target)
  Total Fiscal 2016 Annual
Incentive Payout

(% of Target)
 
   Revenue Metric
Payout

(% of Target)
  Non-GAAP
Operating  Income
Metric Payout

(% of Target)
  

Dr. Sehat Sutardja

 $980,000   $1,102,500 (112.5%)  $(0%)  $(0%)  $(0%) 

Ms. Weili Dai

 $650,000   $390,000 (60%)  $(0%)  $(0%)  $(0%) 

Dr. Zining Wu

 $435,000   $163,125 (37.5%)  $(0%)  $(0%)  $(0%) 

The ECC will continue to review non-equity incentive opportunities relative to the difficultycaptions “Board of plan goalsDirectors and affordability of payouts relative to financial performance.

Fiscal 2016 Long-Term Incentive (“LTI”) Awards (Equity)

Our executive compensation packages are designed to ensure that a substantial portion of compensation is linked to incentivizing and rewarding increases in our market capitalization as a result of sustained share price growth. For fiscal 2016, and in response to shareholder feedback, the ECC decided to accomplish this objective by granting equity awards to named executive officers as follows:

Approximately 75% as performance-based RSUs and performance awards with equal potential vesting tranches on April 1, 2016 subject to the achievement of pre-determined fiscal 2016 company and individual strategic performance goals, and on April 1, 2017 subject to the achievement of 2-fiscal year relative total shareholder return (TSR) goals; and

Approximately 25% as stock options with equal vesting on each of April 1, 2018 and April 1, 2019.

Each of the foregoing stock options, performance-based RSUs and performance awards were made pursuant to the 1995 Stock Plan. The performance-based RSUs and performance awards were granted on April 30, 2015, and stock option awards were granted on June 24, 2015. The exercise price of each stock option award was equal to $14.35, the closing price of our common stock as reported on the NASDAQ Global Select Market on June 24, 2015, the date of grant.

The tables below provide the number of shares underlying the equity awards described above.

   Performance-based RSUs
and Performance  Awards
at Target Performance
Levels
   Stock Options   Total
Value
 

Executive

  Number   Grant Date
Fair Value
   Number   Grant Date
Fair Value
   

Dr. Sehat Sutardja

   444,939    $5,831,951     458,856    $1,823,677    $7,655,628  

Ms. Weili Dai

   247,066    $3,243,796     254,920    $1,013,154    $4,256,950  

Dr. Zining Wu

   142,066    $1,874,343     127,460    $506,577    $2,380,920  

Assumptions used in valuing the stock option grants included:

Methodology

Black-Scholes

Grant Date

June 24, 2015

Exercise Price/FMV

$14.35

Volatility

33.78%

Expected Term

5.41 years

Dividend Yield

1.62%

Valuation

$3.97

The LTI plan used the following metrics: revenue, modified non-GAAP operating income, relative total shareholder return (“TSR”), individual strategic goals and supplemental individual strategic goals. Marvell TSR performance was compared to the TSR performance of constituent companies of the Philadelphia Semiconductor Sector Index (SOX) during a 2-fiscal year performance period. See also “— Actual Performance Achievement and Awards Vested” below.

Performance Metrics

  LTI Plan Goals 
  Threshold  Target  Maximum 
  Goal  Shares as
% of  Target
  Goal  Shares as
% of  Target
  Goal  Shares as
% of  Target
 

FY2016 Revenue

  $3,000M    50 $3,400M    100 $3,869M    200

FY2016 Modified Non-GAAP Operating Income

  $310M    50 $460M    100 $585M    200

FY2016-FY2017 Relative TSR (percentile positioning relative to SOX index constituents)

   25th%ile    50  50th%ile    100  100th%ile    200

The awards of performance-based RSUs and performance awards described above, as determined by the ECC, resulted in the following weightings of financial performance metrics, individual strategic goals and relative TSR goals:

   Weighting of Performance Metrics by NEO 
   Revenue  Modified Non-GAAP
Operating Income
  Individual Strategic
Goals
  Relative
TSR
 

Dr. Sehat Sutardja

   18  18  23  40

Ms. Weili Dai

   18  18  23  41

Dr. Zining Wu

   16  16  34  35

The individual strategic goals identified for each executive officer included a mix of financial and operational, quantitative and qualitative factors. For fiscal 2016, these included, but were not limited to: execution of the strategic plan; cost management, expense and pricing related goals; and product and technology development goals. The strategic goals and weightings approved by the Committee were tailored to the specific roles and responsibilities of each named executive officer. The ECC initially determined what categories of individual strategic goals would be appropriate for the executive officers, and then suggested specific goals for each individual. The individual executive officers proposed additional goals based on the needs of their internal constituents. Following discussion without the executive officers present, the ECC then approved the final individual strategic goals.

Vesting of a portion of the performance awards subject to individual strategic goals is subject to achievement of the “Threshold” Company financial performance metric for either of the revenue or modified non-GAAP operating income performance metrics described above. Achievement of threshold financial performance metric allows for vesting of all shares under this portion of the performance awards, but subject to the ECC applying negative discretion based on actual achievement of individual strategic goals to determine the number of shares that shall vest in respect of the performance award for each named executive officer.

Total Compensation Value and Competitive Positioning

The ECC positioned the fiscal 2016 named executive officer compensation packages to be consistent with the compensation philosophy and compensation principles discussed above. The table below presents the resulting positioning of fiscal 2016 compensation for our named executive officers:

(i)

As a percentage of the median (50th percentile) of competitive compensation data collected for the 2016 peer group companies; and

(ii)As a percentile rank relative to competitive compensation data collected for the 2016 peer group companies.

The value attributed to the equity awards is equal to the accounting grant date fair value of the awards. The named executive officer competitive compensation positioning is relative to publicly disclosed compensation information for the 2016 peer group companies as available at the time the ECC approved our fiscal 2016 compensation programs and, therefore, reflects historical, not current year compensation. For purposes of the table below, “AIP” means Annual Incentive Plan and “LTI” means Long-Term Incentive.

    As a Percentage of Median of
2016 Peer Group
Companies
 Percentile Rank Relative to
2016 Peer Group  Companies

Pay Element

 Performance Assumption Dr.
Sutardja
 Ms. W.
Dai
 Dr. Z.
Wu
 Dr.
Sutardja
 Ms. W.
Dai
 Dr. Z.
Wu

Salary

 —   112% 128% 88% 60%ile >75%ile 36%ile

Total Cash Compensation

(Salary + AIP)

 Target AIP Payout 106% 98% 59% 56%ile 50%ile <25%ile

Total Cash Compensation

(Salary + AIP)

 Maximum AIP Payout 150% 127% 72% >75%ile >75%ile <25%ile

Total Direct Compensation

(Salary + AIP + LTI)

 Target AIP & LTI Payout 135% 173% 133% >75%ile >75%ile 69%ile

Total Direct Compensation

(Salary + AIP + LTI)

 Maximum AIP & LTI Payout 209% 265% 194% >75%ile >75%ile >75%ile

Outstanding Performance-Based Equity Awards

In fiscal 2012, performance-based equity awards were granted in the form of stock options with vesting contingent on the achievement of a stringent average stock price hurdle described in more detail below. In fiscal 2013, no performance-based equity awards were granted. In fiscal 2014, Ms. Dai received a performance-based equity award that is no longer outstanding. In fiscal 2015 and fiscal 2016, all named executive officers received performance-based equity awards in the form of RSUs and performance awards.

The table below provides detailed information regarding outstanding performance-based equity awards granted to each named executive officer, including vesting conditions and number of shares vesting based on fiscal 2016 performance.

Executive

 Fiscal
Year of
Grant
  Total Number of
Performance-Based
Shares (options or
RSUs/Performance
Awards) Granted in
Grant Year
(#)
 Performance
Measures
 Number of
Shares That
Could Vest

at Target
Performance For
Fiscal 2016
Performance
Period
(#)
 Actual Number of
Shares Vested
For Fiscal 2016
Performance

Period
(#)

Dr. Sehat Sutardja

  2016   444,939 (RSUs and
performance awards)
 Revenue /Modified non-GAAP Operating
Income / Strategic Goals / Relative TSR
1
 252,220 0
  2015   357,000 (RSUs and
performance awards)
 Revenue / Modified non-GAAP
Operating Income / Strategic Goals
2
 178,500 0
  2012   1,400,000 (options) Share Price3 1,400,000 0

Ms. Weili Dai

  2016   247,466 (RSUs and
performance awards)
 Revenue / Modified non-GAAP
Operating Income / Strategic Goals /
Relative TSR
1
 140,400 0
  2015   200,000 (RSUs and
performance awards)
 Revenue / Modifiednon-GAAP
Operating Income / Strategic Goals
2
 100,000 0
  2012   360,000 (options) Share Price2 360,000 0

Dr. Zining Wu

  2016   142,066 (RSUs and
performance awards)
 Revenue / Modified non-GAAP
Operating Income / Strategic Goals /
Relative TSR
1
 88,533 33,616
  2015   100,000 (RSUs and
performance awards)
 Revenue / Modified non-GAAP
Operating Income / Strategic Goals
2
 50,000 0
  2012   50,000 (options) Share Price2 50,000 0

1.Performance goals disclosed in detail in the section “Fiscal 2016 Long-Term Incentive Awards.”
2.Performance goals for fiscal 2015 awards were disclosed in detail in the Compensation Discussion and Analysis in the 2015 Proxy Statement, in the section “Fiscal 2015 Long-Term Incentive Awards,” and are summarized below in the section “Actual Performance Achievement and Awards Vested.”
3.Performance-based stock options have a ten-year term and vest contingent on the achievement of a stringent average stock price hurdle before April 29, 2016. If the closing price of our common shares as reported by the NASDAQ Global Select Market equals or exceeds an average of $24.70 for a period of 200 consecutive trading days prior to the 5th anniversary of the date of grant (the “Trigger Event”), then 100% of the shares subject to the stock option will vest on the date of the Trigger Event, subject to continued service through both the date of the Trigger Event and April 1, 2013. Each of the performance-based stock options will immediately expire if the Trigger Event does not occur prior to the 5th anniversary of the date of grant. As of April 29, 2016, the Trigger Event had not occurred and all performance-based options expired in accordance with their terms.

Actual Performance Achievement and Awards Vested

Following the end of fiscal 2016, the ECC measured the performance criteria associated with each named executive officer’s respective performance-based equity grants, determined the number of awards that would vest during the fiscal 2016 performance period for each grant and made the following determinations:

The share price Trigger Event for the performance-based stock options granted in fiscal 2012 was not met.

Both the Company’s fiscal 2016 revenue and modified non-GAAP operating income performance were below the threshold goals established by the ECC for both the 2015 and 2016 equity grants. Therefore, the ECC determined that none of the shares underlying fiscal 2015 and fiscal 2016 awards subject to fiscal 2016 Company financial performance would vest (as reflected in the following table):

Performance Metrics

  Actual  FY2016
Performance
  FY2016 Grant FY2015 Grant
    Goal
Achievement
  Vested Shares
as % of Target
 Goal
Achievement
  Vested Shares
as % of Target

Revenue

  $2,726M  Below
Threshold
  0% Below
Threshold
  0%

Modified Non-GAAP Operating Income

  $194M  Below
Threshold
  0% Below
Threshold
  0%

For the Executive Officers’ individual strategic goals, the Committee evaluated the achievement of the strategic performance objectives, achievement of financial performance gates (where applicable), the Company’s overall condition and performance in fiscal 2016, and each individuals’ role within the organization.

For Dr. Sutardja and Ms. Dai, the Committee determined that none of the shares underlying performance awards subject to individual strategic goals would vest. For Dr. Wu, the Committee determined that 33,616 shares would vest for achievement of individual strategic goals linked to technology product rollout, technology development, and process improvement objectives.

Benefits

Our named executive officers are eligible to participate in our life, health and welfare benefit programs and our tax-qualified Section 401(k) plan on the same terms and conditions as our other salaried employees. Beginning in January 2011, employees’ contributions to the Section 401(k) plan are matched dollar for dollar up to a maximum of $500 for each quarter of the calendar year. Also during the entirety of fiscal 2016, Dr. Sutardja had access to a car leased by the Company for his personal use.

We offer all employees, including our named executive officers, the ability to purchase our common shares at a discount under our 2000 Employee Stock Purchase Plan, as amended and restated (the “ESPP”). Employees

who own more than 5% of our stock may not participate in the ESPP. As a result, Dr. Sutardja and Ms. Dai are not eligible to participate in the ESPP. Mr. Eichler is not eligible to participate in the ESPP because he is not an employee of the Company.

Named executive officers did not receive any material employee benefits or perquisites in fiscal 2016 other than the employee benefits and perquisites provided to all employees and the one described in the paragraph below.

Other Fiscal 2016 Compensation Arrangements

In December 2006, in connection with a review by a special committee of our board of directors relating to our historical stock option practices and related accounting matters, we reformed certain outstanding option agreements for option grants previously awarded to our executive officers at the time by the former members of the ECC. These outstanding option agreements were for option grants (i) determined to have measurement dates for accounting purposes different from the recorded grant dates, and (ii) where the fair market values of our common shares on the determined measurement dates were higher than those on the corresponding recorded grant dates. Pursuant to the reformed option agreements, the parties corrected the exercise price for each affected grant still outstanding to that which would have been applicable had the grant been made using the applicable determined measurement date. To the extent that such an option already had been exercised, each applicable executive remitted to us the full amount of the difference between the exercise prices of the options as granted and the fair market values of the underlying common shares on the determined measurement dates.

However, in connection with the exercise in January 2006 of one such option grant to our Chief Executive Officer, Dr. Sutardja, the Internal Revenue Service and the California Franchise Tax Board determined that penalty taxes applied pursuant to Section 409A of the Code (“Federal Tax Code”) and California Revenue and Taxation Code Section 17501 (“California Tax Code” and, together with the Federal Tax Code, the “Tax Codes”). This determination was made despite the fact that (a) the relevant option agreement had been subsequently reformed to correct the exercise price for the affected grant to that which would have been applicable had the grant been made using the determined measurement date, and (b) to the extent that option had been exercised, Dr. Sutardja had remitted to us the full amount of the difference between the exercise price of the option as granted and the fair market values of the underlying common shares on the determined measurement date. On March 2, 2011, our board of directors authorized, based on the recommendation of its Nominating and Governance Committee, the indemnification of Dr. Sutardja for reasonable fees and expenses that he may incur in a legal challenge of the determination that penalty taxes applied, based on the board’s finding that Dr. Sutardja was not involved in setting the terms of the relevant options and that, in 2007, we had taken responsibility for and paid the penalty taxes under the Tax Codes that were incurred by other similarly situated Marvell employees who had exercised options in 2006.

On February 27, 2013, the U.S. Court of Federal Claims ruled against Dr. Sutardja and determined that the Tax Codes applied to the exercise of the relevant option grant. After discussing and evaluating at several meetings the alternatives to a continuing legal challenge of the court’s determination, the likelihood of success of further appeal by Dr. Sutardja and the potential negative impact on the Company of a continuation of the case regardless of the outcome, on February 25, 2015, the ECC (comprised solely of board members who were not part of the ECC that approved the relevant option grant to Dr. Sutardja) determined to provide Dr. Sutardja with relief from the financial effects of the penalty taxes, consistent with the relief provided to other similarly-situated Marvell employees in 2007. Accordingly, the ECC approved a one-time cash payment to Dr. Sutardja equal to the amount of his penalty taxes owed under the Tax Codes, plus accrued interest owed with respect to such liabilities, all grossed-up for income taxes that will be owed by Dr. Sutardja on receipt of such cash payment. The total amount of this one-time payment and gross-up was estimated at the time to be approximately $15.4 million. A payment of $8.4 million was made in April 2015 to reimburse (with gross-up) Dr. Sutardja for the federal portion of taxes he had previously paid in connection with this liability. This amount is included in the Summary

Compensation Table under “Other Compensation.” The amount of state taxes to be owed by Dr. Sutardja in connection with this liability is still pending final determination by the California Franchise Tax Board and has not yet been paid. The Company anticipates reimbursing Dr. Sutardja for the state taxes he pays (with gross-up), provided that the aggregate amount of all payments pursuant to this reimbursement arrangement shall not exceed $15.4 million.

Fiscal 2016 Chief Financial Officer Compensation

The fiscal 2016 compensation arrangements approved by the Committee for each of the individuals that served a portion of the year in the role of Chief Financial Officer are as follows:

Name

Period Served as
Chief Financial
Officer

Description of Fiscal 2016 Compensation Approved by the ECC

Mr. David P. EichlerInterim CFO from October 16, 2015

For Mr. Eichler’s services, Marvell will pay Tatum $15,000 per week for up to 60 hours of professional services. For Mr. Eichler’s time in excess of 60 hours a week, Marvell will pay Tatum at a rate of $325 an hour. The Services Agreement has a minimum term of three months, and thereafter may be terminated by either party for any reason upon 15 days’ advance written notice. See the “Employment Agreements” section of this Annual Report on Form 10-K for additional information regarding our agreement with Tatum.

Mr. Sukhi Nagesh

Interim CFO from May 22, 2015 to October 7, 2015

Prior to being appointed interim CFO, Mr. Nagesh’s annual salary was $285,200.00 and his PRP target was 40%.

At the June 24, 2015 ECC meeting, Mr. Nagesh was granted a focal stock option for 50,000 shares. This service-based stock option has a ten-year term and vests equally over two years beginning on the third anniversary of April 1, 2015.

Also at the June 24, 2015 ECC meeting, it was determined not to change Mr. Nagesh’s base salary or target bonus at this time, but to provide him with an immediate, one-time bonus of $100,000 in consideration for his service in assuming the responsibilities of Interim Chief Financial Officer and managing the related transition.

On October 7, 2015, Mr. Nagesh resigned as Interim Chief Financial Officer and was promoted to Senior Vice President Corporate Development and Strategy, Financial Planning and Analysis and Investor Relations with a new annualized salary of $360,000. Mr. Nagesh resigned from that position in January 2016.

Mr. Michael RashkinCFO until May 22, 2015Fiscal 2016 salary of $410,000 (2.5% increase from fiscal 2015).
Fiscal 2016 Annual Incentive Plan target opportunity of 37.5% of salary. No payout under fiscal 2016 Annual Incentive Plan due to retirement.
Fiscal 2016 equity grants of 67,195 performance-based RSUs and performance awards (assuming target performance levels), subject to the same vesting conditions as fiscal 2016 equity awards to other named executive officers, and were all forfeited upon retirement.

Other Factors Considered in Determining Executive Compensation

Employment Agreements

We did not have any employment, change-in-control, or severance agreements or arrangements with any of our named executive officers in fiscal 2016.

Risk Considerations

During fiscal 2016, the ECC requested of Mercer, the Committee’s compensation consultant, and later discussed with management, an assessment of our compensation programs for (i) the named executive officers, (ii) the broad-based employee population, and (iii) the sales professionals. The purpose of the review was to determine whether such programs might encourage inappropriate risk taking that could result in a material adverse effect on the Company. Mercer, with the help of our management, reviewed these programs considering:

Pay mix;

Caps on incentive pay;

Performance measures;

Funding mechanisms; and

Plan governance.

The annual risk assessment specifically noted that:

Our emphasis on performance-based long-term incentives for named executive officers, as described above, minimizes large windfalls based on short-term performance;

Stock options granted to named executive officers do not begin vesting for two years, rewarding long-term growth in shareholder value, not short-term results;

Annual incentives are paid pursuant to fixed, pre-established financial and strategic goals, consistent with the requirements of Section 162(m) of the Code;

Together, the annual and long term performance programs reward a balance of internal (company financial and strategic goals) and external (stock price) performance;

Dr. Sutardja and Ms. Dai collectively owned approximately 14% of our outstanding common shares as of May 1, 2016. This strongly aligned the financial interests of the two former executives with that of shareholders. We have executive stock ownership guidelines that apply to all named executive officers and, in general, strong corporate governance features that provide protection against possible windfall payouts to the named executive officers;

No material changes were made for fiscal 2016 to the broad-based annual incentive plan. The plan continues to provide safeguards designed to prevent inappropriate risk-taking. The broad-based incentive plan contains both an overall plan funding cap and individual award caps thus mitigating the opportunity for windfall payouts. Multiple metrics impacting plan funding and an allocation process requiring multiple levels of approval mitigate the ability to impact short-term results by excessive risk-taking;

The sales incentive plans include risk mitigating features such as a mix of performance metrics and reasonable pay opportunities were retained from the prior plan, and individual award caps were introduced which further helps avoid any concerns of incentivizing excessive risk-taking; and

Broad-based employee equity awards for fiscal 2016 consisted of a fixed mix of stock options and RSUs that varied by level (no equity choice). Below the named executive officers, all equity awards are subject to service-based vesting. Equity awards are broadly used to align employees to long-term company value creation and to provide retention through vesting of equity over time. The broad-based equity award levels, vehicles and vesting conditions do not encourage inappropriate risk-taking.

Based on such assessment, the ECC concluded that our compensation policies and practices for our employees are not reasonably likely to have a material adverse effect on us.

Governance and Other Considerations

Equity Grant Practices

Our board of directors has adopted a policy with respect to our equity grant practices. Our current policy covers, among other things, the following:

All stock option grants must have an exercise price per share no less than the per share fair market value of our common shares on the date of grant, as determined under the appropriate U.S. financial accounting rules and the applicable rules and regulations under the U.S. securities laws.

The ECC or a subcommittee thereof has the authority to approve equity grants to employees, provided that only the ECC (and not a subcommittee) may approve equity grants to our executive officers.

Equity grants to newly hired employees are made monthly during regularly scheduled ECC or subcommittee meetings. An equity award proposal is generally prepared for consideration by the second month following the month of the new employee’s date of hire. These awards may only be made by the ECC or a subcommittee of the ECC, and are typically based upon the recommendation of the CEO or a set of guidelines approved by the CEO. It is our policy for equity grants to newly hired employees to vest over four years.

Annual focal equity grants to employees are generally made after the annual performance review process is completed and are scheduled to be made no later than the last Friday of our fiscal month in April in each calendar year, provided that focal stock option grants shall not be made during any period of time commencing with the last day of a fiscal quarter and ending with the first full trading day following our earnings release for such quarter. If focal stock option awards have not been granted by the last Friday of the fiscal month of April, then focal option awards are to be granted during an ‘open window’ as set forth in our insider trading policy. Such restriction does not apply to restricted stock units or other types of equity awards that do not include an exercise price or other term related to the market price of our securities on the date of grant. Other than with respect to annual focal equity grants, grants to named executive officers must be made during an ‘open window.’

Management regularly reviews with the ECC share usage (run rate), potential dilution and total cost of equity grants, relative to internal and external benchmarks to ensure that share usage is carefully and appropriately managed. The table below shows the company run rate for the three most recent fiscal years (all number of shares granted are in thousands):

   Share-Based Run Rate
(All Stock Options
and RSUs Granted)
  Stock Option Equivalent
Based Run Rate
(2:1 Stock Option to
Full Value
Share Conversion)
 

Fiscal Year

  # Granted   % Average Common
Shares Outstanding
  # Stock Option
Equivalents
   YE
O/S
 

2016

   12,935     2.51  19,486     3.81

2015

   13,176     2.59  19,986     3.93

2014

   22,750     4.50  26,578     5.26

Policy Concerning Recoupment of CEO and CFO Bonuses Following Restatements

In the event of a restatement of our financial results, where a bonus was paid to the CEO and/or the CFO based on financial results that were subject to the restatement and there is finding by a majority of the disinterested members of our board of directors at the time of the restatement that the restatement was due, in

whole or in part, to the gross recklessness or intentional misconduct of either the CEO or CFO, respectively, our board of directors shall review all such bonuses for the period(s) in which the results were restated. If such bonuses would have been lower had they been calculated based on the restated results, our board of directors will, to the extent permitted under applicable law, seek to recoup for the benefit to us of all such bonuses paid to the CEO and/or CFO, as applicable. This policy shall apply in addition to any right of recoupment against the CEO and the CFO under Section 304 of the Sarbanes-Oxley Act of 2002.

Stock Ownership Guidelines for Executive Officers

Our board of directors has established equity ownership guidelines for our executive officers designed to encourage long-term stock ownership and more closely link their interests with those of our other shareholders. These guidelines were amended in March 2012 to provide that, within a five-year period, executive officers should have actual ownership of common shares equal in value to (i) six times the annual base salary for the CEO and (ii) two times their respective annual base salary for the other named executive officers. Our board of directors reviews progress against these guidelines annually and updates them as appropriate. Each of our currently employed named executive officers has either satisfied these ownership guidelines or has time remaining to do so as of April 30, 2016.

Role of Consultants and Conflicts of Interest with Respect Thereto

The ECC engages executive compensation consulting firms to provide advice and market data relating to executive compensation. Such compensation consulting firms serve at the discretion of the ECC. In fiscal 2015, the ECC engaged Mercer. Mercer serves at the discretion of the ECC to provide analysis, advice and guidance with respect to compensation.

The ECC charter provides that the ECC shall be directly responsible for the appointment, compensation and oversight of the work of any committee adviser retained by it, and the Company shall provide for appropriate funding, as determined by the ECC, for payment of (a) reasonable compensation to any committee advisor, and (b) ordinary administrative expenses of the ECC that are necessary or appropriate in carrying out its duties. The ECC may select a committee adviser and receive advice from a committee advisor, only after taking into consideration all factors relevant to that person’s independence from the Company’s management, specifically including the following:

1.The provision of other services to the Company by the committee adviser’s employer;

2.The amount of fees received from the Company by the committee adviser’s employer, as a percentage of the total revenue of the committee adviser’s employer;

3.The policies and procedures of the committee adviser’s employer that are designed to prevent conflicts of interest;

4.Any business or personal relationship of the committee adviser with a member of the ECC;

5.Any stock of the Company owned by the committee adviser; and

6.Any business or personal relationship of the committee adviser or the committee adviser’s employer with an executive officer of the Company.

Under rules promulgated by the SEC, the ECC must determine, after taking into account these six independence-related factors, whether any work completed by a compensation consultant raised any conflict of interest. For fiscal 2016, the ECC reviewed these six factors in their totality as they apply to Mercer and did not identify any conflict of interest.

Tax Considerations

Generally, Section 162(m) of the Code (“Section 162(m)”) disallows a tax deduction to publicly-held corporations for compensation paid to certain of their executive officers to the extent such compensation exceeds $1.0 million per covered officer in any year. This limitation does not apply to compensation that is considered “qualified performance-based compensation” for purposes of Section 162(m), which definition allows for certain types of performance-based compensation to be excluded from the $1.0 million deduction limit if specific requirements are met.

The ECC considers the impact of Section 162(m) when designing our short-term and long-term incentive compensation programs so that awards may be granted under these programs in a manner that qualifies them as “performance-based compensation” for purposes of Section 162(m). We believe that in establishing these programs for our executive officers, however, the potential tax deductibility of the compensation payable under those programs should be only one of a number of relevant factors taken into consideration, and not the sole governing factor. We believe it is important to maintain cash and equity incentive compensation at the levels and with the design features needed to attract and retain the executive officers essential to our success, even if all or part of that compensation may not be deductible by reason of the Section 162(m) limitation. Accordingly, the ECC may grant awards under which payments may not be deductible under Section 162(m) when the ECC determines that such non-deductible arrangements are otherwise in the best interests of the Company and in furtherance of the stated objectives for our executive compensation program.

Section 409A of the Code (“Section 409A”) imposes taxes in the event that an employee, including a named executive officer, receives “deferred compensation” that does not satisfy the requirements of Section 409A. Although we do not maintain a traditional nonqualified deferred compensation plan, Section 409A applies to certain severance arrangements and equity awards. Consequently, to assist our employees in avoiding the taxes imposed by Section 409A, we have structured our equity awards in a manner intended to either avoid the application of Section 409A or, to the extent doing so is not possible, comply with the applicable Section 409A requirements.

Accounting Considerations

We are required to estimate and record an expense for each equity award over its vesting period. The ECC reviews the effect of the compensation expense under FASB ASC Topic 718 for equity compensation to the named executive officers.

Insider Trading/Anti-Hedging Policies

All employees, officers and directors of, and consultants and contractors to, us or any of our subsidiaries are subject to our Insider Trading Prohibition Policy and Guidelines. The policy prohibits the unauthorized disclosure of any nonpublic information acquired in the work-place and the misuse of material nonpublic information in securities trading. The policy also includes specific anti-hedging provisions.

To ensure compliance with the policy and applicable federal and state securities laws, all individuals subject to the policy must refrain from the purchase or sale of our securities except in designated trading windows. Even during a trading window period, certain identified insiders, which include the named executive officers and directors, must comply with our designated pre-clearance policy prior to trading in our securities. The anti-hedging provisions prohibit all employees, officers and directors from engaging in “short sales” of our securities or in trading market exchanged “derivative securities” tied to our securities.

In April 2008, our board of directors amended our insider trading policy to permit Rule 10b5-1 trading plans. None of our named executive officers had a Rule 10b5-1 plan in effect at June 30, 2016.

Changes in the ECC in Fiscal 2017

The ECC for fiscal 2016 consisted of the following members: Dr. Gromer (Chairman), Dr. Kassakian, Mr. Krueger and Dr. Thakur. On May 1, 2016, the ECC was reconstituted to consist of the following members: Mr. Khaykin (Chairman), Mr. Feld, Dr. Gromer and Dr. Kassakian.

Changes in Executive Management in Fiscal 2017

In April 2016, the board of directors terminated the employment of our Chairman and Chief Executive Officer, Dr. Sehat Sutardja, and our President, Ms. Weili Dai. In June 2016, the board of directors appointed Matthew J. Murphy as our new President and Chief Executive Officer, effective July 11, 2016. Mr. Murphy was also appointed to serve on the board of directors effective as of the date he commenced employment with the Company. The board also appointed Richard S. Hill, our ChairmanCommittees of the Board to serve as Interim Principal Executive Officer until such time as the Company has filed its Quarterly Report on Form 10-Q for the second quarter of fiscal 2017 ending July 30, 2016. Mr. Murphy will assume the role of principal executive officer immediately following such filing.

In May 2016, the board of directors appointed Mitchell Gaynor, Executive Vice President, Chief Legal Officer and Secretary as an executive officer of the Company. In June 2016, the board of directors appointed the following additional individuals as executive officers of the Company: Christopher Koopmans, Executive Vice President, Marketing and Sales; and Andrew Micallef, Chief Operations Officer.

Key Fiscal 2017 Compensation Program Decisions

For fiscal 2017, the ECC determined to retain many elements of the fiscal 2016 named executive officer compensation program that already promotes strong pay for performance alignment, such as the overall compensation philosophy, the use of Company financial targets in setting performance goals, and a strong weighting on equity awards with performance-based vesting. However, the ECC decided to make some program changes for fiscal 2017 to continue its efforts to improve the named executive officer compensation program.

Ongoing compensation packages for executives, including annual salaries and annual incentive plan target percentages, were made in consideration of FY2017 peer group data and an overall median compensation philosophy, the experience of the individuals being hired/promoted or incumbent in the roles, Marvell’s performance, the revised executive team structure and internal equity of compensation levels between roles within that structure. In addition, hire-on awards also took into account equity and other compensation forfeited to join Marvell.

Specifically, the ECC made the following decisions with respect to the executive compensation program for fiscal 2017:

Fiscal 2017 Peer Group Revisions

For fiscal 2017, the Marvell ECC undertook a detailed peer group review incorporating the following considerations:

The impact of M&A activity on prior peer companies and availability of peer data;

Marvell’s current revenue size and industry classification;

Continued feedback from shareholders and advisory groups regarding appropriateness of peer companies; and

Input from new Directors, including the ECC Chair and Board Chair, regarding potential peers.

As a result of that review the ECC approved a new peer group of 16 semiconductor and related equipment companies, with median peer company revenue size closely aligned with Marvell. The approved peer group includes 14 companies from the PHLX Semiconductor Sector Index and overlaps with both the Marvell FY2016 peer group and comparator companies used by shareholder advisory groups.

Peer Group for Fiscal 2017

Company

  Revenue
($Bs)
   Mkt. Cap.
($Bs)
   PHLX  FY 2016
Peer
 

Lam Research Corporation

  $5.26    $12.90    ü    

NVIDIA Corporation

  $5.01    $15.79    ü    ü   

Juniper Networks, Inc.

  $4.86    $10.60     ü   

Advanced Micro Devices

  $3.99    $2.27     ü   

On Semiconductor Corporation

  $3.50    $4.04    ü    

Analog Devices, Inc.

  $3.44    $18.76    ü    ü   

Skyworks Solutions, Inc.

  $3.26    $16.03    ü    

Qorvo, Inc.

  $2.61    $6.42    ü    

Maxim Integrated Products

  $2.31    $9.85    ü    

Xilinx, Inc.

  $2.21    $12.03    ü    ü   

Microchip Technology, Inc.

  $2.17    $9.84    ü    

Teradyne, Inc.

  $1.64    $4.21    ü    

Cypress Semiconductor Corp.

  $1.61    $3.26    ü    

Linear Technology Corporation

  $1.48    $10.60    ü    

Microsemi Corporation

  $1.25    $3.12    ü    

Atmel Corporation

  $1.17    $3.63     

Average

  $2.86    $8.96     

Fiscal 2017 Salaries and Target Bonus as Percentage of Salary

The ECC approved an annual base salary for Mr. Murphy in the amount of $750,000 and a target bonus as a percentage of his salary of 150%.

Fiscal 2017 Long-Term Incentive Awards

In connection with the commencement of Mr. Murphy’s employment, ECC is scheduled to approve long-term incentive awards as follows, once the Company is current with its SEC filings:

He will receive grants of RSUs for the number of shares of Marvell common stock equal to $4.0 million divided by the Share Price (as defined below), as follows:

(1)RSUs for the number of shares of common stock equal to $1.6 million divided by the Share Price (as defined below) that will vest over three (3) years.

(2)RSUs for the number of shares of common stock (at the target achievement level) equal to $1.2 million divided by the Share Price (as defined below) that will vest based on the Company’s relative total shareholder return measured against total shareholder return of comparable companies of the Philadelphia Semiconductor Sector Index over the performance period measured from the First Current Date (as defined below) through the end of fiscal year 2019. The number of shares that could vest under this award can range from zero to 150% of the target number.

(3)RSUs for the number of shares of common stock equal to $1.2 million divided by the Share Price (as defined below) that will vest based on the achievement of operating performance metrics for fiscal years 2017 and 2018. The performance period, metrics and relative weightings (as well as the maximum number of shares that could vest if performance exceeds the target achievement level) will be established by the ECC at the time of grant and will be measured as of the end of fiscal year 2018. Any shares deemed to have been earned upon the successful achievement of such metrics will vest 100% on the third anniversary of the vesting start date.

For purposes of the equity awards described above, “Share Price” shall mean the closing price of the common shares of Marvell (NASDAQ: MRVL) on the NASDAQ Stock Market on (x) the date that is one (1) full

trading day after the first date on which Marvell has filed all required periodic reports with the Securities and Exchange Commission, such that Marvell is “current” with its financial reporting, or (y) the date that the awards are approved by the ECC (but no later than 30 days after the “First Current Date” as defined below), whichever is later. The date that Marvell becomes “current” with its financial reporting is referred to as the “First Current Date.”

Buy-Out Cash Bonus and Sign-on Equity Awards

In connection with Mr. Murphy’s departure from his prior employer to join the Company, he forfeited existing equity awards, including RSUs and “in the money” options and may not receive his cash incentive bonus earned for 2016. In consideration therefor, the ECC recommended and the Board approved a one-time cash bonus and one-time buy-out equity awards (to be granted by the ECC when the Company is current in its financial reporting), as follows:

(1)Cash Bonus — a one-time, buy-out sign-on bonus in an amount equal to $2.1 million minus the amount of any bonus paid to him by his prior employer for its fiscal year 2016. In the event that within twelve (12) months of the start date of his employment he is terminated for “Cause” or if he resigns his employment other than for “Good Reason” (both as defined below), Mr. Murphy will be obligated to repay a pro rata portion of the sign-on bonus.

(2)Hire-On RSU Award — a restricted stock unit award for 435,000 common shares of Marvell which shall vest over three (3) years at the rate of 174,000 shares on the first anniversary of his start date, and the balance shall vest in eight quarterly installments of 32,625 shares. If his employment is terminated without Cause or if he resigns for Good Reason (both as defined below), the unvested portion of the award will vest in full on the date his employment with the Company terminates, provided that he executes and does not revoke a separation agreement and complete release of claims in a form provided by the Company.

(3)Hire-On Performance-Based RSU Award — a performance-based restricted stock unit award for up to 210,000 common shares of Marvell (at the target achievement level) which shall vest based on achievement of performance objectives relating to the relative total shareholder return of Marvell’s stock as compared to the total shareholder return of comparable companies of the Philadelphia Semiconductor Sector Index over the performance period measured from his start date through the third anniversary of his start date. The number of shares that could vest under this award can range from zero to 150% of the 210,000 target number. If the Company terminates his employment without Cause or he resigns for Good Reason (both as defined below), (i) the performance measurement period will be deemed to end on the date five (5) business days before the employment termination date, (ii) the achievement of the performance metrics will be calculated by the ECC with respect to such shortened measurement period, and (iii) the number of shares that would vest based on such calculations will vest effective upon his termination date, provided that he executes and does not revoke a separation agreement and complete release of claims in a form provided by the Company. Any remaining unvested portion of the award will be forfeited and terminate.

For purposes of the above, “Cause” is defined as: (A) an act of material dishonesty in connection with Mr. Murphy’s job responsibilities; (B) conviction of, or plea of nolo contendere to, a felony or any crime involving fraud, embezzlement or moral turpitude; (C) gross misconduct; (D) willful unauthorized use or disclosure of any proprietary information or trade secrets of the Company or Marvell Technology Group Ltd. (“Marvell”); (E) willful breach of any obligations under any written agreement with the Company or Marvell that is not cured within 10 days after your receipt of written notice from the Company specifying the breach; (F) willful refusal to cooperate in good faith with a governmental or internal investigation of the Company, Marvell or their directors, officers or employees, if the Company or Marvell has requested his cooperation; or (G) willful failure to substantially perform his duties with Company or Marvell (other than as a result of incapacity due to physical or mental illness); provided that the action or conduct described in this clause (G) will constitute “Cause” only if such failure continues after the Company’s Board of Directors or Chairman of the Board has provided him with a

written demand for substantial performance setting forth in detail the specific respects in which the Company believes he has willfully failed to substantially perform his duties thereof and he has been provided a reasonable opportunity (to be not less than 20 days) to cure the same. “Good Reason” is defined as the occurrence of any of the following conditions without Mr. Murphy’s consent: (X) a change in his position within the Company (or a parent or subsidiary employing him) that materially reduces his level of duties, authority or responsibilities; provided, however, that if there is a change in his role after which he does not have the role as chief executive officer with respect to a parent entity whose stock is publicly-traded, then such a change shall affirmatively constitute Good Reason; (Y) a reduction of 10% or greater in his level of annual base salary or incentive compensation eligibility; or (Z) the Company requires (i) Mr. Murphy to relocate the principal place of performance of his duties to a location more than 30 miles from the his principal place of performance and (ii) the relocation results in a greater commute him.

Severance Agreement

Concurrently with the commencement of his employment, Mr. Murphy and the Company entered into a severance agreement pursuant to which, if Mr. Murphy’s employment is terminated by the Company for other than “Cause” or if he resigns for “Good Reason” (both as defined therein), he will be paid a lump sum separation payment equal to the sum of his then annual base salary plus target incentive bonus plus reimbursement for 12 months of medical insurance premiums, provided he executes and does not revoke a release of claims in a form provided by the Company. If the provisions of Marvell’s Change in Control and Severance Plan (described below) are triggered in connection with termination of his employment and he receives the severance benefits provided therein, he will not be eligible for the severance payments under the severance agreement.

The ECC provided these severance benefits to Mr. Murphy given recent board and management changes at the Company. The amounts of these benefits were intended to be reasonable relative to market practice and market trends.

Adoption of Change in Control and Severance Plan

In June 2016, the ECC recommended, and the Company’s board of directors adopted, a Change in Control and Severance Plan (the “CIC Plan”), the purpose of which is to provide assurances of specified benefits to certain employees of the Company whose employment is subject to being involuntarily terminated other than for death, Disability, or Cause or voluntarily terminated for Good Reason under the circumstances described in the CIC Plan. All capitalized terms are as defined in the CIC Plan. A copy of the CIC Plan is filed as Exhibit 10.2 to our Current Report on Form 8-K as filed with the SEC on June 20, 2016.

The ECC designed the CIC Plan to protect key senior employees involved in a transaction in order to facilitate a clear focus on what is best for shareholders by making the executives neutral to a potential transaction. The protections offered by tier were developed in consideration of market practice and trends, and Marvell executives were slotted into tiers based on the ongoing executive team structure/roles.

An individual is only eligible to participate in the CIC Plan if he or she is designated a participant by the ECC or board. A designated participant is eligible for Severance Benefits under the CIC Plan if he or she experiences an Involuntary Termination during the period beginning upon a Change in Control and ending on the date that is 18 months following the Change in Control. The amount and type of Severance Benefits differ based on the participation level as determined by the ECC for the designated individuals as follows:

Tier 1: Lump sum payment equal to 24 months of annual base salary, 200% of annual target bonus for the fiscal year in which Involuntary Termination occurs, and annual target bonus for fiscal year in which Involuntary Termination occurs pro-rated for the number of full months employed during the fiscal year; acceleration of 100% of outstanding and unvested equity awards (with performance-based equity awards subject to adjustment as set forth in the CIC Plan); reimbursement of 24 months of continued health coverage.

Tier 2: Lump sum payment equal to 18 months of annual base salary, 150% of annual target bonus for the fiscal year in which Involuntary Termination occurs, and annual target bonus for fiscal year in which Involuntary Termination occurs pro-rated for the number of full months employed during the fiscal year; acceleration of 100% of outstanding and unvested equity awards (with performance-based equity awards subject to adjustment as set forth in the CIC Plan); reimbursement of 18 months of continued health coverage.

Tier 3: Lump sum payment equal to 12 months of annual base salary, 100% of annual target bonus for the fiscal year in which Involuntary Termination occurs, and annual target bonus for fiscal year in which Involuntary Termination occurs pro-rated for the number of full months employed during the fiscal year; acceleration of 100% of outstanding and unvested equity awards (with performance-based equity awards subject to adjustment as set forth in the CIC Plan); reimbursement of 12 months of continued health coverage.

Tier 4: Lump sum payment equal to 6 months of annual base salary, 50% of annual target bonus for the fiscal year in which Involuntary Termination occurs, and annual target bonus for fiscal year in which Involuntary Termination occurs pro-rated for the number of full months employed during the fiscal year; acceleration of 100% of outstanding and unvested equity awards (with performance-based equity awards subject to adjustment as set forth in the CIC Plan); reimbursement of 6 months of continued health coverage.

The payment of Severance Benefits is subject to the limitations set forth in the CIC Plan regarding compliance with Sections 280G and 409A of the Internal Revenue Code, as amended. In order to receive the Severance Benefits set forth above, an individual must sign and not revoke a separation and release of claims in a form satisfactory to the Company.

The ECC designated the following executive officers as participants in the CIC Plan at the levels set forth following their names: Matthew J. Murphy, President and CEO (Tier 1); Mitchell Gaynor, Executive Vice President, Chief Legal Officer and Secretary (Tier 2); Andrew Micallef, Chief Operations Officer (Tier 2); and Christopher Koopmans, Executive Vice President, Marketing and Sales (Tier 3).

Compensation Committee Report

The information contained in the Compensation Committee Report shall not be deemed to be “soliciting material” or to be “filed” with the SEC, nor shall such information be incorporated by reference into any future filing under the Securities Act of 1933, as amended, or the Exchange Act, except to the extent that the Company specifically incorporates the information by reference in such filing.

The ECC for fiscal 2016 consisted of the following members: Dr. Gromer (Chairman), Dr. Kassakian, Mr. Krueger and Dr. Thakur. On May 1, 2016, the ECC was reconstituted to consist of the following members: Mr. Khaykin (Chairman), Mr. Feld, Dr. Gromer and Dr. Kassakian.

The ECC has reviewed and discussed the Compensation Discussion and Analysis required by Item 402(b) of Regulation S-K with management. Based on such review and discussions, the ECC has recommended to our board of directors that the Compensation Discussion and Analysis be included in our Annual Report onForm 10-K for the fiscal year ended January 30, 2016.

Respectfully submitted by the members of the ECC of our board of directors:

Mr. Oleg Khaykin, Chairman

Mr. Peter Feld

Dr. Juergen Gromer

Dr. John G. Kassakian

Summary Compensation Table for Fiscal 2016, 2015 and 2014

Name and Principal Position

 Fiscal
Year
  Salary ($)  Bonus ($)  Stock
Awards
($)  (1)
  Option
Awards
($) (2)(3)
  Non-Equity
Incentive Plan
Compensation
($) (4)
  All Other
Compensation
($)
  Total ($) 

Dr. Sehat Sutardja

  2016    956,500    —      5,831,950    1,823,677    —      8,379,444 (5)   16,991,571  
Former Chief Executive Officer  2015    850,000    —      5,537,784    1,480,374    1,818,402    1,890 (6)   9,688,450  
  2014    850,000    —      2,104,000    5,112,450    —      1,603    8,068,053  

Weili Dai

  2016    571,231    —      3,243,796    1,013,154    —      1,656    4,829,837  

Former President

  2015    551,154    —      3,102,400    795,900    638,936    1,890 (6)   5,090,280  
  2014    510,000    —      1,683,200    1,533,735    —      1,603    3,728,538  

Mr. Michael Rashkin (7)

  2016    132,231    —      1,667,793    —      —      62,369 (8)   1,862,393  
Former Chief Financial Officer  2015    394,618    30,000 (9)   1,551,200    397,950    285,239    2,000 (10)   2,661,007  
  2014    120,000    —      —      —      —      2,000    122,000  

Mr. Sukhi Nagesh (11)

  2016    299,461    100,000    —      198,720    155,820    45,692 (12)   799,694  
Former Interim Chief Financial Officer        

Dr. Zining Wu

  2016    428,873    —      1,865,572    506,577    —      36,585 (13)   2,837,607  

Chief Technology Officer

  2015    384,578    110,000 (9)   1,551,200    397,950    285,239    102,233 (14)   2,831,200  
  2014    307,911    —      168,320    408,996    —      47,135    932,632  

Mr. David P. Eichler

  2016    214,381    —      —      —      —      —      214,381  
Interim Chief Financial Officer (15)        

(1)The dollar value of RSUs and performance awards shown represents the grant date fair value calculated on the basis of the fair market value of the underlying common shares on the grant date in accordance with FASB ASC Topic 718 and without any adjustment for estimated forfeitures. The actual value that an executive will realize on each RSU award and performance award will depend on the price per share of our common shares at the time shares underlying the RSUs and performance awards are sold. There can be no assurance that the actual value realized by an executive will be at or near the grant date fair value of the RSUs or performance awards awarded.
(2)The dollar value of the options shown represents the estimated grant date fair value determined in accordance with FASB ASC Topic 718 pursuant to the Black-Scholes option pricing model, with no adjustment for estimated forfeitures. For a discussion of valuation assumptions used in the calculations, see Note 12 of Notes to Consolidated Financial Statements in Part I, Item 8 of this Annual Report Form 10-K. The actual value, if any, that an executive may realize on each option will depend on the excess of the stock price over the exercise price on the date the option is exercised and the shares underlying such option are sold. There is no assurance that the actual value realized by an executive will be at or near the value estimated by the Black-Scholes model.
(3)Companies make different assumptions regarding the volatility input when determining the estimated grant date fair value of stock option awards in accordance with FASB ASC Topic 718. We use a blended volatility that is an equally weighted combination of historical stock price volatility and implied volatility in our financial statements. The implied volatility is derived from traded options on our stock in the marketplace and the historical volatility is based on the actual historical changes in our stock price over an extended period of time prior to the grant. Because many companies use only an implied volatility, which is based on the level of volatility assumed in the market prices of freely traded options as of the date of grant, we believe it is useful to provide investors with what the value of stock option awards would be had we used only implied volatility as an input for comparative purposes. The following table presents the grant date fair value of our stock option awards in fiscal 2016 assuming an implied volatility of 33% (compared to a blended implied and historical volatility of 34%), the grant date fair value of our stock option awards in fiscal 2015 assuming an implied volatility of 31% (compared to a blended implied and historical volatility of 34%) and the grant date fair value of our stock option awards in fiscal 2014 assuming an implied volatility of 41% (compared to a blended implied and historical volatility of 45%).

Named Executive Officer

  Fiscal
Year
   Option
Awards
Calculation
Using
Blended
Volatility ($)
   Option Awards
Calculation
Using
Implied
Volatility ($)
   (Decrease) to
Total
Compensation
Using Implied
Volatility ($)
 

Dr. Sehat Sutardja

   2016     1,823,677     1,784,812     (38,865

Dr. Sehat Sutardja

   2015     1,480,374     1,354,936     (125,438

Dr. Sehat Sutardja

   2014     5,112,450     4,627,350     (485,100

Weili Dai

   2016     1,013,154     991,562     (21,592

Weili Dai

   2015     795,900     728,460     (67,440

Weili Dai

   2014     1,533,735     1,388,205     (145,530

Michael Rashkin

   2016     —       —       —    

Michael Rashkin

   2015     397,950     364,230     (33,720

Sukhi Nagesh

   2016     198,720     194,485     (4,235

Dr. Zining Wu

   2016     506,577     495,781     (10,796

Dr. Zining Wu

   2015     397,950     364,230     (33,720

Dr. Zining Wu

   2014     408,996     370,188     (38,808

David P. Eichler

   2016     —       —       —    

(4)The amounts shown in this column represent annual cash incentive awards earned by the named executive officers under our fiscal 2015 annual incentive plan, which is intended to qualify as performance-based compensation under Section 162(m). Further information regarding the fiscal 2015 awards is included in the section entitled “Elements of Executive Compensation for Fiscal 2015-Fiscal 2015 Annual Incentive Plan Cash” in the Compensation Discussion and Analysis above.
(5)This amount includes reimbursement of taxes and penalty owed under IRS Tax Code 409(A) plus accrued interest in an amount of $8,374,575, use of a car leased by the Company in the amount of $2,748, premium for basic life insurance of 2.5 times annual salary up to $1,000,000 in the amount of $1,889 and $231 in consideration for an election not to enroll in our healthcare plan.
(6)This amount includes premium for basic life insurance of 2.5 times annual salary up to $1,000,000 in the amount of $1,890.
(7)Mr. Rashkin retired as the Company’s Chief Financial Officer effective May 22, 2015.
(8)This amount includes payout of flexible time off in the amount of $61,369 and Company matching contributions to Mr. Rashkin’s 401(k) retirement account in the amount of $1,000.
(9)Represents payment in connection with a bonus program developed in the second quarter of fiscal year 2015 for certain of the Company’s vice presidents who had received no bonus for service in fiscal year 2014. When the Company completed its fiscal year 2014 employee performance and compensation review in March and April 2014, the Company determined to allocate no funds for distribution to the Company’s vice presidents for service in fiscal year 2014 in order to maximize funds available for distribution to employees below the vice president level, and all such funds were distributed in April 2014. Subsequently, based on the Company’s review of its financial results for the first quarter of fiscal year 2015, including cost savings achieved in that quarter, in May 2014 the Company created a budget for bonuses for employees at the vice president level who had been excluded from the fiscal year 2014 bonus program. The Company allocated bonuses to nonexecutive vice presidents in June 2014. In connection with this process, the Company recognized that Mr. Rashkin and Dr. Wu would have been eligible for a bonus pursuant to this program but for the fact that they had been appointed as executive officers very late in fiscal year 2014 (December 2013 and January 2014, respectively). Subsequently, the Executive Compensation Committee approved payments to Dr. Wu and Mr. Rashkin consistent with the bonuses allocated to nonexecutive vice presidents under this program.
(10)This amount represents the Company’s matching contributions to Mr. Rashkin’s 401(k) retirement account of $2,000.

(11)Mr. Nagesh was appointed Interim Chief Financial Officer on May 22, 2015. On October 7, 2015, Mr. Nagesh resigned as Interim Chief Financial Officer and was appointed Senior Vice President, Corporate Development and Strategy, Financial Planning and Analysis and Investor Relations. Mr. Nagesh resigned from such position on January 15, 2016.
(12)This amount includes payout of flexible time off in the amount of $42,569, Company matching contributions to Mr. Nagesh’s 401(k) retirement account in the amount of $2,000 and premium for basic life insurance of 2.5 times annual salary up to $1,000,000 in the amount of $1,123.
(13)This amount includes cash out of flexible time off in the amount of $33,462, Company matching contributions to Dr. Wu’s 401(k) retirement account in the amount of $2,000 and premium for basic life insurance of 2.5 times annual salary up to $1,000,000 in the amount of $1,123.
(14)This amount includes premium for basic life insurance of 2.5 times annual salary up to $1,000,000 in the amount of $791, the Company’s matching contributions to Dr. Wu’s 401(k) retirement account of $2,000, cash out of accrued vacation of $7,692, and payments under our non-executive patent award program to Dr. Wu prior to his appointment as an executive officer of $91,750.
(15)Represents amounts paid by us to Ranstad Professional Services d/b/a Tatum for Mr. Eichler’s services.

Grants of Plan-Based Awards in Fiscal 2016

  Grant
Date
  Estimated Future Payouts
Under Non-Equity Incentive
Plan Awards (1)
  Estimated Future Payouts
Under Equity Incentive
Plan Awards
  All
Other
Stock
Awards:
Number
of
Shares
of Stock
or Units
(#)
  All
Other
Option
Awards:
Number
of
Securities
Underlying
Options
(#) (2)
  Exercise
or Base
Price
of Option
Awards
($/shr)
  Grant
Date
Fair
Value of
Stock
and
Option
Awards
($) (3)(4)
 

Name

  Threshold($)  Target($)  Maximum($)  Threshold(#)  Target(#)  Maximum(#)     

Dr. Sehat Sutardja

  04/30/2015    —     —     —     0    154,176    308,352    —     —     —     2,123,004  
  04/30/2015    —     —     —     0    98,044    —      —     —     —     1,350,066  
  04/30/2015    —     —     —     0    192,719    385,439    —     —     —     2,358,881  
  06/24/2015    —     —     —     —     —     —     —     458,856    14.35    1,823,677  
   661,500    1,102,500    1,984,500    —     —     —     —     —     —     —   

Weili Dai

  04/30/2015    —     —     —     0    85,654    171,306    —     —     —     1,179,456  
  04/30/2015    —     —     —     0    54,746    —      —     —     —     753,852  
  04/30/2015    —     —     —     0    107,066    214,133    —     —     —     1,310,488  
  06/24/2015    —     —     —     —     —     —     —     254,920    14.35    1,013,154  
   234,000    390,000    702,000    —     —     —     —     —     —     —   

Michael Rashkin

  04/30/2015    —     —     —     0    42,826    85,654    —     —     —     589,714  
  4/30/2015    —     —     —     0    30,707    —     —     —     —     422,835  
  4/30/2015    —     —     —     0    53,533    107,066    —     —     —     655,244  
   92,250    153,750    276,750    —     —     —     —     —     —     —   

Zining Wu

  04/30/2015    —     —     —     0    42,826    85,654    —     —     —     589,714  
  04/30/2015    —     —     —     0    45,707    —     —     —     —     629,385  
  04/30/2015    —     —     —     0    53,533    107,066    —     —     —     655,244  
  06/24/2015    —     —     —     —     —     —     —     127,460    14.35    506,577  
   97,875    163,125    293,625    —     —     —     —      

Sukhi Nagesh

  06/24/2015    —     —     —     —     —     —     —     50,000    14.35    198,720  

David P. Eichler

   —     —     —     —     —     —     —     —     —     —   

(1)The amounts represent the threshold, target and maximum dollar payouts under our Executive Incentive Performance Plan for fiscal 2016. There is no payout below threshold performance. Payments under this plan are intended to qualify as performance-based compensation under Section 162(m). Further information regarding this plan is included in the section entitled “Elements of Executive Compensation-Fiscal 2016 Annual Incentive Plan Cash” in the Compensation Discussion and Analysis above.

(2)Amounts shown represent options issued under the 1995 Stock Plan that will, in general, vest and become exercisable in two equal annual installments upon the named executive officer’s completion of each year of service on the third and fourth anniversary, measured from April 1, 2015. The options have a term of 10 years from the date of grant.
(3)The dollar value of stock awards shown represents the grant date fair value calculated on the basis of the fair market value of the underlying common shares on the grant date in accordance with FASB ASC Topic 718 and without any adjustment for estimated forfeitures. The actual value that an executive will realize on each stock award will depend on the price per share of our common shares at the time shares underlying the stock awards are sold. There can be no assurance that the actual value realized by an executive will be at or near the grant date fair value of the stock awarded.
(4)The dollar value of the options shown represents the estimated grant date fair value determined in accordance with FASB ASC Topic 718 pursuant to the Black-Scholes option pricing model, with no adjustment for estimated forfeitures. For a discussion of valuation assumptions used in the calculations, see Note 12 of Notes to Consolidated Financial Statements in Part I, Item 8 of this Annual Report Form 10-K. Companies make different assumptions regarding the volatility input when determining the estimated grant date fair value in accordance with FASB ASC Topic 718 pursuant to the Black-Scholes option pricing model. For additional details on the difference between the aggregate value of fiscal 2016 stock option awards using a blended volatility and implied volatility, see note (3) to the Summary Compensation Table for Fiscal 2016, 2015 and 2014. The actual value, if any, that an executive may realize on each option will depend on the excess of the stock price over the exercise price on the date the option is exercised and the shares underlying such option are sold. There is no assurance that the actual value realized by an executive will be at or near the value estimated by the Black-Scholes model.

Outstanding Equity Awards at Fiscal 2016 Year-End

   Option Awards   Stock Awards 

Name

  Number of
Securities
Underlying
Unexercised
Options (#)
Exercisable
  Number of
Securities
Underlying
Unexercised
Options (#)
Unexercisable
  Equity
Incentive
Plan
Awards:
Number of
Securities
Underlying
Unexercised
Unearned
Options (#)
  Option
Exercise
Price
($)
   Option
Expiration
Date
   Number
of
Units
That
Have
Not
Vested
(#)
  Market
Value of
Units of
Stock
That
Have Not
Vested ($)
  Equity
Incentive
Plan
Awards:
Number of
Unearned
Units That
Have Not
Vested (#)
  Equity
Plan
Incentive
Plan
Awards:
Market
Value of
Unearned
Units
That
Have Not
Vested ($)
 

Dr. Sehat Sutardja

   292,000(1)   —      —      34.3750     3/10/2016     —      —      —      —    
   162,000(1)   —      —      24.7950     5/25/2016     —      —      —      —    
   235,000(1)   —      —      14.01     12/28/2017     —      —      —      —    
   226,800(1)   —      —      14.01     12/28/2017     —      —      —      —    
   97,500(1)   —      —      6.84     12/18/2018     —      —      —      —    
   300,000(1)   —      —      6.84     12/18/2018     —      —      —      —    
   250,000(1)   —      —      21.14     4/12/2020     —      —      —      —    
   700,000(1)   —      —      15.425     4/29/2021     —      —      —      —    
   —      —      1,400,000(2)   15.425     4/29/2021     —      —      —      —    
   1,125,000(3)   375,000(3)   —      15.20     4/21/2022     —      —      —      —    
   500,000(4)   1,000,000(4)   —      10.76     4/30/2023     —      —      —      —    
   —      —      —      —       —       50,000(5)  $442,500(6)   —      —    
   —      372,000(7)   —      14.59     6/16/2024     —      —      —      —    
   —      —      —      —       —       —      —      119,000(8)  $1,053,150(6) 
   —      —      —      —       —       —      —      59,500(9)  $526,575(6) 
   —      458,000(10)   —      14.35     6/24/2025     —      —      —      —    
   —      —      —      —       —       —      —      154,176(11)  $1,364,458(6) 
   —      —      —      —       —       —      —      98,044(12)  $867,689(6) 
   —      —      —      —       —       —      —      192,719(13)  $1,705,563(6) 

Weili Dai

   200,000(1)   —      —      6.84     12/18/2018     —      —      —      —    
   100,000(1)   —      —      12.92     6/10/2019     —      —      —      —    
   100,000(1)   —      —      21.14     4/12/2020     —      —      —      —    
   180,000(1)   —      —      15.425     4/29/2021     —      —      —      —    
   —      —      360,000(2)   15.425     4/29/2021     —      —      —      —    
   600,000(3)   200,000(3)   —      15.20     4/21/2022     —      —      —      —    
   150,000(4)   300,000(4)   —      10.76     4/30/2023     —      —      —      —    
   —      —      —      —       —       20,000(5)  $177,000(6)   —      —    
   —      200,000(7)   —      14.59     6/16/2024     —      —      —      —    
   —      —      —      —       —       —      —      66,666(8)  $589,994(6) 
   —      —      —      —       —       —      —      33,334(9)  $295,006(6) 
   —      254,920(10)   —      14.35     6/24/2025     —      —      —      —    
   —      —      —      —       —       —      —      85,654(11)  $758,038(6) 
   —      —      —      —       —       —      —      54,746(12)  $484,502(6) 
   —      —      —      —       —       —      —      107,066(13)  $947,534(6) 

   Option Awards   Stock Awards 

Name

  Number of
Securities
Underlying
Unexercised
Options (#)
Exercisable
  Number of
Securities
Underlying
Unexercised
Options (#)
Unexercisable
  Equity
Incentive
Plan
Awards:
Number of
Securities
Underlying
Unexercised
Unearned
Options (#)
  Option
Exercise
Price
($)
   Option
Expiration
Date
   Number
of
Units
That
Have
Not
Vested
(#)
  Market
Value of
Units of
Stock
That
Have Not
Vested ($)
  Equity
Incentive
Plan
Awards:
Number of
Unearned
Units That
Have Not
Vested (#)
  Equity
Plan
Incentive
Plan
Awards:
Market
Value of
Unearned
Units
That
Have Not
Vested ($)
 

Michael Rashkin

   —      —      —      —         —      —      —      —    

Dr. Zining Wu

   30,000(1)   —      —      21.14     4/12/2020     —      —      —      —    
   50,000(1)   —      —      15.425     4/29/2021     —      —      —      —    
   —      —      50,000(2)   15.425     4/29/2021     —      —      —      —    
   18,750(3)   6,250(3)   —      15.20     4/21/2022     —      —      —      —    
   —      80,000(4)   —      10.76     4/30/2023     —      —      —      —    
   —      —      —      —       —       8,125(5)  $71,906(6)   —      —    
   —      100,000(7)   —      14.59     6/16/2024     —      —      —      —    
   —      —      —      —       —       —      —      15,000(8)  $132,750(6) 
   —      —      —      —       —       —      —      35,000(9)  $309,750(6) 
   —      127,460(10)   —      14.35     6/24/2025     —      —      —      —    
   —      —      —      —       —       —      —      42,826(11)  $379,010(6) 
   —      —      —      —       —       —      —      45,707(12)  $404,507(6) 
   —      —      —      —       —       —      —      53,533(13)  $473,767(6) 

Sukhi Nagesh

   4,583(14)   —      —      14.14     2/14/2016     —      —      —      —    
   3,062(15)   —      —      15.20     2/14/2016     —      —      —      —    
   8,250(16)   —      —      10.76     2/14/2016     —      —      —      —    

David P. Eichler

   —      —      —      —       —       —      —      —      —    

(1)Fully vested.
(2)

Performance-based stock options with a market-based condition were granted that have a ten-year term and vest contingent on the achievement of a stringent average stock price hurdle before April 29, 2016. If the closing price of our common shares as reported by the NASDAQ Global Select Market equals or exceeds an average of $24.70 for a period of 200 consecutive trading days prior to the 5th anniversary of the date of grant (the “Trigger Event”), then 100% of the shares subject to the option will vest on the date of the Trigger Event, subject to continued service through both the date of the Trigger Event and April 1, 2013. Each of the performance-based stock options will immediately expire if the Trigger Event does not occur prior to the 5th anniversary of the date of grant.

(3)

The option vests as to 25% of the shares on the one year anniversary of the vesting commencement date, which was April 1, 2012, and 1/4th yearly thereafter. The option will be fully vested on April 1, 2016.

(4)

The option vests as to 1/3 of the shares on the two year anniversary of the vesting commencement date, which was April 1, 2013, and 1/3rd yearly thereafter. The option will be fully vested on April 1, 2017.

(5)

The RSU award vests as to 25% of the shares on the one year anniversary of the vesting commencement date, which was April 1, 2012, and 1/4th yearly thereafter.

(6)The price per share of our common shares on the last trading day of fiscal 2016 was $8.85 as reported on the NASDAQ Global Select Market on January 29, 2016.
(7)The option vests as to 50% of the shares on the third year anniversary of the vesting commencement date, which was April 1, 2014, and 50% on the fourth anniversary of the vesting commencement date. The option will be fully vested on April 1, 2018.
(8)Represents performance-based RSUs awarded on April 29, 2014 that are earned upon the Company’s achievement of revenue and operating income targets for fiscal 2015 and 2016. If earned the performance-based RSUs vest as to 50% of the shares on the first anniversary of the vesting commencement date of April 1, 2014 for fiscal 2015 targets, and 50% on the second anniversary of the vesting commencement date of April 1, 2014 for fiscal 2016 targets. In accordance with SEC disclosure requirements, the maximum number of shares issuable under the performance-based RSUs is shown, assuming achievement at the maximum level of 200% because following 2015 fiscal year end, it was determined that achievement was in excess of the target level of 100% for fiscal 2015.
(9)Represents performance award shares awarded on April 29, 2014 that are earned upon the NEO’s achievement of individual strategic performance objectives for fiscal 2015 and 2016. If earned the performance shares vest as to 50% of the shares on the first anniversary of the vesting commencement date of April 1, 2014 for fiscal 2015 targets, and 50% on the second anniversary of the vesting commencement date of April 1, 2014 for fiscal 2016 targets. In accordance with SEC disclosure requirements, the target number of shares issuable under the performance share awards is shown, assuming achievement at the 100% level because following 2015 fiscal year end, it was determined that achievement for each NEO was at or below the target level of 100% for fiscal 2015.
(10)The option vests annually over two years beginning on the third anniversary of April 1, 2015, subject to the continued service through each vesting date. The option will be fully vested on April 1, 2019.
(11)Performance-based RSUs that vest on the first anniversary of April 1, 2015 based on the achievement of revenue and operating income targets, subject to continued service through the vesting date.
(12)Performance shares that vest on the first anniversary of April 1, 2015 based on the achievement of individual strategic performance objectives.
(13)Performance shares that vest on the second anniversary of April 1, 2015 based on the achievement of total shareholder return reward objectives, subject to continued service through the vesting date.
(14)

Original option amount of 25,000 options vest and become exercisable at the rate of 1/5th of the shares on May 9, 2012 and 1/60th of the shares after the completion of each additional month of employment with the Company thereafter after the next four years. Mr. Nagesh’s last date of employment was January 15, 2016, and to the extent this Option was vested at the date of termination, Mr. Nagesh was able to exercise this Option at any time during the 30 day period immediately following termination.

(15)Original option amount of 12,250 options vest and become exercisable in four equal annual installments beginning on April 1, 2013 and every year thereafter; provided employment is served through each applicable vesting date. Mr. Nagesh’s last date of employment was January 15, 2016, and to the extent this Option was vested at the date of termination, Mr. Nagesh was able to exercise this Option at any time during the 30 day period immediately following termination.
(16)Original option amount of 24,750 options vest and become exercisable in three equal annual installments on April 1, 2015 and each year thereafter; provided employment is served through each applicable vesting date. Mr. Nagesh’s last date of employment was January 15, 2016, and to the extent this Option was vested at the date of termination, Mr. Nagesh was able to exercise this Option at any time during the 30 day period immediately following termination.

Option Exercises and Stock Vested in Fiscal 2016

   Option Awards   Stock Awards 

Name

  Number of
Shares
Acquired on
Exercise(#)
  Value
Realized
on
Exercise($)
   Number of
Shares
Acquired
on Vesting(#)
   Value
Realized
on Vesting($)

(1)
 

Dr. Sehat Sutardja

   —      —       279,217     4,179,878  

Weili Dai

   —      —       147,912     1,632,368  

Michael Rashkin

   2,500(2)   35,525     67,194     1,005,894  

Dr. Zining Wu

   40,000(3)   150,141     66,803     1,000,040  

Sukhi Nagesh

   27,376(4)   45,449     13,625     203,991  

David P. Eichler

   —      —       —       —    

(1)The RSUs vested and were released on April 1, 2015 at $14.97 per share.
(2)Mr. Rashkin exercised an option with an exercise price of $6.84 on June 5, 2015.
(3)Dr. Wu exercised an option with an exercise price of $10.76 on June 23, 2015.
(4)On February 23, 2015, Mr. Nagesh exercised 18,750 options with an exercise price of $14.14; 6,126 options with an exercise price of $15.20; and 2,500 options with an exercise price of $15.43.

Employment Contracts and Change-in-Control Arrangements

On October 15, 2015, the Company retained David P. Eichler of Randstad Professionals U.S., LP, d/b/a Tatum (“Tatum”) to serve as our Interim Chief Financial Officer (“Interim CFO”), effective October 16, 2015. In such capacity Mr. Eichler also acts as our principal accounting officer. In connection with retaining Mr. Eichler as our Interim CFO, we entered into an Interim Services Agreement with Tatum, effective October 15, 2015. For the provision of Mr. Eichler’s services, we pay Tatum $15,000 per week for up to 60 hours of professional services. In addition, for work by Mr. Eichler in excess of 60 hours, we pay Tatum at a rate of $325 per hour, and for work performed by other Tatum professionals, we pay Tatum at a rate of $250 per hour. Mr. Eichler is not eligible for any other compensation or benefits from the Company. The Interim Services Agreement requires that the Company indemnify Mr. Eichler and Tatum in connection with services thereunder. The Interim Services Agreement has a minimum term of three months, and thereafter may be terminated by either party for any reason upon 15 days’ advance written notice. A copy of the Interim Services Agreement is attached as Exhibit 10.1 to our Quarterly Report on Form 10-Q for the quarter ending October 31, 2015.

During fiscal 2016, we did not have any employment agreements with any of our named executive officers, other than the Interim Services Agreement with Tatum, and we did not have any compensatory plan or arrangement that would result in any payments to any named executive officers upon such officer’s resignation, retirement or other termination or from a change-in-control. Any of our named executive officers may resign at any time and the employment of any named executive officer may be terminated at any time by our board of directors.

- Director Compensation Table, — Fiscal 2016

The following table details the total compensation paid to our nonemployee directors (“Outside Directors”) in fiscal 2016.

Name

  Fees
Earned or
Paid in
Cash
($)
   Stock
Awards
($) (1)
   Total
($)
 

Dr. Juergen Gromer

   245,000     219,992     464,992  

Dr. John G. Kassakian

   150,000     219,992     369,992  

Arturo Krueger

   205,000     219,992     424,992  

Dr. Randhir Thakur

   150,000     219,992     369,992  

(1)The dollar value of RSUs shown represents the grant date fair value calculated on the basis of the fair market value of the underlying common shares on the grant date based on the closing market price on such date. The actual value that a director will realize on each RSU award will depend on the price per share of our common shares at the time shares underlying the RSUs are sold. There can be no assurance that the actual value realized by a director will be at or near the grant date fair value of the RSUs awarded. This number was calculated based on the maximum number of RSUs that could be granted pursuant to the Annual RSU Award on July 1, 2014, which is 15,058 RSUs under the 2007 Director Plan.

The following table provides the number of shares subject to outstanding RSUs held at January 30, 2016 for each current Outside Director, as applicable:

Name

Total RSU
Awards
Outstanding
(#)

Dr. Juergen Gromer

16,685

Dr. John G. Kassakian

16,685

Arturo Krueger

16,685

Dr. Randhir Thakur

16,685

In fiscal 2014” “Executive Compensation” and prior years, our Outside Directors received stock options as part of their compensation. The following table provides the number of shares subject to outstanding unexercised stock options held by each current Outside Director at January 30, 2016 (all of which are fully vested):

Name

Total Options
Awards
Outstanding
(#)

Dr. Juergen Gromer

145,000

Dr. John G. Kassakian

133,000

Arturo Krueger

119,000

Dr. Randhir Thakur

50,000

Executive“Executive Compensation Committee Interlocks and Insider Participation

The Executive Compensation Committee (“ECC”) during fiscal 2016 consisted of Dr. Gromer (Chairman), Dr. Kassakian, Mr. Krueger and Dr. Thakur. None of the members of the ECC who served during fiscal 2016 is a current or former officer or employee of us orParticipation” in our subsidiaries, or had any relationship with us not otherwise disclosed herein under applicable SEC rules. In addition, to our knowledge, there are no compensation committee interlocks between us and other entities involving our executive officers or directors who serve as executive officers or directors of such other entities. On May 1, 2016, the membership of the ECC was reconstituted as follows: Mr. Khaykin (Chairman), Mr. Feld, Dr. Gromer and Dr. Kassakian.

2017 Proxy Statement.

Item 12.Security Ownership of Certain Beneficial Owners and Management and Related Shareholder Matters

The following table sets forth information regardingrequired by Item 403 of Regulation S-K is incorporated by reference herein to the beneficial ownership of our shares as of July 11, 2016, except as noted otherwise, for:

each person or entity who is known by us to own beneficially more than 5% of our outstanding shares;

each of our directors and nominees for director;

each of our named executive officers named in the Summary Compensation Tableinformation set forth under the caption “Security Ownership of Certain Beneficial Owners and Management” in Part III, Item 11 of this Annual Report on Form 10-K; and

our 2017 Proxy Statement.

all directors and current executive officers as a group.


Unless otherwise indicated, the address of each of the beneficial owners is c/o Marvell Semiconductor, Inc., 5488 Marvell Lane, Santa Clara, CA 95054.

   Shares Beneficially Owned (1) 

Name

          Number             Percent**   

5% Shareholders:


FMR LLC (2)

   50,835,497     9.9  

245 Summer Street


Boston, Massachusetts 02210


Starboard Value LP (3)

   33,720,786     6.6  

777 Third Avenue, 18th Floor


New York, New York, 10017


The Vanguard Group (4)

   28,730,206     5.6  

100 Vanguard Blvd.


Malvern, Pennsylvania 19355


Directors and Named Executive Officers:


Richard S. Hill

   2,000     *  

Mathew J. Murphy

   —       *  

Weili Dai (5)

   71,225,977     13.9  

Peter A. Feld (3)

   33,720,786     6.6  

Dr. Juergen Gromer (6)

   200,964     *  

Dr. John G. Kassakian (7)

   191,262     *  

Oleg Khaykin

   10,000     *  

Arturo Krueger (8)

   163,262     *  

Michael Strachan

   —       *  

Dr. Sehat Sutardja (5)

   71,225,977     13.9  

Robert Switz

   —       *  

Dr. Randhir Thakur (9)

   90,078     *  

David P. Eichler

   —       *  

Mike Rashkin (11)

   43,317     *  

Sukhi Nagesh (11)

   7,354     *  

Dr. Zining Wu (10)

   264,898     *  

Directors and current executive officers as a group (19 persons) (12)

   106,120,862     20.7  

*Less than one percent.
**The percentage of beneficial ownership for the following table is based on 511,246,011 shares outstanding on July 11, 2016.
(1)Unless otherwise indicated, to our knowledge, all persons listed have sole voting and investment power with respect to their shares, except to the extent authority is shared by spouses under applicable law. The number of shares beneficially owned by each shareholder is determined in accordance with the rules of the SEC and is not necessarily indicative of beneficial ownership for any other purpose. Under these rules, beneficial ownership includes those shares with respect to which the shareholder has sole or shared voting or investment power and any shares that the shareholder has a right to acquire within 60 days after July 11, 2016 through the exercise of any option, warrant or other right. The percentage ownership of the outstanding shares, however, is based on the assumption, expressly required by the rules of the SEC, that only the person or entity whose ownership is being reported has converted options or warrants into shares. Unless otherwise noted, the amounts shown are based on information furnished by the people named.
(2)Based solely on information on Schedule 13G/A filed with the SEC on June 10, 2016.
(3)

Based solely on information on Schedule 13D/A filed with the SEC on April 25, 2016. Represents 33,720,786 shares held in an account managed by Starboard Value LP, which includes 13,323,422 shares underlying call options exercisable within 60 days of April 25, 2016. Includes (i) 1,772,606 shares held in the Starboard Value LP Account, (ii) 13,495,491 shares beneficially owned by Starboard Value and Opportunity Master Fund Ltd (“Starboard V&O Fund”), including 11,287,308 Shares underlying certain call

options, (iii) 1,588,369 shares beneficially owned by Starboard Value and Opportunity S LLC (“Starboard S LLC”), including 1,308,889 Shares underlying certain call options. (iv) 877,932 shares beneficially owned by Starboard Value and Opportunity C LP (“Starboard C LP”), including 727,225 Shares underlying certain call options; (v) 9,310,245 shares beneficially owned by Starboard Leaders Juliet LLC (“Starboard Juliet LLC”), (vi) 3,792,301 shares beneficially owned by Starboard Leaders Select II LP (“Starboard Select II LP”) and (vii) 2,883,842 shares beneficially owned by Starboard T Fund LP (“Starboard T LP”). Starboard Value R LP (“Starboard R LP”), as the general partner of Starboard C LP, may be deemed the beneficial owner of the shares owned by Starboard C LP. Starboard Value R GP LLC (“Starboard R GP”), as the general partner of Starboard R LP, may be deemed the beneficial owner of the shares owned by Starboard C LP. Starboard Leaders Fund LP (“Starboard Leaders Fund”), as a member of Starboard Juliet LLC, may be deemed the beneficial owner of the shares owned by Starboard Juliet LLC. Starboard Leaders Select II GP LLC (“Starboard Select II GP”), as the general partner of Starboard Select II LP, may be deemed the beneficial owner of the shares owned by Starboard Select II LP. Starboard Leaders Select Fund LP (“Starboard Select Fund”), as the sole member of Starboard Select II GP, may be deemed the beneficial owner of the shares owned by Starboard Select II LP. Starboard Value A LP (“Starboard A LP”), as the general partner of Starboard Leaders Fund, Starboard Select Fund and Starboard T LP and the managing member of Starboard Juliet LLC, may be deemed the beneficial owner of the shares owned by Starboard Juliet LLC, Starboard Select II LP and Starboard T LP. Starboard Value A GP LLC (“Starboard A GP”), as the general partner of Starboard A LP, may be deemed the beneficial owner of the shares owned by Starboard Juliet LLC, Starboard Select II LP and Starboard T LP. Starboard Value LP, as the investment manager of Starboard V&O Fund, Starboard C LP, Starboard Juliet LLC, Starboard Select II LP, Starboard T LP, and the Starboard Value LP Account and the manager of Starboard S LLC, may be deemed the beneficial owner of the shares owned by Starboard V&O Fund, Starboard S LLC, Starboard C LP, Starboard Juliet LLC, Starboard Select II LP, Starboard T LP, and the shares held in the Starboard Value LP Account. Starboard Value GP LLC (“Starboard Value GP”), as the general partner of Starboard Value LP, may be deemed the beneficial owner of the shares owned by Starboard V&O Fund, Starboard S LLC, Starboard C LP, Starboard Juliet LLC, Starboard Select II LP, Starboard T LP, and the shares held in the Starboard Value LP Account. Starboard Principal Co LP (“Principal Co”), as a member of Starboard Value GP, may be deemed the beneficial owner of the shares owned by Starboard V&O Fund, Starboard S LLC, Starboard C LP, Starboard Juliet LLC, Starboard Select II LP, Starboard T LP, and the shares held in the Starboard Value LP Account. Starboard Principal Co GP LLC (“Principal GP”), as the general partner of Principal Co, may be deemed the beneficial owner of the shares owned by Starboard V&O Fund, Starboard S LLC, Starboard C LP, Starboard Juliet LLC, Starboard Select II LP, Starboard T LP, and the shares held in the Starboard Value LP Account. Each of Jeffrey C. Smith, Mark R. Mitchell and Peter A. Feld, as a member of Principal GP and as a member of each of the Management Committee of Starboard Value GP and the Management Committee of Principal GP, may be deemed the beneficial owner of the shares owned by Starboard V&O Fund, Starboard S LLC, Starboard C LP, Starboard Juliet LLC, Starboard Select II LP, Starboard T LP, and the shares held in the Starboard Value LP Account. Mr. Feld expressly disclaims beneficial ownership of all such shares, except to the extent of his pecuniary interest therein.
(4)Based solely on information on Schedule 13G/A filed with the SEC on February 10, 2016.
(5)Consists of 4,309,300 shares subject to stock options held by Dr. Sutardja of which Ms. Dai may be deemed to have beneficial ownership and 1,680,000 shares subject to stock options held by Ms. Dai of which Dr. Sutardja may be deemed to have beneficial ownership and that are currently exercisable or will become exercisable within 60 days after July 11, 2016; 46,983,343 shares held jointly by Dr. Sutardja and Ms. Dai, of which Dr. Sutardja and Ms. Dai share voting and dispositive power; and 18,253,334 shares held by The Sutardja Family Partners, a California family limited partnership, of which Dr. Sutardja and Ms. Dai are the general partners and share voting and dispositive power. Dr. Sutardja and Ms. Dai are husband and wife.
(6)Includes 145,000 shares subject to stock options that are currently exercisable or will become exercisable within 60 days after July 11, 2016.
(7)Includes 133,000 shares subject to stock options that are currently exercisable or will become exercisable within 60 days after July 11, 2016.

(8)Includes 107,000 shares subject to stock options that are currently exercisable or will become exercisable within 60 days after July 11, 2016.
(9)Includes 48,078 shares held by the Thakur Family Trust DTD 6/7/1999 and 50,000 shares subject to stock options that are currently exercisable or will become exercisable within 60 days after July 11, 2016.
(10)Includes 145,000 shares subject to stock options that are currently exercisable or will become exercisable within 60 days after July 11, 2016.
(11)Based on the most current Form 4 filed by the reporting person.
(12)Includes 6,569,300 shares subject to stock options that are currently exercisable or will become exercisable within 60 days after July 11, 2016.

Securities Authorized for Issuance under Equity Compensation Plans

Equity Compensation Plan Information

The following table provides certain information with respect to all of our equity compensation plans in effect as of January 30, 2016:

Plan Category

  (a)
Number  of
Securities
to Be Issued
Upon Exercise
of Outstanding
Options, Warrants
and Rights (1)
   (b)
Weighted
Average
Exercise  Price
of Outstanding
Options,
Warrants, and
Rights (2)
   (c)
Number of
Securities Remaining
Available for Future
Issuance under Equity
Compensation Plans
(Excluding Securities
Reflected in Column (a))
 

Equity compensation plans approved by security holders (3)(4)

   52,703,661    $13.91     108,030,974  


28, 2017:

98


Plan Category 
(a)
Number of
Securities to Be Issued
Upon Exercise of Outstanding
Options, Warrants
and Rights (1)
 
(b)
Weighted
Average Exercise Price
of Outstanding Options,
Warrants, and
Rights (2)
 
(c)
Number of
Securities Remaining
Available for Future
Issuance under Equity
Compensation Plans
(Excluding Securities
Reflected in Column (a)
Equity compensation plans approved by security holders (3)(4) 35,662,014
 $12.97
 120,536,940
(1)Includes only options and restricted stock units (outstanding under our equity compensation plans, as no stock warrants or other rights were outstanding as of January 30, 2016)28, 2017).
(2)The weighted average exercise price calculation does not take into account any restricted stock units as those units vest, without any cash consideration or other payment required for such shares.
(3)Includes our Amended and Restated 1995 Stock Option Plan, our 1997 Directors’ Stock Option Plan, our Amended 2000 Employee Stock Purchase Plan (the “2000 ESPP”) and our 2007 Directors’ Stock Incentive Plan..
(4)The number of shares reserved for issuance under our 2000 ESPP includes an annual increase in shares reserved for issuance equal to the lesser of (i) 8,000,000 shares of Common Stock, or (ii) 1.5% of the outstanding shares of capital stock on such date, or (iii) an amount determined by the Board (provided that the amount approved by the Board shall not be greater than (i) or (ii)).

Item 13.Certain Relationships and Related Transactions, and Director Independence

The nominatinginformation required by Item 404 of Regulation S-K is incorporated by reference herein to the information set forth under the caption “Related Party Transactions” in our 2017 Proxy Statement.
The information required by Item 407(a) of Regulation S-K is incorporated by reference herein to the information set forth under the caption “Board of Directors and governance committee is responsible for review, approval or ratification of “related-person transactions” between us or our subsidiaries and related persons. Under SEC rules and our written policy, a “related person” is a director, officer, nominee for director, or 5% shareholder since the beginningCommittees of the last fiscal year and their immediate family members. We have adopted written policies and procedures that apply to any transaction or series of related transactionsBoard” in which Marvell or a subsidiary is a participant, the amount involved exceeds $120,000 in any calendar year and a related person has a direct or indirect material interest. Pursuant to our policy, the following transactions will not be deemed to be related person transactions requiring approval by the nominating and governance committee:

2017 Proxy Statement.

Employment of executive officers. Any employment by us of an executive officer if: (a) the related compensation is required to be reported in our proxy statement under SEC compensation disclosure rules; or (b) the executive officer is not an immediate family member of another executive officer or director of our company, and the related compensation would have been reported in our proxy

statement under SEC compensation disclosure rules if the executive officer was a “named executive officer,” and the ECC approved (or recommended that our board of directors approve) such compensation.

Director compensation. Any compensation paid to a director if the compensation is required to be reported in our proxy statement under SEC compensation disclosure rules.

Certain transactions with other companies. Any transaction with another company at which a related person’s only relationship is as an employee (other than an executive officer), director or beneficial owner of less than 10% of that company’s shares, if the aggregate amount involved does not exceed the greater of $1,000,000, or two percent of that company’s total annual revenues.

Transactions where all shareholders receive proportional benefits. Any transaction where the related person’s interest arises solely from the ownership of a class of our equity securities and all holders of that class of our equity securities received the same benefit on a pro rata basis (e.g., dividends).

Transactions involving competitive bids. Any transaction involving a related person where the rates or charges involved are determined by competitive bids.

Regulated transactions. Any transaction with a related person involving the rendering of services as a common or contract carrier, or public utility, at rates or charges fixed in conformity with law or governmental authority.

Certain banking-related services. Any transaction with a related person involving services as a bank depositary of funds, transfer agent, registrar, trustee under a trust indenture, or similar services.

Other Transactions. Any other transaction where disclosure of such transaction would not be required pursuant to Item 404 of Regulation S-K, as may be amended from time to time.

Marvell International Ltd., a direct subsidiary (“MIL”) is party to a technology license agreement with VeriSilicon Holdings Co., Ltd. (“VeriSilicon”), which has been amended various times since its assumption by MIL to include additional technology beyond the scope of the original agreement and is renewable annually. MIL assumed this technology license agreement between VeriSilicon and UTStarcom, Inc. after our acquisition of the semiconductor business of UTStarcom in December 2005. In connection with all of its transactions with VeriSilicon, MIL paid $1.8 million to VeriSilicon during fiscal 2016. As of May 1, 2016, MIL had approximately $0.3 million of accrued liability to VeriSilicon. Ms. Dai’s brother (and Dr. Sutardja’s brother-in-law), Wayne Dai, is the Chairman, President and Chief Executive Officer of VeriSilicon. Ms. Dai is also a shareholder of VeriSilicon. Dr. Sutardja and Ms. Dai are members of our board of directors and were our Chief Executive Officer and President during fiscal 2016. Dr. Sutardja and Ms. Dai are husband and wife.

In December 2009, MIL entered into a technology license agreement with Vivante Corporation (“Vivante”) that provides for the license of graphics technology and associated services. This agreement restates, expands and succeeds previous agreements between the parties for the same technology. In December 2012, the parties renewed this technology license agreement for another three years. The total amount of the license fee was approximately $13.0 million (to be paid over three years) and ten percent for support fees (to be paid over three years). In February 2012, the parties entered into a services agreement, pursuant to which Vivante agreed to provide support services to MIL. In connection with all of its transactions with Vivante, MIL paid $4.0 million to Vivante during fiscal 2016. As of May 1, 2016, MIL had approximately $1.4 million of accrued liability to Vivante. In January 2016, VeriSilicon completed the acquisition of Vivante. As a result of their ownership of and control of Estopia LLC and their existing shareholdings, Dr. Sutardja and Ms. Dai are now direct and indirect shareholders of VeriSilicon. In addition, as a result of the acquisition, Ms. Dai’s brother Weijin Dai, who was the Chief Executive Officer and member of the board of directors of Vivante is now an executive officer and board member of VeriSilicon. Dr. Sutardja who was Chairman of the board of directors of Vivante is not on the board of directors of VeriSilicon.

Indemnification Arrangements

We have agreed to indemnify certain current and former directors, officers and employees of us and our subsidiary Marvell Semiconductor, Inc. for reasonable costs and expenses incurred by such individuals in connection with certain civil actions and governmental investigations relating to our past stock option granting practices. Our agreement to pay reasonable fees and costs is subject to each individual’s agreement to reimburse us in the event that it is subsequently determined that the individual is not entitled to indemnification under the Bye-Laws or applicable law. In addition, we have agreed to indemnify Dr. Sutardja for reasonable fees and expenses that he may incur in a legal challenge of the determination that penalty taxes applied, based on the board’s finding that Dr. Sutardja was not involved in setting the terms of the relevant options and that we had in 2007 taken responsibility for and paid the penalty taxes under the Tax Codes that were incurred by other similarly situated Marvell employees who had exercised options in 2006. See “Executive Compensation — Key Fiscal 2016 Compensation Program Decisions — Other Compensation Arrangements” set forth in Part III, Item 11, in this Annual Report on Form 10-K.

We have also entered into a standard form of indemnification agreement with each of our named executive officers and directors.

Director Independence

Our board of directors has determined that, among our current directors, each of Mr. Feld, Mr. Khaykin, Mr. Switz, Dr. Gromer, Dr. Kassakian, Mr. Krueger, Mr. Strachan and Dr. Thakur are “independent” as such term is defined by the rules and regulations of the NASDAQ Stock Market (“Nasdaq”) and the rules and regulations of the SEC. Mr. Hill was determined not to be independent during the period in which he also serves as the Company’s Interim Principal Executive Officer. Once the Company’s Quarterly Report on Form 10-Q for the quarter ended July 30, 2016 is filed with the SEC, Mr. Murphy will assume the role of principal executive officer of the Company and Mr. Hill will resume his role as Chairman of the Board and be considered independent for purposes of Nasdaq and SEC rules and regulations.

To be considered independent, our board of directors must affirmatively determine that neither the director, nor any member of his or her immediate family, has had any direct or indirect material relationship with us within the previous three years. Our board of directors considered relationships, transactions and/or arrangements with each of the directors and concluded that none of the nine nonemployee directors, or any of his immediate family members, has or has had within the previous three years any relationship with us that would impair his independence.

Item 14.Principal Accounting Fees and Services

Deloitte & Touche LLP (“Deloitte”) has been our auditors and independent registered public accounting firm for the financial statements commencing with the fiscal year ended January 30, 2016.

Fees Paid to Deloitte & Touche LLP

In addition to retaining Deloitte to audit the consolidated financial statements for fiscal 2016, we have retained Deloitte to provide certain other professional services in fiscal 2016.

The aggregate fees billed for fiscal 2016 for eachinformation required by Item 9(e) of the following categories of services are as follows:

Fees Billed to the Company

  Fiscal 2016 

Audit fees (1)

  $13,598,256  

Tax fees (2)

   106,770  

All other fees (3)

   16,300  


Total Fees

  $13,721,326  

(1)Includes fees for audit services rendered for the audit of our annual financial statements, review of financial statements included in our quarterly reports on Form 10-Q and services that were provided in connection with statutory and regulatory filings or engagements.
(2)Includes fees for tax compliance and advice and foreign tax matters.
(3)Includes fees for all other non-audit services, including permissible business and advisory consulting services and a subscription to an accounting regulatory database.

Fees Paid to PricewaterhouseCoopers LLP

PricewaterhouseCoopers were our auditors and independent registered public accounting firm for the financial statements for each year from the year ended January 31, 1998 through the fiscal year ended January 31, 2015. In addition to retaining PricewaterhouseCoopers to audit the consolidated financial statements for fiscal 2015, we retained PricewaterhouseCoopers to provide certain other professional services in fiscal 2015 and for a portion of fiscal 2016 during which they provided certain services in connection with our transition from PricewaterhouseCoopers to Deloitte and Touche.

The aggregate fees billed for all servicesSchedule 14A is incorporated by PricewaterhouseCoopers in fiscal 2015 and fiscal 2016 were as follows:

Fees Billed to the Company

  Fiscal 2016   Fiscal 2015 

Audit fees (1)

  $1,649,846    $2,679,640  

Audit related fees (2)

   10,278     29,171  

Tax fees (3)

   111,581     80,173  

All other fees (4)

   —       16,800  


Total Fees

  $1,771,705    $2,805,784  

(1)Includes fees for audit services rendered for the audit of our annual financial statements, review of financial statement included in our quarterly reports on Form 10-Q and services that were provided in connection with statutory and regulatory filings or engagements.
(2)Includes fees which are for assurance and related services other those included in audit fees above. These services included procedures to support local statutory requirements and certain due diligence related to acquisitions.
(3)Includes fees for tax compliance and advice and foreign tax matters.
(4)Includes fees for all other non-audit services, including permissible business and advisory consulting services and a subscription to an accounting regulatory database.

Policy on Pre-Approval and Procedures

The engagement of Deloitte for non-audit accounting and tax services performed for us is limited to those circumstances where these services are considered integralreference to the audit services that Deloitte provides orinformation set forth under the caption “Information Concerning Independent Registered Public Accounting Firm” in which there is another compelling rationale for using its services. Pursuant to the Sarbanes-Oxley Act of 2002, all audit and permitted non-audit services for which the company engages Deloitte require pre-approval by the audit committee. All audit and permitted non-audit service fees were approved by the audit committee.

Section 10A(i)(3) of the Securities Exchange Act of 1934 permits an audit committee to delegate to one or more designated members of the audit committee who are independent directors of the board of directors the authority to grant preapprovals required by such Section 10A(i). In February 2016, the audit committee approved a policy that allows the chairman of the audit committee to pre-approve audit and non-audit services to be provided by Deloitte without further approval of the full committee, on a case-by-case basis, provided the fees and expenses for such services do not exceed $250,000 per engagement and that all such pre-approvals are communicated to the full committee, for informational purposes only, at its next scheduled meeting.

our 2017 Proxy Statement.


99


PART IV


Item 15.Exhibits, Financial Statement Schedules

(a)The following documents are filed as part of this Annual Report on Form 10-K:

1.Financial Statements:

See the “Index to Consolidated Financial Statements” on page 5744 of this Annual Report on Form 10-K.

2.Financial Statement Schedule:

See “Schedule II — Valuation and Qualifying Accounts” on page 164103 of this Annual Report on Form 10-K:

All other schedules not listed above have been omitted because they are not applicable or required, or the information required to be set forth therein is included in the Consolidated Financial Statements or Notes thereto.

3.Exhibits.

See the “Index to Exhibits” immediately following the signature page of this Annual Report on Form 10-K.


100


SIGNATURES

Pursuant to the requirements of section 13 or 15(d) of the Securities Exchange Act of 1934, the registrant has duly caused this report to be signed on its behalf by the undersigned, thereunto duly authorized.

  MARVELL TECHNOLOGY GROUP LTD.
MARVELL TECHNOLOGY GROUP LTD.
Dated: July 21, 2016March 27, 2017 By: 
/S/    DAVID P. EICHLER        Jean Hu
  

David P. Eichler

Interim

Jean Hu
Chief Financial Officer

(Principal Financial Officer)

POWER OF ATTORNEY

KNOW ALL PERSONS BY THESE PRESENTS, that each person whose signature appears below constitutes and appoints Richard S. HillMitchell Gaynor and David P. Eichler,Jean Hu, and each of them individually, as his or her attorney-in-fact, each with full power of substitution, for him or her in any and all capacities, to sign any and all amendments to this Annual Report on Form 10-K, and to file the same, with exhibits thereto and all other documents in connection therewith, with the Securities and Exchange Commission, hereby ratifying and confirming all that said attorney-in-fact, or his substitute or substitutes, may do or cause to be done by virtue hereof.

Pursuant to the requirements of the Securities Exchange Act of 1934, this report has been signed by the following persons on behalf of the registrant in the capacities and on the dates indicated.

Name and Signature


Title


Date

/S/    RICHARD S. HILL

Richard S. Hill


Chairman of the Board

(Interim Principal Executive Officer)

 July 21, 2016

/S/    DAVID P. EICHLERM

David P. EichlerATT

MURPHY
 Interim
President and Chief Executive Officer (Principal Executive Officer)

March 27, 2017
Matt Murphy
/S/    JEAN HU
Chief Financial Officer (Principal Financial Officer)March 27, 2017
Jean Hu
/S/    DAVE CARON
Controller and Chief Accounting Officer (Principal Accounting Officer) July 21, 2016March 27, 2017
Dave Caron

Weili Dai/S/    T

UDOR BROWN
 Director March 27, 2017
Tudor Brown

/S/S/    PETERFELD

Peter Feld

 Director July 21, 2016March 27, 2017
Peter Feld

/S/    JUERGEN GROMERR

Dr. Juergen GromerICHARD

 S. HILL
Chairman of the BoardMarch 27, 2017
Richard S. Hill
/S/    OLEG KHAYKIN
 Director July 21, 2016March 27, 2017

/S/    JOHN G. KASSAKIAN

Dr. John G. Kassakian

Oleg Khaykin
 Director
 July 21, 2016

/S/    OLEG KHAYKIN

Oleg Khaykin

 DirectorJuly 21, 2016

101


/S/    ARTURO KRUEGER

Arturo Krueger

DirectorJuly 21, 2016

Name and Signature


Title


Date

/S/    MICHAEL STRACHAN

Michael Strachan

 Director July 21, 2016March 27, 2017
Michael Strachan

Dr. Sehat Sutardja/

S/    ROBERT E. SWITZ
 Director March 27, 2017

/S/    ROBERT E. SWITZ

Robert E. Switz

/

S/    RANDHIR THAKUR
 Director July 21, 2016March 27, 2017
Dr. Randhir Thakur


102


SCHEDULE II
VALUATION AND QUALIFYING ACCOUNTS
(in thousands)
 
Balance at
Beginning
of Year
 Additions Deductions 
Balance at
End of
Year
Fiscal year ended January 28, 2017       
Allowance for doubtful accounts and sales return reserve$2,762
 $4,456
 $(5,834) $1,384
Deferred tax valuation allowance$424,914
 $31,627
 $
 $456,541
Fiscal year ended January 30, 2016       
Allowance for doubtful accounts and sales return reserve$2,112
 $2,614
 $(1,964) $2,762
Deferred tax valuation allowance$382,796
 $42,118
 $
 $424,914
Fiscal year ended January 31, 2015       
Allowance for doubtful accounts and sales return reserve$2,294
 $3,041
 $(3,223) $2,112
Deferred tax valuation allowance$335,890
 $46,906
 $
 $382,796

103


INDEX TO EXHIBITS
Exhibit
No.
 Description Form File Number Incorporated by Reference from Exhibit Number Filed with SEC
          
3.1 Memorandum of Association of Marvell Technology Group Ltd. S-1 333-33086 3.1 3/23/2000
           
3.2 Fourth Amended and Restated Bye-Laws of Marvell Technology Group Ltd. 8-K 000-30877 3.1 11/10/2016
           
3.3 Memorandum of Increase of Share Capital of Marvell Technology Group Ltd. 8-K 000-30877 3.1 7/6/2006
           
10.1# 1997 Directors’ Stock Option Plan S-1 333-33086 10.2 3/23/2000
           
10.1.1# Form of Notice of Stock Option Grants, Nonstatutory Stock Option Agreement, Exercise Notice and Restricted Stock Purchase Agreement for use under the 1997 Directors’ Stock Option Plan S-8 333-148621 10.7 1/11/2008
           
10.2# 2000 Employee Stock Purchase Plan (as amended and restated as of October 31, 2011) 10-Q 000-30877 10.1 12/2/2011
           
10.2.1# 2000 Employee Stock Purchase Plan Form of Subscription Agreement 10-K 000-30877 10.4 3/29/2013
          
10.3# Amended and Restated 1995 Stock Option Plan, amended through April 16, 2015 8-K 000-30877 10.2 7/2/2015
          
10.3.1# Amended and Restated 1995 Stock Option Plan Restricted Stock Agreement 10-K 000-30877 10.2 4/13/2006
          
10.3.2# Form of Option Agreement for use with the Amended and Restated 1995 Stock Option Plan (for options granted prior to December 4, 2008) 10-K 000-30877 10.21 4/13/2006
          
10.3.3# Form of Stock Option Agreement and Notice of Grant of Stock Options and Option Agreement for use with the Amended and Restated 1995 Stock Option Plan (for options granted on or after December 4, 2008) 8-K 000-30877 10.1 12/17/2008
          
10.3.4# Form of Stock Option Agreement and Notice of Grant of Stock Options and Option Agreement for use with the Amended and Restated 1995 Stock Option Plan (for options granted on or after August 2, 2010) 10-Q 000-30877 10.3 9/3/2010
          
10.3.5# Form of Stock Option Agreement and Notice of Grant of Stock Options and Option Agreement for use with the Amended and Restated 1995 Stock Option Plan (for options granted on or after September 20, 2013) 8-K 000-30877 10.1 9/26/2013
          
10.3.6# Form of Restricted Stock Unit Agreement for use with the Amended and Restated 1995 Stock Option Plan (for RSUs granted prior to December 4, 2008) 10-K 000-30877 10.34 7/2/2007
           

104


/S/    RANDHIR THAKUR

Dr. Randhir Thakur

DirectorJuly 21, 2016

SCHEDULE II

VALUATION AND QUALIFYING ACCOUNTS

(in thousands)

   Balance at
Beginning
of Year
   Additions   Deductions  Balance at
End of
Year
 

Fiscal year ended January 30, 2016


Allowance for doubtful accounts and sales return reserve

  $2,112    $2,614    $(1,964 $2,762  


Deferred tax valuation allowance

  $382,796    $42,118    $—     $424,914  


Fiscal year ended January 31, 2015


Allowance for doubtful accounts and sales return reserve

  $2,294    $3,041    $(3,223 $2,112  


Deferred tax valuation allowance

  $335,890    $46,906    $—     $382,796  


Fiscal year ended February 1, 2014


Allowance for doubtful accounts and sales return reserve

  $7,921    $3,808    $(9,435 $2,294  


Deferred tax valuation allowance

  $299,449    $36,441    $—     $335,890  


INDEX TO EXHIBITS

Exhibit
No.

Description

  3.1Memorandum of Association of Marvell Technology Group Ltd., incorporated by reference to Exhibit 3.1 of the registrant’s Registration Statement on Form S-1 (file no. 333-33086) as filed on March 23, 2000
  3.2Third Amended and Restated Bye-Laws of Marvell Technology Group Ltd., incorporated by reference to Exhibit 3.1 of the registrant’s Current Report on Form 8-K (file no. 000-30877) as filed on July 13, 2010
  3.3Memorandum of Increase of Share Capital of Marvell Technology Group Ltd., incorporated by reference to Exhibit 3.1 of the registrant’s Current Report on Form 8-K (file no. 000-30877) as filed on July 6, 2006
10.1#1997 Directors’ Stock Option Plan, incorporated by reference to Exhibit 10.2 of the registrant’s Registration Statement on Form S-1 (file no. 333-33086) as filed on March 23, 2000
10.2#Form of Notice of Stock Option Grants, Nonstatutory Stock Option Agreement, Exercise Notice and Restricted Stock Purchase Agreement for use under the 1997 Directors’ Stock Option Plan, incorporated by reference to Exhibit 10.7 of the registrant’s Registration Statement on Form S-8 (file no. 333-148621) as filed on January 11, 2008
10.3#2000 Employee Stock Purchase Plan (as amended and restated as of October 31, 2011), incorporated by reference to Exhibit 10.1 of the registrant’s Quarterly Report on Form 10-Q (file no. 000-30877) for the period ended October 29, 2011 as filed on December 2, 2011
10.4#2000 Employee Stock Purchase Plan Form of Subscription Agreement, incorporated by reference to Exhibit 10.4 of the registrant’s Annual Report on Form 10-K (file no. 000-30877) for the year ended February 2, 2013 as filed on March 29, 2013
10.5#Amended and Restated 1995 Stock Option Plan, amended through April 16, 2015, incorporated by reference to Exhibit 10.2 of the registrant’s Current Report on Form 8-K (file no. 000-30877) as filed on July 2, 2015
10.6#Amended and Restated 1995 Stock Option Plan Restricted Stock Agreement, incorporated by reference to Exhibit 10.20 of the registrant’s Annual Report on Form 10-K (file no. 000-30877) for the year ended January 28, 2006 as filed on April 13, 2006
10.7#Form of Option Agreement for use with the Amended and Restated 1995 Stock Option Plan, incorporated by reference to Exhibit 10.21 of the registrant’s Annual Report on Form 10-K (file no. 000-30877) for the year ended January 28, 2006 as filed on April 13, 2006 (for options granted prior to December 4, 2008)
10.7.1#Form of Stock Option Agreement and Notice of Grant of Stock Options and Option Agreement for use with the Amended and Restated 1995 Stock Option Plan, incorporated by reference to Exhibit 10.1 of the registrant’s Current Report on Form 8-K (file no. 000-30877) as filed on December 17, 2008 (for options granted on or after December 4, 2008)
10.7.2#Form of Stock Option Agreement and Notice of Grant of Stock Options and Option Agreement for use with the Amended and Restated 1995 Stock Option Plan, incorporated by reference to Exhibit 10.3 of the registrant’s Quarterly Report on Form 10-Q (file no. 000-30877) for the period ended July 31, 2010 as filed on September 3, 2010 (for options granted on or after August 2, 2010)
10.7.3#Form of Stock Option Agreement and Notice of Grant of Stock Options and Option Agreement for use with the Amended and Restated 1995 Stock Option Plan (for options granted on or after September 20, 2013), incorporated by reference to Exhibit 10.1 of the registrant’s Current Report on Form 8-K (file no. 000-30877) as filed on September 26, 2013

Exhibit
No.

Description

10.8#Form of Restricted Stock Unit Agreement for use with the Amended and Restated 1995 Stock Option Plan, incorporated by reference to Exhibit 10.34 of the registrant’s Annual Report on Form 10-K (file no. 000-30877) for the year ended January 27, 2007 as filed on July 2, 2007 (for RSUs granted prior to December 4, 2008)
10.8.1#10.3.7# Form of Stock Unit Agreement and Notice of Grant of Award and Award Agreement for use with the Amended and Restated 1995 Stock Option Plan incorporated by reference to Exhibit 10.2 of the registrant’s Current Report on Form 8-K (file no. 000-30877) as filed on December 17, 2008 (for RSUs granted on or after December 4, 2008)
8-K000-3087710.212/17/2008
10.8.2#
10.3.8# Form of Stock Unit Agreement and Notice of Grant of Award and Award Agreement for use with the Amended and Restated 1995 Stock Option Plan incorporated by reference to Exhibit 10.4 of the registrant’s Quarterly Report on Form 10-Q (file no. 000-30877) for the period ended July 31, 2010 as filed on September 3, 2010 (for RSUs granted on or after August 2, 2010)
10-Q000-3087710.49/3/2010
10.9#
10.3.9# Form of Notice of Grant of Stock Options — Performance-Based, for use with the Amended and Restated 1995 Stock Option Plan incorporated by reference to Exhibit 8-K000-3087710.1 of the registrant’s Current Report on Form 8-K as filed on December 19, 12/19/2008
10.10# Reformation of Stock Option Agreement dated December 27, 2006 by and between Sehat Sutardja and Marvell Technology Group Ltd., incorporated by reference to Exhibit 10.1 of the registrant’s Current Report on Form 8-K (file no. 000-30877) as filed on January 4, 2007
10.11# Reformation of Stock Option Agreement dated December 27, 2006 by and between Weili Dai and Marvell Technology Group Ltd., incorporated by reference to Exhibit 10.2 of the registrant’s Current Report on Form 8-K (file no. 000-30877) as filed on January 4, 2007
10.12# Reformation of Stock Option Agreement dated May 6, 2007 between Marvell Technology Group Ltd. and Dr. Sehat Sutardja, incorporated by reference to Exhibit 10.1 of the registrant’s Current Report on Form 8-K (file no. 000-30877) as filed on May 8, 2007
10.13# Amendment of Stock Option Agreement dated May 6, 2007 between Marvell Technology Group Ltd. and Weili Dai, incorporated by reference to Exhibit 10.2 of the registrant’s Current Report on Form 8-K (file no. 000-30877) as filed on May 8, 2007
10.14#10.3.10# Form of Performance Award Agreement and Notice of Grant of Performance Award and Award Agreement for use with the Amended and Restated 1995 Stock Option Plan incorporated by reference to Exhibit 10-Q000-3087710.2 of the registrant’s Quarterly Report on Form 10-Q (file no. 000-30877) for the period ended May 3, 2014 as filed on June 5, 6/5/2014
10.15#10.4#Reformation of Stock Option Agreement dated December 27, 2006 by and between Sehat Sutardja and Marvell Technology Group Ltd.8-K000-3087710.11/4/2007
10.5#Reformation of Stock Option Agreement dated December 27, 2006 by and between Weili Dai and Marvell Technology Group Ltd.8-K000-3087710.21/4/2007
10.6#Reformation of Stock Option Agreement dated May 6, 2007 between Marvell Technology Group Ltd. and Dr. Sehat Sutardja8-K000-3087710.15/8/2007
10.7#Amendment of Stock Option Agreement dated May 6, 2007 between Marvell Technology Group Ltd. and Weili Dai8-K000-3087710.25/9/2007
10.8# Marvell Technology Group Ltd. Executive Performance Incentive Plan incorporated by reference to Exhibit 8-K000-3087710.1 of the registrant’s Current Report on Form 8-K (file no. 000-30877) as filed on July 2, 7/2/2015
10.16#10.9# 2007 Director Stock Incentive Plan, as amended and restated effective March 11, 2014 incorporated by reference to Exhibit 10-K000-3087710.15 of the registrant’s Annual Report on Form 10-K (file no. 000-30877) for the year ended February 1, 2014 as filed on March 27, 3/27/2014
10.17.1#10.9.1# Form of Stock Option Agreement for use with the 2007 Director Stock Incentive Plan — Initial Award incorporated by reference to Exhibit 8-K000-3087710.2 of the registrant’s Current Report on Form 8-K (file no. 000-30877) as filed on October 25, 10/25/2007
10.17.2#10.9.2# Form of Stock Option Agreement for use with the 2007 Director Stock Incentive Plan — AnnualInitial Award incorporated by reference to Exhibit 10.3 of the registrant’s Current Report on Form 8-K (file no. 000-30877) as filed on October 25, 2007

Exhibit
No.


Description

8-K
000-3087710.210/25/2007
10.17.3#10.9.3# Form of Stock Unit Agreement and Notice of Grant of Award and Award Agreement for use with the 2007 Director Stock Incentive Plan incorporated by reference to Exhibit 8-K000-3087710.2 of the registrant’s Current Report on Form 8-K (file no. 000-30877) as filed on July 1, 7/1/2011
10.18#10.10# Description of Indemnification Rights for certain current and former directors, officers and employees incorporated by reference to Exhibit 10-Q000-3087710.37 of the registrant’s Quarterly Report on Form 10-Q (file no. 000-30877) for the period ended July 28, 9/6/2007 as filed on September 6, 2007


105


10.11# Form of Indemnification Agreement with Directors and Executive Officers 8-K 000-30877 10.1 10/10/2008
           
10.12# Indemnification Arrangement with Dr. Sehat Sutardja 8-K 000-30877 10.1 3/7/2011
           
10.13# Interim Services Agreement between the registrant and Randstad Professionals U.S., LP d/b/a “Tatum” dated October 15, 2015 in connection with the retention of David P. Eichler as Interim Chief Financial Officer 10-Q 000-30877 10.1 7/21/2016
           
10.14# Offer Letter between the Marvell and Matthew J. Murphy and form of Severance Agreement attached thereto as Appendix B 8-K 000-30877 10.1 6/20/2016
           
10.15# Marvell Technology Group Ltd. Change in Control Severance Plan and Summary Plan Description, effective June 15, 2016 8-K 000-30877 10.2 6/20/2016
           
10.16# Offer Letter between Marvell and Mitchell Gaynor 10-Q 000-30877 10.3 9/8/2016
           
10.17# Offer Letter between Marvell and Christopher Koopmans 10-Q 000-30877 10.4 9/8/2016
           
10.18# Offer Letter between Marvell and Andrew Micallef 10-Q 000-30877 10.5 9/8/2016
           
10.19 Starboard Agreement 8-K 000-30877 10.1 4/27/2016
           
10.20# Offer Letter between the Company and Jean Hu 8-K 000-30877 10.1 8/23/2016
           
10.21# Offer Letter between the Company and David Caron 8-K 000-30877 10.1 10/3/2016
           
10.22# Offer Letter between the Company and Thomas Lagatta       Filed herewith
           
10.23# Severance Agreement between the Company and Mitchell Gaynor       Filed herewith
           
21.1 Subsidiaries of Registrant       Filed herewith
           
23.1 Consent of Independent Registered Public Accounting Firm - Deloitte & Touche LLP       Filed herewith
           
23.2 Consent of Independent Registered Public Accounting Firm - PricewaterhouseCoopers LLP       Filed herewith
           
24.1 Power of Attorney (contained in the signature page to this Annual Report)       Filed herewith
           
31.1 Rule 13a-14(a)/15d-14(a) Certification of the Principal Executive Officer       Filed herewith
           

106


10.19#Form of Indemnification Agreement with Directors and Executive Officers, incorporated by reference to Exhibit 10.1 of the registrant’s Current Report on Form 8-K (file no. 000-30877) as filed on October 10, 2008
10.20#31.2 Indemnification Arrangement with Dr. Sehat Sutardja, incorporated by reference to Exhibit 10.1Rule 13a-14(a)/15d-14(a) Certification of the registrant’s Current Report on Form 8-K (file no. 000-30877) as filed on March 7, 2011
10.21#Principal Financial Officer Interim Services Agreement between the registrant and Randstad Professionals U.S., LP d/b/a “Tatum” dated October 15, 2015 in connection with the retention of David P. Eichler as Interim Chief Financial Officer, incorporated by reference to Exhibit 10.1 of the registrant’s Quarterly Report on Form 10-Q (file no. 000-30877) for the period ended October 31, 2015 as filed on the date hereof.
Filed herewith
 21.1 Subsidiaries of the registrant
  24.1 Power of Attorney (contained in the signature page to this Annual Report)
  31.132.1* Certification of Interim Principal Executive OfficerPursuant to 18 U.S.C. Section 1350, as required pursuant to Section 302 of the Sarbanes-Oxley Act
  31.2Certification of Interim Chief Financial Officer as required pursuant to Section 302 of the Sarbanes-Oxley Act
  32.1~Certification of Interim Principal Executive Officer as required pursuantAdopted Pursuant to Section 906 of the Sarbanes-Oxley Act
of 2002 for Principal Executive OfficerFiled herewith
 32.2~
32.2* Certification of Interim Chief Financial OfficerPursuant to 18 U.S.C. Section 1350, as required pursuantAdopted Pursuant to Section 906 of the Sarbanes-Oxley Act of 2002 for Principal Financial OfficerFiled herewith
101.INS XBRL Instance Document
101.SCH XBRL Taxonomy Extension Schema Document
101.CAL XBRL Taxonomy Extension Calculation Linkbase Document
101.DEF XBRL Taxonomy Extension Definition
101.LAB XBRL Taxonomy Extension Label Linkbase Document
101.PRE XBRL Taxonomy Presentation Linkbase Document

#Management contracts or compensation plans or arrangements in which directors or executive officers are eligible to participate.
~
*In accordance with Item 601(b)(32)(ii) of Regulation S-K and SEC Release No. 33-8238 and 34-47986, Final Rule: Management’s Reports on Internal Control Over Financial Reporting and Certification of Disclosure in Exchange Act Periodic Reports, the certifications furnished in Exhibits 32.1 and 32.2 hereto are deemed to accompany this Annual Report Form 10-K and will not be deemed “filed” for purposes of Section 18 of the Exchange Act. Such certifications will not be deemed to be incorporated by reference into any filings under the Securities Act or the Exchange Act, except to the extent that the registrant specifically incorporates it by reference.

167


107