SECURITIES AND EXCHANGE COMMISSION
|
| |
| ☒ | ANNUAL REPORT PURSUANT TO SECTION 13 OR 15(d) OF THE SECURITIES EXCHANGE ACT OF 1934 |
For the fiscal year ended December 31, 20162019
|
| |
| ☐ | TRANSITION REPORT PURSUANT TO SECTION 13 OR 15(d) OF THE SECURITIES EXCHANGE ACT OF 1934 |
Commission File Number 001-35872 (Exact name of registrant as specified in its charter) |
| | | |
| Puerto Rico | | 66-0783622 |
(State or other jurisdiction of incorporation or organization) | | identification number) |
| | |
Cupey Center Building, | Road 176, Kilometer 1.3, San Juan, Puerto Rico
| | |
| San Juan, | Puerto Rico | | 00926 (Zip Code)
|
| (Address of principal executive offices) | | (Zip Code) |
(787)
(Registrant’s telephone number, including area code)
Securities registered pursuant to Section 12(b) of the Act: |
| | |
Title of each class | Trading Symbol(s) | Name of each exchange on which registered |
| Common Stock, $0.01 par value per share | EVTC | New York Stock Exchange |
Securities registered pursuant to Section 12(g) of the Act: None
Indicate by check mark if the registrant is a well-known seasoned issuer, as defined in Rule 405 of the Securities Act. Yes ☐No☒ Indicate by check mark if the registrant is not required to file reports pursuant to Section 13 or Section 15(d) of the Act. Yes ☐No☒ Indicate by check mark whether the registrant (1) has filed all reports required to be filed by Section 13 or 15(d) of the Securities Exchange Act of 1934 during the preceding 12 months (or for such shorter period that the registrant was required to file such reports), and (2) has been subject to such filing requirements for the past 90 days. Yes☒ No ☐ Indicate by check mark whether the registrant has submitted electronically and posted on its corporate Web site, if any, every Interactive Data File required to be submitted and posted pursuant to Rule 405 of Regulation S-T (§232.405 of this chapter) during the preceding 12 months (or for such shorter period that the registrant was required to submit and post such files). Yes☒ No ☐ Indicate by check mark if disclosure of delinquent filers pursuant to Item 405 of Regulation S-K (§229.405 of this chapter) is not contained herein, and will not be contained, to the best of registrant’s knowledge, in definitive proxy or information statements incorporated by reference in Part III of this Form 10-K or any amendment to this Form 10-K. ☒ Indicate by check mark whether the registrant is a large accelerated filer, an accelerated filer, a non-accelerated filer, or a smaller reporting company. See the definitions of “large accelerated filer,” “accelerated filer” and “smaller reporting company” in Rule 12b-2 of the Exchange Act.:
|
| | | | | | |
| Large accelerated filer | | ☒ | | Accelerated filer | | ☐ |
| | | |
| Non-accelerated filer | | ☐ (Do not check if a smaller reporting company) | | Smaller reporting company | | ☐ |
If an emerging growth company, indicate by check mark if the registrant has elected not to use the extended transition period for complying with any new or revised financial accounting standards provided pursuant to Section 13(a) of the Exchange Act. ☐
Indicate by check mark whether the registrant is a shell company (as defined in Rule 12b-2 of the Exchange Act). Yes ☐ No ☒ The aggregate market value of the common stock held by non-affiliates of EVERTEC, Inc. was approximately
$959,986,017$1,451,933,072 based on the closing price of
$15.54$32.70 as of the close of business on June 30,
2016.2019.
As of February 17, 2017,19, 2020, there were 72,635,03272,000,261 outstanding shares of common stock of EVERTEC, Inc. Documents Incorporated by Reference:
Part III incorporates certain information by reference to
Specifically identified portions of the Proxy Statement for the
20172020 Annual Meeting of Shareholders
are incorporated by reference in Part III.
2019 Annual Report on Form 10-K
Forward-Looking Statements
This Annual Report on Form 10-K, or Report, contains “forward-looking statements” within the meaning of, and subject to the protection of, the Private Securities Litigation Reform Act of 1995. Such statements can be identified by the use of forward-looking terminology such as “believes,” “expects,” “may,” “estimates,” “will,” “should,” “plans” or “anticipates” or the negative thereof or other variations thereon or comparable terminology, or by discussions of strategy. Readers are cautioned that any such forward-looking statements are not guarantees of future performance and may involve significant risks and uncertainties, and that actual results may vary materially from those in the forward-looking statements as a result of various factors. Among the factors that significantly impact our business and could impact our business in the future are:
our reliance on our relationship with Popular, Inc. (“Popular”) for a significant portion of our revenues andpursuant to our master services agreement with Banco Popular de Puerto Rico (“Banco Popular”), Popular’s principal banking subsidiary,them and to grow our merchant acquiring business;
as a regulated institution, the likelihood we most likely will be required to obtain regulatory approval before engaging in certain new activities or businesses, whether organically or by acquisition, and may be unableour potential inability to obtain such approval on a timely basis or at all, which may make transactions more expensive or impossible to complete, or make us less attractive to potential sellers;
our ability to renew our client contracts on terms favorable to us, including our contract with Popular;Popular, and any significant concessions we may have to grant to Popular with respect to pricing, services or other key terms in anticipation of the negotiation of the terms of the MSA and the services we provide thereunder to Popular, both in respect of the current term and any extension of the MSA;
our dependence on our processing systems, technology infrastructure, security systems and fraudulent payment detection systems, as well as on our personnel and certain third parties with whom we do business, and the risks to our business if our systems are hacked or otherwise compromised;
our ability to develop, install and adopt new software, technology and computing systems;
a decreased client base due to consolidations and failures in the financial services industry;
the credit risk of our merchant clients, for which we may also be liable;
the continuing market position of the ATH network;
a reduction in consumer confidence, whether as a result of a global economic downturn or otherwise, which leads to a decrease in consumer spending;
our dependence on credit card associations, including any adverse changes in credit card association or network rules or fees;
changes in the regulatory environment and changes in international, legal, tax, political, administrative or economic conditions;
the effects of legislative initiatives or proposals, statutory changes, governmental or other applicable regulations or changes in industry requirements, including privacy and cybersecurity laws and regulations;
the geographical concentration of our business in Puerto Rico, including our business with the government of Puerto Rico and its instrumentalities, which are facing severe fiscal challenges;
additional adverse changes in the general economic conditions in Puerto Rico, whether as a result of the government’s debt crisis or otherwise, including the continued migration of Puerto Ricans to the U.S. mainland, which could negatively affect our customer base, general consumer spending, our cost of operations and our ability to hire and retain qualified employees;
a protracted federal government shutdown may affect our financial performance;
operating an international business in multiple regionsLatin America and the Caribbean, in jurisdictions with potential political and economic instability, including Latin America;political changes and civil unrest;
our ability to execute our geographic expansion and acquisition strategies;strategies, including challenges in successfully acquiring new businesses and integrating and growing acquired businesses;
our ability to protect our intellectual property rights against infringement and to defend ourselves against claims of infringement brought by third parties;
our ability to recruit and retain the qualified personnel necessary to operate our business;
our ability to comply with U.S. federal, state, local and foreign regulatory requirements;
evolving industry standards and adverse changes in global economic, political and other conditions;
adverse developments with respect to the payment card industry, including change in use of card as a payment mechanism;
our high level of indebtedness and restrictions contained in our debt agreements, including the senior secured credit facilities, as well as debt that could be incurred in the future;
our ability to prevent a cybersecurity attack or breach in our information security;
our ability to generate sufficient cash to service our indebtedness and to generate future profits;
our ability to refinance our debt;
the possibility that we could lose our preferential tax rate in Puerto Rico;
the risk that the counterparty to our interest rate swap agreementagreements fails to satisfy its obligations under the agreement;
uncertainty of the pending debt restructuring process under Title III of the Puerto Rico Oversight, Management and Economic Stability Act (“PROMESA”), as well as actions taken by the Puerto Rico government or by the PROMESA Board to address the Puerto Rico fiscal crisis;
uncertainty related to Hurricanes Irma and Maria as well as recent earthquakes and other natural disasters and their impact on the economies of Puerto Rico and the Caribbean;
the possibility of future catastrophic hurricanes and other potential natural disasters affecting Latin America and the Caribbean;
the nature, timing and amount of any restatement; and
other risks and uncertainties detailed in Part I, Item IA “Risk Factors” in this Report.
These forward-looking statements involve a number of risks and uncertainties that could cause actual results to differ materially from those suggested by the forward-looking statements. Forward-looking statements should, therefore, be considered in light of various factors, including those set forth under “Item 1A. Risk Factors,” in “Item 7. Management’s Discussion and Analysis of Financial Condition and Results of Operations” and elsewhere in this Report. These forward-looking statements speak only as of the date of this Report, and we do not undertake any obligation to publicly release any revisions to these forward-looking statements to reflect events or circumstances after the date of this Report or to reflect the occurrence of unanticipated events.
This Form 10-K includes industry data that we obtained from periodic industry publications, including the
July 2015 and the September
20162019 Nilson Report and the
2015 and 20162019 World Payments Report. Industry publications generally state that the information contained therein has been obtained from sources believed to be reliable. This Form 10-K also includes market share and industry data that were prepared primarily based on management’s knowledge of the industry and industry data. Unless otherwise noted, statements as to our market share and market position relative to our competitors are approximated and based on management estimates using the above-mentioned latest-available third-party data and our internal
analysesanalysis and estimates. While we are not aware of any misstatements regarding any industry data presented herein, our estimates, in particular as they relate to market share and our general expectations, involve risks and uncertainties and are subject to change based on various factors, including those discussed under “Risk Factors,” “Forward-Looking Statements” and “Management’s Discussion and Analysis of Financial Condition and Results of Operations” in this Form 10-K.
Part I
Except as otherwise indicated or unless the context otherwise requires, (a) the terms “EVERTEC,” “we,” “us,” “our,” “our Company” and “the Company” refer to EVERTEC, Inc. and its subsidiaries on a consolidated basis, (b) the term “Holdings” refers to EVERTEC Intermediate Holdings, LLC, but not any of its subsidiaries and (c) the term “EVERTEC Group” refers to EVERTEC Group, LLC and its predecessor entities and their subsidiaries on a consolidated basis, including the operations of its predecessor entities prior to the Merger (as defined below). EVERTEC Inc.’s subsidiaries include Holdings, EVERTEC Group, EVERTEC Dominicana, SAS,
Evertec Chile Holdings SpA (formerly known as Tecnopago SpA), Evertec Chile SpA (formerly known as EFT Group SpA), Evertec Chile Global SpA (formerly known as EFT Global Services SpA), Evertec Chile Servicios Profesionales SpA (formerly known as EFT Servicios Profesionales SpA), EFT Group S.A., Tecnopago España SL, Paytrue S.A., Caleidon, S.A., Evertec Brasil Solutions Informática Ltda. (formerly known as Paytrue Solutions Informática Ltda.), EVERTEC Panamá, S.A., EVERTEC Costa Rica, S.A. (“EVERTEC CR”), EVERTEC Guatemala, S.A.,
Evertec Colombia, SAS (formerly known as Processa,
SAS,SAS), EVERTEC USA, LLC,
EGM Ingeniería sin Fronteras, S.A.S. ("PlacetoPay") and EVERTEC México Servicios de Procesamiento, S.A. de C.V. Neither EVERTEC nor Holdings conducts any operations other than with respect to its indirect or direct ownership of EVERTEC Group.
EVERTEC is a leading full-service transaction processing business in Latin America
(which includes Central America and the Caribbean,
unless otherwise specified), providing a broad range of merchant acquiring, payment
processingservices and business process management services. According to the September
20162019 Nilson Report, we are one of the largest merchant acquirers in Latin America based on total number of transactions and we believe we are the largest merchant acquirer in the Caribbean and Central America. We serve
1826 countries in the region
fromout of 11 offices, including our
baseheadquarters in Puerto Rico. We manage a system of electronic payment networks that process more than two billion transactions annually, and offer a comprehensive suite of services for core bank processing, cash processing and technology outsourcing. In addition, we own and operate the ATH network, one of the leading personal identification number (“PIN”) debit networks in Latin America. We serve a diversified customer base of leading financial institutions, merchants, corporations and government agencies with “mission-critical” technology solutions that enable them to issue, process and accept transactions securely. We believe our business is well-positioned to continue to expand across the fast-growing Latin American region.
We are differentiated, in part, by our diversified business model, which enables us to provide our varied customer base with a broad range of transaction-processing services from a single source across numerous channels and geographic markets. We believe this
single-source capability provides several competitive advantages that will enable us to continue to penetrate our existing customer base with complementary new services, win new customers, develop new sales channels and enter new markets. We believe these competitive advantages include:
Our ability to provide best in classcompetitive products;
Our ability to provide in one package a range of services that traditionally had to be sourced from different vendors;
Our ability to serve customers with disparate operations in several geographies with a single integrated technology solutionsolutions that enablesenable them to manage their business as one enterprise; and
Our ability to capture and analyze data across the transaction processing value chain and use that data to provide value-added services that are differentiated from those offered by pure-play vendors that serve only one portion of the transaction processing value chain (such as only merchant acquiring or payment processing)services).
Our broad suite of services spans the entire transaction processing value chain and includes a range of front-end customer-facing solutions such as the electronic capture and authorization of transactions at the point-of-sale, as well as back-end support services such as the clearing and settlement of transactions and account reconciliation for card issuers. These include: (i) merchant acquiring services, which enable point of sales (“POS”) and
e-commerce merchants to accept and process electronic methods of payment such as debit, credit, prepaid and
electronic benefit transfer (“EBT”) cards; (ii) payment processing services, which enable financial institutions and other issuers to manage, support and facilitate the processing for credit, debit, prepaid, automated teller machines (“ATM”) and EBT card programs; and (iii) business process management solutions, which provide “mission-critical” technology solutions such as core bank processing, as well as IT outsourcing and cash management services to financial institutions, corporations and governments. We provide these services through a scalable, end-to-end technology platforms that we manage and operate in-house and that generatesgenerate significant operating efficiencies that enable us to maximize profitability.
We sell and distribute our services primarily through a proprietary direct sales force with established customer relationships. We
are also building a variety of indirect sales channels that enable us to leverage the distribution capabilities of partners in adjacent markets, including value-added resellers. We continue to pursue joint ventures and merchant acquiring alliances.
We benefit from an attractive business model, the
hallmarks of which are recurring revenue, scalability, significant operating margins and moderate capital expenditure requirements. Our revenue is predominantly recurring in nature because of the mission-critical and embedded nature of the services we provide. In addition, we generally negotiate multi-year contracts with our customers.
OurWe believe our business model
enablesshould enable us to continue to grow our business organically in the primary markets we serve without significant incremental capital expenditures.
We generate revenues based primarily on transaction or discount fees paid by our merchants and financial institutions in our merchant acquiring and payment processing segments and on transaction fees or fees based on number of accounts on file in our business solutions segment. Our total revenues increased from $358.4 million for the year ended December 31, 2013 to $389.5 million for the year ended December 31, 2016, representing a compound annual growth rate (“CAGR”) of 2.81%. Our Adjusted EBITDA (as defined in “Item 7. Management’s Discussion and Analysis of Financial Condition and Results of Operations—Net Income Reconciliation to EBITDA, Adjusted EBITDA, Adjusted Net Income and Adjusted Net Income per common share”) increased from $177.7 million for the year ended December 31, 2013 to $187.6 million for the year ended December 31, 2016, representing a CAGR of 1.82%. Our Adjusted Net Income (as defined in “Item 7. Management’s Discussion and Analysis of Financial Condition and Results of Operations—Net Income Reconciliation to EBITDA, Adjusted EBITDA, Adjusted Net Income and Adjusted Net Income per common share”) increased from $116.0 million for the year ended December 31, 2013 to $124.7 million for the year ended December 31, 2016, representing a CAGR of 2.41%.
EVERTEC, Inc.
(formerly("EVERTEC", formerly known as Carib Latam Holdings, Inc.) is a Puerto Rico corporation organized in April 2012. Our main operating subsidiary, EVERTEC Group, LLC (formerly known as EVERTEC, LLC and EVERTEC, Inc., hereinafter “EVERTEC Group”), was organized in Puerto Rico in 1988. EVERTEC Group was formerly a wholly-owned subsidiary of Popular. On September 30, 2010, pursuant to an Agreement and Plan of Merger (as amended, the “Merger Agreement”), AP Carib Holdings, Ltd. (“Apollo”)
, an affiliate of Apollo Global Management LLC, acquired a 51% indirect ownership interest in EVERTEC Group as part of a merger (the “Merger”) and EVERTEC Group became a wholly-owned subsidiary of Holdings.
On April 17, 2012, EVERTEC Group was converted from a Puerto Rico corporation to a Puerto Rico limited liability company (the “Conversion”) for the purpose of improving its consolidated tax efficiency by taking advantage of changes to the Puerto Rico Internal Revenue Code, as amended (the “PR Code”), that permit limited liability companies to be treated as partnerships that are pass-through entities for Puerto Rico tax purposes. Concurrent with the Conversion, Holdings, which is our direct subsidiary, was also converted from a Puerto Rico corporation to a Puerto Rico limited liability company. Prior to these conversions, EVERTEC, Inc. was formed in order to act as the new parent company of Holdings and its subsidiaries, including EVERTEC Group. The transactions described above in this paragraph are collectively referred to as the “Reorganization.”
We have over a 25 year operating history in the transaction processing industry. Prior to the Merger, EVERTEC Group was 100% owned by Popular, the largest financial institution in the Caribbean, and operated substantially as an independent entity within Popular. As mentioned above, following the Merger, Apollo
which is an affiliate of the leading private equity investor Apollo Global Management, LLC, owned a 51% interest in us and shortly thereafter, we began the transition to a separate, stand-alone entity. As a stand-alone company, we have made substantial investments in our technology and infrastructure, recruited various senior executives with significant transaction processing experience in Latin America, enhanced our profitability through targeted productivity and cost savings actions and broadened our footprint beyond the markets historically served.
We continue to benefit from our relationship with
Popular. Popular,
is our largest
customer,customer. Popular acts as one of our largest merchant referral partners and sponsors us with the card associations (such as Visa or MasterCard), enabling merchants to accept these card associations’ credit card transactions. Popular also provides merchant sponsorship as one of the participants of the ATH network, enabling merchants to connect to the ATH network and accept ATH debit card transactions. We provide a number of critical products and services to Popular, which are governed by a 15-year Amended and Restated Master Services Agreement (the “Master Services Agreement”) that runs through 2025.
On April 17, 2013, the Company completed its initial public
offering of 28,789,943 shares of common stock at a price to the public of $20.00 per share. On September 18, 2013 and December 13, 2013, the Company completed public offerings of 23,000,000 and 15,233,273 shares, respectively, of the Company’s common stock by Apollo Global Management, LLC (“Apollo”), Popular, Inc. (“Popular”), and current and former employees. After the completion of these offerings, Popular owned approximately 11.7 million shares of EVERTEC’s common stock, or 16.05% as of December 31, 2016, and Apollo no longer owns any of the Company’s common stock.offering.
Popular, Inc. (NASDAQ: BPOP), whose principal banking subsidiary’s history dates back to 1893, is the No. 1 bank holding company by both assets and deposits based in Puerto Rico, and, as of September 30,
2016,2019, ranks
4947 by
total asset balanceassets among U.S. bank holding companies. As of December 31,
2016,2019, Popular owned approximately
16.05%16.2% of our common stock.
Shift to Electronic Payments
The ongoing migration from cash, check and other paper methods of payment to electronic payments continues to benefit the transaction processing industry globally. This migration is driven by factors including customer convenience, marketing efforts by financial institutions, card issuer rewards and the development of new forms of payment. We believe that the penetration of electronic payments in the markets where we principally operate is significantly lower relative to more mature U.S. and European markets and that this ongoing shift will continue to generate important growth opportunities for our business. In addition, in an effort to better capture taxes over generated revenue, recent legislation in Puerto Rico has required most licensed
professionals to provide an electronic payment option to their customers, and that all consumer businesses that generate revenues in excess of $50,000 provide an electronic payment option,
to their customers, with the exception of certain businesses, further expanding the need for an electronic payment network in Puerto Rico.
Fast Growing Latin American and Caribbean Financial Services and Payments Markets
Currently, the penetration of banking products, including electronic payments, in the Latin American and Caribbean region is lower relative to the mature U.S. and European markets. As these markets continue to grow, and financial inclusion increases, the emergence of a larger and more sophisticated consumer base will influence
and drive an increase in card (like(e.g., debit, credit, prepayment, and EBT) and electronic payments usage. According to the July 2015 Nilson Report, Latin American purchase transactions on cards are projected to increase by 46% from 14.37 billion in 2013 to 21.02 billion in 2018. According to the 20152019 World Payments Report, non-cash payment volumes in Latin America increased to 43.1 billion in 2017 from 39.8 billion in 2016, representing a growth rate of 8%. A growing base of young and Internet-savvy customers and e-commerce growth are defining the Latin America payments landscape with credit card penetration, digital wallets, and other value-added offerings. Debit card transactions in Latin America grew by 8.6%, while14% in 2017. Latin American non-cash markets continued to be poised for growth despite recovering economies, as non-cash transactions are expected to grow 6% through 2022. The region's FinTech sector is driving change via new financial inclusion initiatives and mobile payment platforms that are becoming popular alternatives to cash payments. In North America, non-cash payments outperformed GDP growthgrew by 4.6%. While there was a slight decline5.1% in growth in non-cash payment transactions in Latin2017, are projected to grow 4.7% through 2022 and North America is expected to cede the growth rate remains at a higher rate than any market considered mature. The CAGRposition as the region with the largest number of non-cash transactions in Latin America from 2010 to 2014 was 10.6%. While in the past mature markets have dominated non-cash transaction volumes, a shift in balance is occurring as the developing markets’ share of global non-cash transaction volumes have increased from 12% to 27%. Latin America’s share of non-cash transaction volumes grew from 25.6 billion in 2010 to 38.3 billion in 2014. If current trends continue, developing markets’ share of global non-cash volumes is expected to increase from 27% in 2013 to 33%emerging Asia by 2020. We continue to believe that the attractive characteristics of our markets and our leadership positionsposition across multiple services and sectors will continue to drive growth and profitability in our businesses.
Ongoing Technology Outsourcing Trends
Financial institutions globally are facing significant challenges including the entrance of non-traditional competitors, the compression of margins on traditional products, significant channel proliferation and increasing regulation that could potentially curb profitability. Many of these institutions have traditionally fulfilled their IT needs through legacy computer systems, operated by the institution itself. Legacy systems are generally highly proprietary, inflexible and costly to operate and maintain and we believe the trend to outsource in-house technology systems and processes by financial institutions will continue.
We believe our ability to provide integrated, open, flexible, customer-centric and efficient IT products and services cater to the evolving needs of our customers, particularly for small- and mid-sized financial institutions in the Latin American markets in which we operate.
The electronic payments industry experiences ongoing technology innovation. Emerging payment technologies such as prepaid cards, contactless payments, payroll cards, mobile commerce,
onlinemobile “wallets” and innovative POS devices
facilitatecontinue to drive the
continued shift away from cash, check and other paper methods of payment. The increasing demand for new and flexible payment options catering to a wider range of consumer segments is driving growth in the electronic payment processing sector.
Our Competitive Strengths
Market Leadership in Latin America and the Caribbean
We believe we have an inherent competitive advantage relative to U.S. competitors based on our first-hand knowledge of the Latin American and Caribbean markets and technological needs, language and culture. We have built leadership positions across the transaction processing value chain in the key geographic markets that we serve, which we believe will enable us to continue to penetrate our core markets and provide advantages to enter new markets. According to the September
20162019 Nilson Report, we are one of the largest merchant acquirers in Latin America based on total number of transactions and we believe we are the largest merchant acquirer in the Caribbean and Central America. We own and operate the ATH network, one of the leading ATM and PIN debit networks in Latin America.
The ATH network and processing businessesEVERTEC processed
over twoapproximately 2.4 billion transactions in
2016, which according2019. According to
managementmanagement's estimates,
makes ATH branded products
are the most frequently used electronic method of payment in Puerto Rico. We offer compelling value to our merchants, as noted in the most recent report published by the Federal Reserve Board regarding debit network fees,
which ranked the ATH network
ranked as one of the most economical networks for merchants. Given our scale and customer base of top tier financial institutions and government entities, we believe we are the leading card issuer
processor and core bank processor in the Caribbean and the only non-bank provider of cash processing services to the U.S. Federal Reserve in the Caribbean. We believe our competitive position and brand recognition increases card acceptance, driving usage of our proprietary network, and presents opportunities for future strategic relationships.
Diversified Business Model across the Transaction Processing Value Chain
Our leadership position in the region is driven in part by our diversified business model which provides a range of merchant acquiring, payment processing and business solutions services to financial institutions, merchants, corporations and government agencies across different geographies. We offer end-to-end technology solutions through a single provider and we have the ability to tailor and customize the features and functionality of our products and services to the specific requirements of our customers in various industries and across geographic markets. We believe the breadth of our offerings enables us to penetrate our customer base from a variety of perspectives and positions us favorably to cross-sell our other offerings over time. For example, we may host a client’s electronic cash register software (part of the business solutions segment), acquire transactions that originate at that electronic cash register (part of the merchant acquiring segment), route the transaction through the ATH network (part of the payment processing segment), and finally settle the transaction between the client and the issuer bank (part of the payment processing segment). In addition, we can serve customers with disparate operations in several geographies with a single integrated technology solution that enables them to access one processing platform and manage their business as one enterprise. We believe these services are becoming increasingly complementary and integrated as our customers seek to capture, analyze and monetize the vast amounts of data that they process across their enterprises. As a result, we are able to capture significant value across the transaction processing value chain and believe that this combination of attributes represents a differentiated value proposition vis-à-vis our competitors who have a limited product and service offering.
Broad and Deep Customer Relationships and Recurring Revenue Business Model
We have built a strong and long-standing portfolio of financial institution, merchant, corporate and government customers across Latin America and the Caribbean, which provides us with a reliable, recurring revenue base and powerful references that have helped us expand into new channels and geographic markets. Our Payment
ProcessingServices - Puerto Rico & Caribbean, Payment Services - Latin America and Merchant Acquiring segments, as well as certain business lines representing the majority of our business solutions segment, generate recurring revenues that collectively accounted for approximately
89%94% of our total revenues in
2016.2019. We receive recurring revenues from services based on our customers’ on-going daily commercial activity such as processing loans, hosting accounts and information on our servers, and processing everyday payments at grocery stores, gas stations and similar establishments. We generally provide these services under one to five year contracts, often with automatic renewals. We also provide a few project-based services that generate non-recurring revenues in our business solutions segment
and our Payment Services - Latin America segment, such as IT consulting for a specific project or
integration.integration or one-time license sales. Additionally, we entered into a 15-year Master Services Agreement with Popular on September 30, 2010. We provide a number of critical payment
processingservices and business solutions products and services to Popular and benefit from the bank’s distribution network and continued support. Through our long-standing and diverse customer relationships, we are able to gain valuable insight into trends in the marketplace that allows us to identify new market opportunities. In addition, we believe the recurring nature of our business model provides us with revenue and earnings stability.
Highly Scalable, End-to-End Technology
PlatformsPlatform
Our diversified business model is supported by our scalable, end-to-end technology platforms
which allowsthat allow us to provide a broad range of transaction processing services and develop and deploy technology solutions to our customers at low incremental costs and increasing operating efficiencies. We have spent over
$160$214 million over the last five years on technology investments, including POS, to continue to build the capacity and functionality of our platforms and we have been able to achieve attractive economies of scale with flexible product development capabilities. We believe that our platforms will allow us to provide differentiated services to our customers and facilitate further expansion into new sales channels and geographic markets.
Experienced Management Team with a Strong Track Record of Execution
We have grown our revenue organically by introducing new products and services and expanding our geographic footprint throughout Latin America. We have a proven track record of creating value from operational and
technology improvements and capitalizing on cross-selling opportunities. We have combined new leadership at EVERTEC, bringing many years of industry experience, with long-standing leadership at the operating business level. In April 2015, Morgan M. Schuessler, Jr., former President of International for Global Payments, Inc., joined our management team as President and Chief Executive Officer. In May 2015, Mariana Lischner Goldvarg joined the Company as President for our Latin America operations. Prior to joining the Company, she served as President of Equifax Latin America. In September 2015, Peter J.S. Smith, former Chief Accounting Officer of Fidelity National Information Services, joined our management team as Chief Financial Officer. In 2012, Philip Steurer, former Senior Vice President of Latin America for First Data Corporation, joined our management team as our Chief Operating Officer. Our management has extensive experience managing and growing transaction processing businesses in Latin America as well as North America, Asia and Europe. Collectively, our management team benefits from an average of over 20 years of industry experience and we believe they are well positioned to continue to drive growth across business lines and regions. In 2016, Guillermo Rospigliosi, former Managing Director for Latin America at CyberSource, a Visa subsidiary, joined the company as the Executive Vice President of Product Management & Marketing of EVERTEC, with 20 years of experience in the Payments, Financial Services, Innovation, and Technology sectors.
We intend to grow our business by continuing to execute on the following business strategies:
Continue Cross-Sales to Existing Customers
We seek to grow revenue by continuing to sell additional products and services to our existing merchant, financial institution, corporate and government customers. We intend to broaden and deepen our customer relationships by leveraging our full suite of end-to-end technology solutions. For example, we believe that there is significant opportunity to cross-sell our
card issuing and card acquiring platforms and services, network services,
and ATM point-of-sale processing,
and card issuer processing servicesas well as our risk management products to our over 180 existing financial institution customers, particularly in markets outside of Puerto Rico. We will also seek to continue to cross-sell value added services into our existing merchant base.
Leverage Our Franchise to Attract New Customers in the Markets We Currently Serve
We intend to attract new customers by leveraging our comprehensive product and services offering, the strength of our brand and our leading end-to-end technology platform. Furthermore, we believe we are well positioned to develop new products and services
and to take advantage of our access to and position in markets we currently serve. For example, in markets we serve outside of Puerto Rico, we believe there is a
significantgood opportunity to penetrate small to medium
and some larger financial institutions with our products and
services, as well as to penetrate governments with offerings such as EBT.services.
Expand in the Latin American Region
We believe there is substantial opportunity to expand our businesses in the Latin American region. We believe that we have a competitive advantage relative to U.S. competitors based on our first-hand knowledge of the Latin American and Caribbean markets and
their technological needs,
our physical presence in the region, language and culture. We believe significant growth opportunities exist in a number of large markets such as Colombia, México, and Chile, among others. We also believe that there is an opportunity to provide our services to existing financial institution customers in other regions where they operate. Additionally, we continually evaluate our strategic plans for geographic expansion, which can be achieved through
strategic acquisitions, joint ventures, partnerships,
alliances or
strategic acquisitions.alliances. For a description of risks associated with obtaining regulatory approvals and other risks associated with strategic transactions, see “Item 1A. Risk Factors—Risks Related to Our Business—Our expansion and selective acquisition strategy exposes us to risks, including the risk that we may not be able to successfully integrate acquired businesses.”
Develop New Products and Services
Our experience with our customers provides us with insight into their needs and enables us to continuously develop new transaction processing services. We plan to continue growing our merchant, financial institution, corporate and government customer base by developing and offering additional value-added products and services to cross-sell along with our core offerings. We intend to continue to focus on these and other new product opportunities in order to take advantage of our leadership position in the transaction processing industry in the Latin American and Caribbean region.
We offer our customers end-to-end products and solutions across the transaction processing value chain from a single source across numerous channels and geographic markets, as further described below.
According to the September
20162019 Nilson Report, we are one of the largest merchant acquirers in Latin America based on total number of transactions and we believe we are the largest merchant acquirer in the Caribbean and Central America. Our merchant acquiring business provides services to merchants that allow them to accept electronic methods of payment such as debit, credit, prepaid and EBT cards carrying the ATH, Visa, MasterCard, Discover and American Express brands. Our full suite of merchant acquiring services includes, but is not limited to, the underwriting of each merchant’s contract, the deployment and rental of POS devices and other equipment necessary to capture merchant transactions, the processing of transactions at the point-of-sale, the settlement of funds with the participating financial institution, detailed sales reports and customer support. In
2016,2019, our merchant acquiring business processed over
370440 million transactions.
Our Merchant Acquiring business generated $91.2 million, or 23.4%, of total revenues and $31.1 million, or 22.2%, of total segment income from operations for the year ended December 31, 2016.
Payment
ProcessingServices
We
believe we are the largest card processor and card network service provider in the Caribbean. We provide a diversified suite of payment processing products and services to blue chip regional and global corporate customers, government agencies, and financial institutions across Latin America and the Caribbean. These services provide the infrastructure technology necessary to facilitate the processing and routing of payments across the transaction processing value chain.
At the point-of-sale, we sell transaction processing technology solutions, similar to the services in our merchant acquiring business, to other merchant acquirers to enable them to service their own merchant customers. We also offer terminal driving solutions to merchants, merchant acquirers (including our merchant acquiring business) and financial institutions, which provide the technology to securely operate, manage and monitor POS terminals and ATMs. We also rent POS devices to financial institution customers who seek to deploy them across their own businesses.
To connect the POS terminals to card issuers, we own and operate the ATH network, one of the leading ATM and PIN debit networks in Latin America. The ATH network connects the merchant or merchant acquirer to the card issuer and enables transactions to be routed or “switched” across the transaction processing value chain. The ATH network offers the technology, communications standards, rules and procedures, security and encryption, funds settlement and common branding that allow consumers, merchants, merchant acquirers, ATMs, card issuer processors and card issuers to conduct commerce seamlessly, across a variety of channels, similar to the services provided by Visa and MasterCard. The ATH network and
payment processing businesses processed
over twoapproximately 2.0 billion transactions in
2016.2019.
To enable financial institutions, governments and other businesses to issue and operate a range of payment products and services, we offer an array of card processing and other payment technology services, such as
internetInternet and mobile banking software services, bill payment systems and EBT solutions. Financial institutions and certain retailers outsource to us certain card processing services such as card issuance, processing card applications, cardholder account maintenance, transaction authorization and posting,
high volume payment processing fraud and risk management services, and settlement. Our payment products include electronic check processing, automated clearing house (“ACH”), lockbox, online, interactive voice response and web-based payments through personalized websites, among others.
We have been the main provider of EBT services to the Puerto Rican government since 1998. Our EBT application allows certain agencies to deliver government benefits to participants through a magnetic card system and serves
over 806,000approximately 740,000 active participants.
Our Payment Processing business accounted for $111.5 million, or 28.6%, of total revenues and $52.1 million, or 37.2%, of total segment income from operations for the year ended December 31, 2016.
We provide our financial institutions, corporate and government customers with a wide suite of business process management solutions including specifically core bank processing, network hosting and management, IT consulting,
services, business process outsourcing, item and cash processing, and fulfillment. In addition, we believe we are the only non-bank provider of cash processing services to the U.S. Federal Reserve in the Caribbean.
Our Business Solutions business accounted for $186.8 million, or 47.9%, of total revenues and $56.8 million, or 40.6%, of total segment income from operations for the year ended December 31, 2016.
For additional information regarding the Company’s segments refer to Note 22 of the Audited Consolidated Financial Statements included elsewhere in this Annual Report on Form 10-K.
Competitive factors impacting the success of our services include the quality of the technology-based application or service, application features and functions, ease of delivery and integration, ability of the provider to maintain, enhance and support the applications or services, and price. We believe that we compete well in each of these categories. In addition, we believe that our relationship with Popular, scale and expertise, and financial institution industry expertise, combined with our ability to offer multiple applications, services and integrated solutions to individual customers, enhances our competitiveness against companies with more limited offerings and helps us compete with large global competitors with similar assets to ours.
In merchant acquiring, we compete with several other service providers and financial institutions, including
Vantiv,Fidelity National Information Services, Inc.,
First Data Corporation,Fiserv, Inc., Global Payments, Inc., Elavon, Inc.,
Sage Payment Solutions,EVO Payments, Inc., independent sales organizations and some local banks. Also, the card associations and payment networks are increasingly offering products and services that compete with ours. The main competitive factors are price, brand awareness, strength of the relationship with financial institutions, system functionality, integration service capabilities and innovation. Our business is also impacted by the expansion of new payments methods and devices, card association business model expansion, and bank consolidation.
In payment
processing,services, we compete with several other third party card processors,
and debit networks,
and financial technology start-ups, including
First Data Corporation,Tecnocom Telecomunicaciones y Energía, S.A., Fidelity National Information Services, Inc., Fiserv, Inc., Total System Services,
Inc., Vantiv, Inc., MasterCard, Visa, American Express, Discover and Global Payments, Inc. Also, card associations and payment networks are increasingly offering products and services that compete with our products and services. The main competitive factors are price, system performance and reliability, system functionality, security, service capabilities and disaster recovery and business continuity capabilities.
In business solutions, our main competition includes internal technology departments within financial institutions, retailers, data processing or software development departments of large companies,
and/or large technology and consulting
companies. Maincompanies, and/or financial technology start-ups, such as Fidelity National Information Services, Inc. and Fiserv, Inc. The main competitive factors are price, system performance and reliability, system functionality, security, service capabilities, and disaster recovery and business continuity capabilities.
We own numerous registrations for several trademarks in different jurisdictions and own or have licenses to use certain software and technology, which are critical to our business and future success. For example, we own the ATH and EVERTEC trademarks in several jurisdictions, which are associated by the public, financial institutions and merchants with high quality and reliable electronic commerce, payments, and debit network solutions and services. Such goodwill allows us to be competitive, retain our customers and expand our business. Further, we also use a combination of (i) proprietary software, and (ii) duly licensed third party software to operate our business and deliver secure and reliable products and services to our customers. The licensed software is subject to terms and conditions that we considered within the industry standards. Most are perpetual licenses and the rest are term licenses with renewable terms. In addition, we monitor these license agreements and maintain close contact with our suppliers to ensure their continuity of service.
We seek to protect our intellectual property rights by securing appropriate statutory intellectual property protection in the relevant
jurisdictions, including patents.jurisdictions. We also protect proprietary know-how and trade secrets through company confidentiality policies, licenses, programs and contractual agreements.
As of December 31,
2016,2019, we
employedhad approximately
1,650 persons2,300 employees across
811 countries in the United States, Latin America and the Caribbean.
In Brazil, we have two unionized employees covered by the terms of industry-specific collective agreements. None of our
other employees are
subject to collective bargaining agreements, and weotherwise represented by any labor organization. We consider our relationships with our employees to be good. We have not experienced any work
stoppages.stoppages in connection with employee matters.
Government Regulation and Payment Network Rules
Oversight by the
Federal Reserve
Regulations
Popular is a bank holding company that has elected to be treated as a financial holding company under the provisions of the Gramm-Leach-Bliley Act of 1999.
As long asTo the extent that we are deemed to be a “subsidiary” of Popular for purposes of the Bank Holding Company (“BHC”) Act, we will be subject to regulation and oversight by the Board of Governors of the Federal Reserve System (the “Federal Reserve Board”) and our activities will be subject to several related significant restrictions, the more significant of which are discussed below.
Transactions with Affiliates
As long as
To the extent that we are deemed to be an affiliate of Popular for purpose of the affiliate transaction rules found in Section 23A and 23B of the Federal Reserve Act and Regulation W of the Federal Reserve Board, we will be subject to various restrictions on our ability to borrow from, and engage in certain other transactions with Popular’s bank subsidiaries, Banco Popular and Banco Popular North America (“BPNA”). In general, these rules require that any “covered transaction” that we enter into with Banco Popular or BPNA (or any of their respective operating subsidiaries), as the case may be, must be secured by designated amounts of specified collateral and must be limited to 10% of Banco Popular’s or BPNA’s, as the case may be, capital stock and surplus. In addition, all “covered transactions” between Banco Popular or BPNA, on the one hand, and Popular and all of its subsidiaries and affiliates on the other hand, must be limited to 20% of Banco Popular’s or BPNA’s, as the case may be, capital stock and surplus. “Covered transactions” are defined by statute to include a loan or extension of credit, as well as a purchase of securities issued by an affiliate, a purchase of assets (unless otherwise exempted by the Federal Reserve Board) from the affiliate, the acceptance of securities issued by the affiliate as collateral for a loan and the issuance of a guarantee, acceptance or letter of credit on behalf of an affiliate.
In addition, Section 23B and Regulation W require that
as long asto the extent that we are deemed an affiliate of Banco Popular or BPNA, all transactions between us and either Banco Popular or BPNA be on terms and conditions, including credit standards, that are substantially the same or at least as favorable to Banco Popular or BPNA, as the case may be, as those prevailing at the time for comparable transactions involving other non-affiliated companies or, in the absence of comparable transactions, on terms and conditions, including credit standards, that in good faith would be offered by Banco Popular or BPNA to, or would apply to, non-affiliated companies.
Permissible Activities
As long as
To the extent that we are deemed to be controlled by Popular for bank regulatory purposes, we may conduct only those activities that are authorized for a bank holding company or a financial holding company under the BHC Act, the Federal Reserve Board’s Regulation K and other relevant U.S. federal banking laws. These activities generally include activities that are related to banking, financial in nature or incidental to financial activities. In addition, restrictions placed on Popular as a result of supervisory or enforcement actions may restrict us or our activities in certain circumstances, even if these actions are unrelated to our conduct or business. For as long asTo the extent that we are deemed to be a foreign subsidiary of a bank holding company under the Federal Reserve Board’s regulations, we will rely on the authority granted under the Federal Reserve Board’s Regulation K to conduct our data processing, management consulting and related activities outside the United States. The Federal Reserve Board’s Regulation K generally limits activities of a bank holding company outside the United States that are not banking or financial in nature, specifically permitted under Regulation K to foreign subsidiaries or necessary to carry on such activities that are not otherwise permissible for a foreign subsidiary under the banking regulations. We continue to engage in certain activities outside the scope of such permissible activities pursuant to authority under the Federal Reserve Board’s Regulation K, which allows a bank holding company to retain, in the context of an acquisition of a going concern, such
otherwise impermissible activities if they account for not more than 5% of either the consolidated assets or consolidated revenues of the acquired organization.
New lines of business, other new activities, divestitures or acquisitions that we may wish to commence in the future may not be permissible for us under the BHC Act,
the Federal Reserve Board’s Regulation K or other
relevantapplicable U.S. federal banking laws. Further, as a result of being subject to regulation and supervision by the Federal Reserve Board, we may be required to obtain the approval of the Federal Reserve Board before engaging in certain new activities or businesses, whether organically or by acquisition, unless such activities are considered financial in nature.
More generally, the Federal Reserve Board has broad power to approve, deny or refuse to act upon applications or notices for us to conduct new activities, acquire or divest businesses or assets, or reconfigure existing operations. If we are unable to obtain
any such approval on a timely basis, are delayed in receiving approval,
are approved subject to regulatory conditions or do not receive approval, this may make transactions more expensive or may make us less attractive to potential sellers.
As a technology service provider to financial institutions, we are also subject to regulatory oversight and examination by the Federal Financial Institutions Examination Council (the “FFIEC”), an interagency body of federal financial regulators that includes the Federal Reserve Board. The office of the Commissioner of Financial Institutions of Puerto Rico also participates in such examinations by the FFIEC. In addition, independent auditors annually review several of our operations to provide reports on internal controls for our clients’ auditors and regulators.
Regulatory Reform and Other Legislative Initiatives
The payment card industry has come under increased scrutiny from lawmakers and regulators.
In July 2010, the Dodd-Frank Act was signed into law in the United States. The Dodd-Frank
Wall Street Reform and Protection Act
sets(the “Dodd-Frank Act”) set forth significant structural and other changes to the regulation of the financial services industry,
and establishes a new agency,including the establishment of the Consumer Financial Protection Bureau
or(the “CFPB”). The CFPB
to regulatehas broad supervisory, enforcement and rulemaking authority over consumer financial products and services (including many offered by us and by our clients)
. and certain bank and non-bank providers of such products and services. In addition, Section 1075 of the Dodd-Frank Act (commonly referred to as the
“Durbin “Durbin Amendment”) imposesimposed new restrictions on card networks and debit card issuers. More specifically, the Durbin Amendment provides that the interchange transaction fees that a card issuer or payment network may receive or charge for an electronic debit transaction must be “reasonable and proportional” to the cost incurred by the card issuer in authorizing, clearing and settling the transaction.
The Federal
Reserve Board adopted the final regulations on June 29, 2011 and added a fraud-prevention adjustment on July 27, 2012.TheReserve’s regulations (a) limit debit transaction interchange fees to $.21 + (5 bps times the value of the transactions) + $.01 (as a fraud adjustment for issuers that have in place policies and measures to address fraud); (b) require that issuers must enable at least two unaffiliated payment card networks on their debit cards without regard to authentication method; and (c) prohibit card issuers and payment card networks from entering into exclusivity arrangements for debit card processing and restrict card issuers and payment networks from inhibiting the ability of merchants to direct the routing of debit card transactions over networks of their choice. The Dodd-Frank Act also allows merchants to set minimum dollar amounts (currently, not to exceed $10) for the acceptance of a credit card and provide discounts or incentives to entice consumers to pay with various payment methods, such as cash, checks, debit cards or credit cards, as the merchant prefers.
The CFPB is responsible for many of the regulatory functions with respect to consumer financial products and services. In addition to rulemaking authority over several enumerated federal consumer financial protection laws, the Dodd-Frank Act, fromCFPB is authorized to issue rules prohibiting unfair, deceptive or abusive acts or practices in connection with the offering of a consumer financial product or service or any transaction with a consumer for such product or service. The CFPB also has authority to examine supervised entities for compliance with, and to enforce violations of, consumer financial protection laws.
To the extent that we are deemed an affiliate of Banco Popular-an insured depository institution with greater than $10 billion in total consolidated assets-and as a service provider to other insured depository institutions with $10 billion or more in total consolidated assets, as well as larger participants in markets for consumer financial products and services, as determined by the CFPB, we are subject to the supervision, enforcement and rulemaking authority of the CFPB. CFPB rules, examinations and enforcement actions may require us to adjust our activities and may increase our compliance costs.
From time to time, various legislative
and regulatory initiatives are introduced in Congress and state legislatures,
as well asand changes in regulations or agency policies, or in the interpretation of such regulations and policies, are proposed by regulatory agencies. Such initiatives may include proposals to
diminishmodify the powers of bank holding companies and their affiliates. Such legislation
or changes in regulation could
change banking statutes andaffect our operating environment in substantial and unpredictable ways. If
enacted,adopted, such legislation
or changes in regulation could increase the cost of doing business or limit permissible activities. We cannot predict whether any such legislation will be enacted, and, if enacted, the effect that it, or any implementing regulations
or related policies and guidance, would have on our financial condition or results of operations.
The Dodd-Frank Act assigned most of the regulatory responsibilities previously exercised by the federal banking regulators and other agencies with respect to consumer financial products and services and other additional powers to the CFPB. In addition to rulemaking authority over several enumerated federal consumer financial protection laws, the CFPB is authorized to issue rules prohibiting unfair, deceptive or abusive acts or practices in connection with any transaction with a consumer for a consumer financial product or service, or the offering of a consumer financial product or service, and has authority to enforce consumer financial protection laws and CFPB rules. We are subject to regulation and enforcement by the CFPB because we are an affiliate of Banco Popular (which is an insured depository institution with greater than $10 billion in assets) for bank regulatory purposes and because we are a service provider to insured depository institutions with assets of $10 billion or more in connection with their consumer financial products and to entities that are larger participants in markets for consumer financial products and services. CFPB rules, examinations and enforcement actions may require us to adjust our activities and may increase our compliance costs. Various proposals have been made to either eliminate or restructure the CFPB. It is possible that during the current administration one or more of the various proposals could become law. It is unclear whether or how any such change could affect the manner in which our consumer product and service activities in which we engage. One possibility is that regulatory responsibility would be reallocated to the various bank regulatory agencies.
Other Government Regulations
In addition to oversight by the Federal Reserve Board, our
Our services are
also subject to a broad range of complex federal, state, Puerto Rico and foreign regulation, including privacy laws, international trade regulations, the Bank Secrecy Act and other anti-money laundering laws, anti-trust and competition laws, the U.S. Internal Revenue Code, the PR Code, the Employee Retirement Income Security Act, the Health Insurance Portability and Accountability Act and other Puerto Rico laws and regulations. Failure of our services to comply with applicable laws and regulations could result in restrictions on our ability to provide such services, as well as the imposition of civil fines and/or criminal penalties. The principal areas of regulation (in addition to oversight by the Federal Reserve Board) that impact our business are described below.
Privacy
and Information Security Regulations
We and our financial institution clients are required to comply with various U.S. state, federal and foreign privacy laws and regulations, including those imposed under the Gramm-Leach-Bliley Act of 1999 which applies directly to a broad range of financial institutions and to companies that provide services to financial institutions. These laws and regulations place restrictions on the collection, processing, storage, use and disclosure of certain personal information, require disclosure to individuals of detailed privacy practices and provide them with certain rights to prevent the use and disclosure of protected information. The regulations, however, permit financial institutions to share information with non-affiliated parties who perform services for the financial institutions. These laws also impose requirements for safeguarding personal information through the issuance of data security standards or guidelines. Certain state laws impose similar privacy obligations, as well as, in certain circumstances, obligations to provide notification to affected individuals, states officers and consumer reporting agencies, as well as businesses and governmental agencies that own data, of security breaches of computer databases that contain personal information. In addition, U.S. state and federal government agencies have been contemplating or developing new initiatives to safeguard privacy and enhance data
and information security. Some foreign privacy laws are stricter than those applicable under U.S. federal, state or Puerto Rican law. As a provider of services to financial institutions, we are required to comply with
theapplicable privacy
and cybersecurity regulations and are bound by the same limitations on disclosure of the information received from our customers as apply to the financial institutions themselves. See “Item 1A. Risk
Factors—RisksFactors-Risks Related to Our
Business—SecurityBusiness-We are subject to security breaches or
other confidential data theft from our
own failure to comply with privacy regulationssystems, which can adversely affect our reputation and
industry security requirements imposed on providers of services to financial institutions and card processing services could harm our business by disrupting our delivery of services and damaging our reputation.”business."
Anti-Money Laundering and Office of Foreign Assets Control Regulation
Since we provide data processing services to both foreign and domestic financial institutions, we are required to comply with certain anti-money laundering and terrorist financing laws and economic sanctions imposed on designated foreign countries, nationals and others. Specifically, we must adhere to the requirements of the Bank Secrecy Act, as amended by the USA PATRIOT Act of 2001 (collectively, the “BSA”) regarding processing and facilitation of financial transactions, as well as other state, local and foreign laws relating to money laundering. Furthermore, as a data processing company that provides services to foreign parties and facilitates financial transactions between foreign parties, we are obligated to screen transactions for compliance with the sanctions programs administered by the U.S. Department of the Treasury’s Office of Foreign Assets Control (“OFAC”). These regulations prohibit us from entering into or facilitating a transaction to or from or dealings with specified countries, their governments and, in certain circumstances, their nationals and others, such as narcotics traffickers and terrorists or terrorist organizations designated by the U.S. Government under one or more sanctions regimes.
A major focus of governmental policy in recent years has been aimed at combating money laundering and terrorist financing. Preventing and detecting money laundering and other related suspicious activities at their earliest stages warrants careful monitoring. The BSA, along with a number of other anti-money laundering laws, imposes various reporting and record-keeping requirements concerning currency and other types of monetary instruments. Similar anti-money laundering, counter-terrorist financing and proceeds of crime laws apply to movements of currency and payments through electronic transactions and to dealings with persons specified on lists maintained by organizations similar to OFAC in several other countries and which may impose specific data retention obligations or prohibitions on intermediaries in the payment process. These laws and regulations impose obligations to maintain appropriate policies, procedures and controls to detect, prevent and report money laundering and terrorist financing and to verify the identity of their customers. Failure to maintain and implement adequate programs to combat money laundering and terrorist financing, or to comply with all of the relevant laws or regulations, could have serious legal and reputational consequences for us.
We may also be subject to enforcement actions and as a result may incur losses and liabilities that may impact our business.
Federal Trade Commission Act and Other Laws Impacting our
Customers’Customers' Business
All persons engaged in commerce, including, but not limited to, us and our merchant and financial institution customers are subject to Section 5 of the Federal Trade Commission Act prohibiting Unfair or Deceptive Acts or Practices (“UDAP”). In addition, there are other laws, rules and/or regulations, including the Telemarketing Sales Act, that may directly impact the activities of our merchant customers and in some cases may subject us, as the
merchant’smerchant's payment processor, to investigations, fees, fines and disgorgement of funds in the event we are deemed to have aided and abetted or otherwise provided the means and instrumentalities to facilitate the illegal activities of the merchant through our payment processing services. Federal and state regulatory enforcement agencies including the Federal Trade Commission, or FTC, and the
states’states' attorneys general have authority to take action against nonbanks that engage in UDAP or violate other laws, rules and regulations. To the extent we process payments for a merchant that may be in violation of these laws, rules and regulations, we may be subject to enforcement actions and as a result may incur losses and liabilities that may impact our business.
Anti-trust and Competition Laws
We are required to comply with various federal, local and foreign competition and anti-trust laws, including the Sherman Act, Clayton Act, Hart-Scott-Rodino Antitrust Improvements Act, Robinson-Patman Act, Federal Trade Commission Act and Puerto Rico Anti-Monopoly Act. In general, competition laws are designed to protect businesses and consumers from anti-competitive behavior. Competition and anti-trust law investigations can be lengthy, and violations are subject to civil and/or criminal fines and other sanctions for both corporations and individuals that participate in the prohibited conduct. Class action civil anti-trust lawsuits can result in significant judgments, including in some cases, payment of treble damages and/or
attorneys’attorneys' fees to the successful plaintiff. See “Item 1A. Risk
Factors—RisksFactors-Risks Related to Our
Business—FailureBusiness-Failure to comply with U.S. state and federal antitrust requirements, or the Puerto Rico Anti-Monopoly Act, and government investigations into our compliance, could adversely affect our business.”
Foreign Corrupt Practices Act (“FCPA”), Export Administration and Other
As a data processing company that services both foreign and domestic clients, our business activities in foreign countries, and in particular our transactions with foreign governmental entities, subject us to the anti-bribery provisions of the FCPA, as well as the laws and regulations of the foreign jurisdiction where we operate. Pursuant to applicable anti-bribery laws, our transactions with foreign government officials and political candidates are subject to certain limitations. Finally, in the course of business with foreign clients and subsidiaries, we export certain software and hardware that is regulated by the Export Administration Regulations from the United States to the foreign parties. Together, these regulations place restrictions on who we can transact with, what transactions may be facilitated, how we may operate in foreign jurisdictions and what we may export to foreign countries.
The preceding list of laws and regulations is not exhaustive, and the regulatory framework governing our operations changes continuously. The enactment of new laws and regulations may increasingly affect directly and indirectly the operation of our business, which could result in substantial regulatory compliance costs, litigation expense, loss of revenue, decreased profitability and/or adverse publicity.
Association and Network Rules
Several of our subsidiaries are registered with or certified by card associations and payment networks, including the ATH network, MasterCard, Visa, American Express, Discover and numerous debit and EBT networks as members or as service providers for member institutions in connection with the services we provide to our customers. As such, we are subject to applicable card association and network rules, which could subject us to a variety of fines or penalties that may be levied by the card associations or networks for certain acts and/or omissions by us, our acquirer customers, processing customers and/or merchants. For example, “EMV” is a credit and debit card authentication methodology that the card associations are mandating to processors, issuers
and acquirers in the payment industry. Compliance deadlines for EMV mandates vary by country and by payment network. We have invested significant resources and man-hours to develop and implement this methodology in all our payment related platforms. However, we are not certain if or when our financial institution customers will use or accept the methodology and the time it will take for this technology to be rolled-out to all customer ATM and POS devices connected to our platforms or adopted by our card issuing clients. Non-compliance with EMV mandates could result in lost business or financial losses from fraud or fines from network operators. We are also subject to network operating rules promulgated by the National Automated Clearing House Association relating to payment transactions processed by us using the Automated Clearing House Network and to various government laws regarding such operations, including laws pertaining to EBT.
Our revenue composition by geographical area is based in Latin America and
the Caribbean. Latin America includes, among others, Costa Rica, México, Guatemala, Colombia,
Chile, Uruguay, Brazil and Panamá. The Caribbean
includesprimarily represents Puerto Rico, the Dominican Republic and
the Virgin
Islands, among others.Islands. See Note
22 of23 to Audited Consolidated Financial Statements included elsewhere in this Annual Report on Form 10-K for additional information related to geographic areas.
Our payment businesses generally experience increased activity during the traditional holiday shopping periods and around other nationally recognized holidays.
EVERTEC’s Annual Report on Form 10-K, Quarterly Reports on Form 10-Q and Current Reports on Form 8-K and amendments to such reports (if applicable) filed or furnished pursuant to Sections 13(a) or 15(d) of the Securities Exchange Act of 1934, as amended (the “Exchange Act”) are available free of charge, through our website,http://www.evertecinc.com, as soon as reasonably practicable after such material is electronically filed with or furnished to the SEC. In addition, we make available on our website under the heading of “Corporate Information” our: (i) Code of Ethics; (ii) Code of Ethics for Service Providers; (iii) Corporate Governance Guidelines; (iv) the charters of the Audit, Compensation and Nominating and Corporate Governance committees, and also we intend to disclose any amendments to the Code of Ethics. The aforementioned reports and materials can also be obtained free of charge upon written request or telephoning to the following address or telephone number:
San Juan, Puerto Rico 00926
(787) 759-9999
The public may read and copy any materials EVERTEC files with the SEC at the SEC’s Public Reference Room at 100 F Street, NE, Washington, D.C. 20549. In addition, the public may obtain information on the operation of the Public Reference Room by calling the SEC at 1-800-SEC-0330.
Our filings with the SEC are also available to the public from commercial document retrieval services and at the web site maintained by the SEC athttp://www.sec.gov.
Readers should carefully consider, in connection with other information disclosed in this Annual Report on Form 10-K, the risks and uncertainties described below. The following discussion sets forth
somerisks that we believe are material to our stockholders and prospective stockholders. The occurrence of any of the
more important risk factors that could affectfollowing risks might cause our
business, financial condition, operating resultsstockholders to lose all or
cash flow. However,other factors, besides those discussed below or elsewherea part of their investment in this Report or other of our reports filed with or furnished to the Securities and Exchange Commission (“SEC”), also could adversely affect our business, financial condition, operating results or cash flow.Company. We cannot assure you that the risk factors described below or elsewhere in this document are a complete set of all potential risks we may face; additional risks and uncertainties not presently known to us or not believed by us to be material may also negatively impact us. Theseaffect our business results, financial condition, results of operations, cash flows, and the trading price of our common stock. Some statements in this report, including statements in the following risk factors also serve to describe factors which may cause our results to differ materially from those discussed in forward looking statements included herein or in other documents or statements that make reference to this Annual Report on Form 10-K.section, constitute forward-looking statements. Please also refer to the section titled “Forward Looking Statements” inat the beginning of this Annual Report on Form 10-K.
Risks Related to Our Business
We expect to continue to derive a significant portion of our revenue from Popular.
Our services to Popular account for a significant portion of our revenues, and we expect that our services to Popular will continue to represent a significant portion of our revenues for the foreseeable future. In
2016,2019, products and services billed to Popular accounted for approximately
45%43% of our total
revenues, of which approximately 83% (or approximately 37% of total revenues) are derived from core bank processing and related services for Popular and approximately 17% (or approximately 8% of total revenues) are transaction processing activities driven by third parties.revenues. The majority of Popular’s business is presented in the Business Solutions segment. If Popular were to terminate, fail to perform under
(in whole or in part), or fail to renew the Master Services Agreement (“MSA”), which currently expires in 2025, or our other material agreements with Popular, our revenues could be materially reduced and our profitability and cash flows could also be materially reduced,
all of which
in turn, could potentially limitwould have a material adverse impact on our
ability to renegotiate our debt.financial condition and results of operations.
We depend, in part, on our merchant relationships and our alliance with Banco Popular, a wholly-owned subsidiary of Popular, to grow our merchant acquiring business. If we are unable to maintain these relationships and this alliance, our business may be adversely affected.
Growth in our merchant acquiring business is derived primarily from acquiring new merchant relationships, new and enhanced product and service offerings, cross selling products and services into existing relationships, the shift of consumer spending to increased usage of electronic forms of payment, and the strength of our relationship with Banco Popular. A substantial portion of our business is generated from our Independent Sales Organization Sponsorship and Services Agreement
(the “ISO Agreement”) with Banco
Popular.Popular, which expires in 2025.
Banco Popular acts as a merchant referral source and provides sponsorship into the ATH, Visa, Discover and MasterCard networks for merchants, as well as card association sponsorship, clearing and settlement services. We provide transaction processing and related functions. Both
we and Popular as alliance partners may provide management, sales, marketing, and other administrative
services.services to merchants. We rely on the continuing growth of our merchant relationships,
which in turn is dependent upon our alliance with Banco Popular and other distribution channels. There can be no guarantee that this growth will continue and the loss or deterioration of these relationships,
whether due to the termination of the ISO Agreement or otherwise, could negatively impact our business and result in a reduction of our revenue and
profit.income.
Our MSA with Popular, our ISO Agreement with Banco Popular and our ATH Network Participation Agreement and ATH Support Agreement with Banco Popular (the “BPPR ATH Agreements”) have initial terms ending in 2025. If Popular or Banco Popular decide not to renew one or more of these agreements, or if we are unable to negotiate extensions, or if we must provide significant concessions to Popular or Banco Popular to secure extensions or otherwise, our results of operations, financial condition and trading price of our common stock may be materially adversely affected, and it could also potentially limit our ability to renegotiate our debt.
Our MSA with Popular has an initial term that ends in 2025. For 2019, we derived approximately 43% of our revenue from such contract, which makes the MSA our most significant client contract. We regularly discuss with Popular the terms of the MSA and the services we provide thereunder to Popular. We cannot be certain that we will be able to negotiate an extension to the MSA. In addition, even if we are able to negotiate an extension of the MSA, any new master services agreement may be materially different from the existing MSA. Further, Popular may require significant concessions from us with respect to pricing, services and other key terms, both in respect of the current term and any extension of the MSA, particularly as we approach 2025. Any such events may materially negatively impact our financial condition, results of operations and trading price of our common stock, as well as potentially limit our ability to renegotiate our debt.
Pursuant to our ISO Agreement with Banco Popular, Banco Popular sponsors us as an independent sales organization with respect to certain credit card associations and is required to exclusively refer to us any merchant that inquires about, requests or otherwise evidences interest in merchant and other services. If the ISO Agreement is not renewed, we will have to seek other card association sponsors, we will not benefit from Banco Popular referral of merchants and we may experience the loss of some merchants if Banco Popular itself enters the merchant acquiring business or agrees to sponsor another independent sales organization. Any of these may negatively impact our financial condition and results of operations.
Similarly, the BPPR ATH Agreements have initial terms ending in 2025. Under such agreements, among other things, we provide Banco Popular certain ATM and POS services in connection with our ATH network; we grant a license to use the ATH logo, word mark and associated trademarks; and Banco Popular agrees to support, promote and market the ATH network and brand and to issue debit cards bearing the symbol of the ATH network. If one or both of the BPPR ATH Agreements are not extended, our ATH brand and network could be negatively impacted and our financial condition and results of operations adversely affected.
A protracted government shutdown could negatively affect our financial condition.
During any protracted federal government shutdown, the federal government may reduce or cut funding for certain welfare and disaster relief programs. Beneficiaries of certain federal programs, such as the Supplemental Nutrition Assistance Program (SNAP), obtain their benefits through electronic benefits transfer (EBT) accounts. A temporary or permanent reduction in federal welfare and relief programs could lead to a decrease in electronic benefit card volume. The effect of a protracted government shutdown now or in the future may affect our revenues, profitability and cash flows.
If we are unable to renew client contracts
aton favorable terms
we could lose clients andor at all, our results of operations and financial condition may be adversely affected.
Failure to achieve favorable renewals of client contracts could negatively impact our business. Our contracts with private clients generally run for a period of one to five years, except for
theour Master Services Agreement with
Popular, which has a term of 15 years, and approximately 9 years remaining on the contract, and provide for termination fees upon early termination.Popular. Our government contracts generally run for one year
withoutand do not include automatic renewal periods due to
requirements of the government procurement rules and related fiscal funding requirements. Our standard merchant contract has an initial term of
one orup to three years, with automatic one-year renewal periods. At the end of the contract term, clients
have the opportunity tocan renew or renegotiate their contracts with
us, and tobut may also consider whether to engage one of our competitors to provide products and services. If we are not successful in achieving high renewal rates andand/or contract terms that are favorable to us, our results of operations and financial condition may be adversely affected.
Our substantial leverage could adversely affect our ability to raise additional capital to fund our operations, limit our ability to react to changes in the economy or our industry, expose us to interest rate risk to the extent of our variable rate debt and prevent us from meeting our obligations under our notes and senior secured credit
facilities.facilities, and, if we incur additional amounts of debt, it could exacerbate the risks associated with our substantial indebtedness.
We are highly leveraged. As of December 31,
2016,2019, the total principal amount of our indebtedness was approximately
$659.5$530.9 million. Our high degree of leverage could have
important consequences for you,a significant impact on us, including:
increasing our vulnerability to adverse economic, industry or competitive developments;
requiring a substantial portion of cash flow from operations to be dedicated to the payment of principal and interest on our indebtedness, therefore reducing our ability to use our cash flow for other purposes, including for our operations, capital expenditures and future business opportunities;
exposing us to the risk of increasedincreases in interest rates because our borrowings are predominantly at variable rates of interest;
making it more difficult for us to satisfy our obligations with respect to our indebtedness and any failure to complygenerally, including complying with the obligations of any of our other debt instruments, including restrictive covenants and borrowing conditions, our noncompliance with which could result in an event of default under the agreements governingsetting forth the terms such of other indebtedness;
restricting us from making strategic acquisitions or causing us to make non-strategic divestitures;
limiting our ability to obtain additional debt or equity financing for working capital, capital expenditures, business development, debt service requirements, acquisitions and general corporate or other purposes; and
limiting our flexibility in planning for, or reacting to, changes in our business or market conditions and placing us at a competitive disadvantage compared to our competitors who aremay be less highly leveraged and who therefore, may be able to take advantage of opportunities that our leverage prevents us from exploiting.
For the year ended December 31, 2016, our cash interest expense on the senior secured credit facilities amounted to $22.5 million. Our interest expense could increase if interest rates increase because the entire amount of the indebtedness under the senior secured credit facilities bears interest at a variable rate. At December 31, 2016, we had approximately $659.5 million aggregate principal amount of variable rate indebtedness under the senior secured credit facilities of which $200 million is fixed with an interest rate swap. A 100 basis point increase in interest rates over our floor(s) on our debt balances outstanding as of December 31, 2016 under the senior secured credit facilities would increase our annual interest expense by approximately $4.6 million when taking into consideration the referenced fixed interest rate swap.
We rely on our systems, employees and certain
suppliers and counterparties, and certain failures could materially adversely affect our operations.
Many of our services are based on sophisticated software, technology and computing systems, and we may encounter delays when developing new technology solutions and services. Further, the technology solutions underlying our services have occasionally contained, and may in the future contain, undetected errors or defects when first introduced or when new versions are released. In addition, we may experience difficulties in installing or integrating our technologies on platforms used by our customers.
Our businesses are dependent on our ability to reliably process, record and monitor a large number of transactions. For example, we settle funds on behalf of financial institutions, other businesses and consumers and process funds transactions from clients, card issuers, payment networks and consumers on a daily basis for a variety of transaction types. Transactions facilitated by us include debit card, credit card, electronic bill payment transactions, ACH payments, electronic benefits transfer transactions and check clearing that supports consumers, financial institutions and other businesses. These payment activities rely upon the technology infrastructure that facilitates the verification of activity with counterparties, the facilitation of the payment and, in some cases, the detection or prevention of fraudulent payments. If any of our financial, accounting, or other data processing systems or applications fail or haveexperience other significant shortcomings or limitations, weour ability to serve our clients and accordingly our results of operations could be materially adversely affected. Such failures or shortcomings could be the result of events that are wholly or partially beyond our control, which may include, for example, computer viruses, fires, electrical or telecommunications outages, natural disasters, disease pandemics, terrorist acts or other unanticipated damage to property or physical assets. Any such failure or shortcoming could also damage our reputation, require us to expend significant resources to correct the defect, and may result in liability to third parties, especially since some of our contractual agreements with financial institutions require the crediting of certain fees if our systems do not meet certain specified service levels.
Although we have taken steps to protect against data loss and system failures, there is still risk that we may lose critical data or experience system failures. We perform the vast majority of disaster recovery operations ourselves, though we utilize select third parties for some aspects of recovery. To the extent we outsource our disaster recovery, we are at risk of the vendor’s unresponsiveness in the event of breakdowns in our systems. Furthermore, our property and business interruption insurance may not be adequate to compensate us for all losses or failures that may occur.
We are similarly dependent on our employees.
WeOur operations could be materially adversely affected if one
of ouror more employees
causescause a significant operational breakdown or failure, either
intentionally or as a result of human
error or where an individual purposefully sabotages or fraudulently manipulates our operations or systems. Thirderror. Suppliers and third parties with which we do business could also be
sources of operational risk to us, including relating to breakdowns or failures of such parties’ own systems or employees. Any of these occurrences could diminish our ability to operate one or more of our businesses, or result in potential liability to clients, reputational damage and regulatory intervention or fines, any of which could materially adversely affect us.
Weour financial condition or results of operations.
In December 2019, a strain of coronavirus surfaced in Wuhan, China and resulted in an outbreak with infections throughout China and abroad, which has affected operations and global supply chains. During the first months of 2020, we were notified of potential delays in the delivery of POS devices from suppliers whose operations have been affected by the coronavirus. At this time, the coronavirus has not caused major disruptions to our operations, nor has it affected our employees or client base. However, if the coronavirus outbreak continues to spread and becomes a global pandemic, it may be subjectaffect our employees, our clients and our suppliers in ways which could materially adversely affect our financial condition or results of operations.
Laws and regulations regarding the handling of personal data and information may impede our services or result in increased costs, legal claims, or fines against us.
Our business relies on the processing of data in multiple jurisdictions and the movement of data across national borders. Legal requirements relating to
disruptionsthe collection, storage, handling, use, disclosure, transfer, and security of
our operating systems arising from events that are wholly or partially beyond our control, which may include, for example, computer viruses or electrical or telecommunications outages, natural disasters, disease pandemics or other unanticipated damagepersonal data continues to
property or physical assets. Such an incident occurred on January 9, 2016, when our payments network suffered a two hour interruption of service. Such disruptions may give rise to lossesevolve, and regulatory scrutiny in
service to customers and loss or liability to us. In addition, therethis area is
increasing around the
risk that our controls and proceduresworld. Significant uncertainty exists as
well as business continuityprivacy and data
protection laws may differ from country to country and may create inconsistent or conflicting requirements. Our ongoing efforts to comply with privacy, cybersecurity, and data protection laws may entail expenses, may divert resources from other initiatives and projects, and could limit the services we are able to offer. Enforcement actions and investigations by regulatory authorities related to data security
systems prove to be inadequate. Any such failureincidents and privacy actions or investigations could
affect our operations, damage our reputation and
materially adversely affectimpact us through increased costs or restrictions on our
results of operations by requiring us to expendbusiness, and noncompliance could result in regulatory penalties and significant
resources to correct the defect, by causing a loss of confidence in our services that leads to a decrease in use of our services, and by exposing us to litigation, regulatory fines, penalties or other sanctions or losses not covered by insurance.legal liability.
If our amortizable intangible assets or goodwill become impaired, it may adversely affect our financial condition and operating results.
If our amortizable intangible assets or goodwill were to become impaired, we may be required to record a significant charge to earnings. Under theU.S. generally accepted accounting principles in the United States of America (“GAAP”), definitive useful life intangibles are evaluated periodically for impairment when events or changes in circumstances indicate that the carrying amount may not be recoverable.
Goodwill is tested for impairment at least annually.
The goodwill impairment evaluation process requires us to make estimates and assumptions with regards to the fair value of our reporting units. Actual values may differ significantly from these estimates. Such differences could result in future impairment of goodwill that would, in turn, negatively impact our results of operations and the reporting unit where the goodwill is recorded.
For 2016, the Company used a “qualitative assessment” option or “step zero” for the goodwill impairment test for all of its reporting units. With this process, the Company first assesses whether it is “more likely than not” that the fair value of a reporting unit is less than its carrying amount. If the answer is no, then the fair value of the reporting unit does not need to be measured, and step one and step two are bypassed. In assessing the fair value of a reporting unit, which is based on the nature of the business and reporting unit’s current and expected financial performance, the Company uses a combination of factors such as general macroeconomic conditions, industry and market conditions, overall financial performance and the entity and reporting unit specific events. In 2016, step one and step two were bypassed for all reporting units.
Our risk management procedures may not be fully effective in identifying or helping us mitigate our risk exposure against all types of risks.
We operate in a rapidly changing industry, and we have experienced significant change in the past
fourten years, including our separation from Popular following the Merger, our initial public offering in April 2013 and our listing on the New York Stock Exchange (“NYSE”). Accordingly, we may not be fully effective in identifying, monitoring and managing our risks. In some cases, the information we use to perform our risk assessments may not be accurate, complete or up-to-date. In other cases, our risk assessments may depend upon information that we may not have or cannot obtain. If we are not fully effective or we are not always successful in identifying all risks to which we are or may be exposed, we could be subject to losses, penalties, litigation or regulatory actions that could harm our reputation or have a material adverse effect on our business, financial conditions and results of operations.
Security
We are subject to security breaches or
other confidential data theft from our
own failure to comply with privacy regulationssystems, which can adversely affect our reputation and
industry security requirements imposed on providers of services to financial institutions and card processing services could harm our business by disrupting our delivery of services and damaging our reputation.business.
As part of our business, we electronically receive, process, store and transmit a wide range of confidential information, including sensitive businesscustomer information of our customers. In addition, we collectand personal consumer data, such as names and addresses, social security numbers, driver’s license numbers, cardholder data and payment history records. We also operate payment, cash access and electronic card systems. Attacks on information technology systems continue to grow in frequency, complexity and sophistication, a trend we expect will continue. The uninterrupted operationobjectives of our informationthese attacks include, among other things, gaining unauthorized access to systems to facilitate financial fraud, disrupt operations, cause denial of service events, corrupt data, and the confidentialitysteal non-public information. Such attacks have become a point of the customer/consumer information that resides on such systems are critical to the successful operations of our business. focus for individuals, businesses and governmental entities.
Despite the safeguards we have in place, unauthorized access to our computer systems or databases could result in the theft or publication of confidential information, the deletion or modification of records or could otherwise cause interruptions in the successful operations of our operations.businesses. These risks are increased when we transmit information over the Internet. OurInternet as our visibility in the global payments industry may attract hackers to conduct attacks on our systems that could compromisesystems. Our security measures may also be breached due to the security of our data or could cause interruptions in the operations of our businesses and subject us to increased costs, litigation and other liabilities. There is also a possibility of mishandling or misuse of information; for example, if such information were erroneously provided to parties who are not permitted to have the information, either by fault of our systems, employees acting contrary to our policies or whereas a result of a fault in our systems.
Actual or perceived vulnerabilities or data breaches may lead to claims against us, which may require us to spend significant additional resources to remediate by addressing problems caused by breaches and further protect against security or privacy breaches. Additionally, while we maintain insurance policies specifically for cyber-attacks, our current insurance policies may not be adequate to reimburse us for losses caused by security breaches, and we may not be able to collect fully, if at all, under these insurance policies. A significant security breach, such
information is intercepted or otherwise improperly taken by third parties. An information breach in the system andas loss of
confidential information such as credit card numbers and related information, could have a
longer and more significant impactmaterial adverse effect on
the business operations than a hardware failureour reputation and could result in
claims against us for misusea loss of
personal information, such as identity theft.Additionally, ascustomers throughout the years. Some of our systems have experienced past security breaches and, although they did not have a providermaterial adverse effect on our operating results or reputation, there can be no assurance of services to financial institutions, such as card processing services, we are subject directly (or indirectly through our clients) to the same laws, regulations, industry standards and limitations on disclosure of the information we receive from our customers that apply to the customers themselves. If we fail to comply with these regulations, standards and limitations, we could be exposed to claims for breach of contract, fines, governmental proceedings, or prohibitions on card processing services. In addition, as more restrictive privacy laws, rules or industry security requirements are adopteda similar result in the future on the federalfuture. We cannot assure you that our security measures will prevent security breaches or local level or by a specific industry body, the change could have an adverse impact on us through increased costs or restrictions on business processes. We may be required to expend significant capital and other resources to comply with mandatory privacy and security standards required by law, industry standards or contracts.
Any inabilitythat failure to prevent security or privacy breaches or failure to comply with privacy regulations and industry security requirements could cause our existing customers to lose confidence in our systems and terminate their agreements with us, and could inhibit our ability to attract new customers, damage our reputation and/or adversely impact our relationship with administrative agencies.
We may experience breakdowns in our processing systems that could damage customer relations and expose us to liability.
We depend heavily on the reliability of our processing systems in our core businesses. A system outage or data loss, regardless of reason, couldthem will not have a material adverse effect on our business, results of operations, financial condition and resultsreputation. In addition, any breaches of operations. Not only would we suffer damage to our reputation in the event of a system outagenetwork or data loss, but we may also be liable to third parties. Some ofsecurity at our contractual agreements with financial institutions require the crediting of certain fees if our systems do not meet certain specified service levels. To successfully operate our business, we must be able to protect our processing and other systems from interruption, including from events that may be beyond our control. Events that could cause system interruptions include, but are not limited to, fire, natural disasters, telecommunications failure, computer viruses, terrorist acts and war. Although we have taken steps to protect against data loss and system failures, there is still risk that we may lose critical datacustomers, partners or experience system failures. We perform the vast majority of disaster recovery operations ourselves, though we utilize select third parties for some aspects of recovery. To the extent we outsource our disaster recovery, we are at risk of the vendor’s unresponsiveness in the event of breakdowns in our systems. Furthermore, our property and business interruption insurance may not be adequate to compensate us for all losses or failures that may occur.
Lack of system integrity, fraudulent payments or credit quality related to funds settlement could result in a financial loss.
We settle funds on behalf of financial institutions, other businesses and consumers and process funds transactions from clients, card issuers, payment networks and consumers on a daily basis for a variety of transaction types. Transactions facilitated by us include debit card, credit card, electronic bill payment transactions, ACH payments, electronic benefits transfer transactions and check clearing that supports consumers, financial institutions and other businesses. These payment activities rely upon the technology infrastructure that facilitates the verification of activity with counterparties, the facilitation of the payment and, in some cases, the detection or prevention of fraudulent payments. If the continuity of operations, integrity of processing, or ability to detect or prevent fraudulent payments were compromised this could result in a financial loss to us.
We may experience defects, development delays, installation difficulties, system failure, or other service disruptions with respect to our technology solutions, which would harm our business and reputation and expose us to potential liability.
Many of our services are based on sophisticated software, technology and computing systems, and we may encounter delays when developing new technology solutions and services. Further, the technology solutions underlying our services have occasionally contained and may in the future contain undetected errors or defects when first introduced or when new versions are released. In addition, we may experience difficulties in installing or integrating our technologies on platforms used by our customers. Finally, our systems and operations could be exposed to damage or interruption from fire, natural disaster, power loss, telecommunications failure, unauthorized entry and computer viruses or other cyber-attacks. Attacks on information technology systems continue to grow in frequency, complexity and sophistication, a trend we expect will continue. Such attacks have become a point of focus for individuals, businesses and governmental entities. The objectives of these attacks include, among other things, gaining unauthorized access to systems to facilitate financial fraud, disrupt operations, cause denial of service events, corrupt data, and steal non-public information.
As part of our business, we electronically receive, process, store and transmit a wide range of confidential information, including sensitive customer information and personal consumer data. We also operate payment, cash access and electronic card systems. A successful cyber-attack on our system could result in: (1) interruption of business operations; (2) delay in market acceptance; (3) additional development and remediation costs; (4) diversion of technical and other resources; (5) loss of customers; (6) negative publicity and loss of reputation; or (7) exposure to liability claims.
Any one or more of the foregoingvendors could have a material adverse effect on our business, financial condition and results of operations.
similar negative effects.
The ability to adopt technology to changing industry and customer needs or trends may affect our competitiveness or demand for our products, which may adversely affect our operating results.
Changes in technology may limit the competitiveness of and demand for our services. Our businesses operate in industries that are subject to technological advancements, developing industry standards and changing customer needs and preferences. Also, our customers continue to adopt new technology for business and personal uses. We must anticipate and respond to these industry and customer changes in order to remain competitive within our relative markets. Our inability to respond to new competitors and technological advancements could impact all of our businesses. For example, the ability to adopt technological advancements surrounding POS technology available to merchants could have an impact on our merchant acquiring business.
Consolidations in the banking and financial services industry could adversely affect our revenues by eliminating existing or potential clients and making us more dependent on a more limited number of clients.
In recent years, there have been a number of mergers and consolidations in the banking and financial services industry. Mergers and consolidations of financial institutions reduce the number of our clients and potential
clients, which could adversely affect our revenues. Further, if our clients fail or merge with or are acquired by other entities that are not our clients, or that use fewer of our services, they may discontinue or reduce their use of our services. It is also possible that the larger banks or financial institutions resulting from mergers or consolidations would have greater leverage in negotiatingto negotiate terms withless favorable to us or could decide to perform in-house some or all of the services which we currently provide or could provide. Any of these developments could have a material adverse effect on our business, financial condition and results of operations.
We are subject to the credit risk that our merchants will be unable to satisfy obligations for which we may also be liable.
We are subject to the credit risk of our merchants being unable to satisfy obligations for which we also may be liable. For example, as the merchant acquirer, we are contingently liable for transactions originally acquired by us that are disputed by the cardholder and charged back to the merchants. For certain merchants, if we are unable to collect this amountamounts paid to cardholders in the form of refunds or chargebacks from the merchant, due to the merchant’s insolvency or other reasons, we will bear the loss for the amount of the refund or chargeback paid to the cardholder.those amounts. Notwithstanding our adherence to
industry standards with regards to the acceptance of new merchants and certain steps to screen for
merchant credit risk,
it is possible that a default on
suchpayment obligations by one or more of our merchants could have a material adverse effect on our business.
We depend on our payment processing clients to comply with their contractual obligations, as well as any applicable laws, regulatory requirements and credit card associations rules or standards.
Our contracts with our payment processing clients generally require that they comply with all applicable laws and regulatory requirements, as well as any applicable credit card associations rules or standards. A client’s failure to comply with any such laws or requirements could force us to declare a breach of contract and terminate the client relationship. The termination of such contracts or relationships, as well as any inability to collect any damages caused, could have a material adverse effect on our business, financial condition and results of operations. Additionally, any such failure by clients to comply could also result in fines, penalties or obligations imputed to EVERTEC, which could also have a material adverse effect on our business.
Increased competition
or changes in consumer spending or payment preferences could adversely affect our business.
A decline in the market for our services either as a result of increased competition a decrease in consumer spending or a shift in consumer payment preferences, could have a material adverse effect on our business. We may face increased competition in the future as new companies enter the market and existing competitors expand their services. Some of these competitors could have greater overall financial, technical and marketing resources than us, which could enhance their ability to finance acquisitions, fund internal growth and respond more quickly to professional and technological changes. Some competitors could have or may develop a lower cost structure. New competitors or alliances among competitors could emerge, resulting in a loss of business for us and a corresponding decline in revenues and profit margin. Further, if
Changes in consumer spending or payment preferences could adversely affect our business.
A decline in the market for our services, either as a result of continued migration of Puerto Ricans to the U.S. mainland, a further deterioration in the Puerto Rico economy, a decrease in consumer spending or a shift in consumer payment preferences, could have a material adverse effect on our business. If consumer confidence decreases in a way that adversely affects consumer spending, whether in conjunction with a global economic downturn or otherwise, we could experience a reduction in the volume of transactions we process. In addition, if we fail to respond to changes in technology or consumer payment preferences, we could lose business.
There may be a change in the use of cards as a payment mechanism or adverse developments with respect to card industry in general.
If the number of electronic and digital payment transactions of the type we process does not continue to grow or if businesses or consumers do not continue to adopt our services, it could have a material adverse effect on the profitability of our business,
financial position and results of operations. We believe future growth in the use of credit, debit and other electronic and digital payments will be driven by the cost, ease-to-use, and quality of products and services offered to
competitors.customers and businesses. In order to consistently increase and maintain our profitability, businesses and consumers must continue to use electronic and digital payment methods that we process, including credit and debit cards.
Changes in credit card association or other network rules or standards could adversely affect our business.
In order to provide our transaction processing services, several of our subsidiaries are registered with or certified by Visa, Discover and MasterCard and other networks as members or as service providers for member institutions. As such, we and many of our customers are subject to card association and network rules that could subject us or our customers to a variety of fines or penalties that may be levied by the card associations or networks for certain acts or omissions by us, acquirer customers, processing customers and merchants. Visa, Discover, MasterCard and other networks, some of which are our competitors, set the standards with
respect to which we must comply. The termination of Banco Popular’s or our subsidiaries’ member registration or our subsidiaries’ status as a certified service provider, or any changes in card association or other network rules or standards, including interpretation and implementation of the rules or standards, that increase the cost of doing business or limit our ability to provide transaction processing services to or through our customers, could have an adverse effect on our business, operating results and financial condition.
Changes in interchange fees or other fees charged by card associations and debit networks could increase our costs or otherwise adversely affect our business.
From time to time, card associations and debit networks change interchange, processing and other fees, which could impact our merchant acquiring and payment
processingservices businesses.
It is possible that competitiveCompetitive pressures
will could result in our merchant acquiring and payment processingservices businesses absorbing a portion of such increases in the future, which would increase our operating costs, reduce our profit margin and adversely affect our business, operating results and financial condition.
Our revenues from the sale of services to merchants that accept Visa, Discover and MasterCard cards are dependent upon our continued Visa, Discover and MasterCard registration and financial institution sponsorship.
In order to provide our Visa, Discover and MasterCard transaction processing services, we must be registered as a merchant processor of Visa, Discover and MasterCard. These designations are dependent upon our being sponsored by member banks of those organizations. If our sponsor banks should stop providing sponsorship for us, we would need to find another financial institution to serve as a sponsor, which could prove to be difficult and/or more expensive. If we are unable to find a replacement financial institution to provide sponsorship we may no longer be able to provide processing services to the affected customers which would negatively impact our revenues and earnings.
For purposes of the
BHCBank Holding Company Act
for as long asof 1956 (the “BHC Act”), to the extent that we are deemed to be controlled by Popular, we will be subject to
regulation, supervision and examination by
the U.S.
federal banking regulators,Federal Reserve Board, and our activities will be limited to those permissible
for Popular. Furthermore, as a technology service provider to regulated financial institutions, we are subject to additional regulatory oversightunder the BHC Act and
examination. As a regulated institution, werelated regulations. We may be required to obtain regulatory approval before engaging in certain new activities or businesses, whether organically or by acquisition.
For so long as
To the extent that we are
deemed to be a “subsidiary” of Popular for purposes of the Bank Holding Company Act of 1956 (the “BHC Act”), in other words deemed to be controlled by Popular
pursuant to regulation and guidance under the BHC Act, we will be subject to regulation,
supervision and
supervisionexamination by the Federal Reserve Board. The BHC Act defines “control” differently than
GAAP. AsGAAP, and “control” can be found based on a
deemed subsidiary, we may conduct only those activities that are authorized for our deemed parent, which depend on whether it is treated as a bank holding company or a financial holding company. The activities that are permissible for subsidiariesvariety of
bank holding companies are those that are treated as closely related to banking; those that are permissible for subsidiaries of financial holding companies generally include activities that are financial in nature or complementary to financial activities. In addition, we are subject to regulatory oversightfacts and
examination by the Federal Financial Institution Examination Council because we are a technology service provider to regulated financial institutions, including Banco Popular.circumstances.
New lines of business, other new activities
and acquisitions that we may wish to commence or undertake in the future,
andincluding the manner in which we conduct our business
or may undertake such activities or acquisitions, may not be permissible for us under the BHC Act,
the Federal Reserve Board’s Regulation K or other
relevantapplicable U.S. federal banking laws or may require the approval of the Federal Reserve Board or
any otheranother applicable U.S. federal banking regulator. In addition,
dealspotential acquisitions may take longer, be more costly, or make us less attractive as a buyer.
Additional regulatory requirements may be imposed if Popular is subject to any enforcement action. More generally, the Federal Reserve Board has broad powers to approve, deny or refuse to act upon applications or notices submitted by Popular on our behalf with respect to new activities, the acquisition of businesses or assets, or the reconfiguration of existing operations. Any such action by the Federal Reserve Board may also depend on our ability to comply with the standards imposed by our regulators. There can be no assurance that any required regulatory approvals will be
obtained. In addition, further restrictions placedobtained, or that they will be obtained without regulatory conditions. Additional regulatory requirements may be imposed on
our activities or acquisitions to the extent we are controlled by Popular
as a result ofand Popular is subject to any supervisory or enforcement
actions may restrict us or our activities in certain circumstances,action, even if
thesethe supervisory actions are unrelated to
conductus or to our business.
As a technology service provider to regulated financial institutions, we are subject to additional regulatory oversight and examination.
In general, financial institution regulators require their supervised institutions to cause their service providers to agree to certain terms and to agree to supervision and oversight by applicable financial regulators, primarily to protect the safety and soundness of the financial institution. We have agreed to such terms and provisions in many of our service agreements with financial institutions. In particular, we are subject to regulatory oversight and examination by applicable U.S. federal regulators as a technology service provider to regulated U.S. financial institutions, including Banco Popular.
Changes in laws, regulations and enforcement activities may adversely affect the products and services we provide and markets in which we operate.
We and our customers are subject to U.S. federal, Puerto Rico and other countries’ laws, rules and regulations that affect the electronic payments industry. Our customers are subject to numerous laws, rules and regulations applicable to banks, financial institutions, processors and card issuers in the United States and abroad. We are
subject to regulation because of our activities in the countries where we carry them out and because of our relationship with Popular, and at times we are also affected by the laws, rules and regulations to which our customers are subject. Failure to comply with any of these laws, rules and regulations may result in the suspension or revocation of licenses or registrations, the limitation, suspension or termination of service,one or more of the services we provide, and/or the imposition of civil and criminal penalties, including fines, all of which could have an adverse effect on our financial condition. In addition, even an inadvertent failure by us to comply with laws, rules and regulations, as well as rapidly evolving social expectations of corporate fairness, could damage our reputation or brands.
Regulation of the electronic payment card industry, including regulations applicable to us and our customers, has increased significantly in recent years. There is also
increasingcontinued scrutiny by the U.S. Congress of the manner in which payment card networks and card issuers set various fees, from which some of our customers derive significant revenue.
For example, on July 21, 2010, the Dodd-Frank Act was signed into law in the United States. The Durbin Amendment contains requirements relating to payment card networks. To implement this provision, the Federal Reserve adopted rules which took effect on October 1, 2011 and April 1, 2012. These rules, among other things, place certain restrictions on the interchange transaction fees that a card issuer can receive for an electronic debit transaction originated at a merchant and also places various exclusivity prohibitions and routing requirements on such transactions. To date, the Durbin Amendment has had mixed implications for our business, but the overall net impact has been positive due to lower interchange costs improving the overall margins of the business. However, we cannot assure you that this trend will continue, and we believe that any future impact (positive or negative) resulting from the Durbin Amendment and subsequent developments is uncertain due to the competitive landscape in which we operate. Further, banking regulators have been strengthening their examination guidelines with respect to relationships between banks and their third-party service providers, such as
EVERTEC.us. Any such heightened supervision of our relationship with Popular could have an effect on our contractual relationship with Popular as well as on the standards applied in the evaluation of our services. See “Item 1.
Business—GovernmentBusiness-Government Regulation and Payment Network
Rules—RegulatoryRules-Regulatory Reform and Other Legislative Initiatives.”
Further changes to laws, rules and regulations, or interpretation or enforcement thereof, could have a negative financial effect on us. We have structured our business in accordance with existing tax laws and interpretations
The Government of
such laws. Changes in tax laws or their interpretations could decreasePuerto Rico’s fiscal crisis continues. The expiration of the
valueautomatic stay on litigation to collect claims against the Government on May 1, 2017, the initiation of
revenues we receivecreditor litigation promptly thereafter and the
amountGovernment’s filing for bankruptcy protection on May 3, 2017, are all expected to further slow the Puerto Rico economy, increase emigration from Puerto Rico, increase the risk of
our cash flownon-payment of Government obligations and
negatively affect the economy and consumer spending, which could have a material adverse
impacteffect on our
business.Our business concentration in Puerto Rico and the trading price of our business with the government of Puerto Rico expose us to significant risks.
common stock.
For the
fiscal years ended December 31,
20162019 and
2015,2018, approximately
84%81% and
86%79%, respectively, of our total revenues were generated from our operations in Puerto Rico. In addition, some revenues that are generated from our operations outside Puerto Rico are dependent upon our operations in Puerto Rico. As a result, our financial condition and results of operations are highly dependent on the economic and political conditions in Puerto Rico, and could be significantly
adversely impacted by adverse economic or political developments in Puerto Rico.
In 2016, the government of Puerto Rico was our second largest customer representing approximately 7% of our total revenues. Revenues from the government of Puerto Rico come from numerous agencies and public corporations. We believe a substantial portion of the services we provide to the government of Puerto Rico are mission-critical or essential. Some of the government-sponsored initiatives we provide are indirectly funded in part by U.S. federal government programs. The government of Puerto Rico is currently experiencing a fiscal crisis (as described further in the following risk factor). A federal law adopted in June 2016 creates an Oversight Board with broad budgetary and financial powers over Puerto Rico’s budget, laws, financial plans and regulation, and imposes an automatic temporary stay on all litigation against Puerto Rico and its instrumentalities to enforce or collect claims against the Puerto Rico government. If the Puerto Rico government defaults in payment, delays or withholds payment to us, we may not be able to enforce our claims against the government until the stay is lifted and may not be able to recover the full amount on the receivables due to us. In addition, the Puerto Rico
government may elect not to renew contracts for our services, or the Oversight Board may decide not to approve the budget for them. While we believe that the government of Puerto Rico will continue to engage our services despite the challenging financial situation it is currently facing, a failure of the government to do so or the Oversight Board to approve the required budget could have a material adverse impact on our financial condition and results of operations.
In addition, severe weather conditions that are prevalent in tropical climates and other natural disasters, could negatively affect, among other things, our ability to provide services, as well as our physical locations, property and equipment, and could have a material adverse effect on our financial condition and results of operations.
A prolongation of the Government of Puerto Rico’s fiscal crisis, or worsening of the crisis, could slow the Puerto Rico economy, delay Government payments and negatively affect consumer spending.
The Commonwealth of Puerto Rico has been in economic recession since 2006. In August 2015, the governmentPuerto Rico defaulted for the first time on the Public Finance Corporation bonds. In April 2016, the Puerto Rico governor signed a debt moratorium law that gave the governor emergency powers to deal with the fiscal crisis, including the ability to declare a moratorium on any debt payment. On June 30, 2016, the U.S. President signed into law the Puerto Rico Oversight, Management and Economic Stability Act (PROMESA). PROMESA establishes a fiscal oversight and management board (the “Oversight Board”) comprised of seven voting members appointed by the President. The Oversight Board was constituted in September of 2016, has broad budgetary and financial powers over Puerto Rico’s budget, laws, financial plans and regulations, including the power to approve restructuring agreements with creditors, file petitions for restructuring and reform the electronic system for the tax collection. The Oversight BoardPROMESA also has ultimate authority in preparing the Puerto Rico government’s budget and any issuance of future debt by the government and its instrumentalities. In addition, PROMESA imposesimposed an automatic stay on all litigation against Puerto Rico and its instrumentalities, as well as any other judicial or administrative actions or proceedings to enforce or collect claims against the Puerto Rico government. This
On May 1, 2017, the automatic stay is currently in effect up toimposed by PROMESA expired and creditors of the Puerto Rico government filed various lawsuits involving defaults on more than $70 billion of bonds issued by Puerto Rico. On May 3, 2017, Puerto Rico filed for bankruptcy-like protection under Title III of PROMESA.
While the Title III filing does not foreclose negotiations between creditors and the Puerto Rico government toward a consensual restructuring agreement, there can be extendedno assurance that meaningful negotiations will occur or that any consensual agreement will be reached or by what date. Importantly, there also can be no assurance as to the financial outcome or timing of
the completion of the Title III processes. There also can be no assurance as to any favorable intervention by the Oversight BoardU.S. Congress or the U.S. District CourtPresident.
The invocation of
Title III is expected to potentially deepen Puerto
Rico.As long asRico’s economic recession, and to further curtail the fiscal crisis endures,ability of the Commonwealth of Puerto Rico and its instrumentalities, subject to the oversight of the Oversight Board (collectively, the “Government”), may be unable to access the capital markets to place new debt or roll its upcoming maturities, andfuture maturities. Additionally, potential Government actions such as further reductions in spending or the Government may reduce spending, imposeimposition of new taxes may further deepen the current economic crisis, lead to an increase in unemployment rates, and take other actions which could slowresult in a continued decline in population and in the economy. A prolonged recession
Over the past several months, the Oversight Board released and has been working on a restructuring plan intended to reduce Puerto Rico’s debt to sustainable levels and provide a path for Puerto Rico to exit the bankruptcy-like protections under PROMESA. This was an important milestone, but the most recent version of the plan is facing legal and political challenges from various sectors. The final plan will require the approval from the judge overseeing the case. At this point, it is uncertain if or future fiscal measures may negativelywhen a restructuring plan will get approved or when Puerto Rico will resolve its current debt situation.
Such recent events could potentially adversely impact
the trading price of our
business. The continuing challenging economic environment could affectcommon stock, adversely impact our customer base, depress general consumer spending and
lengthendelay the Government’s payments thus increasing our Government accounts
receivables; these outcomes, if realized,receivables, and potentially impair the collectability of those accounts receivable, all of which, individually or in the aggregate, could
potentially have a material adverse effect on our business, financial condition and results of operations.
At December 31, 2016, the Company has no direct exposure to the Government’s debt obligations, including those of its instrumentalities or municipalities. The Company has accounts receivable with the Puerto Rico government and its agencies amounting to $18.0 million as As of December 31, 2016 down2019, we had net receivables of $8.9 million from $18.4 millionPuerto Rico and certain public corporations.
Puerto Rico's economy, including its governmental financial crisis and the continuing effects of Hurricanes Irma and Maria and other natural disasters including recent earthquakes could have a prolonged negative impact on the countries in which we operate and a material adverse effect on our business and results of operations.
Puerto Rico’s location in the Caribbean exposes the island to increased risk of hurricanes and other severe tropical weather conditions and natural disasters. Hurricanes Irma and Maria and other natural disasters including the recent earthquakes, and their aftermaths, such as
the widespread power outage in Puerto Rico, the damage to infrastructure and communications networks, and the temporary cessation and slow pace of
December 31, 2015.Therereestablishment of regular day-to-day commerce, have severely impacted the economies of Puerto Rico and the Caribbean. It is unknown how long it will take for the business communities, resident populations and the economies to fully recover. Puerto Rico’s current situation following Hurricane Maria could further accelerate the ongoing emigration trend of Puerto Rico residents to the United States. A prolonged delay in the repairs to the islands’ infrastructures, decline in business volume and any other economic declines due to Hurricanes Irma and Maria and their aftermaths may impact demand for our services and could have a material adverse effect on our business and results of operations.
As a result of Puerto Rico's governmental financial crisis and the impacts of natural disasters, businesses may be reluctant to establish or expand their operations in Puerto Rico and the Caribbean, or might consider closing operations currently in such locations. The damage resulting from the hurricanes or other natural disasters to the operating conditions of our clients, and insufficient federal recovery and rebuilding assistance may cause lasting and severe damage to the island's economic base. The high cost of electricity, combined with Puerto Rico's high level of debt, may make Puerto Rico a less attractive place to expand existing operations or commence new business activities. In the event that companies in the financial services and related industries decide not to commence new operations or not to expand their existing operations in Puerto Rico, or consider closing operations in Puerto Rico, the demand for our services could be negatively affected.
Our presence in international markets includes operations in several Latin American and Caribbean countries. Although we have contingency plans in effect for natural disasters or other catastrophic events, the occurrence of a natural disaster such as, but not limited to, earthquakes, landslides, hurricanes, tornadoes, tsunamis, volcanic activity, droughts and floods, could still disrupt our operations outside the United States and Puerto Rico. For example, we conduct business in Chile, a country that is particularly susceptible to earthquakes. Any natural disaster or catastrophic event in the countries in which we do business could adversely affect our business, results of operations and financial condition.
We are
exposed to risks associated with our presence in international markets, including political or economic instability.
Our financial performance may be significantly affected by general economic, political and social conditions in the emerging markets where we operate. Many countries in Latin America have suffered significant economic, political and social crises in the past, and these events may occur again in the future. Instability in Latin America has been caused by many different factors, including:
exposure to foreign exchange variation;
significant governmental influence over local economies;
substantial fluctuations in economic growth;
high levels of inflation;
exchange controls or restrictions on expatriation of earnings;
high domestic interest rates;
wage and price controls;
changes in governmental economic or tax policies;
imposition of trade barriers;
unexpected changes in regulation which may restrict the movement of funds or result in the deprivation of contract rights or the taking of property without fair compensation;compensation
terrorist attacks and other acts of violence or war; and
overall political, social and economic instability.
Adverse economic, political and social conditions in the Latin America markets where we operate may create uncertainty regarding our operating environment, which could have a material adverse effect on our
company.results of operations.
Our business in countries outside the United States and transactions with foreign governments increase our compliance risks and exposes us to business risks.
Our operations outside the United States could expose us to trade and economic sanctions or other restrictions imposed by the United States or other local governments or organizations.
The U.S. DepartmentsIn foreign countries in which we have operations, a risk exists that our associates, contractors or agents could, in contravention of
the Treasury and Justice (the “Agencies”), the SEC and other federal agencies and authorities have a broad range of civil and criminal penalties they may seek to impose against corporations and individuals for violations of economic sanctions laws, the FCPA and other federal statutes. Under economic sanctions laws, the Agencies may seek to impose modifications toour policies, engage in business practices
prohibited by U.S. laws and regulations applicable to us, such as the Foreign Corrupt Practices Act ("FCPA"). We have existing safeguards in place designed to ensure compliance with these laws and regulations. Nevertheless, we remain subject to the risk that one or more of our associates, contractors or agents, including
cessationthose based in or from countries where practices that violate such U.S. laws and regulations or the laws and regulations of
other countries may be customary, will engage in business
activities involving sanctioned countries,practices that are prohibited by our policies and,
modifications to compliance programs, which may increase compliance costs.by doing so, violate such laws and regulations. Any such violations, even if prohibited by our internal policies, could adversely affect our business, operating results, financial condition and reputation and result in severe criminal or civil sanctions. In addition, we are also subject to compliance with local government regulations.
If any of the risks described above materialize, it could adversely impact our business, operating results and financial condition.These regulations also prohibit improper payments or offers of payments to foreign governments and their officials and political parties by the United States and other business entities for the purpose of obtaining or retaining business. We have operations and deal with government entities and financial institutions in countries known to experience corruption, particularly certain emerging countries in Latin America, and further international expansion may involve more of these countries. Our activities in these countries create the risk of unauthorized payments or offers of payments by one of our employees or consultants that could be in violation of various laws including the FCPA, even though these parties are not always subject to our control. Our existing safeguards and any future improvements may prove to be less than effective, and our employees or consultants may engage in conduct for which we may be held responsible. Violations of the FCPA may result in severe criminal or civil sanctions, and we may be subject to other liabilities, which could negatively affect our business, operating results and financial condition.
We are also subject to the Export Administration Regulations (“EAR”)
administered by the U.S. Department of Commerce’s Bureau of Industry and Security, which regulates the export, re-export and re-transfer abroad of covered items made or originating in the United States as well as the transfer of covered U.S.-origin technology abroad. We have adopted
an Export Management Compliance Policy, a
comprehensive compliance program
under which theto make sure our goods and technologies
that we export are
identified and classified under the EAR to make sure they are being exported in compliance with the requirements of the EAR. However, there can be no assurance that we have not violated the EAR in past transactions or that our new policies and procedures will prevent us from violating the EAR in every transaction in which we engage. Any such violations of the EAR could result in fines, penalties or other sanctions being imposed on us, which could negatively affect our business, operating results and financial condition.
Moreover, some financial institutions refuse, even in the absence of a regulatory requirement, to provide services to companies operating in certain countries or engaging in certain practices because of concerns that the compliance efforts perceived to be necessary may outweigh the usefulness of the service relationship. Our operations outside the United States make it more likely that financial institutions may refuse to conduct business with us for this type of reason. Any such refusal could negatively affect our business, operating results and financial condition.
We and our subsidiaries conduct business with financial institutions and/or card payment networks operating in countries whose nationals, including some of our customers’ customers, engage in transactions in countries that are the targets of U.S. economic sanctions and embargoes. If we are found to have failed to comply with applicable U.S. sanctions laws and regulations in these instances, we and our subsidiaries could be exposed to fines, sanctions and other penalties or other governmental investigations.
We and our subsidiaries conduct business with financial institutions and/or card payment networks operating in countries whose nationals, including some of our customers’ customers, engage in transactions in countries that are the target of U.S. economic sanctions and embargoes, including Cuba. As a U.S.-based entity, we and our subsidiaries are obligated to comply with the economic sanctions regulations administered by OFAC. These regulations prohibit U.S.-based entities from entering into or facilitating unlicensed transactions with, for the benefit of, or in some cases involving the property and property interests of, persons, governments, or countries designated by the U.S. government under one or more sanctions regimes. Failure to comply with these sanctions and embargoes may result in material fines, sanctions or other penalties being imposed on us or other governmental investigations. In addition, various state and municipal governments, universities and other
investors maintain prohibitions or restrictions on investments in companies that do business involving sanctioned countries or entities.
For these reasons, we have established risk-based policies and procedures designed to assist us and our personnel in complying with applicable U.S. laws and
regulations. Theseregulations and have in the past voluntarily submitted disclosures to OFAC in compliance with those policies and procedures when we have identified a potential violation. Our policies and procedures include the use of software to screen transactions we process for evidence of sanctioned-country and persons involvement. Consistent with a risk-based approach and the difficulties of identifying all transactions of our customers’ customers that may involve a sanctioned country, there can be no assurance that our policies and procedures will prevent us from violating applicable U.S. laws and regulations in every transaction in which we engage, and such violations could adversely affect our reputation, business, financial condition and results of operations.
Because we process transactions on behalf of
the aforementioned financial institutions through the
aforementioned payment networks, we have processed a limited number of transactions potentially involving sanctioned countries and there can be no assurances that, in the future, we will not inadvertently process such transactions. Due to a variety of factors, including technical failures and limitations of our transaction screening process, conflicts between U.S. and local laws, political or other concerns in certain countries in which we and our subsidiaries operate, and/or failures in our ability
to effectively
to control employees operating in certain non-U.S. subsidiaries, we have not rejected every transaction originating from or otherwise involving sanctioned countries, or persons and there can be no assurances that, in the future, we will not inadvertently fail to reject such transactions.
On June 25, 2010, EVERTEC Group discovered potential violations of the Cuban Assets Control Regulations (“CACR”), which are administered by OFAC, which occurred due to an oversight in the activation of screening parameters for two customers located in Haiti and Belize. Upon discovery of these potential violations, EVERTEC Group initiated an internal review and submitted an initial notice of voluntary self-disclosure to OFAC on July 1, 2010. OFAC responded to this initial report with requests for additional information. EVERTEC Group provided the information requested on September 24, 2010 in its final notice of voluntary self-disclosure, which also included information on the remedial measures and new and enhanced internal controls adopted by EVERTEC Group to avoid this situation in the future. These potential violations involved a small number of processed transactions from Cuba compared to the overall number of transactions processed for these
customers during the two-month period in which the screening failures occurred. We cannot predict the timing or ultimate outcome of the OFAC review, the total costs to be incurred in response to this review, the potential impact on our personnel, the effect of implementing any further measures that may be necessary to ensure full compliance with U.S. sanctions regulations, or to what extent, if at all, we could be subject to penalties or other governmental investigations.
Separately, on September 15, 2010, EVERTEC Group submitted an initial notice of voluntary self-disclosure to OFAC regarding certain activities of its former Venezuelan subsidiary, EVERTEC de Venezuela, C.A. (which ceased being a subsidiary of EVERTEC Group after the closing of the Merger and is now known as Tarjetas y Transacciones en Red TRANRED, C.A. (“Tranred”)) and EVERTEC Group’s Costa Rican subsidiary (which continues to be a subsidiary of EVERTEC Group after the closing of the Merger). This initial self-disclosure informed OFAC that these subsidiaries appeared to have been involved in processing Cuba-related credit card transactions that EVERTEC Group and the subsidiary believed they could not reject under governing local law and policies, but which nevertheless may not be consistent with the CACR. With respect to EVERTEC Group and its former Venezuelan subsidiary, we disclosed that they completely ceased processing Cuba-related transactions for financial institutions operating in Venezuela on September 4, 2010. We also disclosed that EVERTEC Group’s Costa Rican subsidiary completely ceased processing Cuba-related credit card transactions for financial institutions operating in Costa Rica in January 2009. In addition, it was also disclosed that EVERTEC Group’s Costa Rican subsidiary’s switch had served as a conduit through which information about Cuban-related debit card transactions was transmitted to credit card associations and issuer banks, which made the decisions to approve or reject the transactions.
On November 15, 2010, EVERTEC Group submitted its final notice of voluntary self-disclosure on these transactions to OFAC. The final report indicated the measures that we had taken to determine the amount of the credit transactions relating to Cuba that had not been rejected between 2007 and 2010. In addition, we confirmed that EVERTEC Group terminated the routing of the Cuban-related debit card transaction information through its Costa Rican subsidiary on September 30, 2010. While the credit and debit card transactions at issue represent a small proportion of the overall number of transactions processed for these financial institutions, the transactions occurred over an extended period of time.
On August 7, 2013, Popular submitted a voluntary self-disclosure to OFAC regarding certain routed debit card transactions by Tranred between October 2012 and May 2013 that may be in violation of the CACR. The voluntary self-disclosure also states that transactions constitute a small number of transactions compared to the overall number of transactions Tranred processed, and are representative of transactions that may have occurred prior to October 2010 when the entity was subject to the ownership and control of EVERTEC. We have been advised by Popular that effective May 2013, Tranred implemented a new control filter in its debit card transactions routing system to prevent the routing by Tranred of any debit card transaction originating in Cuba.
Should OFAC determine that certain activities identified in the voluntary self-disclosures described above constituted violations of the CACR, civil or criminal penalties could be assessed against EVERTEC Group and/or its subsidiary. Since November 15, 2010, there have been no communications between OFAC and EVERTEC Group regarding the transactions included in the above described voluntary self-disclosures.
Popular agreed to specific indemnification obligations with respect to all of the matters described above and certain other matters, in each case, subject to the terms and conditions contained in the Merger Agreement and/or contained in the Venezuela Transition Services Agreement, dated September 29, 2010, as amended. However, we cannot assure you that we will be able to fully collect any claims made with respect to such indemnities or that Popular and/or Tranred will satisfy its indemnification obligations to us.
Our expansion and selective acquisition strategy exposes us to risks, including the risk that we may not be able to successfully integrate acquired businesses.
As part of our growth strategy, we evaluate opportunities for acquiring complementary businesses that may supplement our internal growth. However, there can be no assurance that we will be able to identify and purchase suitable operations.
Furthermore, for as long asTo the extent that we are deemed
a “subsidiary” of a bank holding companyto be controlled by Popular for purposes of the BHC Act, we may conduct only activities authorized under the BHC Act and the Federal Reserve Board’s Regulation K and other related regulations for a bank holding company or a financial holding company. These restrictions may limit our ability to acquire other businesses or enter into other strategic transactions.
See “—For purposes of the BHC Act, for as long as we are deemed to be controlled by Popular, we will be subject to supervision and examination by U.S. federal banking regulators, and our activities are limited to those permissible for Popular. Furthermore, as a technology service provider to regulated financial institutions, we are subject to additional regulatory oversight and examination. As a regulated institution, we may be required to obtain regulatory approval before engaging in certain new activities or businesses, whether organically or by acquisition.”In addition, in connection with any acquisitions, we must comply with U.S. federal and other antitrust and/or competition law requirements.
Further, the success of any acquisition depends in part on our ability to integrate the acquired company, which may involve unforeseen difficulties and may require a disproportionate amount of our management’s attention and our financial and other resources. Although we conduct due diligence investigations prior to each acquisition, there can be no assurance that we will discover all operational deficiencies or material liabilities of an acquired business for which we may be responsible as a successor owner or operator. The failure to successfully integrate these acquired businesses or to discover such liabilities could adversely affect our operating results.
Failure to protect our intellectual property rights and defend ourselves from potential intellectual property infringement claims may diminish our competitive advantages or restrict us from delivering our services.
Our trademarks, proprietary software, and other intellectual property, including technology/software licenses, are important to our future success.
For example, the ATH trademark and trade name is recognized in Latin America and the Caribbean. Therefore, such marks represent substantial intangible assets and are important to our business. Limitations or restrictions on our ability to use such marks or a diminution in the perceived quality associated therewith could have an adverse impact on the growth of our businesses. We also rely on proprietary software and technology, including third party software that is used under licenses. It is possible that others will independently develop the same or similar software or technology, which would permit them to compete with us more efficiently. Furthermore, if any of the third party software or technology licenses are terminated or otherwise determined to be unenforceable, then we would have to obtain a comparable license, which may involve increased license fees and other costs.
Despite our efforts to protect our proprietary or confidential business know-how and other intellectual property rights, unauthorized parties may attempt to copy or misappropriate certain aspects of our services, infringe upon our rights, or to obtain and use information that we regard as proprietary. Policing such unauthorized use of our proprietary rights is often very difficult, and therefore, we are unable to guarantee that the steps we have taken will prevent misappropriation of our proprietary software/technology or that the agreements entered into for that purpose will be effective or enforceable in all instances. Misappropriation of our intellectual property or potential litigation concerning such matters could have a material adverse effect on our results of operations or financial condition. Our registrations and/or applications for trademarks, copyrights, and patents could be challenged, invalidated or circumvented by others and may not be of sufficient scope or strength to provide us with maximum protection or meaningful advantage.
If we are unable to maintain the proprietary nature of our software or technologies, we could lose competitive advantages and our businesses may be materially adversely affected. Furthermore, the laws of certain foreign countries in which we do business or contemplate doing business in the future may not protect intellectual property rights to the same extent as do the laws of the United States or Puerto Rico. Adverse determinations in judicial or administrative proceedings could prevent us fromselling our services and products, or prevent us from preventing others from selling competing services, and may result in a material adverse effect on our business, financial condition and results of operations.
If our applications or services or third party applications upon which we rely are found to infringe the proprietary rights of others, we may be required to change our business practices and may also become subject to significant costs and monetary penalties.
As our IT applications and services develop, we are increasingly subject to potential claims for intellectual property infringement, for example, patent or copyright infringement. AnyManaging any such claims,challenges, even if lackingthey lack merit, could: (i) be expensive and time-consuming to defend; (ii) cause us to cease making, licensing or using software or applications that incorporate the challenged intellectual property; (iii) require us to redesign our software or applications, if feasible; (iv) divert management’s attention and resources; and (v) require us to enter into royalty or licensing agreements in order to obtain the right to use necessary technologies. Unfavorable resolutionFurthermore, the laws of these claimscertain foreign countries in which we do business or contemplate doing business in the future may not protect intellectual property rights to the same extent as do the laws of the United States or Puerto Rico. Adverse determinations in judicial or administrative proceedings related to intellectual property or licenses could prevent us from selling our services and products, or prevent us from preventing others from selling competing services, impose liability costs on us, or result in a non-favorable settlement, all of which could result in us being restricted from delivering the related servicea material adverse effect on our business, financial condition and products, liable for damages, or otherwise result in a settlement that could be material to us.
results of operations.
The ability to recruit, retain and develop qualified personnel is critical to our success and growth.
All of our businesses function at the intersection of rapidly changing technological, social, economic and regulatory developments that requiresrequire a wide ranging set of expertise and intellectual capital. For us to successfully compete and grow, we must retain, recruit and develop the necessary personnel who can provide the needed expertise across the entire spectrum of our intellectual capital needs. In addition, we must develop our personnel to provide succession plans capable of maintaining continuity in the midst of the inevitable unpredictability of human capital. However, the market for qualified personnel is competitive and we may not succeed in recruiting additional personnel or may fail to effectively replace current personnel who depart with qualified or effective successors. Recruiting and retaining qualified personnel in Puerto Rico is particularly challenging, given the poor state of the Puerto Rican economy.economy and the increased emigration of Puerto Ricans following Hurricanes Irma and Maria. Our effort to retain and develop personnel may also result in significant additional expenses, which
could adversely affect our profitability. We cannot assure you that key personnel, including executive officers, will continue to be employed or that we will be able to attract and retain qualified personnel in the future. Failure to retain or attract key personnel could have a material adverse effect on us.
Failure to comply with U.S. state and federal antitrust requirements, or the Puerto Rico Anti-Monopoly Act, and government investigations into our compliance, could adversely affect our business.
Due to our ownership of the ATH network and our merchant acquiring and payment
processingservices business in Puerto Rico, we are involved in a significant percentage of the debit and credit card transactions conducted in Puerto Rico each day.
RegulatoryWe have in the past been subject to regulatory investigations and any future regulatory scrutiny of, or regulatory enforcement action in connection with, compliance with U.S. state and federal antitrust requirements could potentially have a material adverse effect on our reputation and business.
In February 2016, the Department of Justice of the Commonwealth of Puerto Rico announced that it initiated a formal investigation into whether we had engaged in conduct that interferes with free competition with respect to the products and services we provide within the Commonwealth of Puerto Rico and which conduct could constitute a violation of the Puerto Rico Anti-Monopoly Act, Law 77 of June 25, 1964. In August 2016, we received official confirmation that the Puerto Rico Department of Justice had formally closed its investigation and concluded that we had not engaged in such conduct. However, there can be no assurance that another such investigation will not be initiated in the future. If there is another such investigation, an adverse finding could lead to restrictions on our business, or our being required to take action, that has a materially adverse effect on our financial condition and results of operations. Any such effect, or the perception by investors as to the likelihood of such an effect, could have a material adverse effect on our stock price.
The market for our electronic commerce services is evolving and may not continue to develop or grow rapidly enough for us to maintain and increase our profitability.
If the number of electronic commerce transactions does not continue to grow or if consumers or businesses do not continue to adopt our services, it could have a material adverse effect on the profitability of our business, financial condition and results of operations. We believe future growth in the electronic commerce market will be driven by the cost, ease-of-use, and quality of products and services offered to consumers and businesses. In order to consistently increase and maintain our profitability, consumers and businesses must continue to adopt our services.
Our subsidiary, EVERTEC Group, benefits from a preferential tax exemption grant from the Puerto Rico Government under the Tax Incentive Act No. 73 of 2008 that imposes certain commitments, conditions and representations on EVERTEC Group. If EVERTEC Group does not comply with the terms of the grant, EVERTEC Group may be subject to reduction of the benefits of the grant, tax penalties, other payment obligations or full revocation of the grant, which could have a material adverse effect on our financial condition, results of operations and our stock price.
EVERTEC Group has a tax exemption grant under the Tax Incentive Act No. 73 of 2008 from the Government of Puerto Rico. Under this grant, EVERTEC Group will benefit from a preferential income tax rate of 4% on industrial development income, as well as from tax exemptions with respect to its municipal and property tax obligations for certain activities derived from its data processing operations in Puerto Rico. The grant has a term of 15 years effective as of January 1, 2012 with respect to income tax obligations and July 1, 2013 and January 1, 2013 with respect to municipal and property tax obligations, respectively.
The grant contains customary commitments, conditions and representations that EVERTEC Group
will beis required to comply with in order to maintain the grant. The more significant commitments include: (i) maintaining at least 750 employees in EVERTEC Group’s Puerto Rico data processing operations during 2012 and at least 700 employees for the remaining years of the grant, (ii) investing at least $200.0 million in building, machinery, equipment or computer programs to be used in Puerto Rico during the effective term of the grant (to be made over four year capital investment cycles in $50.0 million increments), (iii) an additional best efforts capital investments requirement of $75.0 million by December 31, 2026 (to be made over four year capital investment cycles in $20.0 million the first three increments and $15.0 million the last increment); and (iv) 80% of EVERTEC Group employees must be residents of Puerto Rico. Failure to meet the requirements could result, among other things, in reductions in the benefits of the grant, tax penalties, other payment obligations or revocation of the grant in its entirety, which could have a material adverse effect on our financial condition
and results of
operations and our stock price.operations.
Risks Related to Our Structure, Governance and Stock Exchange Listing
We are a holding company and rely on dividends and other payments, advances and transfers of funds from our subsidiaries to meet our obligations and pay any dividends.
We have no direct operations or significant assets other than the ownership of 100% of the membership interest of Holdings, which in turn has no significant assets other than ownership of 100% of the membership interest of EVERTEC Group. Because we conduct our operations through our subsidiaries, we depend on those entities for dividends and other payments to generate the funds necessary to meet our financial obligations, and to pay any dividends with respect to our common stock. Legal and contractual restrictions in
theour existing senior secured credit facilities and other agreements which may govern future indebtedness of our subsidiaries, as well as the financial condition and operating requirements of our subsidiaries, may limit our ability to obtain cash from our subsidiaries.
The earnings from, or other available assets of, our subsidiaries may not be sufficient to pay dividends or make distributions or loans or enable us to pay any dividends on our common stock or other obligations.Any declaration and payment of future dividends to holders of our common stock may be limited by restrictive covenants of our debt agreements, and will be at the sole discretion of our Board and will also depend on many factors.
Any declaration and payment of future dividends to holders of our common stock may be limited by restrictive covenants of our debt agreements, and will be at the sole discretion of our Board and will depend on many factors, including our financial condition, earnings, capital requirements, level of indebtedness, statutory and contractual restrictions applying to the payment of dividends and other considerations that our Board deems relevant. The terms of our senior secured credit facilities may restrict our ability to pay cash dividends on our common stock. We are prohibited from paying any cash dividend on our common stock unless we satisfy certain conditions. The senior secured credit facilities also include limitations on the ability of our subsidiaries to pay dividends to us. Furthermore, we will be permitted under the termsThe earnings from, or other available assets of, our debt agreements to incur additional indebtedness that may severely restrict or prohibit the payment of dividends. The agreements governing our current and future indebtednesssubsidiaries may not permitbe sufficient to pay dividends or make distributions or loans or enable us to pay any dividends on our common stock.
The requirements of havingstock or other obligations.
As a
class of publicly traded
equity securities may strain our resources and distract management.Upon completioncompany, we are exposed to risks relating to evaluations of our initial public offering in April 2013, we became subject to additional reporting requirementscontrols required by Section 404 of the Securities Exchange Act of 1934, as amended (the “Exchange Act”),Sarbanes-Oxley Act.
Changing laws, regulations and standards relating to corporate governance and public disclosure, including the Sarbanes-Oxley Act of 2002 (the “Sarbanes-Oxley(“Sarbanes-Oxley Act”), and the Dodd-Frank Act. The Dodd-Frank Act effects comprehensive changes to public company governance and disclosures in the United States and subjects us to additional federal regulation. Some of the regulation mandated under the Dodd-Frank Act has yet to be adopted or implemented. We cannot predict with any certainty the requirements of the regulations ultimately adopted or how such regulations will impact the cost of compliance for a company with publicly traded common stock. We are currently evaluating and monitoring developments with respect to the Dodd-Frank Act, and other newrelated regulations implemented by the SEC, have substantially increased legal and proposed rulesfinancial compliance costs. We expect that our ongoing compliance with applicable laws and cannot predict or estimateregulations,
including the
amountExchange Act, the Dodd-Frank Act, and the Sarbanes-Oxley Act, will involve significant and potentially increasing costs. In particular, we must annually evaluate our internal controls systems to allow management to report on our internal controls. We must perform the system and process evaluation and testing (and any necessary remediation) required to comply with the management certification and, when applicable, auditor attestation requirements of Section 404 of the
additional costs we may incur or the timing of such costs. These laws, regulations and standards are subject to varying interpretations, in many cases due to their lack of specificity, and, as a result, their application in practice may evolve over time as new guidance is provided by regulatory and governing bodies. This could result in continuing uncertainty regarding compliance matters and higher costs necessitated by ongoing revisions to disclosure and governance practices.Sarbanes-Oxley Act. We intend to invest resources to comply with evolving laws, regulations and standards, and this investment may result in increased general and administrative expenses and a diversion of management’s time and attention from revenue-generating activities to compliance activities. If
our effortswe are not able to
comply with new laws, regulationscontinue to satisfy the requirements of the Exchange Act, the Dodd-Frank Act, and
standards differ from the activities intended by regulatory or governing bodies due to ambiguities related to practice, regulatory authorities may initiate legal proceedings against us and our business may be harmed. These new rules and regulations may make it more expensive for us to obtain director and officer liability insurance, and we may be required to accept reduced coverage or incur substantially higher costs to obtain coverage. These factors could also make it more difficult for us to attract and retain qualified members of our Board, particularly to serve on our audit committee, and qualified executive officers.We are required to maintain effective internal controls over financial reporting, which could place a strain on our resources, and our failure to do so could require a restatement of our financials and lead to a potential default under our credit facility or a delisting from NYSE.
The Sarbanes-Oxley Act requires that we maintain effective disclosure controls and procedures and internal control over financial reporting. These requirements may place a strain on our systems and resources. Under Section 404 of the Sarbanes-Oxley Act, we are required to include a report of managementmay default on our internal control over financial reporting incredit facility and be subject to sanctions or investigation by regulatory authorities, including the SEC. Any action of this Annual Report on Form 10-K for the year ended December 31, 2016. In order to maintain and improve the effectiveness oftype could adversely affect our disclosure controls and procedures and internal control over financial reporting, significant resources and management oversight is required. This may divert management’s attention from other business concerns, which could have a material adverse effect on our business, financial condition, results of operations, and cash flows.
If we are unable to conclude that our disclosure controls and procedures and internal control over financial reporting are effective, or if our independent public accounting firm is unable to provide us with an unqualified report on our internal control over financial reporting in future years, investors may loseinvestors’ confidence in our financial reportscompany, and could cause our stock price mayto decline. In addition, a material weakness in our internal controls over financial reporting could lead to the occurrence of material misstatements in our financial statements and we could be required to restate our financial results. Our failure to file timely and file materially complete and accurate financial information in our reports with the SEC could lead to a number of adverse consequences, including a loss of confidence by our investors, a default under our credit facility, or a violation of NYSE’s listing rules that could lead to our delisting. Any of these results could have a material adverse effect on our business and results of operations and on the trading price of our common stock.
The price of our common stock may fluctuate significantly and you could lose all or part of your investment.
Volatility in the market price of our common stock may prevent you from being able to sell your common stock at or above the price you paid for your common stock. The market price for our common stock could fluctuate significantly for various reasons, including:
our operating and financial performance and prospects;
changes in earnings estimates or recommendations by securities analysts who track our common stock or industry;
market perception of our success, or lack thereof, in pursuing our growth strategy;
market perception of the challenges of operating a company in Puerto Rico; and
sales of common stock by us, our stockholders, Popular or members of our management team.
In addition, the stock market has experienced significant price and volume fluctuations
historically and particularly in
recent years.late 2018 and early 2019. This volatility has had a significant impact on the market price of securities issued by many companies, including companies in our industries. The changes frequently appear to occur without regard to the operating performance of the affected companies. Hence, the price of our common stock could fluctuate based upon factors that have little or nothing to do with us, and these fluctuations could materially reduce our share price.
Future sales or the possibility of future sales of a substantial amount of our common stock may depress the price of shares of our common stock.
We may sell additional shares of common stock in subsequent public offerings or otherwise, including financing acquisitions. Our amended and restated certificate of incorporation authorizes us to issue 206,000,000 shares of common stock, of which
72,635,03272,000,261 are outstanding as of
JanuaryDecember 31,
2017.2019. All of these shares, other than the 11,654,803 shares held by Popular and the shares held by our officers and directors, are freely transferable without restriction or further registration under the Securities Act.
In addition, we have filed a Form S-8 under the Securities Act covering 12,089,382 shares of our common stock reserved for issuance under our Carib Holdings, Inc. 2010 Equity Incentive Plan (or the 2010 Plan), and our EVERTEC, Inc. 2013 Equity Incentive plan (or the 2013 Plan) and certain options and restricted stock granted outside of these plans (which we refer to as the Equity Plans), but subject to the terms and conditions of the 2010 Plan. Accordingly, shares of our common stock registered under such registration statement may become available for sale in the open market upon grants under the Equity Incentive Plans, subject to vesting restrictions, Rule 144 limitations applicable to our affiliates and the contractual lock-up provisions described below.
We cannot predict the size of future issuances of our common stock or the effect, if any, that future issuances and sales of our common stock will have on the market price of our common stock. Sales of substantial amounts of our common stock (including any shares issued in connection with an acquisition), or the perception that such sales could occur, may adversely affect prevailing market prices for our common stock.
If securities analysts stop publishing research or reports about our company, or if they issue unfavorable commentary about us or our industry or downgrade our common stock, the price of our common stock could decline.
The trading market for our common stock will depend in part on the research and reports that third party securities analysts publish about our company and our industry. One or more analysts could downgrade our common stock or issue other negative commentary about our company or our industry. In addition, we may be unable or slow to attract research coverage. Alternatively, if one or more of these analysts cease coverage of our company, we could lose visibility in the market. As a result of one or more of these factors, the trading price of our common stock could decline.
The interests of Popular may conflict with or differ from your interests as a stockholder.
Popular has the right to nominate two members of our Board and, therefore,
continues tomay be able to
significantly influence our decisions. The interests of Popular could conflict with your interests as a holder of our common stock. For example, the concentration of ownership held by Popular, the terms of the Stockholder Agreement and our organizational documents (including Popular’s quorum rights and consent rights over amendments to our bylaws) and Popular’s right to terminate certain of its agreements with us in certain situations upon a change of control of EVERTEC Group, could delay, defer or prevent certain significant corporate actions that you as a stockholder may otherwise view favorably, including a change of control of us (whether by merger, takeover or other business combination). See “Certain Relationships and Related Party Transactions”
in EVERTEC’s proxy statement for a description of the circumstances under which Popular may terminate certain of its agreements with us. A sale of a substantial number of shares of stock in the future by Popular could cause our stock price to decline.
Our organizational documents and Stockholder Agreement may impede or discourage a takeover, which could deprive our investors of the opportunity to receive a premium for their shares.
Provisions of our amended and restated certificate of incorporation, amended and restated bylaws and the Stockholder Agreement may make it more difficult for, or prevent a third party from, acquiring control of us without the approval of our Board and/or Popular. These provisions include:
a voting agreement pursuant to which Popular agreed to vote its shares in favor of the Popular director nominees (which, constitute the right to appoint two of our nine directors), directors nominated by a committee of our Board in accordance with the Stockholder Agreement and the management director and to remove and replace any such directors in accordance with the terms of the Stockholder Agreement and applicable law and an agreement by us to take all actions within our control necessary and desirable to cause the election, removal and replacement of such directors in accordance with the Stockholder Agreement and applicable law;
requiring that a quorum for the transaction of business at any meeting of the Board (other than a reconvened meeting with the same agenda as the originally adjourned meeting) consist of (1) a majority of the total number of directors then serving on the Board and (2) at least one director nominated by Popular, for so long as it owns, together with its affiliates, 5% or more of our outstanding common stock;
prohibiting cumulative voting in the election of directors;
authorizing the issuance of “blank check” preferred stock without any need for action by stockholders other than Popular (as further described below);
prohibiting stockholders from acting by written consent unless the action is taken by unanimous written consent;
establishing advance notice requirements for nominations for election to our Board or for proposing matters that can be acted on by stockholders at stockholder meetings, which advance notice requirements are not applicable to any directors nominated in accordance with the terms of the Stockholder Agreement.
Our issuance of shares of preferred stock could delay or prevent a change in control of us. Our Board has authority to issue shares of preferred stock, subject to the approval of at least one director nominated by Popular for so long as
it,Popular, together with its respective affiliates, owns at least 10% of our outstanding common stock. Our Board may issue preferred stock in one or more series, designate the number of shares constituting any series, and fix the rights, preferences, privileges and restrictions thereof, including dividend rights, voting rights, rights and terms of redemption, redemption price or prices and liquidation preferences of such series.
The issuance of shares of our preferred stock may have the effect of delaying, deferring or preventing a change in control without further action by the stockholders, even where stockholders are offered a premium for their shares. In addition, Popular, under and subject to the Stockholder Agreement and our organizational documents, will retain significant influence over matters requiring board or stockholder approval, including the election of directors.
See “Certain Relationships and Related Party Transactions—Related Party Transactions” Together, our amended and restated certificate of incorporation, bylaws and Stockholder Agreement could make the removal of management more difficult and may discourage transactions that otherwise could involve payment of a premium over prevailing market prices for our common stock. Furthermore, the existence of the foregoing provisions, as well as the significant common stock owned by Popular and its individual right to nominate a specified number of directors in certain circumstances, could limit the price that investors might be willing to pay in the future for shares of our common stock. They could also deter potential acquirers of us, thereby reducing the likelihood that you could receive a premium for your common stock in an acquisition.
Risks Related to Our Indebtedness
Despite our high indebtedness level, we and our subsidiaries still may be able to incur significant additional amounts of debt, which could further exacerbate the risks associated with our substantial indebtedness.
We and our subsidiaries may be able to incur substantial additional indebtedness in the future, some of which may be secured. Although the agreement
governingsetting forth the terms of our senior secured credit facilities contain restrictions on the incurrence of additional indebtedness, these restrictions are subject to a number of significant qualifications and exceptions, and under certain circumstances, the amount of indebtedness that could be incurred in compliance with these restrictions could be substantial.
In addition to the $72$116.9 million which was available for borrowing under our revolving credit facility as of December 31, 2016,2019, the terms of the senior secured credit facilities enable us to increase the amount available under the term loan and/or revolving credit facilities if we are able to obtain loan commitments from banks and satisfy certain other conditions. If new debt is added to our and our subsidiaries’ existing debt levels, the related risks that we face would increase.
If we are unable to comply with covenants in our debt instruments that limit our flexibility in operating our business, or obligate us to take action such as deliver financial reports, we may default under our debt instruments and our indebtedness may become due.
The agreement
governingsetting forth the terms of the senior secured credit facilities contain, and any future indebtedness we incur may contain, various covenants that limit our ability to engage in specified types of transactions. These covenants limit our
ability and our restricted subsidiaries’ ability to, among other things:
incur additional indebtedness or issue certain preferred shares;
pay dividends on, repurchase or make distributions in respect of our capital stock or make other restricted payments;
make certain investments;
sell certain assets;
creategrant liens;
consolidate, merge, sell or otherwise dispose of all or substantially all of our assets;
enter into certain transactions with our affiliates; and
designate our subsidiaries as unrestricted subsidiaries.
As a result of these covenants, we are limited in the manner in which we conduct our business and we may be unable to engage in favorable business activities or finance future operations or capital needs. In addition, the covenants in the senior secured credit facilities require us to maintain a maximum
seniortotal secured
net leverage ratio and also limit our capital expenditures.
In addition, we are required to comply with certain non-monetary covenants, including the timely delivery of financial statements that fairly present, in all material respects in accordance with GAAP, our financial condition and results of operations.A breach of any of these covenants could result in a default under one or more of these agreements, including as a result of cross default provisions and, in the case of our revolving credit facility, permit the lenders to cease making loans to us. Upon the occurrence of an event of default under the senior secured credit facilities, the lenders could elect to declare all amounts outstanding under the senior secured credit facilities to be immediately due and payable and terminate all commitments to extend further credit. Such actions by those lenders could cause cross defaults under our other indebtedness. If we were unable to repay those amounts, the lenders under our senior secured credit facilities could proceed against the collateral granted to them to secure that indebtedness. We have pledged a significant portion of our assets as collateral under the senior secured credit facilities. If the lenders under the senior secured credit facilities accelerate the repayment of borrowings, the proceeds from the sale or foreclosure upon such assets will first be used to repay debt under our senior secured credit facilities and we may not have sufficient assets to repay our unsecured indebtedness thereafter. As a result, our common stock could become worthless.
We may not be able to generate sufficient cash to service all of our indebtedness and may be forced to take other actions to satisfy our obligations under our indebtedness, which may not be successful.
Our ability to make scheduled payments on or to refinance our debt obligations depends on our financial condition and operating performance, which is subject to prevailing economic and competitive conditions and to certain financial, business and other factors beyond our control. We may not be able to maintain a level of cash flows from operating activities sufficient to permit us to pay the principal, premium, if any, and interest on our indebtedness.
If our cash flows and capital resources are insufficient to fund our debt service obligations, we may be forced to reduce or delay investments and capital expenditures, or to sell assets, seek additional capital or restructure or refinance our indebtedness. Our ability to restructure or refinance our debt will depend on the condition of the capital markets and our financial condition at such time. Any refinancing of our debt could be at higher interest rates and may require us to comply with more onerous covenants, which could further restrict our business operations. The terms of existing or future debt instruments may restrict us from adopting some of these alternatives. In addition, any failure to make payments of interest and principal on our outstanding indebtedness on a timely basis would likely result in a reduction of our credit rating, which could harm our ability to incur additional indebtedness. These alternative measures may not be successful and may not permit us to meet our scheduled debt service obligations.
The risks referenced above are not the only risks facing us. Additional risks and uncertainties not currently known to us or that we currently deem to be immaterial also may materially adversely affect our business, financial condition or results of operations.
Discontinuation, reform or replacement of LIBOR and other benchmark rates, or uncertainty related to the potential for any of the foregoing, may adversely affect our business.
The U.K. Financial Conduct Authority announced in 2017 that it intends to phase out LIBOR by the end of 2021. In addition, other regulators have suggested reforming or replacing other benchmark rates. The discontinuation, reform or replacement of LIBOR or any other benchmark rates may have an unpredictable impact on contractual mechanics in the credit markets or cause disruption to the broader financial markets. Uncertainty as to the nature of such potential discontinuation, reform or replacement may negatively impact the volatility of LIBOR rates, liquidity, our access to funding required to operate our business, our ability to hedge our interest rate risk, or the trading market for our existing senior secured credit facilities.
At December 31, 2019, we had $530.8 million of borrowings under our senior secured credit facilities bearing interest at LIBOR plus an applicable margin. Together with the administrative agent for those facilities, we may replace LIBOR with a comparable or successor rate in a manner that gives due consideration to any evolving or then existing convention for similar U.S. dollar denominated syndicated credit facilities. The replacement of LIBOR with a comparable or successor rate could
cause the amount of interest payable on our senior secured credit facilities to be materially different than expected. We may choose in the future to pursue amendments to our senior secured credit facilities to provide for a comparable or successor rate, but we can give no assurance that we will be able to reach agreement with our lenders on any such amendments.
At December 31, 2019, we also had two interest rate swap agreements which are designed to protect us from changes in interest rates. If LIBOR becomes unavailable and market quotations for specified inter-bank lending are not available, it is unclear how payments under such agreements would be calculated, which could cause these agreements to no longer offer us the protection we expect. Relevant industry groups are seeking to create a standard protocol addressing the expected discontinuation of LIBOR, to which parties to then-existing swaps will be able to adhere. There can be no assurance that such a protocol will be developed or that our swap counterparties will adhere to it. It is uncertain whether amending our then-existing swap agreements may provide us with effective protection from changes in the then-applicable interest rate on our senior secured credit facility indebtedness or other indebtedness. Similarly, while industry groups have announced that they anticipate amending standard documentation to facilitate a market in swaps on one or more successor rates to LIBOR, it is uncertain whether and to what extent a market for interest rate swaps on the successor rate selected for our senior secured credit facility indebtedness or other indebtedness will develop, which may affect our ability to effectively hedge our interest rate exposure.
Item 1B. Unresolved Staff Comments
None.
Our principal operations are conducted in Puerto Rico. Our principal executive offices are
leased and located at Cupey Center Building, Road 176, Kilometer 1.3, San Juan, Puerto Rico 00926.
We own one property in Costa Rica, in the province of San Jose, which is used by our Costa Rican subsidiary for its payment processingservices business. We also lease space in 914 other locations across Latin America and the Caribbean, including our headquarters in San Juan, Puerto Rico and various data centers and office facilities to meet our sales and operating needs. We believe that our properties are in good operating condition and adequately serve our current business operations. We also anticipate that suitable additional or alternative space, including those under lease options, will be available at commercially reasonable terms for future expansion.
Item 3. Legal Proceedings
We are defendants in various lawsuits or arbitration proceedings arising in the ordinary course of business. Management believes, based on the opinion of legal counsel and other factors, that the aggregateaggregated liabilities, if any, arising from such actions will not have a material adverse effect on the financial condition, results of operations and the cash flows of the Company.
Item 4. Mine Safety Disclosures
Part II
Item 5. Market for Registrant’s Common Equity, Related Stockholder Matters and Issuer Purchases of Equity Securities
Our common stock trades on the NYSE under the symbol “EVTC”"EVTC".
Dividends
The
following table sets forth the high and low sales pricesCompany has a history of
our common stock as reported by the NYSE, for each full quarterly period within the two most recent fiscal years. As of February 17, 2017, the approximate number of record holders of our common stock was 202. The closing price as reported on the NYSE of our common stock on such date was $17.20 per share. | | | | | | | | |
| | | Price Range | |
| | | High | | | Low | |
2016 | | | | | | | | |
First Quarter | | $ | 16.63 | | | $ | 11.27 | |
Second Quarter | | | 16.32 | | | | 12.98 | |
Third Quarter | | | 17.62 | | | | 15.13 | |
Fourth Quarter | | | 18.60 | | | | 14.15 | |
2015 | | | | | | | | |
First Quarter | | | 22.87 | | | | 19.36 | |
Second Quarter | | | 23.12 | | | | 20.13 | |
Third Quarter | | | 21.71 | | | | 17.42 | |
Fourth Quarter | | | 19.66 | | | | 14.93 | |
Dividends
We currently have a policy under which we pay a regular quarterly dividend on our common stock, subject to the declaration thereof each quarter by our Board. The following table provides a detail of dividend information for 2016 and 2015:
| | | | | | | | |
Declaration Date
| | Record Date | | Payment Date | | Dividend
per share | |
February 18, 2015
| | March 2, 2015 | | March 19, 2015 | | | 0.10 | |
May 6, 2015
| | May 18, 2015 | | June 5, 2015 | | | 0.10 | |
August 5, 2015
| | August 17, 2015 | | September 3, 2015 | | | 0.10 | |
November 4, 2015
| | November 16, 2015 | | December 4, 2015 | | | 0.10 | |
February 17, 2016
| | February 29, 2016 | | March 17, 2016 | | | 0.10 | |
May 11, 2016
| | May 23, 2016 | | June 10, 2016 | | | 0.10 | |
July 28, 2016
| | August 9, 2016 | | September 2, 2016 | | | 0.10 | |
October 27, 2016
| | November 14, 2016 | | December 2, 2016 | | | 0.10 | |
paying cash dividends. Any declaration and payment of future dividends to holders of our common stock will be at the discretion of our Board and will depend on many factors, including our financial condition, earnings, available cash, business opportunities, legal requirements, restrictions in our debt agreements and other contracts, capital requirements, level of indebtedness and other factors that our Board deems relevant. The covenants of our senior secured credit facilities may limit our ability to pay dividends on our common stock and limit the ability of our subsidiaries to pay dividends to us if we do not meet required performance metrics contained in our debt agreements. See “Management’s Discussion and Analysis of Financial Condition and Results of Operations—Financial Obligations.”
We are a holding company and have no direct operations. We will only be able to pay dividends from our available cash on hand and funds received from our subsidiaries, Holdings and EVERTEC Group, whose ability to make any payments to us will depend upon many factors, including their operating results and cash flows. In addition, the senior secured credit facilities limit EVERTEC
Group’sInc.’s ability to pay distributions on its equity
interests. See “Management’s Discussion and Analysis of Financial Condition and Results of Operations—Financial Obligations.”
Issuer Purchases of Equity Securities
| | | | | | | | | | | | | | | | |
Period | | Total number of
shares purchased | | | Average price paid
per share | | | Total shares purchased
as part of a publicly
announced program | | | Aproximate dollar value of
shares that may yet be
purchased under the
program(1) | |
2/1/2016 - 2/29/2016 | | | 212,863 | | | | 11.555 | | | | 212,863 | | | | | |
6/1/2016 - 6/30/2016 | | | 830,516 | | | | 15.827 | | | | 830,516 | | | | | |
8/1/2016 - 8/31/2016 | | | 210,000 | | | | 16.980 | | | | 210,000 | | | | | |
9/1/2016 - 9/30/2016 | | | 625,285 | | | | 16.836 | | | | 625,285 | | | | | |
11/1/2016 - 11/30/2016 | | | 428,863 | | | | 15.701 | | | | 428,863 | | | | | |
12/1/2016 - 12/31/2016 | | | 196,900 | | | | 17.861 | | | | 196,900 | | | | | |
| | | | | | | | | | | | | | | | |
| | | 2,504,427 | | | $ | 15.950 | | | | 2,504,427 | | | $ | 80,012,223 | |
| | | | | | | | | | | | | | | | |
|
| | | | | | | | | | | | | | |
| | | Total number of shares | | Average price paid | | Total number of shares purchased as part of a publicly | | Approximate dollar value of shares that may yet be purchased |
| Period | | purchased | | per share | | announced program (1) | | under the program |
| 10/1/2019-10/31/2019 | | 21,720 |
| | $ | 30.644 |
| | 21,720 |
| | |
| 11/1/2019-11/30/2019 | | 76,283 |
| | 30.543 |
| | 76,283 |
| | |
| 12/1/2019-12/31/2019 | | 11,400 |
| | 30.914 |
| | 11,400 |
| | |
| Total | | 109,403 |
| | $ | 30.602 |
| | 109,403 |
| | $ | 30,550,139 |
|
| On September 24, 2014, the Company announced a stock repurchase program authorizing the purchase of up to $75 million of the Company’s common stock over the next twelve months. |
| (1) | On February 17, 2016, the Company announced that its Board of Directors approved an increase and extension to the current stock repurchase program, authorizing the purchase of up to $120 million of the Company’s common stock and extended the expiration to December 31, 2017. On November 2, 2017, the Company's Board approved an extension to the expiration date of the current stock repurchase program to December 31, 2020. |
Securities Authorized for Issuance under Equity Compensation Plans
On September 30, 2010, the board of directors of Holdings adopted the 2010 Plan. Holdings reserved 5,843,208 shares of its Class B Non-Voting Common Stock for issuance upon exercise and grants of stock options, restricted stock and other equity awards under the Plan. On April 17, 2012, in connection with the Reorganization, the Company assumed the 2010 Plan and all of the outstanding equity awards issued thereunder or subject thereto. As a result, each of the then outstanding stock options to purchase shares of Holdings’ Class B Non-Voting Common Stock became a stock option to purchase the same number and class of shares of the Company’s Class B Non-Voting Common Stock, in each case on the same terms (including exercise price) as the original stock option. In connection with our initial public offering in April 2013, all of the outstanding shares of the Company’s Class B Non-Voting Common Stock and stock options to purchase shares of the Company’s Class B Non-Voting Common Stock were converted into and deemed exercisable for, respectively, shares of our common stock on a one-to-one basis. Similarly, each of the then outstanding shares of restricted stock of Holdings was converted into the same number of shares of restricted stock of the Company.
In connection with our initial public offering, we adopted the 2013 Plan and reserved 5,956,882 shares of our Common Stock for issuance upon exercise and grants of stock options, restricted stock and other equity awards. We have filed a Form S-8 under the Securities Act covering 12,089,382 shares of our common stock reserved for issuance under the Equity Plans and certain options and restricted stock granted outside of the Equity Plans but subject to the terms and conditions of the 2010 Plan.
The following table summarizes equity compensation plans approved by security holders and equity compensation plans that were not approved by security holders as of December 31,
2016: | | | | | | | | | | | | |
Plan Category | | Number of securities to
be issued upon exercise
of outstanding options,
warrants and rights
(A) | | | Weighted-average
exercise price of
outstanding options,
warrants and rights
(B) | | | Number of securities remaining
available for future issuance
under equity compensation
plans (excluding securities
reflected in column (A))
(C) | |
Equity compensation plans approved by security holders | | | N/A | | | | N/A | | | | N/A | |
Equity compensation plans not approved by security holders | | | 20,000 | | | $ | 6.04 | | | | 6,648,508 | |
2019:
|
| | | | | | | | |
| Plan Category | | Number of securities to
be issued upon exercise
of outstanding options,
warrants and rights
(A) | | Weighted-average
exercise price of
outstanding options,
warrants and rights
(B) | | Number of securities remaining available for future issuance
under equity compensation plans (excluding securities reflected
in column (A))
(C) |
Equity compensation plans approved by security holders (1) | | 1,592,755 |
| | $0.00 | | 3,380,212 |
|
| Equity compensation plans not approved by security holders | | N/A |
| | N/A | | N/A |
|
| |
| (1) | The Company's equity plans were approved by the two sole stockholders prior to the Company's initial public offering, Apollo and Popular. |
The following Performance Graph shall not be deemed incorporated by reference and shall not constitute soliciting material or otherwise considered filed under the Securities Act of 1933 or the Exchange Act.
The following graph shows a comparison from April 12, 2013 (the date our common stock commenced trading on the NYSE) through December 31,
20162019 of the cumulative total return for our common stock, the S&P 500 Index and the S&P Technology Index. The graph assumes that $100 was invested on April 12, 2013 in our common stock and each index and that all dividends were reinvested.
Note that historical stock price performance is not necessarily indicative of future stock price performance.
Comparison of
forty-fiveeighty-one months cumulative total return of EVERTEC Inc.

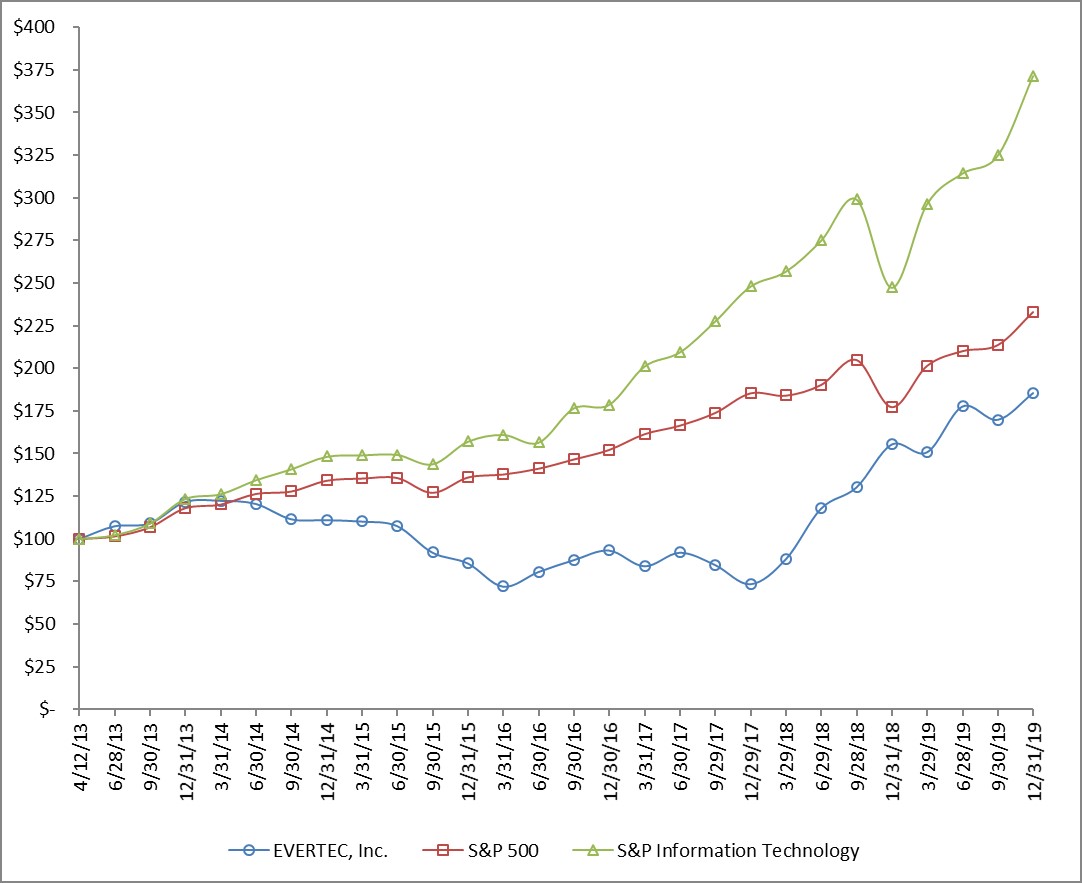
Item 6. Selected Financial Data
The following table sets forth our selected historical consolidated financial data as of the dates and for the periods indicated. The selected consolidated financial data as of and for the years ended December 31,
2019, 2018, 2017, 2016
2015 and
20142015 have been derived from the audited consolidated financial statements of EVERTEC, included in
thisour Annual
ReportReports on Form 10-K.
The results of operations for any period are not necessarily indicative of the results to be expected for any future period. The selected historical consolidated financial data set forth below should be read in conjunction with, and are qualified by reference to, “Management’s Discussion and Analysis of Financial Condition and Results of Operations” and the consolidated financial statements and related notes thereto appearing elsewhere in this Annual Report on Form 10-K.
| | | | | | | | | | | | | | | | | | | | |
| | | Year ended December 31, | |
| (Dollar amounts in thousands, except per share data) | | 2016 | | | 2015 | | | 2014 | | | 2013 | | | 2012 | |
Statements of Income Data: | | | | | | | | | | | | | | | | | | | | |
Revenues: | | | | | | | | | | | | | | | | | | | | |
Merchant Acquiring, net | | $ | 91,248 | | | $ | 85,411 | | | $ | 79,136 | | | $ | 73,616 | | | $ | 69,591 | |
Payment Processing | | | 111,507 | | | | 108,320 | | | | 104,713 | | | | 100,104 | | | | 95,607 | |
Business Solutions | | | 186,752 | | | | 179,797 | | | | 177,939 | | | | 184,682 | | | | 175,437 | |
| | | | | | | | | | | | | | | | | | | | |
Total revenues | | | 389,507 | | | | 373,528 | | | | 361,788 | | | | 358,402 | | | | 340,635 | |
| | | | | | | | | | | | | | | | | | | | |
Operating costs and expenses | | | | | | | | | | | | | | | | | | | | |
Cost of revenues, exclusive of depreciation and amortization shown below | | | 175,809 | | | | 167,916 | | | | 157,537 | | | | 162,980 | | | | 159,183 | |
Selling, general and administrative expenses | | | 46,986 | | | | 37,278 | | | | 41,276 | | | | 38,810 | | | | 31,686 | |
Depreciation and amortization | | | 59,567 | | | | 64,974 | | | | 65,988 | | | | 70,366 | | | | 71,492 | |
| | | | | | | | | | | | | | | | | | | | |
Total operating costs and expenses | | | 282,362 | | | | 270,168 | | | | 264,801 | | | | 272,156 | | | | 262,361 | |
| | | | | | | | | | | | | | | | | | | | |
Income from operations | | | 107,145 | | | | 103,360 | | | | 96,987 | | | | 86,246 | | | | 78,274 | |
| | | | | | | | | | | | | | | | | | | | |
Interest income | | | 377 | | | | 495 | | | | 328 | | | | 236 | | | | 320 | |
Interest expense | | | (24,617 | ) | | | (24,266 | ) | | | (25,772 | ) | | | (37,417 | ) | | | (54,721 | ) |
(Losses) earnings of equity method investment | | | (52 | ) | | | 147 | | | | 1,140 | | | | 935 | | | | 564 | |
Other income (expenses) | | | 544 | | | | 2,306 | | | | 2,375 | | | | (75,682 | ) | | | (8,491 | ) |
| | | | | | | | | | | | | | | | | | | | |
Income (loss) before income taxes | | | 83,397 | | | | 82,042 | | | | 75,058 | | | | (25,682 | ) | | | 15,946 | |
Income tax expense (benefit) | | | 8,271 | | | | (3,335 | ) | | | 8,901 | | | | 1,435 | | | | (59,136 | ) |
| | | | | | | | | | | | | | | | | | | | |
Net income (loss) | | | 75,126 | | | | 85,377 | | | | 66,157 | | | | (27,117 | ) | | | 75,082 | |
Less: Net income attributable to non-controlling interest | | | 90 | | | | — | | | | — | | | | — | | | | — | |
| | | | | | | | | | | | | | | | | | | | |
Net income (loss) attributable to EVERTEC Inc.’s common stockholders | | $ | 75,036 | | | $ | 85,377 | | | $ | 66,157 | | | $ | (27,117 | ) | | $ | 75,082 | |
| | | | | | | | | | | | | | | | | | | | |
Net income (loss) per common share—basic | | $ | 1.01 | | | $ | 1.11 | | | $ | 0.84 | | | $ | (0.34 | ) | | $ | 1.03 | |
| | | | | | | | | | | | | | | | | | | | |
Net income (loss) per common share—diluted | | $ | 1.01 | | | $ | 1.11 | | | $ | 0.84 | | | $ | (0.34 | ) | | $ | 0.98 | |
| | | | | | | | | | | | | | | | | | | | |
Cash dividends declared per common share(1) | | $ | 0.40 | | | $ | 0.40 | | | $ | 0.40 | | | $ | 0.20 | | | $ | 4.39 | |
| | | | | | | | | | | | | | | | | | | | |
(1) | Adjusted to reflect the two for one stock split effective April 1, 2013. |
| | | | | | | | | | | | | | | | | | | | |
| | | December 31, | |
| (Dollar amounts in thousands) | | 2016 | | | 2015 | | | 2014 | | | 2013 | | | 2012 | |
Balance Sheet Data: | | | | | | | | | | | | | | | | | | | | |
Cash | | $ | 51,920 | | | $ | 28,747 | | | $ | 32,114 | | | $ | 22,275 | | | $ | 25,634 | |
Total assets | | | 885,662 | | | | 863,654 | | | | 885,321 | | | | 918,863 | | | | 978,525 | |
Total long-term liabilities | | | 648,324 | | | | 662,939 | | | | 691,085 | | | | 705,872 | | | | 759,387 | |
Total debt | | | 650,759 | | | | 662,699 | | | | 681,240 | | | | 725,648 | | | | 746,787 | |
Total equity | | | 108,175 | | | | 98,214 | | | | 94,840 | | | | 87,972 | | | | 101,593 | |
|
| | | | | | | | | | | | | | | | | | | | |
| | | Year ended December 31, |
| (Dollar amounts in thousands, except per share data) | | 2019 | | 2018 | | 2017 | | 2016 | | 2015 |
| Statements of Income Data: | | | | | | | | | | |
| Revenues | | $ | 487,374 |
| | $ | 453,869 |
| | $ | 407,144 |
| | $ | 389,507 |
| | $ | 373,528 |
|
| Operating costs and expenses | | | | | | | | | | |
| Cost of revenues, exclusive of depreciation and amortization shown below | | 213,379 |
| | 196,957 |
| | 200,650 |
| | 175,809 |
| | 167,916 |
|
| Selling, general and administrative expenses | | 61,411 |
| | 68,717 |
| | 56,161 |
| | 46,986 |
| | 37,278 |
|
| Depreciation and amortization | | 68,082 |
| | 63,067 |
| | 64,250 |
| | 59,567 |
| | 64,974 |
|
| Total operating costs and expenses | | 342,872 |
| | 328,741 |
| | 321,061 |
| | 282,362 |
| | 270,168 |
|
| Income from operations | | 144,502 |
| | 125,128 |
| | 86,083 |
| | 107,145 |
| | 103,360 |
|
| Interest income | | 1,217 |
| | 787 |
| | 716 |
| | 377 |
| | 495 |
|
| Interest expense | | (28,811 | ) | | (30,044 | ) | | (29,861 | ) | | (24,617 | ) | | (24,266 | ) |
| Earnings (losses) of equity method investment | | 936 |
| | 692 |
| | 604 |
| | (52 | ) | | 147 |
|
| Other (expenses) income | | (1,169 | ) | | 2,602 |
| | 2,657 |
| | 544 |
| | 2,306 |
|
| Income before income taxes | | 116,675 |
| | 99,165 |
| | 60,199 |
| | 83,397 |
| | 82,042 |
|
| Income tax expense (benefit) | | 12,975 |
| | 12,596 |
| | 4,780 |
| | 8,271 |
| | (3,335 | ) |
| Net income | | 103,700 |
| | 86,569 |
| | 55,419 |
| | 75,126 |
| | 85,377 |
|
| Less: Net income attributable to non-controlling interest | | 231 |
| | 299 |
| | 365 |
| | 90 |
| | — |
|
| Net income attributable to EVERTEC, Inc.’s common stockholders | | $ | 103,469 |
| | $ | 86,270 |
| | $ | 55,054 |
| | $ | 75,036 |
| | $ | 85,377 |
|
| Net income per common share—basic | | $ | 1.44 |
| | $ | 1.19 |
| | $ | 0.76 |
| | $ | 1.01 |
| | $ | 1.11 |
|
| Net income per common share—diluted | | $ | 1.41 |
| | $ | 1.16 |
| | $ | 0.76 |
| | $ | 1.01 |
| | $ | 1.11 |
|
|
| | | | | | | | | | | | | | | |
| | | December 31, |
| | | 2019 | | 2018 | | 2017 | | 2016 | | 2015 |
| Balance Sheet Data: | | | | | | | | | | |
| Cash and cash equivalents | | $111,030 | | $69,973 | | $50,423 | | $51,920 | | $28,747 |
| Total assets | | 1,011,676 |
| | 927,292 |
| | 902,788 |
| | 885,662 |
| | 863,654 |
|
| Total long-term liabilities | | 595,739 |
| | 574,981 |
| | 607,596 |
| | 648,324 |
| | 662,939 |
|
| Total debt | | 527,603 |
| | 538,606 |
| | 616,740 |
| | 650,759 |
| | 662,699 |
|
| Total equity | | 271,623 |
| | 215,606 |
| | 147,976 |
| | 108,175 |
| | 98,214 |
|
Item 7. Management’s Discussion and Analysis of Financial Condition and Results of Operations
The following Management’s Discussion and Analysis of Financial Condition and Results of Operations (“MD&A”) covers: (i) the results of operations for the years ended December 31,
2016, 20152019, 2018 and
2014;2017 and (ii) the financial condition as of December 31,
20162019 and
2015.2018. See Note 1 of the
Notes to Audited Consolidated Financial Statements for additional information about the Company and the basis of presentation of our financial statements. You should read the following discussion and analysis in conjunction with the financial statements and related notes appearing elsewhere herein. This MD&A contains forward-looking statements that involve risks and uncertainties. Our actual results may differ from those indicated in the forward-looking statements. See “Forward-Looking Statements” for a discussion of the risks, uncertainties and assumptions associated with these statements.
EVERTEC is a leading full-service transaction processing business in Latin America
and the Caribbean, providing a broad range of merchant acquiring, payment
processingservices and business process management services. According to the September
20162019 Nilson Report, we are one of the largest merchant acquirers in Latin America based on total number of transactions and we believe we are the largest merchant acquirer in the Caribbean and Central America. We serve
1826 countries in the region
fromout of 11 offices, including our
baseheadquarters in Puerto Rico. We manage a system of electronic payment networks that process more than two billion transactions annually, and offer a comprehensive suite of services for core bank processing, cash processing and technology outsourcing. In addition, we own and operate the ATH network, one of the leading personal identification number (“PIN”) debit networks in Latin America. We serve a diversified customer base of leading financial institutions, merchants, corporations and government agencies with “mission-critical” technology solutions that enable them to issue, process and accept transactions securely. We believe our business is well-positioned to continue to expand across the fast-growing Latin American region.
We are differentiated, in part, by our diversified business model, which enables us to provide our varied customer base with a broad range of transaction-processing services from a single source across numerous channels and geographic markets. We believe this
single-source capability provides several competitive advantages that will enable us to continue to penetrate our existing customer base with complementary new services, win new customers, develop new sales channels and enter new markets. We believe these competitive advantages include:
Our ability to provide competitive products;
Our ability to provide in one package a range of services that traditionally had to be sourced from different vendors;
Our ability to serve customers with disparate operations in several geographies with a single integrated technology solutionsolutions that enablesenable them to manage their business as one enterprise; and
Our ability to capture and analyze data across the transaction processing value chain and use that data to provide value-added services that are differentiated from those offered by pure-play vendors that serve only one portion of the transaction processing value chain (such as only merchant acquiring or payment processing)services).
Our broad suite of services spans the
entire transaction processing value chain and includes a range of front-end customer-facing solutions such as the electronic capture and authorization of transactions at the point-of-sale, as well as back-end support services such as the clearing and settlement of transactions and account reconciliation for card issuers. These include: (i) merchant acquiring services, which enable point of sales (“POS”) and e-commerce merchants to accept and process electronic methods of payment such as debit, credit, prepaid and electronic benefit transfer (“EBT”) cards; (ii) payment processing services, which enable financial institutions and other issuers to manage, support and facilitate the processing for credit, debit, prepaid, automated teller machines (“ATM”) and EBT card programs; and (iii) business process management solutions, which provide “mission-critical” technology solutions such as core bank processing, as well as IT outsourcing and cash management services to financial institutions, corporations and governments. We provide these services through
a highly scalable, end-to-end technology
platformplatforms that we manage and operate in-house and that generates significant operating efficiencies that enable us to maximize profitability.
We sell and distribute our services primarily through a proprietary direct sales force with established customer relationships. We
are also building a variety of indirect sales channels that enable us to leverage the distribution capabilities of partners in adjacent markets, including value-added resellers. We continue to pursue joint ventures and merchant acquiring alliances.
We benefit from an attractive business model, the hallmarks of which are recurring revenue, scalability, significant operating margins and lowmoderate capital expenditure requirements. Our revenue is predominantly recurring in nature because of the mission-critical and embedded nature of the services we provide. In addition, we generally negotiate multi-year contracts with our customers. OurWe believe our business model enablesshould enable us to continue to grow our business organically in the primary markets we serve without significant incremental capital expenditures.
Separation from and Key Relationship with Popular
Prior to the Merger on September 30, 2010, EVERTEC Group was 100% owned by Popular, the largest financial institution in the Caribbean, and operated substantially as an independent entity within Popular. After the consummation of the Merger, Popular retained an approximately 49% indirect ownership interest in EVERTEC Group and is our largest customer. In connection with, and upon consummation of, the Merger, EVERTEC Group entered into a 15-year Master Services Agreement, and several related agreements with Popular. Under the terms of the Master Services Agreement, Popular agreed to continue to use EVERTEC services on an ongoing exclusive basis, for the duration of the agreement, on commercial terms consistent with those of our historical relationship. Additionally, Popular granted us a right of first refusal on the development of certain new financial technology products and services for the duration of the Master Services Agreement. As of December 31,
2016,2019, Popular retained a
16.05%16.2% interest in EVERTEC.
2016
Our MSA with Popular has an initial term that ends in 2025. For 2019, we derived approximately 43% of our revenue from such contract, which makes the MSA our most significant client contract. We anticipate that we will enter into a negotiation with Popular prior to the expiration of the initial term of the MSA. We cannot be certain that we will be able to negotiate an extension to the MSA. In addition, even if we are able to negotiate an extension of the MSA, any new master services agreement may be materially different from the existing MSA. Further, the anticipated negotiation of the MSA extension may result in Popular obtaining significant concessions from us with respect to pricing and other key terms, both in respect of the current term and any extension of the MSA, particularly as we approach 2025. See “Item 1A. Risk Factors—Risks Related to Our Business—We expect to continue to derive a significant portion of our revenue from Popular."
The
Company’sCompany's Board of Directors approved regular quarterly dividends of
$0.10$0.05 per common share in February,
May,April, July and October of
2016.2019. The Board anticipates declaring this dividend in future quarters on a regular basis; however future declarations of dividends are subject to the Board’s approval and may be adjusted as business needs or market conditions change.
On
March 1, 2016,December 2, 2019, the Company completed the
purchaseacquisition of
65%100% of the
shareshares of capital
stock of
Processa SAS.On November 4, 2016, EVERTEC Group, together with certain other directEGM Ingeniería Sin Fronteras, S.A.S., commercially known as PlacetoPay. PlacetoPay is a gateway and indirect subsidiaries of the Company, entered into a third amendment to the Credit Agreement, dated as of April 17, 2013. Among other things, the amendment to the Credit Agreement extends the maturity of (a) approximately $219 million of the Borrower’s existing approximately $250 million of term loan A facility to January 17, 2020 and (b) $65 million of the Borrower’s existing $100 million of revolving credit facility to January 17, 2020. The remaining approximately $30 million of term loan A facility and the $35 million of revolving credit facility that were not extended will remainpayment service provider based in place and mature as originally scheduled on April 17, 2018.
On December 14, 2016, the Company completed the purchase of certain assets, including the customer relationship, of Accuprint, Inc., a data management and printing services company in Puerto Rico.
Medellin, Colombia.
Factors and Trends Affecting the Results of Our Operations
The ongoing migration from cash and paper methods of payment to electronic payments continues to benefit the transaction- processing industry globally. We believe that the penetration of electronic payments in the markets in which we operate is significantly lower relative to the U.S. market, and that this ongoing shift will continue to generate
substantial growth opportunities for our business. For example, currently the adoption of banking products, including electronic payments, in the Latin American and Caribbean region is lower relative to the mature U.S. and European markets. We believe that the unbanked and underbanked population in our markets will continue to shrink, and therefore drive incremental penetration and growth of electronic payments in Puerto Rico and other Latin American regions. We also benefit from the trend for financial institutions and government
agencies to outsource technology systems and processes. Many medium- and small-size institutions in the Latin American markets in which we operate have outdated computer systems and updating these IT legacy systems is financially and logistically challenging, which presents a business opportunity for us.
Finally, our financial condition and results of operations are, in part, dependent on the economic and general conditions of the geographies in which we operate.
The Puerto Rico government is experiencing a debt crisis and has defaulted on several of its debt payments, stating that it is unable to both service its debt and continue to provide essential services to its citizens. An emergency moratorium on debt payments was implemented by the Puerto Rico government to ensure continuity of essential services to Puerto Rico citizens. The Puerto Rican government is a large customer of ours and many Puerto Rican businesses and if it is unable to pay its obligations as they become due or at all, this will likely have an adverse impact on the island’s economy.
On June 30, 2016, the U.S. President signed into law PROMESA. PROMESA establishes a fiscal oversight and the Oversight Board comprised of seven voting members appointed by the President. The Oversight Board has broad budgetary and financial powers over Puerto Rico’s budget, laws, financial plans and regulations, including the power to approve restructuring agreements with creditors, file petitions for restructuring and reform the electronic system for the tax collection. The Oversight Board will havehas ultimate authority in preparing the Puerto Rico government’s budget and any issuance of future debt by the government and its instrumentalities. In addition, PROMESA imposes an automatic stay on all litigation against Puerto Rico and its instrumentalities, as well as any other judicial or administrative actions or proceedings to enforce or collect claims against the Puerto Rico government. ThisOn May 1, 2017, the automatic stay is currently in effect upexpired. Promptly after the expiration of the stay, creditors of the Puerto Rico government filed various lawsuits involving defaults on more than $70 billion of bonds issued by Puerto Rico, having failed to reach a negotiated settlement on such defaults with the Puerto Rico government during the period of the automatic stay. On May 3, 2017, and can be extended by the Oversight Board filed a voluntary petition of relief on behalf of the Commonwealth
pursuant to Title III of PROMESA for the restructuring of the Commonwealth’s debt. Subsequently, the Oversight Board filed voluntary petitions of relief pursuant to Title III of PROMESA on behalf certain public corporations and instrumentalities. Title III is an in-court debt restructuring proceeding similar to protections afforded debtors under Chapter 11 of the United States Code (the “Bankruptcy Code”); the Bankruptcy Code is not available to the Commonwealth or U.S. District Courtits instrumentalities.
Over the past several months, the Oversight Board released and has been working on a restructuring plan intended to reduce Puerto Rico’s debt to sustainable levels and provide a path for Puerto Rico to exit the bankruptcy-like protections under PROMESA. This was an important milestone, but the most recent version of
the plan is facing legal and political challenges from various sectors. The final plan will require the approval from the judge overseeing the case. At this point, it is uncertain if or when a restructuring plan will get approved or when Puerto
Rico.Rico will resolve its current debt situation.
As the solution to the Puerto Rican government’s debt crisis remains unclear, we continue to carefully monitor our receivables with the government as well as monitor general economic trends to understand the impact the crisis has on the economy of Puerto Rico and our card payment volumes. To date our receivables with the Puerto Rican government and overall payment transaction volumes have not been significantly affected by the debt
crisis, howevercrisis; however; we remain cautious.
We are also concerned
The hurricanes that
the crisis could further accelerate the ongoing emigration trend ofimpacted Puerto Rico
residentsin 2017 led to
an influx of funds for recovery efforts, primarily from private insurance companies and federal agencies and programs, that impacted the
United States, which haseconomy through 2018 and 2019. These funds have had a
negativepositive impact on
the island’sPuerto Rico's economy and our business.
Post hurricane recovery expectations by the local government and the Oversight Board consider a significant amount of disaster recovery funding that will impact the island and the economy over the next years. However, the actual amounts to be deployed, the timing in which they will become available and the impact to the Puerto Rico economy remain unclear. We will continue to monitor progress on these funds but remain cautious as to the amount and impact they will have in our business.
In addition to the macroeconomic trends described above, management currently estimates that we will continue to experience revenue attrition in Latin America of approximately $3 million to $5 million for previously disclosed migrations anticipated in 2020. Clients’ decision to migrate, which were made prior to 2015, were driven by a variety of historical factors, including primarily a desire to enhance customer service experience. Management believes that these customer decisions are unlikely to change; however, the timing of the migration is subject to change based on each customer’s conversion schedule.
Critical Accounting
EstimatesPolicies
Our consolidated financial statements are prepared in accordance with GAAP. In connection with the preparation of our financial statements, we are required to make estimates and assumptions about future events, and apply judgments that affect the reported amounts of certain assets and liabilities, and in some instances, the reported amounts of revenues and expenses during the period.
We base our assumptions, estimates, and judgments on historical experience, current events and other factors that management believes to be relevant at the time our consolidated financial statements are prepared. However, because future events are inherently uncertain and their effects cannot be determined with certainty, actual results could differ from our assumptions and estimates, and such differences could be material. A summary of significant accounting policies is included in Note 1 of the
Notes to Audited Consolidated Financial Statements appearing elsewhere in this Annual Report on Form 10-K. We believe that the following accounting estimates are the most critical; require the most difficult, subjective or complex judgments; and thus, result in estimates that are inherently uncertain.
Revenue
Recognitionrecognition
The Company’s revenue recognition policy follows the guidance from Accounting Standards Codification (“ASC”("ASC') 605606, Revenue Recognition; ASC 605-25,Revenue Recognition-Multiple Element Arrangements; and; ASC 985,Softwarefrom Contracts with Customers, which provide guidance on the recognition, presentation, and disclosure of revenue in consolidated financial statements.
The Company recognizes revenue when the following four criteria are met: (i) persuasive evidence(or as) control of an agreement exists, (ii) delivery and acceptance has occurredgoods or services have been rendered,are transferred to a customer. The transfer of control occurs when the customer can direct the use of and receive substantially all the benefits from the transferred good or service. Therefore, revenue is recognized over time (typically for services) or at a point in time (typically for goods).
The assessment of revenue recognition is performed by the Company based on the five-step model established in Topic 606, as follows: Step 1: Identify the contract with customer; Step 2: Identify the performance obligations in the contract; Step 3: Determine the transaction price; Step 4: Allocate the transaction price to the performance obligations in the contract; and Step 5: Recognize revenue when or as the entity satisfies a performance obligation.
At contract inception, the Company evaluates whether the contract (i) is legally enforceable; (ii) approved by both parties; (iii) properly defines rights and obligations of the selling priceparties, including payment terms; (iv) has commercial substance; and (v) collection of substantially all consideration entitled is fixed or determinable,probable, before proceeding with the assessment of revenue recognition. If any of these requirements is not met, the contract does not exist for purposes of the model and (iv) collectionany consideration received is reasonably assured. For multiple deliverable arrangements, EVERTECrecorded as a liability. A reassessment may be performed in a later date upon change in facts and circumstances. The Company also evaluates each arrangementwithin this step if contracts issued within a period of 6 months with the same customer should be accounted for as a single contract. The Company’s contracts with customers may be modified through amendments, change requests and waivers. Upon receipt, modifications of contracts with customers are evaluated to determine if these must be accounted for: (i) as a separate contract, (ii) a cumulative catch-up, or (iii) as a termination and creation of a new contract. Contract modifications must also comply with the elementsrequirements to determine if a contract with a customer exists for accounting purposes.
To identify performance obligations within contracts with customers, the Company first identifies all the promises in the contract (i.e., explicit and implicit). This includes the customer’s options to acquire additional goods or deliverables withinservices for free or at a discount in exchange for an upfront payment. The Company then assesses if each material good or service (or bundle of goods or services) is distinct in nature (i.e., the arrangement represent separate unitscustomer can benefit from the good or service on its own or together with other readily available resources), and is capable of accounting pursuantbeing distinct in the context of the contract (i.e., the promise to ASC 605-25. Iftransfer the deliverables are determinedgood or service is separately identifiable from other promises in the contract). A distinct good or service (or bundle of goods or services) constitutes a performance obligation.
The Company also applies the series guidance to distinct goods or services (either with a specified quantity of goods or services or a stand-ready service), with an over time revenue recognition, to determine whether they should be separate units of accounting, revenuesaccounted for as a single performance obligation. These distinct goods or services are recognized as unitsa single performance obligation when their nature and timely increments are substantially the same and have the same pattern of accountingtransfer to the customer (i.e., the distinct goods or services within the series use the same method to measure progress towards complete satisfaction). To determine if a performance obligation should be recognized over time, one or more of the following criteria must be met: (1) the customer simultaneously receives and consumes the benefits as the Company performs (i.e., routine or recurring services); (2) the customer controls the asset as the entity creates or enhances it (i.e., asset on customer’s site); or (3) the Company’s performance does not create an asset for which the Company has an alternative use and there is a right to payment for performance to date (i.e., asset built to order). Performance obligations that do not meet the over time criteria are deliveredrecognized at a point in time.
In addition, in Step 2 of the model, the Company evaluates whether the practical expedient of right-to-invoice applies. If this practical expedient is applicable, steps 3, 4 and 5 are waived. For this practical expedient to apply, the right to consideration must correspond directly with the value received by the customer for the Company’s performance to date, no significant up-front payments or retroactive adjustments must exist, and specified minimums must be deemed non-substantive at the contract level. If the contract with the customer has multiple performance obligations and the practical expedient of right-to-invoice does not apply, the Company proceeds to determine the transaction price and allocate it on a stand-alone selling price basis among the different performance obligations identified in the Step 2.
The Company generally applies the expected cost-plus margin approach to determine the stand-alone selling price at the performance obligation level. In addition, for performance obligations that are satisfied over time and the right to invoice practical expedient is not available, the Company determines a method to measure progress (i.e., input or output method) based on current facts and circumstances. When these performance obligations have variable consideration within its transaction price and are part of a series, the Company allocates the variable consideration to each time increment.
As part of the revenue recognition
criteria are met. Ifanalysis, when another party is involved in providing goods or services to a customer, the
deliverables are not determined to be separate units of accounting, revenuesCompany evaluates, for
each performance obligation, whether it is providing the
deliveredgoods or services
are combined into one unit of accounting and recognized (i) over the lifeitself (i.e., as principal), or if it is only arranging on behalf of the
arrangementother party. The Company acts as principal if
all services are consistently delivered overit controls the specified good or service before that good or service is transferred to a customer. To determine if the Company acts as an agent, the Company considers indicators, such
term, or if otherwise,as: (i) the responsibility to fulfill a promise; (ii)
at the
time that all servicesinventory risk; and
deliverables have been delivered. The selling price for each deliverable is based on vendor specific objective evidence (“VSOE”) if available, third party evidence (“TPE”) if VSOE is not available, or Management’s best estimate of selling price (“BESP”) if neither VSOE nor TPE is available. EVERTEC establishes VSOE of selling price using(iii) the price
charged when the same element is sold separately. EVERTEC bifurcates or allocates the arrangement consideration to each of the deliverables based on the relative selling price of each unit of accounting.The Company has two main categories of revenues according to the type of transactions EVERTEC enters into with the Company’s customers: (a) transaction-based fees and (b) fixed fees and time and material.
Transaction-based fees
The Company provides services that generate transaction-based fees. Typically transaction-based fees depend on factors such as number of accounts or transactions processed. These factors typically consist of a fee per transaction or item processed, a percentage of dollar volume processed or a fee per account on file, or some combination thereof. Revenue derived from the transaction-based fee contracts are recognized when the underlying transaction is processed, which constitutes delivery of service.
Revenues from business contracts in the Company’s Merchant Acquiring segment are primarily comprised of discount fees charged to the merchants based on the sales amount of transactions processed. Revenues include a discount fee and membership fees charged to merchants and debit network fees as well as point-of-sale (“POS”) rental fees. Pursuant to the guidance from ASC 605-45-45,Revenue Recognition–Principal Agent Considerations, EVERTEC records Merchant Acquiring revenues net of interchange and assessments charged by the credit and debit card network associations and recognizes such revenues at the time of the sale (when a transaction is processed).
Payment processing revenues are comprised of revenues related to providing access to the ATH networkdetermination.
Goodwill and other
card networks to financial institutions, and related services. Payment processing revenues also include revenues from card issuer processing services (such as credit and debit card processing, authorization and settlement, and fraud monitoring and control to debit or credit card issuers), payment processing services (such as payment and billing products for merchants, businesses and financial institutions) and EBT (which principally consists of services to the Puerto Rico government for the delivery of government benefits to participants). Revenues in EVERTEC’s Payment Processing segment are primarily comprised of fees per transaction processed or per account on file, or a combination of both, and are recognized at the time transactions are processed or on a monthly basis for accounts on file.Transaction-based fees within EVERTEC’s Business Solutions segment consist of revenues from business process management solutions including core bank processing, business process outsourcing, item and cash processing, and fulfillment. Transaction-based fee revenues generated by the Company’s core bank processing services are derived from fees based on various factors such as the number of accounts on file (e.g. savings or checking accounts, loans, etc.), and the number of transactions processed or registered users (e.g. for online banking services). For services dependent on the number of transactions processed, revenues are recognized as the underlying transactions are processed. For services dependent on the number of users or accounts on file, revenues are recognized on a monthly basis based on the number of accounts on file each month. Item and cash processing revenues are based upon the number of items (e.g. checks) processed and revenues are recognized when the underlying item is processed. Fulfillment services include technical and operational resources for producing and distributing variable print documents such as statements, bills, checks and benefits summaries. Fulfillment revenues are based upon the number pages for printing services and the number of envelopes processed for mailing services. Revenues are recognized as services are delivered based on a fee per page printed or envelope mailed, as applicable.
Fixed fees and time and material
The Company also provides services that generate a fixed fee per month or fees based on time and expenses incurred. These services are mostly provided in EVERTEC’s Business Solutions segment. Revenues are generated from EVERTEC’s core bank solutions, network hosting and management and IT consulting services.
In core bank solutions, the Company mostly provides access to applications and services such as back-up or recovery, hosting and maintenance that enable a bank to operate the related hosted services accessing the Company’s IT infrastructure. These contracts generally contain multiple elements or deliverables which are evaluated by EVERTEC and revenues are recognized according to the applicable guidance. Revenue is derived from fixed fees charged for the use of hosted services and are recognized on a monthly basis as delivered. Set-up fees are billed to the customer when the service is rendered; however, they are deferred and recognized as revenues over the term of the arrangement or the expected period of the customer relationship, whichever is longer, as set-up services rarely provide value to the customer on a stand-alone basis and are interrelated with the service to be provided under the contract.
In network hosting and management, EVERTEC provides hosting services for network infrastructure at EVETEC’s facilities; automated monitoring services; maintenance of call centers; interactive voice response solutions, among other related services. Revenues are primarily derived from monthly fees as services are delivered. Set-up fees are billed up-front to the customer when the set-up service is rendered; however, they are deferred and recognized as revenues over the term of the arrangement or the expected period of the customer relationship, whichever is longer, as set-up services rarely provide value to the customer on a stand-alone basis and are interrelated with the service under the contract. There are some arrangements under this line of service category that may contain undelivered elements. In such cases, the undelivered elements are evaluated and recognized when the services are delivered or at the time that all deliverables under the contract have been delivered.
IT consulting services revenue primarily consists of time billings based upon the number of hours dedicated to each client. Revenue from time billings are recognized as services are delivered.
EVERTEC also charges members of the ATH network an annual membership fee; however, these fees are deferred and recognized as revenues on a straight-line basis over the year and recorded in the Company’s Payment Processing segment. In addition, occasionally EVERTEC is a reseller of hardware and software products and revenues from these resale transactions are recognized when such product is delivered and accepted by the client.
Service level arrangements
The Company’s service contracts may include service level arrangements (“SLA”) generally allowing the customer to receive a credit for part of the service fee when the Company has not provided the agreed level of services. The SLA performance obligation is committed on a monthly basis, thus SLA performance is monitored and assessed for compliance with arrangements on a monthly basis, including determination and accounting for its economic impact, if any.
Goodwill and Other Intangible Assets
intangible assets
Goodwill represents the excess of the purchase price and related costs over the value assigned to net assets acquired. Goodwill is not amortized, but is tested for impairment at least annually, or more often if events or circumstances indicate there may be impairment.
For 2016, the Company used a “qualitative assessment” option or “step zero” for the goodwill impairment test for all of its reporting units. With this process, the
The Company first assesses qualitative factors to determine whether it is “morenecessary to perform the quantitative impairment test. If determined to be necessary, the quantitative impairment test shall be used to identify goodwill impairment and measure the
amount of a goodwill impairment loss to be recognized (if any). The Company may assess qualitative factors to determine whether it is more likely than
not”not, that is, a likelihood of more than 50 percent that the fair value of
athe reporting unit is less than its carrying
amount. Ifamount, including goodwill. The Company has an unconditional option to bypass the
answer is no, thenqualitative assessment for any reporting unit in any period and proceed directly to performing the
fair valuequantitative goodwill impairment test. The Company may resume performing the qualitative assessment in any subsequent period. With the early adoption in December 2017 of the
reporting unit does not need to be measured, and step one and step two, as explained below, are bypassed. In assessing the fair value of a reporting unit, which is based on the nature of the business and reporting unit’s current and expected financial performance, the Company uses a combination of factors such as industry and market conditions, overall financial performance and the entity and reporting unit specific events.In the past,accounting standards update that simplifies the goodwill impairment test, used was a two-step process at each reporting unit level. The first stepthe quantitative goodwill impairment test, used to identify potentialboth the existence of impairment and the amount of impairment loss, compares the fair value of a reporting unit with its carrying amount, including goodwill. If the Company determines to perform a quantitative impairment test, a third-party may be engaged to prepare an independent valuation of each reporting unit. If the fair value of a reporting unit exceeds its carrying amount, goodwill of the reporting unit is considered not considered impaired andimpaired. If the second stepcarrying amount of a reporting unit exceeds its fair value, an impairment loss shall be recognized in an amount equal to that excess, limited to the impairment test is not necessary. Iftotal amount of goodwill allocated to that reporting unit. Additionally, the Company shall consider the income tax effect from any tax-deductible goodwill on the carrying amount of the reporting unit, exceeds the fair value, there is an indication of potential impairment and the second step ofif applicable, when measuring the goodwill impairment analysis is required. The second step consists of comparing the implied fair value of the reporting unit goodwill with the carrying amount of that goodwill.
loss. For the years ended December 31, 2016, 20152019, 2018 and 2014,2017, no impairment losses associated with goodwill were recognized.
Other identifiable intangible assets with
a definitive useful
lifelives are amortized using the straight-line method or
an accelerated
method.methods. These intangibles are evaluated periodically for impairment when events or changes in circumstances indicate that the carrying
amountamounts may not be recoverable.
Other identifiable intangible assets with
a definitive useful
lifelives include
a customer
relationship, trademark,relationships, trademarks, software packages and a non-compete
agreement acquired during September 2010 when Apollo acquired a 51% indirect ownership interest in EVERTEC as part of a merger (the “Merger”); a customer relationship asset acquired in 2015 from a local bank in Puerto Rico, and customer relationship assets acquired as part of business combination transactions in 2016.The customer relationship assetsagreement. Customer relationships were valued using the excess earnings method under the income approach. Trademark assets were valued using the relief-from-royalty method under the income approach. SoftwareInternally developed software packages, which include capitalized software development costs, wereare recorded at cost.cost, while software packages acquired as part of a business combination were valued using the relief-from-royalty method under the income approach. The non-compete agreement was valued based on the estimated impact that theoretical competition would have on revenues and expenses.
Income taxes are accounted for under the asset and liability method. A temporary difference refers to a difference between the tax basis of an asset or liability, determined based on recognition and measurement requirements for
tax positions, and its reported amount in the financial statements that will result in taxable or deductible amounts in future years when the reported amount of the asset or liability is recovered or settled, respectively. Deferred tax assets and liabilities represent the future effects on income taxes that result from temporary differences and carryforwards that exist at the end of a period. Deferred tax assets and liabilities are measured using enacted tax rates and provisions of the enacted tax law and are not discounted to reflect the time-value of money. The effect on deferred tax assets and liabilities of a change in tax rates is recognized in the consolidated statements of income and comprehensive income in the period that includes the enactment date. A deferred tax valuation allowance is established if it is considered more likely than not that all or a portion of the deferred tax asset will not be realized.
The Company recognizes the benefit of uncertain tax positions only if it is more likely than not that the tax position will be sustained on examination by taxing authorities, based on the technical merits of the position. The tax benefits recognized in the financial statements from such a position are measured based on the largest benefit that has a greater than fifty percent likelihood of being realized upon ultimate settlement or disposition of the underlying issue with the taxing authority. Accordingly, the amount of benefit recognized in the consolidated financial statements may differ from the amount taken or expected to be taken in the tax return resulting in unrecognized tax benefits (“UTBs”). The Company recognizes the interest and penalties associated with UTBs as part of the provision for income taxes on its consolidated statements of income and comprehensive income. Accrued interest and penalties are included on the related tax liability line in the consolidated balance sheets.
All companies within EVERTEC are legal entities which file separate income tax returns.
Share-based Compensation
The Company estimates the fair value of stock-based awards, on a contemporaneous basis, at the date they are granted using the Black-Scholes-Merton option pricing model for Tranche A options and the Monte Carlo simulation analysis for Tranche B and Tranche C options and market based restricted stock units (“RSUs”) using the following assumptions: (1) stock price; (2) risk-free rate; (3) expected volatility; (4) expected annual dividend yield and (5) expected term. The risk-free rate is based on the U.S. Constant Maturities Treasury Interest Rate as of the grant date or the yield of a 2-year or 3-year Treasury bond, as applicable. The expected volatility is based on a combination of historical volatility and implied volatility from publicly traded companies in the Company’s industry. The expected annual dividend yield is based on management’s expectations of future dividends as of the grant date and, in certain cases, assumes that those dividends will be reinvested over the performance period. The expected term for stock options granted under the 2010 Plan was based on the vesting time of the options. For the stock options granted under the 2013 Plan, the simplified method was used to estimate the expected term, given that the Company did not have appropriate exercise data on which to base the estimate nor is exercise data relating to employees of comparable companies easily obtainable. Performance and time based RSUs and restricted stock are valued based on the market price of the Company’s stock at the grant date.
Upon option exercise or restricted stock or RSUs release, participants may elect to “net share settle”. Rather than requiring the participant to deliver cash to satisfy the exercise price, for options exercise, and statutory minimum tax withholdings, the Company withholds a sufficient number of shares to cover these amounts and delivers the net shares to the participant. The Company recognizes the associated tax withholding obligation as a reduction of additional paid-in capital.
As compensation expense is recognized, a deferred tax asset is established. At the time stock options are exercised, restricted stock or RSUs are released, a current tax deduction arises based on the value at the time of exercise or release. This deduction may exceed the associated deferred tax asset, resulting in a “windfall tax benefit”. The windfall is recognized in the consolidated balance sheets as an increase to additional paid-in capital, and is included in the consolidated statements of cash flows as a financing inflow.
In determining the amount of cash tax savings realized from the excess share-based compensation deductions, the Company follows the tax law ordering approach. Under this approach, the utilization of excess tax deductions
associated with share-based awards is dictated by provision in the tax law that identify the sequence in which such benefits are utilized for tax purposes.
Recent Accounting Pronouncements
For a description of recent accounting standards, see Note 2 of the
Notes to Audited Consolidated Financial Statements included in this Annual Report on Form 10-K.
Non-GAAP Financial Measures
EBITDA, Adjusted EBITDA, Adjusted Net Income and Adjusted
Net IncomeEarnings per common share, as presented in this Annual Report on Form 10-K, are supplemental measures of our performance that are not required by, or presented in accordance with GAAP. They are not measurements of our financial performance under GAAP and should not be considered as alternatives to total revenues, net income or any other performance measures derived in accordance with GAAP or as alternatives to cash flows from operating activities as measures of our liquidity.
Adjusted EBITDA at the segment level is reported to the chief operating decision maker for purposes of making decisions about allocating resources to the segments and assessing their performance. For this reason, Adjusted EBITDA, as it relates to our segments, is presented in conformity with Accounting Standards Codification 280, Segment Reporting, and is excluded from the definition of non-GAAP financial measures under the Securities and Exchange Commission's Regulation G and Item 10(e) of Regulation S-K.
For more information regarding EBITDA, Adjusted EBITDA, Adjusted Net Income and Adjusted
Net IncomeEarnings per common share, including a quantitative reconciliation of EBITDA, Adjusted EBITDA, Adjusted Net Income and Adjusted
Net IncomeEarnings per common share to the most directly comparable GAAP financial performance measure, which is net income, see “—Net Income Reconciliation to EBITDA, Adjusted EBITDA, Adjusted Net Income and Adjusted
Net IncomeEarnings per common share” and “—Covenant Compliance” below.
Overview of
|
| | | | | | | | | | | | | | | | | | | | | | | | | |
| | Year ended December 31, | | | | | | | | |
| (In thousands) | 2019 | | 2018 | | 2017 | | Variance 2019 vs. 2018 | | Variance 2018 vs. 2017 |
| | | | | | | | | | | | | | |
| Revenues | $ | 487,374 |
| | $ | 453,869 |
| | $ | 407,144 |
| | $ | 33,505 |
| | 7 | % | | $ | 46,725 |
| | 11 | % |
| Operating costs and expenses | | | | | | | | | | | | | |
| Cost of revenues, exclusive of depreciation and amortization shown below | 213,379 |
| | 196,957 |
| | 200,650 |
| | 16,422 |
| | 8 | % | | (3,693 | ) | | (2 | )% |
| Selling, general and administrative expenses | 61,411 |
| | 68,717 |
| | 56,161 |
| | (7,306 | ) | | (11 | )% | | 12,556 |
| | 22 | % |
| Depreciation and amortization | 68,082 |
| | 63,067 |
| | 64,250 |
| | 5,015 |
| | 8 | % | | (1,183 | ) | | (2 | )% |
| Total operating costs and expenses | 342,872 |
| | 328,741 |
| | 321,061 |
| | 14,131 |
| | 4 | % | | 7,680 |
| | 2 | % |
| Income from operations | $ | 144,502 |
| | $ | 125,128 |
| | $ | 86,083 |
| | $ | 19,374 |
| | 15 | % | | $ | 39,045 |
| | 45 | % |
Revenues
Total revenues in 2019 increased by $33.5 million or 7% when compared with the prior year. The following briefly describes the componentsincrease in revenues primarily reflects growth driven in ATH debit network transaction volumes, value added solutions, new managed services, pricing actions, as well as a one-time revenue related to an electronic benefits services contract of approximately $2.7 million and other completed projects.
Cost of revenues
Cost of revenues in 2019 increased $16.4 million or 8% when compared with the prior year. The increase is primarily related to an increase in professional fees driven by higher programming services, an increase in equipment expenses, cloud related expenses, and an increase in cost of sales associated with new managed services, and hardware and software sales.
Selling, general and administrative
Selling, general and administrative expenses in 2019 decreased $7.3 million or 11% when compared with 2018. The decrease is mainly driven by lower professional services as presentedthe prior year included fees in connection with due diligence for a potential transaction that the Company decided not to pursue, expenses incurred in the Consolidated Statementsprior year in connection with the Company's debt refinancing that did not recur, a decrease in equipment expenses and a decrease in other operating taxes.
Depreciation and amortization
Depreciation and amortization expense increased by $5.0 million in 2019 compared to 2018. The increase is related to higher depreciation and amortization mainly driven by purchases of Incomedata processing equipment and Comprehensive Income. Descriptionsdevelopment projects going into production.
Non-operating income (expenses)
|
| | | | | | | | | | | | | | | | | | | | | | | | | |
| | Year ended December 31, | | | | | | | | |
| (In thousands) | 2019 | | 2018 | | 2017 | | Variance 2019 vs. 2018 | | Variance 2018 vs. 2017 |
| | | | | | | | | | | | | | |
| Interest income | $ | 1,217 |
| | $ | 787 |
| | $ | 716 |
| | $ | 430 |
| | 55 | % | | $ | 71 |
| | 10 | % |
| Interest expense | (28,811 | ) | | (30,044 | ) | | (29,861 | ) | | 1,233 |
| | (4 | )% | | (183 | ) | | 1 | % |
| Earnings of equity method investment | 936 |
| | 692 |
| | 604 |
| | 244 |
| | 35 | % | | 88 |
| | 15 | % |
| Other (expenses) income | (1,169 | ) | | 2,602 |
| | 2,657 |
| | (3,771 | ) | | (145 | )% | | (55 | ) | | (2 | )% |
| Total non-operating expenses | $ | (27,827 | ) | | $ | (25,963 | ) | | $ | (25,884 | ) | | $ | (1,864 | ) | | 7 | % | | $ | (79 | ) | | — | % |
Total non-operating expenses in 2019 increased by $1.9 million or 7% to $27.8 million when compared to 2018. The increase is mainly driven by higher Other (expenses) income by $3.8 million, mainly due to increased foreign exchange losses, partially offset by a decrease in interest expense resulting from improved rates from the debt refinancing completed in the fourth quarter of the revenue recognition policies are detailedprior year.
Income tax expense
|
| | | | | | | | | | | | | | | | | | | | | | | | | |
| | Year ended December 31, | | | | | | | | |
| (In thousands) | 2019 | | 2018 | | 2017 | | Variance 2019 vs. 2018 | | Variance 2018 vs. 2017 |
| Income tax expense | $ | 12,975 |
| | $ | 12,596 |
| | $ | 4,780 |
| | $ | 379 |
| | 3 | % | | $ | 7,816 |
| | 164 | % |
Income tax expense in Note 12019 increased by $0.4 million to $13.0 million. The effective tax rate for the period was 11% compared with 13% in the prior year. The decrease in the effective tax rate is mainly the result of tax deductions related to equity compensation and the Audited Consolidated Financial Statements includedimpact from additional deductions related to withholdings.
Segment Results of Operations
The Company operates in
this Annual Report on Form 10-K.four business segments: Payment Services - Puerto Rico & Caribbean, Payment Services - Latin America, Merchant Acquiring, net. Merchant Acquiring revenue consistsand Business Solutions.
The Payment Services - Puerto Rico & Caribbean segment revenues are comprised of
income from services that allow merchants to accept electronic methods of payment. Our standard merchant contract has an initial term of one or three years, with automatic one-year renewal periods. In the Merchant Acquiring segment, sources of revenue include a discount fee (generally a percentage of the sales amount of a credit or debit card transaction value) and membership fees charged to merchants, debit network fees and rental income from POS devices and other equipment, net of credit card interchange and assessment fees charged by credit card associations (such as VISA or MasterCard) or payment networks.Payment Processing. Payment Processing revenue comprises incomerevenues related to providing access to the ATH debit network and other card networks to financial institutions, including related services such as authorization, processing, management and recording of ATM and point of sale ("POS") transactions, and ATM management and monitoring. The segment revenues also include revenues from card processing services (such as credit and debit card processing, authorization and settlement and fraud monitoring and control to debit or credit issuers), payment processing services (such as payment and billing products for merchants, businesses and financial institutions) and EBT (which principally consist of services to the government of Puerto Rico for the delivery of benefits to participants). For ATH debit network and processing services, revenues are primarily driven by the number of transactions processed. Revenues are derived primarily from network fees, transaction switching and processing fees, and the leasing of POS devices. For card issuer processing, revenues are primarily dependent upon the number of cardholder accounts on file, transactions and authorizations processed, the number of cards embossed and other processing services. For EBT services, revenues are primarily derived from the number of beneficiaries on file.
The Payment Services - Latin America segment revenues consist of revenues related to providing access to the ATH network
of ATMs and other card networks
to financial institutions, including related services such as authorization, processing, management and recording of ATM and POS transactions, and ATM management and monitoring.
Payment Processing revenueThe segment revenues also
includes incomeinclude revenues from card processing services
for debit or credit issuers, such(such as credit and debit card processing, authorization and settlement and fraud monitoring and control
services;to debit or credit issuers), payment processing services
such(such as payment and billing products for merchants, businesses and financial
institutions;institutions), as well as licensed software solutions for risk and
EBT, which principally consists of services to the Puerto Rico government for the delivery of government benefits to participants. Payment products include electronic check processing, automated clearing house (“ACH”), lockbox, interactive voice responsefraud management and
web-based payments through personalized websites, among others.We generally enter into one to five year contracts with our privatecard payment processing clients and one year contracts with our government payment processing clients.processing. For ATH network and processing services, revenue isrevenues are primarily driven mainly by the number of transactions processed. Revenue isRevenues are derived mainlyprimarily from network fees, transaction switching and processing fees, and the leasing of POS devices. For card issuer processing, revenue isrevenues are primarily dependent mostly upon the number of cardholder accounts on file, transactions and authorizations processed, the
number of cards embossed, and other processing services. For EBT
The Merchant Acquiring segment consists of revenues from services
revenuethat allow merchants to accept electronic methods of payment. In the Merchant Acquiring segment, revenues include a discount fee and membership fees charged to merchants, debit network fees and rental fees from POS devices and other equipment, net of credit card interchange and assessment fees charged by credit cards associations (such as VISA or MasterCard) or payment networks. The discount fee is
derived mainly fromgenerally a percentage of the transaction value. EVERTEC also charges merchants for other services that are unrelated to the number of
beneficiaries on file.Business Solutions.transactions or the transaction value.
The Business Solutions
revenuesegment consists of
incomerevenues from a full suite of business process management solutions
includingin various product areas such as core bank processing, network
hosting and management,managed services, IT
consultingprofessional services, business process outsourcing, item
andprocessing, cash processing, and fulfillment.
We generally enter into one to five year contracts with our privateCore bank processing and
governmentnetwork services revenues are derived in part from a recurrent fixed fee, from fees based on the number of accounts on file (i.e. savings or checking accounts, loans, etc.), transactions processed, number of users, or computer resources utilized. Revenues from other processing services within the Business Solutions
clients.segment are generally volume-based and depend on factors such as the number of accounts processed. In addition, we areEVERTEC is a reseller of hardware and software products;products and these resale transactions are generally one-time transactions. Revenue from sales of hardware or software products is recognized oncenon-recurring.
In addition to the
following four
criteriaoperating segments described above, Management identified certain functional cost areas that operate independently and do not constitute businesses in themselves. These areas could neither be concluded as operating segments nor could they be combined with any other operating segments. Therefore, these areas are
met: (i) evidence of an agreement exists, (ii) deliveryaggregated and
acceptance has occurred or services have been rendered, (iii)presented as “Corporate and Other” category in the
selling price is fixed or determinable, and (iv) collection offinancial statements alongside the
selling price is reasonably assured or probable, as applicable.Cost of revenues. This caption includes the costs directly associated with providing services to customers, as well as, product and software sales, including software licensing and maintenance costs; telecommunications costs; personnel and infrastructure costs to develop and maintain applications, operate computer networks and provide associated customer support;operating segments. The Corporate and other operating expenses.
Selling, general and administrative. This captioncategory consists mainly of salaries, wages and relatedcorporate overhead expenses, paid to sales personnel, administrative employees and management, advertising and promotional costs, audit and legal fees,intersegment eliminations, certain leveraged activities and other selling expenses.
Depreciationnon-operating and amortization. This caption consists of ourmiscellaneous expenses that are not included in the operating segments. The overhead and leveraged costs relate to activities such as:
marketing,
corporate finance and accounting,
human resources,
legal,
risk management functions,
internal audit,
corporate debt related costs,
non-operating depreciation and amortization expense. Following the completion of the Merger, our depreciation and amortization expense increasedexpenses generated as a result of merger and acquisition activity,
intersegment revenues and expenses, eliminations, and
other non-recurring fees and expenses that are not considered when management evaluates financial performance at a segment level
The Chief Operating Decision Maker ("CODM") reviews the
purchase price allocation adjustments to reflect the fair market value and revised useful life assigned to property and equipment and intangible assets in connection with the Merger.Results of Operations
The following tables set forth certain consolidatedoperating segments separate financial information to assess performance and to allocate resources. Management evaluates the operating results of each of its operating segments based upon revenues and Adjusted Earnings before Interest, Taxes, Depreciation and Amortization ("Adjusted EBITDA"). Adjusted EBITDA is defined as EBITDA further adjusted to exclude unusual items and other adjustments. Adjusted EBITDA, as it relates to operating segments, is presented in conformity with Accounting Standards Codification Topic 280, "Segment Reporting" given that it is reported to the CODM for the years ended December 31, 2016, 2015 and 2014. These tables and the related discussion should be read in conjunction with the information contained in our Audited Consolidated Financial Statements and the notes thereto included elsewhere in this Annual Report on Form 10-K.
Comparisonpurposes of the years ended December 31, 2016 and 2015
The following tables present the components of our audited consolidated statements of income and comprehensive income by business segment and the change in those amounts for the years ended December 31, 2016 and 2015.
Revenues
| | | | | | | | | | | | | | | | |
| | | Years ended
December 31, | | | | | | | |
| (Dollar amounts in thousands) | | 2016 | | | 2015 | | | Variance | |
Merchant Acquiring, net | | $ | 91,248 | | | $ | 85,411 | | | $ | 5,837 | | | | 7 | % |
Payment Processing | | | 111,507 | | | | 108,320 | | | | 3,187 | | | | 3 | % |
Business Solutions | | | 186,752 | | | | 179,797 | | | | 6,955 | | | | 4 | % |
| | | | | | | | | | | | | | | | |
Total revenues | | $ | 389,507 | | | $ | 373,528 | | | $ | 15,979 | | | | 4 | % |
| | | | | | | | | | | | | | | | |
Total revenues increased by $16.0 million to $389.5 million when compared with 2015.
Merchant Acquiring revenue increased $5.8 million or 7% when compared with the prior year. The revenue growth was drivenallocating resources. Segment asset disclosure is not used by the addition of the FirstBank of Puerto Rico (“FirstBank”) merchant portfolio in the fourth quarter of 2015, partially offset by a contract change for a merchant acquiring customer to payment processing, lower average ticket as well as other merchant mix shifts.
Payment Processing revenue increased by $3.2 million or 3% primarily driven by an increase in transactions processed over the ATH® debit network and revenue related to the Processa acquisition. These increases were partially offset by a reduction related to the shift in revenue from FirstBank from payment processing to merchant acquiring in 2016, as wellCODM as a decrease in revenues due to a delayed project amounting to approximately $4.5 million and lower revenues frommeasure of segment performance since the government lottery tax contract terminated in the fourth quarter of 2015.
Business Solutions revenue increased approximately $7.0 million or 4% when compared with 2015. The increasesegment evaluation is primarily driven by revenues from core banking activities related to an increase in volume and new services provided. In addition, revenues grew modestly in network services, business process outsourcing and IT Consulting. This growth was partially offset by a decrease in revenue from cash and item processing services.
Operating costs and expenses
| | | | | | | | | | | | | | | | |
| | | Years ended
December 31, | | | | | | | |
| (Dollar amounts in thousands) | | 2016 | | | 2015 | | | Variance | |
Cost of revenues, exclusive of depreciation and amortization shown below | | $ | 175,809 | | | $ | 167,916 | | | $ | 7,893 | | | | 5 | % |
Selling, general and administrative expenses | | | 46,986 | | | | 37,278 | | | | 9,708 | | | | 26 | % |
Depreciation and amortization | | | 59,567 | | | | 64,974 | | | | (5,407 | ) | | | -8 | % |
| | | | | | | | | | | | | | | | |
Total operating costs and expenses | | $ | 282,362 | | | $ | 270,168 | | | $ | 12,194 | | | | 5 | % |
| | | | | | | | | | | | | | | | |
Operating costs and expenses increased by $12.2 million or 5% to $282.4 million for the year ended December 31, 2016. The increase is primarily driven by a $17.6 million increase in cost of revenues and selling general and administrative expenses, partially offset by a decrease of $5.4 million in depreciation and amortization.
Cost of revenues increased 5% to $175.8 million and was primarily driven by a $4.9 million increase in expenses for revenue sharing referral agreements with certain banks in Puerto Rico and increases in equipment expenses, professional fees and other operating taxes. These increases were partially offset by a $4.5 million decrease in compensation expense as the prior year period includes severance payments as part of voluntary termination offers extended to certain employees which included special termination benefits.
Selling, general and administrative expenses increased by $9.7 million primarily driven by a $4.5 million increase in salaries and benefits including higher share based compensation, coupled with a $3.0 million increase in professional fees mostly due to costs incurred in connection with the restatement.
Depreciation and amortization expense decreased by $5.4 million or 8% compared with 2015. The decrease resulted from lower amortization of software packages primarily related to software acquired as part of the Merger that became fully amortized during the third quarter of 2015.
Income from operations
The following table presents income from operations by reportable segments.
| | | | | | | | | | | | | | | | |
| | | Years ended
December 31, | | | | | | | |
| (Dollar amounts in thousands) | | 2016 | | | 2015 | | | Variance | |
Segment income from operations | | | | | | | | | | | | | | | | |
Merchant Acquiring, net | | $ | 31,051 | | | $ | 36,466 | | | $ | (5,415 | ) | | | -15 | % |
Payment Processing | | | 52,071 | | | | 55,429 | | | | (3,358 | ) | | | -6 | % |
Business Solutions | | | 56,794 | | | | 50,200 | | | | 6,594 | | | | 13 | % |
| | | | | | | | | | | | | | | | |
Total segment income from operations | | | 139,916 | | | | 142,095 | | | | (2,179 | ) | | | -2 | % |
Merger related depreciation and amortization and other unallocated expenses(1) | | | (32,771 | ) | | | (38,735 | ) | | | 5,964 | | | | -15 | % |
| | | | | | | | | | | | | | | | |
Income from operations | | $ | 107,145 | | | $ | 103,360 | | | $ | 3,785 | | | | 4 | % |
| | | | | | | | | | | | | | | | |
(1) | Primarily represents non-operating depreciation and amortization expenses generated as a result of the Merger and certain non-recurring fees and expenses. |
Income from operations increased $3.8 million or 4% compared with 2015. The increase was primarily driven by Business Solutions as revenuesadjusted EBITDA performance. As such, segment assets are not disclosed in the segment increased year over year while maintaining operating expenses relatively stable and reducing depreciation and amortization expenses. In addition, Merger related depreciation and amortization decreased as some assets were fully amortized towardsnotes to the end of the prior year. These positive variances were partially offset by a decrease in income from operations in our Merchant Acquiring segments as a result of the aforementioned contract change for a merchant acquiring customer to payment processing coupled with revenues at lower margins from FirstBank. The FirstBank relationship also resulted in increased amortization expense from the customer relationship intangible asset recognized as part of the acquisition. In addition, we experience reduced margin contribution due to increased transactions at a lower ticket price and merchant mix shifts that reduced net revenue. The Payment Processing segment was impacted by the aforementioned project delay which decreased revenues by approximately $4.5 million coupled with an increase in depreciation and amortization expense.
accompanying condensed consolidated financial statements.
See Note 2223 of the Audited Consolidated Financial Statements includedappearing elsewhere in this Annual Report on Form 10-K for additionalthe reconciliation of EBITDA to consolidated net income.
The following tables set forth information onabout the Company’s reportableoperations by its four business segments for the periods indicated below.
Payment Services - Puerto Rico & Caribbean
|
| | | | | | | | |
| | Year ended December 31, |
| (In thousands) | 2019 | | 2018 | | 2017 |
| Revenues | $125,544 | | $114,119 | | $101,687 |
| Adjusted EBITDA | 78,609 | | 75,104 | | 58,534 |
| Adjusted EBITDA margin | 62.6 | % | | 65.8 | % | | 57.6 | % |
Payment Services - Puerto Rico & Caribbean revenues in 2019 increased $11.4 million when compared with 2018. The increase in revenues was primarily driven by higher transaction volumes, new transaction fees, as well as $2.7 million one-time revenue from the electronic benefits contract. Adjusted EBITDA increased by $3.5 million mainly as a result of the increase in revenues, partially offset by higher operating expenses for specific projects that went into production throughout the year.
Payment Services - Latin America
|
| | | | | | | | |
| | Year ended December 31, |
| (In thousands) | 2019 | | 2018 | | 2017 |
| Revenues | $84,453 | | $80,899 | | $62,702 |
| Adjusted EBITDA | 30,679 | | 27,727 | | 17,558 |
| Adjusted EBITDA margin | 36.3 | % | | 34.3 | % | | 28.0 | % |
Payment Services - Latin America revenues increased $3.6 million in 2019 driven mainly by higher intercompany software sales and fordevelopment revenues from the Payment Services - Latin America segment to the Payment Services - Puerto Rico & Caribbean segment, partially offset by anticipated client attrition. Adjusted EBITDA increased $3.0 million when compared to the prior year period, primarily due to the revenue associated to intercompany services and sales, partially offset by the impact of foreign exchange losses.
Merchant Acquiring
|
| | | | | | | | |
| | Year ended December 31, |
| (In thousands) | 2019 | | 2018 | | 2017 |
| Revenues | $106,388 | | $99,655 | | $85,778 |
| Adjusted EBITDA | 47,156 | | 46,516 | | 37,497 |
| Adjusted EBITDA margin | 44.3 | % | | 46.7 | % | | 43.7 | % |
Merchant acquiring segment revenue increased $6.7 million to $106.4 million in 2019 driven primarily by higher sales volume, as well as pricing actions impacting both spread and non-transactional revenue. Adjusted EBITDA increased by $0.6 million as a
reconciliationresult of
incomethe increased revenues, partially offset by higher internal processing costs resulting from
operations to net income.Non-operating expenses
| | | | | | | | | | | | | | | | |
| | | Years ended
December 31, | | | | | | | |
| (Dollar amounts in thousands) | | 2016 | | | 2015 | | | Variance | |
Non-operating income (expenses) | | | | | | | | | | | | | | | | |
Interest income | | $ | 377 | | | $ | 495 | | | $ | (118 | ) | | | -24 | % |
Interest expense | | | (24,617 | ) | | | (24,266 | ) | | | (351 | ) | | | 1 | % |
(Losses) earnings of equity method investment | | | (52 | ) | | | 147 | | | | (199 | ) | | | -135 | % |
Other income, net | | | 544 | | | | 2,306 | | | | (1,762 | ) | | | -76 | % |
| | | | | | | | | | | | | | | | |
Total non-operating expenses | | $ | (23,748 | ) | | $ | (21,318 | ) | | $ | (2,430 | ) | | | 11 | % |
| | | | | | | | | | | | | | | | |
Total non-operating expenses increased $2.4a declining average ticket.
Business Solutions
|
| | | | | | | | |
| | Year ended December 31, |
| (In thousands) | 2019 | | 2018 | | 2017 |
| Revenues | $216,662 | | $197,602 | | $189,077 |
| Adjusted EBITDA | 97,421 | | 87,813 | | 86,790 |
| Adjusted EBITDA margin | 45.0 | % | | 44.4 | % | | 45.9 | % |
Business solutions revenue was $216.7 million in 2019, an increase of $19.1 million when compared with the prior year.
The increase isRevenue growth in the segment was driven by
increased volumes and new services to Popular and the
$1.5 million loss on extinguishment recorded as partGovernment of
the debt refinancing transactionPuerto Rico, in addition to increases in hardware and software sales completed
in the fourth quarter of 2016, which is included in Other income, net, coupled with a $0.4 million increase in interestexpense and a $0.2 million decrease in earnings from our equity method investment in the Dominican Republic, Consorcio de Tarjetas Dominicanas, S.A. (“CONTADO”).
Income tax expense (benefit)
Income tax expense for the year ended December 31, 2016 amounted to approximately $8.3 million compared with an income tax benefit of $3.3 million in 2015. The effective tax rate in 2016 was approximately 10%. The prior year tax benefit reflects the reversal of tax liability related to an uncertain tax position for which the statute of limitations expired during the third quarter of 2015.
See Note 18 of the Audited Consolidated Financial Statements included in this Annual Report on Form 10-K for additional information regarding income taxes.
Comparison of the years ended December 31, 2015 and 2014
The following tables present the components of our audited consolidated statements of income and comprehensive income by business segment and the change in those amounts for the years ended December 31, 2015 and 2014.
Revenues
| | | | | | | | | | | | | | | | |
| | | Years ended
December 31, | | | | | | | |
| (Dollar amounts in thousands) | | 2015 | | | 2014 | | | Variance | |
Merchant Acquiring, net | | $ | 85,411 | | | $ | 79,136 | | | $ | 6,275 | | | | 8 | % |
Payment Processing | | | 108,320 | | | | 104,713 | | | | 3,607 | | | | 3 | % |
Business Solutions | | | 179,797 | | | | 177,939 | | | | 1,858 | | | | 1 | % |
| | | | | | | | | | | | | | | | |
Total revenues | | $ | 373,528 | | | $ | 361,788 | | | $ | 11,740 | | | | 3 | % |
| | | | | | | | | | | | | | | | |
Total revenuesyear. Adjusted EBITDA increased by $11.7 $9.6
million
to $373.5 million when compared with 2014.Merchant Acquiring revenue increased $6.3 million or 8% when compared with the prior year. The revenue growth was primarily related to an increase in sales volumes for existing merchants coupled with the addition of the FirstBank of Puerto Rico (“FirstBank”) merchant portfolio and an overall improvement in spread.
Payment Processing revenue increased by $3.6 million or 3%. Revenue growth was driven mainly by an increase in ATH and POS network and processing transactions, partially offset by reduced revenues from contracts with the Puerto Rico government.
Business Solutions revenue increased $1.9 million or 1% when compared with 2014. The increase is primarily driven by an increase in revenues from core banking activities, partially offset by a decrease in IT Consulting and IT Management services.
Operating costs and expenses
| | | | | | | | | | | | | | | | |
| | | Years ended
December 31, | | | | | | | |
| (Dollar amounts in thousands) | | 2015 | | | 2014 | | | Variance | |
Cost of revenues, exclusive of depreciation and amortization shown below | | $ | 167,916 | | | $ | 157,537 | | | $ | 10,379 | | | | 7 | % |
Selling, general and administrative expenses | | | 37,278 | | | | 41,276 | | | | (3,998 | ) | | | -10 | % |
Depreciation and amortization | | | 64,974 | | | | 65,988 | | | | (1,014 | ) | | | -2 | % |
| | | | | | | | | | | | | | | | |
Total operating costs and expenses | | $ | 270,168 | | | $ | 264,801 | | | $ | 5,367 | | | | 2 | % |
| | | | | | | | | | | | | | | | |
Operating costs and expenses increased by $5.4 million or 2% to $270.2 million for the year ended December 31, 2015. The increase is primarily driven by a $10.4 million increase in cost of revenues, partially offset by a decrease of $4.0 million and $1.0 million in selling, general and administrative expenses and depreciation and amortization, respectively.
Cost of revenues increased 7% when compared with 2014. The increase was primarily driven by a $7.4 million increase in salaries and other benefits as a result of severance payments primarily related to the voluntary termination offers extended to certain employees during 2015 coupled with an increase in share based compensation. Other operating expenses increased by $2.3 million primarily driven by an increase in bad debt expense and operational losses in addition to expenses recorded as a result of the revenue sharing agreement entered into with FirstBank in connection with the purchase of the merchant portfolio during the fourth quarter of 2015. Additionally, professional fees increased by $1.2 million as a result of an increase in project development costs related to a card issuing platform initiative.
Selling, general and administrative expenses decreased 10% when compared with the prior year. The decrease was primarily driven by non-recurring expenses recorded in 2014 amounting to $7.9 million associated to the CEO succession and acceleration of vesting of certain stock options, and a $1.1 million decrease in professional expenses related to the debt offering that was withdrawn. This decrease washigher revenues, partially offset by an increase in salaries related to higher share based compensation and the impactoperating expenses, including increased cost of severance payments made related to the aforementioned voluntary termination offers.
Depreciation and amortization expense decreased by 2% compared with 2014. The decrease resulted from lower amortization of software packages.
Income from operations
The following table presents income from operations by reportable segments.
| | | | | | | | | | | | | | | | |
| | | Years ended
December 31, | | | | | | | |
| (Dollar amounts in thousands) | | 2015 | | | 2014 | | | Variance | |
Segment income from operations | | | | | | | | | | | | | | | | |
Merchant Acquiring, net | | $ | 36,466 | | | $ | 34,362 | | | $ | 2,104 | | | | 6 | % |
Payment Processing | | | 55,429 | | | | 58,796 | | | | (3,367 | ) | | | -6 | % |
Business Solutions | | | 50,200 | | | | 48,299 | | | | 1,901 | | | | 4 | % |
| | | | | | | | | | | | | | | | |
Total segment income from operations | | | 142,095 | | | | 141,457 | | | | 638 | | | | 0 | % |
Merger related depreciation and amortization and other unallocated expenses(1) | | | (38,735 | ) | | | (44,470 | ) | | | 5,735 | | | | -13 | % |
| | | | | | | | | | | | | | | | |
Income from operations | | $ | 103,360 | | | $ | 96,987 | | | $ | 6,373 | | | | 7 | % |
| | | | | | | | | | | | | | | | |
(1) | Primarily represents non-operating depreciation and amortization expenses generated as a result of the Merger and certain non-recurring fees and expenses. |
Income from operations increased $6.4 million or 7% compared with 2014. The increase in income from operations was primarily driven by an increase in income from Merchant Acquiring and Business Solutions, coupled with a decrease in Merger related depreciation and amortization and other unallocated expenses, partially offset by a decrease in income from Payment Processing. Merchant Acquiring income increased by $2.1 million, primarily driven by an increase in sales volume and spread coupled with increased business from the FirstBank merchant portfolio purchased during the fourth quarter of 2015. Business Solutions income increased by $1.9 million as a result of an increase in Core Banking revenues primarily from the Doral Bank consolidation as well as new projects with Popular. Payment Processing income decreased by $3.4 million as a
result of certain repricings that occurred during the fourth quarter of 2014 and reduced revenues from contracts with the Puerto Rico government.
See Note 22 of the Audited Consolidated Financial Statements included in this Annual Report on Form 10-K for additional information on the Company’s reportable segments and for a reconciliation of income from operations to net income.
Non-operating expenses
| | | | | | | | | | | | | | | | |
| | | Years ended
December 31, | | | | | | | |
| (Dollar amounts in thousands) | | 2015 | | | 2014 | | | Variance | |
Non-operating income (expenses) | | | | | | | | | | | | | | | | |
Interest income | | $ | 495 | | | $ | 328 | | | $ | 167 | | | | 51 | % |
Interest expense | | | (24,266 | ) | | | (25,772 | ) | | | 1,506 | | | | -6 | % |
Earnings of equity method investment | | | 147 | | | | 1,140 | | | | (993 | ) | | | -87 | % |
Other income (expenses) | | | 2,306 | | | | 2,375 | | | | (69 | ) | | | -3 | % |
| | | | | | | | | | | | | | | | |
Total non-operating expenses | | $ | (21,318 | ) | | $ | (21,929 | ) | | $ | 611 | | | | -3 | % |
| | | | | | | | | | | | | | | | |
Total non-operating expenses decreased $0.6 million when compared with the prior year. The decrease is primarily driven by a $1.5 million decrease in interest expense mainly as a result of a decrease of 25 basis points in the interest rate as a result of the senior secured leverage ratio decreasing below 3.50x coupled with a lower outstanding loan balance. The decrease was partially offset by a $1.0 million decrease in earnings from our equity method investment in the Dominican Republic, CONTADO.
Income tax (benefit) expense
Income tax benefit for the year ended December 31, 2015 amounted to approximately $3.3 million compared with an income tax expense of $8.9 million in 2014. The $12.6 million increase in tax benefit is primarily driven by the reversal of liabilities related to an uncertain tax position for which the statute of limitations expired during the third quarter of 2015.
See Note 18 of the Notes to Audited Consolidated Financial Statements included in this Annual Report on Form 10-K for additional information regarding income taxes.
sales.
Liquidity and Capital Resources
Our principal source of liquidity is cash generated from operations, and our primary liquidity requirements are the funding of capital expenditures
principal debt repayments and working capital needs. We also have a
$100.0$125.0 million revolving credit facility, of which
$72$116.9 million was available as of December 31,
2016.2019. The Company issues letters of credit against our revolving credit facility which reduce our availability of funds to be drawn.
At December 31,
2016,2019, we had cash
and cash equivalents of
$51.9$111.0 million, of which
$35.5$57.8 million resides in our subsidiaries located outside of Puerto Rico for purposes of (i) funding the respective subsidiary’s current business operations and (ii) funding potential future investment outside of Puerto Rico. We intend to indefinitely reinvest these funds outside of Puerto Rico, and based on our liquidity forecast, we will not need to repatriate this cash to fund
ourthe Puerto Rico operations or to meet debt-service obligations. However, if in the future we determine that we no longer need to maintain
such cash balances within our foreign subsidiaries, we may elect to distribute such cash to the Company in Puerto Rico. Distributions from the foreign subsidiaries to Puerto Rico
are likelymay be subject to tax withholding and other tax consequences.
Additionally, our credit agreement imposes certain restrictions on the distribution of dividends from subsidiaries.
Our primary use of cash is for operating expenses, working capital requirements,
acquisitions, capital expenditures, dividend payments, share repurchases, debt service,
acquisitions and other transactions as opportunities present themselves.
Based on our current level of operations, we believe our cash flows from operations and the available
senior secured
revolving credit facilityRevolving Credit Facility will be adequate to meet our liquidity needs for the next twelve months. However, our ability to fund future operating expenses, dividend payments, capital expenditures, mergers and acquisitions, and our ability to make scheduled payments of interest, to pay principal on or refinance our indebtedness and to satisfy any other of our present or future debt obligations will depend on our future operating performance, which
willmay be affected by general economic, financial and other factors beyond our control.
Comparison of the years ended December 31, 20162019 and 2015The following table presents our cash flows from operations, investing and financing activities for the years ended December 31, 2016 and 2015:
| | | | | | | | |
| | | Years ended December 31, | |
| (Dollar amounts in thousands) | | 2016 | | | 2015 | |
Cash provided by operating activities | | $ | 168,054 | | | $ | 162,419 | |
Cash used in investing activities | | | (54,083 | ) | | | (53,068 | ) |
Cash used in financing activities | | | (90,798 | ) | | | (112,718 | ) |
| | | | | | | | |
Increase (decrease) in cash | | $ | 23,173 | | | $ | (3,367 | ) |
| | | | | | | | |
Net cash provided by operating activities for the year ended December 31, 2016 was $168.1 million, an increase of $5.6 million compared with 2015. The increase was driven by less cash used to pay accounts payable and accrued liabilities and an increase in unearned income.
Net cash used in investing activities amounted to $54.1 million, primarily driven by additions to software amounting to $23.8 million, acquisitions of property and equipment of $18.5 million and the completion of the Processa and the Accuprint purchase transactions for $15.6 million in cash.
Net cash used in financing activities for the year ended December 31, 2016 amounted to $90.8 million, a decrease of $21.9 million when compared with the prior year. The decrease is driven by less cash used in the repurchase of common stock, coupled with an increase in cash provided by short-term borrowings partially offset by cash paid during the year for amendments made to the Company’s debt agreement, credit amendment fees of $3.6 million and debt issue costs of $4.8 million.
Comparison of the years ended December 31, 2015 and 2014
2018
The following table presents our cash flows from operations for the years ended December 31, 20152019 and 2014: | | | | | | | | |
| | | Years ended December 31, | |
| (Dollar amounts in thousands) | | 2015 | | | 2014 | |
Cash provided by operating activities | | $ | 162,419 | | | $ | 139,819 | |
Cash used in investing activities | | | (53,068 | ) | | | (25,831 | ) |
Cash used in financing activities | | | (112,718 | ) | | | (104,149 | ) |
| | | | | | | | |
(Decrease) increase in cash | | $ | (3,367 | ) | | $ | 9,839 | |
| | | | | | | | |
2018:
|
| | | | | | | | |
| | | Years ended December 31, |
| (In thousands) | | 2019 | | 2018 |
| Cash provided by operating activities | | $ | 179,949 |
| | $ | 172,734 |
|
| Cash used in investing activities | | (65,347 | ) | | (41,300 | ) |
| Cash used in financing activities | | (70,227 | ) | | (105,055 | ) |
| Increase in cash, cash equivalents and restricted cash | | $ | 44,375 |
| | $ | 26,379 |
|
Net cash provided by operating activities for the year ended December 31,
20152019 was
$162.4$179.9 million, an increase of
$22.6$7.2 million compared with
2014.2018. The increase
in cash provided by operating activities was
primarily driven by
higherthe increase in net income
from operations in 2015, coupled with
lessmore cash received from accounts receivable, partially offset by cash used to pay
down accounts payable and accrued liabilities.
Net cash used in investing activities increased by
$27.2$24.0 million
primarily driven byto $65.3 million. The increase is mainly related to increased capital expenditures of $18.6 million. In 2019, capital expenditures amounted to $59.9 million, compared with $41.3 million in 2018. In addition, in the
FirstBank merchant portfolio transaction in whichfourth quarter of 2019, the Company
purchasedused $5.6 million in the
FirstBank merchant portfolio and certain POS machines for $11.5 million. In addition, restrictedacquisition of PlacetoPay, net of cash
increased by $6.1 million.received.
Net cash used in financing activities for the year ended December 31, 20152019 amounted to $112.7$70.2 million, an increasea decrease of $8.6$34.8 million when compared with the prior year. The increasedecrease is drivenmainly a result of the prior year repayment of long-term debt concurrent with the issuance of new debt under the 2018 Credit Agreement. The decrease was partially offset by more cash
used
in the repurchasefor repurchases of common stock
partially offset by lessof $21.8 million, for cash
used to pay down short term borrowings duringdividends of $7.1 million and for withholding taxes on restricted stock compensation of $6.7 million, all when compared with amounts incurred in the
prior year.
Our principal
use of capital resources include capital expenditures
are forsuch as hardware and computer software (purchased and internally developed), additions to property and equipment and
business combination transactions, including the purchase of Processa and Accuprint during 2016 for $15.6 million. In connection with the Accuprint acquisition, we have recorded a $1.1 million contingent liability to be settled in two years.acquisitions. We invested approximately
$57.9$59.9 million,
$47.0$41.3 million, and
$25.6$33.5 million
on capital expenditures for hardware and computer software and property and equipment for the years ended December 31,
2016, 20152019, 2018 and
2014,2017, respectively.
In terms of acquisitions, in 2019, we completed the purchase of PlacetoPay for $6.3 million, while in 2017, we completed the purchase of EVERTEC Chile for $42.8 million. Capital expenditures are expected to be funded by cash flow from operations and, if necessary, borrowings under our revolving credit facility.
Dividend Payments
We currently have a policy under which we pay
The Company pays a regular quarterly dividend on
our common stock, subject to the declaration thereof
each quarter by our
Board.Board each quarter. Any declaration and payment of future dividends to holders of our common stock will be at the discretion of our Board and will depend on many factors, including our financial condition, earnings, available cash, business opportunities, legal requirements, restrictions in our debt agreements and other contracts, capital requirements, level of indebtedness and other factors that our Board deems relevant. Refer to the table below for details regarding our dividends in
20162019 and
2015: | | | | | | | | |
Declaration Date
| | Record Date | | Payment Date | | Dividend
per share | |
February 18, 2015
| | March 2, 2015 | | March 19, 2015 | | | 0.10 | |
May 6, 2015
| | May 18, 2015 | | June 5, 2015 | | | 0.10 | |
August 5, 2015
| | August 17, 2015 | | September 3, 2015 | | | 0.10 | |
November 4, 2015
| | November 16, 2015 | | December 4, 2015 | | | 0.10 | |
February 17, 2016
| | February 29, 2016 | | March 17, 2016 | | | 0.10 | |
May 11, 2016
| | May 23, 2016 | | June 10, 2016 | | | 0.10 | |
July 28, 2016
| | August 9, 2016 | | September 2, 2016 | | | 0.10 | |
October 27, 2016
| | November 14, 2016 | | December 2, 2016 | | | 0.10 | |
2018:
|
| | | | | | | | |
| Declaration Date | | Record Date | | Payment Date | | Dividend per share |
| July 26, 2018 | | August 6, 2018 | | September 7, 2018 | | $ | 0.05 |
|
| October 25, 2018 | | November 5, 2018 | | December 7, 2018 | | 0.05 |
|
| February 15, 2019 | | February 26, 2019 | | March 22, 2019 | | 0.05 |
|
| April 25, 2019 | | May 6, 2019 | | June 7, 2019 | | 0.05 |
|
| July 25, 2019 | | August 5, 2019 | | September 6, 2019 | | 0.05 |
|
| October 23, 2019 | | November 4, 2019 | | December 6, 2019 | | 0.05 |
|
During
2016,2019, the Company repurchased
2,504,4271,104,389 shares of the Company’s common stock at a cost of
$39.9$31.8 million. The Company funded such repurchase with cash on hand and borrowings under the existing revolving credit facility.
During
2015,2018, the Company repurchased
3,012,826367,403 shares of the Company’s common stock at a cost of
$54.9$10.0 million. The Company funded such repurchase with cash on hand and borrowings under the existing revolving credit facility.
During
the fourth quarter of 2014,2017, the Company repurchased
1,201,194465,240 shares of the Company’s common stock at a cost of
$26.2$7.7 million. The Company funded such repurchase with cash on hand and borrowings under the existing revolving credit facility.
Repurchases may be accomplished through open market transactions, privately negotiated transactions, accelerated share repurchase programs and other means.
2018 Senior Secured Credit Facilities
On
April 17, 2013,November 27, 2018, EVERTEC and EVERTEC Group
(“Borrower”) entered into a credit agreement
(the “2013 Credit Agreement”) governing the senior secured credit facilities, consisting of a
$300.0$220.0 million term loan A facility
(the “Term A Loan”that matures on November 27, 2023 ("2023 Term A"), a
$400.0$325.0 million term loan B facility
(the “Term B Loan”that matures on November 27, 2024 ("2024 Term B") and a
$100.0$125.0 million revolving credit
facility.facility (the "Revolving Facility") that matures on November 27, 2023, with a syndicate of lenders and Bank of America, N.A. (“Bank of America”), as administrative agent, collateral agent, swingline lender and line of credit issuer (collectively the “2018 Credit Agreement”). The material terms and conditions of the senior secured credit facilities are summarized below.
Scheduled Amortization Payments
The 2023 Term A
LoanThe Term A Loan requires principal payments onprovides for amortization in the last business dayamount of each quarter equal to (a) 1.250%1.25% of the original principal amount commencing on September 30, 2013 through June 30, 2016; (b) 1.875% of the original principal amount from September 30, 2016 through June 30, 2017; (c) 2.50% of the original principal amount from September 30, 2017 through March 31, 2018; and (d) the remaining outstanding principal amount on the maturity of the2023 Term A Loan on April 17, 2018. Interest is based on EVERTEC Group LLC’s (“EVERTEC Group”) first lien secured net leverage ratio and payable at a rate equal to, at the Company’s option, either (a) LIBOR Rate plus an applicable margin ranging from 2.00% to 2.50%, or (b) Alternate Base Rate (“ABR”), as defined in the 2013 Credit Agreement, plus an applicable margin ranging from 1.00% to 1.50%. The Term A Loan has no LIBOR or Base Rate minimum or floor.
Term B Loan
The Term B Loan requires principal payments on the last business day of each quarter equal to 0.250% of the original principal amount commencing on September 30, 2013 and the remaining outstanding principal amount on the maturity of the Term B Loan on April 17, 2020. Interest is based on EVERTEC Group’s first lien secured net leverage ratio and payable at a rate equal to, at the Company’s option, either (a) LIBOR Rate plus an applicable margin ranging from 2.50% to 2.75%, or (b) Base Rate plus an applicable margin ranging from 1.50% to 1.75%. The LIBOR Rate and Base Rate are subject to floors of 0.75% and 1.75%, respectively.
Revolving Credit Facility
The revolving credit facility has an available balance up to $100.0 million, with an interest rate on loans calculated the same as the applicable Term A Loan rate. The facility matures on April 17, 2018 and has a “commitment fee” payable one business day after the last business day of each quarter calculated based on the daily unused commitment during the preceding quarter. The commitment fee for the unused portion of this facility ranges from 0.125% to 0.375% and is based on EVERTEC Group’s first lien secured net leverage ratio.
All loans may be prepaid without premium or penalty.
The senior secured credit facilities contain various restrictive covenants. As a result of the Third Amendment (as defined below), the Term A Loan and the revolving credit facility (subject to certain exceptions) require the Company to maintain on a quarterly basis a specified maximum senior secured leverage ratio of up to 4.75 to 1.00 as defined in the 2013 Credit Agreement (total first lien secured debt to adjusted EBITDA) until September 30, 2018 and 4.25 to 1.00 for any fiscal quarter ending thereafter. In addition, the 2013 Credit Agreement, among other things: (a) limits the Company’s ability and the ability of the Company’s subsidiaries to incur additional indebtedness, incur liens, pay dividends or make certain other restricted payments, as all net assets are restricted, and enter into certain transactions with affiliates; (b) restricts the Company’s ability to enter into agreements that would restrict the ability of the Company’s subsidiaries to pay dividends or make certain payments to EVERTEC; and (c) places restrictions on the Company’s ability and the ability of the Company’s subsidiaries to merge or consolidate with any other person or sell, assign, transfer, convey or otherwise dispose of all or substantially all of the Company’s assets.
Amendments to the 2013 Credit Agreement
During the second quarter of 2016, EVERTEC Group, together with certain other direct and indirect subsidiaries of the Company, entered into a second amendment and waiver to the outstanding Credit Agreement (the “Second Amendment”). The Company paid each lender that consented to the amendment a fee equal to 0.50% of the aggregate principal amount of outstanding term loans and revolving commitments held by such lender. The credit amendment fees paid during the second quarter of 2016 amounted to $3.6 million.
During the fourth quarter of 2016, EVERTEC Group, together with certain other direct and indirect subsidiaries of the Company, entered into a third amendment (the “Third Amendment”) to the 2013 Credit Agreement. The Third Amendment extends the maturity of (a) approximately $219 million of EVERTEC Group’s existing approximately $250 million of Term A loan facility to January 17, 2020 (the “2020 Term A loan”) and (b) $65 million of EVERTEC Group’s existing $100 million of revolving credit facility to January 17, 2020. The remaining approximately $30 million of Term A loan (the “2018 Term A loan”) and the $35 million of revolving credit facility that were not extended will remain in place and mature as originally scheduled on April 17, 2018. The Term B loan facility will remain in place and mature as originally scheduled on April 17, 2020 (collectively, the “Senior Secured term loans”).
Under the terms of the Third Amendment, the 2018 Term A Loan amortizes on a basis of 1.875% of the original principal amount beginning in the third quarter of 2016 and during each of the next three first twelve quarters starting from the quarter ending March 31, 2019, 1.875% during each of the four subsequent
quarters and 2.50% of the original principal amount during each of the final three quarters, with the balance payable on the final maturity date.
The
20202024 Term
A Loan amortizes on a basis of 1.50%B provides for quarterly amortization payments totaling 1.00% per annum of the original principal amount
beginning in the fourth quarter of 2016 and during each of the
next five quarters, 1.875% of the original principal amount during each of the four subsequent quarters, and 2.50% of the original principal amount during each of the final three quarters,2024 Term B, with the balance payable on the final maturity date.
Voluntary Prepayments and Reduction and Termination of Commitments
The applicable marginterms of the 2018 senior secured credit facilities allow EVERTEC Group to prepay loans and permanently reduce the loan commitments under the 2013senior secured credit facilities at any time, subject to the payment of customary LIBOR breakage costs, if any, provided that, in connection with certain refinancing or repricing of the 2024 Term B on or prior to the date which is six months after the closing date of the 2018 Credit Agreement, a prepayment premium of 1.00% will be required.
Additionally, the terms of the facilities require mandatory repayment of outstanding principal balances based on a percentage of excess cash flow provided that no such prepayment shall be due if the resulting amount of the excess cash flow times the applicable percentage is less than $10 million.
Interest
The interest rates under the 2023 Term A and revolving credit facility are based on, at EVERTEC Group’s option, (a) adjusted LIBOR plus an interest margin of 2.25% or (b) the greater of (i) with respect to any 2018Bank of America’s “prime rate,” (ii) the Federal Funds Effective Rate plus 0.5% and (iii) adjusted LIBOR plus 1.0% (“ABR”) plus an interest margin of 1.25%. The interest rates under the 2024 Term B are based on, at EVERTEC Group’s option, (a) adjusted LIBOR plus an interest margin of 3.50% or (b) ABR plus an interest margin of 2.50%. The interest margins under the 2023 Term A Loan, 2.50% per annum in the case of any LIBOR Loan and 1.50% per annum in the case of any ABR LoanRevolving Facility are subject to reduction based on achievement of specific first lienspecified total secured net leverage ratios, (ii)ratio.
Guarantees and Collateral
EVERTEC Group’s obligations under the senior secured credit facilities and under any cash management, interest rate protection or other hedging arrangements entered into with respecta lender or any affiliate thereof are guaranteed by EVERTEC and each of EVERTEC’s existing wholly-owned subsidiaries (other than EVERTEC Group) and subsequently acquired or organized subsidiaries, subject to certain exceptions.
Subject to certain exceptions, the senior secured credit facilities are secured to the extent legally permissible by substantially all of the assets of (1) EVERTEC, including a perfected pledge of all of the limited liability company interests of EVERTEC Intermediate Holdings, LLC (“Holdings”), (2) Holdings, including a perfected pledge of all of the limited liability company interests of EVERTEC Group and (3) EVERTEC Group and the subsidiary guarantors, including but not limited to: (a) a pledge of substantially all capital stock held by EVERTEC Group or any guarantor and (b) a perfected security interest in substantially all tangible and intangible assets of EVERTEC Group and each guarantor.
Covenants
The senior secured credit facilities contain affirmative and negative covenants that the Company believes are usual and customary for a senior secured credit agreement. The negative covenants in the senior secured credit facilities include, among other things, limitations (subject to exceptions) on the ability of EVERTEC and its restricted subsidiaries to:
declare dividends and make other distributions;
redeem or repurchase capital stock;
grant liens;
make loans or investments (including acquisitions);
merge or enter into acquisitions;
sell assets;
enter into any sale or lease-back transactions;
incur additional indebtedness;
prepay, redeem or repurchase certain indebtedness;
modify the terms of certain debt;
restrict dividends from subsidiaries;
change the business of EVERTEC or its subsidiaries; and
enter into transactions with their affiliates.
In addition, the 2023 Term A and the Revolving Facility require EVERTEC to maintain a maximum total secured net leverage ratio of 4.25 to 1.00 for any quarter ending on or prior to September 30, 2020 and for fiscal quarters ending thereafter, 4.00 to 1.00.
Concurrently with the execution of the 2018 Credit Agreement, the Company terminated the existing senior secured credit facilities. The net proceeds received by EVERTEC Group from the senior secured credit facilities under the 2018 Credit Agreement, together with other cash available to EVERTEC Group, were used, among other things, to refinance EVERTEC Group’s previous senior secured credit facilities, which consisted of a $191.4 million 2020 Term A
Loan, 2.50% per annum in the case of any LIBOR Loan and
1.50% per annum in the case of any ABR Loan, (iii) with respect to anya $379.0 million Term B,
Loan, 2.75% per annum inunder the
casecredit agreement, dated as of
any LIBOR LoanApril 17, 2013 and
1.75% per annum inas subsequently amended, among EVERTEC Intermediate Holdings, LLC, EVERTEC Group, JPMorgan Chase Bank, N.A., as administrative agent, collateral agent, swingline lender and L/C issuer, and the
caselenders party thereto. In connection with this transaction the Company recognized a loss on extinguishment of
any ABR Loan subject to reduction based on achievement of specific first lien secured leverage ratios, and (iv) with respect to any Revolving Facility Loan, (A) 2.50% per annum in the case of any LIBOR Loan and (B) 1.50% per annum in the case of any ABR Loan.$2.6 million.
The unpaid principal balance at December 31,
20162019 of the
2018 Term A Loan, the 20202023 Term A Loan and the
2024 Term B Loan was
$29.5 million, $216.0$209.0 million, and
$386.0$321.8 million, respectively. The additional borrowing capacity for the Revolving Facility loan at December 31,
20162019 was
$72.0$116.9 million.
See Note 11 The Company issues letters of credit against the revolving credit facility which reduce the additional borrowing capacity of the Audited Consolidated Financial Statements appearing elsewhererevolving credit facility.
Events of Default
The events of default under the senior secured credit facilities include, without limitation, nonpayment, material misrepresentation, breach of covenants, insolvency, bankruptcy, certain judgments, change of control (as defined in
this Annual Reportthe 2018 Credit Agreement) and cross-events of default on
Form 10-K for additional information.Notematerial indebtedness.
In
December 2014, June 2015, and May 2016, EVERTEC Group entered into
a non-interest bearing financing
agreementsagreement amounting to
$4.6 million, $1.1 million and $0.7
million, respectively, and in October 2016 entered into an interest bearing agreement of $1.1 million to purchase software. As of December 31,
20162019 and
2015,December 31, 2018, the outstanding principal balance of the
notesnote payable was
$3.4$0.2 million and
$4.2$0.3 million, respectively. The current portion of
these notesthis note is recorded as part of accounts payable and the long-term portion is included in other long-term liabilities.
Interest Rate Swap
In December 2019, EVERTEC Group entered into two non-interest bearing financing agreements amounting to $2.4 million to purchase software and maintenance. As of December 31, 20162019, the outstanding principal balance of the notes payable was $2.4 million, recorded as part of accounts payable and 2015,the long-term portion is included in other long-term liabilities.
Interest Rate Swaps
At December 31, 2019, the Company
has the followinghad two interest rate swap
agreement convertingagreements, entered into in December 2015 and December 2018, which convert a portion of the interest rate
exposurepayments on the
Company’sCompany's 2023 Term B
loanLoan from variable to fixed:
| | | | | |
| | | | | | | | | | |
Swap Agreement | | Effective date | | Maturity Date | | | Notional Amount | | | Variable Rate | | | Fixed Rate |
| 2015 Swap | |
January 2017 | | | April 2020 | | | $ | 200 million | | | | 1-month LIBOR | | 1.9225% |
| 2018 Swap | | 1.9225April 2020 | % | November 2024 | | $250 million | | 1-month LIBOR | | 2.89% |
The Company has accounted for
this transactionthese transactions as
a cash flow
hedge. The fair value of the Company’s derivative instruments is determined using standard valuation models. The significant inputs used in these models are readily available in public markets, or can be derived from observable market transactions, and therefore have been classified as Level 2. Inputs used in these standard valuation models for derivative instruments include the applicable forward rates and discount rates.As ofhedges.
At December 31,
20162019 and
2015,2018, the carrying amount of the
derivativederivatives on the Company’s balance
sheetsheets is as follows:
| | | | | | | | |
| (Dollar amounts in thousands) | | December 31, 2016 | | | December 31, 2015 | |
Other long-term liabilities | | $ | 1,964 | | | $ | 515 | |
|
| | | | | | | | |
| (In thousands) | | December 31, 2019 | | December 31, 2018 |
| Other long-term assets | | $ | — |
| | $ | 1,683 |
|
| Other long-term liabilities | | 14,452 |
| | 4,059 |
|
For the year ended December 31, 2019, the Company recognized gains related to hedging activities on the Statement of Income and Comprehensive Income that offset the Company's interest expense as follows:
|
| | | | |
| (In thousands) | | December 31, 2019 |
| Interest expense | | $ | 677 |
|
During the year ended December 31, 2019, the Company reclassified gains of $0.7 million from accumulated other comprehensive loss into income through interest expense. Based on current LIBOR rates, the Company expects to reclassify losses of $2.2 million from accumulated other comprehensive loss into income through interest expense over the next 12 months. Refer to Note 13 for tabular disclosure of the fair value of the derivative and to Note 15 for tabular disclosure of gains (losses) recorded on cash flow hedging activities.
The cash flow
hedge ishedges are considered highly
effective and no impact on earnings is expected due to hedge ineffectiveness.effective.
Covenant Compliance
The credit facilities contain various restrictive covenants. The Term A Loan and the revolving facility (subject to certain exceptions) require EVERTEC Group to maintain on a quarterly basis a specified maximum senior secured leverage ratio of up to 4.75 to 1.00 as defined in the third amendment to the 2013 Credit Agreement (total first lien senior secured debt to Adjusted EBITDA) until September 30, 2018 and 4.25 to 1.00 for any fiscal quarter ending thereafter. In addition, the 2013 Credit Agreement, among other things: (a) limits EVERTEC Group’s ability and the ability of its subsidiaries to incur additional indebtedness, incur liens, pay dividends or make certain other restricted payments and enter into certain transactions with affiliates; (b) restricts EVERTEC Group’s ability to enter into agreements that would restrict the ability of its subsidiaries to pay dividends or make certain payments to its parent company; and (c) places restrictions on EVERTEC Group’s ability and the ability of its subsidiaries to merge or consolidate with any other person or sell, assign, transfer, convey or otherwise dispose of all or substantially all of their assets. However, all of the covenants in these agreements are subject to significant exceptions.
As of December 31,
2016,2019, the
seniortotal secured
net leverage ratio was
3.382.07 to 1.00. As of the date of filing of this Form 10-K,
except as otherwise disclosed to the Administrative Agent (and for which corrective action has been taken and publicly disclosed by the Company in its Form 8-K filed with the SEC on April 14, 2016), no event has occurred that constitutes an Event of Default or Default.
In this Annual Report on Form 10-K, we refer to the term “Adjusted EBITDA” to mean EBITDA as so defined and calculated for purposes of determining compliance with the
seniortotal secured
net leverage ratio based on the financial information for the last twelve months at the end of each quarter.
Net Income Reconciliation to EBITDA, Adjusted EBITDA,
and Adjusted Net Income
and Adjusted Earnings per common share (Non-GAAP Measures)
We define “EBITDA” as earnings before interest, taxes, depreciation and amortization. We define “Adjusted EBITDA” as EBITDA further adjusted to exclude unusual items and other adjustments described below.
Adjusted EBITDA by segment is reported to the chief operating decision maker for purposes of making decisions about allocating resources to the segments and assessing their performance. For this reason, Adjusted EBITDA, as it relates to our segments, is presented in conformity with Accounting Standards Codification 280, Segment Reporting, and is excluded from the definition of non-GAAP financial measures under the Securities and Exchange Commission's Regulation G and Item 10(e) of Regulation S-K. We define “Adjusted Net Income” as net income adjusted to exclude unusual items and other adjustments described below.
We define “Adjusted Earnings per common share” as Adjusted Net Income divided by diluted shares outstanding.
We present EBITDA and Adjusted EBITDA because we consider them important supplemental measures of our performance and believe they are frequently used by securities analysts, investors and other interested parties in
the evaluation of ourselves and other companies in our industry. In addition, our presentation of Adjusted EBITDA is substantially consistent with the equivalent measurements that are contained in the senior secured credit facilities in testing EVERTEC Group’s compliance with covenants therein such as the seniortotal secured net leverage ratio. We use Adjusted Net Income to measure our overall profitability because we believe it better reflects our comparable operating performance by excluding the impact of the non-cash amortization and depreciation that was created as a result of the Merger. In addition, in evaluating EBITDA, Adjusted EBITDA, and Adjusted Net Income and Adjusted Earnings per common share, you should be aware that in the future we may incur expenses such as those excluded in calculating them. Further, our presentation of these measures should not be construed as an inference that our future operating results will not be affected by unusual or nonrecurring items.
Some of the limitations of EBITDA, Adjusted EBITDA,
and Adjusted Net Income
and Adjusted earnings per common share are as follows:
they do not reflect cash outlays for capital expenditures or future contractual commitments;
they do not reflect changes in, or cash requirements for, working capital;
although depreciation and amortization are non-cash charges, the assets being depreciated and amortized will often have to be replaced in the future, and EBITDA and Adjusted EBITDA do not reflect cash requirements for such replacements;
in the case of EBITDA and Adjusted EBITDA, they do not reflect interest expense, or the cash requirements necessary to service interest, or principal payments, on indebtedness;
in the case of EBITDA and Adjusted EBITDA, they do not reflect income tax expense or the cash necessary to pay income taxes; and
other companies, including other companies in our industry, may not use EBITDA, Adjusted EBITDA, and Adjusted Net Income, and Adjusted Earnings per common share or may calculate EBITDA, Adjusted EBITDA, Adjusted Net
Income and Adjusted Net IncomeEarnings per common share differently than as presented in this Report, limiting their usefulness as a comparative measure.
EBITDA, Adjusted EBITDA, Adjusted Net Income and Adjusted Earnings per common share are not measurements of liquidity or financial performance under GAAP. You should not consider EBITDA, Adjusted EBITDA, Adjusted Net Income and Adjusted Earnings per common share as alternatives to cash flows from operating activities or any other performance measures determined in accordance with GAAP, as an indicator of cash flows, as a measure of liquidity or as an alternative to operating or net income determined in accordance with GAAP.
A reconciliation of net income to EBITDA, Adjusted EBITDA,
and Adjusted Net Income
and Adjusted Earnings per common share is provided below:
| | | | |
| (Dollar amounts in thousands, except per share data) | | Year ended
December 31,
2016 | |
Net Income | | $ | 75,126 | |
Income tax expense | | | 8,271 | |
Interest expense, net | | | 24,240 | |
Depreciation and amortization | | | 59,567 | |
| | | | |
| |
EBITDA | | | 167,204 | |
Software maintenance reimbursement and other costs(1) | | | 521 | |
Equity income(2) | | | (19 | ) |
Compensation and benefits(3) | | | 10,482 | |
Transaction, refinancing and other non-recurring fees(4) | | | 7,579 | |
Restatement related expenses(5) | | | 1,837 | |
| | | | |
| |
Adjusted EBITDA | | | 187,604 | |
Operating depreciation and amortization(6) | | | (28,468 | ) |
Cash interest expense, net(7) | | | (20,468 | ) |
Income tax expense(8) | | | (13,752 | ) |
Non-controlling interest(9) | | | (258 | ) |
| | | | |
| |
Adjusted Net Income | | $ | 124,658 | |
Net Income per common share (GAAP): | | | | |
Diluted | | $ | 1.01 | |
Adjusted Earnings per common share (Non-GAAP): | | | | |
Diluted | | $ | 1.67 | |
Shares used in computing Adjusted Net Income per common share: | | | | |
Diluted | | | 74,473,369 | |
|
| | | | |
| | | Year Ended December 31, 2019 |
| (Dollar amounts in thousands) | | |
| Net income | | $ | 103,700 |
|
| Income tax expense | | 12,975 |
|
| Interest expense, net | | 27,594 |
|
| Depreciation and amortization | | 68,082 |
|
| EBITDA | | 212,351 |
|
Equity income (1) | | (451 | ) |
Compensation and benefits (2) | | 13,798 |
|
Transaction, refinancing and other fees (3) | | 498 |
|
| Adjusted EBITDA | | 226,196 |
|
Operating depreciation and amortization (4) | | (34,880 | ) |
Cash interest expense, net (5) | | (27,016 | ) |
Income tax expense (6) | | (20,239 | ) |
Non-controlling interest (7) | | (347 | ) |
| Adjusted net income | | $ | 143,714 |
|
| Net income per common share (GAAP): | | |
| Diluted | | $ | 1.41 |
|
| Adjusted Earnings per common share (Non-GAAP): | | |
| Diluted | | $ | 1.96 |
|
| Shares used in computing adjusted earnings per common share: | | |
| Diluted | | 73,475,763 |
|
1) |
Predominantly represents reimbursements received for certain software maintenance expenses as part of the Merger. |
|
2) | |
| 1) | Represents the elimination of non-cash equity earnings from our 19.99% equity investment in CONTADO,Dominican Republic, Consorcio de Tarjetas Dominicanas, S.A. (“CONTADO”), net of cash dividends received. |
3) | |
| 2) | Primarily represents share-based compensation and other compensation expense of $6.4 million and severance payments of $3.7 million for the year ended December 31, 2016.payments. |
4) | Primarily represents |
| 3) | Represents fees and expenses associated with corporate transactions as defined in the Credit Agreement, certain fees paid to resolve a software maintenance contract matter, fees paid in connection with the debt refinancingrecorded as part of selling, general and a software impairment charge.administrative expenses and cost of revenues. |
5) | Represents consulting, audit and legal expenses incurred as part of the restatement. |
6)4) | Represents operating depreciation and amortization expense, which excludes amounts generated as a result of the Merger.Merger and from purchase accounting intangibles generated from acquisitions. |
7) | |
| 5) | Represents interest expense, less interest income, as they appear on our consolidated statements of income and comprehensive income, adjusted to exclude non-cash amortization of the debt issue costs, premium and accretion of discount. |
8) | |
| 6) | Represents income tax expense calculated on adjusted pre-tax income using the applicable GAAP tax rate.rate, adjusted for certain discreet items. |
9) | |
| 7) | Represents the 35% non-controlling equity interest in Processa,Evertec Colombia, net of amortization for intangibles created as part of the purchase. |
The Company’s contractual obligations as of December 31,
20162019 are as follows:
| | | | | | | | | | | | | | | | | | | | |
| | | Payment due by periods | |
| (Dollar amounts in thousands) | | Total | | | Less than
1 year | | | 1-3 years | | | 3-5 years | | | After
5 years | |
Long-term debt(1) | | $ | 692,604 | | | $ | 39,932 | | | $ | 108,098 | | | $ | 544,574 | | | $ | — | |
Operating leases(2) | | | 23,472 | | | | 6,971 | | | | 13,953 | | | | 2,144 | | | | 404 | |
Short-term borrowings(3) | | | 28,277 | | | | 28,277 | | | | — | | | | — | | | | — | |
Other long-term liabilities | | | 4,448 | | | | 3,204 | | | | 1,055 | | | | 189 | | | | — | |
| | | | | | | | | | | | | | | | | | | | |
Total | | $ | 748,801 | | | $ | 78,384 | | | $ | 123,106 | | | $ | 546,907 | | | $ | 404 | |
| | | | | | | | | | | | | | | | | | | | |
|
| | | | | | | | | | | | | | | | | | | | |
| | | Payment due by periods |
| (In thousands) | | Total | | Less than
1 year | | 1-3 years | | 3-5 years | | After 5 years |
Long-term debt (1) | | $ | 642,869 |
| | $ | 39,728 |
| | $ | 279,355 |
| | $ | 323,786 |
| | $ | — |
|
Operating leases (2) | | 34,669 |
| | 6,574 |
| | 16,803 |
| | 8,927 |
| | 2,365 |
|
| Other long-term liabilities | | 2,622 |
| | 1,061 |
| | 1,561 |
| | — |
| | — |
|
| Total | | $ | 680,160 |
| | $ | 47,363 |
| | $ | 297,719 |
| | $ | 332,713 |
| | $ | 2,365 |
|
| |
| (1) | Long-term debt includes principal balance of $530.8 million and the payments of cash interest (based on interest rates as of December 31, 20162019 for variable rate debt) and aggregate principal amount of the senior secured term loan facilities, as well as commitments fees related to the unused portion of our senior secured revolving credit facility, as required under the terms of the long-term debt agreements. |
| |
| (2) | Includes certain facilities and equipment under operating leases. See Note 2122 of the Notes to Audited Consolidated Financial Statements for additional information regarding operating lease obligations. |
(3) | Excludes the payments of cash interest related to the outstanding portion of the senior secured revolving credit facility as of December 31, 2016. |
The table above excludes other obligations that we may have classified as other long term liabilities in our consolidated balance sheet, because the timing of the related payments is not determinable or because there is no contractual obligation associated with the underlying obligations.
Off Balance Sheet Arrangements
In the ordinary course of business, the Company may enter into commercial commitments.
AsWith the exception of the letters of credit issued against the Revolving Facility which reduce the additional borrowing capacity of the Revolving Facility, as of December 31,
2016, we had an2019, the Company did not have any off balance sheet
item of $4.2 million related to the unused amount of windfall that is available to offset future taxable income.See Note 18 of the Audited Consolidated Financial Statements appearing elsewhere in this Annual Report on Form 10-K for additional information related to this off balance sheet item.
items.
Our payment businesses generally
experiencesexperience moderate increased activity during the traditional holiday shopping periods and around other nationally recognized
holidays.holidays, which follow consumer spending patterns.
While inflationary increases in certain inputsinput costs, such as occupancy, labor and benefits, and general administrative costs, have an impact on our operating results, inflation has had minimal net impact on our operating results during the last three years as overall inflation has been partially offset by increased selling processmargins on incremental revenue and cost reduction actions. We cannot assure you, however, that we will not be affected by general inflation in the future.
Item 7A. Quantitative and Qualitative Disclosures about Market Risk
We are exposed to market risks arising from our normal business activities. These market risks principally involve the possibility of change in interest rates that will adversely affect the value of our financial assets and
liabilities or future cash flows and earnings.earnings, and foreign exchange risk that may result in unfavorable foreign currency translation adjustments. Market risk is the potential loss arising from adverse changes in market rates and prices.
We issued floating-rate debt which is subject to fluctuations in interest rates. Our senior secured credit facilities accrue interest at variable rates and only the Term B Loan is subject to floors or minimum rates. A 100 basis point increase in interest rates over our floor(s) on our debt balances outstanding as of December 31,
2016,2019, under the senior secured credit facilities would increase our annual interest expense by approximately
$4.6 million in 2017.$3.3 million. The impact on future interest expense as a result of future changes in interest rates will depend largely on the gross amount of our borrowings at that time.
In December 2015
and December 2018, we entered into
an interest rate swap
agreement withagreements which convert a
notional amount of $200 million, which represents approximately 30%portion of our outstanding
debt. Under this agreement, commencing January 1, 2017, we will receive avariable rate
equaldebt to
the LIBOR rate applicable to our Term B loan, and pay a fixed rate equal to 1.9225%. The net effect of the swap agreement is to fix the interest rate on $200 million of our Term B loan at 4.4225%, beginning January 1, 2017 and ending when the Term B loan matures, in April 2020.fixed.
The interest rate swap exposes us to credit risk in the event that the counterparty to the swap agreement does not or cannot meet its obligations. The notional amount is used to measure interest to be paid or received and does not represent the amount of exposure to credit loss. The loss would be limited to the amount that would have been received, if any, over the remaining life of the swap. The counterparty to the swap is a major
US based financial institution and we expect the counterparty to be able to perform its obligations under the swap. We use derivative financial instruments for hedging purposes only and not for trading or speculative purposes
See Note
1112 of the
Notes to Audited Consolidated Financial Statements appearing elsewhere in this Annual Report on Form 10-K for additional information related to the senior secured credit facilities.
Foreign
currency exchange risk
We conduct business in certain countries in Latin America. Some of this business is conducted in the countries’ local currencies. The resulting foreign currency translation adjustments, from operations for which the functional currency is other than the U.S. dollar, are reported in accumulated other comprehensive loss in the audited consolidated balance sheet, except for highly inflationary environments in which the effects would be included in other operating income in the consolidated statements of income and comprehensive income. At December 31, 2016,2019, the Company had $10.4$16.9 million in an unfavorable foreign currency translation adjustment as part of accumulated other comprehensive loss compared to an unfavorable foreign currency translation adjustment of $7.1$21.6 million at December 31, 2015.2018.
Item 8. Financial Statements and Supplementary Data
The Audited Consolidated Financial Statements, together with EVERTEC’s independent registered public accounting firms reports, are included herein beginning on page F-1 of this Annual Report on Form 10-K.
Selected Quarterly Financial Data
| | | | | | | | | | | | | | | | |
| | | Quarters ended, | |
| (Dollar amounts in thousands, except per share data) | | March 31,
2016 | | | June 30,
2016 | | | September 30,
2016 | | | December 31,
2016 | |
Revenues | | $ | 95,479 | | | $ | 97,672 | | | $ | 94,467 | | | $ | 101,889 | |
Operating costs and expenses | | | 68,913 | | | | 69,480 | | | | 67,460 | | | | 76,509 | |
| | | | | | | | | | | | | | | | |
Income from operations | | | 26,566 | | | | 28,192 | | | | 27,007 | | | | 25,380 | |
Non-operating expenses | | | (5,523 | ) | | | (5,157 | ) | | | (5,657 | ) | | | (7,411 | ) |
| | | | | | | | | | | | | | | | |
Income before income taxes | | | 21,043 | | | | 23,035 | | | | 21,350 | | | | 17,969 | |
Income tax expense | | | 1,876 | | | | 2,801 | | | | 1,639 | | | | 1,955 | |
| | | | | | | | | | | | | | | | |
Net income | | $ | 19,167 | | | $ | 20,234 | | | $ | 19,711 | | | $ | 16,014 | |
| | | | | | | | | | | | | | | | |
Net income attributable to EVERTEC, Inc.’s common stockholders | | $ | 19,148 | | | $ | 20,235 | | | $ | 19,680 | | | $ | 15,972 | |
| | | | | | | | | | | | | | | | |
Net income per common share—basic | | $ | 0.26 | | | $ | 0.27 | | | $ | 0.27 | | | $ | 0.22 | |
| | | | | | | | | | | | | | | | |
Net income per common share—diluted | | $ | 0.26 | | | $ | 0.27 | | | $ | 0.26 | | | $ | 0.22 | |
| | | | | | | | | | | | | | | | |
| | | | | | | | | | | | | | | | |
| | | Quarters ended, | |
| (Dollar amounts in thousands, except per share data) | | March 31,
2015 | | | June 30,
2015 | | | September 30,
2015 | | | December 31,
2015 | |
Revenues | | $ | 91,497 | | | $ | 93,405 | | | $ | 92,941 | | | $ | 95,685 | |
Operating costs and expenses | | | 64,481 | | | | 65,958 | | | | 71,467 | | | | 68,262 | |
| | | | | | | | | | | | | | | | |
Income from operations | | | 27,016 | | | | 27,447 | | | | 21,474 | | | | 27,423 | |
Non-operating expenses | | | (5,697 | ) | | | (5,236 | ) | | | (5,485 | ) | | | (4,900 | ) |
| | | | | | | | | | | | | | | | |
Income before income taxes | | | 21,319 | | | | 22,211 | | | | 15,989 | | | | 22,523 | |
Income tax expense (benefit) | | | 2,775 | | | | 2,645 | | | | (9,347 | ) | | | 592 | |
| | | | | | | | | | | | | | | | |
Net income | | $ | 18,544 | | | $ | 19,566 | | | $ | 25,336 | | | $ | 21,931 | |
| | | | | | | | | | | | | | | | |
Net income per common share—basic | | $ | 0.24 | | | $ | 0.25 | | | $ | 0.33 | | | $ | 0.29 | |
| | | | | | | | | | | | | | | | |
Net income per common share—diluted | | $ | 0.24 | | | $ | 0.25 | | | $ | 0.33 | | | $ | 0.29 | |
| | | | | | | | | | | | | | | | |
|
| | | | | | | | | | | | | | | |
| | Quarters ended, |
| (Dollar amounts in thousands, except per share data) | March 31, 2019 | | June 30, 2019 | | September 30, 2019 | | December 31, 2019 |
| Revenues | $ | 118,836 |
| | $ | 122,548 |
| | $ | 118,804 |
| | $ | 127,186 |
|
| Operating costs and expenses | 81,431 |
| | 84,860 |
| | 84,002 |
| | 92,579 |
|
| Income from operations | 37,405 |
| | 37,688 |
| | 34,802 |
| | 34,607 |
|
| Non-operating expenses | (6,862 | ) | | (8,062 | ) | | (6,296 | ) | | (6,607 | ) |
| Income before income taxes | 30,543 |
| | 29,626 |
| | 28,506 |
| | 28,000 |
|
| Income tax expense | 3,809 |
| | 2,489 |
| | 3,720 |
| | 2,957 |
|
| Net income | $ | 26,734 |
| | $ | 27,137 |
| | $ | 24,786 |
| | $ | 25,043 |
|
| Net income attributable to EVERTEC, Inc.’s common stockholders | $ | 26,644 |
| | $ | 27,058 |
| | $ | 24,754 |
| | $ | 25,013 |
|
| Net income per common share - basic | $ | 0.37 |
| | $ | 0.38 |
| | $ | 0.34 |
| | $ | 0.35 |
|
| Net income per common share - diluted | $ | 0.36 |
| | $ | 0.37 |
| | $ | 0.34 |
| | $ | 0.34 |
|
| | | | | | | | |
| | Quarters ended, |
| (Dollar amounts in thousands, except per share data) | March 31, 2018 | | June 30, 2018 | | September 30, 2018 | | December 31, 2018 |
| Revenues | $ | 110,274 |
| | $ | 113,347 |
| | $ | 112,017 |
| | $ | 118,231 |
|
| Operating costs and expenses | 76,719 |
| | 82,707 |
| | 79,656 |
| | 89,659 |
|
| Income from operations | 33,555 |
| | 30,640 |
| | 32,361 |
| | 28,572 |
|
| Non-operating expenses | (6,506 | ) | | (7,395 | ) | | (5,984 | ) | | (6,078 | ) |
| Income before income taxes | 27,049 |
| | 23,245 |
| | 26,377 |
| | 22,494 |
|
| Income tax expense | 3,935 |
| | 3,112 |
| | 3,302 |
| | 2,247 |
|
| Net income | $ | 23,114 |
| | $ | 20,133 |
| | $ | 23,075 |
| | $ | 20,247 |
|
| Net income attributable to EVERTEC, Inc.’s common stockholders | $ | 23,022 |
| | $ | 20,052 |
| | $ | 22,997 |
| | $ | 20,199 |
|
| Net income per common share - basic | $ | 0.32 |
| | $ | 0.28 |
| | $ | 0.32 |
| | $ | 0.27 |
|
| Net income per common share - diluted | $ | 0.31 |
| | $ | 0.27 |
| | $ | 0.31 |
| | $ | 0.27 |
|
Item 9. Changes in and Disagreements with Accountants on Accounting and Financial Disclosure
None.
Item 9A. Controls and Procedures
Evaluation of Disclosure Controls and Procedures
The Company, under the direction of the Chief Executive Officer and the Chief Financial Officer, has established disclosure controls and procedures as defined in Rule 13a-15(e) under the Securities Exchange Act of 1934, as amended (the “Exchange Act”)
that are designed to provide reasonable assurance that information required to be disclosed by the Company in the reports that it files or submits under the Exchange Act is recorded, processed, summarized and reported within the time periods specified in the SEC’s rules and forms, and that such information is accumulated and communicated to management as appropriate to allow timely decisions regarding required disclosure.An evaluation of the effectiveness of the design and operation of the Company’s disclosure controls and procedures pursuant to Rule 13a-15(b) under the Exchange Act as of December 31, 2016 was performed under the supervision and with the participation of the Company’s management, including the Chief Executive Officer and Chief Financial Officer.. Based upon their evaluation, the Chief Executive Officer and Chief Financial Officer have concluded that as of December 31, 2016,2019, the Company’s disclosure controls and procedures are effective.
Changes in Internal Control Over Financial Reporting
There
have not been anywere no changes
except as provided below, in
the Company’sour internal control over financial reporting
that occurred during the quarter ended December 31,
20162019 that
have materially affected, or are reasonably likely to materially affect, our internal control over financial reporting.
In our Annual Report on Form 10-K for the year ended December 31, 2015, management identified a material weakness in our internal control over financial reporting. In response to this material weakness, management implemented the following remediation actions to address the control deficiency identified in 2015.
Enhanced control procedures to ensure completeness of documented analyses supporting material tax positions taken by the company.
Enhanced monitoring activities over highly technical tax related aspects of material transactions, including the implementation of formal periodic meetings attended by the Chief Financial Officer, Finance Director, legal and tax departments to ensure that material tax positions, including uncertain tax positions, are vetted fully and continuously monitored for appropriate income tax accounting and disclosure purposes.
Management has determined that the remediation actions discussed above were effectively designed and demonstrated effective operation for a sufficient period of time to enable the Company to conclude that the 2015 material weakness regarding its internal controls associated with the assessment and monitoring of uncertain tax positions and potential obligations has been remediated as of December 31, 2016.
Management’s Report on Internal Control Over Financial Reporting
Deloitte & Touche, LLP, an independent registered public accounting firm, has audited the consolidated financial statements as of and for the year ended December 31, 2016,2019, included in this Form 10-K and, as part of the audit, has issued a report, included as part of Item 8 of this Form 10-K, on the effectiveness of our internal control over financial reporting as of December 31, 2016.2019.
The Company uses derivative financial instruments to enhance its ability to manage its exposure to certain financial and market risks, primarily those related to changes in interest rates.risks. On the date the derivative instrument contract is entered into, the Company may designate the derivative as (1) a hedge of the fair value of a recognized asset or liability or an unrecognized firm commitment (“fair value” hedge), (2) a hedge of a forecasted transaction or of the variability of cash flows to be received or paid related to a recognized asset or liability (“cash flow” hedge), or (3) as a “standalone” derivative instrument, including economic hedges that the Company has not formally documented as a fair value or cash flow hedge. Changes in the fair value of a derivative that qualifies for cash flow hedge accounting are recognized in Other Comprehensive Income (Loss). Amounts accumulated in other comprehensive income (loss) are reclassified to earnings when the related cash outflow affects earnings. Changes in the fair value of a derivative instrument that is highly effective and that is designated and qualifies as a fair value hedge, along with changes in the fair value of the hedged asset or liability that isare attributable to the hedged risk (including gains or losses on firm commitments), are recorded in current-period earnings. Similarly, the changes in the fair value of stand-alone derivative instruments or derivatives not qualifying or designated for hedge accounting are reported in current-period earnings. The Company recognizes all
The fair value of financial instruments is the price that would be received to sell an asset or paid to transfer a liability in an orderly transaction between market participants at the measurement date. Fair value estimates are made at a specific point in time based on the type of financial instrument and relevant market information. Many of these estimates involve various assumptions and may vary significantly from amounts that could be realized in actual transactions.
The Merchant Acquiring segment consists of revenues from services that allow merchants to accept electronic methods of payment. In the Merchant Acquiring segment, revenues include a discount fee and membership fees charged to merchants, debit network fees and rental fees from POS devices and other equipment, net of credit card interchange and assessment fees charged by credit cards associations (such as VISA or MasterCard) or payment networks. The discount fee is generally a percentage of