SECURITIES AND EXCHANGE COMMISSION
Washington, D.C. 20549
FORM 10-K
FORM10-K
☒ |
| |
| ý | ANNUAL REPORT PURSUANT TO SECTION 13 OR 15(d) OF THE SECURITIES EXCHANGE ACT OF 1934 |
For the fiscal year ended December 31, 20162019 ☐ |
| |
| ¨ | TRANSITION REPORT PURSUANT TO SECTION 13 OR 15(d) OF THE SECURITIES EXCHANGE ACT OF 1934 |
For the transition period from
to
Commission file number 001-37391
COMMERCE UNION BANCSHARES, INC.
Reliant Bancorp, Inc.
(Exact name of registrant as specified in its charter)
|
| |
| Tennessee | | 37-1641316 |
(State or other jurisdiction of incorporation or organization) | (I.R.S. Employer Identification No.) |
| |
1736 Carothers Parkway, Suite 100, Brentwood, Tennessee | 37027 |
(I.R.S. EmployerIdentification No.)
Address of principal executive offices) | (Zip Code) |
1736 Carothers Parkway, Suite 100
Brentwood, TN 37027
(Address of principal executive offices) (Zip Code)
(615) 221-2020
(
Registrant’s telephone number, including area
code)code: (615) 221-2020
Securities registered pursuant to Section 12(b) of the Act:Common Stock
Act
:
|
| | |
| Title of each class | Trading Symbol(s) | Name of each exchange on which registered |
| Common Stock, $1.00 par value per share | RBNC | The Nasdaq Capital Market |
Securities registered pursuant to Section 12(g) of the Act:
None
None
(Title of class)
Indicate by check mark if the registrant is a well-known seasoned issuer, as defined in Rule 405 of the Securities Act. ☐ ¨ Yes ☒ý No Indicate by check mark if the registrant is not required to file reports pursuant to Section 13 or Section 15(d) of the Act. ☐ ¨ Yes ☒ ý No Indicate by check mark whether the registrant (1) has filed all reports required to be filed by Section 13 or 15(d) of the Securities Exchange Act of 1934 during the preceding 12 months (or for such shorter period that the registrant was required to file such reports), and (2) has been subject to such filing requirements for the past 90 days. ☒ ý Yes ☐ ¨ No
Indicate by check mark whether the registrant has submitted electronically and posted on its corporate Web site, if any, every Interactive Data File required to be submitted and posted pursuant to Rule 405 of RegulationS-T (§ 232.405 of this chapter) during the preceding 12 months (or for such shorter period that the registrant was required to submit and post such files). ☒ý Yes ☐¨ NoIndicate by check mark if disclosure of delinquent filers pursuant to Item 405 of RegulationS-K (§ 229.405 of this chapter) is not contained herein, and will not be contained, to the best of registrant’s knowledge, in definitive proxy or information statements incorporated by reference in Part III of this Form10-K or any amendment to this Form10-K. ☒
Indicate by check mark whether the registrant is a large accelerated filer, an accelerated filer, a
non-accelerated filer,
or a smaller reporting
company, or an emerging growth company. See the definitions of “large accelerated filer,” “accelerated
filer” andfiler,” “smaller reporting
company,” and “emerging growth company” in Rule
12b-2 of the Exchange Act.
| | |
| | | |
| Large accelerated filer | | ☐ | ¨ | Accelerated filer | | ☒ý |
| | | |
| Non-accelerated filer | | ☐ (Do not check if a smaller reporting company) | ¨ | Smaller reporting company | ý
|
| | ☐ | | |
| | Emerging growth company | ý |
If an emerging growth company, indicate by check mark if the registrant has elected not to use the extended transition period for complying with any new or revised financial accounting standards provided pursuant to Section 13(a) of the Exchange Act. ¨
Indicate by check mark whether the registrant is a shell company (as defined in Rule12b-2 of the Act). ☐ ¨ Yes ☒ ý No The aggregate market value of the voting and
non-voting common equity held by
non-affiliates computed by reference to was approximately $211,513,193 on June 28, 2019, the
last business day of the registrant’s most recently completed second fiscal quarter, based on $23.63 per share, the last reported sales price
at whichof the common
equity was last sold as of June 30, 2016 was $102,626,860 (computedstock on
the basis of $15.27 per share).The Nasdaq Capital Market on such date.
APPLICABLE ONLY TO CORPORATE REGISTRANTS
The number of shares outstanding of the registrant’s common stock, par value $1.00 per share, as of March
13, 201712, 2020 was
7,802,959.11,717,386 excluding 298,441 unexchanged shares in connection with acquisitions.
DOCUMENTS INCORPORATED BY REFERENCE
Portions of the
Registrant’s Proxyregistrant's definitive proxy statement for its
2020 Annual Meeting of Shareholders,
towhich will be
held on June 2, 2017,filed with the Securities and Exchange Commission within 120 days of December 31, 2019 are incorporated by reference
ininto Part III of this
Form10-K.
report for the year ended December 31, 2019.
CAUTIONARY STATEMENT REGARDING FORWARD-LOOKING STATEMENTS
Commerce Union Bancshares, Inc.(“CommerceUnion”the“Company”or“CUBN”) may from time to time make written or oral statements, including
Various statements contained in or incorporated by reference into this report (including, without limitation, certain statements in “Management’s Discussion and Analysis of Financial Condition and Results of Operations” in Item 7), that constituteAnnual Report on Form 10-K (this “Annual Report”) are forward-looking statements within the meaning of Section 27A of the Securities Act of 1933, as amended (the “Securities Act”), and Section 21E of the Securities Exchange Act of 1934, as amended (the“ExchangeAct”). The words “expect,“believe,” “anticipate,” “intend,“expect,” “consider,“may,” “plan,“will,” “believe,” “seek,“assume,” “should,” “estimate,“predict,” “could,” “would,” “intend,” “targets,” “estimates,” “projects,” “plans,” and “potential,” and other similar words and expressions of the future, are intended to identify such forward-looking statements, but other statements not based on historical information may constitute forward-looking statements. These statements shouldalso be considered subject to various risksforward-looking, including statements about the Company’s future financial and uncertainties. Suchoperating results and the Company’s plans, objectives, and intentions. All forward-looking statements are made based upon management’s belief as well as assumptions made by,subject to risks, uncertainties, and information currently available to, management pursuant to “safe harbor” provisionsother factors that may cause the actual results, performance, or achievements of the Private Securities Litigation Reform Act of 1995. Commerce Union’s actual results mayCompany to differ materially from theany results, anticipated inperformance, or achievements expressed or implied by such forward-looking statements due to a variety of factors.statements. Such risks, uncertainties, and other factors include, without limitation, those specifically described in Item 1A of Part I of this Annual Report on Form10-K, as well as the following:among others: (i) the possibility that our asset quality wouldcould decline or that we experience greater loan losses than anticipated, (ii) increased levels of other real estate, primarily as a result of foreclosures, (iii) the impact of liquidity needs on our results of operations and financial condition, (iv) competition from financial institutions and other financial service providers, (v) economic conditionsthe effect of interest rate increases on the cost of deposits, (vi) unanticipated weakness in loan demand or loan pricing, (vii) lack of strategic growth opportunities or our failure to execute on available opportunities, (viii) deterioration in the local markets where we operate, (vi)financial condition of borrowers resulting in significant increases in loan losses and provisions for those losses, (ix) the ability to grow and retain low-cost core deposits and retain large, uninsured deposits, (x) our ability to effectively manage problem credits, (xi) our ability to successfully implement efficiency initiatives on time and with the results projected, (xii) our ability to successfully develop and market new products and technology, (xiii) the impact of negative developments in the financial industry and U.S.United States and global capital and credit markets, (vii)(xiv) our ability to retain the services of key personnel, and (viii)(xv) our ability to adapt to technological changes. Manychanges, (xvi) risks associated with litigation, including the applicability of such factors are beyond Commerce Union’sinsurance coverage, (xvii) the vulnerability of the Bank’s network and online banking portals, and the systems of parties with whom the Company and the Bank contract, to unauthorized access, computer viruses, phishing schemes, spam attacks, human error, natural disasters, power loss, and other security breaches, (xviii) changes in state and federal laws, rules, regulations, or policies applicable to banks or bank or financial holding companies, including regulatory or legislative developments, (xix) adverse results (including costs, fines, reputational harm, and/or other negative effects) from current or future litigation, regulatory examinations, or other legal and/or regulatory actions, (xx) the risk that expected cost savings and revenue synergies from (a) the merger of the Company and Tennessee Community Bank Holdings, Inc. (“TCB Holdings”) (the “TCB Holdings Transaction”) or (b) the proposed merger between the Company and First Advantage Bancorp (“FABK”) (the “FABK Transaction” and, together with the TCB Holdings Transaction, collectively, the “Transactions”), may not be realized or may take longer than anticipated to be realized, (xxi) the ability to controlmeet expectations regarding the timing and completion of the FABK Transaction and the accounting and tax treatment of the Transactions, (xxii) the effect of the announcement, pendency, or predict,completion of the Transactions on customer, supplier, or employee relationships and readers are cautioned notoperating results (including without limitation difficulties in maintaining relationships with employees and customers), as well as on the market price of the Company’s common stock, (xxiii) the risk that the businesses and operations of TCB Holdings and its subsidiaries and of FABK and its subsidiaries cannot be successfully integrated with the business and operations of the Company and its subsidiaries or that integration will be more costly or difficult than expected, (xxiv) the occurrence of any event, change, or other circumstances that could give rise to put undue reliance on such forward-looking statements. Commerce Union does not intendthe termination of the definitive merger agreement for the FABK Transaction, (xxv) the amount of costs, fees, expenses, and charges related to update or reissue any forward-looking statements contained in this reportthe Transactions, including those arising as a result of new informationunexpected factors or events, (xxvi) reputational risk associated with and the reaction of our customers, suppliers, employees, or other circumstancesbusiness partners to the Transactions, (xxvii) the failure of any of the conditions to the closing of the FABK Transaction to be satisfied, or any unexpected delay in completing the FABK Transaction, (xxviii) the dilution caused by the Company’s issuance of additional shares of its common stock in the Transactions, (xxix) the Company’s ability to simultaneously execute on two separate business combination transactions, (xxx) the risk associated with Company management’s attention being diverted away from the day-to-day business and operations of the Company to the completion and integration of the Transactions, and (xxxi) general competitive, economic, political, and market conditions, including economic conditions in the local markets where we operate.
These forward-looking statements involve a number of risks and uncertainties that
may become knowncould cause actual results to
Commerce Union.differ materially from those suggested by the forward-looking statements. Forward-looking statements should therefore be considered in light of various factors, including those set forth in this Annual Report under “Item 1A. Risk Factors,” and in “Item 7. Management's Discussion and Analysis of Financial Condition and Results of Operations,” and elsewhere in this Annual Report. In light of such risks and uncertainties, we caution you not to place undue reliance on these forward-looking statements. These forward-looking statements speak only as of the date of this Annual Report, or if earlier, as of the date they were made. We do not intend to, and disclaim any obligation to, update or revise any forward-looking statements unless required by applicable securities law.
Unless this Annual Report indicates otherwise or the context requires, the terms “Reliant Bancorp,” “our Company,” “the Company,” “us,” “we” and “our” and similar terms refer to Reliant Bancorp Inc. and its subsidiaries including Reliant Bank, which we sometimes refer to as “Reliant” or the “Bank”.
ITEM 1. BUSINESSS
Reliant Bancorp, Inc. (f/k/a Commerce Union Bancshares, Inc.), is a Tennessee corporation and the holding company for and the sole shareholder of Reliant Bank. Reliant Bancorp is registered as a financial holding company under the Bank Holding Company Act of 1956 as amended ("Bank Holding Company Act"). Reliant Bank is a commercial bank chartered under Tennessee law and a member of the Federal Reserve System (the "Federal Reserve").
Reliant Bank, Reliant Bancorp's wholly-owned subsidiary, provides a full range of traditional banking products and services to corporate and consumer clients throughout Middle Tennessee and the Nashville-Davidson-Murfreesboro-Franklin, TN Metropolitan Statistical Area (the “Nashville MSA”) and Chattanooga, Tennessee. Reliant Bank operates banking centers in Cheatham, Davidson, Hamilton, Hickman, Maury, Montgomery, Robertson, Rutherford, Sumner, and Williamson counties, Tennessee. Additionally, Reliant Bank operates mortgage offices in Brentwood, Hendersonville, and Memphis, Tennessee, as well as two in Little Rock and two in Hot Springs, Arkansas.
HISTORY AND GROWTH
Reliant Bank was organized on April 17, 2006, as a state-chartered bank, under the laws of the State of Tennessee. Reliant Bank opened for business on August 14, 2006.
Reliant Bancorp, Inc. was incorporated
under the laws of the State of Tennessee on March 4, 2011, to serve as a holding company for
and the sole shareholder of Commerce UnionReliant Bank.
ItReliant Bancorp became the holding company
for, and sole shareholder of,
Commerce UnionReliant Bank upon
the completion of
Commerce UnionReliant Bank’s reorganization into a holding company
corporate structure on June 6, 2012.
Until December 31, 2017, the Company operated under the name “Commerce Union Bancshares, Inc.”
Reliant Mortgage Ventures, LLC ("RMV") was organized on November 15, 2011 as a joint venture between VHC Fund 1, LLC ("VHC") and Legacy Reliant Bank (as defined below) to offer mortgage banking services within the Legacy Reliant Bank's market footprint. The Bank controls 51% of RMV's governance rights and is scheduled to receive 30% of RMV's profits once VHC recovers its capital contributions.
On March 10,July 7, 2015, the shareholdersCompany’s common stock began trading on The Nasdaq Capital Market (“Nasdaq”).
Reliant Investment Holdings, LLC ("Holdings") was organized on October 26, 2018 as a wholly owned subsidiary of Commerce Union approved the mergerBank to offer investment services to the Bank.
As of Commerce Union Bank with Reliant Bank, which became effective onDecember 31, 2019, the Company had grown to approximately $1.9 billion in assets, including approximately $1.4 billion of loans-held-for-investment and approximately $1.6 billion of deposits.
ACQUISITIONS
On April 1, 2015,
(“theMerger”). Each outstanding share and option to purchase a share of Reliant Bank
and legacy Reliant Bank, a Tennessee state-chartered bank established in January 2006 and headquartered in Brentwood, Tennessee, ("Legacy Reliant Bank") completed a merger of equals. Legacy Reliant Bank shareholders received 3,069,030 shares of common stock,
converted intovalued at approximately $47.9 million. As of merger date, the
right to receive 1.0213 sharescombined companies reported total assets of
Commerce Union common stock. After the Merger was completed, Commerce Union shareholders owned approximately 44.5%$790.8 million with $11.4 million of
the common stockgoodwill, total loans-held-for-investment of
the Company$561.4 million and
Reliant Bank’s shareholders owned approximately 55.5%total deposits of
the common stock of the Company on a fully diluted basis.$623.9 million. The Mergertransaction was accounted for as a reverse merger using the acquisition method of accounting in accordance with the provisions of FASB ASC Topic805-10 Business Combinations.
As such, for accounting purposes,and Legacy Reliant Bank wasis considered to be acquiring Commerce Unionhave acquired Reliant Bancorp in this transaction. As a result, the historical financial statements of the Company prior to the Mergercombined company are the historical financial statements of Legacy Reliant Bank. TheBank following the completion of the merger.
On January 1, 2018, Reliant Bancorp completed its acquisition of Community First, Inc. ("Community First") the parent company for Community First Bank & Trust, a Tennessee state-chartered bank headquartered in Columbia Tennessee, for 2,416,444 shares of Company common stock valued at approximately $62.0 million, acquiring assets with an approximate value of $480.0 million, including goodwill of approximately $32.1 million, loans-held-for-investment of approximately $316.2 million and liabilitiesdeposits of Commerce Unionapproximately $432.9 million ( the "Community First Transaction"). Additionally, outstanding restricted share awards became
fully vested and converted automatically into the right to receive merger consideration. In connection with the Community First Transaction, pursuant to supplemental indentures, in each case dated as of January 1, 2018, by and between the effective dateCompany and Wilmington Trust Company, as trustee, the Company assumed all of Community First's obligations with respect to its preferred trust securities.
On January 1, 2020, Reliant Bancorp completed the acquisition of TCB Holdings, the parent company for Community Bank & Trust, a Tennessee state-chartered bank headquartered in Ashland City, Tennessee (“CBT”). Upon completion of the Merger were recorded at their respective estimated fair valuesTCB Holdings Transaction, and added to those of Reliant Bank. Any excess of purchase price over the net estimate fair values of the acquired assets and assumed liabilities of Commerce Union were allocated to all identifiable intangibles assets. Any remaining excess was then allocated to goodwill.In periods following the Merger, the comparative historicalbased on December 31, 2019 financial statements ofdata, the Company are thosewould have approximately $2.1 billion in total consolidated assets including approximately $52.3 million of goodwill, gross loans-held-for-investment of approximately $1.6 billion, and total deposits of approximately $1.8 billion.
On October 22, 2019, Reliant Bancorp entered into a definitive agreement to acquire FABK, the parent company for First Advantage Bank prior(“FAB”), a Tennessee state-chartered bank headquartered in Clarksville, Tennessee. The Company expects to the Merger. These consolidated financial statements include the results attributable to the operationscomplete this transaction effective April1, 2020. Upon completion of Commerce Union beginning on April 1, 2015.Commerce Union is a registered bank holding company under the Bank Holding Company Act of 1956, as amended, and under the bank holding company laws of the State of Tennessee. It conducts its operation through its wholly-owned subsidiary, Reliant Bank (f/k/a Commerce Union Bank) which was organized in April 17, 2006, as a state chartered bank under the laws of the State of Tennessee and opened for business on August 14, 2006. The description of the business contained in this Item 1 should be read in conjunctiontransaction along with the information included elsewhere in this annual report on Form 10-K for the fiscal year endedTCB Holdings,
using December 31, 2016,2019 financial data, the Company would have approximately $2.9 billion in total consolidated assets including but not limited to, the consolidated financial statementsgoodwill of $94.8 million gross loans of approximately $2.2 billion and notes thereto beginning on Page F-1.Target Markets
Commerce Union, through its subsidiary Reliant Bank, provides a full rangetotal deposits of traditional banking services throughout the Middle Tennessee Region and the Nashville-Davidson-Murfreesboro-Franklin Metropolitan Statistical Area (the“NashvilleMSA”). Based on the deposit market share data published by FDIC as of June 30, 2016, the latest available date, Reliant Bank is the 15th largest bank in the Nashville MSA. Reliant Bank primarily markets its services to small businesses and residents of its market area through its main office and branch in Brentwood, Tennessee, a second branch office in Brentwood, Tennessee, a branch in Franklin, Tennessee, two branches in Gallatin, Tennessee, a branch in Nashville, Tennessee, a branch in Springfield, Tennessee, a mortgage location in Hendersonville, Tennessee, and loan production offices in Murfreesboro, Tennessee and Timonium, Maryland. Reliant Bank opened a full-service retail branch office in the Green Hills area of Nashville, Tennessee in February of 2017. A loan production office opened in Chattanooga, Tennessee in March of 2017. It employs seasoned banking professionals with experience in the market area and who are active in their communities.
Reliant Bank’s eight branches are located in Williamson, Davidson, Robertson, and Sumner County, Tennessee. In 2015, the estimated population of Williamson County was 211,672, the estimated population of Davidson County was 678,889, the estimated population of Robertson County was 68,570, and the estimated population of Sumner County was 175,989. The population of the Nashville MSA was estimated at 1,830,345 as of 2015. The median household income in the Nashville MSA for 2015 was $57,985. Significant growth of population and an increase in the median salary in the Nashville MSA are expected to continue through the next census period.
Employees
approximately $2.4 billion.
EMPLOYEES
As of December 31,
2016, Commerce Union2019, Reliant Bancorp and Reliant Bank had
143302 employees on a full-time or part-time basis. The employees are not represented by a collective bargaining
unit. Commerce Union believes that itsagreement. We believe our relationship with
itsour employees is good.
Products and Services Overview
PRODUCTS AND SERVICES
Reliant Bank is a full-service community bank. ItsOur principal business is banking, consistingwhich consists of lending and deposit gathering services (as well as other banking-related products and services) that are offered to businesses and individuals of the communities it serves,within our market footprint.
Loan Products and the operational support to deliver, fund and manage such banking services. Reliant Bank providesServices
We offer a widefull range of commercial banking services for businesses and individuals,lending products, including treasury management, credit cards, checking, savings, and money market deposit accounts, certificates of deposit, and loans for consumers, commercial, organization, and real estate projects. Reliant Bank’sand consumer loans. We compete for these loans with other financial institutions who are also well established in our geographic markets.
Our profitability
is dependent ondepends upon our responsible lending
with strong focus on lending standards topractices, which will help ensure
our long-term,
balanced growth in assets, loans, deposits and net
income in a manner consistent with safe, sound and prudent banking practices.income. To achieve this goal,
Reliant Bank’sour strategy is to: (1) expand loans and deposits through organic market share growth and strategic acquisitions; (2) provide customers with a breadth of
financial products and
financial services; (3) employ, empower and motivate
managementour employees to provide personalized customer service, consistent with the best traditions of community banking, while maximizing profits; and (4) maintain
exceptional asset quality and control overhead
expense.Reliant Bank providesexpenses.
Depository Products and Services
We seek to establish a varietystrong base of loans,core deposits including savings, noninterest-bearing checking, interest-bearing checking, money market and relatedcertificate of deposit accounts, including access to products offered through various Certificate of Deposit Account Registry Service ("CDARS") programs.
Our ability to gather deposits is enhanced by the comprehensive relationships our directors and bankers have built with the businesses and individuals who live and do business in our market footprint. Rates paid on deposits vary among banking markets and deposit categories due to different terms and conditions, individual deposit size, services rendered, and rates paid by competitors on similar deposit products. We act as a depository for a number of state and local governments and governmental agencies or municipalities. Such public fund deposits are often subject to itscompetitive bid and in many cases must be secured by pledging a portion of our investment securities or a letter of credit.
We also offer our commercial clients a comprehensive array of treasury management services, which include remote deposit capture, on-line wire origination, enhanced Automated Clearing House ("ACH") origination services, positive pay, zero balance and sweep accounts, automated bill pay services, electronic receivables processing, lockbox processing, merchant card acceptance services, small business customers. Such services include but are not limited to business checking, mobile business banking depositand commercial credit cards, and corporate purchasing cards.
Other Banking Products and Services
We offer a broad array of convenience-centered products and services, business loans,including MoneyPass, a nationwide network of surcharge free ATMs available to our clients, 24-hour telephone and lines of credit. Reliant Bank offers similar service to its consumers, including but not limited to personal loans, checking, residential mortgage loansonline banking, mobile banking, debit and mortgage refinancing, safe deposit boxes, debitcredit cards, direct deposit and official bank checks. A substantial portionmobile deposit options.
COMPETITIVE ENVIRONMENT
We face competition in all phases of our
residential mortgage loansoperation from a variety of competitors, many of which are larger and
mortgage refinancings are originated through our residential mortgage banking segment. These loans are originated throughout the United Stateshave access to more financial resources than us. Such competitors include national, regional, Internet banks and
are typically sold in the secondary market. For a more detailed description of our residential mortgage loan operations, see Notes 20 and 23 to our Consolidated Financial Statements.Competition
Reliant Bank has substantialFinTechs. We also face competition in attracting and retaining deposits and making loans to its customers in all of its principal markets. Competition involves efforts to retain current customers, obtain new loans and deposits, increase type of services offered, and offer competitive interest rates on deposits and loans. The primary factors in competing for deposits are the range and qualityfrom many others types of financial services offered, the ability to offer attractive rates and the availability of convenient office locations. Reliant Bank competes for deposits with 62 other commercial banking institutions, in Davidson, Williamson, Robertson, and Sumner Counties, as well as, numerousincluding, community banks, savings and loanloans associations, credit unions, and issuers of commercial paper and other securities. Reliant Bank’s market share in its four counties is 1.55% as of June 30, 2016. According to the FDIC, there are 390 commercial bank branch offices in the four counties as of June 30, 2016. Additional competition for deposits comes from other investment alternatives, such as money market mutual funds and corporate and government securities. The primary factors in competing for loans are the range and quality of the lending services offered, interest rates, and loan origination fees. Competition for the origination of loans normally comes from other financial institutions, commercial banks, credit unions,finance companies, brokerage firms, insurance companies, and other financial intermediaries Additionally, technology has lowered barriers to entry and made it possible for non-banks to offer products and services companies. Reliant Bank believestraditionally provided by banks, such as automatic transfer and automatic payment systems. Many of our non-bank competitors have fewer regulatory constraints and may have lower cost structures.
We believe that
it haswe are able to successfully
competedcompete with
larger banks and other
smaller community banksfinancial institutions in
the Williamson, Robertson, Sumner, and Davidson County marketsour market footprint by focusing on personal service and
financialoffering products
to meetsthat meet the needs of the
community.Intellectual Property
Reliant Bank utilizes the ownership rightsbusinesses and consumers who work and live in those markets.
AVAILABLE INFORMATION
We are required to two registered trademarksfile annual reports on Form 10-K, quarterly reports on Form 10-Q, current reports on Form 8-K, proxy statements and other information with the United States PatentSecurities and Trademark Office forExchange Commission (the “SEC”), which are available to the protectionpublic from commercial document retrieval services and at the SEC's website at http://www.sec.gov. Our common stock is listed and traded on Nasdaq under the symbol “RBNC”.
We also make available on our website (http:// www.reliantbank.com) all of
“RELIANT BANK” in the
company’s respective colors and fonts. Reliant Bank also utilizes the website domains of reliantbank.com. Commerce Union also holds the rights to three registered trademarksreports that we file with the
United States PatentSEC and
Trademark Office foramendments to those reports, including related exhibits and supplemental schedules, filed or furnished pursuant to Section 13(a) or Section 15(d) of the
continued protectionExchange Act, free of
“COMMERCE UNION BANK” incharge, as soon as reasonably practicable after we electronically file such material with the
former entity’s respective colors and fonts.Supervision and Regulation
Both Commerce Union and Reliant BankSEC. Information contained on our website is not incorporated by reference into this Annual Report. Please note that our website address is provided as an inactive textual reference only. We intend to disclose on our website any amendments or waivers to our Code of Ethics that are required to be disclosed pursuant to Item 5.05 of Form 8-K.
SUPERVISION AND REGULATION
General
We are subject to extensive
regulation under both federal and state
and federal bankinglaw. These laws and
regulations that impose specific requirements or restrictions on and provide for general regulatory oversight of virtually all aspects of our operations. These laws andrelated regulations are generally intended to protect depositors
and customers, not shareholders.
TheTo the extent that the following
summaryinformation describes statutory or regulatory provisions, it is qualified
in its entirety by reference to the
statutory and regulatory provisions discussed. Changesparticular statute or regulation. Any change in applicable laws or regulations may have a material effect on our business,
operations, and prospects.
Our operations may be affected by legislative changes and the policies of various regulatory authorities. We cannot
accurately predict the
effectnature or the extent of the effects on our business and earnings that fiscal or monetary policies,
economic control, or new federal or state legislation
or regulation may have
on our business and earnings in the future.
Commerce Union Bancshares, Inc.
Commerce Union owns 100% of the stock of
Holding Company Regulation
Reliant Bank, and therefore, we are consideredBancorp is registered as a bank holding company within the meaning ofunder the Bank Holding Company Act, and we have elected under the Bank Holding Company Act to be treated as a financial holding company. In order to qualify to be a financial holding company, a bank holding company and each of 1956, as amended (the “BankHoldingCompanyits subsidiary depository institutions must be “well capitalized” and “well managed” and each subsidiary depository institution must have at least a “satisfactory” rating under The Community Reinvestment Act”) (which is discussed below).
As a
result,financial holding company, we are
primarily subject to the supervision
of and to regulation and examination
and reporting requirementsby the Board of Governors of the Federal Reserve
underSystem (the “Federal Reserve”) and subject to the reporting and other requirements of the Bank Holding Company Act and the regulations promulgated
thereunder.thereunder by the Federal Reserve. Moreover, as
the holding company for a bank
holding company of a bank locatedchartered in Tennessee, we also are subject to the Tennessee Banking
Act, and as a Tennessee corporation, we are subject generally to the Tennessee Business Corporation Act.
As a financial holding company, Reliant Bancorp is required by law and Federal Reserve policy to act as a source of financial and managerial strength for its bank subsidiary, Reliant Bank, and to commit resources to support Reliant Bank. This support can be required at times when it would not be in the best interest of Reliant Bancorp’s shareholders or creditors to provide it.
The Bank Holding Company Act
subjectand the regulations thereunder place limitations on the activities in which a bank holding company may engage. Subject to certain exceptions,
also prohibitsthe Bank Holding Company Act and the regulations thereunder generally prohibit a bank holding company from engaging in or acquiring direct or indirect control of more than 5% of the voting stock of any company engaged in
non-banking activities. An exception to this prohibition is for activities expressly found by the Federal Reserve to be so closely related to banking or managing or controlling banks as to be a proper incident thereto.
As Financial holding companies, however, are allowed to engage without prior Federal Reserve approval in a bank holding company, Commerce Union is requiredbroader range of banking and non-banking activities
that are deemed to file semi-annual reports withbe financial in nature or incidental to a financial activity. These “financial in nature” activities include securities underwriting, dealing and market making; organizing, sponsoring and managing mutual funds; insurance underwriting and agency; merchant banking activities; and other activities that the Federal Reserve together with any additional information ashas determined to be closely related to banking.
Under the
Change in Bank Control Act and associated Federal Reserve
may require. The Federal Reserve may also examine Commerce Union.Bank holding companies are required to act as a source of financial strength to each subsidiary bank and to commit resources to support each such subsidiary. This support may be required at times when a holding company may not be able to provide such support. In the event of a loss suffered or anticipated by the FDIC - as a result of default of a banking or thrift subsidiary of Commerce Union or related to FDIC assistance provided to a subsidiary in danger of default - the other banking subsidiaries of Commerce Union, ifregulations, generally, any may be assessed for the FDIC’s loss, subject to certain exceptions.
Regulation Y of the Rules and Regulations of the Federal Reserve Board of Governors requires persons actingperson that, directly or indirectly or in concert with one or more other persons, seeks to acquire control of a bank holding company or a Federal Reserve member bank (such as Reliant Bank) must give the Federal Reserve 60 days’ prior written notice before acquiring control of athe bank holding company.company or member bank. Under the regulation,applicable regulations, control is defined as the ownership or control with theof or power to vote 25% or more of any class of voting securities of the bank holding company.company or member bank. The regulationregulations also providesprovide for a presumption of control if a person owns, controls,would own, control, or holdshold with the power to vote 10% or more (but less than 25%) of any class of voting securities of the bank holding company or member bank and ifeither the institution has securities registered under Section 12 of the Exchange Act or no other person owns a greater percentage of that class of voting securities.
Reliant Bancorp is subject to the registration, disclosure, reporting, and other requirements of the Securities Act and the Exchange Act, and the rules and regulations promulgated thereunder and administered by the SEC. Because the Company’s common stock is listed on Nasdaq, the Company is subject to Nasdaq’s rules for listed companies.
Bank Regulation
Reliant Bank is subject to extensive federal and state regulation that significantly affects its business and operations. As a Tennessee state-chartered bank that is a member of the Federal Reserve system, the Bank is primarily subject to supervision and regulation by the Federal Reserve and the Tennessee Department of Financial Institutions (the “TDFI”). The Bank is also subject to various regulations promulgated by the federal Consumer Financial Protection Bureau, an agency responsible for consumer protection in the financial sector.
The Federal Reserve and the TDFI regularly examine the Bank’s operations and have the authority to approve or disapprove of mergers to which the Bank is a party, the Bank’s establishment of new branches, and similar corporate actions. Both regulatory agencies have the power to take enforcement action to prevent or halt the continuance of unsafe or unsound banking practices or other violations of law. The FDIC, as the insurer of the Bank’s deposits, also has certain regulatory authority over and requires certain routine reporting by the Bank.
As a bank chartered under Tennessee law, Reliant Bank is subject to the provisions of the Tennessee Banking Act and, to the extent not inconsistent with the Tennessee Banking Act, the provisions of the Tennessee Business Corporation Act.
Dividends
Reliant Bancorp is a legal entity separate and distinct from Reliant Bank. The principal source of Reliant Bancorp’s cash flow for operations, including the payment of interest on its trust preferred securities and subordinated notes, the payment of other indebtedness, and the payment of dividends to holders of its common stock, is dividends that Reliant Bancorp receives from Reliant Bank.
Various federal and state statutory provisionslaws, rules, and regulations limit the amount of dividends that a subsidiary banksbank can pay to theirits parent holding companiescompany without regulatory approval. TheGenerally, the Bank cannot pay dividends in any calendar year that exceed its net income for that year plus its retained net income for the prior two calendar years without prior regulatory approval. Additionally, the Bank is generally prohibited from paying dividends if the Bank is not adequately capitalized or if payment of the dividends would cause the Bank to become undercapitalized. Under applicable federal capital adequacy guidelines, banks are also subject to dividend limitations and restrictions if they fail to maintain an appropriate capital conservation buffer. Federal and state bank regulators also have the authority to prohibit the payment of dividends by any bankbanks if they determine the payment of dividends to be an unsafe and unsound banking practice.
There are also may be affected by other factors, such as the maintenance of adequate capital for such subsidiary bank. In additionlimitations on Reliant Bancorp’s ability to the foregoing restrictions, the Federal Reserve has the powerpay dividends to prohibit dividends by bank holding companies if their actions constitute unsafe or unsound practices.its shareholders. The Federal Reserve has issued a policy statement onwith regard to the payment of cash dividends by bank holding companies, which expresses the Federal Reserve’s viewcompanies. This policy statement provides generally that a bank holding company experiencing earnings weaknesses should not pay, cashor should defer or significantly reduce, dividends that exceed its net income or that could only be funded in ways that weakenif the bank holding company’s financial health, such as by borrowing. Furthermore,net income available to shareholders over the Tennessee Department of Financial Institutions (TDFI) also has authority to prohibit the paymentlast four quarters (net of dividends by a Tennessee chartered bank when it determines such paymentpaid) is not sufficient to be an unsafe and unsound banking practice. Should an insured member bank controlled by a bank holding company be “significantly undercapitalized” underfully fund the applicable federal bank capital ratios,dividends or if the bank subsidiaryholding company’s prospective rate of earnings retention is “undercapitalized”not consistent with the company’s capital needs and has failed to submit an acceptable capital restoration plan or has materially failed to implement such a plan, the Federal Reserve may require prior approval for any capital distribution by theoverall current and prospective financial condition. A bank holding company. In addition, since our legal entitycompany subject to the federal capital adequacy regulations is separatealso subject to dividend limitations and distinctrestrictions if it fails to maintain an appropriate capital conservation buffer. Under Tennessee
law, Reliant Bancorp is not permitted to pay dividends if, after giving effect to the dividends, it would not be able to pay its debts as they come due in the usual course of business or if its assets would be less than the sum of its liabilities plus the amount necessary to satisfy the rights of preferred shareholders, if any, upon dissolution. The Company may from Reliant Bank and does not conduct stand-alone operations, ourtime to time also be subject to contractual restrictions on its ability to pay dividends dependsto its shareholders.
During the fiscal year ended December 31, 2019, Reliant Bancorp paid dividends totaling $0.36 per share on its common stock for a total of $3,053 in aggregate dividend declarations for the abilityyear. The amount and timing of all future dividend payments, if any, is subject to our board’s discretion and our compliance with applicable laws, rules, regulations and regulatory guidance, and will depend on our earnings, capital position, financial condition and other factors, including new regulatory capital requirements, as they become known to us.
Transactions with Affiliates and Insiders
Transactions between Reliant Bank
to pay dividends to us, which is also subject to regulatory restrictions.A bank holding company and its subsidiariesaffiliates are also prohibited from acquiring any voting shares of, or interest in, any banks located outsidegoverned by Sections 23A and 23B of the stateFederal Reserve Act and the Federal Reserve’s Regulation W, which generally:
•limit the extent to which a bank or its subsidiaries may engage in which the operations“covered transactions” with any one affiliate to an amount equal to 10.0% of the bank’s capital stock and surplus;
•limit the extent to which a bank holding company’sor its subsidiaries are located, unlessmay engage in “covered transactions” with all affiliates to an amount equal to 20.0% of the bank’s capital stock and surplus; and
•require that all such transactions be on terms substantially the same, or at least as favorable to the bank holding company and its subsidiaries are well-capitalized and well-managed. Further,or subsidiary, as those provided to a bank holding company and its subsidiaries are prohibited from engaging in certain tying arrangements in connection with the extension of credit or provision of any property or service. non-affiliate.
An affiliate of a bank
holdinggenerally is any company
maythat controls, is controlled by, or is under common control with the bank which is not
extend credit, lease, sell property, or furnish any services or fix or vary the consideration for these on the condition that (i) the customer must obtain or provide some additional credit, property or services from or to its bank holding company or subsidiaries thereof or (ii) the customer may not obtain some other credit, property, or services from a
competitor, except to the extent reasonable conditions are imposed to assure the soundnesssubsidiary of the
credit extended.In approving acquisitionsbank. The term “covered transaction” includes the making of loans to an affiliate, the purchase of assets from an affiliate, the issuance of a guarantee on behalf of an affiliate, the purchase of securities issued by bank holding companiesan affiliate, and other similar types of banks and companies engaged in the banking-related activities described above, the Federal Reserve considers a number of factors, including expected benefits to the public such as greater convenience, increased competition, or gains in efficiency, as weighed against the risks of possible adverse effects such as undue concentration of resources, decreased or unfair competition, conflicts of interest, or unsound banking practices. transactions.
The Federal Reserve
is also empoweredAct and the Federal Reserve’s Regulation O impose restrictions on Reliant Bank’s authority to
differentiate between new activitiesextend credit to its executive officers, directors, and
activities commenced throughgreater than 10% shareholders, as well as companies such persons' control. Among other things, these extensions of credit must be made on terms (including interest rates charged and collateral required) substantially the
acquisitionsame as those offered to unaffiliated persons, or be made as part of a
going concern.The Attorney Generalbenefit or compensation program and on terms widely available to employees, and must not involve a greater than normal risk of repayment. In addition, the United Statesamount of loans Reliant Bank may within 30 days aftermake to these persons is based, in part, on the bank’s capital position, and specified approval by the procedures must be followed in making loans which exceed specified amounts.
Capital Adequacy
Federal
Reserve of an acquisition involving a bank holding company, bring an action challenging such acquisition under the federal antitrust laws, in which case the effectiveness of such approval is stayed pending a final ruling by the courts. Failure of the Attorney General to challenge an acquisition does not, however, exempt the bank holding company from complying with both state and federal antitrust laws after the acquisition is consummated or immunize the acquisition from future challenge under the anti-monopoly provisions of the Sherman Antitrust Act.Capital Guidelines
The Federal Reserve has issuedbanking regulators have implemented risk-based capital adequacy guidelines for certain bank or financial holding companies and member banks. Under the guidelines, the minimum ratio of capital to risk-weighted assets (including certainoff-balance sheet items, such as standby letters of credit) is 8%. To be considered a “well-capitalized” bank or bank holding company under the guidelines, a bank or bank holding company must have a total risk-based capital ratio in excess of 10%. At least half of the total capital is to be comprised of common equity, retained earnings, and a limited amount of perpetual preferred stock, after subtracting goodwill and certain other adjustments (“TierIcapital”). The remainder may consist of perpetual debt, mandatory convertible debt securities, a limited amount of subordinated debt, other preferred stock not qualifying for Tier I capital, and a limited amount of loan and lease loss reserves (“TierIIcapital”). Reliant Bank is subject to these capital requirements. In addition, the Federal Reserve has adopted a minimum leverage ratio (Tier I capital to total assets) of 3%. Generally, banking organizations are expected to operate well above the minimum required capital level of 3% unless they meet certain specified criteria, including that they have the highest regulatory ratings. Most banking organizations are required to maintain a Tier 1 leverage capital ratio of 3%, plus an additional cushion of at least 1% to 2%. The guidelines also provide that banking organizations experiencing internal growth or making acquisitions are expected to maintain strong capital positions substantially above the minimum supervisory levels without significant reliance upon intangible assets.
insured depository institutions.
In July 2013,
the federal banking regulators, in response to the statutory requirements of
the Dodd-Frank
Wall Street Reform and Consumer Protection Act of 2010 (the “Dodd-Frank Act”), federal banking regulators adopted regulations implementing the Basel Capital Adequacy Accord (“
BaselIII” III”), which had been approved by the Basel member central bank governors in 2010 as an agreement among the countries’ central banks and bank regulators on the amount of capital banks must hold as a cushion against losses and insolvency.
The newThese regulations provide for the following minimum capital to risk-weighted assets
(“RWA”) requirements
arein order for an institution to be considered “adequately capitalized”: a common equity Tier 1 capital ratio of 4.5%, a Tier 1 capital ratio of 6.0%, and a total capital ratio of 8.0%.
The minimumAdditionally, to be considered “adequately capitalized,” an institution must have a leverage ratio (Tier 1 capital to total assets)
isof at least 4.0%.
The new rule also changes the definition of capital, mainly by adopting stricter eligibility criteria for regulatory capital instruments, and new constraints on the inclusion of minority interests, mortgage-servicing assets (“MSAs”), deferred tax assets (“DTAs”), and certain investments in the capital of unconsolidated financial institutions. In
addition, the new rule requires that most regulatory capital deductionsorder to be
made fromconsidered “well capitalized,” an institution must have a common equity Tier 1
capital.capital ratio of 6.5%, a Tier 1 capital ratio of 8.0%, a total capital ratio of 10.0%, and a leverage ratio of 5.0%.
Under Basel III, in order to avoid limitations on capital distributions, including dividend payments, and certain discretionary bonus payments to executive officers, a banking organization must hold a capital conservation buffer composed of common equity Tier 1 capital above its minimum risk-based capital requirements. The buffer is measured relative to
RWA.Phase-in of therisk-weighted assets. The capital conservation buffer
requirements began onwas phased in starting January 1, 2016, and
the requirements will be it became fully phased in on January January��1, 2019. A banking organization with a buffer greater than 2.5% once the capital conservation buffer is fully phased in would not be subject to limitslimitations on capital distributions or discretionary bonus payments; however, apayments. A banking organization with a buffer of less than 2.5% would beis subject to increasingly stringent limitations as the buffer approaches zero. The new ruleregulation also prohibits a banking organization from making distributions or discretionary bonus payments during any quarter if its eligible retained income is negative in that quarter and its capital conservation buffer ratio was less than 2.5% at the beginning of the quarter. The eligible retained income of a banking organization is defined as its net income for the four calendar quarters preceding the current calendar quarter, based on the organization’s quarterly regulatory reports, net of any distributions and associated tax effects not already reflected in net income. When the new rule is fully phased in, theThe minimum risk-based capital requirements plus the capital conservation buffer will exceed the current prompt corrective action (“PCA”)(PCA) well-capitalized thresholds.
Underthresholds (discussed below).
In July 2019, federal banking regulators issued a final rule intended to simplify certain aspects of the new rule, MSAs and DTAsregulatory capital rules for banking organizations, such as Reliant Bank, that are subjectnot advanced approaches banking organizations. This final is intended to stricter limitations than those applicable undersimplify the current general risk-basedregulatory capital rule. More specifically,treatment for mortgage servicing assets, certain DTAsdeferred tax assets arising from temporary differences, MSAs, and significant investments in the capital of unconsolidated financial institutions, and the calculation of minority interests. These changes were effective for Reliant Bank effective January 1, 2020.
Bank holding companies that qualify for the Federal Reserve’s Small Bank Holding Company and Savings and Loan Holding Company Policy Statement (the “Small Bank Holding Company Policy Statement”) are exempt from consolidated capital requirements. The Small Bank Holding Company Policy Statement is generally applicable to bank holding companies with consolidated assets of less than $3 billion that are not engaged in
significant nonbanking activities, either directly or through a nonbank subsidiary; do not conduct significant off-balance sheet activities, either directly or through a nonbank subsidiary; and do not have a material amount of debt or equity securities outstanding (other than trust preferred securities) that are registered with the
form of common stock are eachSEC. Historically, the Company has qualified for the Small Bank Holding Company Policy Statement and, therefore, has not been subject to
an individual limitthe Federal Reserve’s capital adequacy guidelines on a consolidated basis at the bank holding company level. Upon completion of
10% of common equity Tier 1 capital elements and are subjectthe FABK Transaction, the Company is expected to
an aggregate limit of 15% of common equity Tier 1 capital elements. The amount of these itemshave total consolidated assets in excess of
the 10% and 15% thresholds are$3 billion, in which event we will be subject to
be deducted from common equity Tier 1 capital. Amounts of MSAs, DTAs, and significant investments in unconsolidated financial institutions that are not deducted due to the aforementioned 10% and 15% thresholds must be assigned a 250% risk weight. Finally, the new rule increases the risk weights forpast-due loans, certain commercial real estate loans, and some equity exposures, and makes selected other changes in risk weights and credit conversion factors.The new minimumconsolidated capital requirements of Basel III took effect onbeginning January 1, 2015, whereas the capital conservation buffer and the deductions from common equity Tier 1 capital phase2021 if consolidated assets are in over time. Similarly,non-qualifying capital instruments phase out over time, except as described above. Most existingnon-qualifying capital instruments issued by community banks before May 19, 2010, such as trust preferred securities and cumulative perpetual preferred stock, will continue to count as regulatory capital.
Failure to meet statutorily mandated capital guidelines or more restrictive ratios separately established for a financial institution could subject a banking institution to a varietyexcess of enforcement remedies available to state and federal regulatory authorities, including issuance of a capital directive, the termination of deposit insurance by the FDIC, a prohibition on accepting or renewing brokered deposits, limitations on the rates of interest that the institution may pay on its deposits, and other restrictions on its business.
Tennessee Banking Act; Federal Deposit Insurance Act
Reliant Bank is incorporated under the banking laws of the State of Tennessee and is subject to the applicable provisions of those laws. Reliant Bank is subject to the supervision of the TDFI and to regular examination by that department. Reliant Bank is a member of the Federal Reserve and therefore is subject to Federal Reserve regulations and policies and is subject to regular examination by the Federal Reserve. Reliant Bank’s deposits are insured by the FDIC through the Deposit Insurance Fund (“DIF”), and Reliant Bank is, therefore, subject to the provisions of the Federal Deposit Insurance Act (“FDIA”).
$3 billion at June 30, 2020.
The
FDIC has adopted a risk-based assessment system for insured depository institutions that takes into account the risks attributable to different categories and concentrations of assets and liabilities. Under the Dodd-Frank Wall Street ReformEconomic Growth, Regulatory Relief, and Consumer Protection Act
of 2010 (“Dodd-FrankAct”(the “Regulatory Relief Act”),
enacted May 24, 2018, provided for the
FDIC was required to adopt regulations that would base deposit insurance assessments on total assets lesssimplification of the regulatory capital
rather than deposit liabilities and to includeoff-balance sheet liabilities ofrules for certain financial institutions and their
affiliates inholding companies with total consolidated assets of less than $10 billion. The Regulatory Relief Act required the federal banking agencies to develop a community bank leverage ratio (“CBLR”) for qualifying banks and holding companies with total consolidated assets of less than $10 billion and an appropriate risk profile. The Regulatory Relief Act mandated a minimum CBLR of not less than 8% and not more than 10%. In October 2019, the federal banking agencies issued a final rule implementing the CBLR framework and setting the CBLR at 9%. Under the final rule, the CBLR is calculated, generally, as Tier 1 capital divided by average total consolidated assets (minus amounts deducted from Tier 1 capital). Under this final rule, which was effective January 1, 2020, a qualifying community banking organization that has opted to use the CBLR framework is considered to have met the generally applicable risk-based
assessments. The Emergency Economic Stabilization Act (“ESSA”) provided for a temporary increase inand leverage capital requirements, the
basic limit on federal deposit insurance coverage from $100,000capital ratio requirements to
$250,000 per depositor. This increased level of basic deposit insurance was made permanent bybe considered “well capitalized” under the
Dodd-Frank Act. In addition, on October 14, 2008,prompt corrective action framework (discussed below), and any other capital or leverage requirements to which the
FDIC instituted temporary unlimited FDIC coverage ofnon-interest-bearing deposit transaction accounts, but this extra coverage expired December 31, 2012. The Dodd-Frank Act also repealed the prohibition on paying interest on demand transaction accounts, but did not extend unlimited insurance protection for these accounts.The FDIC may terminate its insurance of depositsqualifying community banking organization is subject, if it findsmaintains a CBLR greater than 9%. A qualifying community banking organization is a non-advanced approaches banking organization, such as Reliant, that has a leverage ratio of greater than 9%, total consolidated assets of less than $10 billion, total off-balance sheet exposures (excluding derivatives other than sold credit derivatives and unconditionally cancelable commitments) of 25% or less of total consolidated assets, and total trading assets and trading liabilities of 5% or less of total consolidated assets. While we believe we qualify as a qualifying community banking organization, we have not opted into the institution has engagedCBLR framework.
Our failure to comply with applicable capital adequacy guidelines could lead to limitations on our business and operations, including limitations on our ability to engage in
unsafe and unsound practices, is in an unsafe or unsound condition to continue operations, or has violated any applicable law, regulation, rule, order or condition imposed by the FDIC.Tennessee statutes and the federal law regulate a variety of the bankingexpansionary activities of Reliant Bank, including required reserves, investments, loans,such as mergers and consolidations, issuances of securities, payments of dividends,acquisitions and the establishment of branches. There are certain limitations under federal and Tennessee lawnew branch officers, as well as mandatory or discretionary actions by our regulators that could have a direct material effect on the payment of dividends by banks. A state bank, with the approval of the TDFI, may transfer funds from its surplus account to the undivided profits (retained earnings) account or any part of itspaid-in-capital account. The payment of dividends by any bank is dependent upon its earnings andour financial condition and in addition to the limitations referred to above, is subject to the statutory powerresults of certain federal and state regulatory agencies to act to prevent what they deem unsafe or unsound banking practices. The payment of dividends could, depending upon our financial condition, be deemed to constitute such an unsafe or unsound practice. Also, without regulatory approval, a dividend only can be paid to the extent of the net income of the bank for that year plus the net income of the prior two years. The FDIA prohibits a state bank, the deposits of which are insured by the FDIC, from paying dividends if it is in default in the payment of any assessments due the FDIC.
State banks also are subject to regulation respecting the maintenance of certain minimum capital levels (see above), and Reliant Bank is required to file annual reports and such additional information as the Tennessee Banking Act and Federal Reserve regulations require. We are also subject to certain restrictions on loan amounts, interest rates, “insider” loans to officers, directors and principal shareholders, tying arrangements, privacy, transactions with affiliates, and many other matters. Strict compliance at all times with state and federal banking laws is required.
Tennessee law contains limitations on the interest rates that may be charged on various types of loans and restrictions on the nature and amount of loans that may be granted and on the types of investments that may be made. The operations of banks are also affected by various consumer laws and regulations, including those relating to equal credit opportunity and regulation of consumer lending practices. All Tennessee banks must become and remain insured banks under the FDIA.
Under Tennessee law, state banks are prohibited from lending to any one person, firm, or corporation amounts more than 15% of its equity capital accounts, except (i) in the case of certain loans secured by negotiable title documents covering readily marketable nonperishable staples or (ii) we may make a loan to one person, firm or corporation of up to 25% of its equity capital accounts with the prior written approval of the Bank’s board of directors.
Community Reinvestment Act
The Community Reinvestment Act (“CRA”), first enacted by Congress in 1977 and amended from time to time thereafter, requires that each depository institution’s record of helping meet the needs of its entire community be evaluated by depository institution’s primary federal regulator. The CRA helps assure that banks and other financial institutions make credit available tolow- and moderate-income borrowers, consistent with safe and sound operations. Before the effective date of the merger, Reliant Bank earned the rating of “Satisfactory” in August of 2012 and Commerce Union Bank had earned a rating of “Outstanding” as of September 2012.
Federal Deposit Insurance Corporation Improvement Act of 1991
Federal law and regulations establish a capital-based regulatory framework designed to promote early intervention (or “prompt corrective action”) for troubled banks. The Federal Deposit Insurance Corporation Improvement Act of 1991 (“
FDICIA”FDICIA”)
substantially revised the depository institution regulatory and funding provisions of the FDIA, and revised several other federal banking statutes. Among other things, FDICIA requires
the federal banking regulators to take “prompt corrective action”
inwith respect
ofto FDIC-insured depository institutions that do not meet
certain minimum capital requirements. FDICIA
establishesestablished five capital
tiers:categories: “well capitalized,” “adequately capitalized,” “undercapitalized,” “significantly
undercapitalized”undercapitalized,” and “critically undercapitalized.” Under
currently applicable
prompt corrective action regulations,
aan FDIC-insured depository institution is
definedconsidered to be well capitalized if (i) it maintains a Tier 1 leverage capital ratio of
at leastno less than 5%, a
risk-adjustedcommon equity Tier 1
risk-based capital ratio of no less than 6.5%, a Tier 1 risk-based capital ratio of no less than 8%, and a total risk-based capital ratio of no less than 10% percent and (ii) it is not subject to any order or written directive to meet and maintain a specific capital level for any capital measure. An FDIC-insured depository institution generally is considered to be adequately capitalized if it maintains a Tier 1 leverage capital ratio of at least 4%, a common equity Tier 1 risk-based capital ratio of at least 4.5%, a Tier 1 risk-based capital ratio of at least 6%, and a total risk-based capital ratio of at least
10% and (ii)8%. An FDIC-insured depository institution is considered to be undercapitalized if it
is not subject tohas a
directive, orderTier 1 leverage capital ratio of less than 4%, a common equity Tier 1 risk-based capital ratio of less than 4.5%, a Tier 1 risk-based capital ratio of less than 6%, or
written agreement to meet and maintain specifica total risk-based capital
levels.ratio of less than 8%. An
insuredFDIC-insured depository institution is defined to be
adequately capitalized if it meets all of its minimum capital requirements as described above. In addition, an insured depository institution is considered undercapitalized if it fails to meet any minimum required measure, significantly undercapitalized if it
has a Tier 1 leverage capital ratio of less than 3%, a common equity Tier 1 risk-based capital ratio of less than 3%, a Tier 1 risk-based capital ratio of less than 4%, or a total risk-based capital ratio of less than 6%. An institution is
significantly below such measure, andconsidered critically undercapitalized if it fails to maintain
a level of tangible equity
equal to
not lesstotal assets of greater than 2%
of total assets.. An insured depository institution may be deemed to be in a capitalization category that is lower than is indicated by its actual capital position if it receives an unsatisfactory examination rating.
A qualifying community banking organization that has opted into the CBLR framework and maintains a CBLR greater than 9% will generally be considered “well capitalized” under the prompt corrective action regulations. If a qualifying community banking organization that has opted into the CBLR framework subsequently fails to satisfy one or more of the CBLR criteria but continues to report a CBLR of greater than 8%, the organization can continue to use the CBLR framework and be deemed to meet the ‘‘well capitalized’’ capital ratio requirements for a grace period of up to two quarters. An organization that is unable to restore compliance with all qualifying criteria during the two-quarter grace period (including coming into compliance with the greater than 9% leverage ratio requirement) or that reports a leverage ratio of 8% or less would be subject to the generally applicable prompt corrective action capital requirements. As mentioned above, we have not opted into the CBLR framework.
Federal banking regulators are required to take various mandatory supervisory actions, and are authorized to take other discretionary actions, with respect to institutions in the three undercapitalized categories. The severity of the action taken depends upon the capital category in which an institution is placed.
FDICIA generally prohibits an FDIC-insured depository institution from making any capital distributions (including dividend payments) or paying any management fee to its holding company if the depository institution is or would thereafter be undercapitalized. Undercapitalized depository institutions are required to submit capital restoration plans guaranteed by their holding companies (as applicable), are subject to limitations on asset growth, and are subject to limitations on acquisitions, branching, and engaging in new lines of business. Significantly undercapitalized depository institutions (as well as undercapitalized institutions that fail to submit or implement an acceptable capital plan) are subject to a number of increasingly more stringent requirements and restrictions, including orders to sell sufficient stock to become adequately capitalized, limitations on the interest rates paid on deposits, mandates to alter, reduce, or terminate activities determined to pose excessive risk, prohibitions on accepting deposits from correspondent depository institutions, and limitations on compensation paid to senior executive officers (in addition to the requirements and restrictions applicable to undercapitalized institutions). Critically undercapitalized depository institutions are subject to the appointment of a receiver or conservator.
Additionally, an insured depository institution that is adequately capitalized may not accept, renew, or roll over brokered deposit unless it has applied for and been granted a waiver and, even if granted a waived, the institution may not pay an effective yield on any such deposits which exceeds certain regulatory established benchmarks by more than 75 basis points. An undercapitalized institution may not accept, renew, or roll over brokered deposits.
The capital-based prompt corrective action
provisionprovisions of FDICIA and their implementing regulations apply to FDIC-insured depository institutions and are not directly applicable to
the holding companies that control those institutions. However, the Federal Reserve has indicated that, in regulating bank
and financial holding companies, it will take appropriate action at the holding company level based on an assessment of the effectiveness of supervisory actions imposed upon subsidiary depository institutions pursuant to these provisions and regulations.
FDICIA generally prohibits an
Federal Deposit Insurance
Reliant Bank’s deposits are insured up to prescribed statutory limits by the Deposit Insurance Fund of the FDIC. The standard deposit insurance coverage limit is $250,000 per depositor, per FDIC-insured bank, per ownership category.
The Bank is subject to deposit insurance assessments to maintain the Deposit Insurance Fund. In this regard, the Bank is required to remit quarterly deposit insurance premiums to the FDIC. Insurance premiums for each insured depository institution from making anyare determined based upon the institution’s capital distribution (including payment of dividends) or paying any management fee to its bank holding company if the depository institution would thereafter be undercapitalized. Undercapitalized depository institutions are subject to restrictions on borrowing from the Federal Reserve. In addition, undercapitalized depository institutions are subject to growth limitationslevel and are required to submit capital restoration plans. A depository institution’s bank holding company must guarantee the capital plan, up to an amount equalsupervisory rating provided to the lesser of 5% ofFDIC by the depository institution’s assets atprimary federal regulator and other information the time it becomes undercapitalized orFDIC determines to be relevant to the risk posed to the Deposit Insurance Fund by the institution. The assessment rate determined by considering such information is then applied to the amount of the capital deficiency wheninsured depository institution’s average consolidated total assets less its average tangible equity during the assessment period to determine the insured depository institution’s insurance premiums. An increase in the Bank’s assessment rate could have a material and adverse effect on our earnings, depending on the amount of the increase. The FDIC may also impose special assessments in emergency situations.
The FDIC may terminate the deposit insurance of any insured depository institution if the FDIC finds that the institution failshas engaged in or is engaging in unsafe or unsound practices, is in an unsafe or unsound condition, or has violated any applicable law, regulation, rule, order or condition imposed by the FDIC or any other regulatory agency. The termination of the Bank’s deposit insurance would have a material and adverse effect on our financial condition and results of operations.
Community Reinvestment Act
The Community Reinvestment Act of 1977, as amended (the “CRA”), requires depository institutions to
complyassist in meeting the credit needs of their market areas consistent with safe and sound banking practices. Under the CRA, each depository institution is required to help meet the credit needs of its market areas by, among other things, providing credit or other financial assistance to low-income and moderate-income individuals and communities. Depository institutions are periodically examined for compliance with the
plan. TheCRA and are assigned ratings, which ratings are made publicly available by the federal banking agencies. A bank’s CRA performance is also considered by federal banking agencies
may not accept a capital plan without determining, among otherin evaluating applications seeking approval for things
thatsuch as mergers, acquisitions, and new branch facilities. Reliant Bank’s CRA performance is evaluated by the
plan is based on realistic assumptionsFederal Reserve. The Bank’s most recent CRA performance evaluation was in October 2016, and
is likelyReliant Bank received an overall rating of “Satisfactory.” Reliant Bank’s failure to
succeedfulfill its obligations under the CRA could prohibit or delay us from engaging in
restoring the depository institution’s capital. If a depository institution fails to submit an acceptable plan, it is treated as if it is significantly undercapitalized.Significantly undercapitalized depository institutions may be subject to a number of requirements andexpansionary activities or result in regulatory restrictions including orders to sell sufficient voting stock to become adequately capitalized, requirements to reduce total assets and cessation of receipt of deposits from correspondent banks. Critically undercapitalized depository institutions are subject to appointment of a receiver or conservator generally within 90 days of the date on which they became critically undercapitalized.
The FDIC has adopted regulations under FDICIA governing the receipt of brokered deposits and pass-through insurance. Under the regulations, a bank cannot accept, rollover or renew brokered deposits unless it is well-capitalized or it is adequately capitalized and receives a waiver from the FDIC. A bank that cannot receive brokered deposits also cannot offer “pass-through” insurance on certain employee benefit accounts. Whether or not it has obtained this waiver, an adequately capitalized bank may not pay an interest rate on any depositsconditions being imposed in excess of 75 basis points over certain index prevailing market rates specified by regulation. There are no such restrictions on a bank that is well-capitalized.
FDICIA contains numerous other provisions, including accounting, audit and reporting requirements, termination of the “too big to fail” doctrine except in special cases, limitations on the FDIC’s payment of deposits at foreign branches, new regulatory standards in such areas as asset quality, earnings and compensation and revised regulatory standards for, among other things, powers of state banks, real estate lending and capital adequacy. FDICIA also requires that a depository institution provide 90 days prior notice of the closing of any branches.
connection with those activities.
Gramm-Leach-Bliley Act
In 1999, the
The Gramm-Leach-Bliley Act (“GLBA”GLBA”) ratified new powers for banks and, enacted in 1999, expanded the universe of activities in which bank holding companies especiallyand affiliates of banks are permitted to engage. GLBA eliminated many historical barriers to affiliations among banks and securities firms, insurance companies, and other financial service providers. Under GLBA, a bank holding company which has elected to become a financial holding company, like Reliant Bancorp has done, is able to engage in an expanded range of activities that are financial in nature, incidental to a financial activity, or complementary to a financial activity, subject in certain instances to prior Federal Reserve approval.
Additionally, pursuant to GLBA, federal banking regulators have adopted regulations limiting the
areasability of
securitiesbanks and
insurance. This law also includes requirements regarding the privacy and protection ofnon-public customer information held by financial institutions, as well as many other
providers of financial services. There are provisions providing for functional regulation of the various services provided by institutions among different regulators. GLBA codified the “safeguards rule” which requires financial institutions to
developdisclose nonpublic consumer information to non-affiliated third parties. The regulations require disclosure of privacy policies to consumers and, in some circumstances, allow consumers to prevent disclosure of certain personal information to nonaffiliated third parties. Under GLBA and its implementing regulations, banks and other financial institutions are required to implement a
writtencomprehensive information security
planprogram that
describes howincludes administrative, technical, and physical safeguards to ensure the
company is prepared forsecurity and
plansconfidentiality of customer records and information. Pursuant to
continueGLBA and certain state laws, financial institutions are required to
protect customers’ and consumers’non-publicnotify customers of security breaches resulting in unauthorized access to their personal information.
GLBA did not remove the restrictions in the Bank Holding Company Act that preventnon-financial companies from entering retail and/or commercial banking. Finally, among many other sections of this law, there is some relief for small banks from the regulatory burden of the Community Reinvestment Act.
Bank Secrecy Act and USA PATRIOT Act
The Currency and Foreign Transactions Reporting Act of 1970, better known as the Bank Secrecy Act
(“BSA”(the “BSA”)
, requires all United States financial institutions to assist United States government agencies to detect and prevent money laundering. Specifically,
the BSA requires financial institutions to
(i) keep records of cash purchases of negotiable
instruments,instruments; (ii) file reports of cash transactions exceeding a daily aggregate amount of
$10,000, and to$10,000; (iii) report suspicious activity that might signify money laundering, tax evasion, or other criminal
activities.activities; and (iv) obtain and retain information regarding the identify and verification of the beneficial owners of business customers.
The Uniting and Strengthening America by Providing Appropriate Tools Required to Intercept and Obstruct Terrorism Act of 2001
(“USA(the “USA PATRIOTAct” Act”) substantially broadened existing anti-money laundering legislation and the extraterritorial jurisdiction of the United States, imposed new compliance and due diligence obligations, defined new crimes and penalties, compelled the production of documents located both inside and outside the United States, including those of foreign institutions that have a correspondent relationship in the United States, and clarified the safe harbor from civil liability to customers. The
U.S.United States Treasury Department has issued a number of regulations implementing the USA PATRIOT Act that apply certain of its requirements to financial institutions such as
ourReliant Bank. The regulations impose
new obligations on financial institutions to maintain appropriate policies, procedures, and controls to detect, prevent, and report money laundering and terrorist financing.
The Treasury Department may issue additional regulations that will further clarify the USA PATRIOT Act’s requirements.Under the USA PATRIOT Act, all “financial
institutions,” as defined,institutions” (as therein defined) must establish anti-money laundering compliance and due diligence programs. Such programs must include, among other things, adequate policies, the designation of a compliance officer, employee and director training programs,
and an independent audit function to review and test the
program.program, and the ongoing due diligence and monitoring of customer relationships including the beneficial owners of business customers.
Dodd-Frank Wall Street Reform and Consumer Protection Act of 2010
(“Dodd-Frank Act”)
In July 2010, the Dodd-Frank Act was signed into law
incorporatingbringing about numerous financial institution regulatory reforms. Many of these reforms were implemented between 2011 and 2014 through regulations promulgated by banking and securities regulators. The following discussion describes
thecertain material elements of the regulatory framework. Many of the Dodd-Frank Act provisions are stated to only apply to larger financial institutions and do not directly impact community-based institutions like Reliant Bank. For instance, provisions that regulate derivative transactions and limit derivatives trading activity of federally-insured institutions, enhance supervision of “systemically significant” institutions, impose new regulatory authority over hedge funds, limit proprietary trading by banks, and
phase-out the eligibility of trust preferred securities for Tier 1 capital are among the provisions that do not directly impact
ourReliant Bank either because of exemptions for institutions below a certain asset size or because of the nature of
our Bank’sthe bank’s operations. Other provisions
of the Dodd-Frank Act that impact Reliant Bank
are:include provisions that:Change
•Changed the assessment base for federal deposit insurance from the amount of insured deposits to consolidated assets less tangible capital, eliminateeliminated the ceiling for and increase the size ofincreased the floor of the DIF,Deposit Insurance Fund, and offset the impact of the increase in the minimum floor on institutions with less than $10 billion in assets.
Make
•Made permanent the $250,000 limit for federal deposit insurance.
Repeal
•Repealed the federal prohibition on payment of interest on demand deposits, thereby permitting depositingdepository institutions to pay interest on business transaction and other accounts.
| • | | Centralize responsibility for consumer financial protection by creating a new agency, the Consumer Financial Protection Bureau (“CFPB”), responsible for implementing federal consumer protection laws, although banks below $10 billion in assets will continue to be examined and supervised for compliance with these laws by their federal bank regulator. |
Restrict
•Centralized responsibility for consumer financial protection by creating a new agency, the Bureau of Consumer Financial Protection, also known as the Consumer Financial Protection Bureau (the “CFPB”), responsible for implementing federal consumer protection laws, although banks below $10 billion in assets continue to be examined and supervised for compliance with these laws by their primary federal bank regulator.
•Restricted the preemption of state law by federal law and disallowdisallowed national bank subsidiaries from availing themselves of such preemption.
Impose
•Imposed new requirements for mortgage lending, including new minimum underwriting standards, prohibitions on certain yield-spread compensation to mortgage originators, special consumer protections for mortgage loans that do not meet certain provision qualifications, prohibitions, and limitations on certain mortgage terms, and various new mandated disclosures to mortgage borrowers.
Apply
•Made applicable to certain bank and financial holding companies (currently, generally, those with $3 billion or more in total consolidated assets) the same leverage and risk basedrisk-based capital requirements that apply to insured depository institutions to bank holding companies.institutions.
•Permit national and state banks to establish de novo interstate branches at any location where a bank based in that state could establish a branch and require that bank and financial holding companies and banks be well-capitalized and well managed in order to acquire banks located outside their home state.
Impose
•Imposed new limits on affiliated transactions and cause derivative transactions to be subject to lending limits.
Implement
•Implemented corporate governance revisions, including with regard to executive compensation and proxy access to shareholders, that apply to all public companies, not just financial institutions.
Many aspects of the
The Dodd-Frank Act
are subject to continued rulemaking and will take effect over several years, and their impact on Reliant Bank orhas increased the
financial industry is difficult to predict before such regulations are adopted. However, there is a significant possibility that the Dodd-Frank Act will, in the long run, increase regulatory burden, compliance costs, and
interestnon-interest expense for community banks. Of particular concern to many community banks is the
depth and breadth of the powers of the CFPB, which may have significant
impactimpacts on consumer compliance regulation
andresulting in increased
regulatory compliance costs, particularly for smaller depository institutions.
Volcker Rule
Economic Growth, Regulatory Relief and Consumer Protection Act
The Volcker Rule generally prohibits a “banking entity” (which includes any insuredRegulatory Relief Act was enacted in 2018 to modify or remove certain financial reform rules and regulations, including some of those implemented under the Dodd-Frank Act. While it maintained the majority of the regulatory structure established by the Dodd-Frank Act, the Regulatory Relief Act amended certain aspects for smaller depository institution,institutions with less than $10 billion in assets, such as Reliant Bank. Portions of the Regulatory Relief Act address access to mortgage credit; consumer access to credit; protections for veterans, consumers, and homeowners; rules for certain bank or financial holding companies; capital access; and protections for student borrowers. Reliant Bancorp and Reliant Bank or any affiliate orhave focused and will continue to focus on the implementing rules and guidance for the various provisions in each section of the Regulatory Relief Act that impact their operations and activities.
As discussed above, the Regulatory Relief Act provided for the simplification of the regulatory capital rules for most financial institutions and their holding companies with total consolidated assets of less than $10 billion by establishing the community bank leverage ratio (CBLR) framework.
The Regulatory Relief Act also expanded the universe of bank holding companies that are permitted to rely on the Small Bank Holding Company Policy Statement by increasing the size of qualifying bank holding companies that can rely on the Small Bank Holding Company Policy Statement from $1 billion in total consolidated assets to $3 billion in total consolidated assets. Bank holding companies that qualify for the Small Bank Holding Company Policy Statement are exempt from consolidated capital requirements, even though their subsidiary of such depository institution, such as Commerce Union Bancshares, Inc.)institutions continue to be subject to capital adequacy guidelines.
Further, the Regulatory Relief Act decreased the burden for community banks in regard to call reports, the Volcker Rule (which generally restricts banks from engaging in
proprietary trading and acquiring or retaining any ownership interest in, sponsoring, or engaging in certain
transactions with, a “covered fund”. Both the proprietary trading and covered fund-related prohibitions are subject to a number of exemptions and exclusions. The Volcker Rule became effective by statute in July 2012, and on December 10, 2013, five federal regulators including the FDIC and the Federal Reserve jointly adopted the final regulations to implement the Volcker Rule. The final regulations contain exemptions for, among others, market making, risk-mitigating hedging, underwriting, and trading in U.S. government and agency obligations and also permit certain ownership interests in certain types of funds to be retained. They also permit the offering and sponsoring of funds under certain conditions. In addition, the final regulations impose significant compliance and reporting obligations on banking entities.The final regulations became effective on April 1, 2014, and banking entities were required to conform their proprietary tradinginvestment activities and investments inlimits involvement with hedge funds and relationships with covered funds that were in place afterprivate equity firms), mortgage disclosures, and risk weights for some high-risk commercial real estate loans. On December 31, 2013 by July 21, 2015. For those banking entities whose investments in and relationships with covered funds were in place prior to December 31, 2013 (“legacy covered funds”), the Volcker Rule conformance period was recently extended by the Federal Reserve to July 21, 2017 for such legacy covered funds. In addition, the Federal Reserve has also indicated its intention to grant two additionalone-year extensions of the conformance period to July 21, 2017, for banking entities to conform ownership interests in and sponsorship of activities of collateralized loan obligations, or CLOs, that are backed in part bynon-loan assets and that were in place as of December 31, 2013.
FIRREA and FDICIA
Far-reaching legislation, including the Financial Institutions Reform, Recovery and Enforcement Act of 1989, or FIRREA, and the Federal Deposit Insurance Corporation Improvement Act of 1991, or FDICIA, have impacted the business of banking for years. FIRREA primarily affected the regulation of savings institutions rather than the regulation of commercial banks and bank holding companies like Reliant Bank and Commerce Union Bancshares, Inc., but did include provisions affecting deposit insurance premiums, acquisitions of thrifts by banks and bank holding companies, liability of commonly controlled depository institutions, receivership and conservatorship rights and procedures and substantially increased penalties for violations of banking statutes, regulations and orders.
FDICIA resulted in extensive changes to28, 2018, the federal banking laws.agencies issued a final rule increasing the asset threshold to qualify for an 18-month examination cycle from $1 billion to $3 billion for qualifying institutions that are well-capitalized, well-managed and meet certain other requirements.
Any number of the provisions of the Regulatory Relief Act may have the effect of increasing our expenses, decreasing our revenues, or changing the activities in which we choose to engage. The primary purposeenvironment in which financial institutions operate, including legislative and regulatory changes affecting capital, liquidity, supervision, permissible activities, corporate governance and compensation, changes in fiscal policy and steps to eliminate government support for financial institutions, may have long-term effects on the profitability of FDICIAfinancial institutions that cannot now be foreseen.
Current Expected Credit Loss
In June 2016, a new accounting standard changing the method for providing for allowances for loan and lease losses was to authorize additional borrowingsintroduced by the FDICFinancial Accounting Standards Board. This new standard is commonly referred to as the Current Expected Credit Loss standard, or “CECL”. In December 2018, federal banking agencies issued a joint final rule to revise the regulatory capital rules to, among other things, address the upcoming implementation of CECL and provide an optional three-year phase-in period for the day-one adverse regulatory capital effects that banking organizations are expected to experience upon adopting CECL.
CECL is currently scheduled to become effective for Reliant Bank in 2023. The use of this standard will increase the types of data required to determine the appropriate level of Reliant Bank’s allowance for loan and lease losses. The use of this standard may potentially increase Reliant Bank’s allowance for loan and lease losses. Any increase in Reliant Bank’s allowance for loan and lease losses or expenses incurred in order to
assist inmake the
resolution of faileddetermination for such allowance could have a material and
failing financial institutions. However, the law also instituted certain changes to the supervisory process and contained various provisions affecting the operations of banks and bank holding companies.The additional supervisory powers and regulations mandated by FDICIA include a “prompt corrective action” program based upon five regulatory zones for banks, in which all banks are placed largely basedadverse effect on their capital positions. Regulators are permitted to take increasingly harsh action as a bank’s financial condition declines. Regulators are also empowered to place in receivership or require the sale of a bank to another depository institution when a bank’s ratio of tangible equity to total assets reaches two percent. Better capitalized institutions are generally subject to less onerous regulation and supervision than banks with lesser amounts of capital. The Federal Reserve has adopted regulations implementing the prompt corrective action provisions of the FDICIA, which place financial institutions into one of the following five categories based upon capitalization ratios as these ratios have been amended following regulations implementing the requirements of Basel III: (1) a “well capitalized” institution has a total risk-based capital ratio of at least 10%, a Tier 1 risk-based capital ratio of at least 8%, a leverage ratio of at least 5% and a CET1 capital ratio of at least 6.5%; (2) an “adequately capitalized” institution has a total risk-based ratio of at least 8%, a Tier 1 risk-based ratio of at least 6%, a leverage ratio of at least 4% and a CET1 capital ratio of at least 4.5%; (3) an “undercapitalized” institution has a total risk-based capital ratio of under 8%, a Tier 1 risk-based capital ratio of under 6%, a leverage ratio of under 4% or a CET1 capital ratio of less than 4.5%; (4) a
“significantly undercapitalized” institution has a total risk-based capital ratio of under 6%, a Tier 1 risk-based ratio of under 4%, a leverage ratio of under 3% or a CET1 capital ratio of less than 3%; and (5) a “critically undercapitalized” institution has a ratio of tangible equity to total assets of 2% or less. Institutions in any of the three undercapitalized categories would generally be prohibited from declaring dividends or making capital distributions. The regulations also establish procedures for “downgrading” an institution to a lower capital category based on supervisory factors other than capital.
Various other sections of the FDICIA impose substantial audit and reporting requirements and increase the role of independent accountants and outside directors. Set forth below is a list containing certain other significant provisions of the FDICIA:
annualon-site examinations by regulators (except for smaller, well-capitalized banks with high management ratings, which must be examined every 18 months);
mandated annual independent audits by independent public accountants and an independent audit committee of outside directors for institutions with more than $500,000,000 in assets;
uniform disclosure requirements for interest rates and terms of deposit accounts;
a requirement that the FDIC establish a risk-based deposit insurance assessment system;
authorization for the FDIC to impose one or more special assessments on its insured banks to recapitalize the bank insurance fund (now called the Deposit Insurance Fund);
a requirement that each institution submit to its primary regulators an annual report on itsReliant Bank’s financial condition and management, which report will be available to the public;
a banresults of operations. The direct effects of CECL on the acceptance of brokered deposits except by well capitalized institutionsReliant Bank are not yet known.
OtherLaws and by adequately capitalized institutions with the permission of the FDIC, and the regulation of the brokered deposit market by the FDIC;
restrictions on the activities engaged in by state banks and their subsidiaries as principal, including insurance underwriting, to the same activities permissible for national banks and their subsidiaries unless the state bank is well capitalized and a determination is made by the FDIC that the activities do not pose a significant risk to the insurance fund;
a review by each regulatory agency of accounting principles applicable to reports or statements required to be filed with federal banking agencies and a mandate to devise uniform requirements for all such filings;
the institution by each regulatory agency of noncapital safety and soundness standards for each institution it regulates which cover (1) internal controls, (2) loan documentation, (3) credit underwriting, (4) interest rate exposure, (5) asset growth, (6) compensation, fees and benefits paid to employees, officers and directors, (7) operational and managerial standards, and (8) asset quality, earnings and stock valuation standards for preserving a minimum ratio of market value to book value for publicly traded shares (if feasible);
uniform regulations regarding real estate lending; and
a review by each regulatory agency of the risk-based capital rules to ensure they take into account adequate interest rate risk, concentration of credit risk, and the risks ofnon-traditional activities.Regulations
Jumpstart Our Business Startups Act of 2012
The Jumpstart Our Business Startups Act (the “JOBSAct”) increased the threshold under which a bank or bank holding company may terminate registration of a security under the Securities Exchange Act of 1934, as amended, to 1,200 shareholders of record from 300. The JOBS Act also raised the threshold requiring companies to register to 2,000 shareholders from 500. Since the JOBS Act was signed, numerous banks or bank holding companies have filed to deregister their common stock.
Other Regulations
Interest
Loan interest and other charges that
our subsidiary bankReliant Bank collects or contracts for are subject to state usury laws and federal laws concerning interest rates.
Our bank’sReliant Bank’s loan operations are also subject to federal laws applicable to credit transactions, such as:
•The federalTruth-In-Lending Act, governingwhich governs disclosures of credit terms to consumer borrowers;
•The Home Mortgage Disclosure Act, requiringwhich requires financial institutions to provide information to enable the public and public officials to determine whether a financial institution is fulfilling its obligationobligations to help meet the housing needs of the communitycommunities it serves;
•The Equal Credit Opportunity Act, prohibitingwhich prohibits discrimination in extending credit on the basis of race, creedcolor, religion, national origin, sex, marital status, age, or other prohibited factors in extending credit;factors;
•The Fair Credit Reporting Act, governingwhich governs the use of consumer credit information and the provision of information to credit reporting agencies;
•The Fair Debt Collection Practices Act, governing the manner in which consumer debts may be collected bygoverns debt collection agencies;practices; and
•The rules and regulations of the various governmental agencies chargecharged with the responsibility of implementing these federal laws.
In addition,
our bank subsidiary’sReliant Bank’s deposit operations are subject to the Electronic Funds Transfer Act and Regulation E issued by the Federal Reserve to implement
thisthat act, which
governsgovern automatic deposits to and withdrawals from deposit accounts and customers’ rights and liabilities arising from the use of automated teller machines and other electronic banking services.
FDIC Insurance Premiums
Reliant Bank is required to pay quarterly FDIC deposit insurance assessments to the DIF. The FDIC merged the Bank Insurance Fund (“BIF”) and the Savings Association Insurance Fund (“SAIF”) to form the DIF on March 31, 2006, in accordance with the Federal Deposit Insurance Reform Act of 2005. The FDIC maintains the DIF by assessing depository institutions an insurance premium. The amount each institution is assessed is based upon statutory factors that include the balance of insured deposits as well as the degree of risk the institution poses to the insurance fund. The FDIC uses a risk-based premium system that assesses higher rates on those institutions that pose greater risks to the DIF.
Effective April 1, 2009, the FDIC revised its risk-based assessment system to adjust the risk-based calculation of an institution’s unsecured debt, secured liabilities and brokered deposits. On November 12, 2009, the FDIC announced a final rule to increase of 3 basis points the deposit assessment base rate, beginning January 1, 2011. Additional increases in premiums will impact Reliant Bank’s earnings adversely. Depending on any future losses that the FDIC insurance fund may suffer due to failed institutions, there can be no assurance that there will not be additional significant premium increases in order to replenish the fund.
Under the FDIA, insurance of deposits may be terminated by the FDIC upon a finding that the institution has engaged in unsafe and unsound practices, is in an unsafe or unsound condition to continue operations or has violated any applicable law, regulation, rule, order or condition imposed by a federal bank regulatory agency.
Effects of Governmental Policies
Reliant Bank’s earnings are affected by the difference between the interest earned by Reliant Bank on its loans and investments and the interest paid by Reliant Bank on its deposits or other borrowings. The yields on its assets and the rates paid on its liabilities are sensitive to changes in prevailing market rates of interest. Thus, the earnings and growth of Reliant Bank are influenced by general economic conditions, fiscal policies of the federal government, and the policies of regulatory agencies, particularly the Federal Reserve, which establishes national monetary policy. The nature and impact of any future changes in fiscal or monetary policies cannot be predicted.
Commercial banks
such as Reliant Bank are affected by the credit policy of various regulatory authorities, including the Federal Reserve. An important function of the Federal Reserve is to regulate the national supply of bank credit. Among the instruments of monetary policy used by the Federal Reserve to implement
theseits objectives are open market operations in
U.S.United States Government securities, changes in reserve requirements on bank deposits, changes in the discount rate on bank borrowings and limitations on interest rates that banks may pay on time and savings deposits. The Federal Reserve uses these
meansinstruments in varying combinations to influence
the overall growth of bank loans, investments and deposits, and also to affect interest rates charged on loans, received on investments or paid for deposits.
The monetary and fiscal policies of regulatory authorities, including the Federal Reserve, also affect the banking industry. Through changes in the reserve requirements against bank deposits, open market operations in
U.S.United States Government securities and changes in the discount rate on bank borrowings, the Federal Reserve influences the cost and availability of funds obtained for lending and investing. No prediction can be made with respect to possible future changes in interest rates, deposit levels or loan demand or with respect to the impact of such changes on the business and earnings of Reliant Bank.
From
Future Legislation and Regulation
Various and significant legislation affecting financial institutions and the financial industry is from time to time
legislation is enacted which hasintroduced in the
effect of increasingUnited States Congress, as evidenced by the
cost of doing business, limiting or expanding permissible activities, or affecting the competitive balance between banks and other financial institutions. With the enactments of EESA, the American Recovery and Reinvestment Act, andsweeping reforms in the Dodd-Frank Act, and the
subsequent rollback of portions of the Dodd-Frank Act that began in 2018. Many of the regulations mentioned above were adopted or amended pursuant to the Dodd-Frank Act. Additional legislation may create new, or continue to change existing, banking statutes and regulations, and may alter the operating environment of Reliant and its subsidiaries, particularly Reliant Bank, in significant
numberand unpredictable ways, and such legislation could significantly increase or decrease our cost of
regulations that havedoing business, limit or
will be promulgated under theseexpand the permissible activities in which we can engage, and/or affect the competitive balance among financial institutions. Current and
other laws affecting financial institutions,future political and economic conditions and uncertainty makes the nature and extent of
the future legislative and regulatory changes affecting financial institutions
and the resulting impact on those institutions is and will be unpredictable.
Bills are currently pending which may have the effect of changing the way our Bank conducts its business.Statistical Information Required by Guide 3
The statistical information required to be displayed under Item 1 pursuant to Guide 3, “StatisticalDisclosurebyBankHoldingCompanies,” of the Exchange Act Industry Guides is included in “Management’s Discussion and Analysis of Financial Condition and Results of Operations” in Item 7.
Reliant’s
ITEM 1A. RISK FACTORS
Investing in our common stock involves a high degree of risk. Before you decide to invest in our common stock, you should carefully consider the risks described below, together with all other information included in this Annual Report, including the disclosures in “Item 7. Management’s Discussion and Analysis of Financial Condition and Results of Operations” and our consolidated financial statements and the related notes included in “Item 8. Financial Statements and Supplementary Data.” We believe the risks described below are the risks that are material to us as of the date of this Annual Report. If any of the following risks actually occur, our business, financial condition, results of operations and growth prospects could be materially and adversely affected. In that case, you could experience a partial or complete loss of your investment.
Risks Related to Reliant Bancorp’s Business
Reliant Bancorp is geographically concentrated in Middle Tennessee and changes in local economic conditions impact our profitability.
We currently operate primarily in the Nashville MSA, and most of our loan, deposit and other customers live or have operations in this area. Accordingly, our success significantly depends upon the growth in population, income levels, deposits, and housing starts in this market, along with the continued attraction of business ventures to the area, and our profitability is impacted by the changes in general economic conditions in this market. We cannot assure you that economic conditions, including loan demand, in our market will improve during 2020, or thereafter, and in that case, we may not be able to grow our loan portfolio in line with our expectations. In addition, the ability of our customers to repay their loans to us may be negatively impacted and our financial condition and results of operations could be negatively impacted.
Compared to regional or national financial institutions, we are less able to spread the risks of unfavorable local economic conditions across a large number of diversified economies. Moreover, we cannot give any assurance that we will benefit from any market growth or more favorable economic conditions in our primary market areas if they do occur.
Reliant Bank’s decisions regarding credit risk and
reservesprovision for loan
lossesloss may materially and adversely affect its business.
Making loans and other extensions of credit is an essential element of Reliant Bank’s business. Although Reliant Bank seeks to mitigate risks inherent in lending by adhering to specific underwriting practices, its loans and other extensions of credit may not be repaid. The risk of nonpayment is affected by a number of factors, including:
the duration of the credit;
credit risks of a particular customer;
changes in economicmicro or macroeconomic and industry conditions; and
in the case of a collateralized loan, risks resulting from uncertainties about the future value of the collateral.
Reliant Bank attempts to maintain an appropriate allowance for loan lossesand lease loss ("ALLL") to provide for potential losses in its loan portfolio. Reliant Bank periodically determines the amount of the allowance based on consideration of several factors, including:
an ongoing review of the quality, mix, and size of ourReliant Bank’s overall loan portfolio;
Reliant Bank’s historical loan loss experience;
evaluation of economicmicro and macroeconomic conditions;
regular reviews of loan delinquencies and loan portfolio quality; and
the amount and quality of collateral, including guarantees, securing the loans.
There is no precise method of predicting credit losses; therefore, Reliant Bank faces the risk that charge-offs in future periods will exceed its
allowance for loan lossesALLL and that additional increases in the
allowance for loan lossesALLL will be required. Additions to the
allowance for loan lossesALLL would result in a decrease in
Commerce Union’sReliant Bancorp’s net income and
possibly its capital.
Federal and state regulators periodically review Reliant Bank’s
allowance for loan lossesALLL and may require
Reliant Bankus to increase its provision for loan losses or recognize further loan charge-offs, based on judgments different than those of its management. Any increase in the amount of Reliant Bank’s provision or loans
charged-off as required by these regulatory agencies could have a negative effect on its operating results.
Uncertain market conditions and economic trends could adversely affect our business, financial condition and results of operations.
We operate in an uncertain economic environment, including generally uncertain conditions nationally and locally in our industry and market. Financial institutions continue to be affected by volatility in the real estate market in some parts of the country and uncertain regulatory and interest rate conditions. We retain direct exposure to the residential and commercial real estate market in Middle Tennessee, particularly in the Nashville MSA, and are affected by these events.
Our ability to assess the creditworthiness of customers and to estimate the losses inherent in our loan portfolio is made more complex by uncertain market and economic conditions. While economic conditions in the United States are at positive market levels for low unemployment, job participation rates and real estate values, economic growth may slow or reverse as concerns about the level of United States government debt and fiscal actions that may be taken to address this, as well as economic and political conditions in the national and global markets. Unfavorable economic trends, sustained high unemployment, and declines in real estate values can cause a reduction in the availability of commercial credit and can negatively impact the credit performance of commercial and consumer loans, resulting in increased write-downs. These negative trends can cause economic pressure on consumers and businesses and diminish confidence in the financial markets, which may adversely affect our business, financial condition, results of operations and ability to access capital. A worsening of these conditions, such as a recession or economic slowdown, would likely exacerbate the adverse effects of these difficult market conditions on us and others in the financial services industry.
Our risk management practices, such as monitoring the concentration of our loans within specific industries and our credit approval practices, may not adequately reduce credit risk, and our credit administration personnel, policies and procedures may not adequately adapt to changes in economic or any other conditions affecting customers and the quality of the loan portfolio. A national economic recession or deterioration of conditions in our market could drive losses beyond that which is provided for in our ALLL and result in one or more of the following consequences:
increases in loan delinquencies;
increases in nonperforming assets and foreclosures;
decreases in demand for our products and services, which could adversely affect our liquidity position; and
decreases in the value of the collateral securing our loans, especially real estate, which could reduce customers’ borrowing power and repayment ability.
Declines in real estate values, volume of home sales and financial stress on borrowers as a result of the uncertain economic environment, including job losses, could have an adverse effect on our borrowers and/or their customers, which could adversely affect our business, financial condition and results of operations.
Interest rate shifts could reduce net interest income and otherwise negatively impact our financial condition and results of operations.
A large portion of our banking assets are monetary in nature and subject to risk from changes in interest rates. Like most financial institutions, our earnings and cash flows depend to a great extent upon the level of net interest income, or the difference between the interest income earned on loans, investments and other interest-earning assets, and the interest paid on interest-bearing liabilities, such as deposits and borrowings. Changes in interest rates can increase or decrease net interest income because different types of assets and liabilities may react differently, and at different times, to market interest rate changes. When interest-bearing liabilities mature or reprice more quickly or to a greater degree than interest-earning assets in a period, an increase in interest rates could reduce net interest income. Similarly, when interest-earning assets mature or reprice more quickly or to a greater degree than interest-bearing liabilities, falling interest rates could reduce net interest income.
An increase in interest rates may also, among other things, reduce the demand for loans and our ability to originate loans and decrease loan repayment rates. A decrease in the general level of interest rates may affect us through, among other things, increased prepayments on our loan portfolio and increased competition for deposits. Accordingly, changes in the level of market interest rates affect our net yield on interest-earning assets, loan origination volume, loan portfolio and overall results. Although our asset-liability management strategy is designed to control and mitigate exposure to the risks related to changes in market interest rates, those rates are affected by many factors outside of our control, including governmental monetary policies, inflation, deflation, recession, changes in unemployment, the money supply, international disorder and instability in domestic and foreign financial markets.
Additionally, interest rate increases often result in larger payment requirements for our borrowers, which increases the potential for default and could result in a decrease in the demand for loans. At the same time, the marketability of the property securing a loan may be adversely affected by any reduced demand resulting from higher interest rates. In a declining interest rate environment, there may be an increase in prepayments on loans as borrowers refinance their loans at lower rates. In addition, in a low interest rate environment, loan customers often pursue long-term fixed rate credits, which could adversely affect our earnings and net interest margin if rates increase. Changes in interest rates also can affect the value of loans, securities and other assets. An increase in interest rates that adversely affects the ability of borrowers to pay the principal or interest on loans may lead to an increase in nonperforming assets and a reduction of income recognized, which could have a material adverse effect on our results of operations and cash flows. Increases in interest rates may have a material adverse effect on our mortgage banking revenue and profitability. RMV may also be adversely affected by other economic factors within our markets such as negative changes in employment levels, job growth, and consumer confidence and availability of mortgage financing, one or all of which could result in reduced demand or price depression from current levels. RMV is also dependent upon the securitization market for mortgage-backed securities and could be materially adversely affected by any fluctuation or downturn in such market. In the event that disruptions to the secondary markets tighten or eliminate the available liquidity within the secondary markets for mortgage loans, we could experience a material adverse effect with respect to sales of mortgage loans and the profitability of our mortgage banking business.
Further, when we place a loan on nonaccrual status, we reverse any accrued but unpaid interest receivable, which decreases interest income. At the same time, we continue to incur a cost to fund the loan, which is reflected as interest expense on deposits and borrowings, without any interest income to offset the associated funding expense. We would incur a higher cost of funds to retain these deposits in a rising interest rate environment. Our net interest income could be adversely affected if the rates we pay on deposits and borrowings increase more rapidly than the rates we earn on loans and investment securities. Thus, an increase in the amount of nonperforming assets would have an adverse impact on our net interest income.
Reliant Bank may have higher loan losses than it has allowed for in its
allowance for loan losses.ALLL. Our loan portfolio includes a meaningful amount of
real estate construction and development,
commercial mortgage, and other commercial loans, which have a greater credit risk than residential mortgage loans.
Reliant Bank’s actual loan losses could exceed its
allowance for loan losses.ALLL. Reliant Bank’s average loan size continues to increase and reliance on its historic
allowance for loan lossesALLL may not be adequate. A large portion of Reliant Bank’s loan portfolio is composed of construction
and development, commercial mortgage, and
other commercial loans. Repayment of such loans is generally considered more subject to market risk than residential mortgage loans. Industry experience shows that a portion of loans will become delinquent and a portion of loans will require partial or entire
charge-off. Regardless of the underwriting criteria used, losses may be experienced as a result of various factors beyond Reliant Bank’s control, including, among other things, changes in market conditions affecting the value of loan collateral and problems affecting the credit of Reliant Bank’s borrowers.
Both Commerce Union and Reliant Bank
Our business may suffer if there are
subject to extensive regulation.Commerce Union and Reliant Bank are subject to extensive governmental regulation and control. Compliance with state and federal banking laws has a material effect on the business and operations of Commerce Union and Reliant Bank. Our operations are subject to state and federal banking laws, regulations, and procedures. The laws and regulations applicable to the banking industry could change at any time and are subject to interpretation, and management cannot predict the effects of these changes on Commerce Union’s business and profitability. Because government regulation greatly affects the business and financial results of all commercial banks and bank holding companies, the cost of compliance could adversely affect the ability of Commerce Union to operate profitably.Non-banking financial institutions, such as securities brokerage firms, insurance companies, and money market funds are now permitted to offer services that compete directly with services offered by banks. See “Supervision and Regulation.”
Regulations relating to privacy, information security and data protection could increase our costs, affect or limit how we collect and use personal information and adversely affect our business opportunities.
We are subject to various privacy, information security and data protection laws, including requirements concerning security breach notification, and we could be negatively impacted by them. For example,significant declines in the United States, certainvalue of our businesses are subject to the Gramm-Leach-Bliley Act (“GLBA”) and implementing regulations and guidance. Among other things, the GLBA: (i) imposes certain limitations on the abilityreal estate.
The market value of
financial institutions to share consumers’ nonpublic personal information with nonaffiliated third parties, (ii) requires that financial institutions provide certain disclosures to consumers about their information collection, sharing and security practices and affords customers the right to “opt out” of the institution’s disclosure of their personal financial information to nonaffiliated third parties (with certain exceptions) and (iii) requires financial institutions to develop, implement and maintain a written comprehensive information security program containing safeguards that are appropriate to the financial institution’s size and complexity, the nature and scope of the financial institution’s activities, and the sensitivity of customer information processed by the financial institution as well as plans for responding to data security breaches.Moreover, various United States federal banking regulatory agencies, states and foreign jurisdictions have enacted data security breach notification requirements with varying levels of individual, consumer, regulatory and/or law enforcement notification in certain circumstances in the event of a security breach. Many of these requirements also apply broadly to our partners that accept our payment. In many countries that have yet to impose data security breach notification requirements, regulators have increasingly used the threat of significant sanctions and penalties by data protection authorities to encourage voluntary notification and discourage data security breaches.
Furthermore, legislators and/or regulators in the United States are increasingly adopting or revising privacy, information security and data protection laws that potentially could have a significant impact on our current and planned privacy, data protection and information security-related practices, our collection, use, sharing, retention and safeguarding of consumer and/or employee information, and some of our current or planned business activities. This could also increase our costs of compliance and business operations and could reduce income from certain business initiatives. This includes increased privacy-related enforcement activity at the federal level, by the Federal Trade Commission, as well as at the state level, such as with regard to mobile applications.
Compliance with current or future privacy, data protection and information security laws (including those regarding security breach notification) affecting customer and/or employee data to which we are subject could result in higher compliance and technology costs and could restrict our ability to provide certain products and services, which could materially and adversely affect our profitability. Our failure to comply with privacy, data protection and information security laws could result in potentially significant regulatory and/or governmental investigations and/or actions, litigation, fines, sanctions and damage to our reputation and our brand.
Material changes to national or state legislation or regulation may increase our expenses and reduce earnings.
Bank regulators continue to impose and emphasize additional restrictions (including those originating from the Dodd-Frank Act) on financial institutions. Changes in federal legislation, regulation or policies, such as bankruptcy laws, deposit insurance, consumer protection laws, and capital requirements, among others, can result in significant increases in our expenses and/or charge-offs, which may adversely affect our earnings. Changes in state or federal tax laws or regulations can have a similar impact. The current administration has said that changes to federal tax laws, as well as the manner in which financial institutions are regulated, are high priority legislative issues. The federal government, as well as state and municipal governments, including the State of Tennessee, could seek to increase their tax revenues through increased tax levies which could have a meaningful impact on our results of operations. Furthermore, financial institution regulatory agencies are expected to continue to be aggressive in responding to concerns and trends identified in examinations, including the continued issuance of additional formal or informal enforcement or supervisory actions. Negative developments in the financial services industry and the impact of recently enacted or new legislation in response to those developments could negatively impact our operations by restricting our business operations, including our ability to originate or sell loans, and adversely impact our financial performance. In addition, industry, legislative or regulatory developments may cause us to materially change our existing strategic direction, capital strategies, compensation or operating plans.
Anti-money laundering and anti-terrorism financing laws could have significant adverse consequences for us.
We maintain an enterprise-wide program designed to enable us to comply with applicable anti-money laundering and anti-terrorism financing laws and regulations, including the Bank Secrecy Act and the USA PATRIOT Act. This program includes policies, procedures, processes and other internal controls designed to identify, monitor, manage and mitigate the risk of money laundering or terrorist financing posed by our products, services, customers and geographic locale. These controls include procedures and processes to detect and report suspicious transactions, perform customer due diligence, respond to requests from law enforcement, and meet all recordkeeping and reporting requirements related to particular transactions involving currency or monetary instruments. We cannot be sure our programs and controls will be effective to ensure our compliance with all applicable anti-money laundering and anti-terrorism financing laws and regulations, and our failure to comply could subject us to significant sanctions, fines, penalties and reputational harm, all of which could have a material adverse effect on our business, results of operations and financial condition.
Reliant Bank’s focus on lending to small tomid-sized community based businesses may increase Commerce Union’s credit risk.
Most of Reliant Bank’s commercial business and commercial real estate loans are made to small business or middlecan fluctuate significantly in a short period of time as a result of market customers. These businesses generally have fewer financial resources in terms of capital or borrowing capacity than larger entities and have a heightened vulnerability to economic conditions. If general economic conditions in the marketsgeographic area in which Reliant Bank operates negatively impact this important customer sector, Commerce Union’s results of operations and financial condition andthe real estate is located. If the value of its common stock may be adversely affected. Furthermore, the deterioration of Reliant Bank’s borrowers’ businesses may hinder their abilityreal estate serving as collateral for our loan portfolio were to repay their loans with Reliant, which could havedecline materially, a material adverse effect on Reliant’s financial condition and results of operations.
Reliant is geographically concentrated in middle Tennessee and changes in local economic conditions impact our profitability.
We currently operate primarily in the Nashville, Tennessee MSA, and mostsignificant part of our loan deposit and other customers liveportfolio could become under-collateralized. If the loans that are collateralized by real estate become troubled during a time when market conditions are declining or have operations in this area. Accordingly, our success significantly depends upon the growth in population, income levels, deposits, and housing starts in this market, along with the continued attraction of business ventures to the areas, and our profitability is impacted by the changes in general economic conditions in this market. We cannot assure you that economic conditions, including loan demand, in our market will improve during 2016, or thereafter, and in that case,declined, we may not be able to growrealize the value of the security anticipated when we originated the loan, which in turn could have an adverse effect on our allowance and provision for loan portfolio in line with our expectations. In addition, the ability of our customers to repay their loans to us may be negatively impactedand lease losses and our financial condition, and results of operations and liquidity.
Most of our foreclosed assets are comprised of real estate properties. We carry these properties at their estimated fair values less estimated selling costs. While we believe the carrying values for such assets are reasonable and appropriately reflect current market conditions, there can be no assurance that the values of such assets will not further decline prior to sale or that the amount of proceeds realized upon disposition of foreclosed assets will approximate the carrying value of such assets. If the proceeds from any such dispositions are less than the carrying value of foreclosed assets, we will record a loss on the disposition of such assets, which in turn could
be negatively impacted.have an adverse effect on our results of operations.
Compared to
regional or national financial institutions, we are less able to spread the risks of unfavorable local economic conditions across a large number of diversified economies. Moreover, we cannot give any assurance that we will benefit from any market growth or return of more favorable economic conditions in our primary market areas if they do occur.
Reliant Bank’s focus on lending to small to mid-sized community based businesses may increase Reliant Bancorp’s credit risk.
Most of Reliant Bank’s commercial business and commercial real estate loans are made to small business or middle market customers. These businesses generally have fewer financial resources in terms of capital or borrowing capacity than larger entities and have a heightened vulnerability to economic conditions. Small to medium-sized businesses frequently have smaller market shares than their competition, may be more vulnerable to economic downturns, often need substantial additional capital to expand or compete and may experience substantial volatility in operating results, any of which characteristics may impair a borrower’s ability to repay a loan. In addition, the success of a small or medium-sized business often depends on the management skills, talents and efforts of a small group of people, and the death, disability or resignation of one or more of these people could have a material adverse impact on the business and its ability to repay its loans. If general economic conditions in the markets in which Reliant Bank
faces strong competition for customers, which could prevent it from obtaining customersoperates negatively impact this important customer sector, Reliant Bancorp’s results of operations and
financial condition and the value of its common stock may
cause itbe adversely affected. Furthermore, the deterioration of Reliant Bank’s borrowers’ businesses may hinder their ability to
pay higher interest rates to attract customers.The banking business is highly competitive, andrepay their loans with Reliant Bank, experiences competition in its market from many other financial institutions. Reliant Bank competes with commercial banks, credit unions, savings and loan associations, mortgage banking firms, consumer finance companies, securities brokerage firms, insurance companies, money market funds, and other mutual funds, as well as other super-regional, national, and international financial institutions that operate offices in Reliant’s primary market areas and elsewhere. Reliant competes with these institutions both in attracting deposits and in making loans. In addition, Reliant has to attract its customer base from other existing financial institutions and from new residents and businesses that have relocated to the Nashville, Tennessee, MSA. Many of Reliant’s competitors are well-established, larger financial institutions. These institutions offer some services, such as extensive and established branch networks, that Reliant does not provide. There is a risk that Reliant will not be able to compete successfully with other financial institutions in Reliant’s market, and that it may have to pay higher interest rates to attract deposits, resulting in reduced profitability. In addition, competitors that are not depository institutions are generally not subject to the extensive regulations that apply to Reliant.
Reliant’s deposit insurance premiums could be substantially higher in the future, which could have a material adverse effect on its future earnings.
Reliant Bancorp’s financial condition and results of operations.
Our financial condition and results of operations may be adversely affected by changes in accounting policies, standards and interpretations.
The FDIC insures deposits at FDIC-insured depository institutions, suchFASB and other bodies that establish accounting standards periodically change the financial accounting and reporting standards governing the preparation of our financial statements. Additionally, those bodies that establish and interpret the accounting standards (such as the FASB, SEC and banking regulators) may change prior interpretations or positions on how these standards should be applied. Changes resulting from these new standards may result in materially different financial results and may require that we change how we process, analyze and report financial information and that we change financial reporting controls.
In June 2016, the FASB issued CECL . The FASB subsequently issued an update and CECL is currently scheduled to become effective for Reliant Bank
up2023. This standard amends guidance on reporting credit losses for assets held at amortized cost basis and available for sale debt securities. CECL will require financial institutions to
applicable limits. The amountdetermine periodic estimates of
a particular institution’s deposit insurance assessmentlifetime expected credit losses on loans and recognize the expected credit losses through provision for loan losses. This will change the current method of provisioning for loan losses that are probable, which may require Reliant Bank to increase its ALLL, and is
based on that institution’s risk classification under an FDIC risk-based assessment system. An institution’s risk classification is assigned based onlikely to increase the types of data Reliant Bank would need to collect and review to determine the appropriate level of its
capital levels andALLL. In addition, this change may result in more volatility in the level of
supervisory concernReliant Bank's ALLL. An increase, to the
institution posesextent material, in Reliant Bank's ALLL or expenses incurred to
its regulators. Recent market developments and bank failures significantly depleteddetermine the
FDIC’s Deposit Insurance Fund and reduced the ratio of reserves to insured deposits. As a result of recent economic conditions and the enactmentappropriate level of the
Dodd-Frank Act, banks are now assessed deposit insurance premiums based on the bank’s average consolidated total assets, and the FDIC has modified certain risk-based adjustments, which increase or decrease a bank’s overall assessment rate. This has resulted in increases to the deposit insurance assessment rates and thus raised deposit premiums for many insured depository institutions. If these increases are insufficient for the Deposit Insurance Fund to meet its funding requirements, further special assessments or increases in deposit insurance premiums may be required. Reliant is generally unable to control the amount of premiums that Reliant Bank is required to pay for FDIC insurance. If there are additional bank or financial institution failures, Reliant Bank may be required to pay even higher FDIC premiums than the recently increased levels. Any future additional assessments, increases or required prepayments in FDIC insurance premiums could reduce Reliant Bank’s profitability, may limit its ability to pursue certain business opportunities or otherwise negatively impact its operations.Changes in prevailing interest rates may reduce Reliant’s profitability.
Reliant’s results of operations depend in large part upon the level of its net interest income, which is the difference between interest income from interest earning assets, such as loans and investment securities, and interest expense on interest bearing liabilities, such as deposits and other borrowings. Depending on the terms and maturities
of Reliant’s assets and liabilities, Reliant believes it is more likely than not a significant change in interest ratesALLL could have a material adverse effect on its profitability. Manyour capital levels, financial condition, and results of operations.
ASU 2016-02, “Leases (Topic 842).” ASU 2016-02 requires lessees to recognize a lease liability, which is a lessee's obligation to make lease payments arising from a lease, measured on a discounted basis; and a right-of-use asset, which is an asset that represents the lessee’s right to use, or control the use of, a specified asset for the lease term. ASU 2016-02 will be effective for us on January 1, 2020 and will require transition using a modified retrospective approach for leases existing at, or entered into after, the beginning of the earliest comparative period presented in the consolidated financial statements. The effect of implementing this pronouncement resulted in right to use assets of $12,032 and a corresponding lease liability.
We may be unable to implement aspects of our growth strategy, which may affect our ability to maintain historical earnings trends.
Our business has grown rapidly with a strategy focused on organic growth, supplemented by acquisitions. Financial institutions that grow rapidly can experience significant difficulties as a result. We may be unable to execute on aspects of our growth strategy to sustain our historical rate of growth or may be unable to grow at all. More specifically, we may be unable to generate sufficient new loans and deposits within acceptable risk and expense tolerances, obtain the personnel or funding necessary for additional growth or find suitable acquisition candidates. Various factors, cause changessuch as economic conditions and competition, may impede or prohibit the growth of our operations, the opening of new branches and the consummation of acquisitions. Further, we may be unable to attract and retain experienced bankers, which could adversely affect our growth. The success of our strategy also depends on our ability to effectively manage growth, which is dependent upon a number of factors, including the ability to adapt existing credit, operational, technology and governance infrastructure to accommodate expanded operations. If we fail to build infrastructure sufficient to support rapid growth or fail to implement one or more aspects of our strategy, we may be unable to maintain historical earnings trends, which could have an adverse effect on our business, financial condition and results of operations.
Ourrecent acquisitions and growth and future expansion may result in interest rates,additional risks.
Over the last three years, we have completed the Community First Transaction and TCB Holdings Transaction. In addition, on October 22, 2019, we entered into a definitive agreement to acquire FABK, the parent company for FAB. We expect to continue to expand in our current markets and in other select markets through additional branches or through additional acquisitions of all or part of other financial institutions. These types of expansions involve various risks, including governmental monetarythe risks detailed below.
Growth. As a result of our acquisition activity and organic growth, we may be unable to successfully:
maintain acceptable loan quality in the context of significant loan growth;
obtain regulatory and other approvals;
attract or retain sufficient deposits and capital to fund anticipated loan growth;
maintain adequate common equity and regulatory capital;
avoid diversion or disruption of our existing operations or management as well as those of any acquired institution;
maintain adequate management personnel and systems to oversee and support such growth;
maintain adequate internal audit, loan review and compliance functions; and
implement additional policies, procedures and domesticoperating systems required to support such growth.
Results of Operations. There is no assurance that existing offices or future offices will maintain or achieve deposit levels, loan balances or other operating results necessary to avoid losses or produce profits. Our growth strategy necessarily entails growth in overhead expenses as we routinely add new offices and international economic and political conditions. While Reliant intends to manage the effects of changes in interest rates by adjusting the terms, maturities, and pricing of its assets and liabilities, its effortsstaff. Our historical results may not be effectiveindicative of future results or results that may be achieved as we continue to increase the number and itsconcentration of our branch offices in our newer markets.
Development of Offices. There are considerable costs involved in opening branches, and new branches generally do not generate sufficient revenues to offset their costs until they have been in operation for at least a year or more. Accordingly, any new branches we establish can be expected to negatively impact our earnings for some period of time until they reach certain economies of scale. The same is true for our efforts to expand in current markets with the hiring of additional seasoned professionals with significant
experience in those markets. Our expenses could be further increased if we encounter delays in opening new branches. We may be unable to accomplish future branch expansion plans due to a lack of available satisfactory sites, difficulties in acquiring such sites, failure to receive any required regulatory approvals, increased expenses or loss of potential sites due to complexities associated with zoning and permitting processes, higher than anticipated merger and acquisition costs or other factors. Finally, we can have no assurance any branch will be successful even after it has been established or acquired, as the case may be.
Regulatory and Economic Factors. Our growth and expansion plans may be adversely affected by a number of regulatory and economic developments or other events. Failure to obtain required regulatory approvals, changes in laws and regulations or other regulatory developments and changes in prevailing economic conditions or other unanticipated events may prevent or adversely affect our continued growth and expansion. Such factors may cause us to alter our growth and expansion plans or slow or halt the growth and expansion process, which may prevent us from entering into or expanding in our targeted markets or allow competitors to gain or retain market share in our existing markets.
Transaction Termination. In connection with acquisitions, pending transactions carry the risk of not being completed and subject to contractual termination fees as well as reputational risk.
Failure to successfully address these and other issues related to our expansionary activities could have a material adverse effect on our financial condition and results of operations
and could
suffer.Commerce Unionadversely affect our ability to successfully implement our business strategy. Also, if our growth occurs more slowly than anticipated or declines, our results of operations and financial condition could be materially adversely affected.
We may face risks with respect to future acquisitions.
When we attempt to expand our business through mergers and acquisitions (as we have done over the last several years), we seek targets that are culturally similar to us, have experienced management and possess either market presence or have potential for improved profitability through economies of scale or expanded services. In addition to the general risks associated with our growth plans, which are highlighted above, in general, acquiring other banks, businesses or branches, particularly those in markets with which we are less familiar, involves various risks commonly associated with acquisitions, including, among other things:
the time and costs associated with identifying and evaluating potential acquisition and merger targets;
inaccuracies in the estimates and judgments used to evaluate credit, operations, management and market risks with respect to the target institution;
the time and costs associated with evaluating new markets, hiring experienced local management, including as a result of de novo expansion into a market, and opening new bank locations, and the time lags between these activities and the generation of sufficient assets and deposits to support the significant costs of the expansion that we may incur, particularly in the first 12 to 24 months of operations;
our ability to finance an acquisition and possible dilution to our existing shareholders;
the diversion of our management’s attention to the negotiation of a transaction and integration of an acquired company’s operations with ours;
the incurrence of an impairment of goodwill associated with an acquisition and adverse effects on our results of operations;
entry into new markets where we have limited or no direct prior experience;
closing delays and increased expenses related to the resolution of lawsuits filed by our shareholders or shareholders of companies we may seek to acquire;
the inability to receive regulatory approvals timely or at all, including as a result of community objections, or such approvals being restrictively conditional; and
risks associated with integrating the operations, technologies and personnel of an acquired business.
We expect to continue to evaluate merger and acquisition opportunities that are presented to us in our current markets as well as other markets throughout the region and conduct due diligence activities related to possible transactions with other financial institutions. As a result, merger or acquisition discussions and, in some cases, negotiations may take place and future mergers or acquisitions involving cash or equity securities and related capital raising transactions may occur at any time. Generally, acquisitions
of financial institutions involve the payment of a premium over book and market values, and, therefore, some dilution of our book value and fully diluted earnings per share may occur in connection with any future transaction. Failure to realize the expected revenue increases, cost savings, increases in product presence and/or other projected benefits from an acquisition could have a material adverse effect on our financial condition and results of operations.
In addition, we may face significant competition from numerous other financial institutions, many of which may have greater financial resources than we do, when considering acquisition opportunities. Accordingly, attractive acquisition opportunities may not be available to us. There can be no assurance that we will be successful in identifying or completing any potential future acquisitions.
Reliant Bancorp and Reliant
Bank are dependent on
retaining and recruiting key individuals and the loss of one or more of these key individuals could curtail its growth and adversely affect its prospects.
Commerce Union and Reliant Bank are
Our Company is materially dependent on the performance of
theour executive management team, loan officers, and other support personnel.
On January 30, 2017, the Company announced the retirement of William R. (Ron) DeBerry, its chairman and CEO, effective June 30, 2017, and its intention to appoint the company’s current President, DeVan D. Ard, Jr., to succeed Mr. DeBerry. While the Company believes it has reasonable succession plans in place, the Company is dependent on its executive team including the President, Chief Executive Officer, Chief Financial Officer and other high-level officers. The loss of the services of any of these individuals could have a material adverse effect on the business of
Commerce UnionReliant Bancorp and Reliant
Bank and our results of operations and financial condition. Many of these key
officerspersonnel have important customer relationships, which are instrumental to
theReliant Bank’s operations. Changes in key personnel and their responsibilities may be disruptive to Reliant
Bancorp's and Reliant Bank’s business and could have a material adverse effect on Reliant
Bancorp's and Reliant Bank’s business, financial condition, and results of
operations, either before or after the merger.operations. Management believes that future results also will depend in part upon attracting and retaining highly skilled and qualified management, especially in the new market areas into which Reliant
Bank may enter, as well as sales and marketing personnel. Competition for such personnel is intense, and management cannot be sure that Reliant
Bank will be successful in attracting or retaining such personnel.
Commerce Union is an emerging growth company, and it cannot
We may be
certain if the reduced disclosure requirements applicable to emerging growth companies will make Commerce Union’s common stock less attractive to investors.Commerce Union is subject to periodic reporting requirements under the Securities Exchange Act of 1934. Commerce Union is an “emerging growth company,” as definedenvironmental liabilities in the JOBS Act, however, and it may take advantage of certain exemptions from various reporting requirements that are applicable to public companies that are not emerging growth companies, including, but not limited to, not being required to complyconnection with the auditor attestation requirements of Section 404 offoreclosure on real estate assets securing our loan portfolio.
Hazardous or toxic substances or other environmental hazards may be located on the
Sarbanes-Oxley Act, reduced disclosure obligations regarding executive compensation in its periodic reports and proxy statements, and exemptions from the requirements of holding a nonbinding advisory vote on executive compensation and stockholder approval of any golden parachute payments not previously approved. In addition, even if Commerce Union complies with the greater obligations of public companiesproperties that
are not emerging growth companies immediately after this offering, Commerce Union may avail itself of the reduced requirements applicable to emerging growth companies from time to time in the future, so long as it is an emerging growth company. Commerce Union will remain an emerging growth company for up to five years, though it may cease to be an emerging growth company earlier under certain circumstances, including if, before the end ofsecure our loans. If we acquire such
five years, it is deemed to be a large accelerated filer under the rules of the SEC (which depends on, among other things, having a market value of common stock held bynon-affiliates in excess of $700 million) or if Commerce Union’s total annual gross revenues equal or exceed $1 billion in a fiscal year. Commerce Union cannot predict if investors will find its common stock less attractive because it will rely on these exemptions. If some investors find Commerce Union’s common stock less attractiveproperties as a result
there mayof foreclosure or otherwise, we could become subject to various environmental liabilities. For example, we could be
a less active trading marketheld liable for
Commerce Union’s common stock and its stock price maythe cost of cleaning up or otherwise addressing contamination at or from these properties. We could also be
more volatile.Further, the JOBS Act exempts emerging growth companies from being required to comply with new or revised financial accounting standards until private companies (that is, those that have not had a Securities Act registration statement declared effective or do not have a class of securities registered under the Exchange Act) are required to comply with the new or revised financial accounting standards. The JOBS Act provides that a company can elect to opt out of the extended transition period and comply with the requirements that apply tonon-emerging growth companies but any such election to opt out is irrevocable. Commerce Union has elected not to opt out of such an extended transition period, which means that when a standard is issued or revised and it has different application dates for public or private companies, Commerce Union, as an emerging growth company, can adopt the new or revised standard at the time private companies adopt the new or revised standard. This may make Commerce Union’s financial statements not comparable with those of another public company that is neither an emerging growth company nor an emerging growth company, which has opted out of using the extended transition period because of the potential differences in accounting standards used.
The short-term and long-term impact of the changing regulatory capital requirements and recently adopted capital rules is uncertain.
On September 12, 2010, the Group of Governors and Heads of Supervision, the oversight body of the Basel Committee on Banking Supervision, announced agreementheld liable to a strengthened set of capital requirementsgovernmental entity or third party for internationally active banking organizations in the U.S.property damage, personal injury or other claims relating to any environmental contamination at or from these properties. In addition, we may own and around the world, known as Basel III. Basel III called for increases in the requirements for minimum common equity, minimum Tier 1 capital and minimum total capital foroperate certain systemically important financial institutions, to be phased in over time until fully phased in by January 1, 2019. The final rules were adopted by the federal banking agencies in July 2013.
The rules add a new common equity Tier 1 capital to risk-weighted assets ratio minimum of 4.5%, increase the minimum ratio of Tier 1 capital to risk-weighted assets from 4.0% to 6.0%, and decrease the Tier 2 capitalproperties that may be included in calculating total risk-based capital from 4.0%subject to 2.0%. The final rules also introduce a common equity Tier 1 capital conservation buffersimilar environmental liability risks during any given fiscal year. If we were to become subject to significant environmental liabilities, our business, financial condition and results of 2.5% of risk-weighted assets, which is in additionoperations could be adversely affected.
We are exposed to
the Tier 1 and total risk-based capital requirements. The required minimum ratio of total capital to risk-weighted assets will remain 8.0% and the minimum leverage ratio will remain 4.0%. The new risk-based capital requirements (except for the capital conservation buffer) became effective for Commerce Union on January 1, 2015. The capital conservation buffer is being phased in over four years which began on January 1, 2016, with a maximum buffer of 0.625% of risk-weighted assets for 2016, 1.25% for 2017, 1.875% for 2018, and 2.5% for 2019 and thereafter. Failure to maintain the required capital conservation buffer will result in limitations on capital distributions and on discretionary bonuses to executive officers.The final rules also implement revisions and clarifications consistent with Basel III regarding the various components of Tier 1 capital, including common equity, unrealized gains andincreased credit losses and instruments that will no longer qualify as Tier 1 capital. The final rules also set forth certain changes for the calculation of risk-weighted assets that Commerce Union was required to implement beginning January 1, 2015.
In addition to the updated capital requirements, the final rules also contain revisions to the prompt corrective action framework. Beginning January 1, 2015, the minimum ratios to be considered well-capitalized were updated to increase the minimum Tier 1 capital requirement from 6.0% to 8.0%, in addition to the requirement to maintain a common equity Tier 1 capital ratio of 6.5%.
In addition,credit related expenses in the currentevent of a major natural disaster, public health crisis, other catastrophic event or significant climate change effects.
The occurrence of a major natural or environmental disaster, public health crisis or similar catastrophic event, as well as significant climate change effects such as wildfires, especially in densely populated geographic areas, could increase our credit losses and credit related expenses. A natural disaster, public health crisis or catastrophic event or other significant climate change effect that either damages or destroys residential or multifamily real estate underlying mortgage loans or real estate collateral, or negatively affects the ability of borrowers to continue to make payments on loans, could increase our serious delinquency rates and average loan loss severity in the affected areas. Such events could also cause downturns in economic and
regulatory environment, regulators of banks and bank holding companies have become more likely to impose capital requirements on bank holding companies and banks that are more stringent than those required by applicable existing regulations.The application of more stringent capital requirements for Commerce Union and Reliant Bankmarket conditions generally, which could among other things, result in lower returns on invested capital, require the issuance of additional capital, and result in regulatory actions if Commerce Union were to be unable to comply with such requirements.
Interest rate movements, inflation and other economic factors can negatively impact our mortgage banking business.
Our financial results also are affected by the risks generally incident to our mortgage banking business, including interest rate levels, the impact of government regulation on mortgage loan originations and servicing and the need to issue forward commitments to fund and sell mortgage loans. Our mortgage banking business also is affected by interest rate fluctuations. We also may experience market losses resulting from daily increases in interest rates to the extent we are unable to match interest rates and amounts on loans we have committed to originate with forward commitments from third parties to purchase such loans. Increases in interest rates may have a material adverse effect on our mortgage banking revenue, profitability, stock performance,business and financial results. We may not have adequate insurance coverage for some of these natural, catastrophic, public health or climate change-related events.
Liquidity risk could impair our ability to servicefund our debt obligationsoperations and jeopardize our financial condition.
Liquidity represents an institution’s ability to provide funds to satisfy demands from depositors, borrowers and other creditors by either converting assets into cash or accessing new or existing sources of incremental funds. Liquidity risk arises from the possibility that we may be unable to satisfy current or future funding requirements and needs.
The objective of managing liquidity risk is to ensure that our cash flows.flow requirements resulting from depositor, borrower and other creditor demands as well as our operating cash needs are met, and that our cost of funding such requirements and needs is reasonable. We maintain an asset/liability and interest rate risk policy and a liquidity and funds management policy, including a contingency funding plan, that, among other things, include procedures for managing and monitoring liquidity risk. Generally, we rely on deposits, repayments of loans and leases and cash flows from our investment securities as our primary sources of funds. Our mortgage loan operations mayprincipal deposit sources include consumer, commercial and public funds customers in our markets. We have used these funds, together with federal funds purchased and other sources of short-term and long-term borrowings, to make loans and leases, acquire investment securities and other assets and to fund continuing operations.
An inability to maintain or raise funds in amounts necessary to meet our liquidity needs could have a substantial negative effect on Reliant Bank’s liquidity. Our access to funding sources in amounts adequate to finance our activities, or on terms attractive to us, could be impaired by factors that affect us specifically or the financial services industry in general. For example, factors that could detrimentally impact our access to liquidity sources include a decrease in the level of our business activity due to a market downturn or adverse regulatory action against us, a reduction in our credit rating, any damage to our reputation or any other decrease in depositor or investor confidence in our creditworthiness and business. Our access to liquidity could also be adversely affectedimpaired by other economic factors within our marketsthat are not specific to us, such as severe volatility or disruption of the financial markets or negative changes in employment levels, job growth,views and consumer confidenceexpectations about the prospects for the financial services industry as a whole. Any such event or failure to manage our liquidity effectively could affect our competitive position, increase our borrowing costs and availability of mortgage financing, one or all of which could result in reduced demand or price depression from current levels. Our mortgage banking operations are also dependent upon the securitization market for mortgage-backed securities, and could be materially adversely affected by any fluctuation or downturn in such market. In the event that disruptionsinterest rates we pay on deposits, limit our access to the secondarycapital markets tighten or eliminate the available liquidity within the secondary markets for mortgage loans, we could experienceand have a material adverse effect on our sales, profitability,results of operations or financial condition.
Deposit levels may be affected by a number of factors, including rates paid by competitors, general interest rate levels, returns available to customers on alternative investments, general economic and
stock performance.market conditions and other factors. Loan and lease repayments are a relatively stable source of funds but are subject to the borrowers’ and lessees’ ability to repay loans and leases, which can be adversely affected by a number of factors including changes in general economic conditions, adverse trends or events affecting business industry groups or specific businesses, declines in real estate values or markets, business closings or lay-offs, inclement weather, natural disasters and other factors. Furthermore, loans and leases generally are not readily convertible to cash. Accordingly, we may be required from time to time to rely on secondary sources of liquidity to meet growth in demand for loans and leases, deposit withdrawal demands or otherwise fund operations. Such secondary sources include FHLB advances, brokered deposits, secured and unsecured federal funds lines of credit from correspondent banks, Federal Reserve borrowings and/or accessing the equity or debt capital markets.
We anticipate we will continue to rely primarily on deposits, loan and lease repayments, and cash flows from our investment securities to provide liquidity. Additionally, where necessary, the secondary sources of borrowed funds described above will be used to augment our primary funding sources. If we are unable to access any of these secondary funding sources when needed, we might be unable to meet our customers’ or creditors’ needs, which would adversely affect our financial condition, results of operations, and liquidity.
If the underwriting quality of our mortgage
loan originations is found to be deficient, our
profitprofitability could decrease, and we may incur losses.
We provide several different loan products to our customers to finance the
purchasepurchases of their homes. We sell a large number of the mortgage loans we originate into the secondary mortgage market, and those loans are underwritten to the standards and specifications of the ultimate investor. Insofar as we underwrite our originated loans to those standards, we bear no increased concentration of credit risk from the issuance of loans, except in certain limited instances where early payment default occurs. In the event that a substantial number of the loans that we have originated fall into default and the investors to whom we sold the loans determine that we did not underwrite the loans in accordance with their requirements, we could be required to repurchase the loans from the investors or indemnify the
investorinvestors for any losses incurred. This may result in losses that could have a material adverse effect on our profitability
stock performance, ability to service our debt obligations and
future cash flows.The new“ability-to-repay” and “qualified mortgage” rules could have a negative impact on our loan origination process and foreclosure proceedings.
The Consumer Financial Protection Bureau, created by the Dodd-Frank Act, has adopted rules that are likely to impact our residential mortgage lending practices, and the residential mortgage market generally including rules that implement the“ability-to-repay” requirement and provide protection from liability for “qualified mortgages,” as required by the Dodd-Frank Act. Theability-to-repay rule, which took effect on January 10, 2014, requires lenders to consider, among other things, income, employment status, assets, payment amounts, and credit history before approving a mortgage, and provides a compliance “safe harbor” for lenders that issue certain “qualified mortgages.” The rules define a “qualified mortgage” to have certain specified characteristics, and generally prohibit loans with negative amortization, interest-only payments, balloon payments, or terms exceeding 30 years from being qualified mortgages. The rule also establishes general underwriting criteria for qualified mortgages, including that monthly payments be calculated based on the highest payment that will apply in the first five yearsresults of the loan and that the borrower have a totaldebt-to-income ratio that is less than or equal to 43 percent. While “qualified mortgages” will generally be afforded safe harbor status, a rebuttable presumption of compliance will attach to mortgages that also meet the definition of a “higher priced mortgage” (which are generally subprime loans). Although the new “qualified mortgage” rules may provide better definition and more certainty regarding regulatory requirements, the rules may also increase our compliance burden and reduce our lending flexibility and discretion, which could negatively impact our ability to originate new loans and the cost of originating new loans. Any loans that we make outside of the “qualified mortgage” criteria could expose us to an increased risk of liability and reduce or delay our ability to foreclose on the underlying property. Additionally, qualified “higher priced mortgages” only provide a rebuttable presumption of compliance and thus may be more susceptible to challenges from borrowers. It is difficult to predict how the CFPB’s “qualified mortgage” rules will impact us, but any decreases in loan origination volume or increases in compliance and foreclosure costs could negatively affect our business, operating results and financial condition.
Commerce Union’soperations.
Reliant Bancorp’s historical operating results may not be indicative of its future operating results.
Commerce Union
Reliant Bancorp may not be able to sustain its historical rate of growth, and, consequently,
Commerce Union’sReliant Bancorp’s historical results of operations will not necessarily be indicative of its future
operations due to the merger with Reliant Bank.results of operations. Various factors, such as economic conditions,
political, regulatory and legislative
initiatives and considerations, and competition, may
also impede
Commerce Union’sReliant Bancorp’s ability to expand its market presence. If
Commerce UnionReliant Bancorp experiences a significant decrease in its historical rate of growth,
Commerce Union’sReliant Bancorp’s results of operations and financial condition may be adversely affected because a high percentage of its operating costs are fixed expenses.
Commerce Union
Reliant Bancorp may be adversely affected by the soundness of other financial institutions.
Financial services institutions are interrelated as a result of trading, clearing, counterparty, or other relationships. We have exposure to many different industries and counterparties, and routinely
executesexecute transactions with counterparties in the financial services industry, including commercial banks, brokers and dealers, investment banks, and other institutional clients. Many of these transactions expose our
bankBank to credit risk in the event of a default by a counterparty or client. In addition, our credit risk may be exacerbated when the collateral held by the
bankBank cannot be realized
uponon or is liquidated at prices not sufficient to recover the full amount of the credit or derivative exposure. Any such losses could have a material adverse effect on our financial condition and results of operations.
Commerce Union’s
Economic and other circumstances may require Reliant Bancorp to raise capital at times or in amounts that are unfavorable to it. If Reliant Bancorp has to issue shares of common stock, the issuance will dilute the percentage ownership interest of existing shareholders and may dilute the book value per share of Reliant Bancorp’s common stock and adversely affect the terms on which Reliant Bancorp may obtain additional capital.
We face significant capital and other regulatory requirements as a financial institution. We may need to raise additional capital in the future to provide sufficient capital resources and liquidity to meet our commitments and business needs, which could include the possibility of financing acquisitions. In addition, we, on a consolidated basis, and Reliant Bank, on a standalone basis, must meet certain regulatory capital requirements and maintain sufficient liquidity. Importantly, regulatory capital requirements could increase from current levels, which could require us to raise additional capital or reduce our operations. Our ability to pay cash dividendsraise additional capital depends on conditions in the capital markets, economic conditions and a number of other factors, including investor perceptions regarding the banking industry, market conditions and governmental activities, and on our financial condition and performance.
Reliant Bancorp may need to incur additional debt or equity financing in the future to make strategic acquisitions or investments or to strengthen its capital position. Reliant Bancorp’s ability to raise additional capital, if needed, will depend on, among other things, conditions in the capital markets at that time, which are outside of our control, and Reliant Bancorp’s financial performance and condition. Reliant Bancorp cannot provide assurance that such financing will be available to Reliant Bancorp on acceptable terms or at all, or if Reliant Bancorp does raise additional capital that it will not be dilutive to existing shareholders.
If Reliant Bancorp determines, for any reason, that it needs to raise capital, Reliant Bancorp’s board of directors generally has the authority, without action by or vote of Reliant Bancorp's shareholders, to issue all or part of any authorized but unissued shares of stock for any corporate purpose, including issuance of equity based incentives under or outside of Reliant Bancorp’s equity compensation plans, subject to certain Nasdaq rules. Additionally, Reliant Bancorp is
limited, and Commerce Union may be unablenot restricted from issuing additional common stock or preferred stock, including securities that are convertible into or exchangeable for, or that represent the right to
pay future dividends even if it desiresreceive, common stock or preferred stock or any substantially similar securities. The market price of Reliant Bancorp’s common stock could decline as a result of sales by Reliant Bancorp of a large number of shares of common stock or preferred stock or similar securities in the market or from the perception that such sales could occur. If Reliant Bancorp issues preferred stock that has a preference over its common stock with respect to
do so.The Federal Reserve has issued a policy statement regarding the payment of dividends or upon liquidation, dissolution or winding-up, or if Reliant Bancorp issues preferred stock with voting rights that dilute the voting power of the common stock, the rights of holders of the common stock or the market price of Reliant Bancorp’s common stock could be adversely affected. Any issuance of additional shares of common stock will dilute the percentage ownership interest of Reliant Bancorp’s shareholders and may dilute the book value per share of its common stock. Shares that Reliant Bancorp issues in connection with any such offering will increase the total number of shares outstanding and may dilute the economic and voting ownership interest of Reliant Bancorp’s existing shareholders.
Reliant Bank faces strong competition for customers, which could prevent it from obtaining customers and may cause it to pay higher interest rates to attract customers.
The banking business is highly competitive, and Reliant Bank experiences competition in its markets from many other financial institutions. Reliant Bank competes with commercial banks, credit unions, savings and loan associations, mortgage banking firms, consumer finance companies, securities brokerage firms, insurance companies, money market funds, and other mutual funds, as
well as other super-regional, national, and international financial institutions that operate offices in Reliant Bank’s primary market areas and elsewhere. Reliant Bank competes with these institutions both in attracting deposits and in making loans. In addition, Reliant Bank has to attract its customer base from other existing financial institutions and from new residents and businesses that have relocated to the Nashville MSA. Many of Reliant Bank’s competitors are well-established, larger financial institutions. These institutions offer some services, such as extensive and established branch networks, that Reliant Bank does not provide. There is a risk that Reliant Bank will not be able to compete successfully with other financial institutions in Reliant Bank’s markets, and that it may have to pay higher interest rates to attract deposits, resulting in reduced profitability. In addition, competitors that are not depository institutions are generally not subject to the extensive regulations that apply to Reliant Bank.
Negative public opinion surrounding Reliant Bancorp and the financial institutions industry generally could damage our reputation and adversely impact its earnings.
Reputation risk, or the risk to Reliant Bancorp’s business, earnings and capital from negative public opinion surrounding Reliant Bancorp or the financial institutions industry generally, is inherent in Reliant Bancorp’s business. Negative public opinion can result from Reliant Bancorp’s actual or alleged conduct in any number of activities, including lending practices, corporate governance and acquisitions, and from actions taken by government regulators and community organizations in response to those activities. Negative public opinion can adversely affect Reliant Bancorp’s ability to keep and attract clients and employees and can expose it to litigation and regulatory action. Although Reliant Bancorp takes steps to minimize reputation risk in dealing with its clients and communities, this risk will always be present given the nature of Reliant Bancorp’s business.
We may not be able to report our financial results accurately and timely as a publicly listed company if we fail to maintain an effective system of disclosure controls and procedures and internal control over financial reporting.
As a publicly traded company, we are required to file periodic reports containing our consolidated financial statements with the SEC within a specified time following the completion of quarterly and annual periods. Maintaining effective disclosure controls and procedures is necessary to identify information we must disclose in our periodic reports and maintaining effective internal control over financial reporting is necessary to produce reliable financial statements and to prevent fraud. If we fail to maintain effective disclosure controls and procedures or effective internal control over financial reporting, we may experience difficulty in satisfying our SEC reporting obligations. Any failure by us to file our periodic reports with the SEC in a timely manner could harm our reputation and cause investors and potential investors to lose confidence in us and reduce the market price of our common stock, and could result in Nasdaq suspending or delisting our common stock.
We incur significant costs on an ongoing basis as a result of operating as a company whose ordinary shares are publicly traded in the United States, and our management is required to devote substantial time to compliance responsibilities, which will increase after we are no longer an emerging growth company.
As a company whose shares are publicly traded in the United States, we incur significant legal, accounting and other expenses on an ongoing basis for compliance purposes. In addition, the rules of the SEC and Nasdaq have imposed various requirements on public companies, including requirements for the establishment and maintenance of effective disclosure controls and internal control over financial reporting. Our management and other personnel devote a substantial amount of time to these compliance initiatives.
When the emerging growth company exemptions under the JOBS Act cease to apply, which we expect to occur on December 31, 2020, we expect to incur additional expenses and devote increased management effort toward ensuring compliance with increased reporting requirements. We cannot predict or estimate the amount of additional costs we may incur as a result of losing our emerging growth company status or the timing of such costs.
We are subject to certain operational risks, including but not limited to customer or employee fraud.
Employee errors and employee and customer misconduct could subject us to financial losses or regulatory sanctions and seriously harm our reputation. Misconduct by our employees could include hiding unauthorized activities from us, improper or unauthorized activities on behalf of our customers or improper use of confidential information. It is not always possible to prevent employee
errors and misconduct, and the precautions we take to prevent and detect this activity may not be effective in all cases. Employee errors could also subject us to financial claims for negligence. We maintain a system of internal controls and insurance coverage to mitigate against these operational risks. If our internal controls fail to prevent or detect an occurrence, or if any resulting loss is not insured or exceeds applicable insurance limits, it could have a material adverse effect on our business, financial condition or results of operations.
In addition, we rely heavily upon information supplied by third parties, including information contained in credit applications, property appraisals, title information, valuations and employment and income documentation, in deciding which loans we will originate as well as the terms of those loans. If any of the information upon which we rely is misrepresented, either fraudulently or inadvertently, and the misrepresentation is not detected prior to asset funding, the value of the asset may be significantly lower than expected, or we may fund a loan that we would not have funded or on terms we would not have extended.
A failure in or breach of Reliant Bancorp’s or Reliant Bank’s computer or information technology systems or networks, or those of third parties, could disrupt our businesses and adversely impact our financial condition and results of operations, as well as cause us reputational harm.
The potential for operational risk exposure exists throughout our organization and, as a result of our interactions with and reliance on third parties, is not limited to our own internal operating functions. Our computer and information technology systems and networks, as well as those of third parties, are integral to our business and performance. We rely on our employees and third parties in the course of our day-to-day operations, any of whom may, as a result of human error, misconduct, malfeasance, or a failure or breach of systems or networks, expose us to risk. We have taken measures to implement backup systems and other safeguards to support our operations, but our ability to conduct business may be adversely affected by any significant disruptions in or to our computer or information technology systems or networks or those of third parties with whom we interact or upon whom we rely. Our Company has also prepared and annually tests a business continuity plan that would be implemented in the event of a significant technological failure or if a current site become unavailable. In addition, our ability to implement backup systems and other safeguards with respect to third-party systems is more limited than with respect to our own systems. Our financial, accounting, data processing, backup, or other operating or security systems, or those of third parties with whom we interact or upon whom we rely, may fail to operate properly or become disabled or damaged as a result of a number of factors, including events that are wholly or partially beyond our or such third parties’ control, which could adversely affect our ability to process transactions or provide services. There could be sudden increases in customer transaction volume; electrical, telecommunications, or other major physical infrastructure outages; newly identified vulnerabilities in key hardware or software; natural disasters such as earthquakes, tornadoes, hurricanes, and floods; disease pandemics; and events arising from local or larger scale political or social matters, including terrorist acts. In the event that backup systems are utilized, these systems may not process data as quickly as our primary systems and some data might not have been backed up. We continuously update the systems on which we rely to support our operations and to remain compliant with applicable laws, rules, and regulations. This updating entails significant costs and creates risks associated with implementing new systems and integrating them with existing ones, including business interruptions. Operational risk exposures could materially and adversely impact our business, financial condition, and results of operations, as well as cause us reputational harm.
The financial services industry is undergoing rapid technological changes and we may not have the resources to implement new technology to stay current with these changes.
The financial services industry is undergoing rapid technological changes, with new technology-driven products and services being frequently introduced. In addition to better serving customers, the effective use of technology increases efficiency and enables financial institutions to reduce costs. Our future success will depend in part upon our ability to address the needs of our customers by using technology to provide products and services that will satisfy customer demands for convenience as well as to provide secure electronic environments as we continue to grow and expand our market area. Many of our larger competitors have substantially greater resources to invest, and have invested significantly more than us, in technological improvements. As a result, they may be able to offer additional or more convenient products compared to those that we will be able to provide, which would put us at a competitive disadvantage. We may not be able to effectively implement new technology-driven products and services or be successful in marketing such products and services to our customers, which could impair our growth and profitability.
A cyber-attack, information or security breach, or technology failure, on our part or that of a third party, could adversely affect our ability to conduct our business, result in the disclosure or misuse of confidential or proprietary information, or adversely impact our business, financial condition, and results of operations, as well as cause us reputational harm.
Our business is highly dependent on the security and integrity of our computer and information technology systems and networks, as well as those of third parties with whom we interact or on whom we rely. Our business is dependent on the secure processing, transmission, storage, and retrieval of confidential, proprietary, and other information in our computer and information technology
systems and networks, and in the computer and information technology systems and networks of third parties. In addition, to access our networks, products, and services, our customers and other third parties may use personal mobile or computing devices that are outside of our network environment and are subject to their own unique cybersecurity risks.
We and our third-party service providers and customers have been subject to, and are likely to continue to be the target of, cyber-attacks. These cyber-attacks include computer viruses, malicious or destructive code, phishing attacks, denials of service or information, or other security breaches that could result in the unauthorized release, gathering, monitoring, misuse, loss, or destruction of confidential, proprietary, or other information of ours or of our employees or customers or third parties, as well as damages to our and third-party computer and information technology systems and networks and the disruption of our or our customers’ or other third parties’ systems, networks, or business. As cyber threats continue to evolve, we may be required to expend significant additional resources to continue to modify or enhance our protective measures or to investigate and remediate any information security vulnerabilities or incidents. Despite efforts to protect the integrity of our systems and networks and implement controls, processes, policies, and other protective measures, cyber threats are rapidly evolving, and we may not be able to anticipate or prevent cyber-attacks or security breaches.
Cybersecurity risks for financial institutions have significantly increased in recent years in part because of the proliferation of new technologies and the use of the internet and telecommunications technologies to conduct financial transactions. For example, cybersecurity risks may increase in the future as we continue to increase our mobile-payment and other internet-based product offerings and expand our internal usage of web-based products and applications. In addition, cybersecurity risks have significantly increased in recent years in part due to the increased sophistication and activities of organized crime groups, hackers, terrorist organizations, hostile foreign governments, disgruntled employees or vendors, activists, and other external parties. Even the most advanced internal control environment may be vulnerable to compromise. Targeted social engineering attacks are becoming more sophisticated and are extremely difficult to prevent. The techniques used by bad actors change frequently, may not be recognized until launched, and may not be recognized until well after a breach has occurred. Additionally, the occurrence of cyber-attacks or security breaches involving third parties with access to our data, such as vendors, may not be disclosed to us in a timely manner.
Although to date we have not experienced any material losses or other material consequences relating to technology failures, cyber-attacks, or other information or security breaches, whether directed at us or third parties, there can be no assurance that we will not suffer such losses or other consequences in the future. Our risks associated with these matters remains heightened because of, among other things, the evolving nature of these threats, our size and scale, our role in the financial services industry, our plans to continue to implement our internet banking and mobile banking channel strategies and develop additional remote connectivity solutions to serve our customers when and how they want to be served, our continuous transmission of sensitive information to, and storage of such information by, third parties, the outsourcing of some of our business operations, threats of cyber terrorism, and system and customer account updates and conversions. As a result, cybersecurity and the continued development and enhancement of our controls, processes, policies, and other protective measures designed to protect our systems, computers, software, data, and networks from attack, damage, or unauthorized access remain a priority.
We also face indirect technology, cybersecurity, and operational risks relating to the customers and other third parties with whom we do business or upon whom we rely to facilitate or enable our business activities, including financial counterparties; financial intermediaries such as clearing agents, exchanges, and clearing houses; vendors; regulators; providers of critical infrastructure such as internet access and electrical power; and retailers for whom we process transactions. As a result of increasing consolidation, interdependence, and complexity of financial entities and technology systems, a technology failure, cyber-attack, or other information or security breach that significantly degrades, deletes, or compromises the systems or data of one or more financial entities could have a material impact on counterparties or other market participants, including us. This consolidation, interdependence, and complexity increases the risk of operational failure, on both individual and industry-wide bases, as disparate systems need to be integrated, often on an accelerated basis. Any third-party technology failure, cyber-attack, or other information or security breach could, among other things, adversely affect our ability to effect transactions, service our customers, manage our exposure to risk, or operate or expand our businesses.
Cyber-attacks or other information or security breaches, whether directed at us or third parties, may result in material losses or have other material adverse consequences. Furthermore, the public perception that a cyber-attack on our systems has been successful, whether or not this perception is correct, could damage our reputation with customers and third parties with whom we do business. A successful penetration or circumvention of the security of our computer or information technology systems or networks could cause us negative consequences, including loss of customers and business opportunities, disruption to our operations and business, misappropriation or destruction of our confidential information or that of our customers, or damage to our customers’ or other third parties’ computers or systems, and could result in a violation of applicable privacy laws and other laws, litigation exposure, regulatory fines, penalties or intervention, loss of confidence in our security measures, reputational damage, reimbursement or other compensatory costs, and additional compliance costs, all of which could materially and adversely affect our business, financial condition, and results of operations.
Reliant Bank could incur significant costs and expenses related to RMV, and these costs and expenses could have a material adverse effect on our business, financial condition, and results of operations.
RMV provides mortgage banking services to Reliant Bank customers. Reliant Bank holds 51% of the governance rights in RMV and 30% of the financial rights in RMV. VHC is the other member of RMV and holds 49% of the governance rights in RMV and 70% of the financial rights in RMV. Under the terms of the RMV operating agreement, VHC is required to fund RMV’s losses via additional capital contributions to RMV. RMV incurred a net loss of $5.66 million for the year ended December 31, 2019 and has incurred cumulative net losses of $13.41 million since inception. Also, per the terms of the RMV operating agreement, VHC is to receive all distributions of cash flow from RMV until such time as VHC has recovered its capital contributions to RMV. After the return to VHC of its capital contributions, VHC is to receive 70% of RMV cash flow distributions and Reliant Bank is to receive 30% of RMV cash flow distributions. There can be no assurance that RMV will ever generate sufficient income to return to VHC its aggregate capital contributions or that Reliant Bank will ever receive cash flow distributions from RMV.
To date, VHC has not failed to make a required contribution of additional capital to RMV to cover losses incurred by the company. In the event VHC fails to make a required contribution of additional capital to cover losses of RMV, Reliant Bank has the right to cause the dissolution of RMV. However, in such event, Reliant Bank could also be required to fund losses of RMV not funded by VHC, which losses could be significant. Additionally, in the event Reliant Bank were to cause the dissolution of RMV, there would be costs and expenses associated with dissolving RMV and winding up the company’s operations or integrating them with those of Reliant Bank, and those costs and expenses could be significant. Accordingly, VHC’s failure to make a required contribution of additional capital to cover losses of RMV and/or Reliant Bank’s decision to cause the dissolution of RMV in the event of such a failure could have a material adverse effect on our business, financial condition, and results of operations.
Reliant Bancorp is an emerging growth company, and it cannot be certain if the reduced disclosure requirements applicable to emerging growth companies will make Reliant Bancorp’s common stock less attractive to investors.
Reliant Bancorp is subject to periodic reporting requirements under the Exchange Act. Reliant Bancorp is an “emerging growth company,” as defined in the JOBS Act, however, and it may take advantage of certain exemptions from various reporting requirements that are applicable to public companies that are not emerging growth companies, including, but not limited to, not being required to comply with the auditor attestation requirements of Section 404 of the Sarbanes-Oxley Act, reduced disclosure obligations regarding executive compensation in its periodic reports and proxy statements, and exemptions from the requirements of holding a nonbinding advisory vote on executive compensation and shareholder approval of any golden parachute payments not previously approved. In addition, even if Reliant Bancorp chooses to comply with the reporting requirements applicable to public companies that are not emerging growth companies, Reliant Bancorp may avail itself of the reduced requirements applicable to emerging growth companies from time to time in the future, so long as Reliant Bancorp is an emerging growth company. Reliant Bancorp will remain an emerging growth company for up to five years, which would end on December 31, 2020, though it may cease to be an emerging growth company earlier under certain circumstances, including if, before the end of such five years, it is deemed to be a large accelerated filer under the rules of the SEC (which depends on, among other things, having a market value of common stock held by non-affiliates in excess of $700 million) or if Reliant Bancorp’s total annual gross revenues equal or exceed $1.07 billion in a fiscal year. Reliant Bancorp cannot predict if investors will find its common stock less attractive because it will rely on these exemptions. If some investors find Reliant Bancorp’s common stock less attractive as a result, there may be a less active trading market for Reliant Bancorp’s common stock and its stock price may be more volatile.
Further, the JOBS Act exempts emerging growth companies from being required to comply with new or revised financial accounting standards until private companies (that is, those that have not had a Securities Act registration statement declared effective or do not have a class of securities registered under the Exchange Act) are required to comply with the new or revised financial accounting standards. The JOBS Act provides that a company can elect to opt out of the extended transition period and comply with the requirements that apply to non-emerging growth companies but any such election to opt out is irrevocable. Reliant Bancorp has elected not to opt out of such an extended transition period, which means that when a standard is issued or revised and it has different application dates for public or private companies, Reliant Bancorp, as an emerging growth company, can adopt the new or revised standard at the time private companies adopt the new or revised standard. This may make Reliant Bancorp’s financial statements not comparable with those of another public company that is neither an emerging growth company nor an emerging growth company which has opted out of using the extended transition period because of the potential differences in accounting standards used.
The amount of interest payable on the subordinated notes will vary beginning on December 15, 2024.
On December 13, 2019, Reliant Bancorp issued and sold $60.0 million in aggregate principal amount of its 5.125% Fixed-to-Floating Rate Subordinated Notes due 2029 (the “Subordinated Notes”). The interest rate on the Subordinated Notes will vary
beginning on December 15, 2024. The Subordinated Notes will bear interest at an initial rate of 5.125%, payable semi-annually until December 15, 2024, at which time the Subordinated Notes will bear interest at a floating rate equal to three-month Secured Overnight Financing Rate (“SOFR”) (provided, that in the event the three-month SOFR is less than zero, the three-month SOFR will be deemed to be zero), plus a spread of 376.5 basis points. If interest rates rise, the cost of the Subordinated Notes may increase, thereby negatively affecting our net income.
The value of our goodwill and other intangible assets may decline in the future.
As of December 31, 2019, we had $50.9 million of goodwill and other intangible assets. A significant decline in our financial condition, a significant adverse change in the business climate, slower growth rates, or a significant and sustained decline in the price of our common stock may necessitate taking charges in the future related to the impairment of our goodwill and other intangible assets. If we were to conclude that a future write-down of goodwill and other intangible assets is necessary, we would record the appropriate charge, which could have a material adverse effect on our financial condition and results of operations. Future acquisitions of other financial institutions could result in additional goodwill.
Risks Related to Reliant Bancorp’s Industry and Regulation
We are subject to extensive government regulation and supervision; compliance with new and existing legislation, regulations, and supervisory requirements and expectations could detrimentally affect our business.
Reliant Bancorp and Reliant Bank are subject to extensive federal and state regulation and supervision, the primary focus of which is to protect customers, depositors, the deposit insurance fund, and the safety and soundness of the banking system as a whole, and not shareholders. The quantity and scope of applicable federal and state regulations may place banks at a competitive disadvantage compared to less regulated competitors such as finance companies, credit unions, and leasing companies. Banking and consumer lending laws and regulations apply to almost every aspect of our business, including lending, capital, investments, deposits, other services, and products, risk management, dividends, and acquisitions.
Legislation and regulation with respect to our industry has increased in recent years, and we expect that federal and state supervision and regulation of our industry will continue to expand in scope and complexity. Congress and federal regulatory agencies continually review banking laws, rules, regulations and policies for possible changes. Changes to statutes, rules, regulations or regulatory policies, including changes in the interpretation or implementation of statutes, rule, regulations or policies, could affect us in substantial and unpredictable ways, and could subject us to additional costs, limits on the services and products we may offer, or limits on the pricing of banking services and products. In addition, establishing systems and processes to achieve compliance with laws, rules and regulations increases our costs and could limit our ability to pursue business opportunities.
If we receive less than satisfactory results on regulatory examinations, we could be subject to damage to our reputation, significant fines and penalties, requirements to increase compliance and risk management activities, and an increase in our deposit insurance assessment rate, in addition to related costs and restrictions on acquisitions, new locations, new lines of business, or continued growth. Future changes in federal and state banking laws and regulations could adversely affect our operating results and ability to continue to compete effectively. For example, the Dodd-Frank Act and related regulations subject us to additional restrictions, oversight and reporting obligations, which have significantly increased costs, although certain provisions of the Regulatory Relief Act may alleviate some of these burdens (however the impact of the Regulatory Relief Act is currently unknown because implementing rules and regulations are required in some instances and many of these implementing rules and regulations have not yet been written or finalized). Also, over the last several years, state and federal regulators have focused on enhanced risk management practices, compliance with the BSA and anti-money laundering laws, including the new beneficial ownership rule, data integrity and security, use of service providers, and fair lending and other consumer protection issues, which has increased our need to build additional processes and infrastructure. Government agencies charged with adopting and interpreting laws, rules and regulations may do so in an unforeseen manner, including in ways that potentially expand the reach of the laws, rules or regulations more than initially contemplated or currently anticipated. We cannot predict the substance or impact of pending or future legislation or regulation. Compliance with such current and potential legislation and regulation and increased regulatory scrutiny could significantly increase our costs, impede the efficiency of our internal business processes, require us to increase our regulatory capital and limit our ability to pursue business opportunities in an efficient manner. Our success depends on our ability to maintain compliance with both existing and new laws, rules and regulations.
Reliant Bank’s FDIC deposit insurance premiums and assessments may increase.
Our deposits are insured up to applicable limits by the DIF of the FDIC and are subject to deposit insurance assessments to maintain deposit insurance. As an FDIC-insured institution, we are required to pay quarterly deposit insurance premium assessments to the FDIC. Although we cannot predict what the insurance assessment rates will be in the future, either deterioration in our risk-based capital ratios or adjustments to the base assessment rates could have a material adverse impact on our business, financial condition, results of operations, and cash flows.
We are subject to increased capital requirements, which may adversely impact return on equity or prevent us from paying dividends or repurchasing shares.
The Dodd-Frank Act requires the federal banking agencies to establish stricter risk-based and leverage capital requirements to apply to banks and bank and savings and loan holding companies. In general,2013, the Federal Reserve’s policies provide that dividends should be paid only out of current earningsfederal banking agencies adopted revised risk-based and only if the prospective rate of earnings retention by theleverage capital requirements as well as a revised method for calculating risk-weighted assets. The capital rules apply to all bank holding company appears consistentcompanies with $1 billion or more in consolidated assets and all banks regardless of size.
The revised capital rules subjected us to higher required capital levels on January 1, 2015, with a phase-in period for certain provisions over four years that began in 2016. As of January 1, 2019, the
organization’s capital requirements
asset qualitywere fully phased in. The application of more stringent capital requirements on us could, among other things, result in lower returns on equity, require the raising of additional capital, and
overall financial condition. The Federal Reserve’s policies also require that a bank holding company serveresult in regulatory actions such as
a source of financial strength to its subsidiary banks by standing ready to use available resources to provide adequate capital funds to those banks during periods of financial stress or adversity and by maintaining the
financial flexibility and capital raising capacity to obtain additional resources for assisting its subsidiary banks where necessary. In addition, under the prompt corrective action regulations, the ability of a bank holding company to pay dividends may be restricted if a subsidiary bank becomes undercapitalized. These regulatory policies could affect Commerce Union’s abilityinability to pay dividends or
otherwise engage in capital distributions.Commerce Union’s abilityrepurchase shares if we were to pay cash dividends may be limited by regulatory restrictions, by Reliant Bank’s abilityunable to pay cash dividends to Commerce Union and by Commerce Union’s need to maintain sufficient capital to support Commerce Union’s operations. A Tennessee chartered bank may,comply with the approval of the TDFI, transfer funds from its surplus accountsuch requirements.
On October 29, 2019, pursuant to the undivided profits (retained earnings) account or any part of itspaid-in-capital account. The payment of dividends by any bank is dependent upon its earningsRegulatory Relief Act, the federal banking agencies adopted a final rule to simplify the regulatory capital requirements for eligible community banks and financial condition and, in additionholding companies that opt-in to the limitations referredCBLR framework. Under the final rule, which became effective as of January 1, 2020, community banks and holding companies (which would include Reliant Bancorp and Reliant Bank) that satisfy certain qualifying criteria, including having less than $10 billion in average total consolidated assets and a leverage ratio of greater than 9%, would be eligible to above, isopt-in to the CBLR framework. Presently, Reliant Bancorp and Reliant Bank do not intend to make this election.
The application of more stringent capital requirements for Reliant Bancorp or Reliant Bank could, among other things, result in lower returns on invested capital, require the issuance of additional capital, and result in regulatory actions if Reliant Bancorp or Reliant Bank were to be unable to comply with such requirements.
Laws and regulations relating to privacy, information security and data protection could increase our costs, affect or limit how we collect and use personal information and adversely affect our business opportunities.
We are subject to various privacy, information security and data protection laws, including requirements relating to security breach notification, and we could be negatively impacted by them. For example, we are subject to the statutory powerGLBA and related implementing regulations and guidance. Among other things, GLBA: (i) imposes certain limitations on the ability of financial institutions to share consumers’ nonpublic personal information with nonaffiliated third parties, (ii) requires that financial institutions provide certain federaldisclosures to consumers about their information collection, sharing and state regulatory agenciessecurity practices and affords consumers the right to act“opt out” of the institution’s disclosure of their personal financial information to prevent what they deem unsafe or unsound banking practices. The payment of dividends could, depending uponnonaffiliated third parties (with certain exceptions) and (iii) requires financial institutions to develop, implement and maintain a written comprehensive information security program containing safeguards that are appropriate to the financial condition of Reliant Bank, be deemed to constitute such an unsafe or unsound practice. Without regulatory approval, a dividend only can be paid toinstitution’s size and complexity, the extentnature and scope of the netfinancial institution’s activities, and the sensitivity of customer information processed by the financial institution as well as plans for responding to data security breaches.
Moreover, various United States federal agencies, states and foreign jurisdictions have enacted data security breach notification requirements with varying levels of required individual, consumer, regulatory and/or law enforcement notification in certain circumstances in the event of a security breach. Many of these requirements not only apply to us but also apply broadly to our partners that accept payments from our customers. In many countries that have yet to impose data security breach notification requirements, regulators have increasingly used the threat of significant sanctions and penalties by data protection authorities to encourage voluntary notification and discourage data security breaches.
Furthermore, legislators and/or regulators in the United States are increasingly adopting or revising privacy, information security and data protection laws that potentially could have a significant impact on our current and planned privacy, data protection and information security-related practices, our collection, use, sharing, retention and safeguarding of consumer and/or employee information, and some of our current or planned business activities. This could also increase our costs of compliance and business operations and could reduce income from certain business initiatives. This includes increased privacy-related enforcement activity at the federal level, by the Federal Trade Commission, as well as at the state level, such as with regard to mobile applications.
Compliance with current or future privacy, data protection and information security laws (including those regarding security breach notification) affecting customer and/or employee data to which we are subject could result in higher compliance and technology costs and could restrict our ability to provide certain products and services, which could materially and adversely affect our profitability. Our failure to comply with privacy, data protection and information security laws could result in potentially significant regulatory and/or governmental investigations and/or actions, litigation, fines, sanctions and damage to our reputation and our brand.
Anti-money laundering and anti-terrorism financing laws could have significant adverse consequences for us.
We maintain an enterprise-wide program designed to enable us to comply with applicable anti-money laundering and anti-terrorism financing laws and regulations, including the BSA and the USA PATRIOT Act. This program includes policies, procedures, processes and other internal controls designed to identify, monitor, manage and mitigate the risk of
the bank for that year plus the net income of the prior two years. The FDIA prohibits a state bank, the depositsmoney laundering or terrorist financing posed by our products, services, customers and geographic locale. These controls include procedures and processes to detect and report suspicious transactions, perform customer due diligence, respond to requests from law enforcement, and meet all recordkeeping and reporting requirements related to particular transactions involving currency or monetary instruments. We cannot be sure our policies, procedures, processes and controls will be effective to ensure our compliance with all applicable anti-money laundering and anti-terrorism financing laws and regulations, and our failure to comply could subject us to significant sanctions, fines, penalties and reputational harm, all of which
are insured by the FDIC, from paying dividends if it is in default in the paymentcould have a material adverse effect on our business, results of
any assessments due the FDIC.If operations and financial condition.
Risks Related to Our Common Stock
Reliant
Bank is not permitted to pay cash dividends to Commerce Union, it is unlikely that Commerce Union would be able to pay cash dividends on Commerce Union’s common stock. Moreover, holders of Commerce Union’s common stock are entitled to receive dividends only when and if declared by Commerce Union’s board of directors. Although Commerce Union has paid cash dividends on its common stock in recent years, Commerce Union is not required to do so, and Commerce Union’s board of directors could reduce or eliminate Commerce Union’s common stock dividend in the future.Commerce Union’sBancorp’s stock price may fluctuate, which could result in losses to its investors and litigation against Commerce Union.
Commerce Union’sReliant Bancorp.
Reliant Bancorp’s common stock
was approved to beis listed on
The Nasdaq Stock Market, LLC, effective July 7, 2015. We cannot assure you that this listing will result in significant trading in Commerce Union’s common stock. Further, we cannot assure that an active market for Commerce Union common stock will benefit the stock price. The stock will be subject to greater fluctuations and more easily impacted by general market factors.Nasdaq. A number of factors could cause
Commerce Union’sReliant Bancorp’s stock price to fluctuate substantially in the future. These factors include but are not limited to: actual or anticipated variations in earnings, changes in analysts’ recommendations or projections,
Commerce Union’sReliant Bancorp’s announcement of developments related to its businesses, operations and stock performance of other companies deemed to be peers, new technology used or services offered by traditional and
non-traditional competitors, news reports of trends, irrational exuberance on the part of investors, new federal banking
laws, rules or regulations, and other
issuesmatters related to the financial services industry.
Commerce Union’sReliant Bancorp’s stock price may fluctuate significantly in the future, and these fluctuations may be unrelated to its performance. General market declines or market volatility in the future, especially in the financial institutions sector,
as well as natural disasters or public health issues, could adversely affect the price of
Commerce Union’sReliant Bancorp’s common stock, and the current market price may not be indicative of future market prices. Stock price volatility may make it more difficult for
Commerce Union’sReliant Bancorp’s shareholders to resell their common stock when desired and at prices they find attractive. Moreover, in the past, securities class action lawsuits have been instituted against some companies following periods of volatility in the market price of
itstheir securities.
Commerce UnionReliant Bancorp could in the future be the target of similar litigation. Securities litigation could result in substantial costs and divert management’s attention and resources from
Commerce Union’sReliant Bancorp’s normal business.
Economic and other circumstances may require Commerce Union to raise capital at times or in amounts that are unfavorable to it. If Commerce Union has to issue shares of
Even though our common stock the issuance will dilute the percentage ownership interest of existing shareholders and may dilute the book value per share of Commerce Union’sis currently traded on Nasdaq, it has less liquidity than many other stocks quoted on a national securities exchange.
The trading volume in our common stock
and adversely affecton Nasdaq has been relatively low when compared with larger companies listed on Nasdaq or other stock exchanges. Because of this, it may be more difficult for shareholders to sell a substantial number of shares for the
terms onsame price at which
Commerce Union may obtain additional capital.Commerce Union may need to incur additional debt or equity financingshareholders could sell a smaller number of shares.
We cannot predict the effect, if any, that future sales of our common stock in the
future to make strategic acquisitionsmarket, or
investments or to strengthen its capital position. Commerce Union’s ability to raise additional capital, if needed, will depend on, among other things, conditions in the
capital markets at that time, which are outside of our control, and Commerce Union’s financial performance. Commerce Union cannot provide assurance that such financing will be available to Commerce Union on acceptable terms or at all, or if Commerce Union does raise additional capital that it will not be dilutive to existing shareholders.If Commerce Union determines, for any reason, that it needs to raise capital, Commerce Union’s board of directors generally has the authority, without action by or vote of the shareholders, to issue all or part of any authorized but unissued shares of stock for any corporate purpose, including issuance of equity based incentives under or outside of Commerce Union’s equity compensation plans, subject to certain Nasdaq rules. Additionally, Commerce Union is not restricted from issuing additional common stock or preferred stock, including any securities that are convertible into or exchangeable for, or that represent the right to receive, common stock or preferred stock or any substantially similar securities. The market price of Commerce Union’s common stock could decline as a result of sales by Commerce Union of a large numberavailability of shares of common stock or preferredfor sale in the market, will have on the market price of our common stock. We can give no assurance that sales of substantial amounts of common stock or similar securities in the market, or from the perception that suchpotential for large amounts of sales could occur. If Commerce Union issues preferred stock that has a preference overin the market, would not cause the price of our common stock with respect to decline or impair our future ability to raise capital through sales of our common stock.
The market price of our common stock has fluctuated, and may fluctuate significantly in the future. These fluctuations may be unrelated to our performance. General market or industry price declines or overall market volatility in the future could adversely affect the price of our common stock, and the current market price may not be indicative of future market prices.
Reliant Bancorp’s ability to pay cash dividends is limited, and Reliant Bancorp may be unable to pay future dividends even if it desires to do so.
Even though our board of directors has approved the payment of
cash dividends
or upon liquidation, dissolution orwinding-up, or if Commerce Union issues preferred stock with voting rights that dilute the voting power of theon Reliant Bancorp’s common stock
the rights of holders of the common stock or the market price of Commerce Union’s common stock could be adversely affected. Any issuance of additional shares of stock will dilute the percentage ownership interest of Commerce Union’s shareholders and may dilute the book value per share of its common stock. Shares Commerce Union issues in connection with any such offering will increase the total number of shares and may dilute the economic and voting ownership interest of Commerce Union’s existing shareholders.A failure in or breach of Commerce Union’s operational or security systems or infrastructure, or those of Commerce Union’s third party vendors and other service providers or other third parties, including as a result of cyberattacks, could disrupt Commerce Union’s businesses, result in the disclosure or misuse of confidential or proprietary information, damage its reputation, increase its costs, and cause losses.
Commerce Union relies heavily on communications and information systems to conduct its business. Information security risks for financial institutions such as Commerce Union have generally increased in recent years, in part because of the proliferation of new technologies, the use of the internet and telecommunications technologies to conduct financial transactions, and the increased sophistication and activities of organized crime (both domestic and international), hackers, terrorists, activists, and other external parties. As customer, public, and regulatory expectations regarding operational and information security have increased, Commerce Union’s operating systems and infrastructure must continue to be safeguarded and monitored for potential failures, disruptions, and breakdowns. Commerce Union’s business, financial, accounting, and data processing systems, or other operating systems and facilities, may stop operating properly or become disabled or damaged as a result of a number of factors, including events that are wholly or partially beyond Commerce Union’s control. For example, there could be electrical or telecommunication outages; natural disasters such as earthquakes, tornadoes, and floods; disease pandemics; events arising from local or larger scale political or social matters, including terrorist acts; and as described below, cyberattacks.
As noted above, Commerce Union’s business relies on its digital technologies, computer ande-mail systems, software and networks to conduct its operations. Although Commerce Union has information security procedures and controls in place, Commerce Union’s technologies, systems and networks and its customers’ devices may become the target of cyberattacks or information security breaches that could result in the unauthorized release, gathering, monitoring, misuse, loss, or destruction of Commerce Union’s or its customers’ or other third parties’ confidential information. Third parties with whom Commerce Union does business or that facilitate Commerce Union’s business activities, including financial intermediaries, or vendors that provide service or security solutions for Commerce Union’s operations, and other unaffiliated third parties, could also be sources of operational and information security risk to Commerce Union, including from breakdowns or failures of their own systems or capacity constraints.
While Commerce Union has business continuity and other policies and procedures designed to prevent or limit the effect of the failure, interruption or security breach of its information systems, there can be no assurance thatas to whether or when we may pay dividends on our common stock in the future. Future dividends, if any, such failures, interruptions or security breaches will not occur or, if they do occur, that they will be adequately addressed. Commerce Union’s riskdeclared and exposurepaid at the discretion of Reliant Bancorp’s board of directors and will depend on a number of factors. Reliant Bancorp’s principal source of funds used to pay cash dividends on its common stock will be dividends that Reliant Bancorp receives from Reliant Bank. Although Reliant Bank’s asset quality, earnings performance, liquidity, and capital requirements will be taken into account before Reliant Bancorp declares or pays any future dividends on its common stock, our board of directors will also consider our liquidity and capital requirements, and our board of directors could determine to declare and pay dividends without relying on dividend payments from Reliant Bank.
Federal and state banking laws and regulations and state corporate laws restrict the amount of dividends we may declare and pay and that Reliant Bank may declare and pay to Reliant Bancorp. For example, Federal Reserve regulations implementing the capital rules required under Basel III do not permit dividends unless capital levels exceed certain higher levels applying capital conservation buffers that became fully phased in beginning January 1, 2019.
In addition, Reliant Bancorp must make payments on the subordinated debentures (and the related trust preferred securities) and the Subordinated Notes before any dividends can be paid on its common stock. Reliant Bancorp may also from time to time enter into other contractual arrangements, including borrowing relationships with other financial institutions, that could limit the ability of Reliant Bancorp to pay dividends on its common stock in the future.
We may issue additional common stock or other equity securities in the future which could dilute the ownership interest of existing shareholders.
In order to maintain our or Reliant Bank’s capital at desired or regulatory-required levels, we may issue additional shares of common stock, or securities convertible into, exchangeable for or representing rights to acquire shares of common stock. We may sell these matters remain heightened becauseshares at prices below the current market price for shares of Reliant Bancorp common stock, and the sale of these shares may significantly dilute existing shareholder ownership. We could also issue additional shares in connection with acquisitions of other financial institutions (as we did in connection with our acquisition of Community First and TCB Holdings and as contemplated in our pending acquisition of FABK), which could also dilute existing shareholder ownership.
Holders of our debt obligations have rights that are senior to those ofourshareholders.
In connection with the Community First acquisition, Reliant Bancorp assumed trust preferred securities and accompanying junior subordinated debentures totaling $23.0 million, of which $10.0 million was owned by Community First prior to the acquisition and assumed by Reliant Bancorp. On December 13, 2019, Reliant Bancorp issued and sold the Subordinated Notes. Payments of the evolving natureprincipal and interest on the trust preferred securities are conditionally guaranteed by Reliant Bancorp, and the accompanying subordinated debentures and the Subordinated Notes are senior to shares of these threats.Reliant Bancorp’s common stock. As a result, cyber securityReliant Bancorp must make payments on the subordinated debentures (and the related trust preferred securities) and the continued developmentSubordinated Notes before any dividends can be paid on its common stock and, enhancement of Commerce Union’s controls, processes, and practices designed to protect its systems, computers, software, data, and networks from attack, damage or unauthorized access remain a focus for Commerce Union. As threats continue to evolve, Commerce Union may be required to expend additional resources to continue to modify or enhance its protective measures or to investigate and remediate information security vulnerabilities. Disruptions or failures in the physical infrastructureevent of Reliant Bancorp’s bankruptcy, dissolution or operating systems that support Commerce Union’s businesses and clients, or cyberattacks or security breachesliquidation, the holders of the networks, systems or devicessubordinated debentures and the Subordinated Notes must be satisfied before any distributions can be made on Reliant Bancorp’s common stock.
Reliant Bancorp may from time to time issue additional subordinated indebtedness that
Commerce Union’s clients usewould have to
access Commerce Union’s products and services could result in client attrition, regulatory fines, penalties or intervention, reputation damage, reimbursement or other compensation costs, and/or additional compliance costs,be repaid before Reliant Bancorp’s shareholders would be entitled to receive any of
which could have a material effect on Commerce Union’s resultsthe assets of
operationsReliant Bancorp or
financial condition.Negative public opinion surrounding Commerce Union and the financial institutions industry generally could damage Commerce Union’s reputation and adversely impact its earnings.
Reputation risk, or the risk to Commerce Union’s business, earnings and capital from negative public opinion surrounding Commerce Union and the financial institutions industry generally, is inherent in Commerce Union’s business. Negative public opinion can result from Commerce Union’s actual or alleged conduct in any number of activities, including lending practices, corporate governance and acquisitions, and from actions taken by government regulators and community organizations in response to those activities. Negative public opinion can adversely affect Commerce Union’s ability to keep and attract clients and employees and can expose it to litigation and regulatory action. Although Commerce Union takes steps to minimize reputation risk in dealing with its clients and communities, this risk will always be present given the nature of Commerce Union’s business.
Reliant Bank.
If securities or industry analysts do not publish research or publish unfavorable research about our business, our stock price and trading volume could decline.
As a smaller company, it may be difficult for us to attract or retain the interest of equity research analysts. A lack of research coverage may adversely affect the liquidity of and market price of our common stock. We will not have any control over the equity research analysts or the content and opinions included in their reports. The price of our stock could decline if one or more equity research analysts downgrade our stock or issue other unfavorable commentary or research. If one or more equity research analysts
ceases coverage of our company, or fails to publish reports on us regularly, demand for our stock could decrease, which in turn could cause our stock price or trading volume to decline.
Shares of
Commerce UnionReliant Bancorp common stock are not FDIC insured.
Shares of Commerce Union
An investment in our common stock areis not deposits with a bank deposit and, aretherefore, is not insured against loss or guaranteed by the FDIC.FDIC, any other deposit insurance fund or by any other public or private entity. An investment in our common stock is inherently risky for the reason
s described herein. As a result, if you acquire our common stock, you could lose some or all of your investment.
ITEM 1B. | UNRESOLVED STAFF COMMENTS |
ITEM 1B. UNRESOLVED STAFF COMMENTS
ITEM 2. PROPERTIES
As of December 31,
2016,2019, the
mainprincipal executive office of both
Commerce UnionReliant Bancorp and Reliant Bank was located at 1736 Carothers Parkway, Suite 100, Brentwood,
Tennessee. Commerce Union ownsTennessee 37027, and
operates threeReliant Bancorp also has a corporate office located at 6100 Tower Circle, Suite 120, Franklin, Tennessee 37067. In addition, as of December 31, 2019, we operated (i) 16 full-service branch offices
withlocated in the
following addresses: the Gallatin Branch at 1204 Nashville Pike, Gallatin, Tennessee
37066, the East Main Branch at 425 East Main, Gallatin,counties of Davidson, Hickman, Hamilton, Maury, Robertson, Rutherford, Sumner, and Williamson and (ii) mortgage offices in Brentwood, Hendersonville, and Memphis, Tennessee,
37066, and the Springfield Branch at 701 South Main Street, Springfield, TN 37172.Reliant Bank leases its main office, as well as the following: the Murfreesboro Loan Production Office at 745 South Church Street, Suite 401, Murfreesboro, TN 37130; the Franklin Branch at 101 Creekstone Boulevard, Suite 100, Franklin, TN 37064; the Lenox Branch at 6005 Nolensville Pike, Suite 101, Nashville, TN 37211; the Hendersonville, TN Mortgage Location (Loan Production Office) at 711 East Main Street, Suite 105, Hendersonville, TN 37075; the Maryland Farms Branch at 5109 Peter Taylor Drive, Suite 300, Brentwood, TN 37027; the Timonium, Maryland (Loan Production Office) at 15 West Aylesbury Road, Suite 600, Timonium, MD 21093two in Little Rock and the Green Hills Branch which recently opened on February 27, 2017, located at 4108 Hillsboro Pike, Nashville, TN 37215.two in Hot Springs, Arkansas.
All of these properties are leased by Reliant Bank
also leasesexcept for nine branches in Maury, Hickman, Sumner, Robertson, and Williamson counties. Although the
Chattanooga Loan Production Office at 633 Chestnut Street, Suite 630, Chattanooga, TN 37450. Other leases routinely exist onproperties owned are generally considered adequate, we have a
month-to-month basis. continuing program of modernization, expansion and, when necessary, occasional replacement of facilities.
As
ITEM 3. LEGAL PROCEEDINGS
Reliant Bancorp or one or more of
the end of 2016, neither Commerce Union nor Reliant Bank was involved in any litigation that is expectedits subsidiaries are from time to
have a material impact on our financial position or results of operations. The Bank is periodically involved as a plaintiff or defendant in varioustime parties to ordinary routine legal
actionsproceedings in the ordinary course of
its business.
Management believes thatAs with all legal proceedings, no assurance can be provided as to the outcome of these matters. As of the date hereof, there are currently no material pending legal proceedings to which Reliant Bancorp or any
claims pending against Commerce Union orof its subsidiaries
are without meritis a party or
thatof which any of the
ultimate liability, ifproperty of Reliant Bancorp or any
resulting from them will not materially affect Reliant Bank’s financial condition or Commerce Union’s consolidated financial position.of its subsidiaries is the subject. .
ITEM 4. | MINE SAFETY DISCLOSURES |
ITEM 4. MINE SAFETY DISCLOSURES
ITEM 5. | MARKET FOR THE REGISTRANT’S COMMON EQUITY, RELATED STOCKHOLDER MATTERS AND ISSUER PURCHASES OF EQUITY SECURITIES |
Commerce Union’s
ITEM 5. MARKET FOR THE REGISTRANT’S COMMON EQUITY, RELATED STOCKHOLDER MATTERS AND ISSUER PURCHASES OF EQUITY SECURITIES
Reliant Bancorp’s common stock is traded on
theThe Nasdaq Capital Market under the symbol
“CUBN.“RBNC.” As of March
1, 2017,12, 2020, there were
5361,551 holders of record of
Commerce UnionReliant Bancorp common stock. This number does not include shareholders with shares in nominee name held by the Depository Trust Company or its nominee.
Dividends
Commerce Union declared
Reliant Bancorp has paid a
quarterly cash dividend
on its common stock since the second quarter of
$0.22 per share on December 15, 2016, which was payable January 20, 2017.
The following table sets forthWe currently expect that comparable cash dividends
declared and/orwill continue to be paid
to shareholders of Commerce Union duringin the
previous two fiscal years. | | | | | | | | |
Date Paid | | Total Value Issued | | | Per Share Value | |
01/16/2015 | | $ | 613,766.00 | | | $ | 0.20 | |
01/22/2016 | | $ | 1,488,715.60 | | | $ | 0.20 | |
01/20/2017 | | $ | 1,711,227.98 | | | $ | 0.22 | |
Payment of dividends by Commerce Union and Reliant Bank are subject to certain regulations that may limit or prevent the payment of dividends, and is further subject to the discretion of the board of directors of Commerce Union and Reliant Bank.
Commerce Union and Reliant Bank anticipates that earnings, if any, may be held for purposes of enhancing capital. Nofuture. However, no assurances can be given that any dividends on Commerce Union’s common stock will be declared or paid on Reliant Bancorp’s common stock in the future, or, if declared whatand paid, the amount or frequency of such dividends will be or whether such dividends will continue for future periods.
Market Price for Commerce Union’s Stock
Prior to the merger, the sharesthose dividends. The ability of Reliant Bancorp and Reliant Bank were not publicly traded. The following table showsto pay dividends is restricted by certain laws and regulations, and the payment of dividends by Reliant Bancorp and Reliant Bank is within the discretion of their respective boards of directors.
Securities Authorized for Issuance Under Equity Compensation Plans
See Part III, Item 12, “Security Ownership of Certain Beneficial Owners and Management and Related Stockholder Matters” for the
indicated periodsinformation required by Item 201(d) of Regulation S-K. Item 5 of the
high and low sales prices for Commerce Union’s common stock. Prior to July 7, 2015, the common stock was traded on the OTCQB market place. Effective as10-K includes Item 201 of
July 7, 2015, Commerce Union’s common stock has been traded on the Nasdaq Capital Market under the symbol “CUBN.” These prices may include retail markups, markdowns, or commissions. | | | | | | | | |
CUBN (1) | | High | | | Low | |
2016 | | | | | | | | |
First Quarter | | $ | 16.74 | | | $ | 13.50 | |
Second Quarter | | | 16.50 | | | | 14.93 | |
Third Quarter | | | 22.99 | | | | 15.20 | |
Fourth Quarter | | | 21.51 | | | | 19.00 | |
2015 | | | | | | | | |
First Quarter | | $ | 15.50 | | | $ | 13.00 | |
Second Quarter | | | 15.25 | | | | 14.00 | |
Third Quarter | | | 14.50 | | | | 12.50 | |
Fourth Quarter | | | 14.10 | | | | 13.30 | |
(1) | Companies that have common shares quoted on theover-the-counter market typically do not have an active trading market. Consequently, the prices quoted above falling prior to the Nasdaq listing effective July 7, 2015, may not represent an accurate indication of the value of shares of Commerce Union’s common stock. |
Regulation S-K.
The following chart, which is furnished not filed, compares the
monthlyyearly percentage changes in the cumulative shareholder return on our common stock during the five fiscal years ended December 31,
2016,2019, with (i) the Russell 2000
index,Index and (ii) the SNL Southeast
U.S. Bank Index. This comparison assumes $100 was invested on the
January 1, 2011,last trading day of 2014, in our common stock and the comparison indices, and assumes the reinvestment of all cash dividends prior to any tax effect and retention of all stock dividends. Price information from
JulyDecember 31, 2015 to December 31,
2016,2019, was obtained by using the Nasdaq closing prices as of the last trading day of each
month.year. From August 29, 2012 to July 7, 2015, our stock was traded on the
over-the-counter market, and closing prices for
the months of 2012, 2013, and 2014 have been obtained by using the closing prices reported on the last trading day
ofthrough the
month through theover-the-counter system.
Prior to August of 2012, our stock was traded exclusively in private transactions and the prices reported for 2011 reflect the last trade made in each month of 2011 that is known to us. Note that all stock prices below are representative of Commerce Union common stock, both before and after the Merger.
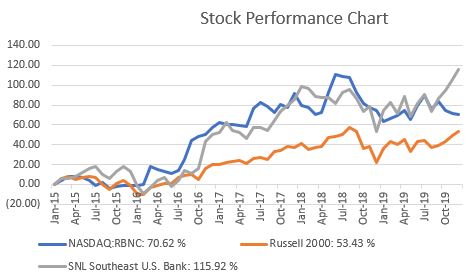
Recent Sales of Unregistered Securities
There were no sales of unregistered securities for the period ended December 31,
2016.2019.
Issuer Purchases of Securities
There were no repurchases of the Company’s common stock for the
periodquarter ended December 31,
2016.2019.
RELIANT BANCORP, INC.
SELECTED FINANCIAL DATA
December 31, 2019, 2018, 2017, 2016 and 2015
(Dollar amounts in thousands except per share amounts)
ITEM 6. | SELECTED FINANCIAL DATA |
ITEM 6. SELECTED FINANCIAL DATA
The following selected historical consolidated financial data, as of and for the twelve monthsyears ended December 31, 2019, 2018, 2017, 2016, 2015 and 2014,2015 is derived from the audited consolidated financial statements of Commerce Union Bancshares, Inc. TheReliant Bancorp.
|
| | | | | | | | | | | | | | | | | | | | |
| | | 2019 | | 2018 | | 2017 | | 2016 | | 2015 |
| SUMMARY OF OPERATIONS: | | | | | | | | | | |
| Total interest income | | $ | 79,185 |
| | $ | 69,225 |
| | $ | 40,158 |
| | $ | 36,015 |
| | $ | 29,888 |
|
| Total interest expense | | 23,380 |
| | 15,396 |
| | 5,671 |
| | 3,363 |
| | 2,718 |
|
| Net interest income | | 55,805 |
| | 53,829 |
| | 34,487 |
| | 32,652 |
| | 27,170 |
|
| Provision for loan losses | | 1,211 |
| | 1,035 |
| | 1,316 |
| | 968 |
| | (270 | ) |
| Net interest income after | | | | | | | | | | |
| provision for loan losses | | 54,594 |
| | 52,794 |
| | 33,171 |
| | 31,684 |
| | 27,440 |
|
| Noninterest income | | 11,964 |
| | 9,646 |
| | 6,010 |
| | 8,800 |
| | 12,382 |
|
| Noninterest expense | | 53,892 |
| | 50,561 |
| | 31,076 |
| | 30,374 |
| | 31,569 |
|
| Income before income taxes | | 12,666 |
| | 11,879 |
| | 8,105 |
| | 10,110 |
| | 8,253 |
|
| Income tax expense | | 2,129 |
| | 1,372 |
| | 1,942 |
| | 2,213 |
| | 2,271 |
|
| Consolidated net income | | 10,537 |
| | 10,507 |
| | 6,163 |
| | 7,897 |
| | 5,982 |
|
| Noncontrolling interest in net (income) loss of subsidiary | | 5,659 |
| | 3,578 |
| | 1,083 |
| | 1,039 |
| | (407 | ) |
| Net income attributable to common shareholders | | 16,196 |
| | 14,085 |
| | 7,246 |
| | 8,936 |
| | 5,575 |
|
| | | | | | | | | | | |
| | | | | | | | | | | |
| PER COMMON SHARE DATA: | | | | | | | | | | |
| Net income attributable to common | | | | | | | | | | |
| shareholders, per share | | | | | | | | | | |
| Basic | | $ | 1.44 |
| | $ | 1.24 |
| | $ | 0.89 |
| | $ | 1.18 |
| | $ | 0.88 |
|
| Diluted | | 1.44 |
| | 1.23 |
| | 0.88 |
| | 1.16 |
| | 0.86 |
|
| Book value per common share | | 19.97 |
| | 18.07 |
| | 15.51 |
| | 13.75 |
| | 13.29 |
|
| Tangible book value per common share | | 15.42 |
| | 13.58 |
| | 14.11 |
| | 12.08 |
| | 11.46 |
|
| Dividends per common share | | 0.27 |
| | 0.33 |
| | 0.24 |
| | 0.22 |
| | 0.20 |
|
| Preferred shares outstanding | | — |
| | — |
| | — |
| | — |
| | — |
|
| Basic weighted average common shares | | 11,212,127 | | 11,389,122 | | 8,151,492 |
| | 7,586,993 |
| | 6,329,316 |
|
| Diluted weighted average common shares | | 11,281,262 | | 11,468,789 | | 8,239,301 |
| | 7,691,493 |
| | 6,478,952 |
|
| Common shares outstanding at period end | | 11,206,254 | | 11,530,810 | | 9,034,439 |
| | 7,778,309 |
| | 7,279,620 |
|
| | | | | | | | | | | |
| BALANCE SHEET DATA: | | | | | | | | | | |
| Total assets | | $ | 1,898,467 |
| | $ | 1,724,338 |
| | $ | 1,125,034 |
| | $ | 911,984 |
| | $ | 876,404 |
|
| Mortgage loans held for sale, net | | 37,476 |
| | 15,823 |
| | 45,322 |
| | 11,831 |
| | 55,093 |
|
| Loans held for investment | | 1,397,374 |
| | 1,220,184 |
| | 762,488 |
| | 657,701 |
| | 608,747 |
|
| Allowance for loan losses | | 12,578 |
| | 10,892 |
| | 9,731 |
| | 9,082 |
| | 7,823 |
|
| Total securities | | 260,293 |
| | 296,323 |
| | 220,201 |
| | 146,813 |
| | 133,825 |
|
| Other real estate, net | | 750 |
| | 1,000 |
| | — |
| | — |
| | 1,149 |
|
| Goodwill and core deposit intangible | | 50,912 |
| | 51,861 |
| | 12,684 |
| | 12,986 |
| | 13,342 |
|
| Total deposits | | 1,583,789 |
| | 1,437,903 |
| | 883,519 |
| | 763,834 |
| | 640,008 |
|
| Federal Home Loan Bank advances | | 10,737 |
| | 57,498 |
| | 96,747 |
| | 32,287 |
| | 135,759 |
|
RELIANT BANCORP, INC.
SELECTED FINANCIAL DATA
December 31, 2019, 2018, 2017, 2016 and 2015
(Dollar amounts in thousands except per share amounts)
|
| | | | | | | | | | | | | | | | | | | | |
| Dividends payable | | 76 |
| | 1,036 | | 542 | | 1,711 | | 1,489 |
|
| Stockholders' equity | | 223,753 |
| | 208,414 | | 140,137 | | 106,919 | | 96,751 |
| Average total assets | | 1,799,002 |
| | 1,644,360 | | 995,436 | | 885,074 | | 733,651 |
| Average gross loans, excluding loans held for sale | | 1,298,922 |
| | 1,138,946 | | 714,982 | | 640,592 | | 517,148 |
| Average interest earning assets | | 1,660,049 |
| | 1,505,748 | | 939,947 | | 835,337 | | 694,135 |
| Average deposits | | 1,541,087 |
| | 1,337,860 | | 823,088 | | 664,844 | | 543,341 |
| Average interest bearing deposits | | 1,309,859 |
| | 1,118,993 | | 688,680 | | 537,225 | | 459,610 |
| Average interest bearing liabilities | | 1,349,197 |
| | 1,216,265 | | 739,410 | | 648,515 | | 565,234 |
| Average total shareholders' equity | | 214,987 |
| | 203,317 | | 117,780 | | 104,216 | | 80,122 |
| | | | | | | | | | | |
| | | | | | | | | | | |
| SELECTED FINANCIAL RATIOS: | | | | | | | | | | |
| Return on average assets | | 0.90 | % | | 0.86 | % | | 0.73 | % | | 1.01 | % | | 0.76 | % |
| Return on average equity | | 7.53 | % | | 6.93 | % | | 6.15 | % | | 8.57 | % | | 6.96 | % |
| Average equity to average total assets | | 11.95 | % | | 12.36 | % | | 11.83 | % | | 11.77 | % | | 10.92 | % |
| Dividend payouts | | 18.75 | % | | 26.61 | % | | 26.97 | % | | 18.64 | % | | 22.73 | % |
| Net interest margin(1) | | 3.54 | % | | 3.78 | % | | 3.97 | % | | 4.15 | % | | 4.00 | % |
| Net interest spread(2) | | 3.22 | % | | 3.53 | % | | 3.81 | % | | 4.04 | % | | 3.91 | % |
| | | | | | | | | | | |
| CAPITAL RATIOS(4) | | | | | | | | | | |
| Tier 1 leverage | | 9.74 | % | | 10.38 | % | | 11.89 | % | | 10.86 | % | | 9.92 | % |
| Common equity tier 1 | | 10.55 | % | | 11.59 | % | | 13.90 | % | | 13.00 | % | | 12.02 | % |
| Tier 1 risk-based capital | | 11.30 | % | | 12.44 | % | | 13.90 | % | | 13.00 | % | | 12.02 | % |
| Total risk-based capital | | 15.97 | % | | 13.28 | % | | 14.97 | % | | 14.22 | % | | 13.13 | % |
| | | | | | | | | | | |
| ASSET QUALITY RATIOS: | | | | | | | | | | |
| Net charge-offs (recoveries) to average loans | | (0.04 | )% | | (0.01 | )% | | 0.09 | % | | (0.05 | )% | | (0.14 | )% |
| Allowance to period end loans(3) | | 0.89 | % | | 0.88 | % | | 1.26 | % | | 1.36 | % | | 1.27 | % |
| Allowance for loan losses to non-performing loans | | 211.96 | % | | 259.33 | % | | 132.74 | % | | 105.76 | % | | 116.59 | % |
| Non-performing assets to total assets | | 0.35 | % | | 0.44 | % | | 0.65 | % | | 0.94 | % | | 0.90 | % |
| | | | | | | | | | | |
| OTHER DATA: | | | | | | | | | | |
| Banking locations | | 17 |
| | 17 |
| | 8 |
| | 7 |
| | 9 |
|
| Loan production offices | | 5 |
| | 2 |
| | 2 |
| | 3 |
| | 8 |
|
| Full-time equivalent employees | | 301 |
| | 263 |
| | 167 |
| | 143 |
| | 226 |
|
(1) Net interest margin is net interest income divided by total average earning assets.
(2) Net interest spread is the difference between the average yield on interest earning assets and the average yield on interest bearing liabilities.
(3) Period end loans excludedeferred fees and costs.
(4) Capital ratios calculated on consolidated financial data presentedstatements for the Company.
ITEM7.MANAGEMENT’S DISCUSSION AND ANALYSIS OF FINANCIAL CONDITION AND RESULTS OF OPERATIONS
Executive Summary
The following is a summary of financial highlights and significant events from the year ended December 31, 2019:
Net income available to common shareholders totaled $16.2 million or $1.44 per diluted common share, compared to $14.1 million, or $1.23 per diluted common share for 2018.
Return on average assets was 0.90%, compared to 0.86% for the same period in 2018.
Net year-over-year loan growth was $177.2 million.
Core Deposits grew $72.5 million or 8.2% from December 31, 2019.
On December 13, 2019 the Company issued and sold $60.0 million in aggregate principal amount of Subordinated Notes due on December 15, 2029 at a fixed annual rate of 5.125%, payable semi-annually for the initial five years. Beginning January 2024, the interest rate resets quarterly to the then-current three-month Secured Overnight Financing Rate plus 376.5 basis points, payable quarterly.
The Company repurchased 365,931 shares for $8.3 million during the year ended December 31, 2019 as part of a Board-authorized share repurchase program.
Asset quality remains strong with nonperforming assets to total assets of just 0.35%.
Announced two definitive merger agreements in 2019, both are scheduled to close in 2020.
Definitive Agreement to acquire the parent company of First Advantage Bank
On October 22, 2019, Reliant Bancorp, entered into a definitive agreement to acquire First Advantage Bancorp (“FABK”), the parent company for FAB, located in Clarksville, Tennessee. The agreement provides for a cash and stock transaction valued at approximately $123.4 million, or $30.67 per share of FABK common stock, based on the closing price for Reliant Bancorp common stock of $23.65 per share on October 22, 2019. The acquisition is anticipated to become effective on April 1, 2020. For more information on this acquisition, see Part I, Item 1.
Definitive Agreement to acquire the parent company of Community Bank and Trust
On January 1, 2020, the Company completed the acquisition of TCB Holdings, located in Ashland City, Tennessee. Pursuant to the Agreement and Plan of Merger, dated September 16, 2019; the Company issued 811,210 shares of Company common stock valued at $18,041 and paid approximately $18,505 in cash, which included $430 paid to holders of unexercised options at merger date. All shares of Company’s common stock outstanding prior to the
Merger is derived frommerger were unaffected by the
historical financial statements of Reliant Bank. | | | | | | | | | | | | |
| | | 2016 | | | 2015 | | | 2014 | |
SUMMARY OF OPERATIONS: | | | | | | | | | | | | |
Total interest income | | $ | 36,015 | | | $ | 29,888 | | | $ | 17,215 | |
Total interest expense | | | 3,363 | | | | 2,718 | | | | 1,629 | |
Net interest income | | | 32,652 | | | | 27,170 | | | | 15,586 | |
Provision for loan losses | | | 968 | | | | (270 | ) | | | (1,500 | ) |
Net interest income after provision for loan losses | | | 31,684 | | | | 27,440 | | | | 17,086 | |
Noninterest income | | | 8,800 | | | | 12,382 | | | | 4,608 | |
Noninterest expense | | | 30,374 | | | | 31,569 | | | | 17,166 | |
Income before income taxes | | | 10,110 | | | | 8,253 | | | | 4,528 | |
Income tax expense | | | 2,213 | | | | 2,271 | | | | 1,816 | |
Consolidated net income | | | 7,897 | | | | 5,982 | | | | 2,712 | |
Noncontrolling interest in net (income) loss of subsidiary | | | 1,039 | | | | (407 | ) | | | 1,184 | |
Net income attributable to common shareholders | | | 8,936 | | | | 5,575 | | | | 3,896 | |
| | | |
PER COMMON SHARE DATA: | | | | | | | | | | | | |
Net income attributable to common shareholders, per share | | | | | | | | | | | | |
Basic | | $ | 1.18 | | | $ | 0.88 | | | $ | 0.98 | |
Diluted | | $ | 1.16 | | | $ | 0.86 | | | $ | 0.96 | |
Book value per common share | | $ | 13.75 | | | $ | 13.29 | | | $ | 11.13 | |
Tangible book value per common share | | $ | 12.08 | | | $ | 11.46 | | | $ | 10.84 | |
Dividends per common share | | $ | 0.22 | | | $ | 0.20 | | | $ | 0.20 | |
Preferred shares outstanding | | | — | | | | — | | | | — | |
Basic weighted average common shares | | | 7,586,993 | | | | 6,329,316 | | | | 3,993,206 | |
Diluted weighted average common shares | | | 7,691,493 | | | | 6,478,952 | | | | 4,053,804 | |
Common shares outstanding at period end | | | 7,778,309 | | | | 7,279,620 | | | | 3,910,191 | |
| | | |
BALANCE SHEET DATA: | | | | | | | | | | | | |
Total assets | | $ | 911,984 | | | $ | 876,404 | | | $ | 449,731 | |
Mortgage loans held for sale, net | | | 11,831 | | | | 55,093 | | | | 26,640 | |
Total loans, net | | | 657,701 | | | | 608,747 | | | | 309,497 | |
Allowance for loan losses | | | 9,082 | | | | 7,823 | | | | 7,353 | |
Total securities | | | 146,813 | | | | 133,825 | | | | 77,245 | |
Other real estate, net | | | — | | | | 1,149 | | | | 1,204 | |
Goodwill and core deposit intagible | | | 12,986 | | | | 13,342 | | | | 1,110 | |
Total deposits | | | 763,834 | | | | 640,008 | | | | 334,365 | |
Federal Home Loan Bank advances | | | 32,287 | | | | 135,759 | | | | 63,500 | |
Dividends payable | | | 1,711 | | | | 1,489 | | | | — | |
Stockholders’ equity | | | 106,919 | | | | 96,751 | | | | 43,516 | |
Average total assets | | | 885,074 | | | | 733,651 | | | | 417,050 | |
Average gross loans, excluding loans held for sale | | | 640,592 | | | | 517,148 | | | | 293,195 | |
Average interest earning assets | | | 835,337 | | | | 694,135 | | | | 401,487 | |
Average deposits | | | 664,844 | | | | 543,341 | | | | 323,466 | |
Average interest bearing deposits | | | 537,225 | | | | 459,610 | | | | 278,363 | |
Average interest bearing liabilities | | | 648,515 | | | | 565,234 | | | | 329,565 | |
Average total shareholders’ equity | | | 104,216 | | | | 80,122 | | | | 41,525 | |
| | | | | | | | | | | | |
| | | 2016 | | | 2015 | | | 2014 | |
SELECTED FINANCIAL RATIOS: | | | | | | | | | | | | |
Return on average assets | | | 1.01 | % | | | 0.76 | % | | | 0.93 | % |
Return on average equity | | | 8.57 | % | | | 6.96 | % | | | 9.38 | % |
Average equity to average total assets | | | 11.77 | % | | | 10.92 | % | | | 9.96 | % |
Dividend payouts | | | 18.64 | % | | | 22.73 | % | | | 20.41 | % |
Efficiency ratio(1) | | | 73.28 | % | | | 79.82 | % | | | 85.01 | % |
Net interest margin(2) | | | 4.15 | % | | | 4.00 | % | | | 3.96 | % |
Net interest spread(3) | | | 4.04 | % | | | 3.91 | % | | | 3.88 | % |
| | | |
Capital Ratios(5) | | | | | | | | | | | | |
Tier 1 leverage | | | 10.86 | % | | | 9.92 | % | | | 9.71 | % |
Common equity tier 1 | | | 13.00 | % | | | 12.02 | % | | | 12.19 | % |
Tier 1 risk-based capital | | | 13.00 | % | | | 12.02 | % | | | 12.19 | % |
Total risk-based capital | | | 14.22 | % | | | 13.13 | % | | | 13.45 | % |
| | | |
ASSET QUALITY RATIOS: | | | | | | | | | | | | |
Net charge-offs to average loans | | | -0.05 | % | | | -0.14 | % | | | -0.11 | % |
Allowance to period end loans(4) | | | 1.36 | % | | | 1.27 | % | | | 2.32 | % |
Allowance for loan losses tonon-performing loans | | | 105.76 | % | | | 116.59 | % | | | 83.40 | % |
Non-performing assets to total assets | | | 0.94 | % | | | 0.90 | % | | | 2.23 | % |
| | | |
OTHER DATA: | | | | | | | | | | | | |
Banking locations | | | 7 | | | | 9 | | | | 4 | |
Loan production offices | | | 3 | | | | 8 | | | | 7 | |
Full-time equivalent employees | | | 143 | | | | 226 | | | | 138 | |
(1) | Efficiency ratio isnon-interest expense divided by the sum of net interest income before the provision for loan losses plusnon-interest income. |
(2) | Net interest margin is net interest income divided by total average earning assets. |
(3) | Net interest spread is the difference between the average yield on interest earning assets and the average yield on interest bearing liabilities. |
(4) | Period end loans exclude deferred fees and costs. |
(5) | Capital ratios calculated on consolidated financial statements for the Company. |
ITEM 7. | MANAGEMENT’S DISCUSSION AND ANALYSIS OF FINANCIAL CONDITION AND RESULTS OF OPERATIONS |
TCB Holdings Transaction. For more information on this acquisition, see Part I, Item 1.
In the following
sectionsections the terms
“Reliant Bancorp,” the “Company,”
“CUBN,“us,”
“we,” “our,” or similar terms refer to Reliant Bancorp Inc., and
“Commerce Union” each means “Commerce Union Bancshares, Inc.” and “Bank” means “Reliant Bank.its subsidiaries, including Reliant Bank, which we sometimes refer to as ““Reliant” or the “Bank.” The following discussion and analysis identifies significant factors that have affected our financial position and operating results during the periods included in the accompanying financial statements. We encourage you to read this discussion and analysis in conjunction with Item
88. “FINANCIAL STATEMENTS AND SUPPLEMENTARY DATA” as well as other information included in this
Form10-K.Annual Report. Amounts in the narrative are shown in thousands, except for economic and demographic information, numbers of shares, per share amounts and as otherwise noted.
Critical Accounting Policies
The accounting and reporting policies of the Company are in accordance with
accounting principles generally accepted in the United States of AmericaUS GAAP and conform to general practices within the banking industry. To prepare financial statements in conformity with
accounting principles generally accepted in the United States of America,a US GAAP, management makes estimates and assumptions based on available information. These estimates and assumptions affect the amounts reported in the financial statements and the disclosures provided, and actual results could differ. The
allowance for loan lossesALLL and fair value of financial instruments are particularly subject to change.
Our accounting policies are integral to understanding the results reported. Accounting policies are described in detail in Note 1 of the notes to the consolidated financial statements included elsewhere in this report. The critical accounting policies require our judgment to ascertain the valuation of assets, liabilities, commitments and contingencies. We have established policies and control procedures that are intended to ensure valuation methods are well controlled and applied consistently from period to period. In addition, the policies and procedures are intended to ensure that the process for changing methodologies occurs in an appropriate manner. The following is a brief summary of the more significant policies.
Principles of Consolidation
The consolidated financial statements as of and for the year ended December 31, 2016periods presented include the accounts of Commerce Union Bancshares, Inc., its wholly-owned subsidiary, Reliant Bancorp, the Bank, (the “Bank”Community First Trups Holding Company (“TRUPS”), which is wholly owned by Reliant Bancorp , Reliant Investment Holdings, LLC ("Holdings"), which is 100% wholly owned by the Bank’s majority controlled subsidiary, Reliant Mortgage Ventures, LLC, collectively (the “Company”). The consolidated financial statements forBank, and RMV, of which the year ended December 31, 2015 included the accountsBank controls 51% of the Company aftergovernance rights (Reliant Bancorp, the reverse merger described below forBank, Holdings, TRUPS, and RMV are collectively referred to herein as the nine months ended December 31, 2015 and the accounts of Reliant Bank only, with its wholly-owned subsidiary Reliant Investments, LLC and it’s 51% controlled subsidiary Reliant Mortgage Ventures, LLC, for the three months ended March 31, 2015. Comparative periods are comprised of the accounts of Reliant Bank, its wholly-owned subsidiary, Reliant Investments, LLC, and its 51% controlled subsidiary, Reliant Mortgage Ventures, LLC. “Company”).
All significant intercompany
accountsbalances and transactions have been eliminated in consolidation.
As described in Note 22 to our consolidated financial statements included elsewhere in this Annual Report, Reliant Bancorp and Community First merged effective January 1, 2018. The accounting and reporting policies of the Company conform to U.S. GAAP and to general practices in the banking industry.
During 2011, the Bank and another entity organized
Reliant Mortgage Ventures, LLC referred to above for the purpose of improving the Bank’s mortgage operations.RMV. Under the related operating agreement, the
non-controlling member receives 70% of the profits of
the mortgage venture,RMV, and the Bank receives 30% of the profits once the
non-controlling member recovers its aggregate losses. The
non-controlling member is responsible for 100% of
the mortgage venture’sRMV’s net losses. As of December 31,
2016,2019, the cumulative losses to date totaled
$3,397. Reliant Mortgage Ventures, LLC$13.4 million. RMV will have to generate net income of this amount before the Company will participate in future earnings.
Purchased Loans
The Company maintains an allowance for loan losses on
We record purchased
loans based on credit deterioration subsequent to the acquisition date. In accordance with the accounting guidance for business combinations, because we recorded all acquired loans at fair value as of the date of the
reverse mergeracquisition (discussed below),
we did not establish an allowance for loan losses on any of the loans we purchased as of the acquisition date assince any credit deterioration evident in the loans was included in the determination of the acquisition date fair values.
Forno ALLL is recorded for purchased
credit-impaired loans
because all loans are recorded at fair value at merger date. Impaired purchased loans are accounted for under ASC
310-30, management establishes in which an
allowance for loan lossesALLL subsequent to the date of acquisition
is established by
re-estimating expected cash flows on these loans,
on a quarterly basis, with any decline in expected cash flows due to a credit triggering impairment recorded as
provision for loan losses.purchased credit impairment (PCI). The
allowance establishedamount is the excess of the loan’s carrying value over the present value of projected future cash flows, discounted at the current accounting yield of the loan or the fair value of collateral (less estimated costs to sell) for collateral dependent loans. These cash flow evaluations are inherently subjective as they require material estimates, all of which may be susceptible to significant change. While the determination of specific cash flows involves estimates, each estimate is unique to the individual loan, and none is individually significant. For
non-purchased credit-impaired loans acquired in the
reverse merger and that are accounted for under ASC
310-20, the historical loss estimates are based on the historical losses experienced by Reliant Bank for loans with similar characteristics as those acquired other than purchased credit-impaired loans. We
recordestablish an
allowanceALLL provision for
loan lossesthese loans only when the calculated amount exceeds the remaining credit mark established at acquisition.
Allowance for Loan Losses
ALLL
The allowance for loan lossesALLL is a valuation allowance foran estimate of future probable incurred credit losses. Loan lossesLosses on loans-held-for-investment are charged against the allowanceALLL when management believes the uncollectibility of a loanremaining balance is confirmed.due has become uncollectible. Subsequent recoveries, if any, are credited to the allowance.ALLL. Management estimates a general component to the allowance balance required usingALLL based on historical loan loss experience theand qualitative factors, which include, 1) The nature and volume of the portfolio, information about specific borrower situations and estimated collateral values, current2) Current economic conditions (national and local), and other factors such as changes3) Changes in interest rates, portfolio4) Portfolio concentrations, 5) changes in the experience, ability, and depth of the lending function, levelsand 6) Levels of and trends incharged-off loans, recoveries,past-due loans and volume and severity of classified loans. The allowance consists of
A specific
and general components. The specificALLL component
relates tois calculated for loans that
areindividually classified as impaired. The general component coversnon-impaired loans and is based on historical loss experience adjusted for current factors. The entire allowance is available for any loan that, in management’s judgment, should be charged off.
meet the definition of impairment. A loan is considered impaired when full payment undermanagement believes that principal and interest due on that loan will not be collected in accordance with the terms and conditions of the loan terms is not expected. All classified loans and loans onnon-accrual status are individually evaluated for impairment. Factors considered in determining ifagreement. Once a loan is deemed to be impaired, includemanagement must calculate the borrower’s abilitypotential loss for the specific loan based on one of three approved methodologies to repay amounts owed, collateral deficiencies,estimate the risk ratingexpected recovery from secondary payment sources, which is then deducted from the book value of the loan and economic conditions affectingasset to calculate the borrower’s industry, among other things. If a loan is impaired, a portionamount of specific reserve required, 1) fair value of collateral, less expected cost to sell, 2) discounted cash flows of the allowance is allocated so that theexpected future loan is reported, net, at the present value of estimated future cash flows using the loan’s existing rate or at the fair value (less estimated costspayments, 3) Expected sale proceeds if loan was sold to sell) of collateral if repayment is expected solely from the collateral. another lender.
Interest payments on impaired loans are typically applied to principal unless the principal amount is deemed fully collectible, in which case interest is recognized on a cash basis. When recognition of interest income on a cash basis is appropriate, the amount of income recognized is limited to what would have been accrued on the remaining principal balance at the contractual rate. Cash payments received over this limit, and not applied to reduce the loans remaining principal balance, are recorded as recoveries of prior charge-offs until these charge-offs have been fully recovered.
Fair Value of Financial Instruments
Fair values of financial instruments are estimated using relevant market information and other assumptions, as more fully disclosed in a separate note to the consolidated financial statements. Fair value estimates involve uncertainties and matters of significant judgment regarding interest rates, credit risk, prepayments, and other factors, especially in the absence of broad markets for particular items. Changes in assumptions or in market conditions could significantly affect the estimates.
COMPARISON OF RESULTS OF OPERATIONS FOR THEYEARSENDEDDECEMBER 31, 2016, 2015 AND 2014Merger Between Commerce Union Bancshares, Inc. and Reliant Bank
On March 10, 2015, Commerce Union Bancshares, Inc. approved a merger with Reliant Bank which became effective on April 1, 2015 (“the Merger”). Each outstanding share and option to purchase a share of Reliant Bank common stock converted into the right to receive 1.0213 shares of Commerce Union Bancshares, Inc. common stock. After the Merger was completed, Commerce Union Bancshares, Inc.’s shareholders owned approximately 44.5% of the common stock of the Company and Reliant Bank’s shareholders owned approximately 55.5% of the common stock of the Company on a fully diluted basis.
The Merger was accounted for as a reverse merger using the acquisition method of accounting, in accordance with the provisions of FASB ASC Topic805-102019, Business Combinations.
As such, for accounting purposes, Reliant Bank was considered to be acquiring Commerce Union Bancshares, Inc. in this transaction. As a result of the merger, the historical financial statements for the year ended December 31, 2015, of the Company include the historical financial statements of Reliant Bank for the three months ended March 31, 2015 and Commerce Union Bancshares, Inc. for the nine months ended December 31, 2015. The assets and liabilities of Commerce Union Bancshares, Inc. as of the effective date of the Merger were recorded at their respective estimated fair values and added to those of Reliant Bank. Any excess of purchase price over the net estimated fair values of the acquired assets and assumed liabilities of Commerce Union Bancshares, Inc. were allocated to all identifiable intangibles assets. Any remaining excess was then allocated to goodwill.
In periods following the Merger, the comparative historical financial statements of the Company are those of Reliant Bank prior to the Merger. These consolidated financial statements include the results attributable to the operations of Commerce Union Bancshares, Inc. beginning on April 1, 2015.
Merger expenses totaled $82, $849 and $832, for the years ended December 31, 2016, 2015 and 2014, respectively. These expenses were related to various professional fees for legal, accounting and other consultants. These and other factors that contributed to the Company’s earnings results for the periods indicated are discussed in more detail below.
As of March 31, 2015, Commerce Union Bancshares, Inc., including its wholly-owned subsidiary Commerce Union Bank, had total assets of $305 million, total loans of $249 million and total deposits of $247 million. Commerce Union Bank held a loan portfolio that was primarily comprised of real estate loans. Immediately prior to the closing of the acquisition, for the three months ended March 31, 2015, Commerce Union Bank’s balance of nonperforming loans totaled 0.61% of total loans.
As a result of the Merger, the Company:
2018AND2017 grew consolidated total assets from $474.4 million to $790.9 million as of April 1, 2015, after giving effect to purchase accounting;
increased total loans from $313.2 million to $561.4 million as of April 1, 2015;Earnings
increased total deposits from $376.6 million to $623.9 million as of April 1, 2015; and
expanded its employee base from 164 full time equivalent employees to 215 full time equivalent employees as of April 1, 2015.
Earnings
Net income attributable to shareholders amounted to $8,936,was $16,196, or $1.18$1.44 per basic share, for the year ended December 31, 2016,2019, compared to $5,575,$14,085, or $0.88$1.24 per basic common share, for the same period in 2018 and $7,246 or $0.89 per basic share, for the same period in 2015 and $3,896 or $0.98 per basic share for the same period in 2014.2017. Diluted net income attributable to shareholders per share was $1.16, $0.86$1.44, $1.23 and $0.96$0.88 per diluted share for the years ended December 31, 2016, 20152019, 2018, and 2014,2017, respectively. TheLoan growth was the largest components ofcontributing factor to the improvementgrowth in profitability from the year ended December 31, 20152018 to the year ended December 31, 2016 include a 20.2% increase in net interest income of $5,482, and a decrease innon-interest expenses of $1,195 for the year ended December 31, 2016 compared to the same period in 2015. The largest factors offsetting the improvement was a decrease innon-interest income of $3,582 for the year ended December 31, 2016 compared to the same period in 2015. The largest components of the improvement from the year ended December 31, 2014 to the year ended December 31, 2015 include a 74.3% increase in net interest income of $11,584, and an increase innon-interest income of $7,774 for the year ended December 31, 2015 compared to the same period in 2014. The largest factors offsetting the improvement was an increase innon-interest expenses of $14,403 for the year ended December 31, 2015 compared to the same period in 2014.
2019.
Net Interest Income
Net interest income represents the amount by which interest earned on various earning assets exceeds interest paid on deposits and other interest-bearing liabilities and is the most significant component of our revenues.
The following tables set forth the amount of our average balances, interest income or interest expense for each category of interest-earning assets and interest-bearing liabilities and the average interest rate for interest-earning assets and interest-bearing liabilities, net interest spread and net interest margin for the years ended December 31,
2016, 20152019, 2018, and
20142017 (dollars in thousands):
Average Balances – Yields and Rates
| | | | | | | | | | | | | | | | | | | | | | | | | | | | | | | | | | | | |
| | | Year Ended December 31,
2016 | | | Year Ended December 31,
2015 | | | Year Ended December 31,
2014 | |
| | | Average
Balances | | | Rates /
Yields
(%) | | | Interest
Income /
Expense | | | Average
Balances | | | Rates /
Yields
(%) | | | Interest
Income /
Expense | | | Average
Balances | | | Rates /
Yields
(%) | | | Interest
Income /
Expense | |
Interest earning assets | | | | | | | | | | | | | | | | | | | | | | | | | | | | | | | | | | | | |
Loans | | $ | 640,592 | | | | 4.78 | | | $ | 29,950 | | | $ | 517,148 | | | | 4.78 | | | $ | 24,719 | | | $ | 293,195 | | | | 4.63 | | | $ | 13,578 | |
Loan fees | | | — | | | | 0.31 | | | | 1,955 | | | | — | | | | 0.25 | | | | 1,298 | | | | — | | | | 0.37 | | | | 1,081 | |
| | | | | | | | | | | | | | | | | | | | | | | | | | | | | | | | | | | | |
Loans with fees | | | 640,592 | | | | 5.09 | | | | 31,905 | | | | 517,148 | | | | 5.03 | | | | 26,017 | | | | 293,195 | | | | 5.00 | | | | 14,659 | |
Mortgage loans held for sale | | | 21,064 | | | | 3.67 | | | | 773 | | | | 38,284 | | | | 3.98 | | | | 1,523 | | | | 17,110 | | | | 4.20 | | | | 718 | |
Deposits with banks | | | 20,240 | | | | 0.35 | | | | 70 | | | | 21,715 | | | | 0.18 | | | | 39 | | | | 14,285 | | | | 0.19 | | | | 27 | |
Investment securities - taxable | | | 40,463 | | | | 1.79 | | | | 724 | | | | 46,393 | | | | 1.90 | | | | 881 | | | | 42,061 | | | | 2.43 | | | | 1,024 | |
Investment securities -tax-exempt | | | 105,536 | | | | 3.39 | | | | 2,211 | | | | 65,165 | | | | 2.76 | | | | 1,185 | | | | 31,443 | | | | 3.09 | | | | 641 | |
Fed funds sold and other | | | 7,442 | | | | 4.46 | | | | 332 | | | | 5,430 | | | | 4.48 | | | | 243 | | | | 3,393 | | | | 4.30 | | | | 146 | |
| | | | | | | | | | | | | | | | | | | | | | | | | | | | | | | | | | | | |
Total earning assets | | | 835,337 | | | | 4.56 | | | | 36,015 | | | | 694,135 | | | | 4.39 | | | | 29,888 | | | | 401,487 | | | | 4.37 | | | | 17,215 | |
| | | | | | | | | | | | | | | | | | | | | | | | | | | | | | | | | | | | |
Nonearning assets | | | 49,737 | | | | | | | | | | | | 39,516 | | | | | | | | | | | | 15,563 | | | | | | | | | |
| | | | | | | | | | | | | | | | | | | | | | | | | | | | | | | | | | | | |
| | $ | 885,074 | | | | | | | | | | | $ | 733,651 | | | | | | | | | | | $ | 417,050 | | | | | | | | | |
| | | | | | | | | | | | | | | | | | | | | | | | | | | | | | | | | | | | |
Interest bearing liabilities | | | | | | | | | | | | | | | | | | | | | | | | | | | | | | | | | | | | |
Interest bearing demand | | $ | 88,775 | | | | 0.21 | | | | 182 | | | $ | 88,857 | | | | 0.21 | | | | 190 | | | $ | 51,662 | | | | 0.29 | | | | 148 | |
Savings and money market | | | 186,473 | | | | 0.34 | | | | 632 | | | | 158,670 | | | | 0.29 | | | | 466 | | | | 116,434 | | | | 0.28 | | | | 330 | |
Time deposits - retail | | | 159,351 | | | | 0.70 | | | | 1,116 | | | | 116,364 | | | | 0.76 | | | | 883 | | | | 33,640 | | | | 1.13 | | | | 380 | |
Time deposits - wholesale | | | 102,626 | | | | 0.70 | | | | 719 | | | | 95,719 | | | | 0.56 | | | | 533 | | | | 76,627 | | | | 0.54 | | | | 417 | |
| | | | | | | | | | | | | | | | | | | | | | | | | | | | | | | | | | | | |
Total interest bearing deposits | | | 537,225 | | | | 0.49 | | | | 2,649 | | | | 459,610 | | | | 0.45 | | | | 2,072 | | | | 278,363 | | | | 0.46 | | | | 1,275 | |
Federal Home Loan Bank advances | | | 111,290 | | | | 0.64 | | | | 714 | | | | 105,624 | | | | 0.61 | | | | 646 | | | | 51,202 | | | | 0.69 | | | | 354 | |
| | | | | | | | | | | | | | | | | | | | | | | | | | | | | | | | | | | | |
Total borrowed funds | | | 111,290 | | | | 0.64 | | | | 714 | | | | 105,624 | | | | 0.61 | | | | 646 | | | | 51,202 | | | | 0.69 | | | | 354 | |
Total interest-bearing liabilities | | | 648,515 | | | | 0.52 | | | | 3,363 | | | | 565,234 | | | | 0.48 | | | | 2,718 | | | | 329,565 | | | | 0.49 | | | | 1,629 | |
| | | | | | | | | | | | | | | | | | | | | | | | | | | | | | | | | | | | |
Net interest rate spread (%) / Net interest income ($) | | | | | | | 4.04 | | | $ | 32,652 | | | | | | | | 3.91 | | | $ | 27,170 | | | | | | | | 3.88 | | | $ | 15,586 | |
| | | | | | | | | | | | | | | | | | | | | | | | | | | | | | | | | | | | |
Non-interest bearing deposits | | | 127,619 | | | | (0.09 | ) | | | | | | | 83,731 | | | | (0.07 | ) | | | | | | | 45,103 | | | | (0.06 | ) | | | | |
Othernon-interest bearing liabilities | | | 4,724 | | | | | | | | | | | | 4,564 | | | | | | | | | | | | 857 | | | | | | | | | |
Stockholder’s equity | | | 104,216 | | | | | | | | | | | | 80,122 | | | | | | | | | | | | 41,525 | | | | | | | | | |
| | | | | | | | | | | | | | | | | | | | | | | | | | | | | | | | | | | | |
| | $ | 885,074 | | | | | | | | | | | $ | 733,651 | | | | | | | | | | | $ | 417,050 | | | | | | | | | |
| | | | | | | | | | | | | | | | | | | | | | | | | | | | | | | | | | | | |
Cost of funds | | | | | | | 0.43 | | | | | | | | | | | | 0.41 | | | | | | | | | | | | 0.43 | | | | | |
| | | | | | | | | | | | | | | | | | | | | | | | | | | | | | | | | | | | |
Net interest margin | | | | | | | 4.15 | | | | | | | | | | | | 4.00 | | | | | | | | | | | | 3.96 | | | | | |
| | | | | | | | | | | | | | | | | | | | | | | | | | | | | | | | | | | | |
|
| | | | | | | | | | | | | | | | | | | | | | | | | | | | | | | | | |
| | | Year Ended December 31, 2019 | | Year Ended December 31, 2018 | | Year Ended December 31, 2017 |
| | | Average Balances | | Rates / Yields (%) | | Interest Income / Expense | | Average Balances | | Rates / Yields (%) | | Interest Income / Expense | | Average Balances | | Rates / Yields (%) | | Interest Income / Expense |
| Interest earning assets | | | | | | | | | | | | | | | | | | |
| Loans | | $ | 1,298,922 |
| | 5.12 |
| | $ | 66,446 |
| | $ | 1,138,946 |
| | 4.99 |
| | $ | 56,777 |
| | $ | 714,982 |
| | 4.59 |
| | $ | 32,839 |
|
| Loan fees | | — |
| | 0.25 |
| | 3,253 |
| | — |
| | 0.25 |
| | 2,855 |
| | — |
| | 0.28 |
| | 2,012 |
|
| Loans with fees | | 1,298,922 |
| | 5.37 |
| | 69,699 |
| | 1,138,946 |
| | 5.24 |
| | 59,632 |
| | 714,982 |
| | 4.87 |
| | 34,851 |
|
| Mortgage loans held for sale | | 18,212 |
| | 5.28 |
| | 961 |
| | 24,882 |
| | 5.14 |
| | 1,278 |
| | 19,016 |
| | 4.56 |
| | 868 |
|
| Deposits with banks | | 34,576 |
| | 1.69 |
| | 583 |
| | 34,504 |
| | 1.37 |
| | 471 |
| | 15,177 |
| | 0.71 |
| | 107 |
|
| Investment securities - taxable | | 74,220 |
| | 2.83 |
| | 2,099 |
| | 70,170 |
| | 2.62 |
| | 1,836 |
| | 31,557 |
| | 2.19 |
| | 691 |
|
| Investment securities - tax-exempt | | 221,249 |
| | 3.71 |
| | 8,199 |
| | 225,592 |
| | 3.72 |
| | 8,393 |
| | 151,446 |
| | 4.01 |
| | 6,081 |
|
| Fed funds sold and other | | 12,870 |
| | 5.20 |
| | 669 |
| | 11,654 |
| | 5.87 |
| | 684 |
| | 7,769 |
| | 5.30 |
| | 412 |
|
| Total earning assets | | 1,660,049 |
| | 4.95 |
| | 82,210 |
| | 1,505,748 |
| | 4.80 |
| | 72,294 |
| | 939,947 |
| | 4.58 |
| | 43,010 |
|
| Nonearning assets | | 138,953 |
| | | | | | 138,612 |
| | | | | | 55,489 |
| | | | |
| Total assets | | $ | 1,799,002 |
| | | | | | $ | 1,644,360 |
| | | | | | $ | 995,436 |
| | | | |
| Interest bearing liabilities | | | | | | | | | | | | | | | | | | |
| Interest bearing demand | | $ | 146,518 |
| | 0.26 |
| | 384 |
| | $ | 146,717 |
| | 0.25 |
| | 366 |
| | $ | 84,171 |
| | 0.21 |
| | 173 |
|
| Savings and money market | | 376,927 |
| | 1.10 |
| | 4,154 |
| | 349,986 |
| | 0.74 |
| | 2,589 |
| | 196,939 |
| | 0.38 |
| | 748 |
|
| Time deposits - retail | | 559,404 |
| | 2.10 |
| | 11,739 |
| | 531,780 |
| | 1.55 |
| | 8,264 |
| | 319,456 |
| | 0.98 |
| | 3,126 |
|
| Time deposits - wholesale | | 227,010 |
| | 2.48 |
| | 5,622 |
| | 90,510 |
| | 1.77 |
| | 1,598 |
| | 88,114 |
| | 1.10 |
| | 969 |
|
| Total interest bearing deposits | | 1,309,859 |
| | 1.67 |
| | 21,899 |
| | 1,118,993 |
| | 1.15 |
| | 12,817 |
| | 688,680 |
| | 0.73 |
| | 5,016 |
|
| Federal Home Loan Bank advances | | 24,611 |
| | 2.21 |
| | 543 |
| | 85,706 |
| | 2.16 |
| | 1,855 |
| | 50,730 |
| | 1.29 |
| | 655 |
|
| Subordinated debt | | 14,727 |
| | 6.37 |
| | 938 |
| | 11,566 |
| | 6.26 |
| | 724 |
| | — |
| | — |
| | — |
|
| Total borrowed funds | | 39,338 |
| | 3.76 |
| | 1,481 |
| | 97,272 |
| | 2.65 |
| | 2,579 |
| | 50,730 |
| | 1.29 |
| | 655 |
|
| Total interest-bearing liabilities | | 1,349,197 |
| | 1.73 |
| | 23,380 |
| | 1,216,265 |
| | 1.27 |
| | 15,396 |
| | 739,410 |
| | 0.77 |
| | 5,671 |
|
| Net interest rate spread (%) / Net interest income ($) | |
|
| | 3.22 |
| | 58,830 |
| |
|
| | 3.53 |
| | 56,898 |
| | | | 3.81 |
| | 37,339 |
|
| Non-interest bearing deposits | | 231,228 |
| | (0.25) |
| | | | 218,867 |
| | (0.20) |
| | | | 134,408 |
| | (0.11) |
| | |
| Other non-interest bearing liabilities | | 3,590 |
| | | | | | 5,911 |
| | | | | | 3,838 |
| | | | |
| Stockholder's equity | | $ | 214,987 |
| | | | | | $ | 203,317 |
| | | | | | $ | 117,780 |
| | | | |
|
| | | | | | | | | | | | | | | | | | | | | | | | | | | | | | | | | |
| Total liabilities and stockholders' equity | | 1,799,002 |
| | | | | | 1,644,360 |
| | | | | | 995,436 |
| | | | |
| Cost of funds | | | | 1.48 |
| | | | | | 1.07 |
| | | | | | 0.66 |
| | |
| Net interest margin | | | | 3.54 |
| | | | | | 3.78 |
| | | | | | 3.97 |
| | |
TableAssumptions—Average loan balances are inclusive ofinclude nonperforming loans. Yields computed ontax-exempt instrumentsInterest income and yields are on a tax equivalent basis. Interest income reflects a state tax credit received on low or zero percent interest loans made to construct low income housing of $1,265, $1,268, and $650 for the years ended December 31, 2019, 2018, and 2017, respectively. Net interest spread is calculated as the yields realized on interest-bearing assets less the rates paid on interest-bearing liabilities. Net interest margin is the result of net interest income calculated on atax-equivalent basis divided by average interest earning assets for the period. Changes in net interest income are attributed to either changes in average balances (volume change) or changes in average rates (rate change) for earning assets and sources of funds on which interest is received or paid. Volume change is calculated as change in volume times the previous rate while rate change is change in rate times the previous volume. Changes not due solely to volume or rate changes have been allocated to volume change and rate change in proportion to the relationship of the absolute dollar amounts of the change in each category.
Analysis of Changes in Interest Income and Expense
| | | | | | | | | | | | | | | | | | | | | | | | |
| | | Change for Year Ended
December 31, 2016 to 2015 | | | Change for Year Ended
December 31, 2015 to 2014 | |
| | | Due to
Volume | | | Due to
Rate | | | Total | | | Due to
Volume | | | Due to
Rate | | | Total | |
Interest earning assets | | | | | | | | | | | | | | | | | | | | | | | | |
Loans | | $ | 5,231 | | | $ | — | | | $ | 5,231 | | | $ | 10,687 | | | $ | 454 | | | $ | 11,141 | |
Loan fees | | | 657 | | | | — | | | | 657 | | | | 217 | | | | — | | | | 217 | |
| | | | | | | | | | | | | | | | | | | | | | | | |
Loans with fees | | | 5,888 | | | | — | | | | 5,888 | | | | 10,904 | | | | 454 | | | | 11,358 | |
Mortgage loans held for sale | | | (639 | ) | | | (111 | ) | | | (750 | ) | | | 845 | | | | (40 | ) | | | 805 | |
Deposits with banks | | | (3 | ) | | | 34 | | | | 31 | | | | 13 | | | | (1 | ) | | | 12 | |
Investment securities - taxable | | | (108 | ) | | | (49 | ) | | | (157 | ) | | | 97 | | | | (240 | ) | | | (143 | ) |
Investment securities -tax-exempt | | | 749 | | | | 277 | | | | 1,026 | | | | 684 | | | | (140 | ) | | | 544 | |
Fed funds sold and other | | | 92 | | | | (3 | ) | | | 89 | | | | 91 | | | | 6 | | | | 97 | |
| | | | | | | | | | | | | | | | | | | | | | | | |
Total earning assets | | | 5,979 | | | | 148 | | | | 6,127 | | | | 12,634 | | | | 39 | | | | 12,673 | |
| | | | | | | | | | | | | | | | | | | | | | | | |
| | | | | | |
Interest bearing liabilities | | | | | | | | | | | | | | | | | | | | | | | | |
Interest bearing demand | | | (8 | ) | | | — | | | | (8 | ) | | | 90 | | | | (48 | ) | | | 42 | |
Savings and money market | | | 84 | | | | 82 | | | | 166 | | | | 123 | | | | 13 | | | | 136 | |
Time deposits - retail | | | 307 | | | | (74 | ) | | | 233 | | | | 663 | | | | (160 | ) | | | 503 | |
Time deposits - wholesale | | | 42 | | | | 144 | | | | 186 | | | | 101 | | | | 15 | | | | 116 | |
| | | | | | | | | | | | | | | | | | | | | | | | |
Total interest bearing deposits | | | 425 | | | | 152 | | | | 577 | | | | 977 | | | | (180 | ) | | | 797 | |
Federal Home Loan Bank advances | | | 36 | | | | 32 | | | | 68 | | | | 337 | | | | (45 | ) | | | 292 | |
| | | | | | | | | | | | | | | | | | | | | | | | |
Total borrowed funds | | | 36 | | | | 32 | | | | 68 | | | | 337 | | | | (45 | ) | | | 292 | |
Total interest-bearing liabilities | | | 461 | | | | 184 | | | | 645 | | | | 1,314 | | | | (225 | ) | | | 1,089 | |
| | | | | | | | | | | | | | | | | | | | | | | | |
Change in Net interest income | | $ | 5,518 | | | $ | (36 | ) | | $ | 5,482 | | | $ | 11,320 | | | $ | 264 | | | $ | 11,584 | |
| | | | | | | | | | | | | | | | | | | | | | | | |
|
| | | | | | | | | | | | | | | | | | | | | | | | |
| | | Change for Year Ended December 31, 2019 to 2018 | | Change for Year Ended December 31, 2018 to 2017 |
| | | Due to Volume | | Due to Rate | | Total | | Due to Volume | | Due to Rate | | Total |
| Interest earning assets | | | | | | | | | | | | |
| Loans | | $ | 8,156 |
| | $ | 1,513 |
| | $ | 9,669 |
| | $ | 20,342 |
| | $ | 2,990 |
| | $ | 23,332 |
|
| Loan fees | | 398 |
| | — |
| | 398 |
| | 843 |
| | — |
| | 843 |
|
| Loans with fees | | 8,554 |
| | 1,513 |
| | 10,067 |
| | 21,185 |
| | 2,990 |
| | 24,175 |
|
| Mortgage loans held for sale | | (351 | ) | | 34 |
| | (317 | ) | | 290 |
| | 120 |
| | 410 |
|
| Deposits with banks | | 1 |
| | 111 |
| | 112 |
| | 210 |
| | 154 |
| | 364 |
|
| Investment securities - taxable | | 110 |
| | 153 |
| | 263 |
| | 986 |
| | 159 |
| | 1,145 |
|
| Investment securities - tax-exempt | | (170 | ) | | (24 | ) | | (194 | ) | | 3,119 |
| | (418 | ) | | 2,701 |
|
| Fed funds sold and other | | 67 |
| | (82 | ) | | (15 | ) | | 224 |
| | 48 |
| | 272 |
|
| Total earning assets | | 8,211 |
| | 1,705 |
| | 9,916 |
| | 26,014 |
| | 3,053 |
| | 29,067 |
|
| | | | | | | | | | | | | |
| | | | | | | | | | | | | |
| Interest bearing liabilities | | | | | | | | | | | | |
| Interest bearing demand | | — |
| | 18 |
| | 18 |
| | 153 |
| | 40 |
| | 193 |
|
| Savings and money market | | 213 |
| | 1,352 |
| | 1,565 |
| | 830 |
| | 1,011 |
| | 1,841 |
|
| Time deposits - retail | | 444 |
| | 3,031 |
| | 3,475 |
| | 2,740 |
| | 2,398 |
| | 5,138 |
|
| Time deposits - wholesale | | 3,178 |
| | 846 |
| | 4,024 |
| | 27 |
| | 602 |
| | 629 |
|
| Total interest bearing deposits | | 3,835 |
| | 5,247 |
| | 9,082 |
| | 3,750 |
| | 4,051 |
| | 7,801 |
|
| Federal Home Loan Bank advances | | (1,354 | ) | | 42 |
| | (1,312 | ) | | 607 |
| | 593 |
| | 1,200 |
|
| Subordinated debt | | 201 |
| | 13 |
| | 214 |
| | — |
| | 724 |
| | 724 |
|
| Total borrowed funds | | (1,153 | ) | | 55 |
| | (1,098 | ) | | 607 |
| | 1,317 |
| | 1,924 |
|
| Total interest-bearing liabilities | | $ | 2,682 |
| | $ | 5,302 |
| | $ | 7,984 |
| | $ | 4,357 |
| | $ | 5,368 |
| | $ | 9,725 |
|
| Net interest rate spread (%) / Net interest income ($) | | $ | 5,529 |
| | $ | (3,597 | ) | | $ | 1,932 |
| | $ | 21,657 |
| | $ | (2,315 | ) | | $ | 19,342 |
|
Analysis—For the year ended December 31, 2016, we recorded2019, net interest income ofwas approximately $32.7$58.8 million which resulted in(including tax equivalent adjustments), producing a net interest margin (net interest income divided by the average balance of interest earning assets) of 4.15%3.54%. For the year ended December 31, 2015, we recorded2018, net interest income ofwas approximately $27.2$56.9 million which resulted in(including tax equivalent adjustments), producing a net interest margin of 4.00%3.78%. For the year ended December 31, 2014, we recorded2017, net interest income ofwas approximately $15.6$37.3 million which resulted in(including tax equivalent adjustments), generating a net interest margin of 3.96%3.97%. For the yearyears ended December 31, 2016, 20152019, 2018, and 2014,2017, our net interest spread was 4.04%3.22%, 3.91%3.53% and 3.88%3.81%, respectively. During the year ended December 31, 2016, a contributing factor to the increase in our net interest income was the payoff of loans previously carried as purchase credit impaired. These payoffs resulted in a $827 increase in our net interest income for the period. This was partially offsetPurchased loan accretion and state tax credits increased margin and spread by reversals of interest due to nonaccrual loans.0.19%, 0.26% and 0.20% respectively.
Our year-over-year average loan volume increased by approximately
23.9%14.0% from
20152018 to
20162019 and
76.4%59.3% from
20142017 to
2015.2018. Our combined loan and loan fee yield increased from
5.03%5.24% to
5.09%5.37% for
20152019 compared to
2016,2018, respectively, and
increased from
5.00%4.87% to
5.03%5.24% for
20142018 compared to
2015,2017, respectively.
Our tax equivalent yield decreased to 3.71% for the year ended December 31, 2019 from 3.72% for the year ended December 31, 2018 and decreased from 4.01% for the year ended December 31, 2017. The decrease from 2017 was driven by reduction in the federal tax rate.
Our cost of funds increased from
0.41%1.07% to
0.43%1.48% for
20152019 compared to the same period in
20162018 and
declined from
0.43%0.66% to
0.41%1.07% for
20142018 compared to the same period in
2015.2017. Our cost of interest-bearing liabilities increased from
0.48%1.27% at December 31,
20152018 to
0.52%1.73% at December 31,
2016. Our cost2019 and from 0.77% at December 31, 2017 to 1.27% at December 31, 2018. All categories of interest-bearing liabilities
decreased from 0.49% at December 31, 2014contributed to
0.48% at December 31, 2015. We also experienced 52.4% and 85.6% increasesthe increase in our
averagecost of funds due to rate increases by the Federal Reserve as well as competition for core deposits and the use of wholesale funding sources. Additionally, we assumed subordinated debt in the Community First acquisition and issued another $60 million in December 2019 with a combined cost of 6.37%. Our non-interest bearing deposits
from the year ended December 31, 2015 and 2016 anddecreased our cost of funds by 25 basis points for the year ended December 31, 20142019 compared to 20 basis points and 2015, respectively. The increase from 2015 to 2016 was primarily the result of the Merger that occurred on April 1, 2015, but also a result of our continuing initiative to grow low cost core deposits. The increase from 2014 to 2015 was primarily the result of the Merger effective April 1, 2015, and a result of a year-long strategic growth initiative.
We continue to deploy various asset and liability management strategies to manage our risk to interest rate fluctuations. We believe margin expansion over both the short and the long term will be challenging due to continued pressure on earning asset yields during this extended period of low interest rates. Loan pricing11 basis points for creditworthy borrowers is very competitive in our markets and has limited our ability to increase pricing on new and renewed loans over the last several quarters.
Provision for Loan Losses
The provision for loan losses represents a charge (or in the case of the years ended December 31, 20152018 and 2014, a recovery) to earnings necessary to establish an allowance2017, respectively.
Provision for loan losses that, in management’s evaluation, should be adequate to provide coverage for the inherent losses on outstanding loans. Based upon management’s assessment of the loan portfolio, we adjust our allowance for loan losses on a quarterly basis to an amount deemed appropriate to adequately cover probable losses inherent in the loan portfolio.Based upon our evaluation of the loan portfolio, we believe the allowance for loan losses to be adequate to absorb our estimate of probable losses existing in the loan portfolio at December 31, 2016. While policies and procedures used to estimate the allowance for loan losses, as well as the resultant provision for loan losses charged to operations, are considered adequate by management, they are necessarily approximate and imprecise. There are factors beyond our control, such as conditions in the local and national economy, local real estate market, or particular industry or borrower-specific conditions, which may materially negatively impact our asset quality and the adequacy of our allowance for loan losses and, thus, the resulting provision for loan losses.
Loan
Losses We recorded a provision for loan losses of
$968$1,211, $1,035, and $1,316 for the
yearyears ended December 31,
2016, a negative provision for loan losses of $270 for the year ended December 31, 20152019, 2018, and
a negative provision for loan losses of $1,500 for the year ended December 31, 2014.2017, respectively. Our provision increase
wasin 2019 primarily
the result ofresulted from loan
growth that we have experienced. The lowergrowth. Our provision
for loan losses (including the negative provision) experienceddecrease in
the prior year was due to the continued improvement of credit-quality factors in our loan portfolio, continued recoveries2018 resulted from improved credit quality metrics and low charge-offs.
Our
non-interest income is composed of several components, some of which vary significantly between periods. The following is a summary of our
non-interest income for the years ended December 31,
2016, 20152019, 2018, and
20142017 (dollars in thousands):
| | | | | | | | | | | | | | | | | | | | | | | | | | | | |
| | | Years Ended December 31, | | | Dollar
Increase | | | Percent
Increase | | | Year Ended December 31, | | | Dollar Increase | | | Percent
Increase | |
| | | 2016 | | | 2015 | | | (Decrease) | | | (Decrease) | | | 2014 | | | (Decrease) | | | (Decrease) | |
Non-interest income | | | | | | | | | | | | | | | | | | | | | | | | | | | | |
Service charges on deposit accounts | | $ | 1,239 | | | $ | 958 | | | $ | 281 | | | | 29.3 | % | | $ | 617 | | | $ | 341 | | | | 55.3 | % |
Gains (loss) on securities transactions, net | | | 36 | | | | (388 | ) | | | 424 | | | | 109.3 | % | | | 143 | | | | (531 | ) | | | -371.3 | % |
Gains on mortgage loans sold, net | | | 6,317 | | | | 10,999 | | | | (4,682 | ) | | | -42.6 | % | | | 3,447 | | | | 7,552 | | | | 219.1 | % |
Gain (loss) on sale of other real estate | | | 301 | | | | 6 | | | | 295 | | | | 4916.7 | % | | | (8 | ) | | | 14 | | | | 175.0 | % |
Other noninterest income: | | | | | | | | | | | | | | | | | | | | | | | | | | | | |
Bank-owned life insurance | | | 750 | | | | 541 | | | | 209 | | | | 38.6 | % | | | 360 | | | | 181 | | | | 50.3 | % |
Brokerage revenue | | | 89 | | | | 93 | | | | (4 | ) | | | -4.3 | % | | | 18 | | | | 75 | | | | 416.7 | % |
Rental income | | | 2 | | | | 6 | | | | (4 | ) | | | -66.7 | % | | | — | | | | 6 | | | | 100.0 | % |
Miscellaneous noninterest income, net | | | 66 | | | | 167 | | | | (101 | ) | | | -60.5 | % | | | 31 | | | | 136 | | | | 438.7 | % |
| | | | | | | | | | | | | | | | | | | | | | | | | | | | |
Total othernon-interest income | | | 907 | | | | 807 | | | | 100 | | | | 12.4 | % | | | 409 | | | | 398 | | | | 97.3 | % |
| | | | | | | | | | | | | | | | | | | | | | | | | | | | |
Totalnon-interest income | | $ | 8,800 | | | $ | 12,382 | | | $ | (3,582 | ) | | | -28.9 | % | | $ | 4,608 | | | $ | 7,774 | | | | 168.7 | % |
| | | | | | | | | | | | | | | | | | | | | | | | | | | | |
The most significant reason
|
| | | | | | | | | | | | | | | | | | |
| | | Year Ended | | Percent Increase (Decrease) | | | | Percent Increase (Decrease) |
| | | December 31, | | | | December 31, | | |
| | | 2019 | | 2018 | | | | 2017 | | |
| Non-Interest Income | | | | | | | | | | |
| Service charges and fees | | $ | 3,746 |
| | $ | 3,419 |
| | 9.6 | % | | $ | 1,251 |
| | 173.3 | % |
| Securities gains, net | | 1,451 |
| | 43 |
| | 3,274.4 | % | | 59 |
| | (27.1 | )% |
| Gains on mortgage loans sold, net | | 4,905 |
| | 4,418 |
| | 11.0 | % | | 3,675 |
| | 20.2 | % |
| Gain on sale of other real estate | | 166 |
| | 259 |
| | (35.9 | )% | | 27 |
| | 859.3 | % |
| Gain (loss) on disposal of premises and equipment | | — |
| | 13 |
| | 100.0 | % | | (52 | ) | | 125.0 | % |
| Bank-owned life insurance | | 1,119 |
| | 1,186 |
| | (5.6 | )% | | 836 |
| | 41.9 | % |
| Other noninterest income: | | | | | | | | | | |
| Brokerage revenue | | 49 |
| | 99 |
| | (50.5 | )% | | 116 |
| | (14.7 | )% |
| Miscellaneous noninterest income | | 528 |
| | 209 |
| | 152.6 | % | | 98 |
| | 113.3 | % |
| Total other non-interest income | | 577 |
| | 308 |
| | 87.3 | % | | 214 |
| | 44.4 | % |
| Total non-interest income | | $ | 11,964 |
| | $ | 9,646 |
| | 24.0 | % | | $ | 6,010 |
| | 54.7 | % |
Noninterest income increased for
the decrease during the year ended December 31,
20162019 compared to the same period in
2015, related2018, primarily due to
gains realized on the
decline in gains on mortgage loans sold, net, while thesale of securities. The increase for the year ended December 31,
2015 compared to 2014, related to an increase in gains on mortgage loans sold, net, and the Merger between Commerce Union Bancshares, Inc. and Reliant Bank that was effective April 1, 2015. Following is a description of certain components ofnon-interest income and other reasons for fluctuations during the year ended December 31, 20162018 when compared to the same period in
2015 and the year ended December 31, 2015 compared2017 was primarily due to the
same period in 2014.Community First Transaction. Service charges on deposit accounts generally reflect customer growth trends but also are impacted by changes in the growth of our customer base. Changes infee pricing for deposit account services, the addition or discontinuation of deposit productsstructure to help attract and the volume and type of deposit account transactions will also impact our level of service charges.
Securities gains and losses will fluctuate from period to period and are often attributable to various balance sheet risk strategies. retain customers.
During the year ended December 31,
2016,2019, the Company sold securities
classified as available for sale totaling
$31,782$85,895 and recognized a gain of $1,451. During the year ended December 31, 2018, the Company sold securities totaling $100,737 and recognized a net gain of
$36. Proceeds from sales during 2016 were primarily reinvested in higher yielding securities with comparable interest rate and credit risk.$43. During the year ended December 31,
2015,2017, the Company sold securities
classified as available for sale and held to maturity totaling
$27,258 and recognized a net loss of $388. During the first quarter of 2015, the Bank sold securities that were previously classified as held to maturity and recognized a loss on sale of $396, which is included in the net loss above. All other securities classified as held to maturity were transferred toavailable-for-sale during the first quarter of 2015. During the year ended December 31, 2014, the Company sold securities classified as available for sale and held to maturity totaling $14,732$18,688 and recognized a net gain of
$143.$59.
Gains on mortgage loans sold, net, consists of fees from the origination and sale of mortgage loans.
These mortgage fees are for loans originated throughout the U.S. and subsequently sold to third-party investors. All of these loan sales transfer servicing rights to the buyer.
Generally, mortgage related revenue increases in lower interest rate environments and more robust housing markets and decreases in rising interest rate environments and more challenging housing markets. Mortgage-related revenue will fluctuate as the rate environment changes and as changes occur to our mortgage operations. Gains on mortgage loans sold, net, amounted to
$6,317, $10,999$4,905, $4,418 and
$3,447,$3,675, for the years ended December 31,
2016, 20152019, 2018, and
2014,2017, respectively.
As discussed further in the notes to our consolidated financial statements, gains on mortgage loans sold are generally recognized at the time of a loan sale corresponding to the transfer of risk. The decline in sells of loans during 2016 primarily related to the transition of a majority of ourout-of-market mortgage loan production offices during the quarter ended June 30, 2016 to better focus our marketing and other resources in our core Middle Tennessee markets. The increase during 2015 compared to same period in 2014 was due to expanding our mortgage operation during the second quarter of 2014 by increasing the number ofout-of-market offices and personnel.
During the
yearyears ended December 31,
2016,2019, 2018, and 2017, we recognized
a gaingains of $166, $259, and $27, respectively on
salesales of other real estate
and on the recognition of
$301 when we sold the remaining two properties in our other real estate portfolio and recognized a
gain previously deferred
related togains from the
payoffpayoffs of
a loan financing a previous other real estate sale.loans.
Noninterest income also includes appreciation in the cash surrender value of bank-owned life insurance
(BOLI), which was
$750, $541$1,119, $1,186, and
$360$836 for the years ended December 31,
2016, 20152019, 2018, and
2014,2017, respectively. Primarily, the increases in earnings on these
bank-owned life insuranceBOLI policies
when compared with 2017 resulted from
the Merger effective April 1, 2015. Also, at the end of June 2015, an additional
$4.0$10.7 million
which came over as part of
bank-owned life insurance was purchased with terms similar to our existing policies, and during 2016, an additional $4.0 million of bank-owned life insurance was purchased with terms similar to our existing policies.the Community First acquisition. The assets that support these policies are administered by the life insurance carriers and the income we receive (i.e., increases or decreases in the cash surrender value of the policies) is dependent upon the returns the insurance carriers are able to earn on the underlying investments that support the policies. Earnings on these policies generally are not taxable.
Our brokerage revenue is
generated through an arrangement with a third party and issolely based on
the volumecommissions received from established referral relationships and
type of product sales made to customers referred by our employees.Rental income relates to rent receivedfluctuate based on foreclosed properties and is minimal for the periods presented.
related activity.
The following is a summary of our
non-interest expense for the years ended December 31,
2016, 20152019, 2018, and
20142017 (dollars in thousands):
| | | | | | | | | | | | | | | | | | | | | | | | | | | | |
| | | Years Ended December 31, | | | Dollar
Increase | | | Percent
Increase | | | Year Ended December 31, | | | Dollar Increase | | | Percent
Increase | |
| | | 2016 | | | 2015 | | | (Decrease) | | | (Decrease) | | | 2014 | | | (Decrease) | | | (Decrease) | |
Non-interest expense | | | | | | | | | | | | | | | | | | | | | | | | | | | | |
Salaries and employee benefits | | $ | 18,256 | | | $ | 18,657 | | | $ | (401 | ) | | | -2.1 | % | | $ | 10,170 | | | $ | 8,487 | | | | 83.5 | % |
Occupancy | | | 3,174 | | | | 3,387 | | | | (213 | ) | | | -6.3 | % | | | 2,599 | | | | 788 | | | | 30.3 | % |
Information technology | | | 2,486 | | | | 2,479 | | | | 7 | | | | 0.3 | % | | | 1,399 | | | | 1,080 | | | | 77.2 | % |
Advertising and public relations | | | 702 | | | | 1,213 | | | | (511 | ) | | | -42.1 | % | | | 559 | | | | 654 | | | | 117.0 | % |
Audit, legal and consulting | | | 1,287 | | | | 1,892 | | | | (605 | ) | | | -32.0 | % | | | 714 | | | | 1,178 | | | | 165.0 | % |
Federal deposit insurance | | | 438 | | | | 383 | | | | 55 | | | | 14.4 | % | | | 264 | | | | 119 | | | | 45.1 | % |
Provision for losses on other real estate | | | 70 | | | | 110 | | | | (40 | ) | | | -36.4 | % | | | 72 | | | | 38 | | | | 52.8 | % |
Other operating | | | 3,961 | | | | 3,448 | | | | 513 | | | | 14.9 | % | | | 1,389 | | | | 2,059 | | | | 148.2 | % |
| | | | | | | | | | | | | | | | | | | | | | | | | | | | |
Totalnon-interest expense | | $ | 30,374 | | | $ | 31,569 | | | $ | (1,195 | ) | | | -3.8 | % | | $ | 17,166 | | | $ | 14,403 | | | | 83.9 | % |
| | | | | | | | | | | | | | | | | | | | | | | | | | | | |
|
| | | | | | | | | | | | | | | | | | |
| | | Year Ended | | Percent Increase (Decrease) | | Year Ended | | Percent Increase (Decrease) |
| | | December 31, | | | | December 31, | | |
| | | 2019 | | 2018 | | | | 2017 | | |
| Non-Interest Expense | | | | | | | | | | |
| Salaries and employee benefits | | $ | 30,514 |
| | $ | 27,510 |
| | 10.9 | % | | $ | 18,432 |
| | 49.3 | % |
| Occupancy | | 5,423 |
| | 4,949 |
| | 9.6 | % | | 3,353 |
| | 47.6 | % |
| Information technology | | 6,213 |
| | 5,333 |
| | 16.5 | % | | 2,715 |
| | 96.4 | % |
| Advertising and public relations | | 1,293 |
| | 600 |
| | 115.5 | % | | 264 |
| | 127.3 | % |
| Audit, legal and consulting | | 2,302 |
| | 2,976 |
| | (22.6 | )% | | 1,508 |
| | 97.3 | % |
| Federal deposit insurance | | 605 |
| | 793 |
| | (23.7 | )% | | 399 |
| | 98.7 | % |
| Provision for losses on other real estate | | 98 |
| | — |
| | N/A |
| | — |
| | N/A |
|
| Merger expenses | | 1,603 |
| | 2,774 |
| | (42.2 | )% | | 1,426 |
| | 94.5 | % |
| Other operating | | 5,841 |
| | 5,626 |
| | 3.8 | % | | 2,979 |
| | 88.9 | % |
| Total non-interest expense | | $ | 53,892 |
| | $ | 50,561 |
| | 6.6 | % | | $ | 31,076 |
| | 62.7 | % |
The most significant reason for the changes during the years ended December 31,
2016, 20152019 and
2014 relate2018 was increased salary and employee benefits expense and a reduction in merger expense. Non-interest expense incurred by RMV is reflected in the total reported non-interest expense but does not impact the Company's net income attributable to
common shareholders. RMV's non-interest expense for the
Merger between Commerce Union Bancshares, Inc.three years presented was $11,510, $9,049 and
Reliant Bank that was effective April 1, 2015.$5,552 respectively. Following is a description of certain components of
non-interest expense and additional reasons for fluctuations during the years ended December 31,
2016, 20152019, 2018, and
2014.2017. For more information regarding RMV's operating agreement please refer to Part 7, Principles of Consolidation.
Salaries and employee benefits decreasedincreased significantly for the year ended December 31, 20162019 and 2018 compared to the same periods in 2018 and 2017. The primary reason for the change during the year ended December 31, 2019 was increased staffing for RMV, due in part, to their build out of a correspondent mortgage line-of-business, as well as our staffing of de novo branches in Murfreesboro during the third quarter of 2018 and Chattanooga in the fourth quarter of 2018 and other investments in revenue producers and leadership. The primary reason for the change for the year ended December 31, 2018 compared to the same period in 20152017 was the Community First Transaction. RMV's salary and employee benefits expense for the three periods presented was $6,745, $5,296 and $4,157 respectively.
Occupancy costs increased during the year ended December 31, 2019 compared to the same period in 2018 mainly due to the commencement of Murfreesboro and Chattanooga leases. Additionally. in 2019 we added leases for mortgage production offices in Memphis, Chattanooga and two in Little Rock, Arkansas. Occupancy costs also increased during the year ended December 31, 2018 when compared to the same period in 2017. This increase is mainly due to the Community First Transaction and the commencement of a lease on a new corporate office in Franklin, Tennessee. RMV's occupancy expense for the three periods presented was $564, $393 and $330, respectively.
Information technology costs increased for the year ended December 31,
2015 compared2019 and December 31, 2018 when comparing to the
same periodcomparable periods in
2014. The primary reason for the changes during the year ended December 31, 2016 compared2018 and 2017. This increase is mainly attributable to
the same period in 2015increasing volume of accounts and
the same period in 2014 was a result of the Merger effective April 1, 2015. The decrease from 2015 to 2016 was primarily a result of a decrease in compensation from transitioning several of ourout-of-market mortgage offices to another bank and was partially offset from general increases in compensation of our staff. The increase from 2014 to 2015, aside from the Merger effective April 1, 2015, was related to payments made under a management incentive program, the expansion of our mortgage operations and payments made under a retail incentive program to help grow business and consumer deposit activity.Certain of our facilities are leased while there are others that we own. Occupancy costs decreased during the year ended December 31, 2016 compared to the same period in 2015. This decrease is due to transitioning several of ourout-of-market mortgage offices to another bank. When comparing the period of 2015 with 2014, occupancy costs increased, primarilytransactions due to the Merger effective April 1, 2015,Community First Transaction and increasesnew de novo branch offices that served to increase data processing costs incrementally. Additionally, we have made investments in rent for other mortgage loan production offices.
Information technology to improve our network perform, strengthen our cybersecurity infrastructure and enhance our ability to deliver digital products to our commercial and consumer clients.
Advertising and public relations costs
were relatively flatincreased $693 when comparing the year ended December 31,
2016 to the comparable period in 2015. When comparing the year ended December 31, 2015 to the comparable period in 2014, the increase was substantially due to the Merger effective April 1, 2015. The Company operated on two core data processing systems untilmid-November 2015 when the conversion to one core system occurred. Since November 2015, core service costs have declined as a result of this conversion.Advertising and public relations costs decreased when comparing the year ended December 31, 20162019 to the similar period in 2015, by $511. The decrease is2018. Increased costs were primarily due to transitioning several of ourout-of-market mortgage offices to another bank. These decreases have been partially offset by cost increases attributable to our current customer acquisition strategy.a $676 increase in promotional expenses and advertising for RMV, additional donation and sponsorship commitments, and expenses associated with the launch of a branding initiative. Advertising and public relations costs increased when comparing the year ended December 31, 20152018 to the similar period in 2014, by $654. These costs were substantially attributable2017 mainly due to a retail customer acquisition strategy, expanded use of a mortgage lead-generating platformthe Community First Transaction. RMV's advertising and public relations expense for the Merger effective April 1, 2015. We engaged a third party to assist with the implementation of a program to grow businessthree periods presented was $707, $32 and consumer deposit accounts during the period from 2014 to 2016.
$12, respectively.
Audit, legal and consulting costs decreased
$605$674 when comparing the year ended December 31,
20162019 compared to the similar period in
2015 due2018. This decrease is mainly attributable to
a reductionthe higher legal fees and consulting fees incurred during 2018 by RMV which decreased $713 in
merger-related expenses offset partially by increased costs associated with being a public company.2019. The increase from
20142017 to
20152018 of
$1,178$1,468 was
dueattributable to
merger-related expensesincrease legal and
consulting expense incurred by RMV. RMV's audit, legal and consulting expense for the
costs associated with being a public company.three periods presented was $1,168, $1,881 and $562, respectively.
Our FDIC expense is based on our outstanding
liabilitiesdeposits for the period multiplied by a factor determined by the FDIC, mainly driven by our most recent regulatory rating and certain financial performance factors. Our FDIC expense
increased $55decreased $188 for year ended December 31,
2016,2019, compared to the same period in
20152018 and increased
$119$394 for the year ended December 31,
20152018 compared to the same period in
2014.2017. This decrease in 2019 was attributable to an approximately $375 credit received from the FDIC. The increase
fromin 2018 is primarily the
year ended December 31, 2014 toresult of the
same period in 2015 was primarily due to the Merger effective April 1, 2015. Increase in both periods relate to our increase inCommunity First Transaction which increased average
liabilities which is the base for determining our premiums. The costs associated with the increase in average liabilities was slightly offset by an improved combined rate post-merger.liabilities.
We recorded a provision for losses on other real estate of
$70, $110 and $72 during the years ended December 31, 2016, 2015 and 2014, respectively. The provision recorded for 2016 related to a property held in our other real estate portfolio while the provision recorded for 2015 related to a different property held in our other real estate portfolio. The provision recorded for 2014 related to two properties that were held in our other real estate portfolio.Other operating expenses increased $513$98 for the year ended December 31, 2016,2019 compared to none in 2018, and 2017. The provision in 2019 related to a property sold in January 2020.
Other operating expenses increased by $215 for the year ended December 31, 2019 compared to the same period in
20152018 due to increased travel and
entertainment costs incurred by RMV. Other operating expenses increased
$2,059by $2,647 for the year ended December 31,
20152018 compared to the same period in
2014 mainly2017 due to
the Merger effective April 1, 2015. These increases from 2015 compared to 2016 were partially offset by decreases in loan-related expenses such as processing costs relating to our mortgage operations as volume decreased and our transitioning of several of ourout-of-market mortgage offices to another bank. Other increases from 2014 compared to 2015cost related to
loan-related expenses from volume increases in mortgage originationsthe Community First Transaction and
sales during the year ended December 31, 2015. We also recorded a provision for unfunded commitments of $85 and $323 during the years ended December 31, 2016 and 2015, respectively. This provision was recorded to provide for estimated losses in our unfunded loan commitments.RMV.
During the years ended December 31,
2016, 20152019, 2018, and
20142017 we recorded income tax expense of
$2,213, $2,271$2,129, $1,372, and
$1,816,$1,942, respectively. The Company files separate Federal tax returns for
RMV and the
operations of the mortgage banking and banking operations.Bank. The taxable income or losses of
the mortgage banking operations areRMV is included in the respective returns of the Bank and
the non-controlling members for Federal purposes.
During the third quarter of 2015, the Company began consolidating the results of the Bank and the mortgage banking operations in its tax filings with the State of Tennessee. At that time, we recognized a cumulative benefit of $159 relating to 2014 and prior tax losses of the mortgage banking operations that were available to offset a portion of the income of the Bank. Results of the mortgage banking operations were previously reported on the individual state returns of the Bank and mortgage banking operation’snon-controlling members.
Our income tax expense for the year ended December 31,
2016,2019, reflects an effective income tax rate of
20.4%13.47% (exclusive of a tax benefit
from our mortgage banking operations of
$72$393 realized on
RMV's pre-tax loss of
$1,111)($6,052)) compared to
30.3%10.25% (exclusive of a tax benefit
from our mortgage banking operationsf of
$148$236 on
RMV's pre-tax income loss of
$259) for the comparable period of 2015.($3,814). During the
yearyears ended December 31,
2016,2019, 2018, and 2017, the Company recognized excess tax benefits of
$478$46, $110, and $184 related to the exercise of stock options
and vesting of restricted shares, respectively, thereby reducing our effective tax
rate as compared torate. The Company recognized tax credits of $1,265, $1,268, and $650 for the
yearyears ended December 31,
2015. Also, during the year ended December 31, 2016, the Bank2019, 2018, and 2017 due to interest-free loan agreements entered into
an interest-free loan agreement and recognizes a state tax credit inby the
amount of $217 each quarter beginning in the second quarter of 2016.Bank. Our income tax expense
forwas also positively affected in 2019 and 2018 by the
year ended December 31, 2014, reflects an effective income tax rate of 31.8% (exclusive of apre-tax loss of 1,184benefits from our
mortgage banking operations with no tax expense or benefit).investment subsidiary formed in the fourth quarter of 2018, the impact was somewhat offset by a reduction of our tax-exempt investments during 2019. Our effective tax rate represents our blended federal and state rate of
38.29%26.1% for 2019 and 2018 and 38.3% for 2017 reduced by the impact of anticipated favorable permanent differences between our book and taxable income such as
bank-owned life insurance,BOLI, income earned on
tax-exempt securities and certain federal and state tax credits. The non-deductibility of certain merger related expenses also drives fluctuations in our effective tax rate.
Noncontrolling Interest in Net Income (Loss) of Subsidiary
Our noncontrolling interest in net The Tax Cuts and Jobs Act permanently reduced the U.S. federal corporate income (loss) of subsidiary is solely attributabletax rate from 35% to Reliant Mortgage Ventures, LLC. Reliant Bank has a 51% voting interest in this venture. Under the terms of the related operating agreement, the noncontrolling member receives 70% of the profits of the mortgage venture, and the Bank receives 30% of the profits. The noncontrolling member is responsible21%, effective for 100% of the mortgage venture’s net losses. During the year ended December 31, 2016,tax years beginning after 2017. Accordingly, the Company transitioned mosthas remeasured its deferred tax assets and liabilities at the new tax rate and recorded a one-time noncash tax expense of itsout-of-market mortgage offices$620 to another bank. The venture incurred a net loss of $1,039deferred income taxes for the year ended December 31, 2016,2017. This expense resulted in the Company’s higher effective tax rate for that year.
Noncontrolling Interest in NetIncome (Loss)of Subsidiary
RMV incurred a net
incomeloss of
$407$5,659 for the year ended December 31,
2015 and a2019, net loss of
$1,184$3,578 for the year ended December 31,
2014.2018, and a net loss of $1,083 for the year ended December 31, 2017. The net loss for the year ended December 31,
2016,2019, results in a cumulative net loss
from the venture of
$3,397. Revenue and expenses from the operation$13,409. These amounts are included in our consolidated
statements of operations as noninterest income and noninterest expense and the net income (loss) is subtracted (added) as the noncontrolling interest.results. See Note
2021 for segment reporting in the consolidated financial statements included elsewhere herein.
Return on Equity and Assets
The following schedule details selected key ratios for the years ended December 31,
2016, 20152019, 2018, and
2014: | | | | | | | | | | | | |
| | | 2016 | | | 2015 | | | 2014 | |
| | | |
Return on assets | | | 1.01 | % | | | 0.76 | % | | | 0.93 | % |
(Net income divided by average total assets) | | | | | | | | | | | | |
Return on equity | | | 8.57 | % | | | 6.96 | % | | | 9.38 | % |
(Net income divided by average equity) | | | | | | | | | | | | |
Dividend payout ratio | | | 18.64 | % | | | 22.73 | % | | | 20.41 | % |
(Dividends declared per share divided by net income per share) | | | | | | | | | | | | |
Equity to assets ratio | | | 11.77 | % | | | 10.92 | % | | | 9.96 | % |
(Average equity divided by average total assets) | | | | | | | | | | | | |
Leverage capital ratio - Bank | | | 10.75 | % | | | 9.88 | % | | | 9.71 | % |
(Equity divided by fourth quarter average total assets, excluding accumulated other comprehensive income) | | | | | | | | | | | | |
2017:
|
| | | | | | | | | |
| | | 2019 | | 2018 | | 2017 |
| Return on assets | | 0.90 | % | | 0.86 | % | | 0.73 | % |
| (Net income divided by average total assets) | | | | | | |
| Return on equity | | 7.53 | % | | 6.93 | % | | 6.15 | % |
| (Net income divided by average equity) | | | | | | |
| Dividend payout ratio | | 18.75 | % | | 26.61 | % | | 26.97 | % |
| (Dividends declared per share divided by net income per share) | | | | | | |
| | | | | | | |
| Equity to assets ratio | | 11.95 | % | | 12.36 | % | | 11.83 | % |
| (Average equity divided by average total assets) | | | | | | |
| Leverage capital ratio - Bank | | 10.30 | % | | 10.17 | % | | 11.68 | % |
| (Equity divided by fourth quarter average total assets, excluding accumulated other comprehensive income) | | | | | | |
Under guidelines developed by regulatory agencies a “risk weight” is assigned to various categories of assets and commitments
ranging from 0% to 100% based on the risk associated with the asset. The following schedule details the Bank’s risk-based capital at December 31,
20162019 excluding the net unrealized
lossgain on
available-for-sale securities which is shown as
a reductionan increase in shareholders’ equity in the consolidated financial statements:
| | | | |
| | | In Thousands,
Except
Percentages | |
Tier 1 capital | | | | |
Shareholders’ equity, excluding accumulated other comprehensive income, disallowed goodwill, other disallowed intangible assets and disallowed servicing assets | | $ | 95,637 | |
Tier 2 capital | | | | |
Allowable allowance for loan losses (limited to 1.25% of gross risk- weighted assets) | | | 9,082 | |
| | | | |
Total risk-based capital | | $ | 104,719 | |
| | | | |
| |
Risk-weighted assets, gross | | $ | 742,640 | |
Less: Excess allowance for loan and lease losses | | | — | |
| | | | |
| |
Risk-weighted assets, net | | $ | 742,640 | |
| | | | |
| |
Risk-based capital ratios: | | | | |
Tier 1 risk-based capital ratio | | | 12.88 | % |
| | | | |
| |
Total risk-based capital ratio | | | 14.10 | % |
| | | | |
|
| | | |
| | In Thousands, Except Percentages |
| Tier 1 capital | |
| Shareholders' equity, excluding accumulated other comprehensive income, disallowed goodwill, other disallowed intangible assets, and disallowed servicing assets | $ | 186,734 |
|
| Tier 2 capital | |
| Allowable allowance for loan losses (limited to 1.25% of gross risk-weighted assets) | 13,003 |
|
| | |
| Total risk-based capital | $ | 199,737 |
|
| | |
| Risk-weighted assets, gross | $ | 1,562,016 |
|
| Less: Excess allowance for loan and lease losses | — |
|
| | |
| Risk-weighted assets, net | $ | 1,562,016 |
|
| | |
| Risk-based capital ratios: | |
| Tier 1 risk-based capital ratio | 11.95 | % |
| | |
| Total risk-based capital ratio | 12.79 | % |
The minimum Tier 1 risk-based capital ratio required by the regulatory agencies is 4.00%, and the minimum total risk-based capital ratio required is
8.00%9.25%. At December 31,
2016,2019, the Company was in compliance with these requirements.
COMPARISON OF BALANCE SHEETS ATDECEMBER 31, 2016 2019ANDDECEMBER 31, 20152018
The Company’s total assets were
$911,984$1,898 million at December 31,
20162019 and
$876,404$1,724 million at December 31,
2015.2018. Our assets increased by
4.1%10.1% from December 31,
20152018 to December 31,
2016.2019. The increase in assets from December 31,
20152018 to December 31,
2016,2019, was substantially attributable to an increase in
cash and cash equivalents of $3.7 million; an increase in net
loansloans-held-for-investment of approximately
$49.0$177.2 million,
discussed further below; a net increase in our
securities portfoliomortgage loans-held-for-sale of
$13.0$21.7 million,
discussed further below; and
a $4.8an increase of $15.9 million
increase in
bank-owned life insurance.cash and cash equivalents. These increases were offset by a decrease in
our mortgage loans held for saleinvestments of
$43.3$36.0 million. The Company’s total liabilities were
$805,065$1,675 million at December 31,
20162019 and
$779,653$1,516 million at December 31,
2015,2018, an increase of
3.3%10.5%. The increase in total liabilities from December 31,
20152018 to December 31,
2016,2019, was substantially attributable to
anthe increase in total deposits of
$123.8$145.9 million
and an increase of $59.3 million in subordinated debt and somewhat offset by a decrease
of $46.8 million in
Federal Home Loan Bank advances of $103.5 million.FHLB advances. These and other components of our balance sheets are discussed further below.
Loans
Loans-Held-For-Investment
Lending-related income is the most important component of our net interest income and is a major contributor to profitability. The loan portfolio is the largest component of earning assets, and it therefore generates the largest portion of revenues.
The absolute volume of loans and the volume of loans as a percentage of earning assets is an important determinant of net interest margin as loans are expected to produce higher yields than securities and other earning assets. As previously discussed, the competition for quality loans in our markets has remained intense. Our goal is to steadily grow our loan portfolio, focusing on quality. This is not always possible for various factors, including but not limited to, scheduled maturities or early payoffs exceeding new loan volume. Early payoffs typically increase in lowering rate environments as customers identify advantageous opportunities for refinancing.
We have been adding experienced lending officers to our staff to help with loan growth as the local market has continued to improve. Total
loans,loans-held-for-investment, net, at December 31,
2016,2019, and December 31,
2015,2018, were
$657,701$1,397,374 and
$608,747,$1,220,184, respectively. This represented an increase of
8.0%14.5% from December 31,
20152018 to December 31,
2016.2019.
The table below provides a summary of the loan portfolio composition for the dates noted (including
purchased credit-impaired (PCI)PCI loans).
| | | | | | | | | | | | | | | | | | | | | | | | |
| | | As of December 31, | |
| | | 2016 | | | 2015 | | | 2014 | |
| | | Amount | | | Percent | | | Amount | | | Percent | | | Amount | | | Percent | |
| | | | | | |
Commerical, industrial and agricultural | | $ | 134,404 | | | | 20.1 | % | | $ | 143,770 | | | | 23.3 | % | | $ | 80,817 | | | | 25.5 | % |
Real estate: | | | | | | | | | | | | | | | | | | | | | | | | |
1-4 family residential | | | 113,031 | | | | 16.9 | % | | | 110,736 | | | | 17.9 | % | | | 41,297 | | | | 13.0 | % |
1-4 family HELOC | | | 57,460 | | | | 8.6 | % | | | 49,665 | | | | 8.0 | % | | | 33,108 | | | | 10.4 | % |
Multifamily and commercial real estate | | | 215,639 | | | | 32.3 | % | | | 202,736 | | | | 32.8 | % | | | 112,805 | | | | 35.6 | % |
Construction, land development and farmland | | | 115,889 | | | | 17.4 | % | | | 89,763 | | | | 14.6 | % | | | 37,127 | | | | 11.7 | % |
Consumer | | | 17,240 | | | | 2.6 | % | | | 15,271 | | | | 2.5 | % | | | 11,771 | | | | 3.7 | % |
Other | | | 13,745 | | | | 2.1 | % | | | 5,556 | | | | 0.9 | % | | | 300 | | | | 0.1 | % |
| | | | | | | | | | | | | | | | | | | | | | | | |
| | | 667,408 | | | | 100.0 | % | | | 617,497 | | | | 100.0 | % | | | 317,225 | | | | 100.0 | % |
Less: | | | | | | | | | | | | | | | | | | | | | | | | |
Deferred loan fees | | | 625 | | | | | | | | 927 | | | | | | | | 375 | | | | | |
Allowance for possible loan losses | | | 9,082 | | | | | | | | 7,823 | | | | | | | | 7,353 | | | | | |
| | | | | | | | | | | | | | | | | | | | | | | | |
| | | | | | |
Loans, net | | $ | 657,701 | | | | | | | $ | 608,747 | | | | | | | $ | 309,497 | | | | | |
| | | | | | | | | | | | | | | | | | | | | | | | |
| | | | | | | | | | | | | | | | |
| | | As of December 31, | |
| | | 2013 | | | 2012 | |
| | | Amount | | | Percent | | | Amount | | | Percent | |
Commerical, industrial and agricultural | | $ | 84,715 | | | | 29.6 | % | | $ | 75,627 | | | | 26.6 | % |
Real estate: | | | | | | | | | | | | | | | | |
1-4 family residential | | | 38,604 | | | | 13.5 | % | | | 37,790 | | | | 13.3 | % |
1-4 family HELOC | | | 35,353 | | | | 12.3 | % | | | 42,503 | | | | 14.9 | % |
Multifamily and commercial real estate | | | 91,400 | | | | 31.9 | % | | | 99,138 | | | | 34.8 | % |
Construction, land development and farmland | | | 27,916 | | | | 9.7 | % | | | 19,350 | | | | 6.8 | % |
Consumer | | | 8,330 | | | | 2.9 | % | | | 9,820 | | | | 3.5 | % |
Other | | | 302 | | | | 0.1 | % | | | 302 | | | | 0.1 | % |
| | | | | | | | | | | | | | | | |
| | | 286,620 | | | | 100.0 | % | | | 284,530 | | | | 100.0 | % |
Less: | | | | | | | | | | | | | | | | |
Deferred loan fees | | | 320 | | | | | | | | 552 | | | | | |
Allowance for possible loan losses | | | 8,530 | | | | | | | | 7,760 | | | | | |
| | | | | | | | | | | | | | | | |
| | | | |
Loans, net | | $ | 277,770 | | | | | | | $ | 276,218 | | | | | |
| | | | | | | | | | | | | | | | |
|
| | | | | | | | | | | | | | | | | | | | | |
| | | December 31, |
| | | 2019 | | 2018 | | 2017 |
| | | Amount | | Percent | | Amount | | Percent | | Amount | | Percent |
| Commercial, Industrial and Agricultural | | $ | 245,515 |
| | 17.4 | % | | $ | 213,850 |
| | 17.4 | % | | $ | 138,706 |
| | 18.0 | % |
| Real Estate: | | | | | | | | | | | | |
| 1-4 Family Residential | | 227,529 |
| | 16.2 | % | | 225,863 |
| | 18.3 | % | | 111,932 |
| | 14.4 | % |
| 1-4 Family HELOC | | 96,228 |
| | 6.8 | % | | 88,112 |
| | 7.2 | % | | 72,017 |
| | 9.3 | % |
| Multifamily and Commercial | | 536,845 |
| | 38.1 | % | | 447,840 |
| | 36.4 | % | | 261,044 |
| | 33.8 | % |
| Construction, Land Development and Farmland | | 273,872 |
| | 19.4 | % | | 220,801 |
| | 17.9 | % | | 156,452 |
| | 20.3 | % |
| Consumer | | 16,855 |
| | 1.2 | % | | 20,495 |
| | 1.7 | % | | 17,605 |
| | 2.3 | % |
| Other | | 13,180 |
| | 0.9 | % | | 14,106 |
| | 1.1 | % | | 14,694 |
| | 1.9 | % |
| | | 1,410,024 |
| | 100.0 | % | | 1,231,067 |
| | 100.0 | % | | 772,450 |
| | 100.0 | % |
| Less: | | | | | | | | | | | | |
| Deferred loan fees (cost) | | 72 |
| | | | (9 | ) | | | | 231 |
| | |
| ALLL | | 12,578 |
| | | | 10,892 |
| | | | 9,731 |
| | |
| | | | | | | | | | | | | |
| Loans, net | | $ | 1,397,374 |
| | | | $ | 1,220,184 |
| | | | $ | 762,488 |
| | |
|
| | | | | | | | | | | | | | |
| | | As of December 31, |
| | | 2016 | | 2015 |
| | | Amount | | Percent | | Amount | | Percent |
| Commercial, Industrial and Agricultural | | $ | 134,404 |
| | 20.1 | % | | $ | 143,770 |
| | 23.3 | % |
| Real Estate: | | | | | | | | |
| 1-4 Family Residential | | 113,031 |
| | 16.9 | % | | 110,736 |
| | 18.0 | % |
| 1-4 Family HELOC | | 57,460 |
| | 8.6 | % | | 49,665 |
| | 8.0 | % |
| Multifamily and Commercial | | 215,639 |
| | 32.3 | % | | 202,736 |
| | 32.8 | % |
| Construction, Land Development and Farmland | | 115,889 |
| | 17.4 | % | | 89,763 |
| | 14.5 | % |
| Consumer | | 17,240 |
| | 2.6 | % | | 15,271 |
| | 2.5 | % |
| Other | | 13,745 |
| | 2.1 | % | | 5,556 |
| | 0.9 | % |
| | | 667,408 |
| | 100.0 | % | | 617,497 |
| | 100.0 | % |
| Less: | | | | | | | | |
| Deferred loan fees (cost) | | 625 |
| | | | 927 |
| | |
| ALLL | | 9,082 |
| | | | 7,823 |
| | |
| | | | | | | | | |
| Loans, net | | $ | 657,701 |
| | | | $ | 608,747 |
| | |
| | | | | | | | | |
The table below provides a summary of PCI
loansloans-held-for-investment as of December 31,
20162019, and
2015: | | | | | | | | |
| | | December 31,
2016 | | | December 31,
2015 | |
| | |
Commerical, industrial and agricultural | | $ | 385 | | | $ | 1,558 | |
Real estate: | | | | | | | | |
1-4 family residential | | | 92 | | | | 1,016 | |
1-4 family HELOC | | | 36 | | | | 40 | |
Multifamily and commercial real estate | | | 3,321 | | | | 4,565 | |
Construction, land development and farmland | | | 1,569 | | | | 1,598 | |
Consumer | | | — | | | | — | |
Other | | | — | | | | — | |
| | | | | | | | |
Total gross PCI loans | | | 5,403 | | | | 8,777 | |
Less: | | | | | | | | |
Remaining purchase discount | | | 635 | | | | 1,671 | |
Allowance for possible loan losses | | | 6 | | | | 247 | |
| | | | | | | | |
| | |
Loans, net | | $ | 4,762 | | | $ | 6,859 | |
| | | | | | | | |
December 31, 2018:
|
| | | | | | | | |
| | | December 31, 2019 | | December 31, 2018 |
| Commercial, Industrial and Agricultural | | $ | — |
| | $ | 63 |
|
| Real Estate: | | | | |
| 1-4 Family Residential | | 231 |
| | 324 |
|
| 1-4 Family HELOC | | — |
| | — |
|
| Multifamily and Commercial | | 217 |
| | 233 |
|
| Construction, Land Development and Farmland | | 1,021 |
| | 1,958 |
|
| Consumer | | — |
| | 18 |
|
| Other | | — |
| | — |
|
| Total gross PCI loans | | 1,469 |
| | 2,596 |
|
| Less: | | | | |
| Remaining purchase discount | | 246 |
| | 300 |
|
| Allowance for possible loan losses | | — |
| | — |
|
| | | | | |
| Loans, net | | $ | 1,223 |
| | $ | 2,296 |
|
Commercial loans
above consist of commercial and industrial loans made to U.S. domiciled customers. These include loans
used for
use in normal business operations to finance working capital needs, equipment purchases or other expansionary projects. Commercial
loansloans-held-for-investment of
$134,404$245.5 million at December 31,
2016, decreased 6.5%2019, increased 14.8% compared to
$143,770$213.9 million as of December 31,
2015.2018. Agricultural loans
-held-for-investment represent
10.9%4.1% of the total commercial, industrial and agricultural portfolio, and
2.2%0.7% of gross
loansloans-held-for-investment at December 31,
2016.2019.
Real estate loans comprised
75.2%80.5% of the
loanloans-held-for-investment portfolio at December 31,
2016.2019. Residential loans included in this category consist mainly of
closed-end loans secured by first and second liens that are not held for sale and revolving,
open-end loans secured by
1-4 family residential properties extended under home equity lines of credit. The Company increased the residential portfolio
3.1% from December 31,
20152018 to December 31,
2016.2019. Commercial loans included in the real estate category above include (in typical order of prominence) loans secured by
non- owner-occupied nonfarm nonresidential properties, loans secured by owner-occupied nonfarm nonresidential properties, and loans secured by multi-family residential properties. Multi-family and commercial real estate loans of
$215,639$536.8 million at December 31,
2016,2019, increased
6.4%19.9% compared to
the $202,736$447.8 million as of December 31,
2015.2018. Real estate construction loans consist of
1-4 family residential construction loans, other construction loans, land loans, and loans secured by farmland. Construction lending also increased
during 2015 and 2016,24.0% from December 31, 2018 to December 31, 2019, based on a
strengtheningstrong local economy.
Consumer loans
mainly consist of loans to individuals for household, family, and other personal expenditures under revolving credit plans and other consumer loans.
We have no credit card loans although we do offer credit cards to customers through a third party. We have a relatively small number of automobile loans. Our consumer
loansloans-held-for-investment experienced
an increasea decrease from December 31,
2015,2018 to December 31,
2016,2019, of
12.9%17.8%.
Our other
Other loans consist mainly of loans to states and political subdivisions and loans to other depository institutions and were minimalexperienced a 6.6% decrease from December 31, 2018 to December 31, 2019.
The loan repayments are significant source of liquidity for the
periods presented.The repayment of loans is a source of additional liquidity for us.Bank. The following table sets forth the loans repricing or maturing within specific intervals at December 31, 2016,2019, excluding unearned net fees and costs.
| | | | | | | | | | | | | | | | |
| | | One Year or
Less | | | One to Five
Years | | | Over Five
Years | | | Total | |
Commercial, industrial and agricultural | | $ | 43,134 | | | $ | 73,624 | | | $ | 17,646 | | | $ | 134,404 | |
Real estate: | | | | | | | | | | | | | | | | |
1-4 family residential | | | 17,071 | | | | 68,215 | | | | 27,745 | | | | 113,031 | |
1-4 family HELOC | | | 8,002 | | | | 23,055 | | | | 26,403 | | | | 57,460 | |
Multifamily and commercial real estate | | | 20,377 | | | | 103,958 | | | | 91,304 | | | | 215,639 | |
Construction, land development and farmland | | | 63,369 | | | | 46,141 | | | | 6,379 | | | | 115,889 | |
Consumer | | | 10,059 | | | | 6,886 | | | | 295 | | | | 17,240 | |
Other | | | 464 | | | | 5,781 | | | | 7,500 | | | | 13,745 | |
| | | | | | | | | | | | | | | | |
Total | | $ | 162,476 | | | $ | 327,660 | | | $ | 177,272 | | | $ | 667,408 | |
| | | | | | | | | | | | | | | | |
| | | | |
Fixed interest rate | | $ | 61,607 | | | $ | 259,604 | | | $ | 137,150 | | | $ | 458,361 | |
Variable interest rate | | | 100,869 | | | | 68,056 | | | | 40,122 | | | | 209,047 | |
| | | | | | | | | | | | | | | | |
Total | | $ | 162,476 | | | $ | 327,660 | | | $ | 177,272 | | | $ | 667,408 | |
| | | | | | | | | | | | | | | | |
|
| | | | | | | | | | | | | | | | |
| | | One Year or Less | | One to Five Years | | Over Five Years | | Total |
| Commercial, Industrial and Agricultural | | $ | 61,257 |
| | $ | 128,491 |
| | $ | 55,767 |
| | $ | 245,515 |
|
| Real Estate: | | | | | | | | |
| 1-4 Family Residential | | 26,843 |
| | 86,084 |
| | 114,602 |
| | 227,529 |
|
| 1-4 Family HELOC | | 3,789 |
| | 6,338 |
| | 86,101 |
| | 96,228 |
|
| Multifamily and Commercial | | 24,389 |
| | 270,579 |
| | 241,877 |
| | 536,845 |
|
| Construction, Land Development and Farmland | | 104,161 |
| | 113,595 |
| | 56,116 |
| | 273,872 |
|
| Consumer | | 10,523 |
| | 5,828 |
| | 504 |
| | 16,855 |
|
| Other | | 2,624 |
| | 1,438 |
| | 9,118 |
| | 13,180 |
|
| Total | | $ | 233,586 |
| | $ | 612,353 |
| | $ | 564,085 |
| | $ | 1,410,024 |
|
| | | | | | | | | |
| Fixed interest rate | | $ | 62,942 |
| | $ | 494,264 |
| | $ | 205,858 |
| | $ | 763,064 |
|
| Variable interest rate | | 170,644 |
| | 118,089 |
| | 358,227 |
| | 646,960 |
|
| Total | | $ | 233,586 |
| | $ | 612,353 |
| | $ | 564,085 |
| | $ | 1,410,024 |
|
The information presented in the above table is based upon the contractual maturities of the individual loans including
loansthose which may be subject to renewal at their contractual maturity. Renewal
of such loans is subject to review and credit approval, as well as modification of terms upon their maturity. Consequently, we believe this treatment presents fairly the
maturity and repricing structure of the loan portfolio.
Allowance for Loan Losses
We maintain an allowance for loan losses that we believe is adequate to absorb the probable incurred losses inherent in our loan portfolio. Loan losses are charged against the allowance when management believes the uncollectibility of a loan balance is confirmed. Subsequent recoveries, if any, are credited to the allowance. Management estimates the allowance balance required using historical loan loss experience, the nature and volume of the portfolio, information about specific borrower situations and estimated collateral values, current economic conditions (national and local), and other factors such as changes in interest rates, portfolio concentrations, changes in the experience, ability, and depth of the lending function, levels of and trends incharged-off loans, recoveries,past-due loans and volume and severity of classified loans. The allowance consists of specific and general components. The specific component relates to loans that are individually classified as impaired. The general component coversnon-impaired loans and is based on historical loss experience adjusted for current factors. The entire allowance is available for any loan that, in management’s judgment, should be charged off.
A loan is impaired when full payment under the loan terms is not expected. All classified loans and loans onnon-accrual status are individually evaluated for impairment. Factors considered in determining if a loan is impaired include the borrower’s ability to repay amounts owed, collateral deficiencies, the risk rating of the loan and economic conditions affecting the borrower’s industry, among other things. If a loan is impaired, a portion of the allowance is allocated so that the loan is reported, net, at the present value of estimated future cash flows using the loan’s existing rate or at the fair value (less estimated costs to sell) of collateral if repayment is expected solely from the collateral. Interest payments on impaired loans are typically applied to principal unless the principal amount is deemed fully collectible, in which case interest is recognized on a cash basis. When recognition of interest income on a cash basis is appropriate, the amount of income recognized is limited to what would have been accrued on the remaining principal balance at the contractual rate. Cash payments received over this limit, and not applied to reduce the loans remaining principal balance, are recorded as recoveries of prior charge-offs until these charge-offs have been fully recovered.
ALLL
At December 31,
2016,2019, the
allowance for loan lossesALLL was
$9,082$12,578 compared to
$7,823$10,892 at December 31,
2015.2018. The
allowance for loan lossesALLL as a percentage of total loans was
1.4%0.89% at December 31,
20162019 and
1.3%0.88% at December 31,
2015.2018. The
allowanceALLL was adjusted upward from December 31,
20152018 to December 31,
2016. This increase in our allowance for2019, due to loan
losses is directly attributablegrowth. Loan charge-offs continue to
our loan growth.Charge-offdecline, and general economic
activity hasconditions have continued to improve for our
areamarket footprint. Please refer to Item 7, Purchased Loans and
our customers.ALLL for more information.
The following table sets forth the activity in
the allowance for loan lossesALLL for the years presented.
Analysis of Changes in Allowance for Loan Losses
| | | | | | | | | | | | | | | | | | | | |
| | | 2016 | | | 2015 | | | 2014 | | | 2013 | | | 2012 | |
| | | | | |
Beginning Balance, January 1 | | $ | 7,823 | | | $ | 7,353 | | | $ | 8,530 | | | $ | 7,760 | | | $ | 9,738 | |
Loans charged off | | | | | | | | | | | | | | | | | | | | |
Commerical, industrial and agricultural | | | (84 | ) | | | — | | | | (9 | ) | | | (41 | ) | | | (1,706 | ) |
Real estate: | | | | | | | | | | | | | | | | | | | | |
1-4 family residential | | | (25 | ) | | | — | | | | — | | | | (53 | ) | | | (930 | ) |
1-4 family HELOC | | | — | | | | (6 | ) | | | — | | | | (143 | ) | | | (1,029 | ) |
Multifamily and commercial real estate | | | — | | | | — | | | | — | | | | — | | | | — | |
Construction, land development and farmland | | | — | | | | — | | | | — | | | | — | | | | (464 | ) |
Consumer | | | — | | | | (35 | ) | | | (120 | ) | | | (16 | ) | | | — | |
Other | | | (36 | ) | | | — | | | | (11 | ) | | | — | | | | (9 | ) |
| | | | | | | | | | | | | | | | | | | | |
Total loans charged off | | | (145 | ) | | | (41 | ) | | | (140 | ) | | | (253 | ) | | | (4,138 | ) |
| | | | | | | | | | | | | | | | | | | | |
Recoveries on loans previously charged off: | | | | | | | | | | | | | | | | | | | | |
Commerical, industrial and agricultural | | | 323 | | | | 346 | | | | 178 | | | | 381 | | | | 212 | |
Real estate | | | | | | | | | | | | | | | | | | | | |
1-4 family residential | | | 66 | | | | 15 | | | | 100 | | | | 281 | | | | 177 | |
1-4 family HELOC | | | 11 | | | | 25 | | | | 25 | | | | 354 | | | | 46 | |
Multifamily and commercial real estate | | | 18 | | | | 388 | | | | 49 | | | | 105 | | | | 157 | |
Construction, land development and farmland | | | 6 | | | | 7 | | | | 111 | | | | 250 | | | | 215 | |
Consumer | | | 12 | | | | — | | | | — | | | | 1 | | | | 3 | |
Other | | | — | | | | — | | | | — | | | | 1 | | | | — | |
| | | | | | | | | | | | | | | | | | | | |
Total loan recoveries | | | 436 | | | | 781 | | | | 463 | | | | 1,373 | | | | 810 | |
| | | | | | | | | | | | | | | | | | | | |
Net recoveries (charge-offs) | | | 291 | | | | 740 | | | | 323 | | | | 1,120 | | | | (3,328 | ) |
Provision for loan losses | | | 968 | | | | (270 | ) | | | (1,500 | ) | | | (350 | ) | | | 1,350 | |
| | | | | | | | | | | | | | | | | | | | |
Total allowance, December 31 | | $ | 9,082 | | | $ | 7,823 | | | $ | 7,353 | | | $ | 8,530 | | | $ | 7,760 | |
| | | | | | | | | | | | | | | | | | | | |
Gross loans at end of period(1) | | $ | 667,408 | | | $ | 617,497 | | | $ | 317,225 | | | $ | 286,620 | | | $ | 284,530 | |
| | | | | | | | | | | | | | | | | | | | |
Average gross loans(1) | | $ | 640,592 | | | $ | 517,148 | | | $ | 293,195 | | | $ | 283,276 | | | $ | 281,221 | |
| | | | | | | | | | | | | | | | | | | | |
Allowance to total loans | | | 1.36 | % | | | 1.27 | % | | | 2.32 | % | | | 2.98 | % | | | 2.73 | % |
| | | | | | | | | | | | | | | | | | | | |
Net charge offs (recoveries) to average loans | | | -0.05 | % | | | -0.14 | % | | | -0.11 | % | | | -0.40 | % | | | 1.18 | % |
| | | | | | | | | | | | | | | | | | | | |
(1) | | | | | | | | | | | | | | | | | | | | | | | | 2019 | | 2018 | | 2017 | | 2016 | | 2015 | | Beginning Balance, January 1 | $ | 10,892 |
| | $ | 9,731 |
| | $ | 9,082 |
| | $ | 7,823 |
| | $ | 7,353 |
| | Loans charged off: | | | | | | | | | | | Commercial, Industrial and Agricultural | (396 | ) | | (381 | ) | | (976 | ) | | (84 | ) | | — |
| | Real Estate: | | | | | | | | | | | 1-4 Family Residential | (29 | ) | | (36 | ) | | (14 | ) | | (25 | ) | | — |
| | 1-4 Family HELOC | — |
| | (6 | ) | | — |
| | — |
| | (6 | ) | | Multifamily and Commercial | — |
| | (76 | ) | | — |
| | — |
| | — |
| | Construction, Land Development and Farmland | (60 | ) | | (215 | ) | | (45 | ) | | — |
| | — |
| | Consumer | (50 | ) | | (26 | ) | | (36 | ) | | — |
| | (35 | ) | | Other | (35 | ) | | (47 | ) | | — |
| | (36 | ) | | — |
| | Total loans charged off | (570 | ) | | (787 | ) | | (1,071 | ) | | (145 | ) | | (41 | ) | | Recoveries on loans previously charged off: | | | | | | | | | | | Commercial, Industrial and Agricultural | 393 |
| | 590 |
| | 378 |
| | 323 |
| | 346 |
| | Real estate: | | | | | | | | | | | 1-4 Family Residential | 225 |
| | 12 |
| | — |
| | 66 |
| | 15 |
| | 1-4 Family HELOC | 12 |
| | 10 |
| | 19 |
| | 11 |
| | 25 |
| | Multifamily and Commercial | 65 |
| | 221 |
| | — |
| | 18 |
| | 388 |
| | Construction, Land Development and Farmland | — |
| | 44 |
| | 5 |
| | 6 |
| | 7 |
| | Consumer | 51 |
| | 34 |
| | 2 |
| | 12 |
| | — |
| | Other | 299 |
| | 2 |
| | — |
| | — |
| | — |
| | Total loan recoveries | 1,045 |
| | 913 |
| | 404 |
| | 436 |
| | 781 |
| | Net recoveries (charge-offs) | 475 |
| | 126 |
| | (667 | ) | | 291 |
| | 740 |
| | Provision for loan losses | 1,211 |
| | 1,035 |
| | 1,316 |
| | 968 |
| | (270 | ) | | Total allowance at end of period | $ | 12,578 |
| | $ | 10,892 |
| | $ | 9,731 |
| | $ | 9,082 |
| | $ | 7,823 |
| | Gross loans at end of period (1) | $ | 1,410,024 |
| | $1,231,067 | | $ | 772,450 |
| | $ | 667,408 |
| | $ | 617,497 |
| | Average gross loans (1) | $ | 1,298,922 |
| | $1,138,946 | | $ | 714,982 |
| | $ | 640,592 |
| | $ | 517,148 |
| | Allowance to total loans | 0.89 | % | | 0.88 | % | | 1.26 | % | | 1.36 | % | | 1.27 | % | | Net charge-offs (recoveries) to average loans (annualized) | (0.04 | )% | | (0.01 | )% | | 0.09 | % | | (0.05 | )% | | (0.14 | )% |
(1) Loan balances exclude loans held for sale. |
While no portion of the allowance is in any way restricted to any individual loan or group of loans and the entire allowance is available to absorb losses from any and all loans, theheld for sale.
The following table summarizes
our allocation of allowance for loan lossesthe ALLL by
loan category and
loansloans-held-for-investment in each category as a percentage of total loans, for the years presented.
| | | | | | | | | | | | | | | | | | | | | | | | | | | | | | | | | | | | |
| | | 2016 | | | 2015 | | | 2014 | |
| | | Amount | | | % of
Allowance
To Total | | | % of Loan
Type to
Total Loans | | | Amount | | | % of
Allowance
To Total | | | % of Loan
Type to
Total Loans | | | Amount | | | % of
Allowance
To Total | | | % of Loan
Type to
Total Loans | |
| | | | | | | | | |
Commerical, industrial and agricultural | | $ | 2,432 | | | | 26.8 | % | | | 20.1 | % | | $ | 2,198 | | | | 28.1 | % | | | 23.3 | % | | $ | 2,184 | | | | 29.7 | % | | | 25.5 | % |
Real estate: | | | | | | | | | | | | | | | | | | | | | | | | | | | | | | | | | | | | |
1-4 family residential | | | 1,178 | | | | 13.0 | % | | | 16.9 | % | | | 1,214 | | | | 15.5 | % | | | 17.9 | % | | | 642 | | | | 8.7 | % | | | 13.0 | % |
1-4 family HELOC | | | 704 | | | | 7.8 | % | | | 8.6 | % | | | 699 | | | | 8.9 | % | | | 8.0 | % | | | 854 | | | | 11.6 | % | | | 10.4 | % |
Multifamily and commercial real estate | | | 2,737 | | | | 30.1 | % | | | 32.3 | % | | | 2,591 | | | | 33.1 | % | | | 32.8 | % | | | 2,070 | | | | 28.2 | % | | | 35.6 | % |
Construction, land development and farmland | | | 1,786 | | | | 19.7 | % | | | 17.4 | % | | | 894 | | | | 11.4 | % | | | 14.6 | % | | | 742 | | | | 10.1 | % | | | 11.7 | % |
Consumer | | | 208 | | | | 2.3 | % | | | 2.6 | % | | | 192 | | | | 2.5 | % | | | 2.5 | % | | | 181 | | | | 2.5 | % | | | 3.7 | % |
Other | | | 37 | | | | 0.3 | % | | | 2.1 | % | | | 35 | | | | 0.5 | % | | | 0.9 | % | | | 2 | | | | 0.0 | % | | | 0.1 | % |
Unallocated | | | — | | | | 0.0 | % | | | 0.0 | % | | | — | | | | 0.0 | % | | | 0.0 | % | | | 678 | | | | 9.2 | % | | | 0.0 | % |
| | | | | | | | | | | | | | | | | | | | | | | | | | | | | | | | | | | | |
| | $ | 9,082 | | | | 100.0 | % | | | 100.0 | % | | $ | 7,823 | | | | 100.0 | % | | | 100.0 | % | | $ | 7,353 | | | | 100.0 | % | | | 100.0 | % |
| | | | | | | | | | | | | | | | | | | | | | | | | | | | | | | | | | | | |
| | | | | | | | | | | | | | | | | | | | | | | | |
| | | 2013 | | | 2012 | |
| | | Amount | | | % of
Allowance
To Total | | | % of Loan
Type to
Total Loans | | | Amount | | | % of
Allowance
To Total | | | % of Loan
Type to
Total Loans | |
| | | | | | |
Commerical, industrial and agricultural | | $ | 2,138 | | | | 25.1 | % | | | 29.6 | % | | $ | 1,318 | | | | 17.0 | % | | | 26.6 | % |
Real estate: | | | | | | | | | | | | | | | | | | | | | | | | |
1-4 family residential | | | 1,071 | | | | 12.6 | % | | | 13.5 | % | | | 2,319 | | | | 29.9 | % | | | 13.3 | % |
1-4 family HELOC | | | 865 | | | | 10.1 | % | | | 12.3 | % | | | 1,366 | | | | 17.6 | % | | | 14.9 | % |
Multifamily and commercial real estate | | | 1,581 | | | | 18.5 | % | | | 31.9 | % | | | 1,467 | | | | 18.9 | % | | | 34.8 | % |
Construction, land development and farmland | | | 553 | | | | 6.5 | % | | | 9.7 | % | | | 339 | | | | 4.4 | % | | | 6.8 | % |
Consumer | | | 257 | | | | 3.0 | % | | | 2.9 | % | | | 48 | | | | 0.6 | % | | | 3.5 | % |
Other | | | 13 | | | | 0.2 | % | | | 0.1 | % | | | 2 | | | | 0.0 | % | | | 0.1 | % |
Unallocated | | | 2,052 | | | | 24.0 | % | | | 0.0 | % | | | 901 | | | | 11.6 | % | | | 0.0 | % |
| | | | | | | | | | | | | | | | | | | | | | | | |
| | $ | 8,530 | | | | 100.0 | % | | | 100.0 | % | | $ | 7,760 | | | | 100.0 | % | | | 100.0 | % |
| | | | | | | | | | | | | | | | | | | | | | | | |
|
| | | | | | | | | | | | | | | | | | | | | | | | | | | | | | |
| | | December 31, 2019 | | December 31, 2018 | | December 31, 2017 |
| | | Amount | | % of Allowance To Total | | % of Loan Type to Total Loans | | Amount | | % of Allowance To Total | | % of Loan Type to Total Loans | | Amount | | % of Allowance To Total | | % of Loan Type to Total Loans |
| Commercial, Industrial and Agricultural | | $ | 2,529 |
| | 20.1 | % | | 17.4 | % | | $ | 1,751 |
| | 16.1 | % | | 17.4 | % | | $ | 2,538 |
| | 26.1 | % | | 18.0 | % |
| Real Estate: | | | | | | | | | | | | | | | | | | |
| 1-4 Family Residential | | 1,280 |
| | 10.2 | % | | 16.2 | % | | 1,333 |
| | 12.2 | % | | 18.3 | % | | 773 |
| | 7.9 | % | | 14.4 | % |
| 1-4 Family HELOC | | 624 |
| | 5.0 | % | | 6.8 | % | | 656 |
| | 6.0 | % | | 7.2 | % | | 595 |
| | 6.1 | % | | 9.3 | % |
| Multifamily and Commercial | | 5,285 |
| | 42.0 | % | | 38.1 | % | | 4,429 |
| | 40.6 | % | | 36.4 | % | | 3,166 |
| | 32.5 | % | | 33.8 | % |
| Construction, Land Development and Farmland | | 2,649 |
| | 21.0 | % | | 19.4 | % | | 2,500 |
| | 23.0 | % | | 17.9 | % | | 2,434 |
| | 25.0 | % | | 20.3 | % |
| Consumer | | 177 |
| | 1.4 | % | | 1.2 | % | | 184 |
| | 1.7 | % | | 1.7 | % | | 183 |
| | 1.9 | % | | 2.3 | % |
| Other | | 34 |
| | 0.3 | % | | 0.9 | % | | 39 |
| | 0.4 | % | | 1.1 | % | | 42 |
| | 0.5 | % | | 1.9 | % |
| | | $ | 12,578 |
| | 100.0 | % | | 100.0 | % | | $ | 10,892 |
| | 100.0 | % | | 100.0 | % | | $ | 9,731 |
| | 100.0 | % | | 100.0 | % |
|
| | | | | | | | | | | | | | | | | | | | |
| | | December 31, 2016 | | December 31, 2015 |
| | | Amount | | % of Allowance To Total | | % of Loan Type to Total Loans | | Amount | | % of Allowance To Total | | % of Loan Type to Total Loans |
| Commercial, Industrial and Agricultural | | $ | 2,432 |
| | 26.8 | % | | 20.1 | % | | $ | 2,198 |
| | 28.1 | % | | 23.3 | % |
| Real Estate: | | | | | | | | | | | | |
| 1-4 Family Residential | | 1,178 |
| | 13.0 | % | | 16.9 | % | | 1,214 |
| | 15.5 | % | | 18.0 | % |
| 1-4 Family HELOC | | 704 |
| | 7.8 | % | | 8.6 | % | | 699 |
| | 8.9 | % | | 8.0 | % |
| Multifamily and Commercial | | 2,737 |
| | 30.1 | % | | 32.3 | % | | 2,591 |
| | 33.1 | % | | 32.8 | % |
| Construction, Land Development and Farmland | | 1,786 |
| | 19.7 | % | | 17.4 | % | | 894 |
| | 11.4 | % | | 14.5 | % |
| Consumer | | 208 |
| | 2.3 | % | | 2.6 | % | | 192 |
| | 2.5 | % | | 2.5 | % |
| Other | | 37 |
| | 0.3 | % | | 2.1 | % | | 35 |
| | 0.4 | % | | 0.9 | % |
| | | $ | 9,082 |
| | 100.0 | % | | 100.0 | % | | $ | 7,823 |
| | 100.0 | % | | 100.0 | % |
Non-performing assets consist of
non-performing loans plus real estate acquired through foreclosure or deed in lieu of foreclosure.
Non-performing loans by definition consist of
non-accrual loans and loans past due 90 days or more and still accruing interest. When we place a loan on
non-accrual status, interest accruals cease, and uncollected interest is reversed and charged against current income. The interest on these loans is accounted for on the cash-basis, or cost-recovery method, until qualifying for return to accrual.
Loans are returned to accrual status when all the principal and interest amounts contractually due are brought current and future payments are reasonably assured.
The following table provides information with respect to the Company’s
non-performing assets.
| | | | | | | | | | | | | | | | | | | | |
| | | December 31, | |
| | | 2016 | | | 2015 | | | 2014 | | | 2013 | | | 2012 | |
| | | | | |
Non-accrual loans | | $ | 5,634 | | | $ | 5,004 | | | $ | 2,625 | | | $ | 3,570 | | | $ | 9,106 | |
Past due loans 90 days or more and still accruing interest | | | — | | | | — | | | | — | | | | — | | | | — | |
Restructured loans | | | 2,953 | | | | 1,706 | | | | 6,192 | | | | 5,455 | | | | 2,277 | |
| | | | | | | | | | | | | | | | | | | | |
Totalnon-performing loans | | | 8,587 | | | | 6,710 | | | | 8,817 | | | | 9,025 | | | | 11,383 | |
Other real estate | | | — | | | | 1,149 | | | | 1,204 | | | | 1,375 | | | | 1,455 | |
| | | | | | | | | | | | | | | | | | | | |
Totalnon-performing assets | | $ | 8,587 | | | $ | 7,859 | | | $ | 10,021 | | | $ | 10,400 | | | $ | 12,838 | |
| | | | | | | | | | | | | | | | | | | | |
Totalnon-performing loans as a percentage of total loans | | | 1.29 | % | | | 1.09 | % | | | 2.78 | % | | | 3.15 | % | | | 4.00 | % |
Totalnon-performing assets as a percentage of total assets | | | 0.94 | % | | | 0.90 | % | | | 2.23 | % | | | 2.70 | % | | | 3.34 | % |
Allowance for loan losses as a percentage ofnon-performing loans | | | 105.76 | % | | | 116.59 | % | | | 83.40 | % | | | 94.52 | % | | | 68.17 | % |
|
| | | | | | | | | | | | | | | | | | | | |
| | | December 31, 2019 | | December 31, 2018 | | December 31, 2017 | | December 31, 2016 | | December 31, 2015 |
| Non-accrual loans | | $ | 4,071 |
| | $ | 4,194 |
| | $ | 5,161 |
| | $ | 5,634 |
| | $ | 5,004 |
|
| Past due loans 90 days or more and still accruing interest | | 64 |
| | 6 |
| | — |
| | — |
| | — |
|
| Restructured loans | | 1,799 |
| | 2,469 |
| | 2,170 |
| | 2,953 |
| | 1,706 |
|
| Total non-performing loans | | 5,934 |
| | 6,669 |
| | 7,331 |
| | 8,587 |
| | 6,710 |
|
| Foreclosed real estate ("OREO") | | 750 |
| | 1,000 |
| | — |
| | — |
| | 1,149 |
|
| Total non-performing assets | | $ | 6,684 |
| | $ | 7,669 |
| | $ | 7,331 |
| | $ | 8,587 |
| | $ | 7,859 |
|
| Total non-performing loans as a percentage of total loans | | 0.42 | % | | 0.54 | % | | 0.95 | % | | 1.29 | % | | 1.09 | % |
| Total non-performing assets as a percentage of total assets | | 0.35 | % | | 0.44 | % | | 0.65 | % | | 0.94 | % | | 0.90 | % |
| Allowance for loan losses as a percentage of non-performing loans | | 211.96 | % | | 163.32 | % | | 132.74 | % | | 105.76 | % | | 116.59 | % |
Investment Securities and Other Earning Assets
The investment securities portfolio is intended to provide the
CompanyBank with
adequatea liquidity, meet customer collateral needs, provide flexible asset/liability management and a source of stable income. The portfolio
is structured with minimal credit exposure to the Company and consists of securities classified as
available-for-sale. All
available-for-sale securities are carried at fair value and may be used for liquidity purposes should management deem it to be in our best interest. Unrealized gains and losses
on this portfolio are excluded from earnings, but are reported as other comprehensive income in a separate component of stockholders’ equity, net of income tax. Premium amortization and discount accretion are recognized as adjustments to interest income using the interest method. Realized gains or losses on sales are based on the net proceeds and the adjusted carrying value amount of the securities sold using the specific identification method.
Securities are a component of the Company’s earning assets.
Securities totaled
$146,813$260,293 at December 31,
2016.2019. This represents a
9.7% increase12.2% decrease from the December 31,
20152018 total of
$133,825. The increase is attributable$296,323. During 2019, the Company reduced its investment portfolio by $98,232. $48,108 of the proceeds was used to
purchasing $59,332purchase investment securities
available for sale duringand the
year ended December 31, 2016, offset by sales, principal paydownsremainder funded loan growth and
maturities of $41,037 during the same period.reduced wholesale funding.
Restricted equity securities totaled
$7,133$11,279 at December 31,
2016.2019. This represents a
14.2% increase3.5% decrease from the December 31,
20152018 total of
$6,244.$11,690. Restricted securities consist of Federal Reserve Bank and
Federal Home Loan BankFHLB stock.
The following table
showssummarizes the Company’s
investments’investment portfolio at amortized cost and fair value, aggregated by investment category for the periods presented:
| | | | | | | | | | | | | | | | | | | | | | | | | | | | | | | | | | | | |
| | | December 31, 2016 | | | December 31, 2015 | | | December 31, 2014 | |
| Available-For-Sale | | Amortized
Cost | | | Fair Value | | | % of Total | | | Amortized
Cost | | | Fair Value | | | % of Total | | | Amortized
Cost | | | Fair Value | | | % of Total | |
| | | | | | | | | |
U.S.Treasury and other U.S. government agencies | | $ | 1,909 | | | | 1,908 | | | | 1.30 | % | | $ | 4,918 | | | | 4,836 | | | | 3.61 | % | | $ | 4,758 | | | | 4,628 | | | | 8.53 | % |
State and municipal | | | 122,813 | | | | 119,634 | | | | 81.49 | % | | | 86,604 | | | | 87,595 | | | | 65.46 | % | | | 35,952 | | | | 36,209 | | | | 66.70 | % |
Corporate bonds | | | 2,000 | | | | 1,987 | | | | 1.35 | % | | | 2,000 | | | | 1,979 | | | | 1.48 | % | | | 1,000 | | | | 1,007 | | | | 1.85 | % |
Mortgage backed securities | | | 20,197 | | | | 20,034 | | | | 13.65 | % | | | 36,617 | | | | 36,165 | | | | 27.02 | % | | | 9,933 | | | | 9,942 | | | | 18.31 | % |
Time deposits | | | 3,250 | | | | 3,250 | | | | 2.21 | % | | | 3,250 | | | | 3,250 | | | | 2.43 | % | | | 2,500 | | | | 2,500 | | | | 4.61 | % |
| | | | | | | | | | | | | | | | | | | | | | | | | | | | | | | | | | | | |
| | | | | | | | | |
Total | | $ | 150,169 | | | | 146,813 | | | | 100.00 | % | | $ | 133,389 | | | | 133,825 | | | | 100.00 | % | | $ | 54,143 | | | | 54,286 | | | | 100.00 | % |
| | | | | | | | | | | | | | | | | | | | | | | | | | | | | | | | | | | | |
| | | | | | | | | |
Held-To-Maturity | | | | | | | | | | | | | | | | | | | | | | | | | | | | | | | | | | | | |
| | | | | | | | | |
U.S.Treasury and other U.S. government agencies | | $ | — | | | | — | | | | — | | | $ | — | | | | — | | | | — | | | $ | 21,016 | | | | 20,675 | | | | 91.26 | % |
Corporate bonds | | | — | | | | — | | | | — | | | | — | | | | — | | | | — | | | | 1,943 | | | | 1,980 | | | | 8.74 | % |
| | | | | | | | | | | | | | | | | | | | | | | | | | | | | | | | | | | | |
| | | | | | | | | |
Total | | $ | — | | | | — | | | | — | | | $ | — | | | | — | | | | — | | | $ | 22,959 | | | | 22,655 | | | | 100.00 | % |
| | | | | | | | | | | | | | | | | | | | | | | | | | | | | | | | | | | | |
|
| | | | | | | | | | | | | | | | | | | | | | | | | | | | | | |
| | | December 31, 2019 | | December 31, 2018 | | December 31, 2017 |
| | | Amortized Cost | | Fair Value | | % of Total | | Amortized Cost | | Fair Value | | % of Total | | Amortized Cost | | Fair Value | | % of Total |
| U.S. Treasury and other U.S. government agencies | | $ | 59 |
| | 59 |
| | 0.02 | % | | $ | 568 |
| | 554 |
| | 0.19 | % | | $ | 586 |
| | 578 |
| | 0.26 | % |
| State and municipal | | 186,283 |
| | 196,660 |
| | 75.56 | % | | 232,589 |
| | 229,298 |
| | 77.38 | % | | 189,576 |
| | 191,752 |
| | 87.08 | % |
| Corporate bonds | | 7,880 |
| | 7,845 |
| | 3.01 | % | | 3,130 |
| | 3,017 |
| | 1.02 | % | | 1,500 |
| | 1,492 |
| | 0.68 | % |
| Mortgage backed securities | | 38,126 |
| | 37,761 |
| | 14.51 | % | | 32,172 |
| | 31,958 |
| | 10.78 | % | | 6,262 |
| | 6,169 |
| | 2.80 | % |
| Asset backed securities | | 18,374 |
| | 17,968 |
| | 6.90 | % | | 28,635 |
| | 27,996 |
| | 9.45 | % | | 16,753 |
| | 16,710 |
| | 7.59 | % |
| Time deposits | | — |
| | — |
| | — | % | | 3,500 |
| | 3,500 |
| | 1.18 | % | | 3,500 |
| | 3,500 |
| | 1.59 | % |
| Total | | $ | 250,722 |
| | 260,293 |
| | 100.00 | % | | $ | 300,594 |
| | 296,323 |
| | 100.00 | % | | $ | 218,177 |
| | 220,201 |
| | 100.00 | % |
The table below summarizes the maturities and yield characteristics of the Company’savailable-for-sale securities
portfolio as of December 31,
2016.2019. Expected maturities will differ from contractual maturities because borrowers may have the right to call or prepay obligations with or without call or prepayment penalties.
| | | | | | | | | | | | | | | | | | | | | | | | | | | | | | | | | | | | | | | | |
| | | One year or less | | | Over one year
through five years | | | Over five year through
ten years | | | Over ten years | | | Total | |
| | | Fair Value | | | Yield | | | Fair Value | | | Yield | | | Fair Value | | | Yield | | | Fair Value | | | Yield | | | Fair Value | | | Yield | |
Available-For-Sale | | | | | | | | | | | | | | | | | | | | | | | | | | | | | | | | | | | | | | | | |
U.S.Treasury and other U.S. government agencies | | $ | — | | | | — | | | $ | 1,043 | | | | 2.02 | % | | $ | 611 | | | | 2.19 | % | | $ | 254 | | | | 1.37 | % | | $ | 1,908 | | | | 1.99 | % |
State and municipal | | | 1,133 | | | | 2.72 | % | | | 15,944 | | | | 2.62 | % | | | 9,958 | | | | 3.56 | % | | | 92,599 | | | | 4.25 | % | | | 119,634 | | | | 3.96 | % |
Corporate bonds | | | — | | | | — | | | | 1,490 | | | | 1.64 | % | | | — | | | | — | | | | 497 | | | | 3.48 | % | | | 1,987 | | | | 2.10 | % |
Mortgage backed securities | | | — | | | | — | | | | 222 | | | | 0.80 | % | | | 4,737 | | | | 1.99 | % | | | 15,075 | | | | 2.17 | % | | | 20,034 | | | | 2.11 | % |
Time deposits | | | — | | | | — | | | | 3,250 | | | | 2.18 | % | | | — | | | | — | | | | — | | | | — | | | | 3,250 | | | | 2.18 | % |
| | | | | | | | | | | | | | | | | | | | | | | | | | | | | | | | | | | | | | | | |
Total | | $ | 1,133 | | | | 2.72 | % | | $ | 21,949 | | | | 2.44 | % | | $ | 15,306 | | | | 3.02 | % | | $ | 108,425 | | | | 3.95 | % | | $ | 146,813 | | | | 3.63 | % |
| | | | | | | | | | | | | | | | | | | | | | | | | | | | | | | | | | | | | | | | |
|
| | | | | | | | | | | | | | | | | | | | | | | | | | | | | | | | | | | |
| | | One year or less | | Over one year through five years | | Over five year through ten years | | Over ten years | | Total |
| | | Fair Value | | Yield | | Fair Value | | Yield | | Fair Value | | Yield | | Fair Value | | Yield | | Fair Value | | Yield |
| U.S.Treasury and other U.S. government agencies | | $ | — |
| | — |
| | $ | 59 |
| | 2.03 | % | | $ | — |
| | — | % | | $ | — |
| | — | % | | $ | 59 |
| | 2.03 | % |
| State and municipal | | — |
| | — | % | | 221 |
| | 5.43 | % | | 5,989 |
| | 4.09 | % | | 190,450 |
| | 3.92 | % | | 196,660 |
| | 3.92 | % |
| Corporate bonds | | 999 |
| | 2.58 | % | | 2,000 |
| | 6.34 | % | | 4,846 |
| | 4.22 | % | | — |
| | — |
| | 7,845 |
| | 4.55 | % |
| Mortgage backed securities | | — |
| | — | % | | 2,114 |
| | 3.18 | % | | 970 |
| | 2.02 | % | | 34,677 |
| | 3.29 | % | | 37,761 |
| | 3.25 | % |
| Asset backed securities | | — |
| | — |
| | 469 |
| | 2.50 | % | | 1,428 |
| | 2.49 | % | | 16,071 |
| | 2.78 | % | | 17,968 |
| | 2.75 | % |
| Total | | $ | 999 |
| | 2.58 | % | | $ | 4,863 |
| | 4.50 | % | | $ | 13,233 |
| | 3.81 | % | | $ | 241,198 |
| | 3.75 | % | | $ | 260,293 |
| | 3.77 | % |
Securities pledged at December 31,
20162019 and
20152018 had a carrying amount of
$36,292$46,918 and
$39,815$70,097 and were pledged to secure
public depositsFHLB advances and
repurchase agreements.municipal deposits.
At December 31,
20162019 and
2015,2018, there were no holdings of securities of any one issuer
other than U.S. government-sponsored entities and agencies, in an amount greater than 10% of stockholders’ equity.
Premises and equipment, net, totaled
$9,093$21,376 at December 31,
20162019 compared to
$9,196$22,033 at December 31,
2015,2018, a net decrease of
$103$657 or
1.1%3.0%. Asset purchases amounted to approximately
$873$1,339 during the year ended
2016December 31, 2019 while related depreciation expense amounted to
$976.$1,996. At December 31,
2016,2019, we operated
from seven17 retail
branchbanking locations as well as
twofive stand-alone mortgage loan production
offices and one commercial loan production office. Two of our bank branch locations, including our main office, are in Brentwood, Tennessee. Our other five bank branch locations are in Franklin, Springfield, Gallatin and Nashville, Tennessee. Our commercial loan productionoffice is in Murfreesboro, Tennessee. As ofoffices. Please refer to Item 2, Properties for additional information.
Deposits
At December 31,
2016, our mortgage loan production offices2019, total deposits were
located Hendersonville, Tennessee, as well as Timonium, Maryland.$1,583,789, an increase of $145,886, or 10.1%, compared to $1,437,903 at December 31, 2018. During the year ended December 31,
2016, the Company transitioned most of itout-of-market branches to another bank. Until the Merger, all of our facilities were leased. After the Merger,2019, we
own three branch and office facilities located in Robertson and Sumner counties of Tennessee.Deposits
Deposits represent the Company’s largest source of funds. The Company competes with other bank and nonbank institutions forincreased non-interest bearing deposits as well as with a growing number ofnon-deposit investment alternatives available to depositors such as money market funds and other brokerage investment products. Challenges to deposit growth include price changes on deposit products given movements in theby $43.1 million or 19.9%, interest rate environment and other competitive pricing pressures, and customer preferences regarding higher-costing deposit products ornon-deposit investment alternatives.
At December 31, 2016, total deposits were $763,834, an increase of $123,826, or 19.3%, compared to $640,008 at December 31, 2015. During the year ended December 31, 2016, we increasednon-interest bearing demand deposits decreased by $23.5$1.5 million, or 21.1%1.0%, increased savings and money market deposits by $2.5$7.4 million, or 1.4%1.8% and increased time deposits by $107.8$96.8 million, or 42.8%, while interest bearing demand deposits decreased $9.9 million, or 10.4%14.6%. A large portion of theThe increase in time deposits relatedis in part due to obtaining certificates of deposita shift in funding from the state of Tennessee of which the proceeds were usedFHLB advances to repay Federal Home Loan Bank advances.wholesale deposits. We are continuing to focus on growth of ournon-interest bearing deposits and using alternative sources of funds to better manage our cost of funds. As of December 31, 2016,2019, non-interest bearing deposits represent 17.6%16.4% of total deposits.
The average amounts for deposits for
2016, 20152019, 2018 and
20142017 are detailed in the following schedule (in thousands, except for percentages).
| | | | | | | | | | | | | | | | | | | | | | | | |
| | | 2016 | | | 2015 | | | 2014 | |
| | | Average
Balance | | | Average
Rate | | | Average
Balance | | | Average
Rate | | | Average
Balance | | | Average
Rate | |
| | | | | | |
Non-interest-bearing deposits | | $ | 127,619 | | | | 0.00 | % | | $ | 83,731 | | | | 0.00 | % | | $ | 45,103 | | | | 0.00 | % |
Interest bearing demand | | | 88,775 | | | | 0.21 | % | | | 88,857 | | | | 0.21 | % | | | 51,662 | | | | 0.29 | % |
Savings and money market | | | 186,473 | | | | 0.34 | % | | | 158,670 | | | | 0.29 | % | | | 116,434 | | | | 0.28 | % |
Time deposits-retail | | | 159,351 | | | | 0.70 | % | | | 116,364 | | | | 0.76 | % | | | 33,640 | | | | 1.13 | % |
Time deposits-wholesale | | | 102,626 | | | | 0.70 | % | | | 95,719 | | | | 0.56 | % | | | 76,627 | | | | 0.54 | % |
| | | | | | | | | | | | | | | | | | | | | | | | |
| | | | | | |
| | $ | 664,844 | | | | 0.40 | % | | $ | 543,341 | | | | 0.38 | % | | $ | 323,466 | | | | 0.39 | % |
| | | | | | | | | | | | | | | | | | | | | | | | |
|
| | | | | | | | | | | | | | | | | | | | | |
| | | 2019 | | 2018 | | 2017 |
| | | Average Balance | | Average Rate | | Average Balance | | Average Rate | | Average Balance | | Average Rate |
| Non-interest-bearing deposits | | $ | 231,228 |
| | — | % | | $ | 218,867 |
| | — | % | | $ | 134,408 |
| | — | % |
| Interest bearing demand | | 146,518 |
| | 0.26 | % | | 146,717 |
| | 0.25 | % | | 84,171 |
| | 0.21 | % |
| Savings and money market | | 376,927 |
| | 1.10 | % | | 349,986 |
| | 0.74 | % | | 196,939 |
| | 0.38 | % |
| Time deposits-retail | | 559,404 |
| | 2.10 | % | | 531,780 |
| | 1.55 | % | | 319,456 |
| | 0.98 | % |
| Time deposits-wholesale | | 227,010 |
| | 2.48 | % | | 90,510 |
| | 1.77 | % | | 88,114 |
| | 1.10 | % |
| Total deposits | | $ | 1,541,087 |
| | 1.42 | % | | $ | 1,337,860 |
| | 0.96 | % | | $ | 823,088 |
| | 0.61 | % |
The following table shows maturity of time deposits of
$100,000$250,000 or more by category based on time remaining until maturity.
| | | | |
| | | December 31,
2016 | |
Three months or less | | $ | 187,933 | |
Over three months through six months | | | 8,141 | |
Over six months through 12 months | | | 25,247 | |
Over one year through three years | | | 44,530 | |
Over three years through five years | | | 13,744 | |
Over five years | | | — | |
| | | | |
Total | | $ | 279,595 | |
| | | | |
|
| | | |
| | December 31, 2019 |
| Three months or less | $ | 169,183 |
|
| Over three months through six months | 9,289 |
|
| Over six months through 12 months | 33,441 |
|
| Over one year through three years | 22,913 |
|
| Over three years through five years | 3,178 |
|
| Over five years | — |
|
| Total | $ | 238,004 |
|
Market and Liquidity Risk Management
Our objective is to manage assets and liabilities to provide a satisfactory, consistent level of profitability within the framework of established liquidity, loan, investment, borrowing, and capital policies. Our Asset Liability Management Committee (ALCO) is charged with the responsibility of monitoring these policies, which are designed to ensure acceptable composition of asset/liability mix. Two critical areas of focus for ALCO are interest rate sensitivity and liquidity risk management.
InterestRateSensitivity—Interest rate sensitivity refers to the responsiveness of interest-earning assets and interest-bearing liabilities to changes in market interest rates. In the normal course of business, we are exposed to market risk arising from fluctuations in interest rates. ALCO measures and evaluates the interest rate risk so that we can meet customer demands for various types of loans and deposits. ALCO determines the most appropriate amounts ofon-balance sheet andoff-balance sheet items.items to maximize long-term earnings and mitigate interest rate risk. Measurements we use to help us manage interest rate sensitivity include a gap analysis, an earnings simulation model and an economic value of equity model. These measurements are used in conjunction with competitive pricing analysis and are further described below.
InterestRateSensitivityGapAnalysis—The rate sensitive position, or gap, is the difference in the volume of rate-sensitive assets and liabilities, at a given time interval, including both floating rate instruments and instruments which are approaching maturity. The measurement of our interest rate sensitivity, or gap, is one of the three principal techniques we use in our asset/liability management effort. Our policy is to have 12 and
24-month cumulative repricing gaps that do not exceed
25%15% of assets. We were in compliance with our policy as of December 31,
2016.2019. Although we do monitor our gap on a periodic basis, we recognize the potential shortcomings of such a model. The static nature of the gap schedule makes it difficult to incorporate changes in behavior that are caused by changes in interest rates. Also, although the periods of estimated and contractual repricing are identified in the analysis, the extent of repricing is not modeled in the gap schedule (i.e. whether repricing is expected to move on a
one-to-one or other basis in relationship to the market changes simulated). For these and other shortcomings, we rely more heavily on the earnings simulation model and the economic value of equity model discussed further below.
EarningsSimulationModel—We believe interest rate risk is effectively measured by our earnings simulation modeling. Earning assets, interest-bearing liabilities andoff-balance sheet financial instruments are combined with simulated forecasts of interest rates for the next 12 months and 24 months. To limit interest rate risk, we have guidelines for our earnings at risk which seek to
limit the variance of net interest income in instantaneous changes to interest rates. We also periodically monitor simulations based on various rate scenarios such as
non-parallel shifts in market interest rates over time. For changes up or down in rates from
management’sa flat interest rate forecast over the next 12 and 24 months,
limits in the declineour estimated change in net interest income
as well as our policy limits are as follows:
| | | | | | | | | | | | | | | | |
| | | Maximum Percentage Decline in Net Interest Income from the Budgeted or
Base Case Projection of Net Interest Income | |
| | | Next 12
Months | | | Next 24
Months | |
| | | Estimate | | | Policy | | | Estimate | | | Policy | |
-200 bp | | | -5.1 | % | | | -15 | % | | | -12.2 | % | | | -15 | % |
-100 bp | | | -2.2 | % | | | -10 | % | | | -5.4 | % | | | -10 | % |
+100 bp | | | -0.1 | % | | | -10 | % | | | 0.1 | % | | | -10 | % |
+200 bp | | | 0.0 | % | | | -15 | % | | | 0.2 | % | | | -15 | % |
+300 bp | | | 0.1 | % | | | -20 | % | | | 0.1 | % | | | -20 | % |
+400 bp | | | 0.0 | % | | | -25 | % | | | 0.1 | % | | | -25 | % |
|
| | | | | | | | |
| Instantaneous, Parallel Change in Prevailing Interest Rates Equal to | | Estimated Change in Net Interest Income and Policy of Maximum Percentage Decline in Net Interest Income |
| | | Next 12 | | Next 24 |
| | | Months | | Months |
| | | Estimate | | Policy | | Estimate | | Policy |
| -200 bp | | (1.2)% | | (15)% | | (7.2)% | | (15)% |
| -100 bp | | 0.1% | | (10)% | | (3.0)% | | (10)% |
| +100 bp | | 0.8% | | (10)% | | 2.1% | | (10)% |
| +200 bp | | 2.5% | | (15)% | | 5.0% | | (15)% |
| +300 bp | | 4.4% | | (20)% | | 7.9% | | (20)% |
| +400 bp | | 6.1% | | (25)% | | 10.7% | | (25)% |
We were in compliance with the earnings simulation model policies monitored by the Bank as of December 31,
2016,2019, indicating what we believe to be a fairly neutral profile.
Economicvalueofequity—Our economic value of equity model measures the extent that estimated economic values of our assets, liabilities andoff-balance sheet items will change as a result of interest rate changes. Economic values are determined by discounting expected cash flows from assets, liabilities andoff-balance sheet items, which establishes a base case economic value of equity. To help monitor our related risk, we’ve established the following policy limits regarding simulated changes in our economic value of equity:
| |
| | |
Instantaneous, Parallel Change in Prevailing Interest Rates Equal to | | Maximum Percentage Decline in Economic Value of
Equity from the Economic Value of Equity at
Currently Prevailing Interest Rates | |
±100-200 bp
| | | 15 | % 25% |
±200-100 bp
| | | 25 | % 15% |
±300+100 bp
| | | 30 | % 15% |
±400+200 bp
| | | 35 | % 25% |
Non-parallel shifts
+300 bp | | 30% |
| +400 bp | 35 | % 35% |
| Non-parallel shifts | | 35% |
At December 31,
2016,2019, our model
results indicated that we were within these policy limits.
Each of the above analyses may not, on its own, be an accurate indicator of how our net interest income will be affected by changes in interest rates. Income associated with interest-earning assets and costs associated with interest-bearing liabilities may not be affected uniformly by changes in interest rates. In addition, the magnitude and duration of changes in interest rates may have a significant impact on net interest income. For example, although certain assets and liabilities may have similar maturities or periods of repricing, they may react in different degrees to changes in market interest rates. Interest rates on certain types of assets and liabilities fluctuate in advance of changes in general market rates, while interest rates on other types may lag behind changes in general market rates. In addition, certain assets, such as adjustable rate mortgage loans, have features (generally referred to as interest rate caps and floors) which limit changes in interest rates. Prepayment and early withdrawal levels also could deviate significantly from those assumed in calculating the maturity of certain instruments. The ability of many borrowers to service their debts also may decrease during periods of rising interest rates. Our ALCO reviews each of the above interest rate sensitivity analyses along with several different interest rate scenarios as part of its responsibility to provide a satisfactory, consistent level of profitability within the framework of established liquidity, loan, investment, borrowing, and capital policies.
Interest Rate Sensitivity
The following schedule details the Company’s interest rate sensitivity at December 31, 2019:
|
| | | | | | | | | | | | | | | | | | | | |
| | | | | Repricing Within |
| | | Total | | 1-90 days | | 3 months to 12 months | | 1 to 5 years | | Over 5 years |
| Earning assets: | | | | | | | | | |
| | Loans-Held-for-Investment (1) | $ | 1,410,024 |
| | $ | 188,508 |
| | $ | 172,059 |
| | $ | 757,359 |
| | $ | 292,098 |
|
| | Available for sale securities | 260,293 |
| | 47,202 |
| | — |
| | 7,245 |
| | 205,846 |
|
| | Mortgage loans held for sale | 37,476 |
| | 8,928 |
| | — |
| | — |
| | 28,548 |
|
| | Deposits with banks | 43,036 |
| | 43,036 |
| | — |
| | — |
| | — |
|
| | Federal funds sold and other | 52 |
| | 52 |
| | — |
| | — |
| | — |
|
| | | | | | | | | | | |
| | Total earning assets | 1,750,881 |
| | 287,726 |
| | 172,059 |
| | 764,604 |
| | 526,492 |
|
| | | | | | | | | | | |
| Interest-bearing liabilities: | | | | | | | | | |
| | Interest-bearing demand accounts | 152,718 |
| | 152,718 |
| | — |
| | — |
| | — |
|
| | Savings and money market accounts | 408,724 |
| | 408,724 |
| | — |
| | — |
| | — |
|
| | Time deposits (2) | 762,274 |
| | 313,021 |
| | 243,633 |
| | 205,620 |
| | — |
|
| | Federal funds purchased | — |
| | — |
| | — |
| | — |
| | — |
|
| | Subordinated debt | 70,883 |
| | 883 |
| | — |
| | 70,000 |
| | — |
|
| | Federal Home Loan Bank advances | 10,737 |
| | 7,000 |
| | — |
| | 3,737 |
| | — |
|
| | | | | | | | | | | |
| | Total interest-bearing liabilities | 1,405,336 |
| | 882,346 |
| | 243,633 |
| | 279,357 |
| | — |
|
| | | | | | | | | | | |
| | Interest-sensitivity gap | $ | 345,545 |
| | $ | (594,620 | ) | | $ | (71,574 | ) | | $ | 485,247 |
| | $ | 526,492 |
|
| | | | | | | | | | | |
| | Cumulative gap | | | $ | (594,620 | ) | | $ | (666,194 | ) | | $ | (180,947 | ) | | $ | 345,545 |
|
| | | | | | | | | | | |
| | Interest -sensitivity gap as % of total average assets | | | (33.05 | )% | | (3.98 | )% | | 26.97 | % | | 29.27 | % |
| | | | | | | | | | | |
| | Cumulative gap as % of total average assets | | | (33.05 | )% | | (37.03 | )% | | (10.06 | )% | | 19.21 | % |
| |
| (1) | Loans, net of unearned income excludes non-accrual loans |
| |
| (2) | We moved $100,000 of time deposits from the 1-90 days to the 1-5 years due to the swap maturity. |
LiquidityRiskManagement—The purpose of liquidity risk management is to ensure that there are sufficient cash flows to satisfy loan demand, deposit withdrawals, and our other needs. Traditional sources of liquidity for a bank include asset maturities and growth in core deposits. A bank may achieve its desired liquidity objectives from the management of its assets and liabilities and by internally generated funding through its operations. Funds invested in marketable instruments that can be readily sold and the continuous maturing of other earning assets are sources of liquidity from an asset perspective. The liability base provides sources of liquidity through attraction of increased deposits and borrowing funds from various other institutions.
Changes in interest rates also affect our liquidity position. We currently price deposits in response to market rates and our management intends to continue this policy. If deposits are not priced in response to market rates, a loss of deposits could occur which would negatively affect our liquidity position.
Scheduled loan payments are a relatively stable source of funds, but loan payoffs and deposit flows fluctuate significantly, being influenced by interest rates, general economic conditions and competition. Additionally, debt security investments are subject to prepayment and call provisions that could accelerate their payoff prior to stated maturity. We attempt to price our deposit products to meet our asset/liability objectives consistent with local market conditions. Our ALCO is responsible for monitoring our ongoing liquidity needs. Our regulators also monitor our liquidity and capital resources on a periodic basis.
The Company has established a line of credit with the
Federal Home BankFHLB of Cincinnati which is secured by a blanket pledge of cash deposits,
1-4 family residential mortgages, multi-family residential, home equity loans, and
available-for-sale securities.
At December 31,
2016, Federal Home Loan Bank2019, FHLB advances totaled
$32,287$10,737 compared to
$135,759$57,498 as of December 31,
2015.2018. The decrease in FHLB advances
is substantially attributablewas due to
obtaining lower cost funding from certificates of deposit issued by the
state of Tennessee.increase in wholesale time deposits.
At December 31,
2016,2019, the scheduled maturities of these advances and interest rates were as follows (scheduled maturities will differ from scheduled repayments):
| | | | | | | | |
Scheduled Maturities | | Amount | | | Weighted
Average
Rates | |
| | |
2017 | | $ | 20,000 | | | | 0.66 | % |
2018 | | | 6,000 | | | | 2.74 | % |
2019 | | | — | | | | 0.00 | % |
2020 | | | — | | | | 0.00 | % |
2021 | | | 519 | | | | 2.73 | % |
Thereafter | | | 5,768 | | | | 1.86 | % |
| | | | | | | | |
| | |
| | $ | 32,287 | | | | 1.29 | % |
| | | | | | | | |
|
| | | | | | |
| Scheduled Maturities | | Amount | | Weighted Average Rates |
| 2020 | | $ | 7,000 |
| | 1.65% |
| 2021 | | 323 |
| | 2.73% |
| 2022 | | 557 |
| | 1.22% |
| 2023 | | 2,342 |
| | 1.94% |
| 2024 | | 515 |
| | 2.49% |
| Thereafter | | — |
| | —% |
| | | | | |
| | | $ | 10,737 |
| | 1.76% |
Stockholders’ equity was $106,919$223,753 at December 31, 2016,2019, an increase of $10,168,$15,339, or 10.5%7.4%, from $96,751$208,414 at December 31, 2015.2018. The Company raised $4.8 million$439 of capital through the exercise of Company stock options during the year ended December 31, 2016. The2019. In December 2019, $13,796 of the subordinated debentures issued and the additional capital wasfrom the stock option exercises during the year were pushed-down to the Bank and when combined with the accretion of earnings to capital but offset by the declared dividends and the increase in assets, led to an increase in the Bank’s December 31, 20162019 Tier 1 leverage ratio to 10.75%10.30% compared with 9.88%10.17% at December 31, 20152018 (see other ratios discussed further below). Additionally, the subordinated debentures qualify as Tier 1 and Total risk-based capital for the Company subject to limitations. Common dividends of $1,489 (declared during$4,013 (of which $1,036 were declared in the fourth quarter of 2015)prior year) were paid during the first quarter of 2016. As ofyear ended December 31, 2016,2019.
On December 4, 2018, the Company announced that its board of directors has authorized a stock repurchase plan pursuant to which the Company may purchase up to $12 million of shares of the Company’s outstanding common dividendsstock, par value $1.00 per share. Stock repurchases under the plan will be made from time to time in the open market or privately negotiated transactions, or otherwise, at the discretion of $1,711 were declaredmanagement of the Company and in accordance with applicable legal requirements. As part of this plan, the Company purchased 365,931 shares for $8,291 during 2019.
On July 14, 2017, the Company filed a Form S-3 registration statement to
offer, issue and sell from time to time in one or more offerings any combination of (i) common stock, (ii) preferred stock, (iii) debt securities, (iv) depositary shares, (v) warrants, and (vi) units, up to a maximum aggregate offering price of $75,000,000. The net proceeds from any offering will be
paid duringused for general corporate purposes including acquisitions, capital expenditures, investments, and the
first quarterrepayment, redemption, or refinancing of
2017.any indebtedness or other securities. Until allocated to such purposes it is expected that we will invest any proceeds in short-term, interest-bearing instruments or other investment-grade securities.
Banks as regulated institutions are required to meet certain levels of capital. The Federal Reserve Board of Governors, the primary federal regulator for the Bank, has adopted minimum capital regulations or guidelines that categorize components and the level of risk associated with various types of assets. Financial institutions are expected to maintain a level of capital commensurate with
the risk profile assigned to their assets in accordance with the guidelines. We regularly review our capital adequacy to ensure compliance with these guidelines and to help ensure that sufficient capital is available for current and future needs. It is management’s intent to maintain an optimal capital and leverage mix for growth and for shareholder return.
Prompt corrective action regulations provide five classifications: well capitalized, adequately capitalized, undercapitalized, significantly undercapitalized, and critically undercapitalized, although these terms are not used to represent overall financial condition. If adequately capitalized, regulatory approval is required to accept brokered deposits. If undercapitalized, capital distributions are limited, as is asset growth and expansion, and capital restoration plans are required. At December 31,
2016,2019, the most recent regulatory notifications categorized the Bank as well capitalized under the regulatory framework for prompt corrective action. There are no conditions or events since that
notifications that management believes have changed the institution’s category. There are no conditions or events since that notification that management believes have changed the institution’s category.
Under these rules, the leverage and risk-based capital ratios of bank holding companies may not be lower than the leverage and risk-based capital ratios for insured depository institutions. The final rules implementing Basel III became effective on January 1, 2015, and include new minimum risk-based capital and leverage ratios and a new common equity tier 1 ratio. In addition, these rules refine the definition of what constitutes capital for purposes of calculating those ratios, including the definitions of Tier 1 capital and Tier 2 capital.
Basel III establishes a “capital conservation buffer” of 2.5% which began phasing in on January 1, 2016, at a rate of .625% per year. The buffer becomes fully phased in on January 1, 2019. An institution is subject to limitations on paying dividends, engaging in share repurchases, and paying discretionary bonuses if capital levels fall below minimum levels plus the buffer.
Actual and required capital amounts and ratios are presented below as of December 31,
20162019 and December 31,
20152018 for the Company and Bank.
| | | | | | | | | | | | | | | | | | | | | | | | |
| | | Actual Regulatory Capital | | | For Capital Adequacy
Purposes | | | To Be Well Capitalized
Under Prompt Corrective
Action Provisions | |
| | | Amount | | | Ratio | | | Amount | | | Ratio | | | Amount | | | Ratio | |
December 31, 2016 | | | | | | | | | | | | | | | | | | | | | | | | |
Company | | | | | | | | | | | | | | | | | | | | | | | | |
Common equity Tier 1 | | $ | 96,682 | | | | 13.00 | % | | $ | 38,115 | | | | 5.125 | % | | | N/A | | | | N/A | |
Tier I leverage | | | 96,682 | | | | 10.86 | % | | | 35,610 | | | | 4.000 | % | | | N/A | | | | N/A | |
Tier I risk-based capital | | | 96,682 | | | | 13.00 | % | | | 49,271 | | | | 6.625 | % | | | N/A | | | | N/A | |
Total risk-based capital | | | 105,764 | | | | 14.22 | % | | | 64,150 | | | | 8.625 | % | | | N/A | | | | N/A | |
| | | | | | |
Bank | | | | | | | | | | | | | | | | | | | | | | | | |
Common equity Tier 1 | | $ | 95,637 | | | | 12.88 | % | | $ | 38,054 | | | | 5.125 | % | | $ | 48,264 | | | | 6.50 | % |
Tier I leverage | | | 95,637 | | | | 10.75 | % | | | 35,586 | | | | 4.000 | % | | | 44,482 | | | | 5.00 | % |
Tier I risk-based capital | | | 95,637 | | | | 12.88 | % | | | 49,192 | | | | 6.625 | % | | | 59,402 | | | | 8.00 | % |
Total risk-based capital | | | 104,719 | | | | 14.10 | % | | | 64,057 | | | | 8.625 | % | | | 74,269 | | | | 10.00 | % |
| | | | | | |
December 31, 2015 | | | | | | | | | | | | | | | | | | | | | | | | |
Company | | | | | | | | | | | | | | | | | | | | | | | | |
Common equity Tier 1 | | $ | 84,608 | | | | 12.02 | % | | $ | 31,675 | | | | 4.50 | % | | | N/A | | | | N/A | |
Tier I leverage | | | 84,608 | | | | 9.92 | % | | | 34,116 | | | | 4.00 | % | | | N/A | | | | N/A | |
Tier I risk-based capital | | | 84,608 | | | | 12.02 | % | | | 42,234 | | | | 6.00 | % | | | N/A | | | | N/A | |
Total risk-based capital | | | 92,431 | | | | 13.13 | % | | | 56,317 | | | | 8.00 | % | | | N/A | | | | N/A | |
| | | | | | |
Bank | | | | | | | | | | | | | | | | | | | | | | | | |
Common equity Tier 1 | | $ | 84,196 | | | | 11.97 | % | | $ | 31,653 | | | | 4.50 | % | | $ | 45,720 | | | | 6.50 | % |
Tier I leverage | | | 84,196 | | | | 9.88 | % | | | 34,087 | | | | 4.00 | % | | | 42,609 | | | | 5.00 | % |
Tier I risk-based capital | | | 84,196 | | | | 11.97 | % | | | 42,204 | | | | 6.00 | % | | | 56,271 | | | | 8.00 | % |
Total risk-based capital | | | 92,019 | | | | 13.08 | % | | | 56,281 | | | | 8.00 | % | | | 70,351 | | | | 10.00 | % |
|
| | | | | | | | | | | | | | | | | | | | | | | | | | | | |
| | | Actual Regulatory Capital | | Pre-Phase In Minimal Capital Adequacy | | Minimum Required Capital Basel III Phased In | | To Be Well Capitalized Under Prompt Corrective Action Provisions |
| | | Amount | | Ratio | | Amount | | Ratio | | Amount | | Ratio | | Amount | | Ratio |
| December 31, 2019 | | | | | | | | | | | | | | | | |
| Company | | | | | | | | | | | | | | | | |
| Tier I leverage | | $ | 176,748 |
| | 9.74 | % | | N/A |
| | — | % | | $ | 72,586 |
| | 4.000 | % | | $ | 90,733 |
| | 5.00 | % |
| Common equity Tier 1 | | 165,063 |
| | 10.55 | % | | N/A |
| | — | % | | 109,520 |
| | 7.000 | % | | 101,698 |
| | 6.50 | % |
| Tier I risk-based capital | | 176,748 |
| | 11.30 | % | | N/A |
| | — | % | | 132,952 |
| | 8.500 | % | | 125,131 |
| | 8.00 | % |
| Total risk-based capital | | 249,751 |
| | 15.97 | % | | N/A |
| | — | % | | 164,207 |
| | 10.500 | % | | 156,388 |
| | 10.00 | % |
| | | | | | | | | | | | | | | | | |
| Bank | | | | | | | | | | | | | | | | |
| Tier I leverage | | $ | 186,734 |
| | 10.30 | % | | N/A |
| | — | % | | $ | 72,518 |
| | 4.000 | % | | $ | 90,648 |
| | 5.00 | % |
| Common equity Tier 1 | | 186,734 |
| | 11.95 | % | | N/A |
| | — | % | | 109,384 |
| | 7.000 | % | | 101,571 |
| | 6.50 | % |
| Tier I risk-based capital | | 186,734 |
| | 11.95 | % | | N/A |
| | — | % | | 132,823 |
| | 8.500 | % | | 125,010 |
| | 8.00 | % |
| Total risk-based capital | | 199,737 |
| | 12.79 | % | | N/A |
| | — | % | | 163,975 |
| | 10.500 | % | | 156,167 |
| | 10.00 | % |
| | | | | | | | | | | | | | | | | |
| December 31, 2018 | | | | | | | | | | | | | | | | |
| Company | | | | | | | | | | | | | | | | |
| Tier I leverage | | $ | 168,876 |
| | 10.38 | % | | $ | 65,077 |
| | 4.00 | % | | $ | 65,077 |
| | 4.000 | % | | $ | 81,347 |
| | 5.00 | % |
| Common equity Tier 1 | | 157,273 |
| | 11.59 | % | | 61,064 |
| | 4.50 | % | | 86,507 |
| | 6.375 | % | | 88,203 |
| | 6.50 | % |
| Tier I risk-based capital | | 168,876 |
| | 12.44 | % | | 81,451 |
| | 6.00 | % | | 106,905 |
| | 7.875 | % | | 108,602 |
| | 8.00 | % |
| Total risk-based capital | | 180,193 |
| | 13.28 | % | | 108,550 |
| | 8.00 | % | | 133,991 |
| | 9.875 | % | | 135,688 |
| | 10.00 | % |
| | | | | | | | | | | | | | | | | |
| Bank | | | | | | | | | | | | | | | | |
| Tier I leverage | | $ | 165,308 |
| | 10.17 | % | | $ | 65,018 |
| | 4.00 | % | | $ | 65,018 |
| | 4.000 | % | | $ | 81,272 |
| | 5.00 | % |
| Common equity Tier 1 | | 165,308 |
| | 12.19 | % | | 61,024 |
| | 4.50 | % | | 86,451 |
| | 6.375 | % | | 88,146 |
| | 6.50 | % |
| Tier I risk-based capital | | 165,308 |
| | 12.19 | % | | 81,366 |
| | 6.00 | % | | 106,792 |
| | 7.875 | % | | 108,488 |
| | 8.00 | % |
| Total risk-based capital | | 176,625 |
| | 13.02 | % | | 108,525 |
| | 8.00 | % | | 133,961 |
| | 9.875 | % | | 135,657 |
| | 10.00 | % |
The following table summarizes our contractual obligations and other commitments to make future payments as of December 31,
2016: | | | | | | | | | | | | | | | | | | | | |
| | | December 31, 2016 | |
| | | Total | | | Due in one year
or less | | | Due over one year
and less than three
years | | | Due over three
years and less
than five years | | | Due over five
years | |
Deposits with maturities | | $ | 359,776 | | | $ | 288,850 | | | $ | 54,188 | | | $ | 16,738 | | | $ | — | |
Federal Home Loan Bank advances | | | 32,287 | | | | 20,960 | | | | 7,447 | | | | 1,763 | | | | 2,117 | |
Federal funds purchased | | | 3,671 | | | | 3,671 | | | | — | | | | — | | | | — | |
Lease commitments | | | 11,237 | | | | 1,540 | | | | 2,906 | | | | 2,681 | | | | 4,110 | |
| | | | | | | | | | | | | | | | | | | | |
Total | | $ | 406,971 | | | $ | 315,021 | | | $ | 64,541 | | | $ | 21,182 | | | $ | 6,227 | |
| | | | | | | | | | | | | | | | | | | | |
2019:
|
| | | | | | | | | | | | | | | | | | | | |
| | | December 31, 2019 |
| | | Total | | Due in one year or less | | Due over one year and less than three years | | Due over three years and less than five years | | Due over five years |
| Deposits with maturities | | $ | 762,274 |
| | $ | 656,654 |
| | $ | 84,852 |
| | $ | 20,768 |
| | $ | — |
|
| Federal Home Loan Bank advances | | 10,737 |
| | 7,000 |
| | 880 |
| | 2,857 |
| | — |
|
| Operating lease obligations | | 14,907 |
| | 2,369 |
| | 4,591 |
| | 3,435 |
| | 4,512 |
|
| Total | | $ | 787,918 |
| | $ | 666,023 |
| | $ | 90,323 |
| | $ | 27,060 |
| | $ | 4,512 |
|
Off Balance Sheet Arrangements
Off-balance sheet arrangements generally consist of unused lines of credit and standby letters of credit. Such commitments were as follows (dollars in thousands):
| | | | |
| | | December 31,
2016 | |
| |
Unused lines of credit | | $ | 159,019 | |
Standby letters of credit | | | 12,217 | |
| | | | |
Total commitments | | $ | 171,236 | |
| | | | |
|
| | | |
| | December 31, 2019 |
| Unused lines of credit | $ | 335,755 |
|
| Standby letters of credit | 17,132 |
|
| Total commitments | $ | 352,887 |
|
Emerging Growth Company Status
The Company is an “emerging growth company,” as defined in the Jumpstart Our Business Startups“JOBS Act, of 2012 (the “JOBS Act”), and may take advantage of certain exemptions from various reporting requirements that are applicable to public companies that are not emerging growth companies, including, but not limited to, not being required to comply with the auditor attestation requirements of Section 404 of the Sarbanes-Oxley Act, reduced disclosure obligations regarding executive compensation in periodic reports and proxy statements, and exemptions from the requirements of holding a nonbinding advisory vote on executive compensation and shareholder approval of any golden parachute payments not previously approved. In addition, even if the Company complieschooses to comply with the greater obligationsreporting requirements of public companies that are not emerging growth companies, the Company may avail itself of the reduced requirements applicable to emerging growth companies from time to time in the future, so long as the Company is an emerging growth company. The Company will remain anexit the emerging growth company for up to five years, though it may cease to be an emerging growth company earlier under certain circumstances, including if, before the end of such five years, it is deemed to be a large accelerated filer under the rules of the SEC (which dependsstatus on among other things, having a market value of common stock held byDecember 31, 2020.
non-affiliates in excess of $700 million) or if total annual gross revenues equal or exceed $1 billion in a fiscal year. Management cannot predict if investors will find the Company’s common stock less attractive because it will rely on these exemptions. If some investors find the Company’s common stock less attractive as a result, there may be a less active trading market for its common stock and the Company’s stock price may be more volatile.Further, the JOBS Act exempts emerging growth companies from being required to comply with new or revised financial accounting standards until private companies (that is, those that have not had a Securities Act registration statement declared effective or do not have a class of securities registered under the Exchange Act) are required to comply with the new or revised financial accounting standards. The JOBS Act provides that a company can elect to opt out of the extended transition period and comply with the requirements that apply tonon-emerging growth companies but any such election to opt out is irrevocable. The Company has elected to take advantage of the extended transition period that allows an emerging growth company to delay the adoption of certain accounting standards until those standards would otherwise apply to private companies, which means that the financial
statements included in this filing, as well as the financial statements we will file in the future, will be subject to all new or revised accounting standards generally applicable to private companies. As a result, we will comply with new or revised accounting standards to the same extent that compliance is required fornon-public companies. companies.
Effects of Inflation and Changing Prices
The accompanying consolidated financial statements have been prepared in accordance with generally accepted accounting principles, which require the measurement of financial position and operating results in terms of historical dollars without considering the change in the relative purchasing power of money over time due to inflation. Unlike most industrial companies, virtually all of the assets and liabilities of a financial institution are monetary in nature. As a result, interest rates generally have a more significant impact on the performance of a financial institution than the effects of general levels of inflation. Although interest rates do not necessarily move in the same direction or to the same extent as the prices of goods and services, increases in inflation generally have resulted in increased interest rates. In addition, inflation affects financial institutions’
increased cost of goods and services purchased, the cost of salaries and benefits, occupancy expense, and similar items. Inflation and related increases in interest rates generally decrease the market value of investments and loans held and may adversely affect liquidity, earnings, and shareholders’ equity. Commercial and other loan originations and refinancings tend to slow as interest rates increase and can reduce our earnings from such activities.
Impact of Recent Accounting Guidance
ASU2014-04, “Receivables-TroubledDebtRestructuringsbyCreditors(Subtopic310-40):ReclassificationofResidentialRealEstateCollateralizedConsumerMortgageLoansuponForeclosure” clarifies when substance repossession or foreclosure occurs. A creditor is considered to have received physical possession of residential real estate property collateralizing a consumer mortgage loan, upon either (1) the creditor obtaining legal title to the residential real estate property upon completion of a foreclosure or (2) the borrower conveying all interest in the residential real estate property to the creditor to satisfy that loan through completion of a deed in lieu of foreclosure or through a similar legal agreement. Additionally, the amendments require interim and annual disclosure of both (1) the amount of foreclosed residential real estate property held by the creditor and (2) the recorded investment in consumer mortgage loans collateralized by residential real estate property that are in the process of foreclosure according to local requirements of the applicable jurisdiction. ASU2014-11 became effective for the Company on January
Please see Note 1
2015 and did not have a significant impact onof the consolidated financial
statements.ASU 2014-09, “RevenuefromContractswithCustomers(Topic606)” implements a common revenue standard that clarifies the principles for recognizing revenue. The principle element ofASU 2014-09 is that an entity should recognize revenue to depict the transfer of promised goods or services to customers in an amount that reflects the consideration to which the entity expects to be entitled in exchange for those goods or services. To achieve this principle, an entity should apply the following steps: (i) identify the contract(s) with a customer, (ii) identify the performance obligations in the contract, (iii) determine the transaction price, (iv) allocate the transaction price to the performance obligations in the contract and (v) recognize revenue when (or as) the entity satisfies a performance obligation. ASU2014-09 was originally going to be effective for us on January 1, 2017; however, the FASB recently issuedASU 2015-14,“RevenuefromContractswithCustomers(Topic606)–DeferraloftheEffectiveDate” which deferred the effective date ofASU 2014-09 by one year to January 1, 2018. Our revenue is comprised of net interest income on financial assets and financial liabilities, which is explicitly excluded from the scope ofASU 2014-09, andnon-interest income. We do not expect these changes to have a significant impact on our consolidated financial statements. We continue to evaluatestatements where we discuss the impact ofASU 2014-09 on other components ofnon-interest income.
ASU2014-11, “TransfersandServicing(Topic860)” requires thatrepurchase-to-maturity transactions be accounted for as secured borrowings consistent with the recent accounting for other repurchase agreements. In addition,ASU 2014-11 requires separate accounting for repurchase financings, which entails the transfer of a financial asset executed contemporaneously with a repurchase agreement with the same counterparty.ASU 2014-11 requires entities to disclose certain information about transfers accounted for as sales in transactions that are economically similar to repurchase agreements. In addition,ASU 2014-11 requires disclosures related to collateral, remaining contractual tenor and of the potential risks associated with repurchase agreements, securities lending transactions andrepurchase-to-maturity transactions. ASU2014-11 became effective for the Company on January 1, 2015 and did not have a significant impact on the consolidated financial statements.
ASU2015-02,“Consolidation(Topic810)–AmendmentstotheConsolidationAnalysis” implements changes to both the variable interest consolidation model and the voting interest consolidation model.ASU 2015-02 (1) eliminates certain criteria that must be met when determining when fees paid to a decision maker or service provider do not represent a variable interest, (2) amends the criteria for determining whether a limited partnership is a variable interest entity and (3) eliminates the presumption that a general partner controls a limited partnership in the voting model.ASU 2015-02 became effective for the Company on January 1, 2016 and did not have a significant impact on the consolidated financial statements.
ASU2015-03,“Interest–ImputationofInterest(Subtopic835-30)–SimplifyingthePresentationofDebtIssuanceCosts” requires that debt issuance costs related to a recognized debt liability be presented in the balance sheet as a direct deduction from the carrying amount of that debt liability, consistent with debt discounts. The recognition and measurement guidance for debt issuance costs are not affected by the amendments inASU 2015-03.ASU 2015-03 became effective for the Company on January 1, 2016 and did not have a significant impact on the consolidated financial statements.
ASU 2015-05,“Intangibles–GoodwillandOther-Internal-UseSoftware(Subtopic350-40)–Customer’sAccountingforFeesPaidinaCloudComputingArrangement” addresses accounting for fees paid by a customer in cloud computing arrangements such as (i) software as a service, (ii) platform as a service, (iii) infrastructure as a service and (iv) other similar hosting arrangements.ASU 2015-05 provides guidance to customers about whether a cloud computing arrangement includes a software license. If a cloud computing arrangement includes a software license, then the customer should account for the software license element of the arrangement consistent with the acquisition of other software licenses. If a cloud computing arrangement does not include a software license, the customer should account for the arrangement as a service contract.ASU 2015-05 became effective for the Company on January 1, 2016 and did not have a significant impact on the consolidated financial statements.
ASU 2015-16,“BusinessCombinations(Topic805)–SimplifyingtheAccountingforMeasurement-PeriodAdjustments” requires that adjustments to provisional amounts that are identified during the measurement period of a business combination be recognized in the reporting period in which the adjustment amounts are determined. Furthermore, the income statement effects of such adjustments, if any, must be calculated as if the accounting had been completed at the acquisition date. The portion of the amount recorded in current-period earnings that would have been recorded in previous reporting periods if the adjustment to the provisional amounts had been recognized as of the acquisition date. Under previous guidance, adjustments to provisional amounts identified during the measurement period are to be recognized retrospectively.ASU 2015-16 became effective for the Company on January 1, 2016 and did not have a significant impact on the consolidated financial statements.
ASU 2016-02, “Leases(Topic842).”ASU 2016-02 will require lessees to recognize a lease liability, which is a lessee’s obligation to make lease payments arising from a lease, measured on a discounted basis; and aright-of-use asset, which is an asset that represents the lessee’s right to use, or control the use of, a specified asset for the lease term.ASU 2016-02 will be effective for us on January 1, 2019 and will require transition using a modified retrospective approach for leases existing at, or entered into after, the beginning of the earliest comparative period presented in the consolidated financial statements. We are evaluating the potential impact ofASU 2016-02 on our consolidated financial statements.
ASU2016-07,“Investments-EquityMethodandJointVentures(Topic323):SimplifyingtheTransitiontotheEquityMethodofAccounting.” The amendments affect all entities that have an investment that becomes qualified for the equity method of accounting as a result of an increase in the level of ownership interest or degree of influence.ASU 2016-07 simplifies the transition to the equity method of accounting by eliminating retroactive adjustment of the investment when an investment qualifies for use of the equity method, among other things.ASU 2016-07 will be effective for the Company on January 1, 2017 and is not expected to have a significant impact on the consolidated financial statements.
ASU2016-09,“Compensation-StockCompensation(Topic718):ImprovementstoEmployeeShare-BasedPaymentAccounting.” UnderASU 2016-09 all excess tax benefits and tax deficiencies related to share-based payment awards should be recognized as income tax expense or benefit in the income statement during the period in which they occur. Previously, such amounts were recorded in the pool of excess tax benefits included in additionalpaid-in capital, if such pool was available. Because excess tax benefits are no longer recognized in additionalpaid-in capital, the assumed proceeds from applying the treasury stock method when computing earnings per share excludes the amount of excess tax benefits that would have previously been recognized in additionalpaid-in capital.
Additionally, excess tax benefits should be classified along with other income tax cash flows as an operating activity rather than a financing activity, as was previously the case.ASU 2016-09 also provides that an entity can make an entity-wide accounting policy election to either estimate the number of awards that are expected to vest (current GAAP) or account for forfeitures when they occur.ASU 2016-09 changes the threshold to qualify for equity classification (rather than as a liability) to permit withholding up to the maximum statutory tax rates (rather than the minimum as was previously the case) in the applicable jurisdictions. The Company elected to adopt the provisions of ASU2016-09 in 2016 in advance of the required application date of January 1, 2017. The adoption of this standard reduced reported income tax expense by $478, or approximately $0.06 per diluted common share, for 2016.
ASU2016-13,“FinancialInstruments-CreditLosses(Topic326):MeasurementofCreditLossesonFinancialInstruments.”ASU 2016-13 requires the measurement of all expected credit losses for financial assets held at the reporting date based on historical experience, current conditions, and reasonable and supportable forecasts and requires enhanced disclosures related to the significant estimates and judgments used in estimating credit losses, as well as the credit quality and underwriting standards of an organization’s portfolio. In addition,ASU 2016-13 amends the accounting for credit losses onavailable-for-sale debt securities and purchased financial assets with credit deterioration. ASU2016-13 will be effective on January 1, 2020. We are currently evaluating the potential impact ofASU 2016-13 on our financial statements.
ASU2016-15,“StatementofCashFlows(Topic230)-ClassificationofCertainCashReceiptsandCashPayments.”ASU 2016-15 provides guidance related to certain cash flow issues in order to reduce the current and potential future diversity in practice.ASU 2016-15 will be effective for the Company on January 1, 2018 and is not expected to have a significant impact on the consolidated financial statements.
ASU 2016-16,“IncomeTaxes(Topic740)-Intra-EntityTransfersofAssetsOtherThanInventory.”ASU 2016-16 provides guidance stating that an entity should recognize the income tax consequences of an intra-entity transfer of an asset other than inventory when the transfer occurs.ASU 2016-16 will be effective for the Company on January 1, 2018 and is not expected to have a significant impact on the consolidated financial statements.
ASU 2016-18,“StatementofCashFlows(Topic230)-RestrictedCash.”ASU 2016-18 requires that a statement of cash flows explain the change during the period in the total of cash, cash equivalents, and amounts generally described as restricted cash or restricted cash equivalents. Therefore, amounts generally described as restricted cash and restricted cash equivalents should be included with cash and cash equivalents when reconciling thebeginning-of-period andend-of-period total amounts shown on the statement of cash flows.ASU 2016-18 will be effective for the Company on January 1, 2018 and is not expected to have a significant impact on the consolidated financial statements.
ASU 2017-01,“BusinessCombinations(Topic805)-ClarifyingtheDefinitionofaBusiness.”ASU 2017-01 clarifies the definition and provides a more robust framework to use in determining when a set of assets and activities constitutes a business.ASU 2017-01 is intended to provide guidance when evaluating whether transactions should be accounted for as acquisitions (or disposals) of assets or businesses.ASU 2017-01 will be effective for the Company on January 1, 2018 and is not expected to have a significant impact on the consolidated financial statements.
guidance.
ITEM 7A. | QUANTITATIVE AND QUALITATIVE DISCLOSURES ABOUT MARKET RISK |
ITEM 7A. QUANTITATIVE AND QUALITATIVE DISCLOSURES ABOUT MARKET RISK
This item is included in
“Management’s“Management's Discussion and Analysis of Financial Condition and Results of Operations.” Please see headings: “Market and Liquidity Risk Management,” “Interest Rate Sensitivity” and “Effect of Inflation and Changing Prices.”
ITEM 8. | FINANCIAL STATEMENTS AND SUPPLEMENTARY DATA |
ITEM 8. FINANCIAL STATEMENTS AND SUPPLEMENTARY DATA
The financial statements required by this Item are included as a separate section of this report commencing on page
F-1.
ITEM 9. | CHANGES IN AND DISAGREEMENTS WITH ACCOUNTANTS ON ACCOUNTING AND FINANCIAL DISCLOSURE |
ITEM 9.CHANGES IN AND DISAGREEMENTS WITH ACCOUNTANTS ON ACCOUNTING AND FINANCIAL DISCLOSURE
ITEM 9A. | CONTROLS AND PROCEDURES |
ITEM 9A. CONTROLS AND PROCEDURES
Disclosure Controls and Procedures
Commerce Union
Reliant Bancorp maintains disclosure controls and procedures, as defined in Rule
13a-15(e) and Rule 15d - 15(e) of the Exchange Act, which are designed to ensure that information required to be disclosed by it in the reports that it files or submits under the Exchange Act is recorded, processed, summarized and reported within the time periods specified in the
Securities and Exchange Commission’s rules and forms and that such information is accumulated and communicated to
Commerce Union’sReliant Bancorp’s management, including its Chief Executive Officer and Chief Financial Officer, as appropriate, to allow timely decisions regarding required disclosure.
Commerce UnionReliant Bancorp carried out an evaluation, under the supervision and with the participation of its management, including its Chief Executive Officer and Chief Financial Officer, of the effectiveness of the design and operation of its disclosure controls and procedures as of the end of December 31,
2016.2019. Based on the evaluation of these disclosure controls and procedures, the Chief Executive Officer and Chief Financial Officer have concluded that as of December 31,
2016, Commerce Union’s2019, Reliant Bancorp’s disclosure controls and procedures were effective.
Management’s Report on Internal Control Over Financial Reporting
The report of
Commerce Union Bancshares, Inc.’sReliant Bancorp’s management on internal control over financial reporting is set forth on page
F-1 of this Annual Report on Form
10-K. This Annual Report does not include an attestation report of the Company’s registered public accounting firm regarding internal control over financial reporting.
Changes in Internal Controls
There were no changes in
Commerce Union’sReliant Bancorp’s internal control over financial reporting during
Commerce Union’sReliant Bancorp’s fiscal quarter ended December 31,
20162019 that have materially affected, or are reasonably likely to materially affect,
Commerce Union’sReliant Bancorp’s internal control over financial reporting.
ITEM 9B. | OTHER INFORMATION |
ITEM 9B. OTHER INFORMATION
ITEM 10. | DIRECTORS, EXECUTIVE OFFICERS AND CORPORATE GOVERNANCE |
ITEM 10. DIRECTORS, EXECUTIVE OFFICERS AND CORPORATE GOVERNANCE
The response toinformation called for by this item is incorporated by referenceset forth in our Definitive Proxy Statement relating to the Company’s proxy statement for the 2017 annual meeting2020 Annual Meeting of shareholders under the captions “Proposal One - Election of Directors,Shareholders (the “2020 Proxy Statement” “Information About the Directors,” “Information About the Executive Officers,” “Corporate Governance and the Board of Directors” and “Section 16(a) Beneficial Ownership Reporting Compliance.” The Company’s proxy statement will), to be filed no later thanwith the SEC within 120 days afterof the closeend of our lastthe fiscal year.year ended December 31, 2019, and is incorporated herein by reference.
ITEM 11. | EXECUTIVE COMPENSATION |
ITEM 11. EXECUTIVE COMPENSATION
The
response toinformation called for by this item is
incorporated by reference to the Company’sset forth in our 2020 Proxy Statement,
under the captions “Compensation of Directors and
Executive Officers” and “Director Compensation.”is incorporated herein by reference.
ITEM 12. | SECURITY OWNERSHIP OF CERTAIN BENEFICIAL OWNERS AND MANAGEMENT AND RELATED STOCKHOLDER MATTERS |
ITEM 12.SECURITY OWNERSHIP OF CERTAIN BENEFICIAL OWNERS AND MANAGEMENT AND RELATED STOCKHOLDER MATTERS
The response to this item
will be included in, and is incorporated by reference to, the
Company’s2020 Proxy Statement, under the caption “Security Ownership of Certain Beneficial Owners and Management.”
The following table summarizes the Company’s equity compensation plan information as of December 31,
2016:Equity Compensation Plan Information as of December 31, 2016
| | | | | | | | | | | | |
Plan category | | Number of securities
to be issued upon
exercise of
outstanding options | | | Weighted average
exercise price of
outstanding
options | | | Number of securities
remaining available
for future issuance | |
Equity compensation plans approved by security holders | | | 241,541 | | | $ | 12.96 | | | | 1,188,586 | (1) |
Equity compensation plans not approved by security holders | | | — | | | | — | | | | — | |
| | | | | | | | | | | | |
Total | | | 241,541 | | | $ | 12.96 | | | | 1,188,586 | |
| | | | | | | | | | | | |
|
| | | | | | |
| Plan category | | Number of securities to be issued upon exercise of outstanding options, warrants and rights | | Weighted average exercise price of outstanding options, warrants and rights | | Number of securities remaining available for future issuance under equity compensation plans (excluding securities reflected in column (a)) |
| | | (a) | | (b) | | (c) |
| Equity compensation plans approved by security holders | | 156,701 | | 18.81 | | 1,034,322 (1) |
| Equity compensation plans not approved by security holders | | — | | — | | — |
| Total | | 156,701 | | 18.81 | | 1,034,322 |
| |
| (1) | This number includes 434,186 securities available to be issued under the Commerce Union Bancshares, Inc. Amended and Restated Stock Option Plan. Although this plan will remain in effect until March 23, 2021, the Company has no intentions to issue new awards under the plan. Future awards are intended to be issued under the Commerce Union Bancshares, Inc. 2015 Equity Incentive Plan, forunder which the number of securities remaining available for future issuance is 754,400.600.136. |
ITEM 13. | CERTAIN RELATIONSHIPS AND RELATED TRANSACTIONS, AND DIRECTOR INDEPENDENCE |
ITEM 13. CERTAIN RELATIONSHIPS AND RELATED TRANSACTIONS, AND DIRECTOR INDEPENDENCE
The
response toinformation called for by this item is
incorporated by reference to the Company’sset forth in our 2020 Proxy Statement
under the captions “Proposal One - Election of Directors” and
“Related Party Transactions.”is incorporated herein by reference.
ITEM 14. | PRINCIPAL ACCOUNTANT FEES AND SERVICES |
ITEM 14. PRINCIPAL ACCOUNTANT FEES AND SERVICES
The
response toinformation called for by this item is
incorporated by reference to the Company’sset forth in our 2020 Proxy Statement,
Item2-Ratification of Auditor Appointment under the caption “Proposal Two - Ratification of Independent Registered Public Accountants.”and is incorporated herein by reference.
ITEM 15. EXHIBITS AND FINANCIAL STATEMENT SCHEDULES
ITEM 15. | EXHIBITS AND FINANCIAL STATEMENT SCHEDULES |
| (a) | Documents filed as a part of this Annual Report on Form 10-K |
(1) Financial statements
The following consolidated financial statements of the Company are included asincorporated in this Item 15 by reference from Part II - Item 8 of this Form10-K beginningAnnual Report on PageForm 10-K:
Report of Independent Registered Public Accounting Firm
F-1.Consolidated Balance Sheets as of December 31, 2019 and 2018Consolidated Statements of Operations for the years ended December 31, 2019, 2018 and 2017
Consolidated Statements of Comprehensive Income for the years ended December 31, 2019, 2018 and 2017
Consolidated Statements of Changes in Stockholders’ Equity for the years ended December 31, 2019, 2018 and 2017
Consolidated Statements of Cash Flows for the years ended December 31, 2019, 2018 and 2017
Notes to Consolidated Financial Statements
| |
| (2) | Financial Statement Schedules:statement schedules |
All schedules have been omitted because
the information is not required,they are either not applicable, not
presentrequired or the information called for therein appears in
amounts sufficient to require submission of the
schedule, or is included in theconsolidated financial statements or notes thereto.
The exhibits filed as part
See Item 15(b) of this report and incorporated herein by reference to other documents are listedAnnual Report on the Exhibit Index to this annual report on Form 10-K
|
| |
Exhibit No. | Description |
| |
| 2.1* | Agreement and Plan of Merger dated August 22, 2017, by and among Commerce Union Bancshares, Inc., Pioneer Merger Sub, Inc., Reliant Bank, Community First, Inc., and Community First Bank & Trust (incorporated by reference to Exhibit 2.1 to Form 8-K filed August 23, 2017). |
| 2.2* | |
| 2.3* | |
| 3.1 | |
| 3.2 | |
| 4.1 | |
| 4.2† | |
| 4.3 | The rights of securities holders are defined in the Charter and Bylaws provided in Exhibits 3.1 and 3.2 |
| 4.4 | |
|
| |
Exhibit No. | Description |
| 4.5 | |
| 10.1# | |
| 10.2# | |
| 10.3# | |
| 10.4# | |
| 10.5# | |
| 10.6# | |
| 10.7# | |
| 10.8 | |
| 10.9 | |
| 10.10 | |
| 10.11 | |
| 10.12 | |
| 10.13 | |
| 10.14# | |
| 10.15# | |
| 10.16# | |
| 10.17# | |
| 10.18# | |
| 10.19# | |
| 10.20# | |
| 10.21# | |
| 10.22# | |
| 10.23# | |
| 10.24# | |
|
| |
Exhibit No. | Description |
| 10.25# | |
| 10.26# | |
| 10.27 | |
| 10.28 | |
| 21.1 | |
| 23.1† | |
| 24.1† | Power of Attorney (included on the signature page to this Annual Report on Form 10-K). |
| 31.1† | |
| 31.2† | |
| 32.1** | |
101.INS XBRL Instance Document †
101.SCH XBRL Taxonomy Extension Schema Document †
101.CAL XBRL Taxonomy Extension Calculation Linkbase Document †
101.DEF XBRL Taxonomy Extension Definition Linkbase Document †
101.LAB XBRL Taxonomy Extension Label Linkbase Document †
101.PRE XBRL Taxonomy Extension Presentation Linkbase Document †
| |
| * | The registrant has omitted schedules to the subject agreement pursuant to Item 601(a)(5) of Regulation S-K. The registrant will furnish a copy of any omitted schedule to the SEC upon request. |
| |
| # | Indicates management contract or compensatory plan or arrangement |
| |
| (c) | Schedules to the consolidated financial statements are omitted, as the required information is not applicable. |
CONSOLIDATED FINANCIAL STATEMENTS
10-K,DECEMBER immediately following the financial statements.SUPPLEMENTAL INFORMATION31, 2019AND 2018 AND
FOR THE THREE PERIOD ENDED DECEMBER 31, 2018
TABLE OF CONTENTS
CONSOLIDATED FINANCIAL STATEMENTS
DECEMBER31, 2019AND 2018 AND
FOR THE THREE PERIOD ENDED DECEMBER 31, 2019
TABLE OF CONTENTS
RELIANT BANCORP, INC.
NOTES TO BE FURNISHED WITH REPORTS FILED PURSUANTCONSOLIDATED FINANCIAL STATEMENTS (CONTINUED)
DECEMBER 31, 2019, 2018 AND 2017
(Dollar amounts in thousands except per share amounts)
ITEM 16. FORM 10-K SUMMARY
None.
RELIANT BANCORP, INC.
NOTES TO
SECTION 15(d) OF THE ACT BY REGISTRANTS THAT HAVE NOT REGISTERED SECURITIES PURSUANT TO SECTION 12 OF THE ACT.No annual report to security holders or proxy materials covering the Company’s last fiscal year have been sent as of the date of this report. If sent, copies of these materials will be furnishedCONSOLIDATED FINANCIAL STATEMENTS (CONTINUED)
DECEMBER 31, 2019, 2018 AND 2017
(Dollar amounts in thousands except per share amounts)
SIGNATURES
Pursuant to the SEC when they are mailed to security holders. The annual report and proxy materials shall not be deemed to be “filed” with the SEC or otherwise subject to the liabilitiesrequirements of Section 18 of the act.SIGNATURES
In accordance with Section 13 or 15(d) of the Securities Exchange Act of 1934, the Registrantregistrant has duly caused this report to be signed on its behalf by the undersigned, thereunto duly authorized.
authorized. | | | | | | |
| | | | | | COMMERCE UNION BANCSHARES, INC. |
| | | |
Date: March 14, 2017 | | RELIANT BANCORP, INC. | |
| Date: March 13, 2020 | By: | /s/ DeVan D. Ard, Jr. | |
| | By:DeVan D. Ard, Jr. | |
| | /s/ William Ronald DeBerry
|
| | | | | | William Ronald DeBerry |
| | | | | | Chairman, and Chief Executive Officer, and President | |
| | | | | | (Principal Executive Officer) | |
KNOW
KNOWN ALL MENPERSONS BY THESE PRESENTS, that each person whose signature appears below constitutes and appoints William R. DeBerry, hisDeVan Ard, Jr. and J. Daniel Dellinger, each of whom may act without joinder of the other, as their true and lawfulattorney-in-fact attorneys-in-fact and agent,agents, each with full power of substitution and resubstitution, for himsuch person and in his or her name, place and stead, in any and all capacities, to sign any and all amendments to this report,Annual Report on Form 10-K, and to file the same, with all exhibits thereto and other documents in connection therewith, with the Securities and Exchange Commission, granting untoattorney-in-fact said attorneys-in-fact and agentagents full power and authority to do and perform each and every act and thing requisite orand necessary to be done in and about the premises, as fully to all intents and purposes as he might or could do in person, hereby ratifying and confirming all thatattorney-in-fact said attorneys-in-fact and agent,agents, or his substitute ortheir substitutes, may lawfully do or cause to be done by virtue hereof.
Pursuant to the requirements of the Securities Exchange Act of 1934, this report has been signed below by the following persons on behalf of the registrant and in the capacities and on
March 14, 2017.the dates indicated.
RELIANT BANCORP, INC.
NOTES TO CONSOLIDATED FINANCIAL STATEMENTS (CONTINUED)
DECEMBER 31, 2019, 2018 AND 2017
(Dollar amounts in thousands except per share amounts)
| | | | |
| | SIGNATURE AND CAPACITY | | |
| | |
| Signature | Title | /s/ Homayoun Aminmadani
| | |
| | Homayoun Aminmadani,
Director
/s/ DeVan D. Ard
| | |
| | DeVan D. Ard,
Director and President
/s/ Charles Trimble Beasley
| | |
| | Charles Trimble (Trim) Beasley,
Director
/s/ John Lewis Bourne
| | |
| | John Lewis (Buddy) Bourne,
Director
/s/ William R. DeBerry
| | |
| | William R. DeBerry,
Chairman and Chief Executive Officer (Principal Executive Officer)
/s/ Sharon H. Edwards
| | |
| | Sharon H. Edwards,
Director
/s/ Farzin Ferdowsi
| | |
| | Farzin Ferdowsi,
Director
/s/ Darrell S. Freeman
| | |
| | Darrell S. Freeman, Sr.,
Director
| | |
| | |
| | /s/ James Gilbert Hodges
James Gilbert Hodges,
Director
| | |
| | |
| | /s/ James R. Kelley
James R. Kelley,
Director
| | |
| | |
| | /s/ Don R. Sloan
| | |
| | Don Richard Sloan
Director
| | |
COMMERCE UNION BANCSHARES, INC.
CONSOLIDATED FINANCIAL STATEMENTS
DECEMBER 31, 2016, 2015 AND 2014
TABLE OF CONTENTS
| | | | Date |
| | | PAGE |
| /s/ DeVan D. Ard, Jr. | Chairman, Chief Executive Officer, and President | March 13, 2020 |
| DeVan D. Ard, Jr. | (Principal Executive Officer)
| |
| |
MANAGEMENT’S REPORT ON INTERNAL CONTROL OVER FINANCIAL REPORTING
| | |
F-1/s/ J. Daniel Dellinger | Chief Financial Officer | March 13, 2020 |
J. Daniel Dellinger
| (Principal Financial Officer and Accounting Officer)
| |
| |
REPORT OF INDEPENDENT REGISTERED PUBLIC ACCOUNTING FIRM – 2016 AND 2015
| | |
F-2/s/ Homayoun Aminmadani | Director | March 13, 2020 |
Homayoun Aminmadani
| | |
| |
REPORT OF INDEPENDENT REGISTERED PUBLIC ACCOUNTING FIRM - 2014
| | |
F-3/s/ Charles Trimble Beasley | Director
| March 13, 2020 |
| Charles Trimble Beasley | | |
| |
CONSOLIDATED FINANCIAL STATEMENTS
| | | | |
| |
Consolidated Balance Sheets
| | |
F-4/s/ Robert E. Daniel | Director
| March 13, 2020 |
| Robert E. Daniel | | |
| |
Consolidated Statements of Operations
| | |
F-5/s/ William R. DeBerry | Director
| March 13, 2020 |
| William R. DeBerry | | |
| |
Consolidated Statements of Comprehensive Income
| | |
F-6/s/ Sharon H. Edwards | Director
| March 13, 2020 |
| Sharon H. Edwards | | |
| |
Consolidated Statements of Changes in Stockholders’ Equity
| | |
F-7/s/ Darrell S. Freeman, Sr. | Director
| March 13, 2020 |
| Darrell S. Freeman, Sr. | | |
| |
Consolidated Statements of Cash Flows
| | |
F-8/s/ James Gilbert Hodges | Director
| March 13, 2020 |
| James Gilbert Hodges | | |
| |
Notes to Consolidated Financial Statements
| | |
F-10/s/ Louis E. Holloway | Director
| March 13, 2020 |
| Louis E. Holloway | | |
| | |
| /s/ Connie S. McGee | Director
| March 13, 2020 |
| Connie S. McGee | | |
| | |
| /s/ Linda E. Rebrovick | Director
| March 13, 2020 |
| Linda E. Rebrovick | | |
| | |
| /s/ Ruskin A. Vest | Director
| March 13, 2020 |
| Ruskin A. Vest | | |
Management Report On Internal Control OverFinancial Reporting The management of Commerce Union Bancshares,Reliant Bancorp, Inc. and its subsidiaries (collectively referred to as the Company)“the Company”) is responsible for the preparation, integrity and fair presentation of published financial statements and all other information presented in this annual
report. The financial statements have been prepared in accordance with accounting principles generally accepted in the United States of America
(GAAP)(“GAAP”) and, as such, include amounts based on informed judgments and estimates made by management.
Management is responsible for establishing and maintaining adequate internal control over financial reporting for financial presentations in conformity with GAAP. Pursuant to the rules and regulations of the Securities and Exchange Commission, internal control over financial reporting is a process designed by, or under the supervision of, the Company’s Board of Directors, management and other personnel, to provide reasonable assurance regarding the reliability of financial reporting and the preparation of financial statements for external purposes in accordance with GAAP and included those policies and procedures that:
Pertain to the maintenance of records that in reasonable detail accurately and fairly reflect the transactions and dispositions of the assets of the Company.
Provide reasonable assurance that transactions are recorded as necessary to permit preparation of financial statements in accordance with generally accepted accounting principles, and that receipts and expenditures of the Company are being made only in accordance with authorizations of management and Directors of the Company; and
Provide reasonable assurance regarding prevention or timely detection of unauthorized acquisition, use or disposition of the Company’s assets that could have a material effect on the financial statements.
All internal control systems, no matter how well designed, have inherent limitations, including the possibility of human error and the circumvention of overriding controls. Accordingly, even effective internal control can provide only reasonable assurance with respect to financial statement preparation. Further, because of changes in conditions, or that the degree of compliance with the policies and procedures include in such controls may deteriorate.
Management has evaluated the effectiveness of its internal control over financial reporting as of December 31, 20162019 based on the control criteria established in a report entitledInternalControl–IntegratedFramework(2013), issued by the Committee of Sponsoring Organizations of the Treadway Commission. Based on such evaluation, we have concluded that Commerce Union Bancshares,Reliant Bancorp, Inc.’s internal control over financial reporting is effective as of December 31, 2016.2019.
This annual report does not include an attestation report of the Company’s registered public accounting firm regarding internal control over financial reporting. Management’s report was not subject to attestation by the Company’s registered public accounting firm pursuant to rules of the Securities and Exchange Commission that permit the Company to provide only management’s report in this annual report.
| | |
| |

| | | | Stephen M. Maggart, CPA, ABV, CFF
J. Mark Allen, CPA
M. Todd Maggart, CPA, ABV, CFF
Michael Holland, CPA, ABV, CFF
Michael F. Murphy, CPA
P. Jason Ricciardi, CPA, CGMA
David B. von Dohlen, CPA
T. Keith Wilson, CPA, CITP
|
Report of Independent Registered Public Accounting Firm
The Board of Directors and
ShareholdersStockholders of
Commerce Union Bancshares,
Opinion on the Financial Statements
We have audited the accompanying consolidated balance sheets of Commerce Union Bancshares,Reliant Bancorp, Inc. and Subsidiaries(the “Company”) as of December 31, 20162019 and 2015, and2018, the related consolidated statements of operations, comprehensive income, changes in stockholders’ equity, and cash flows for each of the twothree years in the period ended December 31, 2016. Commerce Union Bancshares, Inc.’s management is responsible2019, and the related notes (collectively referred to as the “financial statements”). In our opinion, the financial statements present fairly, in all material respects, the financial position of the Company as of December 31, 2019 and 2018, and the results of its operations and its cash flows for theseeach of the three years in the period ended December 31, 2019, in conformity with accounting principles generally accepted in the United States of America.
Basis for Opinion
These financial
statements.statements are the responsibility of the Company’s management. Our responsibility is to express an opinion on
thesethe Company’s financial statements based on our audits.
We are a public accounting firm registered with the Public Company Accounting Oversight Board (United States) (“PCAOB”) and are required to be independent with respect to the Company in accordance with the U.S. federal securities laws and the applicable rules and regulations of the Securities and Exchange Commission and the PCAOB.
We conducted our audits in accordance with the standards of the Public Company Accounting Oversight Board (United States).PCAOB. Those standards require that we plan and perform the audit to obtain reasonable assurance about whether the financial statements are free of material misstatements.misstatement, whether due to error or fraud. The Company is not required to have, nor were we engaged to perform, an audit of its internal control over financial reporting. Our audit included considerationreporting in accordance with the standards of the PCAOB. As part of our audits we are required to obtain an understanding of internal control over financial reporting as a basis for designing audit procedures that are appropriate in the circumstances, but not for the purpose of expressing an opinion on the effectiveness of the Company’s internal control over financial reporting. Accordingly, we express no such opinion. An audit also includesopinion in accordance with the standards of the PCAOB.
Our audits included performing procedures to assess the risks of material misstatement of the financial statements, whether due to error or fraud, and performing procedures that respond to those risks. Such procedures included examining, on a test basis, evidence
supportingregarding the amounts and disclosures in the financial
statements, assessingstatements. Our audits also included evaluating the accounting principles used and significant estimates made by management, as well as evaluating the overall
presentation of the financial
statement presentation.statements. We believe that our audits provide a reasonable basis for our opinion.
In our opinion, the consolidated financial statements referred to above present fairly, in all material respects, the financial position of Commerce Union Bancshares, Inc. and Subsidiaries as of December 31, 2016 and 2015, and the results of its operations and its cash flows for each of the two years in the period ended December 31, 2016, in conformity with accounting principles generally accepted in the United States of America.
/s/ Maggart & Associates, P.C.
Nashville, Tennessee
March 14, 2017
150 FOURTH AVENUE, NORTH ◾ SUITE 2150 ◾ NASHVILLE, TENNESSEE 37219-2431 ◾ (615)252-6100 ◾ Fax ◾ (615)252-6105
www.maggartpc.com

REPORT OF INDEPENDENT REGISTERED PUBLIC ACCOUNTING FIRM
The Board of Directors
Reliant Bank
Brentwood, Tennessee
We have
auditedserved as the
accompanying consolidated statement of operations, comprehensive income, changes in stockholders’ equity, and cash flows for the year ended December 31, 2014. These financial statements are the responsibility of the Bank’s management. Our responsibility is to express an opinion on these financial statements based on our audit.We conducted our audit in accordance with the standards of the Public Company Accounting Oversight Board (United States). Those standards require that we plan and perform the audit to obtain reasonable assurance about whether the financial statements are free of material misstatement. An audit includes examining, on a test basis, evidence supporting the amounts and disclosures in the financial statements. An audit also includes assessing the accounting principles used and significant estimates made by management, as well as evaluating the overall financial statement presentation. We believe that our audit provides a reasonable basis for our opinion.
In our opinion, such consolidated financial statements present fairly, in all material respects, the fmancial position of Reliant Bank, the results of their operations and their cash flows for the year ended December 31, 2014, in conformity with accounting principles generally accepted in the United States of America.
/s/ KraftCPAs PLLC
Company’s auditor since 2015.
March
31, 2015, except for Note 20 as to which the date is March 28, 2016KraftCPAs PLLC ◾ Certified Public Accountants and Consultants
555 Great Circle Road ◾ Nashville, TN 37228 ◾ phone: 615-242-7351 ◾ fax: 615-782-4271 ◾ kraftcpas.com
13, 2020
|
| | | | |
1201 DEMONBREUN STREET ▪ SUITE 1220 ▪ NASHVILLE, TENNESSEE 3720.-3140 ▪ (615) 252-6100 ▪ Fax ▪ (615) 252-6105 www.maggartpc.com |
COMMERCE UNION BANCSHARES,CONSOLIDATED BALANCE SHEETS
DECEMBER 31, 20162019 AND 20152018
(Dollar amounts in thousands except per share amounts)
| | | | | | | | |
| | | 2016 | | | 2015 | |
| ASSETS | | | | | | | | |
Cash and due from banks | | $ | 23,413 | | | $ | 20,289 | |
Federal funds sold | | | 830 | | | | 281 | |
| | | | | | | | |
Total cash and cash equivalents | | | 24,243 | | | | 20,570 | |
Securities available for sale | | | 146,813 | | | | 133,825 | |
Loans, net | | | 657,701 | | | | 608,747 | |
Mortgage loans held for sale, less allowance for fair market adjustment of $160 at December 31, 2016 | | | 11,831 | | | | 55,093 | |
Accrued interest receivable | | | 3,786 | | | | 3,096 | |
Premises and equipment, net | | | 9,093 | | | | 9,196 | |
Restricted equity securities, at cost | | | 7,133 | | | | 6,244 | |
Other real estate, net | | | — | | | | 1,149 | |
Cash surrender value of life insurance contracts | | | 24,827 | | | | 20,077 | |
Deferred tax assets, net | | | 3,437 | | | | 2,383 | |
Goodwill | | | 11,404 | | | | 11,404 | |
Core deposit intangibles | | | 1,582 | | | | 1,938 | |
Other assets | | | 10,134 | | | | 2,682 | |
| | | | | | | | |
| | |
TOTAL ASSETS | | $ | 911,984 | | | $ | 876,404 | |
| | | | | | | | |
| | |
| LIABILITIES AND STOCKHOLDERS’ EQUITY | | | | | | | | |
LIABILITIES | | | | | | | | |
Deposits | | | | | | | | |
Demand | | $ | 134,792 | | | $ | 111,309 | |
Interest-bearing demand | | | 85,478 | | | | 95,397 | |
Savings and money market deposit accounts | | | 183,788 | | | | 181,316 | |
Time | | | 359,776 | | | | 251,986 | |
| | | | | | | | |
Total deposits | | | 763,834 | | | | 640,008 | |
Accrued interest payable | | | 107 | | | | 55 | |
Federal funds purchased | | | 3,671 | | | | — | |
Federal Home Loan Bank advances | | | 32,287 | | | | 135,759 | |
Dividends payable | | | 1,711 | | | | 1,489 | |
Other liabilities | | | 3,455 | | | | 2,342 | |
| | | | | | | | |
| | |
TOTAL LIABILITIES | | | 805,065 | | | | 779,653 | |
| | | | | | | | |
| | |
STOCKHOLDERS’ EQUITY | | | | | | | | |
Preferred stock, $1 par value; 10,000,000 shares authorized; no shares issued to date | | | — | | | | — | |
Common stock, $1 par value; 30,000,000 shares authorized; 7,778,309 and 7,279,620 shares issued and outstanding at December 31, 2016 and 2015, respectively | | | 7,778 | | | | 7,280 | |
Additionalpaid-in capital | | | 89,045 | | | | 84,520 | |
Retained earnings | | | 12,212 | | | | 4,987 | |
Accumulated other comprehensive loss | | | (2,116 | ) | | | (36 | ) |
| | | | | | | | |
| | |
TOTAL STOCKHOLDERS’ EQUITY | | | 106,919 | | | | 96,751 | |
| | | | | | | | |
| | |
TOTAL LIABILITIES AND STOCKHOLDERS’ EQUITY | | $ | 911,984 | | | $ | 876,404 | |
| | | | | | | | |
|
| | | | | | | |
| | 2019 | | 2018 |
| ASSETS | | | |
| Cash and due from banks | $ | 50,990 |
| | $ | 34,807 |
|
| Federal funds sold | 52 |
| | 371 |
|
| Total cash and cash equivalents | 51,042 |
| | 35,178 |
|
| Securities available for sale | 260,293 |
| | 296,323 |
|
| Loans, net | 1,397,374 |
| | 1,220,184 |
|
| Mortgage loans held for sale, net | 37,476 |
| | 15,823 |
|
| Accrued interest receivable | 7,111 |
| | 8,214 |
|
| Premises and equipment, net | 21,376 |
| | 22,033 |
|
| Restricted equity securities, at cost | 11,279 |
| | 11,690 |
|
| Other real estate, net | 750 |
| | 1,000 |
|
| Cash surrender value of life insurance contracts | 46,632 |
| | 45,513 |
|
| Deferred tax assets, net | 3,933 |
| | 7,428 |
|
| Goodwill | 43,642 |
| | 43,642 |
|
| Core deposit intangibles | 7,270 |
| | 8,219 |
|
| Other assets | 10,289 |
| | 9,091 |
|
| | | | |
| TOTAL ASSETS | $ | 1,898,467 |
| | $ | 1,724,338 |
|
| | | | |
| LIABILITIES AND STOCKHOLDERS’ EQUITY | | | |
| LIABILITIES | | | |
| Deposits | | | |
| Demand | $ | 260,073 |
| | $ | 216,937 |
|
| Interest-bearing demand | 152,718 |
| | 154,218 |
|
| Savings and money market deposit accounts | 408,724 |
| | 401,308 |
|
| Time | 762,274 |
| | 665,440 |
|
| Total deposits | 1,583,789 |
| | 1,437,903 |
|
| Accrued interest payable | 2,022 |
| | 1,063 |
|
| Subordinated debentures | 70,883 |
| | 11,603 |
|
| Federal Home Loan Bank advances | 10,737 |
| | 57,498 |
|
| Dividends payable | 76 |
| | 1,036 |
|
| Other liabilities | 7,207 |
| | 6,821 |
|
| | | | |
| TOTAL LIABILITIES | 1,674,714 |
| | 1,515,924 |
|
| | | | |
|
| | | | | | | |
| | 2019 | | 2018 |
| | | | |
| STOCKHOLDERS’ EQUITY | | | |
| Preferred stock, $1 par value; 10,000,000 shares authorized; no shares issued to date | $ | — |
| | $ | — |
|
| Common stock, $1 par value; 30,000,000 shares authorized; 11,206,254 and 11,530,810 shares issued and outstanding at December 31, 2019 and 2018, respectively | 11,206 |
| | 11,531 |
|
| Additional paid-in capital | 167,006 |
| | 173,238 |
|
| Retained earnings | 40,472 |
| | 27,329 |
|
| Accumulated other comprehensive income (loss) | 5,069 |
| | (3,684 | ) |
| | | | |
| TOTAL STOCKHOLDERS’ EQUITY | 223,753 |
| | 208,414 |
|
| | | | |
| TOTAL LIABILITIES AND STOCKHOLDERS’ EQUITY | $ | 1,898,467 |
| | $ | 1,724,338 |
|
See accompanying notes to consolidated financial
statements.COMMERCE UNION BANCSHARES,statements
CONSOLIDATED STATEMENTS OF OPERATIONS
FOR THE YEARS ENDED DECEMBER 31, 2016, 20152019, 2018 AND 20142017
(Dollar amounts in thousands except per share amounts)
| | | | | | | | | | | | |
| | | 2016 | | | 2015 | | | 2014 | |
INTEREST INCOME | | | | | | | | | | | | |
Interest and fees on loans | | $ | 31,905 | | | $ | 26,017 | | | $ | 14,659 | |
Interest and fees on loans held for sale | | | 773 | | | | 1,523 | | | | 718 | |
Interest on investment securities, taxable | | | 724 | | | | 881 | | | | 1,024 | |
Interest on investment securities, nontaxable | | | 2,211 | | | | 1,185 | | | | 641 | |
Federal funds sold and other | | | 402 | | | | 282 | | | | 173 | |
| | | | | | | | | | | | |
| | | |
TOTAL INTEREST INCOME | | | 36,015 | | | | 29,888 | | | | 17,215 | |
| | | | | | | | | | | | |
| | | |
INTEREST EXPENSE | | | | | | | | | | | | |
Deposits | | | | | | | | | | | | |
Demand | | | 182 | | | | 190 | | | | 148 | |
Savings and money market deposit accounts | | | 632 | | | | 466 | | | | 330 | |
Time | | | 1,835 | | | | 1,416 | | | | 797 | |
Federal Home Loan Bank advances and other | | | 714 | | | | 646 | | | | 354 | |
| | | | | | | | | | | | |
| | | |
TOTAL INTEREST EXPENSE | | | 3,363 | | | | 2,718 | | | | 1,629 | |
| | | | | | | | | | | | |
| | | |
NET INTEREST INCOME | | | 32,652 | | | | 27,170 | | | | 15,586 | |
| | | |
PROVISION FOR LOAN LOSSES | | | 968 | | | | (270 | ) | | | (1,500 | ) |
| | | | | | | | | | | | |
| | | |
NET INTEREST INCOME AFTER PROVISION FOR LOAN LOSSES | | | 31,684 | | | | 27,440 | | | | 17,086 | |
| | | | | | | | | | | | |
| | | |
NONINTEREST INCOME | | | | | | | | | | | | |
Service charges on deposit accounts | | | 1,239 | | | | 958 | | | | 617 | |
Gains on mortgage loans sold, net | | | 6,317 | | | | 10,999 | | | | 3,447 | |
Gain (loss) on securities transactions, net (reclassified from other comprehensive income) | | | 36 | | | | (388 | ) | | | 143 | |
Gain (loss) on sale of other real estate | | | 301 | | | | 6 | | | | (8 | ) |
Other | | | 907 | | | | 807 | | | | 409 | |
| | | | | | | | | | | | |
| | | |
TOTAL NONINTEREST INCOME | | | 8,800 | | | | 12,382 | | | | 4,608 | |
| | | | | | | | | | | | |
| | | |
NONINTEREST EXPENSE | | | | | | | | | | | | |
Salaries and employee benefits | | | 18,256 | | | | 18,657 | | | | 10,170 | |
Occupancy | | | 3,174 | | | | 3,387 | | | | 2,599 | |
Information technology | | | 2,486 | | | | 2,479 | | | | 1,399 | |
Advertising and public relations | | | 702 | | | | 1,213 | | | | 559 | |
Audit, legal and consulting | | | 1,287 | | | | 1,892 | | | | 714 | |
Federal deposit insurance | | | 438 | | | | 383 | | | | 264 | |
Provision for losses on other real estate | | | 70 | | | | 110 | | | | 72 | |
Other operating | | | 3,961 | | | | 3,448 | | | | 1,389 | |
| | | | | | | | | | | | |
| | | |
TOTAL NONINTEREST EXPENSE | | | 30,374 | | | | 31,569 | | | | 17,166 | |
| | | | | | | | | | | | |
| | | |
INCOME BEFORE PROVISION FOR INCOME TAXES | | | 10,110 | | | | 8,253 | | | | 4,528 | |
| | | |
INCOME TAX EXPENSE | | | 2,213 | | | | 2,271 | | | | 1,816 | |
| | | | | | | | | | | | |
| | | |
CONSOLIDATED NET INCOME | | | 7,897 | | | | 5,982 | | | | 2,712 | |
| | | | | | | | | | | | |
| | | |
NONCONTROLLING INTEREST IN NET (INCOME) LOSS OF SUBSIDIARY | | | 1,039 | | | | (407 | ) | | | 1,184 | |
| | | | | | | | | | | | |
| | | |
NET INCOME ATTRIBUTABLE TO COMMON SHAREHOLDERS | | $ | 8,936 | | | $ | 5,575 | | | $ | 3,896 | |
| | | | | | | | | | | | |
| | | |
Basic net income attributable to common shareholders, per share | | $ | 1.18 | | | $ | 0.88 | | | $ | 0.98 | |
| | | | | | | | | | | | |
Diluted net income attributable to common shareholders, per share | | $ | 1.16 | | | $ | 0.86 | | | $ | 0.96 | |
| | | | | | | | | | | | |
|
| | | | | | | | | | | |
| | Year Ended
December 31, |
| | 2019 | | 2018 | | 2017 |
| INTEREST INCOME | | | | | |
| Interest and fees on loans | $ | 68,421 |
| | $ | 58,351 |
| | $ | 34,176 |
|
| Interest and fees on loans held for sale | 961 |
| | 1,278 |
| | 868 |
|
| Interest on investment securities, taxable | 2,099 |
| | 1,836 |
| | 691 |
|
| Interest on investment securities, nontaxable | 6,452 |
| | 6,605 |
| | 3,904 |
|
| Federal funds sold and other | 1,252 |
| | 1,155 |
| | 519 |
|
| | | | | | |
| TOTAL INTEREST INCOME | 79,185 |
| | 69,225 |
| | 40,158 |
|
| | | | | | |
| INTEREST EXPENSE | | | | | |
| Deposits | | | | | |
| Demand | 384 |
| | 366 |
| | 173 |
|
| Savings and money market deposit accounts | 4,154 |
| | 2,589 |
| | 748 |
|
| Time | 17,361 |
| | 9,862 |
| | 4,095 |
|
| Federal Home Loan Bank advances and other | 543 |
| | 1,855 |
| | 655 |
|
| Subordinated debentures | 938 |
| | 724 |
| | — |
|
| | | | | | |
| TOTAL INTEREST EXPENSE | 23,380 |
| | 15,396 |
| | 5,671 |
|
| | | | | | |
| NET INTEREST INCOME | 55,805 |
| | 53,829 |
| | 34,487 |
|
| | | | | | |
| PROVISION FOR LOAN LOSSES | 1,211 |
| | 1,035 |
| | 1,316 |
|
| | | | | | |
| NET INTEREST INCOME AFTER PROVISION FOR LOAN LOSSES | 54,594 |
| | 52,794 |
| | 33,171 |
|
| | | | | | |
| NONINTEREST INCOME | | | | | |
| Service charges on deposit accounts | 3,746 |
| | 3,419 |
| | 1,251 |
|
| Gains on mortgage loans sold, net | 4,905 |
| | 4,418 |
| | 3,675 |
|
| Gain on securities transactions, net | 1,451 |
| | 43 |
| | 59 |
|
| Gain on sale of other real estate | 166 |
| | 259 |
| | 27 |
|
| Gain (loss) on disposal of premises and equipment | — |
| | 13 |
| | (52 | ) |
| Earnings on bank owned life insurance contracts | 1,119 |
| | 1,186 |
| | 836 |
|
| Other | 577 |
| | 308 |
| | 214 |
|
| | | | | | |
| TOTAL NONINTEREST INCOME | 11,964 |
| | 9,646 |
| | 6,010 |
|
|
| | | | | | | | | | | |
| | Year Ended
December 31, |
| | 2019 | | 2018 | | 2017 |
| NONINTEREST EXPENSE | | | | | |
| Salaries and employee benefits | $ | 30,514 |
| | $ | 27,510 |
| | $ | 18,432 |
|
| Occupancy | 5,423 |
| | 4,949 |
| | 3,353 |
|
| Information technology | 6,213 |
| | 5,333 |
| | 2,715 |
|
| Advertising and public relations | 1,293 |
| | 600 |
| | 264 |
|
| Audit, legal and consulting | 2,302 |
| | 2,976 |
| | 1,508 |
|
| Federal deposit insurance | 605 |
| | 793 |
| | 399 |
|
| Provision for losses on other real estate | 98 |
| | — |
| | — |
|
| Merger expenses | 1,603 |
| | 2,774 |
| | 1,426 |
|
| Other operating | 5,841 |
| | 5,626 |
| | 2,979 |
|
| | | | | | |
| TOTAL NONINTEREST EXPENSE | 53,892 |
| | 50,561 |
| | 31,076 |
|
| | | | | | |
| INCOME BEFORE PROVISION FOR INCOME TAXES | 12,666 |
| | 11,879 |
| | 8,105 |
|
| | | | | | |
| INCOME TAX EXPENSE | 2,129 |
| | 1,372 |
| | 1,942 |
|
| | | | | | |
| CONSOLIDATED NET INCOME | 10,537 |
| | 10,507 |
| | 6,163 |
|
| | | | | | |
| NONCONTROLLING INTEREST IN NET LOSS OF SUBSIDIARY | 5,659 |
| | 3,578 |
| | 1,083 |
|
| | | | | | |
| NET INCOME ATTRIBUTABLE TO COMMON SHAREHOLDERS | $ | 16,196 |
| | $ | 14,085 |
| | $ | 7,246 |
|
| | | | | | |
| Basic net income attributable to common shareholders, per share | $ | 1.44 |
| | $ | 1.24 |
| | $ | 0.89 |
|
| Diluted net income attributable to common shareholders, per share | $ | 1.44 |
| | $ | 1.23 |
| | $ | 0.88 |
|
See accompanying notes to consolidated financial
statements.COMMERCE UNION BANCSHARES,statements
CONSOLIDATED STATEMENTS OF COMPREHENSIVE INCOME
FOR THE YEARS ENDED DECEMBER 31, 2016, 20152019, 2018 AND 20142017
(Dollar amounts in thousands except per share amounts)
| | | | | | | | | | | | |
| | | 2016 | | | 2015 | | | 2014 | |
| | | |
Consolidated net income | | $ | 7,897 | | | $ | 5,982 | | | $ | 2,712 | |
| | | |
Other comprehensive income (loss) | | | | | | | | | | | | |
Net unrealized gains (losses) onavailable-for-sale securities, net of tax of $(1,275), $(17) and $892 for the years ended December 31, 2016, 2015 and 2014, respectively | | | (2,058 | ) | | | (25 | ) | | | 1,440 | |
| | | |
Reclassification adjustment for (gains) losses included in net income, net of tax of $(14), $149 and $(55) for the years ended December 31, 2016, 2015 and 2014, respectively | | | (22 | ) | | | 239 | | | | (88 | ) |
| | | |
Amortization of unrealized holding loss related to transfer of securities from available for sale to held to maturity, net of tax of $26 for the year ended December 31, 2014 | | | — | | | | — | | | | 39 | |
| | | | | | | | | | | | |
| | | |
TOTAL OTHER COMPREHENSIVE INCOME (LOSS) | | | (2,080 | ) | | | 214 | | | | 1,391 | |
| | | | | | | | | | | | |
| | | |
TOTAL COMPREHENSIVE INCOME | | $ | 5,817 | | | $ | 6,196 | | | $ | 4,103 | |
| | | | | | | | | | | | |
|
| | | | | | | | | | | | |
| | | 2019 | | 2018 | | 2017 |
| Consolidated net income | | $ | 10,537 |
| | $ | 10,507 |
| | $ | 6,163 |
|
| | | | | | | |
| Other comprehensive income (loss) | | | | | | |
| Net unrealized gains (losses) on available-for-sale securities, net of tax of $(3,718), $1,513 and $(2,102) for the years ended December 31, 2019, 2018 and 2017, respectively | | 10,508 |
| | (4,277 | ) | | 3,384 |
|
| | | | | | | |
| Net unrealized losses on interest rate swap derivatives, net of tax of $242 and $301 for the years ended December 31, 2019 and 2018, respectively | | (683 | ) | | (852 | ) | | — |
|
| | | | | | | |
| Reclassification adjustment for gains included in net income, net of tax of $379, $11 and $23 for the years ended December 31, 2019, 2018 and 2017, respectively | | (1,072 | ) | | (32 | ) | | (36 | ) |
| | | | | | | |
| TOTAL OTHER COMPREHENSIVE INCOME (LOSS) | | 8,753 |
| | (5,161 | ) | | 3,348 |
|
| | | | | | | |
| TOTAL COMPREHENSIVE INCOME | | $ | 19,290 |
| | $ | 5,346 |
| | $ | 9,511 |
|
See accompanying notes to consolidated financial
statements.COMMERCE UNION BANCSHARES,statements
CONSOLIDATED STATEMENTS OF CHANGES IN STOCKHOLDERS’ EQUITY
FOR THE YEARS ENDED DECEMBER 31, 2016, 20152019, 2018 AND 20142017
(Dollar amounts in thousands except per share amounts)
| | | | | | | | | | | | | | | | | | | | | | | | | | | | |
| | | | | | | | | | | | | | | ACCUMULATED | | | | | | | |
| | | | | | | | | ADDITIONAL | | | | | | OTHER | | | | | | | |
| | | COMMON STOCK | | | PAID-IN | | | RETAINED | | | COMPREHENSIVE | | | NONCONTROLLING | | | | |
| | | SHARES | | | AMOUNT | | | CAPITAL | | | EARNINGS | | | INCOME (LOSS) | | | INTEREST | | | TOTAL | |
BALANCE - JANUARY 1, 2014 | | | 3,910,191 | | | $ | 3,910 | | | $ | 38,925 | | | $ | (2,212 | ) | | $ | (1,641 | ) | | $ | — | | | $ | 38,982 | |
Stock based compensation expense | | | — | | | | — | | | | 32 | | | | — | | | | — | | | | — | | | | 32 | |
Stock issuance costs | | | — | | | | — | | | | (2 | ) | | | — | | | | — | | | | — | | | | (2 | ) |
Noncontrolling interest contributions | | | — | | | | — | | | | — | | | | — | | | | — | | | | 1,184 | | | | 1,184 | |
Cash dividend declared to common shareholders ($0.20 per share) | | | — | | | | — | | | | — | | | | (783 | ) | | | — | | | | — | | | | (783 | ) |
Net income (loss) | | | — | | | | — | | | | — | | | | 3,896 | | | | — | | | | (1,184 | ) | | | 2,712 | |
Other comprehensive income | | | — | | | | — | | | | — | | | | — | | | | 1,391 | | | | — | | | | 1,391 | |
| | | | | | | | | | | | | | | | | | | | | | | | | | | | |
BALANCE - DECEMBER 31, 2014 | | | 3,910,191 | | | | 3,910 | | | | 38,955 | | | | 901 | | | | (250 | ) | | | — | | | | 43,516 | |
Stock based compensation expense | | | — | | | | — | | | | 104 | | | | — | | | | — | | | | — | | | | 104 | |
Shares retained by shareholders of Commerce Union Bancshares, Inc., net of stock issuance costs of $741 | | | 3,069,030 | | | | 3,069 | | | | 44,091 | | | | — | | | | — | | | | — | | | | 47,160 | |
Conversion shares issued to shareholders of Reliant Bank | | | 83,015 | | | | 83 | | | | (83 | ) | | | — | | | | — | | | | — | | | | — | |
Exercise of stock options | | | 186,884 | | | | 187 | | | | 1,633 | | | | — | | | | — | | | | — | | | | 1,820 | |
Restricted stock awards | | | 30,500 | | | | 31 | | | | (31 | ) | | | — | | | | — | | | | — | | | | — | |
Stock issuance costs | | | — | | | | — | | | | (149 | ) | | | — | | | | — | | | | — | | | | (149 | ) |
Noncontrolling interest distributions | | | — | | | | — | | | | — | | | | — | | | | — | | | | (407 | ) | | | (407 | ) |
Cash dividend declared to common shareholders ($0.20 per share) | | | — | | | | — | | | | — | | | | (1,489 | ) | | | — | | | | — | | | | (1,489 | ) |
Net income | | | — | | | | — | | | | — | | | | 5,575 | | | | — | | | | 407 | | | | 5,982 | |
Other comprehensive income | | | — | | | | — | | | | — | | | | — | | | | 214 | | | | — | | | | 214 | |
| | | | | | | | | | | | | | | | | | | | | | | | | | | | |
BALANCE - DECEMBER 31, 2015 | | | 7,279,620 | | | | 7,280 | | | | 84,520 | | | | 4,987 | | | | (36 | ) | | | — | | | | 96,751 | |
Stock based compensation expense | | | — | | | | — | | | | 251 | | | | — | | | | — | | | | — | | | | 251 | |
Exercise of stock options | | | 476,889 | | | | 477 | | | | 4,295 | | | | — | | | | — | | | | — | | | | 4,772 | |
Restricted stock awards | | | 23,800 | | | | 23 | | | | (23 | ) | | | — | | | | — | | | | — | | | | — | |
Restricted stock forfeiture | | | (2,000 | ) | | | (2 | ) | | | 2 | | | | — | | | | — | | | | — | | | | — | |
Noncontrolling interest contributions | | | — | | | | — | | | | — | | | | — | | | | — | | | | 1,039 | | | | 1,039 | |
Cash dividend declared to common shareholders ($0.22 per share) | | | — | | | | — | | | | — | | | | (1,711 | ) | | | — | | | | — | | | | (1,711 | ) |
Net income (loss) | | | — | | | | — | | | | — | | | | 8,936 | | | | — | | | | (1,039 | ) | | | 7,897 | |
Other comprehensive loss | | | — | | | | — | | | | — | | | | — | | | | (2,080 | ) | | | — | | | | (2,080 | ) |
| | | | | | | | | | | | | | | | | | | | | | | | | | | | |
BALANCE - DECEMBER 31, 2016 | | | 7,778,309 | | | $ | 7,778 | | | $ | 89,045 | | | $ | 12,212 | | | $ | (2,116 | ) | | $ | — | | | $ | 106,919 | |
| | | | | | | | | | | | | | | | | | | | | | | | | | | | |
|
| | | | | | | | | | | | | | | | | | | | | | | | | | | |
| | | | | | | ADDITIONAL | | | | ACCUMULATED OTHER | | | | |
| | | COMMON STOCK | | PAID-IN | | RETAINED | | COMPREHENSIVE | | NONCONTROLLING | | |
| | | SHARES | | AMOUNT | | CAPITAL | | EARNINGS | | INCOME (LOSS) | | INTEREST | | TOTAL |
| BALANCE- JANUARY 1, 2017 | | 7,778,309 |
| | $ | 7,778 |
| | $ | 89,045 |
| | $ | 12,212 |
| | $ | (2,116 | ) | | $ | — |
| | $ | 106,919 |
|
| Stock based compensation expense | | — |
| | — |
| | 616 |
| | — |
| | — |
| | — |
| | 616 |
|
| Exercise of stock options | | 72,080 |
| | 72 |
| | 751 |
| | — |
| | — |
| | — |
| | 823 |
|
| Restricted stock awards | | 50,050 |
| | 50 |
| | (50 | ) | | — |
| | — |
| | — |
| | — |
|
| Restricted stock forfeiture | | (3,000 | ) | | (3 | ) | | 3 |
| | — |
| | — |
| | — |
| | — |
|
| Common stock, net of issuance cost of $1,805 | | 1,137,000 |
| | 1,137 |
| | 22,072 |
| | — |
| | — |
| | — |
| | 23,209 |
|
| Noncontrolling interest contributions | | — |
| | — |
| | — |
| | — |
| | — |
| | 1,083 |
| | 1,083 |
|
| Cash dividend declared to common shareholders ($0.24 per share) | | — |
| | — |
| | — |
| | (2,024 | ) | | — |
| | — |
| | (2,024 | ) |
| Net income (loss) | | — |
| | — |
| | — |
| | 7,246 |
| | — |
| | (1,083 | ) | | 6,163 |
|
| Reclassification of federal income tax rate change | | — |
| | — |
| | — |
| | (245 | ) | | 245 |
| | — |
| | — |
|
| Other comprehensive income | | — |
| | — |
| | — |
| | — |
| | 3,348 |
| | — |
| | 3,348 |
|
| BALANCE- DECEMBER 31, 2017 | | 9,034,439 |
| | 9,034 |
| | 112,437 |
| | 17,189 |
| | 1,477 |
| | — |
| | 140,137 |
|
| Stock based compensation expense | | — |
| | — |
| | 923 |
| | — |
| | — |
| | — |
| | 923 |
|
| Exercise of stock options | | 30,001 |
| | 30 |
| | 368 |
| | — |
| | — |
| | — |
| | 398 |
|
| Restricted stock awards | | 51,710 |
| | 52 |
| | (52 | ) | | — |
| | — |
| | — |
| | — |
|
| Restricted stock forfeiture | | (1,550 | ) | | (2 | ) | | 2 |
| | — |
| | — |
| | — |
| | — |
|
| Conversion shares issued to shareholders of Community First, Inc. | | 2,416,444 |
| | 2,417 |
| | 59,566 |
| | — |
| | — |
| | — |
| | 61,983 |
|
| Shares acquired from dissenting shareholder | | (234 | ) | | — |
| | (6 | ) | | — |
| | — |
| | — |
| | (6 | ) |
| Noncontrolling interest contributions | | — |
| | — |
| | — |
| | — |
| | — |
| | 3,578 |
| | 3,578 |
|
| Cash dividend declared to common shareholders ($0.33 per share) | | — |
| | — |
| | — |
| | (3,945 | ) | | — |
| | — |
| | (3,945 | ) |
| Net income (loss) | | — |
| | — |
| | — |
| | 14,085 |
| | — |
| | (3,578 | ) | | 10,507 |
|
|
| | | | | | | | | | | | | | | | | | | | | | | | | | | |
| Other comprehensive loss | | — |
| | — |
| | — |
| | — |
| | (5,161 | ) | | — |
| | (5,161 | ) |
| BALANCE- DECEMBER 31, 2018 | | 11,530,810 |
| | 11,531 |
| | 173,238 |
| | 27,329 |
| | (3,684 | ) | | — |
| | 208,414 |
|
| Stock based compensation expense | | — |
| | — |
| | 1,222 |
| | — |
| | — |
| | — |
| | 1,222 |
|
| Exercise of stock options | | 34,714 |
| | 34 |
| | 405 |
| | — |
| | — |
| | — |
| | 439 |
|
| Employee Stock Purchase Plan stock issuance | | 8,512 |
| | 9 |
| | 152 |
| | — |
| | — |
| | — |
| | 161 |
|
| Restricted stock awards | | 9,500 |
| | 10 |
| | (10 | ) | | — |
| | — |
| | — |
| | — |
|
| Restricted shares withheld for taxes | | (3,601 | ) | | (4 | ) | | (84 | ) | | — |
| | — |
| | — |
| | (88 | ) |
| Restricted stock and dividend forfeiture | | (7,750 | ) | | (8 | ) | | 8 |
| | — |
| | — |
| | — |
| | — |
|
| Common stock shares redeemed | | (365,931 | ) | | (366 | ) | | (7,925 | ) | | — |
| | — |
| | — |
| | (8,291 | ) |
| Noncontrolling interest contributions | | — |
| | — |
| | — |
| | — |
| | — |
| | 5,659 |
| | 5,659 |
|
| Cash dividend declared to common shareholders ($0.27 per share) | | — |
| | — |
| | — |
| | (3,053 | ) | | — |
| | — |
| | (3,053 | ) |
| Net income (loss) | | — |
| | — |
| | — |
| | 16,196 |
| | — |
| | (5,659 | ) | | 10,537 |
|
| Other comprehensive income | | — |
| | — |
| | — |
| | — |
| | 8,753 |
| | — |
| | 8,753 |
|
| BALANCE - DECEMBER 31, 2019 | | 11,206,254 |
| | $ | 11,206 |
| | $ | 167,006 |
| | $ | 40,472 |
| | $ | 5,069 |
| | $ | — |
| | $ | 223,753 |
|
See accompanying notes to consolidated financial
statements.COMMERCE UNION BANCSHARES,statements
CONSOLIDATED STATEMENTS OF CASH FLOWS
FOR THE YEARS ENDED DECEMBER 31, 2016, 20152019, 2018 AND 20142017
(Dollar amounts in thousands except per share amounts)
| | | | | | | | | | | | |
| | | 2016 | | | 2015 | | | 2014 | |
OPERATING ACTIVITIES | | | | | | | | | | | | |
Consolidated net income | | $ | 7,897 | | | $ | 5,982 | | | $ | 2,712 | |
Adjustments to reconcile consolidated net income to net cash provided (used) in operating activities | | | | | | | | | | | | |
Provision for loan losses | | | 968 | | | | (270 | ) | | | (1,500 | ) |
Deferred income taxes | | | 235 | | | | (203 | ) | | | 830 | |
Depreciation and amortization of premises and equipment | | | 976 | | | | 890 | | | | 567 | |
Net amortization of securities | | | 1,551 | | | | 1,110 | | | | 391 | |
Net realized (gains) losses on sales of securities | | | (36 | ) | | | 388 | | | | (143 | ) |
Gains on mortgage loans sold, net | | | (6,317 | ) | | | (10,999 | ) | | | (3,447 | ) |
Stock-based compensation expense | | | 251 | | | | 104 | | | | 32 | |
Loss (gain) on sale of other real estate | | | (301 | ) | | | (6 | ) | | | 8 | |
Provision for losses on other real estate | | | 70 | | | | 110 | | | | 72 | |
Increase in cash surrender value of life insurance contracts | | | (750 | ) | | | (541 | ) | | | (360 | ) |
Mortgage loans originated for resale | | | (158,457 | ) | | | (409,338 | ) | | | (108,498 | ) |
Proceeds from sale of mortgage loans | | | 208,036 | | | | 391,884 | | | | 87,985 | |
Amortization of core deposit intangible | | | 356 | | | | 300 | | | | 131 | |
Change in | | | | | | | | | | | | |
Accrued interest receivable | | | (690 | ) | | | (465 | ) | | | (105 | ) |
Other assets | | | (6,580 | ) | | | (1,357 | ) | | | (120 | ) |
Accrued interest payable | | | 52 | | | | (107 | ) | | | 26 | |
Other liabilities | | | 1,501 | | | | (167 | ) | | | 631 | |
| | | | | | | | | | | | |
| | | |
TOTAL ADJUSTMENTS | | | 40,865 | | | | (28,667 | ) | | | (23,500 | ) |
| | | | | | | | | | | | |
| | | |
NET CASH PROVIDED BY (USED IN) OPERATING ACTIVITIES | | | 48,762 | | | | (22,685 | ) | | | (20,788 | ) |
| | | | | | | | | | | | |
| | | |
INVESTING ACTIVITIES | | | | | | | | | | | | |
Activities in available for sale securities | | | | | | | | | | | | |
Purchases | | | (59,332 | ) | | | (62,556 | ) | | | (22,364 | ) |
Sales | | | 31,782 | | | | 6,609 | | | | 14,732 | |
Maturities, prepayments and calls | | | 9,255 | | | | 7,297 | | | | 2,000 | |
Activities in held to maturity securities | | | | | | | | | | | | |
Sales | | | — | | | | 20,649 | | | | — | |
Maturities, prepayments and calls | | | — | | | | — | | | | 105 | |
Purchases of restricted equity securities | | | (889 | ) | | | (1,007 | ) | | | (436 | ) |
Loan originations and payments, net | | | (49,922 | ) | | | (51,480 | ) | | | (30,227 | ) |
Purchase of buildings, leasehold improvements, and equipment | | | (873 | ) | | | (926 | ) | | | (340 | ) |
Proceeds from sale of other real estate | | | 1,313 | | | | 568 | | | | 91 | |
Improvement of other real estate | | | (16 | ) | | | — | | | | — | |
Purchase of life insurance contracts | | | (4,000 | ) | | | (4,000 | ) | | | (2,000 | ) |
Cash received in merger | | | — | | | | 12,378 | | | | — | |
| | | | | | | | | | | | |
| | | |
NET CASH USED IN INVESTING ACTIVITIES | | | (72,682 | ) | | | (72,468 | ) | | | (38,439 | ) |
| | | | | | | | | | | | |
| | | |
FINANCING ACTIVITIES | | | | | | | | | | | | |
Net change in deposits | | | 123,826 | | | | 57,848 | | | | 44,564 | |
Net change in federal funds purchased | | | 3,671 | | | | (6,651 | ) | | | 6,651 | |
Advances from (repayments to) Federal Home Loan Bank, net | | | (103,472 | ) | | | 51,403 | | | | 8,500 | |
Issuance of common stock | | | 4,772 | | | | 1,820 | | | | — | |
Stock issuance costs | | | — | | | | (149 | ) | | | (2 | ) |
Noncontrolling interest contributions received | | | 285 | | | | 305 | | | | 775 | |
Cash dividends paid on common stock | | | (1,489 | ) | | | — | | | | (783 | ) |
| | | | | | | | | | | | |
| | | |
NET CASH PROVIDED BY FINANCING ACTIVITIES | | | 27,593 | | | | 104,576 | | | | 59,705 | |
| | | | | | | | | | | | |
| | | |
NET INCREASE IN CASH AND CASH EQUIVALENTS | | | 3,673 | | | | 9,423 | | | | 478 | |
CASH AND CASH EQUIVALENTS - BEGINNING OF PERIOD | | | 20,570 | | | | 11,147 | | | | 10,669 | |
| | | | | | | | | | | | |
CASH AND CASH EQUIVALENTS - END OF PERIOD | | $ | 24,243 | | | $ | 20,570 | | | $ | 11,147 | |
| | | | | | | | | | | | |
|
| | | | | | | | | | | |
| | 2019 | | 2018 | | 2017 |
| OPERATING ACTIVITIES | | | | | |
| Consolidated net income | $ | 10,537 |
| | $ | 10,507 |
| | $ | 6,163 |
|
| Reclassification of federal income tax rate change | — |
| | — |
| | (245 | ) |
| Adjustments to reconcile consolidated net income to net cash provided by (used in) operating activities | | | | | |
| Provision for loan losses | 1,211 |
| | 1,035 |
| | 1,316 |
|
| Provision to reflect lower of cost or market value of mortgage loans held for sale | — |
| | — |
| | (160 | ) |
| Deferred income taxes | 398 |
| | 380 |
| | 504 |
|
| (Gain) loss on disposal of premises and equipment | — |
| | (13 | ) | | 52 |
|
| Depreciation and amortization of premises and equipment | 1,996 |
| | 1,697 |
| | 1,017 |
|
| Net amortization of securities | 3,051 |
| | 3,182 |
| | 2,030 |
|
| Net realized gains on sales of securities | (1,451 | ) | | (43 | ) | | (59 | ) |
| Gains on mortgage loans sold, net | (4,905 | ) | | (4,418 | ) | | (3,675 | ) |
| Stock-based compensation expense | 1,222 |
| | 923 |
| | 616 |
|
| Realization of gain on other real estate | (166 | ) | | (259 | ) | | (27 | ) |
| Provision for losses on other real estate | 98 |
| | — |
| | — |
|
| Increase in cash surrender value of life insurance contracts | (1,119 | ) | | (1,186 | ) | | (836 | ) |
| Mortgage loans originated for resale | (179,331 | ) | | (141,783 | ) | | (157,220 | ) |
| Proceeds from sale of mortgage loans | 162,583 |
| | 176,610 |
| | 127,564 |
|
| Other amortization (accretion), net | 2,503 |
| | (756 | ) | | (377 | ) |
| Change in | | | | | |
| Accrued interest receivable | 1,103 |
| | (1,305 | ) | | (1,958 | ) |
| Other assets | (1,198 | ) | | (372 | ) | | 4,371 |
|
| Accrued interest payable | 959 |
| | 326 |
| | 198 |
|
| Other liabilities | (1,606 | ) | | (2,260 | ) | | 403 |
|
| TOTAL ADJUSTMENTS | (14,652 | ) | | 31,758 |
| | (26,241 | ) |
| NET CASH PROVIDED BY (USED IN) OPERATING ACTIVITIES | (4,115 | ) | | 42,265 |
| | (20,323 | ) |
| INVESTING ACTIVITIES | | | | | |
| Cash received from merger | — |
| | 33,128 |
| | — |
|
| Activities in available for sale securities | | | | | |
| Purchases | (50,430 | ) | | (106,893 | ) | | (95,430 | ) |
| Sales | 85,895 |
| | 100,737 |
| | 18,688 |
|
| Maturities, prepayments and calls | 12,807 |
| | 12,987 |
| | 6,763 |
|
| Purchases (redemptions) of restricted equity securities | 411 |
| | (2,190 | ) | | (641 | ) |
| Loan originations and payments, net | (180,881 | ) | | (145,090 | ) | | (105,478 | ) |
| Purchase of buildings, leasehold improvements, and equipment | (1,339 | ) | | (4,342 | ) | | (1,766 | ) |
| Proceeds from sale of other real estate | 1,261 |
| | 1,947 |
| | — |
|
| Purchase of life insurance contracts | — |
| | — |
| | (8,000 | ) |
| | | | | | |
|
| | | | | | | | | | | |
| | 2019 | | 2018 | | 2017 |
| NET CASH USED IN INVESTING ACTIVITIES | (132,276 | ) | | (109,716 | ) | | (185,864 | ) |
| FINANCING ACTIVITIES | | | | | |
| Net change in deposits | 145,897 |
| | 121,960 |
| | 119,685 |
|
| Net change in federal funds purchased | — |
| | — |
| | (3,671 | ) |
| Net change in advances from Federal Home Loan Bank | (46,707 | ) | | (39,195 | ) | | 64,514 |
|
| Issuance of subordinate debentures, net of issuance costs | 59,198 |
| | — |
| | — |
|
| Issuance of common stock, net | 600 |
| | 398 |
| | 24,032 |
|
| Redemption of common stock | (8,379 | ) | | (6 | ) | | — |
|
| Noncontrolling interest contributions received | 5,659 |
| | 2,255 |
| | 1,245 |
|
| Cash dividends paid on common stock | (4,013 | ) | | (3,451 | ) | | (3,193 | ) |
| NET CASH PROVIDED BY FINANCING ACTIVITIES | 152,255 |
| | 81,961 |
| | 202,612 |
|
| NET CHANGE IN CASH AND CASH EQUIVALENTS | 15,864 |
| | 14,510 |
| | (3,575 | ) |
| CASH AND CASH EQUIVALENTS - BEGINNING OF PERIOD | 35,178 |
| | 20,668 |
| | 24,243 |
|
| CASH AND CASH EQUIVALENTS - END OF PERIOD | $ | 51,042 |
| | $ | 35,178 |
| | $ | 20,668 |
|
See accompanying notes to consolidated financial
statements.COMMERCE UNION BANCSHARES,statements
CONSOLIDATED STATEMENTS OF CASH FLOWS (CONTINUED)
FOR THE YEARS ENDED DECEMBER 31, 2016, 20152019, 2018 AND 20142017
(Dollar amounts in thousands except per share amounts)
| | | | | | | | | | | | |
| | | 2016 | | | 2015 | | | 2014 | |
SUPPLEMENTAL DISCLOSURE OF CASH FLOW INFORMATION: | | | | | | | | | | | | |
Cash paid during the period for | | | | | | | | | | | | |
Interest | | $ | 3,311 | | | $ | 2,742 | | | $ | 1,603 | |
Taxes | | | 3,091 | | | | 4,232 | | | | 142 | |
| | | |
Non-cash investing and financing activities | | | | | | | | | | | | |
Unrealized gain (loss) on securitiesavailable-for-sale | | $ | (3,369 | ) | | $ | 293 | | | $ | 2,439 | |
Change in due to/from noncontrolling interest | | | 754 | | | | (712 | ) | | | 409 | |
Foreclosures transferred from loans to other real estate | | | — | | | | 622 | | | | — | |
Dividends declared, not paid | | | 1,711 | | | | 1,489 | | | | — | |
|
| | | | | | | | | | | |
| | 2019 | | 2018 | | 2017 |
| SUPPLEMENTAL DISCLOSURE OF CASH FLOW INFORMATION: | | | | | |
| Cash paid during the year for | | | | | |
| Interest | $ | 22,421 |
| | $ | 14,638 |
| | $ | 5,473 |
|
| Taxes | 1,303 |
| | 1,400 |
| | 1,750 |
|
| | | | | | |
| Non-cash investing and financing activities | | | | | |
| Unrealized gain (loss) on securities available-for-sale | $ | 13,842 |
| | $ | (6,925 | ) | | $ | 5,380 |
|
| Unrealized gain (loss) on derivatives | (1,992 | ) | | (690 | ) | | 47 |
|
| Change in due to/from noncontrolling interest | 5,659 |
| | 3,578 |
| | 1,083 |
|
| Foreclosures transferred from loans to other real estate | 943 |
| | 1,060 |
| | — |
|
| Dividends declared, not paid | 76 |
| | 1,036 |
| | 542 |
|
See accompanying notes to consolidated financial
statements.COMMERCE UNION BANCSHARES,statements
NOTES TO CONSOLIDATED FINANCIAL STATEMENTS
DECEMBER 31,
2016, 20152019, 2018 AND
20142017
(Dollar amounts in thousands except per share amounts)
NOTE 1 - SUMMARY OF SIGNIFICANT ACCOUNTING POLICIES
Nature of Operations
Reliant Bancorp, Inc. (f/k/a Commerce Union Bancshares, Inc.), is a Tennessee corporation and the holding company for and the sole shareholder of Reliant Bank. Reliant Bancorp is registered as a financial holding company under the Bank Holding Company Act of 1956 as amended ("Bank Holding Company Act"). Reliant Bank is a commercial bank chartered under Tennessee law and a member of the Federal Reserve System (the "Federal Reserve").
Reliant Bank, Reliant Bancorp's wholly-owned subsidiary, provides a full range of traditional banking products and services to corporate and consumer clients throughout Middle Tennessee and the Nashville-Davidson-Murfreesboro-Franklin, TN Metropolitan Statistical Area (the “Nashville MSA”) and Chattanooga, Tennessee. Reliant Bank operates banking centers in Cheatham, Davidson, Hamilton, Hickman, Maury, Montgomery, Robertson, Rutherford, Sumner, and Williamson counties, Tennessee. Additionally, Reliant Bank operates mortgage offices in Brentwood, Hendersonville, and Memphis, Tennessee, as well as two in Little Rock and two in Hot Springs, Arkansas.
On January 1, 2020, Tennessee Community Bank Holdings, Inc., a community banking organization headquartered in Ashland City, Tennessee, was merged with and into the Company (See Note 27).
Basis of Presentation
The accounting and reporting policies of
Commerce Union Bancshares,Reliant Bancorp, Inc.
and Subsidiaries (“the Company”) conform to
accounting principles generally accepted in the United States of AmericaUS GAAP and to general practices within the banking industry. The following is a brief summary of the significant policies.
Principles of Consolidation
The consolidated financial statements as of and for the periods presented include the accounts of Commerce Union Bancshares, Inc, itsReliant Bancorp, the Bank, Community First Trups Holding Company (“TRUPS”), which is wholly owned subsidiary,by Reliant Bank (the “Bank”Bancorp, Reliant Investment Holdings, LLC ("Holdings"), which is 100% wholly owned by the Bank’s wholly-owned subsidiaries, Commerce Union Mortgage Services, Inc. (inactiveBank, and terminated in September 2016), Reliant Investments, LLC (inactiveRMV, of which the Bank controls 51% of the governance rights (Reliant Bancorp, the Bank, Holdings, TRUPS, and terminated in September 2016), andRMV are collectively referred to herein as the Bank’s majority controlled subsidiary, Reliant Mortgage Ventures, LLC. “Company”).
All significant intercompany balances and transactions have been eliminated in consolidation. As described in Note 21, Commerce Union Bancshares, Inc.22, Reliant Bancorp and Reliant BankCommunity First merged effective AprilJanuary 1, 2015.2018.
During 2011, the Bank and another entity organized RMV. Under the related operating agreement, the non-controlling member receives 70% of the profits of RMV, and the Bank receives 30% of the profits once the non-controlling member recovers its aggregate losses. The merger was accountednon-controlling member is responsible for as a reverse acquisition, and as a result,100% of RMV’s net losses. As of December 31, 2019, the historical financial statements presented forcumulative losses to date totaled $13.4 million. RMV will have to generate net income of this amount before the Company are the historical financial statementswill participate in future earnings.
RELIANT BANCORP, INC.
NOTES TO CONSOLIDATED FINANCIAL STATEMENTS (CONTINUED)
DECEMBER 31, 2019, 2018 AND 2017
(Dollar amounts in
the United States of America (“U.S. GAAP”) and to general practices in the banking industry.Nature of Operations
The Company began its organizational activities in 2005. The Company provides financial services through its offices in Williamson, Robertson, Davidson, and Sumner Counties. Its primary deposit products are checking, savings, and term certificate accounts, and its primary lending products are commercial and residential construction loans, commercial loans, installment loans and lines secured by home equity. Substantially all loans are secured by specific items of collateral including commercial and residential real estate, business assets, and consumer assets. Commercial loans are expected to be repaid from cash flow from operations of businesses.
At December 31, 2016, the Company had significant credit exposures to borrowers in real estate. If this industry experiences another economic slowdown and, as a result, the borrowers in this industry are unable to meet the obligations of their existing loan agreements, earnings could be negatively impacted.
thousands except per share amounts)
NOTE 1 - SUMMARY OF SIGNIFICANT ACCOUNTING POLICIES (CONTINUED)
The preparation of financial statements in conformity with
accounting principles generally accepted in the United States of AmericaUS GAAP, which requires management to make estimates and assumptions based on available information. These estimates and assumptions affect the reported amounts of assets and liabilities and disclosure of contingent assets and liabilities at the date of the consolidated financial statements and the reported amounts of revenues and expenses during the reporting period.
COMMERCE UNION BANCSHARES, INC.
NOTES TO CONSOLIDATED FINANCIAL STATEMENTS (CONTINUED)
DECEMBER 31, 2016, 2015 AND 2014
(Dollar amounts in thousands except per share amounts)
NOTE 1 - SUMMARY OF SIGNIFICANT ACCOUNTING POLICIES (CONTINUED)
Use of Estimates (Continued)
Actual results could differ from those estimates. Material estimates that are particularly susceptible to significant change in the near term relate to determination of the allowance for loan losses, the valuation of other real estate, the valuation of debt and equity securities, the valuation of deferred tax assets and fair values of financial instruments.
Concentrations
At December 31, 2019 and 2018, the Company had significant credit exposures to borrowers in real estate. If this industry experiences another economic slowdown and, as a result, the borrowers in this industry are unable to meet the obligations of their existing loan agreements, earnings could be negatively impacted. The Company is concentrated in the middle Tennessee regional market and the operating results are impacted by the economic conditions of that area.
Cash and Cash Equivalents
For purposes of reporting cash flows, cash and cash equivalents include cash on hand, deposits with other financial institutions with maturities less than 90 days, and federal funds sold. Generally, federal funds sold are purchased and sold for
one-day periods. Net cash flows are reported for customer loan and deposit transactions,
securities sold under repurchase agreements, federal funds sold, and short-term Federal Home Loan Bank
("FHLB") borrowings.
The Company maintains deposits in excess of the federal insurance amounts with other financial institutions. Management makes deposits only with financial institutions it considers financially sound.
Federal funds sold of
$830$52 and
$281$371 at December 31,
20162019 and
2015,2018, respectively, were invested in
twoone financial
institutions.institution. Such funds were unsecured and matured the next business day.
The Company classifies its securities in one of two categories: held to maturity
("HTM") and available for
sale. Held to maturitysale ("AFS"). HTM securities are those securities for which the Company has the ability and intent to hold until maturity. Securities are classified as
available for saleAFS when they might be sold before maturity.
As theThe Company
sold securities in thehad no held to maturity
classification during 2015, it currently classifies all securities
as available for sale.at December 31, 2019 and 2018, or in the three-year period ended December 31, 2019.
Interest income includes purchase premiums and discounts amortized or accreted over the life of the related security as an adjustment to the yield without anticipating prepayments, except for mortgage-backed securities where prepayments are anticipated. Gains and losses on sales are recorded on the trade date and determined using the specific identification
method.method including reclassification from other comprehensive income.
When the fair value of a debt security has declined below the amortized cost at the measurement date, if an entity intends to sell a security or is more likely than not to sell the security before the recovery of the security’s cost basis, the entity must recognize the other-than-temporary impairment
(OTTI)(“OTTI”) in earnings. For a debt security with a fair value below the amortized cost at the measurement date where it is more likely than not that an entity will not sell the security before the recovery of its cost basis, but an entity does not expect to recover the entire cost basis of the security, the security is classified as OTTI.
COMMERCE UNION BANCSHARES,
NOTES TO CONSOLIDATED FINANCIAL STATEMENTS (CONTINUED)
DECEMBER 31,
2016, 20152019, 2018 AND
20142017
(Dollar amounts in thousands except per share amounts)
NOTE 1 - SUMMARY OF SIGNIFICANT ACCOUNTING POLICIES (CONTINUED)
Securities (Continued)
The related OTTI loss on the debt security will be recognized in earnings to the extent
that the loss is due to the declining credit quality of the
credit losses,issuer, with the remaining impairment loss recognized in accumulated other comprehensive income. In estimating OTTI losses, management considers: the length of time and extent that fair value of the security has been less than the cost of the security, the financial condition and near term prospects of the issuer, cash flow, stress testing analysis on securities, when applicable, and the Company’s ability and intent to hold the security for a period sufficient to allow for any anticipated recovery in fair value.
Loans
Loans
Loans-Held-for-Investment
Loans-held-for-investment (LHFS) that management has the intent and ability to hold for the foreseeable future or until maturity or payoff are reported at the principal balance outstanding, net of unearned interest, deferred loan fees, and an allowance for loan
losses.losses (ALLL). Interest income is accrued on the unpaid principal balance. Loan origination fees, net of certain direct origination costs, are deferred and recognized in interest income using
a straight-linethe level yield method without anticipating prepayments. This treatment does not materially differ from the level interest yield method. Past due status is determined based on the contractual terms of the note.
The accrual of interest is discontinued when a loan becomes 90 days past due according to the contractual terms of the note unless it is well collateralized and in the process of collection, or when management believes, after considering economic and business conditions and collection efforts, that the principal or interest will not be collectible in the normal course of business. When a loan is placed on
non-accrual status, previously accrued and uncollected interest is charged against interest income on loans. When full collection of the remaining book balance is uncertain, interest payments received are applied to the principal balance outstanding. In some cases, when the remaining book balance of the loan is deemed fully collectible, payments are treated as interest income on a cash basis. Loans are returned to accrual status when all the principal and interest amounts contractually due are brought current and future payments are reasonably assured.
The restructuring of a loan is considered a “troubled debt restructuring” if the borrower is experiencing financial difficulties and the Company has granted a concession. Concessions may include interest rate reductions or below market interest rates, principal forgiveness, restructuring amortization schedules and other actions intended to minimize potential losses.
COMMERCE UNION BANCSHARES, INC.
NOTES TO CONSOLIDATED FINANCIAL STATEMENTS (CONTINUED)
DECEMBER 31, 2016, 2015 AND 2014
(Dollar amounts in thousands except per share amounts)
NOTE 1 - SUMMARY OF SIGNIFICANT ACCOUNTING POLICIES (CONTINUED)
Allowance for Loan
LossesLoss
The allowance for loan lossesloss ("ALLL") is a valuation allowance foran estimate of future probable incurred credit losses. Loan lossesLosses on loans-held-for-investment are charged against the allowanceALLL when management believes the uncollectibility of a loanremaining balance is confirmed.due has become uncollectible. Subsequent recoveries, if any, are credited to the allowance.ALLL. Management estimates a general component to the allowance balance required usingALLL based on historical loan loss experience and qualitative factors, which include, 1) the nature and volume of the portfolio, information about specific borrower situations and estimated collateral values,2) current economic conditions (national and local), and other factors such as3) changes in interest rates, 4) portfolio concentrations, 5) changes in the experience, ability, and depth of the lending function, and 6) levels of and trends incharged-off loans, recoveries, past duepast-due loans and volume and severity of classified loans. The allowance consists of
A specific
and general components. The specificALLL component
relates tois calculated for loans that
are individually classified as impaired. The general component coversnon-impaired loans and is based on historical loss experience adjusted for current factors. The entire allowance is available for any loan that, in management’s judgment, should be charged off.During 2011,meet the Company added an unallocated general reserve. This unallocated portiondefinition of the reserve was above the allocated amount calculated for each loan pool segment based on each loan pool’s historical loss experience adjusted for current economic and environmental factors. This unallocated reserve was added due to the volatility in credit losses and the uncertainty risk that is not specifically identified with any particular loan pool segment. It also recognized that the current recessionary period manifested in higher and more unpredictable loss rates over an extended period of time. Management believed the decline in real estate values over the past several years as well as the continued slowness in general economic recovery supported maintaining an unallocated portion of the general reserve. During 2015, management determined that the decline in real estate values had subsided and, accordingly, management has removed the unallocated portion of the general reserve.
impairment. A loan is considered impaired when full payment undermanagement believes that principal and interest due on that loan will not be collected in accordance with the terms and conditions of the loan terms is not expected. All classified loans and loans onnon-accrual status are individually evaluated for impairment. Factors considered in determining ifagreement. Once a loan is deemed to be impaired, includemanagement must calculate the borrower’s abilitypotential loss for the specific loan based on one of three approved methodologies to repay amounts owed, collateral deficiencies,estimate the risk ratingexpected recovery from secondary payment sources, which is then deducted from the book value of the loan and economic conditions affectingasset to calculate the borrower’s industry, among other things. If a loan is impaired, a portionamount of specific reserve required, 1) fair value of collateral, less expected cost to sell, 2) discounted cash flows of the allowance is allocated so that theexpected future loan is reported, net, at the present value of estimated future cash flows using the loan’s existing rate or at the fair value (less estimated costspayments, and 3) expected sale proceeds if loan was sold to sell) of collateral if repayment is expected solely from the collateral. another lender.
Interest payments on impaired loans are typically applied to principal unless the principal amount is deemed fully collectible, in which case interest is recognized on a cash basis. When recognition of interest income on a cash basis is appropriate, the amount of income recognized is limited to what would have been accrued on the remaining principal balance at the contractual rate. Cash payments received over this limit, and not applied to reduce the loans remaining principal balance, are recorded as recoveries of prior charge-offs until these charge-offs have been fully recovered.
COMMERCE UNION BANCSHARES,
NOTES TO CONSOLIDATED FINANCIAL STATEMENTS (CONTINUED)
DECEMBER 31,
2016, 20152019, 2018 AND
20142017
(Dollar amounts in thousands except per share amounts)
NOTE 1 - SUMMARY OF SIGNIFICANT ACCOUNTING POLICIES (CONTINUED)
A loan is impaired when full payment under the loan terms is not expected. All classified loans and loans on non-accrual status are individually evaluated for impairment. Factors considered in determining if a loan is impaired include the borrower’s ability to repay amounts owed, collateral deficiencies, the risk rating of the loan and economic conditions affecting the borrower’s industry, among other things. Interest payments on impaired loans are typically applied to principal unless the principal amount is deemed fully collectible, in which case interest is recognized on a cash basis. When recognition of interest income on a cash basis is appropriate, the amount of income recognized is limited to what would have been accrued on the remaining principal balance at the contractual rate. Cash payments received over this limit, and not applied to reduce the loans remaining principal balance, are recorded as recoveries of prior charge-offs until these charge-offs have been fully recovered.
Mortgage Loans Held for Sale
Mortgage loans originated with the intent to sell to third party investors are classified as held for
sale.sale (LHFS). Such loans are carried at the lower of aggregate cost or market value, as determined by
outstanding commitments from investors.pricing on an individual loan basis. These loans are typically marketed to potential investors prior to closing the loan with the borrower. Net unrealized losses, if any, are recorded through a valuation allowance and charged to operations.
At December 31, 2016, aThe valuation allowance of $160
existing at January 1, 2017, was
attributable to mortgage loans held for sale. The related servicing rights are generally sold withremoved in the
loans.year ended December 31, 2017.
Transfers of Financial Assets
Transfers of financial assets are accounted for as sales, when control over the assets has been relinquished. Control over transferred assets is deemed to be surrendered when the assets have been isolated from the Company, the transferee obtains the right (free of conditions that constrain it from taking advantage of that right) to pledge or exchange the transferred assets, and the Company does not maintain effective control over the transferred assets through an agreement to repurchase them before maturity.
Premises and equipment are stated at cost less accumulated depreciation. Depreciation is computed using the straight-line method over the estimated useful lives of the related assets or the terms of the related lease for leasehold improvements. The range of estimated useful lives for buildings is 30 to 40 years, for leasehold improvements is 3 to 25 years, which correlates with the applicable lease term, and for furniture, fixtures and equipment is 3 to 7 years. Gain or loss on items retired and otherwise disposed of is credited or charged to operations and the cost and related accumulated depreciation are removed from the asset and accumulated depreciation accounts.
Expenditures and improvements of premises and equipment are capitalized and those for maintenance and repairs are charged to earnings as incurred.
Restricted Equity Securities
Each member of the Federal Reserve is required to subscribe to Federal Reserve Bank (“FRB”) stock.
The Bank is a member of the Federal Home Loan Bank (“FHLB”)
system. Members aresystem and the Federal Reserve system and is required to
own a certain amount ofhold stock
based on the level of borrowings and other factors, and may invest in
additional amounts.both entities.
These
stocksinvestments are carried at cost, classified as restricted equity securities, and periodically evaluated for impairment based on ultimate recovery of par value.
Both cash and stock dividends are reported as income.COMMERCE UNION BANCSHARES,
NOTES TO CONSOLIDATED FINANCIAL STATEMENTS (CONTINUED)
DECEMBER 31,
2016, 20152019, 2018 AND
20142017
(Dollar amounts in thousands except per share amounts)
NOTE 1 - SUMMARY OF SIGNIFICANT ACCOUNTING POLICIES (CONTINUED)
Real estate acquired in the settlement of loans is initially recorded at estimated fair value, less estimated cost to sell, if less than the carrying value of the loan when acquired. Based on periodic evaluations by management, the carrying values are reduced by a direct charge to earnings when they exceed net realizable value. Costs relating to the development and improvement of the property are capitalized up to fair value less cost to sell, while holding costs of the property are charged to expense in the period incurred.
Cash Surrender Value of Life Insurance Contracts
The Company is the owner and beneficiary of various life insurance policies on certain key employees. These policies are recorded at their cash surrender values.
Impairment ofLong-Term Assets Premises and equipment and other long-term assets are reviewed for impairment when events indicate their carrying amount may not be recoverable from future undiscounted cash flows. If impaired, the assets are written down to fair value, with a corresponding charge to earnings.
Goodwill represents
thatthe excess of the purchase price
of over the fair value of assets and liabilities acquired in
two previous business acquisitions and a
2015 businessbranch acquisition
(see Note 21) and intreated as a
2009 business acquisition. Goodwill is evaluated for impairment at least annually and more frequently if events and circumstances indicate that the asset might be impaired.
Securities Sold Under Agreements to Repurchase
All repurchase agreement liabilities represent amounts advanced by a customer of the Company. Securities are pledged to cover these liabilities, which are not covered by federal deposit insurance.
Loan Commitments and Related Financial Instruments
Financial instruments include
off-balance sheet credit instruments, such as commitments to make loans and commercial letters of credit, issued to meet customer financing needs. The face amount for these items represents the exposure to loss, before considering customer collateral or ability to repay. Such financial instruments are recorded when they are funded.
COMMERCE UNION BANCSHARES,
Derivatives
At the inception of a derivative contract, the Company designates the derivative as one of three types based on the Company's intentions and belief as to the likely effectiveness as a hedge. These three types are (1) a hedge of the fair value of a recognized asset or liability or of an unrecognized firm commitment ("fair value hedge"), (2) a hedge of a forecasted transaction or the variability of cash flows to be received or paid related to a recognized asset or liability ("cash flow hedge"), or (3) an instrument with no hedging designation ("stand-alone derivative"). For a fair value hedge, the gain or loss on the derivative, as well as the offsetting loss or gain on the hedged item, are recognized in current earnings as fair values change. For a cash flow hedge, the gain or loss on the derivative is reported in other comprehensive income and is reclassified into earnings in the same periods during which the hedged transaction affects earnings. For both types of hedges, changes in the fair value of derivatives that are not highly effective in hedging the changes in fair value or expected cash flows of the hedged item are recognized immediately in current earnings.
Net cash settlements on derivatives that qualify for hedge accounting are recorded in interest income or interest expense, based on the item being hedged. Net cash settlements on derivatives that do not qualify for hedge accounting are reported in non-interest income. Cash flows on hedges are classified in the cash flow statement the same as the cash flows of the items being hedged.
NOTES TO CONSOLIDATED FINANCIAL STATEMENTS (CONTINUED)
DECEMBER 31,
2016, 20152019, 2018 AND
20142017
(Dollar amounts in thousands except per share amounts)
NOTE 1 - SUMMARY OF SIGNIFICANT ACCOUNTING POLICIES (CONTINUED)
Derivatives, (Continued)
The Company formally documents the relationship between derivatives and hedged items, as well as the risk-management objective and the strategy for undertaking hedge transactions at the inception of the hedging relationship. This documentation includes linking fair value or cash flow hedges to specific assets and liabilities on the balance sheet or to specific firm commitments or forecasted transactions. The Company also formally assesses, both at the hedge's inception and on an ongoing basis, whether the derivative instruments that are used are highly effective in offsetting changes in fair values or cash flows of the hedged items. The Company discontinues hedge accounting when it determines that the derivate is no longer effective in offsetting changes in the fair value or cash flows of the hedged item, the derivative is settled or terminates, a hedged forecasted transaction is no longer probable, a hedged firm commitment is no longer firm, or treatment of the derivative as a hedge is no longer appropriate or intended.
When hedge accounting is discontinued, subsequent changes in fair value of the derivative are recorded as non-interest income. When a fair value hedge is discontinued, the hedged asset or liability is no longer adjusted for changes in fair value and the existing basis adjustment is amortized or accreted over the remaining life of the asset or liability. When a cash flow hedge is discontinued but the hedged cash flows or forecasted transactions are still expected to occur, gains or losses that were accumulated in other comprehensive income are amortized into earnings over the same periods which the hedged transactions will affect earnings.
Compensation cost recognized for stock options and restricted stock
and unit awards issued to employees is based on the fair value of these awards at the date of grant. A binomial model is utilized to estimate the fair value of stock options. Compensation cost is recognized over the required service period, generally defined as the vesting period.
Additionally, during 2016, the Company elected to adopt the provisions of ASU2016-09,“Compensation-StockCompensation(Topic718):ImprovementstoEmployeeShare-BasedPaymentAccounting,” in advance of the required application date of January 1, 2017. Our financial statements for 2016 are presented as if we adoptedASU 2016-09 on January 1, 2016 on a prospective basis and prior periods have not been restated. ASU2016-09 requires that all income tax effects related to settlements of share-based payment awards be reported in earnings as an increase (or decrease) to income tax expense. Previously, income tax benefits at settlement of an award were reported as an increase (or decrease) to additionalpaid-in capital to the extent that those benefits were greater than (or less than) the income tax benefits recognized in earnings during the award’s vesting period. The requirement to report those income tax effects in earnings has been applied to settlements occurring on or after January 1, 2016 and the impact of applying that guidance reduced reported income tax expense by $478, or approximately $0.06 per diluted common share, for 2016.
ASU2016-09 also requires that all incometax-related cash flows resulting from share-based payments be reported as operating activities in the statement of cash flows. Previously, income tax benefits at settlement of an award were reported as a reduction to operating cash flows and an increase to financing cash flows to the extent that those benefits exceeded the income tax benefits reported in earnings during the award’s vesting period.
Income tax expense or benefit is the total of the current year income tax due or refundable and the change in deferred tax assets and liabilities. Deferred tax assets and liabilities are the expected future tax amounts for the temporary differences between carrying amounts and tax bases of assets and liabilities, computed using enacted tax rates. A valuation allowance, if needed, reduces deferred tax assets to the
expected amount
expectedmost likely to be realized.
Realization of deferred tax assets is dependent upon the generation of a sufficient level of future taxable income and recoverable taxes paid in prior years. Although realization is not assured, management believes it is more likely than not that all of the deferred tax assets will be realized.
Management performs an evaluation of all income tax positions taken or expected to be taken in the course of preparing the Company’s income tax returns to determine whether the income tax positions meet a “more likely than not” standard of being sustained under examination by the applicable taxing authorities. Management has performed its evaluation of all income tax positions taken on all open income tax returns and has determined that there were no positions taken that do not meet the “more likely than not” standard. Penalties and interest relating to income taxes are recognized in income tax expense.
COMMERCE UNION BANCSHARES, INC.
NOTES TO CONSOLIDATED FINANCIAL STATEMENTS (CONTINUED)
DECEMBER 31, 2016, 2015 AND 2014
(Dollar amounts in thousands except per share amounts)
NOTE 1 - SUMMARY OF SIGNIFICANT ACCOUNTING POLICIES (CONTINUED)
Income Taxes (Continued)
The Company files income tax returns in the U.S. federal jurisdiction and various states. The Company’s federal and
statestates income tax returns for years prior to fiscal year
20132017 are no longer open to examination.
Certain returns from years in which net operating losses have occurred are still open for examination by the tax authorities.
Earnings per share is computed by dividing net income attributable to common shareholders by the weighted-average number of common shares outstanding. Diluted earnings per share is computed by dividing net income attributable to common shareholders by the weighted-average number of common shares outstanding plus shares representing the dilutive effect of stock options,
restricted stock awards and units, and employee stock purchase plan shares outstanding.
RELIANT BANCORP, INC.
NOTES TO CONSOLIDATED FINANCIAL STATEMENTS (CONTINUED)
DECEMBER 31, 2019, 2018 AND 2017
(Dollar amounts in thousands except per share amounts)
NOTE 1 - SUMMARY OF SIGNIFICANT ACCOUNTING POLICIES (CONTINUED)
The Company has a 401(k) retirement plan covering all employees who elect to participate, subject to certain eligibility requirements. The Plan allows employees to defer up to 100% of their salary, subject to regulatory limitations with the Company matching 100% of the first
3% and 50% of the next 2% which is6% contributed by the employee. The Company recognizes as expense the amount of matching contributions related to the 401(k) plan. Vesting within the plan is immediate for 100% of deferral and employer contributions.
Comprehensive income consists of net income
(loss) and other comprehensive income (loss). Other comprehensive income (loss) includes unrealized gains and losses on
AFS securities
available for sale and derivatives. These gains and losses are recognized as a separate component of stockholders’ equity.
Loss contingencies, including claims and legal actions arising in the ordinary course of business, are recorded as liabilities when the likelihood of loss is probable and an amount or range of loss can be reasonably estimated. Management does not believe there are such matters that will have a material effect on the consolidated financial statements.
Restrictions on Cash
Cash on hand or on deposit with the Federal Reserve Bank was required to meet regulatory reserve and clearing requirements. At December 31, 2016, the Company did not have a reserve balance to maintain and at December 31, 2015, the Company’s reserve requirement was $10,310.
COMMERCE UNION BANCSHARES, INC.
NOTES TO CONSOLIDATED FINANCIAL STATEMENTS (CONTINUED)
DECEMBER 31, 2016, 2015 AND 2014
(Dollar amounts in thousands except per share amounts)
NOTE 1 - SUMMARY OF SIGNIFICANT ACCOUNTING POLICIES (CONTINUED)
Preferred shares
have rights that can be set when issued as determined by the Board of Directors.
Banking regulations require maintaining certain capital levels and may limit the dividends paid by the Company to shareholders.
Advertising costs are expensed as incurred and totaled
$684, $1,117$1,293, $600 and
$403$264 for the years ended December 31,
2016, 20152019, 2018 and
2014.2017, respectively.
RELIANT BANCORP, INC.
NOTES TO CONSOLIDATED FINANCIAL STATEMENTS (CONTINUED)
DECEMBER 31, 2019, 2018 AND 2017
(Dollar amounts in thousands except per share amounts)
NOTE 1 - SUMMARY OF SIGNIFICANT ACCOUNTING POLICIES (CONTINUED)
Financial accounting standards relating to fair value measurements establish a framework for measuring fair value. That framework provides a fair value hierarchy that prioritizes the inputs to valuation techniques used to measure fair value. The hierarchy gives the highest priority to unadjusted quoted prices in active markets for identical assets or liabilities (Level 1 measurements) and the lowest priority to unobservable inputs (Level 3 measurements). The three levels of the fair value hierarchy are described below:
| | | | |
| |
| Level 1 | | Inputs to the valuation methodology are unadjusted quoted prices for identical assets or liabilities in active markets that the Company has the ability to access. |
| |
| Level 2 | | Inputs to the valuation methodology include: |
| | |
| | •
| | Quoted prices for similar assets or liabilities in active markets; |
| | |
| | •
| | Quoted prices for identical or similar assets or liabilities in inactive markets; |
| | |
| | •
| | Inputs other than quoted prices that are observable for the asset or liability; |
| | |
| | •
| | Inputs that are derived principally from or corroborated by the observable market data by correlation or other means. |
| |
| | If the asset or liability has a specified (contractual) term, the Level 2 input must be observable for substantially the full term of the asset or liability. |
Quoted prices for similar assets or liabilities in active markets;
Quoted prices for identical or similar assets or liabilities in inactive markets;
Inputs other than quoted prices that are observable for the asset or liability;
Inputs that are derived principally from or corroborated by the observable market data by correlation or other means.
If the asset or liability has a specified (contractual) term, the Level 2 input must be observable for substantially the full term of the asset or liability.
| |
| Level 3 | | Inputs to the valuation methodology are unobservable and reflect an entity’s own assumptions about the assumptions that market participants would use in pricing the assets or liabilities. |
An asset’s or liability’s fair value measurement level within the fair value hierarchy is based on the lowest level of any input that is significant to the fair value measurement. Valuation techniques should maximize the use of observable inputs and minimize the use of unobservable inputs.
COMMERCE UNION BANCSHARES, INC.
NOTES TO CONSOLIDATED FINANCIAL STATEMENTS (CONTINUED)
DECEMBER 31, 2016, 2015 AND 2014
(Dollar amounts in thousands except per share amounts)
NOTE 1 - SUMMARY OF SIGNIFICANT ACCOUNTING POLICIES (CONTINUED)
Fair Value Measurements (Continued)
Following is a description of the valuation methodologies used for assets and liabilities measured at fair value on a recurring basis:
AFS Securitiesavailableforsale:: The fair values of AFS securities available for sale are determined by obtaining quoted prices on nationally recognized securities exchanges (Level 1 inputs) or matrix pricing, which is a mathematical technique widely used in the industry to value debt securities without relying exclusively on quoted prices for the specific securities but rather by relying on the securities’ relationship to other benchmark quoted securities (Level 2 inputs). The Company obtains fair value measurements for
AFS securities
available for sale from an independent pricing service. The fair value measurements consider observable data that may include benchmark yields, reported trades, broker/dealer quotes, issuer spreads,
two-sided markets, benchmark securities, bids, offers, cash flows and reference data, including market research publications, among other things.
Interestrateswaps: The fair values of interest rate swaps are determined based on discounted future cash flows.
RELIANT BANCORP, INC.
NOTES TO CONSOLIDATED FINANCIAL STATEMENTS (CONTINUED)
DECEMBER 31, 2019, 2018 AND 2017
(Dollar amounts in thousands except per share amounts)
NOTE 1 - SUMMARY OF SIGNIFICANT ACCOUNTING POLICIES (CONTINUED)
Fair Value Measurements (Continued)
Certain assets and liabilities are measured at fair value on a nonrecurring basis; that is, the instruments are not measured at fair value on an ongoing basis, but are subject to fair value adjustments in certain circumstances (for example, when there is evidence of impairment). Assets and liabilities measured at fair value on a nonrecurring basis include the following:
ImpairedLoans loans: The fair value of impaired loans with specific allocations of the allowance for loan losses is generally based on the present value of expected payments using the loan’s effective rate as the discount rate or recent real estate appraisals. These appraisals may utilize a single valuation approach or a combination of approaches including comparable sales and the income approach. Adjustments are routinely made in the appraisal process by the appraisers to adjust for differences between the comparable sales and income data available. Such adjustments are typically significant and result in a Level 3 classification of the inputs for determining fair value.
Mortgage loans held for sale: Bid quotes are presently used for the fair value estimate of mortgage loans held for sale, while previously the Company used a model as developed and performed by an independent entity to value such loans.
Otherrealestateowned: The fair value of other real estate owned is generally based on recent real estate appraisals. These appraisals may utilize a single valuation approach or a combination of approaches including comparable sales and the income approach. Adjustments are routinely made in the appraisal process by the appraisers to adjust for differences between the comparable sales and income data available. Such adjustments are typically significant and result in a Level 3 classification of the inputs for determining fair value.No changes in the valuation methodologies have been made since the prior year.
COMMERCE UNION BANCSHARES, INC.
NOTES TO CONSOLIDATED FINANCIAL STATEMENTS (CONTINUED)
DECEMBER 31, 2016, 2015 AND 2014
(Dollar amounts in thousands except per share amounts)
NOTE 1 - SUMMARY OF SIGNIFICANT ACCOUNTING POLICIES (CONTINUED)
Fair Value Measurements (Continued)
The methods described above may produce a fair value calculation that may not be indicative of net realizable value or reflective of future fair values. Furthermore, while the Company’s valuation methods are appropriate and consistent with other market participants, the use of different methodologies or assumptions to determine the fair value of certain financial instruments could result in a different estimate of fair value at the reporting date.
Fair Value of Financial Instruments
Fair values of financial instruments are estimated using relevant market information and other assumptions, as more fully disclosed in Note
4.5. Fair value estimates involve uncertainties and matters of significant judgment regarding interest rates, credit risk, prepayments, and other factors, especially in the absence of broad markets for particular items. Changes in assumptions or in market conditions could significantly affect the estimates.
Certain reclassifications have been made in the
20152018 and
20142017 consolidated financial statements to conform to the
20162019 presentation. These reclassifications had no effect on
total assets, total liabilities or the results of operations previously reported.
RELIANT BANCORP, INC.
NOTES TO CONSOLIDATED FINANCIAL STATEMENTS (CONTINUED)
DECEMBER 31, 2019, 2018 AND 2017
(Dollar amounts in thousands except per share amounts)
NOTE 1 - SUMMARY OF SIGNIFICANT ACCOUNTING POLICIES (CONTINUED)
Recent Authoritative Accounting Guidance
The following discusses new authoritative accounting guidance and the related impact on the Company.
ASU2014-04,“Receivables-TroubledDebtRestructuringsbyCreditors(Subtopic310-40)”: Reclassification of Residential Real Estate Collateralized Consumer Mortgage Loans upon Foreclosure clarifies when substance repossession or foreclosure occurs. A creditor is considered to have received physical possession of residential real estate property collateralizing a consumer mortgage loan, upon either (1) the creditor obtaining legal title to the residential real estate property upon completion of a foreclosure or (2) the borrower conveying all interest in the residential real estate property to the creditor to satisfy that loan through completion of a deed in lieu of foreclosure or through a similar legal agreement. Additionally, the amendments require interim and annual disclosure of both (1) the amount of foreclosed residential real estate property held by the creditor and (2) the recorded investment in consumer mortgage loans collateralized by residential real estate property that are in the process of foreclosure according to local requirements of the applicable jurisdiction. ASU2014-11 became effective for the Company on January 1, 2015 and did not have a significant impact on the consolidated financial statements
COMMERCE UNION BANCSHARES, INC.
NOTES TO CONSOLIDATED FINANCIAL STATEMENTS (CONTINUED)
DECEMBER 31, 2016, 2015 AND 2014
(Dollar amounts in thousands except per share amounts)
NOTE 1 - SUMMARY OF SIGNIFICANT ACCOUNTING POLICIES (CONTINUED)
Recent Authoritative Accounting Guidance, (Continued)
ASU 2014-09, “ “RevenuefromContractswithCustomers(Topic606)606)” implements a common revenue standard that clarifies the principles for recognizing revenue. The principle element ofASU 2014-09 is that an entity should recognize revenue to depict the transfer of promised goods or services to customers in an amount that reflects the consideration to which the entity expects to be entitled in exchange for those goods or services. To achieve this principle, an entity should apply the following steps: (i) identify the contract(s) with a customer, (ii) identify the performance obligations in the contract, (iii) determine the transaction price, (iv) allocate the transaction price to the performance obligations in the contract and (v) recognize revenue when (or as) the entity satisfies a performance obligation. ASU2014-09 was originally going to be effective for usthe Company on January 1, 2017;2018; however, the FASB recently issuedASU 2015-14,“RevenuefromContractswithCustomers(Topic606)606) –DeferraloftheEffectiveDate” Date" which deferred the effective date ofASU 2014-09 by one year to January 1, 2018. Our revenue2019. Revenue is comprised of net interest income on financial assets and financial liabilities, which is explicitly excluded from the scope of ASU 2014-09, and non-interest income. The Company had no material impact in adopting ASU 2014-09 related to non-interest income (See Note 26).
ASU 2014-09,2016-01, “Financial Instruments – Overall (Subtopic 825-10): Recognition and Measurement of Financial Assets and Financial Liabilitiesnon-interest income. We do not expect these." ASU 2016-01, among other things, (i) requires equity investments, with certain exceptions, to be measured at fair value with changes
in fair value recognized in net income, (ii) simplifies the impairment assessment of equity investments without readily determinable fair values by requiring a qualitative assessment to
identify impairment, (iii) eliminates the requirement for public business entities to disclose the methods and significant assumptions used to estimate the fair value that is required to be disclosed for financial instruments measured at amortized cost on the balance sheet, (iv) requires public business entities to use the exit price notion when measuring the fair value of financial instruments for disclosure purposes, (v) requires an entity to present separately in other comprehensive income the portion of the total change in the fair value of a liability resulting from a change in the instrument-specific credit risk when the entity has elected to measure the liability at fair value in accordance with the fair value option for financial instruments, (vi) requires separate presentation of financial assets and financial liabilities by measurement category and form of financial asset on the balance sheet or the accompanying notes to the financial statements and (viii) clarifies that an entity should evaluate the need for a valuation allowance on a deferred tax asset related to available-for-sale securities. ASU 2016-01 was effective for us on January 1, 2019 and did not have a significant impact on our consolidated financial statements.
We continue to evaluate the impact ofASU 2014-09 on other components ofnon-interest income.ASU2014-11,“TransfersandServicing(Topic860)” requires thatrepurchase-to-maturity transactions be accounted for as secured borrowings consistent with the accounting for other repurchase agreements. In addition,ASU 2014-11 requires separate accounting for repurchase financings, which entails the transfer of a financial asset executed contemporaneously with a repurchase agreement with the same counterparty.ASU 2014-11 requires entities to disclose certain information about transfers accounted for as sales in transactions that are economically similar to repurchase agreements. In addition,ASU 2014-11 requires disclosures related to collateral, remaining contractual tenor and of the potential risks associated with repurchase agreements, securities lending transactions andrepurchase-to-maturity transactions. ASU2014-11 became effective for the Company on January 1, 2015 and did not have a significant impact on the consolidated financial statements.
ASU2015-02,“Consolidation(Topic810)–AmendmentstotheConsolidationAnalysis” implements changes to both the variable interest consolidation model and the voting interest consolidation model.ASU 2015-02 (1) eliminates certain criteria that must be met when determining when fees paid to a decision maker or service provider do not represent a variable interest, (2) amends the criteria for determining whether a limited partnership is a variable interest entity and (3) eliminates the presumption that a general partner controls a limited partnership in the voting model.ASU 2015-02 became effective for the Company on January 1, 2016 and did not have a significant impact on the consolidated financial statements.
COMMERCE UNION BANCSHARES, INC.
NOTES TO CONSOLIDATED FINANCIAL STATEMENTS (CONTINUED)
DECEMBER 31, 2016, 2015 AND 2014
(Dollar amounts in thousands except per share amounts)
NOTE 1 - SUMMARY OF SIGNIFICANT ACCOUNTING POLICIES (CONTINUED)
Recent Authoritative Accounting Guidance, (Continued)
ASU2015-03,“Interest–ImputationofInterest(Subtopic835-30)–SimplifyingthePresentationofDebtIssuanceCosts” requires that debt issuance costs related to a recognized debt liability be presented in the balance sheet as a direct deduction from the carrying amount of that debt liability, consistent with debt discounts. The recognition and measurement guidance for debt issuance costs are not affected by the amendments inASU 2015-03.ASU 2015-03 became effective for the Company on January 1, 2016 and did not have a significant impact on the consolidated financial statements.
ASU 2015-05,“Intangibles–GoodwillandOther-Internal-UseSoftware(Subtopic350-40)–Customer’sAccountingforFeesPaidinaCloudComputingArrangement” addresses accounting for fees paid by a customer in cloud computing arrangements such as (i) software as a service, (ii) platform as a service, (iii) infrastructure as a service and (iv) other similar hosting arrangements.ASU 2015-05 provides guidance to customers about whether a cloud computing arrangement includes a software license. If a cloud computing arrangement includes a software license, then the customer should account for the software license element of the arrangement consistent with the acquisition of other software licenses. If a cloud computing arrangement does not include a software license, the customer should account for the arrangement as a service contract.ASU 2015-05 became effective for the Company on January 1, 2016 and did not have a significant impact on the consolidated financial statements.
ASU 2015-16,“BusinessCombinations(Topic805)–SimplifyingtheAccountingforMeasurement-PeriodAdjustments” requires that adjustments to provisional amounts that are identified during the measurement period of a business combination be recognized in the reporting period in which the adjustment amounts are determined. Furthermore, the income statement effects of such adjustments, if any, must be calculated as if the accounting had been completed at the acquisition date. The portion of the amount recorded in current-period earnings that would have been recorded in previous reporting periods if the adjustment to the provisional amounts had been recognized as of the acquisition date. Under previous guidance, adjustments to provisional amounts identified during the measurement period are to be recognized retrospectively.ASU 2015-16 became effective for the Company on January 1, 2016 and did not have a significant impact on the consolidated financial statements.
ASU 2016-02, “Leases “Leases(Topic842)(Topic 842).”ASU 2016-02 will require requires lessees to recognize a lease liability, which is a lessee’slessee's obligation to make lease payments arising from a lease, measured on a discounted basis; and aright-of-use asset, which is an asset that represents the lessee’s right to use, or control the use of, a specified asset for the lease term.ASU 2016-02 will be effective for us on January 1, 20192020 and will require transition using a modified retrospective approach for leases existing at, or entered into after, the beginning of the earliest comparative period presented in the consolidated financial statements. We are evaluatingThe effect of implementing this pronouncement resulted in right to use assets of $12,032 and a corresponding lease liability.
ASU 2016-05, “Derivatives and Hedging (Topic 815) Effect of Derivative Contract Novations on Existing Hedge Accounting Relationships.” ASU 2016-05 clarifies that a change in the potentialcounterparty to a derivative instrument that has been designated as the hedging instrument under ASC Topic 815 does not, in and of itself, require dedesignation of that hedging relationship provided that all other hedge accounting criteria continue to be met. ASU 2016-05 became effective for the us on January 1, 2018 and did not have a significant impact ofASU 2016-02 on our consolidated financial statements.COMMERCE UNION BANCSHARES,
NOTES TO CONSOLIDATED FINANCIAL STATEMENTS (CONTINUED)
DECEMBER 31,
2016, 20152019, 2018 AND
20142017
(Dollar amounts in thousands except per share amounts)
NOTE 1 - SUMMARY OF SIGNIFICANT ACCOUNTING POLICIES (CONTINUED)
Recent Authoritative Accounting Guidance, (Continued)
ASU2016-07,“Investments-EquityMethodandJointVentures(Topic323):SimplifyingtheTransitiontotheEquityMethodofAccounting.” The amendments affect all entities that have an investment that becomes qualified for the equity method of accounting as a result of an increase in the level of ownership interest or degree of influence.ASU 2016-07 simplifies the transition to the equity method of accounting by eliminating retroactive adjustment of the investment when an investment qualifies for use of the equity method, among other things.ASU 2016-07 will be effective for the Company on January 1, 2017 and is not expected to have a significant impact on the consolidated financial statements.
ASU2016-09,“Compensation-StockCompensation(Topic718):ImprovementstoEmployeeShare-BasedPaymentAccounting.” UnderASU 2016-09, all excess tax benefits and tax deficiencies related to share-based payment awards should be recognized as income tax expense or benefit in the income statement during the period in which they occur. Previously, such amounts were recorded in the pool of excess tax benefits included in additionalpaid-in capital, if such pool was available. Because excess tax benefits are no longer recognized in additionalpaid-in capital, the assumed proceeds from applying the treasury stock method when computing earnings per share excludes the amount of excess tax benefits that would have previously been recognized in additionalpaid-in capital. Additionally, excess tax benefits should be classified along with other income tax cash flows as an operating activity rather than a financing activity, as was previously the case.ASU 2016-09 also provides that an entity can make an entity-wide accounting policy election to either estimate the number of awards that are expected to vest (current GAAP) or account for forfeitures when they occur.ASU 2016-09 changes the threshold to qualify for equity classification (rather than as a liability) to permit withholding up to the maximum statutory tax rates (rather than the minimum as was previously the case) in the applicable jurisdictions. The Company elected to adopt the provisions of ASU2016-09 in 2016 in advance of the required application date of January 1, 2017. The adoption of this standard reduced reported income tax expense by $478, or approximately $0.06 per diluted common share, for 2016. The Company did not apply the provisions of this pronouncement retrospectively.
COMMERCE UNION BANCSHARES, INC.
NOTES TO CONSOLIDATED FINANCIAL STATEMENTS (CONTINUED)
DECEMBER 31, 2016, 2015 AND 2014
(Dollar amounts in thousands except per share amounts)
NOTE 1 - SUMMARY OF SIGNIFICANT ACCOUNTING POLICIES (CONTINUED)
Recent Authoritative Accounting Guidance, (Continued)
ASU2016-13,“FinancialInstruments-CreditLosses(Topic326):MeasurementofCreditLossesonFinancialInstruments.”
ASU 2016-13, “Financial Instruments - Credit Losses (Topic 326): Measurement of Credit Losses on Financial Instruments.” ASU 2016-13 requires the measurement of all expected credit losses for financial assets held at the reporting date based on historical experience, current conditions, and reasonable and supportable forecasts and requires enhanced disclosures related to the significant estimates and judgments used in estimating credit losses, as well as the credit quality and underwriting standards of an organization’s portfolio. In addition,ASU 2016-13 amends the accounting for credit losses onavailable-for-sale available for sale debt securities and purchased financial assets with credit deterioration. On November 15, 2019, ASU 2019-10 "Financial Instruments - Credit Losses (Topic 326), Derivatives and Hedging (Topic 815), and Leases (Topic 842): Effective Dates"2016-13 will be was issued. As a smaller reporting company, ASU 2019-10 delays the effective
ondate of ASU 2016-13 to January 1,
2020.2023. We are currently evaluating the potential impact of
ASU 2016-13 on our financial statements.
We are currently developing an implementation plan to include assessment of processes, portfolio segmentation, model development, system requirements and the identification of data and resource needs, among other things. We are also in the process of implementing a third-party vendor solution to assist us in the application of the ASU2016-15 2016-13. The adoption of the ASU 2016-13 could result in an increase in the allowance for loan losses as a result of changing from an “incurred loss” model, which encompasses allowances for current known and inherent losses within the portfolio, to an “expected loss” model, which encompasses allowances for losses expected to be incurred over the life of the portfolio. Furthermore, ASU 2016-13 will necessitate that we establish an allowance for expected credit losses for certain debt securities and other financial assets. While we are currently unable to reasonably estimate the impact of adopting ASU 2016-13, we expect that the impact of adoption will be significantly influenced by the composition, characteristics and quality of our loan and securities portfolios as well as the prevailing economic conditions and forecasts as of the adoption date.,“StatementofCashFlows(Topic230)-ClassificationofCertainCashReceiptsandCashPayments.”
ASU 2016-152017-04, “ provides guidance relatedIntangibles - Goodwill and Other (Topic 350) - Simplifying the Test for Goodwill Impairment.” ASU 2017-04 eliminates Step 2 from the goodwill impairment test which required entities to certain cash flow issues in ordercompute the implied fair value of goodwill. Under ASU 2017-04, an entity should perform its annual, or interim, goodwill impairment test by comparing the fair value of a reporting unit with its carrying amount. An entity should recognize an impairment charge for the amount by which the carrying amount exceeds the reporting unit’s fair value; however, the loss recognized should not exceed the total amount of goodwill allocated to reduce the current and potential future diversity in practice.that reporting unit. ASU 2016-152017-04 will be effective for the Companyus on January 1, 2023, with earlier adoption permitted and is not currently expected to have a significant impact on our consolidated financial statements.
RELIANT BANCORP, INC.
NOTES TO CONSOLIDATED FINANCIAL STATEMENTS (CONTINUED)
DECEMBER 31, 2019, 2018 AND 2017
(Dollar amounts in thousands except per share amounts)
NOTE 1 - SUMMARY OF SIGNIFICANT ACCOUNTING POLICIES (CONTINUED)
Recent Authoritative Accounting Guidance, (Continued)
ASU 2017-12, “Derivatives and Hedging (Topic 815) - Targeted Improvements to Accounting for Hedging Activities.” ASU 2017-12 amends the hedge accounting recognition and presentation requirements in ASC 815 to improve the transparency and understandability of information conveyed to financial statement users about an entity’s risk management activities to better align the entity’s financial reporting for hedging relationships with those risk management activities and to reduce the complexity of and simplify the application of hedge accounting. ASU 2017-12 will be effective for us on January 1, 2020 and is not expected to have a significant impact on theour consolidated financial statements.
ASU 2016-16,2018-02“, “Income Statement - Reporting Comprehensive IncomeTaxes(Topic740) 220) -Intra-EntityTransfers Reclassification ofAssets Certain Tax Effects from Accumulated OtherThanInventory. Comprehensive Income.”Under ASU 2016-16 provides guidance stating that an entity should recognize the2018-02, entities may elect to reclassify certain income tax consequenceseffects related to the change in the U.S. statutory federal income tax rate under the Tax Cuts and Jobs Act, which was enacted on December 22, 2017, from accumulated other comprehensive income to retained earnings. ASU 2018-02 also requires certain accounting policy disclosures. We elected to adopt this change in accounting principle in the fourth quarter of 2017, which resulted in a decrease to retained earnings and an intra-entity transferincrease to accumulated other comprehensive income of an asset other than inventory when$245 in 2017 on the transfer occurs.consolidated statement of changes in stockholders’ equity.
ASU 2016-162018-13, “Fair Value Measurement (Topic 820) - Disclosure Framework-Changes to the Disclosure Requirements for Fair Value Measurement.” ASU 2018-13 modifies the disclosure requirements on fair value measurements in Topic 820. The amendments in this update remove disclosures that no longer are considered cost beneficial, modify/clarify the specific requirements of certain disclosures, and add disclosure requirements identified as relevant. ASU 2018-13 will be effective for the Companyus on January 1, 20182021, with early adoption permitted, and is not expected to have a significant impact on theour consolidated financial statements.
ASU 2016-18,2018-16,“Statement “Derivatives and Hedging (Topic 815) - Inclusion ofCashFlows(Topic230)-RestrictedCash. the Secured Overnight Financing Rate (SOFR) Overnight Index Swap (OIS) Rate as a Benchmark Interest Rate for Hedge Accounting Purposes.”The amendments in this update permit use of the OIS rate based on SOFR as a U.S. benchmark interest rate for hedge accounting purposes under Topic 815 in addition to the interest rates on direct U.S. Treasury obligations, the LIBOR swap rate, the OIS rate based on the Fed Funds Effective Rate and the Securities Industry and Financial Markets Association (SIFMA) Municipal Swap Rate. ASU 2018-16 was effective for us on January 1, 2020 and did not have a significant impact on our consolidated financial statements.
ASU 2016-182019-12, requires “Income Taxes (Topic 740) - Simplifying the Accounting for Income Taxes.” The guidance issued in this update simplifies the accounting for income taxes by eliminating certain exceptions to the guidance in ASC 740 related to the approach for intra-period tax allocation, the methodology for calculating income taxes in an interim period and the recognition for deferred tax liabilities for outside basis differences. ASU 2019-12 also simplifies aspects of the accounting for franchise taxes and enacted changes in tax laws or rates and clarifies the accounting for transactions that result in a statement of cash flows explain the change during the periodstep-up in the totaltax basis of cash, cash equivalents, and amounts generally described as restricted cash or restricted cash equivalents. Therefore, amounts generally described as restricted cash and restricted cash equivalents should be included with cash and cash equivalents when reconciling thebeginning-of-period andend-of-period total amounts shown on the statement of cash flows.goodwill. ASU 2016-182019-12 will be effective for the Companyus on January 1, 20182021, with early adoption permitted, and is not expected to have a significant impact on theour consolidated financial statements.ASU 2017-01,“BusinessCombinations(Topic805)-ClarifyingtheDefinitionofaBusiness.”ASU 2017-01 clarifies the definition and provides a more robust framework to use in determining when a set
NOTES TO CONSOLIDATED FINANCIAL STATEMENTS (CONTINUED)
DECEMBER 31,
2016, 20152019, 2018 AND
20142017
(Dollar amounts in thousands except per share amounts)
The
amortized cost and fair value of
available for saleAFS securities and the related gross unrealized gains and losses recognized in accumulated other comprehensive
loss were as followsincome (loss) at December 31,
20162019 and
2015: | | | | | | | | | | | | | | | | |
| | | December 31, 2016 | |
| | | Amortized
Cost | | | Gross
Unrealized
Gains | | | Gross
Unrealized
Losses | | | Estimated
Fair
Value | |
U. S. Treasury and other U. S. government agencies | | $ | 1,909 | | | $ | 4 | | | $ | (5 | ) | | $ | 1,908 | |
State and municipal | | | 122,813 | | | | 446 | | | | (3,625 | ) | | | 119,634 | |
Corporate bonds | | | 2,000 | | | | 8 | | | | (21 | ) | | | 1,987 | |
Mortgage backed securities | | | 20,197 | | | | 11 | | | | (174 | ) | | | 20,034 | |
Time deposits | | | 3,250 | | | | — | | | | — | | | | 3,250 | |
| | | | | | | | | | | | | | | | |
| | | | |
Total | | $ | 150,169 | | | $ | 469 | | | $ | (3,825 | ) | | $ | 146,813 | |
| | | | | | | | | | | | | | | | |
| |
| | | December 31, 2015 | |
| | | Amortized
Cost | | | Gross
Unrealized
Gains | | | Gross
Unrealized
Losses | | | Estimated
Fair
Value | |
U. S. Treasury and other U. S. government agencies | | $ | 4,918 | | | $ | 1 | | | $ | (83 | ) | | $ | 4,836 | |
State and municipal | | | 86,604 | | | | 1,262 | | | | (271 | ) | | | 87,595 | |
Corporate bonds | | | 2,000 | | | | 5 | | | | (26 | ) | | | 1,979 | |
Mortgage backed securities | | | 36,617 | | | | 63 | | | | (515 | ) | | | 36,165 | |
Time deposits | | | 3,250 | | | | — | | | | — | | | | 3,250 | |
| | | | | | | | | | | | | | | | |
| | | | |
Total | | $ | 133,389 | | | $ | 1,331 | | | $ | (895 | ) | | $ | 133,825 | |
| | | | | | | | | | | | | | | | |
COMMERCE UNION BANCSHARES,2018 were as follows:
|
| | | | | | | | | | | | | | | | |
| | | December 31, 2019 |
| | | Amortized Cost | | Gross Unrealized Gains | | Gross Unrealized Losses | | Estimated Fair Value |
| U. S. Treasury and other U. S. government agencies | | $ | 59 |
| | $ | — |
| | $ | — |
| | $ | 59 |
|
| State and municipal | | 186,283 | | 10,413 |
| | (36 | ) | | 196,660 |
| Corporate bonds | | 7,880 | | 97 |
| | (132 | ) | | 7,845 |
| Mortgage backed securities | | 38,126 | | 296 | | (661 | ) | | 37,761 |
| Asset backed securities | | 18,374 | | — |
| | (406 | ) | | 17,968 |
| Total | | $ | 250,722 |
| | $ | 10,806 |
| | $ | (1,235 | ) | | $ | 260,293 |
|
|
| | | | | | | | | | | | | | | | |
| | | December 31, 2018 |
| | | Amortized Cost | | Gross Unrealized Gains | | Gross Unrealized Losses | | Estimated Fair Value |
| U. S. Treasury and other U. S. government agencies | | $ | 568 |
| | $ | — |
| | $ | (14 | ) | | $ | 554 |
|
| State and municipal | | 232,589 | | 879 |
| | (4,170 | ) | | 229,298 |
| Corporate bonds | | 3,130 | | — |
| | (113 | ) | | 3,017 |
| Mortgage backed securities | | 32,172 | | 34 | | (248 | ) | | 31,958 |
| Asset backed securities | | 28,635 | | — |
| | (639 | ) | | 27,996 |
| Time deposits | | 3,500 |
| | — |
| | — |
| | 3,500 |
|
| Total | | $ | 300,594 |
| | $ | 913 |
| | $ | (5,184 | ) | | $ | 296,323 |
|
NOTES TO CONSOLIDATED FINANCIAL STATEMENTS (CONTINUED)
DECEMBER 31,
2016, 20152019, 2018 AND
20142017
(Dollar amounts in thousands except per share amounts)
NOTE 2 - SECURITIES (CONTINUED)
There were no
held to maturityHTM securities as of December 31,
20162019 and
2015. On January 16, 2015, as part of a strategy to reposition the Company’s investment portfolio, $20,806 of securities classified as held to maturity were sold resulting in a loss on sale of $396. Subsequent to the sale, all other securities classified as held to maturity were transferred to available for sale.2018.
The
amortized cost and estimated fair value of
available for sale debtAFS securities at December 31,
20162019 are presented below by contractual
maturity is provided below. Mortgage backed securities, which arematurity. Expected maturities may differ from contractual maturities because issuers may have the right to call or prepay obligations with or without call or prepayment penalties. Securities not due at a single maturity date are shown separately.
| | | | | | | | |
| | | Amortized
Cost | | | Estimated
Fair Value | |
Due within one year | | $ | 1,130 | | | $ | 1,133 | |
Due in one to five years | | | 21,723 | | | | 21,727 | |
Due in five to ten years | | | 10,565 | | | | 10,569 | |
Due after ten years | | | 96,554 | | | | 93,350 | |
Mortgage backed securities | | | 20,197 | | | | 20,034 | |
| | | | | | | | |
| | |
| | $ | 150,169 | | | $ | 146,813 | |
| | | | | | | | |
|
| | | | | | | | |
| | | Amortized Cost | | Estimated Fair Value |
| Due within one year | | $ | 999 |
| | $ | 1,000 |
|
| Due in one to five years | | 2,414 |
| | 2,285 |
|
| Due in five to ten years | | 10,301 |
| | 10,834 |
|
| Due after ten years | | 180,508 |
| | 190,445 |
|
| Mortgage backed securities | | 38,126 |
| | 37,761 |
|
| Asset backed securities | | 18,374 |
| | 17,968 |
|
| Total | | $ | 250,722 |
| | $ | 260,293 |
|
The following table shows available for sale AFS securities with unrealized losses and their estimated fair value aggregated by investment category and length of time that individual securities had been in a continuous unrealized loss position as of December 31, 2019:
|
| | | | | | | | | | | | | | | | | | | | | | | | |
| | | Less than 12 months | | 12 months or more | | Total |
| | | Estimated Fair Value | | Unrealized Loss | | Estimated Fair Value | | Unrealized Loss | | Estimated Fair Value | | Unrealized Loss |
| State and municipal | | $ | 1,960 |
| | $ | 36 |
| | $ | — |
| | $ | — |
| | $ | 1,960 |
| | $ | 36 |
|
| Corporate bonds | | — |
| | — |
| | 2,499 | | 132 | | 2,499 | | 132 |
| Mortgage backed securities | | 16,104 | | 286 | | 9,081 | | 375 | | 25,185 | | 661 |
| Asset backed securities | | — |
| | — |
| | 17,682 |
| | 406 |
| | 17,682 |
| | 406 |
|
| Total temporarily impaired | | $ | 18,064 |
| | $ | 322 |
| | $ | 29,262 |
| | $ | 913 |
| | $ | 47,326 |
| | $ | 1,235 |
|
RELIANT BANCORP, INC.
NOTES TO CONSOLIDATED FINANCIAL STATEMENTS (CONTINUED)
DECEMBER 31, 2019, 2018 AND 2017
(Dollar amounts in thousands except per share amounts)
NOTE 2 - SECURITIES (CONTINUED)
The following table shows available for sale securities with unrealized losses and their estimated fair value aggregated by investment category and length of time that individual securities had been in a continuous unrealized loss position as of December 31,
2016: | | | | | | | | | | | | | | | | | | | | | | | | |
| | | Less than 12 months | | | 12 months or more | | | Total | |
| | | Estimated
Fair Value | | | Unrealized
Loss | | | Estimated
Fair Value | | | Unrealized
Loss | | | Estimated
Fair Value | | | Unrealized
Loss | |
Description of Securities | | | | | | | | | | | | | | | | | | | | | | | | |
U. S. Treasury and other U. S. government agencies | | $ | 748 | | | $ | 5 | | | $ | — | | | $ | — | | | $ | 748 | | | $ | 5 | |
State and municipal | | | 83,637 | | | | 3,597 | | | | 1,115 | | | | 28 | | | | 84,752 | | | | 3,625 | |
Corporate bonds | | | 496 | | | | 4 | | | | 983 | | | | 17 | | | | 1,479 | | | | 21 | |
Mortgage backed securities | | | 17,599 | | | | 129 | | | | 1,255 | | | | 45 | | | | 18,854 | | | | 174 | |
| | | | | | | | | | | | | | | | | | | | | | | | |
| | | | | | |
Total temporarily impaired | | $ | 102,480 | | | $ | 3,735 | | | $ | 3,353 | | | $ | 90 | | | $ | 105,833 | | | $ | 3,825 | |
| | | | | | | | | | | | | | | | | | | | | | | | |
COMMERCE UNION BANCSHARES, INC.
NOTES TO CONSOLIDATED FINANCIAL STATEMENTS (CONTINUED)
DECEMBER 31, 2016, 2015 AND 2014
(Dollar amounts in thousands except per share amounts)
NOTE 2 - SECURITIES (CONTINUED)
The following table shows available for sale securities with unrealized losses and their estimated fair value aggregated by investment category and length of time that individual securities had been in a continuous unrealized loss position as of December 31, 2015:
| | | | | | | | | | | | | | | | | | | | | | | | |
| | | Less than 12 months | | | 12 months or more | | | Total | |
| | | Estimated
Fair Value | | | Unrealized
Loss | | | Estimated
Fair Value | | | Unrealized
Loss | | | Estimated
Fair Value | | | Unrealized
Loss | |
Description of Securities | | | | | | | | | | | | | | | | | | | | | | | | |
U. S. Treasury and other U. S. government agencies | | $ | 2,002 | | | $ | 14 | | | $ | 2,421 | | | $ | 69 | | | $ | 4,423 | | | $ | 83 | |
State and municipal | | | 18,619 | | | | 226 | | | | 3,760 | | | | 45 | | | | 22,379 | | | | 271 | |
Corporate bonds | | | 974 | | | | 26 | | | | — | | | | — | | | | 974 | | | | 26 | |
Mortgage backed securities | | | 28,547 | | | | 367 | | | | 4,009 | | | | 148 | | | | 32,556 | | | | 515 | |
| | | | | | | | | | | | | | | | | | | | | | | | |
| | | | | | |
Total temporarily impaired | | $ | 50,142 | | | $ | 633 | | | $ | 10,190 | | | $ | 262 | | | $ | 60,332 | | | $ | 895 | |
| | | | | | | | | | | | | | | | | | | | | | | | |
2018:
|
| | | | | | | | | | | | | | | | | | | | | | | | |
| | | Less than 12 months | | 12 months or more | | Total |
| | | Estimated Fair Value | | Unrealized Loss | | Estimated Fair Value | | Unrealized Loss | | Estimated Fair Value | | Unrealized Loss |
| U. S. Treasury and other U. S. government agencies | | $ | — |
| | $ | — |
| | $ | 555 |
| | $ | 14 |
| | $ | 555 |
| | $ | 14 |
|
| State and municipal | | 118,580 | | 2,263 | | 47,223 | | 1,907 | | 165,803 | | 4,170 |
| Corporate bonds | | 2,526 |
| | 105 |
| | 492 | | 8 | | 3,018 | | 113 |
| Mortgage backed securities | | 17,015 | | 99 | | 5,397 | | 149 | | 22,412 | | 248 |
| Asset backed securities | | 20,351 |
| | 383 |
| | 7,255 |
| | 256 |
| | 27,606 |
| | 639 |
|
| Total temporarily impaired | | $ | 158,472 |
| | $ | 2,850 |
| | 60,922 |
| | 2,334 |
| | $ | 219,394 |
| | $ | 5,184 |
|
At December 31,
2016,2019, management had the intent and ability to hold all securities in a loss position for the foreseeable future, and the decline in fair value was largely due to changes in interest rates. The fair value is expected to recover as the securities approach their maturity date and/or market rates decline. There were
19347 and 242 securities in an unrealized loss position as of December 31,
2016.2019 and 2018, respectively.
During the years ended December 31,
2016, 20152019, 2018 and
2014,2017, gross realized gains on sales of securities were
$359, $75$1,810, $82 and
$158,$97, respectively, and gross realized losses were
$323, $463$359, $39 and
$15,$38, respectively.
Securities pledged at December 31,
20162019 and
20152018 had a market value of
$36,292$46,918 and
$39,815,$70,097, respectively, and were pledged to collateralize
Federal Home Loan BankFHLB advances, Federal Reserve advances and municipal deposits.
At December 31,
20162019 and
2015,2018, there were no holdings of securities of any one issuer,
other than the U.S. government and its agencies, in an amount greater than 10% of stockholders’ equity.
COMMERCE UNION BANCSHARES,
NOTES TO CONSOLIDATED FINANCIAL STATEMENTS (CONTINUED)
DECEMBER 31,
2016, 20152019, 2018 AND
20142017
(Dollar amounts in thousands except per share amounts)
NOTE 3 - LOANS AND ALLOWANCE FOR LOAN
LOSSESLOSS
Loans at December 31,
20162019 and
20152018 were comprised as follows:
| | | | | | | | |
| | | December 31,
2016 | | | December 31,
2015 | |
Commerical, industrial and agricultural | | $ | 134,404 | | | $ | 143,770 | |
Real estate | | | | | | | | |
1-4 family residential | | | 113,031 | | | | 110,736 | |
1-4 family HELOC | | | 57,460 | | | | 49,665 | |
Multi family and commercial real estate | | | 215,639 | | | | 202,736 | |
Construction, land development and farmland | | | 115,889 | | | | 89,763 | |
Consumer | | | 17,240 | | | | 15,271 | |
Other | | | 13,745 | | | | 5,556 | |
| | | | | | | | |
| | | 667,408 | | | | 617,497 | |
Less | | | | | | | | |
Deferred loan fees | | | 625 | | | | 927 | |
Allowance for possible loan losses | | | 9,082 | | | | 7,823 | |
| | | | | | | | |
| | |
Loans, net | | $ | 657,701 | | | $ | 608,747 | |
| | | | | | | | |
|
| | | | | | | | |
| | | December 31, 2019 | | December 31, 2018 |
| Commercial, Industrial and Agricultural | | $ | 245,515 |
| | $ | 213,850 |
|
| Real Estate | | | | |
| 1-4 Family Residential | | 227,529 | | 225,863 |
| 1-4 Family HELOC | | 96,228 | | 88,112 |
| Multi-family and Commercial | | 536,845 | | 447,840 |
| Construction, Land Development and Farmland | | 273,872 | | 220,801 |
| Consumer | | 16,855 | | 20,495 |
| Other | | 13,180 | | 14,106 |
| Total | | 1,410,024 | | 1,231,067 |
| Less | | | | |
| Deferred loan fees (costs) | | 72 |
| | (9) |
| Allowance for possible loan losses | | 12,578 |
| | 10,892 |
| Loans, net | | $ | 1,397,374 |
| | $ | 1,220,184 |
|
At December 31,
20162019 and
2015,2018, loans are recorded net of purchase discounts of
$1,210$2,909 and
$3,533,$4,525, respectively.
COMMERCE UNION BANCSHARES, INC.
NOTES TO CONSOLIDATED FINANCIAL STATEMENTS (CONTINUED)
DECEMBER 31, 2016, 2015 AND 2014
(Dollar amounts in thousands except per share amounts)
NOTE 3 - LOANS AND ALLOWANCE FOR LOAN LOSSES (CONTINUED)
Activity in the
allowance for loan lossesALLL by portfolio segment was as follows for the year ended December 31,
2016: | | | | | | | | | | | | | | | | |
| | | Commercial
Industrial and
Agricultural | | | Multi Family
and
Commercial
Real Estate | | | Construction
Land
Development
and Farmland | | | 1-4 Family
Residential
Real Estate | |
Beginning balance | | $ | 2,198 | | | $ | 2,591 | | | $ | 894 | | | $ | 1,214 | |
Charge-offs | | | (84 | ) | | | — | | | | — | | | | (25 | ) |
Recoveries | | | 323 | | | | 18 | | | | 6 | | | | 66 | |
Provision | | | (5 | ) | | | 128 | | | | 886 | | | | (77 | ) |
| | | | | | | | | | | | | | | | |
Ending balance | | $ | 2,432 | | | $ | 2,737 | | | $ | 1,786 | | | $ | 1,178 | |
| | | | | | | | | | | | | | | | |
| | | | |
| | | 1-4 Family
HELOC | | | Consumer | | | Other | | | Total | |
Beginning balance | | $ | 699 | | | $ | 192 | | | $ | 35 | | | $ | 7,823 | |
Charge-offs | | | — | | | | — | | | | (36 | ) | | | (145 | ) |
Recoveries | | | 11 | | | | 12 | | | | — | | | | 436 | |
Provision | | | (6 | ) | | | 4 | | | | 38 | | | | 968 | |
| | | | | | | | | | | | | | | | |
Ending balance | | $ | 704 | | | $ | 208 | | | $ | 37 | | | $ | 9,082 | |
| | | | | | | | | | | | | | | | |
2019:
|
| | | | | | | | | | | | | | | | | | | | | | | | |
| | Commercial Industrial and Agricultural | Multi-family and Commercial
Real Estate | Construction Land Development and Farmland | 1-4 Family Residential Real Estate | 1-4 Family HELOC | Consumer | Other | Total |
| Beginning balance at | | | | | | | | |
| December 31, 2018 | $ | 1,751 |
| $ | 4,429 |
| $ | 2,500 |
| $ | 1,333 |
| $ | 656 |
| $ | 184 |
| $ | 39 |
| $ | 10,892 |
|
| Charge-offs | (396 | ) | — |
| (60 | ) | (29 | ) | — |
| (50 | ) | (35 | ) | (570 | ) |
| Recoveries | 393 |
| 65 |
| — |
| 225 |
| 12 |
| 51 |
| 299 |
| 1,045 |
|
| Provision | 781 |
| 791 |
| 209 |
| (249 | ) | (44 | ) | (8 | ) | (269 | ) | 1,211 |
|
| Ending balance at | | | | | | | | |
| December 31, 2019 | $ | 2,529 |
| $ | 5,285 |
| $ | 2,649 |
| $ | 1,280 |
| $ | 624 |
| $ | 177 |
| $ | 34 |
| $ | 12,578 |
|
RELIANT BANCORP, INC.
NOTES TO CONSOLIDATED FINANCIAL STATEMENTS (CONTINUED)
DECEMBER 31, 2019, 2018 AND 2017
(Dollar amounts in thousands except per share amounts)
NOTE 3 - LOANS AND ALLOWANCE FOR LOAN LOSS (CONTINUED)
Activity in the
allowance for loan lossesALLL by portfolio segment was as follows for the year ended December 31,
2015: | | | | | | | | | | | | | | | | |
| | | Commercial
Industrial and
Agricultural | | | Multi Family
and
Commercial
Real Estate | | | Construction
Land
Development
and Farmland | | | 1-4 Family
Residential
Real Estate | |
Beginning balance | | $ | 2,184 | | | $ | 2,070 | | | $ | 742 | | | $ | 642 | |
Charge-offs | | | — | | | | — | | | | — | | | | — | |
Recoveries | | | 346 | | | | 388 | | | | 7 | | | | 15 | |
Provision | | | (332 | ) | | | 133 | | | | 145 | | | | 557 | |
| | | | | | | | | | | | | | | | |
Ending balance | | $ | 2,198 | | | $ | 2,591 | | | $ | 894 | | | $ | 1,214 | |
| | | | | | | | | | | | | | | | |
| | | | | | | | | | | | | | | | | | | | |
| | | 1-4 Family
HELOC | | | Consumer | | | Other | | | Unallocated | | | Total | |
Beginning balance | | $ | 854 | | | $ | 181 | | | $ | 2 | | | $ | 678 | | | $ | 7,353 | |
Charge-offs | | | (6 | ) | | | (35 | ) | | | — | | | | — | | | | (41 | ) |
Recoveries | | | 25 | | | | — | | | | — | | | | — | | | | 781 | |
Provision | | | (174 | ) | | | 46 | | | | 33 | | | | (678 | ) | | | (270 | ) |
| | | | | | | | | | | | | | | | | | | | |
Ending balance | | $ | 699 | | | $ | 192 | | | $ | 35 | | | $ | — | | | $ | 7,823 | |
| | | | | | | | | | | | | | | | | | | | |
COMMERCE UNION BANCSHARES, INC.
NOTES TO CONSOLIDATED FINANCIAL STATEMENTS (CONTINUED)
DECEMBER 31, 2016, 2015 AND 2014
(Dollar amounts in thousands except per share amounts)
NOTE 3 - LOANS AND ALLOWANCE FOR LOAN LOSSES (CONTINUED)
2018:
|
| | | | | | | | | | | | | | | | | | | | | | | | |
| | Commercial Industrial and Agricultural | Multi-family and Commercial
Real Estate | Construction Land Development and Farmland | 1-4 Family Residential Real Estate | 1-4 Family HELOC | Consumer | Other | Total |
| Beginning balance at | | | | | | | | |
| December 31, 2017 | $ | 2,538 |
| $ | 3,166 |
| $ | 2,434 |
| $ | 773 |
| $ | 595 |
| $ | 183 |
| $ | 42 |
| $ | 9,731 |
|
| Charge-offs | (381 | ) | (76 | ) | (215 | ) | (36 | ) | (6 | ) | (26 | ) | (47 | ) | (787 | ) |
| Recoveries | 590 |
| 221 |
| 44 |
| 12 |
| 10 |
| 34 |
| 2 |
| 913 |
|
| Provision | (996 | ) | 1,118 |
| 237 |
| 584 |
| 57 |
| (7 | ) | 42 |
| 1,035 |
|
| Ending balance at | | | | | | | | |
| December 31, 2018 | $ | 1,751 |
| $ | 4,429 |
| $ | 2,500 |
| $ | 1,333 |
| $ | 656 |
| $ | 184 |
| $ | 39 |
| $ | 10,892 |
|
Activity in the
allowance for loan lossesALLL by portfolio segment was as follows for the year ended December 31,
2014: | | | | | | | | | | | | | | | | |
| | | Commercial
Industrial and
Agricultural | | | Multi Family
and
Commercial
Real Estate | | | Construction
Land
Development
and Farmland | | | 1-4 Family
Residential
Real Estate | |
Beginning balance | | $ | 2,138 | | | $ | 1,581 | | | $ | 553 | | | $ | 1,071 | |
Charge-offs | | | (9 | ) | | | — | | | | — | | | | — | |
Recoveries | | | 178 | | | | 49 | | | | 111 | | | | 100 | |
Provision | | | (123 | ) | | | 440 | | | | 78 | | | | (529 | ) |
| | | | | | | | | | | | | | | | |
Ending balance | | $ | 2,184 | | | $ | 2,070 | | | $ | 742 | | | $ | 642 | |
| | | | | | | | | | | | | | | | |
| | | | | | | | | | | | | | | | | | | | |
| | | | | |
| | | 1-4 Family
HELOC | | | Consumer | | | Other | | | Unallocated | | | Total | |
Beginning balance | | $ | 865 | | | $ | 257 | | | $ | 13 | | | $ | 2,052 | | | $ | 8,530 | |
Charge-offs | | | — | | | | (120 | ) | | | (11 | ) | | | — | | | | (140 | ) |
Recoveries | | | 25 | | | | — | | | | — | | | | — | | | | 463 | |
Provision | | | (36 | ) | | | 44 | | | | — | | | | (1,374 | ) | | | (1,500 | ) |
| | | | | | | | | | | | | | | | | | | | |
Ending balance | | $ | 854 | | | $ | 181 | | | $ | 2 | | | $ | 678 | | | $ | 7,353 | |
| | | | | | | | | | | | | | | | | | | | |
COMMERCE UNION BANCSHARES,2017:
|
| | | | | | | | | | | | | | | | | | | | | | | | |
| | Commercial Industrial and Agricultural | Multi-family and Commercial
Real Estate | Construction Land Development and Farmland | 1-4 Family Residential Real Estate | 1-4 Family HELOC | Consumer | Other | Total |
| Beginning balance at | | | | | | | | |
| December 31, 2016 | $ | 2,432 |
| $ | 2,737 |
| $ | 1,786 |
| $ | 1,178 |
| $ | 704 |
| $ | 208 |
| $ | 37 |
| $ | 9,082 |
|
| Charge-offs | (976 | ) | — |
| (45 | ) | (14 | ) | — |
| (36 | ) | — |
| (1,071 | ) |
| Recoveries | 378 |
| — |
| 5 |
| — |
| 19 |
| 2 |
| — |
| 404 |
|
| Provision | 704 |
| 429 |
| 688 |
| (391 | ) | (128 | ) | 9 |
| 5 |
| 1,316 |
|
| Ending balance at | | | | | | | | |
| December 31, 2017 | $ | 2,538 |
| $ | 3,166 |
| $ | 2,434 |
| $ | 773 |
| $ | 595 |
| $ | 183 |
| $ | 42 |
| $ | 9,731 |
|
NOTES TO CONSOLIDATED FINANCIAL STATEMENTS (CONTINUED)
DECEMBER 31,
2016, 20152019, 2018 AND
20142017
(Dollar amounts in thousands except per share amounts)
NOTE 3 - LOANS AND ALLOWANCE FOR LOAN
LOSSESLOSS (CONTINUED)
The
allowance for loan lossesALLL and the recorded investment in loans by portfolio segment and based on impairment method as of December 31,
20162019 was as follows:
| | | | | | | | | | | | | | | | |
| | | Commercial
Industrial and
Agricultural | | | Multi Family
and
Commercial
Real Estate | | | Construction
Land
Development
and Farmland | | | 1-4 Family
Residential
Real Estate | |
Allowance for loan losses | | | | | | | | | | | | | | | | |
Individually evaluated for impairment | | $ | 747 | | | $ | — | | | $ | 17 | | | $ | 27 | |
Acquired with credit impairment | | | — | | | | 6 | | | | — | | | | — | |
Collectively evaluated for impairment | | | 1,685 | | | | 2,731 | | | | 1,769 | | | | 1,151 | |
| | | | | | | | | | | | | | | | |
Total | | $ | 2,432 | | | $ | 2,737 | | | $ | 1,786 | | | $ | 1,178 | |
| | | | | | | | | | | | | | | | |
Loans | | | | | | | | | | | | | | | | |
Individually evaluated for impairment | | $ | 5,375 | | | $ | 2,036 | | | $ | 2,544 | | | $ | 1,972 | |
Acquired with credit impairment | | | 329 | | | | 2,852 | | | | 1,481 | | | | 89 | |
Collectively evaluated for impairment | | | 128,700 | | | | 210,751 | | | | 111,864 | | | | 110,970 | |
| | | | | | | | | | | | | | | | |
Total | | $ | 134,404 | | | $ | 215,639 | | | $ | 115,889 | | | $ | 113,031 | |
| | | | | | | | | | | | | | | | |
| | | | |
| | | 1-4 Family
HELOC | | | Consumer | | | Other | | | Total | |
Allowance for loan losses | | | | | | | | | | | | | | | | |
Individually evaluated for impairment | | $ | 62 | | | $ | — | | | $ | — | | | $ | 853 | |
Acquired with credit impairment | | | — | | | | — | | | | — | | | | 6 | |
Collectively evaluated for impairment | | | 642 | | | | 208 | | | | 37 | | | | 8,223 | |
| | | | | | | | | | | | | | | | |
Total | | $ | 704 | | | $ | 208 | | | $ | 37 | | | $ | 9,082 | |
| | | | | | | | | | | | | | | | |
Loans | | | | | | | | | | | | | | | | |
Individually evaluated for impairment | | $ | 1,479 | | | $ | — | | | $ | — | | | $ | 13,406 | |
Acquired with credit impairment | | | 16 | | | | — | | | | — | | | | 4,767 | |
Collectively evaluated for impairment | | | 55,965 | | | | 17,240 | | | | 13,745 | | | | 649,235 | |
| | | | | | | | | | | | | | | | |
Total | | $ | 57,460 | | | $ | 17,240 | | | $ | 13,745 | | | $ | 667,408 | |
| | | | | | | | | | | | | | | | |
COMMERCE UNION BANCSHARES, INC.
NOTES TO CONSOLIDATED FINANCIAL STATEMENTS (CONTINUED)
DECEMBER 31, 2016, 2015 AND 2014
(Dollar amounts in thousands except per share amounts)
NOTE 3 - LOANS AND ALLOWANCE FOR LOAN LOSSES (CONTINUED)
|
| | | | | | | | | | | | | | | | | | | | | | | | |
| | Commercial Industrial and Agricultural | Multi-family and Commercial
Real Estate | Construction Land Development and Farmland | 1-4 Family Residential Real Estate | 1-4 Family HELOC | Consumer | Other | Total |
| Allowance for loan losses | | | | | | | | |
| Individually evaluated for impairment | $ | 755 |
| $ | — |
| $ | 17 |
| $ | — |
| $ | — |
| $ | — |
| $ | — |
| $ | 772 |
|
| Acquired with credit impairment | — |
| — |
| — |
| — |
| — |
| — |
| — |
| — |
|
| Collectively evaluated for impairment | 1,774 |
| 5,285 |
| 2,632 |
| 1,280 |
| 624 |
| 177 | 34 |
| 11,806 |
|
| Total | $ | 2,529 |
| $ | 5,285 |
| $ | 2,649 |
| $ | 1,280 |
| $ | 624 |
| $ | 177 |
| $ | 34 |
| $ | 12,578 |
|
| Loans | | | | | | | | |
| Individually evaluated for impairment | $ | 1,154 |
| $ | 2,396 |
| $ | 1,218 |
| $ | 1,120 |
| $ | 374 |
| $ | — |
| $ | — |
| $ | 6,262 |
|
| Acquired with credit impairment | — |
| 215 |
| 813 |
| 195 |
| — |
| — |
| — |
| 1,223 |
|
| Collectively evaluated for impairment | 244,361 |
| 534,234 |
| 271,841 |
| 226,214 |
| 95,854 |
| 16,855 | 13,180 |
| 1,402,539 |
|
| Total | $ | 245,515 |
| $ | 536,845 |
| $ | 273,872 |
| $ | 227,529 |
| $ | 96,228 |
| $ | 16,855 |
| $ | 13,180 |
| $ | 1,410,024 |
|
The
allowance for loan lossesALLL and the recorded investment in loans by portfolio segment and based on impairment method as of December 31,
20152018 was as follows:
| | | | | | | | | | | | | | | | |
| | | Commercial
Industrial and
Agricultural | | | Multi Family
and
Commercial
Real Estate | | | Construction
Land
Development
and Farmland | | | 1-4 Family
Residential
Real Estate | |
Allowance for loan losses | | | | | | | | | | | | | | | | |
Individually evaluated for impairment | | $ | 479 | | | $ | 11 | | | $ | 22 | | | $ | — | |
Acquired with credit impairment | | | 6 | | | | — | | | | — | | | | 241 | |
Collectively evaluated for impairment | | | 1,713 | | | | 2,580 | | | | 872 | | | | 973 | |
| | | | | | | | | | | | | | | | |
Total | | $ | 2,198 | | | $ | 2,591 | | | $ | 894 | | | $ | 1,214 | |
| | | | | | | | | | | | | | | | |
Loans | | | | | | | | | | | | | | | | |
Individually evaluated for impairment | | $ | 2,438 | | | $ | 2,196 | | | $ | 224 | | | $ | 2,646 | |
Acquired with credit impairment | | | 888 | | | | 3,968 | | | | 1,496 | | | | 735 | |
Collectively evaluated for impairment | | | 140,444 | | | | 196,572 | | | | 88,043 | | | | 107,355 | |
| | | | | | | | | | | | | | | | |
Total | | $ | 143,770 | | | $ | 202,736 | | | $ | 89,763 | | | $ | 110,736 | |
| | | | | | | | | | | | | | | | |
| | | | |
| | | 1-4 Family
HELOC | | | Consumer | | | Other | | | Total | |
Allowance for loan losses | | | | | | | | | | | | | | | | |
Individually evaluated for impairment | | $ | 190 | | | $ | — | | | $ | — | | | $ | 702 | |
Acquired with credit impairment | | | — | | | | — | | | | — | | | | 247 | |
Collectively evaluated for impairment | | | 509 | | | | 192 | | | | 35 | | | | 6,874 | |
| | | | | | | | | | | | | | | | |
Total | | $ | 699 | | | $ | 192 | | | $ | 35 | | | $ | 7,823 | |
| | | | | | | | | | | | | | | | |
Loans | | | | | | | | | | | | | | | | |
Individually evaluated for impairment | | $ | 2,236 | | | $ | — | | | $ | — | | | $ | 9,740 | |
Acquired with credit impairment | | | 19 | | | | — | | | | — | | | | 7,106 | |
Collectively evaluated for impairment | | | 47,410 | | | | 15,271 | | | | 5,556 | | | | 600,651 | |
| | | | | | | | | | | | | | | | |
Total | | $ | 49,665 | | | $ | 15,271 | | | $ | 5,556 | | | $ | 617,497 | |
| | | | | | | | | | | | | | | | |
COMMERCE UNION BANCSHARES,
|
| | | | | | | | | | | | | | | | | | | | | | | | |
| | Commercial Industrial and Agricultural | Multi-family and Commercial
Real Estate | Construction Land Development and Farmland | 1-4 Family Residential Real Estate | 1-4 Family HELOC | Consumer | Other | Total |
| Allowance for loan losses | | | | | | | | |
| Individually evaluated for impairment | $ | 38 |
| $ | — |
| $ | 17 |
| $ | — |
| $ | — |
| $ | — |
| $ | — |
| $ | 55 |
|
| Acquired with credit impairment | — |
| — |
| — |
| — |
| — |
| — |
| — |
| — |
|
| Collectively evaluated for impairment | 1,713 |
| 4,429 |
| 2,483 |
| 1,333 |
| 656 |
| 184 | 39 |
| 10,837 |
|
| Total | $ | 1,751 |
| $ | 4,429 |
| $ | 2,500 |
| $ | 1,333 |
| $ | 656 |
| $ | 184 |
| $ | 39 |
| $ | 10,892 |
|
| Loans | | | | | | | | |
| Individually evaluated for impairment | $ | 978 |
| $ | 1,160 |
| $ | 1,780 |
| $ | 1,246 |
| $ | — |
| $ | 12 |
| $ | — |
| $ | 5,176 |
|
| Acquired with credit impairment | 40 |
| 232 |
| 1,751 |
| 262 |
| — |
| 11 |
| — |
| 2,296 |
|
| Collectively evaluated for impairment | 212,832 |
| 446,448 |
| 217,270 |
| 224,355 |
| 88,112 |
| 20,472 | 14,106 |
| 1,223,595 |
|
| Total | $ | 213,850 |
| $ | 447,840 |
| $ | 220,801 |
| $ | 225,863 |
| $ | 88,112 |
| $ | 20,495 |
| $ | 14,106 |
| $ | 1,231,067 |
|
NOTES TO CONSOLIDATED FINANCIAL STATEMENTS (CONTINUED)
DECEMBER 31,
2016, 20152019, 2018 AND
20142017
(Dollar amounts in thousands except per share amounts)
NOTE 3 - LOANS AND ALLOWANCE FOR LOAN
LOSSESLOSS (CONTINUED)
Risk characteristics relevant to each portfolio segment are as follows:
Commercial and industrial: The commercial and industrial loan portfolio segment includes commercial and industrial loans to commercial customers for use in normal business operations to finance working capital needs, equipment purchases or other expansion projects. Collection risk in this portfolio is driven by the creditworthiness of underlying borrowers, particularly cash flow from customers’ business operations. Commercial and industrial loans are primarily made based on the identified cash flows of the borrower and secondarily on the underlying collateral provided by the borrower. The cash flows of borrowers, however, may not be as expected and the collateral securing these loans may fluctuate in value. Most commercial and industrial loans are secured by the assets being financed or other business assets such as accounts receivable or inventory and may incorporate a personal guarantee; however, some short-term loans may be made on an unsecured basis. In the case of loans secured by accounts receivable, the availability of funds for the repayment of these loans may be substantially dependent on the ability of the borrower to collect amounts due from its customers.
Multi-family and commercial real estate: Commercial real estate loans are subject to underwriting standards and processes similar to commercial and industrial loans, in addition to those of real estate loans. These loans are viewed primarily as cash flow loans and secondarily as loans secured by real estate. Commercial real estate lending typically involves higher loan principal amounts and the repayment of these loans is generally largely dependent on the successful operation of the property securing the loan or the business conducted on the property securing the loan. Commercial real estate loans may be more adversely affected by conditions in the real estate markets or in the general economy. The properties securing the Company’s commercial real estate portfolio are diverse in terms of type. This diversity helps reduce the Company’s exposure to adverse economic events that affect any single market or industry. Management monitors and evaluates commercial real estate loans based on collateral, geography and risk grade criteria. The Company also utilizes third-party experts to provide insight and guidance about economic conditions and trends affecting the market areas it serves. In addition, management tracks the level of owner-occupied commercial real estate loans versus
non-owner occupied non-owner-occupied loans.
Non-owner occupied Non-owner-occupied commercial real estate loans are loans secured by multifamily and commercial properties where the primary source of repayment is derived from rental income associated with the property (that is, loans for which 50 percent or more of the source of repayment comes from third party, nonaffiliated, rental income) or the proceeds of the sale, refinancing, or permanent financing of the property. These loans are made to finance income-producing properties such as apartment buildings, office and industrial buildings, and retail properties. Owner-occupied commercial real estate loans are loans where the primary source of repayment is the cash flow from the ongoing operations and business activities conducted by the party, or affiliate of the party, who owns the property.
COMMERCE UNION BANCSHARES, INC.
NOTES TO CONSOLIDATED FINANCIAL STATEMENTS (CONTINUED)
DECEMBER 31, 2016, 2015 AND 2014
(Dollar amounts in thousands except per share amounts)
NOTE 3 - LOANS AND ALLOWANCE FOR LOAN LOSSES (CONTINUED)
At December 31,
2016,2019, approximately
33%22% of the outstanding principal balance of the Company’s commercial real estate loan portfolio was secured by owner-occupied properties.
Construction and land development: Loans for non-owner-occupied real estate construction or land development are generally repaid through cash flow related to the operation, sale or refinance of the property. The Company also finances construction loans for owner-occupied properties. A portion of the Company’s construction and land portfolio segment is comprised of loans secured by residential product types (residential land and single-family construction). With respect to construction loans to developers and builders that are secured by non-owner occupiednon-owner-occupied properties that the Company may originate from time to time, the Company generally requires the borrower to have had an existing relationship with the Company and have a proven record of success. Construction and land development loans are underwritten utilizing feasibility studies, independent appraisal reviews, sensitivity analysis of absorption and lease rates, market sales activity, and financial analysis of the developers and property owners. Construction loans are generally based upon estimates of costs and value associated with the complete project. These estimates may be inaccurate. Construction loans often involve the disbursement of
substantial funds with repayment substantially dependent on the success of the ultimate project. Sources of repayment for these types of loans may be pre-committed permanent loans from approved long-term lenders, sales of developed property or an interim loan commitment from the Company until permanent financing is obtained. These loans are closely monitored by on-site inspections and are considered to have higher risks than other real estate loans due to their ultimate repayment being sensitive to interest rate changes, governmental regulation of real property, general economic conditions and the availability of long-term financing.
1-4
RELIANT BANCORP, INC.
NOTES TO CONSOLIDATED FINANCIAL STATEMENTS (CONTINUED)
DECEMBER 31, 2019, 2018 AND 2017
(Dollar amounts in thousands except per share amounts)
NOTE 3 - LOANS AND ALLOWANCE FOR LOAN LOSS (CONTINUED)
1-4 family residential real estate: Residential real estate loans represent loans to consumers or investors to finance a residence. These loans are typically financed on 15 to 30 year amortization terms, but generally with shorter maturities of 5 to 15 years. Many of these loans are extended to borrowers to finance their primary or secondary residence. Loans to an investor secured by a 1-4 family residence will be repaid from either the rental income from the property or from the sale of the property. This loan segment also includes closed-end home equity loans that are secured by a first or second mortgage on the borrower’s residence. This allows customers to borrow against the equity in their home. Loans in this portfolio segment are underwritten and approved based on a number of credit quality criteria including limits on maximum Loan-to-Value (LTV), minimum credit scores, and maximum debt to income. Real estate market values as of the time the loan is made directly affect the amount of credit extended and, in addition, changes in these residential property values influence the depth of potential losses in this portfolio segment.COMMERCE UNION BANCSHARES, INC.
NOTES TO CONSOLIDATED FINANCIAL STATEMENTS (CONTINUED)
DECEMBER 31, 2016, 2015 AND 2014
(Dollar amounts in thousands except per share amounts)
NOTE 3
1- LOANS AND ALLOWANCE FOR LOAN LOSSES (CONTINUED)1-4
4 family HELOC: This loan segment includes open-end home equity loans that are secured by a first or second mortgage on the borrower’s residence. This allows customers to borrow against the equity in their home utilizing a revolving line of credit. These loans are underwritten and approved based on a number of credit quality criteria including limits on maximum LTV, minimum credit scores, and maximum debt to income. Real estate market values as of the time the loan is made directly affect the amount of credit extended and, in addition, changes in these residential property values influence the depth of potential losses in this portfolio segment. Because of the revolving nature of these loans as well as the fact that many represent second mortgages, this portfolio segment can contain more risk than the amortizing 1-4 family residential real estate loans. Consumer: The consumer loan portfolio segment includes non-real estate secured direct loans to consumers for household, family, and other personal expenditures. Consumer loans may be secured or unsecured and are usually structured with short or medium term maturities. These loans are underwritten and approved based on a number of consumer credit quality criteria including limits on maximum LTV on secured consumer loans, minimum credit scores, and maximum debt to income. Many traditional forms of consumer installment credit have standard monthly payments and fixed repayment schedules of one to five years.years. These loans are made with either fixed or variable interest rates that are based on specific indices. Installment loans fill a variety of needs, such as financing the purchase of an automobile, a boat, a recreational vehicle, or other large personal items, or for consolidating debt. These loans may be unsecured or secured by an assignment of title, as in an automobile loan, or by money in a bank account. In addition to consumer installment loans, this portfolio segment also includes secured and unsecured personal lines of credit as well as overdraft protection lines. Loans in this portfolio segment are sensitive to unemployment and other key consumer economic measures. Non-accrual loans by class of loan were as followsfollows:
|
| | | | | | | | |
| | | December 31, 2019 | | December 31, 2018 |
| Commercial, Industrial and Agricultural | | $ | 572 |
| | $ | 279 |
|
| Multi-family and Commercial Real Estate | | 1,276 |
| | — |
|
| Construction, Land Development and Farmland | | 555 |
| | 1,294 |
|
| 1-4 Family Residential Real Estate | | 1,344 |
| | 2,556 |
|
| 1-4 Family HELOC | | 296 |
| | — |
|
| Consumer | | 28 |
| | 65 |
|
| Total | | $ | 4,071 |
| | $ | 4,194 |
|
Performing non-accrual loans totaled $1,332 and $2,010 at December
31: | | | | | | | | |
| | | December 31,
2016 | | | December 31,
2015 | |
| | |
Commercial, industrial and agricultural | | $ | 3,062 | | | $ | 947 | |
Multi family and commercial real estate | | | 636 | | | | 713 | |
Construction, land development and farmland | | | 730 | | | | 158 | |
1-4 family residential real estate | | | 344 | | | | 2,109 | |
1-4 family HELOC | | | 862 | | | | 1,077 | |
| | | | | | | | |
| | |
Total | | $ | 5,634 | | | $ | 5,004 | |
| | | | | | | | |
COMMERCE UNION BANCSHARES,31, 2019 and 2018, respectively.
NOTES TO CONSOLIDATED FINANCIAL STATEMENTS (CONTINUED)
DECEMBER 31,
2016, 20152019, 2018 AND
20142017
(Dollar amounts in thousands except per share amounts)
NOTE 3 - LOANS AND ALLOWANCE FOR LOAN
LOSSESLOSS (CONTINUED)
Individually impaired loans by class of loans were as follows at December 31,
2016: | | | | | | | | | | | | | | | | | | | | |
| | | Unpaid
Principal
Balance | | | Recorded
Investment
with no
Allowance
Recorded | | | Recorded
Investment
with
Allowance
Recorded | | | Total
Recorded
Investment | | | Related
Allowance | |
| | | | | |
Commercial, industrial and agricultural | | $ | 6,383 | | | $ | 3,924 | | | $ | 1,780 | | | $ | 5,704 | | | $ | 747 | |
Multi family and commercial real estate | | | 5,666 | | | | 2,914 | | | | 1,974 | | | | 4,888 | | | | 6 | |
Construction, land development and farmland | | | 4,124 | | | | 3,854 | | | | 171 | | | | 4,025 | | | | 17 | |
1-4 family residential real estate | | | 2,422 | | | | 2,035 | | | | 27 | | | | 2,062 | | | | 27 | |
1-4 family HELOC | | | 2,075 | | | | 1,178 | | | | 317 | | | | 1,495 | | | | 62 | |
| | | | | | | | | | | | | | | | | | | | |
| | | | | |
Total | | $ | 20,670 | | | $ | 13,905 | | | $ | 4,269 | | | $ | 18,174 | | | $ | 859 | |
| | | | | | | | | | | | | | | | | | | | |
2019:
|
| | | | | | | | | | | | | | | | | | | | |
| | | Unpaid
Principal
Balance | | Recorded Investment with no Allowance Recorded | | Recorded Investment with Allowance Recorded | | Total Recorded
Investment | | Related
Allowance |
| Commercial, Industrial and Agricultural | | $ | 1,154 |
| | $ | — |
| | $ | 1,154 |
| | $ | 1,154 |
| | $ | 755 |
|
| Multi-family and Commercial Real Estate | | 2,624 |
| | 2,611 |
| | — |
| | 2,611 |
| | — |
|
| Construction, Land Development and Farmland | | 2,348 |
| | 1,860 |
| | 171 |
| | 2,031 |
| | 17 |
|
| 1-4 Family Residential Real Estate | | 1,419 |
| | 1,315 |
| | — |
| | 1,315 |
| | — |
|
| 1-4 Family HELOC | | 376 |
| | 374 |
| | — |
| | 374 |
| | — |
|
| Total | | $ | 7,921 |
| | $ | 6,160 |
| | $ | 1,325 |
| | $ | 7,485 |
| | $ | 772 |
|
Individually impaired loans by class of loans were as follows at December 31,
2015: | | | | | | | | | | | | | | | | | | | | |
| | | Unpaid
Principal
Balance | | | Recorded
Investment
with no
Allowance
Recorded | | | Recorded
Investment
with
Allowance
Recorded | | | Total
Recorded
Investment | | | Related
Allowance | |
| | | | | |
Commercial, industrial and agricultural | | $ | 4,047 | | | $ | 2,145 | | | $ | 1,180 | | | $ | 3,325 | | | $ | 485 | |
Multi family and commercial real estate | | | 6,958 | | | | 5,452 | | | | 713 | | | | 6,165 | | | | 11 | |
Construction, land development and farmland | | | 1,831 | | | | 1,496 | | | | 224 | | | | 1,720 | | | | 22 | |
1-4 family residential real estate | | | 3,763 | | | | 3,009 | | | | 372 | | | | 3,381 | | | | 241 | |
1-4 family HELOC | | | 2,363 | | | | 1,309 | | | | 946 | | | | 2,255 | | | | 190 | |
| | | | | | | | | | | | | | | | | | | | |
| | | | | |
Total | | $ | 18,962 | | | $ | 13,411 | | | $ | 3,435 | | | $ | 16,846 | | | $ | 949 | |
| | | | | | | | | | | | | | | | | | | | |
COMMERCE UNION BANCSHARES,2018:
|
| | | | | | | | | | | | | | | | | | | | |
| | | Unpaid
Principal
Balance | | Recorded Investment with no Allowance Recorded | | Recorded Investment with Allowance Recorded | | Total Recorded
Investment | | Related
Allowance |
| Commercial, Industrial and Agricultural | | $ | 1,247 |
| | $ | 765 |
| | $ | 253 |
| | $ | 1,018 |
| | $ | 38 |
|
| Multi-family and Commercial Real Estate | | 1,670 |
| | 1,392 |
| | — |
| | 1,392 |
| | — |
|
| Construction, Land Development and Farmland | | 3,920 |
| | 3,359 |
| | 172 |
| | 3,531 |
| | 17 |
|
| 1-4 Family Residential Real Estate | | 2,243 |
| | 1,508 |
| | — |
| | 1,508 |
| | — |
|
| Consumer | | 29 |
| | 23 |
| | — |
| | 23 |
| | — |
|
| Total | | $ | 9,109 |
| | $ | 7,047 |
| | $ | 425 |
| | $ | 7,472 |
| | $ | 55 |
|
NOTES TO CONSOLIDATED FINANCIAL STATEMENTS (CONTINUED)
DECEMBER 31,
2016, 20152019, 2018 AND
20142017
(Dollar amounts in thousands except per share amounts)
NOTE 3 - LOANS AND ALLOWANCE FOR LOAN
LOSSESLOSS (CONTINUED)
Individually impaired loans by class of loans were as follows at December 31, 2017:
|
| | | | | | | | | | | | | | | | | | | | |
| | | Unpaid
Principal
Balance | | Recorded Investment with no Allowance Recorded | | Recorded Investment with Allowance Recorded | | Total Recorded
Investment | | Related
Allowance |
| Commercial, Industrial and Agricultural | | $ | 4,398 |
| | $ | 2,959 |
| | $ | 966 |
| | $ | 3,925 |
| | $ | 608 |
|
| Multi-family and Commercial Real Estate | | 3,427 |
| | 3,078 |
| | — |
| | 3,078 |
| | — |
|
| Construction, Land Development and Farmland | | 5,317 |
| | 3,249 |
| | 1,987 |
| | 5,236 |
| | 59 |
|
| 1-4 Family Residential Real Estate | | 2,857 |
| | 2,159 |
| | — |
| | 2,159 |
| | — |
|
| 1-4 Family HELOC | | 90 |
| | 90 |
| | — |
| | 90 |
| | — |
|
| Total | | $ | 16,089 |
| | $ | 11,535 |
| | $ | 2,953 |
| | $ | 14,488 |
| | $ | 667 |
|
Interest income recognized on impaired loans totaled
$848, $853$490, $583 and
$656$703 for the years ended December 31,
2016, 20152019, 2018 and
2014,2017, respectively.
The average recorded investment in impaired loans for the years ended December 31,
20162019, 2018 and
20152017, was as follows:
| | | | | | | | |
| | | 2016 | | | 2015 | |
Commercial, industrial and agricultural | | $ | 6,055 | | | $ | 3,177 | |
Multi family and commercial real estate | | | 5,837 | | | | 3,941 | |
Construction, land development and farmland | | | 3,243 | | | | 1,049 | |
1-4 family residential real estate | | | 2,715 | | | | 3,789 | |
1-4 family HELOC | | | 1,854 | | | | 2,168 | |
| | | | | | | | |
Total | | $ | 19,704 | | | $ | 14,124 | |
| | | | | | | | |
|
| | | | | | | | | | | | |
| | | 2019 | | 2018 | | 2017 |
| Commercial, Industrial and Agricultural | | $ | 1,767 |
| | $ | 2,333 |
| | $ | 5,225 |
|
| Multi-family and Commercial Real Estate | | 2,580 |
| | 2,366 |
| | 4,138 |
|
| Construction, Land Development and Farmland | | 2,462 |
| | 4,571 |
| | 4,502 |
|
| 1-4 Family Residential Real Estate | | 1,686 |
| | 2,468 |
| | 2,212 |
|
| 1-4 Family HELOC | | 208 |
| | 72 |
| | 784 |
|
| Consumer | | 2 |
| | 62 |
| | — |
|
| Total | | $ | 8,705 |
| | $ | 11,872 |
| | $ | 16,861 |
|
The Company utilizes a risk grading system to monitor the credit quality of the Company’s commercial loan portfolio which consists of commercial and industrial, commercial real estate and construction loans. Loans are graded on a scale of 1 to 9. Grades 1 - 5 are pass credits, grade 6 is special mention, grade 7 is substandard, grade 8 is doubtful and grade 9 is loss. A description of the risk grades are as follows:
Grade 1 - Minimal Risk (Pass)
This grade includes loans to borrowers with a strong financial position and history of profits and cash flows sufficient to service the debt. These borrowers have well defined sources of primary/secondary repayment, conservatively leveraged balance sheets and the ability to access a wide range of financing alternatives. Collateral securing these loans is negotiable, of sufficient value and in possession of the Company. Risk of loss is unlikely.
RELIANT BANCORP, INC.
NOTES TO CONSOLIDATED FINANCIAL STATEMENTS (CONTINUED)
DECEMBER 31, 2019, 2018 AND 2017
(Dollar amounts in thousands except per share amounts)
NOTE 3 - LOANS AND ALLOWANCE FOR LOAN LOSS (CONTINUED)
Grade 2 - High Quality (Pass)
This grade includes loans to borrowers with a strong financial condition reflecting dependable net profits and cash flows. The borrower has verifiable liquid net worth providing above average asset protection. An identifiable market exits for the collateral. Risk of loss is unlikely.
COMMERCE UNION BANCSHARES, INC.
NOTES TO CONSOLIDATED FINANCIAL STATEMENTS (CONTINUED)
DECEMBER 31, 2016, 2015 AND 2014
(Dollar amounts in thousands except per share amounts)
NOTE 3 - LOANS AND ALLOWANCE FOR LOAN LOSSES (CONTINUED)
Grade 3 - Above Average (Pass)
This grade includes loans to borrowers with a balance sheet that reflects a comfortable degree of leverage and liquidity. Borrowers are profitable and have a sustained record of servicing debt. An identifiable market exits for the collateral, but liquidation could take up to one year. Risk of loss is unlikely.
This grade includes loans to borrowers with a financial condition that is satisfactory and comparable to industry standards. The borrower has verifiable net worth, providing over time, average asset protection. Borrower cash flows are sufficient to satisfy debt service requirements. Risk of loss is below average.
Grade 5 - Acceptable (Management Attention) (Pass)
This grade includes loans to borrowers whose loans are performing, but sources of repayment are not documented by the current credit analysis. There are some declining trends in margins, ratios and/or cash flow. Guarantor(s) have strong net worth(s), but assets may be concentrated in real estate or other illiquid investments. Risk of loss is average.
Grade 6 - Special Mention
Special mention assets have potential weaknesses that may, if not checked or corrected, weaken the asset or inadequately protect the Company’s position at some future date. These assets pose elevated risk, but their weakness does not yet justify a substandard classification. Borrowers may be experiencing adverse operating trends (declining revenues or margins) or an ill proportioned balance sheet (e.g., increasing inventory without an increase in sales, high leverage, tight liquidity). Adverse economic or market conditions, such as interest rate increases or the entry of a new competitor, may also support a special mention rating. Nonfinancial reasons for rating a credit exposure special mention include management problems, pending litigation, an ineffective loan agreement or other material structural weakness, and any other significant deviation from prudent lending practices. The special mention rating is designed to identify a specific level of risk and concern about asset quality.Although a special mention asset has a higher probability of default than a pass asset, its default is not imminent.COMMERCE UNION BANCSHARES, INC.
NOTES TO CONSOLIDATED FINANCIAL STATEMENTS (CONTINUED)
DECEMBER 31, 2016, 2015 AND 2014
(Dollar amounts in thousands except per share amounts)
NOTE 3 - LOANS AND ALLOWANCE FOR LOAN LOSSES (CONTINUED)
A ‘‘substandard’’ extension of credit is inadequately protected by the current sound worth and paying capacity of the obligor or of the collateral pledged, if any. Extensions of credit so classified should have a well-defined weakness or weaknesses that jeopardize the liquidation of the debt. They are characterized by the distinct possibility that the Company will sustain some loss if the deficiencies are not corrected. Loss potential, while existing in the aggregate amount of substandard credits, does not have to exist in individual extensions of credit classified
as substandard. Substandard assets have a high probability of payment default, or they have other well-defined weaknesses. They require supervision that is more intensive by Company management. Substandard assets are generally characterized by current or expected unprofitable operations, inadequate debt service coverage, inadequate liquidity, or marginal capitalization. Repayment may depend on collateral or other credit risk mitigation.
RELIANT BANCORP, INC.
NOTES TO CONSOLIDATED FINANCIAL STATEMENTS (CONTINUED)
DECEMBER 31, 2019, 2018 AND 2017
(Dollar amounts in thousands except per share amounts)
NOTE 3 - LOANS AND ALLOWANCE FOR LOAN LOSS (CONTINUED)
An extension of credit classified ‘‘doubtful’’ has all the weaknesses inherent in one classified substandard, with the added characteristic that the weaknesses make collection or liquidation in full, on the basis of currently existing facts, conditions, and values, highly questionable and improbable. The possibility of loss is extremely high, but because of certain important and reasonably specific pending factors that may work to the advantage of and strengthen the credit, its classification as an estimated loss is deferred until its more exact status may be determined. Pending factors may include a proposed merger or acquisition, liquidation proceedings, capital injection, perfecting liens on additional collateral, or refinancing plans. Generally, the doubtful classification should not extend for a long period of time because in most cases the pending factors or events that warranted the doubtful classification should be resolved either positively or negatively in a reasonable period of time.
Extensions of credit classified ‘‘loss’’ are considered uncollectible and of such little value that their continuance as bankable assets is not warranted. This classification does not mean that the credit has absolutely no recovery or salvage value, but rather that it is not practical or desirable to defer writing off this basically worthless asset even though partial recovery may be affected in the future. Amounts classified loss should be promptly charged off. The Company will not attempt long term recoveries while the credit remains on the Company’s books. Losses should be taken in the period in which they surface as uncollectible. With loss assets, the underlying borrowers are often in bankruptcy, have formally suspended debt repayments, or have otherwise ceased normal business operations. Once an asset is classified loss, there is little prospect of collecting either its principal or interest.
COMMERCE UNION BANCSHARES, INC.
NOTES TO CONSOLIDATED FINANCIAL STATEMENTS (CONTINUED)
DECEMBER 31, 2016, 2015 AND 2014
(Dollar amounts in thousands except per share amounts)
NOTE 3 - LOANS AND ALLOWANCE FOR LOAN LOSSES (CONTINUED)
Consumer purpose loans are initially assigned a default loan grade of 99 (Pass) and are risk graded (Grade 6, 7, or 8) according to delinquency status when applicable.
Credit quality indicators by class of loan were as follows at December 31,
2016: | | | | | | | | | | | | |
| | | Commercial
Industrial and
Agricultural | | | Multi Family and
Commercial
Real Estate | | | Construction
Land Development
and Farmland | |
| | | |
Pass (grades 1-5) | | $ | 129,880 | | | $ | 211,938 | | | $ | 111,663 | |
Special Mention | | | — | | | | — | | | | 1,767 | |
Substandard | | | 4,524 | | | | 3,701 | | | | 2,459 | |
| | | | | | | | | | | | |
Total | | $ | 134,404 | | | $ | 215,639 | | | $ | 115,889 | |
| | | | | | | | | | | | |
| | | | | | | | | | | | | | | | |
| | | | |
| | | Consumer and
Other | | | 1-4 Family
Residential Real
Estate | | | 1-4 Family
HELOC | | | Total | |
| | | | |
Pass (grades 1-5) | | $ | 30,985 | | | $ | 109,592 | | | $ | 55,981 | | | $ | 650,039 | |
Special Mention | | | — | | | | 1,427 | | | | — | | | | 3,194 | |
Substandard | | | — | | | | 2,012 | | | | 1,479 | | | | 14,175 | |
| | | | | | | | | | | | | | | | |
| | | | |
Total | | $ | 30,985 | | | $ | 113,031 | | | $ | 57,460 | | | $ | 667,408 | |
| | | | | | | | | | | | | | | | |
2019:
|
| | | | | | | | | | | | | | | | |
| | | Pass | | Special Mention | | Substandard | | Total |
| Commercial, Industrial and Agricultural | | $ | 241,089 |
| | $ | 2,382 |
| | $ | 2,044 |
| | $ | 245,515 |
|
| 1-4 Family Residential Real Estate | | 225,809 |
| | — |
| | 1,720 |
| | 227,529 |
|
| 1-4 Family HELOC | | 95,678 |
| | — |
| | 550 |
| | 96,228 |
|
| Multi-family and Commercial Real Estate | | 531,055 |
| | 1,519 |
| | 4,271 |
| | 536,845 |
|
| Construction, Land Development and Farmland | | 272,440 |
| | — |
| | 1,432 |
| | 273,872 |
|
| Consumer | | 16,634 |
| | — |
| | 221 |
| | 16,855 |
|
| Other | | 13,180 |
| | — |
| | — |
| | 13,180 |
|
| Total | | $ | 1,395,885 |
| | $ | 3,901 |
| | $ | 10,238 |
| | $ | 1,410,024 |
|
RELIANT BANCORP, INC.
NOTES TO CONSOLIDATED FINANCIAL STATEMENTS (CONTINUED)
DECEMBER 31, 2019, 2018 AND 2017
(Dollar amounts in thousands except per share amounts)
NOTE 3 - LOANS AND ALLOWANCE FOR LOAN LOSS (CONTINUED)
Credit quality indicators by class of loan were as follows at December 31,
2015: | | | | | | | | | | | | |
| | | Commercial
Industrial and
Agricultural | | | Multi Family and
Commercial
Real Estate | | | Construction
Land Development
and Farmland | |
| | | |
Pass (grades 1-5) | | $ | 141,119 | | | $ | 198,143 | | | $ | 89,521 | |
Special Mention | | | 1,415 | | | | 2,397 | | | | — | |
Substandard | | | 1,236 | | | | 2,196 | | | | 242 | |
| | | | | | | | | | | | |
| | | |
Total | | $ | 143,770 | | | $ | 202,736 | | | $ | 89,763 | |
| | | | | | | | | | | | |
| | | | | | | | | | | | | | | | |
| | | | |
| | | Consumer and
Other | | | 1-4 Family
Residential Real
Estate | | | 1-4 Family
HELOC | | | Total | |
| | | | |
Pass (grades 1-5) | | $ | 20,827 | | | $ | 107,331 | | | $ | 47,504 | | | $ | 604,445 | |
Special Mention | | | — | | | | — | | | | — | | | | 3,812 | |
Substandard | | | — | | | | 3,405 | | | | 2,161 | | | | 9,240 | |
| | | | | | | | | | | | | | | | |
| | | | |
Total | | $ | 20,827 | | | $ | 110,736 | | | $ | 49,665 | | | $ | 617,497 | |
| | | | | | | | | | | | | | | | |
COMMERCE UNION BANCSHARES, INC.
NOTES TO CONSOLIDATED FINANCIAL STATEMENTS (CONTINUED)
DECEMBER 31, 2016, 2015 AND 2014
(Dollar amounts in thousands except per share amounts)
NOTE 3 - LOANS AND ALLOWANCE FOR LOAN LOSSES (CONTINUED)
2018:
|
| | | | | | | | | | | | | | | | |
| | | Pass | | Special Mention | | Substandard | | Total |
| Commercial, Industrial and Agricultural | | $ | 212,761 |
| | $ | — |
| | $ | 1,089 |
| | $ | 213,850 |
|
| 1-4 Family Residential Real Estate | | 221,546 |
| | 1,125 |
| | 3,192 |
| | 225,863 |
|
| 1-4 Family HELOC | | 88,112 |
| | — |
| | — |
| | 88,112 |
|
| Multi-family and Commercial Real Estate | | 442,127 |
| | 3,135 |
| | 2,578 |
| | 447,840 |
|
| Construction, Land Development and Farmland | | 218,053 |
| | 579 |
| | 2,169 |
| | 220,801 |
|
| Consumer | | 20,236 |
| | — |
| | 259 |
| | 20,495 |
|
| Other | | 14,106 |
| | — |
| | — |
| | 14,106 |
|
| Total | | $ | 1,216,941 |
| | $ | 4,839 |
| | $ | 9,287 |
| | $ | 1,231,067 |
|
Past due loan balances by class of loan were as follows at December 31,
2016: | | | | | | | | | | | | | | | | |
| | | Accruing
30-59 Days
Past Due | | | Accruing
60-89 Days
Past Due | | | Accruing
Greater
than
90 Days | | | Accruing
Total
Past Due | |
| | | | |
Commercial, industrial and agricultural | | $ | 207 | | | $ | 142 | | | $ | — | | | $ | 349 | |
Multi family and commercial real estate | | | — | | | | — | | | | — | | | | — | |
Construction, land development and farmland | | | 58 | | | | — | | | | — | | | | 58 | |
1-4 family residential real estate | | | 7 | | | | — | | | | — | | | | 7 | |
1-4 family HELOC | | | — | | | | — | | | | — | | | | — | |
Consumer | | | 193 | | | | — | | | | — | | | | 193 | |
Other | | | — | | | | — | | | | — | | | | — | |
| | | | | | | | | | | | | | | | |
Total | | $ | 465 | | | $ | 142 | | | $ | — | | | $ | 607 | |
| | | | | | | | | | | | | | | | |
| | | | | | | | | | | | | | | | | | | | |
| | | Current | | | Accruing
Total
Past Due | | | Non
Accrual
Current
Loans | | | Non
Accrual
Past
Due
Loans | | | Total
Loans | |
Commercial, industrial and agricultural | | $ | 130,993 | | | $ | 349 | | | $ | 1,243 | | | $ | 1,819 | | | $ | 134,404 | |
Multi family and commercial real estate | | | 215,003 | | | | — | | | | 636 | | | | — | | | | 215,639 | |
Construction, land development and farmland | | | 115,101 | | | | 58 | | | | — | | | | 730 | | | | 115,889 | |
1-4 family residential real estate | | | 112,680 | | | | 7 | | | | 58 | | | | 286 | | | | 113,031 | |
1-4 family HELOC | | | 56,598 | | | | — | | | | 862 | | | | — | | | | 57,460 | |
Consumer | | | 17,047 | | | | 193 | | | | — | | | | — | | | | 17,240 | |
Other | | | 13,745 | | | | — | | | | — | | | | — | | | | 13,745 | |
| | | | | | | | | | | | | | | | | | | | |
Total | | $ | 661,167 | | | $ | 607 | | | $ | 2,799 | | | $ | 2,835 | | | $ | 667,408 | |
| | | | | | | | | | | | | | | | | | | | |
COMMERCE UNION BANCSHARES,2019:
|
| | | | | | | | | | | | | | | | | | | | | | | | |
| | | 30-59 Days Past Due | | 60-89 Days Past Due | | 90+ Days Past Due | | Total Past Due | | Current | | Total Loans |
| Commercial, Industrial and Agricultural | | $ | 79 |
| | $ | 4 |
| | $ | 572 |
| | $ | 655 |
| | $ | 244,860 |
| | $ | 245,515 |
|
| 1-4 Family Residential Real Estate | | 501 |
| | 236 |
| | 229 |
| | 966 |
| | 226,563 |
| | 227,529 |
|
| 1-4 Family HELOC | | — |
| | — |
| | 296 |
| | 296 |
| | 95,932 |
| | 96,228 |
|
| Multi-family and Commercial Real Estate | | 485 |
| | — |
| | 558 |
| | 1,043 |
| | 535,802 |
| | 536,845 |
|
| Construction, Land Development and Farmland | | 255 |
| | — |
| | 339 |
| | 594 |
| | 273,278 |
| | 273,872 |
|
| Consumer | | 38 |
| | 26 |
| | 64 |
| | 128 |
| | 16,727 |
| | 16,855 |
|
| Other | | — |
| | — |
| | — |
| | — |
| | 13,180 |
| | 13,180 |
|
| Total | | $ | 1,358 |
| | $ | 266 |
| | $ | 2,058 |
| | $ | 3,682 |
| | $ | 1,406,342 |
| | $ | 1,410,024 |
|
NOTES TO CONSOLIDATED FINANCIAL STATEMENTS (CONTINUED)
DECEMBER 31,
2016, 20152019, 2018 AND
20142017
(Dollar amounts in thousands except per share amounts)
NOTE 3 - LOANS AND ALLOWANCE FOR LOAN
LOSSESLOSS (CONTINUED)
Past due loan balances by class of loan were as follows at December 31,
2015: | | | | | | | | | | | | | | | | |
| | | Accruing
30-59 Days
Past Due | | | Accruing
60-89 Days
Past Due | | | Accruing
Greater
than
90 Days | | | Accruing
Total
Past Due | |
| | | | |
Commercial, industrial and agricultural | | $ | 1 | | | $ | 148 | | | $ | — | | | $ | 149 | |
Multi family and commercial real estate | | | — | | | | — | | | | — | | | | — | |
Construction, land development and farmland | | | — | | | | — | | | | — | | | | — | |
1-4 family residential real estate | | | 579 | | | | — | | | | — | | | | 579 | |
1-4 family HELOC | | | — | | | | — | | | | — | | | | — | |
Consumer | | | 11 | | | | — | | | | — | | | | 11 | |
Other | | | — | | | | — | | | | — | | | | — | |
| | | | | | | | | | | | | | | | |
Total | | $ | 591 | | | $ | 148 | | | $ | — | | | $ | 739 | |
| | | | | | | | | | | | | | | | |
| | | | | | | | | | | | | | | | | | | | |
| | | Current | | | Accruing
Total
Past Due | | | Non
Accrual
Current
Loans | | | Non
Accrual
Past Due
Loans | | | Total
Loans | |
| | | | | |
Commercial, industrial and agricultural | | $ | 142,674 | | | $ | 149 | | | $ | 504 | | | $ | 443 | | | $ | 143,770 | |
Multi family and commercial real estate | | | 202,023 | | | | — | | | | — | | | | 713 | | | | 202,736 | |
Construction, land development and farmland | | | 89,605 | | | | — | | | | — | | | | 158 | | | | 89,763 | |
1-4 family residential real estate | | | 108,048 | | | | 579 | | | | 415 | | | | 1,694 | | | | 110,736 | |
1-4 family HELOC | | | 48,588 | | | | — | | | | 879 | | | | 198 | | | | 49,665 | |
Consumer | | | 15,260 | | | | 11 | | | | — | | | | — | | | | 15,271 | |
Other | | | 5,556 | | | | — | | | | — | | | | — | | | | 5,556 | |
| | | | | | | | | | | | | | | | | | | | |
Total | | $ | 611,754 | | | $ | 739 | | | $ | 1,798 | | | $ | 3,206 | | | $ | 617,497 | |
| | | | | | | | | | | | | | | | | | | | |
There2018:
|
| | | | | | | | | | | | | | | | | | | | | | | | |
| | | 30-59 Days Past Due | | 60-89 Days Past Due | | 90+ Days Past Due | | Total Past Due | | Current | | Total Loans |
| Commercial, Industrial and Agricultural | | $ | 22 |
| | $ | 153 |
| | $ | 279 |
| | $ | 454 |
| | $ | 213,396 |
| | $ | 213,850 |
|
| 1-4 Family Residential Real Estate | | 1,104 |
| | 335 |
| | 1,203 |
| | 2,642 |
| | 223,221 |
| | 225,863 |
|
| 1-4 Family HELOC | | 50 |
| | — |
| | — |
| | 50 |
| | 88,062 |
| | 88,112 |
|
| Multi-family and Commercial Real Estate | | — |
| | 104 |
| | — |
| | 104 |
| | 447,736 |
| | 447,840 |
|
| Construction, Land Development and Farmland | | 214 |
| | — |
| | 171 |
| | 385 |
| | 220,416 |
| | 220,801 |
|
| Consumer | | 11 |
| | 30 |
| | 46 |
| | 87 |
| | 20,408 |
| | 20,495 |
|
| Other | | — |
| | — |
| | — |
| | — |
| | 14,106 |
| | 14,106 |
|
| Total | | $ | 1,401 |
| | $ | 622 |
| | $ | 1,699 |
| | $ | 3,722 |
| | $ | 1,227,345 |
| | $ | 1,231,067 |
|
At December 31, 2019, there were no loans past due 90 days or more and still accruing
interest atinterest. At December 31,
20162018, there were loans of $6 past due 90 days or
2015.COMMERCE UNION BANCSHARES, INC.
NOTES TO CONSOLIDATED FINANCIAL STATEMENTS (CONTINUED)
DECEMBERmore and still accruing interest.
There were no troubled debt restructurings occurring during the year ended December 31,
2016, 2015 AND 2014(Dollar amounts in thousands except per share amounts)
NOTE 3 - LOANS AND ALLOWANCE FOR LOAN LOSSES (CONTINUED)
2019.
Troubled debt restructurings occurring during the year ended December 31,
20162018 by class of loan were as follows:
| | | | | | | | | | | | |
| | | Number of
Contracts | | | Pre-Modification
Oustanding
Recorded
Investments | | | Post-Modification
Oustanding
Recorded
Investments | |
| | | |
Construction, land development and farmland | | | 2 | | | $ | 1,712 | | | $ | 1,712 | |
|
| | | | | | | | | | | |
| | | Number of Contracts | | Pre-Modification Outstanding Recorded Investments | | Post-Modification Outstanding Recorded Investments |
| 1-4 Family Residential Estate | | 1 |
| | $ | 1,254 |
| | $ | 1,254 |
|
| Multi-family and Commercial Real Estate | | 1 |
| | $ | 661 |
| | $ | 585 |
|
| Total | | 2 |
| | $ | 1,915 |
| | $ | 1,839 |
|
Troubled debt restructurings occurring during the year ended December 31,
20152017 by class of loan were as follows:
| | | | | | | | | | | | |
| | | Number of
Contracts | | | Pre-Modification
Oustanding
Recorded
Investments | | | Post-Modification
Oustanding
Recorded
Investments | |
| | | |
1-4 family residential real estate | | | 1 | | | $ | 196 | | | $ | 196 | |
Troubled debt restructurings occurring
|
| | | | | | | | | | | |
| | | Number of Contracts | | Pre-Modification Outstanding Recorded Investments | | Post-Modification Outstanding Recorded Investments |
| Construction, Land Development and Farmland | | 2 |
| | $ | 2,110 |
| | $ | 1,640 |
|
| Total | | 2 |
| | $ | 2,110 |
| | $ | 1,640 |
|
RELIANT BANCORP, INC.
NOTES TO CONSOLIDATED FINANCIAL STATEMENTS (CONTINUED)
DECEMBER 31, 2019, 2018 AND 2017
(Dollar amounts in thousands except per share amounts)
NOTE 3 - LOANS AND ALLOWANCE FOR LOAN LOSS (CONTINUED)
During the year ended December 21, 2018, one modification occurred that consisted of an interest only monthly payment restructure and had no effect on the allowance for loan losses or interested income. The other modification was a restructure of five loans, including purchased credit impaired loans, in which a charge off occurred of $76. The 1-4 Family Residential loan with a related balance of $1,254 was paid during
2018. During the year ended December 31,
2014 by class2017, two loans were modified in a troubled debt restructuring. One modification consisted of
a partial charge off totaling $470, and a payment restructure with the modification having no effect on interest income for the remaining balance of $308 at December 31, 2017. The other modification consisted of a temporary suspension of required monthly payments of a loan
were as follows: | | | | | | | | | | | | |
| | | Number of
Contracts | | | Pre-Modification
Oustanding
Recorded
Investments | | | Post-Modification
Oustanding
Recorded
Investments | |
| | | |
Commercial and industrial | | | 2 | | | $ | 948 | | | $ | 1,044 | |
with a balance of $108 at December 31, 2017 and had no effect on the allowance for loan losses or interest income. There were no charge offs resulting from modificationsthe modification during the yearsyear ended December 31, 2016, 2015 or 2014.2017. The modificationsmodification consisted of changes in the amortization terms of the loans and payment modifications. The modificationsmodification had no affecteffect on the allowance for loan losses and interest income was not significantly affected.
There were no subsequent defaults on loans modified in troubled debt restructurings during the years ended December 31,
2016, 20152019, 2018 and
2014.COMMERCE UNION BANCSHARES, INC.
NOTES TO CONSOLIDATED FINANCIAL STATEMENTS (CONTINUED)
DECEMBER 31, 2016, 2015 AND 2014
(Dollar amounts in thousands except per share amounts)
NOTE 3 - LOANS AND ALLOWANCE FOR LOAN LOSSES (CONTINUED)
As part of an acquisition completed during 2015, the2017.
The Company has acquired loans for which there was, at acquisition, evidence of deterioration of credit quality since origination and it was probable, at acquisition, that not all contractually required payments would be collected. The carrying amount of those loans was as follows at December 31,
20162019 and
2015,2018, respectively:
| | | | | | | | |
| | | 2016 | | | 2015 | |
Commercial, industrial and agricultural | | $ | 385 | | | $ | 1,558 | |
Multi family and commercial real estate | | | 3,321 | | | | 4,565 | |
Construction, land development and farmland | | | 1,569 | | | | 1,598 | |
1-4 family residential real estate | | | 92 | | | | 1,016 | |
1-4 family HELOC | | | 36 | | | | 40 | |
| | | | | | | | |
Total outstanding balance | | | 5,403 | | | | 8,777 | |
Less remaining purchase discount | | | 635 | | | | 1,671 | |
| | | | | | | | |
| | | 4,768 | | | | 7,106 | |
Allowance for loan losses | | | 6 | | | | 247 | |
| | | | | | | | |
Carrying amount, net of allowance | | $ | 4,762 | | | $ | 6,859 | |
| | | | | | | | |
|
| | | | | | | | |
| | | 2019 | | 2018 |
| Commercial, Industrial and Agricultural | | $ | — |
| | $ | 63 |
|
| Multi-family and Commercial Real Estate | | 217 |
| | 233 |
|
| Construction, Land Development and Farmland | | 1,021 |
| | 1,958 |
|
| 1-4 Family Residential Real Estate | | 231 |
| | 324 |
|
| 1-4 Family HELOC | | — |
| | — |
|
| Consumer | | — |
| | 18 |
|
| Total outstanding balance | | 1,469 |
| | 2,596 |
|
| Less remaining purchase discount | | 246 |
| | 300 |
|
| Allowance for loan losses | | — |
| | — |
|
| Carrying amount, net of allowance | | $ | 1,223 |
| | $ | 2,296 |
|
During the year ended December 31,
2016,2019, a loan with a non-accretable purchase discount of $25 was collected resulting in the recognition of the discount in interest income. During the year ended December 31, 2018, loans with non-accretable purchase discounts totaling $146 were paid in full resulting in the recognition of the discounts in interest income. During the year ended December 31, 2017, a loan with non-accretable purchase discount totaling
$708$354 was paid in full resulting in the recognition of the discounts in interest income.
Activity related to the accretable portion of the purchase discount on loans acquired with deteriorated credit quality is as follows for the years ended December 31,
20152019, 2018 and
2016: | | | | |
Balance at January 1, 2015 | | $ | — | |
New loans acquired | | | 478 | |
Accretion income | | | (97 | ) |
Reclassification to nonaccretable | | | (148 | ) |
| | | | |
Balance at December 31, 2015 | | $ | 233 | |
Accretion income | | | (146 | ) |
| | | | |
Balance at December 31, 2016 | | $ | 87 | |
| | | | |
2017:
|
| | | | | | | | | | | |
| | 2019 | | 2018 | | 2017 |
| Balance at January 1, | $ | 110 |
| | $ | — |
| | $ | 87 |
|
| New loans purchased | — |
| | 260 |
| | — |
|
| Loan charge offs | (12 | ) | | (104 | ) | | — |
|
| Accretion income | — |
| | (46 | ) | | (87 | ) |
| Balance at December 31, | $ | 98 |
| | $ | 110 |
| | $ | — |
|
RELIANT BANCORP, INC.
NOTES TO CONSOLIDATED FINANCIAL STATEMENTS (CONTINUED)
DECEMBER 31, 2019, 2018 AND 2017
(Dollar amounts in thousands except per share amounts)
NOTE 3 - LOANS AND ALLOWANCE FOR LOAN LOSS (CONTINUED)
The Company decreased the allowance for loan losses on purchased credit impaired loans by
$241$4 and $2, during the
yearyears ended December 31,
20162018 and
increased the allowance for loan losses on purchased credit impaired loans by $247 during the year ended December 31, 2015.COMMERCE UNION BANCSHARES, INC.
NOTES TO CONSOLIDATED FINANCIAL STATEMENTS (CONTINUED)
DECEMBER 31, 2016, 2015 AND 2014
(Dollar amounts in thousands except per share amounts)
NOTE 3 - LOANS AND ALLOWANCE FOR LOAN LOSSES (CONTINUED)
Purchased credit impaired loans acquired during the year ended December 31, 2015 for which it was probable at acquisition that all contractually required payments would not be collected are as follows:
| | | | |
Contractually required payments receivable of loans purchased | | $ | 10,201 | |
Cash flows expected to be collected at acquisition | | $ | 8,564 | |
Fair value at acquisition | | $ | 7,346 | |
2017, respectively.
In the normal course of business, the Company will enter into various credit arrangements with its executive officers, directors and their affiliates. These arrangements generally take the form of commercial lines of credit, personal lines of credit, mortgage loans, term loans or revolving arrangements secured by personal residences. An analysis of the activity with respect to loans to related parties for the years ended December 31,
2016, 20152019, 2018 and
2014,2017, is as follows:
| | | | | | | | |
| | | 2016 | | | 2015 | |
| | |
Balance - January 1 | | $ | 10,484 | | | $ | 9,995 | |
New loans during the year | | | 4,442 | | | | 5,413 | |
Repayments during the year | | | (2,991 | ) | | | (4,924 | ) |
| | | | | | | | |
| | |
Balance - December 31 | | $ | 11,935 | | | $ | 10,484 | |
| | | | | | | | |
As of
|
| | | | | | | | | | | | |
| | | 2019 | | 2018 | | 2017 |
| Balance - January 1, | | $ | 7,394 |
| | $ | 8,581 |
| | $ | 11,935 |
|
| New loans during the year | | (3,136 | ) | | 919 |
| | 4,356 |
|
| Repayments during the year | | 3,281 |
| | (2,106 | ) | | (7,710 | ) |
| Balance - December 31, | | $ | 7,539 |
| | $ | 7,394 |
| | $ | 8,581 |
|
During the three-year period ended December 31,
2016 and 2015,2019, none of these loans were restructured
nor were any related party loansor charged
off in 2016, 2015 or 2014.COMMERCE UNION BANCSHARES,off.
NOTES TO CONSOLIDATED FINANCIAL STATEMENTS (CONTINUED)
DECEMBER 31,
2016, 20152019, 2018 AND
20142017
(Dollar amounts in thousands except per share amounts)
NOTE 4 - OTHER REAL ESTATE
Other real estate activity for the years ended December 31, 2019, 2018 and 2017, was as follows:
|
| | | | | | | | | | | |
| | 2019 | | 2018 | | 2017 |
| Beginning balance | $ | 1,000 |
| | $ | — |
| | $ | — |
|
| Loans acquired in merger | — |
| | 1,650 |
| | — |
|
| Loans transferred to other real estate | 943 |
| | 1,060 |
| | — |
|
| Allowance to lower of cost or market | (98 | ) | | — |
| | — |
|
| Sales of other real estate | (1,095 | ) | | (1,710 | ) | | — |
|
| End of year | $ | 750 |
| | $ | 1,000 |
| | $ | — |
|
Activity in the valuation allowance for the years ended December 31, 2019, 2018 and 2017, was as follows:
|
| | | | | | | | | | | |
| | 2019 | | 2018 | | 2017 |
| Beginning balance | $ | — |
| | $ | — |
| | $ | — |
|
| Provisions/(recoveries) charged/(credited) to expense | 98 |
| | — |
| | — |
|
| Reductions from sales of other real estate | — |
| | — |
| | — |
|
| Direct write-downs | — |
| | — |
| | — |
|
| End of year | $ | 98 |
| | $ | — |
| | $ | — |
|
Expenses related to foreclosed assets for the years ended December 31, 2019, 2018 and 2017, include:
|
| | | | | | | | | | | |
| | 2019 | | 2018 | | 2017 |
| Net gain on sales | $ | (166 | ) | | $ | (259 | ) | | $ | (27 | ) |
| Provision for unrealized losses | 98 |
| | — |
| | — |
|
| Operating expenses, net of rental income | 44 |
| | 50 |
| | 7 |
|
| Total | $ | (24 | ) | | $ | (209 | ) | | $ | (20 | ) |
In connection with the 2018 merger with Community First, the Company acquired three real estate parcels. The Company valued the properties at their estimated fair values less costs to sale which totaled $1,650.
RELIANT BANCORP, INC.
NOTES TO CONSOLIDATED FINANCIAL STATEMENTS (CONTINUED)
DECEMBER 31, 2019, 2018 AND 2017
(Dollar amounts in thousands except per share amounts)
NOTE
45 - FAIR VALUES OF ASSETS AND LIABILITIES
The following table sets forth the Company’s major categories of assets and liabilities measured at fair value on a recurring basis, by level within the fair value hierarchy, as of December 31,
20162019 and
2015: | | | | | | | | | | | | | | | | |
| | | Fair Value | | | Quoted Prices in
Active Markets
for Identical
Assets
(Level 1) | | | Significant
Other
Observable
Inputs
(Level 2) | | | Significant
Unobservable
Inputs
(Level 3) | |
| December 31, 2016 | | | | | | | | | | | | | | | | |
Assets | | | | | | | | | | | | | | | | |
U. S. Treasury and other U. S. government agencies | | $ | 1,908 | | | $ | — | | | $ | 1,908 | | | $ | — | |
State and municipal | | | 119,634 | | | | — | | | | 119,634 | | | | — | |
Corporate bonds | | | 1,987 | | | | — | | | | 1,987 | | | | — | |
Mortgage backed securities | | | 20,034 | | | | — | | | | 20,034 | | | | — | |
Time deposits | | | 3,250 | | | | 3,250 | | | | — | | | | — | |
Interest rate swap | | | 195 | | | | — | | | | 195 | | | | — | |
| | | | |
Liabilities | | | | | | | | | | | | | | | | |
Interest rate swap | | $ | 267 | | | $ | — | | | $ | 267 | | | $ | — | |
| | | | |
| December 31, 2015 | | | | | | | | | | | | | | | | |
Assets | | | | | | | | | | | | | | | | |
U. S. Treasury and other U. S. government agencies | | $ | 4,836 | | | $ | — | | | $ | 4,836 | | | $ | — | |
State and municipal | | | 87,595 | | | | — | | | | 87,595 | | | | — | |
Corporate bonds | | | 1,979 | | | | — | | | | 1,979 | | | | — | |
Mortgage backed securities | | | 36,165 | | | | — | | | | 36,165 | | | | — | |
Time deposits | | | 3,250 | | | | 3,250 | | | | — | | | | — | |
Interest rate swap | | | 77 | | | | — | | | | 77 | | | | — | |
| | | | |
Liabilities | | | | | | | | | | | | | | | | |
Interest rate swap | | $ | 572 | | | $ | — | | | $ | 572 | | | $ | — | |
COMMERCE UNION BANCSHARES,2018:
|
| | | | | | | | | | | | | | | | |
| | | Fair Value | | Quoted Prices in Active Markets for Identical Assets (Level 1) | | Significant Other Observable Inputs (Level 2) | | Significant Unobservable Inputs (Level 3) |
| December 31, 2019 | | | | | | | | |
| Assets | | | | | | | | |
| U. S. Treasury and other U. S. government agencies | | $ | 59 |
| | $ | — |
| | $ | 59 |
| | $ | — |
|
| State and municipal | | 196,660 |
| | — |
| | 196,660 |
| | — |
|
| Corporate bonds | | 7,845 |
| | — |
| | 7,845 |
| | — |
|
| Mortgage backed securities | | 37,761 |
| | — |
| | 37,761 |
| | — |
|
| Asset backed securities | | 17,968 |
| | — |
| | 17,968 |
| | — |
|
| Interest rate swap | | 688 |
| | — |
| | 688 |
| | — |
|
| | | | | | | | | |
| Liabilities | | | | | | | | |
| Interest rate swap | | $ | 3,396 |
| | $ | — |
| | $ | 3,396 |
| | $ | — |
|
| | | | | | | | | |
| December 31, 2018 | | | | | | | | |
| Assets | | | | | | | | |
| U. S. Treasury and other U. S. government agencies | | $ | 554 |
| | $ | — |
| | $ | 554 |
| | $ | — |
|
| State and municipal | | 229,298 |
| | — |
| | 229,298 |
| | — |
|
| Corporate bonds | | 3,017 |
| | — |
| | 3,017 |
| | — |
|
| Mortgage backed securities | | 31,958 |
| | — |
| | 31,958 |
| | — |
|
| Asset backed securities | | 27,996 |
| | — |
| | 27,996 |
| | — |
|
| Time deposits | | 3,500 |
| | 3,500 |
| | — |
| | — |
|
| Interest rate swap | | 467 |
| | — |
| | 467 |
| | — |
|
| | | | | | | | | |
| Liabilities | | | | | | | | |
| Interest rate swap | | $ | 1,183 |
| | $ | — |
| | $ | 1,183 |
| | $ | — |
|
NOTES TO CONSOLIDATED FINANCIAL STATEMENTS (CONTINUED)
DECEMBER 31,
2016, 20152019, 2018 AND
20142017
(Dollar amounts in thousands except per share amounts)
NOTE
45 - FAIR VALUES OF ASSETS AND LIABILITIES (CONTINUED)
The following table sets forth the Company’s major categories of assets and liabilities measured at fair value on a nonrecurring basis, by level within the fair value hierarchy, as of December 31,
20162019 and
2015: | | | | | | | | | | | | | | | | |
| | | Fair Value | | | Quoted Prices in
Active Markets
for Identical
Assets
(Level 1) | | | Significant
Other
Observable
Inputs
(Level 2) | | | Significant
Unobservable
Inputs
(Level 3) | |
| December 31, 2016 | | | | | | | | | | | | | | | | |
Assets | | | | | | | | | | | | | | | | |
Impaired loans | | $ | 3,410 | | | $ | — | | | $ | — | | | $ | 3,410 | |
| | | | |
| December 31, 2015 | | | | | | | | | | | | | | | | |
Assets | | | | | | | | | | | | | | | | |
Impaired loans | | $ | 2,486 | | | $ | — | | | $ | — | | | $ | 2,486 | |
Other real estate owned | | | 1,149 | | | | — | | | | — | | | | 1,149 | |
2018:
|
| | | | | | | | | | | | | | | | |
| | | Fair Value | | Quoted Prices in Active Markets for Identical Assets (Level 1) | | Significant Other Observable Inputs (Level 2) | | Significant Unobservable Inputs (Level 3) |
| December 31, 2019 | | | | | | | | |
| Assets | | | | | | | | |
| Impaired loans | | $ | 553 |
| | $ | — |
| | $ | — |
| | $ | 553 |
|
| Other real estate owned | | 750 |
| | — |
| | — |
| | 750 |
|
| | | | | | | | | |
| December 31, 2018 | | | | | | | | |
| Assets | | | | | | | | |
| Impaired loans | | $ | 370 |
| | $ | — |
| | $ | — |
| | $ | 370 |
|
The following table presents additional quantitative information about assets measured at fair value on a nonrecurring basis and for which we have utilized Level 3 inputs to determine fair value at December 31,
20162019 and
2015:2018: | | | | |
| | | |
| | | Techniques (1) | | Significant Unobservable Inputs | | Range
(Weighted Average) | |
Impaired loans | | Appraisal | | Estimated costs to sell | | | 10 | % 10% |
Other real estate owned | | Appraisal | | Estimated costs to sell | | | 10 | % 10% |
| |
| (1) | The fair value is generally determined through independent appraisals of the underlying collateral, which may include Level 3 inputs that are not identifiable, or by using the discounted cash flow method if the loan is not collateral dependent. Estimated cash flows change and appraised values of the assets or collateral underlying the loans will be sensitive to changes. |
COMMERCE UNION BANCSHARES,
NOTES TO CONSOLIDATED FINANCIAL STATEMENTS (CONTINUED)
DECEMBER 31,
2016, 20152019, 2018 AND
20142017
(Dollar amounts in thousands except per share amounts)
NOTE
45 - FAIR VALUES OF ASSETS AND LIABILITIES (CONTINUED)
Carrying amounts and estimated fair values of financial instruments, by level within the fair value hierarchy, at December 31,
20162019 were as follows:
| | | | | | | | | | | | | | | | | | | | |
| | | Carrying
Amount | | | Estimated
Fair
Value | | | Quoted Prices in
Active Markets
for Identical
Assets
(Level 1) | | | Significant
Other
Observable
Inputs
(Level 2) | | | Significant
Unobservable
Inputs
(Level 3) | |
Financial assets | | | | | | | | | | | | | | | | | | | | |
Cash and due from banks | | $ | 23,413 | | | $ | 23,413 | | | $ | 23,413 | | | $ | — | | | $ | — | |
Federal funds sold | | | 830 | | | | 830 | | | | 830 | | | | — | | | | — | |
Loans, net | | | 657,701 | | | | 658,130 | | | | — | | | | — | | | | 658,130 | |
Mortgage loans held for sale | | | 11,831 | | | | 11,831 | | | | — | | | | — | | | | 11,831 | |
Accrued interest receivable | | | 3,786 | | | | 3,786 | | | | — | | | | 3,786 | | | | — | |
Restricted equity securities | | | 7,133 | | | | 7,133 | | | | — | | | | 7,133 | | | | — | |
Financial liabilities | | | | | | | | | | | | | | | | | | | | |
Deposits | | | 763,834 | | | | 763,174 | | | | — | | | | — | | | | 763,174 | |
Accrued interest payable | | | 107 | | | | 107 | | | | — | | | | 107 | | | | — | |
Federal Home Loan Bank advances | | | 32,287 | | | | 32,444 | | | | — | | | | 32,444 | | | | — | |
|
| | | | | | | | | | | | | | | | | | | | |
| | | Carrying Amount | | Estimated Fair Value | | Quoted Prices in Active Markets for Identical Assets (Level 1) | | Significant Other Observable Inputs (Level 2) | | Significant Unobservable Inputs (Level 3) |
| Financial assets | | | | | | | | | | |
| Cash and due from banks | | $ | 50,990 |
| | $ | 50,990 |
| | $ | 50,990 |
| | $ | — |
| | $ | — |
|
| Federal funds sold | | 52 |
| | 52 |
| | — |
| | 52 |
| | — |
|
| Loans, net | | 1,397,374 |
| | 1,383,719 |
| | — |
| | — |
| | 1,383,719 |
|
| Mortgage loans held for sale | | 37,476 |
| | 38,379 |
| | — |
| | 38,379 |
| | — |
|
| Accrued interest receivable | | 7,111 |
| | 7,111 |
| | — |
| | 7,111 |
| | — |
|
| Restricted equity securities | | 11,279 |
| | 11,279 |
| | — |
| | 11,279 |
| | — |
|
| Financial liabilities | | | | | | | | | | |
| Deposits | | $ | 1,583,789 |
| | $ | 1,582,117 |
| | $ | — |
| | $ | — |
| | $ | 1,582,117 |
|
| Accrued interest payable | | 2,022 |
| | 2,022 |
| | — |
| | 2,022 |
| | — |
|
| Subordinate debentures | | 70,883 |
| | 71,454 |
| | — |
| | — |
| | 71,454 |
|
| Federal Home Loan Bank advances | | 10,737 |
| | 10,755 |
| | — |
| | — |
| | 10,755 |
|
Carrying amounts and estimated fair values of financial instruments, by level within the fair value hierarchy, at December 31,
20152018 were as follows:
| | | | | | | | | | | | | | | | | | | | |
| | | Carrying
Amount | | | Estimated
Fair
Value | | | Quoted Prices in
Active Markets
for Identical
Assets
(Level 1) | | | Significant
Other
Observable
Inputs
(Level 2) | | | Significant
Unobservable
Inputs
(Level 3) | |
Financial assets | | | | | | | | | | | | | | | | | | | | |
Cash and due from banks | | $ | 20,289 | | | $ | 20,289 | | | $ | 20,289 | | | $ | — | | | $ | — | |
Federal funds sold | | | 281 | | | | 281 | | | | 281 | | | | — | | | | — | |
Loans, net | | | 608,747 | | | | 611,628 | | | | — | | | | — | | | | 611,628 | |
Mortgage loans held for sale | | | 55,093 | | | | 55,093 | | | | — | | | | — | | | | 55,093 | |
Accrued interest receivable | | | 3,096 | | | | 3,096 | | | | — | | | | 3,096 | | | | — | |
Restricted equity securities | | | 6,244 | | | | 6,244 | | | | — | | | | 6,244 | | | | — | |
Financial liabilities | | | | | | | | | | | | | | | | | | | | |
Deposits | | | 640,008 | | | | 639,746 | | | | — | | | | — | | | | 639,746 | |
Accrued interest payable | | | 55 | | | | 55 | | | | — | | | | 55 | | | | — | |
Federal Home Loan Bank advances | | | 135,759 | | | | 136,138 | | | | — | | | | 136,138 | | | | — | |
COMMERCE UNION BANCSHARES,
NOTES TO CONSOLIDATED FINANCIAL STATEMENTS (CONTINUED)
DECEMBER 31,
2016, 20152019, 2018 AND
20142017
(Dollar amounts in thousands except per share amounts)
|
| | | | | | | | | | | | | | | | | | | | |
| | | Carrying Amount | | Estimated Fair Value | | Quoted Prices in Active Markets for Identical Assets (Level 1) | | Significant Other Observable Inputs (Level 2) | | Significant Unobservable Inputs (Level 3) |
| Financial assets | | | | | | | | | | |
| Cash and due from banks | | $ | 34,807 |
| | $ | 34,807 |
| | $ | 34,807 |
| | $ | — |
| | $ | — |
|
| Federal funds sold | | 371 |
| | 371 |
| | — |
| | 371 |
| | — |
|
| Loans, net | | 1,220,184 |
| | 1,206,574 |
| | — |
| | — |
| | 1,206,574 |
|
| Mortgage loans held for sale | | 15,823 |
| | 15,871 |
| | — |
| | 15,871 |
| | — |
|
| Accrued interest receivable | | 8,214 |
| | 8,214 |
| | — |
| | 8,214 |
| | — |
|
| Restricted equity securities | | 11,690 |
| | 11,690 |
| | — |
| | 11,690 |
| | — |
|
| Financial liabilities | | | | | | | | | | |
| Deposits | | $ | 1,437,903 |
| | $ | 1,434,652 |
| | $ | — |
| | $ | — |
| | $ | 1,434,652 |
|
| Accrued interest payable | | 1,063 |
| | 1,063 |
| | — |
| | 1,063 |
| | — |
|
| Subordinate debentures | | 11,603 |
| | 11,522 |
| | — |
| | — |
| | 11,522 |
|
| Federal Home Loan Bank advances | | 57,498 |
| | 57,434 |
| | — |
| | — |
| | 57,434 |
|
RELIANT BANCORP, INC.
NOTES TO CONSOLIDATED FINANCIAL STATEMENTS (CONTINUED)
DECEMBER 31, 2019, 2018 AND 2017
(Dollar amounts in thousands except per share amounts)
NOTE
45 - FAIR VALUES OF ASSETS AND LIABILITIES (CONTINUED)
The methods and assumptions used to estimate fair value are described as follows:
Carrying amount is the estimated fair value for cash and cash equivalents, accrued interest receivable and payable, restricted equity securities, demand deposits, and variable rate loans or deposits that reprice frequently and fully. For fixed rate loans or deposits and for variable rate loans or deposits with infrequent repricing or repricing limits, fair value is based on discounted cash flows using current market rates applied to the estimated life and credit risk. Fair value of debt is based on current rates for similar financing. The fair value of off-balance-sheet items is not considered material.
NOTE
56 - PREMISES AND EQUIPMENT
The detail of premises and equipment at December 31,
20162019 and
20152018 is as follows:
| | | | | | | | |
| | | 2016 | | | 2015 | |
Land | | $ | 1,211 | | | $ | 1,211 | |
Buildings | | | 4,717 | | | | 4,717 | |
Construction in progress | | | 368 | | | | 406 | |
Leasehold improvements | | | 3,828 | | | | 3,739 | |
Furniture, fixtures and equipment | | | 7,316 | | | | 6,699 | |
| | | | | | | | |
| | | 17,440 | | | | 16,772 | |
Less: accumulated depreciation | | | (8,347 | ) | | | (7,576 | ) |
| | | | | | | | |
| | |
| | $ | 9,093 | | | $ | 9,196 | |
| | | | | | | | |
|
| | | | | | | | |
| | | 2019 | | 2018 |
| Land | | $ | 6,058 |
| | $ | 6,049 |
|
| Buildings | | 9,020 |
| | 8,951 |
|
| Construction in progress | | 371 |
| | — |
|
| Leasehold improvements | | 7,891 |
| | 7,551 |
|
| Furniture, fixtures and equipment | | 10,930 |
| | 10,311 |
|
| | | 34,270 |
| | 32,862 |
|
| Less: accumulated depreciation and amortization | | (12,894 | ) | | (10,829 | ) |
| | | | | |
| | | $ | 21,376 |
| | $ | 22,033 |
|
Depreciation and amortization expense was $976, $890$1,996, $1,697 and $567$1,017 for the years ended December 31, 2016, 20152019, 2018 and 2014,2017, respectively.
NOTE
67 - RESTRICTED EQUITY SECURITIES
The Company owned the following restricted equity securities as of December 31,
20162019 and
2015: | | | | | | | | |
| | | 2016 | | | 2015 | |
Federal Reserve Bank | | $ | 2,906 | | | $ | 2,717 | |
Federal Home Loan Bank | | | 4,227 | | | | 3,527 | |
| | | | | | | | |
| | |
| | $ | 7,133 | | | $ | 6,244 | |
| | | | | | | | |
COMMERCE UNION BANCSHARES,2018:
|
| | | | | | | | |
| | | 2019 | | 2018 |
| Federal Reserve Bank | | $ | 5,754 |
| | $ | 5,735 |
|
| Federal Home Loan Bank | | 5,525 |
| | 5,955 |
|
| Total | | $ | 11,279 |
| | $ | 11,690 |
|
NOTES TO CONSOLIDATED FINANCIAL STATEMENTS (CONTINUED)
DECEMBER 31,
2016, 20152019, 2018 AND
20142017
(Dollar amounts in thousands except per share amounts)
NOTE
78 - GOODWILL AND CORE DEPOSIT
INTANGIBLEINTANGIBLES
The following presents the balances as of December 31,
2016,2019, and
2015,2018, of intangible assets acquired in business acquisitions:
| | | | | | | | |
| | | 2016 | | | 2015 | |
Goodwill | | $ | 11,404 | | | $ | 11,404 | |
| | | | | | | | |
Amortized intangible assets: | | | | | | | | |
Core deposit intangibles | | $ | 2,946 | | | $ | 2,946 | |
Less accumulated amortization | | | (1,364 | ) | | | (1,008 | ) |
| | | | | | | | |
| | $ | 1,582 | | | $ | 1,938 | |
| | | | | | | | |
|
| | | | | | | | |
| | | 2019 | | 2018 |
| Goodwill | | $ | 43,642 |
| | $ | 43,642 |
|
| | | | | |
| Amortized intangible assets: | | | | |
| Core deposit intangibles | | $ | 10,111 |
| | $ | 10,111 |
|
| Less accumulated amortization | | (2,841 | ) | | (1,892 | ) |
| | | $ | 7,270 |
| | $ | 8,219 |
|
Amortization expense was
$356, $300$949, $949 and
$131$302 for the years ended December 31,
2016, 20152019, 2018 and
2014,2017, respectively.
Estimated future amortization expense
by year as of December 31,
20162019 is as follows:
| | | | |
2017 | | $ | 301 | |
2018 | | | 226 | |
2019 | | | 226 | |
2020 | | | 226 | |
2021 | | | 226 | |
Thereafter | | | 377 | |
| | | | |
Total | | $ | 1,582 | |
| | | | |
COMMERCE UNION BANCSHARES, INC.
NOTES TO CONSOLIDATED FINANCIAL STATEMENTS (CONTINUED)
DECEMBER 31, 2016, 2015 AND 2014
(Dollar amounts in thousands except per share amounts)
|
| | | |
| 2020 | $ | 949 |
|
| 2021 | 949 |
|
| 2022 | 949 |
|
| 2023 | 865 |
|
| 2024 | 695 |
|
| Thereafter | 2,863 |
|
| Total | $ | 7,270 |
|
Contractual maturities of time deposit accounts for the next five years at December 31,
20162019 are as follows:
| | | | |
Maturity | | | |
2017 | | $ | 288,850 | |
2018 | | | 45,676 | |
2019 | | | 8,512 | |
2020 | | | 11,423 | |
2021 | | | 5,315 | |
| | | | |
| | $ | 359,776 | |
| | | | |
|
| | | |
| 2020 | $ | 656,654 |
|
| 2021 | 69,639 |
|
| 2022 | 15,213 |
|
| 2023 | 10,049 |
|
| 2024 | 10,719 |
|
| Total | $ | 762,274 |
|
The aggregate amount of overdrafts reclassified to loans receivable was
$154$381 and
$202$415 at December 31,
20162019 and
2015,2018, respectively.
At December 31,
20162019 and
2015,2018, time deposits in excess of $250 totaled
$221,136$238,004 and
$167,720,$330,736 respectively.
Deposits from principal officers, directors, and their affiliates at December 31, 2016, 20152019 and 20142018 were $14,151, $9,920$14,600 and $5,498,$8,376, respectively.
RELIANT BANCORP, INC.
NOTES TO CONSOLIDATED FINANCIAL STATEMENTS (CONTINUED)
DECEMBER 31, 2019, 2018 AND 2017
(Dollar amounts in thousands except per share amounts)
NOTE
910 - FEDERAL HOME LOAN BANK ADVANCES
At December 31, advances from the
Federal Home Loan BankFHLB were as follows:
| | | | | | | | |
| | | 2016 | | | 2015 | |
Maturities January 2017 through March 2024, fixed rates ranging from .64% to 2.99% | | $ | 32,287 | | | $ | 135,759 | |
|
| | | | | | | | |
| | | 2019 | | 2018 |
| Maturities January 2020 through March 2024, fixed rates ranging from 1.22% to 2.86% ($7,000 is due in the year ending December 31, 2020) | | $ | 10,737 |
| | $ | 57,498 |
|
Each advance is payable at its maturity date, with a prepayment penalty for fixed rate advances.
At December 31, 2019, there was $3,737 of advances amortizing on a monthly basis. The weighted average rate
of the total borrowings at December 31,
20162019 and
20152018 was
1.29%1.76% and
.66%2.42%, respectively. The advances were collateralized by
$332,419$657,608 and
$288,397$597,646 of real estate loans at December 31,
20162019 and
2015,2018, respectively. The Company’s additional borrowing capacity was
$30,484$159,379 and
$23,214$96,082 at December 31,
20162019 and
2015,2018, respectively.
COMMERCE UNION BANCSHARES,
Required future principal payments on FHLB advances are as follows:
|
| | | |
| 2020 | $ | 7,000 |
|
| 2021 | 323 |
|
| 2022 | 557 |
|
| 2023 | 2,342 |
|
| 2024 | 515 |
|
| Total | $ | 10,737 |
|
NOTE 11 - SUBORDINATED DEBENTURES
In 2002, $3,000 of floating rate mandatory redeemable subordinated debentures were issued through a special purpose entity as part of a private offering of trust preferred securities. The securities mature on December 31, 2032; however, the Company can currently repay the securities at any time without penalty, subject to approval from the Federal Reserve Bank ("FRB"). The subordinated debentures bear interest at a floating rate equal to the New York Prime rate plus fifty basis points. The interest rate on the subordinated debentures as of December 31, 2019 was 5.50%. The Company has the right from time to time, without causing an event of default, to defer payments of interest on the debentures for up to twenty consecutive quarterly periods. These debentures are presented in liabilities on the balance sheet but count as Tier 1 capital (with certain limitations applicable) for regulatory capital purposes.
In 2005, $5,000 of floating rate mandatory redeemable subordinated debentures were issued through a special purpose entity as part of a pool offering of trust preferred securities. These securities mature on September 15, 2035, however, the Company can currently repay the securities at any time without penalty, subject to approval from the FRB. The subordinated debentures bear interest at a floating rate equal to the three-month London Interbank Offered Rate, ("LIBOR") plus 1.50%. The interest rate on the subordinated debentures as of December 31, 2019 was 3.39%. The Company has the right from time to time, without causing an event of default, to defer payments of interest on the debentures for up to twenty consecutive quarterly periods. These debentures are presented in liabilities on the balance sheet but count as Tier 1 capital for regulatory purposes.
NOTES TO CONSOLIDATED FINANCIAL STATEMENTS (CONTINUED)
DECEMBER 31,
2016, 20152019, 2018 AND
20142017
(Dollar amounts in thousands except per share amounts)
NOTE
911 -
FEDERAL HOME LOAN BANK ADVANCESSUBORDINATED DEBENTURES (CONTINUED)
Required future principal
In 2007, $15,000 of redeemable subordinated debentures were issued through a special purpose entity as part of a pooled offering of trust preferred securities. These subordinated debentures mature in 2037; however, the Company can currently repay the securities at any time without penalty, subject to approval from the FRB. The interest rate on the subordinated debentures was 7.96% until December 15, 2012, and thereafter the subordinated debentures bear interest at a floating rate equal to the three-month LIBOR plus 3.0%. At December 31, 2019, the interest rate was 4.89%. The Company has the right from time to time, without causing an event of default, to defer payments of interest on Federal Home Loan Bank borrowingsthe junior debentures for up to twenty consecutive quarterly periods. These debentures are presented in liabilities on the balance sheet. On December 20, 2016, TRUPS acquired $10,000 in face amount of trust preferred capital securities issued by Community First Statutory Trust II. These capital securities were purchased from an unaffiliated investor and remain outstanding; however, the securities and the underlying subordinated debentures are eliminated in the Company's consolidated financial statements.
In 2019, the Company issued $60,000 of subordinated debentures, which mature in 2029. The Company may, at its option, redeem the subordinated notes (i) in whole or in part, on any interest payment date on or after December 15, 2024 and (ii) in whole but not in part, at any time upon the occurrence of a Tier 2 capital event, tax event or an investment company event. The interest rate on the subordinated debentures is 5.125% until December 15, 2024, and thereafter the subordinated debentures bear interest at a floating rate equal to the three-month SOFR plus 3.765%. See Note 27.
The portion of the subordinated debentures qualifying as
follows: | | | | |
2017 | | $ | 20,960 | |
2018 | | | 6,717 | |
2019 | | | 730 | |
2020 | | | 743 | |
2021 | | | 1,020 | |
Thereafter | | | 2,117 | |
| | | | |
Total | | $ | 32,287 | |
| | | | |
Tier 1 capital is limited to 25% of total Tier 1 capital. Subordinated
debentures in excess of the Tier 1 capital limitation generally qualify as Tier 2 capital. Under the Dodd-Frank Act and the federal regulations issued implementing Basel III, these subordinated debentures will, subject to the limitations described in the preceding sentence, continue to qualify as Tier 1 capital. As of December 31, 2019, the Company was current in the payment of all interest payments due on its subordinated debentures.
NOTE
1012 - BENEFIT PLANS
401(k) Plan
The Company has a 401(k) benefit plan that allows employee contributions up to 100% of their compensation, subject to regulatory limitations. The Company matches 100% of the first 3%6% contributed by the employee. The Company recognized an expense for the years ended December 31, 2019, 2018 and 2017 of $1,033, $805, and $450, respectively.
Employee Stock Purchase Plan
In 2018, the Company adopted an employee
and 50%stock purchase plan (“ESPP”) under which employees, through payroll deductions, are able to purchase shares of Company common stock. The purchase price is 85% of the
next 2%lesser of the
compensation contributed. Expense was $467closing price of the common stock on the first trading date of the relevant offering period or the last trading day of the relevant offering period. The maximum number of shares issuable during any offering period is 200,000 shares and a participant may not purchase more than 2,500 shares during any offering period (and, in any event, no more than $25 worth of common stock in any calendar year). For the year ended December 31, 2019, 8,512 shares were issued related to the ESPP. In 2018, there were no shares of common stock issued under the ESPP. As of December 31, 2019, there were 191,488 shares available for
2016, $416 for 2015 and $173 for 2014.issuance under the ESPP.
On December 22, 2017, comprehensive tax reform legislation known as the Tax Cuts and Jobs Act (the “Tax Reform Act”) was signed into law. The Tax Reform Act amends the Internal Revenue Code to reduce U.S. tax rates and modify policies, credits and deductions for individuals and businesses.
RELIANT BANCORP, INC.
NOTES TO CONSOLIDATED FINANCIAL STATEMENTS (CONTINUED)
DECEMBER 31, 2019, 2018 AND 2017
(Dollar amounts in thousands except per share amounts)
NOTE 13 - INCOME TAXES (CONTINUED)
The Tax Reform Act permanently reduces the U.S. federal corporate income tax rate from 35% to 21%, effective for tax years beginning after 2017. GAAP requires an adjustment to deferred taxes as a result of a change in the corporate tax rate in the period that the change is enacted, with the change recorded to the current year tax provision. Accordingly, the Company has remeasured its deferred tax assets and liabilities at the new tax rate and recorded a one-time noncash tax expense of $620 to deferred income taxes for the year ended December 31, 2017. This expense resulted in the Company’s higher effective tax rate for that year.
The income tax expense consists of the following for the years ended December 31:
| | | | | | | | | | | | |
| | | 2016 | | | 2015 | | | 2014 | |
Income tax expense | | | | | | | | | | | | |
Current | | $ | 1,978 | | | $ | 2,474 | | | $ | 986 | |
Deferred | | | 235 | | | | (203 | ) | | | 830 | |
| | | | | | | | | | | | |
Total provision for income tax expense | | $ | 2,213 | | | $ | 2,271 | | | $ | 1,816 | |
| | | | | | | | | | | | |
COMMERCE UNION BANCSHARES, INC.
NOTES TO CONSOLIDATED FINANCIAL STATEMENTS (CONTINUED)
DECEMBER 31, 2016, 2015 AND 2014
(Dollar amounts in thousands except per share amounts)
NOTE 11 - INCOME TAXES (CONTINUED)
|
| | | | | | | | | | | | |
| | | 2019 | | 2018 | | 2017 |
| Income tax expense | | | | | | |
| Current | | $ | 1,731 |
| | $ | 992 |
| | $ | 1,438 |
|
| Deferred | | 398 |
| | 380 |
| | 504 |
|
| Total provision for income tax expense | | $ | 2,129 |
| | $ | 1,372 |
| | $ | 1,942 |
|
A reconciliation of the income tax expense for the years ended December 31,
2016, 20152019, 2018 and
20142017 from the “expected” tax expense computed by applying the statutory federal income tax rate of
21 percent for 2019 and 2018 and 34 percent
for 2017 to income before income taxes is as follows:
| | | | | | | | | | | | | | | | | | | | | | | | |
| | | 2016 | | | 2015 | | | 2014 | |
Computed “expected” tax expense | | $ | 3,437 | | | | 34 | % | | $ | 2,806 | | | | 34 | % | | $ | 1,540 | | | | 34 | % |
| | | | | | |
Increase (decrease) in tax expense resulting from: | | | | | | | | | | | | | | | | | | | | | | | | |
State tax expense, net of federal tax effect | | | 404 | | | | 4 | % | | | 348 | | | | 4 | % | | | 234 | | | | 5 | % |
Tax exempt interest | | | (923 | ) | | | -9 | % | | | (569 | ) | | | -7 | % | | | (260 | ) | | | -6 | % |
Disallowed interest expense | | | 56 | | | | 1 | % | | | 53 | | | | 1 | % | | | 13 | | | | 0 | % |
Incentive stock options | | | 22 | | | | 0 | % | | | 23 | | | | 0 | % | | | 11 | | | | 0 | % |
Cash surrender value of life insurance contracts | | | (255 | ) | | | -3 | % | | | (184 | ) | | | -2 | % | | | (123 | ) | | | -3 | % |
Meals and entertainment | | | 18 | | | | 0 | % | | | 22 | | | | 0 | % | | | 15 | | | | 0 | % |
Officers life insurance expense | | | 7 | | | | 0 | % | | | 2 | | | | 0 | % | | | — | | | | 0 | % |
Excess tax benefit from stock compensation | | | (478 | ) | | | -5 | % | | | — | | | | 0 | % | | | — | | | | 0 | % |
Expiration of capital loss carryover | | | — | | | | 0 | % | | | — | | | | 0 | % | | | 43 | | | | 1 | % |
Nondeductible merger expenses | | | — | | | | 0 | % | | | 143 | | | | 2 | % | | | — | | | | 0 | % |
Federal and state tax credits | | | (499 | ) | | | -5 | % | | | (123 | ) | | | -1 | % | | | — | | | | 0 | % |
Benefit of subsidiary net loss | | | — | | | | 0 | % | | | (159 | ) | | | -2 | % | | | — | | | | 0 | % |
Subsidiary disregarded for federal taxes | | | 378 | | | | 4 | % | | | (88 | ) | | | -1 | % | | | 403 | | | | 9 | % |
Other | | | 46 | | | | 0 | % | | | (3 | ) | | | 0 | % | | | (60 | ) | | | -1 | % |
| | | | | | | | | | | | | | | | | | | | | | | | |
Total income tax expense | | $ | 2,213 | | | | 21 | % | | $ | 2,271 | | | | 28 | % | | $ | 1,816 | | | | 39 | % |
| | | | | | | | | | | | | | | | | | | | | | | | |
|
| | | | | | | | | | | | | | | | | | | | | |
| | | 2019 | | 2018 | | 2017 |
| Computed “expected” tax expense | | $ | 2,660 |
| | 21 | % | | $ | 2,495 |
| | 21 | % | | $ | 2,756 |
| | 34 | % |
| | | | | | | | | | | | | |
| Increase (decrease) in tax expense resulting from: | | | | | | | | | | | | |
| Federal income tax rate change | | — |
| | — | % | | — |
| | — | % | | 620 |
| | 8 | % |
| State tax expense, net of federal tax effect | | 637 |
| | 5 | % | | 551 |
| | 5 | % | | 331 |
| | 4 | % |
| Tax exempt interest | | (1,374 | ) | | (11 | )% | | (1,422 | ) | | (12 | )% | | (1,452 | ) | | (18 | )% |
| Disallowed interest expense | | 1 |
| | — | % | | 290 |
| | 2 | % | | 193 |
| | 2 | % |
| Stock compensation | | 23 |
| | — | % | | 19 |
| | — | % | | 33 |
| | — | % |
| Cash surrender value of life insurance contracts | | (235 | ) | | (2 | )% | | (249 | ) | | (2 | )% | | (285 | ) | | (4 | )% |
| Excess tax benefit from stock compensation | | (37 | ) | | — | % | | (88 | ) | | (1 | )% | | (184 | ) | | (2 | )% |
| Nondeductible merger expenses | | 155 |
| | 1 | % | | 47 |
| | — | % | | 173 |
| | 2 | % |
| Federal and state tax credits | | (999 | ) | | (8 | )% | | (1,102 | ) | | (9 | )% | | (667 | ) | | (8 | )% |
| Subsidiary disregarded for federal taxes | | 1,189 |
| | 9 | % | | 763 |
| | 6 | % | | 347 |
| | 4 | % |
| Others as a group | | 109 |
| | 1 | % | | 68 |
| | 1 | % | | 77 |
| | 1 | % |
| Total income tax expense | | $ | 2,129 |
| | 16 | % | | $ | 1,372 |
| | 11 | % | | $ | 1,942 |
| | 23 | % |
The Company files a separate Federal tax return for the operations of the mortgage banking and banking operations. The taxable income or losses of the mortgage banking operations are included in the respective returns of the Company and non-controlling members for Federal purposes. During 2015, the Company began consolidating the results of the mortgage banking operations in its
The Company’s income tax filings
with the State of Tennessee. A cumulative income tax benefit of $159 relating to 2014 and prior tax losses of the mortgage banking operations has been included in the consolidated income tax expense of the Company for the year ended December 31, 2015. The benefit of these losses is attributable to the non-controlling interest of the subsidiary.Duringfrom the years endedending December 31, 2016 2015 and 2014, deferredto present remain open to examination by tax assets increased by $1,289, $132 and $863 related to unrealized gains and losses on available for sale securities, and income tax expense (benefit)jurisdictions.
NOTES TO CONSOLIDATED FINANCIAL STATEMENTS (CONTINUED)
DECEMBER 31,
2016, 20152019, 2018 AND
20142017
(Dollar amounts in thousands except per share amounts)
NOTE
1113 - INCOME TAXES (CONTINUED)
Significant components of deferred tax assets as of December 31,
20162019 and
20152018 are as follows:
| | | | | | | | |
| | | 2016 | | | 2015 | |
Organizational and start-up costs | | $ | 188 | | | $ | 231 | |
Core deposit intangible | | | (403 | ) | | | (513 | ) |
Goodwill | | | (109 | ) | | | (94 | ) |
Acquisition fair value adjustments | | | 344 | | | | 1,206 | |
Allowance for loan losses | | | 2,083 | | | | 1,286 | |
Loan fees | | | 240 | | | | 355 | |
Other real estate | | | 19 | | | | 70 | |
Premises and equipment | | | (691 | ) | | | (645 | ) |
Unrealized loss on available-for-sale securities | | | 1,312 | | | | 23 | |
Non-accrual loans | | | 264 | | | | 228 | |
Other | | | 190 | | | | 236 | |
| | | | | | | | |
Total | | $ | 3,437 | | | $ | 2,383 | |
| | | | | | | | |
| | |
State | | $ | 418 | | | $ | 326 | |
Federal | | | 3,019 | | | | 2,057 | |
| | | | | | | | |
Net deferred tax asset | | $ | 3,437 | | | $ | 2,383 | |
| | | | | | | | |
|
| | | | | | | | |
| | | 2019 | | 2018 |
| Organizational and start-up costs | | $ | 38 |
| | $ | 68 |
|
| Core deposit intangible | | (1,817 | ) | | (2,046 | ) |
| Acquisition fair value adjustments | | 414 |
| | 817 |
|
| Allowance for loan losses | | 2,933 |
| | 2,577 |
|
| Loan fees (costs) | | (19 | ) | | (1 | ) |
| Other real estate | | 26 |
| | 577 |
|
| Premises and equipment | | (627 | ) | | (791 | ) |
| Unrealized (gain) loss on available for sale securities | | (2,501 | ) | | 1,115 |
|
| Unrealized loss on derivatives | | 708 |
| | 187 |
|
| Non-accrual loans | | 271 |
| | 280 |
|
| Acquired net operating losses | | 2,711 |
| | 2,966 |
|
| Acquired tax credits net of basis adjustments | | 1,005 |
| | 1,005 |
|
| Deferred compensation | | 310 |
| | 443 |
|
| Other | | 481 |
| | 231 |
|
| Total | | $ | 3,933 |
| | $ | 7,428 |
|
| | | | | |
| State | | $ | (187 | ) | | $ | 688 |
|
| Federal | | 4,120 |
| | 6,740 |
|
| Net deferred tax asset | | $ | 3,933 |
| | $ | 7,428 |
|
In assessing the future realization of deferred tax assets, management considers whether it is more likely than not that some portion or all of the deferred tax assets will not be realized. The ultimate realization of deferred tax assets is dependent upon the generation of future taxable income during the periods in which those temporary differences become deductible. Management determined that as of December 31,
2016,2019, it was more likely than not that all deferred tax assets would be realized.
COMMERCE UNION BANCSHARES,
At December 31, 2018, related to the merger with Community First, Inc., the Company has a federal net operating loss carryforward of $12,911, which begins expiring in 2031 and the Company is limited to utilizing $1,215 annually.
The Securities and Exchange Commission issued Staff Accounting Bulletin No. 118 on December 22, 2017, which provides for a one-year measurement period that allows businesses time to evaluate the financial statement implications of the Tax Reform Act. Companies are required to disclose in financial filings whether their accounting for the income tax effects of the Tax Reform Act is complete, incomplete but reasonably estimated, or incomplete with no estimate provided. The measurement period allows businesses to gather the information necessary to prepare and analyze the income tax accounting effects of the Tax Reform Act on financial statements issued during the measurement period. During the measurement period, an entity may need to reflect adjustments to provisional amounts previously recorded after obtaining, preparing, or analyzing additional information about facts and circumstances that existed as of the enactment date that, if known, would have affected the income tax effects initially reported as provisional amounts. Such adjustments to provisional amounts included in an entity’s financial statements during the measurement period would be included in income from continuing operations as an adjustment to income tax expense or benefit in the reporting period the amounts are determined.
NOTES TO CONSOLIDATED FINANCIAL STATEMENTS (CONTINUED)
DECEMBER 31,
2016, 20152019, 2018 AND
20142017
(Dollar amounts in thousands except per share amounts)
NOTE
1214 - STOCK-BASED COMPENSATION
The Company has two primary stock-based compensation plans as described below. Total compensation cost that has been charged against income for those plans was $1,222, $923 and $616 for 2019, 2018 and 2017, respectively. The excess income tax benefit was $37, $88 and $184 for 2019, 2018 and 2017, respectively.
Stock Option Plan
In 2006, the Board of Directors and shareholders of the Bank approved the Commerce Union Bank Stock Option Plan (the “Plan”). The Plan provides for the granting of stock options and authorizes the issuance of common stock upon the exercise of such options, for up to 625,000 shares of common stock to employees and organizers of the Company. As part of reorganization, all Commerce Union Bank options were replaced with Commerce Union Bancshares, Inc. options with no change in terms. On March 10, 2015, the shareholders of the Company approved the Commerce Union Bancshares, Inc. Amended and Restated Stock Option Plan that permits the grant of awards of up to 1,250,000 shares of the Company common stock in the form of stock options. As part of the merger with Reliant Bank, all outstanding stock options of Reliant Bank were converted to stock options of Commerce Union Bancshares, Inc. under this plan.
Under the Stock Option Plan, stock option awards may be granted in the form of incentive stock options or non-statutory stock options, and are generally exercisable for up to ten years following the date such option awards are granted. Exercise prices of incentive stock options must be equal to or greater than the fair market value of the common stock on the grant date.
A summary of the activity in the stock option plan for the periods ended December 31, 2019, 2018 and 2017, is as follows:
|
| | | | | | | | | | | | |
| | Shares | | Weighted Average Exercise Price | | Weighted Average Remaining Contractual Term | | Aggregate Intrinsic Value |
| Outstanding at January 1, 2017 | 241,541 | | $ | 12.96 |
| | 5.41 years | | $ | 2,065 |
|
| Granted | 15,500 |
| | 23.55 | |
| |
|
| Exercised | (72,080 | ) | | 11.42 | |
| |
|
| Forfeited or expired | (14,200 | ) | | 14.06 | |
| |
|
| Outstanding at December 31, 2017 | 170,761 |
| | 14.48 | | 5.73 years | | 1,905 |
| Exercisable at December 31, 2017 | 95,861 | | 13.00 |
| | 3.75 years | | 1,212 |
| Vested and anticipated vesting shares as of December 31, 2017 | 168,514 | | 14.45 | | 5.73 years | | 1,848 |
| Granted | 25,500 |
| | 28.00 |
| |
| |
|
| Exercised | (30,001 | ) | | 13.27 | |
| |
|
| Forfeited or expired | (7,000 | ) | | 18.20 |
| |
| |
|
| Outstanding at December 31, 2018 | 159,260 |
| | 16.72 | | 6.04 years | | 1,146 |
|
| Exercisable at December 31, 2018 | 88,060 | | 13.45 |
| | 4.32 years | | 847 |
| Vested and anticipated vesting shares as of December 31, 2018 | 157,124 | | 16.67 | | 6.01 years | | 1,002 |
| Granted | 27,500 |
| | 23.28 |
| |
| |
|
| Exercised | (34,714 | ) | | 12.79 |
| |
| |
|
| Forfeited or expired | (2,753 | ) | | 19.35 |
| |
| |
|
| Outstanding at December 31, 2019 | 149,293 | | 18.81 |
| | 6.68 years | | 700 |
|
| Exercisable at December 31, 2019 | 74,693 | | 15.31 |
| | 5.18 years | | 553 |
|
| Vested and anticipated vesting shares as of December 31, 2019 | 147,055 |
| | $ | 18.76 |
| | 6.64 years | | $ | 570 |
|
RELIANT BANCORP, INC.
NOTES TO CONSOLIDATED FINANCIAL STATEMENTS (CONTINUED)
DECEMBER 31, 2019, 2018 AND 2017
(Dollar amounts in thousands except per share amounts)
NOTE 14 - STOCK-BASED COMPENSATION (CONTINUED)
A summary of changes in the Company's non-vested options for the years ended December 31, 2019, 2018 and 2017 are as follows:
|
| | | | | | | |
| | | Shares | | Weighted Average Grant-Date Fair Value |
| Non-vested options at January 1, 2017 | | 96,600 |
| | $ | 3.36 |
|
| Granted | | 15,500 |
| | 6.66 |
|
| Vested | | (23,000 | ) | | 6.95 |
|
| Forfeited | | (14,200 | ) | | 3.18 |
|
| Non-vested options at December 31, 2017 | | 74,900 |
| | 4.14 |
|
| Granted | | 25,500 |
| | 7.10 |
|
| Vested | | (22,200 | ) | | 6.69 |
|
| Forfeited | | (7,000 | ) | | 4.77 |
|
| Non-vested options at December 31, 2018 | | 71,200 |
| | 5.28 |
|
| Granted | | 27,500 |
| | 6.97 |
|
| Vested | | (21,347 | ) | | 5.97 |
|
| Forfeited | | (2,753 | ) | | 4.89 |
|
| Non-vested options at December 31, 2019 | | 74,600 |
| | $ | 6.08 |
|
Information related to the stock option plan during each year follows and assumes a 3% forfeiture rate:
|
| | | | | | | | | | | | |
| | | 2019 | | 2018 | | 2017 |
| Intrinsic value of options exercised | | $ | 320 |
| | $ | 344 |
| | $ | 827 |
|
| Cash received from option exercises | | 439 |
| | 398 |
| | 823 |
|
| Tax benefit realized from option exercises | | 13 |
| | 88 |
| | 184 |
|
| Weighted average fair value of options granted | | 6.97 |
| | 7.10 |
| | 6.66 |
|
As of December 31, 2019, there was $377 of total unrecognized compensation cost related to nonvested stock options granted under the Plan. The cost is expected to be recognized over a weighted-average period of 1.79 years.
The fair value of options granted during 2019 and 2018 was determined using the following assumptions as of the grant date, resulting in an estimated fair value per option of $6.97 and $6.89, respectively.
|
| | | | | | | | | | | | | | | | | |
| | 2019 | | 2018 | | 2017 |
| Risk-free interest rate | 2.08% | | — | | 2.39% | |
| | 2.95% | |
| | 2.30% | | — | | 2.45% |
| Expected term (in years) | 6.5 years | | 6.5 years | | 6.5 years |
| Expected stock price volatility | 31.10% | | — | | 32.80% | |
| | 23.50% | |
| | 24% | | — | | 29.90% |
| Dividend yield | 1.55% | | — | | 1.59% | |
| | 1.14% | |
| | 0.98% | | — | | 1.02% |
RELIANT BANCORP, INC.
NOTES TO CONSOLIDATED FINANCIAL STATEMENTS (CONTINUED)
DECEMBER 31, 2019, 2018 AND 2017
(Dollar amounts in thousands except per share amounts)
NOTE 14 - STOCK-BASED COMPENSATION (CONTINUED)
Equity Incentive Plan
On June 18, 2015, the shareholders of Commerce Union approved the Commerce Union Bancshares, Inc. 2015 Equity Incentive Plan, which provides for the issuance of up to 900,000 shares of common stock in the form of stock options, restricted stock grants or grants for performance-based compensation.
A summary of the activity in the stock option plan for 2016 is as follows.
| | | | | | | | | | | | | | | | |
| | | Shares | | | Weighted
Average
Exercise
Price | | | Weighted
Average
Remaining
Contractual
Term | | | Aggregate
Intrinsic
Value | |
Outstanding at January 1, 2016 | | | 708,921 | | | $ | 10.73 | | | | | | | | | |
Granted | | | 41,500 | | | | 15.57 | | | | | | | | | |
Exercised | | | (476,889 | ) | | | 10.03 | | | | | | | | | |
Forfeited or expired | | | (31,991 | ) | | | 10.61 | | | | | | | | | |
| | | | | | | | | | | | | | | | |
Outstanding at December 31, 2016 | | | 241,541 | | | | 12.96 | | | | 5.41 | | | $ | 2,065 | |
| | | | | | | | | | | | | | | | |
Exercisable at December 31, 2016 | | | 144,941 | | | | 12.11 | | | | 3.25 | | | $ | 1,363 | |
| | | | | | | | | | | | | | | | |
Vested and expected to vest at December 31, 2016 | | | 238,643 | | | | 12.89 | | | | 5.41 | | | $ | 2,003 | |
| | | | | | | | | | | | | | | | |
| | | | | | | | |
| | | Shares | | | Weighted Average
Grant-Date Fair Value | |
Non-vested options at January 1, 2016 | | | 84,160 | | | $ | 2.90 | |
Granted | | | 41,500 | | | | 3.89 | |
Vested | | | (24,260 | ) | | | 2.76 | |
Forfeited | | | (4,800 | ) | | | 2.92 | |
| | | | | | | | |
Non-vested options at December 31, 2016 | | | 96,600 | | | | 3.36 | |
| | | | | | | | |
COMMERCE UNION BANCSHARES, INC.
NOTES TO CONSOLIDATED FINANCIAL STATEMENTS (CONTINUED)
DECEMBER 31, 2016, 2015 AND 2014
(Dollar amounts in thousands except per share amounts)
NOTE 12 - STOCK-BASED COMPENSATION (CONTINUED)
Information related to the stock option plan during each year follows and assumes a 3% forfeiture rate:
| | | | | | | | |
| | | 2016 | | | 2015 | |
Intrinsic value of options exercised | | $ | 2,272 | | | $ | 766 | |
Cash received form option exercises | | | 4,772 | | | | 1,820 | |
Tax benefit realized from option exercises | | | 478 | | | | — | |
The fair value of options granted during 2016 and 2015 was determined using the following assumptions as of the grant date, resulting in an estimated fair value per option of $3.82.
| | | | | | |
| | | 2016 | | 2015 | |
Risk-free interest rate | | 1.33% - 2.45% | | | 1.65 | % |
Expected term | | 6.5 - 10 years | | | 10 years | |
Expected stock price volatility | | 21% - 24% | | | 21.00 | % |
Dividend yield | | 1.02% - 1.57% | | | 1.50 | % |
The following table shows the activity related to
non-vested restricted stock
and units for
2016the years ended December 2019, 2018 and
2015: | | | | | | | | |
| | | 2016 | | | 2015 | |
Non-vested options at January 1, | | | 30,500 | | | | — | |
Granted | | | 23,800 | | | | 30,500 | |
Vested | | | (3,835 | ) | | | — | |
Forfeited | | | (2,000 | ) | | | — | |
| | | | | | | | |
Non-vested options at December 31, | | | 48,465 | | | | 30,500 | |
| | | | | | | | |
The shares issued had a market value of $15.24 per share in 2016 and $13.65 per share in 2015. 2017:
|
| | | | | | | | | | | | | |
| | Restricted Stock Units | | Restricted Stock |
| | Units | | Weighted Average Grant-Date
Fair Value | | Shares | | Weighted Average Grant-Date
Fair Value |
| Outstanding at January 1, 2017 | — |
| | $ | — |
| | 48,465 |
| | $ | 14.36 |
|
| Granted | — |
| | — |
| | 50,050 |
| | 23.65 |
| Vested | — |
| | — |
| | (13,016 | ) | | 14.21 |
| Forfeited | — |
| | — |
| | (3,000 | ) | | 14.18 |
| Outstanding at December 31, 2017 | — |
| | — |
| | 82,499 |
| | 20.03 |
| Granted | — |
| | — |
| | 51,710 |
| | 27.55 |
| Vested | — |
| | — |
| | (21,999 | ) | | 15.95 |
| Forfeited | — |
| | — |
| | (1,550 | ) | | 25.17 |
| Outstanding at December 31, 2018 | — |
| | — |
| | 110,660 |
| | 24.28 |
| Granted | 47,750 |
| | 23.30 |
| | 9,500 |
| | 22.01 |
| Vested | — |
| | — |
| | (21,450 | ) | | 19.31 |
| Forfeited | — |
| | — |
| | (7,750 | ) | | 23.25 |
| Outstanding at December 31, 2019 | 47,750 |
| | $ | 23.30 |
| | 90,960 |
| | $ | 25.31 |
|
The shares vest over periods ranging from one
month to three years. As of December 31,
2016,2019, there was
$496$1,756 of unrecognized compensation cost related to non-vested restricted share awards. The cost is expected to be
recoveredcharged over a weighted-average period of
2.15 years.1 year for the restricted stock share awards and 1.3 years for the restricted stock units. In
2016,2019, 2018 and 2017, the fair value of share awards vested totaled
$60.$605, $439 and $368.
RELIANT BANCORP, INC.
NOTES TO CONSOLIDATED FINANCIAL STATEMENTS (CONTINUED)
DECEMBER 31, 2019, 2018 AND 2017
(Dollar amounts in thousands except per share amounts)
NOTE
1315 -
REGULATORY CAPITAL
REQUIREMENTSThe Company and the Bank are subject to regulatory capital requirements administered by the federal and state banking agencies. Capital adequacy guidelines and, additionally for banks, prompt corrective action regulations, involve quantitative measures of assets, liabilities, and certain off-balance-sheet items calculated under regulatory accounting practices. Capital amounts and classifications are also subject to qualitative judgments by regulators. Failure to meet capital requirements can initiate regulatory action. Management believes that as of December 31,
20162019 and
20152018 the Company and the Bank met all capital adequacy requirements to which they are subject.
COMMERCE UNION BANCSHARES, INC.
NOTES TO CONSOLIDATED FINANCIAL STATEMENTS (CONTINUED)
DECEMBER 31, 2016, 2015 AND 2014
(Dollar amounts in thousands except per share amounts)
NOTE 13 - REGULATORY CAPITAL REQUIREMENTS (CONTINUED)
Prompt corrective action regulations provide five classifications: well capitalized, adequately capitalized, undercapitalized, significantly undercapitalized, and critically undercapitalized, although these terms are not used to represent overall financial condition. If adequately capitalized, regulatory approval is required to accept brokered deposits. If undercapitalized, capital distributions are limited, as is asset growth and expansion, and capital restoration plans are required. At December 31,
20162019 and
2015,2018, the most recent regulatory notifications categorized the Bank as well capitalized under the regulatory framework for prompt corrective action. There are no conditions or events since that notification that management believes have changed the category.
Actual and required capital amounts and ratios are presented below as of December 31,
20162019 and
2015. | | | | | | | | | | | | | | | | | | | | | | | | |
| | | Actual
Regulatory
Capital | | | Minimum Required
Capital Including
Capital Conservation
Buffer | | | To Be Well
Capitalized Under
Prompt Corrective
Action Provisions | |
| | | Amount | | | Ratio | | | Amount | | | Ratio | | | Amount | | | Ratio | |
December 31, 2016 | | | | | | | | | | | | | | | | | | | | | | | | |
Company | | | | | | | | | | | | | | | | | | | | | | | | |
Tier I leverage | | $ | 96,682 | | | | 10.86 | % | | $ | 35,610 | | | | 4.000 | % | | | N/A | | | | N/A | |
Common equity tier 1 | | | 96,682 | | | | 13.00 | % | | | 38,115 | | | | 5.125 | % | | | N/A | | | | N/A | |
Tier I risk-based capital | | | 96,682 | | | | 13.00 | % | | | 49,271 | | | | 6.625 | % | | | N/A | | | | N/A | |
Total risk-based capital | | | 105,764 | | | | 14.22 | % | | | 64,150 | | | | 8.625 | % | | | N/A | | | | N/A | |
| | | | | | |
Bank | | | | | | | | | | | | | | | | | | | | | | | | |
Tier I leverage | | $ | 95,637 | | | | 10.75 | % | | $ | 35,586 | | | | 4.000 | % | | $ | 44,482 | | | | 5.00 | % |
Common equity tier 1 | | | 95,637 | | | | 12.88 | % | | | 38,054 | | | | 5.125 | % | | | 48,264 | | | | 6.50 | % |
Tier I risk-based capital | | | 95,637 | | | | 12.88 | % | | | 49,192 | | | | 6.625 | % | | | 59,402 | | | | 8.00 | % |
Total risk-based capital | | | 104,719 | | | | 14.10 | % | | | 64,057 | | | | 8.625 | % | | | 74,269 | | | | 10.00 | % |
| | | | | | |
December 31, 2015 | | | | | | | | | | | | | | | | | | | | | | | | |
Company | | | | | | | | | | | | | | | | | | | | | | | | |
Tier I leverage | | $ | 84,608 | | | | 9.92 | % | | $ | 34,116 | | | | 4.000 | % | | | N/A | | | | N/A | |
Common equity tier 1 | | | 84,608 | | | | 12.02 | % | | | 31,675 | | | | 4.500 | % | | | N/A | | | | N/A | |
Tier I risk-based capital | | | 84,608 | | | | 12.02 | % | | | 42,234 | | | | 6.000 | % | | | N/A | | | | N/A | |
Total risk-based capital | | | 92,431 | | | | 13.13 | % | | | 56,317 | | | | 8.000 | % | | | N/A | | | | N/A | |
| | | | | | |
Bank | | | | | | | | | | | | | | | | | | | | | | | | |
Tier I leverage | | $ | 84,196 | | | | 9.88 | % | | $ | 34,087 | | | | 4.000 | % | | $ | 42,609 | | | | 5.00 | % |
Common equity tier 1 | | | 84,196 | | | | 11.97 | % | | | 31,653 | | | | 4.500 | % | | | 45,720 | | | | 6.50 | % |
Tier I risk-based capital | | | 84,196 | | | | 11.97 | % | | | 42,204 | | | | 6.000 | % | | | 56,271 | | | | 8.00 | % |
Total risk-based capital | | | 92,019 | | | | 13.08 | % | | | 56,281 | | | | 8.000 | % | | | 70,351 | | | | 10.00 | % |
COMMERCE UNION BANCSHARES,2018.
|
| | | | | | | | | | | | | | | | | | | | | | | | | | | | |
| | | Actual Regulatory Capital | | Minimal Capital Adequacy | | Minimum Required Capital Including Capital Conservation Buffer | | To Be Well Capitalized Under Prompt Corrective Action Provisions |
| | | Amount | | Ratio | | Amount | | Ratio | | Amount | | Ratio | | Amount | | Ratio |
| December 31, 2019 | | | | | | | | | | | | | | | | |
| Company | | | | | | | | | | | | | | | | |
| Tier I leverage | | $ | 176,748 |
| | 9.74 | % | | N/A | | — | % | | $ | 72,586 |
| | 4.000 | % | | $ | 90,733 |
| | 5.00 | % |
| Common equity Tier 1 | | 165,063 |
| | 10.55 | % | | N/A | | — | % | | 109,520 |
| | 7.000 | % | | 101,698 |
| | 6.50 | % |
| Tier I risk-based capital | | 176,748 |
| | 11.30 | % | | N/A | | — | % | | 132,952 |
| | 8.500 | % | | 125,131 |
| | 8.00 | % |
| Total risk-based capital | | 249,751 |
| | 15.97 | % | | N/A | | — | % | | 164,207 |
| | 10.500 | % | | 156,388 |
| | 10.00 | % |
| Bank | | | | | | | | | | | | | | | | |
| Tier I leverage | | $ | 186,734 |
| | 10.30 | % | | N/A | | — | % | | $ | 72,518 |
| | 4.000 | % | | $ | 90,648 |
| | 5.00 | % |
| Common equity Tier 1 | | 186,734 |
| | 11.95 | % | | N/A | | — | % | | 109,384 |
| | 7.000 | % | | 101,571 |
| | 6.50 | % |
| Tier I risk-based capital | | 186,734 |
| | 11.95 | % | | N/A | | — | % | | 132,823 |
| | 8.500 | % | | 125,010 |
| | 8.00 | % |
| Total risk-based capital | | 199,737 |
| | 12.79 | % | | N/A | | — | % | | 163,975 |
| | 10.500 | % | | 156,167 |
| | 10.00 | % |
| | | | | | | | | | | | | | | | | |
| December 31, 2018 | | | | | | | | | | | | | | | | |
| Company | | | | | | | | | | | | | | | | |
| Tier I leverage | | $ | 168,876 |
| | 10.38 | % | | $ | 65,077 |
| | 4.00 | % | | $ | 65,077 |
| | 4.000 | % | | $ | 81,347 |
| | 5.00 | % |
| Common equity Tier 1 | | 157,273 |
| | 11.59 | % | | 61,064 |
| | 4.50 | % | | 86,507 |
| | 6.375 | % | | 88,203 |
| | 6.50 | % |
| Tier I risk-based capital | | 168,876 |
| | 12.44 | % | | 81,451 |
| | 6.00 | % | | 106,905 |
| | 7.875 | % | | 108,602 |
| | 8.00 | % |
| Total risk-based capital | | 180,193 |
| | 13.28 | % | | 108,550 |
| | 8.00 | % | | 133,991 |
| | 9.875 | % | | 135,688 |
| | 10.00 | % |
| Bank | | | | | | | | | | | | | | | | |
| Tier I leverage | | $ | 165,308 |
| | 10.17 | % | | $ | 65,018 |
| | 4.00 | % | | $ | 65,018 |
| | 4.000 | % | | $ | 81,272 |
| | 5.00 | % |
| Common equity Tier 1 | | 165,308 |
| | 12.19 | % | | 61,024 |
| | 4.50 | % | | 86,451 |
| | 6.375 | % | | 88,146 |
| | 6.50 | % |
| Tier I risk-based capital | | 165,308 |
| | 12.19 | % | | 81,366 |
| | 6.00 | % | | 106,792 |
| | 7.875 | % | | 108,488 |
| | 8.00 | % |
| Total risk-based capital | | 176,625 |
| | 13.02 | % | | 108,525 |
| | 8.00 | % | | 133,961 |
| | 9.875 | % | | 135,657 |
| | 10.00 | % |
NOTES TO CONSOLIDATED FINANCIAL STATEMENTS (CONTINUED)
DECEMBER 31,
2016, 20152019, 2018 AND
20142017
(Dollar amounts in thousands except per share amounts)
NOTE
1315 -
REGULATORY CAPITAL
REQUIREMENTS (CONTINUED)
In July 2013, the Bank’s regulators adopted revised regulatory capital requirements known as “Basel III”, which became effective January 1, 2015. Required capital ratios applicable to the Bank under these guidelines are presented in the preceding table. The new requirements also establishestablished a “capital"capital conservation buffer”buffer" of 2.5% that will bewas phased in over four years. If capital levels fall below the minimum requirement, plus the capital conservation buffer, the Bank will be subject to restrictions related dividend payments, share repurchases, and certain employee bonuses.
On December 4, 2018, the Company authorized a stock repurchase plan pursuant to which the Company may purchase up to $12 million of shares of the Company’s outstanding common stock, par value $1.00 per share. Stock repurchases under the plan will be made from time to time in the open market or privately negotiated transactions, or otherwise, at the discretion of management of the Company and in accordance with applicable legal requirements. The timing and amount of share repurchases under the plan will depend on a number of factors, including the Company’s stock price performance, ongoing capital planning considerations, general market conditions, and applicable legal requirements. As of December 31, 2019, the Company has repurchased $8,291 of Company shares. The stock repurchase plan does not obligate the Company to repurchase any dollar amount or number of shares, and the plan may be extended, modified, amended, suspended, or discontinued at any time.
NOTE
1416 - COMMITMENTS AND CONTINGENCIES
The Company has federal funds lines at other financial institutions with availability totaling
$39,500 and $39,300$88,200 at December 31,
20162019, and
2015, respectively.2018. At December 31,
2016,2019 and 2018, the Company
had andid not have outstanding
balance of $3,671 underbalances for these federal funds lines.
The Company had no outstanding balance under these lines as of December 31, 2015. The Company also has an unsecured line of credit at
IDCCDC Deposits
Network with availability of $20,000. The Company did not have
ana balance outstanding
balance underrelated to this line
of credit at December 31,
20162019 or
2015. The2018.The Company also may access borrowings utilizing the Federal Reserve bank discount window of
$3,923$5,780 and $11,166 at December 31,
2016.2019 and 2018, respectively. There
were no funds advanced from the discount window at December 31,
2016.2019 or 2018.
At December 31,
20162019 and
2015,2018, the Company has
$170,000$285,654 and
$25,000$310,454 in standby letters of credit with the Federal Home Loan Bank
with $162,190 and $19,000 pledged to secure municipal deposits.
The Company had $3,047 of pledged cash secured with the Federal Home Loan Bank at December 31, 2016.At December 31,
2016,2019, the Company has employment agreements with certain executive officers. Upon the occurrence of an “Event of Termination” as defined by the agreements, the Company has an obligation to pay each of the executive officers as defined in the agreements.
NOTE 15 - LEASES
The Company’s principal office is located at 1736 Carothers Parkway in Brentwood, Tennessee. The Company leases this office from a related third party but owns the leasehold improvements.
The Company leases additional offices for its operation center and branch at 101 Creekstone Boulevard in Franklin, Tennessee from a related third party but owns the leasehold improvements.
COMMERCE UNION BANCSHARES,
NOTES TO CONSOLIDATED FINANCIAL STATEMENTS (CONTINUED)
DECEMBER 31,
2016, 20152019, 2018 AND
20142017
(Dollar amounts in thousands except per share amounts)
NOTE
15 –17 - LEASES
(CONTINUED)
A summary of the Company’s leased facilities (other than month-to-month agreements) follows:
|
| | | | | | |
Property Description (In Tennesee unless noted)
| | Base Lease
Expiration Date
| | Base Lease Term
With Renewal
Periods | | Renewal | | Escalation Clause
|
| Property Description (In Tennessee unless noted) | | Expiration Date | | Terms | | Clause |
| 1736 Carothers Parkway, Brentwood | | February 28, 2025 | | 2515 years | | 3% annually None |
| 6005 Nolensville Road, Nashville | | September 30, 2018 July 31. 2021 | | 20 years— | | none 3% annually |
| 5109 Peter Taylor Park Drive, Brentwood | | July 31, 20162021 | | 17— | | None |
| 101 Creekstone Blvd., Franklin | | April 1, 2026 | | 10 years | | None |
| 101 Creekstone Blvd., Franklin | | January 31, 2022 | | — | | None |
| 101 Creekstone Blvd., Franklin | | April 1, 2026 | | 10 years | | 1% annually |
| 105 Continental Place, Brentwood | | December 31, 2020 | | — | | 3% annually |
| 633 Chestnut St., Chattanooga | | October 31, 2023 | | — | | 3% annually |
| 633 Chestnut St., Chattanooga | | October 31, 2028 | | 10 years | | Clause |
| 6100 Tower Circle, Franklin | | December 31, 2027 | | — | | None |
| 1835 E. Northfield Blvd., Murfreesboro | | September 30, 2027 | | 5 years | | 3% annually |
| 1412 Trotwood Ave., Columbia | | December 31, 2022 | | — | | None |
| 4108 Hillsboro Pike, Nashville | | November 30, 2021 | | 2715 years | | 10% after 5th year of initial term None |
101 Creekstone Boulevard, Franklin 711 E. Main Street, Hendersonville | | September 30, 2022 | | — | | None |
| 376 S. Perkins Extended Memphis | | March 31, 20262022 | | 20 years— | | 1% annually None |
711 East 308 Main Street, Suite 105, HendersonvilleCrossett, Arkansas | | October 1, 2022 | | — | | None |
| 1398 Desoto Boulevard, Hot Springs Village, Arkansas | | July 31, 2021 | | — | | None |
| 9101 N. Rodney Parham Road, Little Rock, Arkansas | | February 28, 2021 | | — | | None |
| 1401 Malvern Avenue, Hot Springs, Arkansas | | October 31, 20172020 | | 5 years— | | 2.5% annually None |
15 W. Aylesbury Road, Timonium Maryland 51111111 John F. Kennedy Boulevard, North Little Rock, Arkansas | | Month to MonthJuly 31, 2020 | | Monthly— | | none |
745 South Church Street, Murfreesboro | | April 15, 2015 | | 3 years | | $100 annually |
633 Chestnut Street, Chattanooga | | February 28, 2018 | | 1 year | | none None |
The Company has classified all leases as operating lease agreements for office space, copiers, and an automobile. Future minimum rental payments required under the terms of the non-cancellable leases are as follows:
| | | | |
Year Ending December 31, | | | |
2017 | | $ | 1,564 | |
2018 | | | 1,447 | |
2019 | | | 1,463 | |
2020 | | | 1,438 | |
2021 | | | 1,243 | |
Thereafter | | | 4,110 | |
| | | | |
Total | | $ | 11,265 | |
| | | | |
|
| | | | |
| Year Ending | | |
| December 31, | | |
| 2020 | | $ | 2,369 |
|
| 2021 | | 2,474 |
|
| 2022 | | 2,117 |
|
| 2023 | | 1,743 |
|
| 2024 | | 1,692 |
|
| Thereafter | | 4,512 |
|
| Total | | $ | 14,907 |
|
Total rent expense under the leases amounted to
$1,954, $2,094$2,723, $2,536 and
$1,876,$2,055, respectively, during the years ended December 31,
2016, 20152019, 2018 and
2014.NOTE 16 - RELATED PARTY TRANSACTIONS
The main office, operations center, and Franklin branch were previously leased from Corporations in which owners in the Corporations serve as members2017.
NOTES TO CONSOLIDATED FINANCIAL STATEMENTS (CONTINUED)
DECEMBER 31,
2016, 20152019, 2018 AND
20142017
(Dollar amounts in thousands except per share amounts)
NOTE
1718 - FINANCIAL INSTRUMENTS WITH OFF-BALANCE-SHEET RISK
Some financial instruments, such as loan commitments, credit lines, letters of credit, and overdraft protection lines, are issued to meet customer financing needs. These are agreements to provide credit or to support the credit of others, as long as conditions established in the contract are met, and usually have expiration dates. Commitments may expire without being used. Off-balance-sheet risk of credit loss exists up to the face amount of these instruments, although material losses are not anticipated. The same credit policies are used to make such commitments as are used for loans, including obtaining collateral at exercise of the commitment.
The contractual amounts of financial instruments with off-balance-sheet risk at December 31,
20162019 and
20152018 were as follows:
| | | | | | | | |
| | | 2016 | | | 2015 | |
Unused lines of credit | | | | | | | | |
Fixed | | $ | 44,371 | | | $ | 26,957 | |
Variable | | | 114,648 | | | | 93,923 | |
Standby letters of credit | | | 12,217 | | | | 8,776 | |
| | | | | | | | |
Total | | $ | 171,236 | | | $ | 129,656 | |
| | | | | | | | |
|
| | | | | | | | |
| | | 2019 | | 2018 |
| Unused lines of credit | | | | |
| Fixed | | $ | 27,309 |
| | $ | 44,053 |
|
| Variable | | 308,446 |
| | 209,898 |
|
| Standby letters of credit | | 17,132 |
| | 16,545 |
|
| Total | | $ | 352,887 |
| | $ | 270,496 |
|
NOTE
1819 - DERIVATIVES
During the year ended December 31, 2015, the
The Company entered intoutilizes interest rate swap agreements totaling $11,200as part of its asset liability management strategy to effectively convert fixed municipal security yields to floating rates. This hedge is intended to reducehelp manage its interest rate risk position. The notional amount of the interest rate risk associatedswaps does not represent amounts exchanged by the parties. The amount exchanged is determined by reference to the notional amount and other terms of the individual interest rate swap agreements.
Interest Rate Swaps Designated as Cash Flow Hedges
Interest rate swaps with
notional amounts totaling $110,000 and $60,000 as of December 31, 2019 and 2018, respectively, were designated as cash flow hedges of time deposits, Federal Home Loan Bank borrowings and subordinated debentures which are fully effective. As such, no amount of ineffectiveness has been included in net income. Therefore, the
underlying hedged item by mitigatingaggregate fair value of the
risk ofswaps is recorded in other assets (liabilities) with changes in fair value
based on fluctuations in interest rates.The total notional amount of swap agreements was $21,505 at December 31, 2016 and December 31, 2015. At December 31, 2016, the contracts had fair values totaling $195 recorded in other assets and $267 recordedcomprehensive income (loss). The amount included in accumulated other liabilities. At December 31, 2015,comprehensive income (loss) would be reclassified to current earnings should the contracts had fair values totaling $77 recorded in other assets and $572 recorded in other liabilities.
hedges no longer be considered effective. The derivative instruments held byCompany expects the Company are designated and qualify as fair value hedges. Accordingly,hedges to remain fully effective during the gain or loss onremaining terms of the derivatives as well as the offsetting gain or loss on the available-for-sale securities attributable to the hedged risk are recognized in current earnings. At December 31, 2016, the Company’s fair value hedges are effective and are not expected to have a significant impact on net income over the next twelve months.
COMMERCE UNION BANCSHARES,swap agreements.
NOTES TO CONSOLIDATED FINANCIAL STATEMENTS (CONTINUED)
DECEMBER 31,
2016, 20152019, 2018 AND
20142017
(Dollar amounts in thousands except per share amounts)
NOTE 19 - DERIVATIVES (CONTINUED)
Interest Rate Swaps Designated as Cash Flow Hedges, (Continued)
Summary information related to the interest rate swaps designated as cash flow hedges for the years ended December 31, 2019 and 2018 is as follows:
|
| | | | | | | |
| 2019 | | 2018 |
| Notional amounts | $ | 110,000 |
| | $ | 60,000 |
|
| Weighted average pay rates | 2.428 | % | | 3.340 | % |
| Weighted average receive rates | 2.114 | % | | 2.860 | % |
| Weighted average maturity | 3.84 years |
| | 4.47 years |
|
| Unrealized losses | $ | 2,078 |
| | $ | 1,153 |
|
Cash Flow Hedges
The following table presents the net gains (losses) recorded in accumulated other comprehensive income and the Consolidated Statements of Operations relating to the cash flow derivative instruments for the years ended:
|
| | | | | | | | | | | |
| | Amount of Gain (Loss) Recognized in OCI
(Effective Portion) |
| Amount of Gain (Loss) Reclassified from OCI to Interest Income |
| Amount of Gain (Loss) Recognized in Other Non-Interest Income (Ineffective Portion) |
| December 31, 2017 |
|
|
|
|
|
| Interest rate contracts | $ | — |
|
| $ | — |
|
| $ | — |
|
| December 31, 2018 |
|
|
|
|
|
| Interest rate contracts | (1,153 | ) |
| — |
|
| — |
|
| December 31, 2019 |
|
|
|
|
|
| Interest rate contracts | $ | (2,078 | ) |
| $ | — |
|
| $ | — |
|
The following table reflects the cash flow hedges included in the Consolidated Balance Sheets as of December 31, 2019 and 2018:
|
| | | | | | | | | | | | | | | |
| 2019 |
| 2018 |
| Notional Amount |
| Fair Value |
| Notional Amount |
| Fair Value |
| Included in other assets: |
|
|
|
|
|
|
|
| Total included in other assets | $ | — |
|
| $ | — |
|
| $ | — |
|
| $ | — |
|
|
|
|
|
|
|
|
|
| Included in other liabilities: |
|
|
|
|
|
|
|
| Interest rate swaps related to |
|
|
|
|
|
|
|
| subordinate debentures | $ | 10,000 |
|
| $ | 439 |
|
| $ | 10,000 |
|
| $ | 174 |
|
|
|
|
|
|
|
|
|
| Interest rate swaps related to |
|
|
|
|
|
|
|
| Time Deposits | 100,000 |
| | 1,639 |
| | — |
| | — |
|
| Federal Home Loan Bank borrowings | — |
|
| — |
|
| 50,000 |
|
| 979 |
|
| Total included in other liabilities | $ | 110,000 |
|
| $ | 2,078 |
|
| $ | 60,000 |
|
| $ | 1,153 |
|
RELIANT BANCORP, INC.
NOTES TO CONSOLIDATED FINANCIAL STATEMENTS (CONTINUED)
DECEMBER 31, 2019, 2018 AND 2017
(Dollar amounts in thousands except per share amounts)
NOTE 19 - DERIVATIVES (CONTINUED)
Fair Value Hedges
The following table reflects the fair value hedges included in the Consolidated Statements of Operations as of December 31:
|
| | | | | | | | | | | | | |
| Interest rate contracts | Location |
| 2019 |
| 2018 |
| 2017 |
| Change in fair value on interest |
|
|
|
|
|
|
|
| rate swaps hedging investments | Interest income |
| $ | (1,067 | ) |
| $ | 462 |
|
| $ | 47 |
|
The following table reflects the fair value hedges included in the Consolidated Balance Sheets as of December 31:
|
| | | | | | | | | | | | | | | |
| | 2019 | | 2018 |
| | Notional Amount | | Fair Value | | Notional Amount | | Fair Value |
| Included in other assets: | | | | | | | |
| Interest rate swaps related to investments | $ | — |
| | $ | — |
| | $ | 16,902 |
| | $ | 467 |
|
| | | | | | | | |
| Total included in other assets | $ | — |
| | $ | — |
| | $ | 16,902 |
| | $ | 467 |
|
| | | | | | | | |
| Included in other liabilities: | | | | | | | |
| Interest rate swaps related to investments | $ | 19,605 |
| | $ | 630 |
| | $ | 4,203 |
| | $ | 30 |
|
| | | | | | | | |
| Total included in other liabilities | $ | 19,605 |
| | $ | 630 |
| | $ | 4,203 |
| | $ | 30 |
|
RELIANT BANCORP, INC.
NOTES TO CONSOLIDATED FINANCIAL STATEMENTS (CONTINUED)
DECEMBER 31, 2019, 2018 AND 2017
(Dollar amounts in thousands except per share amounts)
NOTE
1920 - EARNINGS PER SHARE
The following is a summary of the components comprising basic and diluted earnings per common share of stock (EPS) for the years ended December
31: | | | | | | | | | | | | |
| | | 2016 | | | 2015 | | | 2014 | |
Basic EPS Computation | | | | | | | | | | | | |
Net income attributable to common shareholders | | $ | 8,936 | | | $ | 5,575 | | | $ | 3,896 | |
Weighted average common shares outstanding | | | 7,586,993 | | | | 6,329,316 | | | | 3,993,206 | |
| | | | | | | | | | | | |
Basic earnings per common share | | $ | 1.18 | | | $ | 0.88 | | | $ | 0.98 | |
| | | | | | | | | | | | |
Diluted EPS Computation | | | | | | | | | | | | |
Net income attributable to common shareholders | | $ | 8,936 | | | $ | 5,575 | | | $ | 3,896 | |
Weighted average common shares outstanding | | | 7,586,993 | | | | 6,329,316 | | | | 3,993,206 | |
Dilutive effect of stock options and restricted shares | | | 104,500 | | | | 149,636 | | | | 60,598 | |
| | | | | | | | | | | | |
Adjusted weighted average common shares outstanding | | | 7,691,493 | | | | 6,478,952 | | | | 4,053,804 | |
| | | | | | | | | | | | |
Diluted earnings per common share | | $ | 1.16 | | | $ | 0.86 | | | $ | 0.96 | |
| | | | | | | | | | | | |
|
| | | | | | | | | | | | |
| | | Year Ended |
| | | 2019 | | 2018 | | 2017 |
| Basic EPS Computation | | | | | | |
| Net income attributable to common shareholders | | $ | 16,196 |
| | $ | 14,085 |
| | $ | 7,246 |
|
| Weighted average common shares outstanding | | 11,212,127 |
| | 11,389,122 |
| | 8,151,792 |
|
| Basic earnings per common share | | $ | 1.44 |
| | $ | 1.24 |
| | $ | 0.89 |
|
| Diluted EPS Computation | | | | | | |
| Net income attributable to common shareholders | | $ | 16,196 |
| | $ | 14,085 |
| | $ | 7,246 |
|
| Weighted average common shares outstanding | | 11,212,127 |
| | 11,389,122 |
| | 8,151,792 |
|
| Dilutive effect of stock options and restricted shares | | 69,135 |
| | 79,667 |
| | 87,809 |
|
| Adjusted weighted average common shares outstanding | | 11,281,262 |
| | 11,468,789 |
| | 8,239,601 |
|
| Diluted earnings per common share | | $ | 1.44 |
| | $ | 1.23 |
| | $ | 0.88 |
|
Stock options for common stock totaling 60,500, 62,910 and 10,500 were not considered in computing diluted earnings per common share for 2019, 2018 and 2017, respectively, because they were antidilutive.
NOTE
2021 - SEGMENT REPORTING
The Company has two reportable business segments: retail banking and residential mortgage banking. Segment information is derived from the internal reporting system utilized by management. Revenues and expenses for segments reflect those, which can be specifically identified and have been assigned based on internally developed allocation methods. Financial results have been presented, to the extent practicable, as if each segment operated on a stand-alone basis.
Retail Banking provides deposit and lending services to consumer and business customers within our primary geographic markets. Our customers are serviced through branch locations, ATMs, online banking, and mobile banking.
Residential Mortgage Bankingoriginates traditional first lien residential mortgage loans and first lien home equity lines of credit throughout the United States. TheseThe traditional first lien residential mortgage loans are typically underwritten to government agency standards and sold to third party secondary market mortgage investors.COMMERCE UNION BANCSHARES, The home equity lines of credit are typically underwritten to participating banks or other investor group standards.
NOTES TO CONSOLIDATED FINANCIAL STATEMENTS (CONTINUED)
DECEMBER 31,
2016, 20152019, 2018 AND
20142017
(Dollar amounts in thousands except per share amounts)
NOTE
2021 - SEGMENT REPORTING (CONTINUED)
The following tables present summarized results of operations for the Company’s business segments:
| | | | | | | | | | | | |
| | | Year Ended December 31, 2016 | |
| | | Retail
Banking | | | Residential
Mortgage
Banking | | | Consolidated | |
Net interest income | | $ | 32,035 | | | $ | 617 | | | $ | 32,652 | |
Provision for loan losses | | | 968 | | | | — | | | | 968 | |
Noninterest income | | | 2,481 | | | | 6,319 | | | | 8,800 | |
Noninterest expense | | | 22,327 | | | | 8,047 | | | | 30,374 | |
Income tax expense | | | 2,285 | | | | (72 | ) | | | 2,213 | |
| | | | | | | | | | | | |
Net income (loss) | | | 8,936 | | | | (1,039 | ) | | | 7,897 | |
Noncontrolling interest in net loss of subsidiary | | | — | | | | 1,039 | | | | 1,039 | |
| | | | | | | | | | | | |
Net income attributable to common shareholders | | $ | 8,936 | | | $ | — | | | $ | 8,936 | |
| | | | | | | | | | | | |
| | | | | | | | | | | | |
| | | Year Ended December 31, 2015 | |
| | | Retail
Banking | | | Residential
Mortgage
Banking | | | Consolidated | |
Net interest income | | $ | 25,931 | | | $ | 1,239 | | | $ | 27,170 | |
Provision for loan losses | | | (270 | ) | | | — | | | | (270 | ) |
Noninterest income | | | 1,383 | | | | 10,999 | | | | 12,382 | |
Noninterest expense | | | 19,590 | | | | 11,979 | | | | 31,569 | |
Income tax expense | | | 2,419 | | | | (148 | ) | | | 2,271 | |
| | | | | | | | | | | | |
Net income | | | 5,575 | | | | 407 | | | | 5,982 | |
Noncontrolling interest in net income of subsidiary | | | — | | | | (407 | ) | | | (407 | ) |
| | | | | | | | | | | | |
Net income attributable to common shareholders | | $ | 5,575 | | | $ | — | | | $ | 5,575 | |
| | | | | | | | | | | | |
COMMERCE UNION BANCSHARES,
|
| | | | | | | | | | | | | | | | |
| | | Year Ended December 31, 2019 |
| | | Retail Banking | | Residential Mortgage Banking | | Elimination Entries | | Consolidated |
| Net interest income | | $ | 55,252 |
| | $ | 553 |
| | $ | — |
| | $ | 55,805 |
|
| Provision for loan losses | | 1,211 |
| | — |
| | — |
| | 1,211 |
|
| Noninterest income | | 7,059 |
| | 5,086 |
| | (181 | ) | | 11,964 |
|
| Noninterest expense | | 42,382 |
| | 11,510 |
| | — |
| | 53,892 |
|
| Income tax expense (benefit) | | 2,522 |
| | (393 | ) | | — |
| | 2,129 |
|
| Net income (loss) | | 16,196 |
| | (5,478 | ) | | (181 | ) | | 10,537 |
|
| Noncontrolling interest in net loss of subsidiary | | — |
| | 5,478 |
| | 181 |
| | 5,659 |
|
| Net income attributable to common shareholders | | $ | 16,196 |
| | $ | — |
| | $ | — |
| | $ | 16,196 |
|
|
| | | | | | | | | | | | | | | | |
| | | Year Ended December 31, 2018 |
| | | Retail Banking | | Residential Mortgage Banking | | Elimination Entries | | Consolidated |
| Net interest income | | $ | 53,008 |
| | $ | 821 |
| | $ | — |
| | $ | 53,829 |
|
| Provision for loan losses | | 1,035 |
| | — |
| | — |
| | 1,035 |
|
| Noninterest income | | 5,232 |
| | 4,595 |
| | (181 | ) | | 9,646 |
|
| Noninterest expense | | 41,512 |
| | 9,049 |
| | — |
| | 50,561 |
|
| Income tax expense (benefit) | | 1,608 |
| | (236 | ) | | — |
| | 1,372 |
|
| Net income | | 14,085 |
| | (3,397 | ) | | (181 | ) | | 10,507 |
|
| Noncontrolling interest in net income of subsidiary | | — |
| | 3,397 |
| | 181 |
| | 3,578 |
|
| Net income attributable to common shareholders | | $ | 14,085 |
| | $ | — |
| | $ | — |
| | $ | 14,085 |
|
|
| | | | | | | | | | | | | | | | |
| | | Year Ended December 31, 2017 |
| | | Retail Banking | | Residential Mortgage Banking | | Elimination Entries | | Consolidated |
| Net interest income | | $ | 33,761 |
| | $ | 726 |
| | $ | — |
| | $ | 34,487 |
|
| Provision for loan losses | | 1,316 |
| | — |
| | — |
| | 1,316 |
|
| Noninterest income | | 2,333 |
| | 3,805 |
| | (128 | ) | | 6,010 |
|
| Noninterest expense | | 25,524 |
| | 5,552 |
| | — |
| | 31,076 |
|
| Income tax expense (benefit) | | 2,008 |
| | (66 | ) | | — |
| | 1,942 |
|
| Net income | | 7,246 |
| | (955 | ) | | (128 | ) | | 6,163 |
|
| Noncontrolling interest in net income of subsidiary | | — |
| | 955 |
| | 128 |
| | 1,083 |
|
| Net income attributable to common shareholders | | $ | 7,246 |
| | $ | — |
| | $ | — |
| | $ | 7,246 |
|
NOTES TO CONSOLIDATED FINANCIAL STATEMENTS (CONTINUED)
DECEMBER 31,
2016, 20152019, 2018 AND
20142017
(Dollar amounts in thousands except per share amounts)
NOTE 20 - SEGMENT REPORTING (CONTINUED)
| | | | | | | | | | | | |
| | | Year Ended December 31, 2014 | |
| | | Retail
Banking | | | Residential
Mortgage
Banking | | | Consolidated | |
Net interest income | | $ | 14,996 | | | $ | 590 | | | $ | 15,586 | |
Provision for loan losses | | | (1,500 | ) | | | — | | | | (1,500 | ) |
Noninterest income | | | 1,161 | | | | 3,447 | | | | 4,608 | |
Noninterest expense | | | 11,945 | | | | 5,221 | | | | 17,166 | |
Income tax expense | | | 1,816 | | | | — | | | | 1,816 | |
| | | | | | | | | | | | |
Net income | | | 3,896 | | | | (1,184 | ) | | | 2,712 | |
Noncontrolling interest in net loss of subsidiary | | | — | | | | 1,184 | | | | 1,184 | |
| | | | | | | | | | | | |
Net income attributable to common shareholders | | $ | 3,896 | | | $ | — | | | $ | 3,896 | |
| | | | | | | | | | | | |
NOTE
2122 - BUSINESS COMBINATION
On March 10, 2015, Commerce Union Bancshares,January 1, 2018, pursuant to the Agreement and Plan of Merger, dated August 22, 2017, by and among Reliant Bancorp, Inc. (“Commerce Union”) approved a, Community First Inc., Pioneer Merger Sub, Inc., and Community First Bank & Trust, Community First, Inc. merged with and into the Reliant Bancorp, Inc. Immediately following the merger, Community First Bank & Trust merged with and into Reliant Bank, with Reliant Bank (“Reliant”) which became effective on April 1, 2015 (“surviving. Pioneer Merger Sub, Inc. was formed to effect the Merger”). Eachmerger and no longer exists.
Pursuant to the merger agreement, each outstanding share
and option to purchase a share of
ReliantCommunity First, Inc. common stock
(except for excluded shares and dissenting shares) was converted into
and cancelled in exchange for the right to receive
1.02130.481 shares of
Commerce Union common stock. After the Merger was completed, Commerce Union’s shareholders owned approximately 44.5% of theReliant Bancorp, Inc. common stock,
together with cash in lieu of
the Company and Reliant Bank’s shareholders owned approximately 55.5% of the common stock of the Company on a fully diluted basis.The Merger was accounted for as a reverse merger using the acquisition method of accounting, in accordance with the provisions of FASB ASC Topic 805-10 Business Combinations. As such, for accounting purposes, Reliant was considered to have acquired Commerce Union in this transaction. As a result, the historical financial statements of the Company will be the historical financial statements of Reliant. The assets and liabilities of Commerce Union as of the effective date of the Merger were recorded at their respective estimated fair values and added to those of Reliant. Any excess of purchase price over the net estimate fair values of the acquired assets and assumed liabilities of Commerce Union were allocated to all identifiable intangibles assets. Any remaining excess was then allocated to goodwill. Goodwill arising from the acquisition consists primarily of synergies of the combined operations. The goodwill resulting from thisany fractional shares. This business combination is not deductibleresults in expanded and more diversified market area for tax purposes.
COMMERCE UNION BANCSHARES, INC.
NOTES TO CONSOLIDATED FINANCIAL STATEMENTS (CONTINUED)
DECEMBER 31, 2016, 2015 AND 2014
(Dollar amounts in thousands except per share amounts)
NOTE 21 - BUSINESS COMBINATION (CONTINUED)
As mentioned above, in periods following the Merger, the comparative historical financial statements of the Company are those of Reliant prior to the Merger. These financial statements include the results attributable to the operations of Commerce Union beginning on April 1, 2015.
Company.
The following table details the financial impact of the merger, including the calculation of the purchase price, the allocation of the purchase price to the fair values of net assets assumed and goodwill recognized:
Calculation
|
| | | |
| Calculation of Purchase Price | |
| | |
| Shares of Community First, Inc. common stock outstanding as of January 1, 2018 | 5,025,884 |
|
| Exchange ratio for Reliant Bancorp, Inc. common stock | 0.481 |
|
| Share conversion | 2,417,450 |
|
| Reliant Bancorp, Inc. common stock shares issued | 2,416,444 |
|
| Reliant Bancorp, Inc. share price at December 29, 2017 | $ | 25.64 |
|
| Value of Reliant Bancorp, Inc. common stock shares issued | $ | 61,958 |
|
| Value of fractional shares | $ | 25 |
|
| Estimated fair value of Community First, Inc. | $ | 61,983 |
|
Table of Purchase Price | | | | |
| |
Shares of CUB common stock outstanding as of March 31, 2015 | | | 3,069,030 | |
Estimated market price of CUB common stock on April 1, 2015 | | $ | 14.95 | |
| | | | |
Estimated fair value of CUB common stock | | | 45,882 | |
Estimated fair value of CUB stock options | | | 2,019 | |
| | | | |
Total consideration | | $ | 47,901 | |
| | | | |
Allocation of Purchase Price
| | | | |
Total consideration above | | $ | 47,901 | |
| | | | |
| |
Fair value of assets acquired and liabilities assumed | | | | |
Cash and cash equivalents | | $ | 12,378 | |
Investment securities available for sale | | | 29,487 | |
Loans | | | 248,122 | |
Premises and equipment | | | 5,807 | |
Deferred tax asset, net | | | 549 | |
Bank owned life insurance | | | 4,181 | |
Core deposit intangible | | | 1,901 | |
Prepaid and other assets | | | 4,229 | |
Deposits | | | (247,307 | ) |
Securities sold under repurchase agreements | | | (488 | ) |
Other borrowings | | | (20,856 | ) |
Payables and other liabilities | | | (733 | ) |
| | | | |
Total fair value of net assets acquired | | | 37,270 | |
| | | | |
| |
Goodwill | | $ | 10,631 | |
| | | | |
COMMERCE UNION BANCSHARES,Contents
NOTES TO CONSOLIDATED FINANCIAL STATEMENTS (CONTINUED)
DECEMBER 31,
2016, 20152019, 2018 AND
20142017
(Dollar amounts in thousands except per share amounts)
NOTE
2122 - BUSINESS COMBINATION (CONTINUED)
|
| | | |
| Allocation of Purchase Price | |
| | |
| Total consideration above | $ | 61,983 |
|
| | |
| Fair value of assets acquired and liabilities assumed | |
| Cash and cash equivalents | (33,128 | ) |
| Time deposits in other financial institutions | (23,309 | ) |
| Investment securities available for sale | (69,078 | ) |
| Loans, net of unearned income | (313,040 | ) |
| Mortgage loans held for sale, net | (910 | ) |
| Accrued interest receivable | (1,165 | ) |
| Premises and equipment | (9,585 | ) |
| Restricted equity securities | (1,726 | ) |
| Cash surrender value of life insurance contracts | (10,664 | ) |
| Other real estate owned | (1,650 | ) |
| Deferred tax asset, net | (4,885 | ) |
| Core deposit intangible | (7,888 | ) |
| Other assets | (1,795 | ) |
| Deposits—noninterest-bearing | 80,395 |
|
| Deposits—interest-bearing | 352,100 |
|
| Other borrowings | 11,522 |
|
| Payables and other liabilities | 5,061 |
|
| Net liabilities assumed (net assets acquired) | (29,745 | ) |
| | |
| Goodwill | $ | 32,238 |
|
During 2018, as part of the system integration of Community First, Inc., the Company determined minor adjustments were appropriate to reduce other assets by $93 and increase payables and other liabilities by $85 effective as of the acquisition date.
Pro forma data for the year ended December 31,
2015 and 20142017, in the table below presents information as if the merger occurred at the beginning of
eachthe year.
| | | | | | | | |
| | | Year Ended
December 31, | |
| | | 2015 | | | 2014 | |
Net interest income | | $ | 30,355 | | | $ | 27,962 | |
Net income attributable to common shareholders | | | 6,221 | | | | 6,980 | |
| | |
Earnings per share—basic | | | 0.88 | | | | 0.99 | |
Earnings per share—diluted | | | 0.85 | | | | 0.97 | |
|
| | | | |
| Net interest income | | $ | 51,031 |
|
| Net income attributable to common shareholders | | $ | 6,387 |
|
| | | |
| Earnings per share - basic | | $ | 0.60 |
|
| Earnings per share - diluted | | $ | 0.60 |
|
Supplemental pro forma earnings in the table above includes, net of tax, $564 in pro forma adjustments for the year ended December 31, 2017. Supplemental pro forma earnings in the above table for the
yearsyear ended December 31,
2015 and 2014 include $849 and $1,4622017 includes $5,478 of nonrecurring costs
respectively.with a related tax benefit of $536 from prior historical results.
RELIANT BANCORP, INC.
NOTES TO CONSOLIDATED FINANCIAL STATEMENTS (CONTINUED)
DECEMBER 31, 2019, 2018 AND 2017
(Dollar amounts in thousands except per share amounts)
NOTE 22 - BUSINESS COMBINATION (CONTINUED)
Loans acquired in connection with a business combination are recorded at fair value, since any credit deterioration evident in the loans is included in the determination of the acquisition date fair values. No ALLL is recorded for such acquired loans because all loans are recorded at fair value at merger date. Impaired purchased loans are accounted for under ASC 310-30, in which an ALLL subsequent to the date of acquisition is established by re-estimating expected cash flows on these loans, with any decline in expected cash flows due to a credit triggering impairment recorded as purchased credit impairment (PCI). The amount is the excess of the loan’s carrying value over the present value of projected future cash flows, discounted at the current accounting yield of the loan or the fair value of collateral (less estimated costs to sell) for collateral dependent loans. These cash flow evaluations are inherently subjective as they require material estimates, all of which may be susceptible to significant change. While the determination of specific cash flows involves estimates, each estimate is unique to the individual loan, and none is individually significant. For non-purchased credit-impaired loans acquired in a merger and that are accounted for under ASC 310-20, the historical loss estimates are based on the historical losses experienced by Reliant Bank for loans with similar characteristics as those acquired other than purchased credit-impaired loans. We establish an ALLL provision for these loans only when the calculated amount exceeds the remaining credit mark established at acquisition.
RELIANT BANCORP, INC.
NOTES TO CONSOLIDATED FINANCIAL STATEMENTS (CONTINUED)
DECEMBER 31, 2019, 2018 AND 2017
(Dollar amounts in thousands except per share amounts)
NOTE 23 - QUARTERLY FINANCIAL RESULTS (UNAUDITED)
The following is a summary of consolidated quarterly financial results for the year ended December 31,
2016: | | | | | | | | | | | | | | | | |
| | | First | | | Second | | | Third | | | Fourth | |
| | | Quarter | | | Quarter | | | Quarter | | | Quarter | |
Interest income | | $ | 8,914 | | | $ | 9,497 | | | $ | 8,656 | | | $ | 8,948 | |
Net interest income | | | 8,082 | | | | 8,692 | | | | 7,835 | | | | 8,043 | |
Consolidated net income | | | 2,558 | | | | 2,137 | | | | 1,763 | | | | 1,439 | |
Noncontrolling interest in net (income) loss of subsidiary | | | (321 | ) | | | 223 | | | | 605 | | | | 532 | |
Net income attributable to common shareholders | | | 2,237 | | | | 2,360 | | | | 2,368 | | | | 1,971 | |
Basic earnings per share | | | 0.30 | | | | 0.31 | | | | 0.31 | | | | 0.26 | |
Diluted earnings per share | | | 0.30 | | | | 0.31 | | | | 0.30 | | | | 0.25 | |
COMMERCE UNION BANCSHARES, INC.
NOTES TO CONSOLIDATED FINANCIAL STATEMENTS (CONTINUED)
DECEMBER 31, 2016, 2015 AND 2014
(Dollar amounts in thousands except per share amounts)
2019:
|
| | | | | | | | | | | | | | | | |
| | | First
Quarter | | Second
Quarter | | Third
Quarter | | Fourth
Quarter |
| Interest income | | $ | 18,843 |
| | $ | 19,692 |
| | $ | 20,211 |
| | $ | 20,439 |
|
| Net interest income | | 13,461 |
| | 13,813 |
| | 14,064 |
| | 14,467 |
|
| Consolidated net income | | 2,281 |
| | 2,684 |
| | 2,614 |
| | 2,958 |
|
| Noncontrolling interest in net loss of subsidiary | | 1,543 |
| | 1,555 |
| | 1,386 |
| | 1,175 |
|
| Net income attributable to common shareholders | | 3,824 |
| | 4,239 |
| | 4,000 |
| | 4,133 |
|
| Basic earnings per share | | $ | 0.34 |
| | $ | 0.38 |
| | $ | 0.36 |
| | $ | 0.37 |
|
| Diluted earnings per share | | $ | 0.33 |
| | $ | 0.38 |
| | $ | 0.36 |
| | $ | 0.37 |
|
The following is a summary of consolidated quarterly financial results for the year ended December 31,
2015: | | | | | | | | | | | | | | | | |
| | | First | | | Second | | | Third | | | Fourth | |
| | | Quarter | | | Quarter | | | Quarter | | | Quarter | |
Interest income | | $ | 4,473 | | | $ | 8,224 | | | $ | 8,483 | | | $ | 8,708 | |
Net interest income | | | 4,069 | | | | 7,481 | | | | 7,719 | | | | 7,901 | |
Consolidated net income | | | 541 | | | | 1,570 | | | | 2,340 | | | | 1,531 | |
Noncontrolling interest in net (income) loss of subsidiary | | | 71 | | | | 32 | | | | (507 | ) | | | (3 | ) |
Net income attributable to common shareholders | | | 612 | | | | 1,602 | | | | 1,833 | | | | 1,528 | |
Basic earnings per share | | | 0.16 | | | | 0.23 | | | | 0.26 | | | | 0.21 | |
Diluted earnings per share | | | 0.15 | | | | 0.22 | | | | 0.25 | | | | 0.21 | |
|
| | | | | | | | | | | | | | | | |
| | | First
Quarter | | Second
Quarter | | Third
Quarter | | Fourth
Quarter |
| Interest income | | $ | 16,362 |
| | $ | 16,830 |
| | $ | 17,570 |
| | $ | 18,463 |
|
| Net interest income | | 13,382 |
| | 13,404 |
| | 13,466 |
| | 13,577 |
|
| Consolidated net income | | 3,277 |
| | 1,202 |
| | 3,240 |
| | 2,788 |
|
| Noncontrolling interest in net loss of subsidiary | | 464 |
| | 937 |
| | 842 |
| | 1,335 |
|
| Net income attributable to common shareholders | | 3,741 |
| | 2,139 |
| | 4,082 |
| | 4,123 |
|
| Basic earnings per share | | $ | 0.33 |
| | $ | 0.19 |
| | $ | 0.36 |
| | $ | 0.36 |
|
| Diluted earnings per share | | $ | 0.33 |
| | $ | 0.19 |
| | $ | 0.36 |
| | $ | 0.36 |
|
The following is a summary of consolidated quarterly financial results for the year ended December 31, 2017:
|
| | | | | | | | | | | | | | | | |
| | | First
Quarter | | Second
Quarter | | Third
Quarter | | Fourth
Quarter |
| Interest income | | $ | 8,973 |
| | $ | 9,704 |
| | $ | 10,627 |
| | $ | 10,854 |
|
| Net interest income | | 7,971 |
| | 8,503 |
| | 9,096 |
| | 8,917 |
|
| Consolidated net income | | 1,559 |
| | 1,794 |
| | 1,840 |
| | 970 |
|
| Noncontrolling interest in net loss of subsidiary | | 499 |
| | 393 |
| | 6 |
| | 185 |
|
| Net income attributable to common shareholders | | 2,058 |
| | 2,187 |
| | 1,846 |
| | 1,155 |
|
| Basic earnings per share | | $ | 0.27 |
| | $ | 0.28 |
| | $ | 0.23 |
| | $ | 0.13 |
|
| Diluted earnings per share | | $ | 0.26 |
| | $ | 0.28 |
| | $ | 0.22 |
| | $ | 0.13 |
|
RELIANT BANCORP, INC.
NOTES TO CONSOLIDATED FINANCIAL STATEMENTS (CONTINUED)
DECEMBER 31, 2019, 2018 AND 2017
(Dollar amounts in thousands except per share amounts)
NOTE
2324 - MORTGAGE OPERATIONS
During
Reliant Mortgage Ventures, LLC ("RMV") was organized on November 15, 2011 the Company andas a joint venture between VHC Fund 1, LLC organized(VHC) and Legacy Reliant Mortgage Ventures, LLC (the “Venture”) forBank to offer mortgage banking services within the purpose of improving the Company’s mortgage operations.Legacy Reliant Bank's market footprint. The Company holdsBank controls 51% of theRMV's governance rights of the Venture (and therefore consolidates the results of its operations) and 30% of the Venture’s financialRMV's income rights.
VHC Fund 1, LLC
holds 49% of the governance rights of the Venture and 70% of the related financial rights. VHC Fund 1, LLC iswas controlled by an immediate family member of a
previous member of the Company’s board of
directors.directors through March 2019. Under the related operating agreement, the non-controlling member receives 70% of the profits of the Venture, and the Company receives 30% of the profits once the non-controlling member recovers its cumulative losses. The non-controlling member is responsible for 100% of the mortgage venture’s operational and credit losses. The income and loss is included in the consolidated results of operations. The portion of the income and loss attributable to the non-controlling member (100% for
2016, 20152019, 2018 and
2014)2017) are included in non-controlling interest in net
(income) loss of subsidiary on the accompanying consolidated statements of operations. At December 31,
2016,2019 and 2018, the Venture
hashad a payable balance to the Company of
$632, and a receivable balance of $122 at December 31, 2015.$1,484 for each date.
Direct costs incurred by the Company attributable to the mortgage operations are allocated to the Venture as well as rent, personnel and core processing. As of December 31,
2016,2019, the cumulative losses to date of the Venture totaled
$3,397.$13,409. The Venture will have to generate net income of this amount before the Company will participate in future earnings.
COMMERCE UNION BANCSHARES, INC.
NOTES TO CONSOLIDATED FINANCIAL STATEMENTS (CONTINUED)
DECEMBER 31, 2016, 2015 AND 2014
(Dollar amounts in thousands except per share amounts)
During 2019, RMV entered into correspondent lending by purchasing non-qualified mortgage loans from other financial institutions and selling those loans to another, larger financial institution.
NOTE
2425 - PARENT COMPANY CONDENSED FINANCIAL INFORMATION
The following tables present parent company condensed financial statements asfor Reliant Bancorp, Inc.:
|
| | | | | | | | |
| CONDENSED BALANCE SHEET |
| DECEMBER 31, |
| | | 2019 | | 2018 |
| ASSETS | | | | |
| Cash and cash equivalents | | $ | 46,997 |
| | $ | 1,985 |
|
| Investment in subsidiaries | | 255,049 |
| | 225,446 |
|
| Other assets | | 2,851 |
| | 3,447 |
|
| Total assets | | $ | 304,897 |
| | $ | 230,878 |
|
| | | | | |
| LIABILITIES AND SHAREHOLDERS' EQUITY | | | | |
| Dividend payable | | $ | 76 |
| | $ | 1,036 |
|
| Accrued expenses and other liabilities | | 735 |
| | 406 |
|
| Subordinate debentures | | 80,333 |
| | 21,022 |
|
| Shareholders' equity | | 223,753 |
| | 208,414 |
|
| Total liabilities and shareholders' equity | | $ | 304,897 |
| | $ | 230,878 |
|
Table of and for the year ended December 31, 2016 and December 31, 2015. Prior to 2015, the parent company was under different ownership.CONDENSED BALANCE SHEET
DECEMBER 31
| | | | | | | | |
| | | 2016 | | | 2015 | |
ASSETS | | | | | | | | |
Cash and cash equivalents | | $ | 166 | | | $ | 113 | |
Due from bank | | | 1,711 | | | | — | |
Investment in subsidiary | | | 105,874 | | | | 96,338 | |
Other assets | | | 920 | | | | 2,412 | |
| | | | | | | | |
Total assets | | $ | 108,671 | | | $ | 98,863 | |
| | | | | | | | |
| | |
LIABILITIES AND EQUITY | | | | | | | | |
Dividend payable | | | 1,711 | | | | 1,489 | |
Accrued expenses and other liabilities | | | 41 | | | | 623 | |
Shareholders’ equity | | | 106,919 | | | | 96,751 | |
| | | | | | | | |
Total liabilities and shareholders’ equity | | $ | 108,671 | | | $ | 98,863 | |
| | | | | | | | |
COMMERCE UNION BANCSHARES,Contents
NOTES TO CONSOLIDATED FINANCIAL STATEMENTS (CONTINUED)
DECEMBER 31,
2016, 20152019, 2018 AND
20142017
(Dollar amounts in thousands except per share amounts)
NOTE
2425 - PARENT COMPANY CONDENSED FINANCIAL INFORMATION (CONTINUED)
CONDENSED STATEMENT OF INCOME
YEARS ENDED DECEMBER 31
| | | | | | | | |
| | | 2016 | | | 2015 | |
Dividends from subsidiary | | $ | 3,161 | | | $ | 3,139 | |
Other expense | | | 1,326 | | | | 1,413 | |
| | | | | | | | |
Income before income tax and undistributed income from subsidiary | | | 1,835 | | | | 1,726 | |
Income tax expense (benefit) | | | (508 | ) | | | (446 | ) |
Equity in undistributed income from subsidiary | | | 6,593 | | | | 3,403 | |
| | | | | | | | |
Net income attributable to common shareholders | | $ | 8,936 | | | $ | 5,575 | |
| | | | | | | | |
CONDENSED STATEMENT OF CASH FLOWS
YEARS ENDED DECEMBER 31
| | | | | | | | |
| | | 2016 | | | 2015 | |
Cash flows from operating activities | | | | | | | | |
Net income attributable to common shareholders | | $ | 8,936 | | | $ | 5,575 | |
Adjustments: | | | | | | | | |
Equity in undistributed income from subsidiary | | | (6,593 | ) | | | (3,403 | ) |
Change in other assets | | | (219 | ) | | | (2,337 | ) |
Change in other liabilities | | | (582 | ) | | | 336 | |
| | | | | | | | |
Net cash from operating activities | | | 1,542 | | | | 171 | |
| | | | | | | | |
| | |
Cash flows from investing activities | | | | | | | | |
Investment in subsidiary | | | (4,772 | ) | | | (1,895 | ) |
Cash from merger | | | — | | | | 17 | |
| | | | | | | | |
Net cash from investing activities | | | (4,772 | ) | | | (1,878 | ) |
| | | | | | | | |
| | |
Cash flows from financing activities | | | | | | | | |
Dividends paid | | | (1,489 | ) | | | — | |
Proceeds from equity issuances, net | | | 4,772 | | | | 1,820 | |
| | | | | | | | |
Net cash from financing activities | | | 3,283 | | | | 1,820 | |
| | | | | | | | |
| | |
Net change in cash and cash equivalents | | | 53 | | | | 113 | |
Beginning cash and cash equivalents | | | 113 | | | | — | |
| | | | | | | | |
Ending cash and cash equivalents | | $ | 166 | | | $ | 113 | |
| | | | | | | | |
COMMERCE UNION BANCSHARES,
The following tables present parent company condensed financial statements for Reliant Bancorp, Inc.:
|
| | | | | | | | | | | | |
| CONDENSED STATEMENT OF INCOME |
| YEARS ENDED DECEMBER 31, |
| | | 2019 | | 2018 | | 2017 |
| Dividends from subsidiaries | | $ | 6,800 |
| | $ | 7,521 |
| | $ | 2,141 |
|
| Interest expense | | 1,520 |
| | 1,277 |
| | — |
|
| Other expense | | 3,619 |
| | 4,775 |
| | 2,920 |
|
| Income before income tax and undistributed income from subsidiaries | | 1,661 |
| | 1,469 |
| | (779 | ) |
| Income tax expense (benefit) | | (1,123 | ) | | (1,537 | ) | | (922 | ) |
| Equity in undistributed income from subsidiaries | | 13,412 |
| | 11,079 |
| | 7,103 |
|
| Net income attributable to common shareholders | | $ | 16,196 |
| | $ | 14,085 |
| | $ | 7,246 |
|
|
| | | | | | | | | | | | |
| CONDENSED STATEMENT OF CASH FLOWS |
| YEARS ENDED DECEMBER 31, |
| | | 2019 | | 2018 | | 2017 |
| Cash flows from operating activities | | | | | | |
| Net income attributable to common shareholders | | $ | 16,196 |
| | $ | 14,085 |
| | $ | 7,246 |
|
| Reclassification of federal income tax rate change | | — |
| | — |
| | (245 | ) |
| Adjustments: | | | | | | |
| Equity in undistributed income from subsidiaries | | (13,412 | ) | | (11,079 | ) | | (7,103 | ) |
| Accretion related to subordinated debentures | | 113 |
| | 969 |
| | — |
|
| Change in other assets | | 596 |
| | (1,333 | ) | | 790 |
|
| Change in other liabilities | | 130 |
| | (230 | ) | | 595 |
|
| Net cash from operating activities | | 3,623 |
| | 2,412 |
| | 1,283 |
|
| | | | | | | |
| Cash flows from investing activities | | | | | | |
| Investment in subsidiary | | (6,017 | ) | | — |
| | (21,195 | ) |
| Net cash used in investing activities | | (6,017 | ) | | — |
| | (21,195 | ) |
| | | | | | | |
| Cash flows from financing activities | | | | | | |
| Issuance of subordinated debentures, net of issuance costs | | 59,198 |
| | — |
| | — |
|
| Dividends paid | | (4,013 | ) | | (3,451 | ) | | (3,193 | ) |
| Redemption of common stock | | (8,379 | ) | | (6 | ) | | — |
|
| Proceeds from equity issuances, net | | 600 |
| | 1,321 |
| | 24,648 |
|
| Net cash from (used in) financing activities | | 47,406 |
| | (2,136 | ) | | 21,455 |
|
| | | | | | | |
| Net change in cash and cash equivalents | | 45,012 |
| | 276 |
| | 1,543 |
|
| Beginning cash and cash equivalents | | 1,985 |
| | 1,709 |
| | 166 |
|
| Ending cash and cash equivalents | | $ | 46,997 |
| | $ | 1,985 |
| | $ | 1,709 |
|
NOTES TO CONSOLIDATED FINANCIAL STATEMENTS (CONTINUED)
DECEMBER 31,
2016, 20152019, 2018 AND
20142017
(Dollar amounts in thousands except per share amounts)
NOTE 26 - CONTRACT REVENUE
The Company does not consider revenue from its contracts subject to ASC 606 to be significant due to the scope exceptions of the standard.
The revenue of the Company from contracts with customers that is within the scope of ASC 606 is presented in non-interest income and includes the following:
Credit card interchange fees arise from card holder transactions and are a percentage of each transaction. These fees are earned and recognized concurrently with the transaction processing. During the years ending December 31, 2019, 2018 and 2017, the Company recognized credit card interchange fees of $136, $65 and $9, respectively.
Investment brokerage fees arise from a contract with an independent third-party service provider. The Company receives monthly commissions from the third party service provider based on mutual customer activity. The Company is only in the role of an agent in arranging the relationship between the mutual customer and the third- party service provider. During the years ending December 31, 2019, 2018 and 2017, the Company recognized investment brokerage fees of $49, $99 and $119, respectively.
NOTE
25 –27 - SUBSEQUENT EVENTS
In February of 2017
Effective January 1, 2020, the Company openedcompleted the acquisition of Tennessee Community Bank Holdings, Inc., a full service retail branch officeTennessee corporation (“TCB Holdings”), pursuant to the Agreement and Plan of Merger, dated September 16, 2019 (the “TCB Holdings Agreement”), by and among the Company, TCB Holdings, and Community Bank & Trust, a Tennessee-chartered commercial bank and wholly owned subsidiary of TCB Holdings (“CBT”). On the terms and subject to the conditions set forth in the Green Hills areaMerger Agreement, TCB Holdings merged with and into the Company (the “TCB Merger”), with the Company as the surviving corporation. Immediately following the TCB Merger, CBT merged with and into Reliant, with Reliant continuing as the surviving banking corporation. Pursuant to the Merger Agreement, at the effective time of the TCB Merger (the “Effective Time”), each outstanding share of TCB Holdings common stock, par value $1.00 per share (other than certain excluded shares), was converted into and canceled in exchange for the right to receive (i) $17.13 in cash, without interest, and (ii) 0.769 shares of the Company’s common stock, par value $1.00 per share (“Company Common Stock”). The Company issued 811,210 shares of Company Common Stock and paid approximately $18,073 in cash, in respect of shares of TCB Holdings common stock as consideration for the TCB Merger. The Company did not issue fractional shares of Company Common Stock in connection with the TCB Merger, but paid cash in lieu of fractional shares based on the volume weighted average closing price per share of the Company Common Stock on The Nasdaq Capital Market for the 10 consecutive trading days ending on and including December 30, 2019 (calculated as $22.36). At time of the TCB Merger, each outstanding option to purchase TCB Holdings common stock was canceled in exchange for a cash payment in an amount equal to the product of (i) $34.25 minus the per share exercise price of the option multiplied by (ii) the number of shares of TCB Holdings common stock subject to the option (to the extent not previously exercised). The Company paid an aggregate consideration payable to holders of unexercised options of approximately $430. All shares of Company’s common stock outstanding prior to the merger were unaffected by the TCB Holdings Transaction. The Company is currently determining the initial accounting for this business combination including completing valuations of loans, premises and equipment, intangible assets, deposits, debt and other liabilities.
TCB Holdings is a Tennessee based full-service community bank organization with operations in Ashland City, Kingston Springs, Pegram, Pleasant View, and Springfield, Tennessee. These communities lie on the northwest perimeter of Nashville, Tennessee. In MarchAt December 31, 2019, TCB Holdings had total assets of approximately $253,000 (unaudited).
RELIANT BANCORP, INC.
NOTES TO CONSOLIDATED FINANCIAL STATEMENTS (CONTINUED)
DECEMBER 31, 2019, 2018 AND 2017
(Dollar amounts in thousands except per share amounts)
NOTE 27 - SUBSEQUENT EVENTS (CONTINUED)
On October 22, 2019, the Company, openedPG Merger Sub, Inc., a Tennessee corporation and a wholly owned subsidiary of Reliant (“Merger Sub”), and First Advantage Bancorp, a Tennessee corporation (“FABK”), entered into an Agreement and Plan of Merger (the “FABK Merger Agreement”) that provides for the combination of the Company and FABK. Under the FABK Merger Agreement, Merger Sub will merge with and into FABK (the “FABK Merger”), with FABK to be the surviving corporation and to become a wholly owned subsidiary of Reliant. As soon as reasonably practicable following the FABK merger and as part of a single integrated transaction, FABK will merge with and into Reliant (the “Second Step Merger” and, together with the FABK merger, as the “FABK Mergers”), with Reliant to be the surviving corporation. Immediately following the completion of the Second Step merger, First Advantage Bank, a Tennessee-chartered commercial bank and a wholly owned subsidiary of FABK (“FAB”), will merge with and into Reliant Bank, a Tennessee-chartered commercial bank and a wholly owned subsidiary of Reliant (the “FABK Bank Merger”), with Reliant Bank to be the surviving bank. In connection with the FABK Merger, each outstanding share of common stock of FABK, par value $0.01 per share (“FABK common stock”) (except for specified shares of FABK common stock held by Reliant, Merger Sub, or FABK and any dissenting shares), will be converted into the right to receive (i) 1.17 shares (the “exchange ratio”) of Reliant common stock, par value $1.00 per share (“Reliant common stock”), and (ii) $3.00 in cash, without interest. In lieu of the issuance of any fractional shares of Reliant common stock, Reliant will pay to each shareholder of FABK who would otherwise be entitled to receive such fractional share an amount in cash (rounded to the nearest whole cent) determined by multiplying (i) the volume-weighted average closing price per share of Reliant common stock on The Nasdaq Capital Market (“Nasdaq”) for the 10 consecutive trading days ending on and including the business day immediately preceding the closing date of the transactions contemplated by the FABK merger agreement by (ii) the fraction of a share (rounded to the nearest thousandth when expressed in decimal form) of Reliant common stock to which such holder would otherwise be entitled to receive. Regulatory approval of the transaction was received in January 2020. Shareholder approval occurred on March 3, 2020. Completion of the FABK Merger is subject to the satisfaction of customary closing conditions. The transaction is expected to close in the beginning of the second quarter of 2020.
FABK is a Tennessee based full-service community bank organization with operations in Clarksville, Nashville, and Franklin, Tennessee. It also has a loan production office in
Chattanooga,Knoxville, Tennessee.
EXHIBIT INDEX
| | | | |
Exhibit
No.
| | Description
| | Location
|
| | |
3.1 | | Amended and Restated Charter of Commerce Union Bancshares, Inc. | | Incorporated by reference to Exhibit 3.1 to Form S-4 filed July 3, 2014 |
| | |
3.2 | | Amended and Restated Bylaws of Commerce Union Bancshares, Inc. | | Incorporated by reference to Exhibit 3.2 to Form S-4 filed July 3, 2014 |
| | |
4.1 | | Specimen certificate representing the common stock, par value $1.00 per share, of Commerce Union Bancshares, Inc. | | Incorporated by reference to Exhibit 4.1 to Form S-4 filed July 3, 2014 |
| | |
10.1** | | Employment Agreement, dated as of April 1, 2015, by and between William Ronald DeBerry and Commerce Union Bancshares, Inc. | | Incorporated by reference to Exhibit 10.1 to Form 8-K filed April 6, 2015 |
| | |
10.2** | | Employment Agreement, dated as of April 1, 2015, by and between Devan D. Ard, Jr. and Commerce Union Bancshares, Inc. and Commerce Union Bank | | Incorporated by reference to Exhibit 10.2 to Form 8-K filed April 6, 2015 |
| | |
10.3** | | Employment Agreement, dated as of April 1, 2015, by and between J. Daniel Dellinger and Commerce Union Bank | | Incorporated by reference to Exhibit 10.3 to Form 8-K filed April 6, 2015 |
| | |
10.4** | | Employment Agreement, dated as of April 1, 2015, by and between Michael Scott McKeown and Commerce Union Bancshares, Inc. and Commerce Union Bank | | Incorporated by reference to Exhibit 10.4 to Form 8-K filed April 6, 2015 |
| | |
10.5 | | Lease Agreement, dated as of January 31, 2013, by and between MarCor Properties, a partnership, and Commerce Union Bank | | Incorporated by reference to Exhibit 10.6 to Form S-4 filed July 3, 2014 |
| | |
10.6 | | Rental Agreement, dated as of March 28, 2013, by and between Springfield Executive Suites LLC and Commerce Union Bank | | Incorporated by reference to Exhibit 10.7 to Form S-4 filed July 3, 2014 |
| | |
10.7** | | Form of First Amendment to Organizer Stock Option Agreement | | Incorporated by reference to Exhibit 10.9 to Form S-4 filed July 3, 2014 |
| | |
10.8** | | Form of Second Amendment to Organizer Stock Option Agreement | | Incorporated by reference to Exhibit 10.10 to Form S-4 filed July 3, 2014 |
| | |
10.9** | | Form of Employee Incentive Stock Option Agreement | | Incorporated by reference to Exhibit 10.11 to Form S-4 filed July 3, 2014 |
| | |
10.10** | | Form of First Amendment to Employee Incentive Stock Option Agreement | | Incorporated by reference to Exhibit 10.12 to Form S-4 filed July 3, 2014 |
| | |
10.11** | | Form of Second Amendment to Employee Incentive Stock Option Agreement | | Incorporated by reference to Exhibit 10.13 to Form S-4 filed July 3, 2014 |
| | |
10.12** | | Form of Management Incentive Stock Option Agreement | | Incorporated by reference to Exhibit 10.14 to Form S-4 filed July 3, 2014 |
| | |
10.13** | | Form of First Amendment to Management Incentive Stock Option Agreement | | Incorporated by reference to Exhibit 10.15 to Form S-4 filed July 3, 2014 |
| | |
10.14** | | Form of Second Amendment to Management Incentive Stock Option Agreement | | Incorporated by reference to Exhibit 10.16 to Form S-4 filed July 3, 2014 |
At December 31, 2019, FABK had total assets of approximately $738,000 (unaudited).
FABK may exit from the FABK Mergers if (i) Reliant’s volume-weighted average closing stock price over a 15 consecutive trading day period prior to and ending on the fifth business day before the closing (the “average closing price”) is less than $18.5464, and (ii) (a) the number obtained by dividing the average closing price by $23.183 is less than (b) the difference between (1) the number obtained by dividing the closing index value for the Nasdaq Bank Index as reported in The Wall Street Journal on the determination date by $3,706.69, and (2) 0.20, provided that FABK shall not be entitled to terminate the FABK merger agreement without giving Reliant written notice of the intent to terminate the FABK merger agreement within two business days after the determination date, and provided further, that FABK’s termination right shall be subject to Reliant’s right to increase the FABK merger consideration (either with additional shares of Reliant common stock or, subject to the requirement that the FABK merger remains a “reorganization” for tax purposes, additional cash) such that the aggregate FABK merger consideration equals, at a minimum, an amount equal to the sum of (i) the cash consideration multiplied by the number of shares of FABK common stock then outstanding, plus (ii) the product of (x) the number of shares of FABK common stock outstanding on the determination date, multiplied by (y) the exchange ratio, multiplied by (z) $18.5464.
In February 2020, the Company entered two $25,000 notional amount cash flow hedges. The Company will pay fixed rates of 1.22% with one hedge having a 4-year maturity and the other having a 5-year maturity. For both hedges the Company will pay a floating rate. These interest rate swap hedges will be designated to offset risk related to short-term deposits and borrowings.
On February 27, 2020, the Company offered to exchange the $60,000 in 5.125% fixed to floating rate subordinated debentures due December 15, 2029 (see Note 11) with “New Notes”. The New Notes will have the same terms but will be registered with the SEC under the Securities Act and will be less restricted on transfer.
| | | | |
Exhibit
No.
| | Description
| | Location
|
| | |
10.15** | | Commerce Union Bancshares, Inc. Amended and Restated Stock Option Plan | | Incorporated by reference to Exhibit 10.17 to Form S-4 filed July 3, 2014 |
| | |
10.16 | | Operations Lease Agreement by and between RBC Center II, LLC and Reliant Bank, dated as of April 1, 2010 | | Incorporated by reference to Exhibit 10.1 to Form 8-K filed January 22, 2016 |
| | |
10.17 | | Branch Lease Agreement by and between RBC Center II, LLC and Reliant Bank, dated as of April 1, 2010 | | Incorporated by reference to Exhibit 10.2 to Form 8-K filed January 22, 2016 |
| | |
10.18 | | First Amendment to the Operations Lease Agreement by and between RBC Center II, LLC and Reliant Bank, dated June 1, 2011 | | Incorporated by reference to Exhibit 10.3 to Form 8-K filed January 22, 2016 |
| | |
10.19 | | First Amendment to the Branch Lease Agreement by and between RBC Center II, LLC and Reliant Bank, dated June 1, 2011 | | Incorporated by reference to Exhibit 10.4 to Form 8-K filed January 22, 2016 |
| | |
10.20 | | Second Amendment to the Operations Lease Agreement by and between RBC Center II, GP (successor-in-interest to RBC Center II, LLC) and Reliant Bank, dated January 15, 2016 | | Incorporated by reference to Exhibit 10.5 to Form 8-K filed January 22, 2016 |
| | |
10.21 | | Second Amendment to the Branch Lease Agreement by and between RBC Center II, GP (successor-in-interest to RBC Center II, LLC) and Reliant Bank, dated January 15, 2016 | | Incorporated by reference to Exhibit 10.6 to Form 8-K filed January 22, 2016 |
| | |
10.22** | | Form of Management Incentive Stock Option Agreement for grants under 2015 Equity Compensation Plan | | Incorporated by reference to Exhibit 10.24 to Form 10-K filed March 28, 2016 |
| | |
10.23** | | Employment Agreement, dated as of March 22, 2016, by and between Wallace E. Gammon, Jr. and Reliant Bank | | Incorporated by reference to Exhibit 10.1 to Form 8-K filed March 22, 2016 |
| | |
10.24 | | Mutual Cooperation Agreement, dated as of March 31, 2016, by and between BBMC Mortgage, LLC and Commerce Union Bancshares, Inc. | | Incorporated by reference to Exhibit 10.1 to Form 10-Q filed August 12, 2016 |
| | |
21.1 | | Subsidiaries of Commerce Union Bancshares, Inc. and Reliant Bank | | Filed herewith |
| | |
23.1 | | Consent of Maggart & Associates, P.C. | | Filed herewith |
| | |
23.2 | | Consent of Kraft CPAs PLLC | | Filed herewith |
| | |
24.1 | | Power of Attorney | | Included in Signature Page hereto |
| | |
31.1 | | Certification of Chief Executive Officer pursuant to Rule 13a-14(a)/15d-14(a) | | Filed herewith |
| | |
31.2 | | Certification of Chief Financial Officer pursuant to Rule 13a-14(a)/15d-14(a) | | Filed herewith |
| | |
32.1 | | Certification of CEO and CFO pursuant to Section 906 of the Sarbanes-Oxley Act | | Filed herewith |
** | Indicates compensatory plan or arrangement |
RELIANT BANCORP, INC.
NOTES TO CONSOLIDATED FINANCIAL STATEMENTS (CONTINUED)
DECEMBER 31, 2019, 2018 AND 2017
(Dollar amounts in thousands except per share amounts)
NOTE 27 - SUBSEQUENT EVENTS (CONTINUED)
On March 4, 2020, Nashville and communities lying east of the Company's middle Tennessee market perimeter sustained tornado damage. Presently, the Company is unable to determine the possible impact of the tornado, but any losses would be mitigated by the required insurance coverages for collateral based loans.
Effective March 10, 2020, the Company authorized a stock repurchase plan for the Company to reacquire up to $15,000 of the Company's outstanding common stock. The repurchase plan is anticipated to remain effective until December 31, 2020, unless the authorized amount of share repurchase is reached at an earlier date. The Company may extend, modify, amend, suspend, or discontinue the plan at any time.