
(Mark One)
| ☑ | ANNUAL REPORT PURSUANT TO SECTION 13 OR 15(d) OF THE SECURITIES EXCHANGE ACT OF 1934 | ||||
2021
| ☐ | TRANSITION REPORT PURSUANT TO SECTION 13 OR 15(d) OF THE SECURITIES EXCHANGE ACT OF 1934 | ||||

Inc.
Delaware | 62-1096725 | |||||||
| (State or other jurisdiction of incorporation or organization) | (I.R.S. Employer Identification | |||||||
6210 Ardrey Kell Road, Suite 600 Charlotte, North Carolina | ||||||||
| (Address of principal executive offices) | (Zip Code) | |||||||
code)
Title of each class | Trading symbol | Name of each exchange on which registered | ||||||||||||
| Common Stock, par value $0.01 | NNBR | The | ||||||||||||
(Title of class)
Indicate by check mark if disclosure of delinquent filers pursuant to Item 405 of Regulation S-K is not contained herein, and will not be contained, to the best of registrant’s knowledge, in definitive proxy or information statements incorporated by reference in Part III of this Form 10-K or any amendment to this Form 10-K. ☐
| Large accelerated filer | ☐ | Accelerated filer | ☑ | ||||||||||||
| Non-accelerated filer | Smaller reporting company | ☑ | |||||||||||||
| ☐ | |||||||||||||||
The number of $7.35. Solely for purposes of making this calculation, shares of the registrant’s common stock outstanding onheld by named executive officers, directors and 5% or greater stockholders of the registrant as of such date have been excluded because such persons may be deemed to be affiliates. This determination of affiliate status is not necessarily a conclusive determination for any other purposes.
4, 2022, there were 43,297,653 shares of the registrant’s common stock, par value $0.01 per share, outstanding.
Such proxy statement will be filed with the Securities and Exchange Commission within 120 days of the registrant’s fiscal year ended December 31, 2021.
PART I
| Page | ||||||||
All dollar amounts presented in tables that follow are in thousands (except for share data) unless otherwise indicated.
Our business is aggregated into three reportable segments, the Precision Bearing Components Group, the Precision Engineered Products Group and the Autocam Precision Components Group. Our business segments and acquisition activity are described further below.
Acquisition Activity
2015
On May 29, 2015, we completed the acquisition of Caprock Manufacturing, Inc. and Caprock Enclosures, LLC (collectively referred to as “Caprock”). Caprock was a privately held plastic components supplier located in Lubbock, Texas. Caprock serves multiple end markets; including aerospace, medical and general industrial. The acquisition provided further balancing of our end markets and represented the first step in our strategic plan related to transforming our plastics business. The results of Caprock have been consolidated with NN since the date of acquisition as part of the Precision Engineered Products Group.
On October 19, 2015, we completed the acquisition (the “PEP Acquisition”) of Precision Engineered Products Holdings, Inc. (“PEP”). As a result of the PEP Acquisition, PEP became a wholly owned subsidiary of NN. PEP is a global manufacturer of highly engineered precision customized solutions serving the medical, electrical, automotive and aerospace end markets. PEPthat combines in-depth materials science expertise with advanced engineering and production capabilities to design and manufacture a broad range of high-precision metal and plastic components and assemblies and finished devices. Following the PEP Acquisition and the divestiture of Delta Rubber Company (described below), we combined the operations of PEP with our Plastics and Rubber Components Group, and renamed the group as the Precision Engineered Products Group.
On November 30, 2015, we completed the divestiture of Delta Rubber Company, a wholly owned subsidiary (“Delta Rubber”). The sale of Delta Rubber was in furtherance of our strategic plan and provided further balance to our portfolio of businesses.
2014
On January 20, 2014, we acquired V-S Industries (“V-S”), a manufacturer of precision metal components with locations in Wheeling, Illinois and Juarez, Mexico. The acquisition of V-S provided us with a broader product offering, allowing for penetration into adjacent markets. V-S’s products serve a variety of industries including electric motors, HVAC, power tools, automotive and medical. V-S’s operations were integrated withend markets on a global basis. As used in this Annual Report on Form 10-K (this “Annual Report”), the Autocam Precision Components Group.
On June 20, 2014, we acquired RFK Industries (“RFK”terms “NN,” the “Company,” “we,” “our,” or the “Konjic Plant”), a manufacturer of tapered rollers located in Konjic, Bosnia and Herzegovina. RFK’s products are complementary“us” refer to our existing roller bearing products and broaden our product offerings and allows penetration into adjacent markets. RFK currently exports all of its products to customers serving the European truck, industrial vehicle and railway markets. RFK’s operations were integrated with our Precision Bearing Components Group.
On July 15, 2014, we acquired Chelsea Grinding Company (“Chelsea”)NN, Inc., a manufacturer of cylindrical rollers used primarily in the hydraulic pump industry. Following the acquisition of Chelsea, we relocated Chelsea’s operations to our Erwin, Tennessee plant. Chelsea’s operations were integrated with the Precision Bearing Components Group.
On August 29, 2014, we acquired Autocam Corporation (“Autocam”), a manufacturer of high precision metal components serving primarily the automotive and commercial vehicle HVAC and fluid power industries. Based in Kentwood, Michigan, Autocam manufactures and assembles highly complex, system critical components for fuel systems, engines, transmission, power steering and electric motors. Autocam and its subsidiaries employ over 2,100 employees with 15 manufacturingsubsidiaries. We have 31 facilities in the U.S.,North America, Europe, South America, and Asia. With
Corporate Information
We were founded in October 1980Power Solutions groups and are incorporatedbased principally on the end markets they serve.
Business Segments
Net sales, income from operations and assets for each of our business segments is presented in Management’s Discussion and Analysis of Financial Condition Results of Operations and Note 12 of the Notes to the Consolidated Financial Statements. Additional information regarding our three business segments (Precision Bearing Components Group, Precision Engineered Products Group and Autocam Precision Components Group) is presented below.
Precision Bearing Components Group
Within our Precision Bearing Components Group, we manufacture and supply high precision bearinginternal combustion engine vehicles. The group currently manufactures components consisting of balls, cylindrical rollers, tapered rollers, spherical rollers and metal retainers, for leading bearing and CV-joint manufacturers on a global basis. We are a leading independent manufacturer of precision steel bearing ballshigh-volume basis for use in power steering, braking, transmissions, and rollers forgasoline fuel system applications, along with components utilized in heating, ventilation and air conditioning and diesel injection and diesel emissions treatment applications. This expertise has been gained through investment in technical capabilities, processes and systems, and allows us to provide skilled program management and product launch capabilities.
Precision Engineered Products Group
Following the PEP Acquisition, we combined the operations of PEP with our Plastics and Rubber Components Segment. Within our Precision Engineered Products Group,this group we combine materials science expertise with advanced engineering and production capabilities to design and manufacture a broad range of high-precision metal and plastic components, assemblies, and finished devices for the medical, electrical, automotive and aerospace end markets.
Autocam Precision Components Group
Within our Autocam Precision Components Group, we manufacture highly engineered, difficult-to-manufacture precision metal components and subassemblies for the automotive, HVAC, fluid power and diesel engine end markets. Our entry into the precision metal components market began in 2006 with the acquisition of Whirlaway Corporation. We dramatically expanded the segment in 2014 with the acquisitions of Autocam and V-S. These acquisitions furthered our strategy to diversify our end markets and build upon our core manufacturing competency of high-precision metal machining.
Products
Precision Bearing Components Group
Precision Steel Balls. At our Precision Bearing Components Group facilities (with the exception of our Veenendaal plant), we manufacture and sell high quality, precision steel balls. Our steel balls are used primarily by manufacturers of anti-friction bearings and constant velocity joints where precise spherical, tolerance and surface finish accuracies are required.
Steel Rollers. We manufacture tapered rollers at our Veenendaal, Erwin, and Konjic plants and cylindrical rollers at our Erwin plant. Rollers are an alternative rolling element used instead of balls in anti-friction bearings that typically have heavier loading or different speed requirements. Our roller products are used primarily for applications similar to those of our precision steel ball product line, plus certain non-bearing applications such as hydraulic pumps and motors. Tapered rollers are a component in tapered roller bearings that are used in a variety of applications including automotive gearbox applications, automotive wheel bearingsranging from power control to flight control and a wide variety of industrial applications. Most cylindrical rollers are made to specific customer requirements for diameter and length and are used in a variety of industrial applications.
Metal Retainers. We manufacture and sell precision metal retainers for roller bearings used in a wide variety of industrial applications. Retainers are used to separate and space the rolling elements within a fully assembled bearing. We manufacture metal retainers at our Veenendaal plant.
Precision Engineered Products Group
Precision Solutions.military devices. We manufacture a variety of components, assemblies and instruments, such as surgical knives, bioresorbable implants, surgical staples, orthopedic system tools, laparoscopic devices, drug delivery devices and catheter components for the medical end market,products including electrical contacts, connectors, contact assemblies, and precision stampings for the electrical control end market, precision components, assemblies and electrical contacts for the automotive end market and a variety of engineered materialshigh precision products for the aerospace and defense end market includingutilizing our extensive process technologies for optical grade plastics, thermally conductive plastics, and titanium, Inconel, magnesium, and gold electroplating. At our Lubbock plant, we manufacture and sell precision plastic retainers for ball and roller bearings used inOur medical business includes the production of a wide variety of industrial applications. We also manufacturetools and sell a wide range of specialized plastic products including automotive under-the-hood components, electronic instrument casesinstruments for the orthopaedics and precision electronic connectors and lenses.
Autocam Precision Components Group
Precision Components. We sell a wide range of highly engineered, extremely close tolerance, precision-machined metal components and subassemblies primarily to the consumer transportation, industrial technology, HVAC, fluid power and diesel enginemedical/surgical end markets.
Research and Development and Product Engineering
Our research and development and product engineering efforts focus on enhancingbelieve our existing products and developing patented products, particularlyability to produce high-precision parts at high production volumes is among the best in the medical industry,market. Our technology platform consists of high precision machining, progressive stamping, injection molding, laser welding, material science, assembly, and design optimization. In-house tool design and process know-how create trade secrets that can be presentedenable consistent production tolerances of less than one micron while producing millions of parts per day. Parts are manufactured to application-specific customer design and soldco-design standards that are developed for a specific use. The high-precision capabilities are part of our zero-defect design process which seeks to eliminate variability and manufacturing defects throughout the entire product lifecycle. We believe our production capabilities provide a competitive advantage as few other manufacturers are capable of meeting tolerance demands at any volume level requested by our customers. As the need for tight-tolerance precision parts, subassemblies, and devices continues to increase, we believe that our production capabilities will place us at the forefront of the industry. We have differentiated ourselves among our competitors by providing customers engineered solutions and a broad reach and breadth of manufacturing capabilities. We believe it is for these reasons, and because of our proven ability to produce high-quality, precision parts and components on a cost-effective basis, that customers choose us to meet their manufacturing needs.
grow the business.
See Note 12 of the Notes to Consolidated Financial Statements and “Management’s Discussion and Analysis of Financial Condition and Results of Operations — Results of Operations” for additional segment financial information.
The following table presents a breakdown
| 2016 | 2015 | 2014 | ||||||||||
Precision Bearing Components Group | $ | 248,534 | $ | 261,837 | $ | 278,026 | ||||||
Percentage of Total Sales | 30 | % | 39 | % | 57 | % | ||||||
Precision Engineered Products Group | 258,816 | 77,183 | 33,351 | |||||||||
Percentage of Total Sales | 31 | % | 12 | % | 7 | % | ||||||
Autocam Precision Components Group | 326,138 | 328,260 | 177,224 | |||||||||
Percentage of Total Sales | 39 | % | 49 | % | 36 | % | ||||||
|
|
|
|
|
| |||||||
Total | $ | 833,488 | $ | 667,280 | $ | 488,601 | ||||||
|
|
|
|
|
| |||||||
Percentage of Total Sales | 100 | % | 100 | % | 100 | % | ||||||
During 2015, followingqualified individuals in the PEP Acquisition and the divestiture of Delta Rubber,communities in which we combined the operations of PEP with our Plastics and Rubber Components Group, and renamed the segment as the Precision Engineered Products Group. The Precision Engineered Products Group includes the Plastic and Rubber Components Group as presented in our previous filings. Net sales for the fiscal years 2014 solely relate to our former Plastic and Rubber Components Segment.
Employees
operate.
Competition
Precision Bearing Components Group
We believe that competition within the Precision Bearing Components Group is based principally on quality, priceour employees and the abilitycommunities in which we operate. Our team monitors country, state, and local guidance, and uses these to consistently meet customer delivery requirements. Management believes that our competitive strengths are our precision manufacturing capabilities, our wide product assortment, our reputationimplement best practice guidelines for consistent qualityemployees and reliability,visitors. Throughout the pandemic, NN has increased communications, including the addition of virtual “town hall” style meetings at the group and organizational level. This has helped employees across our global manufacturing footprint and the productivitystay connected, whether working from home or at one of our workforce.
Precision Engineered Products Group
manufacturing sites.
Our primary competitors in the plastic bearing retainer market are Nakanishi Manufacturing Corporationcontext and Precimold, Inc. Domestically, National Plastics and Sales, Inc., Nypro, Inc., Thermotec, Inc., GW Plastics, Inc., C&J Industries, Inc., and Nyloncraft, Inc., are amongst the largest players in the precision plastic components markets. Our primary competitors in the medical device market are Tecomet, Inc., Lake Region Medical, Inc., and Vention Medical, Inc. Our primary competitors in the electrical market are Deringer-Ney, Inc., Doduco GmbH and Metalor Technologies International. Our primary competitors in the automotive and aerospace market are Interplex Industries, Inc. and Accu-Mold, LLC.
We believe that competition within the plastic injection molding, plastic bearing retainer, precision plastic components, medical device, electrical, automotive and aerospace markets is based principally on quality, price, design capabilities and speed of responsiveness and delivery. Management believes that our competitive strengths are product development, tool design, fabrication, and tight tolerance molding processes. With these strengths, we have built our reputation in the marketplace ashelp them build a quality producer of technically difficult products.
Autocam Precision Components Group
long-term career path.
Raw Materials
development and global platform, as well as on quality, price, and service.
The primary raw material used in our core ball and roller business of the Precision Bearing Components Group is 52100 Steel, which is high quality chromium steel. Our other steel requirements include metal strip, stainless steel, and type S2 rock bit steel.
The Precision Bearing Components Group businesses purchase substantially all of their 52100 Steel requirements from suppliers in Europe and Japan, and all of their metal strip requirements from European suppliers and traders.Machining. We purchase steel on the basis of composition, quality, availability and price. For precision steel balls, the pricing arrangements with our suppliers are typically subject to adjustment every three to six months in North America and contractually adjusted on an annual basisbelieve that competition within the European locations forelectrical and aerospace and defense end markets is based principally on quality, price, design capabilities, and speed of responsiveness and delivery. We believe that our competitive strengths are product development, tool design, fabrication, tight tolerance processes, and customer solutions. With these strengths, we have built our reputation in the base steel price and quarterly for surcharge adjustments. If any of our current suppliers were unable to supply 52100 Steel to us, higher costs and/or production interruptions could occurmarketplace as a resultquality producer of obtaining 52100 Steel from alternate sources. Our operating results would be negatively affected in the event that North American or European governments impose any significant quotas, tariffs or other duties or restrictions on the importtechnically difficult products.
Precision Engineered Products Group
The Precision Engineered Products Group uses a wide variety of metals in various forms, including precious metals like gold, silver, palladium and platinum. Through our diverse network of suppliers, we minimize supplier concentration risk and provide a stable supply of raw materials at competitive pricing. This group also procures resins and metal stampings from several domestic and foreign suppliers.
For the Precision Engineered Products Group, we base purchase decisions on quality, service and price. Generally, we do not enter into written supply contracts with our suppliers or commit to maintain minimum monthly purchases of materials. However, we carefully manage raw material price volatility, particularly with respect to precious metals, through the use of consignment agreements. In effect, we lease the precious metals for our own stock and buy the raw materials on the same day customer shipments are priced, thereby eliminating speculation. In addition, our products with precious metal content are priced with a margin on the raw material cost to further protect against raw material price volatility and to provide incremental profit.
Autocam Precision Components Group
The Autocam Precision Components GroupContent
Most of the raw materials we use are purchased from various suppliers and are typically available from numerous sources, some of which are located in China and Europe. The ongoing COVID-19 pandemic has impacted our suppliers, and we continue to monitor the effect of these impacts on our supply chain in order to maintain regular and timely supply of raw materials to our business segments.
Historically, we
may divert management attention from other business concerns.
Matters
Based on information compiled to date, management believes that our current operations are in substantial compliance with applicable environmental laws and regulations, the violation of which could have a material adverse effect on our business and financial condition. We have assessed conditional asset retirement obligations and have found them to be immaterial to the consolidated financial statements. We cannot assure that currently unknown matters, new laws and regulations, or stricter interpretations of existing laws and regulations will not materially affect our business or operations in the future. More specifically, although we believe that we dispose of waste in material compliance with applicable environmental laws and regulations, we cannot be certain that we will not incur significant liabilities in the future in connection with the clean-up of waste disposal sites.
FDA Compliance
As a contract manufacturer of medical devices, certain of our subsidiaries, including PEP, are required to register as such with the U.S. Food and Drug Administration (“FDA”). Each of our facilities that manufacture finished medical devices is registered with the FDA. To maintain our registration, we deploy a robust quality management system across all of our manufacturing facilities.
Content
sExecutive Officers
date hereof, compliance with these laws and regulations has not had a material effect on our capital expenditures, results of operations, and competitive position. For additional information, see “Item 1A - Risk Factors.”
Name | Age | Position | ||||||||||||
| President and Chief Executive Officer | ||||||||||||||
| Senior Vice President – Chief Financial Officer | ||||||||||||||
| John R. Buchan | 60 | Executive Vice President – Mobile Solutions and Power Solutions | ||||||||||||
| Matthew S. Heiter | Senior Vice President and General Counsel | |||||||||||||
| Senior Vice President | ||||||||||||||
| Senior Vice President | ||||||||||||||
Set forth below is certain additional information with respect to each of our executive officers.
Richard D. Holder joined us as
J. Robert Atkinson joined us as Vice President, Corporate Treasurer and Manager of Investor Relations in 2014. Prior to joining us, Mr. Atkinson was with Regions Bank, one of the nation’s largest full-service providers of consumer and commercial banking, wealth management, mortgage, and insurance products and services. He most recently served as vice president and commercial relationship manager in Regions Corporate Bank Group, where he was responsible for marquee corporate relationships, developing treasury management solutions and negotiating terms and conditions for new and renewal credit facilities. Prior to that position, he served as Vice President of business services. Mr. Atkinson also served as a project coordinator for the Electrical Group of Eaton Corporation. Mr. Atkinson is a member of the Association of Financial Professions and earned his certified treasury professional designation.
Thomas C. Burwell, Jr. joined us as Corporate Controller in September 2005. He was promoted to Vice President Chief Accounting Officer and Corporate Controller in 2011, and to Senior Vice President and Chief Financial Officer in November 2016. Prior to joining NN, Mr. Burwell held various positions at Coats, PLC from 1997 to 2005 ultimately becoming the Vice President of Finance for the U.S. Industrial Division. From 1992 to 1997, Mr. Burwell held various positions at the international accounting firm BDO Seidman, LLP. Mr. Burwell is a Certified Public Accountant.
Matthew S. Heiter joined us as Senior Vice President and General Counsel in July 2015. Prior to joining us, Mr. Heiter was a shareholder in the law firm of Baker, Donelson, Bearman, Caldwell and Berkowitz, PC from May 1996 to December 1999 and from July 2002 to July 2015, where he served as chairman of the firm’s Securities and Corporate Governance Practice Group. From January 2000 to July 2002, Mr. Heiter served as the Executive Vice President, General Counsel and Secretary of Internet Pictures Corporation, a publicly traded internet technology company.
L. Jeffery Manzagol joined us as Senior Vice President—General Manager of the Precision Bearing Components Group in October 2014. Manzagol stepped into his role with more than 36 years of metal bearings and high precision manufacturing experience. He most recently served as President of the Bearings Division at Kaydon Corporation. Previously, Manzagol held various leadership positions at SKF Group, including President and General Manager at the Armada, Michigan facility.
John Manzi joined us as Senior Vice President—General Manager of Precision Engineered Products Group in October 2015 in connection with the completion of the PEP Acquisition. Previously, Mr. Manzi served as the President and Chief Executive Officer of PEP. Mr. Manzi was instrumental in leading PEP’s development and, together with PEP’s management team, has successfully enhanced PEP’s end market reach, expanded its product breadth and executed on key strategic acquisitions. Mr. Manzi has 20 years of experience with PEP. Prior to joining PEP’s management team, Mr. Manzi held various positions including President of PEP’s Attleboro operations, Vice President of Operations, and Engineering Manager.
Warren Veltman joined us as Senior Vice President and General Manager of our former Autocam Precision Components Group in September 2014.Group. Prior to the acquisition, Mr. Veltman served as Chief Financial Officer of Autocam Corporation from 1990 and Secretary and Treasurer since 1991. Prior to Mr. Veltman’s service at Autocam, Mr. Veltman was an Audit Manager with Deloitte & Touche LLP.
James
COVID-19 pandemic.Item 1A.Risk FactorsThe following are risk factors that affect our business, prospects, financial condition, results of operations, and cash flows, some of which are beyond our control. These risk factors should be considered in connection with evaluating the forward-looking statements contained in this Annual Report on Form 10-K. If any of the events described below were to actually occur, our business, prospects, financial condition, results of operations, or cash flows could be adversely affected, and results could differ materially from expected and historical results.Risks Related to Our OperationsA recession impactingThe COVID-19 pandemic and mitigation efforts to control the spread of the disease have impacted, and are expected to continue to materially impact, our business and our financial condition, results of operations and cash flows could be materially adversely affected by factors directly or indirectly relating to the COVID-19 pandemic.The COVID-19 pandemic has created significant volatility in the global economy, led to significant reduced market and economic activity, and disrupted, and may continue to disrupt, the end markets we serve. In response, various governmental bodies and private enterprises implemented numerous measures to contain the pandemic, such as travel bans and restrictions, quarantines, “shelter-in-place” orders and shutdowns. While many of the restrictions have eased across the globe, some areas have re-imposed closures and other restrictions due to increased rates of COVID-19 cases. No assurance can be given that these new closures and restrictions will not continue to occur. New and more easily transmitted variants of COVID-19, such as the Delta and Omicron variants, have emerged and spread in the U.S. and across the globe.The impact of these variants cannot be predicted at this time and could depend on numerous factors, including vaccination rates among the population, the efficacy of COVID-19 vaccines against the new variants, and the response by governmental bodies and regulators.Further surges in COVID-19 infection rates could result in the reinstatement of directives and mandates requiring businesses to again curtail or cease normal operations.The COVID-19 pandemic and the geographic regionsresponses by governmental bodies and regulators thereto have created a disruption in which we orour manufacturing, product distribution, overall supply chain, and other business activities, and that of our customers, operatesuppliers, co-manufacturers, and distributors. A significant number of our customers, suppliers, co-manufacturers, distributors, and manufacturing facilities are located in regions that have been affected by the pandemic and those operations have been, and may continue to be, materially affected by restrictive measures implemented in response to the pandemic. As a result we have experienced, and may continue to experience, delays in the production and distribution of our products and the loss of sales to our customers. Any delay or shortage in the supply of raw materials or delay in the manufacturing or distribution of our products may result in our inability to satisfy customer demand in a timely manner or at all, which could result in the loss of a portion of or all of the customer’s business and damage our reputation. Additionally, if the global economic effects caused by11the COVID-19 pandemic continue or increase, overall customer demand may continue to decrease, which could have a material adverse effect on our ability to finance our operations and implement our growth strategy.During the three month period ended December 31, 2008 and the year ended December 31, 2009, we experienced a sudden and significant reduction in customer orders driven by reductions in automotive and industrial end market demand across all our businesses. Additionally, during the latter part of 2011 and all of 2012, we experienced the impacts of a European recession in our European businesses. Prior to this time, we had never been affected by a recession that had impacted both of our key geographic markets of the U.S. and Europe simultaneously. If we are impacted by a global recession in the future, this could have a material adverse effect on our business, prospects,results of operations, and financial condition.Further, the COVID-19 pandemic could adversely impact our ability, and the ability of our suppliers, co-manufacturers, distributors, and customers, to retain key employees and ensure the continued service and availability of skilled personnel necessary to run our, and their, operations. To the extent our management or other personnel, or the management or other personnel of our suppliers, co-manufacturers, distributors, and customers, are impacted in significant numbers by the pandemic and are not available to perform their job duties, we could experience delays in, or the suspension of, our manufacturing operations, distribution of our products, and other important corporate functions.The ongoing COVID-19 pandemic and the current volatility in the global economy, reduced market and economic activity, and disruptions in the end markets we serve present material risks and uncertainties for us.The extent of the impact that the COVID-19 pandemic will have on our business, results of operations, and financial condition will depend largely on future developments relating to the duration and scope of the COVID-19 pandemic, including the continued emergence, persistence, severity and transmissibility of variants of the virus, the efficacy of vaccines, the pace at which governmental restrictions are eased or lifted, and the implementation of new or additional mitigation efforts by governmental authorities to control the spread of the disease, such as “stay-at-home” orders, business closures, and vaccine mandates. To the extent the COVID-19 pandemic adversely affects our business, financial condition, results of operations, oroperation, and cash flows, and could lead to additional restructuring and/or impairment charges being incurred and our ability to implement our growth strategy.The cyclical demand for our products andit may also have the seasonality impact on our production could adversely affect our revenues.The end markets for fully assembled bearings and industrial and automotive components are cyclical and tend to decline in response to overall declines in industrial and automotive production. As a result, the market for the bearing components and precision metal and industrial plastic products we sell is also cyclical and impacted by overall levelseffect of industrial and automotive production. Our sales have been, and can beheightening other risks disclosed below. In addition, if in the future negatively affected by adverse conditions in the industrial and/there is an outbreak of another highly infectious or automotive production sectors of the economycontagious disease or by adverse global or national economic conditions generally. Similarly, any inflation in oil prices and any resulting increase in gasoline prices could have a negative impact on demand for our products as a result of consumer and corporate spending reductions.In addition, seasonality may have a negative impact on our production. Due to the typical slower summer manufacturing season in Europe,similar public health crisis, we expect that revenues in the third fiscal quarter of each year willwould be lower than in the other quarters of the year.We depend on a very limited number of sources for our primary raw material and are subject to similar risks of shortages and price fluctuation.The steel that we use to manufacture our precision bearing components is of an extremely high quality and is available from only a limited number of producers on a global basis. Due to quality constraints inas posed by the U.S. steel industry, we obtain substantially all of the steel used in our U.S. operations of our Precision Bearing Components Group from non-U.S. suppliers. In addition, we obtain most of the steel used in our European operations from a single European source. If we had to obtain steel from sources other than our current suppliers, we could face higher prices and automotive costs, increased duties or taxes and shortages of steel. Problems in obtaining steel, particularly 52100 chrome steel in the quantities that we require, on commercially reasonable terms, could increase our costs and have a material adverse effect on our business, prospects, financial condition, results of operations, or cash flows.We depend heavily on a relatively limited number of customers, and the loss of any major customer would have a material adverse effect on our business.Sales to various U.S. and foreign divisions of SKF, one of the largest bearing manufacturers in the world, accounted for approximately 13% of consolidated net sales in 2016. No other customers accounted for more than 10% of sales. During 2016,2021, sales to various U.S. and foreign divisions of our ten largest customers accounted for approximately 48%43% of our consolidated net sales. The loss of all or a substantial portion of sales to these customers would cause us to lose a substantial portion of our revenue and would lower our operating profit margin and cash flows from operations.Work stoppages or similar difficulties and unanticipated business disruptions could significantly disrupt our operations, reduce our revenues and materially affect our earnings.A work stoppage at one or more of our facilities could have a material adverse effect on our business, prospects, financial condition, results of operations, or cash flows. Also, if one or more of our customers were to experience a work stoppage, that customer would likely halt or limit purchases of our products,products. For example, increased demand for semiconductor chips in 2020, due in part to the COVID-19 pandemic and an increased use of laptop computers, 5G phones, gaming systems and other IT equipment that use these chips, has resulted in a severe shortage of chips in early 2021 and is ongoing. These same chips are used in automobiles in a variety of parts and information and entertainment systems. As a result, various automotive manufacturers have been forced to delay or stall new vehicle production. If efforts to address the chip shortage by the industry and the U.S government are unsuccessful, there may be further delays in new vehicle production, which could have a material adverse effect on our business, prospects, financial condition, results of operations, or cash flows.We have a complex network of suppliers, owned and leased manufacturing locations, co-manufacturing locations, distribution networks, and information systems that support our ability to consistently provide our products to our customers. Factors that are hard to predict or beyond our control, such as weather, raw material shortages, natural disasters, fires or explosions, political unrest, terrorism, generalized labor unrest, or health pandemics, such as COVID-19, could damage or disrupt our operations or our customers’, suppliers’, co-manufacturers’ or distributors’ operations. These disruptions may require additional resources to restore our supply chain or distribution network. If we cannot respond to disruptions in our operations, whether by finding alternative suppliers or replacing capacity at key manufacturing or distribution locations, or if we are unable to quickly repair damage to our information, production, or supply systems, we may be late in delivering, or be unable to deliver, products to our customers and may also be unable to track orders, inventory, receivables, and payables. If that occurs, our customers’ confidence in us and long-term demand for our products could decline. Any of these events could materially and adversely affect our product sales, financial condition, and operating results.We operate in and sell products to customers outside the U.S. and are subject to several risks related to doing business internationally.Because weWe obtain a majority of our raw materials from overseas suppliers, actively participate in overseas manufacturing operations and sell to a large number of international customers. During the year ended December 31, 2021, sales to customers located outside of the U.S. accounted for approximately 39% of our consolidated net sales. As a result of doing business internationally, we face risks associated with the following:•changes in tariff regulations, which may make our products more costly to export or import;
Our growth strategy depends in part on companies outsourcing critical components, and if outsourcing does not continue, our business could be adversely affected.
Our growth strategy depends in part on major customers continuing to outsource components and expanding the number of components being outsourced. This requires manufacturers to depart significantly from their traditional methods of operations. If major customers do not continue to expand outsourcing efforts or determine to reduce their use of outsourcing, our ability to grow our business could be materially adversely affected.
Our production capacity has been expanded geographically in recent years to operate in the same markets as our customers.
We have expanded our precision bearing components production facilities and capacity over the last several years. Historically, precision bearing component production facilities have not always operated at full capacity. Over the past several years, we have undertaken steps to address a portion of the capacity risk including closing or ceasing operations at certain plants and downsizing employment levels at others. As such, the risk exists that our customers may exit the geographic markets in which our production capacity is located and/or develop vendors in lower cost countries in which we do not have production capacity.
Recent developments relating to the United Kingdom’s referendum vote in favor of leaving the European Union could adversely affect us.
The United Kingdom held a referendum in June 2016 in which a majority voted for the United Kingdom’s withdrawal from the European Union. As a result of this vote, negotiations are expected to commence to determine the terms of the United Kingdom’s withdrawal from (“Brexit”) the European Union as well as its relationship with the European Union going forward, including the terms of trade between the United Kingdom and the European Union. The effects of Brexit have been and are expected to continue to be far-reaching. Brexit, and the perceptions as to its impact, may adversely affect business activity and economic conditions in Europe and globally and could continue to contribute to instability in global financial and foreign exchange markets. The full effects of Brexit are uncertain and will depend on any agreements the United Kingdom may make to retain access to European Union markets. Lastly, as a result of the Brexit, other countries in the European Union may seek to conduct referenda with respect to their continuing membership with the European Union. Given these possibilities and others we may not anticipate, as well as the lack of comparable precedent, the full extent to which our business, prospects, financial condition, results of operations, or cash flows could be adversely affected by Brexit is uncertain.
Changes in legislation, regulation and government policy as a result of the 2016 U.S. presidential and congressional elections may have a material adverse effect on our business in the future.
The recent presidential and congressional elections in the United States could result in significant changes in, and uncertainty with respect to, legislation, regulation and government policy directly affecting our business or indirectly affecting us because of impacts on our customers and suppliers. Legislative and regulatory proposals discussed during and after the election that could have a material direct or indirect impact on us include, but are not limited to, a disallowance of the deduction for net interest expense, a tax on existing unrepatriated foreign earnings, restrictions on imports and exports, modifications to international trade policy, including withdrawal from trade agreements, environmental regulation, changes to immigration policy, changes to health insurance legislation and the imposition of tariffs and other taxes on imports. We are currently unable to predict whether such changes will occur and, if so, the ultimate impact on our business. To the extent that such changes have a negative impact on us, our suppliers or our customers, including as a result of related uncertainty, these changes may materially and adversely impact our business, prospects, financial condition, results of operations, or cash flows.
We have identifiedmaterialweaknessesin our internalcontrol over financialreporting which could,if not remediated, resultinmaterial misstatements in ourfinancialstatements.
Our management is responsible for establishing and maintaining adequate internal control over financial reporting as defined in Rule 13a-15(f) under the Exchange Act. As disclosed in Item 9A, management identified certain material weaknesses in our internal control over financial reporting. Because of these material weaknesses, our management concluded that we did not maintain effective internal control over financial reporting as of December 31, 2016. With the oversight of senior management and the audit committee, we have begun taking steps to remediate the underlying cause of these material weaknesses and improve the design of controls.
While we expect to take the measures necessary to address the underlying causes of these material weaknesses, we cannot at this time estimate how long it will take and our efforts may not prove to be successful in remediating these material weaknesses. While we have not incurred and do not expect to incur material expenses specifically related to the remediation of these material weaknesses, actual expenses may exceed our current estimates and overall costs of compiling the system and processing documentation necessary to assess the effectiveness of our internal control over financial reporting may be material.
If we are unable to successfully remediate these material weaknesses in our internal control over financial reporting, or identify any additional material weaknesses that may exist, the accuracy and timing of our financial reporting may be adversely affected, we may be unable to maintain compliance with securities law requirements regarding timely filing of periodic reports in addition to applicable stock exchange listing requirements, and our stock price may decline materially as a result, all of which could have a material adverse effect on our business, prospects, financial condition, results of operations, or cash flows.
We have had difficulty with purchase accounting and other aspects related to the accounting for our acquisitions, which resulted in material weaknesses in our internal control over financial reporting. Although we have remediated these material weaknesses, there can be no assurances we will not face similar issues with respect to any future acquisitions.
We have and will continue to incur expenses in relation to our acquisitions and the integration of our acquired companies.
We have and will continue to incur expenses in relation to our acquisitions and the integration of our acquired companies. While we have assumed that a certain level of expenses will be incurred, there are many factors beyond our control that could affect the total amount or the timing of the integration expenses. Moreover, many of the expenses that will be incurred are, by their nature, difficult to estimate accurately. These integration expenses may result in us taking charges against earnings, and the amount of any future charges are uncertain at present.
We may be unable to realize the anticipated cost or capital expenditure savings or may incur additional and/or unexpected costs in order to realize them.
There can be no assurance that we will be able to realize the anticipated cost or capital expenditure savings from our acquisitions in the anticipated amounts or within the anticipated timeframes or at all. We anticipate implementing a series of cost savings initiatives that we expect to result in recurring, annual run-rate cost savings. We expect to incur one-time, non-recurring costs to achieve such synergies, including certain costs during 2015 and 2016. These or any other cost or capital expenditure savings that we realize may differ materially from our estimates. We cannot provide assurances that these anticipated savings will be achieved or that our programs and improvements will be completed as anticipated or at all. In addition, any cost savings that we realize may be offset, in whole or in part, by reductions in revenues or through increases in other expenses.
Our projections and assumptions related to cost savings are based on our current estimates, but they involve risks, uncertainties, projections and other factors that may cause actual results, performance or achievements to be materially different from any future results, performance or achievements, express or implied. Neither our independent auditors nor any other independent auditors, have examined, compiled or performed any procedures with respect to these projections, nor have they expressed any opinion, or any other form of assurance on such information or their achievability. Assumptions relating to our projections involve subjective decisions and judgments with respect to, among other things, the estimated impact of certain operational adjustments, including Six Sigma/OpEx optimization programs, product grouping and rationalization, facility rationalization and shared services cost savings and other cost and savings adjustments, as well as future economic, competitive, industry and market conditions and future business decisions, all of which are inherently uncertain and may be beyond the control of our management.
Failure to realize the expected costs savings and operating synergies related to our acquisitions could result in increased costs and have an adverse effect on our business, prospects, financial condition, results of operations, or cash flows.
Our future results could suffer if we cannot effectively manage our expanded operations, which are significantly larger and more complex following our acquisitions.
As a result of our acquisitions over the past few years, the size and scope of our operations were significantly increased. Our future success depends, in part, upon our ability to manage the expanded operations, which will pose challenges for management, including challenges related to the management and monitoring of new operations and associated increased costs and complexity. We may not have the expertise, experience and resources to pursue or successfully operate all of our businesses at once. The administration of our businesses requires implementation and oversight of appropriate operations, management, compliance and financial reporting systems and controls. We may experience difficulties in effectively implementing and overseeing these and other systems. Such implementation and initial oversight will require the focused attention of our management team, including a significant commitment of its time and resources. The need for management to focus on these matters could have a material and adverse impact on our revenues and operating results. There can be no assurance that we will be successful or that we will realize any operating efficiencies, cost savings, revenue enhancements or other benefits currently anticipated from our acquisitions.
Any divestitures and discontinued operations could negatively impact our business and retained liabilities from businesses that we may sell could adversely affect our financial results.As part of our portfolio management process, we review our operations for businesses which may no longer be aligned with our strategic initiatives and long-term objectives. Divestitures pose risks and challenges that could negatively impact our business, including required separation or carve-out activities and costs, disputes with buyers, or potential impairment charges. We may also dispose of a business at a price or on terms that are less than we had previously anticipated. After reaching an agreement with a buyer for the disposition of a business, we are also subject to satisfaction of pre-closing conditions, as well as necessary regulatory and governmental approvals on acceptable terms, which may prevent us from completing a transaction. Dispositions may also involve continued financial involvement, as we may be required to retain responsibility for, or agree to indemnify buyers against contingent liabilities related to a businesses sold, such as lawsuits, tax liabilities, lease payments, product liability claims, or environmental matters. Under these types of arrangements, performance by the divested businesses or other conditions outside of our control could affect future financial results.General Risk FactorsDamage to our reputation could harm our business, including our competitive position and business prospects.Our ability to attract and retain customers, suppliers, investors, and employees is impacted by our reputation. Harm to our reputation can arise from various sources, including employee misconduct, security breaches, unethical behavior, litigation, or19regulatory outcomes. The consequences of damage to our reputation include, among other things, increasing the number of litigation claims and the size of damages asserted or subjecting us to enforcement actions, fines, and penalties, all of which would cause us to incur significant defense related costs and expenses.Changes in U.S. tax laws could have a material adverse effect on our business, cash flow, results of operations, and financial condition.The U.S. tax laws and regulations, as well as the administrative interpretations of those laws and regulations, are constantly under review and may be changed at any time, possibly with retroactive effect. No assurance can be given as to whether, when, or in what form changes to the U.S. tax laws applicable to us may be enacted. Changes in U.S. tax laws, tax rulings, or interpretations of existing laws could materially affect our business, cash flow, results of operations, and financial condition.Item 1B.Unresolved Staff Comments
None
Precision Bearing Componentsfacilities by segment.
| Country | Owned or Leased | ||||||||||||||||||
| Leased | ||||||||||||||||||||
| Brazil | Leased | |||||||||||||||||||
| U.S.A. | Owned | |||||||||||||||||||
| Leased | ||||||||||||||||||||
| Poland | Owned | |||||||||||||||||||
| Leased | ||||||||||||||||||||
| U.S.A. | Leased | |||||||||||||||||||
| Kentwood, Michigan | Plant 3, Warehouse | U.S.A. | Leased | |||||||||||||||||
| Kentwood, Michigan | Office | U.S.A. | Owned | |||||||||||||||||
| Marnaz, France | Plant | France | Owned | |||||||||||||||||
| Marshall, Michigan | Plant 1 | U.S.A. | Leased | |||||||||||||||||
| Marshall, Michigan | Plant 2 | U.S.A. | Leased | |||||||||||||||||
| Sao Joao da Boa Vista, Brazil | Plant 1 | Brazil | Leased | |||||||||||||||||
| Sao Joao da Boa Vista, Brazil | Plant 2 | Brazil | Leased | |||||||||||||||||
| Wellington, Ohio | Plant 1 | U.S.A. | Leased | |||||||||||||||||
| Wellington, Ohio | Plant 2 | U.S.A. | Leased | |||||||||||||||||
| Wuxi, China | Plant | China | Leased | |||||||||||||||||
Precision Engineered Products
| Country | Owned or Leased | ||||||||||||||||||
| Algonquin, | U.S.A. | Owned | ||||||||||||||||||
| Attleboro, Massachusetts | Plant 1 | U.S.A. | Owned | |||||||||||||||||
| Attleboro, Massachusetts | Plant 2 | U.S.A. | ||||||||||||||||||
| Attleboro, | Owned | |||||||||||||||||||
| Owned | ||||||||||||||||||||
| Leased | ||||||||||||||||||||
| Leased | ||||||||||||||||||||
| Owned | ||||||||||||||||||||
| Mexico | Owned | |||||||||||||||||||
| Owned | ||||||||||||||||||||
| U.S.A. | Leased | |||||||||||||||||||
| Leased | ||||||||||||||||||||
Autocam Precision Components Group
| Country | Owned or Leased | ||||||||||||||||||
Joint Venture
| Plant | ||||||||||||
| ||||||||||||
For more information, please see “Management’s Discussion and Analysis of Financial Condition and Results of Operations — Liquidity and Capital Resources.”
All
Partapplicable.
The following table sets forth the high and low closing sales prices of the common stock, as reported by NASDAQ for our two most recent fiscal years.
| Close Price | ||||||||
| High | Low | |||||||
2016 | ||||||||
First Quarter | $ | 14.90 | $ | 10.58 | ||||
Second Quarter | 19.16 | 12.77 | ||||||
Third Quarter | 18.81 | 13.48 | ||||||
Fourth Quarter | 20.21 | 13.65 | ||||||
2015 | ||||||||
First Quarter | $ | 28.18 | $ | 19.49 | ||||
Second Quarter | 29.86 | 22.50 | ||||||
Third Quarter | 26.97 | 18.29 | ||||||
Fourth Quarter | 19.54 | 12.92 | ||||||
$2.42.
In our Annual Report on Form 10-K for the year ended December 31, 2014, we used the Standard & Poors 500 Stock Index as our broad equity market index and the Machinery Index as our line of business index for our performance graph comparison. However, we have determined that the Standard & Poors SmallCap 600 is a more appropriate broad equity market index because it has more companies that have a market capitalization similar to us. Additionally we have determined that the Peer Group is a more appropriate comparative group than the Machinery Index, as the companies comprising the Peer Group include diversified industrial manufacturers like NN. In light of the diversification of our end markets and the broadening of our portfolio of products, services and solutions over the last two years, primarily due to the acquisitions of Autocam and PEP, we believe the Peer Group is comprised of companies that better reflect our current business.
NN Inc., S&P 500, S&P 600, Value Line Machinery and Peer Group

December 31, 2021)
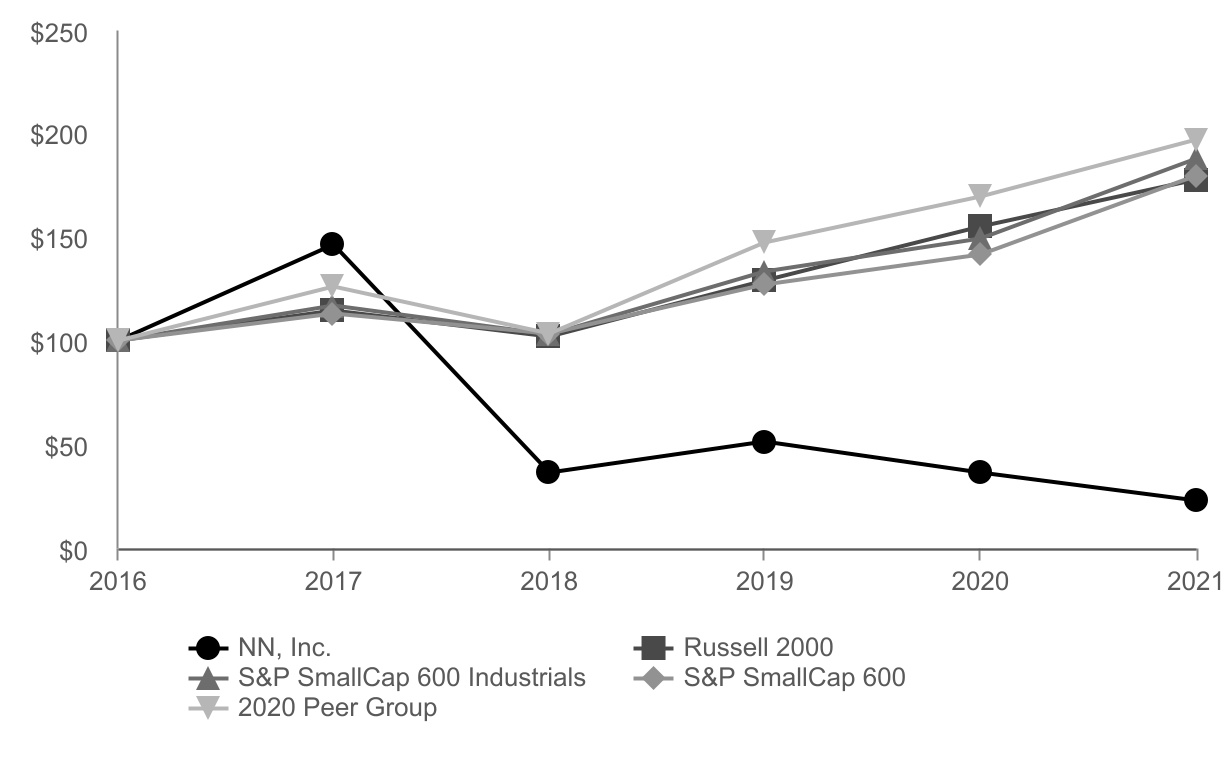
| 2016 | 2017 | 2018 | 2019 | 2020 | 2021 | ||||||||||||||||||||||||||||||
| NN, Inc. | $ | 100.00 | $ | 146.51 | $ | 36.31 | $ | 51.31 | $ | 36.45 | $ | 22.74 | |||||||||||||||||||||||
| Russell 2000 | $ | 100.00 | $ | 114.65 | $ | 102.03 | $ | 129.10 | $ | 155.20 | $ | 177.73 | |||||||||||||||||||||||
| S&P SmallCap 600 Industrials | $ | 100.00 | $ | 117.21 | $ | 102.97 | $ | 133.49 | $ | 149.47 | $ | 188.18 | |||||||||||||||||||||||
| S&P SmallCap 600 | $ | 100.00 | $ | 113.21 | $ | 103.59 | $ | 127.24 | $ | 141.61 | $ | 179.60 | |||||||||||||||||||||||
| 2020 Peer Group | $ | 100.00 | $ | 126.26 | $ | 103.48 | $ | 147.62 | $ | 169.44 | $ | 197.34 | |||||||||||||||||||||||
2016 | Dividend | |||
First Quarter | $ | 0.07 | ||
Second Quarter | $ | 0.07 | ||
Third Quarter | $ | 0.07 | ||
Fourth Quarter | $ | 0.07 | ||
2015 | Dividend | |||
First Quarter | $ | 0.07 | ||
Second Quarter | $ | 0.07 | ||
Third Quarter | $ | 0.07 | ||
Fourth Quarter | $ | 0.07 | ||
The following selected financial data has been derived from our audited financial statements. The selected financial data should be read in conjunction with “Management’s Discussion and Analysis of Financial Condition and Results of Operations” and the audited Consolidated Financial Statements, including the Notes thereto.
| Year ended December 31, | ||||||||||||||||||||
| 2016 | 2015 | 2014 | 2013 | 2012 | ||||||||||||||||
Statement of Income Data: | ||||||||||||||||||||
Net sales | $ | 833,488 | $ | 667,280 | $ | 488,601 | $ | 373,206 | $ | 370,084 | ||||||||||
Cost of products sold (exclusive of depreciation shown separately below) | 621,022 | 525,993 | 384,889 | 295,136 | 294,859 | |||||||||||||||
Selling, general and administrative | 80,266 | 51,745 | 43,756 | 33,281 | 31,561 | |||||||||||||||
Acquisition related costs excluded from selling, general and administrative | — | 11,682 | 9,248 | — | — | |||||||||||||||
Depreciation and amortization | 62,488 | 44,482 | 22,146 | 16,957 | 17,643 | |||||||||||||||
(Gain) loss on disposal of assets | 288 | (687 | ) | — | 5 | (17 | ) | |||||||||||||
Restructuring and integration | 10,024 | 7,268 | 875 | — | 967 | |||||||||||||||
|
|
|
|
|
|
|
|
|
| |||||||||||
Income from operations | 59,400 | 26,797 | 27,687 | 27,827 | 25,071 | |||||||||||||||
Interest expense | 63,154 | 29,899 | 10,895 | 2,374 | 3,878 | |||||||||||||||
Write-off of unamortized debt issuance cost | 3,089 | 18,673 | 1,398 | — | — | |||||||||||||||
Derivative payments on interest rate swap | 609 | — | — | — | — | |||||||||||||||
Derivative losses on change in interest rate swap fair value | 2,448 | — | — | — | — | |||||||||||||||
Other (income) expense, net | (2,591 | ) | 1,175 | 2,222 | 275 | 852 | ||||||||||||||
|
|
|
|
|
|
|
|
|
| |||||||||||
Income before provision (benefit) for income taxes | (7,309 | ) | (22,950 | ) | 13,172 | 25,178 | 20,341 | |||||||||||||
Provision (benefit) for income taxes | (9,313 | ) | (10,518 | ) | 5,786 | 8,000 | (3,927 | ) | ||||||||||||
Share of net income from joint venture | 5,938 | 5,001 | 831 | — | — | |||||||||||||||
|
|
|
|
|
|
|
|
|
| |||||||||||
Net income (loss) | $ | 7,942 | $ | (7,431 | ) | $ | 8,217 | $ | 17,178 | $ | 24,268 | |||||||||
|
|
|
|
|
|
|
|
|
| |||||||||||
Basic income per share: | ||||||||||||||||||||
Net income (loss) | $ | 0.29 | $ | (0.35 | ) | $ | 0.46 | $ | 1.00 | $ | 1.43 | |||||||||
|
|
|
|
|
|
|
|
|
| |||||||||||
Diluted income per share: | ||||||||||||||||||||
Net income (loss) | $ | 0.29 | $ | (0.35 | ) | $ | 0.45 | $ | 1.00 | $ | 1.42 | |||||||||
|
|
|
|
|
|
|
|
|
| |||||||||||
Dividends paid | $ | 0.28 | $ | 0.28 | $ | 0.28 | $ | 0.18 | $ | — | ||||||||||
|
|
|
|
|
|
|
|
|
| |||||||||||
Weighted average number of shares outstanding—Basic | 27,016 | 21,181 | 17,887 | 17,176 | 17,009 | |||||||||||||||
|
|
|
|
|
|
|
|
|
| |||||||||||
Weighted average number of shares outstanding – Diluted | 27,154 | 21,181 | 18,253 | 17,260 | 17,114 | |||||||||||||||
|
|
|
|
|
|
|
|
|
| |||||||||||
Balance Sheet Data: Current assets Current liabilities Total assets Long-term debt Stockholders’ equity As of December 31, 2016 2015 2014 2013 2012 $ 280,555 $ 280,181 $ 242,799 $ 125,674 $ 127,296 138,616 133,351 137,598 69,384 58,758 1,360,386 1,380,567 712,713 262,402 265,343 785,713 795,400 328,026 26,000 63,715 315,199 313,881 173,699 152,760 128,560
The year ended December 31, 2016 reflects fully all the acquisition activity from 2015 and 2014. Line items such as Selling, general and administrative costs, Depreciation and amortization, Restructuring and impairment charges, excluding goodwill impairment, and Interest expense all increased because of increased basis in assets and higher debt and employee levels. There were no acquisitions made during 2016.
The year ended December 31, 2015 was significantly impacted by certain costs related to the PEP Acquisition and to a lesser extent the Caprock acquisition completed in 2015, as well as the issuance of shares of our common stock. The total impact of these costs was $43.0 million (before tax) and $29.4 million (after tax). The balance sheet for the year ended December 31, 2015 includes the impact of these costs. With these acquisitions, we acquired current assets and total assets of $71.2 million and $741.6 million, respectively, and assumed current liabilities and total liabilities of $21.7 million and $111.3 million, respectively.
On July 1, 2015 we closed a registered follow-on offering of public common stock. The total number of shares of common stock sold was approximately 7.6 million at a public offering price of $24.00 per share. The net proceeds received from the offering, after deducting underwriter discounts, commissions and offering expenses, were approximately $173.1 million. Of these proceeds, $148.7 million was used for repayment of principal and interest on existing debt.
On October 19, 2015, concurrent with the PEP Acquisition, we: (i) entered into a new senior secured term loan credit facility in the amount of up to $525.0 million (with a $100.0 million accordion feature) and a seven year maturity (as amended, supplemented and/or restated from time to time, the “Term Loan Credit Facility”); (ii) entered into a new senior secured revolving credit facility in the amount of up to $100.0 million with a five year maturity (as amended, supplement and/or restated from time to time, the “Senior Secured Revolving Credit Facility”, and together with the Term Loan Credit Facility, the “Senior Credit Facilities”); and (iii) issued $300.0 million of 10.25% senior notes due 2020 (the “Senior Notes”). Proceeds from the Term Loan Credit Facility and the Senior Notes were used to finance the purchase price of the PEP Acquisition and pay down debt. The Senior Credit Facilities replaced our existing credit facilities. On November 9, 2015, an incremental term loan of $50.0 million was drawn on the Term Loan Credit Facility, and the proceeds were used to repurchase approximately $50.0 million of the Senior Notes. On September 30, 2016, we amended and restated the Senior Credit Facilities, which lowered the interest rate and rate floor on the Company’s Senior Secured Term Loan B (the “Term Loan B”). The new applicable rate for the Term Loan B is London Inter Bank Offering Rate (“LIBOR”), subject to a 0.75% rate floor, plus 4.25%, which in combination is 75 basis points lower (or 0.75%) than the previous rate. Concurrent with the amended and restated Term Loan B, the Senior Secured Revolving Credit Facility was upsized from $100 million to $133 million. Proceeds were drawn under the Senior Secured Revolving Credit Facility to pay down debt under the Term Loan B, reducing the debt under the Term Loan B to $545 million. During October 2016, an incremental amendment was executed increasing the $133 million Senior Secured Revolving Credit Facility to $143 million. See “Management’s Discussion and Analysis of Financial Condition and Results of Operations” and Note 7 of the Notes to Consolidated Financial Statements for more information. Additional details regarding the financing of the PEP Acquisition may be found in our Current Report on Form 8-K filed with the Securities and Exchange Commission on October 20, 2015.
The year ended December 31, 2014 was significantly impacted by certain costs related to the Autocam acquisition and to a lesser extent the three other acquisitions completed in 2014. The total impact of these costs was $14.8 million (before tax) and $13.6 million (after tax). In addition, related to the Autocam acquisition, we discontinued use of certain trade names and incurred a $0.9 million impairment charge. The balance sheet for the year ended December 31, 2014 includes the impact of four acquisitions closed during 2014. With these acquisitions, we acquired current assets and total assets of $92.9 million and $433.9 million, respectively, and assumed current liabilities and total liabilities of $52.9 million and $124.4 million, respectively. See “Management’s Discussion and Analysis of Financial Condition and Results of Operations” for more information.
The year ended December 31, 2012 was impacted by a favorable tax benefit of a net $7.3 million from removing valuation allowances on deferred tax assets in the U.S. Additionally, results for the year ended December 31, 2012 were negatively impacted by impairments of $1.0 million and after tax foreign exchange losses of $1.1 million related to intercompany notes.
Management generally focuses on these trends and relevant market indicatorsGlobal industrial growth•Trends related to the geographic migration of competitive manufacturing, electric vehicles, and economics;electrification;
•Changes in tariff regulations.23Management generally focuses on the following key indicators of operating performance•Sales growth;
Estimates
Business Combinations. We allocate the total purchase price of the acquired tangible and intangible assets acquired and liabilities assumed based on their estimated fair values as of the business combination date, with the excess purchase price recorded as goodwill. The purchase price allocation process required us to use significant estimates and assumptions, including fair value estimates, as of the business combination date. Although we believe the assumptions and estimates we have made are reasonable and appropriate, they are based in part on historical experience and information obtained from management of the acquired company, in part based on valuation models that incorporate projections of expected future cash flows and operating plans and are inherently uncertain. Valuations are performed by management or third party valuation specialists under management’s supervision. In determining the fair value of assets acquired and liabilities assumed in business combinations, as appropriate, we may use one of the following recognized valuation methods: the income approach (including discounted cash flows from relief from royalty and excess earnings model), the market approach and/or the replacement cost approach.
Examples of significant estimates used to value certain intangible assets acquired include but are not limited to:
However, different assumptions regarding projected performance and other factors associated with the acquired assets may affect the amount recorded under each type of assets and liabilities, mainly between property plant and equipment, intangibles assets, goodwill and deferred income tax liabilities and subsequent assessment could result in future impairment charges. The purchase price allocation process also entails us to refine these estimates over a measurement period not to exceed one year to reflect new information obtained surrounding facts and circumstances existing at acquisition date.
Goodwill and Acquired Intangibles. For new acquisitions, we use estimates, assumptions and appraisals to allocate the purchase price to the assets acquired and to determine the amount of goodwill. These estimates are based on market analyses and comparisons to similar assets. Annual procedures are required to be performed to assess whether recorded goodwill is impaired. The annual tests requireprinciples requires management to make estimates and assumptions with regardabout future events that affect the amounts reported in the financial statements and accompanying notes. Actual results could differ significantly from those estimates. We believe that the following discussion addresses our most critical accounting estimates, which are those that are most important to the futureportrayal of our financial condition and results of operations of its reporting units, and the expected cash flows that they will generate. These estimatesrequire management’s most difficult, subjective, and assumptions could impact the recorded value of assets acquired in a business combination, including goodwill, and whether or not there is any subsequent impairment of the recorded goodwill and the amount of such impairment.
complex judgments.
Generally accepted accounting principles in the U.S. (“GAAP”) prescribes a quantitative two-step process of testing for goodwill impairments. The first step is to determine if the carrying value of the reporting unit with goodwill is less than the related fair value of the reporting unit. We considered three main approaches to value (cost, market and income) the fair value of the reporting unit and market based multiples of earning and sales methods obtained from a grouping of comparable publicly trading companies. We believe this methodology of valuation is consistent with how market participants would value reporting units. The discount rate and market based multiples used are specifically developed for the units tested regarding the level of risk and end markets served. Even though we do use other observable inputs (Level 2 inputs under the GAAP hierarchy), the calculation of fair value for goodwill would be most consistent with Level 3 under the GAAP hierarchy. We conducted tests for goodwill impairment for the years ended December 31, 2016 and 2015 and concluded no impairment of goodwill had occurred.
As of fourth quarter testing, the PEP Acquisition (the “PEP reporting unit”) had an estimated fair value that exceeded the carrying value including goodwill by 4 percent. As of December 31, 2016,2021 and 2020, there was no remaining goodwill of $368.3 million is allocated to the PEP reporting unit. Cash flows from the PEP reporting unit are susceptible to changes in demandbalance due to cyclicality and timingimpairments recognized during the year ended December 31, 2020. An impairment charge was calculated based on a reporting unit’s carrying amount in excess of customer project completions primarily in the electrical and medical markets. Weakened demand in these markets could decrease the estimatedits fair value (i.e., step 1 of the PEP reporting unit. Two of the most critical assumptions used in the calculation of the fair value of the PEP reporting unit are the target market long-term growth rate and the discount rate. Although management believes its estimate of fair value is reasonable, if the PEP reporting unit’s financial performance falls below expectation or there are negative revisions to key assumptions, the Company may be required to recognize antwo-step impairment charge.
test). If the carrying value of the reporting unit including goodwill iswas less than the fair value of the reporting unit, the goodwill iswas not considered impaired. IfReporting units for the carrying value is greater than fair value, then the potential for impairmentpurpose of goodwill exists. The potential impairment is determined by allocatingtesting were the fair value of the reporting unit among the assetssame as our operating segments (Mobile Solutions and liabilities based on a purchase price allocation methodology as if the reporting unit was acquired in a business combination. The fair value of the goodwill is implied from this allocation and compared to the carrying value with an impairment loss recognized if the carrying value is greater than the implied fair value.
Our indefinite lived intangible asset is accounted for similarly to goodwill. This asset is tested for impairment at least annually by comparing the fair value to the carrying value, using the relief from royalty rate method, and if the fair value is less than the carrying value, an impairment charge is recognized for the difference. The indefinite lived intangible asset was impaired during the year ended December 31, 2014, as management is in the process of phasing out the use of the trade name as a result of the Autocam acquisition.
Power Solutions).
Valuation allowances are recorded to reduce deferred tax assets when it is more likely than not that a tax benefit will not be realized. Provision has been made for income taxes on unremitted earnings of certain foreign subsidiaries as these earnings are not deemed to be permanently reinvested. We recognize income tax positions that meet the more likely than not threshold and accrue interest and potential penalties related to unrecognized income tax positions which are recorded as a component of the provision (benefit) for income taxes. We eliminate disproportionate tax effects from accumulated other comprehensive income (loss) when the circumstances upon which they are premised cease to exist.
We did not record a U.S. deferred tax liability for the excess of the book basis over the tax basis of our investments in foreign subsidiaries to the extent the foreign earnings meet the indefinite reversal criteria. As of the year ended December 31, 2016, we consider the unremitted foreign earnings of our foreign subsidiaries to be reinvested indefinitely. We base this assertion on two factors. First, our intention to invest in foreign countries that are strategically important to our Precision Bearing Components Group, Autocam Precision Components Group and customers. With the acquisitions completed in 2015 and 2014, we have expanded our domestic and international base of operations adding subsidiaries in Mexico and China, which will require more foreign investment. Second, we have sufficient access to funds in the U.S. through projected free cash flows and the availability of our credit facilities to fund currently anticipated domestic operational and investment needs. As such, we do not expect unrepatriated foreign earnings to become subject to U.S. taxation.
During
Devaluation2020.
The euro devalued against the U.S. dollar beginning in the latter part of the third quarter of 2014 and accelerated during the fourth quarter of 2014 and into the first quarter of 2015. During these periods, the euro to U.S. dollar dropped from approximately $1.36 in June 2014 to $1.08 in March 2015, representing an approximate 21% decline in value. The exchange rate ranged between $1.08 and $1.12 for the remainder of the 2015. The exchange rates ranged between $1.05 and $1.09 during 2016, with $1.05 being the exchange rate at December 31, 2016. The devaluation of the euro significantly impacted the translation of our euro denominated sales and costs when comparing year over year activity. The euro translation impact, and the translation impact of other currencies, is highlighted below in the overall results as “foreign exchange effects”. In addition to translation effects, the devaluation of the euro impacted the value of certain intercompany loan receivables denominated in euros.
Net Sales

The following table sets forth for the periods indicated selected financial data andpresents the percentage of our net sales represented by each income statement of operations line item presented.
As a Percentageitem.
| Years Ended December 31, | ||||||||||||||||||||
| 2021 | 2020 | 2019 | ||||||||||||||||||
| Net sales | 100.0 | % | 100.0 | % | 100.0 | % | ||||||||||||||
| Cost of sales (exclusive of depreciation and amortization shown separately below) | 81.7 | % | 80.4 | % | 80.2 | % | ||||||||||||||
| Selling, general, and administrative expense | 10.8 | % | 13.6 | % | 14.1 | % | ||||||||||||||
| Depreciation and amortization | 9.7 | % | 10.7 | % | 9.2 | % | ||||||||||||||
| Goodwill impairment | — | % | 21.7 | % | — | % | ||||||||||||||
| Other operating expense (income), net | (0.2) | % | 1.1 | % | 0.2 | % | ||||||||||||||
| Loss from operations | (1.9) | % | (27.5) | % | (3.6) | % | ||||||||||||||
| Interest expense | 2.7 | % | 4.4 | % | 2.7 | % | ||||||||||||||
| Loss on extinguishment of debt and write-off of debt issuance costs | 0.5 | % | — | % | 0.1 | % | ||||||||||||||
| Derivative payments on interest rate swap | 0.4 | % | 1.0 | % | — | % | ||||||||||||||
| Loss on interest rate swap | 0.4 | % | 2.7 | % | — | % | ||||||||||||||
| Other expense (income), net | (1.1) | % | — | % | 0.2 | % | ||||||||||||||
| Loss from continuing operations before benefit (provision) for income taxes and share of net income from joint venture | (4.7) | % | (35.6) | % | (6.6) | % | ||||||||||||||
| Benefit (provision) for income taxes | 0.4 | % | 2.1 | % | (0.1) | % | ||||||||||||||
| Share of net income from joint venture | 1.3 | % | 0.8 | % | 0.3 | % | ||||||||||||||
| Loss from continuing operations | (3.0) | % | (32.6) | % | (6.3) | % | ||||||||||||||
| Income (loss) from discontinued operations, net of tax | 0.3 | % | 9.1 | % | (3.3) | % | ||||||||||||||
| Net loss | (2.8) | % | (23.5) | % | (9.5) | % | ||||||||||||||
For the Year Ended December 31,
| 2016 | 2015 | 2014 | ||||||||||
Net sales | 100.0 | % | 100.0 | % | 100.0 | % | ||||||
Cost of products sold (exclusive of depreciation and amortization shown separately below) | 74.5 | % | 78.8 | % | 78.8 | % | ||||||
Selling, general and administrative | 9.6 | % | 7.8 | % | 9.0 | % | ||||||
Acquisition related costs excluded from selling, general and administrative | 0.0 | % | 1.8 | % | 1.9 | % | ||||||
Depreciation and amortization | 7.5 | % | 6.7 | % | 4.5 | % | ||||||
(Gain) loss on disposal of assets | 0.0 | % | -0.1 | % | 0.0 | % | ||||||
Restructuring and impairment charges | 1.2 | % | 1.1 | % | 0.2 | % | ||||||
|
|
|
|
|
| |||||||
Income from operations | 7.1 | % | 4.0 | % | 5.7 | % | ||||||
Interest expense | 7.6 | % | 4.5 | % | 2.2 | % | ||||||
Write-off of unamortized debt issuance cost | 0.4 | % | 2.8 | % | 0.3 | % | ||||||
Derivative payments (receipts) on interest rate swap | 0.1 | % | 0.0 | % | 0.0 | % | ||||||
Derivative (gains) losses on change in interest rate swap fair value | 0.3 | % | 0.0 | % | 0.0 | % | ||||||
Other expense, net | -0.3 | % | 0.2 | % | 0.5 | % | ||||||
|
|
|
|
|
| |||||||
Income before provision (benefit) for income taxes and share of net income from joint venture | -0.9 | % | -3.4 | % | 2.7 | % | ||||||
Provision (benefit) for income taxes | -1.1 | % | -1.6 | % | 1.2 | % | ||||||
Share of net income (loss) from joint venture, net of tax | 0.7 | % | 0.7 | % | 0.2 | % | ||||||
|
|
|
|
|
| |||||||
Net income (loss) | 1.0 | % | -1.1 | % | 1.7 | % | ||||||
|
|
|
|
|
| |||||||
Sales Concentration
Sales to various U.S. and foreign divisions of SKF, one of the largest bearing manufacturers in the world, accounted for approximately 13% of consolidated net sales in 2016. During 2016, sales to various U.S. and foreign divisions of our ten largest customers accounted for approximately 48% of our consolidated net sales. None of our other customers individually accounted for more than 10% of our consolidated net sales for 2016. The loss of all or a substantial portion of sales to these customers would cause us to lose a substantial portion of our revenue and have a corresponding negative impact on our operating profit margin due to the operational leverage these customers provide. This could lead to sales volumes not being high enough to cover our current cost structure or to provide adequate operating cash flows or cause us to incur additional restructuring and/or impairment costs. Due to a limit on the amount of excess bearing component production capacity in the markets we serve, we believe it would be difficult for any of our top ten customers to take a significant portion of our business away in the short term.
Content
sThe2020
| Years Ended December 31, | ||||||||||||||||||||||||||
| 2021 | 2020 | $ Change | ||||||||||||||||||||||||
| Net sales | $ | 477,584 | $ | 427,534 | $ | 50,050 | ||||||||||||||||||||
| Organic growth | $ | 47,862 | ||||||||||||||||||||||||
| Foreign exchange effects | 2,188 | |||||||||||||||||||||||||
| Cost of sales (exclusive of depreciation and amortization shown separately below) | 389,995 | 343,594 | 46,401 | |||||||||||||||||||||||
| Selling, general, and administrative expense | 51,489 | 58,055 | (6,566) | |||||||||||||||||||||||
| Depreciation and amortization | 46,195 | 45,680 | 515 | |||||||||||||||||||||||
| Goodwill impairment | — | 92,942 | (92,942) | |||||||||||||||||||||||
| Other operating expense (income), net | (1,091) | 4,720 | (5,811) | |||||||||||||||||||||||
| Loss from operations | (9,004) | (117,457) | 108,453 | |||||||||||||||||||||||
| Interest expense | 12,664 | 18,898 | (6,234) | |||||||||||||||||||||||
| Loss on extinguishment of debt and write-off of debt issuance costs | 2,390 | 144 | 2,246 | |||||||||||||||||||||||
| Derivative payments on interest rate swap | 1,717 | 4,133 | (2,416) | |||||||||||||||||||||||
| Loss on interest rate swap | 2,033 | 11,669 | (9,636) | |||||||||||||||||||||||
| Other income, net | (5,366) | (213) | (5,153) | |||||||||||||||||||||||
| Loss from continuing operations before benefit for income taxes and share of net income from joint venture | (22,442) | (152,088) | 129,646 | |||||||||||||||||||||||
| Benefit for income taxes | 1,756 | 8,972 | (7,216) | |||||||||||||||||||||||
| Share of net income from joint venture | 6,261 | 3,626 | 2,635 | |||||||||||||||||||||||
| Loss from continuing operations | (14,425) | (139,490) | 125,065 | |||||||||||||||||||||||
| Income from discontinued operations, net of tax | 1,200 | 38,898 | (37,698) | |||||||||||||||||||||||
| Net loss | $ | (13,225) | $ | (100,592) | $ | 87,367 | ||||||||||||||||||||
| $ | 30,919 | Intangible asset amortization cost related to a acquisition activities and deferred financing costs | ||
| 10,024 | Reorganization and impairment charges | |||
| 4,651 | Acquisition and integration costs | |||
| 3,785 | Write-off of interest rate swap | |||
| 3,089 | Write-off of unamortized debt issuance costs | |||
| (1,219 | ) | Foreign exchange loss on inter-company charges | ||
| (19,773 | ) | Tax effect of identified items | ||
|
| |||
| $ | 31,476 | Total | ||
|
|
OVERALL RESULTS
| Consolidated NN, Inc. Year ended December 31, | ||||||||||||||||
| 2016 | 2015 | Change | ||||||||||||||
Net sales | $ | 833,488 | $ | 667,280 | $ | 166,208 | ||||||||||
Acquisitions | 192,182 | |||||||||||||||
Foreign exchange effects | (5,377 | ) | ||||||||||||||
Sale of a plant | (8,173 | ) | ||||||||||||||
Volume | 1,214 | |||||||||||||||
Price/material inflation pass-through/mix | (13,638 | ) | ||||||||||||||
Cost of products sold (exclusive of depreciation and amortization shown separately below) | 621,022 | 525,993 | 95,029 | |||||||||||||
Acquisitions | 119,157 | |||||||||||||||
Foreign exchange effects | (4,186 | ) | ||||||||||||||
Sale of a plant | (6,375 | ) | ||||||||||||||
Volume | (1,255 | ) | ||||||||||||||
Cost reduction projects | (12,312 | ) | ||||||||||||||
Selling, general and administrative | 80,266 | 51,745 | 28,521 | |||||||||||||
Acquisitions | 15,514 | |||||||||||||||
Foreign exchange effects | (352 | ) | ||||||||||||||
Integration related costs | 2,984 | |||||||||||||||
Infrastructure and staffing costs | 10,375 | |||||||||||||||
Acquisition related costs excluded from selling, general and administrative | — | 11,682 | (11,682 | ) | ||||||||||||
Depreciation and amortization | 62,488 | 44,482 | 18,006 | |||||||||||||
Acquisitions | 16,979 | |||||||||||||||
Foreign exchange effects | (328) | |||||||||||||||
Increase in expense | 1,355 | |||||||||||||||
Restructuring and impairment charges | 10,024 | 7,268 | 2,756 | |||||||||||||
(Gain)/Loss on disposal of assets | 288 | (687 | ) | 975 | ||||||||||||
|
|
|
|
|
| |||||||||||
Income from operations | 59,400 | 26,797 | 32,603 | |||||||||||||
Interest expense | 63,154 | 29,899 | 33,255 | |||||||||||||
Write-off of unamortized debt issuance cost | 3,089 | 18,673 | (15,584 | ) | ||||||||||||
Derivative payments (receipts) on interest rate swap | 609 | — | 609 | |||||||||||||
Derivative (gains) losses on change in interest rate swap fair value | 2,448 | — | 2,448 | |||||||||||||
Other (income) expense, net | (2,591 | ) | 1,175 | (3,766 | ) | |||||||||||
|
|
|
|
|
| |||||||||||
Income (loss) before provision (benefit) for income taxes and share of net income from joint venture | (7,309 | ) | (22,950 | ) | 15,641 | |||||||||||
Provision (benefit) expense for income taxes | (9,313 | ) | (10,518 | ) | 1,205 | |||||||||||
Share of net income from joint venture | 5,938 | 5,001 | 937 | |||||||||||||
|
|
|
|
|
| |||||||||||
Net income | $ | 7,942 | $ | (7,431 | ) | $ | 15,373 | |||||||||
|
|
|
|
|
| |||||||||||
Net Sales.Net sales increased during 20162021, compared to 2015the year ended December 31, 2020, primarily due to sales from PEP businesshigher demand within all markets that was acquiredwere negatively impacted by the COVID-19 pandemic in the fourth quarterprior year and favorable foreign exchange effects of 2015. Partially offsetting these$2.2 million. In addition, sales were positively impacted by increased selling prices for precious metals allowed under customer contracts due to the sharp rise in underlying commodities costs compared with the year ended December 31, 2020.
| Years Ended December 31, | ||||||||||||||
| 2021 | 2020 | |||||||||||||
| Interest on debt | $ | 10,800 | $ | 7,714 | ||||||||||
| Interest rate swap settlements | 77 | 8,906 | ||||||||||||
| Amortization of debt issuance costs and discount | 1,381 | 1,702 | ||||||||||||
| Capitalized interest | (300) | (204) | ||||||||||||
| Other | 706 | 780 | ||||||||||||
| Total interest expense | $ | 12,664 | $ | 18,898 | ||||||||||
CostNotes to Consolidated Financial Statements describes the effective income tax rate for each period presented.
Selling, General and Administrative. Much of the increase during 2016 was due to the selling, general and administrative costs from the acquired PEP business. Additionally, administrative costs were incurred for infrastructure and staffing costs related to our strategic initiatives.
Acquisition related costs excluded from selling, general and administrative. Acquisition related costs are third party legal, accounting, valuation consulting and investment banking advisory fees incurred directly related to the PEP Acquisition and the Caprock acquisition in 2015.
Depreciation and Amortization. The increase in 2016 was primarily due to depreciation and amortization from the acquired PEP business. This additional depreciation and amortization includes the related step-ups of certain property, plant and equipment to fair value and the addition of intangible assets principally for customer relationships and trade names related to the purchase price allocation of the new acquisitions.
Interest expense. Interest expense increased in 2016 from the interest on the debt we undertook to complete the PEP Acquisition and the Caprock acquisition.
Write-off of unamortized debt issuance costs. Write-off of debt issuance costs was incurred due to the refinancing of debt in both 2016 and 2015.
Joint Venture.
Share of net income fromProvision for Income Taxes. From a dollar standpoint, the provision for both periods was a Benefit of $9.3$94.8 million and $10.5$68.2 million for the years ended December 31, 20162021 and 2015,2020, respectively. However,Additionally, profits improved from expanding variable margins as a percentage basis,result of successful process improvement initiatives, improved product mix, and fixed cost reduction actions.
RESULTS BY SEGMENT
PRECISION BEARING COMPONENTS GROUP
| Year ended December 31, | ||||||||||||||||
| 2016 | 2015 | Change | ||||||||||||||
Net sales | $ | 248,534 | $ | 261,837 | $ | (13,303 | ) | |||||||||
Foreign exchange effects | (2,287) | |||||||||||||||
Volume | (5,795) | |||||||||||||||
Price/material inflation pass-through/mix | (5,221) | |||||||||||||||
Income from operations | $ | 22,985 | $ | 26,310 | $ | (3,325 | ) | |||||||||
|
|
|
|
|
| |||||||||||
Content
s| Years Ended December 31, | |||||||||||||||||||||||
| 2021 | 2020 | $ Change | |||||||||||||||||||||
| Net sales | $ | 285,863 | $ | 256,360 | $ | 29,503 | |||||||||||||||||
| Organic growth | $ | 27,649 | |||||||||||||||||||||
| Foreign exchange effects | 1,854 | ||||||||||||||||||||||
| Income from operations | $ | 9,039 | $ | 5,228 | $ | 3,811 | |||||||||||||||||
The decrease in income from operations was consistent with the decrease in net sales, and an increase in restructuring charges related to personnel reductions of $4.4 million.
PRECISION ENGINEERED PRODUCTS GROUP
| Year ended December 31, | ||||||||||||||||
| 2016 | 2015 | Change | ||||||||||||||
Net sales | $ | 258,816 | $ | 77,183 | $ | 181,633 | ||||||||||
Acquisition | 174,176 | |||||||||||||||
Sale of a plant | (2,298) | |||||||||||||||
Price/material inflation pass-through/mix | 9,755 | |||||||||||||||
Income from operations | $ | 34,744 | $ | (3,718 | ) | $ | 38,462 | |||||||||
|
|
|
|
|
| |||||||||||
The increase in net sales and income from operations was due primarily to the acquisition of PEP and the sale of Delta Rubber infavorable foreign exchange effects. In the fourth quarter of 2015.
AUTOCAM PRECISION COMPONENTS GROUP
| Year ended December 31, | ||||||||||||||||
| 2016 | 2015 | Change | ||||||||||||||
Net sales | $ | 326,138 | $ | 328,260 | $ | (2,122 | ) | |||||||||
Volume | 6,995 | |||||||||||||||
Foreign exchange effects | (3,090) | |||||||||||||||
Price/material inflation pass-through/mix | (6,027) | |||||||||||||||
Income from operations | $ | 29,516 | $ | 31,700 | $ | (2,184 | ) | |||||||||
|
|
|
|
|
| |||||||||||
The decrease2021, we recognized a customer pricing settlement.
The decrease in income from operations was consistent with the decrease in net sales andprior year due to restructuring chargesthe COVID-19 pandemic (such as travel, benefits, and overtime hours), material and labor inflation, and variable cost inefficiencies associated with global supply chain interruptions and uneven customer ordering patterns, particularly in 2016 related to our Wheeling plant closure of $4.3 million.
Year Ended December 31, 2015 Compared to the Year Ended December 31, 2014.
Theautomotive market.
| Years Ended December 31, | |||||||||||||||||||||||
| 2021 | 2020 | $ Change | |||||||||||||||||||||
| Net sales | $ | 191,800 | $ | 171,269 | $ | 20,531 | |||||||||||||||||
| Organic growth | $ | 20,197 | |||||||||||||||||||||
| Foreign exchange effects | 334 | ||||||||||||||||||||||
| Goodwill impairment | $ | — | $ | (92,942) | $ | 92,942 | |||||||||||||||||
| Income (loss) from operations | $ | 6,493 | $ | (85,983) | $ | 92,476 | |||||||||||||||||
| $ | 11,682 | Third party legal, accounting, valuation consulting and investment banking advisory fees, which are reported in acquisition related costs excluded from selling, general and administrative | ||
| 4,300 | Inventory purchase price adjustment related to the PEP Acquisition reported in cost of products sold | |||
| 5,202 | Intangible asset amortization cost related to a backlog purchase price adjustment reported in depreciation and amortization | |||
| 18,673 | Debt issuance costs related to credit facilities refinanced as part of the PEP Acquisition, reported as write-off of debt issuance costs | |||
| 3,368 | Integration costs related to acquisitions reported in cost of products sold | |||
| (15,129 | ) | Tax effect of identified items | ||
|
| |||
| $ | 28,096 | Total | ||
|
|
OVERALL RESULTS
| Consolidated NN, Inc. | ||||||||||||||||
| Year ended December 31, | ||||||||||||||||
| 2015 | 2014 | Change | ||||||||||||||
Net sales | $ | 667,280 | $ | 488,601 | $ | 178,679 | ||||||||||
Acquisitions | 212,463 | |||||||||||||||
Foreign exchange effects | (39,086 | ) | ||||||||||||||
Volume | 10,159 | |||||||||||||||
Price/material infation pass-through/mix | (4,857 | ) | ||||||||||||||
Cost of products sold (exclusive of depreciation and amortization shown separately below) | 525,993 | 384,889 | 141,104 | |||||||||||||
Acquisitions | 163,482 | |||||||||||||||
Foreign exchange effects | (33,673 | ) | ||||||||||||||
Volume | 7,631 | |||||||||||||||
Price/material infation pass-through/mix | (3,861 | ) | ||||||||||||||
Acquisition integration costs and inventory step-up | 7,525 | |||||||||||||||
Selling, general and administrative | 51,745 | 43,756 | 7,989 | |||||||||||||
Acquisitions | 12,455 | |||||||||||||||
Foreign exchange effects | (2,408 | ) | ||||||||||||||
Other | (2,058 | ) | ||||||||||||||
Acquisition related costs excluded from selling, general and administrative | 11,682 | 9,248 | 2,434 | |||||||||||||
Depreciation and amortization | 44,482 | 22,146 | 22,336 | |||||||||||||
Acquisitions | 22,430 | |||||||||||||||
Foreign exchange effects | (1,283 | ) | ||||||||||||||
Increase in expense | 1,189 | |||||||||||||||
Restructuring and impairment charges | 7,268 | 875 | 6,393 | |||||||||||||
(Gain)/Loss on disposal of assets | (687 | ) | — | (687 | ) | |||||||||||
|
|
|
|
|
| |||||||||||
Income from operations | 26,797 | 27,687 | (890 | ) | ||||||||||||
Interest expense | 29,899 | 10,895 | 19,004 | |||||||||||||
Write-off of unamortized debt issuance cost | 18,673 | 1,398 | 17,275 | |||||||||||||
Other (income) expense, net | 1,175 | 2,222 | (1,047 | ) | ||||||||||||
|
|
|
|
|
| |||||||||||
Income (loss) before provision (benefit) for income taxes and share of net income from joint venture | (22,950 | ) | 13,172 | (36,122 | ) | |||||||||||
Provision (benefit) expense for income taxes | (10,518 | ) | 5,786 | (16,304 | ) | |||||||||||
Share of net income from joint venture | 5,001 | 831 | 4,170 | |||||||||||||
|
|
|
|
|
| |||||||||||
Net income | $ | (7,431 | ) | $ | 8,217 | $ | (15,648 | ) | ||||||||
|
|
|
|
|
| |||||||||||
Net Sales Net sales increased during 2015 compared to 2014 principallyyear ended December 31, 2020, primarily due to sales from the companies acquired in 2014 and 2015. Threehigher demand within our end markets, all of the four companies acquired during 2014which were acquired subsequent to the first half of 2014 and two were acquired during 2015. Additionally, sales growth came from overall volume growth in the markets we serve, from new sales programs with existing customers and sales with new customers in each of these geographic markets. Partially offsetting these increases was the impact of devaluation of the euro on euro denominated sales, as discussed above.
Cost of Products Sold (exclusive of depreciation and amortization shown separately below). Cost of products sold was primarilynegatively impacted by the addition of production costs added withCOVID-19 pandemic in the 2015 and 2014 acquisitions, as discussed above. Additionally, the total wasprior year. Sales were positively impacted by increased production costs at those units that experienced higher sales volumes, as discussed above. Finally, we incurred $7.5 million of costs directly related to acquisitions and integrations and specifically $4.3 million related to a step-up in value of inventory of an acquired company and $3.3 million related to integration costs. Partially offsetting these increases was the impact of devaluation of the euro on euro denominated costs, as discussed above.
Selling, General and Administrative. The majority of the increase during 2015 wasselling prices for precious metals allowed under customer contracts due to the selling, general and administrativesharp rise in underlying commodities costs carried over from the companies acquired in 2015 and 2014.
Acquisition related costs excluded from selling, general and administrative. Acquisition related costs are third party legal, accounting, valuation consulting and investment banking advisory fees incurred directly relatedcompared to the PEP Acquisition andyear ended December 31, 2020. In addition, revenue increased during the Caprock acquisition in 2015, and Autocam acquisition and our other acquisitions in 2014.
Depreciation and Amortization. The increase in 2015 wasfourth quarter of 2021 due to depreciation and amortizationprices increases with certain customers.
Interest expense. Interest expense increased in 20152020. In addition, income from the interest on the debt we undertook to complete our acquisitions.
Write-off of unamortized debt issuance costs. Write-off of debt issuance costsoperations increased due to the refinancingabove-noted higher sales volume. These favorable impacts were partially offset by an adverse shift in sales mix; higher material costs as a result of acquisitionsinflation; operating inefficiencies in both 2015our aerospace, defense, and 2014.
Provision for Income Taxes. The 2015 effective tax ratemedical business; and the reintroduction of 46% is consistent withemployee-related costs suspended in the 2014 effective rate of 44%. Both rates are impacted by non-deductible mergers and acquisition cost.
RESULTS BY SEGMENT
PRECISION BEARING COMPONENTS GROUP
| Year ended December 31, | ||||||||||||||||
| 2015 | 2014 | Change | ||||||||||||||
Net sales | $ | 261,837 | $ | 278,026 | $ | (16,189 | ) | |||||||||
Foreign exchange effects | (33,914 | ) | ||||||||||||||
Acquisition | 7,753 | |||||||||||||||
Volume | 11,501 | |||||||||||||||
Price/material infation pass-through/mix | (1,529 | ) | ||||||||||||||
Income from operations | $ | 26,310 | $ | 31,872 | $ | (5,562 | ) | |||||||||
|
|
|
|
|
| |||||||||||
Net sales decreased from 2014 to 2015 principallyprior year due to the impact of devaluation of the euro on euro denominated sales,COVID-19 pandemic, such as discussed above. Partially offsetting the unfavorable foreign exchange effects was greater demand for our products in the North American, Asiantravel, benefits and European automotive and general industrial markets. This greater demand was from market share gains with our customers and from winning business with new customers. Additionally, sales increased with the addition of the companies the segment acquired subsequent to the first half of 2014.
Segment income from operations was unfavorably impacted by $3.3 million due to the depreciation in value of Euro denominated income from operations relative to the U.S. Dollar. Additionally, the segment incurred $1.8 million in restructuring costs related to reduce headcount at certain European plants.
PRECISION ENGINEERED PRODUCTS GROUP
| Year ended December 31, | ||||||||||||||||
| 2015 | 2014 | Change | ||||||||||||||
Net sales | $ | 77,183 | $ | 33,351 | $ | 43,832 | ||||||||||
Acquisition | 44,742 | |||||||||||||||
Price/material infation pass-through/mix | (910 | ) | ||||||||||||||
Income from operations | $ | (3,718 | ) | $ | 1,231 | $ | (4,949 | ) | ||||||||
|
|
|
|
|
| |||||||||||
The Precision Engineered Products Group includes the Plastic and Rubber Components Segment as presented in previous filings. The name of this segment was changed during 2015 after the PEP Acquisition and disposal of Delta Rubber. The increase in sales was primarily due to the acquisition of Caprock during the second quarter of 2015 and the PEP Acquisition in the fourth quarter of 2015. Loss from operations was primarily due to increased depreciation and amortization related to the PEP Acquisition. Specifically included in income from operations was $4.3 million related to a step-up in value of inventory of an acquired company, a charge of $5.2 million related to amortizing a large portion of a backlog intangible asset of an acquired company and $1.6 million of acquisition and integration costs directly attributable to acquisitions within the segment.
AUTOCAM PRECISION COMPONENTS GROUP
| Year ended December 31, | ||||||||||||||||
| 2015 | 2014 | Change | ||||||||||||||
Net sales | $ | 328,260 | $ | 177,224 | $ | 151,036 | ||||||||||
Acquisition | 159,168 | |||||||||||||||
Volume | (1,383 | ) | ||||||||||||||
Foreign exchange effects | (5,172 | ) | ||||||||||||||
Price/material inflation pass-through/mix | (1,577 | ) | ||||||||||||||
Income from operations | $ | 31,700 | $ | 15,732 | $ | 15,968 | ||||||||||
|
|
|
|
|
| |||||||||||
The increased sales from 2014 to 2015 were due to sales added with the acquisition during 2014. The increase in income from operations was primarily from the companies acquired in 2014 partially offset by $2.6 million in restructuring costs related to the Wheeling Plant closure.
overtime hours.
2021
From December 31, 2016 to December 31, 2015, our2021, total liabilities decreased $21.5 million. The majorityincreased by $35.4 million, primarily due to the refinancing of our credit facilities, partially offset by the termination of the decrease was from the utilization of deferred tax and payment on current tax, amortization of debt issuance costs and payments on long term debt.
Working capital, which consists principally of accounts receivable and inventories offset by accounts payable and current maturities of long-term debt, was $141.9 million at December 31, 2016 and $146.8 for 2015. It remained relative consistent with the increase in accounts receivable and payment of taxes, offset by reductions in accounts payable and reclassification of deferred taxes.
ineffective interest rate swap.
year ended December 31, 2021.
Cash used in financing activities was $24.3 million for 2016 compared with cash provided by financing activities of $611.9 million in 2015. The difference was primarily related obtaining financing for 2015 acquisitions compared to a year of debt repayments in 2016. 2020.
the Life Sciences business.
Amounts
Our
Based on the outstanding balance at December 31, 2016, the annual interest payments would have been $27.3 million.
Our Senior Notes require us to pay annual interest of 10.25% payable semi-annually in arrears on May 1 and November 1 of each year. Based on the outstanding balance at December 31, 2016, the annual interest payments would have been $25.6 million.
Our Senior Secured Revolving Credit Facility requires us to pay interest rate ofone-month LIBOR plus an applicable margin of 3.50%6.875%. Based on the outstanding balanceinterest rate in effect at December 31, 2016,2021, and the fixed rate on the 2021 interest rate swap, annual interest payments would have been $1.1be approximately $11.9 million.
on the first $60.0 million of variable rate debt attributable to changes in benchmark one-month LIBOR interest rates. Refer to Note 19 in the Notes to Consolidated Financial Statements
for further discussion about the interest rate swap.Certain of our businesses experience seasonal and other trends related to the industries and end markets that they serve. However, as a whole, we are not subject to material seasonality.
shipment. We invoice and receive payment from many of our customers in euros as well asvarious other currencies. Additionally, we are party to various third party and intercompany loans, payables, and receivables denominated in currencies other than the U.S. dollar. As a result of these sales, loans, payables, and receivables, ourwe are exposed to foreign exchange transaction and translation risk has increased.risk. Various strategies to manage this risk are available to management, including producing and selling in local currencies and hedging programs. As of December 31, 2016,2021, no currency hedgesderivatives were in place. In addition, a strengthening of the U.S. dollar and/or euro against foreign currencies could impair our ability to compete with international competitors for foreign as well as domestic sales.
For the next twelve months, we expect capital expenditures to remain relatively consistent, the majority
The table below sets forth our contractual obligations and commercial commitments as of December 31, 2016:
| Payments Due by Period | ||||||||||||||||||||
Certain Contractual Obligations | Total | Less than 1 year | 1-3 years | 3-5 years | After 5 years | |||||||||||||||
Long-term debt including current portion | $ | 825,090 | $ | 12,751 | $ | 11,936 | $ | 285,591 | $ | 514,812 | ||||||||||
Expected interest payments | 254,908 | 54,030 | 106,632 | 73,571 | 20,675 | |||||||||||||||
Operating leases | 31,272 | 7,824 | 12,615 | 7,684 | 3,149 | |||||||||||||||
Capital leases | 9,024 | 3,955 | 4,201 | 868 | — | |||||||||||||||
|
|
|
|
|
|
|
|
|
| |||||||||||
Total contractual cash obligations | $ | 1,120,294 | $ | 78,560 | $ | 135,384 | $ | 367,714 | $ | 538,636 | ||||||||||
|
|
|
|
|
|
|
|
|
| |||||||||||
There are $4.7 million of long-term post-employment benefits, the payment of which depends on various factors including the date of the employee’s termination. Based on the best available information, we believe the vast majority of these payments will be made after 5 years.
We have approximately $5.8 million in unrecognized tax benefits and related penalties and interest accrued within the liabilities section of our balance sheet. We are unsure when or if at all these amounts might be paid to U.S. and/or foreign taxing authorities. Accordingly, these amounts have been excluded from the table above. (See Note 13 of the Notes to the Consolidated Financial Statements).
Content
salso its functional currency.
Off-Balance Sheet Arrangements
We are not a party to any off-balance sheet arrangements that have, or are reasonably likely to have, a material current or future effect on our financial condition, revenues or expenses, results of operations, liquidity, capital expenditures or capital resources.
Inflation and Changes in Prices
The cost base of our operations has been materially affected by steel inflation during recent years. Due to the ability to pass on this steel inflation to our customers the overall financial impact has been minimized. The prices for steel, engineered resins and other raw materials which we purchase are subject to material change. Our typical pricing arrangements with steel suppliers are subject to adjustment every three to six months in the U.S. and annually in Europe for base prices but quarterly for scrap surcharge adjustments. In the past, we have been able to minimize the impact on our operations resulting from the steel price fluctuations by adjusting selling prices to our customers periodically in the event of changes in our raw material costs.
| Page | ||||||||
Reports of Independent Registered Public Accounting Firm (PCAOB ID: 248) | ||||||||
Report of Independent Registered Public Accounting Firm (PCAOB ID: 238) | ||||||||
To the Contents
In our opinion, (a Delaware corporation) and subsidiaries (the “Company”) as of December 31, 2021, based on our audits andcriteria established in the report2013
As discussed in Note 1 to the consolidatedopinion.
reporting
Charlotte, North Carolina
NN, Inc.
December 31, 2016 and 2015
(In thousands,2020, except per share data)
(in thousands, except per share data) | ||||||||
| 2016 | 2015 | |||||||
Assets | ||||||||
Current assets: | ||||||||
Cash | $ | 14,405 | $ | 15,087 | ||||
Accounts receivable, net | 139,547 | 123,005 | ||||||
Inventories | 114,851 | 119,836 | ||||||
Income tax receivable | — | 3,989 | ||||||
Current deferred tax assets | — | 6,696 | ||||||
Other current assets | 11,752 | 11,568 | ||||||
|
|
|
| |||||
Total current assets | 280,555 | 280,181 | ||||||
Property, plant and equipment, net | 322,953 | 318,968 | ||||||
Goodwill, net | 450,311 | 449,898 | ||||||
Intangible assets, net | 255,981 | 282,169 | ||||||
Non-current deferred tax assets | — | 742 | ||||||
Investment in joint venture | 40,694 | 38,462 | ||||||
Other non-current assets | 9,892 | 10,147 | ||||||
|
|
|
| |||||
Total assets | $ | 1,360,386 | $ | 1,380,567 | ||||
|
|
|
| |||||
Liabilities and Stockholders’ Equity | ||||||||
Current liabilities: | ||||||||
Accounts payable | $ | 75,719 | $ | 69,101 | ||||
Accrued salaries, wages and benefits | 24,996 | 21,125 | ||||||
Income taxes payable | 2,125 | 5,350 | ||||||
Current maturities of long-term debt | 12,751 | 11,714 | ||||||
Current portion of obligation under capital lease | 3,762 | 4,786 | ||||||
Other current liabilities | 19,263 | 21,275 | ||||||
|
|
|
| |||||
Total current liabilities | 138,616 | 133,351 | ||||||
Non-current deferred tax liabilities | 99,591 | 117,459 | ||||||
Long-term debt, net of current portion | 785,713 | 795,400 | ||||||
Accrued post-employment benefits | 5,765 | 6,157 | ||||||
Obligation under capital lease, net of current portion | 5,851 | 9,573 | ||||||
Other | 9,651 | 4,746 | ||||||
|
|
|
| |||||
Total liabilities | 1,045,187 | 1,066,686 | ||||||
Commitments and Contingencies (Note 15) | ||||||||
Stockholders’ equity: | ||||||||
Common stock—$0.01 par value, authorized 45,000 shares, issued and outstanding 27,249 in 2016 and 26,849 in 2015 | 272 | 269 | ||||||
Additional paid-in capital | 284,508 | 277,582 | ||||||
Retained earnings | 55,509 | 55,151 | ||||||
Accumulated other comprehensive income | (25,122 | ) | (19,153 | ) | ||||
Non-controlling interest | 32 | 32 | ||||||
|
|
|
| |||||
Total stockholders’ equity | 315,199 | 313,881 | ||||||
|
|
|
| |||||
Total liabilities and stockholders’ equity | $ | 1,360,386 | $ | 1,380,567 | ||||
|
|
|
| |||||
See accompanying notesfor the effect of discontinued operations discussed in Note 2 to the consolidated financial statements,
as to which the date is March 15, 2021, and except for the 2019 summarized financial information of the unconsolidated joint venture in Note 9 to the consolidated financial statements, as to which the date is March 11, 2022.
Years ended December 31, 2016, 2015 and 2014
(In thousands, except per share data)
(in thousands, except per share data) | 2016 | 2015 | 2014 | |||||||||
Net sales | $ | 833,488 | $ | 667,280 | $ | 488,601 | ||||||
Cost of products sold (exclusive of depreciation and amortization shown separately below) | 621,022 | 525,993 | 384,889 | |||||||||
Selling, general and administrative | 80,266 | 51,745 | 43,756 | |||||||||
Acquisition related costs excluded from selling, general and administrative | — | 11,682 | 9,248 | |||||||||
Depreciation and amortization | 62,488 | 44,482 | 22,146 | |||||||||
(Gain) loss on disposal of assets | 288 | (687 | ) | — | ||||||||
Restructuring and integration | 10,024 | 7,268 | 875 | |||||||||
|
|
|
|
|
| |||||||
Income from operations | 59,400 | 26,797 | 27,687 | |||||||||
Interest expense | 63,154 | 29,899 | 10,895 | |||||||||
Write-off of unamortized debt issuance costs | 3,089 | 18,673 | 1,398 | |||||||||
Derivative payments on interest rate swap | 609 | — | — | |||||||||
Derivative losses on change in interest rate swap fair value | 2,448 | — | — | |||||||||
Other (income) expense, net | (2,591 | ) | 1,175 | 2,222 | ||||||||
|
|
|
|
|
| |||||||
Income (loss) before provision (benefit) for income taxes and share of net income from joint venture | (7,309 | ) | (22,950 | ) | 13,172 | |||||||
Provision (benefit) expense for income taxes | (9,313 | ) | (10,518 | ) | 5,786 | |||||||
Share of net income from joint venture | 5,938 | 5,001 | 831 | |||||||||
|
|
|
|
|
| |||||||
Net income (loss) | $ | 7,942 | $ | (7,431 | ) | $ | 8,217 | |||||
|
|
|
|
|
| |||||||
Other comprehensive income (loss): | ||||||||||||
Change in fair value of interest rate hedge | 3,015 | (2,584 | ) | (431 | ) | |||||||
Foreign currency translation gain (loss) | (8,984 | ) | (21,936 | ) | (17,731 | ) | ||||||
|
|
|
|
|
| |||||||
Other comprehensive income (loss) | (5,969 | ) | (24,520 | ) | (18,162 | ) | ||||||
|
|
|
|
|
| |||||||
Comprehensive income (loss) | $ | 1,973 | $ | (31,951 | ) | $ | (9,945 | ) | ||||
|
|
|
|
|
| |||||||
Basic income per share: | ||||||||||||
Net income | $ | 0.29 | $ | (0.35 | ) | $ | 0.46 | |||||
|
|
|
|
|
| |||||||
Weighted average shares outstanding | 27,016 | 21,181 | 17,887 | |||||||||
|
|
|
|
|
| |||||||
Diluted income per share: | ||||||||||||
Net income | $ | 0.29 | $ | (0.35 | ) | $ | 0.45 | |||||
|
|
|
|
|
| |||||||
Weighted average shares outstanding | 27,154 | 21,181 | 18,253 | |||||||||
|
|
|
|
|
| |||||||
Cash dividends per common share | $ | 0.28 | $ | 0.28 | $ | 0.28 | ||||||
|
|
|
|
|
| |||||||
| Years Ended December 31, | ||||||||||||||||||||
| (in thousands, except per share data) | 2021 | 2020 | 2019 | |||||||||||||||||
| Net sales | $ | 477,584 | $ | 427,534 | $ | 489,514 | ||||||||||||||
| Cost of sales (exclusive of depreciation and amortization shown separately below) | 389,995 | 343,594 | 392,482 | |||||||||||||||||
| Selling, general, and administrative expense | 51,489 | 58,055 | 68,895 | |||||||||||||||||
| Depreciation and amortization | 46,195 | 45,680 | 44,896 | |||||||||||||||||
| Restructuring and integration expense, net | — | — | (12) | |||||||||||||||||
| Goodwill impairment | — | 92,942 | — | |||||||||||||||||
| Other operating expense (income), net | (1,091) | 4,720 | 846 | |||||||||||||||||
| Loss from operations | (9,004) | (117,457) | (17,593) | |||||||||||||||||
| Interest expense | 12,664 | 18,898 | 13,030 | |||||||||||||||||
| Loss on extinguishment of debt and write-off of debt issuance costs | 2,390 | 144 | 540 | |||||||||||||||||
| Derivative payments on interest rate swap | 1,717 | 4,133 | — | |||||||||||||||||
| Loss on interest rate swap | 2,033 | 11,669 | — | |||||||||||||||||
| Other expense (income), net | (5,366) | (213) | 962 | |||||||||||||||||
| Loss from continuing operations before benefit (provision) for income taxes and share of net income from joint venture | (22,442) | (152,088) | (32,125) | |||||||||||||||||
| Benefit (provision) for income taxes | 1,756 | 8,972 | (305) | |||||||||||||||||
| Share of net income from joint venture | 6,261 | 3,626 | 1,681 | |||||||||||||||||
| Loss from continuing operations | (14,425) | (139,490) | (30,749) | |||||||||||||||||
| Income (loss) from discontinued operations, net of tax (Note 2) | 1,200 | 38,898 | (15,992) | |||||||||||||||||
| Net loss | $ | (13,225) | $ | (100,592) | $ | (46,741) | ||||||||||||||
| Other comprehensive income (loss): | ||||||||||||||||||||
| Reclassification adjustment for discontinued operations | $ | — | $ | 5,961 | $ | — | ||||||||||||||
| Foreign currency translation loss | (1,135) | (1,683) | (3,845) | |||||||||||||||||
| Interest rate swap: | ||||||||||||||||||||
| Change in fair value, net of tax | 59 | (12,443) | (10,479) | |||||||||||||||||
| Reclassification adjustment for losses included in net loss, net of tax | 2,906 | 18,987 | 1,084 | |||||||||||||||||
| Other comprehensive income (loss) | $ | 1,830 | $ | 10,822 | $ | (13,240) | ||||||||||||||
| Comprehensive loss | $ | (11,395) | $ | (89,770) | $ | (59,981) | ||||||||||||||
| Basic net loss per common share: | ||||||||||||||||||||
| Loss from continuing operations per common share | $ | (0.82) | $ | (3.60) | $ | (0.75) | ||||||||||||||
| Income (loss) from discontinued operations per common share | 0.03 | 0.92 | (0.38) | |||||||||||||||||
| Net loss per common share | $ | (0.79) | $ | (2.68) | $ | (1.13) | ||||||||||||||
| Weighted average common shares outstanding | 44,011 | 42,199 | 42,030 | |||||||||||||||||
| Diluted net loss per common share: | ||||||||||||||||||||
| Loss from continuing operations per common share | $ | (0.82) | $ | (3.60) | $ | (0.75) | ||||||||||||||
| Income (loss) from discontinued operations per common share | 0.03 | 0.92 | (0.38) | |||||||||||||||||
| Net loss per common share | $ | (0.79) | $ | (2.68) | $ | (1.13) | ||||||||||||||
| Weighted average common shares outstanding | 44,011 | 42,199 | 42,030 | |||||||||||||||||
Consolidated Financial Statements.
| December 31, | ||||||||||||||
| (in thousands, except per share data) | 2021 | 2020 | ||||||||||||
| Assets | ||||||||||||||
| Current assets: | ||||||||||||||
| Cash and cash equivalents | $ | 28,656 | $ | 48,138 | ||||||||||
| Accounts receivable, net | 71,419 | 84,615 | ||||||||||||
| Inventories | 75,027 | 62,517 | ||||||||||||
| Income tax receivable | 11,808 | 8,800 | ||||||||||||
| Other current assets | 9,372 | 11,148 | ||||||||||||
| Total current assets | 196,282 | 215,218 | ||||||||||||
| Property, plant and equipment, net | 209,105 | 223,690 | ||||||||||||
| Operating lease right-of-use assets | 46,443 | 50,264 | ||||||||||||
| Intangible assets, net | 88,718 | 103,065 | ||||||||||||
| Investment in joint venture | 34,045 | 26,983 | ||||||||||||
| Deferred tax assets | 314 | — | ||||||||||||
| Other non-current assets | 4,194 | 5,742 | ||||||||||||
| Total assets | $ | 579,101 | $ | 624,962 | ||||||||||
| Liabilities, Preferred Stock, and Stockholders’ Equity | ||||||||||||||
| Current liabilities: | ||||||||||||||
| Accounts payable | $ | 36,710 | $ | 37,435 | ||||||||||
| Accrued salaries, wages and benefits | 17,739 | 21,296 | ||||||||||||
| Income tax payable | 2,072 | 3,557 | ||||||||||||
| Current maturities of long-term debt | 3,074 | 4,885 | ||||||||||||
| Current portion of operating lease liabilities | 5,704 | 4,797 | ||||||||||||
| Other current liabilities | 8,718 | 31,261 | ||||||||||||
| Total current liabilities | 74,017 | 103,231 | ||||||||||||
| Deferred tax liabilities | 7,456 | 11,178 | ||||||||||||
| Long-term debt, net of current portion | 151,052 | 79,025 | ||||||||||||
| Operating lease liabilities, net of current portion | 51,295 | 55,053 | ||||||||||||
| Other non-current liabilities | 17,289 | 17,237 | ||||||||||||
| Total liabilities | 301,109 | 265,724 | ||||||||||||
| Commitments and contingencies (Note 13) | 0 | 0 | ||||||||||||
| Series D perpetual preferred stock - $0.01 par value per share, 65 shares authorized, issued and outstanding at December 31, 2021 | 53,807 | — | ||||||||||||
| Series B convertible preferred stock - $0.01 par value per share, 100 shares authorized, issued and outstanding at December 31, 2020 | — | 105,086 | ||||||||||||
| Stockholders’ equity: | ||||||||||||||
| Common stock - $0.01 par value per share, 90,000 shares authorized, 42,686 and 43,027 shares issued and outstanding at December 31, 2020 and 2021, respectively | 430 | 427 | ||||||||||||
| Additional paid-in capital | 474,757 | 493,332 | ||||||||||||
| Accumulated deficit | (219,100) | (205,875) | ||||||||||||
| Accumulated other comprehensive loss | (31,902) | (33,732) | ||||||||||||
| Total stockholders’ equity | 224,185 | 254,152 | ||||||||||||
| Total liabilities, preferred stock, and stockholders’ equity | $ | 579,101 | $ | 624,962 | ||||||||||
Years ended December 31, 2016, 2015 and 2014
(In thousands)
| Common Stock | Accumulated | |||||||||||||||||||||||||||
| Number | Additional | other | Non- | |||||||||||||||||||||||||
| of | Par | paid in | Retained | comprehensive | controlling | |||||||||||||||||||||||
| (in thousands of dollars and shares) | shares | value | capital | earnings | income | interest | Total | |||||||||||||||||||||
Balance, December 31, 2013 | 17,630 | $ | 176 | $ | 63,126 | $ | 65,929 | $ | 23,529 | $ | — | $ | 152,760 | |||||||||||||||
Net income | — | — | — | 8,217 | — | — | 8,217 | |||||||||||||||||||||
Dividends declared | — | — | — | (5,131 | ) | — | — | (5,131 | ) | |||||||||||||||||||
Stock option expense | — | — | 1,274 | — | — | — | 1,274 | |||||||||||||||||||||
Shares issued for option exercises | 152 | 2 | 1,669 | — | — | — | 1,671 | |||||||||||||||||||||
Shares issued for acquisition | 1,087 | 11 | 31,706 | — | — | — | 31,717 | |||||||||||||||||||||
Restricted stock compensation expense | 114 | 1 | 1,320 | — | — | — | 1,321 | |||||||||||||||||||||
Non-controlling interest | — | — | — | — | — | 32 | 32 | |||||||||||||||||||||
Foreign currency translation loss | — | — | — | — | (17,731 | ) | — | (17,731 | ) | |||||||||||||||||||
Change in fair value of interest rate hedge | — | — | — | — | (431 | ) | — | (431 | ) | |||||||||||||||||||
|
|
|
|
|
|
|
|
|
|
|
|
|
| |||||||||||||||
Balance, December 31, 2014 | 18,983 | $ | 190 | $ | 99,095 | $ | 69,015 | $ | 5,367 | $ | 32 | $ | 173,699 | |||||||||||||||
Net loss | — | — | — | (7,431 | ) | — | — | (7,431 | ) | |||||||||||||||||||
Dividends declared | — | — | — | (6,433 | ) | — | — | (6,433 | ) | |||||||||||||||||||
Stock option expense | — | — | 915 | — | — | — | 915 | |||||||||||||||||||||
Shares issued for option exercises | 179 | 2 | 2,039 | — | — | — | 2,041 | |||||||||||||||||||||
Shares issued in public offering | 7,590 | 76 | 172,976 | — | — | — | 173,052 | |||||||||||||||||||||
Restricted stock compensation expense | 115 | 1 | 2,788 | — | — | — | 2,789 | |||||||||||||||||||||
Restricted shares forgiven for taxes | (18 | ) | — | (231 | ) | — | — | — | (231 | ) | ||||||||||||||||||
Foreign currency translation loss | — | — | — | — | (21,936 | ) | — | (21,936 | ) | |||||||||||||||||||
Change in fair value of interest rate hedge | — | — | — | — | (2,584 | ) | — | (2,584 | ) | |||||||||||||||||||
|
|
|
|
|
|
|
|
|
|
|
|
|
| |||||||||||||||
Balance, December 31, 2015 | 26,849 | $ | 269 | $ | 277,582 | $ | 55,151 | $ | (19,153 | ) | $ | 32 | $ | 313,881 | ||||||||||||||
Net income | — | — | — | 7,942 | — | — | 7,942 | |||||||||||||||||||||
Dividends paid | — | — | — | (7,584 | ) | — | — | (7,584 | ) | |||||||||||||||||||
Stock option expense | — | — | 687 | — | — | — | 687 | |||||||||||||||||||||
Shares issued for option exercises | 270 | 3 | 2,829 | — | — | — | 2,832 | |||||||||||||||||||||
Restricted and performance based stock compensation expense | 142 | — | 3,583 | — | — | — | 3,583 | |||||||||||||||||||||
Restricted shares forgiven for taxes and forfeited | (12 | ) | — | (173 | ) | — | — | — | (173 | ) | ||||||||||||||||||
Foreign currency translation loss | — | — | — | — | (8,984 | ) | — | (8,984 | ) | |||||||||||||||||||
Change in fair value of interest rate swap | — | — | — | — | 3,015 | — | 3,015 | |||||||||||||||||||||
|
|
|
|
|
|
|
|
|
|
|
|
|
| |||||||||||||||
Balance, December 31, 2016 | 27,249 | $ | 272 | $ | 284,508 | $ | 55,509 | $ | (25,122 | ) | $ | 32 | $ | 315,199 | ||||||||||||||
|
|
|
|
|
|
|
|
|
|
|
|
|
| |||||||||||||||
| Common Stock | Accumulated deficit | Accumulated other comprehensive income (loss) | ||||||||||||||||||||||||||||||||||||||||||
| (in thousands) | Number of shares | Par value | Additional paid-in capital | Warrants | Total | |||||||||||||||||||||||||||||||||||||||
| Balance, December 31, 2018 | 42,104 | $ | 421 | $ | 508,655 | $ | — | $ | (58,491) | $ | (31,314) | $ | 419,271 | |||||||||||||||||||||||||||||||
| Net loss | — | — | — | — | (46,741) | — | (46,741) | |||||||||||||||||||||||||||||||||||||
| Dividends declared or accrued for common stock | — | — | (8,933) | — | — | — | (8,933) | |||||||||||||||||||||||||||||||||||||
| Dividends accrued for preferred stock | — | — | (642) | — | — | — | (642) | |||||||||||||||||||||||||||||||||||||
| Shares issued for option exercises | 5 | — | 21 | — | — | — | 21 | |||||||||||||||||||||||||||||||||||||
| Share-based compensation expense | 248 | 2 | 3,931 | — | — | — | 3,933 | |||||||||||||||||||||||||||||||||||||
| Restricted shares forgiven for taxes | (44) | — | (365) | — | — | — | (365) | |||||||||||||||||||||||||||||||||||||
| Change in estimate of share-based award vesting | — | — | (1,052) | — | — | — | (1,052) | |||||||||||||||||||||||||||||||||||||
| Proceeds from issuance of warrants | — | — | — | 1,076 | — | — | 1,076 | |||||||||||||||||||||||||||||||||||||
| Change in fair value of interest rate swap, net of tax of $3,166 | — | — | — | — | — | (10,479) | (10,479) | |||||||||||||||||||||||||||||||||||||
| Reclassification of interest rate swap settlement to net loss, net of tax of $327 | — | — | — | — | — | 1,084 | 1,084 | |||||||||||||||||||||||||||||||||||||
| Foreign currency translation loss | — | — | — | — | — | (3,845) | (3,845) | |||||||||||||||||||||||||||||||||||||
| Adoption of new accounting standard | — | — | — | — | (51) | — | (51) | |||||||||||||||||||||||||||||||||||||
| Balance, December 31, 2019 | 42,313 | $ | 423 | $ | 501,615 | $ | 1,076 | $ | (105,283) | $ | (44,554) | $ | 353,277 | |||||||||||||||||||||||||||||||
| Net loss | — | — | — | — | (100,592) | — | (100,592) | |||||||||||||||||||||||||||||||||||||
| Dividends accrued for preferred stock | — | — | (12,373) | — | — | — | (12,373) | |||||||||||||||||||||||||||||||||||||
| Share-based compensation expense | 417 | 4 | 4,965 | — | — | — | 4,969 | |||||||||||||||||||||||||||||||||||||
| Restricted shares forgiven for taxes | (44) | — | (157) | �� | — | — | (157) | |||||||||||||||||||||||||||||||||||||
| Change in estimate of share-based award vesting | — | — | (718) | — | — | — | (718) | |||||||||||||||||||||||||||||||||||||
| Reclassification of warrants to liabilities (Note 19) | — | — | — | (1,076) | — | — | (1,076) | |||||||||||||||||||||||||||||||||||||
| Change in fair value of interest rate swap, net of tax of $3,764 | — | — | — | — | — | (12,443) | (12,443) | |||||||||||||||||||||||||||||||||||||
| Reclassification of interest rate swap settlement to net loss, net of tax of $5,742 | — | — | — | — | — | 18,987 | 18,987 | |||||||||||||||||||||||||||||||||||||
| Foreign currency translation loss | — | — | — | — | — | (1,683) | (1,683) | |||||||||||||||||||||||||||||||||||||
| Sale of discontinued operations | — | — | — | — | — | 5,961 | 5,961 | |||||||||||||||||||||||||||||||||||||
| Balance, December 31, 2020 | 42,686 | $ | 427 | $ | 493,332 | $ | — | $ | (205,875) | $ | (33,732) | $ | 254,152 | |||||||||||||||||||||||||||||||
| Net loss | — | — | — | — | (13,225) | — | (13,225) | |||||||||||||||||||||||||||||||||||||
| Dividends accrued for preferred stock | — | — | (21,478) | — | — | — | (21,478) | |||||||||||||||||||||||||||||||||||||
| Shares issued for option exercises | 6 | — | 48 | — | — | — | 48 | |||||||||||||||||||||||||||||||||||||
| Share-based compensation expense | 387 | 4 | 3,835 | — | — | — | 3,839 | |||||||||||||||||||||||||||||||||||||
| Restricted shares forgiven for taxes | (52) | (1) | (362) | — | — | — | (363) | |||||||||||||||||||||||||||||||||||||
| Change in estimate of share-based award vesting | — | — | (618) | — | — | — | (618) | |||||||||||||||||||||||||||||||||||||
| Change in fair value of interest rate swap, net of tax of $19 | — | — | — | — | — | 59 | 59 | |||||||||||||||||||||||||||||||||||||
| Reclassification of interest rate swap settlement to net loss, net of tax of $879 | — | — | — | — | — | 2,906 | 2,906 | |||||||||||||||||||||||||||||||||||||
| Foreign currency translation loss | — | — | — | — | — | (1,135) | (1,135) | |||||||||||||||||||||||||||||||||||||
| Balance, December 31, 2021 | 43,027 | $ | 430 | $ | 474,757 | $ | — | $ | (219,100) | $ | (31,902) | $ | 224,185 | |||||||||||||||||||||||||||||||
Consolidated Financial Statements.
Years ended
| Year Ended December 31, | ||||||||||||||||||||
| (in thousands) | 2021 | 2020 | 2019 | |||||||||||||||||
| Cash flows from operating activities | ||||||||||||||||||||
| Net loss | $ | (13,225) | $ | (100,592) | $ | (46,741) | ||||||||||||||
| Adjustments to reconcile net loss to net cash provided by operating activities: | ||||||||||||||||||||
| Depreciation and amortization of continuing operations | 46,195 | 45,680 | 44,896 | |||||||||||||||||
| Depreciation and amortization of discontinued operations | — | 35,731 | 46,950 | |||||||||||||||||
| Amortization of debt issuance costs and discount | 1,381 | 15,692 | 4,789 | |||||||||||||||||
| Goodwill impairment of continuing operations | — | 92,942 | — | |||||||||||||||||
| Goodwill impairment of discontinued operations | — | 146,757 | — | |||||||||||||||||
| Other impairments | — | 4,148 | 643 | |||||||||||||||||
| Loss on extinguishment of debt and write-off of debt issuance costs | 2,390 | 1,532 | 3,293 | |||||||||||||||||
| Total derivative loss (gain), net of cash settlements | (3,259) | 15,309 | — | |||||||||||||||||
| Share of net income from joint venture | (6,261) | (3,626) | (1,681) | |||||||||||||||||
| Gain on disposal of discontinued operations, net of tax and cost to sell | (1,200) | (233,824) | — | |||||||||||||||||
| Compensation expense from issuance of share-based awards | 3,216 | 4,226 | 2,822 | |||||||||||||||||
| Deferred income taxes | (4,845) | (21,697) | (3,142) | |||||||||||||||||
| Other | (2,611) | (4,730) | 3,169 | |||||||||||||||||
| Changes in operating assets and liabilities: | ||||||||||||||||||||
| Accounts receivable | 13,698 | 10,831 | 1,265 | |||||||||||||||||
| Inventories | (12,959) | 5,114 | 1,426 | |||||||||||||||||
| Accounts payable | 343 | (8,606) | (7,900) | |||||||||||||||||
| Income taxes receivable and payable, net | (4,516) | (633) | (5,292) | |||||||||||||||||
| Other | (2,761) | 11,295 | 4,711 | |||||||||||||||||
| Net cash provided by operating activities | 15,586 | 15,549 | 49,208 | |||||||||||||||||
| Cash flows from investing activities | ||||||||||||||||||||
| Acquisition of property, plant and equipment | (18,221) | (23,773) | (54,003) | |||||||||||||||||
| Proceeds from liquidation of short-term investment | — | — | 8,000 | |||||||||||||||||
| Proceeds from (cash paid for post-closing adjustments on) sale of business, net of cash sold | (3,880) | 743,178 | — | |||||||||||||||||
| Proceeds from sale of property, plant, and equipment | 1,418 | 3,317 | 7,287 | |||||||||||||||||
| Cash settlements of interest rate swap | (15,420) | (4,133) | — | |||||||||||||||||
| Other | — | 695 | (711) | |||||||||||||||||
| Net cash provided by (used in) investing activities | (36,103) | 719,284 | (39,427) | |||||||||||||||||
| Cash flows from financing activities | ||||||||||||||||||||
| Cash paid for debt issuance costs | (7,360) | (661) | (11,336) | |||||||||||||||||
| Dividends paid | — | — | (8,879) | |||||||||||||||||
| Proceeds from issuance of preferred stock | 61,793 | — | 95,741 | |||||||||||||||||
| Redemption of preferred stock | (122,434) | — | — | |||||||||||||||||
| Proceeds from long-term debt | 171,000 | 66,195 | 54,209 | |||||||||||||||||
| Repayments of long-term debt | (93,729) | (776,331) | (108,157) | |||||||||||||||||
| Repayments of short-term debt, net | (1,563) | (924) | (12,564) | |||||||||||||||||
| Other | (5,150) | (3,133) | (3,715) | |||||||||||||||||
| Net cash provided by (used in) financing activities | 2,557 | (714,854) | 5,299 | |||||||||||||||||
| Effect of exchange rate changes on cash flows | (1,522) | (3,544) | (1,365) | |||||||||||||||||
| Net change in cash and cash equivalents | (19,482) | 16,435 | 13,715 | |||||||||||||||||
| Cash and cash equivalents at beginning of period (1) | 48,138 | 31,703 | 17,988 | |||||||||||||||||
| Cash and cash equivalents at end of period (1) | $ | 28,656 | $ | 48,138 | $ | 31,703 | ||||||||||||||
| Supplemental schedule of non-cash operating, investing and financing activities: | ||||||||||||||||||||
| Non-cash additions to property, plant and equipment | 4,438 | 9,644 | 23,281 | |||||||||||||||||
| Supplemental disclosures: | ||||||||||||||||||||
| Cash paid for interest | $ | 10,739 | $ | 51,542 | $ | 50,514 | ||||||||||||||
| Cash paid for income taxes | 7,624 | 2,241 | 6,428 | |||||||||||||||||
(In thousands)
(in thousands of dollars) | 2016 | 2015 | 2014 | |||||||||
Cash flows from operating activities: | ||||||||||||
Net income | $ | 7,942 | $ | (7,431 | ) | $ | 8,217 | |||||
Adjustments to reconcile net income to net cash provided by operating activities: | ||||||||||||
Depreciation and amortization | 62,488 | 44,482 | 22,146 | |||||||||
Amortization of debt issuance costs | 4,168 | 1,754 | 844 | |||||||||
Interest rate swap: | ||||||||||||
Total derivative losses (gains), net | 2,563 | — | — | |||||||||
Debt issuance costs write-off | 3,089 | 18,673 | 1,398 | |||||||||
Joint venture net income in excess of cash received | (2,232 | ) | (3,672 | ) | (831 | ) | ||||||
(Gain) loss on disposals of property, plant and equipment | 288 | (687 | ) | — | ||||||||
Allowance for doubtful accounts | 142 | 745 | 208 | |||||||||
Compensation expense from issuance of restricted stock and incentive stock options | 4,270 | 3,704 | 2,595 | |||||||||
Deferred income tax benefit | (10,430 | ) | (16,878 | ) | (1,333 | ) | ||||||
Restructuring and impairment charges | ||||||||||||
Changes in operating assets and liabilities: | ||||||||||||
Accounts receivable | (18,505 | ) | (1,343 | ) | (3,283 | ) | ||||||
Inventories | 4,377 | (1,843 | ) | (9,836 | ) | |||||||
Other current assets | (269 | ) | (944 | ) | (1,624 | ) | ||||||
Other non-current assets | 1,833 | (1,501 | ) | (4,828 | ) | |||||||
Accounts payable | 7,633 | (6,748 | ) | 9,497 | ||||||||
Other liabilities | 1,946 | 4,999 | 7,538 | |||||||||
|
|
|
|
|
| |||||||
Net cash provided by operating activities | 69,303 | 33,310 | 30,708 | |||||||||
|
|
|
|
|
| |||||||
Cash flows from investing activities: | ||||||||||||
Acquisition of property, plant and equipment | (43,820 | ) | (38,553 | ) | (27,602 | ) | ||||||
Proceeds from measurement period adjustments to previous acquisition | 1,635 | — | — | |||||||||
Proceeds from disposals of property, plant and equipment | 839 | 2,995 | 1,374 | |||||||||
Cash paid to acquire businesses, net of cash received | — | (628,281 | ) | (257,664 | ) | |||||||
Capital contributions to joint venture | — | (1,999 | ) | — | ||||||||
Dividend received from joint venture | — | — | 2,284 | |||||||||
|
|
|
|
|
| |||||||
Net cash used by investing activities | (41,346 | ) | (665,838 | ) | (281,608 | ) | ||||||
|
|
|
|
|
| |||||||
Cash flows from financing activities: | ||||||||||||
Debt issue costs paid | (3,952 | ) | (35,189 | ) | (9,380 | ) | ||||||
Dividends Paid | (7,584 | ) | (6,433 | ) | (5,131 | ) | ||||||
Proceeds from long-term debt | — | 885,000 | 344,750 | |||||||||
Repayment of long-term debt | (30,000 | ) | (401,438 | ) | (40,880 | ) | ||||||
Proceeds from short-term debt, net | 18,544 | (84 | ) | 359 | ||||||||
Proceeds from shares issued | 2,832 | 173,052 | — | |||||||||
Proceeds from issuance of stock and exercise of stock options | — | 2,041 | 1,671 | |||||||||
Payment for acquisition of non-controlling interest | — | — | (2,528 | ) | ||||||||
Principal payments on capital lease | (4,148 | ) | (5,098 | ) | (1,888 | ) | ||||||
|
|
|
|
|
| |||||||
Net cash provided by (used in) financing activities | (24,308 | ) | 611,851 | 286,973 | ||||||||
|
|
|
|
|
| |||||||
Effect of exchange rate changes on cash flows | (4,331 | ) | (1,553 | ) | (1,795 | ) | ||||||
Net change in cash and cash equivalents | (682 | ) | (22,230 | ) | 34,278 | |||||||
Cash and cash equivalents at beginning of year | 15,087 | 37,317 | 3,039 | |||||||||
|
|
|
|
|
| |||||||
Cash and cash equivalents at end of year | $ | 14,405 | $ | 15,087 | $ | 37,317 | ||||||
|
|
|
|
|
| |||||||
Supplemental schedule of non-cash operating, investing and financing activities: | ||||||||||||
Compensation expense for stock awards, ($2,285 in 2016, $2,399 in 2015, and $1,321 in 2014) stock option expense ($825 in 2016, $915 in 2015, and $1,274 in 2014), performance based stock units ($1,159 in 2016, $393 in 2015) included in stockholders’ equity | $ | 4,270 | $ | 3,704 | $ | 2,595 | ||||||
Shares issued in acquisition of Autocam | $ | — | $ | — | $ | 37,717 | ||||||
Restructuring charges in Other Liabilities | $ | 283 | $ | 4,362 | $ | 875 | ||||||
Cash paid for interest and income taxes: | ||||||||||||
Interest | $ | 59,158 | $ | 20,146 | $ | 8,307 | ||||||
Income taxes | $ | 889 | $ | 6,377 | $ | 5,747 | ||||||
December 31, 2018, respectively.
Consolidated Financial Statements.
December 31, 2016, 2015 and 2014
(In thousands, except per share data)
Included We have 31 facilities in North America, Europe, South America, and Asia.
AllU.S. dollar amounts presented in the tables that followin these Notes to Consolidated Financial Statements are in thousands (except for share data) unless otherwise indicated.
We consider all highly liquid investments with an original maturitythousands.
Inventories are stated at the lower of cost or net realizable value. Cost is determined using the average cost method which approximates the first in first out method. Our policy is to expense abnormal amounts of idle facility expense, freight, handling cost, and waste included in cost of products sold. In addition, we allocate fixed production overheads based on the normal production capacity of our facilities. Inventory valuations were developed using normalized production capacities for each of our manufacturing locations and the costs from excess capacity or under-utilization of fixed production overheads were expensed in the period incurred and are not included as a component of inventory valuation.
Inventories also include tools, molds and dies in progress that we are producing and will ultimately sell to our customers. This activity is principally related to our Autocam Precision Components and Precision Engineered Products Groups. These inventories are carried at the lower of cost or net realizable value.
Property, plant and equipment are stated at cost less accumulated depreciation. Assets to be disposed of are stated at lower of depreciated cost or fair market value less estimated selling costs. Expenditures for maintenance and repairs are charged to expense as incurred. Major renewals and betterments are capitalized. When a property item is retired, its cost and related accumulated depreciation are removed from the property accounts and any gain or loss is recorded in the consolidated Statements of Operations and comprehensive income. We review the carrying values of long-lived assets for impairment whenever events or changes in circumstances indicate the carrying amount of an asset may not be recoverable. Property, plant and equipment includes tools, molds and dies principally used in our Autocam Precision Components and Precision Engineered Products Groups that are our property.
Depreciation is provided on the straight-line method over the estimated useful lives of the depreciable assets for financial reporting purposes. For leasehold improvements and buildings under capital lease, we depreciate these over the shorter of useful lives or the lease term. In the event we abandon and cease to use certain property, plant, and equipment, depreciation estimates are revised and, in most cases, depreciation expense will be accelerated to reflect the shortened useful life of the asset.
We recognize revenues based on the stated shipping terms with customers when these terms are satisfied and the risks of ownership are transferred to the customers. We have an inventory management program for certain Precision Bearing Components Group customers whereby revenue is recognized when products are used by customers from consigned stock, rather than at the time of shipment. Under both circumstances, revenue is recognized when persuasive evidence of an arrangement exists, delivery has occurred, the sellers’ price is fixed and determinable and collectability is reasonably assured.
Accounts receivable are recorded upon recognition of a sale of goods and ownership and risk of loss is assumed by the customer. Substantially all of our accounts receivable are due primarily from the core served markets. In establishing allowances for doubtful accounts, we perform credit evaluations of our customers, considering numerous inputs when available including the customers’ financial position, past payment history, relevant industry trends, cash flows, management capability, historical loss experience and economic conditions and prospects. Accounts receivable are written off or allowances established when considered to be uncollectible or at risk of being uncollectible, respectively.
Income taxes are accounted for under the asset and liability method. Deferred tax assets and liabilities are recognized for the future tax consequences attributable to differences between the financial statement carrying amounts of existing assets and liabilities and their respective tax bases and operating loss and tax credit carry forwards. Deferred tax assets and liabilities are measured using enacted tax rates expected to apply to taxable income in the years in which those temporary differences are expected to be recovered or settled. The effect on deferred tax assets and liabilities of a change in tax rates is recognized in income in the period that includes the enactment date. Valuation allowances are recorded to reduce deferred tax assets when it is more likely than not that a tax benefit will not be realized. Provision has not been made for income taxes on unremitted earnings of foreign subsidiaries as these earnings are deemed to be permanently reinvested. We recognize income tax positions that meet the more likely than not threshold and accrue interest and potential penalties related to unrecognized income tax positions which are recorded as a component of the provision (benefit) for income taxes.
Basic income per share reflects reported earnings divided by the weighted average number of common shares outstanding. Diluted income per share include the effect of dilutive stock options and the respective tax benefits, unless inclusion would not be dilutive.
The cost of stock options, stock awards and performance based stock units are expensed as compensation expense over the vesting periods based on the fair value at the grant date. (See Note 9 of the Notes to the Consolidated Financial Statements) We use the Black Scholes financial pricing model for our stock options, and a Monte Carlo simulation for the performance based stock units to determine the fair value as these awards as they are not traded in open markets.
We account for stock awards by recognizing compensation expense ratably over the vesting period as specified in the award. Compensation expense to be recognized is based on the stock price at date of grant.
Consolidation
Assets and liabilities of our foreign subsidiaries are translated at current exchange rates, while revenue, costs and expenses are translated at average rates prevailing during each reporting period. Translation adjustments arising from the translation of foreign subsidiary financial statements are reported as a component of other comprehensive income and accumulated other comprehensive income within stockholders’ equity. In addition, transactions denominated in foreign currencies, including intercompany transactions, are initially recorded at the current exchange rate at the date of the transaction. The balances are adjusted to the current exchange rate as of each balance sheet date and as of the date when the transaction is consummated. Transaction gains or losses, excluding intercompany loan transactions, are expensed in either cost of products sold or selling, general and administrative lines in the Consolidated Statements of Operations and Comprehensive Income (Loss) as incurred and were immaterial to the years ended December 31, 2016, 2015 and 2014. Transaction gains or losses on intercompany loan transactions are recognized in the other income, net line in the Consolidated Statements of Operations and Comprehensive Income (Loss) as incurred.
We recognize the excess of the purchase price of an acquired entity over the fair value of the net identifiable assets as goodwill. Goodwill is tested for impairment on an annual basis as of October 1 and between annual tests if a triggering event occurs. The impairment procedures are performed at the reporting unit level for the reporting units that have goodwill. In September 2011, the FASB issued a revised accounting standard, intended to reduce the cost and complexity of the annual goodwill impairment test by providing entities an option to perform a “qualitative” assessment to determine whether further impairment testing is necessary. Specifically, an entity has the option to first assess qualitative factors to determine whether it is necessary to perform the current two-step test. If an entity believes, as a result of its qualitative assessment, that it is more-likely-than-not that the fair value of a reporting unit is less than its carrying amount, the quantitative impairment test is required. Otherwise, no further testing is required. For the years ended, December 31, 2016 and 2015, we determined it was more appropriate to perform a full step 1 goodwill test. The decision to perform a qualitative assessment or a complete step 1 analysis is an annual decision made by management. Based on the results of the step 1 analysis fair value of the reporting units exceeded the carrying value of the reporting units at December 31, 2016 and 2015.
If the qualitative assessment indicates it is more likely than not that the fair value is less than the carrying value, GAAP prescribes a two-step process for testing for goodwill impairments. The first step is to determine if the carrying value of the reporting unit with goodwill is less than the related fair value of the reporting unit. We consider three main approaches to value (cost, market and income) the fair value of the reporting unit and market based multiples of earning and sales methods obtained from a grouping of comparable publicly trading companies. We believe this methodology of valuation is consistent with how market participants would value reporting units. The discount rate and market based multiples used are specifically developed for the unit tested regarding the level of risk and end markets served. Even though we do use other observable inputs (Level 2 inputs) the calculation of fair value for goodwill would be most consistent with Level 3 inputs.
If the carrying value of the reporting unit including goodwill is less than fair value of the reporting unit, the goodwill is not considered impaired. If the carrying value is greater than fair value then the potential for impairment of goodwill exists. The potential impairment is determined by allocating the fair value of the reporting unit among the assets and liabilities based on a purchase price allocation methodology as if the reporting unit was acquired in a business combination. The fair value of the goodwill is implied from this allocation and compared to the carrying value with an impairment loss recognized if the carrying value is greater than the implied fair value.
We base our fair value estimates, in large part, on management business plans and projected financial information which are subject to a high degree of management judgment and complexity. Actual results may differ from projections and the differences may be material.
Long-lived tangible and intangible assets subject to amortization are tested for recoverability when changes in circumstances indicate the carrying value of these assets may not be recoverable. A test for recoverability is also performed when management has committed to a plan to dispose of a reporting unit or asset group. Assets to be held and used are tested for recoverability when indications of impairment are evident. Recoverability of a long-lived tangible and intangible asset is evaluated by comparing its carrying value to the future estimated undiscounted cash flows expected to be generated by the asset or asset group. If the asset is not recoverable the asset is considered impaired and adjusted to fair value which is then depreciated/amortized over its remaining useful life. Assets to be disposed of are carried at the lesser of carrying value or fair value less costs of disposal.
In 2014,
On February 25, 2016, the FASB issued ASU 2016-02, Leases (“ASU 2016-02”). ASU 2016-02 creates Topic 842, Leases, in the FASB Accounting Standards Codification (“FASB ASC”) and supersedes FASB ASC 840, Leases. Entities that hold numerous equipment and real estate leases, in particular those with numerous operating leases, will be most affected by the new guidance. The leasing accounting standard is effective for public companies beginning January 1, 2019 with modified retrospective adoption required and early adoption permitted. The amendments in ASU 2016-02 are expected to impact balance sheets at many companies by adding lease-related assets and liabilities. This may affect compliance with contractual agreements and loan covenants. As noted in Item 2. Properties, we list various leased locations. We have also carried out inquiries within segment locations compiling information on operating and capital leases. We are currently evaluating the impacts of the lease accounting standards regarding these and other leases identified on our financial position or results of operations and related disclosures.
On August 27, 2014, the FASB issued ASU 2014-15, Presentation of Financial Statements – Going Concern, (“ASU 2014-15”) which provides guidance on determining when and how to disclose going-concern uncertainties in the financial statements. The new standard requires management to perform interim and annual assessments of an entity’s ability to continue as a going concern within one year of the date the financial statements are issued. An entity must provide certain disclosures if “conditions or events raise substantial doubt about the entity’s ability to continue as a going concern.” ASU 2014-15 applies to all entities and is effective for annual periods ending after December 15, 2016, and interim periods thereafter, with early adoption permitted. We adopted ASU 2014-15 beginning December 31, 2016, which involved adding policies and procedures around our assessments to continue as a going concern. Per our quantitative and qualitative analysis, currently there is no substantial doubt as to our ability to continue as a going concern within the next twelve months.
During March 2016, ASU 2016-09–Improvements to Employee Share-Based Payment Accounting was issued regarding he guidance of how companies will account for certain aspects of share-based payments to employees. Entities will be required to recognize the income tax effects of awards in the income statement when the awards vest or are settled (i.e., additional paid-in capital or APIC pools will be eliminated). The guidance on employers’ accounting for an employee’s use of shares to satisfy the employer’s statutory income tax withholding obligation and for forfeitures is changing. The guidance is effective for public business entities for fiscal years beginning after 15 December 2016, and interim periods within those fiscal years. For all other entities, it is effective for fiscal years beginning after 15 December 2017, and interim periods within fiscal years beginning after 15 December 2018. Early adoption is permitted in any annual or interim period for which financial statements haven’t been issued or made available for issuance, but all of the guidance must be adopted in the same period. If an entity early adopts the guidance in an interim period, any adjustments must be reflected as of the beginning of the fiscal year that includes that interim period.
The FASB issued ASU 2016-15, Statement of Cash Flows (Topic 230): Classification of Certain Cash Receipts and Cash Payments (“ASU 2016-15”). This ASU provides clarification on how certain cash receipts and cash payments are presented and classified on the statement of cash flows. This ASU is effective for annual and interim periods beginning in 2018 and is required to be adopted using a retrospective approach if practicable, with early adoption permitted. The Company does not expect the adoption of this ASU to have a material impact on its Consolidated Statement of Cash Flows. We are currently evaluating the impact this new guidance is expected to have on our financial position or results of operations and related disclosures.
During January 2017, the FASB issued ASU 2017-04 – Simplifying the Test for Goodwill Impairment that eliminates the requirement to calculate the implied fair value of goodwill (i.e., Step 2 of today’s goodwill impairment test) to measure a goodwill impairment charge. Instead, entities will record an impairment charge based on the excessamount that we ultimately expect to collect from our customers. We evaluate the collectability of a reporting unit’s carrying amount over its fair value (i.e., measure the chargeaccounts receivable based on today’s Step 1). The standard has tiered effective dates, starting in 2020 for calendar-year publica combination of factors including number of days receivables are past due, historical collection experience, current market conditions, and forecasted direction of economic and business entities that meetenvironment. Accounts receivable are written off at the definition of an SEC filer. Early adoptiontime a customer receivable is permitted for interim and annual goodwill impairment testing dates after 1 January 2017. Wedeemed uncollectible.
We adopted ASU No. 2015-11, Inventory (Topic 330)-Simplifying the Measurement of Inventory (“ASU 2015-11”), which simplifies the subsequent measurement of inventories by replacingstated at the lower of cost or market test with a lower of cost and net realizable value test. The subsequent measurement of inventory test, historically three measurements under lower of cost or market, is replaced by lower of cost and net realizable value test. Thus, we will compare the cost of inventory to only one measure, its net realizable value. When evidence exists thatCost is determined using standard costs, which approximates the net realizable valueaverage cost method. Our policy is to expense abnormal amounts of inventory is less than itsidle facility expense, freight, handling cost, (due to damage, physical deterioration, obsolescence, changesand waste included in price levels or other causes), we will recognize the difference as a loss in earnings in the period in which it occurs. In accordance with ASU 2015-11, we are applying the new guidance on a prospective basis.
We adopted ASU No. 2015-17, Income Taxes (Topic 740), Balance Sheet Classificationcost of Deferred Taxes (“ASU 2015-17”). We will classify all deferred tax assets and liabilities as noncurrent on the balance sheet instead of separating deferred taxes into current and noncurrent amounts.products sold. In addition, we will no longer allocate valuation allowances between current and noncurrent deferred tax assets because those allowances also will be classified as noncurrent. We have elected to apply ASU 2015-17 on a prospective basis. Therefore, the prior periods were not retroactively adjusted.
We allocate the total purchase price of the acquired tangible and intangible assets acquired and liabilities assumedfixed production overheads based on their estimated fair values as of the business combination date, with the excess purchase price recorded as goodwill. The purchase price allocation process required us to use significant estimates and assumptions, including fair value estimates, as of the business combination date. Although we believe the assumptions and estimates we have made are reasonable and appropriate, they are based in part on historical experience and information obtained from management of the acquired company, in part based on valuation models that incorporate projections of expected future cash flows and operating plans and are inherently uncertain. Valuations are performed by management or third party valuation specialists under management’s supervision. In determining the fair value of assets acquired and liabilities assumed in business combinations, as appropriate, we may use one of the following recognized valuation methods: the income approach (including discounted cash flows from relief from royalty and excess earnings model), the market approach and/or the replacement cost approach.
Examples of significant estimates used to value certain intangible assets acquired include but are not limited to:
However, different assumptions regarding projected performance and other factors associated with the acquired assets may affect the amount recorded under each type of assets and liabilities, mainly between property plant and equipment, intangibles assets, goodwill and deferred income tax liabilities and subsequent assessment could result in future impairment charges. The purchase price allocation process also entails us to refine these estimates over a measurement period not to exceed one year to reflect new information obtained surrounding facts and circumstances existing at acquisition date.
2) Acquisitions
As reported in our 2015 Annual Report, we completed the acquisition (the “PEP Acquisition”) of Precision Engineered Products Holdings, Inc. (“PEP”) on October 19, 2015. During the nine months ended September 30, 2016, we finalized all issues related to customary working capital adjustments, fixed assets and income taxes. The changes primarily arose from differences noted during acquisition integration and finalizing return to provision adjustments. As a result, we adjusted the preliminary allocation of the purchase price initially recorded at the PEP Acquisition date to reflect these measurement period adjustments.
The following table summarizes the final purchase price allocation for the PEP Acquisition:
| As Reported | Subsequent | Final | ||||||||||
| on | Adjustments | as of | ||||||||||
| December 31, | to fair | September 30, | ||||||||||
| 2015 | value | 2016 | ||||||||||
Consideration: | ||||||||||||
Cash paid | $ | 621,196 | $ | — | $ | 621,196 | ||||||
Cash adjustment | — | (1,635 | ) | (1,635 | ) | |||||||
|
|
|
|
|
| |||||||
Total consideration | $ | 621,196 | $ | (1,635 | ) | $ | 619,561 | |||||
|
|
|
|
|
| |||||||
Fair value of assets acquired and liabilities assumed on | ||||||||||||
Current assets | $ | 69,331 | $ | 452 | $ | 69,783 | ||||||
Property, plant and equipment | 56,163 | (962 | ) | 55,201 | ||||||||
Intangible assets subject to amortization | 240,490 | — | 240,490 | |||||||||
Other non-current assets | 1,500 | — | 1,500 | |||||||||
Goodwill | 364,450 | (1,805 | ) | 362,645 | ||||||||
|
|
|
|
|
| |||||||
Total assets acquired | 731,934 | (2,315 | ) | 729,619 | ||||||||
|
|
|
|
|
| |||||||
Current liabilities | 21,131 | — | 21,131 | |||||||||
Non-current deferred tax liabilities | 87,578 | (680 | ) | 86,898 | ||||||||
Other non-current liabilities | 2,029 | — | 2,029 | |||||||||
|
|
|
|
|
| |||||||
Total liabilities assumed | 110,738 | (680 | ) | 110,058 | ||||||||
|
|
|
|
|
| |||||||
Net assets acquired | $ | 621,196 | $ | (1,635 | ) | $ | 619,561 | |||||
|
|
|
|
|
| |||||||
In accordance with generally accepted accounting principles, we have recognized measurement-period adjustments during the period in which we determine the amount of the adjustment, including the effect on earnings of any amounts we would have recorded in previous periods if the accounting had been completed at the acquisition date.
3) Restructuring, Impairment and Integration Charges, excluding Goodwill Impairments, and Divestitures
Restructuring and integration costs totaling $10.0 million and $7.3 million were recognized in the years ended December 31, 2016 and 2015, comprised of initiatives impacting eachnormal production capacity of our segments.
Within the Precision Bearing Components Group, restructuring initiatives to optimize operations in the U.S., Italy, the Netherlands, Mexico and at segment headquarters resulted in a charge of $4.4 and $2.0 million for the years ended December 31, 2016 and 2015, respectively. These charges consisted primarily of severance and other employee costs relating to personnel reductions.
Within the Autocam Precision Components Group, certain restructuring programs, including the closure of one facility, the Wheeling Plant, resulted in a charge of $4.3 and $2.6 million for the years ended December 31, 2016 and 2015, respectively. These charges consisted of severance costs of $0.8 million, fixed asset impairment of $0.3 million and site closure costs of $3.2 million for 2016.
Within the Precision Engineered Products (“PEP”) Group, initiatives resulted in integration, site closure and employee costs of $1.3 and $0.9 million for the years ended December 31, 2016 and 2015, respectively.
Within the Corporate and Consolidated Segment, a charge of $1.8 million was incurred for an accounting and reporting system that was ultimately never deployed and abandoned for the year ended December 31, 2015.
The following table summarizes restructuring and integration activity related to actions incurred for the years ended December 31, 2016 and 2015:
| Year Ended | ||||||||
| December 31, | ||||||||
| 2016 | 2015 | |||||||
Severance and other employee costs | $ | 5,776 | $ | 2,019 | ||||
Site closure and other associated costs | 3,970 | 4,399 | ||||||
Integration and other associated costs | 278 | 850 | ||||||
|
|
|
| |||||
Total | $ | 10,024 | $ | 7,268 | ||||
|
|
|
| |||||
| Reserve | Reserve | |||||||||||||||
| Balance at | Paid in | Balance at | ||||||||||||||
| December 31, 2015 | Charges | 2016 | December 31, 2016 | |||||||||||||
Severance and other employee costs | $ | 2,517 | $ | 5,776 | $ | (5,274 | ) | $ | 3,019 | |||||||
Site closure and other associated costs | 1,845 | 3,970 | (4,189 | ) | 1,626 | |||||||||||
Integration and other associated costs | — | 278 | (278 | ) | — | |||||||||||
|
|
|
|
|
|
|
| |||||||||
Total | $ | 4,362 | $ | 10,024 | $ | (9,741 | ) | $ | 4,645 | |||||||
|
|
|
|
|
|
|
| |||||||||
| Reserve | Paid in | Reserve | ||||||||||||||
| Balance at | Balance at | |||||||||||||||
| December 31, 2014 | Charges | 2015 | December 31, 2015 | |||||||||||||
Severance and other employee costs | $ | — | $ | 2,691 | $ | (174 | ) | $ | 2,517 | |||||||
Site closure and other associated costs | — | 1,925 | $ | (80 | ) | 1,845 | ||||||||||
Impairment and write-off charges | — | 2,652 | $ | — | — | |||||||||||
Integration and other associated costs | — | — | — | — | ||||||||||||
|
|
|
|
|
|
|
| |||||||||
Total | $ | — | $ | 7,268 | $ | (254 | ) | $ | 4,362 | |||||||
|
|
|
|
|
|
|
| |||||||||
The total restructuring and impairment costs are still being identified at the various segments; therefore, we are not able to estimate the ultimate costs at this time. We will include in future filings updates to these activities along with a reconciliation of beginning and ending liabilities recorded. The amounts recorded for the year ended December 31, 2016 for restructuring charges that have been incurred are primarily expected to be paid out during 2017. Some amounts related to foreign locations extend through 2021.
4) Accounts Receivable and Sales Concentrations
| December 31, | ||||||||
| 2016 | 2015 | |||||||
Trade | $ | 140,754 | $ | 124,226 | ||||
Less—allowance for doubtful accounts | 1,207 | 1,221 | ||||||
|
|
|
| |||||
Accounts receivable, net | $ | 139,547 | $ | 123,005 | ||||
|
|
|
| |||||
Activity in the allowance for doubtful accounts is as follows:
| Balance at | ||||||||||||||||||||
| Beginning | Write- | Currency | Balance at | |||||||||||||||||
| Description | of Year | Additions | offs | Impacts | End of Year | |||||||||||||||
December 31, 2016 | ||||||||||||||||||||
Allowance for doubtful accounts | $ | 1,221 | $ | 142 | $ | (75 | ) | $ | (81 | ) | $ | 1,207 | ||||||||
December 31, 2015 | ||||||||||||||||||||
Allowance for doubtful accounts | $ | 520 | $ | 745 | $ | (8 | ) | $ | (36 | ) | $ | 1,221 | ||||||||
December 31, 2014 | ||||||||||||||||||||
Allowance for doubtful accounts | $ | 445 | $ | 208 | $ | (123 | ) | $ | (10 | ) | $ | 520 | ||||||||
For the years ended December 31, 2016, 2015 and 2014, sales to AB SKF (“SKF”) amounted to $104.2 million, $105.7 million, and $128.0 million, respectively, or 13%, 16%, and 26% of consolidated revenues, respectively. None of our other customers accounted for more than 10% of our net sales in 2016, 2015 or 2014. SKF was the only customer with accounts receivable concentration in excess of 10% in 2016 and 2015. The outstanding balance as of December 31, 2016 and 2015 for SKF was $20.5 million and $16.2 million, respectively. All revenues and receivables related to SKF are in the Precision Bearing Components Group and Precision Engineered Products Group.
5) Inventories
| December 31, | December 31, | |||||||
| 2016 | 2015 | |||||||
Raw materials | $ | 49,205 | $ | 50,204 | ||||
Work in process | 31,348 | 30,604 | ||||||
Finished goods | 34,298 | 39,028 | ||||||
|
|
|
| |||||
Inventories | $ | 114,851 | $ | 119,836 | ||||
|
|
|
| |||||
Finished goods inventory on consignment at customers’ sites at December 31, 2016 and 2015 was approximately $5.0 million and $5.1 million, respectively.
The inventoryfacilities. Inventory valuations above were developed using normalized production capacities for each of our manufacturing locations. AnyThe costs from abnormal excess capacity or under-utilization of fixed production overheads arewere expensed in the period incurred and are not included as a component of inventory valuation.
6) inventory.
| Estimated | December 31, | |||||||||||
| Useful Life | 2016 | 2015 | ||||||||||
Land and buildings | 15-40 years | 96,173 | 97,322 | |||||||||
Machinery and equipment | 3-12 years | 464,291 | 432,841 | |||||||||
Construction in process | 21,045 | 16,049 | ||||||||||
|
|
|
| |||||||||
| 581,509 | 546,212 | |||||||||||
Less—accumulated depreciation | 258,556 | 227,244 | ||||||||||
|
|
|
| |||||||||
Property, plant and equipment, net | $ | 322,953 | $ | 318,968 | ||||||||
|
|
|
| |||||||||
| Years Ended December 31, | ||||||||||||||||||||
| 2021 | 2020 | 2019 | ||||||||||||||||||
| Net sales | $ | — | $ | 225,255 | $ | 357,937 | ||||||||||||||
| Cost of sales (exclusive of depreciation and amortization shown separately below) | — | 160,464 | 249,157 | |||||||||||||||||
| Selling, general, and administrative expense | — | 20,779 | 34,328 | |||||||||||||||||
| Depreciation and amortization | — | 35,731 | 46,950 | |||||||||||||||||
| Goodwill impairment | — | 146,757 | — | |||||||||||||||||
| Other operating expense, net | — | 41 | 20 | |||||||||||||||||
| Income (loss) from operations | — | (138,517) | 27,482 | |||||||||||||||||
| Interest expense | — | 48,893 | 44,125 | |||||||||||||||||
| Loss on extinguishment of debt and write-off of debt issuance costs | — | 1,388 | 2,753 | |||||||||||||||||
| Other expense (income), net | — | (322) | 178 | |||||||||||||||||
| Loss from discontinued operations before costs of disposal and benefit for income taxes | — | (188,476) | (19,574) | |||||||||||||||||
| Benefit for income taxes | — | 12,468 | 3,582 | |||||||||||||||||
| Loss from discontinued operations before costs of disposal | — | (176,008) | (15,992) | |||||||||||||||||
| Gain on disposal of discontinued operations | 1,200 | 212,319 | — | |||||||||||||||||
| Benefit for income taxes on costs of disposal | — | 2,587 | — | |||||||||||||||||
| Income (loss) from discontinued operations, net of tax | $ | 1,200 | $ | 38,898 | $ | (15,992) | ||||||||||||||
| Years Ended December 31, | ||||||||||||||||||||
| 2020 | 2019 | |||||||||||||||||||
| Interest on debt | $ | 35,147 | $ | 40,996 | ||||||||||||||||
| Amortization of debt issuance costs | 13,990 | 3,368 | ||||||||||||||||||
| Capitalized interest and other | (244) | (239) | ||||||||||||||||||
| Total interest expense of discontinued operations | $ | 48,893 | $ | 44,125 | ||||||||||||||||
| Years Ended December 31, | ||||||||||||||||||||
| 2020 | 2019 | |||||||||||||||||||
| Depreciation and amortization | $ | 35,731 | $ | 46,950 | ||||||||||||||||
| Goodwill impairment | 146,757 | — | ||||||||||||||||||
| Amortization of debt issuance costs | 13,990 | 3,368 | ||||||||||||||||||
| Loss on extinguishment of debt and write-off of debt issuance costs | 1,388 | 2,753 | ||||||||||||||||||
| Acquisition of property, plant and equipment | 8,416 | 21,834 | ||||||||||||||||||
| Right-of-use assets obtained in exchange for new finance lease liabilities | 695 | 5,321 | ||||||||||||||||||
| Right-of-use assets obtained in exchange for new operating lease liabilities (1) | 6,174 | 51 | ||||||||||||||||||
| Mobile Solutions | Power Solutions | Corporate and Consolidations | Total | |||||||||||||||||||||||
| Year Ended December 31, 2021 | ||||||||||||||||||||||||||
| Net sales | $ | 285,863 | $ | 191,800 | $ | (79) | (a) | $ | 477,584 | |||||||||||||||||
| Depreciation and amortization | 28,769 | 15,892 | 1,534 | 46,195 | ||||||||||||||||||||||
| Income (loss) from operations | 9,039 | 6,493 | (24,536) | $ | (9,004) | |||||||||||||||||||||
| Interest expense | (12,664) | |||||||||||||||||||||||||
| Other | (774) | |||||||||||||||||||||||||
| Loss from continuing operations before income taxes and share of net income from joint venture | $ | (22,442) | ||||||||||||||||||||||||
| Share of net income from joint venture | $ | 6,261 | $ | — | $ | — | $ | 6,261 | ||||||||||||||||||
| Expenditures for long-lived assets | 15,411 | 2,200 | 610 | 18,221 | ||||||||||||||||||||||
| Total assets | 357,171 | (b) | 184,196 | 37,734 | 579,101 | |||||||||||||||||||||
| Mobile Solutions | Power Solutions | Corporate and Consolidations | Total | |||||||||||||||||||||||
| Year Ended December 31, 2020 | ||||||||||||||||||||||||||
| Net sales | $ | 256,360 | $ | 171,269 | $ | (95) | (a) | $ | 427,534 | |||||||||||||||||
| Depreciation and amortization | 28,298 | 15,730 | 1,652 | 45,680 | ||||||||||||||||||||||
| Goodwill impairment | — | 92,942 | — | 92,942 | ||||||||||||||||||||||
| Income (loss) from operations | 5,228 | (85,983) | (36,702) | $ | (117,457) | |||||||||||||||||||||
| Interest expense | (18,898) | |||||||||||||||||||||||||
| Other | (15,733) | |||||||||||||||||||||||||
| Loss from continuing operations before income taxes and share of net income from joint venture | $ | (152,088) | ||||||||||||||||||||||||
| Share of net income from joint venture | $ | 3,626 | $ | — | $ | — | $ | 3,626 | ||||||||||||||||||
| Expenditures for long-lived assets | 12,400 | 2,754 | 203 | 15,357 | ||||||||||||||||||||||
| Total assets | 370,985 | (b) | 197,348 | 56,629 | 624,962 | |||||||||||||||||||||
| Mobile Solutions | Power Solutions | Corporate and Consolidations | Total | |||||||||||||||||||||||
| Year Ended December 31, 2019 | ||||||||||||||||||||||||||
| Net sales | $ | 297,749 | $ | 192,100 | $ | (335) | (a) | $ | 489,514 | |||||||||||||||||
| Depreciation and amortization | 27,146 | 15,301 | 2,449 | 44,896 | ||||||||||||||||||||||
| Income (loss) from operations | 9,553 | 13,881 | (41,027) | $ | (17,593) | |||||||||||||||||||||
| Interest expense | (13,030) | |||||||||||||||||||||||||
| Other | (1,502) | |||||||||||||||||||||||||
| Loss from continuing operations before income taxes and share of net income from joint venture | $ | (32,125) | ||||||||||||||||||||||||
| Share of net income from joint venture | $ | 1,681 | $ | — | $ | — | $ | 1,681 | ||||||||||||||||||
| Expenditures for long-lived assets | 24,969 | 4,457 | 2,743 | 32,169 | ||||||||||||||||||||||
| Property, Plant, and Equipment, Net As of December 31, | ||||||||||||||
| 2021 | 2020 | |||||||||||||
| United States | $ | 123,442 | $ | 130,077 | ||||||||||
| Europe | $ | 36,972 | $ | 40,663 | ||||||||||
| Asia | 32,605 | 33,854 | ||||||||||||
| Mexico | 1,044 | 1,230 | ||||||||||||
| South America | 15,042 | 17,866 | ||||||||||||
| All foreign locations | $ | 85,663 | $ | 93,613 | ||||||||||
| Total | $ | 209,105 | $ | 223,690 | ||||||||||
| As of December 31, | ||||||||||||||
| 2021 | 2020 | |||||||||||||
| Trade | $ | 72,771 | $ | 86,659 | ||||||||||
| Less—allowance for credit losses | 1,352 | 2,044 | ||||||||||||
| Accounts receivable, net | $ | 71,419 | $ | 84,615 | ||||||||||
| Years Ended December 31, | ||||||||||||||||||||
| 2021 | 2020 | 2019 | ||||||||||||||||||
| Balance at beginning of year | $ | 2,044 | $ | 2,044 | $ | 2,517 | ||||||||||||||
| Additions | 78 | 505 | 231 | |||||||||||||||||
| Write-offs and other | (734) | (562) | (692) | |||||||||||||||||
| Currency impact | (36) | 57 | (12) | |||||||||||||||||
| Balance at end of year | $ | 1,352 | $ | 2,044 | $ | 2,044 | ||||||||||||||
| As of December 31, | ||||||||||||||
| 2021 | 2020 | |||||||||||||
| Raw materials | $ | 27,221 | $ | 22,589 | ||||||||||
| Work in process | 24,960 | 20,758 | ||||||||||||
| Finished goods | 22,846 | 19,170 | ||||||||||||
| Total inventories | $ | 75,027 | $ | 62,517 | ||||||||||
| As of December 31, | ||||||||||||||
| 2021 | 2020 | |||||||||||||
| Land and buildings | $ | 57,991 | $ | 58,296 | ||||||||||
| Machinery and equipment | 344,041 | 339,268 | ||||||||||||
| Construction in progress | 5,009 | 1,270 | ||||||||||||
| Total | 407,041 | 398,834 | ||||||||||||
| Less: Accumulated depreciation | 197,936 | 175,144 | ||||||||||||
| Property, plant and equipment, net | $ | 209,105 | $ | 223,690 | ||||||||||
years ended December 31, 2020 and 2019, respectively, related to the early retirement of identified fixed assets. There were no impairment charges for the year ended December 31, 2021. The impairment charges were recorded to the “Other operating expense (income), net,” line item on the Consolidated Statements of Operations and Comprehensive Income (Loss). The impairment charges were determined by writing the assets down to the estimated salvage value, less disposal costs.
7) Debt
Long-term debt and short-term debt at December 31, 2016 and December 31, 2015 consisted
| Amended | ||||||||
| December 31, | December 31, | |||||||
| 2016 | 2015 | |||||||
Borrowings under our $545.0 million Senior Secured Term Loan B bearing interest at the greater of 0.75% or 1 month LIBOR (0.77% at December 31, 2016) plus an applicable margin of 4.25% at September 30, 2016, expiring October 19, 2022, net of debt issuance costs of $19.0 million at December 31, 2016 and $20.6 million at December 31, 2015. | $ | 524,539 | $ | 552,957 | ||||
Borrowings under our $143.0 million Senior Secured Revolver bearing interest at LIBOR (0.77% at December 31, 2016) plus an applicable margin of 3.50% at September 30, 2016, expiring October 19, 2020, net of debt issuance costs of $2.7 million at December 31, 2016 and $2.9 million at December 31, 2015. | 25,298 | 3,547 | ||||||
Borrowings under our $250.0 million Senior Notes bearing interest at 10.25%, maturing on November 1, 2020, net of debt issuance costs of $4.9 million at December 31, 2016 and $5.9 million at December 31, 2015. | 245,077 | 244,088 | ||||||
French Safeguard Obligations (Autocam) | 358 | 2,000 | ||||||
Brazilian lines of credit and equipment notes (Autocam) | 573 | 826 | ||||||
Chinese line of credit (Autocam) | 2,619 | 3,696 | ||||||
|
|
|
| |||||
Total debt | 798,464 | 807,114 | ||||||
Less current maturities of long-term debt | 12,751 | 11,714 | ||||||
|
|
|
| |||||
Long-term debt, excluding current maturities of long-term debt | $ | 785,713 | $ | 795,400 | ||||
|
|
|
| |||||
On October 19, 2015, we: (i) entered into a new senior secured term loan credit facilityour net goodwill was recorded in the amount of up to $525.0 million (with a $100.0 million accordion feature) and a seven year maturity (as amended, supplemented and/or restated from time to time, the “Term Loan Credit Facility”); (ii) entered into a new senior secured revolving credit facility in the amount of up to $100.0 million with a five year maturity (as amended, supplement and/or restated from time to time, the “Senior Secured Revolving Credit Facility”, and together with the Term Loan Credit Facility, the “Senior Credit Facilities”); and (iii) issued $300.0 million of 10.25% senior notes due 2020 (the “Senior Notes”). On September 30, 2016, we amended and restated the Senior Credit Facilities, which lowered the interest rate and rate floor on the Company’s Senior Secured Term Loan B (the “Term Loan B”). The new applicable rate for the Term Loan B is London Inter Bank Offering Rate (“LIBOR”), subject to a 0.75% rate floor, plus 4.25%, which in combination is 75 basis points lower (or 0.75%) than the previous rate. There were no changes to the maturities or covenants under the Term Loan B. Concurrent with the amended and restated Term Loan B, the Senior Secured Revolving Credit Facility was upsized from $100 million to $133 million. Proceeds were drawn under the Senior Secured Revolving Credit Facility to pay down debt under the Term Loan B, reducing the debt under the Term Loan B to $545 million. During October 2016, an incremental amendment was executed increasing the $133 million Senior Secured Revolving Credit Facility to $143 million. There were no changes to the Senior Secured Revolving Credit Facility maturities, and the covenant threshold was increased from $30 million to $42.9 million (30% drawn threshold). The outcome of the refinancing and debt transactions was lower principal amounts outstanding on the Term Loan B, increased borrowings under the Senior Secured Revolving Credit Facility, resulting in a lower effective interest rate for the overall debt holdings.
In conjunction with the amended and restated Senior Credit Facilities, we incurred $4.0 million in debt issuance costs. We wrote off a total of $2.6 million in debt issuance costs related to the modification and extinguishment of debt.
As part of the merger with Autocam in 2014, we assumed certain foreign credit facilities. These facilities relate to local borrowings in France, Brazil and China. These facilities are with financial institutions in the countries in which foreign plants operate and are used to fund working capital and equipment purchases in those countries.Power Solutions reportable segment. The following paragraphs describe these foreign credit facilities.
Our French operation (acquired with Autocam) has liabilities with certain creditors subject to Safeguard protection. The liabilities are being paid annually over a 10-year period until 2019 and carry a zero percent interest rate. Amounts due as of December 31, 2016 to those creditors opting to be paid over a 10-year period totaled $0.4 million, of which $0.1 million is includedtable shows changes in current maturities of long-term debt and $0.3 million is included in long-term debt, net of current portion, on the Condensed Consolidated Balance Sheet.
The Brazilian equipment notes represent borrowings from certain Brazilian banks to fund equipment purchases for Autocam’s Brazilian plants. These credit facilities have annual interest rates ranging from 2.5% to 9.1%.
The Chinese line of credit is a working capital line of credit with a Chinese bank bearing an annual interest rate ranging from 1.4% to 4.6%.
In accordance with generally accepted accounting principles, we have adopted ASU 2015-03, which provides guidance on simplifying the presentation of debt issuance costs on the balance sheet. To simplify presentation of debt issuance costs, the amendments in ASU 2015-03 require that debt issuance costs related to a recognized debt liability be presented in the balance sheet as a direct deduction from the carrying amount of that debt liability, consistent with debt discounts. The following table displays the debt amounts reported as of December 31, 2015, restated for the adoption of ASU 2015-03. The debt issuance costs were reclassified from other non-current assets and directly applied to the associated liability.
| Reported December 31, 2015 | ASU 2015-13 Reclass | Amended December 31, 2015 | ||||||||||
Borrowings under our $575.0* million Senior Secured Term | $ | 562,580 | $ | (9,623 | ) | $ | 552,957 | |||||
Borrowings under our $100.0** million Senior Secured Revolver | 6,462 | (2,915 | ) | 3,547 | ||||||||
Borrowings under our $250.0 million Senior Notes | 244,509 | (421 | ) | 244,088 | ||||||||
French Safeguard Obligations (Autocam) | 2,000 | 2,000 | ||||||||||
Brazilian lines of credit and equipment notes (Autocam) | 826 | 826 | ||||||||||
Chinese line of credit (Autocam) | 3,696 | 3,696 | ||||||||||
|
|
|
| |||||||||
Total debt | 820,073 | 807,114 | ||||||||||
Less current maturities of long-term debt | 11,714 | 11,714 | ||||||||||
|
|
|
| |||||||||
Long-term debt, excluding current maturities of long-term debt | $ | 808,359 | �� | $ | 795,400 | |||||||
|
|
|
| |||||||||
The aggregate maturities of long-term debt including current portion for each of the five years subsequent to December 31, 2016 are as follows:
Year ending December 31, | ||||
2017 | $ | 12,751 | ||
2018 | 5,968 | |||
2019 | 5,968 | |||
2020 | 279,841 | |||
2021 | 5,750 | |||
Thereafter | 514,812 | |||
|
| |||
Total debt | $ | 825,090 | ||
Less debt issuance costs | (26,626 | ) | ||
|
| |||
Total debt, net of debt issuance cost | $ | 798,464 | ||
|
| |||
On June 1, 2004, our wholly owned subsidiary, NN Asia, entered into a twenty-year lease agreement with Kunshan Tian Li Steel Structure Co. LTD for the lease of land and building (approximately 110,000 square feet) in the Kunshan Economic and Technology Development Zone, Jiangsu, The People’s Republic of China. The fair value of the land and building was estimated to be approximately $0.5 million and $1.9 million (at current exchange rates), respectively and undiscounted annual lease payments are approximately $0.3 million (approximately $5.6 million aggregate non-discounted lease payments over the twenty year term). The lease is cancelable after the fifth, ninth, and fourteenth years without payment or penalty by us. In addition, after the end of year five and each succeeding year we can buy the land for a preset price per square meter value and the building for actual cost less depreciation.
On October 1, 2011, our wholly owned subsidiary, NN Asia, entered into a twenty year lease agreement with Kunshan Tian Li Steel Structure Co. LTD for the lease of land and building adjacent to the current leased facility (approximately 75,000 square feet) in the Kunshan Economic and Technology Development Zone, Jiangsu, The People’s Republic of China. This lease was entered into to expand the production capacity of our current leased facility. The fair value of the land and building was estimated to be approximately $0.8 million and $1.1 million (at current exchange rates), respectively and undiscounted annual lease payments are approximately $0.2 million (approximately $3.6 million aggregate non-discounted lease payments over the twenty year term). The lease is cancelable after the fifth, ninth, and fourteenth years without payment or penalty by us. In addition, after the end of year five and each succeeding year we can buy the land for a preset price per square meter value and the building for actual cost less depreciation.
Below are the aggregate minimum future lease payments under both capital leases together with the present value of the net minimum lease payments as of December 31, 2016:
| Year ending December 31, | ||||
2017 | $ | 434 | ||
2018 | 434 | |||
2019 | 434 | |||
2020 | 434 | |||
2021 | 434 | |||
Thereafter | 2,601 | |||
|
| |||
Total minimum lease payments | 4,771 | |||
Less interest included in payments above | (1,462 | ) | ||
|
| |||
Present value of minimum lease payments | $ | 3,309 | ||
|
| |||
With the Autocam acquisition, we assumed capital leases on certain buildings and equipment. The cost of the assets subject to capital lease obligations as reflected in Property, Plant and Equipment, net in our Consolidated Balance Sheet was $25.0 million as of December 31, 2014. The accumulated depreciation of such assets as reflected in Property, Plant and Equipment, net in our Consolidated Balance Sheet was $3.6 million and $2.6 million as of December 31, 2016 and 2015, respectively.
Below are the minimum future lease payments under the assumed capital leases together with the present value of the net minimum lease payments as of December 31, 2016:
| Year ending December 31, | ||||
2017 | $ | 3,521 | ||
2018 | 2,530 | |||
2019 | 803 | |||
2020 | 0 | |||
2021 | 0 | |||
Thereafter | 0 | |||
|
| |||
Total minimum lease payments | 6,854 | |||
Less interest included in payments above | (282 | ) | ||
|
| |||
Present value of minimum lease payments | $ | 6,572 | ||
|
| |||
We have defined contribution 401(k) profit sharing plans covering substantially all U.S. employees. All eligible employees may enroll in the plans on the first day of the month following their employment date. A participant may elect to contribute between 1% and 60% of their compensation to the plans, subject to Internal Revenue Service (“IRS”) dollar limitations. Participants age 50 and older may defer an additional amount up to the applicable IRS Catch Up Provision Limit. We provide a matching contribution, which is determined on an individual, participating company basis. All participant contributions are immediately vested at 100%. Contributions for all U.S. employees were $2.3 million, $0.2 million and $0.8 million in 2016, 2015, and 2014, respectively.
Post-Employment Benefit Liabilities
We provide certain post-employment benefits to employees at our Pinerolo and Veenendaal plants that are either required by law or are local labor practice. There is a plan at each of our Pinerolo and Veenendaal plants, which are described below.
In accordance with Italian law, we have an unfunded severance plan under which all Italian employees are entitled to receive severance indemnities (Trattamento di Fine Rapporto or “TFR”) upon termination of their employment.
Effective January 1, 2007, the amount payable, based on salary paid, is remitted to a pension fund managed by a third party. The severance indemnities paid to the pension fund accrue approximately at the rate of 1/13.5 of the gross salaries paid during the year. The amounts accrued become payable upon termination of the individual employee, for any reason, e.g., retirement, dismissal or reduction in work force. Employees are fully vested in TFR benefits after their first year of service.
We have a plan that covers our Veenendaal plant employees that provides an award for employees who achieve 25 or 40 years of service and an award for employees upon retirement. The plan is unfunded and the benefits are based on years of service and rate of compensation at the time the award is paid.
The amounts shown in the table below represent the actual liabilities at December 31, 2016 and 2015 reported under accrued post-employment benefits in the Consolidated Balance Sheets for both plans combined.
| 2016 | 2015 | |||||||
Beginning balance | $ | 5,189 | $ | 6,024 | ||||
Amounts accrued | 135 | 53 | ||||||
Payments to employees/government managed plan | (452 | ) | (266 | ) | ||||
Foreign currency impacts | (165 | ) | (622 | ) | ||||
|
|
|
| |||||
Ending balance | $ | 4,707 | $ | 5,189 | ||||
|
|
|
| |||||
Defined Benefit Plan
Effective with the Autocam acquisition on August 29, 2014, we sponsor a defined benefit pension plan (the “Pension Plan”) for substantially all employees of the Bouverat, France plant. These benefits are calculated based on each employee’s years of credited service and most recent monthly compensation and service category. Employees become vested in accordance with governmental regulations in place at the time of retirement.
For the purpose of calculating the 2016 actuarial present value of the benefit obligation under the Pension Plan, the discount rates assumed were 1.6%. The compensation growth rate was assumed was 3.0% for 2016. The measurement date was December 31, 2016.
For the purpose of calculating the 2015 actuarial present value of the benefit obligation under the Pension Plan, the discount rates assumed were 2.2%. The compensation growth rate was assumed was 3.0% for 2015. The measurement date was December 31, 2016.
Set forth below is projected benefit obligation information for the Pension Plan and the plan activity for the years ended December 31, 2016 and 2015:
| 2016 | 2015 | |||||||
Accumulated benefit obligation at measurement date | $ | 949 | $ | 950 | ||||
Effect of salary increases | 533 | 494 | ||||||
|
|
|
| |||||
Projected benefit obligation at measurement date | $ | 1,482 | $ | 1,444 | ||||
|
|
|
| |||||
Projected benefit obligation at date of acquisition | $ | 1,444 | $ | 1,537 | ||||
Service and interest costs | 113 | 103 | ||||||
Actuarial gains (losses) | 118 | (15 | ) | |||||
Benefits paid | (141 | ) | (22 | ) | ||||
Effect of foreign currency translation gains and other | (50 | ) | (159 | ) | ||||
|
|
|
| |||||
Projected benefit obligation at measurement date | $ | 1,484 | $ | 1,444 | ||||
|
|
|
| |||||
Set forth below is net periodic benefit cost information for the Pension Plan for the years ended December 31, 2016 and 2015:
| 2016 | 2015 | |||||||
Service and interest costs | $ | 113 | $ | 103 | ||||
Expected return on plan assets | (10 | ) | (11 | ) | ||||
Amortization of prior service costs | 27 | 28 | ||||||
|
|
|
| |||||
Net periodic benefit cost | $ | 130 | $ | 120 | ||||
|
|
|
| |||||
We expect benefit payments under the Pension Plan to be:
| Year ending December 31, | ||||
2017 | $ | 14 | ||
2018 | 7 | |||
2019 | — | |||
2020 | 25 | |||
2021 | 9 | |||
2022-2026 | 213 | |||
|
| |||
Total benefit payments | 268 | |||
|
| |||
Set forth below is plan asset information for the Pension Plan:
| 2016 | 2015 | |||||||
Plan assets at fair value at measurement date | $ | 426 | $ | 515 | ||||
Projected benefit obligations at measurement date | (1,482 | ) | (1,444 | ) | ||||
|
|
|
| |||||
Funded status | $ | (1,056 | ) | $ | (929 | ) | ||
|
|
|
| |||||
Plan assets at fair value at date of acquisition | $ | 515 | $ | 589 | ||||
Actual return on plan assets | 64 | 9 | ||||||
Benefits paid | (141 | ) | (22 | ) | ||||
Effect of foreign currency translation gains | (13 | ) | (61 | ) | ||||
|
|
|
| |||||
Plan assets at fair value at measurement date | $ | 425 | $ | 515 | ||||
|
|
|
| |||||
The assumed rate of return on assets of the Pension Plan was 2.0% for all periods presented. We have a targeted goal of allocating plan assets one-third to equity and two-thirds to fixed income securities. Actual allocations of Pension Plan assets between equity and fixed income securities were 35% and 65%, respectively, as of December 31, 2016. Our expected funding obligations under the Pension Plan in 2017 is approximately $0.1 million.
Even though we do use other observable inputs (Level 2 inputs under the GAAP hierarchy), the calculation of fair value for pension plan assets and liabilities would be most consistent with Level 3 under the GAAP hierarchy.
We recognize compensation expense of all employee and non-employee director share-based compensation awards in the financial statements based upon the fair value of the awards over the requisite service or vesting period, less anticipated forfeitures. We account for stock awards by recognizing the fair value of the awarded stock at the grant date as compensation expense over the vesting period, less anticipated forfeitures.
In the years ended December 31, 2016, 2015, and 2014, approximately $4.3 million, $3.7 million, and $2.6 million, respectively of compensation expense was recognized in selling, general and administrative expense for all share-based awards. The compensation expense recognized in the years ended December 31, 2016, 2015 and 2014 related to stock options was $0.8 million, $0.9 million and $1.3 million, respectively. The compensation expense related to stock awards in the years ended December 31, 2016, 2015 and 2014 was $2.3 million, $2.4 million and $1.3 million, respectively. The compensation expense related to performance based awards in the year ended December 31, 2016 and 2015, was $1.2 and $0.4 million, respectively.
As of December 31, 2016, we have approximately 2,300 maximum shares that can be issued as options, stock appreciation rights, and/or other stock based awards.
Stock Option Awards
Option awards are typically granted to non-executive directors and key employees on an annual basis. A single option grant is typically awarded to eligible employees and non-executive directors each year if and when granted by the Compensation Committee of the Board of Directors and occasionally individual grants are awarded to eligible employees. All employee and non-executive directors are awarded options at an exercise price equal to the closing price of our stock on the date of grant. The term life of options is ten years with vesting periods of generally three years for key employees and one year for non-executive directors. The fair value of our options cannot be determined by market value as they are not traded in an open market. Accordingly, the Black Scholes financial pricing model is utilized to determine fair value based on certain assumptions discussed below.
During 2016, 2015 and 2014, we granted options to purchase 167,000, 54,600, and 108,620 shares, respectively, to certain key employees and non-employee directors. The weighted average grant date fair value of the options granted during the years ended December 31, 2016, 2015 and 2014 was $5.02, $12.61 and $9.48, respectively. Upon exercise of stock options, new shares of our stock are issued. The weighted average assumptions relevant to determining the fair value at the dates of grant are below:
| 2016 | 2015 | 2014 | ||||||||||
Term | 6 years | 6 years | 6 years | |||||||||
Risk free interest rate | 1.43 | % | 1.43 | % | 1.75 | % | ||||||
Dividend yield | 2.48 | % | 1.11 | % | 1.43 | % | ||||||
Expected volatility | 59.23 | % | 59.22 | % | 56.75 | % | ||||||
Expected forfeiture rate | 3.00 | % | 3.00 | % | 3.00 | % | ||||||
The expected volatility rate is derived from our actual common stock historical volatility over the same time period as the expected term. The volatility rate is derived by mathematical formula utilizing daily closing price data.
The expected dividend yield is derived by a mathematical formula which uses the expected annual dividends over the expected term divided by the fair market value of our common stock at the grant date.
The average risk-free interest rate is derived from United States Department of Treasury published interest rates of daily yield curves for the same time period as the expected term.
The forfeiture rate is determined from examining the historical pre-vesting forfeiture patterns of past option issuances to key employees. While the forfeiture rate is not an input of the Black Scholes model for determining the fair value of the options, it is an important determinant of stock option compensation expense to be recorded.
The term is derived from using the “Simplified Method” of determining stock option terms as described under the Securities and Exchange Commission’s Staff Accounting Bulletin 107.
The following table provides a reconciliation of option activity for the year ended December 31, 2016:
Options | Shares (000) | Weighted- Average Exercise Price | Weighted- Average Remaining Contractual Term (years) | Aggregate Intrinsic Value | ||||||||||||
Outstanding at January 1, 2016 | 1,034 | $ | 12.09 | |||||||||||||
Granted | 167 | $ | 11.31 | |||||||||||||
Exercised | (270 | ) | $ | 10.49 | ||||||||||||
Forfeited or expired | (34 | ) | $ | 17.52 | ||||||||||||
|
|
|
| |||||||||||||
Outstanding at December 31, 2016 | 897 | $ | 12.22 | 5.9 | 6,479 | (1) | ||||||||||
|
|
|
|
|
|
|
| |||||||||
Exercisable at December 31, 2016 | 686 | $ | 11.59 | 4.9 | 5,267 | (1) | ||||||||||
|
|
|
|
|
|
|
| |||||||||
As of December 31, 2016, there was approximately $0.6 million, $1.0 million and $2.0 million of unrecognized compensation costs for stock options, restricted stock and performance based awards, respectively, to be recognized over approximately two years.
Cash proceeds from the exercise of options in the years ended December 31, 2016, 2015, and 2014 totaled approximately $2.6 million, $2.0 million, and $1.7 million, respectively. For the years ended December 31, 2016, 2015 and 2014, proceeds from stock options were presented exclusive of tax benefits in the Financing Activities section of the Consolidated Statements of Cash Flows. The total intrinsic value of options exercised during the years ended December 31, 2016, 2015 and 2014 was $2.9 million, $2.6 million and $2.0 million, respectively.
Stock Awards
During the year ended December 31, 2016, 2015 and 2014, we issued 152,510, 114,475 and 114,300 shares, respectively, of our common stock as awards to key employees and non-executive directors. The fair value of the 2016 shares issued was determined by using the grant date price of our common stock with a weighted average grant date value of $11.39. The recognized compensation expense for stock awards in the years ended December 31, 2016, 2015, and 2014 was approximately $2.3 million, $2.4 million, and $1.3 million, respectively. The shares issued in 2016, 2015 and 2014 vest over three years.
Performance Based Awards
On March 16, 2016 and April 30, 2015, we awarded performance share units (the “PSUs”) to our executive officers. The PSUs are a form of long-term incentive compensation designed to directly align the interests of employees to the interests of our stockholders, and to create long-term stockholder value. The awards were made pursuant to the NN, Inc. 2011 Stock Incentive Plan and a Performance Share Unit Agreement.
There were two tranches of PSUs awarded, PSUs based on total shareholder return (“TSR Awards”) and PSUs based on return on invested capital (“ROIC Awards”). The TSR Awards vest, if at all, upon our achieving a specified relative total shareholder return, which will be measured against the total shareholder return of the S&P SmallCap 600 Index during the period beginning on March 16, 2016 and ending December 31, 2018 for the 2016 awards and the period beginning February 1, 2015 and ending December 31, 2017 for the 2015 awards (the “Performance Periods”). The ROIC Awards will vest, if at all, upon our achieving a specified average return on invested capital during the Performance Periods. If the PSUs do not vest at the end of the Performance Periods, the PSUs will expire automatically. Upon vesting, the PSUs will be settled by the issuance of shares of our common stock, subject to the executive officer’s continued employment. The actual number of shares of common stock will be issued to each award recipient at the end of the Performance Periods will be interpolated between a threshold and maximum payout amount based on actual performance results. No dividends will be paid on outstanding PSUs during the Performance Period; however, dividend equivalents will be paid based on the number of shares of common stock that are ultimately earned at the end of the Performance Periods.
With respect to the TSR Awards, a participant will earn 50% of the target number of PSUs for “Threshold Performance,” 100% of the target number of PSUs for “Target Performance,” and 150% of the target number of PSUs for “Maximum Performance.” With respect to the ROIC Awards, a participant will earn 35% of the target number of PSUs for “Threshold Performance,” 100% of the target number of PSUs for “Target Performance,” and 150% of the target number of PSUs for “Maximum Performance. For performance levels falling between the values shown below, the percentages will be determined by interpolation. The following table establish the goals with respect to TSR and ROIC:
TSR:
| 94,779 | ||||||||||
| (1,837) | ||||||||||
| Impairments | |||||||||||
| Balance as of December 31, 2020 | $ | — | |||||||||
ROIC:
Threshold Performance (35% of Shares) | Target Performance (100% of Shares) | Maximum Performance (150% of Shares) | ||||||||
| 11% | 12.5 | % | 14 | % | ||||||
The recognized compensation expense for the year ended December 31, 2016Power Solutions reporting unit, including estimation of future cash flows, which is dependent on internal forecasts, estimation of the long-term growth rate for each operating segment, and 2015 was $1.2 milliondetermination of weighted average cost of capital. Our forecasts used in the goodwill impairment analysis reflected our expectations of declines in sales resulting from COVID-19. Significant assumptions and $0.4 million, respectively, forestimates are involved in the application of the discounted cash flow model to forecast operating cash flows, including market growth and market share, sales volumes and prices, costs to produce, discount rate, and estimated capital needs. Management considers historical experience and all PSUs. Unrecognized compensation expense at December 31, 2016 was $2.0 million to be recognized over approximately two years.
During the three months ended June 30, 2016, we recorded an out of period adjustment to correct compensation expense recoded with respect to share-based awards previously granted to executives who, eitheravailable information at the time the fair values of such grant or during the applicable vesting period, were eligible to retire from the Company, upon which the vesting of all or a portion of these awards would be accelerated. If the out of period amounts would have been recorded in the appropriate periods, then the Selling, general and administrative expense line item in the Consolidated State of Operations for the years ended December 31, 2015 and 2014 would have been effected by $0.1 million and $32 thousand pre-tax amounts, respectively, increasing expense.
We completed our annual goodwill impairment review during the fourth quarters of 2016 and 2015. For the years ended December 31, 2016, 2015 and 2014, we concluded that there were no indicators of impairment at theits reporting units with goodwill.
The changesare estimated. Assumptions in the carrying amount of goodwill for the years ended December 31, 2016, 2015 and 2014 are as follows:
| Precision Bearing Components Group | Autocam Precision Components Group | Precision Engineered Products Group | Total | |||||||||||||
Balance as of December 31, 2014 | $ | 9,949 | $ | 73,992 | $ | — | $ | 83,941 | ||||||||
Currency impacts | (838 | ) | — | — | (838 | ) | ||||||||||
Goodwill acquired in acquisition | — | — | 366,795 | 366,795 | ||||||||||||
|
|
|
|
|
|
|
| |||||||||
Balance as of December 31, 2015 | $ | 9,111 | $ | 73,992 | $ | 366,795 | $ | 449,898 | ||||||||
Currency impacts | (202 | ) | (601 | ) | (2,051 | ) | (2,854 | ) | ||||||||
Adjustments to goodwill | — | — | (1,805 | ) | (1,805 | ) | ||||||||||
Other adjustments (a) | — | (2,674 | ) | 7,746 | 5,072 | |||||||||||
|
|
|
|
|
|
|
| |||||||||
Balance as of December 31, 2016 | $ | 8,909 | $ | 70,717 | $ | 370,685 | $ | 450,311 | ||||||||
|
|
|
|
|
|
|
| |||||||||
The accumulated impairment charges included in the reported goodwill balances at December 31, 2016, 2015 and 2014 were $40.0 million all of which were recorded during the years ended December 31, 2008 and 2007.
The goodwill acquired in the 2015 acquisitions within the Precision Engineered Products Group was primarily related to the PEP Acquisition. (See Note 2 of the Notes to Consolidated Financial Statements). The goodwill balance related to the PEP Acquisition is derived from the value of the Precision Engineered Products Group. This fair value was based in large part on management business plans and projected financial information whichestimating future cash flows are subject to a high degree of management judgment and complexity. Actual results may differ from these projections,The carrying value of the Power Solutions reporting unit exceeded the estimated fair value as of the March 31, 2020, analysis. As a result of our analysis, we recorded an impairment loss on goodwill of $92.9 million to the “Goodwill impairment” line on the Consolidated Statements of Operations and Comprehensive Income (Loss) for the differences may be material leading to a potential impairmentyear ended December 31, 2020. As of thisDecember 31, 2021 and 2020, there was no remaining goodwill if this reporting unit’s future results are not as forecasted.
balance.
| Mobile Solutions | Power Solutions | Total | ||||||||||||||||||
| Balance as of December 31, 2019 | $ | 32,416 | $ | 84,997 | $ | 117,413 | ||||||||||||||
| Amortization | (3,354) | (10,994) | (14,348) | |||||||||||||||||
| Balance as of December 31, 2020 | 29,062 | 74,003 | 103,065 | |||||||||||||||||
| Amortization | (3,353) | (10,994) | (14,347) | |||||||||||||||||
| Balance as of December 31, 2021 | $ | 25,709 | $ | 63,009 | $ | 88,718 | ||||||||||||||
| December 31, 2021 | December 31, 2020 | |||||||||||||||||||||||||||||||||||||||||||
| Estimated Useful Life in Years | Gross Carrying Value as of Acquisition Date | Accumulated Amortization | Net Carrying Value | Gross Carrying Value as of Acquisition Date | Accumulated Amortization | Net Carrying Value | ||||||||||||||||||||||||||||||||||||||
| Customer relationships | 12 - 20 | $ | 173,746 | $ | (87,895) | $ | 85,851 | $ | 173,746 | $ | (74,250) | $ | 99,496 | |||||||||||||||||||||||||||||||
| Trademark and trade name | 8 - 15 | 7,527 | (4,660) | 2,867 | 7,527 | (3,958) | 3,569 | |||||||||||||||||||||||||||||||||||||
| Total identified intangible assets | $ | 181,273 | $ | (92,555) | $ | 88,718 | $ | 181,273 | $ | (78,208) | $ | 103,065 | ||||||||||||||||||||||||||||||||
| Year Ending December 31, | |||||
| 2022 | $ | 14,347 | |||
| 2023 | 14,262 | ||||
| 2024 | 13,919 | ||||
| 2025 | 13,919 | ||||
| 2026 | 13,919 | ||||
| Thereafter | 18,352 | ||||
| Total | $ | 88,718 | |||
| Precision Bearing Components Group | Autocam Precision Components Group | Precision Engineered Products Group | Total | |||||||||||||
Balance as of December 31, 2014 | $ | 2,328 | $ | 50,499 | $ | — | $ | 52,827 | ||||||||
Additions | — | — | 242,980 | 242,980 | ||||||||||||
Amortization | (238 | ) | (3,625 | ) | (9,180 | ) | (13,043 | ) | ||||||||
Currency impacts | (138 | ) | (457 | ) | — | (595 | ) | |||||||||
|
|
|
|
|
|
|
| |||||||||
Balance as of December 31, 2015 | $ | 1,952 | $ | 46,417 | $ | 233,800 | $ | 282,169 | ||||||||
Amortization | (207 | ) | (3,533 | ) | (22,465 | ) | (26,205 | ) | ||||||||
Currency impacts | (27 | ) | 44 | — | 17 | |||||||||||
|
|
|
|
|
|
|
| |||||||||
Balance as of December 31, 2016 | $ | 1,718 | $ | 42,928 | $ | 211,335 | $ | 255,981 | ||||||||
|
|
|
|
|
|
|
| |||||||||
Withof December 31, 2021. Based on our analysis, the PEP Acquisition, the Precision Engineered Products Group acquired a customer relationship intangible asset of $226.5 million, a trade name intangible asset of $6.3 million, a backlog and unfavorable leasehold intangible of $7.7 million. The intangible assets have estimated useful lives of 12 years for customer relationships and 8 years for trade name, and the backlog and unfavorable leases will be amortized over the fourth quarter of 2015 and first quarter of 2016. After the estimated useful livescarrying values of the backloglong-lived assets were recoverable and inventory, the estimated amortization of intangibles will be approximately $19.7 million a year.
With the Caprock acquisition, the Precision Engineered Products Group acquired $2.5 million of intangibles, approximately $0.1 in trade names and $2.4 million in customer relationships. The intangibles have estimated useful lives of one year for trade names and 12 years for customer relationships. The estimated amortization of the intangibles will be approximately $0.2 million per year.
The Autocam Precision Components Group has an intangible asset not subject to amortization of $0.9 million related to the value of the trade names of Whirlaway. This indefinite lived intangible assetno impairment charge was impairedrecorded during the year ended December 31, 2014 as management2021.
| Balance as of December 31, 2020 | $ | 26,983 | |||
| Share of earnings | 6,261 | ||||
| Foreign currency translation gain | 801 | ||||
| Balance as of December 31, 2021 | $ | 34,045 | |||
| Year Ended December 31, | ||||||||||||||||||||
| 2021 | 2020 | 2019 | ||||||||||||||||||
| Net sales | 94,846 | 68,216 | 58,906 | |||||||||||||||||
| Cost of sales | 77,620 | 56,669 | 52,757 | |||||||||||||||||
| Income from operations | 15,429 | 10,202 | 4,745 | |||||||||||||||||
| Net income | 12,777 | 7,401 | 3,432 | |||||||||||||||||
| December 31, | ||||||||||||||
| 2021 | 2020 | |||||||||||||
| Current assets | 65,465 | 50,794 | ||||||||||||
| Noncurrent assets | 75,222 | 64,635 | ||||||||||||
| Current liabilities | 67,206 | 47,905 | ||||||||||||
| Noncurrent liabilities | 10,006 | 10,279 | ||||||||||||
With the Autocam acquisition, the Autocam Precision Components Group acquired a customer contract intangible asset of $46.2 million, a trade name intangible asset of $4.1 million, a developed technology intangible asset of $0.9$0.1 million, and net favorable leasehold intangible of $0.4 million. The trade names and customer relationship intangible assets have estimated useful lives of 15 years, and the remaining intangibles have a five year useful life. The estimated amortization for the first five year will be approximately $3.5$0.2 million per year.
The Precision Bearing Components Group acquired two customer contract intangible assets related to the acquisition of RKF and Chelsea and a trade name intangible asset related to the acquisition of RFK with an aggregate estimated fair value of $2.7 million. These intangible assets have weighted average useful lives of 10 years and are subject to amortization of approximately $0.3 million per year.
We determined our reportable segments under the provisions of GAAP related to disclosures about segments of an enterprise. Our three reportable segments are based on differences in product lines.
All of the facilities in the Precision Bearing Components Group are engaged in the production of precision steel balls, steel rollers, and metal retainers and automotive specialty products used primarily in the bearing industry. The Precision Engineered Products Group includes the Plastic and Rubber Components Group as presented in previous filings. The name of this segment was changed during 2015 after the PEP Acquisition and disposal of Delta Rubber. With the completion of the PEP Acquisition, we added a global manufacturer of highly engineered precision customized solutions serving the medical, electrical, automotive, aerospace and defense end markets. The Autocam Precision Components Group is engaged in the design and manufacture of close-tolerance, precision-machined metal components. Currently, we manufacture components for use in fuel delivery, electromechanical motor, steering and braking systems for the automotive industry and highly engineered shafts, mechanical components, complex precision assembled and tested parts and fluid system components for the HVAC and fluid power industries. This segment was renamed with the acquisition of Autocam.
December 31, 2016 Net sales Depreciation and amortization Income from operations Interest expense Income tax (benefit) expense Net income (loss) Assets Expenditures for long-lived assets December 31, 2015 Net sales Depreciation and amortization Income from operations Interest expense Income tax (benefit) expense Net income (loss) Assets Expenditures for long-lived assets December 31, 2014 Net sales Depreciation and amortization Income from operations Interest Expense Income tax (benefit) expense Net income (loss) Assets Expenditures for long- lived assets Precision
Bearing
Components
Group Precision
Engineered
Products
Group Autocam
Precision
Components
Group Corporate
and
Consolidations Total $ 248,534 $ 258,816 $ 326,138 $ — $ 833,488 11,676 28,020 22,189 603 62,488 22,985 34,744 29,516 (27,845 ) 59,400 63,154 63,154 (9,313 ) (9,313 ) 7,942 7,942 $ 220,152 $ 715,575 $ 416,490 $ 8,169 $ 1,360,386 $ 11,926 $ 5,352 $ 23,077 $ 3,465 $ 43,820 $ 261,837 $ 77,183 $ 328,260 $ — $ 667,280 11,496 11,295 21,472 219 44,482 26,310 (3,718 ) 31,700 (27,495 ) 26,797 29,899 29,899 (10,518 ) (10,518 ) (7,431 ) (7,431 ) $ 215,163 $ 743,191 $ 417,853 $ 17,319 $ 1,393,526 $ 15,111 $ 728 $ 21,341 $ 1,373 $ 38,553 $ 278,026 $ 33,351 $ 177,224 $ — $ 488,601 12,000 1,160 9,070 (84 ) 22,146 31,872 1,231 15,732 (21,148 ) 27,687 10,895 10,895 5,786 5,786 8,217 8,217 $ 214,291 $ 17,196 $ 444,548 $ 36,678 $ 712,713 $ 10,941 $ 673 $ 10,947 $ 5,041 $ 27,602
The vast majority of the acquisition related costs for the PEP Acquisition and Caprock acquisition in 2015, and the Autocam acquisition and the other three acquisitions in 2014 are reported under Corporate and Consolidations. These costs impacted income from operations at Corporate by $10.9 million and $9.8 million for the years ended December 31, 20152021, 2020, and 2014,2019, respectively. Beginning October 20, 2015Amounts due to us from the JV as of December 31, 2021 were $4.4 million, which includes a $4.0 million dividend declared by the JV in 2021 and September 1, 2014,paid to us in January 2022.
United States Europe Asia Canada Mexico S. America All foreign countries Total December 31, 2016 December 31, 2015 December 31, 2014 Net Sales Property,
Plant and
Equipment,
Net Net Sales Property,
Plant and
Equipment,
Net Net Sales Property,
Plant and
Equipment,
Net $ 456,102 $ 176,632 $ 326,747 $ 183,226 $ 204,360 $ 129,232 172,895 78,664 170,921 77,147 167,665 82,783 102,853 33,867 86,564 35,345 58,470 32,848 10,980 — 9,759 — 8,657 — 54,390 6,308 39,118 2,971 25,900 2,637 36,268 27,482 34,171 20,279 23,549 30,942 377,386 146,321 340,533 135,742 284,241 149,210 $ 833,488 $ 322,953 $ 667,280 $ 318,968 $ 488,601 $ 278,442
Due to the large number of countries in which we sell our products, sales to external customers and long-lived assets utilized by us are reported in the above geographical regions.
Income (loss)from continuing operations before provision (benefit)benefit (provision) for income taxes for the years ended December 31, 2016, 2015 and 2014 was as follows:
| Year ended December 31, | ||||||||||||
| 2016 | 2015 | 2014 | ||||||||||
Income (loss) before provision (benefit) for income taxes: | ||||||||||||
United States | $ | (32,498 | ) | $ | (42,450 | ) | $ | (9,341 | ) | |||
Foreign | 25,189 | 19,500 | 22,513 | |||||||||
|
|
|
|
|
| |||||||
Total | $ | (7,309 | ) | $ | (22,950 | ) | $ | 13,172 | ||||
|
|
|
|
|
| |||||||
share of net income from joint venture.
| Years Ended December 31, | ||||||||||||||||||||
| 2021 | 2020 | 2019 | ||||||||||||||||||
| United States | $ | (35,325) | $ | (146,963) | $ | (31,760) | ||||||||||||||
| Foreign | 12,883 | (5,125) | (365) | |||||||||||||||||
| Loss from continuing operations before benefit (provision) for income taxes and share of net income from joint venture | $ | (22,442) | $ | (152,088) | $ | (32,125) | ||||||||||||||
The loss of $42.5 million from domestic operations during 2015, was primarily driven from acquisition related charges (included in selling, general and administrative of $11.7 million, cost of products sold $7.5 million and write-off of debt issuance costs of $18.7 million) of which approximately $3.8 million was non-deductible as these costs were directly facilitative to the acquisitions.
The loss of $9.3 million from domestic operations during 2014, was primarily driven from acquisition related charges of $14.8 million (included in selling, general and administrative, cost of products sold, and interest expense) of which approximately $6.0 million were non-deductible as these costs were directly facilitative to the acquisitions.
Totalfollowing table summarizes total income tax expense (benefit) for the years ended December 31, 2016, 2015, and 2014 was as follows:
| Year ended December 31, | ||||||||||||
| 2016 | 2015 | 2014 | ||||||||||
Current: | ||||||||||||
U.S. Federal | $ | — | $ | — | $ | — | ||||||
State | 1,017 | 420 | 37 | |||||||||
Foreign | 6,968 | 5,940 | 7,082 | |||||||||
|
|
|
|
|
| |||||||
Total current expense | $ | 7,985 | $ | 6,360 | $ | 7,119 | ||||||
|
|
|
|
|
| |||||||
Deferred: | ||||||||||||
U.S. Federal | $ | (11,033 | ) | $ | (13,391 | ) | $ | 1,625 | ||||
State | (6,440 | ) | (1,869 | ) | (382 | ) | ||||||
U.S. deferred tax valuation allowance | 1,882 | — | (1,434 | ) | ||||||||
Foreign | (1,707 | ) | (1,618 | ) | (1,142 | ) | ||||||
|
|
|
|
|
| |||||||
Total deferred expense (benefit) | (17,298 | ) | (16,878 | ) | (1,333 | ) | ||||||
|
|
|
|
|
| |||||||
Total expense (benefit) (a) | $ | (9,313 | ) | $ | (10,518 | ) | $ | 5,786 | ||||
|
|
|
|
|
| |||||||
Arecognized in each year.
| Years Ended December 31, | ||||||||||||||||||||
| 2021 | 2020 | 2019 | ||||||||||||||||||
| Current taxes: | ||||||||||||||||||||
| U.S. Federal | $ | (19) | $ | (299) | $ | (5,948) | ||||||||||||||
| State | (615) | 4,599 | 1,656 | |||||||||||||||||
| Foreign | 3,014 | 2,250 | 2,247 | |||||||||||||||||
| Total current tax expense (benefit) | 2,380 | 6,550 | (2,045) | |||||||||||||||||
| Deferred taxes: | ||||||||||||||||||||
| U.S. Federal | $ | (8,421) | $ | (10,368) | $ | (1,430) | ||||||||||||||
| State | (1,099) | (5,368) | 3,850 | |||||||||||||||||
| Foreign | (154) | (1,852) | 522 | |||||||||||||||||
| U.S. federal and foreign valuation allowance | 5,538 | 2,066 | (592) | |||||||||||||||||
| Total deferred tax expense (benefit) | (4,136) | (15,522) | 2,350 | |||||||||||||||||
| Total income tax expense (benefit) | $ | (1,756) | $ | (8,972) | $ | 305 | ||||||||||||||
| Years Ended December 31, | ||||||||||||||||||||
| 2021 | 2020 | 2019 | ||||||||||||||||||
| U.S federal statutory income tax rate | 21.0 | % | 21.0 | % | 21.0 | % | ||||||||||||||
| Change in valuation allowance, exclusive of state | (20.0) | % | (1.3) | % | 1.8 | % | ||||||||||||||
| State taxes, net of federal taxes, exclusive of tax reform | 4.5 | % | 0.2 | % | (13.6) | % | ||||||||||||||
| Non-U.S. earnings taxed at different rates | 3.0 | % | 1.4 | % | 3.0 | % | ||||||||||||||
| GILTI | (6.0) | % | (0.1) | % | — | % | ||||||||||||||
| Goodwill impairment | — | % | (12.7) | % | — | % | ||||||||||||||
| Nondeductible asset loss | — | % | — | % | (2.2) | % | ||||||||||||||
| Research and development tax credit | 2.3 | % | 0.4 | % | 2.2 | % | ||||||||||||||
| Change in uncertain tax positions | 0.7 | % | 2.2 | % | 4.3 | % | ||||||||||||||
| Impact of 2019 Treasury regulations | — | % | — | % | (18.4) | % | ||||||||||||||
| CARES Act | — | % | 2.7 | % | — | % | ||||||||||||||
| Return to provision | 0.8 | % | (0.5) | % | (0.2) | % | ||||||||||||||
| Taxes on unremitted foreign earnings | 2.0 | % | (3.9) | % | (2.2) | % | ||||||||||||||
| Restructuring gain | — | % | (2.6) | % | — | % | ||||||||||||||
| Intercompany lending | (5.3) | % | — | % | — | % | ||||||||||||||
| Warrant revaluation | 6.5 | % | — | % | — | % | ||||||||||||||
| Other adjustments, net | (1.7) | % | (0.9) | % | 3.3 | % | ||||||||||||||
| Effective tax rate | 7.8 | % | 5.9 | % | (1.0) | % | ||||||||||||||
| Year ended December 31, | ||||||||||||
| 2016 | 2015 | 2014 | ||||||||||
Income taxes at the federal statutory rate | $ | (2,490 | ) | $ | (7,803 | ) | $ | 4,478 | ||||
Decrease in U.S. valuation allowance | 1,882 | — | (1,434 | ) | ||||||||
Foreign tax credit (additions) expiration | (2,545 | ) | (1,343 | ) | 2,736 | |||||||
State taxes, net of federal taxes | (1,558 | ) | (1,592 | ) | (362 | ) | ||||||
Non-U.S. earnings taxed at different rates | (2,938 | ) | (2,308 | ) | (1,714 | ) | ||||||
Non-deductible mergers and acquisition costs | — | 1,299 | 1,971 | |||||||||
R&D Tax credit | (282 | ) | (623 | ) | (529 | ) | ||||||
Change in uncertain tax positions | (994 | ) | — | — | ||||||||
Other permanent differences, net | (388 | ) | 1,852 | 640 | ||||||||
|
|
|
|
|
| |||||||
| $ | (9,313 | ) | $ | (10,518 | ) | $ | 5,786 | |||||
|
|
|
|
|
| |||||||
equity holdings related to the Power Solutions segment. The 2016restructuring process created a deferred gain, required to be realized upon the third party equity sale, equal to the fair market value of the distributed assets over tax basis. The associated U.S. federal, state, and foreign tax impacts are reflected in the tables within this footnote.
The 2015 effectivefederal statutory tax rate of 46% primarily reflects21% principally due to a discrete tax charge of $6.0 million related to final tax regulations published by the impactDepartment of the Treasury and Internal Revenue Service on February 4, 2019. The tax rate was also impacted by valuation of its state tax attributes.
| As of December 31, | ||||||||||||||
| 2021 | 2020 | |||||||||||||
| Deferred income tax liabilities: | ||||||||||||||
| Tax in excess of book depreciation | $ | 25,732 | $ | 27,459 | ||||||||||
| Intangible assets | 20,812 | 23,695 | ||||||||||||
| Operating leases | 10,473 | 11,149 | ||||||||||||
| Interest rate swap | 37 | — | ||||||||||||
| Taxes on unremitted foreign earnings | 5,630 | 6,601 | ||||||||||||
| Other deferred tax liabilities | 1,007 | 533 | ||||||||||||
| Total deferred income tax liabilities | 63,691 | 69,437 | ||||||||||||
| Deferred income tax assets: | ||||||||||||||
| Interest expense limitation | 7,141 | 3,811 | ||||||||||||
| Goodwill | 24,262 | 25,653 | ||||||||||||
| Inventories | 3,368 | 3,224 | ||||||||||||
| Interest rate swap | — | 3,611 | ||||||||||||
| Pension and personnel accruals | 2,422 | 2,909 | ||||||||||||
| Operating leases | 12,834 | 13,209 | ||||||||||||
| Net operating loss carryforwards | 23,629 | 18,659 | ||||||||||||
| Unrealized losses | 2,143 | 1,529 | ||||||||||||
| Credit carryforwards | 3,044 | 3,574 | ||||||||||||
| Accruals and reserves | 1,435 | 2,399 | ||||||||||||
| Other deferred tax assets | 2,080 | 1,362 | ||||||||||||
| Deferred income tax assets before valuation allowance | 82,358 | 79,940 | ||||||||||||
| Valuation allowance on deferred tax assets | (25,809) | (21,681) | ||||||||||||
| Total deferred income tax assets | 56,549 | 58,259 | ||||||||||||
| Net deferred income tax liabilities | $ | 7,142 | $ | 11,178 | ||||||||||
December 31, 2021. The 2014 effective tax rateforeign NOLs have an indefinite life; however, management believes that benefit for certain of 44% reflects the impactforeign NOLs may not be realized. Therefore, we have established a valuation allowance of two items$2.3 million to reduce the carrying value of the asset related to the merger and acquisition activity in 2014, including: (1) $2.0 million for non-deductible third party merger and acquisition costs, as these costs were directly facilitativeforeign NOLs to the acquisitions;amount that has been determined to be more likely than not realized.
The tax effects of the temporary differencesjurisdictions, respectively, as of December 31, 2016, 2015 and 2014 are as follows:
| December 31, | ||||||||||||
| 2016 | 2015 | 2014 | ||||||||||
Deferred income tax liabilities: | ||||||||||||
Tax in excess of book depreciation | $ | 43,336 | $ | 42,345 | $ | 35,411 | ||||||
Goodwill | 1,580 | 1,554 | 1,949 | |||||||||
Intangible assets | 86,492 | 91,947 | 15,944 | |||||||||
Other deferred tax liabilities | 1,771 | 897 | 1,924 | |||||||||
|
|
|
|
|
| |||||||
Gross deferred income tax liabilities | 133,179 | 136,743 | 55,228 | |||||||||
Deferred income tax assets: | ||||||||||||
Goodwill | 1,165 | 1,666 | 2,411 | |||||||||
Inventories | 960 | 4,490 | 2,035 | |||||||||
Pension/Personnel accruals | 1,602 | 2,778 | 3,029 | |||||||||
Net operating loss carry forwards | 10,296 | 8,313 | 1,196 | |||||||||
Foreign tax credits | 5,759 | 3,242 | 290 | |||||||||
Guarantee claim deduction | 414 | 1,141 | 1,141 | |||||||||
Credit carry forwards | 4,581 | 4,958 | 1,853 | |||||||||
Accruals and reserves | 1,741 | — | — | |||||||||
Other deferred tax assets | 11,160 | 2,510 | 1,926 | |||||||||
|
|
|
|
|
| |||||||
Gross deferred income tax assets | 37,678 | 29,098 | 13,881 | |||||||||
Valuation allowance on deferred tax assets | (4,090 | ) | (2,376 | ) | — | |||||||
|
|
|
|
|
| |||||||
Net deferred income tax assets | 33,588 | 26,722 | 13,881 | |||||||||
|
|
|
|
|
| |||||||
Net deferred income tax assets (liabilities) (b) | $ | (99,591 | ) | $ | (110,021 | ) | $ | (41,347 | ) | |||
|
|
|
|
|
| |||||||
With the PEP Acquisition during 2015,foreign tax credits. In addition, we assumed $87.6have $1.0 million in net deferred tax liabilities primarily related to book and tax basis difference in fixed assets and intangibles (excluding goodwill).
With the Autocam acquisition during 2014, we assumed $43.8 million in net deferred tax liabilities primarily related to book and tax basis differences in fixed assets and intangibles (excluding goodwill).
As realization of certainstate deferred tax assets for which we believe recognition is not assured, managementappropriate.
| Balance at Beginning of Year | Additions | Recoveries | Balance at End of Year | |||||||||||||
2016 | $ | 2,376 | $ | 1,882 | $ | (168 | ) | $ | 4,090 | |||||||
2015 | $ | — | $ | 2,376 | $ | — | $ | 2,376 | ||||||||
2014 | $ | 1,434 | $ | — | $ | (1,434 | ) | $ | — | |||||||
form of cumulative losses is no longer present allowing additional weight to be given to subjective evidence such as our projections for growth.
During 2015, the valuation allowance increased by approximately $2.4 million, consisting solely of an increase due to the uncertainty of realizing certain local tax credits of a foreign subsidiary.
During 2014, the valuation allowance of $1.4 million on our previously recognized foreign tax credits was reduced by the full $1.4 million for credits which expired as of December 31, 2014. In addition to the foreign tax credits with the full valuation allowance, $1.3 million in foreign tax credits expired unused as of December 31, 2014. These foreign tax credits were not utilized during 2014, as management expected, due to the large amount of non-deductible mergers and acquisition costs incurred related to the four acquisitions completed in 2014. The remaining foreign tax credits,reserved net operating loss and credit carry forwards are expected to be utilized before expiration. We recordcarryforwards in certain foreign jurisdictions.
Unremitted earnings of subsidiaries outside the U.S. are considered to be reinvested indefinitely at December 31, 2016. It isTax Cuts and Jobs Act of 2017 and subsequent recognition in income of GILTI, we do not practicable to determine the deferred tax liability for temporaryhave material basis differences related to thosecumulative unremitted earnings. There has been no change in our long term international expansion plans asearnings for U.S. income tax purposes. However, we continue to evaluate quarterly the impact that repatriation of December 31, 2016,foreign earnings would have on withholding and our intent and ability is to indefinitely reinvest our foreign earnings. We base this assertion on two factors. The first factor is our intention to invest in foreign countries that are strategically important to our Precision Bearing Components, Precision Engineered Products and Autocam Precision Components Groups. With the acquisitions completed in 2015 and 2014, we have significantly expanded our international base of operations adding subsidiaries in Mexico, Bosnia and Herzegovina, Brazil, Poland, France and China which will require more foreign investment. Second, we have sufficient access to funds in the U.S. through projected free cash flows and the availability of our U.S. credit facilities to fund currently anticipated domestic operational and investment needs.
A reconciliation of the beginning and ending amounts of unrecognized tax benefits, excluding interest and penalties for the years ended December 31, 2016, 2015 and 2014 is as follows:
| 2016 | 2015 | 2014 | ||||||||||
Beginning balance | $ | 5,724 | $ | 3,834 | $ | 873 | ||||||
Additions for tax positions of prior years | 179 | 2,516 | 3,589 | |||||||||
Reductions for tax positions of prior years | (1,162 | ) | (626 | ) | (628 | ) | ||||||
|
|
|
|
|
| |||||||
Ending balance | $ | 4,741 | $ | 5,724 | $ | 3,834 | ||||||
|
|
|
|
|
| |||||||
other taxes. As of December 31, 2016,2021, we have recorded a liability of $5.6 million for the $4.7 millionanticipated withholding taxes that would be due upon repatriation of unrecognizedthe unremitted earnings of those subsidiaries for which management does not intend to permanently reinvest all earnings.
operations.
| Years Ended December 31, | ||||||||||||||||||||
| 2021 | 2020 | 2019 | ||||||||||||||||||
| Balance at beginning of year | $ | 247 | $ | 2,589 | $ | 4,609 | ||||||||||||||
| Additions for tax positions of prior years | — | 121 | — | |||||||||||||||||
| Settlements for tax positions of prior years | — | — | (275) | |||||||||||||||||
| Reductions for tax positions of prior years | (122) | (2,463) | (1,745) | |||||||||||||||||
| Balance at end of year | $ | 125 | $ | 247 | $ | 2,589 | ||||||||||||||
We or our subsidiaries file income tax returns in the U.S. federal jurisdiction, and in various states and foreign jurisdictions. With few exceptions, we are no longer subject to federal, state and local income tax examinations by tax authorities for years before 2013. We are no longer subject to non-U.S. income tax examinations within various European Union countries for years before 2011. We domay not foresee any significant changes to our unrecognized tax benefits withindecrease during the next twelve months.months as no statutes are expected to lapse within the period.
| As of December 31, | ||||||||||||||
| 2021 | 2020 | |||||||||||||
| Term Loan Facility | $ | 148,875 | $ | — | ||||||||||
| Senior Secured Term Loan | — | 47,728 | ||||||||||||
| Incremental Term Loan | — | 22,716 | ||||||||||||
| International lines of credit and other loans | 10,930 | 14,418 | ||||||||||||
| Total principal | 159,805 | 84,862 | ||||||||||||
| Less-current maturities of long-term debt | 3,074 | 4,885 | ||||||||||||
| Principal, net of current portion | 156,731 | 79,977 | ||||||||||||
| Less-unamortized debt issuance costs and discount (1) | 5,679 | 952 | ||||||||||||
| Long-term debt, net of current portion | $ | 151,052 | $ | 79,025 | ||||||||||
| Years Ending December 31, | Aggregate Maturities Principal Amounts | |||||||
| 2022 | $ | 3,074 | ||||||
| 2023 | 3,405 | |||||||
| 2024 | 3,249 | |||||||
| 2025 | 3,289 | |||||||
| 2026 | 146,788 | |||||||
| Thereafter | — | |||||||
| Total outstanding principal | $ | 159,805 | ||||||
| Years Ended December 31, | ||||||||||||||||||||||||||
| Financial Statement Line Item | 2021 | 2020 | 2019 | |||||||||||||||||||||||
| Finance lease cost: | ||||||||||||||||||||||||||
| Amortization of right-of-use assets | Depreciation and amortization | $ | 1,451 | $ | 1,272 | $ | 1,229 | |||||||||||||||||||
| Interest expense | Interest expense | 213 | 192 | 226 | ||||||||||||||||||||||
| Operating lease cost | Cost of sales and selling, general, and administrative expense | 8,014 | 8,396 | 9,108 | ||||||||||||||||||||||
| Short-term lease cost (1) | Cost of sales and selling, general, and administrative expense | 655 | 591 | 479 | ||||||||||||||||||||||
| Variable lease cost (2) | Cost of sales and selling, general, and administrative expense | 1 | 1 | 1 | ||||||||||||||||||||||
| Total lease cost | $ | 10,334 | $ | 10,452 | $ | 11,043 | ||||||||||||||||||||
| As of December 31, | ||||||||||||||||||||
| Financial Statement Line Item | 2021 | 2020 | ||||||||||||||||||
| Assets: | ||||||||||||||||||||
| Operating lease assets | Operating lease right-of-use assets | $ | 46,443 | $ | 50,264 | |||||||||||||||
| Finance lease assets | Property, plant and equipment, net | 13,641 | 14,644 | |||||||||||||||||
| Total lease assets | $ | 60,084 | $ | 64,908 | ||||||||||||||||
| Liabilities: | ||||||||||||||||||||
| Current liabilities: | ||||||||||||||||||||
| Operating lease liabilities | Current portion of operating lease liabilities | $ | 5,704 | $ | 4,797 | |||||||||||||||
| Finance lease liabilities | Other current liabilities | 3,111 | 4,252 | |||||||||||||||||
| Non-current liabilities: | ||||||||||||||||||||
| Operating lease liabilities | Operating lease liabilities, net of current portion | 51,295 | 55,053 | |||||||||||||||||
| Finance lease liabilities | Other non-current liabilities | 5,446 | 6,858 | |||||||||||||||||
| Total lease liabilities | $ | 65,556 | $ | 70,960 | ||||||||||||||||
| Years Ended December 31, | ||||||||||||||||||||
| 2021 | 2020 | 2019 | ||||||||||||||||||
| Cash paid for amounts included in the measurement of lease liabilities: | ||||||||||||||||||||
| Operating cash flows used in finance leases | $ | 213 | $ | 192 | $ | 226 | ||||||||||||||
| Operating cash flows used in operating leases | 13,434 | 13,498 | 14,090 | |||||||||||||||||
| Financing cash flows used in finance leases | 4,836 | 2,018 | 3,156 | |||||||||||||||||
| Right-of-use assets obtained in exchange for new finance lease liabilities | $ | 2,814 | $ | 728 | $ | 5,250 | ||||||||||||||
| Right-of-use assets obtained in exchange for new operating lease liabilities (1) | — | 8,682 | 8,457 | |||||||||||||||||
The maturities of lease liabilities as of December 31, 2021, is as follows:
In March 2020, we amended the lease of our corporate headquarters building to exit over half of the previously leased space and reduce annual base rent payments. The amendment was accounted for as a lease modification, and the remeasurement of the lease resulted in an $8.1 million decrease in the operating lease right-of-use (“ROU”) asset, a $10.5 million decrease in the noncurrent portion of the operating lease liability, and a $0.6 million decrease in the current portion of the operating lease liability. The $3.0 million difference between the change in the operating lease ROU asset and the operating lease liabilities was recognized in “Other operating expense (income), net,” on the Consolidated Statements of Operations and Comprehensive Income (Loss) | |||||||||||||||||||||||||||||||||||||||||||||||||||||||||||||||||||||||||||||||||||||||||||||||||||||||||||||||||||||||||||||||||||||||||||||||||||||||||||||||||||||||||||||||||||||||||||||||||||||||||||||||||||||||||||||||||||||||||||||||||||||||||||||||||||||||||||||||||||||||||||||||||||||||||||||||||||||||||
| Year ended December 31, | ||||||||||||
| 2016 | 2015 | 2014 | ||||||||||
Net income (loss) | $ | 7,942 | $ | (7,431 | ) | $ | 8,217 | |||||
Weighted average shares outstanding | 27,016 | 21,181 | 17,887 | |||||||||
Effect of dilutive stock options | 138 | — | 366 | |||||||||
|
|
|
|
|
| |||||||
Diluted shares outstanding | 27,154 | 21,181 | 18,253 | |||||||||
|
|
|
|
|
| |||||||
Basic net income (loss) per share | $ | 0.29 | $ | (0.35 | ) | $ | 0.46 | |||||
|
|
|
|
|
| |||||||
Diluted net income (loss) per share | $ | 0.29 | $ | (0.35 | ) | $ | 0.45 | |||||
|
|
|
|
|
| |||||||
Excluded from the dilutive shares outstanding for the year ended December 31, 20162020. In connection with the discontinued use of the previously leased space, we also recognized a $4.4 million termination charge and a $2.9 million impairment charge on the associated leasehold improvements, all of which were 163,200 of anti-dilutive options, which had per share exercise prices ranging from of $19.63 to $25.16. Given the net lossalso recognized in “Other operating expense (income), net” for the year ended December 31, 2015, all options2020.
We have operating lease commitments for machinery, office equipment, vehicles, manufacturing2021 and office space which expire on varying dates. Rent expense for 2016, 2015 and 20142020, was $8.6 million, $5.8$(0.2) million and $4.5$0.7 million, respectively. The following is a schedule by year
Year ending December 31, | ||||
2017 | $ | 7,824 | ||
2018 | 6,830 | |||
2019 | 5,785 | |||
2020 | 4,882 | |||
2021 | 2,802 | |||
Thereafter | 3,149 | |||
|
| |||
Total minimum lease payments | $ | 31,272 | ||
|
| |||
Content
sunfavorable decisions on all matters will be less than $5.0 million, inclusive of interest and penalties.
Allevent of an unfavorable decision and, therefore, have not accrued an amount for the remaining matters as of December 31, 2021.
relief. The Company believes the complaint and allegations to be without merit and intends to vigorously defend itself against these actions. The Company is unable at this time to determine whether the outcome of the litigation would have a material impact on the Company’s financial position, results of operations, or cash flows.
| Year Ended December 31, | |||||||||||||||||
| 2021 | |||||||||||||||||
| Beginning balance | $ | — | |||||||||||||||
| Proceeds from issuance of shares, net of issuance costs | 61,793 | ||||||||||||||||
| Fair value of 2021 Warrants issued | (14,839) | ||||||||||||||||
| Recognition of bifurcated embedded derivative | (282) | ||||||||||||||||
| Accrual of in-kind dividends | 6,222 | ||||||||||||||||
| Amortization | 913 | ||||||||||||||||
| Ending balance | $ | 53,807 | |||||||||||||||
As
| Years Ended December 31, | |||||||||||||||||
| 2021 | 2020 | 2019 | |||||||||||||||
| Beginning balance | $ | 105,086 | $ | 93,012 | $ | — | |||||||||||
| Gross proceeds from issuance of shares | — | — | 100,000 | ||||||||||||||
| Relative fair value of Warrants issued | — | — | (1,076) | ||||||||||||||
| Recognition of bifurcated embedded derivative | — | — | (2,295) | ||||||||||||||
| Allocation of issuance costs to Preferred Stock | — | — | (4,259) | ||||||||||||||
| Accrual of in-kind dividends | 14,008 | 11,121 | 590 | ||||||||||||||
| Amortization | 335 | 953 | 52 | ||||||||||||||
| Redemption | (119,429) | — | — | ||||||||||||||
| Ending balance | $ | — | $ | 105,086 | $ | 93,012 | |||||||||||
Below are the componentstransferring goods or services. The following tables summarize revenue by customer geographical region.
| Year Ended December 31, 2021 | ||||||||||||||||||||||||||
| Mobile Solutions | Power Solutions | Intersegment Sales Eliminations | Total | |||||||||||||||||||||||
| United States and Puerto Rico | $ | 140,383 | $ | 152,931 | $ | (79) | $ | 293,235 | ||||||||||||||||||
| China | 52,227 | 4,745 | — | 56,972 | ||||||||||||||||||||||
| Brazil | 34,644 | 811 | — | 35,455 | ||||||||||||||||||||||
| Mexico | 19,520 | 16,177 | — | 35,697 | ||||||||||||||||||||||
| Germany | 5,230 | 546 | — | 5,776 | ||||||||||||||||||||||
| Poland | 3,743 | 18 | — | 3,761 | ||||||||||||||||||||||
| Other | 30,116 | 16,572 | — | 46,688 | ||||||||||||||||||||||
| Total net sales | $ | 285,863 | $ | 191,800 | $ | (79) | $ | 477,584 | ||||||||||||||||||
| Year Ended December 31, 2020 | ||||||||||||||||||||||||||
| Mobile Solutions | Power Solutions | Intersegment Sales Eliminations | Total | |||||||||||||||||||||||
| United States and Puerto Rico | $ | 129,147 | $ | 139,499 | $ | (95) | $ | 268,551 | ||||||||||||||||||
| China | 46,442 | 5,563 | — | 52,005 | ||||||||||||||||||||||
| Brazil | 27,055 | 689 | — | 27,744 | ||||||||||||||||||||||
| Mexico | 16,465 | 13,400 | — | 29,865 | ||||||||||||||||||||||
| Germany | 5,846 | 378 | — | 6,224 | ||||||||||||||||||||||
| Poland | 4,913 | 14 | — | 4,927 | ||||||||||||||||||||||
| Other | 26,492 | 11,726 | — | 38,218 | ||||||||||||||||||||||
| Total net sales | $ | 256,360 | $ | 171,269 | $ | (95) | $ | 427,534 | ||||||||||||||||||
| Year Ended December 31, 2019 | ||||||||||||||||||||||||||
| Mobile Solutions | Power Solutions | Intersegment Sales Eliminations | Total | |||||||||||||||||||||||
| United States and Puerto Rico | $ | 162,445 | $ | 156,945 | $ | (335) | $ | 319,055 | ||||||||||||||||||
| China | 38,793 | 6,722 | — | 45,515 | ||||||||||||||||||||||
| Brazil | 36,058 | 300 | — | 36,358 | ||||||||||||||||||||||
| Mexico | 18,815 | 13,489 | — | 32,304 | ||||||||||||||||||||||
| Germany | 6,372 | 65 | — | 6,437 | ||||||||||||||||||||||
| Poland | 6,363 | 15 | — | 6,378 | ||||||||||||||||||||||
| Other | 28,903 | 14,564 | — | 43,467 | ||||||||||||||||||||||
| Total net sales | $ | 297,749 | $ | 192,100 | $ | (335) | $ | 489,514 | ||||||||||||||||||
Balance as of August 29, 2014 | $ | 35,595 | ||
Dividends received | (2,538 | ) | ||
Our share of cumulative earnings | 1,646 | |||
Accretion of basis difference from purchase accounting | (372 | ) | ||
|
| |||
Balance as of December 31, 2014 | $ | 34,331 | ||
Capital contributions | 1,999 | |||
Dividends received | (2,868 | ) | ||
Our share of cumulative earnings | 5,440 | |||
Accretion of basis difference from purchase accounting | (440 | ) | ||
|
| |||
Balance as of December 31, 2015 | $ | 38,462 | ||
Our share of cumulative earnings | 6,427 | |||
Dividends declared and paid by joint venture | (3,706 | ) | ||
Accretion of basis difference from purchase accounting | (489 | ) | ||
|
| |||
Balance as of December 31, 2016 | $ | 40,694 | ||
|
|
Set forth below2020. Comparable sales data by customer industry is summarized balance sheetnot available prior to 2020. Our products in the automotive industry include high-precision components and assemblies for electric power steering systems, electric braking, electric motors, fuel systems, emissions control, transmissions, moldings, stampings, sensors, and electrical contacts. Our products in the general industrial industry include high-precision metal and plastic components for a variety of industrial applications including diesel industrial motors, heating and cooling systems, fluid power systems, power tools, and more. While many of the industries we serve include electrical components, our products in the residential/commercial electrical industry category in the following tables include components used in smart meters, charging stations, circuit breakers, transformers, electrical contact assemblies, precision stampings, welded contact assemblies, and specification plating and surface finishing.
| Year Ended December 31, 2021 | ||||||||||||||||||||||||||
| Mobile Solutions | Power Solutions | Intersegment Sales Eliminations | Total | |||||||||||||||||||||||
| Automotive | $ | 182,094 | $ | 38,779 | $ | — | $ | 220,873 | ||||||||||||||||||
| General Industrial | 90,290 | 60,312 | — | 150,602 | ||||||||||||||||||||||
| Residential/Commercial Electrical | — | 61,748 | — | 61,748 | ||||||||||||||||||||||
| Other | 13,479 | 30,961 | (79) | 44,361 | ||||||||||||||||||||||
| Total net sales | $ | 285,863 | $ | 191,800 | $ | (79) | $ | 477,584 | ||||||||||||||||||
| Year Ended December 31, 2020 | ||||||||||||||||||||||||||
| Mobile Solutions | Power Solutions | Intersegment Sales Eliminations | Total | |||||||||||||||||||||||
| Automotive | $ | 170,389 | $ | 31,422 | $ | — | $ | 201,811 | ||||||||||||||||||
| General Industrial | 75,610 | 52,714 | — | 128,324 | ||||||||||||||||||||||
| Residential/Commercial Electrical | — | 58,143 | — | 58,143 | ||||||||||||||||||||||
| Other | 10,361 | 28,990 | (95) | 39,256 | ||||||||||||||||||||||
| Total net sales | $ | 256,360 | $ | 171,269 | $ | (95) | $ | 427,534 | ||||||||||||||||||
| Deferred Revenue | ||||||||
| Balance at December 31, 2020 | $ | 766 | ||||||
| Balance at December 31, 2021 | $ | 489 | ||||||
| December 31, | December 31, | |||||||
| 2016 | 2015 | |||||||
Current assets | $ | 31,295 | $ | 24,663 | ||||
Non-current assets | 22,522 | 22,847 | ||||||
|
|
|
| |||||
Total assets | $ | 53,817 | $ | 47,510 | ||||
|
|
|
| |||||
Current liabilities | $ | 13,549 | $ | 11,171 | ||||
|
|
|
| |||||
Total liabilities | $ | 13,549 | $ | 11,171 | ||||
|
|
|
| |||||
DividendsConsolidated Balance Sheets. These contract liabilities are reported on the Consolidated Balance Sheets on a contract-by-contract basis at the end of $3.7 million were declared for year ended December 31, 2015each reporting period as deferred revenue. Deferred revenue relates to payments received in advance of performance under the contract and paid byrecognized as revenue as (or when) we perform under the JVcontract. Changes in the contract liability balances during the year ended December 31, 2016. We had sales to the JV of $0.1 million2021, were not materially impacted by any other factors. Revenue recognized for the year ended December 31, 2016. Amounts due2021, from amounts included in deferred revenue at the beginning of the period for performance obligations satisfied or partially satisfied during the period was $0.8 million. Deferred revenue is reported in the “Other current liabilities” line on the Consolidated Balance Sheets.
Dividends of $2.8 million were declared for year ended December 31, 2014 and paid by the JV during the year ended December 31, 2015. Our 49% ownership interest2019. Revenues from this customer are in this amount isour Mobile Solutions segment and were less than 10% of consolidated net of a 10% withholding tax levied bysales during the Chinese government. We had sales to the JV of $0.1 million for the yearyears ended December 31, 2015. Amounts due to us from2021 and 2020.
No dividends were declared by the JV for the four months ended December 31, 2014. We had sales$0.4 million attributable to the JV of $36 thousand during the four months ended December 31, 2014. Amounts due to us from JV were $0.2 million as of December 31, 2014. The JV had net sales in 2014 of $50.5 million and net income of $9.0 million.
The following summarizes the unaudited quarterly results ofdiscontinued operations for the years ended December 31, 20162020, and 2015.2019, respectively. The following table lists the components of share-based compensation expense by type of award.
| Years Ended December 31, | ||||||||||||||||||||
| 2021 | 2020 | 2019 | ||||||||||||||||||
| Stock options | $ | 253 | $ | 741 | $ | 881 | ||||||||||||||
| Restricted stock | 2,166 | 3,473 | 1,897 | |||||||||||||||||
| Performance share units | 1,420 | 755 | 1,155 | |||||||||||||||||
Change in estimate of share-based award vesting (1) | (623) | (743) | (1,111) | |||||||||||||||||
| Share-based compensation expense | $ | 3,216 | $ | 4,226 | $ | 2,822 | ||||||||||||||
| Year ended December 31, 2016 | ||||||||||||||||
| March 31 | June 30 | Sept. 30 | Dec. 31 | |||||||||||||
Net sales | $ | 212,226 | $ | 214,272 | $ | 204,961 | $ | 202,029 | ||||||||
Income from operations | $ | 11,874 | $ | 16,703 | $ | 18,727 | $ | 12,096 | ||||||||
Net income (a) | $ | (1,299 | ) | $ | 2,031 | $ | 4,147 | $ | 3,063 | |||||||
Comprehensive income (loss)(a) | $ | 4,418 | $ | (973 | ) | $ | 8,740 | $ | (10,212 | ) | ||||||
Basic net income per share | $ | (0.05 | ) | $ | 0.08 | $ | 0.15 | $ | 0.11 | |||||||
Diluted net income per share | $ | (0.05 | ) | $ | 0.07 | $ | 0.15 | $ | 0.11 | |||||||
Weighted average shares outstanding: | ||||||||||||||||
Basic number of shares | 26,869 | 27,024 | 27,159 | 27,241 | ||||||||||||
Effect of dilutive stock options | — | 163 | 163 | 180 | ||||||||||||
|
|
|
|
|
|
|
| |||||||||
Diluted number of shares | 26,869 | 27,187 | 27,322 | 27,421 | ||||||||||||
|
|
|
|
|
|
|
| |||||||||
| Year ended December 31, 2015 | ||||||||||||||||
| March 31 | June 30 | Sept. 30 | Dec. 31 | |||||||||||||
Net sales | $ | 163,746 | $ | 164,856 | $ | 154,824 | $ | 183,854 | ||||||||
Income from operations | $ | 13,934 | $ | 13,589 | $ | 10,122 | $ | (10,848 | ) | |||||||
Net income (a) | $ | 6,001 | $ | 6,953 | $ | 4,630 | $ | (25,015 | ) | |||||||
Comprehensive income (loss)(a) | $ | (11,856 | ) | $ | 10,955 | $ | (2,121 | ) | $ | (28,929 | ) | |||||
Basic net income per share | $ | 0.32 | $ | 0.36 | $ | 0.17 | $ | (0.93 | ) | |||||||
Diluted net income per share | $ | 0.31 | $ | 0.36 | $ | 0.17 | $ | (0.93 | ) | |||||||
Weighted average shares outstanding: | ||||||||||||||||
Basic number of shares | 18,996 | 19,215 | 26,839 | 26,840 | ||||||||||||
Effect of dilutive stock options | 384 | 367 | 328 | — | ||||||||||||
|
|
|
|
|
|
|
| |||||||||
Diluted number of shares | 19,380 | 19,582 | 27,167 | 26,840 | ||||||||||||
|
|
|
|
|
|
|
| |||||||||
(1) Amounts reflect the decrease in share-based compensation expense based on the change in estimate of the probability of vesting of share-based awards. Unrecognized compensation cost related to unvested awards was $3.8 million as of December 31, 2021. We expect that cost to be recognized over a weighted-average period of 1.7 years. Stock Options Option awards were typically granted to key employees on an annual basis by the Compensation Committee of the Board of Directors. All options have an exercise price equal to the closing price of our stock on the date of grant. The term life of options is generally ten years with a vesting period of generally three years. During the years ended 2020 and 2019, we granted options to purchase 159 thousand, and 210 thousand shares, respectively, to certain key employees. The weighted average grant-date fair value of the options granted during 2020 and 2019 was $4.76, and $2.77 per share, respectively. No options were granted in 2021. The fair value of our options cannot be determined by market value because they are not traded in an open market. Accordingly, we utilized the Black Scholes financial pricing model to estimate the fair value. The following table shows the weighted average assumptions relevant to determining the fair value of stock options granted in each year.
The expected term is derived from using the simplified method of determining stock option terms as described under the SAB Topic 14, Share-based payment. The simplified method was used because sufficient historical stock option exercise experience was not available, primarily due to the transformation of the management structure over the past several years. The average risk-free interest rate is derived from United States Department of Treasury published interest rates of daily yield curves for the same time period as the expected term. The expected dividend yield is derived by a mathematical formula which uses the expected annual dividends over the expected term divided by the fair market value of our common stock at the grant date. The expected dividend yield for 2020 grants reflects no expected annual dividends over the expected term because we discontinued dividends in 2019. The expected volatility rate is derived from our actual common stock historical volatility over the same time period as the expected term. The expected volatility rate is derived by a mathematical formula utilizing daily closing price data. The expected forfeiture rate is determined from examining the historical pre-vesting forfeiture patterns of past option issuances to key employees. While the expected forfeiture rate is not an input of the Black Scholes financial pricing model for determining the fair value of the options, it is an important determinant of stock option compensation expense to be recorded. 65 The following table presents stock option activity for the | ||||||||||||||||||||||||||||||||||||||||||||||||||||||||||||||||||||||||||||||||||||||||||||||||||||||||||||||||||||||||||||||||||||||||||||||||||||
The year ended December 31, 2021.
| Number of Options (in thousands) | Weighted- Average Exercise Price (per share) | Weighted- Average Remaining Contractual Term (years) | Aggregate Intrinsic Value | |||||||||||||||||||||||||||||
| Outstanding at January 1, 2021 | 871 | $ | 12.41 | |||||||||||||||||||||||||||||
| Exercised | (6) | 7.93 | $ | 8 | ||||||||||||||||||||||||||||
| Forfeited | (22) | 9.29 | ||||||||||||||||||||||||||||||
| Expired | (222) | 13.31 | ||||||||||||||||||||||||||||||
| Outstanding at December 31, 2021 | 621 | $ | 12.24 | 3.8 years | $ | — | (1) | |||||||||||||||||||||||||
| Exercisable at December 31, 2021 | 532 | $ | 12.80 | 3.2 years | $ | — | (1) | |||||||||||||||||||||||||
| Nonvested Restricted Shares (in thousands) | Weighted Average Grant-Date Fair Value (per share) | |||||||||||||
| Unvested at January 1, 2021 | 385 | $ | 9.42 | |||||||||||
| Granted | 459 | 6.84 | ||||||||||||
| Vested | (303) | 9.34 | ||||||||||||
| Forfeited | (72) | 7.22 | ||||||||||||
| Unvested at December 31, 2021 | 469 | $ | 7.28 | |||||||||||
| TSR Awards: | Threshold Performance (50% of Shares) | Target Performance (100% of Shares) | Maximum Performance (150% of Shares) | |||||||||||||||||
| 2021 grants | 35 | th Percentile | 50 | th Percentile | 75 | th Percentile | ||||||||||||||
| 2020 grants | 35 | th Percentile | 50 | th Percentile | 75 | th Percentile | ||||||||||||||
| 2019 grants | 35 | th Percentile | 50 | th Percentile | 75 | th Percentile | ||||||||||||||
| ROIC Awards: | Threshold Performance (35% or 50% of Shares)(1) | Target Performance (100% of Shares) | Maximum Performance (150% of Shares) | |||||||||||||||||
| 2021 grants | 6.3 | % | 7.0 | % | 8.6 | % | ||||||||||||||
| 2020 grants (2) | 6.7 | % | 7.9 | % | 8.7 | % | ||||||||||||||
| 2019 grants | 4.7 | % | 5.8 | % | 7.0 | % | ||||||||||||||
The fourthmodified by the compensation committee of the board of directors in the first quarter of 2015 was impacted by merger and acquisition related costs of $18.7 million pre-tax, and $11.6 million after-tax primarily related2021 to the PEP Acquisition. Additionally, the fourth quarter was negatively impacted by $18.7 million in pre-tax costs and $12.0 million in after-tax costs incurred related to writing-off debt issuance costs to our former lenders related to the new debt entered intoadjust for the PEP Acquisition.
sale of the Life Sciences business and the ongoing effects of the COVID-19 pandemic. Threshold Performance was changed to 6.7% to earn 50% of Shares, Target Performance was changed to 7.9% to earn 100% of Shares, and Maximum Performance was changed to 8.7% to earn 150% of Shares.
| TSR Awards | ROIC Awards | |||||||||||||||||||||||||
| Award Year | Shares (in thousands) | Grant-Date Fair Value (per share) | Shares (in thousands) | Grant-Date Fair Value (per share) | ||||||||||||||||||||||
| 2021 | 142 | $ | 8.58 | 172 | $ | 7.20 | ||||||||||||||||||||
| 2020 | 139 | $ | 10.88 | 157 | $ | 9.44 | ||||||||||||||||||||
| 2019 | 136 | $ | 9.28 | 174 | $ | 7.93 | ||||||||||||||||||||
| Nonvested TSR Awards | Nonvested ROIC Awards | |||||||||||||||||||||||||
| Number of Shares (in thousands) | Weighted Average Grant-Date Fair Value | Number of Shares (in thousands) | Weighted Average Grant-Date Fair Value | |||||||||||||||||||||||
| Nonvested at January 1, 2021 | 138 | $ | 10.58 | 160 | $ | 9.13 | ||||||||||||||||||||
| Granted | 142 | 8.58 | 172 | 7.20 | ||||||||||||||||||||||
| Forfeited | (61) | 9.61 | (71) | 8.17 | ||||||||||||||||||||||
| Expired | (25) | 9.28 | (33) | 7.93 | ||||||||||||||||||||||
| Nonvested at December 31, 2021 | 194 | $ | 9.59 | 228 | $ | 8.14 | ||||||||||||||||||||
| Foreign Currency Translation | Interest rate swap | Income taxes (1) | Total | |||||||||||||||||||||||
| Balance at December 31, 2018 | $ | (31,314) | $ | — | $ | — | $ | (31,314) | ||||||||||||||||||
| Other comprehensive income (loss) before reclassifications | (3,845) | (13,645) | 3,166 | (14,324) | ||||||||||||||||||||||
| Amounts reclassified from AOCI to interest expense (2) | — | 1,411 | (327) | 1,084 | ||||||||||||||||||||||
| Net other comprehensive income (loss) | (3,845) | (12,234) | 2,839 | (13,240) | ||||||||||||||||||||||
| Balance at December 31, 2019 | $ | (35,159) | $ | (12,234) | $ | 2,839 | $ | (44,554) | ||||||||||||||||||
| Other comprehensive income (loss) before reclassifications | (1,683) | (16,207) | 3,764 | (14,126) | ||||||||||||||||||||||
| Amounts reclassified from AOCI to interest expense (2) | — | 8,906 | (2,068) | 6,838 | ||||||||||||||||||||||
| Amounts reclassified from AOCI to loss on interest rate swap (3) | — | 15,823 | (3,674) | 12,149 | ||||||||||||||||||||||
| Sale of discontinued operations | 5,961 | — | — | 5,961 | ||||||||||||||||||||||
| Net current-period other comprehensive income (loss) | 4,278 | 8,522 | (1,978) | 10,822 | ||||||||||||||||||||||
| Balance at December 31, 2020 | $ | (30,881) | $ | (3,712) | $ | 861 | $ | (33,732) | ||||||||||||||||||
| Other comprehensive income (loss) before reclassifications | (1,135) | 78 | (19) | (1,076) | ||||||||||||||||||||||
| Amounts reclassified from AOCI to interest expense (2) | — | 73 | (18) | 55 | ||||||||||||||||||||||
| Amounts reclassified from AOCI to loss on interest rate swap (3) | — | 3,712 | (861) | 2,851 | ||||||||||||||||||||||
| Net current-period other comprehensive income (loss) | (1,135) | 3,863 | (898) | 1,830 | ||||||||||||||||||||||
| Balance at December 31, 2021 | $ | (32,016) | $ | 151 | $ | (37) | $ | (31,902) | ||||||||||||||||||
| Years Ended December 31, | ||||||||||||||||||||
| 2021 | 2020 | 2019 | ||||||||||||||||||
| Numerator: | ||||||||||||||||||||
| Loss from continuing operations | $ | (14,425) | $ | (139,490) | $ | (30,749) | ||||||||||||||
| Less: Preferred stock cumulative dividends and deemed dividends | (21,478) | (12,373) | (642) | |||||||||||||||||
| Numerator for basic and diluted loss from continuing operations per common share (1) | (35,903) | (151,863) | (31,391) | |||||||||||||||||
| Income (loss) from discontinued operations, net of tax (Note 2) | 1,200 | 38,898 | (15,992) | |||||||||||||||||
| Numerator for basic and diluted undistributed net loss per common share (1) | $ | (34,703) | $ | (112,965) | $ | (47,383) | ||||||||||||||
| Denominator: | ||||||||||||||||||||
| Weighted average common shares outstanding | 42,991 | 42,692 | 42,299 | |||||||||||||||||
| Adjustment for unvested restricted common stock | (461) | (493) | (269) | |||||||||||||||||
| Adjustment for 2021 Warrants outstanding (2) | 1,481 | — | — | |||||||||||||||||
| Shares used to calculate income (loss) per share, basic and diluted | 44,011 | 42,199 | 42,030 | |||||||||||||||||
| Per common share net loss: | ||||||||||||||||||||
| Basic loss from continuing operations per common share | $ | (0.82) | $ | (3.60) | $ | (0.75) | ||||||||||||||
| Basic income (loss) from discontinued operations per common share | 0.03 | 0.92 | (0.38) | |||||||||||||||||
| Basic net loss per common share | $ | (0.79) | $ | (2.68) | $ | (1.13) | ||||||||||||||
| Diluted loss from continuing operations per common share | $ | (0.82) | $ | (3.60) | $ | (0.75) | ||||||||||||||
| Diluted income (loss) from discontinued operations per common share | 0.03 | 0.92 | (0.38) | |||||||||||||||||
| Diluted net loss per common share | $ | (0.79) | $ | (2.68) | $ | (1.13) | ||||||||||||||
| Cash dividends declared per common share | $ | — | $ | — | $ | 0.21 | ||||||||||||||
basic earnings per share because they are exercisable at an exercise price of $0.01 per share, subject to certain adjustments (see Note 19).
| Years Ended December 31, | ||||||||||||||||||||
| 2021 | 2020 | 2019 | ||||||||||||||||||
| Options | 766 | 871 | 577 | |||||||||||||||||
| 2019 Warrants | 1,500 | 1,500 | 1,500 | |||||||||||||||||
| Series B Preferred Stock, as-converted | — | 19,021 | 12,976 | |||||||||||||||||
| 2,266 | 21,392 | 15,053 | ||||||||||||||||||
measure assets and liabilities at fair value. An asset or liability’s classification within the various levels is determined based on the lowest level input that is significant to the fair value measurement.
| Fair Value Measurements as of December 31, 2021 | ||||||||||||||||||||
| Description | Quoted Prices in Active Markets for Identical Assets (Level 1) | Significant Other Observable Inputs (Level 2) | Significant Unobservable Inputs (Level 3) | |||||||||||||||||
| Derivative liability - other non-current liabilities | 7,771 | — | 453 | |||||||||||||||||
| Fair Value Measurements as of December 31, 2020 | ||||||||||||||||||||
| Description | Quoted Prices in Active Markets for Identical Assets (Level 1) | Significant Other Observable Inputs (Level 2) | Significant Unobservable Inputs (Level 3) | |||||||||||||||||
| Derivative liability - other current liabilities | $ | — | $ | — | $ | 2,453 | ||||||||||||||
| Derivative liability - other non-current liabilities | — | — | 664 | |||||||||||||||||
| Total | $ | — | $ | — | $ | 3,117 | ||||||||||||||
| Years Ended December 31, | ||||||||||||||
| 2021 | 2020 | |||||||||||||
| Beginning balance | $ | 3,117 | $ | 2,295 | ||||||||||
| Issuances | 15,121 | — | ||||||||||||
| Change in fair value (1) | (7,009) | (493) | ||||||||||||
| Settlements | (3,005) | — | ||||||||||||
| Other (2) | — | 1,315 | ||||||||||||
| Ending balance | $ | 8,224 | $ | 3,117 | ||||||||||
| Years Ended December 31, | ||||||||||||||||||||
| 2021 | 2020 | 2019 | ||||||||||||||||||
| Interest expense (1) | $ | 73 | $ | 8,906 | $ | 1,411 | ||||||||||||||
| Derivative payments on interest rate swap (2) | 1,717 | 4,133 | — | |||||||||||||||||
| Loss on interest rate swap (2) | 2,033 | 11,669 | — | |||||||||||||||||
Recurring Fair Value Measurements
tax, in accumulated other comprehensive income related to the interest rate swap.
Our policy is to manage interest expense using a mix of fixed and variable rate debt. To manage this mix effectively, we may enter into an interest rate swap in which we agree to exchange the difference between fixed and variable interest amounts calculated by reference to an agreed upon notional principal amount.
Effective December 16, 2014, we entered into a $150 million swap that went into effect on December 29, 2015 (one year delayed start), at which time our rate was locked at 6.966% until December 31, 2018. As of December 31, 2016 and as a result of post-effective amendments to the derivative, our interest rate is now fixed at 6.466% through December 31, 2018. Prior to December 16, 2014, we did not have any existing interest rate hedges. The hedge instrument will be 100% effective and as such the mark to market gains or losses on this hedge will be included in accumulated other comprehensive income (loss), to the extent effective, and reclassified into interest expense over the term of the related debt instruments.
The tables below summarizing the fair value measurement of this swap valued on a recurring basis on a gross basis:
| Fair Value Measurements at December 31, 2016 | ||||||||||||||||
Description | December 31, 2016 | Quoted Prices in Active Markets for Identical Assets (Level 1) | Significant Other Observable Inputs (Level 2) | Significant Unobservable Inputs (Level 3) | ||||||||||||
Derivative asset—current | $ | 69 | $ | — | $ | 69 | $ | — | ||||||||
Derivative asset—noncurrent | 6 | — | 6 | — | ||||||||||||
Derivative liability—current | (1,903 | ) | — | (1,903 | ) | — | ||||||||||
Derivative liability—noncurrent | (1,028 | ) | — | (1,028 | ) | — | ||||||||||
|
|
|
|
|
|
|
| |||||||||
| $ | (2,856 | ) | $ | — | $ | (2,856 | ) | $ | — | |||||||
|
|
|
|
|
|
|
| |||||||||
| Fair Value Measurements at December 31, 2015 | ||||||||||||||||
Description | December 31, 2015 | Quoted Prices in Active Markets for Identical Assets (Level 1) | Significant Other Observable Inputs (Level 2) | Significant Unobservable Inputs (Level 3) | ||||||||||||
Derivative asset—current | $ | 388 | $ | — | $ | 388 | $ | — | ||||||||
Derivative asset—noncurrent | 368 | — | 368 | — | ||||||||||||
Derivative liability—current | (2,098 | ) | — | (2,098 | ) | — | ||||||||||
Derivative liability—noncurrent | (1,673 | ) | — | (1,673 | ) | — | ||||||||||
|
|
|
|
|
|
|
| |||||||||
| $ | (3,015 | ) | $ | — | $ | (3,015 | ) | $ | — | |||||||
|
|
|
|
|
|
|
| |||||||||
Our policy is to manage interest expense using a mix of fixed and variable rate debt. To manage this mix effectively, we may enter into interest rate swaps in which we agree to exchange the difference between fixed and variable interest amounts calculated by reference to an agreed upon notional principal amount.
Our $150 million interest rate swap went into effect on December 29, 2015, at which time our interest rate was effectively 6.966%. The objective of the hedge was to eliminate the variability of cash flows in interest payments on the first $150 million of variable interest rate debt (the Term Loan B). The variable rate benchmark was the three month LIBOR rate for both the Term Loan B and the interest rate swap. The changes in cash flows of the interest rate swap were expected to exactly offset the changes in cash flowsas of the Term Loan B. The hedged risk was the interest rate risk exposure to changes in the interest payments, attributable to changes in the benchmark three month LIBOR interest rates (subject to a 1.0% LIBOR index floor) from December 29, 2015 through December 31, 2018. As disclosed in Note 7 of the Notes to Consolidated Financial Statements, Long-Term Debt, the LIBOR floor index was lowered
to 0.75% on September 30, 2016,2021 and our intent regarding future interest rate resets changed. Three-month LIBOR was above the floor, and it was more economical to use one month LIBOR. Therefore, our intensions called into question the probability of the amounts deferred in accumulated other comprehensive income (“AOCI”) as the forested transactions would not be probable. As a result, we chose to discontinue hedge accounting, reclassified all amounts in AOCI to earnings, and began to account for the interest rate swap on a mark-to-market basis. The change in reporting will have no impact on our reported cash flows, although future results of operations on a generally accepted accounting principles basis will be affected by the potential volatility of mark-to-market gains and losses which fluctuate with changes in interest rates.
2020.
| Fair Value Measurements as of December 31, 2021 | ||||||||||||||||||||
| Description | Quoted Prices in Active Markets for Identical Assets (Level 1) | Significant Other Observable Inputs (Level 2) | Significant Unobservable Inputs (Level 3) | |||||||||||||||||
| Derivative asset - other non-current assets | $ | — | $ | 284 | $ | — | ||||||||||||||
| Derivative liability - other current liabilities | — | (129) | — | |||||||||||||||||
| Total | $ | — | $ | 155 | $ | — | ||||||||||||||
| Fair Value Measurements as of December 31, 2020 | ||||||||||||||||||||
| Description | Quoted Prices in Active Markets for Identical Assets (Level 1) | Significant Other Observable Inputs (Level 2) | Significant Unobservable Inputs (Level 3) | |||||||||||||||||
| Derivative liability - other current liabilities | $ | — | $ | (11,022) | $ | — | ||||||||||||||
| Derivative liability - other non-current liabilities | — | (4,357) | — | |||||||||||||||||
| Total | $ | — | $ | (15,379) | $ | — | ||||||||||||||
We have elected to present the derivative contracts on a gross basis
Asthe agreement. The amendment increases the maximum total leverage ratio for all quarters of December 31, 2016, we reported no gains or losses in AOCI related to the interest rate swaps. In connection with lowering the LIBOR index floor from 1.0% to 0.75% within the $150 million interest rate swap, we received a $0.3 million payment that reduced the net liability position on the $150 million interest rate swap. The payment was reported as Derivative payments (receipts) on interest rate swap on the Condensed Consolidated Balance Sheet. Additionally, during 2016 when the interest rate swap was accounted for in accordance with hedge accounting, the periodic settlements2022 and related reclassification of other comprehensive income was $1.4 million of net hedging losses on the interest rate swap in the interest expense line on the Consolidated Statements of Operations. We recognized $0.6 million of interest rate swap settlements for the third quarter of 2016 in Derivative payments (receipts) on interest rate swap line on the Consolidated Statement of Operations. If there are no changes in the interest rates for the next twelve months, we expect $1.8 million in cash payments related to the interest rates swap. See the following “Derivatives’ Hedging Relationships” section of this Note for more information regarding the impact of the interest rate swaps on our Condensed Consolidated Financial Statements.
Derivatives’ Hedging Relationships
| Amount recognized in Other Comprehensive Income (effective portion) | Location of gain/(loss) reclassified from AOCI into Net Income (effective portion) | Pre-tax amount of gain/(loss) reclassified from AOCI in Net Income (effective portion) | ||||||||||||||||||
Derivatives’ Cash Flow Hedging Relationships | December 31, 2016 | December 31, 2015 | December 31, 2016 | December 31, 2015 | ||||||||||||||||
Forward starting interest rate swap contract | $ | — | $ | (3,015 | ) | Interest Expense | $ | (1,393 | ) | $ | — | |||||||||
|
|
|
|
|
|
|
| |||||||||||||
| $ | — | $ | (3,015 | ) | $ | (1,393 | ) | $ | — | |||||||||||
|
|
|
|
|
|
|
| |||||||||||||
As of December 31, 2016, we did not own derivative instruments that were classified as fair value hedges or trading securities. In addition, as of December 31, 2016, we did not own derivative instruments containing credit risk contingencies.
On July 1, 2015, we closed an underwritten registered public offering of common stock offered pursuant to a shelf registration statement on Form S-3 that was previously filed with, and declared effective by, the Securities Exchange Commission. The total number of shares of common stock sold was 7,590,000 at a public offering price of $24.00 per share. All of the shares in the offering were sold by us. Our net proceeds from the offering, after deducting underwriting discounts and commissions and offering expenses, were approximately $173.1 million. Of these proceeds, $148.7 million was used for repayment of principal and interest on our existing debt.
None.
Our management, under
A material weakness is a deficiency, or a combination of deficiencies, in internal control over financial reporting, such that there is a reasonable possibility that a material misstatement of our annual or interim financial statements would not be prevented or detected Based on a timely basis.
As of December 31, 2016, management identified the following material weaknesses. We did not maintain an effective control environment due to a lack of a sufficient complement of personnel with an appropriate level of knowledge, experience and training commensurate with our financial reporting requirements. This material weakness in the control environment contributed to the following material weaknesses: we did not design and maintain effective internal control over: (i) the accounting for business combinations, which specifically included not designing and maintaining controls over the (a) accuracy, valuation and presentation and disclosure for allocating goodwill to its international businesses and (b) completeness, accuracy and valuation of deferred income taxes recorded in connection with business combinations; and (ii) the accounting for income taxes, which specifically included not designing and maintaining controls over the completeness, accuracy, valuation and presentation and disclosure of deferred income tax accounts, income tax provision and related disclosures. These material weaknesses resulted in immaterial errors to goodwill, non-current deferred tax liabilities, income taxes and other comprehensive income in our consolidated financial statements for the years ended December 31, 2016, 2015 and 2014. Additionally, these control deficiencies could result in a misstatement of substantially all account balances or disclosures that would result in a material misstatement to the annual or interim consolidated financial statements that would not be prevented or detected. Accordingly, ourthis assessment, management has determined that these control deficiencies constitute material weaknesses.
Based on its evaluation, and as a result of the material weaknesses discussed above, management concluded that ourCompany's internal control over financial reporting was not effective as of December 31, 2016.
The2021.
Remediation Plan for Material Weaknesses
In response to the identified material weaknesses, our management, with the oversightincluded in Item 8 of the Audit Committee of our board of directors, has dedicated significant resources and efforts to improve our control environment and has taken immediate action to remediate the material weaknesses identified. While certain remedial actions have been completed, we continue to actively plan for and implement additional control procedures. The remediation efforts, outlined below, are intended both to address the identified material weaknesses and to enhance our overall financial control environment.
These material weaknesses will not be considered remediated until the applicable remedial controls operate for a sufficient period of time and management has concluded, through testing, that these controls are operating effectively.
We believe the measures described above will remediate the control deficiencies we have identified and strengthen our internal control over financial reporting. We are committed to continuing to improve our internal control processes and will continue to review, optimize and enhance our financial reporting controls and procedures. As we continue to evaluate and work to improve our internal control over financial reporting, we may determine to take additional measures to address control deficiencies or determine to modify, or in appropriate circumstances not to complete, certain of the remediation measures described above.
Changes in Internal Control overOver Financial Reporting
As discussed in the “Remediation Plan for Material Weaknesses” section above, there were
Risk Factor Insert:
We have identified material weaknesses in our internal control over financial reporting which could, if not remediated, result in material misstatements in our financial statements.
Our management is responsible for establishing and maintaining adequate internal control over financial reporting as defined in Rule 13a-15(f) under the Exchange Act. As disclosed in Item 9A, management identified certain material weaknesses in our internal control over financial reporting. Because of these material weaknesses, our management concluded that we did not maintain effective internal control over financial reporting as of December 31, 2016. With the oversight of the audit committee, we have begun taking steps to remediate the underlying cause of these material weaknesses and improve the design of controls.
While we expect to take the measures necessary to address the underlying causes of these material weaknesses, we cannot at this time estimate how long it will take and our efforts may not prove to be successful in remediating these material weaknesses. While we have not incurred and do not expect to incur material expenses specifically related to the remediation of these material weaknesses, actual expenses may exceed our current estimates and overall costs of compiling the system and processing documentation necessary to assess the effectiveness of our internal control over financial reporting may be material.
If we are unable to successfully remediate these material weaknesses in our internal control over financial reporting, or identify any additional material weaknesses that may exist, the accuracy and timing of our financial reporting may be adversely affected, we may be unable to maintain compliance with securities law requirements regarding timely filing of periodic reports in addition to applicable stock exchange listing requirements, and our stock price may decline materially as a result, all of which could have a material adverse effect on our business, prospects, financial condition, results of operations, or cash flows.
Part
Table of Equity Compensation Plan Information
| (in thousands, except per share data) | ||||||||||||
Plan Category | Number of securities to be issued upon exercise of outstanding options, warrants and rights (a) | Weighted –average exercise price of outstanding options, warrants and rights(b) | Number of securities remaining available for future issuance under equity compensation plans (excluding securities reflected in column (a)) (c) | |||||||||
Equity compensation plans approved by security holders | 897 | $ | 12.22 | 2,300 | ||||||||
Equity compensation plans not approved by security holders | — | — | — | |||||||||
Total | 897 | $ | 12.22 | 2,300 | ||||||||
Table of Equity Compensation Plan Information (in thousands, except per share data) | ||||||||||||||||||||
| Plan Category | Number of securities to be issued upon exercise of outstanding options, warrants, and rights (a) | Weighted-average exercise price of outstanding options, warrants, and rights (b) | Number of securities remaining available for future issuance under equity compensation plans (excluding securities reflected in column (a)) (c) | |||||||||||||||||
| Equity compensation plans approved by security holders | 621 | $ | 12.24 | 2,207 | ||||||||||||||||
| Equity compensation plans not approved by security holders | — | — | — | |||||||||||||||||
| Total | 621 | $ | 12.24 | 2,207 | ||||||||||||||||
Information
Information
Information
Part
| Page | ||||||||
| Incorporation by Reference | ||||||||||||||||||||||||||||||||
| Exhibit Number | Exhibit Description | Form | SEC File No. | Exhibit | Filing Date | |||||||||||||||||||||||||||
| 2.1 | 8-K | 000-23486 | 2.1 | July 22, 2014 | ||||||||||||||||||||||||||||
| 2.2 | 8-K | 000-23486 | 2.1 | August 18, 2015 | ||||||||||||||||||||||||||||
| 2.3 | 8-K | 000-23486 | 2.1 | July 10, 2017 | ||||||||||||||||||||||||||||
| 2.4 | 8-K | 000-23486 | 2.1 | April 3, 2018 | ||||||||||||||||||||||||||||
| 2.5 | 8-K | 001-39268 | 2.1 | August 24, 2020 | ||||||||||||||||||||||||||||
| 3.1 | S-3 | 333-89950 | 3.1 | June 6, 2002 | ||||||||||||||||||||||||||||
| 3.2 | 8-K | 000-23486 | 3.1 | May 20, 2019 | ||||||||||||||||||||||||||||
| 3.3 | 8-K | 000-23486 | 3.2 | May 20, 2019 | ||||||||||||||||||||||||||||
| 3.4 | 8-K | 000-23486 | 3.1 | December 18, 2008 | ||||||||||||||||||||||||||||
| 3.5 | 8-K | 000-23486 | 3.1 | December 11, 2019 | ||||||||||||||||||||||||||||
| Incorporation by Reference | ||||||||||||||||||||||||||||||||
| Exhibit Number | Exhibit Description | Form | SEC File No. | Exhibit | Filing Date | |||||||||||||||||||||||||||
| 3.6 | 8-K | 000-23486 | 3.1 | April 16, 2020 | ||||||||||||||||||||||||||||
| 3.7 | 8-K | 000-23486 | 3.1 | November 20, 2015 | ||||||||||||||||||||||||||||
| 3.8 | 8-K | 000-23486 | 3.3 | May 20, 2019 | ||||||||||||||||||||||||||||
| 3.9 | 8-K | 000-39268 | 3.1 | March 22, 2021 | ||||||||||||||||||||||||||||
| 4.1 | S-3 | 333-89950 | 4.1 | June 6, 2002 | ||||||||||||||||||||||||||||
| 4.2 | 8-K | 000-23486 | 4.1 | September 2, 2014 | ||||||||||||||||||||||||||||
| 4.3 | 8-K | 000-23486 | 4.1 | December 11, 2019 | ||||||||||||||||||||||||||||
| 4.4 | 8-K | 000-23486 | 4.1 | April 16, 2020 | ||||||||||||||||||||||||||||
| 4.5 | 10-K | 000-39268 | 4.5 | March 15, 2021 | ||||||||||||||||||||||||||||
| 4.6 | 8-K | 000-39268 | 4.1 | March 22, 2021 | ||||||||||||||||||||||||||||
| 10.1* | S-8 | 333-130395 | 4.1 | December 16, 2005 | ||||||||||||||||||||||||||||
| 10.2* | DEF14A | 000-23486 | Appendix A | April 1, 2016 | ||||||||||||||||||||||||||||
| 10.3* | S-3/A | 333-89950 | 10.6 | July 15, 2002 | ||||||||||||||||||||||||||||
| 10.4* | 10-K | 000-23486 | 10.16 | March 31, 1999 | ||||||||||||||||||||||||||||
| 10.5 | 8-K | 000-23486 | 10.3 | September 2, 2014 | ||||||||||||||||||||||||||||
| 10.6 | 8-K | 000-23486 | 10.4 | September 2, 2014 | ||||||||||||||||||||||||||||
| 10.7* | 10-K | 000-23486 | 10.27 | March 16, 2015 | ||||||||||||||||||||||||||||
| 10.8 | 8-K | 000-23486 | 10.1 | October 3, 2016 | ||||||||||||||||||||||||||||
| 10.9 | 8-K | 000-23486 | 10.1 | November 4, 2016 | ||||||||||||||||||||||||||||
| 10.10 | DEF14A | 000-23486 | Appendix A | November 10, 2016 | ||||||||||||||||||||||||||||
| 10.11 | 10-K | 000-23486 | 10.18 | March 16, 2017 | ||||||||||||||||||||||||||||
| 10.12 | 10-K | 000-23486 | 10.19 | March 16, 2017 | ||||||||||||||||||||||||||||
| 10.13 | 10-K | 000-23486 | 10.20 | March 16, 2017 | ||||||||||||||||||||||||||||
| Incorporation by Reference | ||||||||||||||||||||||||||||||||
| Exhibit Number | Exhibit Description | Form | SEC File No. | Exhibit | Filing Date | |||||||||||||||||||||||||||
| 10.14 | 10-K | 000-23486 | 10.21 | March 16, 2017 | ||||||||||||||||||||||||||||
| 10.15* | 10-Q | 000-23486 | 10.2 | May 4, 2017 | ||||||||||||||||||||||||||||
| 10.16 | 8-K | 000-23486 | 10.1 | April 4, 2017 | ||||||||||||||||||||||||||||
| 10.17 | 8-K | 000-23486 | 10.1 | August 18, 2017 | ||||||||||||||||||||||||||||
| 10.18 | 8-K | 000-23486 | 10.1 | November 24, 2017 | ||||||||||||||||||||||||||||
| 10.19 | 8-K | 000-23486 | 10.1 | April 3, 2018 | ||||||||||||||||||||||||||||
| 10.20 | 8-K | 000-23486 | 10.1 | May 7, 2018 | ||||||||||||||||||||||||||||
| 10.21 | 8-K | 000-23486 | 10.1 | December 26, 2018 | ||||||||||||||||||||||||||||
| 10.22 | 8-K | 000-23486 | 10.1 | February 26, 2019 | ||||||||||||||||||||||||||||
| 10.23 | 8-K | 000-23486 | 10.1 | March 18, 2019 | ||||||||||||||||||||||||||||
| 10.24* | DEF14A | 000-23486 | Appendix C | April 8, 2019 | ||||||||||||||||||||||||||||
| 10.25* | 10-Q | 000-23486 | 10.1 | May 10, 2019 | ||||||||||||||||||||||||||||
| 10.26 | 8-K | 000-23486 | 10.1 | June 12, 2019 | ||||||||||||||||||||||||||||
| 10.27* | 10-Q | 000-23486 | 10.4 | August 9, 2019 | ||||||||||||||||||||||||||||
| Incorporation by Reference | ||||||||||||||||||||||||||||||||
| Exhibit Number | Exhibit Description | Form | SEC File No. | Exhibit | Filing Date | |||||||||||||||||||||||||||
| 10.28* | 10-Q | 000-23486 | 10.5 | August 9, 2019 | ||||||||||||||||||||||||||||
| 10.29* | 10-Q | 000-23486 | 10.6 | August 9, 2019 | ||||||||||||||||||||||||||||
| 10.30* | 10-Q | 000-23486 | 10.7 | August 9, 2019 | ||||||||||||||||||||||||||||
| 10.31* | 8-K | 000-23486 | 10.1 | August 27, 2019 | ||||||||||||||||||||||||||||
| 10.32* | 8-K | 000-23486 | 10.2 | August 27, 2019 | ||||||||||||||||||||||||||||
| 10.33* | 8-K | 000-23486 | 10.1 | September 24, 2019 | ||||||||||||||||||||||||||||
| 10.34 | 8-K | 000-23486 | 10.1 | December 11, 2019 | ||||||||||||||||||||||||||||
| 10.35 | 8-K | 000-23486 | 10.2 | December 11, 2019 | ||||||||||||||||||||||||||||
| 10.36 | 8-K | 000-23486 | 10.1 | December 19, 2019 | ||||||||||||||||||||||||||||
| 10.37* | 8-K | 000-23486 | 10.1 | February 20, 2020 | ||||||||||||||||||||||||||||
| 10.38* | 10-Q | 001-39268 | 10.1 | May 11, 2020 | ||||||||||||||||||||||||||||
| 10.39 | 8-K | 001-39268 | 10.1 | July 31, 2020 | ||||||||||||||||||||||||||||
| 10.40 | 8-K | 001-39268 | 10.1 | August 24, 2020 | ||||||||||||||||||||||||||||
| 10.41* | 8-K | 001-39268 | 10.1 | October 19, 2020 | ||||||||||||||||||||||||||||
| 10.42 | 8-K | 000-39268 | 10.1 | March 22, 2021 | ||||||||||||||||||||||||||||
| 10.43 | 8-K | 000-39268 | 10.2 | March 22, 2021 | ||||||||||||||||||||||||||||
| 10.44 | 8-K | 000-39268 | 10.3 | March 22, 2021 | ||||||||||||||||||||||||||||
| 10.45 | 8-K | 000-39268 | 10.4 | March 22, 2021 | ||||||||||||||||||||||||||||
| Incorporation by Reference | ||||||||||||||||||||||||||||||||
| Exhibit Number | Exhibit Description | Form | SEC File No. | Exhibit | Filing Date | |||||||||||||||||||||||||||
| 10.46 | 8-K | 000-39268 | 10.1 | May 14, 2021 | ||||||||||||||||||||||||||||
| 10.47* | 8-K | 000-39268 | 10.1 | June 15, 2021 | ||||||||||||||||||||||||||||
| 10.48* | 8-K | 000-39268 | 10.2 | June 15, 2021 | ||||||||||||||||||||||||||||
| 10.49 | 8-K | 000-39268 | 10.1 | March 4, 2022 | ||||||||||||||||||||||||||||
| 21.1# | ||||||||||||||||||||||||||||||||
| 23.1# | ||||||||||||||||||||||||||||||||
| 23.2# | ||||||||||||||||||||||||||||||||
| 31.1# | ||||||||||||||||||||||||||||||||
| 31.2# | ||||||||||||||||||||||||||||||||
| 32.1## | ||||||||||||||||||||||||||||||||
| 32.2## | ||||||||||||||||||||||||||||||||
| 101.INS# | XBRL Instance Document | |||||||||||||||||||||||||||||||
| 101.SCH# | XBRL Taxonomy Extension Service | |||||||||||||||||||||||||||||||
| 101.CAL# | Taxonomy Calculation Linkbase | |||||||||||||||||||||||||||||||
| 101.LAB# | XBRL Taxonomy Label Linkbase | |||||||||||||||||||||||||||||||
| 101.PRE# | XBRL Presentation Linkbase Document | |||||||||||||||||||||||||||||||
| 101.DEF# | XBRL Definition Linkbase Document | |||||||||||||||||||||||||||||||
| * | Management contract or compensatory plan or arrangement. | ||||
| # | Filed herewith | ||||
| ## | This certification is being furnished solely to accompany this Annual Report on Form 10-K pursuant to 18 U.S.C. Section 1350 and is not being filed for purposes of Section 18 of the Securities Exchange Act of 1934 and is not to be incorporated by reference into any filing of the Company, whether made before or after the date hereof, regardless of any general incorporation language in such filings. | ||||
| NN, Inc. | ||||||||
| By: | / | |||||||
| President, Chief Executive Officer, | ||||||||
| Date: | ||||||||
|
|
| ||
| ||||
| ||||
| ||||
| ||||
| ||||
| ||||
| ||||
| ||||
Index to Exhibits
Incorporation by Reference | ||||||||||
Exhibit | Exhibit Description | Form | SEC File No. | Exhibit | Filing Date | |||||
2.1 | Agreement and Plan of Merger, dated as of July 18, 2014, by and among NN, Inc., PMC Global Acquisition Corporation, Autocam Corporation, Newport Global Advisors, L.P., and John C. Kennedy | 8-K | 000-23486 | 2.1 | July 22, 2014 | |||||
2.2 | Stock Purchase Agreement, dated as of August 17, 2015, by and among NN, Inc., Precision Engineered Products Holdings, Inc. and PEP Industries, LLC | 8-K | 000-23486 | 2.1 | August 18, 2015 | |||||
3.1 | Restated Certificate of Incorporation of NN, Inc. | S-3 | 333-89950 | 3.1 | June 6, 2002 | |||||
3.2 | Certificate of Designation of Series A Junior Participating Preferred Stock of NN, Inc., as filed with the Secretary of the State of Delaware | 8-K | 000-23486 | 3.1 | December 18, 2008 | |||||
3.3 | Amended and Restated By-Laws of NN, Inc. | 8-K | 000-23486 | 3.1 | November 20, 2015 | |||||
4.1 | The specimen stock certificate representing NN, Inc.’s Common Stock, par value $0.01 per share | S-3 | 333-89950 | 4.1 | June 6, 2002 | |||||
4.2 | Stockholders’ Agreement, effective as of August 29, 2014, by and between NN, Inc. and John C. Kennedy | 8-K | 000-23486 | 4.1 | September 2, 2014 | |||||
4.3 | Indenture, dated as of October 19, 2015, by and among NN, Inc., the subsidiary guarantors party thereto, and U.S. Bank National Association, as trustee | 8-K | 000-23486 | 4.1 | October 20, 2015 | |||||
4.4 | Form of the NN, Inc. 10.25% Senior Notes due 2020 | 8-K | 000-23486 | 4.2 | October 20, 2015 | |||||
4.5 | Supplemental Indenture, dated as of October 19, 2015, by and among NN, Inc., certain direct and indirect subsidiaries of NN, Inc., as additional subsidiary guarantors, and U.S. Bank National Association, as trustee | 8-K | 000-23486 | 4.3 | October 20, 2015 | |||||
10.1* | NN, Inc. 2005 Stock Incentive Plan | S-8 | 333-130395 | 4.3 | December 16, 2005 | |||||
10.2* | NN, Inc. 2011 Amended and Restated Stock Incentive Plan | DEF14A | 000-23486 | Appendix A | April 1, 2016 | |||||
10.3* | Form of Indemnification Agreement | S-3/A | 333-89950 | 10.6 | July 15, 2002 | |||||
10.4* | Elective Deferred Compensation Plan, dated February 26, 1999 | 10-K | 000-23486 | 10.16 | March 31, 1999 | |||||
10.5* | Amended and Restated Executive Employment Agreement, dated September 13, 2012, by and between NN, Inc. and James H. Dorton | 8-K | 000-23486 | 10.2 | September 18, 2012 | |||||
10.6* | Amended and Restated Executive Employment Agreement, dated September 13, 2012, by and between NN, Inc. and Thomas C. Burwell | 8-K | 000-23486 | 10.3 | September 18, 2012 | |||||
10.7* 10.8* 10.9 10.10 10.11* 10.12* 10.13* 10.14 10.15 10.16 10.17 10.18# 10.19# 10.20# 10.21# Amended and Restated Executive Employment Agreement, dated September 13, 2012, by and between the Whirlaway and James R. Widders 8-K 000-23486 10.6 September 18, 2012 Executive Employment Agreement, dated May 8, 2013, between NN, Inc. and Richard D. Holder 8-K 000-23486 10.1 May 10, 2013 Escrow Agreement, effective as of August 29, 2014, by and among NN, Inc., Newport Global Advisors, L.P., John C. Kennedy and Computershare Trust Company, N.A. 8-K 000-23486 10.3 September 2, 2014 Indemnity Agreement, effective as of August 29, 2014, by and among NN, Inc. and each of the shareholders of Autocam Corporation identified therein 8-K 000-23486 10.4 September 2, 2014 Executive Employment Agreement, dated September 9, 2014, between NN, Inc. and Warren A. Veltman 10-K 000-23486 10.27 March 16, 2015 Executive Employment Agreement, dated October 6, 2014, between NN, Inc. and L. Jeffrey Manzagol 10-K 000-23486 10.28 March 16, 2015 Separation Agreement and Release, dated as of April 4, 2016, by and between James H. Dorton and NN, Inc. 8-K 000-23486 10.1 April 4, 2016 Amended and Restated Registration Rights Agreement, dated as of June 10, 2016, by and among NN, Inc., the guarantors party thereto, SunTrust Robinson Humphrey, Inc., on behalf of itself and as representative of the initial purchasers, Spring Capital II Subsidiary, L.P., Summit Partners Credit Fund II, L.P, Summit Partners Credit Fund B-2, L.P., Summit Partners Credit Fund A-2, L.P., Summit Investors Credit II, LLC, Summit Investors Credit II (UK), L.P. and Summit Partners Credit Offshore Intermediate Fund II, L.P. 8-K 000-23486 10.1 June 10, 2016 Amendment and Restatement Agreement, dated as of September 30, 2016, by and among NN, Inc., certain NN, Inc. subsidiaries named therein, SunTrust Bank, KeyBank National Association and Regions Bank 8-K 000-23486 10.1 October 3, 2016 Incremental Amendment to Amended and Restated Credit Agreement, dated as of October 31, 2016, among NN, Inc., the Guarantors, HomeTrust Bank, as 2016 Revolving Credit Increase Lender, KeyBank National Association, as an L/C Issuer, Regions Bank, as Swing Line Lender and an L/C Issuer, and SunTrust Bank, as Administrative Agent and an L/C Issuer 8-K 000-23486 10.1 November 4, 2016 NN, Inc. 2016 Omnibus Incentive Plan DEF14A 000-23486 Appendix A November 10, 2016 Form of Incentive Stock Option Agreement under the 2016 Omnibus Incentive Plan Form of Nonqualified Stock Option Agreement under the 2016 Omnibus Incentive Plan Form of Restricted Share Award Agreement under the 2016 Omnibus Incentive Plan Form of Performance Share Unit Award Agreement under the 2016 Omnibus Incentive Plan
| Name and Signature | Title | Date | ||||||||||||||||||
| /s/ Warren A. Veltman | President, Chief Executive Officer, and Director (Principal Executive Officer) | March 11, 2022 | |||||||||||||||||
| Warren A. Veltman | ||||||||||||||||||||
| /s/ Michael C. Felcher | Senior Vice President – Chief Financial Officer (Principal Financial and Accounting Officer) | March 11, 2022 | ||||||||||||||||||
| ||||||||||||||||||||
| Michael C. Felcher | ||||||||||||||||||||
| ||||||||||||||||||||
| /s/ Jeri J. Harman | Non-Executive Chairman, Director | March 11, 2022 | ||||||||||||||||||
| Jeri J. Harman | |||||||||||||||||||
| /s/ Raynard D. Benvenuti | Director | March 11, 2022 | ||||||||||||||||||
| Raynard D. Benvenuti | |||||||||||||||||||
| /s/ Robert E. Brunner | Director | March 11, 2022 | ||||||||||||||||||
| Robert E. Brunner | |||||||||||||||||||
| /s/ Christina E. Carroll | Director | March 11, 2022 | ||||||||||||||||||
| Christina E. Carroll | |||||||||||||||||||
| /s/ João Faria | Director | March 11, 2022 | ||||||||||||||||||
| João Faria | |||||||||||||||||||
| /s/ Rajeev Gautam, Ph.D. | Director | March 11, 2022 | ||||||||||||||||||
| Rajeev Gautam, Ph.D. | |||||||||||||||||||
| /s/ Shihab Kuran, Ph.D. | Director | March 11, 2022 | ||||||||||||||||||
| Shihab Kuran, Ph.D. | |||||||||||||||||||
| /s/ Tom H. Wilson, Jr. | Director | March 11, 2022 | ||||||||||||||||||
| ||||||||||||||||||||
| Tom H. Wilson, Jr. | ||||||||||||||||||||
| ||||||||||||||||||||
| ||||||||||||||||||||
| ||||||||||||||||||||
| ||||||||||||||||||||
74